Exhibit 15.3

A focused strategy for a lifetime of learning Annual report and accounts 2022
We are the world’s leading learning company |  |
Strategic report | ||||||||
| 2 | ||||||||
| 6 | ||||||||
| 7 | ||||||||
| 10 | ||||||||
| 12 | ||||||||
| 16 | ||||||||
| 18 | ||||||||
| 20 | ||||||||
| 26 | ||||||||
| 30 | ||||||||
| 43 | ||||||||
Governance report | ||||||||
| 53 | ||||||||
| 88 | ||||||||
| 120 | ||||||||
Independent auditor’s report to the members of Pearson plc | 126 | |||||||
| 134 | ||||||||
Company financial statements | 202 | |||||||
Other information | ||||||||
| 213 | ||||||||
| 215 | ||||||||
| 220 | ||||||||
| 221 | ||||||||
The strategic report, up to and including page 52, was approved for issue by the Board on 15 March 2023 and signed on its behalf by:
Sally Johnson
Chief Financial Officer
 | Use this QR code to visit our Pearson plc website where you can find the online version of this report.  https://plc.pearson.com/en-GB/ investors/2022-annual-report-accounts | |

 | We have a focused strategy for a lifetime of learning |  | ||||
Andy Bird, Chief Executive | ||||||
“At Pearson, we’re connecting our different products and brands to support people in their learning journey and create real-life impact. We’re forming an exciting lifelong digital learning ecosystem that provides people with affordable learning throughout their lifetime. By increasing our scale and customer reach, investing in new opportunities and expanding the interconnectedness between our divisions, we’re uncovering great things. The possibilities are vast for Pearson as we embrace the future of learning.” |


At a glance Our purpose is to add life to a lifetime of learning. Because learning isn’t just what we do – it’s who we are. Our vision We want everyone to realise the life they imagine through learning.. Our mission Create vibrant and enriching learning experiences designed for real-life impact. Our values begin with ‘we’ because they apply to all of us. They help guide how we show up every day for our customers, each other, and the communities we serve. 1. We ask ‘why’? We challenge the status quo by challenging ourselves. 2. We ask ‘what if’? We spark curiosity to innovate new possibilities for everyone. 3. We earn trust. We build credibility by acting with integrity every day. 4. We deliver quality. We hold our customers and consumers in the highest regard, and our work to the highest standards. 5. We make our mark. We execute with speed and agility to leave a lasting impact on everyone we serve. “We’ve redefined our purpose to meet this moment in our world where learning is becoming more fluid and exists inside and outside of formal education.” Lynne Frank, Chief Marketing Officer and
Co-President,
Direct-to-Consumer
Our strategy
Our strategy is to create trusted relationships with consumers throughout their lifelong learning journeys. We want to empower them to realise their goals and potential, by developing their skills across multiple stages of their learning lifetime, encompassing not only formal primary, secondary and higher education, but also, increasingly, the world of work.
Our strategy places consumers at the heart of everything we do, and we are integrating our products to create a learning ecosystem that reaches our consumers across all their life stages.

Annual report and accounts 2022 Pearson plc 3 |
At a glance continued | ||||||||||
Our interconnected divisions | Assessment & Qualifications We provide the assessments, qualifications, certifications and licences that enable people to demonstrate their knowledge, skills and aptitude across a lifetime of learning – from school to professional careers. We play an integral role in a host of technology certifications, in areas such as cloud computing and cyber security, that power growth and innovation across the global economy. We deliver numerous medical certification and licensing examinations around the world, giving governments and the public the assurance that their providers have met the standards for care. Exam delivery volumes in the Information Technology sector increased by 12% from 2021 to 2022. Our growth will be fuelled by our unrivalled breadth of offering and global scale across both physical and digital assessment, combined with the growing market need for accreditation and certification in the professional market, more effective formative and summative assessment in the school market, and increased demand and spend across the education landscape in mental health and wellbeing. | Higher Education We provide around 18 million higher education students every year with vibrant digital content, assessments and enriching experiences, leading to positive learning outcomes. We provide a significant entry point for a lifetime of learning in the Pearson ecosystem. We intend to remain the Higher Education content market leader by deepening our relationships with students beyond instructor and faculty required course materials. By enhancing product features and investments into Pearson+, we enable students to succeed in achieving their goals across disciplines and academic paths. We will drive growth through increasing market share and recapture of the secondary market, particularly through enhancements to our suite of digital products including Pearson+, MyLabs, Mastering and Revel. In addition, we will invest in growth in the large international higher education market and capitalise on increased demand in Inclusive Access. | ||||||||
2022 Revenue |  |  | ||||||||
2022 Highlights | — Pearson VUE test volumes grew 16% to 19.4m with particularly strong growth in the IT and healthcare segments. VUE also won major contracts across its portfolio and expanded its presence in the US federal market. — Announced the intention to acquire Personnel Decisions Research Institutes (PDRI) which has significant expertise in providing assessment solutions to the US federal government, one of the largest employers in the US with more than 4 million employees. — Clinical Assessment had a strong performance due to good government funding and continued focus on health and wellbeing. — UK and International Qualifications 2022 revenue was driven by the return to full testing and growth in qualifications and assessment contracts internationally. — US Student Assessment had strong revenue growth with a full testing cycle in 2022 and new contract wins.  | — Inclusive Access sales to not-for-profit — A three-fold increase compared to prior year Fall semester in Pearson+ paid subscriptions, expanding our reach through US college bookstores: — Pearson+ paid subscriptions compared to prior year Fall semester up 205% to 406k (2021: 133k) — Pearson+ registered users compared to prior year Fall semester increased 3% to 2.83m (2021: 2.75m) — Launched Pearson+ Channels (with 18 study channels) in Autumn 2022 to help students understand complex concepts and prepare for exams in the toughest college courses, whether they are using a Pearson eTextbook or not. This increases the total addressable market for Pearson+. | ||||||||
4 Pearson plc | ||||||||||
Virtual Learning We offer highly effective online learning for every age and stage of education. Our users can learn where, when, and how they learn best, in a way that is tailored to their needs and propels them forward in their lives and careers. Our vision in Virtual Schools is to provide a holistic, academic, and innovative learning experience to our students, while being a trusted best-in-class partner for our schools and families. We will grow by continuing to focus on the core learning experience, including individualised learning and curriculum transformation, while innovating and adapting to both industry and market changes to stay ahead of the competition. Our career readiness solutions will fuel growth by providing pathways for students beyond high school, be it in the job market or further study. We will also capitalise on increased awareness and openness to virtual learning and the demand for alternative education mediums driven by parents’ new hybrid and remote working schedules. Our Online Program Management (OPM) business is currently under strategic review. | English Language Learning There are 1.4 billion English language learners across the globe. We have the courseware and assessments to help them achieve their goals, including digital and blended English solutions for educational institutions and the flagship Pearson Test of English, in over 150 countries. Our vision is to become the world’s leading destination for committed learners to build and prove their proficiency in English. We are growing through creating an interconnected suite of personalised products across direct to consumer, institutional, enterprise language learning and assessments, and online language learning through Mondly. This will allow us to expand our addressable market, increase market penetration, and create more repeatable, personal relationships with language learners, capturing more of their lifetime spend. We are also capitalising on a consistent market need for English proficiency in global employment and education, a growing demand for online language learning, and renewed global mobility. | Workforce Skills We’re building a world where everyone is prepared for the future of work and people are recognised for what they know and what they can do. Our newly launched talent investment platform uses workforce analysis and assessment to realise untapped potential, mobilise talent, and help enterprises and individuals close the workforce skills gap, helping everyone find the right work for them. We will grow by connecting consumers, enterprises, recruiters, and learning partners to a marketplace for verified skills. We can also capitalise on employers’ increasing need to reskill and develop their workforce to protect against shifts in both growing and shrinking markets and in response to the high speed of economic and technology change. We need to respond to and enable the accelerating convergence between previously disconnected parts of the HR technology market, particularly Learning and Development, Recruitment, and Talent Management. | ||||||||||
 |  |  | ||||||||||
— Increased retention rates and Net Promoter Score, now +67, for Virtual Schools, which will drive enrolment growth. — Opened our first virtual school in Virginia focusing on grades 6-10 students, expanding to gradesK-10 in 2023.— Helped enact new legislation in Missouri, facilitating easier access to publicly funded virtual learning, leading to a doubling of our virtual school enrolments within that State. | — Pearson Test of English (PTE) test volumes up 90% and underlying revenue up 72%, particularly driven by border reopenings and gaining market share in India, where investment in our agent network and successful market campaigns have helped to drive growth. — Completed the acquisition of Mondly and entered the Online Self-Study language learning space. See our Strategy in Action for more detail on how Mondly is helping us to grow. — Transformed our institutional business through initiatives such as Pearson English Connected Learning, which creates personalised, connected solutions including courseware, assessment and certification to fast-track learning. — Enhanced our user experience to ensure that our courseware is the most engaging and effective on the market, leveraging our partnerships with major corporations including Disney and the BBC. | — Acquired Credly, a leading digital credentials business, giving us a strong foothold and user base in the workplace credentials space. — Developed our talent investment platform which provides accurate, real-time access to employee skills. — Integrated Faethm and Credly into the Workforce Skills division, creating single enterprise go-to-market — We launched Skills Accelerator, a suite of peer-supported, project-based learning courses that help people complete business-critical projects while developing future skills. | ||||||||||
| | | ||||||||||
Annual report and accounts 2022 Pearson plc 5 | ||||||||||||
2022 highlights
A year of
strategic and
operational
progress
 | Achieved underlying sales growth of 5% and adjusted operating profit growth of 11% on an underlying basis, ahead of expectations | |
 | Acquired Mondly and Credly to support the growth strategy across the Pearson ecosystem | |
 | Announced £ 120m | |
6 Pearson plc | ||

Launched our people strategy with a focus on engagement and high-performance Launched 18 study channels on Pearson+ Enterprise Learning reaching c.2000 enterprise clients across Workforce Skills and Pearson VUE Completed the disposal international local courseware publishing businesses |  | |
Chair’s note
| I believe we are well- positioned to continue to grow profitably and to deliver long-term success, creating value for all our stakeholders. | |
Omid Kordestani, Chair | ||

2022 dividend growth 5% | “What drew me to this fantastic company was the incredible opportunity to be globally consequential and the important role we can play in improving society through lifelong learning.” | |||
Return on capital in 2022 8.7% | ||||
| Annual report and accounts 2022 Pearson plc 7 |
Chair’s note
continued
Overview
I’m delighted to be writing my first letter to you as Chair of Pearson. It’s a privilege to join Pearson at this exciting time. What drew me to this fantastic company was the incredible opportunity to be globally consequential and the important role we can play in improving society through lifelong learning. We have a tremendous opportunity to capitalise on this, benefiting all our stakeholders, particularly with the significant potential in digital learning. It is also exciting to see that we are delivering particularly on enterprise learning, in ways we never have before, as the workplace becomes the new heart of many people’s learning journey.
2022 has been a year of strategic and operational development as we continue to create a digital learning ecosystem, fit for the future of learning. We have made considerable progress in executing our direct to consumer, lifelong learning strategy as we reshape our portfolio for profitable growth, adding capabilities and increasing interconnectivity between divisions.
Financial and operational highlights
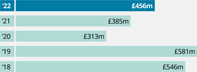
We delivered a strong performance in 2022 with sales increasing on an underlying basis by 5% and our adjusted operating profit margin increased from 11% to 12%. This resulted in our adjusted operating profit increasing to £456m.
We have also made good strategic and operational progress as we build further lifelong learning potential. We’ve been disciplined in right sizing the company to our strategic direction. We have taken bold actions to make Pearson a more efficient, focused company and through this we will accelerate our improved margin expectations to 2023 from 2025.
We have also retained a strong balance sheet and liquidity position that will enable us to continue to invest in our comprehensive growth strategy.
As a result of the strong performance in 2022, the Board recommends a final dividend of 14.9 pence per share. The final dividend will be paid on 5 May 2023 to shareholders on the register on 24 March 2023.
Environmental, social and governance
Pearson has a clear purpose adding life to a lifetime of learning that links naturally to our potential to make a significant positive impact on our society and our planet. Our products and services enable more engaging and stimulating learning experiences. They are accessible to more people, and with a smaller carbon footprint. We continue to make good progress against our ambitious climate targets, and we recognise the role that top talent plays in driving our long-term growth. This year, we also launched a people strategy focused on employee engagement as a driver of performance. We also ensure that we continue to operate as a responsible business and will always act in the best interests of our customers.
Our people make Pearson’s success
Our people are fundamental to our success and strong performance. I would like to take this opportunity to thank everybody for their commitment. I appreciate their incredible work, operational discipline, and focus over 2022. We cannot underestimate how this difficult environment has affected our people, I’m very proud of them all. Taking care of our employees, and ensuring we keep our positive culture is vital. Their efforts have, and will, continue to underpin the company’s performance as we take advantage of the significant growth opportunities ahead.
I also want to thank all our customers for their continued support. We will continue to provide them with engaging ways of learning that reflect today’s world, as we look to deliver the needs of both employers and employees.

 | Pearson has an opportunity to educate the world and be a good citizen, as a business that acts responsibly and sets the right tone. |
 Leading for the future We have a strong performance culture at Pearson, with a high level of execution and operational excellence. We also have a wonderfully diverse Board in terms of both experience and backgrounds. Ensuring we continue to have a diverse set of views and perspectives at Board and leadership level is key to our success. We need different types of leadership and operational talent to execute against our strategy. We will keep monitoring this as Pearson continues to transform so we have the right skill sets for our future, as well as managing succession planning for any upcoming departures. On the Board, we will miss Linda Lorimer, who steps down at Pearson’s upcoming Annual General Meeting (AGM) after serving nearly ten years on the Board. Linda has been an amazing force throughout her tenure, most recently as Chair of our Reputation & Responsibility Committee. At the executive level, we saw new leaders join the leadership team with Marykay Wells being elevated internally to Chief Information Officer. Marykay is working with the Board and leadership team to build a technology strategy that supports a coordinated, cross functional approach to data, content delivery, and product development. Sulaekha (Sue) Kolloru Barger also joined us to become our new Chief Strategy Officer. Since joining, Sue has been focused on driving strategic planning across the company and charting the course for future growth. | Engagement is fundamental As a Board and leadership team, it is critical we engage frequently with all our stakeholders. We want to ensure that our strategy is clear, that the way we’re operating is well understood, and to identify any gaps in our approach. This enables a constructive and positive relationship and helps us understand the views and perspectives of our stakeholders. It also ensures our team is focused on the right approaches, policies, and activities. This year, we undertook a comprehensive review of Pearson’s executive remuneration framework, with the proposed new Directors’ remuneration policy detailed on page 112. The Remuneration Committee and the Board have spent significant time rigorously reviewing the policy and its implementation to ensure it remains fit for purpose. This review considered Pearson’s renewed strategy, the recent strong performance of the business, and the views and expectations of our shareholders, their advisers, and other stakeholders. I believe the proposed policy is the best way to continue to drive a strong pay for performance culture. It also responds to the needs of the global talent market for digital innovators, whilst remaining mindful of the UK governance environment and the views of our shareholders. Confident in our potential In March, the company announced that the Board had received and rejected, in total, three unsolicited, preliminary, and highly conditional takeover approaches from investment firm Apollo. Under Sidney Taurel as Chair, the Board considered the right response for Pearson and our shareholders. While the Board deliberated the approaches with all due focus and attention, our confidence in the strategy that Andy and the leadership team are pursuing led us to unanimously vote against the approaches. We believe they all significantly undervalued the company and its future prospects. I would like to thank our shareholders for their support for the Board’s position. Outlook We start 2023 in a challenging macro environment, but we have a clear focus on execution. I have every confidence in our ability to deliver as we continue to transform because: 1. The company is confident of its strategy. 2. We have a strong executive team that has been established to execute on that strategy, and 3. The company will be very disciplined in measuring how to achieve success and to deliver results for shareholders. Pearson has an opportunity to educate the world and be a good citizen, as a business that acts responsibly and sets the right tone. We take our duties seriously and drive a level of execution that brings us closer to our promise of lifelong Learning: our ‘North Star’. I believe we are well positioned to continue to grow profitably and to deliver long-term success, creating value for all our stakeholders. Omid Kordestani Chair |
| Annual report and accounts 2022 Pearson plc 9 |
Chief Executive’s review
| | Another year of significant strategic, operational and financial progress. | |
Andy Bird, Chief Executive | ||

Underlying sales growth in 2022 5% | “Over the last year, a new Pearson has emerged -streamlined, interconnected, and more agile. This new Pearson is expanding our market opportunities, driving value for our stakeholders and making a positive impact on our world.” | |||
Underlying adjusted operating profit growth in 2022 11% | ||||
10 Pearson plc |
Dear shareholders,
I am pleased to report to you on another year of significant strategic, operational, and financial progress, one that has strengthened our foundations for a future of increasing sustainable growth.
Over the last year, a new Pearson has emerged - streamlined, interconnected, and more agile. This new Pearson is expanding our market opportunities, driving value for our stakeholders, and making a positive impact on our world.
Our 2022 financial results demonstrate the strong momentum we’ve been building. For a second consecutive year, our financial performance was ahead of our expectations, with underlying sales growing by 5% and underlying adjusted operating profits increasing by 11% to £456m. This reflects excellent progress across the Group, driven by our strategic initiatives.
Delivering on our strategy
Our strategy focuses on a lifetime of learning and building a company that is digital-first, puts the consumer at its heart, and delivers high quality learning products at scale. A major focus this year has been enhancing the interconnectivity between our divisions, making more parts of Pearson more relevant to each other while driving financial and operational benefits. Because of this, our business model is moving from standalone products and services to connected learning applications, centered around our trusted relationships with consumers.
At the start of 2022, I identified four clear priorities for Pearson:
| — | Deliver sales and profit growth |
| — | Increase our focus on execution, quality, and trust |
| — | Embed customer and consumer insights across the company |
| — | Scale and grow Pearson+ |
We delivered on those priorities and much more, including significantly evolving our overall proposition and ourstrategies. Critically, we remain on track to deliver approximately £120m of cost efficiencies in 2023, accelerating our improved margin expectations to 2023 from 2025. We reshaped our portfolio with the acquisitions of Credly and Mondly, and announced the intention to acquire Personnel Decisions Research Institutes (PDRI), to drive growth. In addition, we completed the sale of our international courseware local publishing businesses and initiated the strategic review of our Online Programme Management (OPM) business. We saw strong growth in Pearson+ paid subscribers, launched the new Pearson+ Channels feature, and integrated Mondly into the service. As we do all of this, we are growing our universe of consumer relationships. In 2022, our products and services impacted the lives of around 160 million global users.
go-to-market
A future focused on a lifetime of learning
While we continue to work with the full spectrum of learning institutions, the workplace is now the heart of many people’s learning journey. Enterprise learning has long been foundational to our business but 2022 saw us scale that in new ways. Credly added about 70,000 new users each week, for the past 12 months, a strong signal of the need for individual upskilling. We now have more than 2000 enterprise learning clients. This part of our business is, and will continue to be, the subject of strategic investment. We have been hard at work developing our new Workforce Skills talent investment platform, a combination of Credly and Faethm capabilities that aims to help enterprises solve their talent planning, upskilling, and recruiting challenges. As it goes to market in 2023 and beyond, this new product has the potential to greatly accelerate the growth of our Workforce Skills division. In addition, we continue to expand our Pearson VUE offerings, and we are capitalising on the demand for English learning as a gateway to employment.

Beyond our workforce offerings, the progress of Pearson+ continues to point to an exciting future. In the calendar year 2022, our first full year in the market, Pearson+ had c.600,000 paid subscribers and 4.8 million registered users. We now have more than 1,800
e-textbook
titles in Pearson+ and we have introduced 18 study Channels to provide students with supplemental video and learning content. In the Fall of 2022, students viewed nearly 2 million minutes of Channels video content and utilised 1 million practice problems-impressive engagement activity. Between new content, the integration of Mondly, and broadened distribution through college bookstores, we continue to expand our total addressable market and prove the product market fit of Pearson+. We still see Pearson+ as the springboard for our Higher Education business and our bigger ambitions across a lifetime of learning. In our broader Higher Education business, we’re making excellent progress building the tools to return that division to top line growth. This effort centres on going to market more effectively and ensuring we have engaging products that faculty and students love to use.As we’ve demonstrated throughout the year, the cross over between our businesses is accelerating, which is creating synergies and forming the foundations of our digital learning ecosystem. We are at a critical moment where we can combine our capabilities to benefit a vast number of people. We believe there is enormous power in an ecosystem that brings our products together, with a consumer profile at its heart. As we move into 2023 and beyond, you will see us push further into a business model that connects consumer led learning into one Pearson experience.
Looking forward with confidence
As we turn this concept into reality, we continue to work hard every day to deliver what consumers demand: vibrant, impactful, frictionless learning solutions that will help them progress in their lives. As we deepen relationships with our consumers, they can move with ease between our products as their learning needs evolve. That creates lifetime value for learners, for Pearson, and for all our stakeholders.
We are delivering on what we have promised to our stakeholders, and we will continue to do that. The level of activity around the business is unprecedented. But it is also focused and better executed, resulting in better delivery of our strategic goals. I’d like to take this opportunity to thank each and every Pearson employee for their unwavering dedication to our purpose and our strategy. Led by their drive, determination, and unparalleled expertise, we are in a strong position to capture the opportunities in front of us.
Andy Bird
Chief Executive
| Annual report and accounts 2022 Pearson plc 11 |
Our strategy
An integrated strategy
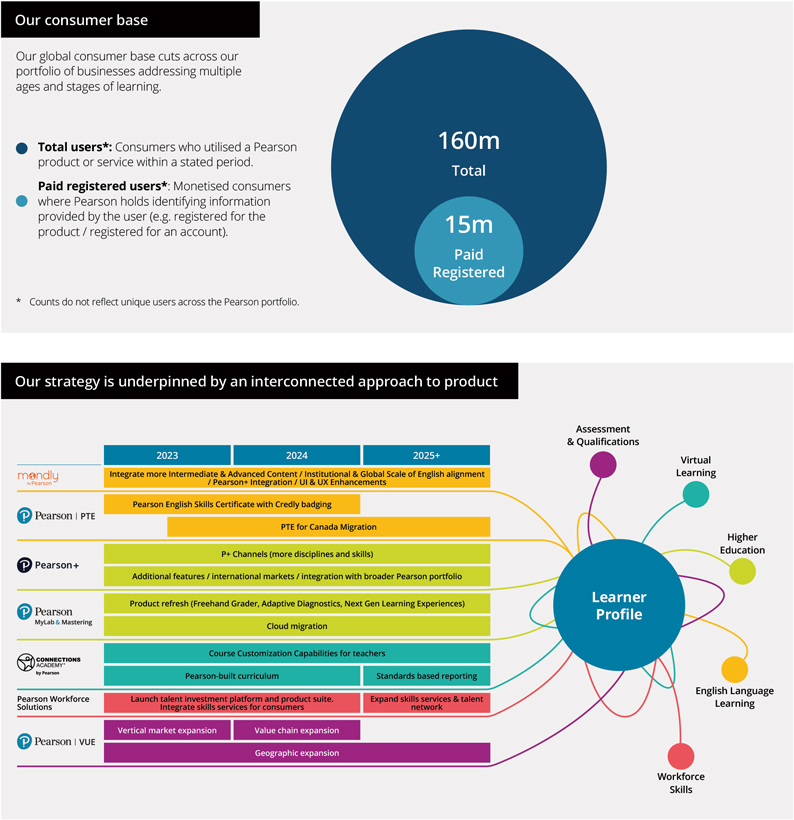
| In 2022, our products and services reached more than 160 million users around the world. |
Our strategy is to grow both by increasing our scale and customer reach. We are deepening our investment in opportunities across our divisions, and are expanding the interconnectedness between our divisions, to uncover and capitalise on further potential. We are confident that there are vast possibilities to expand our reach by linking our different learning capabilities into one experience as we move from standalone to connected learning applications.
We have a well-diversified global consumer base, coming from direct individual customers and institutional, enterprise and government relationships. Of our 160 million users, 15 million are registered with us. It is incumbent upon us to make every interaction with our consumers more meaningful by building relationships. We aim to provide all our audiences with the ability to move between our products as their learning needs evolve.
12 Pearson plc |
| | We are driving successful change through targeted investment, acquisitions, and disposals. |  | ||||
Sulaekha (Sue) Kolloru Barger, Chief Strategy Officer | ||||||
Strategic progress in 2022
Pearson has evolved from a matrixed holding company to the focusedlearning company we are today, as we integrate our businesses and products to form a lifelong digital learning ecosystem. As we better understand our consumers, we are embedding our insights to unlock synergies, build relationships and provide more relevant and inspiring products.
end-to-end
We are reshaping our product portfolio to meet increasing demand from consumers. Their needs are evolving to place a higher importance on skills and continuous learning, and they are consequently turning to their employers for support in upskilling and reskilling to ensure their relevancy in a dynamic workplace. More employers are investing in talent and we are working with them to provide the training and upskilling for their employees to help them progress.
Our 2022 results are evidence that our strategy is delivering results for our consumers and shareholders alike. We made good progress in 2022 both strategically and operationally, which is reflected in our strong financial performance: underlying sales growth was up 5% and underlying adjusted operating profit up 11%. Our new operating model has enabled us to identify approximately £120m of efficiencies in 2022, which we will deliver in 2023 and beyond. In turn, this will help us deliver our improved
mid-teens
margin target in 2023 - two years earlier than expected.Our strong progress in the face of macroeconomic headwinds demonstrates the benefits of our well-diversified business, coupled with the fundamental lifelong need to learn.
We are driving successful change by regularly reviewing and refining our portfolio through:
Significant organic investment, bringing new capabilities
| — | We have invested in new capabilities for Pearson+, including Channels functionality. |
| — | Expanded the reach of our VUE remote proctoring solution to include an in-country China solution |
| — | Workforce Skills launched Skills Accelerator, a suite of peer-supported, project-based learning courses that help people complete business-critical projects while developing future skills |
| — | Developed our MondlyWORKS capabilities and go-to-market |
| — | Virtual Learning began building an enhanced career readiness solution for K-12 students expected to launch later in 2023 |
Acquisitions to bolster our capabilities and enter new markets
| — | Recent acquisitions include Credly (Workforce Skills), Mondly (English Language Learning), Navvy (Assessment & Qualifications), and ClutchPrep (Higher Education), and we have signed an agreement to acquire PDRI (Assessment & Qualifications). |
Strategic disposals to refine our portfolio
| — | We completed the strategic review of our international courseware local publishing business, resulting in successful exits of our Europe, French Canadian, South Africa and Hong Kong local K12 publishing businesses. |

| Annual report and accounts 2022 Pearson plc 13 |
Our strategy
continued
Strategy in action | ||
Enterprise / Workforce Skills Our opportunity Our ambition is to enable a world where people and organisations can achieve their full potential in the new skills economy. We believe that is no longer just about what you’ve done, but what you can do. Our objective is to provide solutions that help employees thrive and empower employers to maximise the value of their most important asset: their people. The £200bn global Workforce Skills market is comprised of several different sub-markets including employee learning and development, talent management, andpre-hire recruitment services. This market is in the midst of widespread disruption, driven by seismic change in the workplace. The World Economic Forum estimates that over 1 billion people will need reskilling by 2030.Organisations are struggling to navigate this change because they lack a comprehensive understanding of the skills their employees have, or the skills they need, to achieve their commercial goals. And without this understanding, their investments into current learning and development services are not delivering the results that they should be. Progress so far We have built integrated product and engineering teams, re-engineered our product portfolio and tech stack, developed a new product roadmap, launched new products, created a single global sales team and built astate-of-the-art We have reshaped our Workforce Skills portfolio to serve an expanding remit, building on Pearson’s existing strong foundation with Enterprise consumers (c.16% of Group sales). To focus on the needs of our different customer segments, we have organised our | Workforce Skills division into two parts: Vocational Qualifications and Workforce Solutions. Vocational Qualifications offers high quality vocational qualifications that allow learners to build the knowledge, skills and behaviours they need for career success. Whether it’s a Higher National Diploma in Computing, a BTEC in Health and Social Care, or training as part of the TQ Construction Academy, these provide the skills and qualifications that our economy needs now and in the future. Workforce Solutions is our enterprise and consumer-focused business. It brings together our two recent acquisitions – Credly and Faethm – with our existing portfolio of products and capabilities in GED, Talentlens and Accelerated Pathways. We have moved quickly this year to restructure and integrate these businesses into a single global entity. Workforce Solutions’ portfolio of services has been specifically designed to meet the needs of enterprises and institutional customers, but with a core focus on the needs of the individual consumers upon which the success of any organisation depends. Throughout 2022, we continued to grow our revenue, including our SaaS subscriptions, expanding our customer base by 133%, and accelerating our reach by adding 4.7m new users to our Credly platform. We firmly fit into Pearson’s wider strategy, with products that can interconnect with others across the Pearson ecosystem, supporting and accelerating Pearson’s lifelong learning ambition. For example, we have a library of certified preparation content and courses for IT professionals in Professional Learning and Development which is relevant for learners in the workplace. English is the globally recognised language of business, so we have added English to Faethm’s skills framework, as well as offering Credly badges for Pearson’s range of English assessment products. | |
English Language Learning Our opportunity We operate in a c.£6 billion addressable market, which integrates three key market segments: 1. Institutional English Language Learning: an addressable market of approximately £3 billion. We offer digital and blended courseware solutions to academic institutions, private language schools and enterprises across the globe. 2. Online self-study language learning, an addressable market of c.£2 billion with double-digit growth, which we have entered through our acquisition of Mondly. 3. High Stakes Assessments: an addressable market of c.£900 million. Our flagship product PTE is a verified, secure certification of English proficiency for international migrants and students. A substantial element of our Institutional business is in K-12, which is generally government funded and backed, making it stable in a variety of macro-economic environments. For PTE, we believe that there will be a strong desire for people to invest in their education and to study in our key destination markets. We aim to acquire more new and existing language learners, and capture more of their lifetime spend on language learning, through cross-selling English Language Learning solutions. We are dedicated to growing the business through improving customer experience, which has already been successful in 2022, with a 24% increase in underlying revenue and 33% increase in underlying profit, and with the potential to gain further share over the next few years. | a. Our institutional business plays an important strategic role. It provides the potential to form relationships with millions of institutional learners as well as corporate learners, and it lends invaluable reputation and credibility in the language space to our entire product portfolio It is also a large lead-generator for our suite of assessment products and Mondly, both of which are complementary products that enhance the student experience. b. Mondly gives us more opportunities to reach more committed learners: a foothold in the fast-growing direct to consumer online language learning market, and the MondlyWORKS platform for enterprise language learning. c. PTE and Mondly give us more direct relationships with consumers, which is strategically important to the division and our ability to cross-sell within Pearson. Progress so far In 2022, we developed the Pearson English Skills Certificate, a new mid-stakes English exam which will complement the PTE to capture more of the English assessments market, and which will launch in 2023. We prioritised aligning Pearson products to the Global Scale of English (GSE), our proprietary scale that allows more granular understanding of English ability, furthermore, working to align Workforce Skills’ Faethm product, laying the ground for future collaboration. Finally, in addition to finding ways to use our institutional content to bolster Mondly material, particularly in the intermediate and advanced levels, we integrated Mondly with Pearson+, welcoming over 10,000 new users through this route. | |
14 Pearson plc |
This allows consumers to prove their language proficiency to employers. The connection between students and work is an obvious collaboration point with Pearson+ and there are fantastic opportunities to connect our services with Pearson VUE, to maximise the value that Pearson can bring to our enterprise customers and consumers.  Mike Howells, President, Workforce Skills | Pearson+ Our opportunity We are a leader in the Higher Education courseware market, with millions of students enrolled in courses using Pearson eTextbooks. We want to leverage this market dynamic in two phases: 1. Shift eTextbook consumption for students directly to Pearson+, and improve monetisation 2. Engage and retain students with relevant and valuable services beyond eTextbooks, and maximise consumer lifetime value Pearson+ is currently monetised through paid access to eTextbooks by students where faculty adopt Pearson content in their courses. Our existing Higher Education business provides a large, efficient customer acquisition funnel for Pearson+. Additional content beyond eTextbooks, such as Pearson+ Channels, will encourage further use of the application. Over time, Pearson+ users can be further monetised through cross-selling other relevant Pearson products and services. Progress so far In 2022, we started to scale users and expand product features. During the fall back-to-school  Tim Bozik, Chief Product Officer | |||||||||
Spotlight on Credly — Credly is an end-to-end — It adds an established, well-known credentialing service to our workforce analytics, learning & assessment capabilities — It has a network of 3,000 certification and badge issuers — It generates 70,000 new users every week — It has issued more than 50 million credentials | ||||||||||
 Giovanni Giovannelli, President, English Language Learning | ||||||||||
Spotlight on Mondly — Global language learning app — 100m+ downloads — 446k paid subscriptions — Highly-rated app both on mobile and VR — 41 languages offered, with more than 1,300 possible language pairs (learners can learn a target language from any other language) | ||||||||||
| Annual report and accounts 2022 Pearson plc 15 |
Our business model
Creating value
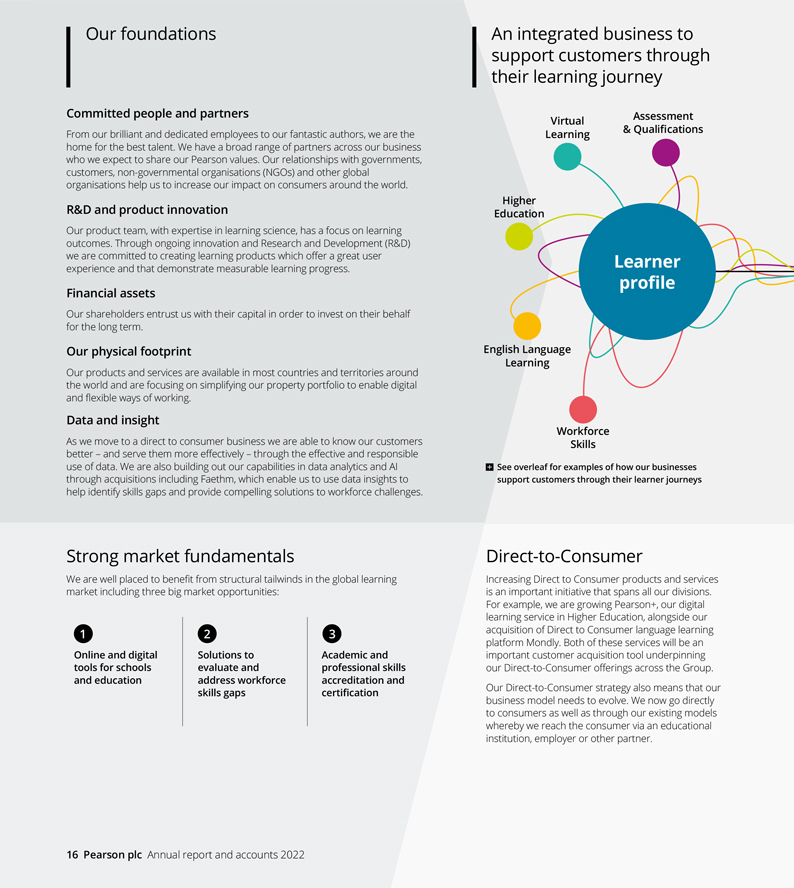
Our foundations An integrated business to support customers through their learning journey Committed people and partners Assessment Virtual From our brilliant and dedicated employees to our fantastic authors, we are the Learning & Qualifications home for the best talent. We have a broad range of partners across our business who we expect to share our Pearson values. Our relationships with governments, customers, non-governmental organisations (NGOs) and other global organisations help us to increase our impact on consumers around the world. Higher R&D and product innovation Education Our product team, with expertise in learning science, has a focus on learning outcomes. Through ongoing innovation and Research and Development (R&D) we are committed to creating learning products which offer a great user Learner experience and that demonstrate measurable learning progress. profile Financial assets Our shareholders entrust us with their capital in order to invest on their behalf for the long term. Our physical footprint English Language Learning Our products and services are available in most countries and territories around the world and are focusing on simplifying our property portfolio to enable digital and flexible ways of working. Data and insight As we move to a direct to consumer business we are able to know our customers Workforce Skills better – and serve them more effectively – through the effective and responsible use of data. We are also building out our capabilities in data analytics and AI See overleaf for examples of how our businesses through acquisitions including Faethm, which enable us to use data insights to support customers through their learner journeys help identify skills gaps and provide compelling solutions to workforce challenges. Strong market fundamentals Direct-to-Consumer We are well placed to benefit from structural tailwinds in the global learning Increasing Direct to Consumer products and services market including three big market opportunities: is an important initiative that spans all our divisions. For example, we are growing Pearson+, our digital learning service in Higher Education, alongside our 1 2 3 acquisition of Direct to Consumer language learning platform Mondly. Both of these services will be an Online and digital Solutions to Academic and important customer acquisition tool underpinning tools for schools evaluate and professional skills our Direct-to-Consumer offerings across the Group. and education address workforce accreditation and skills gaps certification Our Direct-to-Consumer strategy also means that our business model needs to evolve. We now go directly to consumers as well as through our existing models whereby we reach the consumer via an educational institution, employer or other partner.
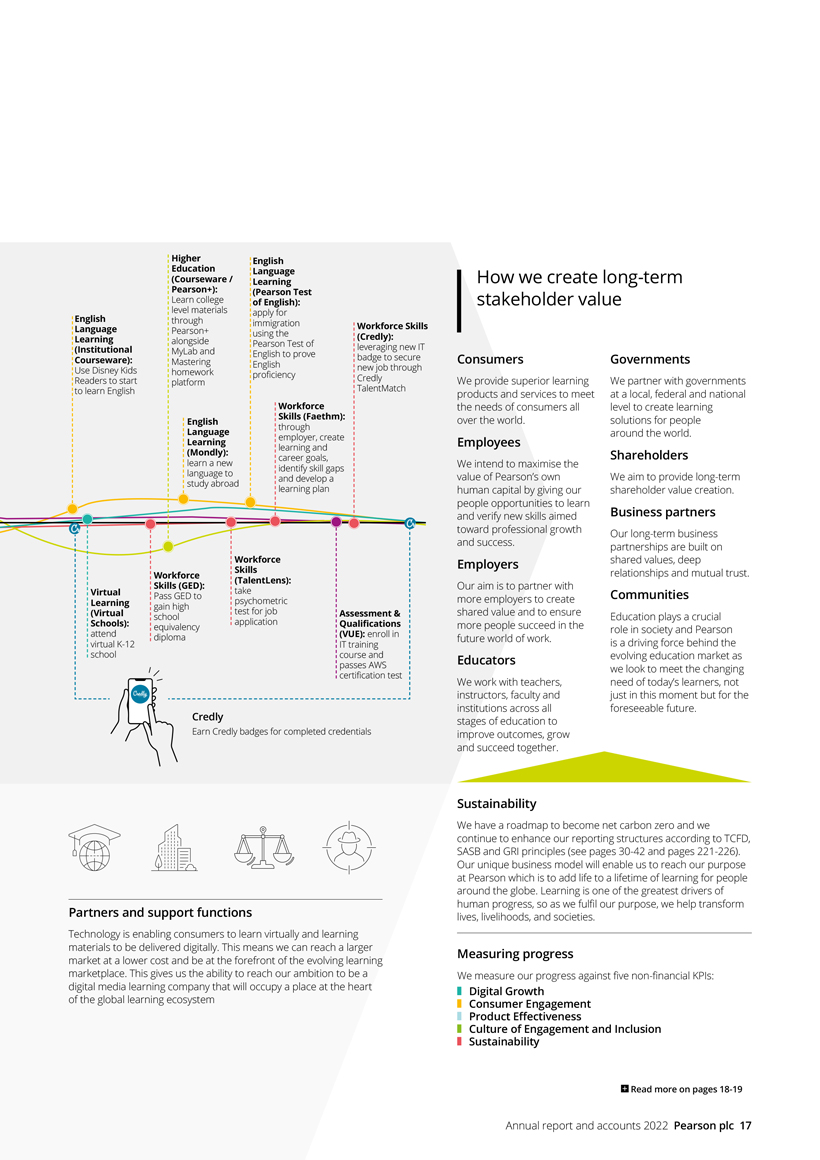
Partners and support functions Technology is enabling consumers to learn virtually and learning materials to be delivered digitally. This means we can reach a larger market at a lower cost and be at the forefront of the evolving learning marketplace. This gives us the ability to reach our ambition to be a digital media learning company that will occupy a place at the heart of the global learning ecosystem How we create long-term stakeholder value Consumers We provide superior learning products and services to meet the needs of consumers all over the world. Employees We intend to maximise the value of Pearson’s own human capital by giving our people opportunities to learn and verify new skills aimed toward professional growth and success. Employers Our aim is to partner with more employers to create shared value and to ensure more people succeed in the future world of work. Educators We work with teachers, instructors, faculty and institutions across all stages of education to improve outcomes, grow and succeed together. Governments We partner with governments at a local, federal and national level to create learning solutions for people around the world. Shareholders We aim to provide long-term shareholder value creation. Business partners Our long-term business partnerships are built on shared values, deep relationships and mutual trust. Communities Education plays a crucial role in society and Pearson is a driving force behind the evolving education market as we look to meet the changing need of today’s learners, not just in this moment but for the foreseeable future. Sustainability We have a roadmap to become net carbon zero and we continue to enhance our reporting structures according to TCFD, SASB and GRI principles (see pages
30-42
and pages221-226).
Our unique business model will enable us to reach our purpose at Pearson which is to add life to a lifetime of learning for people around the globe. Learning is one of the greatest drivers of human progress, so as we fulfil our purpose, we help transform lives, livelihoods, and societies. Measuring progress We measure our progress against fivenon-financial
KPIs: Digital Growth Consumer Engagement Product Effectiveness Culture of Engagement and Inclusion SustainabilityKey performance indicators
Monitoring progress
Non-financial measures |
Digital Growth Objective: Drive digital revenue growth | Digital sales* Underlying Growth in group digital and digital-enabled sales +9% (2021: +9%) | 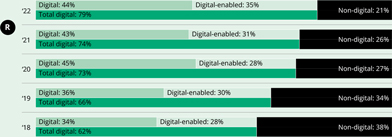 | ||||||||
Virtual Schools US enrolments 106k (2021: 111k) | OPM student enrolments 270k (2021: 275k) | OnVUE volumes 3.0m (2021: 3.0m) | PTE volume 827k (2021: 436k) | Higher Education US digital registrations 9.9m (2021: 11.1m a ) | ||||||
Consumer Engagement Objective: Create engaging and personalised consumer experiences | NPS for Connections Academy +67 (2021: +62) | NPS for PTE +52 (2021: +56) | Mondly paid subscriptions 446K (2021: n/a) | Workforce Skills registered users c 4.7m (2021: n/a) | Pearson+ registered users b 2.83m (2021: 2.75m) | |||||
Product Effectiveness Objective: Improve the effectiveness of our products to deliver better outcomes | PTE speed of score return 1.3 days (2021: 1.2 days) | VUE Test volumes d 19.4m (2021: 16.8m) | VUE partner retention e 99.9% (2021: 99%) | Workforce Skills number of enterprise customers f 1,503 (2021 : 645) | Workforce Skills enterprise customer net retention rate 74% (2021: n/a) | Higher Education Product usage - text units 4.8m (2021: 5.4m) | ||||||
Culture of Engagement and Inclusion Objective: Build an inclusive culture and increase diverse representation | Employee Engagement Pearson uses the Gallup Q 12 ® surveyto measure engagement, annually 3.96 grand mean on a 5 point Likert scale (2021: n/a) | Investing in diverse talent The % of responses who agree or strongly agree to Gallup Q 12 ® surveyquestions In the last six months, someone at work has talked to me about my progress 67% (2021: n/a) This last year, I have had opportunities at work to learn and grow 72% (2021: n/a) | Culture of inclusion index The grand mean of 3 Gallup Q 12 ® survey questions — At work, I am treated with respect — My company is committed to building the strengths of each employee — If I raised a concern about ethics and integrity, I am confident my employer would do what is right 4.12 grand mean on a 5 point Likert scale (2021: n/a) | Increasing diverse talent % of people in leadership development and mentoring programmes who are diverse. 75% (2021: n/a) % of people in succession plans for leadership who are diverse |   | |||||||
Women People of Colour/BAME 52% 26% (2021: 72%) (2021: 24%) | ||||||||||||
Sustainability  Strategy | Progress against achieving net zero carbon by 2030, as measured through percentage carbon reduction | |||||||||||
Objective: Achieve net zero carbon by 2030 | Reduction in total tCO 2 in 2022 | Reduction in total tCO 2 in 2021 | ||||||||||
33% | 31% | |||||||||||
vs 2018 g | vs 2018 g | |||||||||||
| a. | 2021 US digital registrations restated from 11.4m to 11.1m due to recategorising 0.3m of registrations from US to International. |
| b. | Pearson+ registered users represents the number of unique user accounts added over an academic year. |
| c. | Workforce Skills registered users represents the number of net new user accounts on a trailing 12-month basis and includes net new user accounts from Credly pre-acquisition. |
| d. | VUE test volumes include GED tests. |
| e. | VUE Partner retention is based on revenue mix. |
| f. | Workforce Skills number of enterprise customers represent the number of customers at period end. |
| g. | Net zero carbon figures have been restated in 2021 to reflect acquisitions, disposals and data improvements. The net zero carbon figures have been assured by an independent third-party, Corporate Citizenship. |
| * | Historical figures restated to exclude Wall Street English and US K-12 Courseware (sold in 2018, and 2019 respectively). |
Please find further details on our Strategic KPIs here https://plc.pearson.com |  | See how this aligns strategy to management reward: pages 98 & 99 |
18 Pearson plc |
| Financial measures |
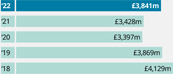
Sales b |  | Adjusted operating profit a |  | Net debt a | ||||
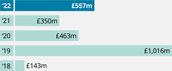
£3,841m | £456m | £557m | ||||||
 |  |  | ||||||
| This is our revenue as reported in our income statement. | A non-GAAP financial measure that enables management to consistently track the underlying operational performance of the Group. | This is a non-GAAP financial measure and is used by management to assess the Group’s cash position. | ||||||
Adjusted earnings per share a |  | Operating profit b | Basic earnings per share b | |||||
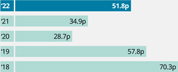
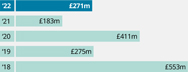
51.8p | £271m | 32.8p | ||||||
 |  |  | ||||||
A non-GAAP financial measure used to evaluate performance. | This is our operating profit as reported in our income statement. | A measure of the amount of profit that can be allocated to one share of our common stock. | ||||||
Operating cash flow and cash conversion a | | Net cash generated from operations b | Dividend per share | |||||
£401m (88%) | £527m | 21.5p | ||||||
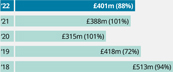 | 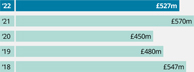 | 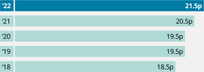 | ||||||
| Operating cash flow is an adjusted measure and is presented in order to align the cash flows with corresponding adjusted operating profit measures. | This is our net cash generated from operations as reported in our cash flow statement. | This is the proposed full year dividend. Our dividend policy is to be progressive and sustainable. | ||||||
Total shareholder returns c 57.16% 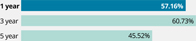 This is a measure of financial performance of shares over time. |  | Return on Capital a 8.7% 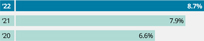 A non-GAAP measure of how efficiently we are generating returns from our asset base. |  | a. See page 215 for an explanation of these alternative performance measures. b. Statutory measure. c. Source: Bloomberg. d. Comparative amounts have been restated, see note 1 of the financial statements for further details. Note: See page 215 for full reconciliation of the alternative performance measures to the equivalent statutory measure. | ||||
 | See how this aligns strategy to management reward: pages 98 & 99 |
For more information on our KPI measures, including why and how we measure them, please refer to the glossary on our website.
| Annual report and accounts 2022 Pearson plc 19 |
Financial review
 | We saw continuing momentum in 2022, with 5% underlying sales growth and adjusted operating profit of £456 million. | |
Sally Johnson, Chief Financial Officer | ||

| Financial summary | ||||||||||||||||||||
Business performance | ||||||||||||||||||||
| £ millions | 2022 | 2021 | Headline growth | CER growth | Underlying growth | |||||||||||||||
| Sales | 3,841 | 3,428 | 12% | 3% | 5% | |||||||||||||||
| Adjusted operating profit | 456 | 385 | 18% | 6% | 11% | |||||||||||||||
| Operating cash flow | 401 | 388 | ||||||||||||||||||
| Adjusted earnings per share | 51.8p | 34.9p | ||||||||||||||||||
| Net debt | (557) | (350 | ) | |||||||||||||||||
Statutory results | ||||||||||||||||||||
| £ millions | 2022 | 2021 | Headline growth | |||||||||||||||||
| Sales | 3,841 | 3,428 | 12% | |||||||||||||||||
| Operating profit | 271 | 183 | ||||||||||||||||||
| Profit for the year | 244 | 178 | * | |||||||||||||||||
| Cash generated from operations | 527 | 570 | ||||||||||||||||||
| Basic earnings per share | 32.8p | 23.5p | * | |||||||||||||||||
| Dividend per share | 21.5p | 20.5p | ||||||||||||||||||
Throughout this section: a) Growth rates are on an underlying basis unless otherwise stated. Underlying growth rates exclude currency movements and portfolio changes; b) The ‘business performance’ measures are non-GAAP measures, and reconciliations to the equivalent statutory heading under IFRS are included in the financial key performance indicators section on pages 215-219; c) Constant exchange rates are calculated by assuming the average FX in the prior year prevailed through the current year.
| * | Comparative amounts have been restated, see note 1b to the financial statements for further details. |
20 Pearson plc |
Financial expectations | ||||||||||||||||||||||||
| Segment | 2022 revenue (£m) | Margins 2022* | 2023 expectations Revenue | 2023 expectations Margins* | Underlying revenue 3-year CAGR 2022 to 2025 | Margins 2025* | ||||||||||||||||||
Assessment & Qualifications | 1,444 | 18% | Low to mid-single digit | Increase | Low to mid-single digit | Increase | ||||||||||||||||||
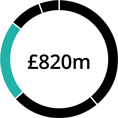
Virtual Learning | 820 | 9% | ||||||||||||||||||||||
| Virtual Schools | 519 | | Mid-single digit decline | | Increase | Low-single digit | Increase | |||||||||||||||||
| OPM | 301 | – – – – – – – – – – – – Under strategic review – – – – – – – – – – – – | ||||||||||||||||||||||
Higher Education | 898 | 10% | Low-single digit decline | Increase | | Low to mid-single digit | | Increase | ||||||||||||||||
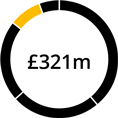
English Language Learning | 321 | 8% | High-single digit | Increase | High-single digit | Increase | ||||||||||||||||||
Workforce Skills | 204 | (1)% | Double-digits | Improve | Greater than 20% | Increase | ||||||||||||||||||
Strategic review | 154 | 10% | ||||||||||||||||||||||
Group | 3,841 | 12% | | Excluding OPM and Strategic review: Low to mid-single digit | | Mid-teens | | Mid-single digit | | | Upper end of mid-teens | | ||||||||||||
| * | Adjusted operating profit margins. |
Operating results
Sales increased on a headline basis by £413m or 12% from £3,428m in 2021 to £3,841m in 2022 and adjusted operating profit increased by £71m or 18% from £385m in 2021 to £456m in 2022 (for a reconciliation of this measure see note 2 to the consolidated financial statements).
The headline basis simply compares the reported results for 2022 with those for 2021. We also present sales and profits on an underlying basis which exclude the effects of exchange, the effect of portfolio changes arising from acquisitions and disposals and the impact of adopting new accounting standards that are not retrospectively applied. Our portfolio change is calculated by excluding sales and profits made by businesses disposed in either 2021 or 2022 and by ensuring the contribution from acquisitions is comparable year on year. Portfolio changes mainly relate to the disposals of our international courseware local publishing businesses in Europe, French-speaking Canada, South Africa and Hong Kong in 2022, the sale of the Sistemas business in Brazil in 2021 and the acquisitions of Credly and Mondly in 2022 and of Faethm in 2021.
| All figures in £ millions | 2022 | 2021 | ||||||
| Operating profit | 271 | 183 | ||||||
| Add back: Cost of major restructuring | 150 | 214 | ||||||
| Add back: Intangible charges | 56 | 51 | ||||||
| Add back: UK pension discretionary increases | 3 | – | ||||||
| Add back: Other net gains and losses | (24 | ) | (63) | |||||
Adjusted operating profit | 456 | 385 | ||||||
On an underlying basis, sales increased by 5% in 2022 compared to 2021 and adjusted operating profit increased by 11%. Currency movements increased sales by £296m and increased adjusted operating profit by £46m. Portfolio changes decreased sales by £37m and decreased adjusted operating profit by £13m. There were no new accounting standards adopted in 2022 that impacted sales or operating profits.
Adjusted operating profit includes the results from discontinued operations when relevant but excludes charges for intangible amortisation and impairment, acquisition related costs, gains and losses arising from disposals, the cost of major restructuring and one off-costs related to the UK pension scheme. A summary of these adjustments is included below and in more detail in note 2 to the consolidated financial statements.
In August 2022, the Group announced a major restructuring programme to run in 2022. The programme includes efficiencies in product and content, support costs, technology and corporate property.
The restructuring costs in 2022 of £150m mainly relate to staff redundancies and impairment of right-of-use property assets. In 2021, restructuring costs of £214m mainly related to the impairment of right-of-use property assets, the write-down of product development assets and staff redundancies. The 2022 charge includes the impact of updated assumptions related to the recoverability of right-of-use assets made in 2021.
Intangible amortisation charges in 2022 were £56m compared to a charge of £51m in 2021. This is due to increased amortisation from recent acquisitions partially offset by a reduction in amortisation from intangible assets at the end of their useful life and recent disposals.
UK pension discretionary increases in 2022 relate to one-off pension increases awarded to certain cohorts of pensioners in response to the cost of living crisis.
2023 outlook
We are confident of further group underlying sales growth of low to mid-single digit, excluding OPM and the strategic review businesses, with adjusted operating profit and tax in line with current market expectations
1
. Our interest charge is expected to be c.£35m.| — | Assessment & Qualifications revenue growth of low to mid-single digit with increased margins. |
| — | In Virtual Learning, Virtual Schools revenue to decline by mid-single digit impacted by the COVID-19 cohort unwind in the 2022/23 academic year, as well as the loss of a major school. We expect margins to increase. We remain confident in the long-term performance of this division and will launch Career Academies aimed at supporting teenagers who wish to gain career education and experience. Four Career Academies will operate in the 2023-24 school year in four states and enrolment is underway. OPM continues to be under strategic review. |
| — | Higher Education revenue to decline, by low-single digit, with increased margins. |
| — | English Language Learning revenue growth of high-single digit with increased margins. |
| — | Double-digits revenue growth in Workforce Skills, underpinned by our talent investment platform, with improved margins. |
2025 ambition
We continue to expect the Group to achieve mid-single digit underlying revenue 3-year CAGR from 2022 to 2025 and for margins to be mid-teens in the near term, as we invest to drive growth, improving by 2025.
| 1. | 2023 consensus on the Pearson website as at 28 th November 2022; median adjusted operating profit of £585m at £:$ 1.14, tax rate 24%. |
Annual report and accounts 2022
Pearson plc 21
Financial review
continued
Other net gains and losses in 2022 relate to the gains on the disposal of our international courseware local publishing businesses in Europe, French-speaking Canada and Hong Kong and a gain arising on a decrease in the deferred consideration payable on prior year acquisitions, offset by a loss on disposal of our international courseware local publishing businesses in South Africa due to recycled currency translation adjustments and costs related to disposals and acquisitions. Other net gains and losses in 2021 largely related to the disposal of PIHE and the disposal of the K12 Sistemas business in Brazil offset by costs related to the acquisition of Faethm and the wind down of certain strategic review businesses.
The reported operating profit of £271m in 2022 compares to a profit of £183m in 2021. The increase in 2022 was driven by operating leverage on revenue growth, property cost savings and a lower restructuring charge, partially offset by inflation and a reduction in other net gains and losses from business acquisitions and disposals.
Divisional results
| £ millions | 2022 | 2021 | Headline growth | CER Growth | Underlying growth | |||||||||||||||
| Sales | ||||||||||||||||||||
| Assessment & Qualifications | 1,444 | 1,238± | 17% | 8% | 8% | |||||||||||||||
| Virtual Learning | 820 | 713 | 15% | 4% | 4% | |||||||||||||||
| Higher Education | 898 | 849 | 6% | (4)% | (4)% | |||||||||||||||
| English Language Learning | 321 | 238 | 35% | 28% | 24% | |||||||||||||||
| Workforce Skills | 204 | 172 | 19% | 16% | 7% | |||||||||||||||
| Strategic review | 154 | 218± | (29)% | (30)% | (16)% | |||||||||||||||
| Total | 3,841 | 3,428 | 12% | 3% | 5% | |||||||||||||||
| Adjusted operating profit | ||||||||||||||||||||
| Assessment & Qualifications | 258 | 219± | 18% | 6% | 6% | |||||||||||||||
| Virtual Learning | 70 | 32 | 119% | 88% | 88% | |||||||||||||||
| Higher Education | 91 | 73 | 25% | 12% | 12% | |||||||||||||||
| English Language Learning | 25 | 15 | 67% | 47% | 33% | |||||||||||||||
| Workforce Skills | (3) | 27 | (111)% | (104)% | (67)% | |||||||||||||||
| Strategic review | 15 | 19± | (21)% | (26)% | 0% | |||||||||||||||
| Total adjusted operating profit | 456 | 385 | 18% | 6% | 11% | |||||||||||||||
± Comparative amounts have been restated to reflect the move between operating segments.
Assessment & Qualifications
In Assessment & Qualifications, sales increased 8% on an underlying basis and 17% on a headline basis. Adjusted operating profit increased 6% in underlying terms due to operating leverage on revenue growth partially offset by inflation and 18% in headline terms due to this and currency movements.
Pearson VUE sales were flat in underlying terms with test volumes increasing 16% to 19.4m with particularly strong growth in the IT and healthcare segments, offset by the known headwind resulting from the DVSA contract change, as previously announced in 2021. Within VUE test volumes, we still capture the volume for all three DVSA regions, given we provide the central platform for test delivery. We retained all our major contracts that were up for renewal and increased our contract renewal rate to 99.9% across the business.
In US Student Assessment, sales increased 17% in underlying terms due to a combination of the commencement of new contracts, which were won in 2020 and 2021, a return of volumes with full state testing commencing post COVID-19, and the addition of new services to existing contracts.
In Clinical Assessment, sales increased 7% in underlying terms due to good government funding and continued focus on health and wellbeing.
In UK and International Qualifications, sales increased 16% in underlying terms as exams resumed following COVID-19.
Virtual Learning
In Virtual Learning, sales increased 4% on an underlying basis and 15% on a headline basis. Adjusted operating profit grew 88% in underlying terms due to operating leverage on revenue growth and efficiency improvements in Virtual Schools and OPM, more than offsetting the investment in our Virtual Schools’ platform and teaching costs, and increased 119% in headline terms due to this and currency movements.
Virtual Schools sales were up 4%, driven by firm retention rates in the 2021/22 academic year and favourable revenue mix, partially offset by a 5% decline in enrolments for the 2022/23 academic year and lower district partnership renewals. We opened new full-time online partner schools in Colorado, Missouri and Virginia which partially offset the planned exits of partner schools in Washington, Colorado, Missouri and one of two schools in Tennessee. As at December 2022, this brings the 2022/2023 total number of partner schools to 46 in 31 states.
In OPM, sales were up 4% driven by enrolment growth in our UK and Australia programs, which were offset by an enrolment decline in our North America programs.
Higher Education
In Higher Education, sales declined 4% for the full year on an underlying basis and increased 6% on a headline basis due to currency movements. Adjusted operating profit increased 12% in underlying terms driven primarily by cost savings, partially offset by trading performance, and increased 25% in headline terms due to this and currency movements.
In the US, we saw a decline in enrolments and a loss of adoptions to non-mainstream publishers, including open educational resources, partially offset by improved pricing. There was continued momentum in Inclusive Access with 9% sales growth to not-for-profit institutions and the total number of institutions increasing to 1,040. Pearson+ performed well in the Fall semester with 2.83m registered users and 406k paid subscriptions, representing a threefold increase compared to the prior year Fall semester.
English Language Learning
In English Language Learning, sales were up 24% on an underlying basis and 35% on a headline basis. Adjusted operating profit increased by 33% in underlying terms due to increased revenue partially offset by increased investment and increased 67% in headline terms due to this and currency movements.
PTE volumes were up 90% driven by border re-openings, as well as market share gain in India. Within Institutional, there was strong growth in Latin America and the Middle East, offset by the impact of government reforms in China.
Workforce Skills
In Workforce Skills, sales were up 7% on an underlying and 19% on a headline basis. Adjusted operating profit declined by 67% in underlying terms due to investment in the business across Faethm, Credly and our talent investment platform and decreased 111% in headline terms due to this, currency movements and portfolio changes.
Revenue growth was driven by growth in BTEC and Apprenticeships, GED and TalentLens. The Vocational Qualifications business (previously known as the Performance business) grew by 5% in underlying terms. The Workforce Solutions business (previously known as the Transformation business) grew by 12% in underlying terms. Pearson has 1,503 enterprise clients in its Workforce Skills portfolio, up 133% on last year, with the acquisition of Credly underpinning this growth.
22 Pearson plc |
Strategic review
Sales in our international courseware local publishing businesses under strategic review declined 16% on an underlying basis and were down 29% on a headline basis for the full year. Following the announcement of the sale of our international courseware local publishing businesses in Europe, French speaking Canada, Hong Kong and South Africa, these financials are no longer included in our underlying performance measures.
Net finance costs
Net interest payable reflected in adjusted earnings in 2022 was £1m, compared to £57m in 2021. The difference is primarily due to the release of £35m of interest recorded in respect of provisions for uncertain tax positions where the related interest was recognised in this line in the income statement. In addition, interest charges have reduced due to the reduction in gross bond debt and increased interest income on cash balances given interest rate rises.
Net finance income relating to retirement benefits has been excluded from our adjusted earnings as we believe the income statement presentation does not reflect the economic substance of the underlying assets and liabilities. Also included in the net finance costs (but not in our adjusted measure) are interest costs relating to acquisition or disposal transactions, fair value movements on investments classified as fair value through profit and loss, foreign exchange and other gains and losses on derivatives. Interest relating to acquisition or disposal transactions is excluded from adjusted earnings as it is considered part of the acquisition cost or disposal proceeds rather than being reflective of the underlying financing costs of the Group. Foreign exchange, fair value movements and other gains and losses are excluded from adjusted earnings as they represent short-term fluctuations in market value and are subject to significant volatility. Other gains and losses may not be realised in due course as it is normally the intention to hold the related instruments to maturity. Interest on certain tax provisions is excluded from our adjusted measure in order to mirror the treatment of the underlying tax item.
In 2022, the total of these items excluded from adjusted earnings was income of £53m compared to income of £51m in 2021. Net finance income in respect of retirement benefits increased from £4m in 2021 to £9m in 2022 reflecting the comparative funding position of the plans at the beginning of each year and higher prevailing discount rates. Interest costs in respect of deferred and contingent consideration are £5m in 2022 due to recent acquisitions. In 2022, there were no finance charges relating to the revaluation of the K12 disposal proceeds compared to income of £6m in 2021 as the outstanding amount has been fully repaid. Fair value gains on investments in unlisted securities are £28m in 2022 compared to £20m in 2021. In addition, there were similar gains year on year on long-term interest rate hedges and an interest charge on tax provisions of £5m has been recognised in 2022 in relation to the State Aid matter.
| £ millions | 2022 | 2021 | ||||||
| Net interest payable | (1 | ) | (57 | ) | ||||
| Finance income in respect of retirement benefits | 9 | 4 | ||||||
| Fair value remeasurement of investments held at FVTPL | 28 | 20 | * | |||||
| Other net finance costs | 16 | 27 | ||||||
Net finance costs | 52 | (6 | )* | |||||
| * | Comparative amounts have been restated, see note 1b to the |
financial statements for further details. |
Taxation
The reported tax charge on a statutory basis in 2022 was a charge of £79m (24.5%) compared to a credit of £1m* (0.6%) in 2021. The tax charge for the period has been impacted principally by two items:
| — | The release of tax risk provisions totalling £72m following the expiry of the statute of limitations for certain periods in the US. This release impacts both statutory and adjusted earnings with a £37m credit to adjusted earnings and the remainder only impacting statutory results. |
| — | As previously disclosed, the European Commission determined that the United Kingdom controlled foreign company group financing partial exemption partially constituted State Aid. This decision was appealed by the UK Government and other parties. On 8 June 2022, the EU General Court dismissed the appeal. Following the EU General Court’s negative decision, the UK Government and other parties have submitted appeals to the European the Court of Justice. At 31 December 2021, the potential risk associated with this issue was disclosed as a contingent liability, however, following the dismissal of the first appeal the prospects of successfully challenging the European Commission’s decision are now considered to be such that a provision is required. |
| — | On that basis a tax provision of £63m plus £5m of associated interest has been recorded. The provision represents an estimate of the expected value which has been calculated by considering a range of possible outcomes and applying a probability to each, resulting in a weighted average outcome. The possible outcomes considered range from no liability through to the full exposure (£105m excluding interest). Due to the large and unusual nature of the provision and the specific one-off nature of the issue, the provision is excluded from adjusted earnings. There is no cash impact in 2022 as a payment on account was made during 2021. The provision of £63m has been offset on the balance sheet against the payments previously made. As the provision is less than the payments made there is a remaining non-current tax receivable of £41m disclosed on the balance sheet. |
The tax on adjusted earnings in 2022 was a charge of £71m (2021: £64m), corresponding to an effective tax rate on adjusted profit before tax of 15.6% (2021: 19.5%). The decrease in the effective rate is primarily due to the release of tax risk provisions following the expiry of the statute of limitations in the US. For a reconciliation of the adjusted measure see note 7 to the consolidated financial statements.
In 2022, there was a net tax payment of £109m (2021: £177m). The overall amount decreased primarily due to the 2021 payment of £97m related to the ongoing EU Commission investigation which is non-recurring. Excluding this payment, tax payments increased primarily due to increased operating profits and legislative changes in the US.
A net deferred tax asset of £20m is recognised in 2022 compared to a net £17m deferred tax asset in 2021. The current tax creditor principally consists of provisions for tax uncertainties. There are contingent liabilities in relation to tax as outlined in note 34 to the consolidated financial statements.
Earnings per share
Adjusted earnings includes adjusted operating profit and adjusted finance and tax charges. The reconciling items between the statutory inputs to earnings per share and the adjusted inputs are discussed in the previous sections.
Adjusted earnings per share is 51.8p in 2022 compared to 34.9p in 2021. The increase is primarily driven by an increase in adjusted operating profit, a reduction in net finance costs, a reduction in the adjusted effective tax rate and a decrease in the number of shares following the share buy back.
Basic earnings per share is 32.8p in 2022 compared to 23.5p* in 2021. The increase in 2022 is mainly due to increased operating profits, reduced interest charges and a decrease in the number of shares following the share buy back, partially offset by increased tax charges.
| Annual report and accounts 2022 Pearson plc 23 |
Financial review
continued
Other comprehensive income
Included in other comprehensive income are the net exchange differences on translation of foreign operations. The gain on translation of £330m in 2022 compares to a loss in 2021 of £6m. The gain in 2022 arises from an overall strengthening of the currencies to which the Group is exposed and in particular the relative strength of the US dollar. A significant proportion of the Group’s operations are based in the US and the US dollar strengthened in 2022 from an opening rate of £1:$1.35 to a closing rate at the end of 2022 of £1:$1.21. At the end of 2021, the US dollar had strengthened from an opening rate of £1:$1.37 to a closing rate of £1:$1.35. The loss in 2021 was driven by this movement in the US dollar, offset by the weakening of other currencies used by the Group.
Also included in other comprehensive income in 2022 is an actuarial gain of £54m in relation to the retirement benefit obligations of the Group. The gain arises largely from a decrease in liabilities driven by higher discount rates and changes to demographic assumptions, partially offset by losses on associated matching assets and experience losses. The actuarial gain in 2022 of £54m compares to an actuarial gain in 2021 of £149m.
Fair value gains of £18m have been recognised in other comprehensive income and relate to movements in the value of investments in unlisted securities held at FVOCI. In 2021, fair value gains of £4m* were recognised.
In 2022, a loss of £5m (2021: £4m gain) was recycled from the currency translation reserve to the income statement in relation to businesses disposed.
Cash flow and working capital
Our operating cash flow measure is an adjusted measure used to align cash flows with our adjusted profit measures. Operating cash inflow increased on a headline basis by £13m from £388m in 2021 to £401m in 2022. The increase is largely explained by the drop-through of increased operating profits offset by unfavourable working capital movements driven by the timing of the disposals of the international courseware local publishing businesses and an increase in capitalised product development.
The equivalent statutory measure, net cash generated from operations, was £527m in 2022 compared to £570m in 2021. Compared to operating cash flow, this measure includes restructuring costs but does not include regular dividends from associates. It also excludes capital expenditure on property, plant, equipment and software, and additions to right-of-use assets as well as disposal proceeds from the sale of property, plant, equipment and right-of-use assets (including the impacts of transfers to/from investment in finance lease receivable). In 2022, restructuring cash outflow was £35m compared to £24m in 2021.
In 2022, there was an overall £394m decrease in cash and cash equivalents compared to a decrease of £176m in 2021. The decrease in 2022 is primarily due to payments for acquisitions of subsidiaries of £228m, repayments of borrowings of £171m, dividends paid of £157m, share buyback programme of £353m, other own share purchases of £37m, tax paid of £109m, capital expenditure of £147m, and repayments of lease liabilities of £93m. These were offset by the cash inflow from operations of £527m and proceeds from disposals of businesses and investments of £350m.
| £ millions | 2022 | 2021 | ||||||
| Net cash generated from operations | 527 | 570 | ||||||
| Dividends from joint ventures and associates | 1 | – | ||||||
| Net capital expenditure on PPE (including right-of-use assets) and software | (162 | ) | (206 | ) | ||||
| Add back: costs paid for major restructuring projects | 35 | 24 | ||||||
Operating cash flow | 401 | 388 | ||||||
| * | Comparative amounts have been restated, see note 1b to the financial statements for further details. |
Liquidity and capital resources
The Group’s net debt increased from £350m at the end of 2021 to £557m at the end of 2022. The increase is largely due to the £350m share buyback programme and dividend payments, partially offset by strong operating cash flow and net proceeds from M&A activity.
In May 2022, the Group repaid the remaining $117m (£95m) of its 2022 US dollar bond upon maturity. In December 2022, the Group repaid the remaining $94m (£76m) of its 2023 US dollar bond. In May 2021, the Group repaid the remaining
€
195m (£167m) of its€
500m Euro 1.85% notes.At 31 December 2022, the Group had approximately £1.4bn in total liquidity immediately available from cash and its Revolving Credit Facility maturing February 2026. In assessing the Group’s liquidity and viability, the Board analysed a variety of downside scenarios including impacts from macro economic factors and other risks. Even under a severe downside case where declines in profitability compared to 2022 are modelled in 2023 and 2024, the Group would maintain comfortable liquidity headroom and sufficient headroom against covenant requirements during the period under assessment even before modelling the mitigating effect of actions that management would take in the event that these downside risks were to crystallise. In all scenarios it is assumed that the Revolving Credit Facility is available.
At 31 December 2022, the Group was rated BBB- (stable outlook) with Fitch and Baa3 (stable outlook) with Moody’s.
Net debt
| £ millions | 2022 | 2021 | ||||||
| Cash and cash equivalents | 558 | 937 | ||||||
| Overdrafts | (15 | ) | – | |||||
| Investment in finance leases | 121 | 115 | ||||||
| Derivative financial instruments | (6 | ) | (2 | ) | ||||
| Bonds | (610 | ) | (767 | ) | ||||
| Lease liabilities | (605 | ) | (633 | ) | ||||
Net debt | (557 | ) | (350 | ) | ||||
Post-retirement benefits
Pearson operates a variety of pension and post-retirement plans. Our UK Group pension plan has by far the largest defined benefit section. We have some smaller defined benefit sections in the US and Canada but, outside the UK, most of our companies operate defined contribution plans.
The charge to profit in respect of worldwide pensions and post-retirement benefits amounted to £66m in 2022 (2021: £58m), of which a charge of £75m (2021: £62m) was reported in operating profit and income of £9m (2021: £4m) was reported in other net finance costs. In 2022, a charge of £3m (2021: nil) related to one-off discretionary pension increases has been excluded from adjusted operating profit.
The overall surplus on UK Group pension plans of £537m at the end of 2021 has increased to a surplus of £573m at the end of 2022. The increase has arisen principally due to the actuarial gain noted above in the other comprehensive income section. In total, our worldwide net position in respect of pensions and other post-retirement benefits increased from a net asset of £471m at the end of 2021 to a net asset of £520m at the end of 2022.
Businesses acquired
In January 2022, the Group acquired 100% of the share capital in Credly Inc (Credly), having previously held a 19.9% interest in the company. Total consideration for the acquisition was £149m comprising upfront cash consideration of £107m, Pearson’s existing interest valued at £31m and £11m of deferred consideration. The deferred consideration is payable in 2 years.
24 Pearson plc |
Additional contingent amounts are also payable in 2024 if certain revenue and non-financial targets are met, and dependent on continuing employment, and therefore these additional amounts will be expensed over the period and are not treated as consideration. Net assets acquired of £44m were recognised on the Group’s balance sheet including £49m of acquired intangible assets. Goodwill of £105m was also recognised in relation to the acquisition.
In April 2022, the Group acquired 100% of the share capital of ATI STUDIOS A.P.P.S S.R.L (Mondly). Total consideration for the acquisition was £135m comprising upfront cash consideration of £105m, and deferred consideration of £30m. The deferred consideration is payable over the next two years. In addition, a further $29.6m (c£24m) of cash and $10m (c£8m) in shares will be paid over the next four years, dependent on continuing employment, and therefore will be expensed over the period and are not treated as consideration. Net assets acquired of £38m were recognised on the Group’s balance sheet including £50m of acquired intangible assets. Goodwill of £97m was also recognised in relation to the acquisition.
In 2022, the Group also made two smaller acquisitions for total consideration of £11m. In December 2022, the Group announced that it had signed a deal to acquire 100% of Personnel Decisions Research Institutes, LLC, the transaction has not yet completed.
The cash outflow in 2022 relating to acquisitions of subsidiaries was £228m. In addition, there was a cash outflow relating to the acquisition of associates of £5m and investments of £12m.
In September 2021, the Group completed the acquisition of 100% of the share capital of Faethm Holdings Pty Limited (‘Faethm’), having already held 9% of the share capital previously. Total consideration for the acquisition was £65m comprising cash consideration of £49m, £6m related to the Group’s existing interest in Faethm and £10m of contingent consideration. Net assets acquired of £27m were recognised on the Group’s balance sheet including £21m of acquired intangible assets. Goodwill of £38m was also recognised in relation to the acquisition. Contingent consideration amounts have been settled during 2022 resulting in the recognition of an £8m gain in the income statement within other net gains and losses.
In 2021, the Group also made two smaller acquisitions for total consideration of £11m and acquired interests in two associates, Smashcut and Academy of Pop, for total consideration of £17m.
The cash outflow in 2021 relating to acquisitions of subsidiaries was £55m. In addition, there was a cash outflow relating to the acquisition of associates of £10m and investments of £4m.
Businesses disposed
In March 2021, the Group announced that it was launching a strategic review of its international courseware local publishing businesses. In 2022, the Group disposed of its interests in the Canadian educational publisher (ERPI), Pearson Italia S.p.A, Stark Verlag GmbH, Austin Education (Hong Kong) Limited, Pearson South Africa (Pty) Ltd and various other South African companies. Total cash proceeds received was £287m resulting in a pre-tax gain on disposal of £42m. All entities disposed of were previously in the Strategic Review segment. £5m of losses arose from other immaterial disposals and costs related to the wind-down of certain businesses. None of the disposed businesses meet the criteria to be presented as discontinued operations.
In February 2021, the Group completed the sale of its interests in PIHE in South Africa resulting in a pre-tax loss of £5m. In October 2021, the Group completed the sale of its K12 Sistemas business in Brazil resulting in a pre-tax gain of £84m.
The cash inflow in 2022 relating to the disposal of businesses was £333m mainly relating to the disposals described above and the receipt of deferred proceeds from the US K12 Courseware sale in 2019.
In 2021, the cash inflow from disposals of £83m mainly related to the disposal of the K12 Sistemas business and the receipt of deferred proceeds from the US K12 Courseware sale in 2019.
In addition, proceeds of £17m (2021: £48m) were received in relation to the disposal of investments.
Dividends
The dividend accounted for in our 2022 financial statements totalling £156m represents the final dividend in respect of 2021 (14.2p) and the interim dividend for 2022 (6.6p). We are proposing a final dividend for 2022 of 14.9p bringing the total paid and payable in respect of 2022 to 21.5p.
This final 2022 dividend which was approved by the Board in March 2023, is subject to approval at the forthcoming AGM. For 2022, the dividend is covered 2.4 times by adjusted earnings.
Share buyback
On 24 February 2022, the Board approved a £350m share buyback programme in order to return capital to shareholders. The programme commenced on 4 April 2022 and completed in December 2022. Approximately 42.3m shares have been bought back and cancelled at a cash cost of £353m. The nominal value of the cancelled shares of £10m has been transferred to the capital redemption reserve.
Climate change
The Group has assessed the impacts of climate change on the Group’s financial statements. The assessment did not identify any material impact on the Group’s significant judgements or estimates, the recoverability of the Group’s assets at 31 December 2022 or the assessment of going concern for the period to June 2024.
Post balance sheet events
In February 2023, the Group renegotiated its revolving credit facility, reducing the maximum facility to $1bn.
Pearson holds investments in unlisted securities with a value at 22 December 2022 of £133m. Some of the businesses relevant to this investment, bank with Silicon Valley Bank which collapsed in early March 2023. Given the US Government has announced that it will guarantee all deposits held at Silicon Valley Bank, any subsequent risk to the valuation of these investments is considered by management to be low, but possible.
Conclusion
We delivered a strong financial performance, despite the challenges arising from economic and geopolitical uncertainty, and have identified margin improvements that bring our profitability target of mid-teens margins forward by two years. My colleagues across finance have helped the business successfully respond to opportunities and challenges that have arisen, through appropriate financial control, critical insights and value creation. I would like to thank them for their hard work and commitment throughout the year.

Sally Johnson
Chief Financial Officer
| Annual report and accounts 2022 Pearson plc 25 |
Stakeholder engagement
Learning from our stakeholders
| Learning is at a pivotal moment, where it is becoming more fluid and exists inside and outside of formal education. Our purpose – to add life to a lifetime of learning – sits at the heart of everything we do. Our digital-first strategy aims to meet these evolving needs of learners at multiple points in their lives. |
Our ability to succeed depends, in part, on how we engage with and mobilise a diverse group of stakeholders - consumers, employees, shareholders, educators, employers, business partners, and governments.
This year, we have continued our many partnerships with stakeholders to respond to the needs of our audiences as they move through different life stages, helping to transform lives, livelihoods, and societies, while making a positive impact on our business.

Why we engage | How we engage | Outcomes | ||
| Our products and services are designed for real-life impact. Consumer engagement helps us to understand their needs and evolve our products to create that impact. | As more people use digital learning products such as Pearson+ and Mondly we can listen to and learn from consumers, informing our innovation and driving better lifelong learning. For example, we know from our 4.8 million Pearson+ Channels registered users that they have engaged in nearly 2 million minutes of video content and 1 million practice problems. Groups including our Pearson Campus Ambassadors allow us to engage directly with college students about their needs and preferences. Feedback from users of Mondly is helping us refine and improve our AR/VR offering, which ranks highly among Occulus users. Across the company, custom consumer research and insight studies are also playing a greater role in understanding the attitudes of today’s consumer and how people consume learning content, use digital products, and purchase learning materials. | Understanding how and why our consumers use our products leads to the development of features that make them more engaging and user friendly. As we study the engagement data in Pearson+, we continue to increase our understanding of consumer behaviour and preferences. This is allowing us further evolve Pearson+, exploring new types of content, enhancing features such as Pearson+ Channels, and tailoring other offerings like the student friendly marketing partnerships that launched in 2022. In Mondly, understanding the barriers that consumers face during language learning, particularly the difficulty in accessing in person tutors, led us to pilot a new conversational AI platform to help support learners practice needs. Our consumer-focused products, such as Mondly have features and content that meet the needs of today’s consumer for affordable, accessible, and direct to consumer learning. | ||

Why we engage | How we engage | Outcomes | ||
| Educators are a cornerstone of our business and our partners in content creation. Their feedback helps us improve the teaching and learning experience. | In our US Higher Education business, our Faculty Advisor group feeds back on the needs of educators and students. They also act as ambassadors for our products with existing and potential customers, carrying out regular campus visits and webinars. Our authors, often educators themselves, are increasingly active in reviewing our digital products and product features, such as the development of Pearson+ and Channels. In the UK, after a difficult experience with BTEC results, we have made a particular effort this year to seek input from educators about how we should improve the process for awarding BTECs. | Our work with educators provides us with unique insights that reflect experiences of both teachers and students. In many cases, feedback from educators leads to concrete change that informs our products and services. This is the case for BTECs, where we are changing specific elements of our awarding process to ensure a smoother experience for students and educators. | ||
26 Pearson plc |

Why we engage | How we engage | Outcomes | ||
We are serving a world where people want to and need to learn in the workplace. We work closely with employers so people can learn as they earn, and employers get the best out of their teams. | Pearson has a strong foothold in enterprise learning, with more than 2,000 clients. Enterprise learning accounted for about 16% of our revenue in 2022 and provides us with a major touch point with employers that need a well-trained workforce. We engage with employers through our Assessment & Qualifications, Workforce Skills, and English Language Learning divisions. Not only do employers trust us to deliver high-quality products and services, but our strong track record has led to stable long-term relationships, which underpins our business. Long term Pearson VUE relationships with industry organisations in the healthcare and cyber security space help employees advance in their careers and make our world safer with credentialed workers. We also work together to develop our products and services, to create more impact for their teams. For example, as we develop our new talent investment platform, we have tested the technology & key value propositions with several enterprises. Their feedback has been critical in understanding customer challenges, developing product features, and prioritising future product enhancements. | As we engage with employers, we are seeing growth in newer areas, such as Credly, which awards employees and workers trusted digital credentials and is averaging 70k+ new users a week, driven by the need for reskilling. The IT and healthcare sectors continue to perform well for Pearson VUE. On a more personal level, we are seeing breakthroughs such as 177 Amazon employees who earned their GED with Pearson, proving that the impact of learning is important, no matter the scale. | ||

Why we engage | How we engage | Outcomes | ||
| Our investors play an important role in providing us with access to capital to ensure that we can operate and add life to a lifetime of learning for people around the world. | We have strong and constructive relationships with our key institutional investors, and regularly communicate with them on key issues, at our financial results, our AGM and at investor meetings and conferences. Over 2022, we held 373 meetings with 192 institutions, both virtually and in person. We discuss financial, operational, and strategic matters, including progress against our new direct to consumer, lifelong learning strategy. | Our investors appreciate the time we spend with them to give them updates on our strategy and progress, and we continue to develop how we communicate effectively across a range of formats. In 2022, our dedicated website for investors, www.pearsonplc.com, won a Gold award for the Best Corporate Website - FTSE 100 at the Corporate and Financial Awards. We are constantly updating our disclosures to enhance understanding and transparency of our business. We are evolving our results presentations to make them more interactive and engaging, with heightened use of video, photography, and social assets. | ||
| Annual report and accounts 2022 Pearson plc 27 |
Stakeholder engagement
continued

Why we engage | How we engage | Outcomes | ||
Governments around the world are charged with implementing policies to expand learning opportunities so their citizens can achieve life goals. As the world’s leading learning company, we use our experience and expertise on issues related to all facets of education, to inform political and educational leaders. | The economic and employment environment in many countries featuring labour shortages, and a rapidly evolving workforce, has spurred policymakers to develop wide-scale programmes to attract, train and upskill workers. By engaging with policymakers, we work to ensure that learners of all ages have access to high-quality educational opportunities, leading to better prospects for individuals, as well as improved economic outcomes for society. | Given governments’ need of support, we engaged with governors across the US, outlining data on future skills needs, learning loss, and success of online learning in their regions, to inform policy decisions on areas of focus in education, skills, language training, and recruitment. Outside the US and UK, many more countries and students want access to technical education certifications, English language courses and proficiency. In 2022, we engaged with UK and US embassies in Central and South America and Asia to support countries’ efforts in this area. | ||

Why we engage | How we engage | Outcomes | ||
Pearson’s people are its greatest asset. Our success as a business and our ability to make a positive impact are highly dependent upon our colleagues. Our managers play a pivotal role in driving engagement throughout Pearson, and we are empowering them with new tools and training to support them and their teams. | In 2022, we launched a new employee engagement survey to better understand our employees’ needs and to benchmark ourselves globally. We also launched a new digital employee experience platform to improve communication across Pearson. We communicate regularly with our managers and leaders through interactive forums and newsletters and hold global town halls and virtual meet-ups available to all colleagues. Our employee engagement network meets regularly with Non-Executive Directors. To read more about the Board’s engagement with employees, see the Governance report on page 53. | Our people actively engage in feeding back, and in 2022, 72% of colleagues participated in our new engagement survey. An average 2,000-3,000 colleagues join our global town halls live, and more than 34,000 users have already accessed our new digital employee experience platform. We know that employee engagement fuels performance and has a direct impact on customer loyalty, productivity, profitability, and their wellbeing. We’re using our engagement survey results as a baseline to measure engagement at a local level, and to drive change in the areas that matter most to our people. | ||

Why we engage | How we engage | Outcomes | ||
| Our suppliers, channel partners, venture partners, and authors play a vital role in helping us execute our business and product strategies, bringing specialised services and expertise to accelerate our work. | Supplier diversity and responsible procurement are key priorities for the company. This year we added two new supplier portals that provide access to over 1 million diverse accredited suppliers. In Assessment & Qualifications, our mentor-protege programme is designed to help small and minority owned suppliers grow their business inside and outside of Pearson. Pearson provides additional support to enhance their professional development and business growth, so they can improve their competitive position across the marketplace. This helps Pearson improve the diversity of our suppliers and promotes responsible and sustainable procurement practices. Additionally, we continue to add business partners who contribute to the diversity of our workforce. In 2022, those new partners included People of Colour in Tech, a recruitment platform that connects under-represented groups with tech jobs and the Hispanic Association on Corporate Responsibility, which works to advance the inclusion of Hispanics in corporate America. | Our work with outside partners is one way we’re building a culture that values diversity, environmental stewardship, and social impact, alongside business growth. We have made a public commitment to support diverse accredited suppliers and have grown our 2022 spend in this area. We are also working towards sourcing 100% of our paper ethically. | ||
28 Pearson plc |

Why we engage | How we engage | Outcomes | ||
| We strive to make a positive and meaningful impact in the communities in which we operate. Learning opportunities and outcomes are closely linked to the prosperity of local communities and inclusive global development. Our global communities are interested in widening access to education through innovation, and the steps we are taking to have a positive impact on society and the environment. | In addition to maintaining relationships with key organisations, we participate in multi-stakeholder initiatives to promote lifelong learning opportunities for all and ensure the lasting protection of our planet. Our global volunteering policy enables all our people to take up to five paid volunteer days off to donate their time to what matters most to them and their local communities. | Learning and acquiring new skills are some of the greatest drivers of positive social mobility. The biggest impact we have on society is by delivering our products and services such as Connections Academy, Accelerated Pathways, GED, and BTECs to name a few. This year, we also responded to the crisis in Ukraine, with Pearson and our employees committing over £1.25 million in humanitarian support and providing additional help to Ukrainians and others affected to continue their education during this conflict. More detail on page 38 on how we invest with purpose. | ||
Directors’ duties statement
In accordance with Section 172 of the Companies Act 2006 (see below right), the Directors fulfil their duties to promote the success of the company through a well-established governance framework. Typically, in large and complex businesses such as Pearson, this framework includes delegation ofdecision-making to employees of the Group.
day-to-day
This governance framework, summarised throughout this document, is far more than a simple delegation of financial authority, and includes the values and behaviours expected of our employees and business partners, including the standards to which they must adhere; how we engage with stakeholders, including understanding and taking into account their views and concerns; and how the Board ensures that we have a robust system of control and assurance processes in place.
In this annual report, we provide examples of how the Directors promote the success of Pearson while taking into account the consequences of decisions in the long-term, building relationships with stakeholders (including our 8 key stakeholder groups, as mentioned previously), and ensuring that business is conducted ethically and responsibly.
While there are many parts of this annual report which illustrate how the Directors do this, with the support of the wider business, the following sections in particular are relevant:
| — | Learning from our stakeholders (pages 26-29), which outlines: |
| — | how we serve and engage with each of our 8 key stakeholder groups, listen to their key concerns and provide our responses |
| — | how we have adapted our business to meet their needs |
| — | how we have had regard to the need to foster the company’s business relationships with each of the stakeholder groups |
| — | Understanding our stakeholders (pages 67-68), which summarises: |
| — | how Directors have engaged with employees and shareholders, and had regard to their interests |
| — | Sustainability (pages 30-42), which describes: |
| — | Initiatives through which we strive to enable more engaging learning experiences, that are accessible to more people, and with a smaller carbon footprint |
| — | Our commitment to creating a culture that prioritises human rights, our employees, DE&I, and socially responsible sourcing |
| — | How we align with widely accepted ESG reporting frameworks including GRI, SASB and TCFD. For further details on TCFD reporting, please see page 39 |
A continued understanding of the key issues affecting stakeholders is an integral part of the Board’s decision-making process. The insights that the Board gains through its engagement mechanisms form an important part of the context for all the Board’s discussions and decision-making processes. For an insight into how the Board has considered the interests of various stakeholders in its decision-making, and what matters the Directors considered when trying to align and mitigate opposing views, please see our case study on the acquisition of Mondly on page 69.
Section 172 of the Companies Act In summary, as required by Section 172 of the Companies Act 2006, a Director of a company must act in the way they consider, in good faith, would most likely promote the success of the company for the benefit of its shareholders as a whole. In doing this, the Director must have regard, among other matters, to: — the likely consequences of any decisions in the long term, — the interests of the company’s employees, — the need to foster the company’s business relationships with suppliers, customers and others, — the impact of the company’s operations on the community and environment, — the company’s reputation for high standards of business conduct, and — the need to act fairly as between members of the company. |
Annual report and accounts 2022
Pearson plc 29
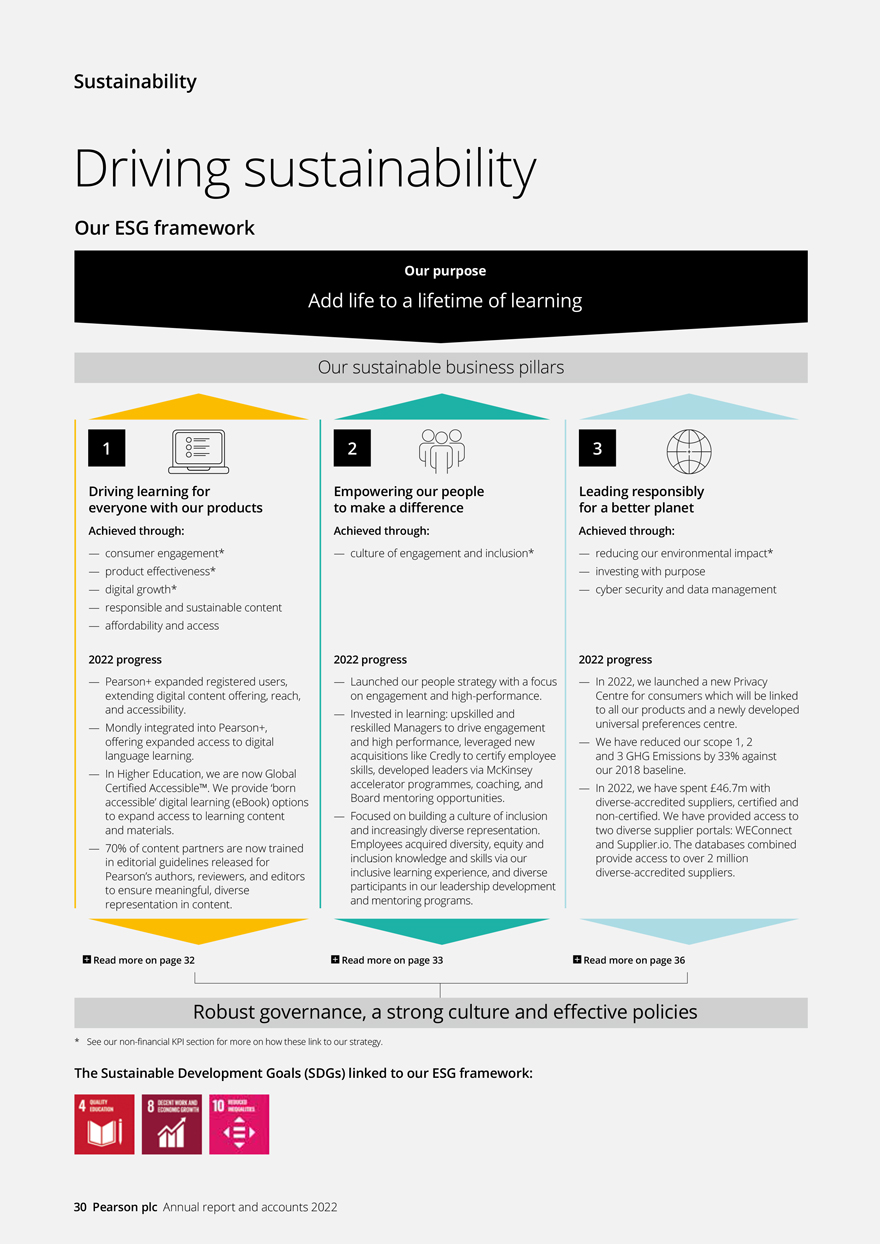
Sustainability Driving sustainability Our ESG framework Our purpose Add life to a lifetime of learning Our sustainable business pillars 1 2 3 Driving learning for Empowering our people Leading responsibly everyone with our products to make a difference for a better planet Achieved through: Achieved through: Achieved through: — consumer engagement* — culture of engagement and inclusion* — reducing our environmental impact* — product effectiveness* — investing with purpose — digital growth* — cyber security and data management — responsible and sustainable content — affordability and access 2022 progress 2022 progress 2022 progress — Pearson+ expanded registered users, — Launched our people strategy with a focus — In 2022, we launched a new Privacy extending digital content offering, reach, on engagement and high-performance. Centre for consumers which will be linked and accessibility. — Invested in learning: upskilled and to all our products and a newly developed — Mondly integrated into Pearson+, reskilled Managers to drive engagement universal preferences centre. offering expanded access to digital and high performance, leveraged new — We have reduced our scope 1, 2 language learning. acquisitions like Credly to certify employee and 3 GHG Emissions by 33% against — In Higher Education, we are now Global skills, developed leaders via McKinsey our 2018 baseline. Certified Accessible™. We provide ‘born accelerator programmes, coaching, and — In 2022, we have spent £46.7m with accessible’ digital learning (eBook) options Board mentoring opportunities. diverse-accredited suppliers, certified and to expand access to learning content — Focused on building a culture of inclusion non-certified. We have provided access to and materials. and increasingly diverse representation. two diverse supplier portals: WEConnect — 70% of content partners are now trained Employees acquired diversity, equity and and Supplier.io. The databases combined in editorial guidelines released for inclusion knowledge and skills via our provide access to over 2 million Pearson’s authors, reviewers, and editors inclusive learning experience, and diverse diverse-accredited suppliers. to ensure meaningful, diverse participants in our leadership development representation in content. and mentoring programs. Read more on page 32 Read more on page 33 Read more on page 36 Robust governance, a strong culture and effective policies * See our non-financial KPI section for more on how these link to our strategy. The Sustainable Development Goals (SDGs) linked to our ESG framework: 30 Pearson plc Annual report and accounts 2022
Why sustainability matters to Pearson
Learning is a powerful enabler and a driver of progress. Our goal is to help learners gain the knowledge and skills they need to advance and thrive sustainably and responsibly in our rapidly changing world. By diagnosing skills gaps, helping people learn and verifying qualifications, we aim to help mobilise talent that is well equipped to build a greener, more responsible economy.
Our ESG framework
In 2021, we introduced three pillars to our ESG framework, driving learning for everyone, empowering our people and leading responsibly. These represent the areas where Pearson can make the biggest positive impact and where we believe our main responsibilities lie towards society and the environment. Underpinning our three pillars is Pearson’s robust corporate governance, strong culture and a range of effective policies to ensure we achieve our ambitions.
Our
non-financial
KPIs, see page 18, have a natural fit with these pillars and are a key measurement of our progress. They are included in both our corporate and sustainable business strategies and will evolve in line with the business. The Board reviews ournon-financial
KPIs regularly, and these are also linked to remuneration. More information on Directors’ remuneration reporting (DRR) requirements can be found on page 88, and a link to our remuneration policy can be found in ournon-financial
and sustainability statement below.During 2022, we updated our materiality assessment, see: https://plc. pearson.com/en-GB/purpose/our-esg-reporting, which confirmed that the views of our external stakeholders and our key priority areas are well aligned. The findings highlighted the importance of assessing and developing the skills of our learners and colleagues, protecting our users’ data, and our role in driving positive change through climate change education.
Driving learning for everyone with our products
The natural alignment between our business strategy and the positive impact we make through driving learning for everyone is a key strength for Pearson. It is hugely motivational and reflected in the selection of three of our
non-financial
KPIs: digital growth, consumer engagement and product effectiveness. All three are interlinked in driving the business and are key enablers in helping more learners, learn more. As we increasingly connect our products to offer a lifelong learning ecosystem, we will strengthen our ability to track and evidence the social impact achieved by our products and services. We therefore, foresee our metrics evolving over time.We are excited to see the opportunities that arise for all our stakeholders through digital growth and the intelligent application of technology to learning. These dynamics will enable us to deliver inclusive, vibrant, and engaging products for all types of learners, throughout their lives. Digitisation broadens access to our products, enables more relevant,content (e.g., on the green economy and social issues) and helps develop deeper engagement with learners, see page 32.
up-to-date
Empowering our people to make a difference
In 2021 we appointed a new Chief Human Resources Officer, who is spearheading our refreshed people strategy. It has three core areas: employee engagement, investing in talent, as well as driving diversity, equity and inclusion, all of which are reflected in our
non-financial
KPIs. We are using our own learning products to develop skills throughout our workforce and in turn, this will maximise our people’s contribution to Pearson’s success, and accelerate innovation.Not only is our people’s learning and development experience a valuable showcase for the business, but it can also support employee engagement and retention, develop a performance and
purpose-led
culture of adding life to a lifetime of learning, and ultimately drive Pearson’s own growth, see page 33.
Cinthia Nespoli,
Chief Legal Officer and Executive Leader for Sustainability
Leading responsibly for a better planet
We are also focused on driving positive change through leading responsibly, while limiting our own impact on the world’s scarce resources. Our carbon footprint is relatively light, and reflects our business model, but as responsible leaders we recognise that we have a significant duty to reduce our carbon impact as much as possible.
We have carbon reduction commitments in place and are implementing actions to achieve our net zero carbon goals. The increased digitisation of our products reduces our environmental footprint, and we are also factoring suppliers’ carbon reporting maturity into our sourcing decisions. This ensures we work with partners who are aligned to our Net Zero commitments to further reduce our overall impact.
Additionally, data privacy and security are becoming more important for all our stakeholders, and this is a key priority for Pearson as part of our digitisation and evolution to a more consumer-facing business.
A strong governance structure
Pearson has a strong governance structure that underpins our sustainability strategy. It is imperative we continue to evolve how we govern sustainability matters, to ensure our structures remain fit for purpose in this fast-moving landscape.
In 2022, we reviewed and adjusted the remit of the Reputation & Responsibility Committee (RRC) to strengthen its focus on ESG topics. Pearson’s other Board Committees work alongside the RRC on several ESG topics as shown below, and we introduced cross-Committee membership by amalgamating the Remuneration & Reputation Committees specifically to ensure that there was a good link between incentives and ESG. Read more about our governance approach on page 53.
As a standing board committee, the RRC meets at least three times per year, and discusses a wide range of topics, including:
| — | product efficacy |
| — | people and culture |
| — | reputational risks including data |
| — | employee engagement |
| — | ESG materiality review |
| — | progress with Pearson’s climate transition plans |
| — | ESG remuneration metrics |
The RRC circulates its conclusions and minutes to the Board, and the Chair is responsible for ensuring action points are followed up. In 2022, the RRC validated Pearson’s materiality review, and received a reporting update in alignment with the evolving regulatory landscape. Priorities for 2023 include the publication of Pearson’s climate transition plan, in addition to the launch of various activities to empower our people to make a difference through behavioural learning opportunities and skill-based volunteering. For more information please see pages
78-79.
| Annual report and accounts 2022 Pearson plc 31 |
Sustainability
continued
 | Driving learning for everyone with our products |
How our products create a more sustainable world
Our success as a company is dependent upon the success of our products in enabling people to develop and learn new skills, realising their potential through a lifetime of learning. At Pearson, we are leveraging our business strategy and innovation capabilities to increase access to education around the world, engage more directly with consumers and augment our positive impact on society.
Digital product growth and the intelligent application of technology have significant positive benefits across both environmental and social impact areas. Group digital and digital-enabled sales in 2022 grew by 9% (2021: 9%).
From a content perspective, Pearson is harnessing the growing demand for
sustainability-led
products and developed new courses and content in 2022 to address this opportunity. We have also made good progress in embedding accessibility in our product design and development processes, alongside continually strengthening our actions on editorially responsible content.The evolution of learning
Our digital andproducts enable us to deliver more inclusive, vibrant, and engaging products for all types of learners, throughout their lives.
direct-to-consumer
Pearson+ had a successful first year since it launched in 2021 and has reduced costs for users considerably, when compared to buying stand-alone textbooks. With its new ‘Channels’ feature it enhances the learning experience of all learners, offering thousands of tutor videos and practice questions bringing life to learning. Pearson+ is also partnering with organisations that share our values such as Headspace, together offering consumers affordable mental wellness content at a discounted student rate.
We also want to empower learners by giving them the control and the flexibility to fit learning into their lives. The recent acquisition of Mondly is another example of how we are investing in personalised learning. The integration of Mondly into Pearson+ brings the world of language learning to Pearson+ users at just a click of a button.
Responsible and sustainable content
We have a clear role to play in creating content, products and services that help solve the major environmental and societal issues of our time. These will encompass formal primary, secondary and higher education, but also, the world of work, to meet increasing demand from consumers who are upskilling while employed to improve their capabilities and opportunities for both themselves and their employers.
For example, we have developed online sustainability courses for the Smith School of Enterprise and the Environment, University of Oxford, in partnership with Pearson. Both courses, The Future of Sustainable Business: Enterprise and the Environment course, and the Law and Sustainability: Tackling Global Environmental Challenges course are eight-week courses that certify participants upon completion. Through these courses we have already equipped 232 learners with fundamental skills in sustainability, leadership and systems thinking. During 2023, we aim to expand our reach, and are exploring a bespoke implementation of these courses internally.
Our new project-based experiential learning platform, Pearson’s Skills Accelerator is another great example. Starting in 2023, we will see enterprise customers offered three courses focusing on tackling climate change, peace-building and conflict prevention. These courses, developed in partnership with the One Young World, through our Workforce Skills division, will help future leaders gain the knowledge and the
know-how
to solve business-critical challenges, leading to outcomes that accelerate the impact to build a fair and sustainable world.In Pearson Edexcel, we are using our position as an awarding body toset of qualifications that will support the move to circularity in design and technology, and empower learners to make more sustainable choices.
co-create
a new Design Education Curriculum for UK schools that will centre on themes such as design thinking, systems thinking, creativity and innovation. This new curriculum will require all state schools to teach towards ato-be-designed
We have also launched
Embedding Sustainability: A Support Guide for
BTEC Nationals.
Accessibility in our product and content development
We strive to incorporate accessible thinking into everything we do, from ensuring accessibility is woven into our culture and training, to innovating and using technology to design and deliver our products.
We have made good progress in building accessibility throughout our product development process, including in the early stages of planning and design. Our learning design principles (LDPs) are a portfolio of learning science research summaries, paired with design recommendations intended to include everyone. Over the past year, we have refreshed our LDPs to include a specific section on how to ensure an equitable application of our design recommendations. These updated LDPs will be part of our product designs from 2023.
In our Higher Education Division, we are now Global Certified Accessible
™
. We provide ‘born accessible’ digital learning (eBook) options for students with disabilities, which are designed so all learners, no matter their ability, have the same access to learning content and materials. Accessibility training is a requirement for key employees, who also complete courses in disability fundamentals, basic web and document accessibility, and disability etiquette. We have built processes and systems to ensure that we are delivering compliant tools and content to both learners and instructors.Our Global Content and Editorial Policy (GCEP) suite is a range of tools and guidance to support our employees and business partners as we improve our content standards. It includes content guidelines on the representation and inclusion of disability, gender, ethnicity and race and LGBT+ communities in our content, among other guidance and tools. In 2022, approximately 70% of our identified content business partners received an orientation to the GCEP training, representing over 6,000 businesses and freelancers. We provided mandatory training to over 11,000 colleagues across the globe who are involved with our content. During 2023, we will develop additional online and live training and embed our maturity model and health assessment, which will allow us to track and monitor the implementation and impact of our content standards initiatives on our business.
32 Pearson plc |
 | Empowering our people to make a difference |
Pearson’s people are our greatest asset. As we transition to a digitally led, consumer-facing company, our success, and our ability to make a positive impact on the world, is highly dependent upon our colleagues. Our goal is to be a world-class place to work. We want to offer an inclusive, high-performing environment, where everyone can leverage their strengths. This is crucial to our people’s engagement, growth, and sense of belonging, and to our future success.
Following our Chief Human Resources Officer’s appointment in 2021, we have refreshed our people strategy, with three focus areas:
| 1. | Employee engagement: |
| 2. | Investing in talent: |
| 3. | Diversity, equity, and inclusion: |
Our
non-financial
KPIs measure how well we are delivering on our people strategy. We also track a wide range of internal outcomes and metrics to understand our people progress and we further supplement these quantitative metrics with qualitative insights from our people.The metrics update for 2023 can be found with our financial and
non-financial
KPIs on pages18-19.
Prioritising employee engagement throughout Pearson
Following the launch of our new purpose, vision, mission, and values in Q1, we brought them to life for employees via a campaign inspiring them to imagine a future of work built on a foundation of engagement as a performance advantage. The goal was to leverage the strengths of all our employees to deliver on our purpose and drive company growth.
We launched a company-wide focus on engagement and high performance as part of our refreshed people strategy, with a new global employee engagement survey, increased manager upskilling and a new digital employee experience platform. Our new survey includes 12 core engagement questions from our survey partner Gallup. It also includes questions on inclusion and coaching, which are key areas of focus for us. Gallup’s approach to engagement is backed by rigorous science, linked to integral performance outcomes, and actionable at the local level. The approach is simple, has been proven to work and provides access to global benchmarks to measure progress. It is encouraging to see a significantly higher number of respondents for our 2022 survey than Pulse surveys run in previous years, and a Gallup GrandMean result of 3.96 on a
5-point
scale.The results tell us where we are now and where we can improve. Our highest-ranking questions, compared to Gallup’s database, were: “My manager, or someone at work, seems to care about me,” and: “My
co-workers
are committed to doing quality work.” This is a great position from which to start our conversations with one another, as it shows our people care for each other’s experiences and are committed to doing great work together. Our opportunities to improve include clarifying roles and demonstrating recognition, and we also need to ensure we continue to emphasise the importance of having regular performance conversations.Manager development to support engagement
As our managers play a pivotal role in employee engagement, in 2022, we had a key focus on building employee engagement via manager upskilling and reskilling. For example, formanagers we developed a programme called iManage Foundations, a
new-to-role
6-month
learning experience focused on developing foundational management and leadership skills across four critical skill areas. We are pleased to report that 286 colleagues enrolled. Across the four modules delivered, 80% of respondents who provided feedback said they had learned at least one new skill and on average 86% said they would apply the skills in their daily work.In parallel with investing in new managers, we are also investing in upskilling and reskilling for all existing managers. From Q4 2022, all managers were given access to Pearson’s Managers Corner Academy. This online resource includes solutions to support managers with employee engagement, performance, and development, including access to a suite of resources aligned to the questions in the engagement survey available via Gallup Access.
Our employee resource groups (ERGs) are voluntary,
employee-led
groups whose aim is to foster a diverse, inclusive and equitable workplace culture for Pearson employees. They continue to support leadership to champion inclusive efforts and promote collaboration and a community between all Pearson employees. We have restructured our nine ERGs to better align with our DE&I strategy, address the needs of our community, and contribute to progress throughout the organisation.Pearson’s employee engagement network is the key feedback mechanism between the Board and the workforce, enabling the Board to hear directly from employees and creating additional insight on how to enhance employee satisfaction and engagement levels. In 2023, we’ll evolve our approach to ensure an even wider range of employee voices are heard, and to provide even more varied opportunities for engagement with our Board members.
During 2022, we launched a new digital employee experience platform to focus on and improve communication across all levels of the organisation. We communicate regularly with our managers and leaders through both interactive forums and newsletters, along with global town halls and virtual
meet-ups
available to all employees.Investing in talent
As we transform to amodel, we are purposefully evolving our organisational makeup and investing in talent to drive our ongoing success. We are hiring people with digital skills, upskilling and reskilling people to support their learning, growth, and progress, while also taking action to retain our current colleagues. Each of these investments is critical to fuel our organisational evolution and ongoing business transformation.
digitally-led,
direct-to-consumer
| Annual report and accounts 2022 Pearson plc 33 |
Sustainability
continued
Turnover
Our Group staff turnover was 33% (22% voluntary/11% involuntary). This was in line with expectations and comparable to 2021. There were two areas of high voluntary turnover. The first area was in our retail model businesses (Pearson VUE), which makes up 34% of voluntary exits. VUE roles are more transient and have an expected higher turnover rate.
The second area was geographical: Sri Lanka and the Philippines where we saw a higher than corporate average increase in voluntary exits in 2022. Roles in these locations are typically front-line operational and technical specialists managing scalable, repeatable transactions. The increased turnover reflects the demand for talent in outsourced service locations. We are mitigating risks in this regard by reviewing rewards and benefits in these locations and looking to diversify the geographic locations of these roles.
Acquisition of skills
We are evolving our suite of learning and career development solutions to fuel skills development, and we are focused on upskilling and reskilling all our people to develop talents needed for the future of work and to provide them with more opportunities for continuous learning and growth.
In 2022, we sold the majority of our
K-12
publishing business in international markets, and made two significant acquisitions in Credly and Mondly. This activity accelerated the acquisition of key underlying skills in our employees, including: digital content development (multimedia production, application management services and content development); technology (software development, software quality and cloud hosting services); and in digital sales and marketing (channel and special market sales).In the UK and US, where 73% of our workforce is based, we are developing additional pathways into Pearson, especially in these areas of high demand. As of 31 December 2022, our Pearson Campus Ambassadors programme in Higher Education now has 146 ambassadors, our internship programmes currently have 100 interns, and we have 160 apprentices across the company. All participants acquire professional skills by workingwith experts, and can apply for permanent jobs within Pearson.
side-by-side
Reskilling and upskilling
We value upskilling highly and during 2022 we used Faethm’s proprietary AI to continue to refine our capabilities framework to drive enterprise-wide transformation through capability building and develop the skills needed for the future of work. The framework currently spans business and leadership skills, with technical skills to be added in 2023. Employees use the capabilities framework to plan their own learning journeys to help them upskill and reskill, learn, and grow as individuals.
In parallel with our investments in manager upskilling and reskilling, we are evolving our solutions for all our people to upskill and, in 2022, expanded our flagship global Learning at Work Week to a monthly series. Each month, we focus on a priority skill from the capabilities framework, with a programme of live and
on-demand,
video-based micro-learning. Last year, we covered engagement, consumer culture and empathy, and inclusion. We feature live sessions with external experts, Pearson authors, Pearson leaders as teachers, and we curate learning pathways and provide team guides to support self-directed learning.In 2022, we also gave our people free access to more commercial learning opportunities, including ourapps Pearson+ and Mondly, and via our pilot of digital credentials powered by Credly. These joint offerings include Pearson eTextbooks via VitalSource, Golden Personality Profiler, Accelerated Pathways and Apprenticeships.
direct-to-consumer
If our
US-based
people wish to continue formal education, we will reimburse tuition costs for up to 18 credit hours if their education programme is related to a job or skills needed within Pearson. Tuition costs are reimbursed after pupils successfully complete a course with a grade C or better, or equivalent mark.In our 2022 employee engagement survey, 72% agreed or strongly agreed they had had access to opportunities to learn and grow over the past six months. We also asked our people what
job-related
skills they wanted to develop, and we are using the findings to drive our pipeline, e.g. for the 2023 Learning at Work series.Building an inclusive culture with increasingly diverse representation
Transforming learning starts with transforming ourselves, which is why much of our work in diversity, equity and inclusion (DE&I) is focused on what we can do within Pearson. From how we select candidates to how we help them grow, our goal is to add more vibrant and enriching experiences at more moments for more people at Pearson, so we can do the same for more people on the world.
Our DE&I approach has four parts: recruitment and promotion; retention; inclusive culture; and social impact. In each part, we have planned outcomes over a set time frame. Each division and corporate function has developed plans for the four parts that reflect its DE&I ambitions and to operationalise our organisational goals. Our
non-financial
KPIs, see page 18, will also help us to build an inclusive culture and increase diverse representation.We lead from the top. Our business leaders and CEO champion the link between DE&I and business performance and have made inclusion a personal priority. Since becoming CEO, Andy Bird has increased both gender and ethnicity representation on the executive leadership team. We have increased female representation by 32% (38% to 50%) with ethnicity remaining the sameAt Board level, female and diverse representation remains at 50% female, including our CFO, and ethnic diversity (US/UK only) has increased from 20% to 30%. Further detail on our Diversity figures can be found in the ESG performance section pages
year-on-year.
224-226,
in accordance with FCA listing rules and both the Parker and the Hampton-Alexander reviews.The percentage of diverse employees in leadership roles, featuring in succession planning and participating in leadership development and mentoring programmes are key measures of our DE&I targets. In 2022, we exceeded our targets for diverse representation in leadership development programmes and met our succession plan objectives, with 52% women and 26% people of colour across our succession plans (target 50% women: 20% people of colour). Evolving a pipeline of talent takes time, but we are excited to see the upcoming team of colleagues participating in Board mentoring, executive coaching, the McKinsey Management Accelerator programme and executive leadership programmes.
Our data shows females make up 59% of our workforce, but we want to achieve parity of female representation atlevels. We are currently at 43%. We also want to increase diverse representation at all career levels. Pearson is in line with the UK national average for employing under-represented people of colour – 18%, but in the US, we are below the national average with Pearson at 32%. We will continue to invest in increasing recruitment of people of colour at all career levels, and of women at senior levels, by providing specific upskilling for managers on inclusive hiring practices and Inclusive Partnerships by working specifically with organisations such as People of Color in Tech, and Historically Black Colleges and Universities (HBCU) Connect.
VP-and-above
Also, we give full and fair consideration to all applicants and support the continued employment of disabled persons, having regard to their aptitudes and abilities, and making reasonable adjustments to address individual needs. Recruitment, promotion, and training are conducted on the basis of merit, against objective criteria that avoid discrimination. We are also proud that ‘Disability: IN’ (https://disabilityin.org/what-we-do/disability-equality-index/2022companies) recognised Pearson as a Best Place to Work on its 2022 Disability Equality Index.
34 Pearson plc |
Skill-based volunteering to create sustainability and social impact
We also continue to invest in our talent through our volunteering programme. Our volunteering policy applies to full- and part-time colleagues. All people who participate in a charitable or community initiatives may claim up to five days (35 hours) of paid leave from work in a calendar year,
pro-rated
for people working less than five days a week.As we enter 2023, we want to find new ways to mobilise the social impact of our talent through volunteering, to face the challenges of today and the future. We will evolve our volunteering policy to enable our people to make an impact in their communities by bringing their unique skill sets, interests, and professional development goals toorganisations.
not-for-profit
We are developing a skills-based programme that will sit at the intersection of volunteering, learning and development. The programme will leverage the skills of our employees to create social impact, and in turn, we will use our unique digital credentialling capabilities to verify and recognise the application of skills through volunteering in real-world contexts.
Reward, benefits and wellbeing
In 2022, we made financial wellness a priority. This built on the foundations of our Global WELL initiative and was in recognition of the challenging macro-economic conditions many countries are facing. Changes were made to the way UK employees interact with their retirement arrangements, giving them greater choice, clear information on their investments and more efficient ways to save. In the US, Roth and true-after tax features were added to the 401(k) plan, further expanding saving options for employees.
We also continued to invest in other aspects of wellbeing: e.g. via the introduction of Sword, a virtual physical care package for back, joint and muscle pain that you can do from the comfort of home. It combines the best in human care withtechnology that is more convenient than traditional
easy-to-use
in-person
physical therapy. Sword matches you with a physical therapist who learns about you over a video call and designs a customised programme. Employees then get a digital therapist computer tablet and motion sensor to track exercise progress, give feedback and help correct your form in real-time, as well as adjusting your programme as your needs change so employees get better, faster.Outlook
Our priority in 2023 is to drive progress against engagement baseline measures and our other
non-financial
KPIs:| — | Employee engagement: by doubling down on our focus on manager development to enable all our managers to operate as coaches with a focus on goals, feedback, and recognition. |
| — | Investing in talent: enhancing how we support career development by further resourcing managers to have conversations about progress, learning and growth. We will also continue to test and scale the integration of our commercial solutions (especially digital credentialling) in support of developing the core business, leadership, and technical skills our employees need for the future of work. |
| — | Diversity, equity, and inclusion: by further integrating a focus on inclusivity into how we develop our managers and leaders, and linking increases in diverse representation to Executive reward. |

Ali Bebo,
Chief Human Resource Officer
72% of employees agreed or strongly agreed they had access to opportunities to learn and grow over the past six months 2 significant acquisitions (Credly and Mondly) accelerated the acquisition of skills in digital content development, technology, digital sales and marketing |
Annual report and accounts 2022 Pearson plc 35 |
Sustainability
continued
 | Leading responsibly for a better planet |
As one of the world’s most prominent learning companies, Pearson has a duty to lead responsibly in all areas of its business and operations. Our stakeholders rely on us to provide excellent products, created with the utmost integrity to millions of individual learners, educational institutions, governments and enterprises around the world, whilst also looking after our own 20,400 employees to the highest possible standards see page 33.
As Pearson’s business becomes more digital and consumer-facing, we are prioritising the safety and security of our customers’ personal data, evolving our processes and governance to address this significant duty of care. We must also use our position to educate people with editorially responsible, sustainable content (see page 32), through products created and delivered with an ever-decreasing environmental footprint. Our ambitious carbon reduction targets reflect our commitment to minimise Pearson’s impact on the planet as much as possible.
In 2022, Pearson made progress against several sustainability priorities, which are summarised below and include data privacy, cyber security, customer safeguarding, carbon emission reductions and responsible supply chain management and sourcing. We also continued to contribute to local communities around the world through our ‘investing with purpose’ initiatives, and we proudly matched our employees’ contributions to several charities in support of the victims of the Ukrainian conflict.
Customer data and safeguarding
Data privacy and cyber security
Pearson holds personal data on individuals worldwide, including schoolchildren, teachers and learners in the workforce. We are committed to the highest standards of data management and these will naturally evolve with our business as we continue our digital transformation.
Pearson’s Executive team has overall responsibility for data privacy and security. Our reporting and risk management structure feeds upwards from individual businesses to Board level.
In 2022, we built on our seven data security and privacy principles introduced in 2021 and established clearer lines of accountability and better reporting. This enables senior management executives and divisional privacy owners to have greater visibility over managing data privacy and security risks. Our clear system of escalation gives them awareness and oversight of key areas and activities. We also provide all colleagues with training on our updated and strengthened data privacy and cyber security principles and processes. More detail on the role our Board Committees play in data privacy and cyber security, and their focus areas in 2022, is on page 82.
In 2022, several operational initiatives contributed to our strengthened processes in data privacy and cyber security:
| • | we increased transparency around what happens to an individual’s data and their choices. This helps us develop our digital products with the confidence that customers can easily exercise control over the use of their personal information. In 2022, we launched a new Privacy Centre for consumers, linked to all our products to a newly developed universal preferences centre. |
| • | we also strengthened our internal resources to help drive a culture of data privacy at Pearson. Senior leaders in each of our divisions and corporate functions have been appointed as Privacy Owners. They are accountable for, and direct the activities of, designated Privacy Leads who are responsible for implementing Pearson’s global privacy programme on a day-to-day |
| • | as the risk of cyber security breaches continues to grow, we stepped up our engagement programmes with divisional leads on the potential risks from digitalisation to ensure awareness and preparedness. Several parts of our business are already certified to international standards for information security, such as ISO 27001. More detail on our approach to cyber security risk management, including our lines of defence, is in the Principal risks on pages 45-50. |
Safeguarding our customers against online harms
Our safeguarding programme is undergoing rapid change, driven both internally by new product development and externally by changes in technology and legislation. The protection of our learners against online harms is particularly important to Pearson as the company continues its transition from traditional ‘bricks and mortar’ schools and colleges to a more digital, direct to consumer model, such as that delivered through our online schools, tutoring and Pearson+ products. To ensure that our systems and processes support a positive user experience, while reducing the risk of online harms, we have:
| • | strengthened our data collection regarding safeguarding incidents. |
| • | established a set of 10 safeguarding standards, including around social media, live-streaming and user-generated content. |
| • | implemented a process for business lines to assess themselves. |
| • | progressed our ‘Safety by Design’ programme to engage with product teams to ensure safety against online harms and compliance with standards like the UK Age-Appropriate Design Code is embedded in our products. |
36 Pearson plc |
Our journey to net zero
Pearson began its decarbonisation journey many years ago, and is transitioning from one of the world’s largest print publishers to becoming a digital-first organisation. In 2018, we set ambitious carbon targets to reflect this transformation opportunity. In addition to our approved commitment under the Science Based Targets initiative to reduce scope 1, 2 and 3 emissions by 50% by 2030 against a 2018 baseline, we have committed to becoming net zero by 2030, a goal which is one of our Group
non-financial
KPIs.We continue to make steady progress in reducing our carbon emissions and at the end of 2022 they had reduced by 33% compared to the 2018 baseline. In 2022, we reduced carbon emissions by 3.3% compared to 2021, through actions such as continuing to shift from print to digital products and rationalising our property footprint. These reductions were achieved despite a bounce back in operations following the pandemic and associated increased emissions in energy, travel and transport of goods.
We present our carbon footprint and progress against our target in two separate tables in this report:
| • | Our carbon footprint in the TCFD Report see page 39. |
| • | Our ESG performance table, global emissions see page 223. |
Carbon reduction and our net zero roadmap
During 2022, we conducted a detailed forecast of Pearson’s emissions to 2030 and 2050. This confirmed that, based upon the current business digitalisation strategy, global decarbonisation trends and specific operational actions, Pearson is on track to reduce its scope 1, 2 and 3 emissions by 50% against the 2018 baseline. More than 90% of our carbon emissions are scope 3, of which c.70% are from purchased goods and services, such as paper and IT services. Our net zero action plan identifies the key programmes of work and timescales needed to reach our net zero goal, focused on our supply chain, operations and governance. Our full action plan can be viewed at:
https://plc.pearson.com/en-GB/purpose/our-esg-reporting.
Building sustainable supply chains
Paper and printing actions
Pearson’s shift from physical books to digital media continues to accelerate. During 2022, we purchased 24,187 tonnes of paper (2021: 29,056) and we expect the amount to continue to reduce over the years as more of our products move online.
Nonetheless, we are reorganising our print supply chain to drive efficiencies and are shifting to printing on demand and better forecasting to reduce our inventory of print products. We are also rationalising our paper suppliers to significantly increase our use of responsibly sourced paper from the Forestry Stewardship Council (FSC) and the Programme for the Endorsement of Forest Certification (PEFC) schemes, which both work for the protection of forests and biodiversity, alongside recognised national schemes such as the Sustainable Forestry Initiative (SFI). This year, FSC certified paper accounted for 33% of our paper consumption; in addition to 20% PEFC certified paper, and 9% SFI certified.
Supplier engagement actions
It is paramount that we engage with our suppliers to help deliver further change and reduction in our scope 3 emissions. Working in partnership with other corporates, we are understanding the decarbonisation plans of our top 50 suppliers, who account for over 20% of our total emissions. Many of our suppliers have their own ambitious environmental plans and climate reduction targets. In 2023, we will develop tailored engagement plans for those suppliers that need support to drive change, and from 2024, we will integrate environmental criteria into supplier selection.
Key actions with our suppliers — Business partners follow our Code of Conduct and Responsible Procurement Policy, and comply with national environmental laws and regulations. — Our net zero strategy goes hand in hand with ethically sourcing materials, and ultimately protecting biodiversity. Our paper and print suppliers are integrated to the Book Chain Project platform, which monitors and tracks actions to protect biodiversity. It analyses the origins of tree fibres to ensure no paper is coming from protected species, and it also tracks the content of chemicals and components in printed materials. Finally, the platform enables us to ensure that international environmental, human rights and safety regulations are followed. — We aim to increase diverse representation of suppliers and spend with underrepresented business owners. In 2022, we spent £46.7 million with diverse-accredited suppliers, representing approx. 2% of total spend. We have provided our purchasing teams with access to two diverse supplier portals: WEConnect and Supplier.io. The databases, taken together, provide access to over 2 million diverse-accredited suppliers. — For the first time in 2022, we asked our key suppliers to participate in an EcoVadis sustainability assessment (or equivalent). We reviewed performance across environmental and human rights areas to ensure that they align to Pearson’s standards. Our key suppliers performed well, with an average score of 57.3/100 (average supplier’s score of 44.9/100). We engaged poorly performing suppliers to implement corrective actions, and they will be reassessed. Our educational environmental material is available to help them progress. — Our own sustainability performance was assessed by EcoVadis, and we scored in the top 11% of our industry, earning a Silver medal. We also received a B score across our CDP (formerly the Carbon Disclosure Project) responses, which includes the areas of climate, forest and water. — We mapped the emissions of our top 50 suppliers assessed by a third party, as described below. |
Driving operational change
Operational actions
Carbon emissions awareness and environmental considerations are progressively being embedded into most aspects of Pearson’s operations. Seeking to align our business and investments with low carbon, we have provided carbon data at divisional level, to enable decision-making by senior executives with oversight of internal P&Ls. We are also integrating key environmental criteria such as Greenhouse Gases (GHGs) emissions into our product design and development processes. This will help us analyse the carbon footprint (including scope 3) of our digital products as our portfolio continues its transition from print to online.
Employee awareness and engagement actions
Achieving our climate goals will naturally require engagement throughout Pearson. The executive team’s commitment to our climate agenda has been a key enabler for the implementation of our plan going forward. But equally, employee engagement is critical to the success of any sustainability programme. See page 33 to see how during 2023 we aim to integrate sustainability into learning and development activities in our people strategy.
| Annual report and accounts 2022 Pearson plc 37 |
Sustainability
continued
Strengthening governance
We describe in detail the steps we have taken to strengthen our governance of climate change in our TCFD report see page 39. Our Net Zero Steering Committee is responsible for implementing our climate action plan, based on the key principle that Pearson’s operating units have ownership of targets and include decarbonisation as a core business objective. Work is also underway to assess the most effective long-term investment options in high-quality environmental projects to enable Pearson to meet its net zero goal by 2030.
Resource use
Our digital growth is much less reliant on raw materials such as paper, and more dependent on green energy for improving our footprint. Our renewable energy is purchased through green energy tariffs or renewable energy certificates (RECs) in the country of consumption. This accounts for 99% of our electricity use.
During 2022, we have seen an increase in our water and waste data for the year. Our total water consumption was 538,556 m3 (2021: 152,702 m3); and there were 1298t of waste generated (2021: 875t) A bounce back in operations, and our estimations methodology are the main drivers behind this sharp upward trend. Pearson reports estimated water and waste in some of its properties by applying an intensity ratio per sqm based on all actual data available. This year, we extended the scope of sites with actual data that are included in 2022 figures.
Investing with purpose
Social bond
In 2022, we allocated the remaining £110m of the £350m education bond we launched in June 2020 in support of Pearson Connections Academy. Connections Academy is a tuition-free online public school that provides a lifeline to learners who need an alternative to a traditional ’bricks and mortar school’ and who may otherwise miss out on a formal education. We have so far supported over 100,000 learners, with 94% of learners completing their course. The net promoter score for Connections Academy was also up in 2022 (2022: +67; 2021: +62), indicating how important a role it plays in students lives. Our latest Education Bond report provides more information and can be found on our website:
https://plc.pearson.com/en-GB/
investors/debt-investors/social-bond-framework.Investing in our global communities
Learning outcomes are closely linked to the prosperity of local communities. Pearson continues to lend its support to people impacted by the conflict in Ukraine, and as part of our commitment, we provided financial and
in-kind
support to make a difference in the lives of those affected by the hostilities.Through our match-giving programme, employees rallied behind three global charitable organisations delivering
in-country
and refugee relief in Ukraine and surrounding countries: the International Rescue Committee (IRC), World Central Kitchen, and the International Committee of the Red Cross (ICRC). Pearson made an initial £1 million donation, and our colleagues made over 1,400 donations to those organisations, totalling £130,000. Pearson matched their donations, providing a further £130,000.In addition to grant giving, our
in-kind
donations included providing free access to electronic materials, for example, launching a webpage where teachers can find information on Pearson’s support for Ukrainian refugee students by offering free materials (subject to legal restraints). Pearson and the charity Talent Beyond Boundaries have also partnered to offer free English language tests to refugees. Over 600 refugees have so far benefited from the partnership.
Rankings and recognition  | ||||||||
FTSE 4 Good Index | Human Rights | |||||||
Pearson remains a constituent of the FTSE 4 Good Index series. | Campaign (HRC) Pearson was named to the HRC Corporate Equality Index. | |||||||
Dow Jones | Stonewall WEI | |||||||
Sustainability Indices (DJSI) Pearson is a constituent of the Dow Jones Sustainability Indices (DJSI), and member of the 2022 Sustainability Yearbook. | Pearson is recognised as a Stonewall Top 100 company for LGBT+ inclusion. For 2022, we ranked 19 th . | |||||||
Disability: IN | Clean200 | |||||||
| Pearson was named to DE&I | Among the largest 200 public | |||||||
| Index with a 100 score in | companies ranked by clean | |||||||
the US. | economy revenue. | |||||||
Moody’s ESG Solutions | MSCI ESG | |||||||
| Robust performance awarded | As of 2022, Pearson received | |||||||
| by Moody’s ESG Solutions. | an MSCI ESG rating of AA. | |||||||
 | ||||||||
Member of Dow Jones Sustainability Indices Powered by the S&P Global CSA |  | |||||||
38 Pearson plc |
Task Force on Climate-related Financial Disclosures
Summary
Our commitment to operate our business more sustainably is demonstrated by our ambitious target to reduce our absolute scope 1, 2 and 3 carbon emissions by 50% by 2030 (validated by the Science Based Targets initiative) using a 2018 baseline, and our goal to be net zero by 2030, with investments in carbon removal solutions.
Below we set out our climate-related financial disclosures compliant with the four Task Force on Climate-related Financial Disclosures (TCFD) recommendations, and 11 recommended disclosures in the 2017 report ‘Recommendations of the Task Force on Climate-related Financial Disclosures’, together with its subsequent annex and implementation guidelines.
We assess climate change risk as an integral part of our risk management process, and in 2022, we updated our assessment of the financial impact of climate risks and opportunities under multiple future climate change scenarios. This identified a number of physical and transitional risks as described below, however none of the risks identified were material or required further action beyond what the management teams are already planning. We concluded that while climate change was not a principal risk for Pearson for the year ending 31 December 2022, the climate transition continues to be an emerging risk due to its intensifying importance to all stakeholders.
In making this assessment, we considered the actions needed to achieve our commitment to net zero by 2030, as well as the strategic and financial impact of potential physical and transition risks. We concluded that these did not have a material impact on the carrying value of any assets and liabilities as at 31 December 2022, as we explain in further detail in note 1d. to the financial statements. During 2022, we also strengthened our governance of climate change, introducing a central steering committee and working groups to manage and execute our climate plans and actions.
To advance our net zero action plan, please see: https://plc.pearson. com/en-GB/purpose/our-esg-reporting. Our key priorities for 2023 are to drive further change within our supplier network, fully plan our emissions reduction strategies, and embed the cost of carbon into business planning decisions. We will also continue to develop climate-related opportunities such as new content and products that educate and inform Pearson’s employees and customers on the threats and challenges from climate change. In 2024, we will also publish a standalone climate transition plan in alignment with the UK Transition Plan Taskforce.
Governance
The Board continues to have ultimate oversight of Pearson’s climate change strategy and achievement of our targets. Sustainability forms part of the company’s strategic
non-financial
KPIs, see page 18. The Board reviews progress against these targets six times per year. Daily responsibility is delegated to the Board’s Reputation & Responsibility Committee (RRC). Members of the RRC include the Group Chief Executive and threeNon-Executives
Directors. Our Chief Legal Officer (the executive leader responsible for the development, monitoring and execution of Pearson’s sustainability strategy) is a regular attendee. Reductions in Pearson’s carbon footprint contribute to the annual incentive plan for all eligible employees within the organisation, as detailed on page 88.The RRC meets three times a year to develop plans for delivering and embedding the sustainability strategy across the Group (including the climate strategy), monitor and track progress against plans, support Group leadership and functions on sustainability-related matters, and discuss recommendations for the Board. Had any significant actions arisen as a result of our assessment of the climate risks, these actions would have been taken for discussion and approval to the RRC.
During the year, we established additional management committees to communicate progress against climate-related issues and implement our climate transition plans as follows:
| — | A steering group (meeting quarterly and including our Chief Financial Officer, Chief Legal Officer and Head of Procurement) which oversees our overall carbon reduction plan and objectives. The outcomes of the committee are subsequently shared with Executive Management. |
| — | Working groups (meeting monthly) which oversee our key drivers of carbon reductions both at a central and individual business level, and ensure actions and change are being implemented successfully. |
The sustainability team regularly reports on the work of these committees into the RRC. For examples of topics the RRC discussed during 2022 and what decisions were made, please see the governance section of this report on page 53.
Risk Management
Our organisational risk management process provides a framework for identification and analysis of, and response to, various forms of risk, including emerging regulatory requirements related to climate change. It establishes tolerances for risk and creates processes intended to mitigate, monitor and manage risks within these thresholds. Climate-change-related risks are reviewed as part of the full-year review of the Group’s risk profile.
Climate change does not represent a principal risk for Pearson, but we have identified the climate transition as an emerging risk. Emerging risks are those which we believe are well mitigated in the short term, but may represent a future opportunity or threat. The relative significance of climate-related risks in relation to other risks can be found on pages
40-41
of the risk management report.During 2022, the results of the latest scenario analysis, conducted by specialist consultancy, ERM, and described below, were discussed at the steering group and the RRC, and shared with the Pearson executive management team for inclusion in its long-term strategic planning.
Strategy
Pearson’s shift from physical publishing to digital media continues to shape our environmental footprint. During our baseline year (2018), our physical book value chain was the largest contributor to our carbon emissions. Since then, the key elements of book production (paper, printing and distribution) have declined sharply and accounted for only 19% of our carbon footprint in 2022; we expect this trend to continue. This year, we have reduced our emissions by 33% against our 2018 baseline, while our products and services reached more than 160 million users around the world.
| Annual report and accounts 2022 Pearson plc 39 |
Sustainability
continued
For a description of how we are driving learning for everyone with our products please see page 32 of this report.
Amid this digital transformation, we commissioned the specialist consultancy ERM to undertake a climate risk assessment to identify and quantify the potential impacts of climate change risks and opportunities on our businesses, strategy and financial planning. The analysis ran across multiple time periods up to 2050, to help us assess the speed of impact on our business model of various scenarios, and to reflect the critical future dates for reducing carbon emissions.
The physical risk of Pearson’s business was assessed using both the RCP 2.6 scenario (low GHG emissions that keep the world below 2 °C warming by 2100, aligned to current commitments under the Paris Climate Agreement), and the RCP 7 scenario (high GHG emissions with average warming greater than 3 °C by 2100). Six physical assets were assessed for exposure to material physical risk. These were chosen because they represent a sample of assets providing a range of critical Pearson services that, if disrupted, could result in delivery failures caused or aggravated by climate physical risks. Each physical hazard was mapped on a materiality matrix and changes in materiality from 2022 present day to 2050 were projected.
The analysis concluded that Pearson’s business is moderately vulnerable to climate change from physical risks in the medium and long term. The main areas of exposure are climate-change-driven extreme heat and water scarcity which may affect the operations of cloud-based data centres that play a central role in our business strategy. Some of Pearson’s physical locations, such as testing centres, are also moderately vulnerable to wildfires or flooding that could impact normal business operations. However, we have business contingency plans, including insurance, in place to reduce our potential financial exposure to such impacts.
The transition risk of Pearson’s business was also assessed, using four scenarios from the IEA’s World Energy Outlook 2021,
(WEO-2021).
The analysis concluded that Pearson is minimally vulnerable to transition risk in the 2030 time frame, but risk increases for longer time horizons across all risk categories. The main transition risks include the reputational risk associated with the use of carbon offsets, and the increasing cost of carbon and ethically sourced paper.All of the above risks are largely mitigated by the opportunities also identified in the analysis. They include the further digitisation of our business, developing climate-related educational content and services, and adopting more ambitious reduction plans as discussed in pages
36-38
of this report.Climate-related risks and opportunities
Risks/Opportunities | Scale of Risk/ Opportunity* | Pearson actions | ||
Physical risks | ||||
| Facility or data centre damage due to flooding and hurricanes | Time frame – short Likelihood – possible Magnitude of impact - low | • Shifting services to alternative locations or servers • Employees working from home (although this would cause an increase in office-based risk) • Insurance cover | ||
Wildfire interruptions to in-person testing | Time frame – medium Likelihood – likely Magnitude of impact – low | • Shifting tests to alternative locations • Rescheduling tests • Moving to digital on-screen assessments• Insurance cover | ||
| Water scarcity: may affect Pearson globally, but Pearson’s consumption levels are small overall | Time frame – medium Likelihood – likely Magnitude of impact – low | • Property updates • Consumption levels remaining minimal | ||
| Increased paper cost due to adverse weather events | Time frame – long Likelihood – likely Magnitude of impact – low | • Short-term pricing changes reflected in operational and strategic plans • Medium-term digital product/services alternatives will be available | ||
Transition risks | ||||
| Increased service charges, reflecting building efficiency standards in the US and EU | Time frame – short Likelihood – likely Magnitude of impact – low | • Fixed lease agreements in the short-term • Selection criteria well above building efficiency minimal requirements for newly leased properties • Property strategy including reduction of property area, leasing/ sub-leasing and service charging• Flexible working policy | ||
| Procurement costs of sustainably-certified paper | Time frame – medium Likelihood – likely Magnitude of impact – low | • Paper use reduction based on ongoing digitalisation strategy, and availability of digital alternatives • Improved product design and greater pricing pass-through | ||
| Increased EU ETS price burden | Time frame – medium Likelihood – possible Magnitude of impact – moderate** | • Digitalisation assumes a lower ETS exposure level • Product design and pricing pass-through from pulp and paper mills | ||
| Reputational risks tied to offsetting | Time frame - long Likelihood - likely Magnitude of impact - low | • Active plans to reduce the amount of carbon sequestration/ offsets required: https://plc.pearson.com/en-GB/purpose/our-esg-reporting. • Currently developing offsetting strategy centred around portfolio of high quality activities and projects that remove carbon from the atmosphere. • Effective communication plans of net zero progress and sequestration strategy | ||
40 Pearson plc |
Risks/Opportunities | Scale of Risk/ Opportunity* | Pearson actions | ||
Opportunities | ||||
| Continuous decarbonisation of Pearson’s products and operations through digitisation, energy efficiency, and flexible working policy | • Please refer to the Leading Responsibly section on pages 36-38 of this report | |||
| Increase in consumer demand for sustainability-related learning content | • Please refer to the Responsible and sustainable content section on page 32 of this report | |||
| * Impact scales: | ||||
Time frame | Likelihood | Magnitude of Impact | ||
| Short: within 5 years | Possible | Low: below £5m | ||
| Medium: between 5 – 10 years | Likely | Moderate: £5m - £20m | ||
| Long: more than 10 years | High: £20m or above | |||
Time frames were selected in relation to our 2030 target date.
| ** | Due to the nature of the risk, and the degree of external variables affecting the matter, it is difficult to meaningfully quantify the risk. However, if not managed effectively, costs associated with offsetting carbon emissions which cannot be fully reduced, may lead to decreased margins. |
Metrics and targets
Our primary targets are to reduce our absolute scope 1, 2 and 3 carbon emissions by 50% by 2030 (validated by the Science Based Targets initiative) using a 2018 baseline; and our internal goal to be net zero by 2030. We have made good progress with our targets, achieving a 33% reduction in emissions since 2018. The Leading responsibly pillar on page 36 highlights the steps Pearson is taking to achieve our targets. Our full set of environmental data can be found in the ESG performance tables on pagesOur emissions data can be summarised as follows:
221-226,
and categories of scope 3 emissions included in our targets are also detailed in our independent assurance statement, seehttps://plc.pearson.com/en-US/purpose/our-esg-reporting.
Our emissions data
tCO 2 e | 2021* | 2022 | ||||
| Scope 1 | 8,342 | 4,622 | ||||
| Scope 2 (location-based) | 22,801 | 29,034 | ||||
| Scope 2 (market-based) | 440 | 182 | ||||
| Scope 3 | 370,853 | 362,473 | ||||
Total – location-based | 401,995 | 396,128 | ||||
Total – market-based | 379,634 | 367,276 | ||||
Intensity ratio – tCO 2 e/sales(Scopes 1,2 market-based and 3) | 110.7 | 95.6 | ||||
* Figures have been restated to reflect acquisitions, disposals and data improvements, assured by an independent third-party, Corporate Citizenship..
Table of contents
Section | Section | Page Reference | ||
Governance | Board’s oversight of climate-related risks and opportunities | 66, 78-79 | ||
Management’s role in assessing and managing climate-related risks and opportunities | 39 | |||
Strategy | Climate-related risks and opportunities over the short, medium and long term | 36-41 | ||
Impact of climate-related risks and opportunities | 36-41 | |||
Pearson’s resilience taking into consideration different climate-related scenarios | 39-41 | |||
Risk management | Processes for identifying and assessing climate-related risks | 30, 39-41, 43-52 | ||
Processes for managing climate-related risks | 36-41, 43-52 | |||
Integration of climate-related risks into the organisation’s overall risk management | 36-41, 43-52 | |||
Metrics and targets | Metrics used to assess climate-related risks and opportunities | 18, 41, 221-226 | ||
Scope 1, scope 2, and scope 3, greenhouse gas (GHG) emissions | 41,221-226 | |||
Performance against targets | 18, 36-41, 221-226 | |||
| Annual report and accounts 2022 Pearson plc 41 |
Sustainability
continued
Non-financial
and sustainability statementIn accordance with Sections 414CA and 414CB of the Companies Act 2006, which outline requirements for
non-financial
reporting, the table below signposts to content in this strategic report, relevant to the management, performance and position of the company, and the impact of our activities in specificnon-financial
areas. Non-financial matter and relevant sections of Annual Report | Page/Link Reference | |
| Business model | Business model: Pages 16 & 17 | |
| Stakeholders: Pages 26 to 29 | ||
ESG-linked remuneration: Page 98 | ||
| Environmental matters | Policies: Addressed in the pages below, with full policies for Pearson Plc available at: | |
| Climate | https://plc.pearson.com/en-GB/corporate-policies | |
| Resource use | Position and performance: Pages 30, 36-41 | |
Risks/opportunities: Pages 36-41 | ||
KPIs: Pages 18, 221-226 | ||
| Social and community matters | Policies: Addressed in the pages below, with full policies for Pearson Plc available at: | |
| Driving learning for everyone with our products | https://plc.pearson.com/en-GB/corporate-policies | |
| Social engagement | Position and performance: Pages 30-38 | |
Risks/opportunities: Pages 30-38, 43-52 | ||
KPIs: Pages 18, 221-226 | ||
| Employee matters | Policies: Addressed in the pages below, with full policies for Pearson Plc available at: | |
| Employee engagement | https://plc.pearson.com/en-GB/corporate-policies | |
| Investing in talent | Position and performance: Pages 30-38 | |
| Diversity, equity and inclusion | Risks/opportunities: Pages 30-38, 43-52 | |
KPIs: Pages 18, 221-226 | ||
| Human rights matters | Policies: Addressed in the pages below, with full policies for Pearson Plc available at: | |
| Customer welfare (data privacy, security, and safeguarding) | https://plc.pearson.com/en-GB/corporate-policies | |
| Empowering our people to make a difference | Position and performance: Pages 30-38 | |
| Sustainable procurement | Risks/opportunities: Pages 30-38, 43-52, 82-83 | |
KPIs: Pages 18, 221-226 | ||
| Anti-corruption and bribery matters | Policies: https://plc.pearson.com/en-GB/corporate-policies | |
| Position and performance: Page 82 | ||
Risks/opportunities: Pages 43-52, 82 | ||
| KPIs: Page 226 | ||
Pearson has a wide range of policies that underpin our sustainability commitments, including:
| — | Pearson Code of Conduct |
| — | Pearson Business Partners’ Code of Conduct (Partner Code) |
| — | Responsible Procurement Policy; and our Human Rights Statement |
| — | Anti-Bribery and Corruption (ABC) Policy; Raising Concerns and Anti-Retaliation Policy |
| — | Pearson’s safeguarding principles (include data privacy/security) |
| — | Global Content and Editorial Policy; Responsible Advertising Policy |
The implementation of these policies are discussed throughout the report and in the prior sustainability section.
42 Pearson plc |
Risk
Risk management
| Effective risk management is essential to executing our strategy, achieving sustainable shareholder value, protecting our brand, and ensuring good governance. |
The table below sets out the Group’s governance structure for risk management.
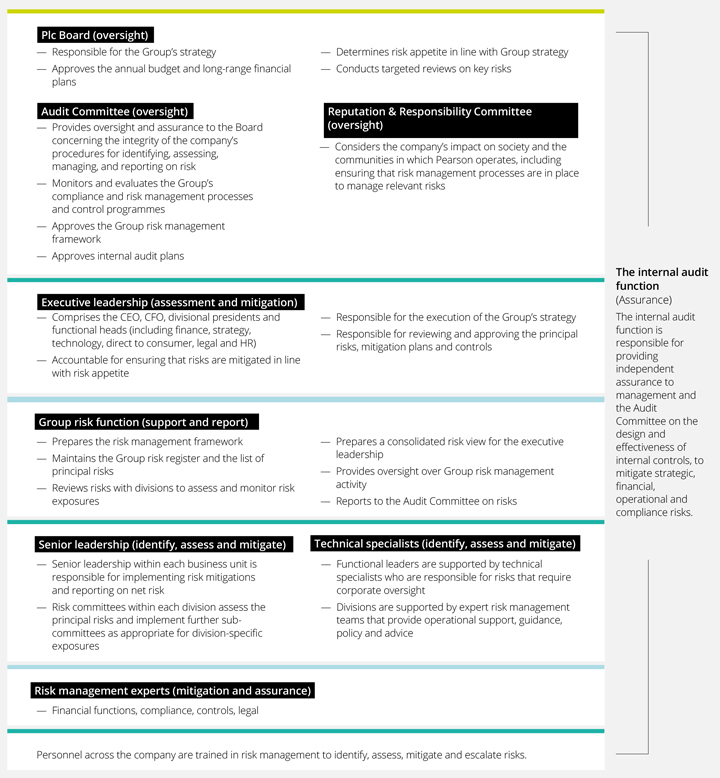
The Board is ultimately responsible for reviewing management’s assessment of the Group’s principal risks and setting the Group’s risk appetite.
| Annual report and accounts 2022 Pearson plc 43 |
Risk
continued
Risk oversight
Risks are managed by members of the Pearson Executive Management team (PEM), either on a divisional basis or by function (as set out in the changes in and accountability for principle risks section on pages
45-50).
Risk owners conduct regular risk reviews with their leadership teams, consulting others where appropriate, including technical experts, either within their division or operating in one of the centres of expertise. Risk reports are shared with key stakeholders, including the Enterprise Risk Management team, and are discussed at PEM team meetings.
The Audit Committee has the delegated responsibility for reviewing the effectiveness of the Group’s procedures for the identification, assessment, management, and reporting of risk.
Each division is expected to present an overview of its risk register to the Audit Committee at least annually and to provide an annual deep dive on key risks, supported by central risk team experts as required. Deep dive sessions are also held with enterprise-wide functions such as tax, treasury and cyber security.
The Audit Committee uses these deep dive sessions to understand the rigour of management’s risk scanning and to challenge any judgements being made in response to risks.
The internal audit team provides independent assurance to the Audit Committee on the design and effectiveness of internal processes, to mitigate strategic, financial, operational and compliance risks. Internal audit plans are aligned to the principal risks but also consider other key risk areas and other assurances available. Plans are agreed in advance with the PEM team and the Audit Committee.
Risk environment
The Group operates in markets in educational content, assessments and qualifications where it has held leading positions over several years and where the businesses and markets have progressively become more digital.
Factors affecting the markets in which the Group operates include a growing number of digital learning providers, technological change, the level of education tuition fees, potential recessions in the UK and US, and the high level of inflation in these markets. The Group seeks to maximise the opportunities from changing market conditions while balancing its expansion with appropriate monitoring and understanding of associated risks.
Our Higher Education division serves learners in the US and internationally, and performance is dependent on enrolments, the competitive environment, and changes in consumption. The Higher Education division served around 18m learners in 2022; and, as expected, continued to see learners shift to digital methods of consumption. We saw growth in Pearson+ paid subscribers and our Inclusive Access offer, but declines in traditional delivery methods, particularly print and print/eText bundles.
The Group’s Assessment & Qualifications business provides secure professional, clinical and academic examinations. VUE provides professional tests in a VUE test centre or online through proctoring. During 2022, VUE test volumes grew by 16%, with particularly strong growth in IT and healthcare. US Student assessments are typically awarded as large contracts by states and nation-states, making the political climate an important factor in performance in this area (quantified by Pearson under the heading accreditation risk). Performance in Clinical Assessment benefited from good availability of government funding in 2022.
Growth in the Group’s Virtual Learning offering is expected to come mainly from demand for virtual schools, driven by a strong national brand and significant scale.
The strategies for our English Language Learning and Workforce Skills divisions anticipate significant growth. For Workforce Skills, success in the enterprise-focused Workforce Solutions area will be contingent on our ability to sell to enterprises and to provide employees with a consumer-grade learning experience, backed up by our ability to assess and verify skills. For English Language Learning, growth is expected to come fromgrowth with Mondly, and through increased adoption of the Pearson Test of English, our market leading language learning assessment.
direct-to-consumer
Risk identification and monitoring
Our risk identification processes follow a dual approach. Firstly, we take a
top-down
view which considers strategic risks relevant across the whole of Pearson. Secondly, we take abottom-up
approach at a divisional or functional level, to identify and assess a complete list of each business units risks, with key risks highlighted in management reporting and in each division’s long range plan.Detailed interviews are conducted throughout the year with each division to assist with risk assessment and management. Risks are then ranked according to their likely impact as principal risks, significant near-term risks, emerging risks, or other risks.
Classification as principal risks, significant near-term risks, and emerging risks
We define our principal risks as those which could have a significant and ongoing effect on the Group’s valuation by reducing the demand for or profitability of its products and services. Effective management of these risks is essential to executing our strategy, achieving sustainable shareholder value, maintaining our reputation, and ensuring good governance. However, they do not comprise all the risks associated with our business, and are not set out in priority order. Additional risks not known to management, or currently deemed to be less material, may also have an adverse effect on our business.
Significant near-term risks are risks which could have a significant near-term cash impact or affect the Group’s short-term results, but would not be expected to have a significant ongoing effect on company valuation.
Emerging risks are risks which we believe are well mitigated in the short term but may represent a significant future opportunity or threat. These include company-specific risks and risks affecting the macro economy.
Principal risks
The Board of Directors has undertaken a robust assessment of the current risks facing Pearson, in accordance with Provision 28 of the 2018 UK Corporate Governance Code. This assessment identified the following principal risks, as well as a number of emerging risks and risks which while more modest could have a significant near-term impact. For each of our principal risks, the tables below identifies:
| — | the change in the risk over the last 12 months |
| — | movement and outlook for that risk |
| — | management actions |
| — | the link between the risk and Group strategy |
| — | our risk tolerance |
| — | examples of the risk |
| — | risk ‘contagion’, i.e., the extent to which issues in one area could increase the risk in other areas |
| — | assessed risk ‘velocity’, i.e., an indication of the speed at which a risk could materially impact the Group. |
44 Pearson plc |
| Accreditation risk | ||
Description | Termination of accreditation due to policy changes or failure to maintain the accreditation of our courses and assessments by states, countries, and professional associations, reducing their eligibility for funding or attractiveness to learners. | |
Movement and outlook | The risk is at a moderate to high level, due to a desire to reduce and/or reform standardised testing in the UK, Australia and US, as well as increased global political risk. The outlook is for the risk to remain at a similar level for the foreseeable future. | |
Management actions | 1. Continue to evolve and enhance security, data and governance standards to ensure the Group meets the required standards to be an accredited provider. 2. Complementary acquisitions to support movement into formative assessment. 3. Continue to grow full-service offering, including online proctoring. This helps to ensure the Group has products and services that can cater for customers many needs, especially in the global assessment market. | |
Link to strategy | Ensuring we can participate in satisfying the growing need for accreditation and certification. | |
Risk tolerance | Low – Pearson seeks to operate in stable, well-regulated markets with known requirements to be accredited, and then has a low tolerance for taking risks which may jeopardise that accreditation. | |
Examples of risks | Political and regulatory | |
Risk contagion | Accreditation risks are likely to have a financial impact but have limited risk of contagion. | |
Risk velocity | If there were to be major long-term changes in regulation, it is likely that these would occur over a multi-year period. | |
| Capability risk | ||
Description | Inability to meet our contractual obligations or to transform as required by our strategy due to infrastructure or organisational challenges. | |
Movement and outlook | This risk remains at a moderately high level, due to the execution risk associated with delivering the Group’s strategy and high competition for talent, especially in the technology space. Key initiatives during 2023 include the launch of a new integrated product in workforce, realisation of synergies with our Mondly language learning offering, and the further development of functionality and content on Pearson+. The risk is expected to remain at a similar elevated level for the next 12 months as key new requirements of the strategy are implemented. | |
Management actions | 1. Risk ratings are applied to each system and plans put in place to maintain system uptime, and recovery plans are in place in the event of downtime to allow customers to maintain as much functionality as possible or to get back online as soon as possible. 2. Each division conducts ongoing reviews of its key systems and implements updates and remedies where necessary. 3. Regular patching, activity, employee training and security measures such as multi-factor authentication help to ensure the stability and security of key Group systems. 4. The divisional structure allows decisions to be made by those closest to each market, to speed innovation and responsiveness. 5. The Group tracks employee engagement and has a significant focus on employee learning and development to help retain key talent. Senior management has undertaken leadership capability assessments and changes have been made to enhance capability, including new hires and development training. 6. Acquisitions such as Credly and Mondly have been made to build the Group’s capability in key strategic areas, such as Workforce Skills and direct-to-consumer | |
Link to strategy | Capability relates to the three priorities to unlock growth: — Consumer-focused and data-led approach— Portfolio and organisational structure — Talent and culture | |
Risk tolerance | Medium – the Group aims to ensure it has the capability to deliver strategic objectives, requiring strong coordination and planning, but without stifling innovation. | |
Examples of risks | Business transformation and change Talent IT resilience | |
Risk contagion | Failures in capability could result in increased reputation and responsibility risk and failures to meet customer expectations. | |
Risk velocity | Failures of capability could impact within a six-month period. | |
| Annual report and accounts 2022 Pearson plc 45 |
Risk
continued
| Competitive marketplace | ||
Description | Significant changes in our target markets could make those markets less attractive. This could be due to significant changes in demand or in supply which impact the addressable market, market share and margins (e.g., changes in enrolments, insourcing of learning and assessment by customers, open educational resources, a shift from in-person to virtual learning or vice versa or innovations in areas such as generative AI). | |
Movement and outlook | This risk continues to be significant in our Higher Education business due to declining enrolments and competition from non-mainstream publishers, including open educational resources. In our other divisions, the risk remains moderately high, due to the pace of innovation and increased competition, although market growth provides some mitigation.The risk is expected to remain elevated for the next 12 months, due to the level of competitor activity being observed, as well as continued investment in educational technology. | |
Management actions | 1. The Group’s Assessment & Qualifications and Virtual Learning businesses, as service businesses, have a particular focus on working in partnership with customers, including IP owners, to ensure that their needs are being met, resulting in high retention rates on the long-term contracts in place. 2. The Group invests in emerging and maturing technologies to lead and respond to changes in market dynamics. Examples include online proctoring and digital-first scoring in assessments and qualifications, and virtual reality language learning in Mondly. 3. The Group’s strategy is to address learners wherever they choose to learn, reducing reliance on learners’ choosing particular institutions. Direct to consumer offerings such as Mondly and Pearson+ can be accessed via smartphone by anyone, while the developing Workforce Skills division addresses learners in the workplace. This complements our existing businesses such as Higher Education and US Student Assessment where the Group is introduced to learners through their college or school. 4. Competitive analysis is undertaken to monitor and respond to competitive threats, with decentralised teams able to mobilise quickly to maximise opportunities and manage risk. 5. Subscription product launches, including Pearson+, improve the customer value proposition. | |
Link to strategy | We have identified three big global opportunities and associated marketplaces: — The rise in online and digital tools for schools and education — The workforce skills gap — The growing need for accreditation and certification | |
Risk tolerance | Medium – This is a strategic risk associated with successfully selecting attractive global opportunities and seizing them. Pearson seeks to lead the shift to digital ways of learning and consequently to maintain strong market positions. | |
Examples of risks | — Substitutes — Product differentiation — Consumer learning preferences | |
Risk contagion | Changes in the competitive marketplace could increase portfolio change. | |
Risk velocity | The changes in the global learning market over a four-year period are expected to be significant. The pace of these changes is uncertain but could be rapid, especially given the significant disruption and innovation since the spread of COVID-19. | |
46 Pearson plc |
| Content and channel risk | ||
Description | Failure to select content and delivery channels to conveniently deliver anticipated learning, resulting in loss of sales. | |
Movement and outlook | The risk remains at a moderate level. This is due to the increasing commoditisation of content, requiring continuing development of both content and the method of delivery to be able to provide differentiated products and services. The risk is expected to remain at a moderate level for the next 12 months, given the ongoing proliferation of methods for learners to choose for their learning and, the funding still available for educational technology businesses. | |
Management actions | 1. Increasing use of interactivity and multi-channel content, particularly on Pearson+, including by offering podcast content and videos (Pearson+ Channels). 2. Continuing focus on efficacy to ensure that Pearson products and services help the learner achieve better outcomes. 3. Actions to reduce piracy and to manage and enforce intellectual property rights. 4. Investment in acquisitions offering new methods for testing or delivering content. | |
Link to strategy | Managing content and channel risk helps achieve our offering of high-quality, affordable products which lead to better access and outcomes. | |
Risk tolerance | Medium – This is a strategic risk and Pearson should be rewarded for successfully developing and delivering products and services that consumers value. Some risk is accepted to ensure the consumer remains at the centre of what we do. | |
Examples of risks | — Intellectual property protection — Method of delivery — Balance of content creation and content purchased | |
Risk contagion | Failure to deliver high-quality and engaging products and services may have an impact on reputation and responsibility risks and on meeting customer expectations. | |
Risk velocity | Due to longer-term contracts or the time required for instructors, or consumers themselves, to learn how to use the new products and services, the impact of changes would have some short-term impact, but is more likely to be fully felt over the longer-term. | |
| Customer expectations | ||
Description | Rising end-user expectations increase the need to offer differentiated value propositions, risking margin pressure to meet these expectations and potential loss of sales if not successful. | |
Movement and outlook | The risk is still at a moderate level, with an expectation from consumers of an increasingly high-quality and engaging user experience. The outlook is similar for the next 12 months, with expectations rising in line with other industries. | |
Management actions | Consumer activity is reviewed via a network of Campus Ambassadors, as well as learner surveys, net promoter scores and external reports. Sales teams regularly meet with faculty members, and content and editorial surveys are completed. The group’s direct to consumer offerings of Mondly and Pearson+ provide valuable insights about usage to help keep pace with changing customer expectations. Our service businesses conduct regular reviews with customers to ensure that their expectations are well understood and met and where gaps arise, steps are taken to address these concerns. | |
Link to strategy | Focus on direct to consumer will help to successfully meet customer expectations. Direct-to-consumer | |
Risk tolerance | Medium – This is a strategic risk and Pearson should be rewarded for successfully developing and delivering products and services that consumers value. Some risk is accepted to ensure the consumer remains at the centre of what we do. | |
Examples of risks | — Customer experience — Data architecture and usage — Accessibility | |
Risk contagion | Failure to produce products and services meeting customer expectations could also impact reputation and responsibility risks. | |
Risk velocity | Typically, one to three years, as long-term contracts run off. | |
| Annual report and accounts 2022 Pearson plc 47 |
Risk
continued
| Portfolio change | ||
Description | Failure to effectively execute desired or required portfolio changes to promote scale or capability and increase focus on key divisional and geographic markets, due to either execution failures or inability to secure transactions at appropriate valuations. | |
Movement and outlook | The risk has increased in the last 12 months as the Group has made key strategic acquisitions such as Faethm, Mondly and Credly, which have been integrated within the company, and with the forthcoming acquisition of PDRI due to complete in H1 2023. The risk is expected to remain high in the next 12 months as these transactions are executed and the integration of recent acquisitions continues. | |
Management actions | 1. Investment plans included in strategic plans, aligning requirements with divisional structure. 2. An experienced Corporate Finance team to execute transactions, supported by a dedicated post-deal Operations team who oversee the integration and ensure that the required value is achieved. 3. Pearson Ventures allows Pearson to take stakes in early funding rounds supporting growth through innovation stages that could potentially be leveraged for the wider Group. | |
Link to strategy | Portfolio and organisational structure to unlock growth. | |
Risk tolerance | Medium – The Group seeks to balance carefully the opportunity to achieve growth through increasing capability and/or scale with the execution risk of portfolio change. | |
Examples of risks | — Identification of requirements — Achieving value on acquisitions/disposals — Integration of acquisitions | |
Risk contagion | Failures in managing portfolio change could impact capability and the ability to meet customer expectations. | |
Risk velocity | The speed of achieving the full benefits of an acquisition will vary depending on the size and scope of the acquisition, but typically from six months for a simple small acquisition to two years for a larger complex transaction. | |
48 Pearson plc |
| Reputation & responsibility | ||
Description | The risk of serious reputational harm through failure to meet obligations to key stakeholders. These include legal and regulatory requirements, the possibility of serious unethical behaviour and serious breaches of customer trust. | |
Movement and outlook | The Group’s aim is to operate in a highly reputable and responsible manner and so we intend to maintain strong mitigations to reputation and responsibility risks. However, numerous threats exist including from those who seek to do harm to the Group or to its customers, including nation-state actors, organised criminal rings, and ransomware attackers, so constant vigilance is required. The risk is considered to be at a moderate to high level, increased since the last year end due to the general increased proliferation of cyber security and data privacy events and the businesses increasing online presence as well as the complexity of navigating different regional regulatory environments. The Group has continued to implement and follow proposals made by the company’s advisers in relation to a 2018 cyber security incident in connection with its AIMSweb 1.0 software, which resulted in a settlement with the US Securities and Exchange Commission (SEC), including an obligation to pay a civil penalty of $1 million agreed on 16 August 2021. | |
Management actions | 1. Dedicated risk management teams throughout the organisation monitor and respond to key risks. These teams provide regular updates to senior management and report to the Reputation & Responsibility Committee or Audit Committee as relevant. 2. All staff are required to undertake training on educational policy, how to identify cyber threats and data privacy, amongst other topics. 3. The Group makes significant investments to ensure high levels of IT resilience and to ensure it has tools in place to repel cyber threats and safeguard customer information. 4. Cyber security and data privacy are topics which are always reviewed as part of the divisional risk deep dive exercises undertaken and reported to the Audit Committee. This work highlights any issues which have arisen and the relative vulnerability of platforms and software. 5. Strong financial controls are in place which are monitored by the controls steering committee and compliance teams as well as local management. 6. Reviews are undertaken after incidents and significant near misses to allow lessons to be learned and any remedial actions put in place. Internal Audit are asked to provide assurance around remediation actions for key risks in a timely manner. | |
Link to strategy | Our reputation and commitment to behaving responsibly underpin our strategy to be a trusted partner for consumers, businesses and educators. | |
Risk tolerance | Low – the Group seeks to be a highly trusted consumer learning brand. Any significant failures could negatively affect our relationship with consumers today and in the future. | |
Examples of risks | — Compliance with laws and regulations — Cyber security — Data privacy — Safeguarding — Test failure — Use of third parties | |
Risk contagion | Significant failures in this area could increase Pearson’s capability and accreditation risks and weaken our position in the competitive marketplace. | |
Risk velocity | Reputational risks could impact within a six-month period. | |
| Annual report and accounts 2022 Pearson plc 49 |
Risk
continued
Changes in and accountability for principal risks
For each of our principal risks (shown in bold), the table below lists the accountable senior executive(s) for each
sub-risk.
Changes in accountability since 2021 are marked in the table:Risks | Accountability | Change since 2021 | ||
Accreditation risk | ||||
| Political and regulatory | Chief Legal Officer and Divisional Presidents | No | ||
Capability risk | ||||
| Business resilience | Chief Legal Officer and Divisional Presidents | Yes | ||
| Business transformation and change | Divisional Presidents and Chief Executive Officer | No | ||
| IT resilience | Divisional Presidents and Chief Information Officer | No | ||
| Safety and corporate security | Chief Legal Officer and Divisional Presidents | Yes | ||
| Talent | Divisional Presidents and Chief Human Resources Officer | No | ||
Competitive marketplace risk | ||||
| Consumer learning preferences | Divisional Presidents | No | ||
| Market pricing | Divisional Presidents | No | ||
| Product differentiation | Divisional Presidents | No | ||
| Substitutes | Divisional Presidents | No | ||
Content and channel risk | ||||
Effective method of delivery (podcast, video, test, in-person, online) | Divisional Presidents | No | ||
| Intellectual property protection | Chief Legal Officer and Divisional Presidents | No | ||
| Products and services – effective investment in own and third-party content | Divisional Presidents | No | ||
| Balance of content creation vs content purchased | Divisional Presidents | No | ||
Customer expectations risk | ||||
| Customer experience | Divisional Presidents | No | ||
| Accessibility | Divisional Presidents | No | ||
| Customer experience | Divisional Presidents and Chief Legal Officer | No | ||
| Data architecture and usage | Chief Data Officer and Divisional Presidents | No | ||
Portfolio change risk | ||||
| Achieving value on acquisitions/disposals | Chief Financial Officer and Chief Strategy Officer | No | ||
| Identification of requirements | Chief Executive Officer, Chief Financial Officer and Chief Strategy Officer | No | ||
| Integration of acquisitions | Chief Financial Officer | No | ||
Reputation and responsibility risk | ||||
| Compliance with laws and regulations | Chief Legal Officer and Divisional Presidents | No | ||
| Cyber security | Chief Information Officer | No | ||
| Safeguarding | Chief Legal Officer and Divisional Presidents | Yes | ||
| Test failure | Assessment & Qualifications, English Language Learning and Workforce Skills Divisional Presidents | No | ||
| Data privacy | Chief Legal Officer and Divisional Presidents | No | ||
| Use of third parties | Chief Financial Officer and Divisional Presidents | No | ||
50 Pearson plc |
Significant near-term and emerging risks
The main near-term and emerging risks are shown in the table below, which also notes accountabilities and where the risk represents a change since the previous year.
Classification and change | ||||||
Risks | Description | Accountability | since 2021 | |||
Climate transition | Costs associated with offsetting carbon emissions which cannot be fully reduced may lead to decreased margins. Expectations around climate change commitments and measurements change on a regular basis. | Chief Legal Officer and Divisional Presidents | Emerging risk. No change. | |||
COVID-19 | The risk of future long-term COVID-19-related | Chief Executive Officer | Significant near-term risk. No change. | |||
Inflation | High global inflation risks increasing the cost of production for Pearson, which the Group may not be able to fully pass on. | Chief Financial Officer and Divisional Presidents | Emerging risk. No change. | |||
Recession | Recession in global markets could put pressure on school, enterprise and consumer budgets, reducing demand for our products and services. This has particular potential to negatively impact our English Language Learning and Workforce Skills divisions, unless disruption in the labour market encourages more people to retrain. Our Higher Education division has historically been counter-cyclical due to the link between unemployment and learning needs, although it is not known whether this will be the case in the future. Our Assessment & Qualifications and Virtual Learning divisions typically benefit from long-term contracts, often with state funding, and so are less likely to be affected in the short term. | Chief Executive Officer | New emerging risk. | |||
Supply chain | Disruption at ports globally and challenges for suppliers may lead to business interruption if not fully planned for and mitigated. | Chief Financial Officer and Divisional Presidents | Emerging risk. No change. | |||
Tax | The outcome of State Aid decisions and a potential risk in Brazil could lead to significant one-off costs or benefits in the near-term. | Chief Financial Officer | Significant near-term risk. No change. | |||
War in Ukraine | This has resulted in sanctions being imposed on Russia by numerous countries, and as a result the Group closed it’s Russian operations during 2022. Pearson’s operations in Ukraine are small and so any related disruption would be expected to have an immaterial impact on Group sales, profits and cash. However, an escalation of the conflict could lead to a material risk if extended beyond those countries. | Chief Executive Officer | Emerging risk. No change. | |||
| Annual report and accounts 2022 Pearson plc 51 |
Risk
continued
Risk assessment of prospects and viability
Corporate planning process
The Board assessed the prospects of the company using the company’s long-range plan, reviewing going concern over the period to 30 June 2024 and viability to 31 December 2026. In 2021 a five-year strategic plan was produced with financials, which was revised and updated during 2022, to cover the remaining four-year period, as the group focusses on executing its strategy. Pearson’s strategic planning process is discussed by the Board at least annually and represents the time over which the company can reasonably predict market dynamics and the impact of additions to the product portfolio.
The strategic plan takes account of a range of factors including market conditions, the likely impact of principal risks to the Group, product and capital investment levels, as well as available funding. Pearson’s strategy and business model are discussed in more detail on pages
12-17.
Going concern
Disclosures relating to the going concern process can be found in the Director’s report on page 120.
Viability assessment approach and outputs
Base case long term plan
In considering going concern and the viability of the company, the four-year plan was used as the base case model for assessment. Sales, profits, and cash are forecast to grow in the base case. Management’s financial expectations by division are shown on page 21. Management would also expect the company to remain profitable and cash generative beyond the period of assessment.
Liquidity model
As 31 December 2022, the group had available liquidity of £1.4bn comprising central cash balances and its undrawn $1.19bn Revolving Credit Facility (RCF) which matures in December 2026. The RCF was reduced to $1 billion in February 2023 and the same time the documentation was updated to allow Pearson to request that the facility be extended by a further year. The first of these options is exercisable in December 2023 and the model conservatively assumes that only seven of the group’s eight banks agree to extend the facility to February 2027. The model also assumes that the PDRI acquisition completes in H1 2023, and downside scenarios conservatively assume a further capital allocation outflow of £350m.
Severe but plausible downside model
A severe but plausible model was prepared based on the base case adjusted for the probability weighted impact of all principal risks as well as other significant risks. The net impact of the risks modelled was to reduce adjusted operating profit by around 30% in each year.
Under the severe but plausible downside case, the company would maintain comfortable liquidity headroom and sufficient headroom against covenant requirements during the period under assessment. That is, even before modelling the mitigating effect of actions that management would take if these downside risks were to crystalise. Such measures could include discretionary cost cutting measures, refinancing debt, reducing dividends, reducing the size of the theoretical capital outflow, and reducing investment.
Reverse stress test
A reverse stress test was modelled to determine the reduction in adjusted operating profit versus the plan that would be required to exhaust liquidity (as this was shown to require a lower profit reduction than would be required to breach covenants). The consequences of exhausting liquidity would mean that the Group would no longer be able to service its debt.
A reduction in adjusted operating profit of over £300m in each of the four years of the model would be required, significantly more than the severe but plausible model, before allowing for potential mitigation strategies available.
Conclusion
Based on the results of these procedures, and considering the company’s strong balance sheet, the Directors have a reasonable expectation that Pearson will be able to continue in operation and to meet its liabilities as they fall due over the four-year period ending 31 December 2026. Further details of the Group’s liquidity are shown in the ‘Financial Review’ page 24.
Below are the inputs included in the severe but plausible scenario.
Accreditation Risk
| — | Risks associated with potential political and regulatory changes in School Assessments |
| — | Risks associated with potential political and regulatory changes in Virtual Schools |
| — | Loss of Pearson Test of English recognition in Australia |
Capability Risk
| — | Additional costs to recruit teachers and students due to market conditions |
| — | Capability challenges in sales and technology reduce sales and result in increased costs |
Competitive Marketplace
| — | Revenue declines in Higher Education due to enrolment and competition pressures |
| — | Pearson Test of English declines due to lower immigration |
| — | Competition from lower cost proctoring offerings |
Content / Channel Risk
| — | Additional costs to ensure accessible content |
| — | Loss of sales due to poor choice of content and/or channel |
Customer Expectations
| — | Additional costs to provide higher than planned functionality and level of user experience |
Portfolio Change
| — | Failure to achieve anticipated acquisition synergies |
Reputation and Responsibility
| — | Potential cyber and data breaches negatively impacting reputation on an ongoing basis |
| — | Potential safeguarding incidents negatively impacting reputation on an ongoing basis |
Recession and inflation
| — | Potential for increased costs and lower sales because of a weak macro environment |
52 Pearson plc |

Chair’s Letter

“A focus on strategic clarity, operational discipline and sustainable success for the benefit of all stakeholders.” |
Dear shareholders,
It is a pleasure to introduce our Governance Report for 2022. In my first year as Chair, I have drawn great confidence from the disciplined approach to governance at Pearson, and the high calibre of our Board members. Their expertise and integrity have helped to cement our strong financial position in 2022 and to advance our purpose: to add life to a lifetime of learning.
Strategy and performance
The Board has been heavily engaged with the management team in overseeing the implementation of our growth strategy, with a particular focus on embedding operational discipline around the new business divisions. This has helped to
‘right-size’
the business and achieve significant efficiencies that have accelerated our margin improvement expectations.A highlight of 2022 was the completion of the first year of Pearson+. With 4.8 million registered users in that full calendar year, it is an important milestone in our journey to realise a digital ecosystem for lifelong learning. Developing our workforce skills strategy has been another priority for the Board in 2022. With more than 2,000 enterprise learning clients, it is the next big opportunity for Pearson to support employers and employees through Assessment & Qualifications, Workforce Skills, and English Language Learning.
The Board also continued to reshape and refine Pearson’s portfolio in support of our strategy through both acquisitions and divestitures. In 2022, we acquired consumer language learning app Mondly, a cornerstone of our direct to consumer approach in English Language Learning – you can read more about this acquisition and the Board’s considerations in relation to it on page 69. Another consumer-focused acquisition was the digital credentials platform Credly, through which we are tapping into the vast and growing focus for learners to be able to evidence their achievements and progress through digital certification. It is also valued by employers to encourage skills development in their workforces and has issued more than 50 million credentials, with some 70,000 new joiners a week. Additionally, the Board oversaw the sale, through a number of transactions, of much of our
K-12
publishing businesses in international markets.The Board was instrumental in assessing and responding to three unsolicited takeover approaches to the company from investment firm Apollo Global Management. After careful consideration, the Board voted unanimously to reject the approaches as we believed they all significantly undervalued the company. We thank you, our shareholders, for your support in the Board’s position.
The Board continued to pay close attention to maintaining a strong financial position, which enabled us to increase the dividend in 2022, in line with our progressive dividend policy. We were also able to launch a £350m share buyback programme, while remaining well placed to pursue strategic opportunities as they arose, such as the announcement in December of our proposed acquisition of Personnel Decisions Research Institute (PDRI), which we look forward to completing subject to receiving the relevant clearances.
As part of monitoring execution and performance, the Board regularly receives a dashboard that allows Directors to monitor progress on Pearson’s financial and strategic priorities, supported by agreed indicators and milestones identified as key measures of performance. While we work to embed the strategy, we will continue to refine this dashboard to ensure it includes the right key performance indicators (KPIs) to monitor our progress. You can read more about those KPIs on page 18 of this annual report.
The Board’s oversight of performance and risk is underpinned by the excellent work of our Audit Committee, which you can read more about on pages
80-87,
including a number of strategic risk deep dives and a particular focus on data privacy and cyber security, as well as overseeing the important matter of our external audit transition in 2022.Sustainability, stakeholder engagement and culture
As the world’s leading learning company, Pearson recognises its enormous potential to make a positive impact on people and the planet, as outlined in our environmental, social and governance (ESG) framework, which you can learn more about on page 30. The Reputation & Responsibility Committee has primary responsibility for monitoring and inputting into Pearson’s sustainability strategy and initiatives on behalf of the Board, with more on this described in the Committee’s report starting on page 78.
Understanding the views and priorities of all our stakeholders is key to running a successful, sustainable company that meets the needs of learners, educators, governments and employers. You can read more about the Board’s engagement activities in the section Understanding our stakeholders on page 67. The Board has engaged extensively with our larger shareholders regarding Pearson’s proposed new Directors’ remuneration policy to be tabled to shareholders at the 2023 AGM. More information on remuneration and the Board’s engagement work, through the Remuneration Committee, is included in the Directors’ remuneration report starting on page 88.
Our Employee Engagement Network remained a valuable forum for the Board to hear employee views in 2022, supported by our Board members Sherry Coutu and Annette Thomas. Read more about this engagement, and plans for evolving the Board’s engagement with the workforce, on page 68. Promoting a diverse and inclusive workforce environment throughout Pearson remains a Board priority and relevant KPIs form part of the regular dashboard reviewed by the Board. We have accelerated our progress on improving our workforce diversity, but we also recognise there is more to be done.
Talent development and succession planning are also ongoing themes in the work of the Board and its Committees, and the Board runs a mentoring programme to support senior talent. The Board has been working with Ali Bebo, Pearson’s Chief Human Resources Officer, to assess our culture and employee engagement levels. It is also supporting the executive management team to drive a culture of performance and accountability throughout the organisation, which is covered in more detail on page 65.
54 Pearson plc |
Board composition, succession and evaluation
As a Board, we pride ourselves on the diverse backgrounds, perspectives and skill sets of our Directors, whose range of expertise includes digital and direct to consumer strategy and business models, sustainability, education and workforce learning, and leadership of global, complex organisations through periods of transformation and disruption, as well as, of course, financial acumen. I am excited to contribute my own leadership experience from Twitter, Google and other tech businesses. You can read more about the Board’s skills and experience on page 75.
New appointments during 2021 and 2022 significantly enhanced the diversity of our Board, as you can see on page 59. We will continue to monitor the Board’s composition to ensure we maintain the range of skillsets and perspectives needed to support the company’s strategy and complement our succession planning.
I would like to take this opportunity to thank my predecessor Sidney Taurel, who led Pearson with distinction for six years, steering its restructuring and digital transformation. Under his tenure, Pearson became a more streamlined, agile and interconnected company, and he leaves us with a strong strategy and a balance sheet primed for growth.
Likewise, on behalf of all Directors I extend our gratitude to Linda Lorimer, who reached nine years with the Board in 2022 but, as explained last year, has stayed on until the 2023 AGM to support a smooth handover to our new Board members. As Chair of the Reputation & Responsibility Committee and a member of the Audit Committee, Linda has been a resounding voice of wisdom and independent judgement, supported by her insight from 40 years serving in higher education. We send Linda our very best wishes for the future. I am delighted that Annette Thomas has agreed to succeed Linda as Chair of the Reputation & Responsibility Committee.
Esther Lee joined the Board as a
Non-Executive
Director in early 2022, bringing significant experience through executive leadership roles with global consumer-facing brands. Already, she has made a strong contribution to the Board and as a member of our Remuneration and Nomination & Governance Committees. Both Esther and I greatly benefited from the induction processes organised for us upon joining Pearson, which are described further on page 70.The Board is fully engaged in planning for future retirements, and closely monitors the evolution of skill sets needed to drive the company forward. More detail about the Board’s succession planning can be found in the Nomination & Governance Committee report on pages
74-77.
I was pleased to lead the annual Board evaluation process in 2022, which is described on pages
71-73.
This provided a wonderful opportunity for me to obtain an overall picture of the Board’s dynamics and views. We have a robust governance approach that will be the bedrock of delivering our strategy. At a time of pivotal strategic development for the company, I have worked with the Board to assess Board and Committee cadence, to empower the Committee Chairs to drive their agendas and to support the Board’s opportunities to engage in rich strategy discussions, while also ensuring a focus on operational excellence.As part of this, we have reviewed the remit of each Committee and how we collaborate on organisation-wide topics, such as culture and sustainability – more detail on the Board and Committees’ collaboration on ESG oversight is set out on page 66, as part of our explanation of how the Board is kept informed on relevant matters.
Conclusion
I hope this report explains clearly to you how Pearson is run and how we align governance and our Board agenda with our strategic direction. Shareholders are always welcome to put their questions or feedback to us, either via our website (www.pearsonplc.com) or at our AGM. Once again this year, shareholders will be able to join us and vote at our AGM either in person or virtually. Details will be included in the forthcoming AGM notice.
It only remains for me to thank our shareholders for their continued support and interest in this fantastic company. It has been a privilege to step into the role of Chair and I look forward to maintaining our stakeholders’ confidence as we seek to capture Pearson’s enormous growth potential as a lifelong digital partner for learners everywhere.
Omid Kordestani
Chair
Compliance with the UK Corporate Governance Code | ||||
The principles set out in the UK Corporate Governance Code (the ‘Code’) emphasise the value of good corporate governance to the long-term sustainable success of listed companies. The Pearson Board is responsible for ensuring that the Group has in place appropriate frameworks to comply with the Code’s requirements. This governance report and the strategic report set out how Pearson has applied the principles of the Code throughout the year. | ||||
The Board believes that during 2022 the company was in full compliance with all applicable principles and provisions of the Code, save that, as described last year, Pearson is not fully compliant with Provision 36 of the Code on the basis that the shares awarded under the Chief Executive’s co-investment award made in 2020 are subject to a post-vesting holding period until 31 December 2023, rather than the total vesting and holding period of five years or more required by the Code. Further detail is provided in the Directors’ remuneration report. | ||||
| Annual report and accounts 2022 Pearson plc 55 |
Board of Directors
Leading the way
Pearson Board members bring a wide range of experience, skills and backgrounds which complement our strategy. |
All Board members have strong leadership experience at global businesses and institutions. Our Board members’ biographies illustrate the contribution each Director makes to the Board by way of their individual experience.
Key to Committees
 | Audit | |
 | Nomination & Governance | |
 | Reputation & Responsibility | |
 | Remuneration | |
 | Committee Chair | |
Current notable commitments reflect other listed company directorships and full-time or executive roles.
 |  |  | ||
Omid Kordestani | Andy Bird, CBE | Sally Johnson | ||
| Chair | Chief Executive | Chief Financial Officer | ||
| Aged 59 | Aged 59 | Aged 49 | ||
Appointment | ||||
First appointed to the Board 1 March 2022 Chair since 29 April 2022 | First appointed to the Board 1 May 2020 Chief Executive Officer since 19 October 2020 | Chief Financial Officer since 24 April 2020 | ||
Skills and experience | ||||
| Omid is an international businessman who serves on the boards of Klarna Bank AB and Klarna Holding AB and is a Council Member for Balderton Capital. He was Executive Chair of Twitter, Inc. between October 2015 and May 2020, and a Board Member until October 2022. From August 2014 to August 2015, Omid served as Senior Vice President and Chief Business Officer at Google and previously from May 1999 to April 2009 as Senior Vice President of Global Sales and Business Development. From 1995 to 1999, Omid served as Vice President of Business Development at Netscape Communications Corporation. Prior to joining Netscape Communications Corporation, Omid held positions in business development, product management and marketing at The 3DO Company, Go Corporation and Hewlett-Packard Company. | Andy has a long and distinguished career spanning over 35 years in the media industry, and he is an accomplished, strategic leader of global consumer content businesses. Most recently, he spent 14 years working for The Walt Disney Company, joining the business as President of Walt Disney International in 2004 before being appointed Chair in 2008. He held this role for a decade, during which time he transformed the organisation into a digital-first, direct to consumer business, focused on serving the diverse needs of customers around the world. In addition, Andy worked to establish the iconic brand in China, through the creation of Disney English, teaching English language to local families through immersive learning experiences. Prior to Disney, Andy worked in a number of senior positions at AOL Time Warner, and spent the earlier part of his career at Piccadilly Radio, Virgin Broadcasting Company, BSB Music Channel, Big & Good Productions, and Unique Broadcasting. | Sally joined Pearson in 2000 and has held various finance and operations roles across the business, both at a corporate level and within the divisions, including The Penguin Group. She brings to the Board extensive commercial and strategic finance experience as well as expertise in transformation, treasury, tax, risk management, business and financial operations, investor relations and mergers and acquisitions. She has held various senior-level roles across the business, most recently as Deputy CFO of Pearson. Sally is a member of the Institute of Chartered Accountants in England and Wales and trained at PricewaterhouseCoopers. She was also a Trustee for the Pearson Pension Plan from 2012 to 2018. | ||
56 Pearson plc |
 |  |  |  | |||
Sherry Coutu, CBE | Esther Lee | Linda Lorimer | Graeme Pitkethly | |||
Non-Executive Director | Non-Executive Director | Non-Executive Director | Non-Executive Director | |||
| Aged 59 | Aged 64 | Aged 70 | Aged 56 | |||
Appointment | ||||||
Non-Executive Director since1 May 2019 | Non-Executive Director since1 February 2022 | Non-Executive Director since1 July 2013 | Non-Executive Director since1 May 2019 | |||
Skills and experience | ||||||
Sherry is a seasoned non-executive director with extensive plc experience in the financial services, technology, and education sectors where she has held numerous senior leadership positions, including Chair, Senior Independent Director, and Chief Executive Officer. Prior to her portfolio career, Sherry founded several technology companies and invested in 70 companies and five venture capital firms.Presently, Sherry serves as the Chair of Workfinder, a technology start-up specialising inAI-based recruitment services, and Raspberry Pi, a computer company. Sherry’s previousnon-executive director experience includes the London Stock Exchange Group plc, DCMS, Zoopla plc, and RM plc. She has also served on the Advisory Boards of LinkedIn, the National Gallery, the Royal Society, and NESTA. | Esther brings significant experience to the Pearson Board through her prior executive leadership roles in developing customer strategies to drive growth, global marketing and branding; driving digital transformation; and building high-performance teams. She has a long track record of senior leadership roles working for global consumer-facing brands. Most recently, she served as Executive Vice President – Global Chief Marketing Officer at MetLife Inc. Previously, Esther served as Senior Vice President – Brand Marketing, Advertising and Sponsorships for AT&T, and she has served as CEO of North America and President of Global Brands for Euro RSCG Worldwide. Prior to that, she served for five years as Global Chief Creative Officer for The Coca-Cola Company. Esther is a Board member at The Clorox Company where she chairs the Nomination & Governance Committee. Current notable commitments The Clorox Company (Non-Executive Director) | Linda is currently a Senior Advisor at the Boston Consulting Group and has spent almost 40 years serving higher education. She retired from Yale in 2016 after 34 years at the university where she served in an array of senior positions, including Vice President for Global and Strategic Initiatives. She oversaw the development of Yale’s online education division and the expansion of Yale’s international programmes and centres. During her tenure, she was responsible for many administrative services, ranging from Yale’s public communications and alumni relations to sustainability, human resources, and the university press. She also served on the boards of several public companies, including as Presiding Director of the McGraw-Hill companies. Linda is a member of the Board of Yale New Haven Hospital, where she chairs the Nomination & Governance committee. She also remains on several consequential advisory committees at Yale University. | Graeme is the Chief Financial Officer and a Board member of Unilever. He joined Unilever in 2002 and, prior to his appointment as the CFO, was responsible for its UK and Ireland business. He also held a number of senior financial and commercial roles within Unilever and spent the earlier part of his career in senior corporate finance roles in the telecommunications industry. Graeme served as Vice President of Financial Planning and Vice President of Corporate Development at FLAG Telecom and started his career at PricewaterhouseCoopers. Graeme is a Vice Chair of the Task Force on Climate-Related Financial Disclosures, a Member of the Strathclyde University Centre for Sustainable Development and is a Chartered Accountant. Current notable commitments Unilever plc (Chief Financial Officer) | |||
| Annual report and accounts 2022 Pearson plc 57 |
Board of Directors
continued
 |  |  | ||||
Tim Score | Annette Thomas | Lincoln Wallen | ||||
Deputy Chair and Senior Independent Director Aged 62 | Non-Executive DirectorAged 57 | Non-Executive Director | ||||
| Aged 62 | ||||||
Appointment | ||||||
Non-Executive Directorsince 1 January 2015 Senior Independent Director since 30 April 2021 Deputy Chair since 29 April 2022 | Non-Executive Directorsince 1 October 2021 | Non-Executive Directorsince 1 January 2016 | ||||
Skills and experience | ||||||
Tim has extensive experience of the technology sector in both developed and emerging markets, having served for 13 years as CFO of ARM Holdings plc, the world’s leading semiconductor IP company. He is an experienced Non-Executive Director and was appointed as a Non- Executive Director of Bridgepoint Group PLC in 2021, alongside his roles as Chair of The British Land Company plc, aNon-Executive Director of the Football Association, and a Trustee of the National Theatre. Tim has garnered extensive financial and listed company experience during previous and current positions. He served on the board of National Express Group plc from 2005 to 2014, including time as interim Chair and six years as SID. Earlier in his career, Tim held senior finance roles with Rebus Group, William Baird, LucasVarity plc and BTR plc.Current notable commitments The British Land Company plc (Chair), Bridgepoint Group PLC (Non-Executive Director) | Annette has a 25-year track record in leading global publishing and data analytics businesses, across academic, educational and consumer media verticals. Most recently, she served as CEO of Guardian Media Group, a position she held until June 2021. Prior to this, Annette was CEO of the Web of Science Group at Clarivate Analytics, a data, analytics and software business focused on research and higher education. She has also served as CEO of Macmillan Publishers and led the digital and global transformation of Nature Publishing Group.She currently serves as Senior Advisor to General Atlantic. Her previous non-executive experience includes serving as a Trustee of Yale University,Non-Executive Director at Clarivate Analytics (2017), and as a Board member for Cambridge University Press and Cambridge Assessment (2019-2020). She has also previously acted as an advisor to Creative Commons and Bain Capital. | Lincoln has extensive experience in the technology and media industries, and is currently CTO of Improbable, a technology start-up supplying next-generation cloud hosting and networking services to the video game industry. Lincoln was CEO of DWA Nova, asoftware-as-a- Non-Executive Director of the Smith Institute for Industrial Mathematics and Systems Engineering, and Varjo, a manufacturer of augmented, virtual and mixed reality headsets for professionals. His early career involved 20 years of professional IT and mathematics research, including as a Reader in Computer Science at Oxford.Current notable commitments Improbable (Chief Technology Officer) | ||||
58 Pearson plc |
Board composition
| Gender | Ethnicity 1 | |||
 |  | |||
| Nationality | Tenure | |||
 |  | |||
This data reflects Directors in office as at 31 December 2022. To learn more about Board diversity, please see page 76. For diversity data in the format prescribed by LR 9.8.6R(10), please see page 225.
1. Ethnicity categories are based on the UK’s Office for National Statistics classification.
Independence of Directors
All of the
Non-Executive
Directors who served during 2022 were considered by the Board to be independent for the purposes of the UK Corporate Governance Code (the Code). The Board reviews the independence of each of theNon-Executive
Directors annually. This includes reviewing their external appointments and any potential conflicts of interest, as well as assessing their individual circumstances in order to ensure that there are no relationships or matters likely to affect their judgement. In addition to this review, each of theNon-Executive
Directors is asked to provide confirmation of their independence on an annual basis (as defined by the Sarbanes-Oxley Act, the New York Stock Exchange (NYSE) listing rules and the Code).In January 2024, Mr Score will reach nine years’ service on the Pearson Board. Upon or in anticipation of attainment of nine years’ service by any
Non-Executive
Director, the Board undertakes an assessment to satisfy itself as to the continuing independence of that Director. The Nomination & Governance Committee gave particular consideration to Mr Score’s independence in March 2023 ahead of proposing to shareholders that he bere-appointed
for a further year at the forthcoming Annual General Meeting, recognising that he will reach nine years’ service during the coming year, ifre-elected.
In doing so, the Committee assessed the degree of objective judgement and constructive challenge demonstrated by Mr Score, and confirmed that his skills, experience and knowledge contribute to productive Board discussions. Accordingly, the Board is satisfied that Mr Score remains independent, and that he continues to provide constructive challenge and hold management to account.In accordance with the Code, Omid Kordestani was considered to be independent upon his appointment as Chair on 29 April 2022.
As originally described in the 2022 Notice of AGM, Linda Lorimer will be retiring from the Board at the 2023 AGM and will not be seeking
re-election.
In 2022, the Committee assessed Ms Lorimer’s independence, having regard to, among other factors, the Financial Reporting Council’s Guidance on Board Effectiveness, and concluded that Ms Lorimer remained independent. In assessment of her own independence, undertaken in February 2023 to address the requirements of the NYSE, Sarbanes-Oxley Act, and the Code, Ms Lorimer did not declare any matters which may cause her independence to be questioned.The Directors can obtain independent professional advice, at the company’s expense, in the performance of their duties. All Directors have access to the advice and services of the Company Secretary, whose appointment and removal is a matter reserved for the full Board.
| Annual report and accounts 2022 Pearson plc 59 |
Pearson Executive Management (PEM)
Key | ||
 | Internal appointment | |
 | External appointment | |
 |  |  |  |  | ||||
Tom ap Simon  | Ali Bebo  | Tim Bozik  | Lynne Frank | Gio Giovannelli | ||||
President – Higher Education and Virtual Learning Aged 44 | Chief Human Resources Officer Aged 54 | Interim Chief Product Officer and Co- President, Direct to Consumer | Chief Marketing Officer and Co- President, Direct to Consumer | President – English Language Learning Aged 50 | ||||
| Aged 61 | Aged 56 | |||||||
Appointment | ||||||||
Joined Pearson 1 December 2004 Appointed to the PEM 1 April 2021 | Joined Pearson 13 December 2021 Appointed to the PEM 13 December 2021 | Joined Pearson 18 May 1998 Appointed to the PEM 23 May 2013 | Joined Pearson 16 November 2020 Appointed to the PEM 16 November 2020 | Joined Pearson 1 February 2014 Appointed to the PEM 1 April 2016 | ||||
Skills and experience | ||||||||
| Tom has 19 years of international business and finance experience. At Pearson, he has led the Virtual Schools business, worked in finance for the emerging markets businesses and led M&A activity in the US. Previously, he worked in investment banking at RW Baird. Tom holds an MA in Economics and Politics from the University of Edinburgh. | Ali is a senior executive with over 25 years of experience building culture for transformative business performance across multiple industries. Prior to joining Pearson, she was an officer and CHRO for Hologic, Inc., a global medical technology company. Prior to Hologic, she held various HR leadership roles with the specialty retail company, ANN INC. Ali earned her BA in Political Science from the University of California, Los Angeles. | Tim has more than 30 years of extensive leadership experience in higher education products and the business of delivering them at Pearson. Tim earned a Bachelor’s Degree from the University of Notre Dame and currently serves on the Board of Directors for the Association of American Publishers. | Lynne has over 25 years of experience in the media industry. Previously, she has worked in companies such as WarnerMedia, ESPN/Disney and Turner Broadcasting. Lynne holds a degree in economics and business, and a certificate in corporate board governance from the University of California, Los Angeles (UCLA). | Gio has over 25 years of international business experience, including four CEO roles in Brazil. Previous board roles include BOVESPA-listed Natura and CVC Viagens. Gio graduated from Bocconi University, holds an Economics PhD and is an OPM graduate of Harvard Business School. | ||||
PEM Composition | ||
Gender  | Ethnicity 1  | |
These figures reflect the executive team excluding the Company Secretary. The Chief Executive and Chief Financial Officer have been excluded and are counted in the Board metrics on page 59. For diversity data in the format prescribed by LR 9.8.6R(10), please see page 225. 1. Ethnicity categories are based on the UK’s Office for National Statistics classification. 60 Pearson plc | ||
 |  |  |  |  | ||||
Mike Howells  | Sulaekha ‘Sue’ Kolloru Barger | Cinthia Nespoli  | Art Valentine | Marykay Wells | ||||
President – Workforce Skills Aged 46 | Chief Strategy Officer Aged 47 | Chief Legal Officer Aged 42 | President – Assessment & Qualifications Aged 58 | Chief Information Officer Aged 60 | ||||
Appointment | ||||||||
Joined Pearson 1 December 2020 Appointed to the PEM 1 December 2020 | Joined Pearson 16 May 2022 Appointed to the PEM 16 May 2022 | Joined Pearson 1 February 2014 Appointed to the PEM 21 May 2020 | Joined Pearson 23 January 2006 Appointed to the PEM 1 February 2022 | Joined Pearson 14 July 2014 Appointed to the PEM 16 March 2022 | ||||
Skills and experience | ||||||||
| Mike has more than 20 years of international business experience. Previously, he has worked in the British diplomatic network and the UK Foreign, Commonwealth and Development Office. Mike holds a Master’s degree in International Law from the University of Nottingham and an Anthropology degree from University College London. | Sue has more than 20 years of global strategy and corporate experience. Previously, she held engineering roles at technology companies. Sue holds an MBA from The Wharton School at the University of Pennsylvania and a BSc in electrical engineering from the University of Ottawa in Canada. She has served on several non-profit boards and councils focused on diversity and STEM. | Cinthia has over 19 years of international legal and compliance experience. Previously, she held leadership roles in legal and compliance at multinational companies. Cinthia was admitted to the Brazilian bar in 2004 and earned her law degree from Pontifícia Universidade Católica de Campinas as well as a post-graduate degree in tax law from Pontifícia Universidade Católica de São Paulo. | Art has more than 30 years of leadership experience in assessments, testing, and technology. Prior to his 16 years at Pearson serving as a senior leader of Pearson VUE and as Managing Director of Pearson Clinical Assessment, Art worked at Promissor, which was acquired by Pearson in 2006. Art earned his MS in Mathematical Science/Computer Science from the University of North Carolina Chapel Hill. | Marykay has over 30 years of strategic planning and large, global technology transformation experience. Prior to joining Pearson, Marykay had CIO roles at Nortel, Tekelec (acquired by Oracle) and Extreme Networks. Marykay holds a BS degree in Computer Information Science from Clarkson University and is a member of the organising committee for the Accenture Women’s Summit, Salesforce Advisory Board, Google Leadership Advisory, and a member of the Gartner Research Board. | ||||
Nationality  | External/Internal Appointment  | |
Annual report and accounts 2022 Pearson plc 61 | ||
Division of responsibilities
The Board
The Board has established four formal Committees. The Committees focus on their own areas of expertise, enabling the Board meetings to focus on strategy, performance, leadership and people, governance and risk, and stakeholder engagement, thereby making the best use of the Board’s time together as a whole. The Committee Chairs report to the full Board at each Board meeting following their sessions, ensuring a good communication flow while retaining the ability to escalate items to the full Board’s agenda, if appropriate.
 | ||||||||||
Nomination & Governance Committee | Reputation & Responsibility Committee | Audit Committee | Remuneration Committee | |||||||
| Reviews corporate governance matters, including Code compliance and Board evaluation; considers the appointment of new Directors, Board experience and diversity; and reviews Board induction and succession plans as well as wider workforce engagement. | Oversees our sustainability and ESG framework, including progress towards our sustainable business strategy commitments. Works to assess and advance Pearson’s reputation with stakeholders, including through the areas of branding, culture, employee engagement and values. | Appraises our financial management and reporting and assesses the integrity of our accounting procedures and financial controls. The Committee also oversees risk, compliance and internal audit. | Determines the remuneration and benefits of the Executive Directors and oversees remuneration arrangements for the Pearson Executive Management team, as well as monitoring remuneration policies for the wider workforce. | |||||||
 | ||||||||||
Chair | Chief Executive | Deputy Chair and Senior Independent Director | Company Secretary | |||||||
| The Chair is primarily responsible for the leadership of the Board and ensuring its effectiveness. They ensure that the Board upholds and promotes the highest standards of corporate governance, setting the Board’s agenda and encouraging open, constructive debate of all agenda items for effective decision-making. They regularly meet the Chief Executive to stay informed and provide advice. They also ensure that shareholders’ views are communicated to the Board. | The Chief Executive is responsible for the operational management of the business and for the development and implementation of the company’s strategy, as agreed by the Board and management. They are responsible for developing operations, proposals and policies for approval by the Board, they promote Pearson’s culture and standards, and they are one of the key representatives of the company to its external stakeholders. | The Deputy Chair and Senior Independent Director supports the Chair on Board effectiveness and governance matters. This role includes meeting regularly with the Chair and Chief Executive to discuss specific issues, as well as being available to shareholders generally, should they have concerns that have not been addressed through the normal channels. The Deputy Chair and Senior Independent Director also leads the evaluation of the Chair on behalf of the other Directors. | The Company Secretary advises on governance matters and compliance with Board procedures. They are responsible, under the direction of the Chair, for ensuring the Board receives accurate, clear and high-quality information, and has adequate time and appropriate resources to function effectively and efficiently. They also support the Chair in delivering the corporate governance agenda, and organise director induction, training programmes and the Board evaluation process. | |||||||
 | ||||||||||
Pearson Executive Management | Standing Committee | Authorities and duties | ||||||||
| The Pearson Executive Management team consists of the Chief Executive and their senior direct reports. They are the executive leadership group for Pearson and are responsible for delivering Pearson’s strategy under clearly defined accountabilities and in line with agreed governance and processes. | A Standing Committee of the Board is established to approve certain operational and ordinary course of business items such as banking matters, guarantees and intra-Group transactions. They also make routine approvals relating to employee share plans. Additional authority may be delegated on an ad-hoc | The authorities and duties of the Board and its Committees, as well as the roles and responsibilities of key individuals on the Board, are clearly set out in writing. These documents are reviewed and approved by the Board on an annual basis and are available on the company’s website (www.pearsonplc.com). | ||||||||
62 Pearson plc |
Board activities
| The Board is deeply engaged in developing and measuring the company’s long-term strategy, performance, culture and values. We believe that Board members provide a valuable and diverse set of external perspectives and that robust, open debate about significant business issues brings an additional discipline to major decisions. |
The role and business of the Board
The key responsibilities of the Board include:
| — | overall leadership of the company and setting the company’s values and standards, including monitoring culture and diversity, equity and inclusion (DE&I) initiatives |
| — | reviewing and determining the company’s strategy, including in relation to environmental, social and governance (ESG) matters, in consultation with management, assessing performance against the strategy and overseeing management’s execution of it |
| — | supervising major changes to the company’s corporate, capital, management and control structures |
| — | approval of all transactions or financial commitments in excess of the authority limits delegated to the Chief Executive and other executive management — assessment of management performance, Board and executive succession planning and talent pipeline |
| — | effective engagement with key stakeholders |
Strategic planning and decision-making
The Board spends considerable time assessing whether any proposed action aligns with the strategy and future direction of the business, while taking into consideration sustainability and impact on our stakeholders. In addition, the Board regularly holds strategy discussions, whether in relation to the specific strategies of Pearson’s five business divisions or the vision and wider strategy of the company as a whole, both of which enhance the Board’s decision-making in shaping the company’s strategic and financial plans.
The Board and Committees receive timely, regular and necessary financial, management and other information to discharge their duties. Comprehensive papers are circulated to Board and Committee members approximately one week in advance of each meeting. The Board receives a regular performance dashboard and key milestones report, together with updates from the Chief Executive and Chief Financial Officer. In addition to meeting papers, a library of current and historical corporate information is made available to Directors to support the Board’s decision-making process. For items that require significant consideration and review in advance of a decision, such as the portfolio changes during 2022 in support of company strategy, the Board’s discussions can take place over a number of sessions.
Board meeting focus during 2022
| Strategy | Performance | Leadership & people | Governance & risk | Shareholder engagement | ||||
— Ongoing digital transformation — Direct to consumer strategy — Pearson+ performance — Implementation of Group strategy — Oversight of Four-Year Strategic Plan and approval of 2023 annual operating plan — M&A pipeline and post-acquisition reviews, as well as consideration, approval and regular updates of major transactions — Enterprise and ecosystem strategic update — Data strategy | — 2021 preliminary results and annual report and accounts — 2022 operating plan performance, including interim results and trading updates — Regular dashboard and milestone reports — Continuing review of forecasts — Final and interim dividend proposals | — Talent review, pipeline development and succession planning — Culture — DE&I initiatives — Employee Engagement Network engagement and feedback — Employee survey assessments — Purpose, vision, mission and values — Workforce learning and development | — Legal and regulatory governance compliance — Data privacy and cyber security matters — Board and Committees’ effectiveness evaluation — Regular review and annual confirmation of conflicts of interest — Approval of Committees’ terms of reference — Approval of division of responsibilities between Chair, Deputy Chair and Senior Independent Director, and Chief Executive — Risk management report | — Investor relations strategy, updates, and share price performance — Shareholder issues and voting — AGM and related shareholder interactions — Feedback from Board member meetings with shareholders — Major shareholders and share register analysis | ||||
| Annual report and accounts 2022 Pearson plc 63 |
Board activities
continued
The Directors recognise their duties towards the shareholders and other stakeholders as set out in Section 172 of the Companies Act 2006, and a continued understanding of the key issues affecting stakeholders is an integral part of the Board’s decision-making process. You can read more on pages
67-69
about how the Board engages with stakeholders and takes their views into account when making decisions.Portfolio changes
The Board receives regular updates on portfolio and corporate finance activities throughout the year, including regular updates on live transactions (disposals, acquisitions and corporate joint venture activity) and outputs of periodic portfolio reviews. These updates can take the form of presenting key summaries of information in Board packs, or oral updates on key matters. These discussions are typically led by executive and divisional management, supported by the Corporate Development team and, where necessary, external advisers. Subsequently, once portfolio transactions have closed, the Board is also kept informed of the integration or transition progress, including post-acquisition reviews conducted to assess transaction success and any learnings to be taken for future projects. In 2022, such portfolio updates included the significant acquisitions of Credly, and Mondly (which you can read more about on page 69) and, subject to closing, PDRI, as well as a review of potential pipeline opportunities and the disposal, across several transactions, of our international courseware local publishing businesses.
Board meetings
The Board held six scheduled meetings in 2022, with discussions and debates focusing on the ongoing implementation and execution of the strategy, as well as other key strategic issues facing the company. Major items covered by the Board in 2022 are shown in the table on page 63. In addition to its scheduled meetings, the Board convenes as necessary to consider matters of a time-sensitive nature. In 2022, the Board also met on a number of additional occasions to consider the unsolicited approaches by Apollo Global Management. The Board welcomed the opportunity in 2022 to return to a fuller schedule of
in-person
meetings but, following its experiences during the pandemic, also continued to operate effectively in a virtual environment where needed.Reflecting on the level and quality of engagement by the Board in 2022, the Board is satisfied that each Director contributed to Board discussions and demonstrated sufficient commitment to be able to meet their responsibilities. As shown in the table below, each of the
Non-Executive
Directors attended all scheduled Board meetings during 2022. In addition, the Nomination & Governance Committee confirmed in its annual assessment that each Director demonstrates the requisite level of commitment and contribution in accordance with Principle H and Provision 18 of the Code.Board attendance
Directors are expected to attend all Board and Committee meetings, but in certain exceptional circumstances, such as
pre-existing
business or personal commitments, it is recognised that Directors may be unable to attend. In these circumstances, the Directors receive relevant papers and, where possible, will communicate any comments and observations in advance of the meeting for raising as appropriate during the meeting. They are updated on any developments after the meeting by the Chair of the Board or Committee, as appropriate.Individuals’ attendance at Board and Committee meetings is considered as part of the formal review of their performance. There was a high level of attendance by the Directors at Board and Committee meetings in 2022, as shown in the table to the right and in the Committee reports that follow.
Directors’ commitments and conflicts of interest
Under the Companies Act 2006 (the ‘Act’), the Directors have a statutory duty to avoid conflicts of interest with the company. The company’s Articles of Association allow the Directors to authorise conflicts of interest. The company has an established procedure to identify actual and potential conflicts of interest, including all directorships or other appointments to, or relationships with, companies that are not part of the Pearson Group and which could give rise to actual or potential conflicts of interest. Additionally, in response to Provision 15 of the UK Corporate Governance Code, Pearson has developed internal guidance to be taken into account when considering changes to a Director’s commitments, or when appointing a new Director, as well as formalising the Board approval process for such matters.
Once notified to the company, any potential conflicts and commitments are considered for authorisation by the Board at its next scheduled meeting or, where necessary in the interests of timeliness, by a committee comprising the Chair, Senior Independent Director and Company Secretary. In particular, the Board or committee considers the type of role, expected time commitment and any impact this may have on the Director’s duties to Pearson, as well as any relationships between Pearson and the external organisation. The interested Director is not permitted to vote on, or be counted in the quorum for, any resolution relating to their commitments, conflict or potential conflict. The Board reviews any authorisations granted on an annual basis.
When making new appointments in 2022, the Board considered other demands on Directors’ time. Esther Lee’s existing commitment as
Non-Executive
Director and Chair of the Nomination & Governance Committee at The Clorox Company, a NYSE-listed manufacturing company with a global portfolio, was considered as part of her appointment process. The Board agreed that Esther’s existing commitment would not have a negative impact on her ability to contribute to Pearson.Omid Kordestani’s existing commitments were considered as part of his appointment process. The Board was of the opinion that Omid’s additional notable commitment as a Board Member of Twitter, Inc. was acceptable as there were no conflicts perceived, and that his existing commitments would not prevent Omid from giving the time and attention that his role as the Chair of the Pearson Board would require.
The Board believes that the experience gained by Directors through their other commitments brings valuable perspectives to the Pearson Board.
| Scheduled meetings attended | ||||
Chair | ||||
Omid Kordestani 1 | 4/4 | |||
Sidney Taurel 2 | 3/3 | |||
Executive Directors | ||||
| Andy Bird | 6/6 | |||
Sally Johnson | 6/6 | |||
Non-Executive Directors | ||||
| Sherry Coutu | 6/6 | |||
Esther Lee 3 | 5/5 | |||
| Linda Lorimer | 6/6 | |||
| Graeme Pitkethly | 6/6 | |||
| Tim Score | 6/6 | |||
| Annette Thomas | 6/6 | |||
Lincoln Wallen | 6/6 | |||
| 1. | Omid Kordestani joined the Board as a Non-Executive Director on 1 March 2022 and became the Chair on 29 April 2022. |
| 2. | Sidney Taurel resigned from the Board on 29 April 2022. |
| 3. | Esther Lee joined the Board on 1 February 2022. |
64 Pearson plc |
How the Board is kept informed
| The application of our Board and governance processes ensures that our Directors receive accurate, timely and clear information from a range of sources. This allows the Board and Committees to monitor and provide feedback on matters of importance, as well as to make informed decisions in the best interests of the company and its stakeholders. |
Talent and culture
Ensuring that we have both a talented, engaged workforce that is focused on delivering our strategy and an inclusive organisational culture that enables and encourages that delivery, is critical to Pearson’s success. During the past year, the Board and executive team have led our focus on making sure Pearson offers a culture and environment that is inclusive and high-performing, and in which our people can leverage their strengths. We track Group-wide progress by our ‘Culture of engagement and inclusion’
non-financial
KPI (see page 18 for more details on our KPIs).In early 2022, Pearson launched its new purpose, vision, mission and values (set out on page 2), and the Board was instrumental in their development. The adoption of our new values by our employees is a key step in developing our culture to support our strategic vision, particularly in driving a culture of performance. Our 2022 ‘People of Pearson’ campaign featured diverse employees throughout our global workforce, showing how they bring our culture and values to life.
Recognising the global need for learning, relearning and upskilling at the heart of our business, our Learning at Work programme provides an
all-employee
opportunity to build a more inclusive learning culture across Pearson, alongside a continued drive for high performance. This programme is built around Pearson’s capabilities framework, which the Board and Executive team believe closely matches the knowledge, skills, mindset and experiences that will enable our people to drive Pearson’s evolution. Recent modules include engagement, being customer-and consumer-driven, and strategy, planning and value.The Board monitors culture and organisational health together with its Committees, and receives regular updates from the Chief Executive and Chief Human Resources Officer. In addition to tracking culture as a
non-financial
KPI, the Board monitors other Group-wide initiatives that underpin our culture (see table below for examples).During 2022, the Reputation & Responsibility Committee expanded its remit to include oversight of culture and employee engagement, increasing the Board-level focus on these matters. The Chief Human Resources Officer is a frequent attendee at Board meetings, as well as a standing attendee at the Reputation & Responsibility, Remuneration, and Nomination & Governance Committees. Her attendance and contributions, together with the Board’s own direct engagement with the workforce, ensure that our Directors are attuned to our culture and employee-related considerations through multiple lenses, including in strategic decision-making (see our case study on page 69), and in conducting their business more broadly.
During the year, the Board and Reputation & Responsibility Committee considered reflections and insights from the Chief Human Resources Officer following her first few months post appointment. Focus areas included cultural themes and principles that will underpin successful navigation of Pearson’s next phase, and attributes that are proven to predict performance, accelerate growth and increase the velocity of innovation – key to instil and hone throughout the company. The Board also has a particular focus on the current and future leaders of Pearson, including our talent pipeline for leadership and other pivotal roles, and we conducted our annual deep dive into talent and succession planning in December 2022. Read more on page 75.
Read more about how we empower our people to make a difference on page 33.
| Cultural indicator | How it is overseen | Board level responsibility | ||
| Employee engagement | The Board ensures engagement through multiple channels, including the new Pearson Engagement Survey in 2022 (the results of which were discussed by the Reputation & Responsibility Committee), our Employee Engagement Network (EEN), and town hall sessions. Read more on page 68. |  | ||
| Code of conduct and training | The Audit Committee is briefed on our annual Code of Conduct programme, including development of the code, completion rates, training and certification methods. Certification of the code is mandatory and we achieved a 100% employee completion rate in 2022. We also have mandatory training for all employees on cyber security and data privacy, and targeted training for employees in certain roles, divisions or geographies. |  | ||
| Compliance, including whistleblowing and investigations | The Chief Compliance Officer reports to the Audit Committee at every meeting on new and ongoing investigations, including matters raised through our SpeakUp process. The Audit Committee considers the programme’s effectiveness annually, including peer benchmarking. The Audit Committee Chair ensures the Board has visibility of matters of note. The Board is free to request further information to support its oversight. |  | ||
| Internal audit | Insights into elements impacting our culture and cultural behaviours are provided where necessary by internal audit to the Audit Committee as part of the findings and recommendations in its reports. |  | ||
| Health and safety (‘H&S’) | The Reputation & Responsibility Committee receives an annual H&S report, so Directors can monitor the key strands of our H&S framework, including: oversight of how Pearson is enabled through awareness, competency, resources and guidance to allow for agile and effective management of H&S risk, while also receiving comfort that we have controls for compliance and assurance purposes. |  | ||
| Remuneration practices and rewarding the workforce | The Remuneration Committee monitors the wider Employee Reward framework, including incentive target setting for group plans, fair pay analysis, Chief Executive pay ratios and alignment of Directors’ pension contribution to the workforce. It also oversees integration of ESG measures into incentive targets. This suite of activity provides insights into the roles that remuneration and setting performance goals play in promoting the right behaviours, particularly in driving a culture of performance, and how incentives and rewards align with culture. |  | ||
| Talent attraction and retention | The Chief Human Resources Officer regularly updates the Remuneration Committee on talent considerations, including trends on recruitment, retention and staff turnover. Talent attraction and retention plays into our ability to execute our strategy, so it is considered in strategic discussions by the Board and executive team. Recognising the importance of our people, Talent is a sub-category of our principal risk, Capability. Read more about our risk management approach starting on page 43. | | ||
The Board has a strong interest in all areas relating to Pearson’s talent and culture, and may choose to spend additional time considering the cultural indicators shown in the table, and others, over and above the input provided by our Committees.
| Annual report and accounts 2022 Pearson plc 65 |
How the Board is kept informed
continued
Sustainability
Pearson has a strong governance structure through which the Board and its Committees monitor and oversee the company’s ESG framework.
The company’s ESG framework includes three pillars: driving learning for everyone with our products, empowering our people to make a difference, and leading responsibly for a better planet. These pillars represent the areas where Pearson can make the biggest positive impact and where our responsibilities lie towards society and the environment.
The Board’s ESG governance structure
Indicative ESG duties falling within remits of Board Committees
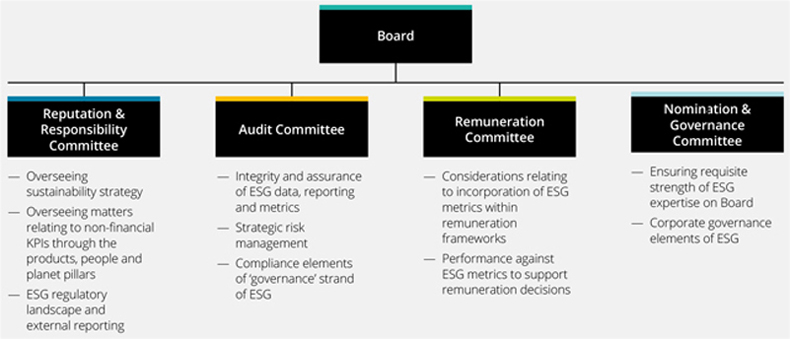
The Reputation and Responsibility Committee (RRC) leads the Board’s oversight of ESG matters.
Given the breadth of topics that feed into our sustainable business pillars, as well as the fast moving and increasingly complex external landscape around these matters, a review was undertaken in 2022 to ensure the Board’s overall governance framework for ESG remained fit for purpose. In particular, the following steps were undertaken:
| — | we revised the terms of reference of the RRC to reflect Pearson’s sustainable business strategy and to acknowledge the RRC’s role with respect to the requirements of the external ESG landscape |
| — | we formally included employee engagement matters in the RRC’s remit, alongside culture, with a particular emphasis on diversity and high-performance |
| — | we further codified the ESG duties of the other Committees, such as the Audit Committee’s role in overseeing the integrity and assurance of ESG data, reporting and metrics, and the Remuneration Committee’s considerations around incorporation of, and performance against, ESG metrics in remuneration decisions |
| — | in order to support alignment in approach and information sharing across all Committees, Annette Thomas, Non-Executive Director, was appointed to the Remuneration Committee, in addition to her existing membership of the RRC and Nomination & Governance Committee |
| — | we held a dedicated session for the Remuneration Committee on the topic of Pearson’s sustainability strategy, to ensure that it was fully apprised of key matters in this space as it began work on the new Directors’ remuneration policy. The session was led by the Chief Legal Officer and VP – Sustainability, with the Chair of the RRC, Linda Lorimer, also in attendance. |
The graphic above illustrates how the Committees work together to support the Board in overseeing sustainability at Pearson.
In addition to the specific actions noted above, during the year the Board and its Committees discussed and monitored a variety of other topics pertinent to Pearson’s sustainable business strategy. These included:
| — | monitoring the performance of Pearson+ and considering the next steps for its expansion, in support of our aims to extend our digital content offering, reach and accessibility |
| — | continued oversight of data privacy and cyber security matters by the Audit Committee. This included monitoring management’s implementation of actions that were recommended as part of a review of Pearson’s privacy and security programme, commissioned by the Board in 2021 |
| — | discussion and endorsement of talent, culture and employee engagement initiatives, as set out on pages 65-68. |
You can read more on the sustainability matters covered during 2022 throughout this Governance Report, in particular in the RRC’s report on pages
78-79.
66 Pearson plc |
Understanding our stakeholders
| A strong understanding of all our stakeholders and their perspectives is integral to our strategic planning and operational delivery. Our Board strategy sessions are informed by the views and needs of our eight stakeholder groups: consumers, educational institutions and educators, employers, business partners and institutions, government and regulators, employees, shareholders, and our communities. |
As required by the UK Corporate Governance Code, the Board ensures Pearson engages effectively with, and encourages participation from, its key stakeholders. The Board maintains its oversight through a variety of direct and indirect mechanisms, and the Reputation & Responsibility Committee monitors our stakeholder engagement framework.
The Board recognises that stakeholder views are integral to decision-making and setting the company’s strategy. More information on Pearson’s key stakeholders, including the outcomes of our engagement throughout 2022, is in the strategic report on pages
26-29.
Further information on how the Directors discharge their duties under Section 172 of the Companies Act 2006, is on page 29.Engagement in 2022
Throughout the year, the Board ensured that it was kept informed of stakeholder views, concerns, and commentary, through engagement, both direct and indirect, physical and virtual. This engagement took place through a variety of ways, including
in-person
and virtual meetings, reports and presentations at Board or Committee meetings, feedback from members of the executive management team and other employee groups, and interactions with different functions, teams and advisers, both inside and outside Pearson. The use of digital technology allowed for broader engagement, helping to ensure that stakeholders retained a voice within the Boardroom.A key factor in any decision-making is listening to and considering the interests of stakeholders. We have set out below examples of the key employee and shareholder engagement activities undertaken by the Board and by individual Directors over 2022. A detailed review of our acquisition of Mondly, and how it relates to our stakeholders and Pearson’s long-term success, is on page 69.
Shareholders
Shareholders are a key consideration in the Board’s decision-making. As the world emerged from the pandemic, we have once more focused on driving shareholder engagement through
in-person
meetings and events, while also using digital technology to reach a wider base of shareholders.The Board is committed to fostering shareholder engagement by making it easier for all types of shareholders to attend annual general meetings (AGMs), recognising that they represent an opportunity for shareholders to interact with the Board and share their views, concerns, and feedback. In 2022, we held our first hybrid AGM, with shareholders able to attend the meeting in person or virtually. The digital technology adopted by Pearson also allowed shareholders to vote and ask questions to the Board, both
in-person
and online.We believe that the hybrid approach enables a broader cross-section of our shareholders to participate in general meetings. Reflecting on the positive experience of our AGM arrangements in 2022, we will again be holding a hybrid AGM in 2023, and look forward to welcoming our shareholders. Further details will be shared in our notice of the 2023 AGM.
The Board ensured a continued shareholder dialogue throughout the year. In accordance with the UK Corporate Governance Code, we engaged with shareholders following a significant minority vote against our Directors’ remuneration report at our 2022 AGM and reported back to the market on the major themes discussed. The Remuneration Committee completed a comprehensive review of Pearson’s executive remuneration framework ahead of the renewal of the Directors’ remuneration policy at the 2023 AGM, in line with the normal three-year cycle in the UK. As part of this process, the Committee engaged extensively with many of its larger shareholders and proxy agencies, and held virtual or
in-person
meetings with a significant proportion of those it approached. Further information on the Directors’ remuneration policy, and shareholder engagement after our 2022 AGM, is on pages88-91.
Shareholder engagement at a glance Over 2022, our Chief Executive, Chief Financial Officer and Divisional Presidents, as well our investor relations team, participated in meetings, conferences, roadshows and events across the world. This concluded with an intensive Q4 roadshow with outreach to over 350 investors and conference participation across the US, Europe and the UK. |  | With |  | |||||
| Annual report and accounts 2022 Pearson plc 67 |
Understanding our stakeholders
continued
Employees
The Reputation & Responsibility Committee leads on employee engagement and its evolution on behalf of the Board. The Board recognises that our employees are one of our most important assets and are integral to our business and is committed to strengthening their voice. Examples of how the Board engaged with employees in 2022 to ensure that they are listened to, supported and rewarded, are illustrated below.
Employee Engagement Network
Our Employee Engagement Network (EEN) acted as a feedback mechanism, enabling the Board to hear directly from employees. Representing the voice of our employees, the EEN consisted of a selected group of active listeners, good communicators, and solid employee ambassadors across the company and in key geographies. These individuals included diverse genders, ethnicity groups, geographies, ages and tenures.
In 2022, the EEN welcomed Annette Thomas as a regular attendee alongside Sherry Coutu, increasing
Non-Executive
Director participation in the EEN.Between November 2021 and December 2022, our second cohort of EEN members held five meetings focused on innovation, systems and processes, reward and recognition, structure and change, and cross-collaboration. Each meeting was structured to ensure that any views or feedback on key topics raised by employees could be passed on to the Board in advance, allowing each Director to review employee input ahead of Board meetings and consider it in their decision-making. Following EEN meetings, the Board received an update on any discussions that had taken place, such as the network’s collective feedback and several themes that arose as part of their discussion about reward and recognition.
The Board was also supportive of executive management receiving regular feedback from the network. In many cases, this feedback helped reaffirm the case for action in areas that were already being improved, such as the simplification of staff onboarding and user experience of internal systems. With the support of the network, approval escalation for many routine requests has been removed, reducing an administrative barrier for employees and their managers.
Looking ahead, the Board believes there is an opportunity to evolve its approach to employee engagement to ensure we continue to be inclusive, authentic and representative of our diverse employee base. The Board has endorsed a wider programme of engagement activities with employees to be rolled out in 2023, which will complement existing executive employee engagement and expand opportunities for direct engagement by
Non-Executive
Directors. This programme will includein-person,
structured listening sessions, as well as informal site visits at Pearson locations and virtual events.Town halls
Throughout 2022, the Chief Executive, Chief Financial Officer and the executive management team held town hall meetings, which Pearson employees were invited to attend. These discussions took place at significant points in the year, such as following key financial results announcements.
Surveys
In 2022, we launched a new approach to engagement, including our new Pearson engagement survey. We partnered with Gallup and used their Q12 survey questions and supporting resources. We collected actionable feedback at the manager level and benchmarked ourselves against 12 item areas proven to power engagement. We heard from over 14,000 employees - an increase in the overall response rate compared to previous engagement surveys. The Reputation and Responsibility Committee received a detailed update on the survey results, including additional insights on the culture of inclusion, coaching effectiveness, and upskilling, which were also discussed at Board level. Further information on the outcomes of the Pearson engagement survey is on page 33.

68 Pearson plc |
Our Board’s decision-making in action Acquisition of Mondly This case study on our acquisition of Mondly, which was announced in April 2022, illustrates how the Directors considered the various aspects of their statutory duties in making the decisions related to the acquisition and its implications for stakeholders. This case study should be read in conjunction with the Directors’ duties statement on page 29. Mondly offers consumers high-quality learning in English and 40 other languages through its app, website, and its virtual reality and augmented reality products. It delivers language courses for personal and professional learning in a combination of more than 1,300 language pairs alongside enterprise solutions and an award-winning app that helps children learn languages. Mondly was Pearson’s first major acquisition in the English Language Learning (ELL) division since the implementation of the new divisional structure, and is integral to its growth plans. The Board paid particular attention in its decision-making to assessing the strategic rationale, integration plans, and synergies to ensure these were robust, clear and achievable. The Board was of the view that Mondly’s technological capability and user experience, combined with the growing direct to consumer language learning market, could provide an engine for future growth of the ELL division based on a successful platform that was well-regarded in the market and had begun to scale while maintaining profitability. Alongside these considerations, the modularised, application-based nature of Mondly’s products had the potential to integrate with Pearson+. The Board understood that Mondly represented a potential avenue to link together ELL’s assessment capability and world-class content through a new channel, as well as noting potential synergies across the portfolio, such as offering the opportunity to bundle language learning with upskilling and reskilling products through Pearson’s Workforce Skills division. The Board was positive about how these potential synergies could play an important role in Pearson’s continued commitment to serve the lifelong learning needs of people around the world. When considering this acquisition, the Board received detailed updates from management (with input from specialists within the business and external advisers) setting out the strategic rationale, anticipated commercial synergies, due diligence findings, valuation and returns analysis, stakeholder considerations, structuring considerations, risks and detailed post-acquisition integration plans. The Board noted how the broader Pearson organisation could support Mondly in optimising its content for Pearson’s target audience of lifelong learners. This was balanced against key risks, such as the difficulty of profitably scaling a direct to consumer proposition and the cultural and operational challenges of post-acquisition integration. Overall, the Board considered Mondly to be an attractive acquisition opportunity, underpinned by its management, the skills and transformational potential of the Mondly team, and strong market fundamentals. Throughout the decision-making process, the Board considered how the acquisition could accelerate the company’s strategy and how the expertise acquired as a result of the acquisition would benefit Pearson stakeholders, all while ensuring that the acquisition was financially viable. The Board was mindful that this acquisition could promote sustainable economic growth and inclusively support learners in their language learning journey. In its decision-making, the Board considered Pearson’s key stakeholders in the following ways.  | Consumers Our strong direct to consumer ambitions put consumers at the heart of our strategic decisions. Mondly’s mission is to build bridges between people and cultures by making language learning fun and easy through technological innovation. The ambition to bring people together sits at the core of Mondly’s work. Furthermore, it strengthens Pearson’s commitment to its purpose of adding life to a lifetime of learning, offering learners new experiences and powerful ways to immerse them in a new language, including, in the long term, through its AR and VR capabilities. As part of its decision-making, the Board noted the broader appeal of developing transferable skills, including foreign language fluency, which can boost employability and success in life. Communities Mondly presented the opportunity to reach learners of all languages across the world by providing a go-to solution for both adults and children. In the Board’s view, Pearson could play an important role in upscaling content by leveraging its existing capabilities, excellent content, and network of customers and consumers to enhance the Mondly offering. This could benefit learners at all stages of their language learning journey - from beginner to advanced - using different features to make learning fun, engaging and accessible for users from a wide spectrum of socioeconomic circumstances and backgrounds globally.Employees Pearson and Mondly’s communications and HR teams worked closely to form an acquisition communications plan for employees and customers. For example, Pearson employees heard directly from the Chief Executive about how Mondly aligned with the company’s strategy, particularly in the ELL space. The Board viewed people and talent integration as crucial for this acquisition, noting that it was imperative to retain Mondly employees, and to maintain their customer-centric approach. In particular, the Board considered various initiatives to retain the skill set of Mondly employees, acknowledging that some of Pearson’s existing employee base might need to pivot their skill set and approach to support the speed and growth of Mondly and to develop into a multi language learning business. Considering the relatively small size of its team, the Directors were also aware of minimising the strain of integration on Mondly. They were keen to ensure appropriate acquisition speed and to prepare for a multiyear gradual and disciplined approach to reach full integration of Mondly into Pearson, while also remaining mindful of Mondly’s obligations once part of the Pearson group. Employers MondlyWORKS, the language learning solution for businesses offered by Mondly, provided the opportunity for Pearson to strengthen Mondly’s appeal by leveraging existing content and assessment solutions. The Directors also noted that Mondly’s solutions would be a strong addition to Pearson’s existing language learning products for corporate customers. The Board considered MondlyWORKS to be capable of offering commercial synergy opportunities that would benefit employers through sophisticated language learning content. Shareholders In considering the acquisition, the Board paid particular attention to, among other factors, commercial and revenue synergies, integration and employee retention costs, the potential financial returns on investment and the risks involved, the structure of the transaction, and whether the commercial terms of the acquisition were in the interests of shareholders as a whole. The Directors agreed that the acquisition had the potential to be transformative for the ELL division and could gradually strengthen Pearson’s offering in the Workforce Skills area and Pearson+, highlighting the already strong returns profile of Mondly. | |
Annual report and accounts 2022 Pearson plc 69 | ||
Directors’ induction
On joining the Board, each Director completes a bespoke induction programme that is guided by the Chair or Deputy Chair and Senior Independent Director, supported by the Company Secretary, and overseen by the Nomination & Governance Committee. Every programme builds on the particular skill set, attributes, and background of the joining Director, their interests in Board or Committee roles, and the company’s recommendations.
In addition to background information on the company, every induction covers a range of topics including Board procedures, recent operational performance and strategic direction of the company, purpose and values, key areas of the business, as well as Directors’ duties and responsibilities. The Directors also cover various governance-related issues and their legal obligations, including procedures for dealing in Pearson shares.
Each induction typically includes a series of meetings with the members of the Board, the executive management team, external advisers and brokers, and other senior management. Directors receive a walk-through of the business from senior executives and a briefing on Pearson’s investor relations programme. A newly appointed Director will have met some, if not all, fellow Board members as part of the original search and appointment process, but additional meetings may nevertheless occur with the same Board members as part of a rich and thorough induction.
Inductions for Esther Lee and Omid Kordestani
Esther Lee joined the Board on 1 February 2022 and Omid Kordestani joined as a
Non-Executive
Director on 1 March 2022, subsequently becoming the Chair on 29 April 2022. As part of their onboarding programmes, Esther and Omid received comprehensive and engaging induction programmes that included a series of meetings, beginning before their joining the Board and running for several consecutive weeks.In addition to meeting the Chair, Chief Executive and Chief Financial
Officer, Esther and Omid met with each of the executive management team members, key representatives of our corporate functions, and brokers. Both induction programmes also includedmeetings with each of their fellow
one-to-one
Non-Executive
Directors and a comprehensive introduction to the activities of each of the Board’s Committees, including their objectives and priorities. Esther and Omid also held meetings with the company’s legal advisers to discuss directors’ duties, corporate governance and external reporting, among other topics.Following the initial phases of her induction, Esther was keen to understand in greater detail our Workforce Skills division and reviewed its competitive landscape, acquisition strategy, market dynamics, and how each of these areas was linked to the strategic plan. The Nomination & Governance and Remuneration Committees, her planned contribution to which she discussed with their respective Chairs, were of particular importance to Esther. A meeting with the company’s external consultants on reward matters was subsequently arranged for Esther to learn more about the Remuneration Committee’s priority areas and the UK market landscape.
As Chair Designate, Omid held regular meetings with the Chair, Deputy Chair Designate and Senior Independent Director, as well as the Chief Executive. Having met the executive management team in person and following his introductory meetings with the company’s advisers, Omid was also invited to join the meetings of each of the Board’s Committees. The table below illustrates the purpose of some of the meetings that formed part of Omid’s induction programme.
“I welcomed the opportunity to get to know other Directors in advance of my joining the Board and to subsequently meet the executive management. From governance matters to divisional deep-dives, my induction programme included everything necessary to understand the dynamics of the Board and how to effectively contribute to its discussions as a Non-Executive Director.” |  Esther Lee Appointed to the Board on 1 February 2022 |
| Induction programme participants | Meeting purpose | |
| Chair, Deputy Chair Designate and Senior Independent Director | Introductory meetings to cover the company’s governance structure, the Board’s priority areas and ways of working, meeting cadence, and ongoing matters considered by the Board. | |
| Chairs and members of the Board’s Committees | Overview of the responsibilities and composition of the Board’s Committees, their governance, regular attendees and advisers. | |
Executive Directors; Divisional Presidents | Overview of the strategic priorities of the company and each division, key performance indicators, financial performance and projections, and competitive landscape. | |
| Heads of Corporate Functions | Introductions with leadership team members, covering an overview of their business area(s), subject matter expertise, organisational structure, company culture and values. | |
| Company Secretary; legal advisers | Induction planning, governance framework, Board and Committee matters, duties and responsibilities of a company director, the company’s policies and procedures, and other legal and regulatory considerations. | |
Directors’ training
All Directors receive training on topics of importance for the company. Following takeover approaches to the company from Apollo Global Management, the Directors received additional training on the application of The City Code on Takeovers and Mergers as well as their responsibilities under the Market Abuse Regulation.
70 Pearson plc |
Board evaluation
The Board operates a three-yearly evaluation cycle which employs a variety of methodologies to ensure the most effective results. |
Following an externally led review in 2020 and an internally facilitated review in 2021, led by the Senior Independent Director, the 2022 evaluation would normally have been questionnaire-based. However, given the recent appointment of Omid Kordestani as Chair in April 2022, it was felt that it would be beneficial for a further internally facilitated evaluation to be conducted during 2022, which Mr Kordestani agreed to lead.
Typical three-yearly evaluation cycle
| Year | Methodology | Last undertaken | ||
 | Questionnaire, tailored to specific needs of the business | 2018 | ||
 | Internally facilitated interviews, to be led by the Chair, Senior Independent Director and/or Company Secretary as appropriate | 2019, 2021, 2022 | ||
 | In-depth evaluation, externally facilitated | 2020 | ||
Approach and methodology
The 2022 evaluation was carried out by Omid Kordestani, Chair, through a series ofconversations with each Director and anchored in a set of questions shared with Directors in advance. Thewere conducted in a ‘free-format’ style, to allow organic discussions and to provide ample opportunity for Directors to raise matters of importance.
one-to-one
one-to-ones
Discussion areas included matters that are relevant to Pearson in particular, as well as those items laid down in the Code and associated guidance, including:
| — | the effectiveness of the organisation and dynamics of the Board, including composition, competencies, diversity, leadership, agendas, meeting cadence, quality of information provided, governance and decision-making |
| — | relationships between the Board and senior leaders, and between members of the Board itself, including the remits of and interaction among the respective Committees and with the Board |
| — | succession planning and talent pipeline for Executive Directors and other senior leaders |
| — | the company’s purpose and the Board’s monitoring of organisational culture, behaviours and employee sentiment |
| — | articulation and implementation of strategy |
| — | understanding of risks facing the company, including likelihood and mitigation |
| — | understanding of stakeholder views, products and markets |
| — | oversight of sustainability matters, including DE&I |
— concerns and areas for improvement.
The Nomination & Governance Committee reviewed the findings from the evaluation together with the full Board at its meeting in December 2022. The Committee will develop an action plan to address areas for improvement and will monitor progress during the year.
In reporting back to the Board, the Chair noted that conversations with Board members were positive, there was much consistency in the feedback provided by individual Directors, and there was unanimous agreement that the Board operates effectively.
Board evaluation process | ||||
 | The format of the review was agreed by the Chair and Deputy Chair & Senior Independent Director (including in the latter’s capacity as Chair of the Nomination & Governance Committee). | |||
| The scope of the review was finalised by the Chair with support from the Company Secretary. | |||
| The Chair interviewed each of the Directors on a confidential and unattributable basis. | |||
| The output of the evaluation was captured in a report to the Board in December 2022, with the Board then discussing the points raised by the review. | |||
| | Progress on the findings of the evaluation will be monitored by the Nomination & Governance Committee throughout 2023. | |||
Key findings included:
| — | Directors are highly motivated and there is a strong diversity of talent on the Board, with the Board as a whole considered to be knowledgeable, respectful and fully engaged. |
| — | Board members have relevant skills and experience, albeit the Board recognised the importance of paying particular attention to its composition and skill sets in light of expected departures during 2023 and 2024 as certain Directors reach the end of their tenure and as the company’s strategy continues to evolve. The Board acknowledged the strength and variety of contributions made by all, including its longest serving Directors. |
| — | Board meetings and discussions are considered to be insightful, with valuable and constructive conversations. The Board is appreciative of the continued efforts by management to deliver focused, succinct meeting papers and materials. |
| — | The Board recognised the progress that had been made on strategy, led by the Chief Executive and the refreshed executive team, including the new Chief Strategy Officer. The Board is appreciative of the in-depth conversations that have taken place on Pearson’s strategy and vision, with the important next step being to focus on execution. |
| — | The Board appreciates both the openness and transparency of the Chief Executive and the access to, and engagement with, the executive management team. |
| — | The Board is supportive of the evolution of the company towards a more performance-oriented culture and looks forward to updates from the Chief Human Resources Officer in this regard. |
| — | The Board recognised the work led by the Chief Legal Officer and her team in respect of Pearson’s sustainability strategies, with guidance and oversight from the Reputation & Responsibility Committee. |
There was unanimous agreement that the Chair leads the Board in an effective manner, fulfilling Principle F of the Code. The Directors agreed that he demonstrates objective judgement, promotes a culture of openness and debate, and facilitates constructive Board relations and the effective contribution of all
Non-Executive
Directors. This, in turn, supportsNon-Executive
Directors in fulfilling the requirements of Principle H of the Code in providing constructive challenge and strategic guidance, offering specialist advice and holding management to account.| Annual report and accounts 2022 Pearson plc 71 |
Board evaluation
continued
The main areas identified by the Board for particular focus during 2023 were:
| — | Continued focus on execution of strategy, including clarity on how the Board can best monitor and measure the execution plan while maintaining its distance from operational matters. In particular, the Board identified the importance of ensuring accountability for execution in the next phase of the company’s transformation. |
| — | Continued sharing of customer and marketplace insights with the Board, which is seen as particularly important at this time as Pearson evolves on multiple fronts. |
| — | Ongoing focus on succession planning and talent review, both at Board and executive level as well as more broadly, to ensure Pearson has both the right skill set to deliver on its strategic vision and a strong pipeline of talent to allow continued execution in the future. |
| — | A desire to identify and focus on the elements of sustainability that are particularly relevant and critical for Pearson’s success. |
| — | As Pearson continues to grow in the direct to consumer space, an ongoing focus on the importance of the risks inherent in the technology, cyber and online spaces, including information security, safeguarding and reputation. |
| — | Following a period of significant acquisition activity, a desire for the Board to focus on post-acquisition integration and evaluation of the performance of acquired businesses. |
| — | Ongoing development of the Board’s roadmap for market visits and deep dives to ensure this is aligned with Pearson’s aspirations and international footprint. |
In addition to the annual evaluation exercise, the Chair meets regularly with the
Non-Executive
Directors and these sessions include reciprocal feedback on the functioning of the Board.Individual evaluation
In addition to the evaluation of the Board as a whole, Executive Directors are evaluated each year on their overall performance against goals agreed by the Board, and in respect of strategic measures under the company’s annual incentive plan. These goals are linked to the key financial and strategic objectives of the company. Progress against each of these metrics is reviewed by the Board on a regular basis, as part of a dashboard of KPIs.
Following his appointment as Chair, Mr Kordestani intends to lead a formal individual evaluation of each
Non-Executive
Director every other year, similar to the practice adopted by the previous Chair, Sidney Taurel, and he encourages open channels of communication with Directors on an ongoing basis. In the Board’s opinion, these ongoing lines of communication, combined with a Group-wide culture which allows and encourages feedback at any time, provide the most effective means for evaluation. In assessing the contribution of eachNon-Executive
Director, the Chair, with the support of the Nomination & Governance Committee, has confirmed that each continues to make a significant contribution to the business and deliberations of the Board. TheNon-Executive
Directors, led by the Deputy Chair & Senior Independent Director, Tim Score, also conduct an annual review of the Chair’s performance, with Mr Score providing feedback from this review to the Chair.Committee evaluation
All Committees undertake an annual evaluation process to review their performance and effectiveness. For 2022, the Committee evaluation process was facilitated internally by the Secretary of each Committee through use of a tailored questionnaire, except for the Nomination & Governance Committee, the evaluation of which formed part of the broader Board evaluation process. The findings from the Committee evaluation process were considered at the next applicable meeting. Read more in the Committee reports on the pages that follow.
Progress on findings of previous evaluation
A number of actions were taken during the year in response to findings from the 2021 Board evaluation process, as set out below. The Board has confirmed that these items were addressed to its satisfaction, with recommendations having been put into practice or a clear action plan identified for each to be taken forward in 2023.
Finding or focus area | Response or action taken | |
| Continued focus on execution of strategy in each of Pearson’s five divisions, including clarity on how the divisions work together and continued optimisation of the more established businesses. | The Board has considered divisional execution plans as part of its strategy discussions throughout the past year. Inter-divisional synergies also continued to be assessed and discussed, including as part of considering acquisition opportunities. Optimisation of established businesses was also a consideration in the Board’s strategic execution discussions: e.g. the agreement to acquire PDRI, announced in December 2022 and subject to completion in 2023, which augments Pearson’s offering to enterprises and US federal job seekers. | |
| Additionally, the Audit Committee has discussed key strategic risks with the Presidents of each of Pearson’s five divisions over the past year as part of a suite of strategic risk deep dives. Read more about the work of the Audit Committee on page 80. | ||
| Continued discussions on portfolio, investment prioritisation, capital allocation and other corporate finance matters, in support of delivery of the strategy. | The Board discussed these topics on a regular basis, with input from divisional leadership and Pearson’s strategy and corporate development teams, resulting in a number of changes to the portfolio as described elsewhere in this report, including Pearson’s acquisition of Mondly (read more about this acquisition on page 69). The Board also determined to undertake a £350m share buyback programme to return capital to shareholders, which was completed in December 2022 (see page 120). | |
| Involvement in the selection of KPIs, with the Board having visibility of supporting data to allow evaluation of relevant metrics. | Strategic KPIs were agreed by the Board in early 2022 and incorporated into the Board’s regular milestone and dashboard report to allow ongoing oversight and evaluation. The Board has subsequently discussed with management the metrics and definitions underpinning certain KPIs and the ways in which these are communicated to stakeholders. | |
| Continued sharing of customer insights with the Board to aid understanding of the quality of product, content and services. | Customer feedback was shared with the Board as part of briefing sessions on developments to the Pearson+ offering. Customer and competitor insights remain an area of particular interest for the Board in 2023. The Reputation & Responsibility Committee also considered the sentiment of different consumer audiences towards the Pearson brand. | |
72 Pearson plc |
Finding or focus area | Response or action taken | |
| Ongoing focus on succession planning and talent management, at both senior levels and more broadly, to ensure Pearson has the right skill set to execute its strategy. | Ali Bebo was appointed as Chief Human Resources Officer in late 2021 and worked with management throughout 2022 in relation to the organisational design, particularly at senior levels, and talent management. This was discussed in detail by the Board at its meeting in December 2022. | |
| New appointments at both Board and Executive level in 2022, as described elsewhere in this report, have brought valuable additional skills and experience to the company’s leadership team. Read more about the Executive Management team on page 60. | ||
| Refinement of long-range planning in light of the new strategy and business structure. | Following the appointment of new Chief Strategy Officer, Sulaekha (Sue) Kolloru Barger, in May 2022, the Board has continued its oversight of substantial strategic planning and initiatives. In particular, work has been undertaken to refine Pearson’s strategic planning cadence in alignment with the annual budget cycle. | |
| Ensure work to refresh the risk management framework continues, particularly given the increasing importance of information security, data management and privacy, and cyber risks. | Divisional strategic risk deep dives at the Audit Committee have been well received by Directors and are proving beneficial for management in developing new ways of thinking about risk. Cyber and data-related risks continue to be key topics arising across the work of the Audit Committee, and the addition of the Chief Information Officer as a regular Audit Committee meeting attendee will enhance oversight and monitoring of these areas. Read more about our approach to risk on page 43 and the work of the Audit Committee on page 80. | |
| Continue to evolve ways of monitoring the culture and behaviours throughout the organisation, as well as overseeing the implementation of Pearson’s new purpose, mission, vision and values. | The Board recognises the progress made by the Chief Human Resources Officer in helping to drive a company-wide focus on engagement and development of a performance culture. This has included a new approach to measuring employee engagement, relaunch of a Learning at Work programme, and the successful roll-out of Pearson’s new purpose, mission, vision and values. The Reputation & Responsibility Committee will lead oversight of culture and employee engagement following revisions to its terms of reference in late 2022, further aiding the Board’s oversight of these matters.The Board is mindful that it is particularly important to pay close attention to culture and engagement throughout the year, particularly following a period of strategic and operational transformation. It will, therefore, be attentive to these matters in 2023. Read more about culture and employee engagement on pages 65-68. | |

Nomination & Governance Committee report

Principal Committee responsibilities Appointments Identifying and nominating candidates for Board vacancies. Balance Ensuring that the Board and its Committees have the appropriate balance of skills, experience, independence, diversity and knowledge to operate effectively. Succession Reviewing the company’s leadership needs with a view to ensuring the continued ability of the organisation to compete in the marketplace. Governance Reviewing and overseeing Pearson’s corporate governance framework, Board evaluation and training plans, and the Board Diversity Policy. |
Terms of reference
The Committee has written terms of reference which clearly set out its authority and duties. These are reviewed annually and can be found in the Governance section of our website (www.pearsonplc.com).
Committee members and attendance
Attendance by Directors at scheduled Nomination & Governance Committee meetings throughout 2022:
Committee members | Meetings attended | |||
| Sherry Coutu | 3/3 | |||
Omid Kordestani 1 | 2/2 | |||
Esther Lee 2 | 2/2 | |||
| Tim Score | 3/3 | |||
Sidney Taurel 3 | 1/1 | |||
| Annette Thomas | 3/3 | |||
| 1. | Mr Kordestani was appointed to the Committee on 1 April 2022. |
| 2. | Ms Lee was appointed to the Committee on 1 April 2022. |
| 3. | Mr Taurel resigned from the Board and the Committee on 29 April 2022. |
Role and composition of the Committee
I am pleased to present my first report as Chair of the Nomination & Governance Committee, having been appointed to the position in April 2022 following the retirement of Sidney Taurel, Board Chair. I offer my thanks to Sidney for his substantial contributions to the Committee’s work, most particularly in ensuring we have a strong and diverse Board in place to lead our company.
The Committee monitors the composition and balance of the Board and of its Committees, identifying and recommending to the Board the appointment of new Directors and/or Committee members. The Committee has oversight of the company’s compliance with, and approach to, all applicable regulation and guidance related to corporate governance matters. The Committee is also available to support the Board as needed in relation to talent and succession plans for senior roles.
The Committee currently has five members including me as Chair, with Omid Kordestani and Esther Lee having joined the Committee following their appointments to the Board in early 2022. The Chief Executive and other senior management, including the Chief Human Resources Officer, attend Committee meetings by invitation.
As Committee Chair, I am available to engage with any shareholders who would like to discuss the work of the Committee and look forward to taking any shareholder questions at our forthcoming AGM in April 2023.
Board succession planning, skills and expertise
A key element of the Committee’s remit is to lead the process for Board appointments in line with appropriate succession plans. The company has contingency plans in place for the temporary absence of the Chief Executive for health or other reasons. The matter of Chief Executive succession is a regular item for discussion and review by the Board on an annual basis. Succession planning for the Board as a whole is considered at least annually by the full Board, and on an ongoing basis by the Committee.
The Committee has defined a set of specific criteria for potential new
Non-Executive
Directors, in particular giving consideration to the skills, experience and knowledge required in any candidates. Pearson expects allNon-Executive
Directors to demonstrate the highest level of integrity and credibility, independence of judgement, maturity, collegiality and also a commitment to devote the necessary time to the company’s business.As part of the Committee’s regular succession planning activity, all Board members are asked periodically to complete a self-assessment of the skills and experience which they believe they each bring to the Board. The assessment focuses on those categories of skills and experience which are relevant to Pearson’s strategy, business model and particular organisational characteristics. When mapped against expected retirement dates, the assessment helps the Committee to identify the areas where it may need to focus any future search activity. The results of the most recent assessment (shown opposite) demonstrate that Pearson currently has a strong spread of skills across all areas identified as being of particular importance.
Having regard to the upcoming retirement of Ms Lorimer from the Board at the 2023 AGM, as well as looking further ahead to anticipated Board retirements over the next two to three years, the Committee agreed to commence a
Non-Executive
Director search process in the latter part of 2022. In preparing for this search, the Committee agreed that it was particularly interested to identify candidates who would collectively bring a combination of skills and expertise in the following areas:| — | operating experience with subscription and/or enterprise SaaS business models, at a scale and complexity commensurate to Pearson |
| — | experience developing innovative digital products and/or driving digital business transformation |
| — | an active senior finance leader, with a deep understanding of public company governance standards, ideally from a UK listed or global business |
| — | capacity to serve on the Audit Committee. |
74 Pearson plc |
Skills matrix
This matrix represents the number of Directors with core or supplemental capability in areas that are relevant to Pearson’s strategy, business model and organisational characteristics. A core capability is one of the strongest areas of a Director’s skill and expertise, where they bring considerable value to Board discussions. A supplemental capability is an area where the Director is competent or has experience, but is not one of the primary skills or attributes that they bring to the Pearson Board.
Category 1. Accounting and finance 2. Data and cyber security governance 3. Digital and technology 4. Disruption management, including: Talent leadership through change, Marketing and data insights, New business models and innovation 5. Direct to consumer business models (including consumer brand and marketing) | 6. Education and public sector 7. Global markets 8. People/general talent focus, including workforce learning 9. Policy and government relations 10. Prior CEO experience, particularly of multinational businesses 11. Remuneration 12. Scale and complexity 13. Sustainability 14. UK plc governance |
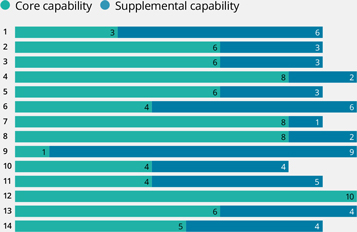
Taking into account the agreed person specification, the Committee has engaged Spencer Stuart to undertake a search process for new
Non-Executive
Directors. In line with the objectives of the Board’s Diversity Policy, the Committee has asked Spencer Stuart to ensure that the list of candidates reflects diversity of gender, ethnicity, geography and age as well as diversity in its broadest sense. You can read more about the Board Diversity Policy and diversity across Pearson on page 76. In addition to theNon-Executive
Director search process, Spencer Stuart also undertakes broader executive search activity for the Group and is a signatory to the Voluntary Code of Conduct for Executive Search Firms. Spencer Stuart has no connection with Pearson or members of the Board beyond its expertise in board and executive search.Executive succession planning
Succession planning for key positions at executive management level is primarily overseen by the full Board, with support provided by the Committee in respect of particular initiatives. The executive team has a key role to play in our strategic planning process, in the ongoing development of our talent pipeline and in fostering the culture and values required to continue to deliver on our strategy. In December 2022, the Board held a discussion on talent, including a succession planning session focused on the executive pipeline from which the future leaders of Pearson were likely to emerge, both at Pearson Executive Management level and for other key roles. A diverse pipeline of ‘ready now’ and ‘ready later’ emerging talent has been identified, and plans are in place to accelerate these individuals’ development and path to succession where possible. These measures include inviting individuals to participate in Board and Committee meetings, mentoring by
Non-Executive
Directors, and encouraging and enabling individuals to take on externalnon-executive
roles in order to increase their exposure to new areas of business. The company also has targeted development programmes for high-potential talent and mentorship programmes for diverse leaders, as well as development programmes for junior and middle management.Other areas of focus during 2022
The Committee oversees the company’s compliance with the UK Corporate Governance Code and reviews a status tracker to enable it to consider the appropriateness and maturity of various elements of our governance framework and to monitor any areas of qualified or
non-compliance.
Learn more about Pearson’s compliance with the Code on page 55.Other areas of focus for the Committee during the year included: oversight of composition of the Board’s Committees, assessment of the independence of Linda Lorimer prior to making a recommendation for her
re-election
at the 2022 AGM (recognising her length of service on the Board), and the annual review of the contribution of each Director to the Board. As Committee Chair and Deputy Chair of the Board, I also paid particular attention to the onboarding and induction of Omid Kordestani as the new Board Chair. You can read more about the induction process for both Omid Kordestani and the recently appointedNon-Executive
Director Esther Lee on page 70.Committee evaluation
The Committee undertakes an annual evaluation process to review its performance and effectiveness. For 2022, feedback relating to the Committee was sought from Directors as part of the wider Board evaluation led by the Board Chair. Topics covered included the effectiveness and dynamics of the Committee, oversight of key areas within the Committee’s remit, the quality of papers and meeting discussions, and the relationships between the Committee and management.
The findings of the effectiveness review process for 2022 indicated that the Committee is considered to be working well with appropriate agendas, papers produced to a good standard and high-quality discussions.
Committee aims for 2023
The Committee’s priorities for the coming year will be to lead and conclude the current
Non-Executive
Director search process, and to oversee the planned externally-facilitated Board evaluation process. Additionally, together with our colleagues on the Audit Committee, we will monitor any proposals by the regulator to revise the UK Corporate Governance Code in light of the UK Government’s response to the consultation on Restoring Trust in Audit and Corporate Governance, and will oversee management’s response to this.Tim Score
Chair of Nomination & Governance Committee
| Annual report and accounts 2022 Pearson plc 75 |
Nomination & Governance Committee report
continued
| Diversity across Pearson |
We have been on an intentional journey to redefine what diversity, equity, and inclusion (DE&I) mean at Pearson and to take action. We have reshaped our policies, practices, and principles around DE&I and created a long-term strategy focusing on recruitment and promotion, retention, inclusive culture, and social impact.
Our ambition is to be an inclusive and high performing place to work where everyone can leverage their unique strengths. That’s why our updated people strategy has DE&I as one of our three pillars with the aim of creating a culture of belonging and increasing diverse representation throughout the company. As part of our new Pearson engagement survey, we have a culture of inclusion index to benchmark and measure against three principles: employees are treated with respect, managers value employees for their strengths, and our leaders do what is right.
In addition, Pearson’s Code of Conduct in relation to ethical practices takes account of gender, age, race, ethnicity, disability, and sexual orientation, and applies to all employee levels, including the executive management team. It is underpinned by a global statement on DE&I, along with country and business-specific policies. Standards are set consistently worldwide – both internally and externally – as part of our efforts to make Pearson a great place to work.
Together, our goal is to drive the transformation of learning, making it more diverse, equitable, and inclusive. It is a continuous combination of intentional
bottom-up
andtop-down
leadership across all levels of the company to foster a culture where everyone feels a sense of belonging.Board diversity
We believe that Board diversity makes us a better and more sustainable business, contributing to high performance, enhanced commercial results, and an inclusive leadership culture. Research indicates that high-performing boards provide an increased competitive advantage and wider perspectives, while the needs for greater inclusion and diversity continue to influence global trends.
We are determined that, as a Board, we must be representative of our employee base and wider society, including the countries in which we operate. The Board embraces the Code’s underlying principles with regard to Board balance and diversity, including in respect of ethnicity, gender and age. The objectives set out in the Board’s Diversity Policy and our progress towards these are shown in the table on page 77.
The Nomination & Governance Committee ensures that the Directors of Pearson demonstrate a broad balance of skills, background and experience, to support our strategic development and reflect the global nature of our business. It requires appointments to be made on merit and relevant experience, while taking into account the broadest definition of diversity. In any
Non-Executive
Director search processes, the Nomination & Governance Committee encourages the retained search firms to place an emphasis on putting forward candidates who would enhance the overall diversity of the Board.In light of the changes put forward by the Financial Conduct Authority (FCA), the Nomination & Governance Committee has updated the objectives that support the Board Diversity and Inclusion Policy, and which underpin Pearson’s commitment to creating a more equitable and inclusive company. The current objectives are set out below:
| — | at least 40% female directors |
| — | at least two directors from an ethnic minority background |
| — | at least one of the Chair, Chief Executive, Deputy Chair and Senior Independent Director or CFO is a woman |
We have also expanded our objectives to confirm that the Board will consider its own diversity, and that of its Committees, as part of the annual effectiveness review processes. Further, the Board will explore expanding its diversity considerations to include characteristics such as sexual orientation, disability and socio-economic background.
The Nomination & Governance Committee has confirmed that it will adopt a principles-based approach to diversity on the Board’s Committees. It is recognised that it is not necessarily practical to set meaningful metrics or targets for diverse membership of Committees due to the notably smaller membership of each of the Committees compared to the size of the Board. Accordingly, our principles-based approach endorses the importance of bringing diverse perspectives to all areas of Board and Committees’ work. As an example of this principles-based approach in practice, as part of its regular Committee succession planning activity, the Nomination & Governance Committee considers the gender and ethnic balance on each Committee when assessing its composition and future needs.
As at 31 December 2022, 50% of Directors were women (2021: 50%), exceeding the target of 40% women’s representation by the end of 2025, as recommended by the FTSE Women Leaders Review. We are also satisfied that, ahead of the target implementation date, we are compliant with the new FCA requirements stating that boards should have at least one woman in the Chair, Chief Executive, Senior Independent Director or Chief Financial Officer role, and that at least one member of the Board should be from an ethnic minority background, among other targets. The FCA requirements are applicable to Pearson with effect from the financial year which began on 1 January 2023.
One of the topics the Board considered during its evaluation process conducted in 2022, was the effectiveness of the organisation and dynamics of the Board, including in respect of diversity. The results and feedback provided by the evaluation indicated that the Directors believe the Board’s diversity is strong. The Board recognised the increasing importance of DE&I and acknowledged the progress being made. It noted that wider forms of diversity, such as sexual orientation, disability, age, and socio-economic background, would be considered when making new appointment decisions.
Diversity and talent at executive level
Five members of our executive team of 10, excluding the Chief Executive and Chief Financial Officer who are counted in the Board’s metric, are women (50% as opposed to 37.5% in 2021). Including the Chief Executive and Chief Financial Officer, this ratio stays at 50% (six women out of 12 members) (2021: 40%). As of 31 December 2022, the senior management team (as specified by the UK Corporate Governance Code), i.e. the executive management team and their direct reports, including the Company Secretary, contained 53 women, representing 50% of that group (2021: 49%). For diversity data in the format prescribed by LR 9.8.6R(10), please see page 225.
All leadership and mentoring programmes aim to have 50% of their candidates from diverse backgrounds. The Nomination & Governance Committee received updates on two internal mentoring schemes that it supports. The first scheme pairs a high-potential leader (typically at Senior Vice President level) with a
Non-Executive
Director. The second scheme involves members of the executive management team sponsoring a small group of individuals at management level, identified through our talent review process as potential successors of senior management.In 2022, we revised our approach to strengthen mentoring schemes by focusing on the creation of mentoring partnerships based on skill development needs. We are currently gathering feedback on the outcomes of Board sponsorship and mentoring schemes in 2022 and are in the process of identifying candidates for opportunities in 2023.
76 Pearson plc |
Board diversity objectives
The Nomination & Governance Committee monitors the progress on the company’s DE&I framework, governance and measurement models, and priority areas. As part of this, the Nomination & Governance Committee reviewed and updated the objectives which underpin the Board Diversity Policy. The objectives in place during 2022 and Pearson’s performance against them are set out below, together with an indication of the amendments (highlighted) to the objectives that have been approved in response to the FCA requirements:
Objectives | Progress | |||
| We will strive to achieve and maintain a Board composition of: | As at 31 December 2022: | |||
— at least 40% Directors are women — at least two Directors from an ethnic minority background — at least one of the Chair, Chief Executive, Deputy Chair and Senior Independent Director or CFO is a woman |  | 50% Directors were women | ||
| The Board included three Directors from an ethnic minority background | |||
| One of the Chair, Chief Executive, Deputy Chair and Senior Independent Director or CFO is a woman | |||
| All Board appointments will be made on merit, in the context of the skills and relevant experience that are needed for the Board to oversee Pearson’s strategic development and that reflect the global nature of our business. | | Our Non-Executive Director search process considers a wide range of candidates, including from diverse backgrounds, all of whom were evaluated on the basis of merit. Our most recent search processes resulted in the appointment of Esther Lee and Omid Kordestani, whom the Board believe possess the requisite skills and experience for their roles. | ||
| The Board will continue to incorporate a focus on a diverse pipeline in its succession and appointment planning, including to prioritise the use of search firms which adhere to the Voluntary Code of Conduct for Executive Search Firms (the Voluntary Code) when seeking to make Board-level appointments. | | The Committee actively includes diversity in its search criteria for Board appointments, and proactively encourages engaged search firms to include candidates from a range of diverse backgrounds in its candidate lists. Spencer Stuart assist Pearson with search activities, including for the external element of the Non-Executive Director search processes. Spencer Stuart is a signatory to the Voluntary Code. | ||
| The Board will continue to adopt best practice, as appropriate, in response to the Parker Review, FTSE Women Leaders Review, FRC Board Director Effectiveness Review, and Financial Conduct Authority requirements. | | The Board is cognisant of the recommendations of the FTSE Women Leaders Review, which has succeeded the Hampton-Alexander Review, and the findings of the FRC Board Diversity and Effectiveness report. The Committee also reflected the new FCA requirements in respect of gender and ethnic diversity in its review of the Board Diversity Policy. | ||
The Board will consider its composition and diversity, and that of its Committees , as part of its consideration of effectiveness in the Board evaluation review process. The Board will also explore expansion of these considerations to cover ethnicity, sexual orientation, disability and socio-economic background characteristics . | | These matters were considered in the 2022 evaluation process. Read more on page 71. | ||
| Where appropriate, we will assist with the development and support of initiatives that promote all forms of DE&I in the Board, Pearson Executive Management team and other senior management. | | Six mentees at the Senior Vice President (SVP) level were mentored by six Non-Executive Directors in 2022. 67% of SVP participants were female and/or persons of colour (target at 50%). | ||
| We will review and report on our progress in line with the policy and our objectives in the annual report, including providing details of initiatives to promote DE&I in the Board, Pearson Executive Management team and other senior management. | | Objectives that accompany the Board’s Diversity Policy have been updated. The Committee continues to monitor developments on DE&I in the external landscape. | ||
| We will continue to make key DE&I information about the Board, senior management and our wider employee population available in the annual report, and aim for ongoing transparency in this area in line with best practice. | | This information is included in the annual report. Read more about DE&I matters in the wider employee population on page 34. | ||
Key
| Target achieved | |
 | Target not met |
New objective for 2023
Annual report and accounts 2022 Pearson plc 77 |
Reputation & Responsibility Committee report
 Principal Committee responsibilities Stakeholders: Sustainability and non-financial KPIs:non-financial KPIs linked to the three pillars of the ESG Framework.Culture and employee engagement: Communications and regulatory matters: Branding: Risk: |
Terms of reference
The Committee has written terms of reference that clearly set out its authority and duties. These are reviewed annually and can be found in the Governance section of our website (www.pearsonplc.com).
Committee members and attendance
Attendance by Directors at scheduled Reputation & Responsibility Committee meetings throughout 2022:
Committee members | Meetings attended | |||||
| Andy Bird | 3/3 | |||||
| Linda Lorimer | 3/3 | |||||
| Graeme Pitkethly | 3/3 | |||||
| Annette Thomas | 3/3 | |||||
| Lincoln Wallen | 3/3 | |||||
Reputation & Responsibility Committee role
The Committee works to assess and advance Pearson’s reputation across the range of its stakeholders and to maximise the company’s positive impact on society and the communities in which we work and serve.
We are the main governance body for sustainability at Pearson, providing important oversight of our environmental, social and governance (ESG) framework; this includes climate change considerations. As part of this role, we promote and oversee Pearson’s sustainable business strategy and assess progress against its commitments. We also monitor branding, culture and values, and provide ongoing oversight and scrutiny across all reputational matters.
The full Board is kept abreast of the Committee’s work through reports I make following each of our sessions. These reports include highlighting any areas of concern and offering specific recommendations for the Board’s action.
In 2022, we led a comprehensive review of the Board’s governance framework for ESG matters, and made the following recommendations for enhancing the Directors’ collective oversight of ESG matters, all of which were approved by the Board:
| — | the Audit Committee will assume responsibility for assurance and integrity of ESG data and metrics |
| — | the Remuneration Committee will formally incorporate ESG considerations in remuneration frameworks and decisions |
| — | employee engagement will be formally added to this Committee’s remit, alongside culture. We have invited the Chief Human Resources Officer to be a regular attendee at our meetings as a resource on the important topics of employee engagement and culture. |
We also conducted a thorough review of our own terms of reference. The Committee’s principal responsibilities, as revised, are summarised to the left of this page and you can read more about our overall Board framework for ESG governance on page 66.
As Committee Chair, I am available at any time to engage with any shareholders who would like to discuss the work of the Committee, and particularly look forward to taking any shareholder questions at our forthcoming AGM in April 2023.
It has been my privilege to serve as Chair of the Committee since 2016, most notably to have had the opportunity to contribute to Pearson’s sustainable business strategy as it has matured and to the development of our ESG framework. I am delighted that the Board has chosen Annette Thomas to be my successor as Chair; Annette has shown a real passion for the work of our Committee and has both experience and expertise in the remit of the Committee.
Committee composition and attendees
The Committee currently has five members, including me as Chair. The members bring a range of expertise across the key areas of the Committee’s remit, including sustainability, stakeholder management, people and talent, and policy and government relations.
In addition, we benefit from the regular attendance of senior executives whose work is central to the remit of the Committee. These include the Chief Legal Officer, who is the executive leader responsible for the development, monitoring and execution of Pearson’s sustainability strategy; the Chief Marketing Officer and
Co-President
of Direct to Consumer; the Chief Human Resources Officer; SVP – Investor Relations; and SVP – Corporate Communications.Sustainability activities in 2022
Throughout the year, the Committee paid particular attention to the continued evolution of our sustainability strategy, including how it aligns to our greatest areas of opportunity and challenge as a business, and how to communicate its tenets to all our stakeholders in a clear and impactful way.
78 Pearson plc |
As described in greater detail in our Sustainability report starting on page 30, our ESG framework comprises three pillars that align with the interests of stakeholders, and where we can make the biggest positive impact:
| — | Driving learning for everyone with our products |
| — | Empowering our people to make a difference |
| — | Leading responsibly for a better planet |
These areas are also materially influential in helping Pearson succeed as a business. The pillars have a clear, natural fit to our
non-financial
KPIs, reflecting the common goal of alignment between our corporate and sustainability strategy. The sustainability strategy is supported by Pearson’s robust corporate governance, strong corporate culture and a range of effective policies to ensure we achieve our ambitions.The Committee receives regular updates from management on progress against specific elements of the sustainability strategy. Over the past year, key activities of the Committee in relation to our three sustainable business pillars included the following:
Driving learning for everyone with our product
In the course of the year, we had reviews of product efficacy and learning design; we undertook our annual safeguarding review, which included our growing attention to digital products and services; and we assessed the company’s consumer brand equity study.
At each meeting, the Committee receives a report on recent incidents and issues that could have an impact on the company’s reputation, including those relating to our products. We consider Pearson’s responses to coverage on social media and in traditional media, including paying particular attention to our protocols for responding to questions about our content, the integrity with which we handle such situations, and any lessons learned. In response to these reports, the Committee provided input about addressing the specific incidents at hand, and made recommendations about how the company can be responding to the general issues raised.
Empowering our people to make a difference
In the course of the year, the Committee asked the Chief Human Resources Officer to lead a session devoted to talent, performance and engagement. We also reviewed new plans for the evolution of our overall approach to employee engagement and continued our practice of an annual review of health and safety across the company.
Leading responsibly for a better planet
In the past year, the Committee monitored progress in respect of climate transition plans, including receiving an update on Pearson’s decarbonisation journey. As part of this, we provided recommendations to management on how to approach reduction in Pearson’s scope 1, 2 and 3 emissions, with reference to the maturity of climate performance in our supply chain
Given world events, the Committee received an update on the status of Pearson’s business operations in Ukraine, Russia and Belarus.
ESG governance and policies
Our three sustainable business pillars are underpinned by robust governance, a strong culture and effective policies. In this regard, during the year:
| — | we reviewed an ESG materiality assessment which confirmed that the views of our external stakeholders align well with our internal ambitions. With input from management and external advisers, we noted improvement opportunities for our core business areas to enhance their impact on Pearson’s sustainability ambitions |
| — | we revised the Board’s ESG governance framework, as noted on page 66 |
| — | we received an update about how the company will be reporting its ESG progress to external regulatory bodies, including the approach for our narrative, non-financial KPI reporting and external data verification, where we work closely with our colleagues on the Audit Committee. We also noted how management plans to evolve our reporting in line with regulatory changes |
| — | we reviewed the annual Modern Slavery Statement with management prior to recommending that the Board approve the statement for publication. |
Other areas of focus during 2022
In addition to the work relating to the three sustainable business pillars, we spent time considering a broader range of matters relating to Pearson’s reputation and key stakeholders, including the following:
| — | with the help of colleagues and external advisers, the Committee conducted a horizon scanning exercise to identify key reputational risks and trends facing Pearson such as critical race theory, social issues and increased scrutiny of branded content platforms. This exercise, which we intend to conduct periodically, helps to ensure that the Committee and our Board is alert to external factors that may impact our business |
| — | we reviewed a new framework to guide the company about when it will ordinarily make public statements concerning societal events. Factors that are part of this decision framework include whether the event could have a material impact directly on our business or people and whether the issue is aligned or misaligned with Pearson’s purpose and values |
| — | after the US midterm elections and the change in the leadership in the UK, we received a government relations update, which is a periodic topic for the Committee’s agenda. |
Committee evaluation
The Committee undertakes an annual evaluation to review its performance and effectiveness. For our evaluation in 2022, Committee members and other key contributors to the Committee were invited to provide their views by way of a tailored questionnaire.
Topics covered included the effectiveness and dynamics of the Committee, oversight of key areas within the Committee’s remit, the quality of papers and meeting discussions, and the relationships between the Committee and management.
The Committee considered the findings from this process at its November 2022 meeting and concluded that:
| — | the Committee is working well with appropriate agendas, papers produced to a good standard, and high-quality discussions |
| — | some refreshing of the Committee’s remit was warranted to specify explicitly that employee engagement and the company’s culture are part of the Committee’s remit as well as expanded responsibility for ESG and sustainability. This feedback guided the revisions to the terms of reference review undertaken towards the end of the year |
| — | it may be beneficial to provide greater exposure for the Committee to a range of external viewpoints and advice. In direct response to this suggestion, the Committee welcomed external advisers to its ESG deep dive session, where external perspectives were provided on Pearson’s ESG materiality assessment and ambitions. |
The matters identified during the previous year’s evaluation process have been addressed to the Committee’s satisfaction during the year, as described elsewhere in this report.
Committee aims for 2023
Our priorities for the coming year include the publication of Pearson’s climate transition plan and the launch of various activities to empower our people to make a difference through learning opportunities and skill-based volunteering. We will continue to oversee Pearson’s ESG framework including progress under each of our three sustainable business pillars, as well as overseeing the newly refreshed approach to employee engagement and culture.
Linda Lorimer
Chair of Reputation & Responsibility Committee
| Annual report and accounts 2022 Pearson plc 79 |
Audit Committee report
 Principal Committee responsibilities Financial reporting The quality and integrity of Pearson’s financial reporting and statements and related disclosures, including significant reporting judgements. Policy Group financial policies, including accounting policies and practices. External audit External audit, including the appointment, qualification, independence and effectiveness of the external auditor. Internal audit, risk and internal control Risk management systems and the internal control environment, including oversight of the work and effectiveness of the internal audit function. Compliance and governance Legal and regulatory requirements in relation to financial reporting and accounting matters, and oversight of compliance programmes and investigations. |
Terms of reference
The Committee has written terms of reference which clearly set out its authority and duties. These are reviewed annually and can be found in the Governance section of our website (www.pearsonplc.com).
Committee members and attendance
Attendance by Directors at scheduled Audit Committee meetings throughout 2022:
Committee members | Meetings attended | |||||
| Linda Lorimer | 4/4 | |||||
Graeme Pitkethly 1 | 3/4 | |||||
| Tim Score | 4/4 | |||||
| Lincoln Wallen | 4/4 | |||||
| 1. | Mr Pitkethly was unable to attend one meeting prior to becoming Committee Chair due to a pre-existing commitment. He reviewed the papers and provided his perspectives to the Committee Chair outside the meeting. |
Audit Committee role and composition
I am pleased to present my first report as Chair of the Audit Committee following my appointment to the role on 1 August 2022.
My predecessor in the role, Tim Score, remains a valued member of the Committee and I offer my thanks to Tim for his considerable contributions as Committee Chair.
The Committee has been established by the Board primarily for the purpose of overseeing the accounting, financial reporting, internal control and risk management processes of the company and the external audit of the financial statements of the company. As a Committee, we are responsible for assisting the Board’s oversight of the quality and integrity of the company’s external financial reporting and statements, and the company’s accounting policies and practices.
Pearson’s Vice President – Internal Audit has a dual reporting line to the Chief Financial Officer and to me, and both she and the external auditors have direct access to the Committee to raise any matters of concern and to report on the results of work directed by the Committee. As Audit Committee Chair, I ensure that the full Board is kept abreast of the business of the Committee in a timely manner, including highlighting any areas of concern or specific recommendations. I also work closely with the CFO and senior financial, risk, legal and internal audit personnel outside the formal meeting schedule to ensure robust oversight and challenge in relation to financial control, compliance, investigations and risk management.
As Committee Chair, I am available to engage with any shareholders who would like to discuss the work of the Committee, and look forward to taking any shareholder questions at our forthcoming AGM in April 2023.
Audit Committee meetings and activities
An important area of focus for the Committee throughout 2022 was the transition of Pearson’s external audit from PricewaterhouseCoopers LLP (PwC) to Ernst & Young LLP (EY), who were selected following a competitive tender process in 2021. The transition process and first audit by EY have necessitated considerable efforts by all involved, and I would like to acknowledge the commitment demonstrated by all Pearson colleagues throughout the financial year who have supported the audit process. You can read more about how the Committee has monitored the transition to EY on page 84.
Other prominent themes in the Committee’s work throughout 2022 included:
| — | important areas such as data privacy, cyber security and business and technology resilience. In addition to continuing to increase in importance at a macro level, these are key factors in the success of Pearson’s digital and consumer-focused strategy |
| — | a strong focus on risk, supported by a new programme of business-focused deep dives led by the Divisional Presidents |
| — | oversight of accounting treatment relating to portfolio changes, including the strategic review of Pearson’s international courseware local publishing businesses |
| — | continued oversight of Pearson’s key judgements and key areas of estimation as described in the financial statements. |
At every meeting, the Committee also considered reports on the activities of the internal audit and compliance functions, including the results of internal audits, project assurance reviews and fraud and whistleblowing reports. The Committee also monitored the company’s financial reporting procedures, discussed the finance and IT controls environment, reviewed the services provided by the external auditors and considered any significant legal claims and regulatory issues in the context of their impact on financial reporting, each on a regular basis. You can view the key activities of the Committee and read more about our work in these areas on the pages that follow.
Additional meeting attendees
The Chief Financial Officer, Deputy Chief Financial Officer, Chief Legal Officer, Chief Information Officer, other executives and senior managers from across the business also attended meetings during the year, either as regular invitees of the Committee or to discuss particular items of business.
80 Pearson plc |
This direct contact with key leadership augments the Committee’s understanding of the issues facing the business as well as helping to develop Pearson’s talent pipeline through facilitation of Board-level engagement opportunities for those leaders and managers. The Committee also meets regularly in private with the external auditors and with the Vice President – Internal Audit.
In addition to the Committee’s formal meeting schedule, I meet as needed with the external auditors, Chief Financial Officer, Deputy Chief Financial Officer, Chief Legal Officer, Chief Compliance Officer and Senior Vice President – Treasury, Risk and Insurance in order to keep abreast of all relevant matters within the Committee’s remit.
Audit Committee training and knowledge sharing
The Committee receives technical updates at each meeting, including on matters such as accounting standards and the audit and governance landscape, and members are able to request specific or personal training as appropriate. In particular, we remain attentive to developments at a legislative and regulatory level, including the proposals announced in May 2022 by the UK Government’s Department for Business, Energy and Industrial Strategy (BEIS) in response to the consultation on ‘Restoring trust in audit and corporate governance’.
The Committee’s focus areas for 2023 will include:
| — | Following up on continuing improvements in the external audit process, as discussed further on page 84. |
| — | Monitoring progress of the UK Government’s proposals on audit and corporate governance reform, any impacts on the company’s processes and practices, and consideration of management’s response. |
| — | Monitoring emerging developments in non-financial reporting, including proposals from the ISSB, EU and SEC. |
| — | Continuing our attention to technology and cyber risk, through an increased frequency of cyber security deep dives and the addition of the Chief Information Officer as a standing attendee at all Committee meetings. |
Committee evaluation
The Committee undertakes an annual evaluation process to review its performance and effectiveness. For 2022, the Committee evaluation process was conducted by way of a tailored questionnaire. The process sought views on an anonymous basis from Committee members and other key contributors to the Committee, including the lead external audit partner, the Chief Financial Officer, Deputy Chief Financial Officer, the Chief Legal Officer, the Vice President – Internal Audit, and senior financial, risk and compliance management.
Topics covered in the evaluation included the effectiveness and dynamics of the Committee, the Committee’s oversight of key areas within its remit, the quality of papers and meeting discussions, and the relationships between the Committee and management.The Committee considered the findings from the evaluation at its November 2022 meeting, including the following key points:
| — | The Committee is considered by Directors and other contributors to be working well with appropriate agendas, papers produced to a good standard and high-quality discussions. |
| — | Respondents welcomed the addition of divisional risk deep dives to the Committee’s work plan and noted the importance of dedicating sufficient time to the overview of risk and associated remediation actions. |
| — | Respondents recognised that it is important for all parts of the Group’s assurance framework to remain attuned to the changing risk profile of the company, including data and cyber risk. It remains important for the Committee to ensure that it continues to have appropriate levels of support and expertise to assess and manage these areas. |
| — | Given the quantum of Pearson’s business in the US, there was a suggestion that at least one meeting per cycle be US-based to allow the Committeein-person access to US management and other stakeholders. We expect to be able to reintroduce this |
element to the Committee’s annual schedule following the relaxation of COVID-19 related travel restrictions. |
| — | Responses highlighted the Committee’s role in encouraging collaboration and alignment between the central corporate risk assessment and compliance functions and the work of internal audit. |
Actions taken following the previous year’s evaluation
Based on the recommendations from the previous year’s evaluation, the Committee took the following actions in 2022:
| — | We assumed responsibility in our terms of reference for matters relating to assurance of ESG metrics. During the year, the Committee considered and approved Pearson’s policy on greenhouse gas emissions re-baselining and restatement. This policy has established guidelines for the recalculation of the base year, as well as restatements, for scope 1, 2 and 3 emissions in the event of significant changes to Pearson’s portfolio. |
| — | Recognising the importance of technology and cyber-related matters to Pearson’s business and strategy, we invited the Chief Information Officer to become a standing attendee at the Committee’s meetings. Previously, the Chief Information Officer was invited to attend for specific agenda items. This strengthens the oversight that the Committee has of technology matters and enables timely engagement with the responsible executive whenever technology-related topics arise in our discussions. |
Fair, balanced and understandable reporting
We are mindful of the Code’s Principle N relating to fair, balanced and understandable reporting, and we build sufficient time into our annual report timetable to ensure that the full Board receives sufficient opportunity to review, consider and comment on the report as it progresses. Learn more about fair, balanced and understandable reporting on page 123.
Financial reporting and policies
In February 2023, the Committee considered the 2022 preliminary results announcement and annual report and accounts, including the financial statements, strategic report and Directors’ report. The significant issues considered by the Committee relating to the 2022 financial statements are set out on pages
86-87.
Correspondence with Financial Reporting Council
In October 2022, Pearson received a letter from the Financial Reporting Council (FRC) confirming that it had completed a limited scope review of the company’s 2021 annual report in connection with their thematic review of deferred tax asset disclosures. There were no questions or queries to which the FRC required a formal written response. Two matters were raised regarding possible improvements to our existing disclosures. These have been addressed in the 2022 annual report where material and relevant.
The FRC’s role is to consider compliance with reporting standards and is not to verify the information provided. Therefore, given the scope and inherent limitations of their review, which does not benefit from any detailed knowledge of the Group, it would not be appropriate to infer any assurance from their review that our 2021 Annual Report and Accounts are correct in all material respects.
Risk assessment, assurance and integrity
A key role of the Committee is to provide oversight and assurance to the Board with regard to the integrity of the company’s procedures for the identification, assessment, management and reporting of risk. In fulfilling its remit, the Committee remains mindful that effective risk management is essential to executing Pearson’s strategy, achieving sustainable shareholder value, protecting the brand and ensuring good governance.
In 2022, the Committee had oversight of management’s refreshed approach towards risk identification and monitoring. Pearson’s risk management programme has evolved in line with the structure of the business, which is managed through five global operating divisions supported by enterprise-wide corporate functions.
| Annual report and accounts 2022 Pearson plc 81 |
Audit Committee report
continued
Through a series of business-focused risk deep dives, the President of each operating division provides an overview of its risk register to the Committee at least annually and leads a session on the key risks facing their particular division. The process is supported by central risk team experts as required, providing the Committee with a clear and consistent framework within which to evaluate the strategic and business risks to the company, based upon the principal, emerging and significant near-term risk categories described on pages
45-51.
The Committee uses these deep dive sessions to understand the rigour of management’s risk scanning and to challenge judgements being made in response to risks. The Committee has reviewed the refreshed risk management approach to ensure it is robust and proportionate, and continues to facilitate a culture of accountability and ownership among business leaders. The introduction of divisional risk deep dives has provided a valuable strategic lens to the risk management process that has been welcomed by the Committee and management alike.
During the year, the Committee also conducted a number of deep dives with selected enterprise-wide functions including data privacy, cyber security, tax, anti-bribery and corruption, and business resilience.
Data privacy, cyber security and technology resilience
Prudent management of data privacy, cyber security and Pearson’s technology estate are fundamental to the company’s success and to building and maintaining trust with our customers. The Committee oversees these matters on behalf of the Board from a risk and assurance perspective and monitors the maturity of Pearson’s associated governance frameworks. It does this through annual deep dives, as well as through oversight of the risk-based internal audit programme, in which these topics are key areas of focus.
As part of the data privacy deep dive led by the Chief Privacy Officer, the Committee considered developments in the global regulatory landscape and trends in enforcement actions, focusing on the importance of transparency and controls around the use of personal information. These regulatory trends, combined with Pearson’s direct to consumer strategy, mean that a compelling user experience is imperative. Accordingly, the Committee discussed the progress that had been made through the launch of a new public-facing privacy centre, which provides an effective and customer friendly approach to explaining how Pearson uses personal information. The Committee also considered the ongoing enhancements to Pearson’s data privacy governance structure, including a newly implemented network of designated privacy owners, strengthening of the internal incident management framework, and continued focus on data retention programmes with a particular focus on customer products, platforms and services.
The Committee also considered the status of Pearson’s cyber security programme, through a deep dive led by the Chief Information Officer and Chief Information Security Officer. This deep dive was set in the context of the challenges and threats prevalent in the dynamic global security landscape. As part of this, the Committee received a report on:
| — | Pearson’s cyber risk profile, including the status and trend of top threats and response to these threats, with a particular focus on strategic products |
| — | Management’s key achievements and focus areas in 2022, which included: simplifying and updating information security policies to support Pearson’s digital strategy; enhancement of identity management capabilities; development of role specific security training; implementation of supplier security risk management; and continued attention to best practices for cloud security |
| — | Objectives for the continued enhancement of Pearson’s cyber security infrastructure and governance frameworks, including the key achievements in 2022 and aims for the coming year |
| — | Findings of the annual third party assessment of Pearson’s cyber capability maturity, which continues to demonstrate year-on-year |
Audit Committee meeting focus during 2022 | ||||||||
Financial reporting | Policy | External audit | Internal audit, risk and internal control | Compliance and governance | ||||
— Accounting and technical updates — Impact of legal claims and regulatory issues on financial reporting — Fair, balanced and understandable reporting, going concern and viability statements including supporting analysis — 2021 annual report and accounts: preliminary announcement, financial statements and income statement — Review of interim results and trading updates — Form 20-F and related disclosures, including annual Sarbanes-Oxley Act Section 404 attestation of financial reporting internal controls— Significant issues reporting | — Accounting matters and Group accounting policies — Treasury Policy and reporting — Tax update — Greenhouse gas emissions - policy for re-baselining and restatement | — Oversight of external auditor transition and first-year audit by new auditor — Provision of non-audit services by external auditor - policy and regular reporting— Appointment of external auditors — Report on half-year procedures — Confirmation of auditor independence — 2022 external audit plan — Remuneration and engagement letter of external auditors — Review opinion on interim results — Review of the effectiveness of external auditors — EY feedback on internal controls over financial reporting — Receipt of external auditors’ report on annual report, Form 20-F andyear-end audit— EY feedback on internal controls over financial reporting | — Internal audit activity reports and review of key findings — 2022 internal audit plan including resourcing — Assessment of the effectiveness of internal audit function, internal control environment and risk management systems — Risk management including Group’s principal and emerging risks — Strategic risk reviews led by Divisional Presidents — Group-wide risk deep dives on cyber security; data privacy; treasury and insurance; anti-bribery and corruption; and business resilience and crisis management — Controls Centre of Excellence updates, including 2022 work plan | — Fraud, whistleblowing reports and compliance investigations — Compliance with accounting and audit-related aspects of the UK Corporate Governance Code — Audit Committee and internal audit function terms of reference — Oversight of Group’s schedule of delegated financial authority — Regulatory briefings, including proposals resulting from BEIS consultation on audit and corporate governance reform — Review of minutes of the Verification Committee’s meetings | ||||
82 Pearson plc
The Committee has a strong focus on Pearson’s cyber security maturity and will increase its scrutiny of this topic by conducting two deep dives each year from 2023. As mentioned elsewhere in this report, the Chief Information Officer now attends every Committee meeting, to ensure ongoing focus on matters of both cyber security and technology resilience, among others.
As indicated in last year’s annual report, the Committee also continued to monitor management’s implementation of the Board’s agreed action plan following a 2018 security incident affecting AIMSweb 1.0. The Committee has concluded that the key workstreams have been successfully delivered, with the agreed improvements now having been incorporated into standard company practices.
The Committee also holds a separate annual deep dive, led by the Chief Information Officer, focusing on Pearson’s technology resilience capabilities. In 2022, this session included updates on infrastructure enhancements, management of thetechnology estate, product availability and incidents, and technology-specific talent risk.
end-of-life
Members
As at the date of this report, the Committee comprises four independent
Non-Executive
Directors, all of whom have financial and/or related business experience due to the senior positions they hold or have held in other listed or publicly traded companies and/or large organisations. The Committee possesses a good balance of skills and knowledge with competence and experience covering all aspects of the sectors in which Pearson operates and the company’s key markets. Each member is “financially literate” for the purposes of the NYSE listing standards.Graeme Pitkethly, Chair of the Committee since August 2022, is the Committee’s designated financial expert within the meaning of the applicable rules and regulations of the SEC, having recent and relevant financial experience, and is a Chartered Accountant. Graeme is Chief Financial Officer for Unilever plc and serves as Vice-Chair of the Financial Stability Board’s Task Force on Climate-related Financial Disclosures (TCFD). Graeme’s full biography is shown on page 57.
The qualifications and relevant experience of the other Committee members are detailed on pages 56 to 58. You can read more on page 59 about the process through which the Board assesses the independence of
Non-Executive
Directors.Compliance, fraud and whistleblowing
The Chief Compliance Officer oversees compliance with our Code of Conduct and works with senior legal, HR and other relevant personnel to investigate any reported incidents, including ethical, corruption and fraud allegations. The Committee receives an update at each meeting on all significant investigations as well as reviewing data regarding matters raised through our whistleblowing reporting system. If applicable, any findings of the external auditors with respect to a particular matter are also considered as part of these discussions. The Committee may also meet in private if required with the Chief Compliance Officer. On behalf of the Board, the Committee considers an annual review of the effectiveness of the whistleblowing system including through benchmarking against peers and by monitoring progress against previous years’ findings. The Committee Chair’s regular reports to the Board include a review of investigations or whistleblowing matters of note.
The Pearson anti-bribery and corruption (ABC) and sanctions compliance programmes provide the framework to support our compliance with various regulations such as the UK Bribery Act 2010 and the US Foreign Corrupt Practices Act. The Committee uses this framework to conduct a deep dive into the ABC and sanctions compliance programmes on an annual basis. In 2022, in addition to its regular review of investigations, the Committee noted the continued enhancements made to the overall compliance programme, including ongoing training for staff, development of a set of FAQs for employees to provide insight into the investigations process, and enhancements to the ways in which Pearson monitors third parties with which it does business.
The Committee also paid particular attention to the work of the sanctions team and wider business in response to the war in Ukraine.
Internal audit
The internal audit function is responsible for providing independent assurance to management and the Committee on the design and effectiveness of internal controls to mitigate strategic, financial, operational and compliance risks. The Vice President – Internal Audit reports jointly to the Chair of the Committee and the Chief Financial Officer and is responsible for theoperations of internal audit and execution of the annual audit plan.
day-to-day
The internal audit mandate is approved annually by the Committee. The audit plan and any changes thereto are also reviewed and approved by the Committee throughout the year, and the Committee is attentive to the resourcing of the internal audit function. The internal audit plan is aligned to Pearson’s greatest areas of risk, as identified by the organisational risk management process, and the Committee considers issues and risks arising from internal audits. Management action plans to improve internal controls and to mitigate risks are agreed with the business area after each audit. Internal audit has a robust process in place for the implementation of audit actions, which also includes review and testing of evidence to corroborate action implementation. Progress of management action plans is reported to the Committee at each meeting. Internal audit has a formal collaboration process in place with the external auditors to ensure efficient sharing of insights and outcomes. Opportunities for reliance by the external auditor on internal audit outcomes are limited due to strict rules set by the external regulator. Regular reports on the findings and emerging themes identified through internal audits are provided to executive management and, via the Committee, to the Board.
In 2022, internal audit carried out engagements across Pearson’s business units and corporate functions covering most of the principal risks. The audit plan changes throughout the year based on changes in Pearson’s risk profile. Key themes in 2022 related to information security and data privacy, cyber security, data architecture and usage, digital safeguarding and business resilience, as well as financial controls in international businesses.
Internal audit evaluation
At its November 2022 meeting, the Committee considered the findings of the review of the performance and effectiveness of Pearson’s internal audit function, a process which is undertaken annually. The 2022 review was conducted by distributing a questionnaire to the key stakeholders of the internal audit function – including Committee members, the lead external audit partner, members of the executive management team, and senior financial, legal and operational management.
The evaluation process sought views on an anonymised basis on the internal audit function’s work programme, resource levels, skills and expertise, and ways of working. Based on the findings of the 2022 review, the Committee is of the opinion that the quality, experience and expertise of the internal audit function is appropriate for the business. The Committee recognised the findings of the review which noted that the internal audit function continues to improve collaboration with other teams, including the corporate risk and compliance teams, and is supportive of the desire to bring a greater level of data-based insight to add context to the findings of internal audit’s work. The Committee will remain attentive to the use of
co-sourcing
arrangements to supplement the internal audit function’s resource, particularly to ensure appropriate coverage of specialist areas.The Committee will ensure that an independent third-party assessment of the effectiveness and processes of the internal audit function is conducted at least once every five years, in line with the requirements of the Institute of Internal Auditors’ International Standards for the Professional Practice of Internal Auditing. The most recent such assessment was undertaken in 2019.
| Annual report and accounts 2022 Pearson plc 83 |
Audit Committee report
continued
Internal control and risk management
The Board has overall responsibility for Pearson’s systems of internal control and risk management, which are designed to manage, and where possible mitigate, the risks facing Pearson, as well as to safeguard assets and provide reasonable, but not absolute, assurance against material financial misstatement or loss. The Board agrees risk management requirements and, in assessing the effectiveness of the risk management effort, reviews a range of inputs as described elsewhere in this report. The Board can and does challenge the reporting it receives and will request further information as needed to make its assessment.
The Committee monitors the effectiveness of the company’s risk management and internal control systems on behalf of the Board. The Committee oversees a risk-based internal audit programme, including periodic audits of the risk processes across the organisation. It provides assurance on the management of risk (including via risk deep dives, as described on page 81), and receives reports on the efficiency and effectiveness of internal controls with input from the Deputy Chief Financial Officer and external auditor. Each business area maintains internal controls and procedures appropriate to its structure, business environment and risk assessment, while complying with company-wide policies, standards and guidelines. These controls and procedures are monitored and certified through the Group-wide Controls Centre of Excellence and are subject to testing as part of both the internal and external audit processes.
The Committee, acting on behalf of the Board, confirms that it has conducted and continues throughout the year to review the effectiveness of Pearson’s systems of risk management and internal control in accordance with Provision 29 of the Code and the FRC Guidance on Risk Management, Internal Control and Related Financial and Business Reporting (‘FRC Guidance’). In making its assessment as to the effectiveness of these systems for 2022, the Committee had regard to an assurance opinion from the internal audit function. Factors considered in this process included:
| — | the outcomes of internal audits completed during the year |
| — | significant changes in Pearson’s strategy, processes and systems |
| — | the wider Pearson risk management and assurance framework which includes other assurance activities by first and second line of defence teams, including enterprise risk management, the Controls Centre of Excellence, divisional and technology assurance teams |
| — | work conducted by the external auditor |
| — | the organisation’s response to internal audit actions |
| — | whether any fundamental or significant actions have not been accepted by management and the consequent risk |
| — | whether any limitations have been placed or the scope of internal audit. |
The Committee reviewed the detail underpinning these factors as part of the 2022
year-end
process. The Committee reviewed all internal control deficiencies identified during the year and noted that the majority have been remediated during 2022. In particular, the Committee reviewed the control implications of the issue related to investments in unlisted securities (see page 87) and were satisfied that the control deficiency has been remediated. They also considered feedback on information provided by the entity (IPE) that underpins control operation. Following this review, the Committee confirms that Pearson’s systems of risk management and internal control operated satisfactorily throughout the year.The Board is ultimately accountable for effective risk management in Pearson and determines our strategic approach to risk. It confirms our enterprise risk management framework as well as our risk appetite targets. The involvement of the Board and Committee in the design, implementation, identification, monitoring and review of risks (including setting risk appetite and reviewing how risk is being embedded in our culture) is outlined in more detail in the Risk management section on page 43.
External audit
In June 2021, the company announced the Board’s intention to propose to shareholders that EY be appointed as the company’s statutory auditor for the financial year ending 31 December 2022. The audit tender process was described in detail in the 2021 annual report and EY’s appointment was approved by shareholders at the 2022 AGM. Following the tender process in 2021, Pearson will put the external audit contract out to tender at least every ten years and will seek the rotation of the audit partner in line with regulation and professional and ethical guidance. The external auditors are required to rotate the audit partner responsible for the Pearson audit every five years. The 2022 audit was the first year for the EY lead audit partner, Ben Marles.
A detailed audit plan was received from EY at the beginning of the audit cycle for the 2022 financial year, which gave an overview of its approach to the audit, outlining the significant risk areas and in particular the approach to materiality and scoping of the audit. The Committee regularly reviewed the significant audit risks and assessed the progress of the audit throughout the year. The Committee also received updates throughout the year from both management and EY on the progress of the first-year audit to allow the Committee to assess the effectiveness of the transition process and to monitor the status of specific areas such as EY’s review of internal controls and their assessment of accounting judgements.
The Committee reviews and makes recommendations to the Board in respect of the appointment and compensation of the external auditors. These recommendations are typically made by the Committee after considering the external auditors’ performance during the year, reviewing external auditor fees, conducting an effectiveness review, considering the annual report on audit quality of the intended external audit firm and confirming the independence, objectivity, qualifications and experience of the external auditors.
External audit effectiveness review
In conducting its review of the effectiveness of EY, Pearson’s external auditors for 2022, the Committee had regard to certain factors set out in the FRC’s guidelines titled ‘Audit Quality Practice Aid for Audit Committees’ as well as the key areas of importance from a strategic, operational, reporting and regulatory perspective. In particular, the Committee considered its own observations and interactions with the external auditors, the quality of the audit, the auditors’ independence, the programme of work conducted by the auditors and their reports on that work.
The review was conducted by distributing a questionnaire to key audit stakeholders, including members of the Committee and key management who interact with the external auditors on a regular basis, including the Chief Financial Officer, Deputy Chief Financial Officer, Senior Vice President – Treasury, Risk and Insurance, Vice President – Internal Audit, Senior Vice President – Finance for each business division, and other heads of corporate functions. The process sought views on an anonymised basis on many aspects of EY’s work and interactions with the company, as well as their mindset, skills and knowledge. In the first year of EY’s tenure as Pearson’s external auditor, there was a particular focus on the transition process, EY’s review of the control environment, ways of working between the Pearson and EY teams, and the observations that EY had made on Pearson’s business, processes, controls and systems.
In considering the independence of the external auditor, the Committee has regard to, among other things, EY’s challenge to management, the degree to which they demonstrate professional scepticism, integrity and judgement in their work, the amount of time passed since a rotation of audit partner and the level of
non-audit
work that the external auditor undertakes (details of which can be found on page 85).The responses to the evaluation indicated that the external audit partners and staff exhibit professional scepticism in their work and are robust in dealing with issues identified during the audit. In particular, respondents remarked upon the scrutiny demonstrated by EY in testing the system of internal controls and the Committee noted the challenge presented to management by the auditors in respect of accounting judgements from prior years. Overall, having reviewed the effectiveness and independence of the external auditors during 2022, the Committee concluded that the auditors provide effective independent challenge to management.
84 Pearson plc |
In early 2022, the Committee asked the outgoing auditor, PwC, to share its perspectives on outputs from the previous year’s evaluation process. The purpose of this was to support a smooth transition by enabling the Committee and EY to take forward the opportunities for improvement identified in the 2021 review.
The Committee will continue to review the performance of the external auditors on an annual basis and will consider their independence and objectivity and the quality of the external audit, taking account of all appropriate guidelines.
Naturally, given this was a year of transition, a number of opportunities for further improvement were identified through the effectiveness review. These primarily related to ways of working between the Pearson and EY teams. Following the conclusion of the 2022 audit, Pearson and EY, led by the Deputy Chief Financial Officer and lead audit partner respectively, will work together to develop an action plan in response to the recommendations. The Committee will oversee implementation of this plan throughout the coming year.
Compliance with the CMA Order
Pearson confirms that it was in compliance with the provisions of The Statutory Audit Services for Large Companies Market Investigation (Mandatory Use of Competitive Tender Processes and Audit Committee Responsibilities) Order 2014 during the financial year ended 31 December 2022.
Review of the external audit
During the year, the Committee discussed the planning, conduct and conclusions of the external audit as it proceeded.
At its April and July 2022 meetings, the Committee discussed and approved the external audit plan and reviewed the key risks of misstatement of Pearson’s financial statements. The external auditors provided an update to the risk assessment at the November 2022 Committee meeting, following the acquisition and disposal transactions in the second half of the year. These risks were then confirmed as final at the conclusion of their audit of the financial statements in February 2023.
The table on pages
86-87
sets out the significant issues considered by the Committee together with details of how these items have been addressed. The Committee discussed these issues with the auditors throughout the audit year.In November 2022, the Committee discussed with the auditors the status of their work, focusing in particular on internal controls and Sarbanes-Oxley testing.
As the auditors concluded their audit, they explained to the Committee:
| — | the work they had conducted over revenue, including over contracts in certain of the Group’s businesses in the US and UK that span the year end, where revenue is recognised using an estimated percentage of completion based on costs and judgements in relation to provisions for returns |
| — | their work in evaluating management’s goodwill impairment exercise, on a value-in-use |
| — | their work in assessing management’s judgements and assumptions regarding the impairment of its right-of-use |
| — | their work conducted over the accounting treatment of certain unlisted securities and their procedures performed over the restatement of prior year comparative numbers and the associated control implications in relation to this matter |
| — | their procedures performed to audit the material acquisitions and disposals completed in the year in addition to evaluating management’s judgement that the businesses under strategic review do not meet the IFRS 5 criteria to be held for sale at 31 December 2022 |
| — | the work performed over the nature and presentation of adjusting items, focusing on subjective judgements and the transparency with which related adjusted measures are presented, and in particular the exclusion of costs related to major restructuring programmes |
| — | their work in assessing management’s judgements and assumptions regarding provisions for uncertain tax positions, in particular the provision made in relation to the EU state aid tax matter |
| — | the results of their controls testing for Sarbanes-Oxley Act Section 404 reporting purposes and in support of their financial statements audit |
| — | the results of their work over the company’s going concern and viability statement reports |
| — | their work in relation to information provided by the entity (IPE) disclosures and other material internal control over financial reporting (ICFR) matters |
| — | their work in relation to other matters which are not classified as key audit matters, but may give rise to additional disclosure requirements, such as pensions, restructuring and asset capitalisation |
| — | the work performed over the carrying value of investments in subsidiaries for the Pearson plc parent company. |
The auditors also reported to the Committee the unadjusted misstatements that they had found in the course of their work, which were immaterial, and the Committee confirmed that there were no material items remaining unadjusted in these financial statements.
Auditors’ independence
In line with best practice, our relationship with EY is governed by our policy on external auditors, which is typically reviewed and approved annually by the Committee. The policy establishes procedures to ensure that the auditors’ independence is not compromised, as well as defining those
non-audit
services that EY may or may not provide to Pearson. Any allowable services are in accordance with relevant UK and US legislation and auditor standards. The policy takes into account certain voluntary commitments by EY regarding independence and applies to all Pearson businesses globally, including associate companies.The Committee approves all audit andbasis, including reviewing the ongoing effectiveness and appropriateness of our policy.
non-audit
services provided by EY. Our policy on the use of the external auditors fornon-audit
services complies with the FRC’s Revised Ethical Standard published in December 2019. The standard applies restrictions on certainnon-audit
services and applies a cap on the level of permittednon-audit
services fees which can be billed in any year. The policy also reflects the restriction on the use ofpre-approval
in the 2016 FRC Guidance on Audit Committees and, accordingly, allnon-audit
services, irrespective of value, are required to be approved by the Committee. In particular, we expressly prohibit the provision of certain tax, HR and other services by the external auditor. We reviewnon-audit
services on acase-by-case
The Committee receives regular reports summarising the amount of fees paid to the auditors. During 2022, Pearson spent a similar amount on
non-audit
fees when compared with 2021. For 2022,non-audit
fees represented 1% of external audit fees (2% in 2021).For all
non-audit
work in 2022, EY was selected only after consideration that it was best able to provide the services we required at a reasonable fee and within the terms of our policy on external auditors. Where EY is selected to provide audit-related services, we take into account its existing knowledge and experience of Pearson. Where appropriate, services were tendered prior to a decision being made as to whether to award work to the auditors.Significant
non-audit
work performed by EY during 2022 included:| — | half-year review of interim financial statements |
A full statement of the fees for audit and
non-audit
services is provided in note 4 to the financial statements on page 158.Graeme Pitkethly
Chair of Audit Committee
| Annual report and accounts 2022 Pearson plc 85 |
Audit Committee report
continued
Significant issues considered by the Audit Committee
Issue | Action taken by Audit Committee | Outcome | ||
Goodwill allocation and impairment reviews | ||||
| — Pearson carries significant goodwill and other intangible asset balances. As a result of business disposals and an associated change in organisation structure there has been a change in the determination of cash generating units and goodwill has been reallocated. There are significant estimates and assumptions used in the impairment review. Pearson has made significant impairments to goodwill across a variety of its businesses in past years. | — The Committee considered the impact of acquisitions, disposals and changes in organisation design on the determination of cash generating units and in particular the level at which goodwill is monitored. The Committee reviewed the reallocation of goodwill across the cash generating units including those disposed. — The Committee monitored the Group’s plans and forecasts during the year to determine if there were impairment triggers. The Committee considered the results of the Group’s goodwill impairment reviews which were undertaken in December and refreshed post year end. Key assumptions – including cash flows derived from strategic and operating plans, long-term growth rates and the weighted average cost of capital – were reviewed and challenged. The Committee considered the sensitivities to changes in assumptions and the adequacy of disclosures required by IAS 36 ‘Impairment of Assets’ in relation to the Group’s CGUs. | — The Committee is satisfied with the determination of cash generating units and the associated goodwill reallocation. — The Committee is satisfied with the annual impairment review with confirmation of sufficient headroom in each of the cash generating units. — The Committee is satisfied with the disclosures relating to goodwill. | ||
Going concern and viability | ||||
| — The assessment of the Group’s viability and the appropriateness of the going concern assumption. | — The Committee reviewed future budgets and cash flow forecasts to understand the Group’s available liquidity and ability to continue as a going concern. The Committee reviewed and challenged the risks identified to the forecasts. The Committee reviewed the outcome of the severe but plausible scenario modelling and stress testing. | — The Committee is satisfied with the modelling process and the risks identified. In addition, the Committee is satisfied with the stress testing performed and the severe but plausible scenario modelling. The Committee noted that in all scenarios the Group had a high level of liquidity headroom and sufficient headroom against covenant requirements. — The Committee is satisfied with the assessment of the Group’s viability and is satisfied that the Group is a going concern. — The Committee is satisfied with the disclosures related to going concern and viability. | ||
Acquisitions and disposals | ||||
— Pearson disposed of its interests in its international courseware local publishing businesses, disposing of assets in French speaking Canada, Italy, Germany, South Africa and Hong Kong. In addition, Pearson announced a strategic review of its Online Program Management business. — Pearson acquired Credly Inc, increasing its ownership from 19.9% to 100%. — Pearson acquired 100% of ATI STUDIOS A.P.P.S S.R.L (Mondly). | — The Committee reviewed the accounting for the disposal of the international courseware local publishing businesses with specific focus on consideration, net assets disposed and disposal costs. The Committee also reviewed tax assumptions relating to the disposal transactions. In addition, the Committee reviewed the judgement related to whether the results and cash flows of the disposed businesses should be classified and presented as discontinued operations by reference to the criteria set out in IFRS 5. — The Committee reviewed the status of the strategic review of the Online Program Management businesses and considered this against the IFRS 5 criteria to be classified as held for sale. — The Committee reviewed the accounting for the Credly and Mondly acquisitions with specific focus on the step acquisition accounting for Credly, consideration, net assets acquired including the valuation of intangibles and the recognition of goodwill. The Committee noted the use of third party valuation experts to value the acquired intangible assets. | — The Committee determined that disposal accounting for the international courseware local publishing businesses had been appropriately recorded. The Committee is satisfied with the judgement that the results and cash flows of the disposed businesses should not be classified and presented as discontinued operations and is also satisfied with the disclosures related to this item. — The Committee also agreed that the IFRS 5 criteria to be classified as held for sale in respect of the Online Program Management businesses had not been met as at 31 December 2022. — The Committee determined that the acquisition accounting for Credly and Mondly had been undertaken appropriately but notes that it remains provisional as at 31 December 2022. | ||
86 Pearson plc |
Issue | Action taken by Audit Committee | Outcome | ||
Revenue recognition | ||||
| — Pearson has a number of revenue streams where revenue recognition is complex. For some revenue streams significant judgements and estimates are required in order to determine the amount and timing of revenue recognition. | — The Committee regularly reviews and challenges revenue recognition practices and the underlying assumptions and estimates. In addition, the Committee has visibility of internal audit findings relating to revenue recognition controls and processes and routinely monitors the views of external auditors on revenue recognition issues. | — The Committee is satisfied that revenue is being recognised appropriately. | ||
Property asset impairment reviews and classification | ||||
— Pearson holds significant right-of-use right-of-use — In light of the changes in use of Pearson’s property assets from own use to sublet, the classification of property assets has been assessed resulting in recognition of certain assets as investment property in 2022. | — The Committee monitored the Group’s property strategy during the year to determine if there were impairment triggers. The Committee considered the results of the Group’s property impairment reviews with specific focus on the 80 Strand and Hoboken properties. Key assumptions – including potential rental value, expected sublease durations and terms such as rent free periods – were reviewed and challenged. The Committee considered the adequacy of related disclosures. The Committee noted the input of third party property specialists in determining the key assumptions. — The Committee reviewed the assessment of the property assets against the criteria to be classified as investment property. | — The Committee is satisfied with the results of the property impairment reviews and the subsequent impairment charges recognised in the income statement. — The Committee is satisfied that the charges relate to a major restructuring programme and so meet the Group’s criteria to be excluded from adjusted performance measures. — The Committee is satisfied with the disclosures relating to property impairments. — The Committee is satisfied with the decision to classify certain property assets as investment property and the disclosures relating to this classification. | ||
Tax | ||||
— Pearson holds provisions in relation to uncertain tax positions. — In 2021, Pearson paid £105m (including interest) in relation to the EU state aid matter and at that time the amount was recognised as an asset as it was expected to be recovered in due course. In 2022, the EU General Court dismissed the appeal made by the UK Government in relation to this matter. As a result of the dismissal, Pearson have concluded that a provision is now required in relation to this issue. — In 2022, Pearson have released tax risk provisions totalling £72m following the expiry of the statute of limitations for certain periods in the US. — Changes to, and the application of, tax legislation continues to be a complex and judgemental area. | — The Committee considered various developments during the year, including Pearson’s ongoing response to the European Commission’s decision that the UK’s Finance Company Partial Exemption rules constituted state aid (‘EU state aid’). The Committee noted that the EU General Court dismissed the UK Government’s appeal in relation to the EU state aid matter and concur with management that a provision is now required for this item. — The Committee reviewed the release of the tax risk provisions resulting from the expiry of the statute of limitations, including the presentation of these items within adjusted and statutory earnings. | — The Committee is satisfied with Pearson’s approach to managing the impact of tax legislation changes and agreed with the views of management regarding tax provisioning levels. — The Committee is satisfied with Pearson’s approach to the EU state aid matter including the provision made in relation to amounts paid in 2021 and ongoing disclosure about this matter. — The Committee is satisfied with the release of US tax provisions and the presentation of the items within the income statement. | ||
Investments in unlisted securities | ||||
— Pearson holds investments in unlisted securities. Historically, all of these investments have been classified as fair value through other comprehensive income. On further review of limited life funds the classification for certain funds has been changed to fair value through profit and loss. — The change in classification represents an error in the prior year accounts and prior year comparative numbers have been restated. | — The Committee considered the classification of certain limited life funds held by Pearson and agreed with the reclassification. — The Committee considered the need for restatement of prior year comparative numbers considering both quantitative and qualitative factors. — The Committee reviewed the disclosures relating to the restatement. — The Committee reviewed the control implications relating to this matter. | — The Committee agreed with the reclassification of certain unlisted securities. — The Committee agreed with the requirement to restate comparative figures based on quantitative size but reviewed and agreed with management’s determination that the qualitative factors suggest this is not a material item to users of the accounts. — The Committee is satisfied with the accounting treatment in the current year and the disclosures related to the restatement of comparative figures. — The Committee were satisfied that the control deficiency has been remediated. | ||
| Annual report and accounts 2022 Pearson plc 87 |
Directors’ remuneration report

Key messages from the Remuneration Committee
| — | During the year, the Committee undertook a comprehensive review of the Directors’ remuneration policy, which is due for its triennial renewal at the 2023 AGM. Following extensive consultation with shareholders, it was determined that a conventional UK incentive structure would be retained but with modifications to quantum and enhancement of key UK governance features. |
| — | The Committee also reviewed the implementation of the Directors’ remuneration policy for 2023, in particular the performance framework, to ensure it appropriately supports delivering Pearson’s forward-looking strategy. |
| — | The Committee spent significant time during the year considering the inclusion of strategic and ESG priorities in incentives and benefited from insights provided by Annette Thomas given her key role on Pearson’s Reputation & Responsibility Committee. We will introduce a new ESG metric into the LTIP and remove digital sales from the AIP. |
| — | As Committee Chair, I engaged extensively with shareholders and their advisers throughout 2022, and all feedback received was considered by the Committee when finalising the Directors’ remuneration policy and its implementation for 2023. |
| — | The Committee considered performance outcomes for 2022. The annual incentive outcome for Executive Directors is 76% of maximum reflecting strong financial and strategic progress delivered in 2022. The long-term incentive granted in 2020 will vest at 58% of maximum considering the profitable growth and shareholder value created over the three-year performance period. |
| — | A thorough review was conducted ahead of the release of the second tranche of the co-investment award for the Chief Executive, considering performance underpins, broader company performance, and stakeholders’ experience and it was determined that this tranche should vest in full. |
| — | The Committee remains focused on ensuring remuneration policies and practice for all Pearson’s colleagues are consistent with our need to attract and retain the right talent for our digital future, and are appropriately aligned to our forward-looking strategy, our purpose, and our mission, vision, and values. |
| — | During the year, I engaged with colleagues on executive pay and wider reward matters through several channels, including the Employee Engagement Network. |
Terms of reference
The Committee’s terms of reference are in line with the 2018 UK Corporate Governance Code and are available on the Governance page of our website at pearsonplc.com (a summary of the Committee’s responsibilities is on page 111).
Board Committee attendance
There were 7 scheduled meetings of the Remuneration Committee in 2022. Attendance by Directors was as follows:
Committee members | Meetings attended | |||
| Sherry Coutu CBE | 7/7 | |||
Esther Lee 1 | 6/6 | |||
| Tim Score | 7/7 | |||
Sidney Taurel 2 | 2/2 | |||
Annette Thomas 3 | 3/3 | |||
| 1. | Esther Lee joined the Remuneration Committee on 1 April 2022. |
| 2. | Sidney Taurel stepped down from Pearson’s Board and the Remuneration Committee at the AGM on 29 April 2022. |
| 3. | Annette Thomas joined the Remuneration Committee on 1 August 2022. |
Dear Shareholder
On behalf of the Board, I am pleased to present the 2022 Directors’ remuneration report, which includes our 2023 Directors’ remuneration policy.
Pearson completed 2022 ahead of original expectations. The Group delivered a robust financial performance, with underlying sales up 5% and an underlying increase in adjusted operating profit growth of 11% as well as being
on-track
to deliver significant cost efficiencies in 2023.Pearson made strong strategic progress over the year, including reshaping the portfolio for growth, adding capabilities and increasing interconnectivity between divisions to unlock synergies and build further lifelong learning potential. The Company’s strong strategic, operational, and financial progress was reflected in the share price and value delivered to our shareholders. Pearson ended the year as one of the top performers in the FTSE 100, delivering a total shareholder return of over 50% in 2022.
The work undertaken by Andy Bird and his new executive team over the last two years has ensured robust digital foundations for the next stage of Pearson’s journey which will enable new digital products and services to be brought to market at pace. Going forward, Pearson intends to capitalise on the momentum to date and continue to accelerate the growth of the business through its connected commercial and consumer strategy.
Directors’ Remuneration Policy review
In line with the normal three-year cycle in the UK, Pearson’s Directors’ remuneration policy will be subject to shareholder vote at the 2023 AGM. In advance of this, the Committee has spent significant time rigorously reviewing the Directors’ remuneration policy and its implementation to ensure it remains fit for purpose as Pearson looks to the future. This review considered Pearson’s renewed strategy, the strong performance of the business, and the views and expectations of our shareholders, their advisers, and other stakeholders.
Andy Bird was appointed Chief Executive shortly after the approval of our existing Directors’ remuneration policy at the 2020 AGM. Under his leadership, Pearson attracted several new experienced individuals to lead the business and the whole organisation is energised and focused on executing our new strategy. Additionally, Pearson has moved from near the foot of the FTSE 100 to around 60
th
due to the significant increase in market cap during 2022.88 Pearson plc |
The continued execution of the renewed digital-first strategy, through which Pearson aims to deliver innovative digital learning products through an integrated commercial and consumer strategy, demands a highly skilled and experienced management team. Attracting and retaining the correct calibre of talent has been and will remain crucial in accelerating the growth of the Company and ensuring it is well positioned to compete globally and capture market share.
North America is a key talent and growth market for Pearson and critical to the future success of the business. Pearson needs to be able to recruit and retain talent from this market, which generates
two-thirds
of Pearson’s total revenue, to deliver on its strategy. However, remuneration practices in the US differ significantly from the UK both in terms of quantum and structure, particularly with regard to long-term equity arrangements.Highlighted by the appointment of Andy Bird, the Committee believes that the existing executive remuneration framework does not adequately act as an attraction, retention and incentivisation tool for US talent. To secure his appointment, the Committee developed a bespoke
one-off
co-investment
award. This illustrates the challenges of recruiting in the US market, and the Committee is keen to ensure that the new Directors’ remuneration policy appropriately rewards the current Executive Directors, whose skills and experience will be particularly sought after for their contribution, while also containing additional flexibility to attract future talent if required over the three-year life of the Directors’ remuneration policy.In this context, the Committee is proposing to implement a package of changes to the Directors’ remuneration policy and its implementation for 2023.
Initially, the Committee considered various alternative incentive frameworks, including a hybrid structure comprising both performance shares and restricted shares, which is very common in the US market, and operated by Pearson for senior management below Executive Director level. Feedback from some investors highlighted a continued preference for performance shares only, and so the Committee determined that a conventional UK incentive framework should be retained.
To support the attraction, retention and incentivisation of the critical executive talent needed to deliver the forward-looking strategy and ultimately the creation of long-term sustainable value for our shareholders and other stakeholders, the Committee is proposing to:
| — | adjust the percentage that pays out under the Annual Incentive Plan (AIP) and Long-Term Incentive Plan (LTIP) for threshold performance to 25% and 20% of maximum, respectively |
| — | increase the Policy maximum opportunity level under AIP from 200% to 300% of salary |
| — | increase the Policy maximum opportunity level under LTIP from 350% to 450% of salary. |
For 2023, it is proposed that the Chief Executive will participate in the AIP and LTIP with maximum opportunity levels aligned to these increased maximums. For the Chief Financial Officer, maximum opportunity levels for 2023 will be increased to 200% of salary for the AIP and 300% of salary for the LTIP (an increase from 170% and 245% of salary, respectively). See page 94 for further details on the market data considered by the Committee in assessing pay competitiveness at Pearson.
The Committee believes that retaining a UK market-aligned remuneration framework for the forward-looking Directors’ remuneration policy, but with increased opportunity levels, is the best way to continue to drive a strong pay for performance culture and respond to the needs of the global talent market for digital innovators, whilst remaining mindful of the UK governance environment and the views of our shareholders.
Performance framework
While the Directors’ remuneration policy contains sufficient flexibility to adjust performance measures on an annual basis, the Committee took the opportunity as part of the Directors’ remuneration policy review to undertake a full review of the performance framework to ensure it continues to closely align to the forward-looking strategy. Overall, the Committee considered that current performance framework principles remain appropriate, although a number of changes to how this is implemented are being proposed for 2023.
Incorporation of ESG into the incentive framework
Pearson is a purpose-driven Company – we add life to a lifetime of learning through creating vibrant and enriching learning experiences designed for real-life impact, so everyone can realise the life they imagine. We believe learning is one of the greatest forces for change in the world, and as the world’s leading learning company, we have a duty to help drive that change and deliver against our purpose. The strategy and priorities for the business are therefore anchored around this, and everyday actions and behaviours have a strong social impact.
The Committee spent a significant amount of time during the year debating the most appropriate ESG measures for inclusion in incentives. The strategic element of the AIP already includes relevant ESG priorities, and this will continue for 2023. In terms of specific ESG metrics, the AIP will include two targets for 2023 – one focused on investing in a diverse pipeline and increasing representation of employees from an ethnic minority background at management levels, and the other focused on achieving a step change towards our 2030 carbon reduction goal. Reflective of the importance of delivering against our strategic commitments, the Committee chose, for the first time in 2022, to prospectively disclose annual performance targets in respect of strategic measures. A similar approach has been taken in respect of ESG measures for 2023.
In addition to the AIP, taking on board feedback from our largest shareholders and reflecting the fact that progression of our ESG priorities is integral to long-term sustainable growth of the business, Pearson is introducing an ESG measure into the LTIP for 2023 with a weighting of 10%. For 2023, the ESG measure will centre on building an inclusive culture and increasing female representation at leadership levels.
When considering specific ESG measures for incentives, the Committee wanted to ensure strong relevance to the strategy and that measures should be quantifiable. Pearson is dedicated to creating bias-free content that reflects the diversity, depth, and breadth of all learners’ lived experiences. Within its content, Pearson acknowledges its responsibility to demonstrate inclusivity and incorporate diverse scholarship so that everyone can achieve their potential through learning. In this context, an ongoing focus on diversity, equality, and inclusion at all levels of the Company is important – embracing diversity throughout our own organisation will lead to a more diverse and representative Pearson product. The Committee therefore considers it appropriate that such metrics are included within both the AIP and LTIP. The focus of each measure does however differ – the AIP considers ethnicity across a broader management population, while the LTIP is focused on female representation in leadership roles.
Proposed changes to other measures
For the AIP, it is proposed that the operating cash flow measure, which has a weighting of 20%, is replaced with a free cash flow measure. Free cash flow is a measure preferred by some investors as it better corresponds to the cashflows available to return to them. The introduction of this measure reflects the importance of free cash flow generation to Pearson’s fundamental value, and ensures executives are incentivised to improve it.
| Annual report and accounts 2022 Pearson plc 89 |
Directors’ remuneration report
continued
The digital sales metric which formed part of the strategic AIP measures in prior years will be removed for 2023. Considering the growth in digital and digitally-enabled sales over the last five years, and that this now accounts for around three quarters of total sales, the Committee, with input from key shareholders, determined that including both a sales metric and a digital sales metric within the AIP was no longer appropriate. The strategic element of the AIP will therefore focus solely on ESG measures for 2023, at the same weighting as in 2022 (10% of the total AIP).
For 2023, in response to the removal of digital sales, the weighting of the adjusted operating profit measure will be increased to 40% to further incentivise the drive for profitable growth. The Committee did consider whether to include an additional strategic measure in place of digital sales, for example, a measure related to consumer engagement or product effectiveness. It was however determined that further work was required to ensure a sufficiently robust metric which could be linked to incentives, although the current intention of the Committee is that such a metric will be incorporated in future years.
Overall, therefore, for 2023, the AIP will be based 40% on adjusted operating profit, 30% on sales, 20% on free cash flow and 10% on strategic ESG measures. In line with normal practice, the Committee will review its approach in advance of each financial year to ensure that the balance of performance measures remains appropriate and aligned to the financial and strategic priorities of the Group.
For the LTIP
The Committee also carefully considered the peer group against which to measure relative TSR performance, reflecting on whether a bespoke peer group, international index or a sector-specific index should be used instead of or alongside the FTSE 100. Initially, it was determined that the FTSE 100 should be retained given its simplicity, the fact that Pearson is a constituent of the FTSE 100 and subject to similar market dynamics as other global
UK-listed
companies. Further, the Committee was mindful of the challenges of identifying either an appropriate bespoke peer group or a defined sector group or index which adequately reflects Pearson’s business mix andUK-listing.
However, during the shareholder consultation exercise, it became clear that shareholders held a broad range of views in relation to the most appropriate TSR comparator group for Pearson. Whilst it was generally recognised there is no “perfect” comparator group, some preferred the simplicity of the FTSE 100 whilst others thought an international or sector-specific comparator group would more closely reflect Pearson’s strategic ambition. The Committee therefore
re-visited
its initial deliberations, and to balance the various perspectives, it has ultimately been determined that a hybrid approach will be taken – 50% of the TSR element will continue to be measured relative to the FTSE 100 while the other 50% will be measured relative to the S&P 500. For both the FTSE 100 and S&P 500, certain sectors – financial services, energy, basic materials, utilities and healthcare – will be excluded as companies within these sectors are subject to very different market forces to Pearson and are therefore not considered relevant comparators.Target-setting for 2023
One of Pearson’s remuneration principles, which apply across the whole organisation, centres on pay for performance, and this is actively considered by the Committee when determining targets. For 2023, in line with usual practice, a robust target-setting process has been followed considering Pearson’s strategic plan as well as analyst consensus to reflect market expectations.
This year, the Committee also considered the increased opportunity levels under the Directors’ remuneration policy to ensure that any
pay-out
will appropriately reflect the performance delivered and ultimately value created for our shareholders. For maximumpay-out,
performance must be significantly in excess of current market guidance. Overall, the Committee believes that the 2023 LTIP targets are appropriately stretching in the context of the business and external environment and would only result in significant value delivered to management where there has been significant value created for shareholders and other stakeholders. See page 99 for full details of 2023 LTIP targets.The Committee has a strong focus on pay for performance and a robust track record of setting stretching targets, as demonstrated by the targets set in recent years and subsequent incentive outcomes. The approach taken this year is no different.
Shareholder engagement
Over the last year, as part of the Directors’ remuneration policy renewal, the Committee has engaged extensively with shareholders and shareholder representative bodies. I would personally like to take this opportunity to thank all those who took the time to engage with us and provided feedback on the executive remuneration approach at Pearson. As always, your feedback is invaluable.
Since the introduction of the
one-off
co-investment
award, which was designed to secure the appointment of Andy Bird, a significant minority of shareholders have continued to vote against Pearson’s remuneration resolutions, including the 2021 Directors’ Remuneration Report at the 2022 AGM. The Committee is naturally disappointed with this outcome, but equally is committed to ensuring Pearson has an executive remuneration framework which allows it to be competitive.When developing the new Directors’ remuneration policy, the Committee took a phased approach to shareholder engagement, initially seeking the views of our major shareholders on the direction of travel, before building out more detailed proposals. These initial conversations with shareholders in June and July 2022 resulted in the Committee deciding to retain the existing incentive framework rather than pursue an alternative.
Overall, the Committee received feedback from, or directly engaged with, approximately 55% of Pearson’s ownership as well as the key proxy advisors. We highly value the inputs and views of all shareholders and their advisors and have taken these into account when finalising our approach. It is worth highlighting, however, that throughout the engagement process we received a broad range of feedback, with the views of individual shareholders often differing, and as a result it is not necessarily always possible to meet the preferences of all shareholders.
In my conversations, there was a general understanding of the challenges faced by Pearson – the need, despite being a
UK-listed
company, to develop an executive remuneration framework which adequately acts as an attraction, retention and incentivisation tool for US talent given that North America is a key talent and growth market for Pearson, and critical to its future success. That said, the engagement exercise highlighted specific areas of concern for some shareholders, and reflective of this, the Committee has modified its proposals. This includes:| — | Introduction of annual bonus deferral. |
| — | Increase in shareholding guidelines |
90 Pearson plc |
| Chief Executive Officer and 300% of salary for the Chief Financial Officer, in line with the proposed annual LTIP award levels. |
| — | Reduction of LTIP threshold to 20% of maximum. |
| — | Re-balancing of LTIP measures. |
Shareholder feedback also informed the Committee’s decisions in relation to the TSR comparator group and Executive Director salary increases for 2023.
Pearson remains committed to a constructive and positive relationship with all its shareholders and their advisers and will continue to engage widely as appropriate going forward.
Incentive outcomes for 2022
2022 AIP and 2020 LTIP
The strong financial and strategic progress delivered in 2022 resulted in a formulaic AIP outcome for Executive Directors of 76% of maximum. Overall, the Committee was satisfied that the formulaic outcome was reflective of the performance achieved.
The LTIP granted in 2020 will vest in 2023 at 58% of maximum reflecting profitable growth and shareholder value created over the three-year performance period. Only the Chief Financial Officer participated in this award, and shares vesting will remain subject to a
two-year
holding period.As disclosed in the 2020 Directors’ Remuneration Report, mindful of the share price volatility at the time the 2020 LTIP was granted, the Committee exercised its discretion to use a
five-day
average share price to 1 March 2020 (573.72p) rather than the share price prior to the date of grant in May (459.80p). This resulted in approximately 55,000 fewer shares being granted to the Chief Financial Officer.The Committee considered that the overall vesting outcome reflected the performance of the business over the three-year period, in particular the success of the new strategy, and therefore no further discretion was applied.
Second tranche of the Chief Executive’s
co-investment award
The second tranche of the
one-off
co-investment
award granted to Andy Bird to secure his appointment vested following 31 December 2022. Vesting was subject to achievement of performance underpins linked to strategic progress and there being no significant ESG issues resulting in significant reputational damage. These underpins are intended to guard against payment for failure, ensuring the Committee can reduce vesting if in its opinion the performance of the business or the individual does not support this.The Committee undertook a rigorous assessment of the relevant performance underpins as well as a holistic review of broader Pearson performance and the experience of all stakeholders.
In its assessment, the Committee followed the framework developed and disclosed in prior years. Overall, the Committee determined that the second tranche of the award would vest in full and full disclosure of the Committee’s deliberations in this regard is on pages 103 and 104.
Shares vesting remain subject to a holding period until 31 December 2023. The final tranche of the award will vest following 31 December 2023 subject to the relevant performance underpins, which include an additional TSR underpin, and Andy Bird’s continued employment at the vesting date.
Salaries for 2023
For 2023, salary levels for Executive Directors were considered in the context of general economic and market conditions, the level of increases made across the Company as a whole, and individual performance. In addition, the Committee recognised that Andy Bird had not had an increase in his salary since his appointment in 2020 and that, from an overall package perspective, his remuneration is significantly below US levels. Mindful of this, and the exceptional performance of the Company since his appointment, the Committee felt that it would have been warranted to increase Andy Bird’s salary significantly, and consulted with shareholders on this basis.
However, cognisant of the current external environment, which over the last year has steadily become more challenging for our broader employee population who are more exposed to high levels of inflation and the associatedpressures, and shareholder feedback and guidance in this area, the Committee determined that the salary increase for Andy Bird should be 3.5%, in line with the average salary increase awarded to the US workforce and below the average rate for the UK workforce and Pearson as a whole.
cost-of-living
The salary for the Chief Financial Officer will be increased by 4% in line with the average increase for the UK workforce.
Remuneration across Pearson
Pearson’s remuneration principles are consistent across the organisation and are designed to support Pearson’s culture and to make Pearson an employer of choice and able to attract and retain talent to execute our digital-first strategy. Remuneration across the workforce is designed to reflects the role, skills and experience, and performance of any relevant individual as well as local market practice. Many of the features of our Directors’ remuneration policy apply more broadly, for example, over half of all Pearson employees (c.11,200 employees) participated in an AIP during 2022 which was funded based on similar performance measures as used for Executive Directors.
Mindful of the energy crisis which has had a disproportionate impact on Pearson’s lowest paid employees in the UK and elsewhere in Europe, Pearson made apayment equal to £1,000 or
one-off
cost-of-living
€
1,000 to these individuals at the end of 2022. As a global company, Pearson monitors the impact of external worldwide events on pay competitiveness and makes adjustment where appropriate to ensure employees are rewarded fairly for their contribution, for example, targeted pay solutions have been implemented in markets suffering from acute inflationary pressures such as Sri Lanka and Turkey.The Committee receives regular updates on talent matters and wider workforce considerations and actively considers the approach to reward throughout the organisation when determining executive remuneration. In addition, the Committee closely reviews relevant pay ratios and pay gaps and supports efforts to make progress against these metrics. Last year, to ensure a more proactive approach and enable a
two-way
conversation, the Employee Engagement Network held a discussion on reward and incentives at Pearson. The EEN met to discuss how the annual bonus plan is funded and how we seek to achieve alignment between Executive Directors and the wider workforce through the use of consistent measures.I would like to thank shareholders for their continued support at the 2023 AGM in relation to both our 2022 Directors’ remuneration report and 2023 Directors’ remuneration policy.
Sherry Coutu, CBE
Chair of Remuneration Committee
| Annual report and accounts 2022 Pearson plc 91 |
Directors’ remuneration report
continued
Pearson’s Remuneration
Framework At a Glance
Remuneration principles
Pearson’s remuneration principles govern pay for the whole organisation. We have developed remuneration arrangements for our Executive Directors with these principles in mind.
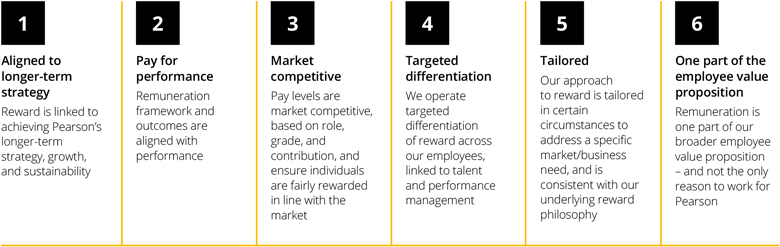
Our Directors’ remuneration policy and its implementation supports our Company purpose of adding life to a lifetime of learning, our strategy and ultimately the delivery of long-term sustainable value for all stakeholders, including our shareholders.
In developing the forward-looking Directors’ remuneration policy, the Committee had due regard to the principles outlined within the UK Corporate Governance Code.
| — | Pearson’s remuneration principles, as set out above, align with our culture |
| — | Our forward-looking executive remuneration framework is designed to be simple |
| — | Our remuneration framework and outcomes are designed to be aligned with performance |
| — | Selected performance measures for the AIP (Annual Incentive Plan) and LTIP (Long-Term Incentive Plan) are key to achieving the Group’s strategic objectives. The Committee reviews performance measures annually to ensure they incentivise appropriate management behaviours and goals |
| — | The Committee carries out a robust target-setting process each year, considering Pearson’s strategic plan, as well as analyst consensus to reflect market expectations. This results in stretching, yet achievable, AIP and LTIP targets |
| — | Maximum awards under the AIP and LTIP are capped and clearly disclosed in our Directors’ remuneration policy alongside predictions |
| — | When determining pay-outs, the Committee considers whether the outcome reflects overall company performance and the experience of stakeholders over the period, including shareholders and colleagues. If not, it has the discretion to adjust outcomes |
| — | The Committee is mindful of reputational and other risks two-year LTIP holding period, as well as robust shareholding guidelines, which extend post-employment. |
| — | Before signing off the Directors’ remuneration report, the Committee reviews drafts and inputs to clarify engaged extensively with shareholders |
92 Pearson plc |
2023 Directors’ Remuneration Policy
The 2023 Directors’ remuneration policy will be subject to shareholder approval at the AGM to be held on 28 April 2023. This section outlines key changes to the Directors’ remuneration policy following the Remuneration Committee’s extensive review over the last year. The 2023 Directors’ remuneration policy is set out in full on pages 112 to 119.
Key changes to Directors’ remuneration policy
Key features of the 2020 Directors’ remuneration policy | Outline of proposed changes for 2023 | |||
Salary | Base salaries reflect level, role, skills, experience, the competitive market and individual contribution. Base salaries are normally reviewed annually, with any increases normally in line with typical increases awarded to other Group employees. | No changes to policy | ||
Allowances and benefits | Reflects the local competitive market and may include travel-related, health-related and risk-related benefits as well as any other benefits provided to the majority of employees. The Committee may introduce other benefits if it is considered appropriate to do so. | No changes to policy | ||
Retirement benefits | Employees in the UK, including Executive Directors, are eligible to join the Money Purchase 2003 section of the Pearson Pension Plan. The Committee has discretion to put in place retirement benefit arrangements in line with local market practice. Executive Directors, who opt out of the pension, can receive a cash allowance of up to 16% of base salary, in line with the maximum company contribution as a percentage of salary that UK employees of a similar age are eligible to receive. | No changes to policy | ||
Annual incentive | Maximum opportunity of 200% of base salary. Based on the achievement of annual business goals and strategic objectives, with financial metrics accounting for at least 75% of total opportunity. Normally no payout for threshold performance, with 50% payable for on-target performance.Discretion to adjust formulaic outcome where this does not reflect underlying performance. Awards paid fully in cash. Malus and clawback provisions apply. | Increase in maximum opportunity to 300% of base salary. For 2023, maximum opportunities are: — 300% for the Chief Executive — 200% for the Chief Financial Officer Increase in payout for threshold performance to 25% of maximum. Introduction of bonus deferral where shareholding guidelines have not been met. | ||
Long-term incentive | Maximum opportunity of 350% of base salary. Based on achievement of targets for earnings per share, a return on measure and relative total shareholder return (weighted equally) over a three-year performance period. Discretion to adjust formulaic outcome where this does not reflect underlying performance. Awards are subject to a post-vesting holding period of two years. Malus and clawback provisions apply. | Increase in maximum opportunity to 450% of base salary. For 2023, maximum opportunities are: — 450% for the Chief Executive — 300% for the Chief Financial Officer Proportion of award that vests for threshold aligned at 20% across all performance measures. Introduction of ESG into the performance framework. | ||
Shareholding guidelines | Current in-employment guidelines of:— 300% for the Chief Executive — 200% for the Chief Financial Officer Post-employment shareholding guidelines apply. | Increase in in-employment guidelines in line with increase LTIP opportunity:— 450% for the Chief Executive — 300% for the Chief Financial Officer | ||
| Annual report and accounts 2022 Pearson plc 93 |
Directors’ remuneration report
continued
Consideration of market data in assessing pay competitiveness at Pearson
In determining the 2023 Directors’ remuneration policy proposals and their implementation, the Remuneration Committee considered remuneration levels at comparable companies both in the UK and US. The approach to market data was to consider multiple different reference points, including those described below, to provide a rounded view of overall positioning against the market.
The Committee has not sought to follow any specific market reference and is mindful that, whilst the primary talent market is likely to continue to be the US, Pearson is a
UK-listed
company and operates a UK market aligned remuneration framework.Market reference points
— Executive Director remuneration in UK-listed companies of a similar market capitalisation to Pearson, the FTSE 41 to 100. This comparator group recognises Pearson’s London listing, the fact that Pearson is a member of the FTSE 100, and that UK investors and proxy agencies would likely consider competitiveness of remuneration levels at Pearson in this context primarily. Pearson is currently positioned c.60th in the FTSE 100 (based on a three-month average market capitalisation). Market data for the FTSE 100 as a whole was also considered as an additional reference point given Pearson’s growth in 2022. |
— Executive Director remuneration in US-listed companies of a broadly similar financial size and in a similar sector to Pearson. This comparator group included companies in the broadcasting, interactive media and software sector with similar revenue to Pearson. It considers what Executive Directors are paid in broadly similarUS-listed companies, although it does not directly align to Pearson’s talent market. |
— Remuneration in US-listed companies more closely aligned to Pearson’s talent market and strategic ambitions. This comparator group comprised US technology, communications, and consumer discretionary companies, in particular those that are at the forefront of transformative, innovative plays within technology and digital, based on theNasdaq-100 Index. Recognising, however, that many of these companies were materially larger than Pearson in terms of financial size, rather than considering remuneration levels for the CEO role, the market data considered was for roles reporting into the CEO (primarily heads of business units or Chief Executives of subsidiary businesses) which is analogous to Andy Bird’s previous executive role. This data was only considered in respect of the CEO role at Pearson. |
The Committee is mindful of the views of many investors in relation to setting executive pay solely based on market data as well as views on using international peer groups. The Committee therefore wanted to take a balanced and thoughtful approach which incorporates the views of all key stakeholders.
94 Pearson plc |
Pay positioning
Overall, the intention of the Committee was to ensure a package for the Chief Executive which was competitive considering Pearson’s primary talent market. While it is acknowledged the proposed package for the Chief Executive is towards the top end of market practice from a UK perspective, it is within the broad range of pay received by executives below CEO level at relevant
US-listed
companies whom Pearson might look to approach for future Executive Director roles – total compensation for such roles typically ranged c.$4m to c.$11m at target. This is still well below that of CEOs at similarly sized US companies.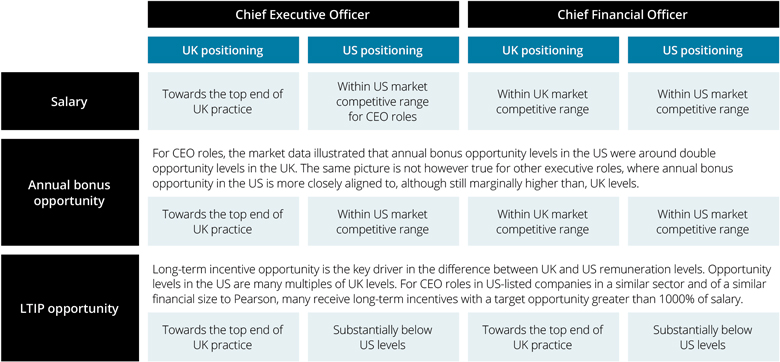
Conclusions
The market data highlighted the stark difference in pay practices between the UK and US, and the Remuneration Committee applied careful judgement when considering how remuneration at Pearson should be positioned taking into account the various reference points as well as the views of shareholders.
The Committee determined, with input from shareholders, that the incentive framework at Pearson for Executive Directors should continue to align to typical UK practice, and as such incentives remain fully performance-linked, which is not typically the case in the US market where often a significant proportion of the long-term equity award is delivered in restricted stock with no performance conditions and over shorter time horizons. In addition, annual bonus deferral and additional holding periods on LTIP awards are uncommon in the US market.
Overall, while it is acknowledged that the 2023 Directors’ remuneration policy proposals and their implementation position Pearson towards the
top-end
of the UK market, the Committee has not sought to match US quantum levels or market practice in terms of incentive design or the overall remuneration framework.Illustrations of application of the 2023 Directors’ remuneration policy in different performance scenarios
Chief Executive (Andy Bird) $000

Chief Financial Officer (Sally Johnson) £000

| Annual report and accounts 2022 Pearson plc 95 |
Directors’ remuneration report
continued
Alignment of performance framework to Pearson’s strategy
Adjusted Operating Profit (40%) | A key financial performance indicator reflecting the underlying operational performance of the Group, and measuring Pearson’s ability to reinvest. | |||||||
Increased weighting for 2023 | ||||||||
Sales (30%) | A key financial performance indicator and measure of top-line growth. | |||||||
Annual Incentive Plan | Free Cash Flow (20%) | A key financial performance indicator reflecting the importance of Free Cash Flow generation to Pearson’s fundamental value, and ensures executives are incentivised to improve cash flow. | ||||||
Replacing operating cash flow for 2023 | ||||||||
Strategic measures (10%) | Specific objectives and targets selected annually to reflect relevant strategic priorities of the Group at the time. For 2023, this strategic element will focus on Pearson’s ESG priorities, in particular increasing representation of employees from an ethnic minority background at management levels and achieving a step change towards Pearson’s 2030 carbon reduction goal. | |||||||
Reduced weighting for 2023 | ||||||||
Relative TSR (30%) | Total Shareholder Return (TSR) is a measure of value created for our shareholders. Following a review of the peer group against which TSR is assessed, a hybrid approach will now be used to better reflect Pearson’s strategic ambitions. For 2023, TSR will be measured relative to: — 50% versus FTSE 100 (excluding certain sectors) — 50% versus S&P 500 (excluding certain sectors) Companies within financial services, energy, basic materials, utilities and healthcare sectors will be excluded as these are subject to very different market forces to Pearson and therefore not considered relevant comparators. | |||||||
Changes to TSR peer group for 2023 | ||||||||
Long-term Incentive Plan | EPS (30%) | A key financial performance indicator used by management to evaluate performance and by investors to more easily, and consistently, track the underlying operational performance of the Group over time. | ||||||
Return on Capital (30%) | A key financial performance indicator measuring how efficiently Pearson generates returns from its asset base. This is considered a more appropriate and simpler measure for the business compared to net ROIC, and more consistent with the approach taken by other companies in the market. | |||||||
Replacing net ROIC for 2023 | ||||||||
ESG (10%) | Pearson is a purpose-driven Company, and everyday actions and behaviours have a strong social impact. Progression of our ESG priorities is integral to long-term sustainable growth of the business. For 2023, the ESG measure will centre on building an inclusive culture and increasing female representation at leadership levels | |||||||
Introduced for 2023 | ||||||||
Discretion framework
When determining performance outcomes, the Remuneration Committee has the ability to adjust payments up or down if it believes that the outcome does not reflect underlying financial or
non-financial
performance or if such other exceptional factors warrant doing so. In making this determination the Remuneration Committee applies the following framework.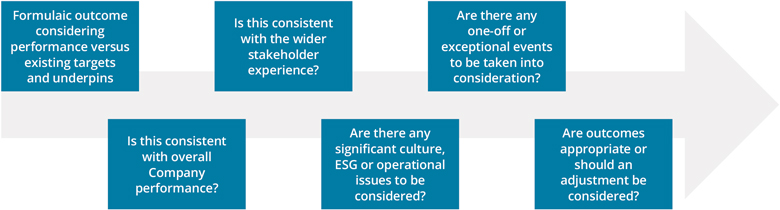
96 Pearson plc |
Performance in 2022
A year of strategic and operational progress
Revenue £3,841m 5% underlying adjusted growth on prior year | Adj. operating profit £456m 11% underlying adjusted growth on prior year | Operating cash flow £401m 3% growth on prior year | Adjusted EPS 51.8p 48% growth on prior year | Net debt £557m 59% increase on prior year due to £350m share buy back | Dividend per share 21.5p 5% increase on prior year | |||||||||||||||
Strategic highlights
| — | Significant organic investment, bringing new capabilities |
| — | Acquisitions, including Mondly and Credly to support growth across the Pearson ecosystem |
| — | Completion of the strategic disposal of Pearson’s International Courseware local publishing businesses |
| — | Launch of 18 study channels on Pearson+ |
| — | Launch of new people strategy with a focus on engagement and high-performance |
| — | Announcement of £120m of cost efficiencies, accelerating improved margin |
Generation of significant returns for shareholders
Pearson TSR performance versus FTSE 100 over 2022
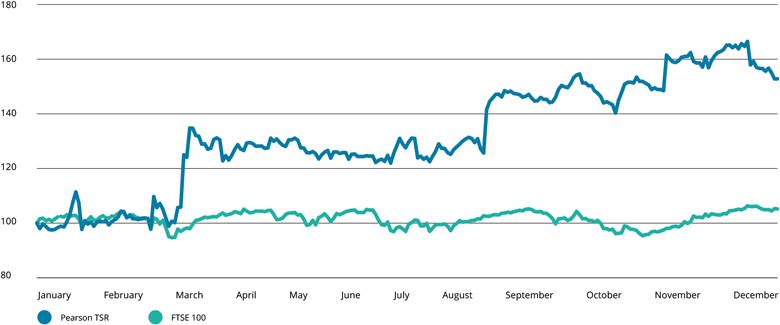
Executive remuneration outcomes for 2022
Chief Executive 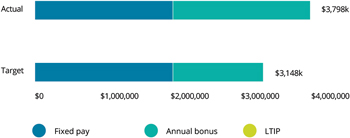 | Chief Financial Officer 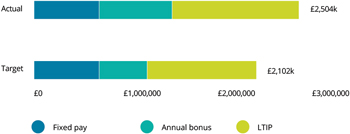 |
Note 1: Target assumes AIP and LTIP outcome at 50% of maximum.
Note 2: The vesting of the second tranche of the Chief Executive’s
co-investment
award is not included in the above illustration.| Annual report and accounts 2022 Pearson plc 97 |
Directors’ remuneration report
continued
Implementation of executive remuneration framework for 2023
Base salary | Andy Bird – $1,293,750 (3.5% increase) Sally Johnson – £557,225 (4% increase) The salary increase for the Chief Executive is line with the average salary increase awarded to the US workforce and below the average level for the UK workforce. The salary increase for the Chief Financial Officer is in line with the increase for the UK workforce. | |||||||||
Allowances and benefits | No change for 2023. Executive Directors will continue to receive travel, health, and risk-related benefits. Andy Bird will also receive a contribution towards accommodation costs. | |||||||||
Retirement benefits | For 2023, both the Chief Executive and Chief Financial Officer will receive a cash allowance of 16% of salary in lieu of pension. This is aligned with the pension provision that UK employees of a similar age are eligible to receive. As described in relation to the Committee’s review of the remuneration policy for 2023, Pearson has retained a UK remuneration framework for Executive Directors which does not reflect US practice in terms of plan design or pay levels. It is therefore considered appropriate that a consistent UK approach is applied with regard to pensions for the CEO. For US employees below Board level, whilst pension arrangements are in line with local practice, Pearson adopts US pay practices more broadly – such as grants of restricted shares in addition to performance shares – which we do not for Executive Directors. | |||||||||
Annual incentive plan | Maximum opportunities of: — 300% of base salary for the Chief Executive — 200% of base salary for the Chief Financial Officer For 2023, the following balanced mix of financial and strategic measures will be used to determine any pay out, with a third of any bonus paid deferred into shares for two years if an Executive Director has not met their shareholding guideline. | |||||||||
Adjusted operating profit | Sales | Free cash flow | Strategic measures | |||
| 40% | 30% | 20% | 10% | |||
| Strategic targets are as follows: | ||||||
Weighting | Threshold | Target | Maximum | |||||
| Invest in diverse pipeline and increase BIPOC/BAME representation at all manager levels | 5% | 2% increase in representation of BIPOC/BAME employees at Manager level and above + maintain overall gender parity as an underpin | 5% increase in representation of BIPOC/BAME employees at Manager level and above | 10% increase in representation of BIPOC/BAME employees at Manager level and above | ||||
| Reduce carbon footprint – net annual reduction versus 2022 baseline as step towards 2030 goal | 5% | 1% reduction | 2% reduction | 5% reduction | ||||
| As in previous years, we will apply a financial underpin to the strategic measures. We will disclose financial targets in full retrospectively following the end of the performance period. | ||||||||
98 Pearson plc |
Implementation of executive remuneration framework for 2023 continued
Long-Term Incentive Plan | Maximum opportunities for Executive Directors are: — 450% of base salary for the Chief Executive — 300% of base salary for the Chief Financial Officer Performance measured over three years, with any shares vesting subject to an additional two-year holding period.For 2023, performance measures and targets are as follows: | |||||||||
% of total | Threshold | Stretch | Maximum | Payout at threshold | Payout at stretch | Payout at maximum | ||||||||||||||||||||||||||||||||||||||||
| Adjusted EPS | 30% | 53.0p | 63.0p | 68.0p | 20% | 65% | 100% | |||||||||||||||||||||||||||||||||||||||
| Return on Capital | 30% | 8.5% | 10% | 11.5% | 20% | 65% | 100% | |||||||||||||||||||||||||||||||||||||||
| Relative TSR vs. FTSE 100 (excl. certain sectors) | 15% | Median | - | Upper quartile | 20% | - | 100% | |||||||||||||||||||||||||||||||||||||||
| Relative TSR vs. S&P 500 (excl. certain sectors) | 15% | Median | - | Upper quartile | 20% | - | 100% | |||||||||||||||||||||||||||||||||||||||
| ESG | 10% | | Improve gender representation at leadership levels overall vs 2022 (VP and above) | | | Achieve gender parity at leadership levels in aggregate (VP and above) | | | Achieve gender parity at all leadership levels (VP and above) | | 20% | 65% | 100% | |||||||||||||||||||||||||||||||||
| Note 1: 2023 LTIP targets have been set at an USD:GBP exchange rate of 1.21. |
| Note 2: Companies within financial services, energy, basic materials, utilities and healthcare sectors will be excluded from both TSR groups. |
Shareholding guidelines | Shareholding guidelines are: — 450% of salary for the Chief Executive — 300% of salary for the Chief Financial Officer | |||||||||
| Annual report and accounts 2022 Pearson plc 99 |
Directors’ remuneration report
continued
Workforce remuneration
at Pearson
The Committee takes seriously its responsibilities concerning the oversight of remuneration policies and practices for the wider organisation. Our remuneration principles are consistent for all our colleagues, and applied depending on business need, level, and geography.
The key difference in our executive remuneration, compared to the approach to remuneration across our workforce, is that remuneration for our Executive Directors is more heavily weighted towards variable pay and linked to the delivering of strategic objectives.
Approach to remuneration across Pearson
Base salary | Set considering economic factors, competitive market rates, roles, skills, experience, and individual performance | |||||||
Allowances and benefits | Reflect the local labour market in which colleagues are based. All eligible colleagues (including Executive Directors) can participate in savings-related share acquisition programmes in the UK, US and the rest of the world, and these are not subject to any performance conditions | |||||||
Retirement benefits | Reflect local market practice. Pearson colleagues in the UK may participate in the same underlying pension arrangements as the Executive Directors, subject to certain age bands and legacy arrangements | |||||||
Annual incentives | Around 11,200 colleagues participate in an Annual Incentive Plan, which is funded based on similar performance measures to the Executive Directors. | All colleagues | ||||||
Several other colleagues participate in alternative cash-based annual bonuses, such as sales incentive and commission plans, based on performance targets and profit-shares where required for legislative reasons | Over half of all Pearson employees participate in the annual incentive plan | |||||||
Long-term | Senior management participates in a long-term incentive arrangement, with both performance shares and restricted shares, recognising the markets in which we compete for talent. At other levels awards are typically made in restricted shares only. | All colleagues | ||||||
incentives | ||||||||
Around 4% of all Pearson employees participate in a long-term incentive plan | ||||||||
Approximately 800 colleagues participate in the annual long-term incentive plan grant, who are selected based on their role, performance, and potential; with other awards being made from time to time on an ad-hoc basis to certain roles based on market need. | ||||||||
During the year, the Committee received reports from the Chief Executive and Chief Human Resources Officer on pay and conditions across Pearson, and on the recruitment and retention experience. We took these into account when determining Executive remuneration. We have established channels in place to inform our colleagues and help them understand how executive remuneration and wider pay policies are aligned, although we continue to develop how best to engage with employees. Further detail on Pearson’s approach to employee engagement is provided on page 33.
Remuneration Committee Chair, Sherry Coutu, CBE is our designated workforce
Non-Executive
Director. She leads the Board’s engagement with colleagues, including attending meetings of the Employee Engagement Network (EEN). Annette Thomas, a member of both the Remuneration Committee and Reputation & Responsibility Committee, also attended meetings of the EEN throughout the year, increasingNon-Executive
Director participation. Feedback received through the EEN is reported to the Board. Views and sentiment expressed by colleagues around matters relating to reward and culture are taken into consideration by the Remuneration Committee when determining pay for senior management. Last year, to ensure a more proactive approach and enable atwo-way
conversation, the EEN held a discussion on reward and incentives at Pearson. The EEN met to discuss how the annual bonus plan is funded and how Pearson seeks to achieve alignment between Executive Directors and the wider workforce through the use of consistent measures. See page 68 for more on how the Board engages with employees.The Committee also considers Pearson’s gender pay gap and ethnicity pay gap in Great Britain. The Committee was pleased to note the improvement in Pearson’s gender pay gap for 2022, which decreased to 11% (from 13% in prior year), however acknowledged there was still progress to be made in terms of closing the gap. Pearson continues to review and update its policies and practices relating to the hiring, retention, and development of women, as well as other diverse talent groups, to ensure equal opportunities for all its people. This year, in line with the commitment as a signatory to the CBI Change the Race Ratio campaign, Pearson will voluntarily be publishing its ethnicity pay gap for Great Britain for the first time. Building an inclusive culture and increasing diverse representation is one of Pearson’s six strategic pillars, and reflective of the Company’s commitments in this area diversity targets have been included in both the AIP and LTIP for Executive Directors for 2023. Further details can be found within our fair pay report which will be published ahead of the AGM.
100 Pearson plc |
Remuneration report for 2022
Certain parts of this report have been audited, as required by the Large and
Medium-sized
Companies and Groups (Accounts and Reports) Regulations 2008 as amended. Those tables subject to audit are marked with an asterisk.Single total figure of remuneration and prior year comparison*
Total aggregate emoluments for Executive and
Non-Executive
Directors were £10,738k in 2022. These emoluments are included within the total employee benefit expense (in Note 5 to the financial statements page 159).Executive Director ‘single figure’ remuneration
The remuneration received by Executive Directors for the financial years ended 31 December 2022 and 31 December 2021 is set out below.
Overall, the Committee considers that the Remuneration Policy operated as intended during 2022.
Executive Director ‘single figure’ remuneration
| Andy Bird $000s | Sally Johnson £000s | |||||||||||||||
2022 | 2021 | 2022 | 2021 | |||||||||||||
| Base salary | 1,250 | 1,250 | 533 | 521 | ||||||||||||
| Allowances and benefits | 448 | 373 | 16 | 16 | ||||||||||||
| Retirement benefits | 200 | 200 | 64 | 58 | ||||||||||||
Total fixed pay | 1,898 | 1,823 | 613 | 595 | ||||||||||||
| Annual incentives | 1,900 | 1,575 | 692 | 560 | ||||||||||||
| Long-term incentives | – | – | 1,199 | – | ||||||||||||
Co-investment award | 4,684 | 3,708 | – | – | ||||||||||||
Total variable pay | 6,584 | 5,283 | 1,891 | 560 | ||||||||||||
Total remuneration | 8,482 | 7,106 | 2,504 | 1,155 | ||||||||||||
Notes to single figure table*
Base salary
The base salary shown in the single figure table above reflects salary paid in the financial year as a Pearson Executive Director. Andy Bird is paid in USD, and Sally Johnson is paid in GBP.
Allowances and benefits
The breakdown of benefits is as follows for 2022:
Andy Bird $000s | Sally Johnson £000s | |||||||
| Travel | – | 14 | ||||||
| Health | 15 | 2 | ||||||
| Risk-related | 2 | – | ||||||
| Accommodation | 431 | – | ||||||
Travel benefits comprise car allowance and reimbursements of a taxable nature resulting from business travel and engagements. Health benefits comprise healthcare, health assessment and dental care. Risk-related benefits comprise of life and other insurance policies. Accommodation benefits for Andy Bird relate to a contribution towards the rental costs of an apartment in New York used for business purposes. This cost is capped at $240,000 per year ($20,000 per month) prior to any taxes due. The gross value for 2022 is higher due to a higher tax rate compared to 2021.
In addition to these allowances and benefits, Executive Directors may also participate in company benefit or policy arrangements that have no taxable value and/or are available to all other colleagues in the same location. Sally Johnson’s life cover is arranged under an excepted policy on a similar basis to other employees who are affected by the lifetime allowance and have opted out of The Pearson Pension Plan.
Retirement benefits
Further detail on retirement benefits is on page 105.
Annual incentives
The 2022 AIP for the Executive Directors was based on a mix of financial (80% weighting) and strategic measures (20% weighting). The 2022 AIP resulted in a 76% of maximum payment for both Andy Bird and Sally Johnson. Bonus is calculated using salary at 31 December 2022, in line with how bonuses are calculated for all participants. More detail on performance metrics and performance against targets in 2022 is on page 102.
Long-term incentives
The 2020 LTIP award was subject to performance conditions assessed to 31 December 2022. Performance targets were partially met resulting in the award vesting at 58% of maximum. The 2020 LTIP award for Sally Johnson was granted on 1 May 2020, based on a share price of 573.7p
(five-day
average to 1 March 2020). The value of the 2020 LTIP included in the single-figure table is based on a three-month average share price to 31 December 2022 of 939.4p. The proportion of the 2020 LTIP attributable to share price growth is therefore £466,633 for Sally Johnson. The Remuneration Committee did not exercise discretion in respect of this share price appreciation. For further details see page 102.Co-investment
awardThe second tranche of the
one-off
investment award, granted to Andy Bird to secure his appointment, was subject to performance underpins assessed to 31 December 2023. It was determined the second tranche of the award would vest in full. The value disclosed, which includes an additional amount equal to the value of dividends payable on the shares vesting, is calculated using the share price at the date of vesting (being 3 March 2023) of 893.5p and was converted using a USD:GBP exchange rate of 1.2371 (average exchange rate for 2022). The award was originally granted based on a share price of 590.2p, and so $1,512k of the figure included in the single figure table is attributable to share price growth. The award has been satisfied using market-purchased shares and shares retained after tax must be held until 31 December 2023. For further details see pages103-104.
| Annual report and accounts 2022 Pearson plc 101 |
Directors’ remuneration report
continued
Executive Directors’ annual incentive payments for 2022*
Andy Bird and Sally Johnson were eligible to participate in the 2022 AIP. The following table summarises the performance targets (presented on a consistent basis to the actual results, considering portfolio and currency movements) and performance against these targets, which resulted in a 76% of maximum payout.
Overall outcome
Performance range | Payout | |||||||||||||||||||||||
% of total | Threshold | Target | Maximum | Actual results | % of max bonus opportunity | |||||||||||||||||||
| Adjusted operating profit | 30% | £405m | £428m | £520m | £456m | 20% | ||||||||||||||||||
| Sales | 30% | £3,600m | £3,725m | £3,980m | £3,841m | 22% | ||||||||||||||||||
| Operating cash flow | 20% | £300m | £315m | £390m | £401m | 20% | ||||||||||||||||||
| Strategic measures | 20% | See below | 14% | |||||||||||||||||||||
100% | 76% | |||||||||||||||||||||||
Performance against strategic measures
The targets and outcomes for performance against each of the strategic measures are shown in the table below.
Strategic priority | Weighting | Threshold | Target | Maximum | Outcome | |||||||||
Digital sales growth | 10% | Plan less 2% | Plan | Plan plus 2% | Met Plan plus 1.8% (9%) | |||||||||
Invest in diverse pipeline and increase representation at management levels | 5% | 50% female and ethnic minority representation in leadership development and mentoring programmes + 50% female and 20% ethnic minority representation in leadership succession plans | Threshold + 5% increase in female and ethnic minority representation at VP level and above | Threshold + 10% increase in female and ethnic minority representation at VP level and above | Achieved threshold of more than 5% increase in ethnic minority representation, but less than 5% increase in female representation, at VP level and above (1%) | |||||||||
Reduce carbon footprint – net annual reduction versus 2021 baseline | 5% | 1% reduction | 2% reduction | 5% reduction | 3.3% net reduction (4%) | |||||||||
Total | 20% | 14% | ||||||||||||
Note: Internal Audit provided an independent assessment of the result for the Committee.
Executive Directors’ Long-Term Incentive Plan award vesting for 2022*
In May 2020, Sally Johnson was granted an LTIP award. This award is due to vest based on performance the business delivered over the three-year period from 2020 to 2022. The targets and performance against these targets are as follows:
Performance range | Vesting | |||||||||||||||||||||||||||||||||||||||
% of total | Threshold | Stretch | Maximum | Payout at threshold | Payout at stretch | Payout at maximum | Actual | Percentage achievement | Percentage of total award | |||||||||||||||||||||||||||||||
Adjusted EPS | A third | 44.2p | 51p | 58.3p | 15% | 65% | 100% | 52.8p | 74% | 25% | ||||||||||||||||||||||||||||||
ROIC | A third | 5.2% | 6.2% | 7.5% | 15% | 65% | 100% | 4.7% | 0% | 0% | ||||||||||||||||||||||||||||||
Relative TSR | A third | Median | - | | Upper quartile | | 25% | - | 100% | | Ranked 10 out of 93 | | 100% | 33% | ||||||||||||||||||||||||||
100% | Total | 58% | ||||||||||||||||||||||||||||||||||||||
Relative TSR was measured against the constituents of the FTSE 100 at the start of the performance period.
In determining the vesting outcome, the Committee carefully considered the portfolio changes over the last three years and made modest adjustments to reflect the impact of these, in particular the divestment of various businesses under strategic review during the performance period – the adjusted targets and adjusted results are presented in the table above. Overall the impact on vesting was an increase from 53% to 58% of maximum. The Committee considers such adjustments appropriate to ensure performance is measured on abasis and reflect the principles against which the original targets were set as these did not consider the impact of the portfolio changes.
like-for-like
Overall, 58% of this award will vest on 1 May 2023, and its value is included in the single figure table on page 101. Shares vesting are subject to an additional
two-year
holding period to 1 May 2025.102 Pearson plc |
Co-investment
award*To secure the appointment of Andy Bird as Chief Executive, the Committee designed a
one-off
co-investment
award. The grant of this award was conditional on Andy Bird buying Pearson ordinary shares equal to 300% of his base salary, which he must continue to hold until 31 December 2023. Theco-investment
award vests in three equal annual tranches, with shares vesting subject to a holding period until 31 December 2023.The vesting of each tranche of the award is subject to these performance underpins:
| — | an appropriate level of continued progress being made in relation to delivering Pearson’s strategy, including the ongoing transition from print to digital, and |
| — | no significant ESG issues occurring, which relate to Andy Bird’s tenure as Chief Executive, and which result in significant reputational damage for Pearson |
In addition, the vesting of the final tranche of the award is subject to the following TSR underpin:
| — | Pearson’s TSR from the date of the announcement of Andy Bird’s appointment to 31 December 2023 is either (1) positive; or (2) is at median or above when compared to the performance of the FTSE 100 |
If one or more of the underpins are not achieved, then the Committee will consider whether, and to what extent, a discretionary reduction in the number of shares vesting is required.
Assessment of performance underpins
The second tranche of the
co-investment
award vested as soon as practical following 31 December 2022. In advance of this, the Committee undertook a rigorous assessment of the relevant performance underpins, reviewed broader Pearson performance, and evaluated the experience of all stakeholders. The Committee followed the framework disclosed in the 2020 Remuneration Report.Initial review of underpins
Progress in delivering Pearson’s strategy | Significant strategic progress was made during 2022 in the face of macroeconomic headwinds. This included: — Significant organic investment, bringing new capabilities. For example: invested in new capabilities for Pearson+, including Channels functionality; expanded reach of VUE remote proctoring solution; launched Skills Accelerator, developed MondlyWORKS capabilities to grow our presence in the enterprise language learning market. — Acquisitions to support growth strategy across the Pearson ecosystem. These include Credly, Mondly, Navvy, and ClutchPrep, and Pearson has also signed an agreement to acquire PDRI. — Refinement of Pearson’s portfolio through the completion of the strategic disposal of Pearson’s International Courseware local publishing businesses. — The delivery of £120m of cost efficiencies, accelerating improved margin expectation. — Launch of people strategy with a focus on engagement and high-performance | |||
In 2022, there have been no ESG issues which, in the opinion of the Committee, have resulted in significant reputational damage.
Consideration of broader performance and stakeholder experience
Robust financial performance
Revenue £3,841m 5% underlying adjusted growth on prior year | Adj. operating profit £456m 11% underlying adjusted growth on prior year | Operating cash flow £401m 3% growth on prior year | Adjusted EPS 51.8p 48% growth on prior year | Net debt £557m 59% increase on prior year due to £350m share buy back | ||||||||||||
Wider stakeholder experience
Shareholders
| — | Strong strategic, operational, and financial progress was reflected in Pearson’s share price and value delivered to shareholders. Pearson ended the year as one of the top performers in the FTSE 100, delivering a total shareholder return of 57% in 2022. |
| — | Strong financial position has enabled Pearson to grow its dividend (up 5% to 21.5p in 2022), in line with Pearson’s commitment to a progressive and sustainable dividend. The Board also approved a £350m share buyback programme in February 2022 to return capital to shareholders. |
| — | Pearson has strong and constructive relationships with its key institutional investors. During 2022, Pearson held 373 meetings with 192 institutions, both virtually and in person. |
Annual report and accounts 2022 Pearson plc 103 |
Directors’ remuneration report
continued
Employees
| — | Launch of people strategy with a focus on engagement and high-performance. |
| — | Refresh of non-financial KPIs to measure how well Pearson is delivering on its people strategy, and to cover employee engagement, investing in talent, and diversity, equity, and inclusion. |
| — | Launch of a new employee engagement survey to better understand employees’ needs and enable Pearson to benchmark itself globally. In addition, Pearson launched a new digital employee experience platform to improve communication across Pearson. Over 70% of colleagues participated in the new engagement survey in 2022, and more than 34,000 users have already accessed the new digital employee experience platform. |
| — | Investment in learning, for example, manager upskilling and reskilling to drive engagement and high performance; new acquisitions such as Credly to certify employee skills; development of leaders via McKinsey accelerator programmes; and coaching and Board mentoring opportunities. Over 70% of Pearson’s employees agreed or strongly agreed they had access to opportunities to learn and grow over the past six months. |
| — | Expansion of Pearson’s flagship Global Learning at Work week to a monthly series focused on priority skills from the Pearson Capabilities Framework featuring live and on demand sessions with external experts, Pearson authors, Pearson leaders as teachers, and curated learning pathways and team guides to support self-directed learning. |
| — | Continued focus on building a culture of inclusion and increasingly diverse representation through inclusive learning experience for employees, and 75% of participants on leadership development and mentoring programs were diverse. |
| — | Evolution of Pearson’s Employee Engagement Network, enabling the Board to hear directly from employees and creating additional insight on how to enhance employee satisfaction and engagement levels. |
Customers
| — | Pearson+ registered users compared to prior year Fall grew to 2.83m (2021: 2.75m) , and there was a three-fold increase compared to prior Fall semester in Pearson+ paid subscriptions to 406k (2021: 133k). Through increased understanding of consumer behaviours and preferences, Pearson continues to evolve Pearson+, exploring new types of content and enhancing features such as Pearson+ Channels, which launched in Autumn 2022. |
| — | In English Language Learning, enhancements were made to the user experience to ensure courseware is the most engaging and effective on the market, leveraging our partnerships with major corporations including Disney and the BBC. |
| — | In Mondly, development of a new AI virtual tutor to be integrated into the product in 2023 to support where it is difficult for individuals to access in-person tutors. |
| — | Reshape of Workforce Skills portfolio to better match the suite of products and services with the different needs of our enterprise customers. |
| — | Launch of Skills Accelerator in Workforce Skills – a suite of peer-supported, project-based learning courses – to support people complete business-critical projects while developing future skills. |
| — | Pearson opened its first virtual school in Virginia and helped to enact new legislation in Missouri facilitating easier access to publicly funded virtual learning. |
| — | Launch of a new Privacy Centre for consumers which will be linked to all our products and a newly developed universal preferences centre. |
| — | 70% of content partners are now trained in editorial guidelines released for Pearson’s authors, reviewers, and editors to ensure meaningful, diverse representation in content. |
Suppliers & Business Partners
| — | Supplier diversity and responsible procurement are key priorities for Pearson. In 2022, two new supplier portals were added that provide access to over one million diverse accredited suppliers. Pearson progressed towards its goal of increasing spend with diverse-accredited suppliers. |
| — | Continued progress towards Pearson’s goal of ethically sourcing 100% of its paper by 2025. Paper and print suppliers are integrated to the Book Chain Project platform which monitors and tracks actions and strategies to protect biodiversity. Pearson has also rationalised its paper suppliers to significantly increase use of responsibly sourced paper from the Forestry Stewardship Council and the Programme for the Endorsement of Forest Certification schemes. |
| — | For the first time in 2022, we asked our key suppliers to participate in an EcoVadis sustainability assessment (or equivalent). We reviewed performance across environmental and human rights areas to ensure that they align to Pearson’s standards. Our key suppliers performed well, with an average score of 57.3/100 (average supplier’s score of 44.9/100). |
| — | Pearson is working in partnership with other corporates to understand the decarbonisation plans of its top 50 suppliers ahead of developing tailored engagement plans for those suppliers that need support to drive change. |
| — | Pearson continues to add business partners who contribute to the diversity of its workforce. In 2022, new partners included People of Colour in Tech and the Hispanic Association on Corporate Responsibility. |
Taking all the above into account, the Committee has determined that the second tranche of the
co-investment
award will vest in full.104 Pearson plc |
Long-term incentives awarded in 2022*
The following LTIP awards were granted during the year:
| Director | Date of award | Vesting date | Number of shares | Face value | Face value (% of base salary) | Value for threshold performance (% of maximum) 1 | Performance period | |||||||||||||||||||||
| Andy Bird | 3 May 2022 | 1 May 2025 | 356,065 | £2,775,171 | 300% | 18.3% | 1 Jan 22 – 31 Dec 24 | |||||||||||||||||||||
| Sally Johnson | 3 May 2022 | 1 May 2025 | 168,415 | £1,312,627 | 245% | 18.3% | 1 Jan 22 – 31 Dec 24 | |||||||||||||||||||||
Note 1: Under the adjusted EPS and ROIC elements, 15% vests for threshold performance; under the TSR element, 25% vests for threshold performance. This is the weighted average of vesting for threshold.
Face value was determined using a share price of 779.4p
(five-day
average to 3 May 2022), which is the share price used to determine award values for LTIP awards for all employees.Performance targets for the 2022 LTIP awards are:
Adjusted earnings per share (EPS) (one-third) | Net return on invested capital (ROIC) (one-third) | Relative total shareholder return (TSR) (one-third) | ||||||||||||||||||||
| Vesting schedule (% max) | Adjusted EPS for FY24 | Vesting schedule (% max) | Adjusted net ROIC for FY24 | Vesting schedule (% max) | Ranked position vs FTSE 100 | |||||||||||||||||
| 15% | 48.0p | 15% | 6.0% | 25% | Median | |||||||||||||||||
| 65% | 55.0p | 65% | 7.0% | – | – | |||||||||||||||||
| 100% | 64p or above | 100% | 8.0% or above | 100% | Upper quartile | |||||||||||||||||
Note 1: Straight-line vesting will occur in between the points shown, with no vesting for performance below threshold.
Note 2: Pearson’s TSR performance is measured relative to the constituents of the FTSE 100 Index over the performance period.
The Committee reserves the right to adjust
pay-outs
up or down before they are released, if it believes the vesting outcome does not reflect underlying financial ornon-financial
performance, or for other exceptional factors. In making any adjustments, the Committee are guided by the principle of aligning shareholder and management interests.Any shares vesting based on performance to 31 December 2024 will be subject to an additional
two-year
holding period to 3 May 2027.Executive Directors’ retirement benefits and entitlements*
Details of the Executive Directors’ pension entitlements and pension-related benefits in 2022 are as follows:
Andy Bird $000s | Sally Johnson £000s | |||||||
| Value of defined benefit | - | 43 | ||||||
| Other allowances in lieu of pension | 200 | 21 | ||||||
| Total value in 2022 | 200 | 64 | ||||||
| Accrued pension at 31 December 2022 | - | 64 | ||||||
Note 1: The value of defined benefit reflects the change in value over the period, less inflation.
Note 2: Other allowances in lieu of pension represent the cash allowances paid.
Note 3: Total value is the sum of the previous two rows and is disclosed in the single figure of remuneration table.
Note 4: The accrued pension at 31 December 2022 is the deferred annual pension to which the member would be entitled on ceasing pensionable service on 31 December 2022. It relates to the pension payable from the UK Plan. Normal retirement age is 62.
Pension Plans
Andy Bird – Payment in Lieu of Pension
Andy Bird receives a payment in lieu of pension at 16% of his base salary, in line with the pension provision for UK employees of a similar age.
Sally Johnson – The Pearson Pension Plan and Payment in Lieu of Pension (from 1 October 2022)
Sally Johnson was a member of the Final Pay section of the Pearson Pension Plan. Her pension accrual rate is 1/60
th
of pensionable salary per annum, restricted to the Plan’s earnings cap.Sally Johnson has now reached her pension lifetime allowance and therefore no further contributions will be made to the Pearson Pension Plan. Instead, from 1 October 2022, Sally Johnson receives a payment in lieu of pension at 16% of her base salary, in line with the pension provision for UK employees of a similar age.
| Annual report and accounts 2022 Pearson plc 105 |
Directors’ remuneration report
continued
Directors’ interests in shares and value of shareholdings*
Shareholding guidelines
Executive Directors are expected to build up a substantial shareholding in Pearson, in line with our policy of encouraging widespread employee share ownership, and to align the interests of Executive Directors and shareholders.
For 2022, the shareholding guideline was 300% of base salary for the Chief Executive and 200% of base salary for the Chief Financial Officer. These shareholding guidelines will increase under the 2023 Directors’ Remuneration Policy.
Shares that count towards these guidelines include any shares held unencumbered by an Executive Director, their spouse and/or dependent children, plus any shares vested but held pending release under a share plan, and any shares unvested but not subject to future performance conditions (on a net of tax basis). Executive Directors have five years from their date of appointment to the Board to reach the guideline. Once the guideline is met, it is not
re-tested,
other than when shares are sold.Executive Directors are expected to retain their current guideline (or actual shareholding if lower) for two years following stepping down as an Executive Director. This guideline does not apply to shares purchased by the Director.
The shareholding guidelines do not apply to the Chair, Deputy Chair and Senior Independent Director and
Non-Executive
Directors. However, a minimum of 25% of the Chair, Deputy Chair and Senior Independent Director andNon-Executive
Directors’ basic fee is paid in Pearson shares, which the Chair, Deputy Chair and Senior Independent Director andNon-Executive
Directors have committed to retain for the period of their directorships.Directors’ interests
The share interests of the Directors and their connected persons are:
| Director | Current shareholding (ordinary shares) at 31 Dec 22 | Conditional shares subject to performance at 31 Dec 22 | Conditional shares subject to employment only at 31 Dec 22 | Total number of ordinary and conditional shares at 31 Dec 22 | Shareholding guideline for 2022 (% salary) | Guideline met? | ||||||||||||||||||
Chair | ||||||||||||||||||||||||
| Omid Kordestani | 32,096 | – | – | – | – | – | ||||||||||||||||||
| Sidney Taurel | 242,770 | – | – | – | – | – | ||||||||||||||||||
Deputy Chair | ||||||||||||||||||||||||
| Tim Score | 67,475 | – | – | – | – | – | ||||||||||||||||||
Executive Directors | ||||||||||||||||||||||||
| Andy Bird | 591,983 | 1,494,289 | 207,584 | 2,293,856 | 300% | Yes | ||||||||||||||||||
| Sally Johnson | 27,778 | 543,330 | 2,357 | 573,465 | 200% | n/a (see note 6) | ||||||||||||||||||
Non-Executive Directors | ||||||||||||||||||||||||
| Sherry Coutu CBE | 10,567 | – | – | – | – | – | ||||||||||||||||||
| Esther Lee | 1,497 | – | – | – | – | – | ||||||||||||||||||
| Linda Lorimer | 18,038 | – | – | – | – | – | ||||||||||||||||||
| Graeme Pitkethly | 10,477 | – | – | – | – | – | ||||||||||||||||||
| Annette Thomas | 2,317 | – | – | – | – | – | ||||||||||||||||||
| Lincoln Wallen | 16,315 | – | – | – | – | – | ||||||||||||||||||
Note 1: Share interests are shown as at 31 December 2022. For Directors who stepped down from the Board during the year, share interests are shown as at the date of their stepping down. Sidney Taurel stepped down from the Board at the AGM on 29 April 2022.
Note 2: Ordinary shares include both ordinary shares listed on the London Stock Exchange and American Depositary Receipts (ADRs) listed on the New York Stock Exchange. The figures include both shares and ADRs acquired by individuals under the LTIP and any other share plans in which they might have participated.
Note 3: Conditional shares subject to performance means unvested shares, which are subject to performance conditions and/or performance underpins and continuing employment for a
pre-defined
period. This includes the LTIP awards granted in 2020, 2021, and 2022 and, in respect of Andy Bird, the second and third tranche of hisco-investment
award.Note 4: Conditional shares subject to employment only means unvested shares, which are subject to a holding period and continued employment. For Andy Bird this includes the first tranche of his
co-investment
award. For Sally Johnson, this includes share awards granted before her appointment to the Board in May 2020.Note 5: Sally Johnson held 2,658 options under the Pearson Save For Shares scheme, a savings-related share acquisition programme open to all employees, which she exercised during the financial year. These were not subject to performance conditions.
Note 6: Sally Johnson has five years from the date of her appointment as an Executive Director on 24 April 2020 to reach the shareholding guideline.
Note 7: The second tranche of Andy Bird‘s
co-investment
award, 423,786 shares (including 20,832 dividend equivalent shares), vested on 3 March 2023, taking his conditional share subject to employment only to 407,575 shares (after the sales of shares to cover any tax liability) and conditional shares subject to performance to 1,091,335 shares. The vestedco-investment
shares are subject to a holding period until 31 December 2023 and continued employment. There have been no other changes in the interests of any Director between 31 December 2022 and 13 March 2023, being the latest practicable date prior to the publication of this report.106 Pearson plc |
Chair, Deputy Chair and Senior Independent Director and
Non-Executive
Director remuneration*Remuneration in 2022
The remuneration paid to the Chair, Deputy Chair and Senior Independent Director and
Non-Executive
Directors for the financial years ended 31 December 2022 and 31 December 2021 is set out below.2022 | 2021 | |||||||||||||||||||||||
Director £000s | ||||||||||||||||||||||||
Total fees | Taxable benefits | Total | Total fees | Taxable benefits | Total | |||||||||||||||||||
| Omid Kordestani | 417 | 19 | 436 | – | – | – | ||||||||||||||||||
| Sidney Taurel | 167 | 13 | 180 | 500 | – | 500 | ||||||||||||||||||
| Sherry Coutu CBE | 100 | 5 | 105 | 92 | – | 92 | ||||||||||||||||||
| Esther Lee | 78 | 7 | 85 | – | – | – | ||||||||||||||||||
| Linda Lorimer | 100 | 9 | 109 | 100 | – | 100 | ||||||||||||||||||
| Graeme Pitkethly | 98 | 4 | 102 | 93 | – | 93 | ||||||||||||||||||
| Tim Score | 163 | 3 | 166 | 130 | – | 130 | ||||||||||||||||||
| Annette Thomas | 90 | 6 | 97 | 21 | – | 21 | ||||||||||||||||||
| Lincoln Wallen | 93 | 6 | 99 | 93 | – | 93 | ||||||||||||||||||
Total | 1,305 | 73 | 1,378 | 1,029 | – | 1,029 | ||||||||||||||||||
Note 1: A minimum of 25% of the Chair, Deputy Chair and Senior Independent Director and
Non-Executive
Directors’ basic fee is paid in shares.Note 2: Taxable benefits refer to travel, accommodation and subsistence expenses incurred while attending Board meetings during the period that were paid or reimbursed by the company, and which HMRC deems taxable in the UK.
Note 3: Omid Kordestani joined the Pearson Board with effect from 1 March 2022. He succeeded Sidney Taurel as Chair on 29 April 2022. Sidney Taurel stepped down from the Board on 29 April 2022.
Note 4: Esther Lee joined the Pearson Board with effect from 1 February 2022.
Note 5: Some figures and subtotals add up to different amounts than the totals due to rounding.
Implementation for 2023
The fee for the role of Chair of the Remuneration Committee has been increased with effect from 1 January 2023 to £27,500 (2022: £22,000). There will be no other changes in the Chair, Deputy Chair and Senior Independent Director or
Non-Executive
Directors’ fees for 2023.| Role | Fees for 2023 | |||
| Chair fee | £500,000 | |||
| Deputy Chair and Senior Independent Director fee | £175,000 | |||
Base fee for Non-Executive Directors | £70,000 | |||
| Role | Chair | Member | ||||||
| Audit Committee | £27,500 | £15,000 | ||||||
| Remuneration Committee | £27,500 | £10,000 | ||||||
| Nomination & Governance Committee | £15,000 | £8,000 | ||||||
| Reputation & Responsibility Committee | £15,000 | £8,000 | ||||||
Payments to former Directors*
There were no payments to former Directors in 2022.
Payments for loss of office*
There were no payments for loss of office made to or agreed for Directors in 2022.
Sidney Taurel stepped down from the Board on 29 April 2022. Other than fees payable for the period up to 29 April 2022, he did not receive any remuneration or payment in connection with ceasing to be Chair.
Service contracts
Terms and conditions of our Directors’ appointment are available for inspection at our registered office during normal business hours and at the AGM.
So that appropriate arrangements can be made for shareholders wishing to inspect documents, we request that shareholders contact the Company Secretary by email at companysecretary@pearson.com in advance of any visit to ensure that access can be arranged.
The Executive Directors have notice periods in their service contracts of 12 months from the company and six months from the Executives. Their contracts are dated 23 August 2020 (Andy Bird) and 15 January 2020 (Sally Johnson).
The Deputy Chair and Senior Independent Director and
Non-Executive
Directors serve Pearson under letters of appointment, which are renewed annually and do not have service contracts. The Deputy Chair and Senior Independent Director andNon-Executive
Directors’ letters of appointment do not contain provision for notice periods or for compensation if their appointments are terminated. The Chair’s appointment may be terminated on 12 months’ notice.Executive Directors’
Non-Executive
directorshipsNeither of the current Executive Directors, Andy Bird nor Sally Johnson, hold any notable external commitments.
| Annual report and accounts 2022 Pearson plc 107 |
Directors’ remuneration report
continued
Historical performance and remuneration
Total shareholder return performance
Set out below is Pearson’s total shareholder return (TSR) performance, relative to the FTSE
All-Share
index, on an annual basis over the10-year
period 1 January 2013 to 31 December 2022. We chose this comparison because the FTSEAll-Share
represents the broad market index within which Pearson shares are traded. TSR is a measure of returns a company provides for shareholders, reflecting share price movements and assuming reinvestment of dividends.Alongside this a summary of the single figure of total remuneration for the Chief Executive over the last 10 years is provided, and a summary of the variable pay outcomes relative to the prevailing maximum at the time.
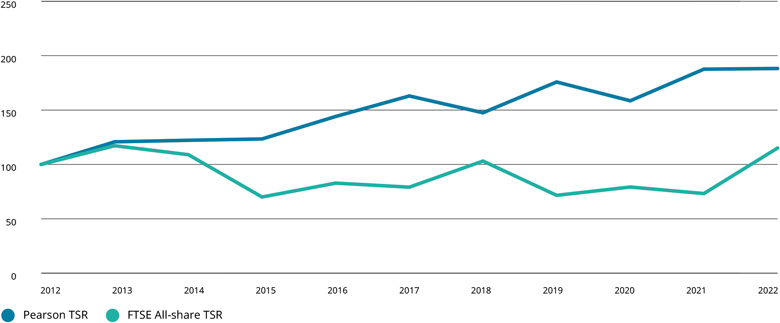
Source: Refinitiv Datastream
| John Fallon | Andy Bird | |||||||||||||||||||||||||||||||||||||||||||||
| 2013 | 2014 | 2015 | 2016 | 2017 | 2018 | 2019 | 2020 | 2020 | 2021 | 2022 | ||||||||||||||||||||||||||||||||||||
| Total remuneration (single figure, £000s) | 1,727 | 1,895 | 1,263 | 1,518 | 1,758 | 3,094 | 1,616 | 855 | 334 | 5,167 | 6,856 | |||||||||||||||||||||||||||||||||||
| Annual incentive (% of maximum) | 34% | 51% | Nil | 24% | 44% | 45% | Nil | Nil | N/A | 63% | 76% | |||||||||||||||||||||||||||||||||||
| Long-term incentive (% of maximum) | Nil | Nil | Nil | Nil | Nil | 42% | 33% | Nil | N/A | N/A | N/A | |||||||||||||||||||||||||||||||||||
Note 1: Total remuneration is as reflected in the single total figure of remuneration table. The 2021 and 2022 figures for Andy Bird include vesting of the first and second tranches of the
co-investment
award.Note 2: Annual incentive is the actual annual incentive received by the incumbent as a percentage of maximum opportunity.
Note 3: Long-term incentive is the payout of performance-related share awards where the year shown is the final year of the performance period for the purposes of calculating the single total figure of remuneration.
Note 4: The single figure remuneration for 2022 Andy Bird has been converted using a USD:GBP exchange rate of 1.2371 (average exchange rate for 2022.)
108 Pearson plc |
Comparative information
The following information provides additional context regarding Directors’ total remuneration.
Relative percentage change in remuneration of Directors and employees
The following table sets out thepercentage change in base salary/fees, allowances and benefits and annual incentives in respect of all Directors during the year, compared to the average percentage change for all employees of Pearson. The figures for all Directors are calculated based on remuneration received in the relevant year as set out in the tables on page 101 and page 107. For base salary/fees, we have annualised part-year figures for this disclosure. Part-year allowances and benefits are not annualised and are excluded from the table.
year-on-year
While the Committee reviews base pay for the Executive Directors relative to Pearson’s broader employee population, local practices drive our approach to benefits, and we determine eligibility depending on level and individual circumstances, which do not lend themselves to comparison.
2022 | 2021 | 2020 | ||||||||||||||||||||||||||||||||||
Base salary/fees | Allowances and benefits | Annual Incentives | Base salary/fees | Allowances and benefits | Annual Incentives | Base salary/fees | Allowances and benefits | Annual Incentives | ||||||||||||||||||||||||||||
Average employee 1 | 4% | 8% | 16% | 4% | 17% | 38% | 1% | 6% | 9% | |||||||||||||||||||||||||||
Executive Directors | ||||||||||||||||||||||||||||||||||||
| Andy Bird | 0% | 20% | 21% | 0% | – | – | – | – | – | |||||||||||||||||||||||||||
| Sally Johnson | 2.5% | 0% | 24% | 1% | – | – | – | – | – | |||||||||||||||||||||||||||
Chair and Non-Executive Directors1 | ||||||||||||||||||||||||||||||||||||
| Omid Kordestani | – | – | – | – | – | – | – | – | – | |||||||||||||||||||||||||||
| Sidney Taurel | 0% | – | – | 0% | – | – | 0% | 95% | – | |||||||||||||||||||||||||||
| Tim Score | 25% 2 | – | – | 13% | – | – | 0% | -20% | – | |||||||||||||||||||||||||||
| Sherry Coutu CBE | 9% | – | – | 5% | – | – | 5% | – | – | |||||||||||||||||||||||||||
| Esther Lee | – | – | – | – | – | – | – | – | – | |||||||||||||||||||||||||||
| Linda Lorimer | 0% | – | – | 1% | – | – | 1% | 102% | – | |||||||||||||||||||||||||||
| Graeme Pitkethly | 5% | – | – | 1% | – | – | 8% | – | – | |||||||||||||||||||||||||||
| Annette Thomas | 7% | – | – | – | – | – | – | – | – | |||||||||||||||||||||||||||
| Lincoln Wallen | 0% | – | – | 1% | – | – | 1% | -97% | – | |||||||||||||||||||||||||||
Note 1: Changes in NED fees during the year are a result of changes in Committee Chairs and membership.
Note 2: Increase due to Tim Score taking over as Deputy Chair in April 2022
Note 3: The Chair and
Non-Executive
Directors did not receive any benefits in respect of 2021, and therefore it is not possible to calculate the relative change for 2022Relative importance of pay spend
The Committee considers Directors’ remuneration in the context of the company’s allocation and disbursement of resources to different stakeholders. Adjusted operating profit measures Pearson’s ability to reinvest, and dividends are an important element of our return to shareholders.
| Headline change | ||||||||||||||||
| All figures in £ | 2022 | 2021 | £ | % | ||||||||||||
| Adjusted operating profit | 456 | 385 | 71 | 18% | ||||||||||||
| Dividend per share | 21.5p | 20.5p | 1p | 5% | ||||||||||||
| Share buybacks | 353 | Nil | - | - | ||||||||||||
| Total wages and salaries | 1,382 | 1,180 | 202 | 17% | ||||||||||||
Note 1: Adjusted operating profit is as set out in the financial statements.
Note 2: The Board approved a £350m share buyback programme in February 2022.
Note 3: Wages and salaries include continuing operations only and include Directors.
Chief Executive to employee pay ratio
The table below illustrates the ratio of Chief Executive to employee pay for 2022. We use the single total figure of remuneration (as disclosed on page 101), compared to the full-time equivalent total reward of employees whose pay is ranked at the 25
th
, 50th
and 75th
percentiles (as identified by the gender pay gap methodology) in Great Britain’s (GB) workforce.| Chief Executive pay ratio | ||||||||||||||
| Year | Method | 25 th percentile | 50 th percentile | 75 th percentile | ||||||||||
2022 | B: Gender pay gap methodology | 214.3 | 181.3 | 117.2 | ||||||||||
| 2021 | B: Gender pay gap methodology | 150.1 | 145.0 | 88.4 | ||||||||||
| 2020 | B: Gender pay gap methodology | 42.5 | 31.9 | 19.5 | ||||||||||
| 2019 | B: Gender pay gap methodology | 65.9 | 47.2 | 36.0 | ||||||||||
| — | We used GB gender pay gap data from April 2022 to identify employees at the 25 th , 50th and 75th percentiles, and analysed data for employees around each quartile figure to ensure there were no anomalies |
| Annual report and accounts 2022 Pearson plc 109 |
Directors’ remuneration report
continued
| — | Using the gender pay gap data to identify the quartile employees gives a general representation of the relevant employee population at the year end, and is the most practicable methodology given the timing of the disclosure and determination of remuneration outcomes for the wider workforce. |
| — | We compared total remuneration for each employee, calculated with reference to 31 December 2022, compared to the Chief Executive’s single figure (this was converted using a USD:GBP exchange rate of 1.2371 – the average exchange rate for 2022). |
| — | For the quartile employees, we calculated total remuneration on a similar basis to the Chief Executive’s single figure. We based base salary, pension and benefits on full-year figures taken from payroll. Annual bonus figures are based on the relevant manager recommendations and relate to performance in 2022. None of the employees at the 25 th , 50th or 75th percentile had share awards vesting in 2022. |
| — | Total remuneration figures for the 25 th , 50th and 75th percentile employees are: £31,998, £37,822 and £58,525. The respective base salaries are: £29,500, £30,257 and £50,078. |
| — | A significant proportion of the Chief Executive’s pay is linked to performance and, in respect of the LTIP and co-investment award, share price performance. Therefore, the Chief Executive’s pay can vary significantlyyear-on-year, |
| — | The increase in this year’s pay ratio is a result of a higher payout under the AIP for the Chief Executive (76% of maximum compared to 63% of maximum last year) as well as the strong share price performance over the last year which has resulted in a higher valuation of the vesting of the second tranche of the co-investment award. |
| — | The median pay ratio is consistent with our wider policies on employee pay, reward and progression. The Committee is focused on ensuring that remuneration for all Pearson colleagues reflects our need to attract and retain the right talent for our digital future. |
Dilution and use of equity
We can use existing shares bought in the market, treasury shares or newly issued shares, to satisfy awards under our various share plans. For restricted stock awards under the LTIP, we would expect to use market-purchased shares. There are limits on the amount of
new-issue
equity we can use. In any rolling10-year
period, no more than 10% of Pearson equity will be issued, or be capable of being issued, under all Pearson’s share plans, and no more than 5% of Pearson equity will be issued, or be capable of being issued, under Executive or discretionary plans. The headroom available for all Pearson plans, Executive or discretionary, and shares held in trust is as follows:| Headroom | 2022 | |||
| All Pearson plans | 7.60% | |||
| Executive or discretionary plans | 4.70% | |||
| Shares held in trust | 4.70% | |||
The Remuneration Committee in 2022
Role | Name | Title | ||
| Chair | Sherry Coutu CBE | Independent | ||
Non-Executive | ||||
| Director | ||||
| Members | Esther Lee | Independent | ||
Non-Executive | ||||
| Director | ||||
| Tim Score | Deputy Chair | |||
| Annette Thomas | Independent | |||
Non-Executive | ||||
| Director | ||||
| Sidney Taurel (until | Chair | |||
| 29 April 2022) | ||||
| Internal attendees | Omid Kordestani | Chair | ||
| Andy Bird | Chief Executive | |||
| Sally Johnson | Chief Financial Officer | |||
| Ali Bebo | Chief Human | |||
| Resources Officer | ||||
| Paul Christian | Senior Vice President, | |||
| Reward | ||||
| Graeme Baldwin | Company Secretary | |||
| External advisers | Deloitte LLP | |||
Advisers to the Remuneration Committee
During 2022, the Remuneration Committee received advice from Deloitte LLP, our independent Remuneration Committee advisers.
Deloitte LLP was appointed by the Committee in July 2017, following a competitive tender process. It advises the Committee on market trends and developments, incentive plan design and target setting, investor engagement and other general executive remuneration matters. For provision of these services in 2022, Deloitte LLP were paid fees of £260,150, based on time spent. During the year, separate teams at Deloitte LLP also provided Pearson with certain tax and other advisory and consultancy services.
Deloitte LLP is a founding member of the Remuneration Consultants’ Group and adheres to its Code of Conduct.
The Committee is satisfied that Deloitte LLP’s advice was objective and independent, and that the provision of other services in no way compromised its independence. The Committee believes that the Deloitte LLP engagement partner and team that provides remuneration advice to the Committee does not have any connections with Pearson or its Directors that may impair its independence. The Committee reviewed the potential for conflicts of interest and believes there are appropriate safeguards against such conflicts.
Terms of reference
The Committee’s full charter and terms of reference are available on the Governance page of our website. A summary of the Committee’s responsibilities is below.
The terms of reference reflect the provisions of the 2018 Code.
Committee responsibilities
Determine and review policy
Determine and regularly review the remuneration policies for the Executive Directors, Presidents, and other members of Pearson’s Executive Management who report directly to the Chief Executive. These policies include base salary, annual and long-term incentives, pension arrangements, any other benefits, and termination of employment. When setting remuneration policy, the Committee considers remuneration practices and related policies for all employees
110 Pearson plc |
Shareholder engagement
Ensure Pearson engages with its shareholders and shareholder representative bodies on the remuneration policy and its implementation
Review and approve implementation
Regularly review the implementation and operation of the remuneration policy, and approve the individual remuneration and benefits packages of Pearson’s Executive Management team, including Executive Directors
Approve performance-related plans
Approve the design of, and determine targets for, any performance-related pay plans operated by the Group for Pearson’s Executive Management team, and approve total payments to be made under such plans
Set termination arrangements
Advise and decide on general and specific remuneration arrangements in connection with the termination of employment of Pearson’s Executive Management team, including Executive Directors
Determine Chair’s remuneration
Delegate responsibility for determining the Chair’s remuneration and benefits package
Appoint remuneration consultants
Appoint and set the terms of engagement for any remuneration consultants who advise the Committee, and monitor the cost of such advice
Talent, retention, and gender pay gap
Review updates from management on talent, retention and gender pay gap
Workforce remuneration
Have oversight of workforce remuneration, policies, and practice for the wider organisation
Remuneration Committee meeting focus during 2022
During the year the Committee undertook the following activities:
| — | Reviewed and approved annual and long-term performance and payouts to Executive Directors and senior management for 2021 |
| — | Reviewed and approved incentive arrangements for Pearson, and how these will apply to Executive Directors and senior management in 2022 |
| — | Reviewed the Directors’ remuneration policy and its implementation ahead of its renewal at the 2023 AGM |
| — | Engaged extensively with shareholders following the 2022 AGM and in respect of the Directors’ remuneration policy review. Reviewed and considered all feedback and considered ongoing shareholder engagement strategy |
| — | Approved remuneration arrangements for new senior management appointments |
| — | Received updates on Pearson’s financial performance and progress against strategic measures. Noted and reviewed the status of in-flight incentives |
| — | Received updates on pay and conditions across Pearson, and took these into account when determining executive remuneration |
| — | Noted updates on corporate governance, including a review of the 2022 AGM remuneration reporting season, and anticipated areas of focus in 2023 |
| — | Reviewed Pearson’s gender and ethnicity pay gap disclosures and noted actions to address the respective gaps |
| — | Noted the activity of the Standing Committee on operating Pearson’s equity-based reward programmes and noted Pearson’s use of equity for employee share plans |
Committee evaluation
Annually, the Committee reviews its performance, constitution, charter, and terms of reference to ensure it is operating at maximum effectiveness, and recommends any changes it considers necessary to the Board for approval. Overall, following its review in 2022, it was considered that the Committee is operating effectively with high levels of discussion and questioning. New members of the Committee brought a different perspective and enhanced visibility of matters that extend across the different Board Committees.
In 2023, the Committee will continue to focus on ensuring remuneration arrangements for senior management and the wider workforce continue to support the attraction and retention of key talent as well as the delivery of Pearson’s strategy. The Committee continually assesses how its activities support and enable Pearson’s progress.
Voting on remuneration resolutions
The following table summarises votes cast for remuneration resolutions:
Votes cast for | % of votes cast for | Votes cast against | % of votes cast against | Votes withheld | ||||||||||||||||
| Annual report on Remuneration (2022 AGM) | 462,488,192 | 76.53% | 141,832,706 | 23.47% | 3,136,939 | |||||||||||||||
| 2020 Remuneration Policy (2020 AGM) | 586,460,258 | 95.12% | 30,106,736 | 4.88% | 219,641 | |||||||||||||||
| Amendment to 2020 Remuneration Policy (2020 GM) | 417,060,992 | 67.22% | 203,423,538 | 32.78% | 370,074 | |||||||||||||||
| Annual report and accounts 2022 Pearson plc 111 |
Directors’ remuneration report
continued
2023 Directors’ remuneration policy
The Remuneration Committee presents the 2023 Directors’ remuneration policy (2023 policy), which will be put to shareholders for binding vote at the AGM to be held on 28 April 2023. Subject to shareholder approval, the effective date of this policy will be 28 April 2023. However, it is proposed, subject to approval at the AGM, that changes to Executive Director incentives be made effective from the start of the 2023 performance periods. The intention of the Committee is that the policy will remain in place for three years from the date of its approval.
Review of the Directors’ remuneration policy
In determining the 2023 policy, the Committee followed a robust process which included discussions on the content of the policy at Remuneration Committee meetings throughout 2022 and in early 2023. The Committee considered the input of management and its independent advisors, while taking steps to ensure any conflicts of interest were appropriately managed. The Committee also sought the views of Pearson’s major shareholders and their advisors, considering all feedback received during the extensive shareholder engagement exercise when finalising the 2023 policy. Further information on the Committee’s decision-making process is set out in the remuneration report.
Changes to policy
The key changes to this 2023 policy compared to the 2020 policy are summarised below:
| — | Increase in the maximum opportunity under the Annual Incentive Plan to 300% of base salary. |
| — | Increase in the maximum opportunity under the Long-Term Incentive Plan to 450% of salary. |
| — | Increase in proportion of the Annual Incentive Plan that is payable for threshold performance to up to 25% of the maximum opportunity. |
| — | Introduction of deferral under the Annual Incentive Plan where an Executive Director has not met their shareholding guideline. |
| — | Changes to allow for the introduction of strategic measures, e.g. an ESG measure, into the long-term incentive performance framework. |
| — | Increase in shareholding guidelines. |
Other minor changes have been made to the drafting of the policy to simplify and aid its operation and to increase clarity.
Policy table for Executive Directors
Total remuneration is made up of fixed and performance-linked elements, with each element supporting different strategic objectives. Remuneration is normally reviewed annually in the context of business performance and conditions prevailing, taking into account pay levels for similar positions in comparable companies as well as internal ratios.
Base salary
Purpose and link to strategy
| — | Helps to recruit, reward and retain. |
| — | Reflects level, role, skills, experience, the competitive market and individual contribution. |
Operation | Opportunity | Performance conditions and period | ||
Base salaries are set to provide the appropriate rate of remuneration for the job, taking into account relevant recruitment markets, business sectors and geographic regions. Base salaries are normally reviewed annually taking into account: general economic and market conditions; the level of increases made across the company as a whole; particular circumstances such as changes in role, responsibilities or organisation; the remuneration and level of increases for executives in similar positions in comparable companies in both the UK, US and internationally; and individual performance. | While there is no maximum salary level or maximum increase that may be offered, salary increases will normally be in line with typical increases awarded to other employees in the Group. However, increases may be above this level, for example, in circumstances including but not limited to: — Where a new Executive Director has been appointed to the Board at a lower than typical market salary to allow for growth in the role then larger increases may be awarded to move salary positioning closer to typical market level as the Executive Director gains experience. — Where an Executive Director has been promoted or has had a change in responsibilities. — Where there has been a significant change in market practice or where there has been a significant change in the size and/or scope of the business | None, although performance of both the company and the individual are taken into account when determining an appropriate level of base salary increase each year. | ||
112 Pearson plc |
Allowances and benefits
Purpose and link to strategy
| — | Help to recruit, reward and retain. |
| — | Reflect local competitive market. |
Operation | Opportunity | Performance conditions and period | ||
Allowances and benefits comprise cash allowances and non-cash benefits which may include:— travel-related benefits (such as car allowance, company car and private use of a driver) — health-related benefits (such as healthcare, health assessment and gym subsidy) and — risk benefits (such as additional life cover and long-term disability insurance that are not covered by the company’s retirement plans). Executive Directors are also eligible to participate in savings-related share acquisition programmes, which are not subject to any performance conditions, on the same terms and to the same value as other employees. Where an Executive Director is required to relocate to perform their role, appropriate one-off or ongoing expatriate/relocation benefits may be provided (e.g., housing, schooling, etc.).The Committee may introduce other benefits if it is considered appropriate to do so, taking into account the individual circumstances, the country of residence of a Director, the benefits available to all employees and the wider external market. | The cost of the provision of allowances and benefits varies from year to year depending on the cost to Pearson and there is no prescribed maximum limit. However, the Committee monitors annually the overall cost of the benefits provided, to ensure that it remains appropriate. | Not applicable | ||
Retirement benefits
Purpose and link to strategy
| — | Help to recruit, reward and retain. |
| — | Recognise long-term commitment to the company. |
Operation | Opportunity | Performance conditions and period | ||
Employees in the UK are eligible to join the Money Purchase 2003 section of the Pearson Pension Plan. Executive Directors are eligible to join this plan or receive a cash allowance of equivalent value. UK Executive Directors who are, or become, affected by the lifetime allowance may be provided with appropriate benefits, as an alternative to further accrual of pension benefits such as a cash supplement, in line with the treatment for the employee population. If any Executive Director is from, or works, outside the UK, the Committee retains a discretion to put in place retirement benefit arrangements for that Director in line with local market practice including defined benefit pension arrangements operated by Pearson locally. The maximum value of such arrangement will reflect local market practice at the relevant time. The Committee may also honour all pre-existing retirement benefit obligations, commitments or other entitlements that were entered into by a member of the Pearson Group before that person became a Director, such as participation in the Final Pay section of the Pearson Pension Plan which is now closed to new members. | Executive Directors are eligible to receive pension contributions or a cash allowance in line with the maximum company contribution as a percentage of salary that UK employees of a similar age are eligible to receive. For UK employees who are over 45, this is currently 16% of base salary. Current Chief Executive Officer: Andy Bird receives a payment in lieu of pension at 16% of base salary in line with the pension provision for UK employees of a similar age. Current Chief Financial Officer: Sally Johnson is a member of the Final Pay section of the Pearson Pension Plan which she joined prior to becoming an Executive Director. Her pension accrual rate is 1/60 th of pensionable salary per annum, restricted to the Plan earnings cap.Sally Johnson has reached the lifetime allowance, and therefore now receives a payment in lieu of pension at 16% of base salary in line with the pension provision for UK employees of a similar age. | Not applicable | ||
| Annual report and accounts 2022 Pearson plc 113 |
Directors’ remuneration report
continued
Annual incentive plan
Purpose and link to strategy
| — | Help to recruit, reward and retain. |
| — | Motivate the achievement of annual business goals and strategic objectives. |
| — | Provide a focus on key financial and non-financial metrics. |
| — | Reward individual contribution to the success of the company. |
| — | Align to strategy execution priorities. |
Operation | Opportunity | Performance conditions and period | ||
Measures and performance targets are typically set by the Committee at the start of the year with payment usually made after year end following the Committee’s assessment of performance relative to targets. Annual incentive plans are discretionary. The Committee reserves the right to adjust payments up or down if it believes that the outcome does not reflect underlying financial or non-financial performance or if such other exceptional factors warrant doing so.Where an Executive Director has not met their shareholding guideline, normally a third of any payment would be deferred into Pearson shares for a period of two years. Participants may receive additional shares representing the gross value of dividends that would have been paid on shares that vest during the vesting period. The Committee may apply malus and/or clawback for a period of five years in certain circumstances, such as financial misstatement, individual misconduct or reputational damage to the company. | Annual incentives will not exceed 300% of base salary. For 2023, the individual maximum incentive opportunity that will apply for the Chief Executive Officer is 300% of base salary and for the Chief Financial Officer is 200% of base salary. The proportion of the award that is payable for threshold performance may be up to 25% of the maximum opportunity. 50% of the maximum opportunity is payable for on-target levels of performance. | The Committee has the discretion to select the performance measures and relative weightings from year to year to ensure continuing alignment with strategy and to ensure targets are sufficiently stretching. The Committee sets performance targets for each measure annually. Annual incentives will normally be based on financial and strategic performance targets. Financial metrics will normally account for at least 75% of the total annual opportunity with the remaining portion normally being based on strategic and/or performance against personal objectives. The Committee would intend to consult with shareholders in advance if there was to be a significant change in the weighting of financial and strategic measures. The plan is designed to incentivise and reward underlying performance. Actual results may be adjusted to remove the effect of foreign exchange and portfolio changes (acquisitions and disposals) and other relevant factors that the Committee considers do not reflect the underlying performance of the business in the performance year. Details of performance measures, weightings and targets will be disclosed in the annual remuneration report for the relevant financial year if and to the extent that the Committee deems them not to be commercially sensitive. The performance period is one year. | ||
114 Pearson plc |
Long-term incentive plan
Purpose and link to strategy
| — | Help to recruit, reward and retain. |
| — | Drive long-term earnings, share price growth and value creation. |
| — | Align the interests of executives and shareholders. |
| — | Encourage long-term shareholding and commitment to the company. |
Operation | Opportunity | Performance conditions and period | ||
Awards of shares are made on an annual basis, which vest on a sliding scale based on performance against stretching performance targets measured at the end of the three-year performance period. Awards are normally subject to a post-vesting holding period (on an after tax basis) for two years following the end of the performance period. Participants may receive additional shares representing the gross value of dividends that would have been paid on shares that vest during the performance period. The Committee reserves the right to adjust the vesting outcome up or down before they are released if it believes that this does not reflect underlying financial or non-financial performance or if such other exceptional factors warrant doing so. In making such adjustments, the Committee is guided by the principle of aligning shareholder and management interests.The Committee may apply malus and/or clawback for a period of five years in certain circumstances, such as financial misstatement, individual misconduct or reputational damage to the company. | The maximum award is 450% of base salary in respect of a financial year. | The Committee will determine the performance measures, weightings and targets governing an award of shares prior to grant to ensure continuing alignment with strategy and to ensure that targets are sufficiently stretching. The Committee establishes a threshold below which no payout is achieved and a maximum at or above which the award pays out in full. The proportion of the award that vests at threshold may be up to 25% of the maximum opportunity. Awards will normally be subject to the achievement of financial targets (e.g., earnings per share and a return measure), shareholder returns (e.g., relative total shareholder return) and strategic objectives (e.g., an environmental, social and/or governance measure). Where strategic objectives are incorporated, financial targets and/or shareholder returns will comprise the majority of the award. The Committee may determine that different measures or weightings may apply for future awards; however, the Committee would intend to consult with shareholders in advance if there was to be a significant change in the weighting of measures or the performance measures used. The performance period is three years. | ||
Shareholding guidelines
Purpose and link to strategy
| — | Align the interests of Executives and shareholders and encourage long-term shareholding and commitment to the company. |
Operation | Opportunity | Performance conditions and period | ||
Executive Directors are expected to build up a shareholding in the company. Executive Directors are expected to reach the guideline within five years from the date of appointment. Post-employment shareholding: Executive Directors are expected to retain their shareholding guideline (or actual holding if lower) for two years following stepping down as an Executive Director. This provision does not apply to any shares purchased by the Executive Director. | The target holding is currently 450% of base salary for the Chief Executive Officer and 300% of base salary for other Executive Directors. | Not applicable | ||
| Annual report and accounts 2022 Pearson plc 115 |
Directors’ remuneration report
continued
Notes to the policy table
Selection of performance measures and target setting
In the selection and weighting of performance measures for the annual and long-term incentive awards, the Committee takes into account Pearson’s strategic objectives and short and long-term business priorities.
Annual incentive plan | For 2023, the Committee identified sales, adjusted operating profit, free cash flow and key strategic measures as being relevant measures of Pearson’s performance against its shorter-term strategic objectives and business priorities. Further details on how these performance measures align to Pearson’s strategy are set out in the remuneration report. | |
Long-term incentive plan | For 2023 LTIP awards, the Committee has judged the following to be most closely matched to sustained delivery of strategy and alignment with shareholders’ interests: — Adjusted earnings per share (30%) — Return on capital (30%) — Relative total shareholder return (30%) — An Environmental, Social and Governance measure (10%) | |
Performance targets are set to provide a careful balance between upside opportunity and downside risk and are normally set in accordance with the company’s operating and strategic plans, while also considering analyst consensus to reflect market expectations.
Pre-existing
commitmentsThe Committee reserves the right to make remuneration payments and payments for loss of office (which includes exercising related discretions) that are not in line with this policy if the terms of the payment were agreed:
| — | before the policy came into effect, if the payment was agreed or made in line with the policy in force at the time or was otherwise approved by shareholders; and |
| — | at a time when the recipient was not subject to the policy, provided the Committee does not consider the payment to have been made in consideration of the recipient becoming subject to the policy. |
For these purposes ‘payment’ means any payment that would otherwise be subject to the policy and, in relation to a share award, will not be considered to have been ‘agreed’ any later than the date of grant.
Remuneration policy for other employees
Pearson has a set of remuneration principles that govern pay for the whole organisation, although how these principles are applied varies by business need, level and geography as required. The key difference in remuneration for Executive Directors compared to the approach to remuneration across the workforce is that remuneration for Executive Directors is more heavily weighted towards variable pay and linked to the delivery of Pearson’s strategic objectives and short and long-term business priorities.
Further details on remuneration across the workforce at Pearson are set out in the remuneration report on page 100.
Pay and performance scenario analysis
The charts below illustrate what each Executive Director could expect to receive under the 2023 policy in different performance scenarios. The relative weighting of fixed and performance-related remuneration and the absolute size of the remuneration packages for the Chief Executive Officer and the Chief Financial Officer is shown. Consistent with its policy, the Committee places considerable emphasis on the performance-linked elements (the annual and long-term incentives) and will continue to review the mix of fixed and performance-linked remuneration on an annual basis.
Chief Executive (Andy Bird) $000 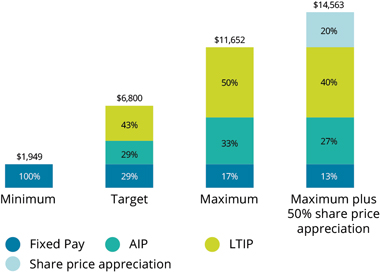 | Chief Financial Officer (Sally Johnson) £000 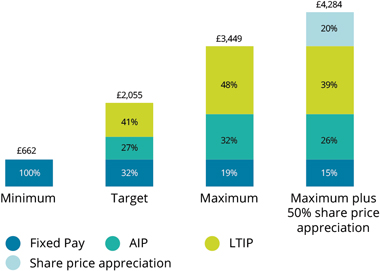 |
116 Pearson plc |
Performance scenario | Elements of remuneration and assumptions | |
Maximum plus 50% share price appreciation | — Fixed pay — Maximum individual annual incentive (300% of base salary for Chief Executive and 200% of salary for Chief Financial Officer) — Maximum value of 2023 LTIP award (450% for Chief Executive and 300% of salary for Chief Financial Officer) with 50% share price growth assumed | |
Maximum | — Fixed pay — Maximum individual annual incentive (300% of base salary for Chief Executive and 200% of salary for Chief Financial Officer) — Maximum value of 2023 LTIP award (450% for Chief Executive and 300% of salary for Chief Financial Officer) with no share price growth assumed | |
Target | — Fixed pay — 50% of the maximum individual annual incentive — 50% of the maximum value of 2023 long-term incentive award with no share price growth assumed | |
Minimum | — Fixed pay only | |
Note 1: Fixed pay includes 2023 base salary ($1,293,750 for the Chief Executive and £557,225 for the Chief Financial Officer); allowances and benefits are the actual amounts incurred in the 2022 financial year. Retirement benefits for both Executive Directors are included at 16% of their base salary.
Note 2: The value of long-term incentives does not take into account dividend awards that are payable on the release of LTIP shares.
Recruitment
The Committee expects any new Executive Directors to be engaged on the same terms and to be awarded variable remuneration within the same normal limits and subject to the same conditions as for the current Executive Directors outlined in the policy.
The maximum level of variable remuneration which may be awarded (excluding any ‘buyout’ awards) in respect of recruitment is 750% of salary, which is in line with the current maximum limits under the annual and long-term incentive.
In setting the basic salary for any new Executive Director, the Committee will apply a level appropriate to recruit a suitable candidate, having regard to the factors set out in the policy table.
The Committee recognises that it cannot always predict accurately the circumstances in which any new Directors may be recruited. The Committee may determine that it is in the interests of the company and shareholders to secure the services of a particular individual which may require the Committee to take account of the terms of that individual’s existing employment and/or their personal circumstances. The Committee may do this in the following circumstances:
| — | Where an individual is relocating in order to take up the role, in which case the company may provide certain benefits such as reasonable relocation expenses, accommodation and assistance with visa applications or other immigration issues and ongoing arrangements such as tax equalisation, annual flights home, schooling and housing allowance. |
| — | Where an individual is required to forego compensation to take up the appointment or forfeits outstanding variable pay opportunities or contractual rights at a previous employer as a result of appointment, the Committee may offer compensatory payments or awards, in such form as the Committee considers appropriate taking into account all relevant factors including where applicable the form of compensation or awards, expected value and vesting time-frame of forfeited opportunities. The Committee would require reasonable evidence of the nature and value of any foregone or forfeited amounts and would, to the extent practicable, ensure any compensation was provided on a like-for-like |
| — | Where an individual incurs legal or other professional fees in connection with their appointment as an Executive Director, the Committee retains the discretion to compensate for these. |
In making any decision on any aspect of the remuneration package for a new recruit, the Committee would balance shareholder expectations, current best practice and the requirements of any new recruit and would strive not to pay more than is necessary to achieve the recruitment. The Committee would give full details of the
terms of the package of any new recruit in the next annual remuneration report.
Where an existing employee of the company is promoted to the Board, the company may honour all existing contractual commitments including any outstanding share awards and benefits, including retirement benefits.
Pearson expects any new Chair or
Non-Executive
Director to be engaged on terms that are consistent with the general remuneration principles outlined in the relevant sections of this Policy.Service contracts and termination provisions
In accordance with long established policy, all Executive Directors have service agreements under which, other than by termination in accordance with the terms of these agreements, employment continues indefinitely.
There are no special provisions for notice or
non-share-based
compensation in the event of a change of control of Pearson.The Chair and other
Non-Executive
Directors serve under letters of appointment.It is the company’s policy that the company may terminate the Chair’s letter of appointment and the Executive Directors’ service agreements by giving no more than 12 months’ notice. Other
Non-Executive
Directors letters of appointment do not contain provision for notice periods or compensation if their appointments are terminated.Payment in lieu of notice
As an alternative, for Executive Directors the company may at its discretion pay in lieu of that notice. Payment in lieu of notice may be made in equal monthly instalments from the date of termination to the end of any unexpired notice period. Payment in lieu of notice in instalments may also be subject to mitigation and reduced taking into account earnings from alternative employment.
For Executive Directors, payment in lieu of notice comprises 100% of the annual salary at the date of termination and the annual cost to the company of providing pension and all other benefits. For the Chair, payment in lieu of notice comprises 100% of the annual fees at the date of termination.
The company may, depending on the circumstances of the termination, determine that it will not pay the Director in lieu of notice and may instead terminate a Director’s contract in breach and make a damages payment, taking into account as appropriate the Director’s ability to mitigate his or her loss.
| Annual report and accounts 2022 Pearson plc 117 |
Directors’ remuneration report
continued
The company may also pay an amount considered to be reasonable by the Remuneration Committee in respect of fees for legal and tax advice and outplacement support for the departing Director. The Committee reserves the right to make any other payments in connection with a Director’s cessation of office or employment where the payments are made in good faith, in discharge of an existing legal obligation (or by way of damages for breach of such an obligation) or by way of settlement of any claim arising in connection with the cessation of a Director’s office or employment.
Share awards
On cessation of employment, treatment of unvested shares awards will be determined based on the rules of Pearson’s share plans.
In respect of unvested deferred annual incentive awards, these will ordinarily subsist, except in circumstances where an individual is summarily dismissed. Awards would ordinarily vest on the original vesting date/be released in line with normal time horizons unless determined otherwise by the Committee.
In respect of unvested long-term incentive awards, unless otherwise provided for under the rules of Pearson’s discretionary share plans, Executive Directors’ entitlements would lapse automatically. In the case of death, injury, disability,
ill-health
or redundancy (as determined by the Committee), where a participant’s employing business ceases to be part of Pearson, or any other reason if the Committee so decides in its absolute discretion:| — | awards will stay in force as if the participant had not ceased employment and shall ordinarily vest on the original vesting date/be released in line with normal time horizons subject to performance conditions. |
| — | the number of shares that are released shall be pro-rated for the period of the participant’s service in the vesting period (although the Committee may in its absolute discretion waive or vary thepro-rating). |
In determining whether and how to exercise its discretion under Pearson’s discretionary share plans, the Committee will have regard to all relevant circumstances distinguishing between different types of leaver, the circumstances at the time the award was originally made, the Director’s performance and the circumstances in which the Director left employment.
The rules of Pearson’s discretionary share plans also make provision for the treatment of awards in respect of corporate activity, including a change of control of Pearson. The Committee would act in accordance with the terms of the awards in these circumstances, which includes terms as to the assessment of performance conditions and time apportionment.
Annual bonus
On cessation of employment, Executive Directors may, at the Committee’s discretion, retain entitlement to a pro rata annual incentive for their period of service in the financial year prior to their leaving date. Such payout will normally be calculated in good faith on the same terms and paid at the same time as for continuing Executive Directors.
Other elements of remuneration
Eligibility for allowances and benefits including retirement benefits (other than pension payments in connection with subsequent retirement) normally ceases on retirement or on the termination of employment for any other reason.
The termination provisions described above may be varied to the extent necessary to comply with applicable laws, including taxation laws in the United States.
Individual service agreements and letters of appointment
Details of each individual’s arrangement are outlined in the table below. Employment agreements for other employees are determined according to local labour law and market practice.
Position | Date of letter / agreement | Notice period | Compensation on termination of employment by the company without notice or cause | |||
| Chair | Omid Kordestani, 16 December 2021 | 12 months from the Director; 12 months from the company | Payment in lieu of notice of 100% of annual fees at the date of termination | |||
Executive Directors | Andy Bird, 23 August 2020 Sally Johnson, 15 January 2020 | 6 months from the Director; 12 months from the company | Payment in lieu of notice of 100% of annual salary at the date of termination and the annual cost of pension and all other benefits | |||
Note 1: Under payment in lieu of notice, the annual cost of pension for Executive Directors is normally calculated as the sum, where applicable, of: an amount equal to the company’s cost of providing the Executive’s pension under the pension plan based on the Future Service Company Contribution Rate for the relevant section of the pension plan as stated in the most recent actuarial valuation (as at the date of termination of employment) as limited by the earnings cap; and any cash allowance in lieu of pension or to take account of the fact that pension benefits and life assurance cover are restricted by the earnings cap.
Executive Directors’
non-Executive
DirectorshipsThe Committee’s policy is that Executive Directors may, by agreement with the Board, serve as
non-executives
of other companies and retain any fees payable for their services.Consideration of employment conditions across Pearson
Under the Committee’s charter and terms of reference, the Committee’s remit includes determining remuneration for the Chief Executive Officer, other Executive Directors and other members of the Pearson Executive Management team. In addition, the Committee’s remit includes oversight of certain remuneration matters below this level and review of remuneration policies and practices across the broader employee population.
When determining remuneration for Executive Directors and other members of the Pearson Executive Management team, the Committee considers reports from the Chief Executive and Chief Human Resources Officer on pay and conditions for the broader employee population, including information on the recruitment and retention of talent, general pay trends in the market and the level of pay increases and incentives across the company as a whole. This helps to ensure that remuneration for senior management is considered in the context of the wider organisation.
There are a number of established channels for consulting with employees and employee representative bodies – including trade unions and works councils in some jurisdictions – about the company’s strategy, competitiveness and performance of the business and other matters affecting employees. The views of employees are also sought via the Employee Engagement Network, feedback from which is reported to the Board, and engagement surveys. These activities provide employees with the opportunity to express how they feel about working for Pearson, what they think about the work they do, the opportunities they have and the rewards (including pay and benefits) they get.
The Committee has not consulted directly with employees on the development of the Directors’ remuneration policy.
118 Pearson plc |
Consideration of shareholder views
The company consults regularly with shareholders on all matters affecting its strategy and business operations. This includes executive remuneration. Over the last year, whilst developing the 2023 policy and considering its implementation, the Remuneration Committee has engaged extensively with shareholders to ensure remuneration for Executive Directors is set appropriately, rewards for performance and aligns management with the shareholder experience.
This engagement exercise included writing to and meeting with many of Pearson’s shareholders and their advisors, to seek their input on
the proposed changes to the policy. We would like to thank our shareholders for the time they have spent with us in this regard. All feedback received, which reflected a significant range of opinions, was duly considered by the Remuneration Committee as it finalised the 2023 policy. Further details on the shareholder engagement exercise can be found in my letter on pages
90-91.
The Committee continues to monitor and respond to best practice guidelines published by shareholders and their representative bodies. Pearson remains committed to an open and transparent dialogue with its shareholders.
Policy table for Chair’s and
Non-Executive
Directors’ remunerationThe table below summarises the policy with respect to remuneration of the Chair and
Non-Executive
Directors.Chair and
Non-Executive
Director remunerationPurpose and link to strategy
| — | To attract and retain high-calibre individuals, with appropriate experience or industry-relevant skills, by offering market competitive fee levels |
Operation | Opportunity | Performance conditions and period | ||
The Chair and Deputy Chair are paid a single fee for all of their responsibilities. The Chair and Deputy Chair fee is set at a level that is competitive considering similar positions in comparable companies. The Non-Executive Directors are paid a basic fee.The Committee Chairs, members of the main Board Committees and, if relevant, the Senior Independent Director are paid an additional fee to reflect their extra responsibilities. Fees for Non-Executive Directors are determined by the full Board having regard to market practice.Additional fees or other payments may be paid to reflect additional responsibilities, roles or contribution, as appropriate. The Chair, Deputy Chair and Non-Executive Directors are not eligible to participate in any annual or long-term incentive, nor are they entitled to any retirement or other employee benefits. Selected benefits may be introduced, if considered appropriate.The company reimburses travel and other business expenses and any tax incurred thereon, if applicable. Normally a minimum of 25% of the Chair’s, Deputy Chair’s and Non-Executive Directors’ basic fee is paid in Pearson shares that they have committed to retain for the period of their directorships. Shares are normally acquired quarterly at the prevailing market price with the individual’safter-tax fee payments. | Fee levels are reviewed on a periodic basis. The total fees payable to the Non-Executive Directors (excluding the Chair) are subject to the limit set out in the Articles of Association of the company (currently £750,000) and as increased by ordinary resolution from time to time. | None. | ||
The Directors’ Remuneration Report was approved by the Board on 15 March 2023 and signed on its behalf by:
Sherry Coutu CBE
Chair of Remuneration Committee
| Annual report and accounts 2022 Pearson plc 119 |
Additional disclosures
Pages
54-124
of this document comprise the Directors’ report for the year ended 31 December 2022.Set out below is other statutory and regulatory information that Pearson is required to disclose in its Directors’ report.
Going Concern
The Directors have confirmed that there are no material uncertainties that cast doubt on the Group’s going concern status and that they have a reasonable expectation that the Group has adequate resources to continue in operational existence beyond 30 June 2024. The consolidated financial statements have therefore been prepared on a going concern basis.
Further details on the procedures undertaken may be found on page 147.
Viability statement
The Board assessed the prospects of the company using the company’s long range plan, together with downside scenarios. Based on the result of these procedures and considering the company’s strong balance sheet, the Directors have a reasonable expectation that Pearson will be able to continue in operation and to meet its liabilities as they fall due over the four-year period ending 31 December 2026. Further details may be found on page 52.
Share capital
Details of share issues and cancellations are given in note 27 to the financial statements on page 191. The company has a single class of shares which is divided into ordinary shares of 25p each. The ordinary shares are in registered form. As at 31 December 2022, 715,733,241 ordinary shares were in issue. At the AGM held on 29 April 2022, the company was authorised, subject to certain conditions, to acquire up to 75,727,045 ordinary shares by market purchase and to issue up to 504,846,968 ordinary shares. Shareholders will be asked to renew these authorities, subject to revised caps, at the AGM on 28 April 2023.
As at 13 March 2023, 2,487 record holders with registered addresses in the United States held 33,286,790 ADRs which represented 4.65% of the company’s outstanding ordinary shares. Some of these ADRs are held by nominees and so these numbers may not accurately represent the number of shares beneficially owned in the United States.
Share buyback
On 25 February 2022, the company announced its intention to commence a share buyback programme during 2022, which was subsequently launched on 4 April 2022 and completed on 7 December 2022. Under the programme, approximately 42.3m shares were bought back and cancelled at a cost of £353m. The nominal value of these shares, approximately £10m, was transferred to the capital redemption reserve. The Board believes that the company’s strategic priorities, combined with the disciplined approach to capital allocation, will enable Pearson to create sustainable, long-term value for every stakeholder.
We have set out clear capital allocation priorities as follows:
| — | Maintaining a strong balance sheet and solid investment-grade credit ratings through an appropriate capital structure |
| — | Focused and disciplined approach to investing in the business to accelerate growth opportunities |
| — | Delivering shareholder returns through a progressive and sustainable dividend policy |
| — | Returning surplus cash to shareholders as and when appropriate through buybacks or special dividends |
Major shareholders
Information provided to the company pursuant to the Financial Conduct Authority’s Disclosure Guidance and Transparency Rules (DTR) is published on a Regulatory Information Service and on the company’s website.
As at 31 December 2022, the company had been notified under DTR 5 of the following holders of significant voting rights in its shares.
Number of voting rights | Percentage as at date of notification | |||||||
| Cevian Capital II GP Limited | 82,952,354 | 11.16% | ||||||
BlackRock, Inc. 1 | 74,503,339 | 10.32% | ||||||
| Ameriprise Financial, Inc. and its group | 41,236,375 | 5.02% | ||||||
| Silchester International Investors LLP | 36,341,993 | <5% | ||||||
| Schroders plc | 36,003,705 | <5% | ||||||
Libyan Investment Authority 2 | 24,431,000 | 3.01% | ||||||
| 1. | Includes 6,864,838 (0.94%) qualifying financial instruments to which voting rights are attached. |
| 2. | Based on notification to the company dated 7 June 2010. We have not been notified of any change to this holding since that date. Assets belonging to, or owned, held or controlled on 16 September 2011 by the Libyan Investment Authority and located outside Libya on that date, are frozen in accordance with The Libya (Sanctions) (EU Exit) Regulations 2020. |
Between 31 December 2022 and 13 March 2023, being the latest practicable date before the publication of this report, the company received a further notification under DTR 5, with the most recent position being as follows:
Number of voting rights | Percentage as at date of notification | |||||||
BlackRock, Inc. 3 | 78,810,810 | 11.00% | ||||||
| 3. | Includes 8,847,811 (1.23%) qualifying financial instruments to which voting rights are attached |
120 Pearson plc |
Annual general meeting
The notice convening the AGM, to be held at 9:30am on Friday, 28 April 2023 at 80 Strand, London WC2R 0RL, is contained in a circular to shareholders to be dated 24 March 2023.
Registered auditors
In accordance with section 489 of the Companies Act 2006 (the Act), a resolution proposing the
re-appointment
of Ernst & Young LLP as auditors to the company will be proposed at the AGM, at a level of remuneration to be agreed by the Audit Committee.Amendment to Articles of Association
Any amendments to the Articles of Association of the company (the Articles) may be made in accordance with the provisions of the Act by way of a special resolution.
Rights attaching to shares
The rights attaching to the ordinary shares are defined in the Articles. A shareholder whose name appears on the company’s register of members can choose whether his/her shares are evidenced by share certificates (i.e. in certificated form) or held electronically (i.e. uncertificated form) in CREST (the electronic settlement system in the UK).
Subject to any restrictions below, shareholders may attend any general meeting of the company and, on a show of hands, every shareholder (or his/her representative) who is present at a general meeting has one vote on each resolution and, on a poll, every shareholder (whether an individual or a corporation) present in person or by proxy shall have one vote for every 25p of nominal share capital held. A resolution put to the vote at a general meeting held partly by means of electronic facility or facilities shall, unless the chair of the meeting determines that it shall be decided on a show of hands, be decided on a poll. Subject to this, at any general meeting, a resolution put to the vote at the meeting shall be decided on a show of hands, unless before, or on the declaration of the result of, a vote on a show of hands, a poll is demanded. A poll can be demanded by the chair of the meeting, or by at least three shareholders (or their representatives) present in person and having the right to vote, or by any shareholders (or their representatives) present in person having at least 10% of the total voting rights of all shareholders, or by any shareholders (or their representatives) present in person holding ordinary shares on which an aggregate sum has been paid up of at least 10% of the total sum paid up on all ordinary shares. At this year’s AGM, voting will again be conducted on a poll, consistent with best practice.
Shareholders can declare a final dividend by passing an ordinary resolution but the amount of the dividend cannot exceed the amount recommended by the Board. The Board can pay interim dividends on any class of shares of the amounts and on the dates and for the periods they decide. In all cases, the distributable profits of the company must be sufficient to justify the payment of the relevant dividend.
The Board may, if authorised by an ordinary resolution of the shareholders, offer any shareholder the right to elect to receive new ordinary shares, which will be credited as fully paid, instead of their cash dividend.
Any dividend which has not been claimed for 8 years after it became due for payment will be forfeited and will then belong to the company, unless the Directors decide otherwise.
If the company is wound up, the liquidator can, with the sanction of a special resolution passed by the shareholders, divide among the shareholders in specie all or any part of the assets of the company and can value assets and determine how the division shall be carried out as between the shareholders or different classes of shareholders.
The liquidator can also, with the same sanction, transfer the whole or any part of the assets to trustees upon such trusts for the benefit of the shareholders.
Voting at general meetings
Any form of proxy sent by the shareholders to the company in relation to any general meeting must be delivered to the company (via its registrars), whether in written or electronic form, not less than 48 hours before the time appointed for holding the meeting or adjourned meeting at which the person named in the appointment proposes to vote.
The Board may decide that a shareholder is not entitled to attend or vote either personally or by proxy at a general meeting or to exercise any other right conferred by being a shareholder if they or any person with an interest in shares has been sent a notice under section 793 of the Act (which confers upon public companies the power to require information with respect to interests in their voting shares) and they or any interested person failed to supply the company with the information requested within 14 days after delivery of that notice.
The Board may also decide, where the relevant shareholding comprises at least 0.25% of the nominal value of the issued shares of that class, that no dividend is payable in respect of those default shares and that no transfer of any default shares shall be registered unless the shareholder is not himself in default as regards supplying the information requested and the transfer, when presented for registration, is accompanied by a certificate from the shareholder in such form as the Board of Directors may require to the effect that after due and careful inquiry, the shareholder is satisfied that no person in default is interested in any of the ordinary shares which are being transferred, or the transfer is an approved transfer as defined in the Articles, or the registration of the transfer is required by the Uncertificated Securities Regulations 2001.
Pearson operates an employee benefit trust to hold shares, pending employees becoming entitled to them under the company’s employee share plans. There were 1,863,202 shares held as at 31 December 2022. The trust has an independent trustee which has full discretion in relation to the voting of such shares. A dividend waiver operates on the shares held in the trust.
Pearson also operates nominee shareholding arrangements which hold shares on behalf of employees. As at 31 December 2022, there were 2,247,759 shares held in the Sharestore account administered by Equiniti Limited (Equiniti). The beneficial owners of shares held in Sharestore are invited to submit voting instructions online at www.shareview.co.uk. If no instructions are given by the beneficial owner by the date specified, the trustees holding these shares will not exercise the voting rights.
As at 31 December 2022, there were 3,028,933 shares held in the Computershare Share Plan Account (SPA), which is administered by Computershare Investor Services plc (Computershare). Beneficial holders of shares held in the Computershare Share Plan Account (SPA) are invited to submit voting instructions online at www.equateplus.com. If no instructions are given by the beneficial owner by the date specified, the nominee holding these shares will not exercise the voting rights.
| Annual report and accounts 2022 Pearson plc 121 |
Additional disclosures
continued
Transfer of shares
The Board may refuse to register a transfer of a certificated share which is not fully paid, provided that the refusal does not prevent dealings in shares in the company from taking place on an open and proper basis. The Board may also refuse to register a transfer of a certificated share unless: (i) the instrument of transfer is lodged, duly stamped (if stampable) or duly certified or otherwise shown to the satisfaction of the Board to be exempt from stamp duty, at the registered office of the company or any other place decided by the Board, and is accompanied by the certificate for the share to which it relates and such other evidence as the Board may reasonably require to show the right of the transferor to make the transfer; (ii) it is in respect of only one class of shares; and (iii) it is in favour of not more than four transferees.
Transfers of uncertificated shares must be carried out using CREST and the Board can refuse to register a transfer of an uncertificated share in accordance with the regulations governing the operation of CREST.
Variation of rights
If at any time the capital of the company is divided into different classes of shares, the special rights attaching to any class may be varied or revoked either:
| (i) | with the written consent of the holders of at least 75% in nominal value of the issued shares of the relevant class or |
| (ii) | with the sanction of a special resolution passed at a separate general meeting of the holders of the shares of the relevant class. |
Without prejudice to any special rights previously conferred on the holders of any existing shares or class of shares, any share may be issued with such preferred, deferred or other special rights, or such restrictions, whether in regard to dividend, voting, return of capital or otherwise as the company may from time to time by ordinary resolution determine.
Appointment and replacement of Directors
The Articles contain the following provisions in relation to Directors.
Directors shall be no less than two in number. Directors may be appointed by the company by ordinary resolution or by the Board.
A Director appointed by the Board shall hold office only until the next AGM and shall then be eligible for
re-appointment.
The Board may from time to time appoint one or more Directors to hold Executive office with the company for such period (subject to the provisions of the Act) and upon such terms as the Board may decide and may revoke or terminate any appointment so made.The Articles provide that, at every AGM of the company, every Director shall retire from office and, unless not willing to act, be eligible for
re-appointment.
If a Director is not
re-appointed,
they shall, subject to the Articles, retain office until the meeting appoints someone in their place, or, if it does not do so, until the end of the meeting, or, if the meeting is adjourned, the end of the adjourned meeting. Where a Director has been appointed after notice of the annual general meeting has been given, that Director shall retire at the next annual general meeting of which notice is first given after his or her appointment as Director.If there is an insufficient number of appointed or
re-appointed
Directors at any of the company’s annual general meetings thus rendering the Board inquorate, all Directors shall be automaticallyre-appointed
only for the purposes of filling vacancies and convening general meetings of the company and to perform such duties as are appropriate to maintain the company as a going concern and to enable it to comply with its legal and regulatory obligations. The Directors are required to convene a further general meeting of the company as soon as reasonably practicable to allow new Directors to be appointed, and such Directors who were not appointed at the original general meeting shall subsequently retire.The company may by ordinary resolution remove any Director before the expiration of their term of office. In addition, the Board may terminate an agreement or arrangement with any Director for the provision of their services to the company.
Powers of the Directors
Subject to the Articles, the Act and any directions given by special resolution, the business of the company will be managed by the Board who may exercise all the powers of the company, including powers relating to the issue and/or buying back of shares by the company (subject to authorisation, and any statutory restrictions or restrictions imposed by shareholders in a general meeting).
Directors’ indemnities
A qualifying third-party indemnity (QTPI), as permitted by the Articles and sections 232 and 234 of the Act, has been granted by the company to each of its Directors. Under the provisions of the QTPI, the company undertakes to indemnify each Director against liability to third parties (excluding criminal and regulatory penalties) and to pay Directors’ costs as incurred, provided that they are reimbursed to the company if the Director is found guilty, the court refuses to grant the relief sought or, in an action brought by the company, judgement is given against the Director. The indemnity has been in force for the financial year ended 31 December 2022 and is currently in force. The company has purchased and maintains Directors’ and Officers’ insurance cover against certain legal liabilities and costs for claims in connection with any act or omission by such Directors and Officers in the execution of their duties.
Significant agreements
The following significant agreements contain provisions entitling the counterparties to exercise termination or other rights in the event of a change of control of the company.
As at 31 December 2022, the Group’s principal bank facility, the $1.19 billion Revolving Credit Facility (RCF) agreement, allowed that upon a change of control of the company, any participating bank may require its outstanding advances, together with accrued interest and any other amounts payable in respect of such facility, and its commitments, to be cancelled, each within 60 days of notification to the banks by the agent. The facility was undrawn at year end. The group’s outstanding fixed rate notes (see note 18 Borrowings for more information) also contain a provision requiring that, in the event of a change of control which leads to a downgrade in credit rating below Baa3 (Moody’s) or
BBB-
(Fitch Ratings), the company is required to make an offer to investors to repurchase outstanding instruments at par plus accrued interest, which investors are not obliged to accept. For these purposes, a ‘change of control’ occurs if the company becomes a subsidiary of any other company, or one or more persons acting either individually or in concert obtains control (as defined in section 1124 of the Corporation Tax Act 2010) of the company. In February 2023, the Group renegotiated its Revolving Credit Facility, reducing the maximum facility to $1 billion.Shares acquired through the company’s employee share plans rank pari passu with shares in issue and have no special rights. For legal and practical reasons, the rules of these plans set out the consequences of a change of control of the company.
122 Pearson plc |
Other statutory information
Other information that is required by the Act and by the Large and
Medium-sized
Companies and Groups (Accounts and Reports) Regulations 2008 (as amended) to be included in the Directors’ report, and which is incorporated by reference, can be located as follows:Summary disclosures index | See more | |||
| Dividend recommendation | Page 25 | |||
| Financial instruments and financial risk management | Page 178 | |||
| Important events since year end | Page 25 | |||
| Future development of the business | Page 11 | |||
| Research and development activities | Page 16 | |||
| Employment of disabled persons | Page 34 | |||
| Employee involvement | Page 33 | |||
| Greenhouse gas emissions and energy consumption data | Page 41 | |||
| Statement describing employee engagement | Page 28 | |||
| Statement describing regard to suppliers, customers and other stakeholders’ interests | Page 29 | |||
With the exception of the dividend waiver described on page 121 there is no information to be disclosed in accordance with Listing Rule 9.8.4.
No political donations or contributions were made or expenditure incurred by the company or its subsidiaries during the year.
Our disclosures are consistent with the recommendations of the Task Force on Climate-related Financial Disclosures (TCFD) and are set out on pages
39-41.
Fair, balanced and understandable reporting and disclosure of information
As required by the UK Corporate Governance Code, we have established arrangements to ensure that all information we report to investors and regulators is fair, balanced and understandable. In its assessment, the Board paid particular attention to a set of criteria recommended by the Financial Reporting Council, including the use of straightforward language, focus on content that is important to investors, and exclusion of irrelevant information.
A process and timetable for the production and approval of this year’s annual report and accounts was agreed by the Board at its meeting in December 2022. The full Board then had the opportunity to review and comment on the report as it progressed. The Audit Committee is also available to advise the Board on certain aspects of the annual report and accounts, to enable the Directors to fulfil their responsibility in this regard.
The Directors consider that the annual report and accounts, taken as a whole, are fair, balanced and understandable and provide the information necessary for shareholders to assess the company’s position, performance, business model and strategy.
Representatives from Financial Reporting, Strategy, Investor Relations, Corporate Affairs, ESG & Sustainability, Company Secretarial, Legal, Internal Audit, Risk, HR and Reward teams are involved in the preparation and review of the annual report to ensure a cohesive and balanced approach and, as with all of our financial reporting, a thorough verification of narrative and financial statements is conducted. We also have procedures in place to ensure the timely release of inside information, through our Market Disclosure Committee.
The Directors also confirm that, for each Director in office at the date of this report:
| — | so far as the Director is aware, there is no relevant audit information of which the Group and company’s auditors are unaware. |
| — | they have taken all the steps that they ought to have taken as Directors to make themselves aware of any relevant audit information and to establish that the Group and the company’s auditors are aware of that information. |
Directors in office
The following Directors were in office during the year:
| A P Bird | G D Pitkethly | |
| S L Coutu | T Score | |
| S K M Johnson | S Taurel – resigned on 29 April 2022 | |
O Kordestani – appointed on 1 March 2022 | A C Thomas | |
E S Lee – appointed on 1 February 2022 | L A Wallen | |
| L K Lorimer | ||
The Directors’ report has been approved by the Board on 15 March 2023 and signed on its behalf by:
Graeme Baldwin
Company Secretary
| Annual report and accounts 2022 Pearson plc 123 |
Statement of Directors’ responsibilities in respect of the financial statements
Statement of Directors’ responsibilities
The Directors are responsible for preparing the annual report and accounts and the financial statements in accordance with applicable law and regulation.
Company law requires the Directors to prepare financial statements for each financial year. Under that law, the Directors have prepared the Group and company financial statements in accordance with
UK-adopted
international accounting standards. In preparing the Group and company financial statements, the Directors have also elected to comply with International Financial Reporting Standards issued by the International Accounting Standards Board (IFRSs as issued by IASB).Under company law, the Directors must not approve the financial statements unless they are satisfied that they give a true and fair view of the state of affairs of the Group and company and of the profit or loss of the Group for that period. In preparing the financial statements, the Directors are required to:
| — | Select suitable accounting policies and then apply them consistently. |
| — | State whether applicable UK-adopted international accounting standards and IFRSs issued by IASB have been followed, subject to any material departures disclosed and explained in the financial statements. |
| — | Make judgements and accounting estimates that are reasonable and prudent. |
| — | Prepare the financial statements on the going concern basis unless it is inappropriate to presume that the Group and company will continue in business. |
The Directors are responsible for safeguarding the assets of the Group and company and hence for taking reasonable steps for the prevention and detection of fraud and other irregularities.
The Directors are responsible for keeping adequate accounting records that are sufficient to show and explain the Group and company’s transactions, and disclose with reasonable accuracy at any time the financial position of the Group and company and enable them to ensure that the financial statements and the Directors’ remuneration report comply with the Companies Act 2006.
The Directors are responsible for the maintenance and integrity of the company’s website. Legislation in the United Kingdom governing the preparation and dissemination of financial statements may differ from legislation in other jurisdictions.
Directors’ confirmations
Each of the Directors, whose names and functions are listed in the Governance report, confirms that, to the best of their knowledge:
| — | The Group and company financial statements, which have been prepared in accordance with UK-adopted international accounting standards and IFRSs issued by IASB, give a true and fair view of the assets, liabilities and financial position of the Group and company, and of the profit of the Group. |
| — | The Strategic report includes a fair review of the development and performance of the business and the position of the Group and company, together with a description of the principal risks and uncertainties that it faces. |
This responsibility statement has been approved by the Board on 15 March 2023 and signed on its behalf by:
Sally Johnson
Chief Financial Officer
124 Pearson plc |

Independent auditor’s report | 126 | |||
| 134 | ||||
Company financial statements | 202 | |||
| Annual report and accounts 2022 Pearson plc 125 |
Page intentionally left blank
126 Pearson plc |
Page intentionally left blank
Annual report and accounts 2022 Pearson plc 127 |
Page intentionally left blank
128 Pearson plc |
Page intentionally left blank
Annual report and accounts 2022 Pearson plc 129 |
Page intentionally left blank
130 Pearson plc |
Page intentionally left blank
Annual report and accounts 2022 Pearson plc 131 |
Page intentionally left blank
132 Pearson plc |
Page intentionally left blank
Annual report and accounts 2022 Pearson plc 133 |
Financial statements
Consolidated income statement
Year ended 31 December 2022
All figures in £ millions | Notes | 2022 | 2021 1 | 2020 1 | ||||||||||||
Continuing operations | ||||||||||||||||
| Sales | 2,3 | 3,841 | 3,428 | 3,397 | ||||||||||||
| Cost of goods sold | 4 | (2,046 | ) | (1,747 | ) | (1,767 | ) | |||||||||
Gross profit | 1,795 | 1,681 | 1,630 | |||||||||||||
| Operating expenses | 4 | (1,549 | ) | (1,562 | ) | (1,402 | ) | |||||||||
| Other net gains and losses | 4 | 24 | 63 | 178 | ||||||||||||
| Share of results of joint ventures and associates | 12 | 1 | 1 | 5 | ||||||||||||
Operating profit | 2 | 271 | 183 | 411 | ||||||||||||
| Finance costs | 6 | (71 | ) | (68 | ) | (107 | ) | |||||||||
| Finance income | 6 | 123 | 62 | 76 | ||||||||||||
Profit before tax | 323 | 177 | 380 | |||||||||||||
| Income tax | 7 | (79 | ) | 1 | (50 | ) | ||||||||||
Profit for the year | 244 | 178 | 330 | |||||||||||||
Attributable to: | ||||||||||||||||
| Equity holders of the company | 242 | 177 | 330 | |||||||||||||
Non-controlling interest | 2 | 1 | – | |||||||||||||
Earnings per share attributable to equity holders of the company during the year | ||||||||||||||||
| (expressed in pence per share) | ||||||||||||||||
| • basic | 8 | 32.8p | 23.5p | 43.7p | ||||||||||||
| • diluted | 8 | 32.6p | 23.3p | 43.7p | ||||||||||||
1. Comparative balances have been restated – see Note 1b.
134 Pearson plc |
Consolidated statement of comprehensive income
Year ended 31 December 2022
All figures in £ millions | Notes | 2022 | 2021 1 | 2020 1 | ||||||||||||
| Profit for the year | 244 | 178 | 330 | |||||||||||||
Items that may be reclassified to the income statement | ||||||||||||||||
| Net exchange differences on translation of foreign operations | 330 | (6 | ) | (109 | ) | |||||||||||
| Currency translation adjustment disposed | (5 | ) | 4 | (70 | ) | |||||||||||
| Attributable tax | 7 | 4 | 10 | (13 | ) | |||||||||||
Items that are not reclassified to the income statement | ||||||||||||||||
| Fair value gain/(loss) on other financial assets | 18 | 4 | (12 | ) | ||||||||||||
| Attributable tax | 7 | 1 | (1 | ) | – | |||||||||||
| Remeasurement of retirement benefit obligations | 25 | 54 | 149 | (23 | ) | |||||||||||
| Attributable tax | 7 | (12 | ) | (61 | ) | 2 | ||||||||||
Other comprehensive income/(expense) for the year | 29 | 390 | 99 | (225 | ) | |||||||||||
Total comprehensive income for the year | 634 | 277 | 105 | |||||||||||||
Attributable to: | ||||||||||||||||
| Equity holders of the company | 630 | 276 | 105 | |||||||||||||
Non-controlling interest | 4 | 1 | – | |||||||||||||
1. Comparative balances have been restated – see Note 1b.
| Annual report and accounts 2022 Pearson plc 135 |
Financial statements
Consolidated balance sheet
As at 31 December 2022
All figures in £ millions | Notes | 2022 | 2021 1 | |||||||||
Assets | ||||||||||||
Non-current assets | ||||||||||||
| Property, plant and equipment | 10 | 250 | 366 | |||||||||
| Investment property | 10 | 60 | – | |||||||||
| Intangible assets | 11 | 3,177 | 2,769 | |||||||||
| Investments in joint ventures and associates | 12 | 25 | 24 | |||||||||
| Deferred income tax assets | 13 | 57 | 57 | |||||||||
| Financial assets – derivative financial instruments | 16 | 43 | 30 | |||||||||
| Retirement benefit assets | 25 | 581 | 537 | |||||||||
| Other financial assets | 15 | 133 | 113 | |||||||||
| Income tax assets | 41 | 97 | ||||||||||
| Trade and other receivables | 22 | 139 | 129 | |||||||||
4,506 | 4,122 | |||||||||||
Current assets | ||||||||||||
| Intangible assets – product development | 20 | 975 | 894 | |||||||||
| Inventories | 21 | 105 | 98 | |||||||||
| Trade and other receivables | 22 | 1,139 | 1,257 | |||||||||
| Financial assets – derivative financial instruments | 16 | 16 | 2 | |||||||||
| Income tax assets | 9 | 26 | ||||||||||
| Cash and cash equivalents (excluding overdrafts) | 17 | 558 | 937 | |||||||||
2,802 | 3,214 | |||||||||||
| Assets classified as held for sale | 32 | 16 | 7 | |||||||||
Total assets | 7,324 | 7,343 | ||||||||||
Liabilities | ||||||||||||
Non-current liabilities | ||||||||||||
| Financial liabilities – borrowings | 18 | (1,144 | ) | (1,245 | ) | |||||||
| Financial liabilities – derivative financial instruments | 16 | (54 | ) | (30 | ) | |||||||
| Deferred income tax liabilities | 13 | (37 | ) | (40 | ) | |||||||
| Retirement benefit obligations | 25 | (61 | ) | (66 | ) | |||||||
| Provisions for other liabilities and charges | 23 | (14 | ) | (7 | ) | |||||||
| Other liabilities | 24 | (120 | ) | (95 | ) | |||||||
(1,430 | ) | (1,483 | ) | |||||||||
136 Pearson plc |
Consolidated balance sheet
continued
As at 31 December 2022
All figures in £ millions | Notes | 2022 | 2021 1 | |||||||||
Current liabilities | ||||||||||||
| Trade and other liabilities | 24 | (1,254 | ) | (1,256 | ) | |||||||
| Financial liabilities – borrowings | 18 | (86 | ) | (155 | ) | |||||||
| Financial liabilities – derivative financial instruments | 16 | (11 | ) | (4 | ) | |||||||
| Income tax liabilities | (43 | ) | (125 | ) | ||||||||
| Provisions for other liabilities and charges | 23 | (85 | ) | (40 | ) | |||||||
(1,479 | ) | (1,580 | ) | |||||||||
| Liabilities classified as held for sale | 32 | – | – | |||||||||
Total liabilities | (2,909 | ) | (3,063 | ) | ||||||||
Net assets | 4,415 | 4,280 | ||||||||||
Equity | ||||||||||||
| Share capital | 27 | 179 | 189 | |||||||||
| Share premium | 27 | 2,633 | 2,626 | |||||||||
| Treasury shares | 28 | (15 | ) | (12 | ) | |||||||
| Capital redemption reserve | 28 | 18 | ||||||||||
| Fair value reserve | (13 | ) | (4 | ) | ||||||||
| Translation reserve | 709 | 386 | ||||||||||
| Retained earnings | 881 | 1,067 | ||||||||||
Total equity attributable to equity holders of the company | 4,402 | 4,270 | ||||||||||
Non-controlling interest | 13 | 10 | ||||||||||
Total equity | 4,415 | 4,280 | ||||||||||
1. Comparative balances have been restated – see Note 1b.
These financial statements have been approved for issue by the Board of Directors on 3
1
March 2023 and signed on its behalf bySally Johnson
Chief Financial Officer
Pearson plc
Registered number: 00053723
| Annual report and accounts 2022 Pearson plc 137 |
Financial statements
Consolidated statement of changes in equity
Year ended 31 December 2022
Equity attributable to equity holders of the company | ||||||||||||||||||||||||||||||||||||||||
All figures in £ millions | Share capital | Share premium | Treasury shares | Capital redemption reserve | Fair value reserve | Translation reserve | Retained earnings | Total | Non- controlling interest | Total equity | ||||||||||||||||||||||||||||||
| At 1 January 2022 | 189 | 2,626 | (12 | ) | 18 | (4 | ) | 386 | 1,067 | 4,270 | 10 | 4,280 | ||||||||||||||||||||||||||||
| Profit for the year | – | – | – | – | – | – | 242 | 242 | 2 | 244 | ||||||||||||||||||||||||||||||
| Other comprehensive income/(expense) | – | – | – | – | 18 | 323 | 47 | 388 | 2 | 390 | ||||||||||||||||||||||||||||||
Total comprehensive income/(expense) | – | – | – | – | 18 | 323 | 289 | 630 | 4 | 634 | ||||||||||||||||||||||||||||||
| Equity-settled transactions | – | – | – | – | – | – | 38 | 38 | – | 38 | ||||||||||||||||||||||||||||||
| Taxation on equity-settled transactions | – | – | – | – | – | – | 3 | 3 | – | 3 | ||||||||||||||||||||||||||||||
| Issue of ordinary shares under share option schemes | – | 7 | – | – | – | – | – | 7 | – | 7 | ||||||||||||||||||||||||||||||
| Buyback of equity | (10 | ) | – | – | 10 | – | – | (353 | ) | (353 | ) | – | (353 | ) | ||||||||||||||||||||||||||
| Purchase of treasury shares | – | – | (37 | ) | – | – | – | – | (37 | ) | – | (37 | ) | |||||||||||||||||||||||||||
| Release of treasury shares | – | – | 34 | – | – | – | (34 | ) | – | – | – | |||||||||||||||||||||||||||||
| Transfer of gain on disposal of FVOCI investment | – | – | – | – | (27 | ) | – | 27 | – | – | – | |||||||||||||||||||||||||||||
| Dividends | – | – | – | – | – | – | (156 | ) | (156 | ) | (1 | ) | (157 | ) | ||||||||||||||||||||||||||
At 31 December 2022 | 179 | 2,633 | (15 | ) | 28 | (13 | ) | 709 | 881 | 4,402 | 13 | 4,415 | ||||||||||||||||||||||||||||
| Equity attributable to equity holders of the company | ||||||||||||||||||||||||||||||||||||||||
All figures in £ millions | Share capital | Share premium | Treasury shares | Capital redemption reserve | Fair value reserve 1 | Translation reserve | Retained earnings 1 | Total | Non- controlling interest | Total equity | ||||||||||||||||||||||||||||||
| At 1 January 2021 | 188 | 2,620 | (7 | ) | 18 | (4 | ) | 388 | 922 | 4,125 | 9 | 4,134 | ||||||||||||||||||||||||||||
| Profit for the year | – | – | – | – | – | – | 177 | 177 | 1 | 178 | ||||||||||||||||||||||||||||||
| Other comprehensive income/(expense) | – | – | – | – | 4 | (2 | ) | 97 | 99 | – | 99 | |||||||||||||||||||||||||||||
Total comprehensive income/(expense) | – | – | – | – | 4 | (2 | ) | 274 | 276 | 1 | 277 | |||||||||||||||||||||||||||||
| Equity-settled transactions | – | – | – | – | – | – | 28 | 28 | – | 28 | ||||||||||||||||||||||||||||||
| Issue of ordinary shares under share option schemes | 1 | 6 | (1 | ) | – | – | – | – | 6 | – | 6 | |||||||||||||||||||||||||||||
| Buyback of equity | – | – | – | – | – | – | – | – | – | – | ||||||||||||||||||||||||||||||
| Purchase of treasury shares | – | – | (16 | ) | – | – | – | – | (16 | ) | – | (16 | ) | |||||||||||||||||||||||||||
| Release of treasury shares | – | – | 12 | – | – | – | (12 | ) | – | – | – | |||||||||||||||||||||||||||||
| Transfer of gain on disposal of FVOCI investment | – | – | – | – | (4 | ) | – | 4 | – | – | – | |||||||||||||||||||||||||||||
| Dividends | – | – | – | – | – | – | (149 | ) | (149 | ) | – | (149 | ) | |||||||||||||||||||||||||||
At 31 December 2021 | 189 | 2,626 | (12 | ) | 18 | (4 | ) | 386 | 1,067 | 4,270 | 10 | 4,280 | ||||||||||||||||||||||||||||
| Equity attributable to equity holders of the company | ||||||||||||||||||||||||||||||||||||||||
All figures in £ millions | Share capital | Share premium | Treasury shares | Capital redemption reserve | Fair value reserve 1 | Translation reserve | Retained earnings 1 | Total | Non- controlling interest | Total equity | ||||||||||||||||||||||||||||||
| At 1 January 2020 | 195 | 2,614 | (24 | ) | 11 | 39 | 567 | 911 | 4,313 | 10 | 4,323 | |||||||||||||||||||||||||||||
| Adjustment (see note 1b) | – | – | – | – | (31 | ) | – | 31 | – | – | – | |||||||||||||||||||||||||||||
| At 1 January 2020 (restated) | 195 | 2,614 | (24 | ) | 11 | 8 | 567 | 942 | 4,313 | 10 | 4,323 | |||||||||||||||||||||||||||||
| Profit for the year | – | – | – | – | – | – | 330 | 330 | – | 330 | ||||||||||||||||||||||||||||||
| Other comprehensive income/(expense) | – | – | – | – | (12 | ) | (179 | ) | (34 | ) | (225 | ) | – | (225 | ) | |||||||||||||||||||||||||
Total comprehensive income/(expense) | – | – | – | – | (12 | ) | (179 | ) | 296 | 105 | – | 105 | ||||||||||||||||||||||||||||
| Equity-settled transactions | – | – | – | – | – | – | 29 | 29 | – | 29 | ||||||||||||||||||||||||||||||
| Issue of ordinary shares under share option schemes | – | 6 | – | – | – | – | – | 6 | – | 6 | ||||||||||||||||||||||||||||||
| Buyback of equity | (7 | ) | – | – | 7 | – | – | (176 | ) | (176 | ) | – | (176 | ) | ||||||||||||||||||||||||||
| Purchase of treasury shares | – | – | (6 | ) | – | – | – | – | (6 | ) | – | (6 | ) | |||||||||||||||||||||||||||
| Release of treasury shares | – | – | 23 | – | – | – | (23 | ) | – | – | – | |||||||||||||||||||||||||||||
| Dividends | – | – | – | – | – | – | (146 | ) | (146 | ) | (1 | ) | (147 | ) | ||||||||||||||||||||||||||
At 31 December 2020 | 188 | 2,620 | (7 | ) | 18 | (4 | ) | 388 | 922 | 4,125 | 9 | 4,134 | ||||||||||||||||||||||||||||
| 1. | Comparative balances have been restated – see Note 1b. |
The capital redemption reserve reflects the nominal value of shares cancelled in the Group’s share buyback programme. The fair value reserve arises on revaluation of other financial assets. The translation reserve includes exchange differences arising from the translation of the net investment in foreign operations and of borrowings and other currency instruments designated as hedges of such investments.
138 Pearson plc |
Consolidated cash flow statement
Year ended 31 December 2022
All figures in £ millions | Notes | 2022 | 2021 1 | 2020 1 | ||||||||||||
Cash flows from operating activities | ||||||||||||||||
| Profit before tax | 323 | 177 | 380 | |||||||||||||
| Net finance (costs) / income | (52 | ) | 6 | 31 | ||||||||||||
| Depreciation and impairment - PPE and investment property | 136 | 241 | 125 | |||||||||||||
| Amortisation and impairment - software | 125 | 117 | 112 | |||||||||||||
| Amortisation and impairment - acquired intangible assets | 54 | 50 | 80 | |||||||||||||
| Other net gains and losses | (24 | ) | (63 | ) | (178 | ) | ||||||||||
| Product development capital expenditure | (357 | ) | (287 | ) | (323 | ) | ||||||||||
| Amortisation and impairment - product development | 303 | 279 | 280 | |||||||||||||
| Share-based payment costs | 35 | 28 | 29 | |||||||||||||
| Change in inventories | (34 | ) | 22 | 35 | ||||||||||||
| Change in trade and other receivables | 33 | (71 | ) | (1 | ) | |||||||||||
| Change in trade and other liabilities | (84 | ) | 37 | (26 | ) | |||||||||||
| Change in provisions for other liabilities and charges | 50 | 14 | (37 | ) | ||||||||||||
| Other movements | 19 | 20 | (57 | ) | ||||||||||||
| Net cash generated from operations | 527 | 570 | 450 | |||||||||||||
| Interest paid | (57 | ) | (67 | ) | (63 | ) | ||||||||||
| Tax (paid)/received | (109 | ) | (177 | ) | 2 | |||||||||||
Net cash generated from operating activities | 361 | 326 | 389 | |||||||||||||
Cash flows from investing activities | ||||||||||||||||
| Acquisition of subsidiaries, net of cash acquired | 30 | (228 | ) | (55 | ) | (6 | ) | |||||||||
| Acquisition of joint ventures and associates | (5 | ) | (10 | ) | – | |||||||||||
| Purchase of investments | (12 | ) | (4 | ) | (6 | ) | ||||||||||
| Purchase of property, plant and equipment and investment property | (57 | ) | (64 | ) | (53 | ) | ||||||||||
| Purchase of intangible assets | (90 | ) | (112 | ) | (81 | ) | ||||||||||
| Disposal of subsidiaries, net of cash disposed | 31 | 333 | 83 | 100 | ||||||||||||
| Proceeds from disposal of joint ventures and associates | 31 | – | – | 531 | ||||||||||||
| Proceeds from disposal of investments | 17 | 48 | – | |||||||||||||
| Proceeds from disposal of property, plant and equipment | 14 | – | – | |||||||||||||
| Lease receivables repaid including disposals | 18 | 21 | 41 | |||||||||||||
| Loans repaid by related parties | – | – | 48 | |||||||||||||
| Interest received | 22 | 13 | 13 | |||||||||||||
| Dividends from joint ventures and associates | 1 | – | 4 | |||||||||||||
Net cash generated from/(used in) investing activities | 13 | (80 | ) | 591 | ||||||||||||
Cash flows from financing activities | ||||||||||||||||
| Proceeds from issue of ordinary shares | 27 | 7 | 6 | 6 | ||||||||||||
| Buyback of equity | 27 | (353 | ) | – | (176 | ) | ||||||||||
| Purchase of treasury shares | 28 | (37 | ) | (16 | ) | (6 | ) | |||||||||
| Proceeds from borrowings | – | – | 346 | |||||||||||||
| Repayment of borrowings | (171 | ) | (167 | ) | (230 | ) | ||||||||||
| Repayment of lease liabilities | (93 | ) | (88 | ) | (92 | ) | ||||||||||
| Dividends paid to company’s shareholders | 9 | (156 | ) | (149 | ) | (146 | ) | |||||||||
Dividends paid to non-controlling interest | (1 | ) | – | (1 | ) | |||||||||||
Net cash used in financing activities | (804 | ) | (414 | ) | (299 | ) | ||||||||||
| Effects of exchange rate changes on cash and cash equivalents | 36 | (8 | ) | (2 | ) | |||||||||||
Net (decrease)/increase in cash and cash equivalents | (394 | ) | (176 | ) | 679 | |||||||||||
| Cash and cash equivalents at beginning of year | 937 | 1,113 | 434 | |||||||||||||
Cash and cash equivalents at end of year | 17 | 543 | 937 | 1,113 | ||||||||||||
| 1. | Comparative balances have been restated – see Note 1b. In addition, the Group has changed the presentation of the consolidated cash flow statement with the aim of simplifying for the reader. The reconciliation to net cash generated from operations is now presented above and certain line items have been aggregated and disaggregated. There has been no change to the classification of cash flows as operating, investing and financing. |
| Annual report and accounts 2022 Pearson plc 139 |
Financial statements
Notes to the consolidated financial statements
General information
Pearson plc (‘the company’), its subsidiaries and associates (together ‘the Group’) are international businesses covering educational courseware, assessments and services.
The company is a public limited company incorporated in England and Wales and domiciled in the United Kingdom. The address of its registered office is 80 Strand, London WC2R 0RL.
The company has its primary listing on the London Stock Exchange and is also listed on the New York Stock Exchange.
These consolidated financial statements were approved for issue by the Board of Directors on 3
1
March 2023.1a. Accounting policies
The principal accounting policies applied in the preparation of these consolidated financial statements are set out below.
Basis of preparation
These consolidated financial statements have been prepared on the going concern basis (see note 1c) and in accordance with the Disclosure and Transparency Rules of the Financial Conduct Authority and in accordance with
UK-adopted
International Accounting Standards and with the requirements of the Companies Act 2006. On 31 December 2020, IFRS as adopted by the European Union at that date was brought into UK law and becameUK-adopted
International Accounting Standards (IASs), with future changes being subject to endorsement by the UK Endorsement Board. The Group transitioned toUK-adopted
IASs on 1 January 2021. This change constituted a change in accounting framework. However, there was no impact on recognition, measurement or disclosure as a result of the change in framework. The consolidated financial statements have also been prepared in accordance with IFRSs as issued by the International Accounting Standards Board (IASB). In respect of accounting standards applicable to the Group, there is no difference betweenUK-adopted
IASs and IFRSs as issued by the IASB.These consolidated financial statements have been prepared under the historical cost convention as modified by the revaluation of financial assets and liabilities (including derivative financial instruments) at fair value.
These accounting policies have been consistently applied to all years presented, unless otherwise stated.
1. Interpretations and amendments to published standards effective 2022
A number of other new pronouncements are effective from 1 January 2022 but they do not have a material impact on the consolidated financial statements. Additional disclosure has been given where relevant.
2. Standards, interpretations and amendments to published standards that are not yet effective
| — | IFRS 17 ‘Insurance contracts’; |
| — | Amendments to IAS 1 and IFRS Practice Statement 2 ‘Disclosure of accounting policies’; |
| — | Amendments to IAS 1 ‘Classification of liabilities as current or non-current’ (not yet endorsed); |
| — | Amendments to IAS 1 ‘Non-current liabilities with covenants’ (not yet endorsed); |
| — | Amendments to IAS 8 ‘Definition of accounting estimates’; |
| — | Amendments to IAS 12 ‘Deferred tax related to assets and liabilities arising from a single transaction’; and |
| — | Amendments to IFRS 16 ’Lease liability in a sale and leaseback’ (not yet endorsed). |
The Group is currently assessing the impact of the above changes, but they are not expected to have a material impact. The Group does not plan to early adopt any of the above new accounting standards or amendments. The Group has not adopted any other standard, amendment or interpretation that has been issued but is not yet effective.
3. Critical accounting assumptions and judgements
All assumptions and estimates constitute management’s best judgement at the date of the financial statements, however, in the future, actual experience may deviate from these estimates and assumptions.
The areas requiring a higher degree of judgement or complexity, or areas where assumptions and estimates have a significant risk of resulting in material adjustments to the carrying value of assets and liabilities within the consolidated financial statements are:
| — | Intangible assets: goodwill and acquired intangible assets |
| — | Taxation |
| — | Revenue: provisions for returns |
| — | Employee benefits: pensions |
| — | Property, plant and equipment: right-of-use |
| — | Classification as discontinued operations |
The key judgements and key areas of estimation are set out below, as well as in the relevant accounting policies and in the notes to the accounts where appropriate.
140 Pearson plc |
 | Key judgements | |||||
— The application of tax legislation in relation to provisions for uncertain tax positions. See notes 7 and 34. — The allocation of goodwill to the cash-generating units and groups of cash-generating units. See note 11. — Whether the Group will be eligible to receive the surplus associated with the UK Group Pension Plan in recognising a pension asset. See note 25. — The results and cash flows of businesses disposed do not meet the criteria to be classified and presented as discontinued operations. See note 31. | ||||||
 | Key areas of estimation | |||||
— The recoverability of goodwill balances. Key assumptions used in goodwill impairment testing are discount rates, perpetuity growth rates, forecast sales growth rates and forecast operating profits. See note 11. — The valuation of acquired intangible assets recognised on the acquisition of a business. See notes 11 and 30. — The level of provisions required in relation to uncertain tax positions is complex and each matter is separately assessed. The estimation of future settlement amounts is based on a number of factors including the status of the unresolved matter, clarity of legislation, range of possible outcomes and the statute of limitations. See notes 7 and 34. — The level of provisions required for anticipated returns is estimated based on historical experience, customer buying patterns and retailer behaviours including stock levels. See note 3. — The determination of the pension cost and defined benefit obligation of the Group’s defined benefit pension schemes depends on the selection of certain assumptions, which include the discount rate, inflation rate, salary growth and longevity. See note 25. — The recoverability of right-of-use | ||||||
The Group has assessed the impact of the uncertainty presented by the volatile macro-economic and
geo-political
environment on the financial statements, specifically considering the impact on key judgements and significant estimates along with other areas of increased risk as follows:| — | Financial instruments and hedge accounting; and |
| — | Translation methodologies. |
No material accounting impacts relating to the areas assessed above were recognised in the year. The Group will continue to monitor these areas of increased judgement, estimation and risk.
The Group no longer considers the
COVID-19
pandemic to be an area of significant uncertainty and is no longer specifically assessing the impact of theCOVID-19
pandemic on areas of judgement, estimation and risk.Consolidation
1. Business combinations
The consideration transferred for the acquisition of a subsidiary is the fair value of the assets transferred, the liabilities incurred and the equity interest issued by the Group. The consideration transferred includes the fair value of any asset or liability resulting from a contingent consideration arrangement. Acquisition-related costs are expensed as incurred in the operating expenses line of the income statement. Identifiable assets acquired and identifiable liabilities and contingent liabilities assumed in a business combination are measured initially at their fair values at the acquisition date. The determination of fair values often requires significant judgements and the use of estimates, and, for material acquisitions, the fair value of the acquired intangible assets is determined by an independent valuer. The excess of the consideration transferred, the amount of any
non-controlling
interest in the acquiree and the acquisition date fair value of any previous equity interest in the acquiree over the fair value of the identifiable net assets acquired is recorded as goodwill (note 30).See the ‘Intangible assets’ policy for the accounting policy on goodwill. If this is less than the fair value of the net assets of the subsidiary acquired, in the case of a bargain purchase, the difference is recognised directly in the income statement.
On anbasis, the Group recognises any
acquisition-by-acquisition
non-controlling
interest in the acquiree either at fair value or at thenon-controlling
interest’s proportionate share of the acquiree’s net assets.IFRS 3 ‘Business Combinations’ has not been applied retrospectively to business combinations before the date of transition to IFRS.
Management exercises judgement in determining the classification of its investments in its businesses, in line with the following:
2. Subsidiaries
3. Transactions with
non-controlling
interestsnon-controlling
interests that do not result in loss of control are accounted for as equity transactions, that is, as transactions with the owners in their capacity as owners. Any surplus or deficit arising from disposals to anon-controlling
interest is recorded in equity. For purchases from anon-controlling
interest, the difference between consideration paid and the relevant share acquired of the carrying value of the subsidiary is recorded in equity.4. Joint ventures and associates
| Annual report and accounts 2022 Pearson plc 141 |
Financial statements
Notes to the consolidated financial statements
continued
1a. Accounting policies continued
Consolidation continued
The Group’s share of its joint ventures’ and associates’ post-acquisition profits or losses is recognised in the income statement and its share of post-acquisition movements in reserves is recognised in reserves.
The Group’s share of its joint ventures’ and associates’ results is recognised as a component of operating profit as these operations form part of the core publishing business of the Group and are an integral part of existing wholly-owned businesses. The cumulative post-acquisition movements are adjusted against the carrying amount of the investment. When the Group’s share of losses in a joint venture or associate equals or exceeds its interest in the joint venture or associate, the Group does not recognise further losses unless the Group has incurred obligations or made payments on behalf of the joint venture or associate.
Unrealised gains and losses on transactions between the Group and its joint ventures and associates are eliminated to the extent of the Group’s interest in these entities.
5. Contribution of a subsidiary to an associate or joint venture
Foreign currency translation
1. Functional and presentation currency
2. Transactions and balances
year-end
exchange rates of monetary assets and liabilities denominated in foreign currencies are recognised in the income statement, except when deferred in equity as qualifying net investment hedges.3. Group companies
| — | Assets and liabilities are translated at the closing rate at the date of the balance sheet |
| — | Income and expenses are translated at average exchange rates |
| — | All resulting exchange differences are recognised as a separate component of equity. |
On consolidation, exchange differences arising from the translation of the net investment in foreign entities, and of borrowings and other currency instruments designated as hedges of such investments, are taken to shareholders’ equity. The Group treats specific inter-company loan balances, which are not intended to be repaid in the foreseeable future, as part of its net investment. When a foreign operation is sold, such exchange differences are recognised in the income statement as part of the gain or loss on sale.
The principal overseas currency for the Group is the US dollar. The average rate for the year against sterling was $1.24 (2021: $1.38; 2020: $1.28) and the
year-end
rate was $1.21 (2021: 1.35; 2020: $1.37).Property, plant and equipment
Property, plant and equipment are stated at historical cost less depreciation. Cost includes the original purchase price of the asset and the costs attributable to bringing the asset to its working condition for intended use. Land is not depreciated. Depreciation on other assets is calculated using the straight-line method to allocate their cost less their residual values over their estimated useful lives as follows:
| Buildings (freehold): | 20–50 years | |
| Buildings (leasehold): | over the period of the lease | |
| Plant and equipment: | 3–10 years | |
The assets’ residual values and useful lives are reviewed, and adjusted if appropriate, at each balance sheet date.
The carrying value of an asset is written down to its recoverable amount if the carrying value of the asset is greater than its estimated recoverable amount.
Investment property
In 2022, the Group classified certain assets as investment property. Properties that are no longer occupied by the Group and which are held for operating lease rental are classified as investment property. Investment property assets are carried at cost less accumulated depreciation and any recognised impairment in value. The depreciation policies for investment property are consistent with those described for property, plant and equipment
Intangible assets
1. Goodwill
non-controlling
interest in the acquiree and the acquisition date fair value of any previous equity interest in the acquiree over the fair value of the identifiable net assets acquired. For the acquisition of subsidiaries made from the date of transition to IFRS to 31 December 2009, goodwill represents the excess of the cost of an acquisition over the fair value of the Group’s share of the net identifiable assets acquired. Goodwill on acquisitions of subsidiaries is included in intangible assets. Goodwill on acquisition of associates and joint ventures represents the excess of the cost of an acquisition over the fair value of the Group’s share of the net identifiable assets acquired.Goodwill on acquisitions of associates and joint ventures is included in investments in associates and joint ventures.
142 Pearson plc |
Goodwill is tested at least annually for impairment and carried at cost less accumulated impairment losses. An impairment loss is recognised to the extent that the carrying value of goodwill exceeds the recoverable amount. The recoverable amount is the higher of fair value less costs of disposal and value in use. These calculations require the use of estimates in respect of forecast cash flows and discount rates and significant management judgement in respect of cash-generating unit (CGU) and cost allocation; impairment is a key source of estimation uncertainty and has a significant risk of resulting in a material adjustment to the carrying amount of relevant assets within the next financial year. A summary of these assets by CGU and a description of the key assumptions and sensitivities is included in note 11.
Goodwill is allocated to aggregated CGUs for the purpose of impairment testing. The allocation is made to those aggregated CGUs that are expected to benefit from the business combination in which the goodwill arose. Where there are changes to CGUs, goodwill is reallocated to the new CGUs and aggregation of CGUs using a relative value method.
Gains and losses on the disposal of an entity include the carrying amount of goodwill relating to the entity sold.
2. Acquired software
three
and eight years.3. Internally developed software
three
andten
years. The assets are assessed for impairment triggers on an annual basis or when triggering events occur.4. Acquired intangible assets
5. Product development assets
Product development assets relating to content are amortised upon publication of the title over estimated economic lives of seven years or less, being an estimate of the expected operating lifecycle of the title, with a higher proportion of the amortisation taken in the earlier years. Product development assets relating to product platforms are amortised over 10 years or less, being an estimate of the expected useful life.
The assessment of the useful economic life and the recoverability of product development assets involves judgement and is based on historical trends and management estimation of future potential sales.
Product development assets are assessed for impairment triggers on an annual basis or when triggering events occur. The carrying amount of product development assets is set out in note 20.
The investment in product development assets has been disclosed as part of net cash generated from operating activities in the cash flow statement.
Other financial assets
Other financial assets are
non-derivative
financial assets classified and measured at estimated fair value.Marketable securities and cash deposits with maturities of greater than three months are classified and subsequently measured at fair value through profit and loss (FVTPL). They are remeasured at each balance sheet date by using market data and the use of established valuation techniques. Any movement in the fair value is immediately recognised in finance income or finance costs in the income statement.
Investments in the equity instruments of other entities are classified and subsequently measured at fair value through other comprehensive income (FVOCI). Changes in fair value are recorded in equity in the fair value reserve via other comprehensive income. On subsequent disposal of the asset, the net fair value gains or losses are reclassified from the fair value reserve to retained earnings. Any dividends received from equity investments classified as FVOCI are recognised in the income statement unless they represent a return of capital.
Investments in funds which have a limited life are classified and subsequently measured at fair value through profit and loss (FVTPL). Changes in fair value are included within net finance costs within the income statement.
Inventories
Inventories are stated at the lower of cost and net realisable value. Cost is determined using the weighted average method or an approximation thereof, such as the first in first out (FIFO) method. The cost of finished goods and work in progress comprises raw materials, direct labour, other direct costs and related production overheads. Net realisable value is the estimated selling price in the ordinary course of business, less estimated costs necessary to make the sale. Provisions are made for slow-moving and obsolete stock.
| Annual report and accounts 2022 Pearson plc 143 |
Financial statements
Notes to the consolidated financial statements
continued
1a. Accounting policies continued
Royalty advances
Advances of royalties to authors are included within trade and other receivables when the advance is paid less any provision required to adjust the advance to its net realisable value. The realisable value of royalty advances relies on a degree of management estimation in determining the profitability of individual author contracts. If the estimated realisable value of author contracts is overstated, this will have an adverse effect on operating profits as these excess amounts will be written off.
The recoverability of royalty advances is based upon an annual detailed management review of the age of the advance, the future sales projections for new authors and prior sales history of repeat authors.
The royalty advance is expensed at the contracted or effective royalty rate as the related revenues are earned. Royalty advances which will be consumed within one year are held in current assets. Royalty advances which will be consumed after one year are held in
non-current
assets.Cash and cash equivalents
Cash and cash equivalents in the cash flow statement include cash in hand, deposits held on call with banks, other short-term highly liquid investments with original maturities of three months or less, and bank overdrafts. Bank overdrafts are included in borrowings in current liabilities in the balance sheet.
Short-term deposits and marketable securities with maturities of greater than three months do not qualify as cash and cash equivalents and are reported as financial assets. Movements on these financial assets are classified as cash flows from financing activities in the cash flow statement where these amounts are used to offset the borrowings of the Group or as cash flows from investing activities where these amounts are held to generate an investment return.
Share capital
Ordinary shares are classified as equity.
Incremental costs directly attributable to the issue of new shares or options are shown in equity as a deduction, net of tax, from the proceeds.
Where any Group company purchases the company’s equity share capital (treasury shares), the consideration paid, including any directly attributable incremental costs, net of income taxes, is deducted from equity attributable to the company’s equity holders until the shares are cancelled, reissued or disposed of. Where such shares are subsequently sold or reissued, any consideration received, net of any directly attributable transaction costs and the related income tax effects, is included in equity attributable to the company’s equity holders.
Ordinary shares purchased under a buyback programme are cancelled and the nominal value of the shares is transferred to a capital redemption reserve.
Borrowings
Borrowings are recognised initially at fair value, which is proceeds received net of transaction costs incurred. Borrowings are subsequently stated at amortised cost with any difference between the proceeds (net of transaction costs) and the redemption value being recognised in the income statement over the period of the borrowings using the effective interest method. Accrued interest is included as part of borrowings.
Where a debt instrument is in a fair value hedging relationship, an adjustment is made to its carrying value in the income statement to reflect the hedged risk.
Where a debt instrument is in a net investment hedge relationship, gains and losses on the effective portion of the hedge are recognised in other comprehensive income.
Derivative financial instruments
Derivatives are recognised at fair value and remeasured at each balance sheet date. The fair value of derivatives is determined by using market data and the use of established estimation techniques such as discounted cash flow and option valuation models.
For derivatives in a hedge relationship, the currency basis spread is excluded from the designation as a hedging instrument.
Changes in the fair value of derivatives are recognised immediately in finance income or costs. However, derivatives relating to borrowings and certain foreign exchange contracts are designated as part of a hedging transaction.
The accounting treatment is summarised as follows:
Typical reason for designation | Reporting of gains and losses on effective portion of the hedge | Reporting of gains and losses on disposal | ||
Net investment hedge | ||||
| The derivative creates a foreign currency liability which is used to hedge changes in the value of a subsidiary which transacts in that currency. | Recognised in other comprehensive income. | On the disposal of foreign operations or subsidiaries, the accumulated value of gains and losses reported in other comprehensive income is transferred to the income statement. | ||
Fair value hedges | ||||
The derivative transforms the interest profile on debt from fixed rate to floating rate. Changes in the value of the debt as a result of changes in interest rates and foreign exchange rates are offset by equal and opposite changes in the value of the derivative. When the Group’s debt is swapped to floating rates, the contracts used are designated as fair value hedges. | Gains and losses on the derivative are reported in finance income or finance costs. However, an equal and opposite change is made to the carrying value of the debt (a ‘fair value adjustment’) with the benefit/cost reported in finance income or finance costs. The net result should be a zero charge on a perfectly effective hedge. | If the debt and derivative are disposed of, the value of the derivative and the debt (including the fair value adjustment) are reset to zero. Any resultant gain or loss is recognised in finance income or finance costs. | ||
Non-hedge accounted contracts | ||||
These are not designated as hedging instruments. Typically, these are short-term contracts to convert debt back to fixed rates or foreign exchange contracts where a natural offset exists. | Recognised in the income statement. No hedge accounting applies. | |||
144 Pearson plc |
Taxation
Current tax is recognised at the amounts expected to be paid or recovered under the tax rates and laws that have been enacted or substantively enacted at the balance sheet date.
Deferred income tax is provided, using the balance sheet liability method, on temporary differences arising between the tax bases of assets and liabilities and their carrying amounts. Deferred income tax is determined using tax rates and laws that have been enacted or substantively enacted by the balance sheet date and are expected to apply when the related deferred tax asset is realised or the deferred income tax liability is settled.
Deferred tax assets are recognised to the extent that it is probable that future taxable profit will be available against which the temporary differences can be utilised.
Deferred income tax is provided in respect of the undistributed earnings of subsidiaries, associates and joint ventures other than where it is intended that those undistributed earnings will not be remitted in the foreseeable future.
Current and deferred tax are recognised in the income statement, except when the tax relates to items charged or credited directly to equity or other comprehensive income, in which case the tax is also recognised in equity or other comprehensive income.
The Group is subject to income taxes in numerous jurisdictions. Significant judgement is required in determining the estimates in relation to the worldwide provision for income taxes. There are many transactions and calculations for which the ultimate tax determination is uncertain during the ordinary course of business. The Group recognises tax provisions when it is considered probable that there will be a future outflow of funds to a tax authority. The provisions are based on management’s best judgement of the application of tax legislation and best estimates of future settlement amounts (see note 7). Where the final tax outcome of these matters is different from the amounts that were initially recorded, such differences will impact the income tax and deferred tax provisions in the period in which such determination is made.
Deferred tax assets and liabilities require management judgement and estimation in determining the amounts to be recognised. In particular, when assessing the extent to which deferred tax assets should be recognised, significant judgement is used when considering the timing of the recognition and estimation is used to determine the level of future taxable income together with any future tax planning strategies (see note 13).
Employee benefits
1. Pensions
When the calculation results in a potential asset, the recognition of that asset is limited to the asset ceiling – that is the present value of any economic benefits available in the form of refunds from the plan or a reduction in future contributions. Management uses judgement to determine the level of refunds available from the plan in recognising an asset.
The determination of the pension cost and defined benefit obligation of the Group’s defined benefit pension schemes depends on the selection of certain assumptions, which include the discount rate, inflation rate, salary growth and longevity (see note 25).
Actuarial gains and losses arising from experience adjustments and changes in actuarial assumptions are charged or credited to equity in other comprehensive income in the period in which they arise. The service cost, representing benefits accruing over the year, is included in the income statement as an operating cost. Net interest is calculated by applying the discount rate to the net defined benefit obligation and is presented as finance costs or finance income.
Obligations for contributions to defined contribution pension plans are recognised as an operating expense in the income statement as incurred.
2. Other post-retirement obligations
3. Share-based payments
Provisions
Provisions are recognised if the Group has a present legal or constructive obligation as a result of past events; it is more likely than not that an outflow of resources will be required to settle the obligation and the amount can be reliably estimated. Provisions are discounted to present value where the effect is material.
Revenue recognition
The Group’s revenue streams are courseware, assessments and services. Courseware includes curriculum materials provided in book form and/or via access to digital content. Assessments includes test development, processing and scoring services provided to governments, educational institutions, corporations and professional bodies. Services includes the operation of schools, colleges and universities, as well as the provision of online learning services in partnership with universities and other academic institutions.
Revenue is recognised in order to depict the transfer of control of promised goods and services to customers in an amount that reflects the consideration to which we expect to be entitled in exchange for those goods and services. This process begins with the identification of our contract with a customer, which is generally through a master services agreement, customer purchase order, or a combination thereof. Within each contract, judgement is applied to determine the extent to which activities within the contract represent distinct performance obligations to be delivered and the total amount of transaction price to which we expect to be entitled.
| Annual report and accounts 2022 Pearson plc 145 |
Financial statements
Notes to the consolidated financial statements
continued
1a. Accounting policies continued
The transaction price determined is net of sales taxes, rebates and discounts, and after eliminating sales within the Group. Where a contract contains multiple performance obligations such as the provision of supplementary materials or online access with textbooks, revenue is allocated on the basis of relative standalone selling prices. Where a contract contains variable consideration, significant estimation is required to determine the amount to which the Group is expected to be entitled.
Revenue is recognised on contracts with customers when or as performance obligations are satisfied, which is the period or the point in time where control of goods or services transfers to the customer. Judgement is applied to determine first whether control passes over time and if not, then the point in time at which control passes. Where revenue is recognised over time, judgement is used to determine the method which best depicts the transfer of control. Where an input method is used, significant estimation is required to determine the progress towards delivering the performance obligation.
Revenue from the sale of books is recognised net of a provision for anticipated returns. This provision is based primarily on historical return rates, customer buying patterns and retailer behaviours including stock levels (see note 24). If these estimates do not reflect actual returns in future periods then revenues could be understated or overstated for a particular period. When the provision for returns is remeasured at each reporting date to reflect changes in estimates, a corresponding adjustment is also recorded to revenue.
The Group may enter into contracts with another party in addition to our customer. In making the determination as to whether revenue should be recognised on a gross or net basis, the contract with the customer is analysed to understand which party controls the relevant good or service prior to transferring to the customer. This judgement is informed by facts and circumstances of the contract in determining whether the Group has promised to provide the specified good or service or whether the Group is arranging for the transfer of the specified good or service, including which party is responsible for fulfilment, has discretion to set the price to the customer and is responsible for inventory risk. On certain contracts, where the Group acts as an agent, only commissions and fees receivable for services rendered are recognised as revenue. Any third-party costs incurred on behalf of the principal that are rechargeable under the contractual arrangement are not included in revenue.
Income from recharges of freight and other activities which are incidental to the normal revenue-generating activities is included in other income.
Additional details on the Group’s revenue streams are also included in note 3.
Leases
The Group as a lessee
The Group assesses whether a contract is or contains a lease at the inception of the contract. A contract is, or contains a lease, if the contract conveys the right to control the use of an identified asset for a period of time in exchange for consideration. The Group recognises aasset and a lease liability at the lease commencement date with respect to all lease arrangements except for short-term leases (leases with a lease term of 12 months or less) and leases of
right-of-use
low-value
assets. For these leases, the lease payments are recognised as an operating expense on a straight-line basis over the term of the lease.Theasset is initially measured at cost, comprising the initial amount of the lease liability plus any initial direct costs incurred and an estimate of costs to restore the underlying asset, less any lease incentives received. Theasset is subsequently depreciated using the straight-line method from the commencement date to the earlier of the end of the useful life of the asset or the end of the lease term. The Group applies IAS 36 to determine whether aasset is impaired. The lease liability is initially measured at the present value of the lease payments that are not paid at the commencement date, discounted using the interest rate implicit in the lease or, if that rate cannot be readily determined, the incremental borrowing rate. The lease liability is measured at amortised cost using the effective interest method. It is remeasured when there is a change in future lease payments arising from a change in an index or a rate or a change in the Group’s assessment of whether it will exercise an extension or termination option. When the lease liability is remeasured, a corresponding adjustment is made to theasset.
right-of-use
right-of-use
right-of-use
right-of-use
Management uses judgement to determine the lease term where extension and termination options are available within the lease.
The Group as a lessor
When the Group is an intermediate lessor, the head lease and sublease are accounted for as two separate contracts. The head lease is accounted for as per the lessee policy above. The sublease is classified as a finance lease or operating lease by reference to theasset arising from the head lease. Where the lease transfers substantially all the risks and rewards of ownership to the lessee, the contract is classified as a finance lease; all other leases are classified as operating leases. Rental income from operating leases is recognised on a straight-line basis over the term of the relevant lease. Amounts due from lessees under finance subleases are recognised as receivables at the amount of the Group’s net investment in the leases discounted using the interest rate implicit in the lease or, if that rate cannot be readily determined, the discount rate used in the head lease.
right-of-use
Dividends
Final dividends are recorded in the Group’s financial statements in the period in which they are approved by the company’s shareholders. Interim dividends are recorded when paid.
Discontinued operations
A discontinued operation is a component of the Group’s business that represents a separate major line of business or geographical area of operations that has been disposed of or meets the criteria to be classified as held for sale.
When applicable, discontinued operations are presented in the income statement as a separate line and are shown net of tax.
Assets and liabilities held for sale
Assets and liabilities are classified as held for sale and stated at the lower of carrying amount and fair value less costs to sell if it is highly probable that the carrying amount will be recovered principally through a sale transaction rather than through continuing use.
No depreciation is charged in respect of
non-current
assets classified as held for sale. Amounts relating tonon-current
assets and liabilities held for sale are classified as discontinued operations in the income statement where appropriate.Trade receivables
Trade receivables are stated at fair value after provision for bad and doubtful debts. Provisions for bad and doubtful debts are based on the expected credit loss model. The ‘simplified approach’ is used with the expected loss allowance measured at an amount equal to the lifetime expected credit losses. A provision for anticipated future sales returns is included within trade and other liabilities (also see Revenue recognition policy).
146 Pearson plc |
1b. Comparative period revisions
In 2022, the Group identified an error related to the classification of certain investments in unlisted securities. Investments that should have been accounted for at fair value through profit and loss were previously accounted for at fair value through other comprehensive income. The investments are held at fair value within other financial assets on the balance sheet. Having assessed both the quantitative and qualitative factors, the Group has determined that the error did not have a material impact on its previously issued consolidated financial statements. However, the comparative financial statement line items have been corrected to reflect the change in accounting treatment. The fair value movements are now recorded within finance income, rather than within other comprehensive income. All impacted primary statements and related notes have been restated.
For the year ended 31 December 2021, the revision has resulted in an increase in finance income and a corresponding increase in profit before tax of £20m, a reduction in the income tax benefit of £2m, an increase in profit for the year and profit for the year attributable to equity holders of the company of £18m, a decrease in the fair value gain on other financial assets through other comprehensive income of £20m with an increase in the attributable tax of £2m, resulting in a decrease in other comprehensive income for the year of £18m, and no change in total comprehensive income for the year, all as compared to amounts previously reported.
For the year ended 31 December 2020, the revision has resulted in an increase in finance income and a corresponding increase in profit before tax of £26m, an increase in income tax expense of £6m, an increase in profit for the year and profit for the year attributable to equity holders of the company of £20m, a decrease in the fair value gain on other financial assets through other comprehensive income of £26m with an increase in the attributable tax of £6m, resulting in a decrease in other comprehensive income for the year of £20m, and no change in total comprehensive income for the year, all as compared to amounts previously reported.
The impact on both basic and diluted earnings per share attributable to equity holders of the company is an increase of 2.4p for 2021 and 2.7p for 2020.
The restatement had no balance sheet impact except within equity. Opening retained earnings as at 1 January 2020 have increased by £31m and closing retained earnings as at 31 December 2020 have increased by £57m and an equivalent decrease has been recorded to the opening and closing fair value reserve. Closing retained earnings at 31 December 2021 has increased by £37m and an equivalent decrease has been recorded to the closing fair value reserve. The restatement has no impact on the carrying amount of other financial assets in the balance sheet and has no impact on reported net assets, cash flows or total equity. Accordingly, an additional balance sheet as at 1 January 2020 has not been presented.
1c. Going concern
In assessing the Group’s ability to continue as a going concern for the period to 30 June 2024, the Board reviewed management’s four-year plan, which was used as the base case. The review included available liquidity throughout the period and headroom against the Group’s two main covenants, which require net debt to EBITDA to be a maximum of four times and interest cover to be at least three times.
At 31 December 2022, the Group had available liquidity of £1.4bn, comprising central cash balances and its undrawn $1.19bn Revolving Credit Facility (RCF). In February 2023, the maximum RCF facility size was reduced to $1bn and the model used reflects this change. Significant liquidity and covenant headroom was observed throughout the assessment period in this base model.
A severe but plausible scenario was analysed, where the Group is impacted by all principal risks in both 2023 and 2024, adjusted for probability weighting as well as other significant risks. For this and other downside scenarios tested, the acquisition of PDRI is assumed to be completed and a further capital allocation outflow of £350m is modelled. In the severe but plausible scenario, adjusted operating profit is reduced by around 30%, with a similar impact on operating cashflow. Significant liquidity and covenant headroom was observed throughout the assessment period even before any mitigation actions which management would take if these downside risks were to crystalise.
A reverse stress test was performed to identify the reduction in profit required to cease to be a going concern at or before 30 June 2024. This was achieved in the model through a covenant breach in June 2024 triggering repayment of the Group’s debts. The model showed that operating losses were required, with profits reduced by around £750m per year in both 2023 and 2024. This significantly exceeded the severe but plausible downside scenario. The Directors consider this reverse stress test scenario to be implausible.
The Directors have confirmed that there are no material uncertainties that cast doubt on the Group’s going concern status and that they have a reasonable expectation that the Group has adequate resources to continue in operational existence beyond 30 June 2024. The consolidated financial statements have therefore been prepared on a going concern basis.
1d. Climate change
The Group has assessed the impacts of climate change on the Group’s financial statements , including our commitment to achieving net zero by 2030, and the actions the Group intends to take to achieve those targets. The assessment did not identify any material impact on the Group’s significant judgements or estimates at 31 December 2022, or the assessment of going concern for the period to June 2024 and the Group’s viability over the next four years. Specifically, we have considered the following areas:
| — | The physical and transition risks associated with climate change; and |
| — | The actions the Group is taking to meet its carbon reduction and net zero targets. |
As a result, the Group has assessed the impacts of climate change on the financial statements, and in particular, on the following areas:
| — | The impact on the Group’s future cash flows, and the resulting impact that such adjustments to our future cash flows would have on the outcome of the annual impairment testing of our goodwill balances (see note 11 for further details), the recognition of deferred tax assets and our assessment of going concern; |
| — | The carrying value of the Group’s assets, in particular the recoverable amounts of inventories, product development assets, intangible assets and property, plant and equipment; and |
| — | Any changes to our estimates of the useful economic lives of product development assets, intangible assets and property, plant and equipment. |
| Annual report and accounts 2022 Pearson plc 147 |
Financial statements
Notes to the consolidated financial statements
continued
2. Segment information
On 8 March 2021, the Group announced a new strategy, which included a new management structure and operating model. As a result, the primary operating segments reported to the Group’s chief operating decision-maker, the Pearson Executive Management team, changed from 1 July 2021 to reflect the new Group structure. There are five main global business divisions, which are each considered separate operating segments for management and reporting purposes. These five divisions are Assessment & Qualifications, Virtual Learning, English Language Learning, Higher Education and Workforce Skills. In addition, the International Courseware local publishing businesses, which were under strategic review, were being managed as a separate division, known as Strategic Review. In 2022, some of the businesses from the Strategic Review division have been disposed of (see note 31) and the decision was made to retain the English-speaking Canadian and Australian K12 courseware businesses. Both of these businesses have been transferred from the Strategic Review division to the Assessment & Qualifications division to reflect changes to the management and reporting structure. Comparative figures for 2021 and 2020 have been restated to reflect the move between segments, resulting in £34m of sales being transferred from the Strategic Review division to the Assessment & Qualifications division in 2021 and £36m in 2020. The Group has separately disclosed the results from the Penguin Random House associate to the point of disposal in April 2020.
The following describes the principal activities of the five main operating segments:
| — | Assessment & Qualifications – Pearson VUE, US Student Assessment, Clinical Assessment, UK GCSE and A Levels and International academic qualifications and associated courseware including the English-speaking Canadian and Australian K-12 businesses; |
| — | Virtual Learning – Virtual Schools and Online Program Management; |
| — | English Language Learning – Pearson Test of English, Institutional Courseware and English Online Solutions; |
| — | Workforce Skills – BTEC, GED, TalentLens, Faethm, Credly, Pearson College and Apprenticeships; and |
| — | Higher Education – US, Canadian and International Higher Education Courseware businesses. |
2022 | ||||||||||||||||||||||||||||||||||||
English | Penguin | |||||||||||||||||||||||||||||||||||
Assessment & | Virtual | Language | Workforce | Higher | Strategic | Random | ||||||||||||||||||||||||||||||
All figures in £ millions | Notes | Qualifications | Learning | Learning | Skills | Education | Review | House | Group | |||||||||||||||||||||||||||
Sales | 3 | 1,444 | 820 | 321 | 204 | 898 | 154 | – | 3,841 | |||||||||||||||||||||||||||
| Adjusted operating profit | 258 | 70 | 25 | (3 | ) | 91 | 15 | – | 456 | |||||||||||||||||||||||||||
| Cost of major restructuring | (39 | ) | (29 | ) | (11 | ) | (7 | ) | (63 | ) | (1 | ) | – | (150 | ) | |||||||||||||||||||||
| Intangible charges | (14 | ) | (21 | ) | (6 | ) | (12 | ) | (3 | ) | – | – | (56 | ) | ||||||||||||||||||||||
| UK Pension discretionary increases | (1 | ) | (1 | ) | – | – | (1 | ) | – | – | (3 | ) | ||||||||||||||||||||||||
| Other net gains and losses | (2 | ) | (2 | ) | (11 | ) | – | – | 39 | – | 24 | |||||||||||||||||||||||||
Operating profit/(loss) | 202 | 17 | (3 | ) | (22 | ) | 24 | 53 | – | 271 | ||||||||||||||||||||||||||
| Finance costs | 6 | (71 | ) | |||||||||||||||||||||||||||||||||
| Finance income | 6 | 123 | ||||||||||||||||||||||||||||||||||
Profit before tax | 323 | |||||||||||||||||||||||||||||||||||
| Income tax | 7 | (79 | ) | |||||||||||||||||||||||||||||||||
Profit for the year | 244 | |||||||||||||||||||||||||||||||||||
Other segment items | ||||||||||||||||||||||||||||||||||||
| Share of results of joint ventures and associates | 12 | – | (2 | ) | 4 | (1 | ) | – | – | – | 1 | |||||||||||||||||||||||||
| Depreciation and impairment | 10 | 63 | 31 | 7 | 6 | 26 | 3 | – | 136 | |||||||||||||||||||||||||||
| Amortisation and impairment | 11, 20 | 139 | 77 | 44 | 27 | 175 | 20 | – | 482 | |||||||||||||||||||||||||||
148 Pearson plc |
| 2021 | ||||||||||||||||||||||||||||||||||||
| English | Penguin | |||||||||||||||||||||||||||||||||||
| Assessment & | Virtual | Language | Workforce | Higher | Strategic | Random | ||||||||||||||||||||||||||||||
All figures in £ millions | Notes | Qualifications | Learning | Learning | Skills | Education | Review | House | Group 1 | |||||||||||||||||||||||||||
Sales | 3 | 1,238 | 713 | 238 | 172 | 849 | 218 | – | 3,428 | |||||||||||||||||||||||||||
| Adjusted operating profit | 219 | 32 | 15 | 27 | 73 | 19 | – | 385 | ||||||||||||||||||||||||||||
| Cost of major restructuring | (48 | ) | (48 | ) | (27 | ) | (28 | ) | (63 | ) | – | – | (214 | ) | ||||||||||||||||||||||
| Intangible charges | (13 | ) | (25 | ) | (3 | ) | (7 | ) | (2 | ) | (1 | ) | – | (51 | ) | |||||||||||||||||||||
| Other net gains and losses | – | – | – | (2 | ) | – | 65 | – | 63 | |||||||||||||||||||||||||||
Operating profit/(loss) | 158 | (41 | ) | (15 | ) | (10 | ) | 8 | 83 | – | 183 | |||||||||||||||||||||||||
| Finance costs | 6 | (68 | ) | |||||||||||||||||||||||||||||||||
| Finance income | 6 | 62 | ||||||||||||||||||||||||||||||||||
Profit before tax | 177 | |||||||||||||||||||||||||||||||||||
| Income tax | 7 | 1 | ||||||||||||||||||||||||||||||||||
Profit for the year | 178 | |||||||||||||||||||||||||||||||||||
Other segment items | ||||||||||||||||||||||||||||||||||||
| Share of results of joint ventures and associates | 12 | – | (1 | ) | 3 | (1 | ) | – | – | – | 1 | |||||||||||||||||||||||||
| Depreciation and impairment | 10 | 92 | 48 | 14 | 9 | 63 | 15 | – | 241 | |||||||||||||||||||||||||||
| Amortisation and impairment | 11, 20 | 134 | 67 | 34 | 25 | 165 | 21 | – | 446 | |||||||||||||||||||||||||||
| 1. | Comparative balances have been restated to reflect the move between operating segments. |
| 2020 | ||||||||||||||||||||||||||||||||||||
| English | Penguin | |||||||||||||||||||||||||||||||||||
| Assessment & | Virtual | Language | Workforce | Higher | Strategic | Random | ||||||||||||||||||||||||||||||
| All figures in £ millions | Notes | Qualifications | Learning | Learning | Skills | Education | Review | House | Group 1 | |||||||||||||||||||||||||||
Sales | 3 | 1,118 | 692 | 218 | 163 | 956 | 250 | – | 3,397 | |||||||||||||||||||||||||||
| Adjusted operating profit | 147 | 29 | 1 | 26 | 93 | 16 | 1 | 313 | ||||||||||||||||||||||||||||
| Cost of major restructuring | – | – | – | – | – | – | – | – | ||||||||||||||||||||||||||||
| Intangible charges | (29 | ) | (30 | ) | (7 | ) | (8 | ) | (3 | ) | (3 | ) | – | (80 | ) | |||||||||||||||||||||
| Other net gains and losses | – | – | – | – | – | (2 | ) | 180 | 178 | |||||||||||||||||||||||||||
Operating profit/(loss) | 118 | (1 | ) | (6 | ) | 18 | 90 | 11 | 181 | 411 | ||||||||||||||||||||||||||
| Finance costs | 6 | (107 | ) | |||||||||||||||||||||||||||||||||
| Finance income | 6 | 76 | ||||||||||||||||||||||||||||||||||
Profit before tax | 380 | |||||||||||||||||||||||||||||||||||
| Income tax | 7 | (50 | ) | |||||||||||||||||||||||||||||||||
Profit for the year | 330 | |||||||||||||||||||||||||||||||||||
Other segment items | ||||||||||||||||||||||||||||||||||||
| Share of results of joint ventures and associates | – | – | 4 | – | – | – | 1 | 5 | ||||||||||||||||||||||||||||
| Depreciation and impairment | 53 | 21 | 7 | 5 | 28 | 11 | – | 125 | ||||||||||||||||||||||||||||
| Amortisation and impairment | 154 | 64 | 34 | 24 | 167 | 29 | – | 472 | ||||||||||||||||||||||||||||
| 1. | Comparative balances have been restated to reflect the move between operating segments. |
| Annual report and accounts 2022 Pearson plc 149 |
Financial statements
Notes to the consolidated financial statements
continued
2. Segment information continued
There were no material inter-segment sales in either 2022, 2021 or 2020.
Corporate costs are allocated to business segments on an appropriate basis depending on the nature of the cost and therefore the total segment result is equal to the Group operating profit.
Adjusted operating profit is shown in the above tables as it is the key financial measure used by management to evaluate the performance of the Group. The measure also enables investors to more easily, and consistently, track the underlying operational performance of the Group and its business segments over time by separating out those items of income and expenditure relating to acquisition and disposal transactions, major restructuring programmes and certain other items that are also not representative of underlying performance, which are explained below and reconciled within this note.
Cost of major restructuring – In August 2022, the Group announced a major restructuring programme to run in 2022. The programme includes efficiencies in product and content, support costs, technology and corporate property. The restructuring costs in 2022 of £150m mainly relate to staff redundancies and impairment ofproperty assets, the write-down of product development assets and staff redundancies. The 2022 charge includes the impact of updated assumptions related to the recoverability ofassets made in 2021. The costs of these restructuring programmes are significant enough to exclude from the adjusted operating profit measure so as to better highlight the underlying performance (see note 4). There was no major restructuring in 2020.
right-of-use
property assets. In 2021, restructuring costs of £214m mainly related to the impairment ofright-of-use
right-of-use
Intangible charges – These represent charges relating to intangibles acquired through business combinations. These charges are excluded as they reflect past acquisition activity and do not necessarily reflect the current year performance of the Group.
Intangible amortisation charges in 2022 were £56m compared to a charge of £51m in 2021. This is due to increased amortisation from recent acquisitions which is partially offset by a reduction in amortisation from intangible assets at the end of their useful life and recent disposals. In 2022 and 2021, intangible charges included no impairment charges. In 2020, intangible charges were £80m including impairment charges of £12m.
Other net gains and losses – These represent profits and losses on the sale of subsidiaries, joint ventures, associates and other financial assets and are excluded from adjusted operating profit as they distort the performance of the Group as reported on a statutory basis. Other net gains and losses also includes costs related to business closures and acquisitions. Other net gains and losses in 2022 relate to the gains on the disposal of our international courseware local publishing businesses in Europe, French-speaking Canada and Hong Kong and a gain arising on a decrease in the deferred consideration payable on prior year acquisitions, offset by a loss on disposal of our international courseware local publishing businesses in South Africa due to recycling of currency translation adjustments and costs related to disposals and acquisitions. Other net gains and losses in 2021 largely related to the disposal of PIHE and the disposal of the K12 Sistemas business in Brazil offset by costs related to the acquisition of Faethm and the wind down of certain strategic review businesses. In 2020, they largely relate to the sale of the remaining interest in Penguin Random House (£180m gain).
UK pension discretionary increases - Charges in 2022 relate to
one-off
pension increases awarded to certain cohorts of pensioners in response to the cost of living crisis.Adjusted operating profit should not be regarded as a complete picture of the Group’s financial performance. For example, adjusted operating profit includes the benefits of major restructuring programmes but excludes the significant associated costs, and adjusted operating profit excludes costs related to acquisitions, and the amortisation of intangibles acquired in business combinations, but does not exclude the associated revenues. The Group’s definition of adjusted operating profit may not be comparable to other similarly titled measures reported by other companies.
The Group operates in the following main geographic areas:
| Sales | Non-current assets | |||||||||||||||||||||
| All figures in £ millions | 2022 | 2021 | 2020 | 2022 | 2021 | |||||||||||||||||
| UK | 424 | 355 | 319 | 527 | 578 | |||||||||||||||||
| Other European countries | 192 | 249 | 216 | 192 | 122 | |||||||||||||||||
| US | 2,668 | 2,182 | 2,335 | 2,333 | 2,034 | |||||||||||||||||
| Canada | 110 | 111 | 91 | 243 | 217 | |||||||||||||||||
| Asia Pacific | 290 | 359 | 251 | 200 | 190 | |||||||||||||||||
| Other countries | 157 | 172 | 185 | 17 | 18 | |||||||||||||||||
Total | 3,841 | 3,428 | 3,397 | 3,512 | 3,159 | |||||||||||||||||
Sales are allocated based on the country in which the customer is located. This does not differ materially from the location where the order is received. The geographical split of
non-current
assets is based on the subsidiary’s country of domicile. This is not materially different to the location of the assets.Non-current
assets comprise investment property, property, plant and equipment, intangible assets and investments in joint ventures and associates.150 Pearson plc |
3. Revenue from contracts with customers
The following tables analyse the Group’s revenue streams. Courseware includes curriculum materials provided in book form and/or via access to digital content. Assessments includes integrated test development, processing and scoring services provided to governments, educational institutions, corporations and professional bodies. Services includes the operation of schools, colleges and universities, including sistemas in Brazil, until disposed, as well as the provision of online learning services in partnership with universities and other academic institutions. Comparative figures for 2021 and 2020 have been restated to reflect the move between segments.
The Group derived revenue from the transfer of goods and services over time and at a point in time in the following major product lines:
2022 | ||||||||||||||||||||||||||||
All figures in £ millions | Assessment & Qualifications | Virtual Learning | English Language Learning | Workforce Skills | Higher Education | Strategic Review | Total | |||||||||||||||||||||
Courseware | ||||||||||||||||||||||||||||
| Products transferred at a point in time | 64 | – | 110 | 2 | 302 | 148 | 626 | |||||||||||||||||||||
| Products and services transferred over time | 21 | – | 25 | – | 588 | 6 | 640 | |||||||||||||||||||||
85 | – | 135 | 2 | 890 | 154 | 1,266 | ||||||||||||||||||||||
Assessments | ||||||||||||||||||||||||||||
| Products transferred at a point in time | 169 | – | 5 | 14 | – | – | 188 | |||||||||||||||||||||
| Products and services transferred over time | 1,190 | – | 138 | 142 | – | – | 1,470 | |||||||||||||||||||||
1,359 | – | 143 | 156 | – | – | 1,658 | ||||||||||||||||||||||
Services | ||||||||||||||||||||||||||||
| Products transferred at a point in time | – | – | 29 | – | – | – | 29 | |||||||||||||||||||||
| Products and services transferred over time | – | 820 | 14 | 46 | 8 | – | 888 | |||||||||||||||||||||
– | 820 | 43 | 46 | 8 | – | 917 | ||||||||||||||||||||||
Total | 1,444 | 820 | 321 | 204 | 898 | 154 | 3,841 | |||||||||||||||||||||
| 2021 | ||||||||||||||||||||||||||||
All figures in £ millions | Assessment & Qualifications | Virtual Learning | English Language Learning | Workforce Skills | Higher Education | Strategic Review | Total | |||||||||||||||||||||
Courseware | ||||||||||||||||||||||||||||
| Products transferred at a point in time | 62 | – | 109 | – | 283 | 180 | 634 | |||||||||||||||||||||
| Products and services transferred over time | 30 | – | 26 | – | 558 | 17 | 631 | |||||||||||||||||||||
| 92 | – | 135 | – | 841 | 197 | 1,265 | ||||||||||||||||||||||
Assessments | ||||||||||||||||||||||||||||
| Products transferred at a point in time | 173 | – | 6 | 16 | – | – | 195 | |||||||||||||||||||||
| Products and services transferred over time | 973 | – | 72 | 119 | – | – | 1,164 | |||||||||||||||||||||
| 1,146 | – | 78 | 135 | – | – | 1,359 | ||||||||||||||||||||||
Services | ||||||||||||||||||||||||||||
| Products transferred at a point in time | – | – | 22 | – | – | 14 | 36 | |||||||||||||||||||||
| Products and services transferred over time | – | 713 | 3 | 37 | 8 | 7 | 768 | |||||||||||||||||||||
| – | 713 | 25 | 37 | 8 | 21 | 804 | ||||||||||||||||||||||
Total | 1,238 | 713 | 238 | 172 | 849 | 218 | 3,428 | |||||||||||||||||||||
| Annual report and accounts 2022 Pearson plc 151 |
Financial statements
Notes to the consolidated financial statements
continued
3. Revenue from contracts with customers continued
| 2020 | ||||||||||||||||||||||||||||
| All figures in £ millions | Assessment & Qualifications | Virtual Learning | English Language Learning | Workforce Skills | Higher Education | Strategic Review | Total | |||||||||||||||||||||
Courseware | ||||||||||||||||||||||||||||
| Products transferred at a point in time | 66 | – | 106 | – | 313 | 185 | 670 | |||||||||||||||||||||
| Products and services transferred over time | 27 | – | 24 | – | 630 | 15 | 696 | |||||||||||||||||||||
| 93 | – | 130 | – | 943 | 200 | 1,366 | ||||||||||||||||||||||
Assessments | ||||||||||||||||||||||||||||
| Products transferred at a point in time | 138 | – | 3 | 7 | – | – | 148 | |||||||||||||||||||||
| Products and services transferred over time | 887 | – | 61 | 123 | – | – | 1,071 | |||||||||||||||||||||
| 1,025 | – | 64 | 130 | – | – | 1,219 | ||||||||||||||||||||||
Services | ||||||||||||||||||||||||||||
| Products transferred at a point in time | – | – | 22 | – | – | 22 | 44 | |||||||||||||||||||||
| Products and services transferred over time | – | 692 | 2 | 33 | 13 | 28 | 768 | |||||||||||||||||||||
| – | 692 | 24 | 33 | 13 | 50 | 812 | ||||||||||||||||||||||
Total | 1,118 | 692 | 218 | 163 | 956 | 250 | 3,397 | |||||||||||||||||||||
a. Nature of goods and services
The following is a description of the nature of the Group’s performance obligations within contracts with customers broken down by revenue stream, along with significant judgements and estimates made within each of those revenue streams.
Courseware
 | Key areas of estimation | |||||
The level of provisions required for anticipated returns is estimated based on historical experience, customer buying patterns and retailer behaviours including stock levels. | ||||||
Revenue is generated from customers through the sales of print and digital courseware materials to schools, bookstores and direct to individual learners. Goods and services may be sold separately or purchased together in bundled packages. The goods and services included in bundled arrangements are considered distinct performance obligations, except for where Pearson provides both a licence of intellectual property and an ongoing hosting service. As the licence of intellectual property is only available with the concurrent hosting service, the licence is not treated as a distinct performance obligation separate from the hosting service.
The transaction price is allocated between distinct performance obligations on the basis of their relative standalone selling prices.
In determining the transaction price, variable consideration exists in the form of discounts and anticipated returns. Discounts reduce the transaction price on a given transaction. A provision for anticipated returns is made based primarily on historical return rates, customer buying patterns and retailer behaviours including stock levels (see note 24). If these estimates do not reflect actual returns in future periods then revenues could be understated or overstated for a particular period. Variable consideration as described above is determined using the expected value approach. The sales return liability at the end of 2022 was £53m (2021: £83m; 2020: £86m). This represents 8% of courseware sales transferred at a point in time.
While payment for these goods and services generally occurs at the start of these arrangements, the length of time between payment and delivery of the performance obligations is generally short-term in nature or the reason for early payment relates to reasons other than financing, including customers securing a vendor in a longer-term arrangement or the transfer of goods or services is at the discretion of the customer. For these reasons and the use of the practical expedient on short-term financing, significant financing components are not recognised within Courseware transactions.
152 Pearson plc |
Revenue from the sale of physical books is recognised at a point in time when control passes. This is generally at the point of shipment when title passes to the customer, when the Group has a present right to payment and the significant risks and rewards of ownership have passed to the customer. Revenue from physical books sold through the direct print rental method is recognised over the rental period, as the customer is simultaneously receiving and consuming the benefits of this rental service through the passage of time.
Revenue from the sale of digital courseware products is recognised on a straight-line basis over the subscription period, unless hosted by a third-party or representative of a downloadable product, in which case Pearson has no ongoing obligation and recognises revenue when control transfers as the customer is granted access to the digital product.
Revenue from the sale ofsoftware is recognised on delivery or on installation of the software where that is a condition of the contract. In certain circumstances, where installation is complex, revenue is recognised when the customer has completed their acceptance procedures.
‘off-the-shelf’
Assessments
Revenue is primarily generated from multi-year contractual arrangements related to large-scale assessment delivery, such as contracts to process qualifying tests for individual professions and government departments, and is recognised as performance occurs. Under these arrangements, while the agreement spans multiple years, the contract duration has been determined to be each testing cycle based on contract structure, including clauses regarding termination.
While in some cases the customer may have the ability to terminate during the term for convenience, significant financial or qualitative barriers exist limiting the potential for such terminations in the middle of a testing cycle.
Within each testing cycle, a variety of service activities are performed such as test administration, delivery, scoring, reporting, item development, operational services and programme management. These services are not treated as distinct in the context of the customer contract as Pearson provides an integrated managed service offering and these activities are accounted for together as one comprehensive performance obligation.
Within each testing cycle, the transaction price may contain both fixed and variable amounts. Variable consideration within these transactions primarily relates to expected testing volumes to be delivered in the cycle. The assumptions, risks and uncertainties inherent to long-term contract accounting can affect the amounts and timing of revenue and related expenses reported. Variable consideration is measured using the expected value method, except where amounts are contingent upon a future event’s occurrence, such as performance bonuses. Such event-driven contingency payments are measured using the most likely amount approach. In estimating and constraining variable consideration, historical experience, current trends and local market conditions are considered. To the extent that a higher degree of uncertainty exists regarding variable consideration, these amounts are excluded from the transaction price and recognised when the uncertainty is reasonably removed.
Customer payments are generally defined in the contract through a payment schedule, which may require customer acceptance for services rendered. Pearson has a history of providing satisfactory services which are accepted by the customer. While a delay between rendering of services and payment may exist, payment terms are within 12 months and the Group has elected to use the practical expedient available in IFRS 15 ‘Revenue from Contracts with Customers’ and not identify a significant financing component on these transactions.
Revenue is recognised for Assessment contracts over time as the customer is benefiting as performance takes place through a continuous transfer of control to the customer. This continuous transfer of control to the customer is supported by clauses in the contracts which may allow the customer to terminate for convenience, compensate us for work performed to date, and take possession of work in process.
As control transfers over time, revenue is recognised based on the extent of progress towards completion of the performance obligation. The selection of the method to measure progress towards completion requires judgement and is based on the nature of the services provided. Revenue is recognised on a percentage of costs basis, calculated using the proportion of the total estimated costs incurred to date. From 2021, the proportion of estimated costs incurred to date was primarily based on historical cost analysis for similar groups of contracts, with regular
true-ups
to contract costs throughout the contract period. Previously, the proportion of estimated costs incurred to date was based on individual contract analysis. The change in input methodology did not result in a material impact on revenue recognition. Percentage of completion is used to recognise the transfer of control of services provided as these services are not provided evenly throughout the testing cycle and involve varying degrees of effort during the contract term.Losses on contracts are recognised in the period in which the loss first becomes foreseeable. Contract losses are determined to be the amount by which estimated total costs of the contract exceed the estimated total revenues that will be generated.
In Assessments contracts driven primarily by transactions directly to end users, Pearson’s main obligation to the customer involves test delivery and scoring. Test delivery and scoring are defined as a single performance obligation delivered over time whether the test is subsequently manually scored or digitally scored on the day of the assessment. Customers may also purchase print and digital supplemental materials. Print products in this revenue stream are recognised at a point in time when control passes to the customer upon shipment. Recognition of digital revenue will occur based on the extent of Pearson’s ongoing hosting obligation.
| Annual report and accounts 2022 Pearson plc 153 |
Financial statements
Notes to the consolidated financial statements
continued
3. Revenue from contracts with customers continued
Services
Revenue is primarily generated from multi-year contractual arrangements related to large-scale educational service delivery to academic institutions, such as schools and higher education universities. Under these arrangements, while an agreement may span multiple years, the contract duration has been determined to be each academic period based on the structure of contracts, including clauses regarding termination. While in some cases the customer may have the ability to terminate during the term for convenience, significant financial or qualitative barriers exist limiting the potential for such terminations in the middle of an academic period. The academic period for this customer base is normally an academic year for schools and a semester for higher education universities.
Within each academic period, a variety of services are provided such as programme development, student acquisition, education technology and student support services. These services are not distinct in the context of the customer contract as Pearson provides an integrated managed service offering and these activities are accounted for together as a comprehensive performance obligation.
Where Services are provided to university customers, volume and transaction price are fixed at the start of the semester. Where Services are provided to school customers, the transaction price may contain both fixed and variable amounts which require estimation during the academic period. Estimation is required where consideration is based upon average enrolments or other metrics which are not known at the start of the academic year. Variable consideration is measured using the expected value method. Historical experience, current trends, local circumstances and customer-specific funding formulas are considered in estimating and constraining variable consideration. To the extent that a higher degree of uncertainty exists regarding variable consideration, these amounts are excluded from the transaction price and recognised when the uncertainty is reasonably removed.
Customer payments are generally defined in the contract as occurring shortly after invoicing. Where there is a longer payment term offered to a customer through a payment schedule, payment terms are within 12 months and the Group has elected to use the practical expedient available in IFRS 15 and not identify a significant financing component on these transactions.
Revenue is recognised for Service contracts over time as the customer is benefiting as performance takes place through a continuous transfer of control to the customer. This continuous transfer of control to the customer is supported by clauses in the contracts which may allow the customer to terminate for convenience, compensate for work performed to date, and take possession of work in process.
As control transfers over time, revenue is recognised based on the extent of progress towards completion of the performance obligation. The selection of the method to measure progress towards completion requires judgement and is based on the nature of the products or services provided. Within the comprehensive service obligation, the timing of services occurs relatively evenly over each academic period and, as such, time elapsed is used to recognise the transfer of control to the customer on a straight-line basis.
Losses on contracts are recognised in the period in which the loss first becomes foreseeable. Contract losses are determined to be the amount by which estimated total costs of the contract exceed the estimated total revenues that will be generated.
In cases of optional or
add-on
purchases, institutions may purchase physical goods priced at their standalone value, which are accounted for separately and recognised at the point in time when control passes to the customer upon shipment.b. Disaggregation of revenue
The tables in notes 2 and 3 show revenue from contracts with customers disaggregated by operating segment, geography and revenue stream. These disaggregation categories are appropriate as they represent the key groupings used in managing and evaluating underlying performance of each of the businesses. The categories also reflect groups of similar types of transactional characteristics, among similar customers, with similar accounting conclusions.
154 Pearson plc |
c. Contract balances
Transactions within the Courseware revenue stream generally entail customer billings at or near the contract’s inception and accordingly Courseware deferred income balances are primarily related to subscription performance obligations to be delivered over time.
Transactions within the Assessments and Services revenue streams generally entail customer billings over time based on periodic intervals, progress towards milestones or enrolment census dates. As the performance obligations within these arrangements are delivered over time, the extent of accrued income or deferred income will ultimately depend upon the difference between revenue recognised and billings to date.
Refer to note 22 for opening and closing balances of accrued income. Refer to note 24 for opening and closing balances of deferred income. Revenue recognised during the period from changes in deferred income was driven primarily by the release of revenue over time from digital subscriptions.
d. Contract costs
The Group capitalises incremental costs to obtain contracts with customers where it is expected these costs will be recoverable. Incremental costs to obtain contracts with customers are considered those which would not have been incurred if the contract had not been obtained. For the Group, these costs relate primarily to sales commissions. The Group has elected to use the practical expedient as allowable by IFRS 15 whereby such costs will be expensed as incurred where the expected amortisation period is one year or less. Where the amortisation period is greater than one year, these costs are amortised over the contract term on a systematic basis consistent with the transfer of the underlying goods and services within the contract to which these costs relate, which will generally be on a rateable basis.
The Group does not recognise any material costs to fulfil contracts with customers as these types of activities are governed by other accounting standards.
There were no deferred contract costs in 2022, 2021 or 2020.
e. Remaining transaction price
The below table depicts the remaining transaction price on unsatisfied or partially unsatisfied performance obligations from contracts with customers.
2022 | ||||||||||||||||||||||||||||
| All figures in £ millions | Sales | Deferred income | Committed sales | Total remaining transaction price | 2023 | 2024 | 2025 and later | |||||||||||||||||||||
Courseware | ||||||||||||||||||||||||||||
| Products transferred at a point in time | 626 | 1 | – | 1 | 1 | – | – | |||||||||||||||||||||
| Products and services transferred over time | 640 | 95 | – | 95 | 56 | 14 | 25 | |||||||||||||||||||||
Assessments | ||||||||||||||||||||||||||||
| Products transferred at a point in time | 188 | – | – | – | – | – | – | |||||||||||||||||||||
| Products and services transferred over time | 1,470 | 262 | 472 | 734 | 524 | 206 | 4 | |||||||||||||||||||||
Services | ||||||||||||||||||||||||||||
| Products transferred at a point in time | 29 | – | – | – | – | – | – | |||||||||||||||||||||
| Products and services transferred over time – subscriptions | 351 | 20 | 7 | 27 | 27 | – | – | |||||||||||||||||||||
| Products and services transferred over time – other ongoing performance obligations | 537 | 22 | 225 | 247 | 247 | – | – | |||||||||||||||||||||
Total | 3,841 | 400 | 704 | 1,104 | 855 | 220 | 29 | |||||||||||||||||||||
| Annual report and accounts 2022 Pearson plc 155 |
Financial statements
Notes to the consolidated financial statements
continued
3. Revenue from contracts with customers continued
| 2021 | ||||||||||||||||||||||||||||
| All figures in £ millions | Sales | Deferred income | Committed sales | Total remaining transaction price | 2022 | 2023 | 2024 and later | |||||||||||||||||||||
Courseware | ||||||||||||||||||||||||||||
| Products transferred at a point in time | 634 | 1 | – | 1 | 1 | – | – | |||||||||||||||||||||
| Products and services transferred over time | 631 | 93 | – | 93 | 60 | 11 | 22 | |||||||||||||||||||||
Assessments | ||||||||||||||||||||||||||||
| Products transferred at a point in time | 195 | – | – | – | – | – | – | |||||||||||||||||||||
| Products and services transferred over time | 1,164 | 255 | 442 | 697 | 503 | 191 | 3 | |||||||||||||||||||||
Services | ||||||||||||||||||||||||||||
| Products transferred at a point in time | 36 | – | – | – | – | – | – | |||||||||||||||||||||
| Products and services transferred over time – subscriptions | 290 | 13 | 10 | 23 | 23 | – | – | |||||||||||||||||||||
| Products and services transferred over time – other ongoing performance obligations | 478 | 24 | 220 | 244 | 244 | – | – | |||||||||||||||||||||
Total | 3,428 | 386 | 672 | 1,058 | 831 | 202 | 25 | |||||||||||||||||||||
| 2020 | ||||||||||||||||||||||||||||
| All figures in £ millions | Sales | Deferred income | Committed sales | Total remaining transaction price | 2021 | 2022 | 2023 and later | |||||||||||||||||||||
Courseware | ||||||||||||||||||||||||||||
| Products transferred at a point in time | 670 | – | – | – | – | – | – | |||||||||||||||||||||
| Products and services transferred over time | 696 | 105 | 14 | 119 | 84 | 14 | 21 | |||||||||||||||||||||
Assessments | ||||||||||||||||||||||||||||
| Products transferred at a point in time | 148 | 1 | – | 1 | 1 | – | – | |||||||||||||||||||||
| Products and services transferred over time | 1,071 | 217 | 413 | 630 | 426 | 203 | 1 | |||||||||||||||||||||
Services | ||||||||||||||||||||||||||||
| Products transferred at a point in time | 44 | – | – | – | – | – | – | |||||||||||||||||||||
| Products and services transferred over time – subscriptions | 323 | 18 | 10 | 28 | 27 | 1 | – | |||||||||||||||||||||
| Products and services transferred over time – other ongoing performance obligations | 445 | 18 | 195 | 213 | 213 | – | – | |||||||||||||||||||||
Total | 3,397 | 359 | 632 | 991 | 751 | 218 | 22 | |||||||||||||||||||||
Committed sales amounts are equal to the transaction price from contracts with customers, excluding those amounts previously recognised as revenue and amounts currently recognised in deferred income. The total of committed sales and deferred income is equal to the remaining transaction price. Time bands stated above represent the expected timing of when the remaining transaction price will be recognised as revenue.
156 Pearson plc |
4. Operating expenses
| All figures in £ millions | 2022 | 2021 | 2020 | |||||||||||||
By function: | ||||||||||||||||
| Cost of goods sold | 2,046 | 1,747 | 1,767 | |||||||||||||
Operating expenses | ||||||||||||||||
| Distribution costs | 61 | 62 | 59 | |||||||||||||
| Selling, marketing and product development costs | 564 | 521 | 572 | |||||||||||||
| Administrative and other expenses | 823 | 802 | 816 | |||||||||||||
| Restructuring costs | 150 | 214 | – | |||||||||||||
| Other income | (49 | ) | (37 | ) | (45 | ) | ||||||||||
Total net operating expenses | 1,549 | 1,562 | 1,402 | |||||||||||||
| Other net gains and losses | (24 | ) | (63 | ) | (178 | ) | ||||||||||
Total | 3,571 | 3,246 | 2,991 | |||||||||||||
Other income includes freight income and sublet income. Included in administrative and other expenses are research and efficacy costs of £10m (2021: £12m; 2020: £11m). Other net gains in 2022, largely relate to the gain on the sales of certain businesses (see note 31) and a gain arising on a decrease in the deferred consideration payable on prior year acquisitions, offset by costs related to disposals and acquisitions. In 2021, other net gains and losses largely relate to the sale of interests in PIHE in South Africa and the school business in Brazil. In 2020, other net gains and losses largely relate to the sale of the remaining interest in Pearson Random House (£180m gain).
In August 2022, the Group announced a major restructuring programme to run in 2022. The programme includes efficiencies in product and content, support costs, technology and corporate property. The restructuring costs in 2022 of £150m mainly relate to severance and impairment ofproperty assets. In March 2021, the Group announced a major restructuring programme to run in 2021, principally comprising the reorganisation of the Group into five global business divisions and the simplification of the Group’s property portfolio. An analysis of major restructuring costs are as follows:
right-of-use
| All figures in £ millions | 2022 | 2021 | 2020 | |||||||||||||
By nature: | ||||||||||||||||
| Product costs | 11 | 19 | – | |||||||||||||
| Employee costs | 73 | 32 | – | |||||||||||||
Depreciation and impairment of non-current assets | 51 | 145 | – | |||||||||||||
| Property and facilities | 7 | 11 | – | |||||||||||||
| Technology and communications | 1 | 3 | – | |||||||||||||
| Professional and outsourced services | 7 | 4 | – | |||||||||||||
Total restructuring – operating expenses | 150 | 214 | – | |||||||||||||
| Annual report and accounts 2022 Pearson plc 157 |
Financial statements
Notes to the consolidated financial statements
continued
4. Operating expenses continued
| All figures in £ millions | Notes | 2022 | 2021 | 2020 | ||||||||||||
By nature: | ||||||||||||||||
| Royalties expensed | 194 | 185 | 191 | |||||||||||||
| Other product costs | 412 | 353 | 349 | |||||||||||||
| Employee benefit expense | 5 | 1,605 | 1,365 | 1,337 | ||||||||||||
| Contract labour | 73 | 69 | 67 | |||||||||||||
| Employee-related expense | 52 | 21 | 30 | |||||||||||||
| Promotional costs | 268 | 239 | 233 | |||||||||||||
| Depreciation and impairment of property, plant and equipment and investment property | 10 | 136 | 241 | 125 | ||||||||||||
| Amortisation and impairment of intangible assets – product development | 20 | 303 | 279 | 280 | ||||||||||||
| Amortisation and impairment of intangible assets – software | 11 | 125 | 117 | 112 | ||||||||||||
| Amortisation and impairment of intangible assets – other | 11 | 54 | 50 | 80 | ||||||||||||
| Property and facilities | 102 | 124 | 85 | |||||||||||||
| Technology and communications | 221 | 215 | 216 | |||||||||||||
| Professional and outsourced services | 501 | 477 | 498 | |||||||||||||
| Other general and administrative costs | 76 | 58 | 71 | |||||||||||||
| Costs capitalised | (478 | ) | (447 | ) | (460 | ) | ||||||||||
| Other net gains and losses | (24 | ) | (63 | ) | (178 | ) | ||||||||||
| Other income | (49 | ) | (37 | ) | (45 | ) | ||||||||||
Total | 3,571 | 3,246 | 2,991 | |||||||||||||
During the year the Group obtained the following services from the Group’s auditors, which changed to EY in 2022 and was PwC in 2021 and 2020:
| All figures in £ millions | 2022 | 2021 | 2020 | |||||||||||||
| The audit of parent company and consolidated financial statements | 6 | 5 | 5 | |||||||||||||
| The audit of the company’s subsidiaries | 1 | 2 | 2 | |||||||||||||
Total audit fees | 7 | 7 | 7 | |||||||||||||
| Audit-related and other assurance services | – | – | – | |||||||||||||
Other non-audit services | – | – | – | |||||||||||||
Total other services | – | – | – | |||||||||||||
Total non-audit services | – | – | – | |||||||||||||
Total | 7 | 7 | 7 | |||||||||||||
Reconciliation between audit and
non-audit
service fees is shown below:| All figures in £ millions | 2022 | 2021 | 2020 | |||||||||||||
| Group audit fees including fees for attestation under section 404 of the Sarbanes-Oxley Act | 7 | 7 | 7 | |||||||||||||
Non-audit fees | – | – | – | |||||||||||||
Total | 7 | 7 | 7 | |||||||||||||
Fees for attestation under section 404 of the Sarbanes-Oxley Act are allocated between fees payable for the audits of consolidated and subsidiary accounts.
158 Pearson plc |
5. Employee information
| All figures in £ millions | Notes | 2022 | 2021 | 2020 | ||||||||||||
Employee benefit expense | ||||||||||||||||
| Wages and salaries (including termination costs) | 1,382 | 1,180 | 1,152 | |||||||||||||
| Social security costs | 113 | 95 | 96 | |||||||||||||
| Share-based payment costs | 26 | 35 | 28 | 29 | ||||||||||||
| Retirement benefits – defined contribution plans | 25 | 46 | 37 | 47 | ||||||||||||
| Retirement benefits – defined benefit plans | 25 | 29 | 25 | 13 | ||||||||||||
Total | 1,605 | 1,365 | 1,337 | |||||||||||||
An additional £3m of share-based payment costs (2021: £nil; 2020: £nil) in respect of remuneration for post-acquisition services for recent acquisitions is included in other net gains and losses in the income statement.
The details of the emoluments of the Directors of Pearson plc are shown in the report on Directors’ remuneration.
| Average number employed | 2022 | 2021 | 2020 | |||||||||||||
Employee numbers | ||||||||||||||||
| UK | 3,244 | 3,395 | 3,304 | |||||||||||||
| Other European countries | 809 | 878 | 886 | |||||||||||||
| US | 11,357 | 11,757 | 11,432 | |||||||||||||
| Canada | 522 | 593 | 648 | |||||||||||||
| Asia Pacific | 3,369 | 2,738 | 2,812 | |||||||||||||
| Other countries | 1,137 | 1,383 | 2,109 | |||||||||||||
Total | 20,438 | 20,744 | 21,191 | |||||||||||||
6. Net finance costs
| All figures in £ millions | Notes | 2022 | 2021 1 | 2020 1 | ||||||||||||
| Interest payable on financial liabilities at amortised cost and associated derivatives | (32 | ) | (30 | ) | (31 | ) | ||||||||||
| Interest on lease liabilities | (25 | ) | (27 | ) | (41 | ) | ||||||||||
| Net foreign exchange losses | – | – | (6 | ) | ||||||||||||
| Interest on deferred and contingent consideration | (5 | ) | – | – | ||||||||||||
| Interest on tax provisions | (7 | ) | (11 | ) | (7 | ) | ||||||||||
| Derivatives not in a hedge relationship | (2 | ) | – | (22 | ) | |||||||||||
Finance costs | (71 | ) | (68 | ) | (107 | ) | ||||||||||
| Interest receivable on financial assets at amortised cost | 18 | 5 | 9 | |||||||||||||
| Interest on lease receivables | 5 | 6 | 9 | |||||||||||||
| Net finance income in respect of retirement benefits | 25 | 9 | 4 | 6 | ||||||||||||
| Fair value remeasurement of disposal proceeds | – | 6 | 26 | |||||||||||||
| Fair value movements on investments held at fair value | 28 | 20 | 26 | |||||||||||||
| Net foreign exchange gains | 1 | 1 | – | |||||||||||||
| Interest on tax provisions | 35 | – | – | |||||||||||||
| Derivatives not in a hedge relationship | 27 | 20 | – | |||||||||||||
Finance income | 123 | 62 | 76 | |||||||||||||
Net finance income/(costs) | 52 | (6 | ) | (31 | ) | |||||||||||
1. Comparative balances have been restated – see Note 1b.
Net movement in the fair value of hedges is further explained in note 16. Derivatives not in a hedge relationship include fair value movements in the interest rate and cross-currency interest rate swaps.
| Annual report and accounts 2022 Pearson plc 159 |
Financial statements
Notes to the consolidated financial statements
continued
7. Income tax
| All figures in £ millions | Notes | 2022 | 2021 1 | 2020 1 | ||||||||||||
Current tax | ||||||||||||||||
| Charge in respect of current year | (127 | ) | (103 | ) | (18 | ) | ||||||||||
| Adjustments in respect of prior years | 18 | (12 | ) | 4 | ||||||||||||
Total current tax charge | (109 | ) | (115 | ) | (14 | ) | ||||||||||
Deferred tax | ||||||||||||||||
| In respect of temporary differences | 29 | 103 | (34 | ) | ||||||||||||
| Other adjustments in respect of prior years | 1 | 13 | (2 | ) | ||||||||||||
Total deferred tax credit/(charge) | 13 | 30 | 116 | (36 | ) | |||||||||||
Total tax (charge)/credit | (79 | ) | 1 | (50 | ) | |||||||||||
| 1. | Comparative balances have been restated – see Note 1b. |
The adjustments in respect of prior years in 2022 is primarily due to movements in provisions for tax uncertainties, whilst in 2021 and 2020 the differences primarily arise from revising the previous year’s reported tax provision to reflect the tax returns subsequently filed. This results in a change between deferred and current tax as well as an absolute benefit to the total tax charge. The tax on the Group’s profit before tax differs from the theoretical amount that would arise using the UK tax rate as follows:
| All figures in £ millions | 2022 | 2021 | 2020 | |||||||||||||
| Profit before tax | 323 | 177 | 380 | |||||||||||||
| Tax calculated at UK rate (2022: 19%; 2021: 19%; 2020: 19%) | (62 | ) | (34 | ) | (72 | ) | ||||||||||
| Effect of overseas tax rates | (12 | ) | (24 | ) | (7 | ) | ||||||||||
| Effect of UK rate change | 3 | 25 | (5 | ) | ||||||||||||
| Joint venture and associate income reported net of tax | – | – | 1 | |||||||||||||
| Intra-group financing benefit | – | 7 | 14 | |||||||||||||
| Net expense not subject to tax | (9 | ) | (9 | ) | (7 | ) | ||||||||||
| Gains and losses on sale of businesses not subject to tax | 2 | 4 | 21 | |||||||||||||
| Unrecognised tax losses | 3 | 9 | (21 | ) | ||||||||||||
| Benefit from changes in local tax law | – | 11 | – | |||||||||||||
| Benefit from US accounting method changes | – | 11 | – | |||||||||||||
| Movement in provisions for tax uncertainties - current year | (23 | ) | – | 24 | ||||||||||||
| Adjustments in respect of prior years - movement in provisions for tax uncertainties | 13 | – | – | |||||||||||||
| Adjustments in respect of prior years - other | 6 | 1 | 2 | |||||||||||||
Total tax (charge)/credit | (79 | ) | 1 | (50 | ) | |||||||||||
| UK | (41 | ) | 27 | 23 | ||||||||||||
| Overseas | (38 | ) | (26 | ) | (73 | ) | ||||||||||
Total tax (charge)/credit | (79 | ) | 1 | (50 | ) | |||||||||||
| Tax rate reflected in earnings | 24.5% | (0.6)% | 13.2% | |||||||||||||
| 1. | Comparative balances have been restated – see Note 1b. |
 | Key judgements | |||||
| The application of tax legislation in relation to provisions for uncertain tax positions. | ||||||
 | Key areas of estimation | |||||
The level of provisions required in relation to uncertain tax positions is complex and each matter is separately assessed. The estimation of future settlement amounts is based on a number of factors including the status of the unresolved matter, clarity of legislation, range of possible outcomes and the statute of limitations. | ||||||
Included in net expense not subject to tax are foreign taxes not creditable, the tax impact of share-based payments and other expenses not deductible.
Factors which may affect future tax charges include changes in tax legislation, transfer pricing regulations, the level and mix of profitability in different countries, and settlements with tax authorities.
160 Pearson plc port and accounts 2022 |
The movement in provisions for tax uncertainties primarily reflects releases due to the expiry of relevant statutes of limitation, settlement of certain audits and the establishment of provisions for new uncertain tax positions, primarily the potential State Aid exposure offset against the release of US provisions following the expiry of the statute of limitations for certain periods. The current tax liability of £43m (2021: £125m; 2020: £84m) includes £28m (2021: £104m; 2020: £104m) of provisions for tax uncertainties principally in respect of several matters in the US and the UK.
The Group is currently under audit in several countries, and the timing of any resolution of these audits is uncertain. In most countries, tax years up to and including 2017 are now statute barred from examination by tax authorities, however, a balance of £3m relates to certain remaining open issues. Of the remaining £25m balance, £1m relates to 2018, £14m to 2019, £5m to 2020, £3m to 2021 and £2m to 2022. The tax authorities may take a different view from management and the final liability may be greater than provided.
The matters provided for include a provision of £63m related to the potential State Aid exposure and the potential disallowance of intra-group charges. In relation to the potential State Aid exposure, a payment has been made in relation to the maximum potential exposure with the p
ro
vision of £63m offset against this resulting in a £41mnon-current
tax debtor.Contingent liabilities relating to tax are disclosed in note 34.
The tax benefit/(charge) recognised in other comprehensive income is as follows:
| All figures in £ millions | 2022 | 2021 | 2020 | |||||||||
| Net exchange differences on translation of foreign operations | 4 | 10 | (13 | ) | ||||||||
| Fair value gain on other financial assets | 1 | (1 | ) | – | ||||||||
| Remeasurement of retirement benefit obligations | (12 | ) | (61 | ) | 2 | |||||||
(7 | ) | (52 | ) | (11 | ) | |||||||
| 1. | Comparative balances have been restated – see Note 1b. |
| Annual report and accounts 2022 Pearson plc 161 |
Financial statements
Notes to the consolidated financial statements
continued
8. Earnings per share
Basic earnings per share is calculated by dividing the profit or loss attributable to equity shareholders of the company (earnings) by the weighted average number of ordinary shares in issue during the year, excluding ordinary shares purchased by the company and held as treasury shares.
Diluted earnings per share is calculated by adjusting the weighted average number of ordinary shares to take account of all dilutive potential ordinary shares and adjusting the profit attributable, if applicable, to account for any tax consequences that might arise from conversion of those shares.
Certain contingently issuable shares vested on 31 December 2022 but have not yet been issued, these shares are considered dilutive for 2022 but do not materially impact basic EPS.
| All figures in £ millions | 2022 | 2021 1 | 2020 1 | |||||||||
| Earnings for the year | 244 | 178 | 330 | |||||||||
Non-controlling interest | (2 | ) | (1 | ) | – | |||||||
Earnings attributable to equity shareholders | 242 | 177 | 330 | |||||||||
| Weighted average number of shares (millions) | 738.1 | 754.1 | 755.4 | |||||||||
| Effect of dilutive share options (millions) | 3.9 | 5.0 | – | |||||||||
| Weighted average number of shares (millions) for diluted earnings | 742.0 | 759.1 | 755.4 | |||||||||
Earnings per share (in pence per share) | ||||||||||||
| Basic | 32.8p | 23.5p | 43.7p | |||||||||
| Diluted | 32.6p | 23.3p | 43.7p | |||||||||
| 1. | Comparative balances have been restated – see Note 1b. |
162 Pearson plc |
Page intentionally left blank
Annual report and accounts 2022 Pearson plc 163 |
Financial statements
Notes to the consolidated financial statements
continued
9. Dividends
| All figures in £ millions | 2022 | 2021 | 2020 | |||||||||
| Final paid in respect of prior year 14.2p (2020: 13.5p; 2021: 13.5p) | 107 | 102 | 101 | |||||||||
| Interim paid in respect of current year 6.6p (2020: 6.0p; 2021: 6.3p) | 49 | 47 | 45 | |||||||||
156 | 149 | 146 | ||||||||||
The Directors are proposing a final dividend in respect of the financial year ended 31 December 2022 of 14.9p per equity share which will absorb an estimated £107m of shareholders’ funds. It will be paid on 5 May 2023 to shareholders who are on the register of members on 24 March 2023. These financial statements do not reflect this dividend.
10. Property, plant and equipment and investment property
Right-of-use | Owned assets | |||||||||||||||||||||||||||||
| All figures in £ millions | Investment property | Land and buildings | Plant and equipment | Land and buildings | Plant and equipment | Assets in the course of construction | Total | |||||||||||||||||||||||
Cost | ||||||||||||||||||||||||||||||
| At 1 January 2021 | – | 439 | 12 | 296 | 308 | 21 | 1,076 | |||||||||||||||||||||||
| Exchange differences | – | – | – | 2 | (3 | ) | – | (1 | ) | |||||||||||||||||||||
| Additions | – | 32 | – | 8 | 17 | 39 | 96 | |||||||||||||||||||||||
| Disposals and retirements | – | (6 | ) | (7 | ) | (100 | ) | (72 | ) | – | (185 | ) | ||||||||||||||||||
| Reclassifications and transfers | – | – | – | 35 | – | (31 | ) | 4 | ||||||||||||||||||||||
| Transfer to assets classified as held for sale | – | – | – | (15 | ) | – | – | (15 | ) | |||||||||||||||||||||
At 31 December 2021 | – | 465 | 5 | 226 | 250 | 29 | 975 | |||||||||||||||||||||||
| Exchange differences | – | 30 | – | 18 | 23 | – | 71 | |||||||||||||||||||||||
| Additions | 22 | 33 | 1 | 4 | 8 | 33 | 101 | |||||||||||||||||||||||
| Transfers to investment property | 174 | (141 | ) | – | (32 | ) | (1 | ) | – | – | ||||||||||||||||||||
| Disposals of businesses (note 31) | – | (10 | ) | – | (1 | ) | (8 | ) | – | (19 | ) | |||||||||||||||||||
| Disposals and retirements | (6 | ) | (23 | ) | (1 | ) | (5 | ) | (39 | ) | – | (74 | ) | |||||||||||||||||
| Reclassifications and transfers | – | – | – | 13 | 27 | (40 | ) | – | ||||||||||||||||||||||
| Transfer to assets classified as held for sale | – | – | – | (45 | ) | (3 | ) | – | (48 | ) | ||||||||||||||||||||
At 31 December 2022 | 190 | 354 | 5 | 178 | 257 | 22 | 1,006 | |||||||||||||||||||||||
164 Pearson plc |
Right-of-use | Owned assets | |||||||||||||||||||||||||||||
| All figures in £ millions | Investment property | Land and buildings | Plant and equipment | Land and buildings | Plant and equipment | Assets in the course of construction | Total | |||||||||||||||||||||||
Depreciation and impairment | ||||||||||||||||||||||||||||||
| At 1 January 2021 | – | (110 | ) | (9 | ) | (199 | ) | (243 | ) | – | (561 | ) | ||||||||||||||||||
| Exchange differences | – | (1 | ) | 1 | (1 | ) | 1 | – | – | |||||||||||||||||||||
| Charge for the year | – | (46 | ) | (3 | ) | (16 | ) | (30 | ) | – | (95 | ) | ||||||||||||||||||
| Disposals and retirements | – | 7 | 6 | 99 | 71 | – | 183 | |||||||||||||||||||||||
| Reclassifications and transfers | – | – | – | (5 | ) | 7 | – | 2 | ||||||||||||||||||||||
| Impairment | – | (119 | ) | – | (22 | ) | (5 | ) | – | (146 | ) | |||||||||||||||||||
| Transfer to assets classified as held for sale | – | – | – | 8 | – | – | 8 | |||||||||||||||||||||||
At 31 December 2021 | – | (269 | ) | (5 | ) | (136 | ) | (199 | ) | – | (609 | ) | ||||||||||||||||||
| Exchange differences | – | (17 | ) | – | (14 | ) | (18 | ) | – | (49 | ) | |||||||||||||||||||
| Transfers to investment property | (105 | ) | 101 | – | 3 | 1 | – | – | ||||||||||||||||||||||
| Charge for the year | (6 | ) | (44 | ) | (1 | ) | (13 | ) | (26 | ) | – | (90 | ) | |||||||||||||||||
| Disposals of businesses (note 31) | – | 2 | – | 1 | 5 | – | 8 | |||||||||||||||||||||||
| Disposals and retirements | – | 13 | 1 | 5 | 39 | – | 58 | |||||||||||||||||||||||
| Reclassifications and transfers | – | – | – | – | – | – | – | |||||||||||||||||||||||
| Impairment | (19 | ) | (15 | ) | – | (9 | ) | (3 | ) | – | (46 | ) | ||||||||||||||||||
| Transfer to assets classified as held for sale | – | – | – | 30 | 2 | – | 32 | |||||||||||||||||||||||
At 31 December 2022 | (130 | ) | (229 | ) | (5 | ) | (133 | ) | (199 | ) | – | (696 | ) | |||||||||||||||||
Carrying amounts | ||||||||||||||||||||||||||||||
| At 1 January 2021 | – | 329 | 3 | 97 | 65 | 21 | 515 | |||||||||||||||||||||||
| At 31 December 2021 | – | 196 | – | 90 | 51 | 29 | 366 | |||||||||||||||||||||||
At 31 December 2022 | 60 | 125 | – | 45 | 58 | 22 | 310 | |||||||||||||||||||||||
| ||||
The recoverability of right-of-use | ||||
Depreciation expense of £45m (2021: £40m; 2020: £44m) has been included in the income statement in cost of goods sold and £45m (2021: £55m; 2020: £81m) in operating expenses. The impairment charge of £46m (2021: £146m; 2020: £nil) has been included within operating expenses within the income statement.
Property, plant and equipment (including investment property) assets are assessed for impairment triggers annually or when triggering events occur. In 2022, similar to 2021, as part of a major restructuring programme, the Group continued to simplify its property portfolio, reducing the overall office space required. All property related assets were assessed for impairment as a result of this triggering event and impairment charges of £46m (2021: £141m) have been recognised within costs of major restructuring (see note 4 for details). The recoverability of certain of the Group’sassets is now based on the Group’s ability to sublease vacant space. This involves the use of assumptions related to future subleases including the achievable rent, lease start dates, lease incentives such as rent free periods and the discount rate applied. Should the future sublease outcomes be more or less favourable than the assumptions used by management this could result in additional impairment charges or reversals of impairment charges.
right-of-use
Investment property
Buildings, or portions of buildings, that are no longer occupied by the Group and are held for operating lease rental are classified as investment property. Investment property includes both,assets and owned assets. The Group recognised rental income of £3m (2021: £nil; 2020 £nil) in relation to properties classified as investment property. Investment property is measured using the cost model. As a result of recent impairments, the fair value of investment property is equal to the carrying value. The fair value of investment property has been determined using a discounted cash flow model. The valuation model is internally generated but uses inputs from external, independent property valuers, having appropriate recognised professional qualifications and recent experience in the location and category of the property being valued. The valuations require the application of judgement and involve the use of known inputs for existing contracted subleases as well as assumptions related to future potential subleases including the achievable rent, lease start dates, lease incentives such as rent free periods and the discount rate applied. The fair value measurement of investment properties has been classified as level 3 within the fair value hierarchy based on the inputs and valuation technique used. Should the future sublease outcomes be more or less favourable than the assumptions used by management this could result in additional impairment charges or reversals of impairment charges.
right-of-use
| Annual report and accounts 2022 Pearson plc 165 |
Financial statements
Notes to the consolidated financial statements
continued
11. Intangible assets
| All figures in £ millions | Goodwill | Software | Acquired customer lists, contracts and relationships | Acquired trademarks and brands | Acquired publishing rights | Other intangibles acquired | Total | |||||||||||||||||||||
Cost | ||||||||||||||||||||||||||||
At 1 January 2021 | 2,094 | 1,104 | 751 | 198 | 97 | 349 | 4,593 | |||||||||||||||||||||
| Exchange differences | 8 | 5 | 4 | (2 | ) | – | (2 | ) | 13 | |||||||||||||||||||
| Additions – internal development | – | 110 | – | – | – | – | 110 | |||||||||||||||||||||
| Additions – purchased | – | 2 | – | – | – | – | 2 | |||||||||||||||||||||
| Disposals and retirements | – | (135 | ) | – | (25 | ) | – | (43 | ) | (203 | ) | |||||||||||||||||
| Acquisition of subsidiary (note 30) | 43 | – | – | – | – | 27 | 70 | |||||||||||||||||||||
| Disposal of subsidiary (note 31) | – | – | (14 | ) | (3 | ) | – | (10 | ) | (27 | ) | |||||||||||||||||
| Transfers | – | 1 | – | – | – | – | 1 | |||||||||||||||||||||
At 31 December 2021 | 2,145 | 1,087 | 741 | 168 | 97 | 321 | 4,559 | |||||||||||||||||||||
| Exchange differences | 206 | 83 | 80 | 20 | 5 | 44 | 438 | |||||||||||||||||||||
| Additions – internal development | – | 86 | – | – | – | – | 86 | |||||||||||||||||||||
| Additions – purchased | – | 4 | – | – | – | – | 4 | |||||||||||||||||||||
| Disposals and retirements | – | (131 | ) | – | – | – | – | (131 | ) | |||||||||||||||||||
| Acquisition of subsidiary (note 30) | 204 | – | 37 | 6 | 1 | 66 | 314 | |||||||||||||||||||||
| Disposal of subsidiary (note 31) | (75 | ) | (9 | ) | (20 | ) | (8 | ) | – | (1 | ) | (113 | ) | |||||||||||||||
| Transfers | – | (5 | ) | – | – | – | – | (5 | ) | |||||||||||||||||||
At 31 December 2022 | 2.480 | 1,115 | 838 | 186 | 103 | 430 | 5,152 | |||||||||||||||||||||
| All figures in £ millions | Goodwill | Software | Acquired customer lists, contracts and relationships | Acquired trademarks and brands | Acquired publishing rights | Other intangibles acquired | Total | |||||||||||||||||||||
Amortisation and impairment | ||||||||||||||||||||||||||||
At 1 January 2021 | – | (676 | ) | (594 | ) | (158 | ) | (95 | ) | (328 | ) | (1,851 | ) | |||||||||||||||
| Exchange differences | – | (5 | ) | (4 | ) | 1 | (1 | ) | 4 | (5 | ) | |||||||||||||||||
| Charge for the year | – | (113 | ) | (34 | ) | (8 | ) | – | (8 | ) | (163 | ) | ||||||||||||||||
| Impairment charge | – | (4 | ) | – | – | – | – | (4 | ) | |||||||||||||||||||
| Disposals and retirements | – | 135 | – | 25 | – | 43 | 203 | |||||||||||||||||||||
| Disposal of subsidiary (note 31) | – | – | 12 | 2 | – | 10 | 24 | |||||||||||||||||||||
| Transfers | – | 6 | – | – | – | – | 6 | |||||||||||||||||||||
At 31 December 2021 | – | (657 | ) | (620 | ) | (138 | ) | (96 | ) | (279 | ) | (1,790 | ) | |||||||||||||||
| Exchange differences | – | (49 | ) | (65 | ) | (16 | ) | (5 | ) | (37 | ) | (172 | ) | |||||||||||||||
| Charge for the year | – | (125 | ) | (33 | ) | (8 | ) | – | (13 | ) | (179 | ) | ||||||||||||||||
| Impairment charge | – | – | – | – | – | – | – | |||||||||||||||||||||
| Disposals and retirements | – | 130 | – | – | – | – | 130 | |||||||||||||||||||||
| Disposal of subsidiary (note 31) | – | 8 | 20 | 7 | – | 1 | 36 | |||||||||||||||||||||
| Transfers | – | – | – | – | – | – | – | |||||||||||||||||||||
At 31 December 2022 | – | (693 | ) | (698 | ) | (155 | ) | (101 | ) | (328 | ) | (1,975 | ) | |||||||||||||||
Carrying amounts | ||||||||||||||||||||||||||||
| At 1 January 2021 | 2,094 | 428 | 157 | 40 | 2 | 21 | 2,742 | |||||||||||||||||||||
| At 31 December 2021 | 2,145 | 430 | 121 | 30 | 1 | 42 | 2,769 | |||||||||||||||||||||
At 31 December 2022 | 2,480 | 422 | 140 | 31 | 2 | 102 | 3,177 | |||||||||||||||||||||
166 Pearson plc |
Goodwill
The goodwill carrying value of £2,480m (2021: £2,145m) relates to acquisitions completed after 1 January 1998. Prior to 1 January 1998, all goodwill was written off to reserves on the date of acquisition. For acquisitions completed between 1 January 1998 and 31 December 2002, no value was ascribed to intangibles other than goodwill which was amortised over a period of up to 20 years. On adoption of IFRS on 1 January 2003, the Group chose not to restate the goodwill balance and at that date the balance was frozen (i.e. amortisation ceased). If goodwill had been restated, then a significant value would have been ascribed to other intangible assets, which would be subject to amortisation, and the carrying value of goodwill would be significantly lower. For acquisitions completed after 1 January 2003, value has been ascribed to other intangible assets which are amortised.
Software and acquired intangible assets
Acquired intangible assets are valued separately for each acquisition. For material business combinations, the valuation is carried out by an independent valuation specialist. The primary method of valuation used is the discounted cash flow method. Acquired intangibles are amortised either on a straight line basis or using an amortisation profile based on the projected cash flows underlying the acquisition date valuation of the intangible asset, which generally results in a larger proportion of amortisation being recognised in the early years of the asset’s life, depending on the individual asset. The Group keeps the expected pattern of consumption under review. Other intangibles acquired includes technology.
Amortisation of £32m (2021: £25m; 2020: £22m) is included in the income statement in cost of goods sold and £147m (2021: £138m; 2020: £158m) in operating expenses. Impairment charges of £nil (2021; £4m; 2020: £12m) are included in operating expenses within the income statement, of which £nil (2021: £4m; 2020: £nil) relates to software, £nil (2021: £nil; 2020: £2m) relates to customer lists, contracts and relationships, and £nil (2021: £nil; 2020: £10m) to other intangibles acquired.
The range of useful economic lives for each major class of intangible asset (excluding goodwill and software) is shown below:
2022 | ||||
Useful economic life | ||||
Class of intangible asset | ||||
| Acquired customer lists, contracts and relationships | 3-20 years | |||
| Acquired trademarks and brands | 2-20 years | |||
| Acquired publishing rights | 5-20 years | |||
| Other intangibles acquired | 2-20 years | |||
The expected amortisation profile of acquired intangible assets is shown below:
2022 | ||||||||||||||||||||
| All figures in £ millions | One to five years | Six to ten years | Eleven to fifteen years | Sixteen to twenty years | Total | |||||||||||||||
Class of intangible asset | ||||||||||||||||||||
| Acquired customer lists, contracts and relationships | 92 | 30 | 10 | 8 | 140 | |||||||||||||||
| Acquired trademarks and brands | 24 | 6 | 1 | – | 31 | |||||||||||||||
| Acquired publishing rights | 2 | – | – | – | 2 | |||||||||||||||
| Other intangibles acquired | 82 | 20 | – | – | 102 | |||||||||||||||
| Annual report and accounts 2022 Pearson plc 167 |
Financial statements
Notes to the consolidated financial statements
continued
11. Intangible assets continued
Impairment tests for cash-generating units (CGUs) containing goodwill
Impairment tests have been carried out where appropriate as described below. Goodwill was allocated to CGUs, or an aggregation of CGUs, where goodwill could not be reasonably allocated to individual business units. CGUs were revised in 2021. Impairment reviews were conducted on these revised CGUs as summarised below:
2022 CGUs
| All figures in £ millions | 2022 Goodwill | |||
| Assessment & Qualifications | 1,361 | |||
| Virtual Learning | 443 | |||
| English Language Learning | 259 | |||
| Workforce Skills | 348 | |||
| Higher Education | 69 | |||
Total | 2,480 | |||
2021 CGUs
| All figures in £ millions | 2021 Goodwill | |||
| Assessment & Qualifications | 1,198 | |||
| Virtual Learning | 395 | |||
| English Language Learning | 153 | |||
| Workforce Skills | 223 | |||
| Higher Education | 68 | |||
| Strategic Review (includes the separate CGUs of China, India, South Africa, Canada and Other Strategic Review) | 108 | |||
Total | 2,145 | |||
Goodwill is tested at least annually for impairment. The recoverable amount of each aggregated CGU is based on the higher of value in use and fair value less costs of disposal. The impairment assessment is based on value in use. Other than goodwill there are no intangible assets with indefinite lives. No impairments of goodwill were recorded in 2022 or 2021.
168 Pearson plc |
| ||||
| The allocation of goodwill to the cash-generating units and groups of cash-generating units. | ||||
| ||||
| The recoverability of goodwill balances. Key assumptions used in goodwill impairment testing are discount rates, perpetuity growth rates, forecast sales growth rates and forecast operating profits. | ||||
The valuation of acquired intangible assets recognised on the acquisition of a business. See note 30. | ||||
Determination of CGUs and reallocation of goodwill
Pearson identifies its CGUs based on its operating model and how data is collected and reviewed for management reporting and strategic planning purposes in accordance with IAS 36 ‘Impairment of Assets’. The CGUs and CGU aggregations reflect the level at which goodwill is monitored by management.
In 2021, the CGUs and aggregations of CGUs were revised to take into account the announcement and implementation of a new strategy including five new business divisions and a strategic review division.
In 2021, goodwill was reallocated to the new CGUs and aggregations of CGUs. The majority of the goodwill balances were directly mapped from one previous CGU (or CGU aggregation) to one newly created CGU (or CGU aggregation). Where it was not possible to directly map the goodwill it was reallocated using a relative value method. The key area where the relative value method was used was for the goodwill related to the previous International CGU aggregation which was reallocated across the newly created CGU aggregations where applicable.
In 2022, the separate CGUs of China, South Africa and Canada have been disposed. The goodwill related to the Strategic Review CGU has been reallocated between businesses disposed and businesses retained. All of the goodwill related to businesses retained has since been transferred to the Assessment & Qualifications CGU aggregation.
Key assumptions
For the purpose of estimating the value in use of the CGUs, management has used an income approach based on present value techniques. The calculations for all CGUs use cash flow projections based on financial budgets approved by management covering a four-year period, except for Virtual Learning which for OPM uses a longer range plan out to 2038 reflecting the term of existing contracts.
The key assumptions used by management in the value in use calculations were:
Discount rates
pre-tax
discount rates range from 11.6% to 12.0% (2021:pre-tax
8.9% to 17.1%).Perpetuity growth rates
The key assumptions used by management in setting the financial budgets were as follows:
Forecast sales growth rates
COVID-19
enrolments and school churn in Virtual Schools in the short term, and steady growth in Assessments and Qualifications. The sales forecasts use average nominal growth rates oflow-mid
single digits for mature businesses in mature markets and double digit growth where there is significant organic and inorganic investment. The Virtual Learning CGU assumeslow-single
digit growth for Virtual Schools, and delivery of existing contracts in OPM which is under strategic review.Operating profits
Management have considered the impact of climate change risks (including physical and transition risks and the costs associated with achieving the Group’s net zero commitment) and are satisfied that any related costs will not materially impact the Group’s profit forecasts or impairment judgements at 31 December 2022.
| Annual report and accounts 2022 Pearson plc 169 |
Financial statements
Notes to the consolidated financial statements
continued
11. Intangible assets continued
The table below shows the key assumptions used by management in the value in use calculations.
| Discount rate | Perpetuity growth rate | |||||||||||
| Assessment & Qualifications | 12.0% | 2.0% | ||||||||||
| Virtual Learning | 11.9% | 2.0% | ||||||||||
| English Language Learning | 11.8% | 3.5% | ||||||||||
| Workforce Skills | 11.6% | 2.0% | ||||||||||
| Higher Education | 12.0% | 2.0% | ||||||||||
Sensitivities
Impairment testing for the year ended 31 December 2022 has identified that the Virtual Learning CGU aggregation is sensitive to reasonably possible changes in key assumptions. The Virtual learning headroom at 31 December 2022 is £82m, this headroom would be eliminated if the discount rate increased to 12.8%, the long term growth rate reduced to 0.8% or the adjusted operating profit per annum reduced by £8m.
12. Investments in joint ventures and associates
The amounts recognised in the balance sheet are as follows:
| All figures in £ millions | 2022 | 2021 | ||||||||||
| Associates | 25 | 24 | ||||||||||
Total | 25 | 24 | ||||||||||
The amounts recognised in the income statement are as follows:
| All figures in £ millions | 2022 | 2021 | ||||||||||
| Associates | 1 | 1 | ||||||||||
Total | 1 | 1 | ||||||||||
The Group has no material associates or joint ventures. The largest associate is a 40% interest in the Academy of Pop (AOP), which was set up in 2021. It had a year end carrying amount of £9m (2021: £10m), of which £5m (2021: £7m) was still to be paid as at 31 December 2022 (see note 36). AOP is incorporated in Delaware and is a Limited Liability Company. It was set up with XIX Entertainment to create a new entertainment driven performing arts learning platform, which will offer coaching from renowned instructors, with a combination of physical locations and online learning.
There were no other material transactions with associates or joint ventures during 2022 or 2021.
13. Deferred income tax
| All figures in £ millions | 2022 | 2021 | ||||||||||
| Deferred income tax assets | 57 | 57 | ||||||||||
| Deferred income tax liabilities | (37 | ) | (40 | ) | ||||||||
Net deferred income tax asset/(liability) | 20 | 17 | ||||||||||
Substantially all of the deferred income tax assets are expected to be recovered after more than one year.
Deferred income tax assets and liabilities shall be offset when there is a legally enforceable right to offset current income tax assets with current income tax liabilities and where the deferred income taxes relate to the same fiscal authority.
At 31 December 2022, the Group has gross tax losses for which no deferred tax asset is recognised of £547m (2021: £721m). The expiry date and key geographic split of these losses is set out in the following table.
170 Pearson plc |
Gross | Tax effected | |||||||||||||||||||||||||||||||
Year ended 31 December 2022 | UK | US | Other | Total | UK | US | Other | Total | ||||||||||||||||||||||||
| Tax losses expiring: | ||||||||||||||||||||||||||||||||
| Within 10 years | – | 3 | 30 | 33 | – | – | 10 | 10 | ||||||||||||||||||||||||
| Within 10-20 years | – | 104 | – | 104 | – | 5 | – | 5 | ||||||||||||||||||||||||
| Available indefinitely | 166 | 30 | 214 | 410 | 41 | 2 | 68 | 111 | ||||||||||||||||||||||||
Total | 166 | 137 | 244 | 547 | 41 | 7 | 78 | 126 | ||||||||||||||||||||||||
Gross | Tax effected | |||||||||||||||||||||||||||||||
Year ended 31 December 2021 | UK | US | Other | Total | UK | US | Other | Total | ||||||||||||||||||||||||
| Tax losses expiring: | ||||||||||||||||||||||||||||||||
| Within 10 years | – | 9 | 27 | 36 | – | – | 10 | 10 | ||||||||||||||||||||||||
Within 10-20 years | – | 297 | – | 297 | – | 14 | – | 14 | ||||||||||||||||||||||||
| Available indefinitely | 166 | 86 | 136 | 388 | 41 | 5 | 49 | 95 | ||||||||||||||||||||||||
Total | 166 | 392 | 163 | 721 | 41 | 19 | 59 | 119 | ||||||||||||||||||||||||
The reduction in unrecognised tax attributes in the US has been impacted by two factors. Firstly certain US tax attributes have now been recognised, however, due to uncertainty over recoverability have been provided against. Offsetting this is the
de-recognition
of certain state tax losses following changes in the forecast profitability of US legal entities. The increase in unrecognised tax losses in other territories is primarily due to foreign exchange and additional losses incurred across territories which have incurred losses either in the ordinary course of trade or as a result of wind down activities.Other gross deductible temporary differences for which no deferred tax asset is recognised total £218m (2021: £22m). This includes £193m in respect of interest limitations, with the increase from 2021 due to changes in the forecast profitability of certain US legal entities. The amount of temporary differences associated with subsidiaries for which no deferred tax has been provided totals £275m (2021: £229m).
In the UK March Budget 2021, the Government announced that from 1 April 2023 the UK corporation tax rate will increase to 25%, and this was substantively enacted on 24 May 2021. UK deferred tax balances have been remeasured at the enacted rate.
Deferred income tax assets of £14m (2021: £19m) have been recognised in countries that reported a tax loss in either the current or preceding year. This primarily arises in Brazil in respect of tax deductible goodwill and tax losses. It is considered more likely than not that there will be sufficient future taxable profits to realise these assets.
The recognition of the deferred income tax assets is supported by management’s forecasts of the future profitability of the relevant countries. In some cases deferred income tax assets are forecast to be recovered through taxable profits over a period that exceeds five years. Management consider these forecasts are sufficiently reliable to support the recovery of the assets. Where there are insufficient forecasts of future profits, deferred income tax assets have not been recognised.
The movement in deferred income tax assets and liabilities during the year is as follows:
| All figures in £ millions | Trading losses | Accruals and other provisions | Retirement benefit obligations | Deferred revenue | Goodwill and intangibles | Interest limitations | Other | Total | ||||||||||||||||||||||||
Deferred income tax assets/(liabilities) | ||||||||||||||||||||||||||||||||
| At 1 January 2021 | 47 | 35 | (49 | ) | 45 | (209 | ) | 76 | 25 | (30 | ) | |||||||||||||||||||||
| Exchange differences | – | (1 | ) | – | – | (2 | ) | – | 2 | (1 | ) | |||||||||||||||||||||
| Acquisition of subsidiaries | 1 | – | – | – | 4 | – | – | 5 | ||||||||||||||||||||||||
| Income statement benefit/(charge) | 34 | 30 | 2 | 7 | 29 | (21 | ) | 35 | 116 | |||||||||||||||||||||||
| Tax charge in OCI | – | – | (61 | ) | – | – | – | (12 | ) | (73 | ) | |||||||||||||||||||||
At 31 December 2021 | 82 | 64 | (108 | ) | 52 | (178 | ) | 55 | 50 | 17 | ||||||||||||||||||||||
| Exchange differences | – | 7 | 2 | 6 | (21 | ) | 6 | 4 | 4 | |||||||||||||||||||||||
| Acquisitions and disposals of subsidiaries | 7 | – | – | – | (21 | ) | – | (12 | ) | (26 | ) | |||||||||||||||||||||
| Income statement benefit/(charge) | 37 | (4 | ) | (9 | ) | 5 | 14 | (6 | ) | (7 | ) | 30 | ||||||||||||||||||||
| Tax charge in OCI / equity | 4 | – | (12 | ) | – | – | – | 3 | (5 | ) | ||||||||||||||||||||||
At 31 December 2022 | 130 | 67 | (127 | ) | 63 | (206 | ) | 55 | 38 | 20 | ||||||||||||||||||||||
Other deferred income tax items include temporary differences in respect ofassets (deferred tax asset of £66m, with an offsetting deferred tax liability of £50m), accelerated capital allowances (£13m) and share-based payments (£9m).
right-of-use
As at 31 December 2022, no deferred income tax assets or liabilities were classified as held for sale (2021: £nil).
| Annual report and accounts 2022 Pearson plc 171 |
Financial statements
Notes to the consolidated financial statements
continued
14. Classification of financial instruments
The accounting classification of each class of the Group’s financial assets, and their carrying values, is as follows:
2022 | 2021 | |||||||||||||||||||||||||||||||||||||||||||||||||||
Fair value | Amortised cost | Fair value | Amortised cost | |||||||||||||||||||||||||||||||||||||||||||||||||
| All figures in £ millions | Notes | Fair value through other comprehensive income | Fair value through profit and loss | Fair value – hedging instrument | Financial assets | Total carrying value | Fair value through other comprehensive income 1 | Fair value through profit and loss 1 | Fair value – hedging instrument | Financial assets | Total carrying value | |||||||||||||||||||||||||||||||||||||||||
| Investments in unlisted securities | 15 | 24 | 109 | – | – | 133 | 28 | 85 | – | – | 113 | |||||||||||||||||||||||||||||||||||||||||
| Cash and cash equivalents | 17 | – | 40 | – | 518 | 558 | – | 84 | – | 853 | 937 | |||||||||||||||||||||||||||||||||||||||||
| Derivative financial instruments | 16 | – | 5 | 54 | – | 59 | – | – | 32 | – | 32 | |||||||||||||||||||||||||||||||||||||||||
| Trade receivables | 22 | – | – | – | 825 | 825 | – | – | – | 854 | 854 | |||||||||||||||||||||||||||||||||||||||||
| Investment in finance lease receivable | 22 | – | – | – | 121 | 121 | – | – | – | 115 | 115 | |||||||||||||||||||||||||||||||||||||||||
| Other receivable | – | – | – | 3 | 3 | – | 87 | – | – | 87 | ||||||||||||||||||||||||||||||||||||||||||
Total financial assets | 24 | 154 | 54 | 1,467 | 1,699 | 28 | 256 | 32 | 1,822 | 2,138 | ||||||||||||||||||||||||||||||||||||||||||
| 1. | Comparative balances have been restated – see Note 1b. |
The carrying value of the Group’s financial assets is equal to, or approximately equal to, the market value. The other receivable relates to the receivable which arose on the disposal of the US
K-12
business and was paid during the year.The accounting classification of each class of the Group’s financial liabilities, together with their carrying values and market values, is as follows:
2022 | 2021 | |||||||||||||||||||||||||||||||||||||||||||||||||||
Fair value | Amortised cost | Fair value | Amortised cost | |||||||||||||||||||||||||||||||||||||||||||||||||
| All figures in £ millions | Notes | Fair value through profit and loss | Fair value – hedging instrument | Other financial liabilities | Total carrying value | Total market value | Fair value through profit and loss | Fair value – hedging instrument | Other financial liabilities | Total carrying value | Total market value | |||||||||||||||||||||||||||||||||||||||||
| Derivative financial instruments | 16 | (2 | ) | (63 | ) | – | (65 | ) | (65 | ) | (12 | ) | (22 | ) | – | (34 | ) | (34 | ) | |||||||||||||||||||||||||||||||||
| Trade payables | 24 | – | – | (348 | ) | (348 | ) | (348 | ) | – | – | (351 | ) | (351 | ) | (351 | ) | |||||||||||||||||||||||||||||||||||
| Deferred and contingent consideration | 24 | (79 | ) | – | – | (79 | ) | (79 | ) | (44 | ) | – | – | (44 | ) | (44 | ) | |||||||||||||||||||||||||||||||||||
| Other borrowings due within one year | 18 | – | – | (86 | ) | (86 | ) | (86 | ) | – | – | (155 | ) | (155 | ) | (155 | ) | |||||||||||||||||||||||||||||||||||
| Borrowings due after more than one year | 18 | – | – | (1,144 | ) | (1,144 | ) | (1,096 | ) | – | – | (1,245 | ) | (1,245 | ) | (1,276 | ) | |||||||||||||||||||||||||||||||||||
Total financial liabilities | (81 | ) | (63 | ) | (1,578 | ) | (1,722 | ) | (1,674 | ) | (56 | ) | (22 | ) | (1,751 | ) | (1,829 | ) | (1,860 | ) | ||||||||||||||||||||||||||||||||
The market value of leases has been stated at book value.
172 Pearson plc |
Fair value measurement
As shown above, the Group’s derivative assets and liabilities, unlisted securities, marketable securities and deferred and contingent consideration are held at fair value. Financial instruments that are measured subsequently to initial recognition at fair value are grouped into levels 1 to 3, based on the degree to which the fair value is observable, as follows:
Level 1 fair value measurements are those derived from unadjusted quoted prices in active markets for identical assets or liabilities.
Level 2 fair value measurements are those derived from inputs, other than quoted prices included within level 1, that are observable for the asset or liability, either directly (as prices) or indirectly (derived from prices).
Level 3 fair value measurements are those derived from valuation techniques that include inputs for the asset or liability that are not based on observable market data (unobservable inputs).
The Group’s bonds valued at £610m (2021: £767m) and money market funds of £40m (2021: £84m) included within cash and cash equivalents are classified as level 1. The Group’s derivative assets valued at £59m (2021: £32m) and derivative liabilities valued at £65m (2021: £34m) are classified as level 2. The Group’s investments in unlisted securities are valued at £133m (2021: £113m) and the other receivable that was repaid in the year £3m (2021: £87m) are classified as level 3.
The following table analyses the movements in level 3 fair value remeasurements:
2022 | 2021 1 | |||||||||||||||||
All figures in £ millions | Other receivable | Investments in unlisted securities | Total | Total | ||||||||||||||
| At beginning of year | 87 | 113 | 200 | 234 | ||||||||||||||
| Exchange differences | 1 | 9 | 10 | 2 | ||||||||||||||
| Acquisition of investments and other receivable | 7 | 12 | 19 | 4 | ||||||||||||||
| Repayments | (92 | ) | – | (92 | ) | (16 | ) | |||||||||||
| Disposal of investments | – | (48 | ) | (48 | ) | (54 | ) | |||||||||||
| Fair value movements - OCI | – | 18 | 18 | 4 | ||||||||||||||
| Fair value movements - income statement | – | 29 | 29 | 26 | ||||||||||||||
At end of year | 3 | 133 | 136 | 200 | ||||||||||||||
| 1. | Comparative balances have been restated – see Note 1b. |
The fair value of the investments in unlisted securities is determined by reference to the financial performance of the underlying asset, recent funding rounds and amounts realised on the sale of similar assets.
The other receivable at the beginning of the year arose on the disposal of the US
K-12
business, and was repaid in January 2022, following a £16m partial repayment in 2021.15. Other financial assets
| All figures in £ millions | 2022 | 2021 1 | ||||||
| At beginning of year | 113 | 138 | ||||||
| Exchange differences | 9 | 1 | ||||||
| Acquisition of investments | 12 | 4 | ||||||
| Disposal of investments | (48 | ) | (54 | ) | ||||
| Fair value movements - OCI | 18 | 4 | ||||||
| Fair value movements - income statement | 29 | 20 | ||||||
At end of year | 133 | 113 | ||||||
1. | Comparative balances have been restated – see Note 1b. |
Other financial assets are unlisted securities of £
133m (2021: £113m), of which £24m (2021: £28m) are classified at fair value through other comprehensive income (FVOCI), with the remaining £109m (2021: £85m) mainly relating to investments in funds, being required to be held at fair value through profit and loss (FVTPL). The assets, which are not held for trading, relate to the Group’s interests in new and innovative educational ventures across the world. These are strategic investments and where permitted, the Group made the election to classify such investments as FVOCI on initial recognition of the assets. None of the investments are individually significant to the financial statements and therefore sensitivities have not been provided.
During the year, the Group disposed of investments that were classified as FVOCI for £31m (2021: £6m). These disposals predominantly relate to the Group’s investments in Credly in 2022 and Faethm in 2021. In both cases the remainder of the share capital was purchased by the Group and so the investment is disposed as the companies are now fully consolidated. The cumulative gain on disposal was £23m (2021: £4m).
| Annual report and accounts 2022 Pearson plc 173 |
Financial statements
Notes to the consolidated financial statements
continued
16. Derivative financial instruments and hedge accounting
The Group’s approach to the management of financial risks is set out in note 19. The Group’s outstanding derivative financial instruments are as follows:
2022 | 2021 | |||||||||||||||||||||||||||
| All figures in £ millions | Gross notional amounts | Assets | Liabilities | Gross notional amounts | Assets | Liabilities | ||||||||||||||||||||||
| Interest rate derivatives – in a fair value hedge relationship | 177 | – | (11 | ) | 168 | 5 | – | |||||||||||||||||||||
| Interest rate derivatives – not in a hedge relationship | 260 | 19 | – | 217 | – | (9 | ) | |||||||||||||||||||||
| Cross-currency rate derivatives – in a hedge relationship | 83 | 34 | (43 | ) | 331 | 24 | (21 | ) | ||||||||||||||||||||
| FX derivatives – in a hedge relationship | 355 | 1 | (9 | ) | 237 | 3 | (1 | ) | ||||||||||||||||||||
| FX derivatives – not in a hedge relationship | 573 | 5 | (2 | ) | 193 | – | (3 | ) | ||||||||||||||||||||
Total | 1,448 | 59 | (65 | ) | 1,146 | 32 | (34 | ) | ||||||||||||||||||||
Analysed as expiring: | ||||||||||||||||||||||||||||
| In less than one year | 1,028 | 16 | (11 | ) | 393 | 2 | (4 | ) | ||||||||||||||||||||
| Later than one year and not later than five years | 420 | 43 | (54 | ) | 679 | 30 | (26 | ) | ||||||||||||||||||||
| Later than five years | – | – | – | 74 | – | (4 | ) | |||||||||||||||||||||
Total | 1,448 | 59 | (65 | ) | 1,146 | 32 | (34 | ) | ||||||||||||||||||||
The Group’s treasury policies only allow derivatives to be traded where the objective is risk mitigation. These are then designated for hedge accounting using the following criteria:
| — | Where interest rate and cross-currency interest rate swaps are used to convert fixed rate debt to floating and we expect to receive inflows equal to the fixed rate debt interest, these are classified as fair value hedges |
| — | Where derivatives are used to create a future foreign currency exposure to provide protection against currency movements affecting the foreign currency movements of an overseas investment, these are designated as a net investment hedge |
| — | All other derivatives are not designated in a hedge relationship. |
The Group’s fixed rate GBP debt is held as fixed rate instruments at amortised cost.
The Group uses a combination of interest rate and cross currency swaps to convert its
€
300m EUR debt. Receive Notional | Receive coupon | FX rate | Notional | Pay coupon | ||||
€ 100m | 1.375% | GBPEUR: 1.1295 | £87m | 3.51% | ||||
€ 181m | 1.375% | GBPUSD: 1.206 | £160m | 3.402% | ||||
€ 19m | 1.375% | GBPUSD: 1.206 | £23m | USD Libor +1.36% | ||||
To create the synthetic debt positions outlined above the Group converts
€
100m to £87m at a rate of 3.51% this is not in a hedge relationship. The remaining€
200m of its EUR fixed debt is swapped to EUR floating debt via interest rate swap contracts that are in a designated fair value hedge. The EUR floating debt is then converted to GBP floating debt via cross-currency swap contracts that are in a designated fair value hedge. The GBP floating debt is then converted to USD floating debt through cross-currency swap contracts that are in a designated net investment hedging relationship. £160m of the EUR debt is finally converted to USD fixed debt via interest rate swap contracts that are not in a hedge relationship.Additionally, the Group uses FX derivatives including forwards, collars, cross-currency swaps and swaptions to create synthetic USD debt as a hedge of its USD assets and to achieve reasonable certainty of USD currency conversion rates, in line with the Group’s FX hedging policy. As at 31 December 2022 the Group held FX outrights with a notional of $378m at an average rate of GBP:USD rate of 1.24.
The Group’s portfolio of derivatives is diversified by maturity, counterparty and type. Natural offsets between transactions within the portfolio and the designation of certain derivatives as hedges significantly reduce the risk of income statement volatility. The sensitivity of the portfolio to changes in market rates is set out in note 19.
In 2021, the Group transitioned GBP exposures from GBP LIBOR to SONIA. During the year, for USD exposures the Group transitioned its RCF from USD LIBOR to SOFR, it plans to move other exposures including derivatives in the near future. The Group’s risk management strategy has not changed as a result of IBOR Reform and it is considered to be immaterial to the financial statements.
Fair value hedges
The Group uses interest rate swaps and cross-currency swaps as fair value hedges of the Group’s euro issued debt.
Interest rate exposure arises from movements in the fair value of the Group’s euro debt attributable to movements in euro interest rates. The hedged risk is the change in the euro bonds fair value attributable to interest rate movements. The hedged items are the Group’s euro bonds which are issued at a fixed rate. The hedging instruments are fixed to floating euro interest rate swaps where the Group receives fixed interest payments and pays three-month Euribor.
As the critical terms of the interest rate swaps match the bonds, there is an expectation that the value of the hedging instrument and the value of the hedged item will move equally in the opposite direction as a result of movements in the zero coupon Euribor curve. Potential sources of hedge ineffectiveness would be material changes in the credit risk of swap counterparties or a reduction or modification in the hedge item.
174 Pearson plc |
A foreign currency exposure arises from foreign exchange fluctuations on translation of the Group’s euro debt into GBP. The hedged risk is the risk of changes in the GBPEUR spot rate that will result in changes in the value of the euro debt when translated into GBP. The hedged items are a portion of the Group’s euro bonds. The hedging instruments are floating to floating cross currency swaps which mitigates an exposure to the effect of euro strengthening against GBP within the hedge item.
As the critical terms of the cross-currency swap match the bonds, there is an expectation that the value of the hedging instrument and the value of the hedged item move in the opposite direction as a result of movements in the EUR:GBP exchange rate. Potential sources of hedge ineffectiveness are a reduction or modification in the hedged item or a material change in the credit risk of swap counterparties.
The Group held the following instruments to hedge exposures to changes in interest rates and foreign currency risk associated with borrowings:
2022 | ||||||||||||
| All figures in £ millions | Carrying amount of hedging instruments | Change in fair value of hedging instrument used to determine hedge ineffectiveness | Nominal amounts of hedging instruments | |||||||||
| Derivative financial instruments for interest rate risk | (11 | ) | (16 | ) | 177 | |||||||
| Derivative financial instruments for currency risk | 33 | 9 | 266 | |||||||||
| 2021 | ||||||||||||
| All figures in £ millions | Carrying amount of hedging instruments | Change in fair value of hedging instrument used to determine hedge ineffectiveness | Nominal amounts of hedging instruments | |||||||||
| Derivative financial instruments for interest rate risk | 5 | (5 | ) | 168 | ||||||||
| Derivative financial instruments for currency risk | 24 | (20 | ) | 168 | ||||||||
The amounts at the reporting date relating to items designated as hedge items were as follows:
2022 | ||||||||||||||||||||
| All figures in £ millions | Carrying amount of hedged items | Accumulated amount of fair value hedge adjustments on the hedged item included in the carrying amount | Change in fair value of hedged item used to determine hedge ineffectiveness | Hedge ineffectiveness | Line item in profit or loss that includes hedge ineffectiveness | |||||||||||||||
Interest rate risk | ||||||||||||||||||||
| Financial liabilities – borrowings | (167 | ) | 11 | 15 | (1 | ) | Finance costs | |||||||||||||
Currency risk | ||||||||||||||||||||
| Financial liabilities – borrowings | (167 | ) | n/a | (14 | ) | – | n/a | |||||||||||||
| 2021 | ||||||||||||||||||||
| All figures in £ millions | Carrying amount of hedged items | Accumulated amount of fair value hedge adjustments on the hedged item included in the carrying amount | Change in fair value of hedged item used to determine hedge ineffectiveness | Hedge ineffectiveness | Line item in profit or loss that includes hedge ineffectiveness | |||||||||||||||
Interest rate risk | ||||||||||||||||||||
| Financial liabilities – borrowings | (173 | ) | (4 | ) | 5 | – | n/a | |||||||||||||
Currency risk | ||||||||||||||||||||
| Financial liabilities – borrowings | (173 | ) | n/a | 20 | – | n/a | ||||||||||||||
Hedge of net investment in a foreign operation
A foreign currency exposure arises from the translation of the Group’s net investments in its subsidiaries which have USD and EUR functional currencies. The hedged risk is the risk of changes in the GBP:USD and GBP:EUR spot rates that will result in changes in the value of the Group’s net investment in its USD and EUR assets when translated into GBP. The hedged items are a portion of the Group’s assets which are denominated in USD and EUR. The hedging instruments are debt and derivative financial instruments, including cross-currency swaps, FX forwards (including
non-deliverable
forwards) and FX collars, which mitigates an exposure to the effect of a weakening USD or EUR on the hedged item against GBP.| Annual report and accounts 2022 Pearson plc 175 |
Financial statements
Notes to the consolidated financial statements
continued
16. Derivative financial instruments and hedge accounting continued
It is expected that the change in value of each of these items will offset each other as there is a clear and direct economic relationship between the hedging instrument and the hedged item in the hedge relationship.
Hedge ineffectiveness would arise if the value of the hedged items fell below the value of the hedging instruments; however, this is unlikely as the value of the Group’s assets denominated in USD and EUR is significantly greater than the proposed net investment programme.
The amounts related to items designated as hedging instruments were as follows:
2022 | ||||||||||||||||||||
| All figures in £ millions | Carrying amount of hedging instruments | Change in value of hedging instrument used to determine hedge ineffectiveness | Nominal amounts of hedging instruments | Hedging gains/(losses) recognised in OCI | Hedge ineffectiveness recognised in profit or loss | |||||||||||||||
| Derivative financial instruments | (50 | ) | (31 | ) | 172 | (31 | ) | – | ||||||||||||
| Financial liabilities – borrowings | (89 | ) | (5 | ) | (88 | ) | (5 | ) | – | |||||||||||
| 2021 | ||||||||||||||||||||
| All figures in £ millions | Carrying amount of hedging instruments | Change in value of hedging instrument used to determine hedge ineffectiveness | Nominal amounts of hedging instruments | Hedging gains/(losses) recognised in OCI | Hedge ineffectiveness recognised in profit or loss | |||||||||||||||
| Derivative financial instruments | (19 | ) | (2 | ) | (400 | ) | (2 | ) | – | |||||||||||
| Financial liabilities – borrowings | (240 | ) | 4 | (240 | ) | 4 | – | |||||||||||||
Included in the translation reserve is a cost of hedging reserve relating to the time value of FX collars which is not separately disclosed due to materiality. The value of that reserve will decrease over the life of the hedge transaction. The balance as at 1 January and 31 December 2022 was £1m. During the year £2m of hedging gains were recycled to the profit and loss on the discontinuance of the net investment hedge of our Italian business.
Offsetting arrangements with derivative counterparties
All of the Group’s derivative financial instruments are subject to enforceable netting arrangements with individual counterparties, allowing net settlement in the event of default of either party. Derivative financial assets and liabilities subject to offsetting arrangements are as follows:
2022 | 2021 | |||||||||||||||||||||||||||
| All figures in £ millions | Gross derivative assets | Gross derivative liabilities | Net derivative assets/ liabilities | Gross derivative assets | Gross derivative liabilities | Net derivative assets/ liabilities | ||||||||||||||||||||||
| Counterparties in an asset position | 30 | (17 | ) | 13 | 17 | (12 | ) | 5 | ||||||||||||||||||||
| Counterparties in a liability position | 29 | (48 | ) | (19 | ) | 15 | (22 | ) | (7 | ) | ||||||||||||||||||
Total as presented in the balance sheet | 59 | (65 | ) | (6 | ) | 32 | (34 | ) | (2 | ) | ||||||||||||||||||
Offset arrangements in respect of cash balances are described in note 17.
Counterparty exposure from all derivatives is managed, together with that from deposits and bank account balances, within credit limits that reflect published credit ratings and by reference to other market measures (e.g. market prices for credit default swaps) to ensure that there is no significant exposure to any one counterparty’s credit risk.
The Group has no material embedded derivatives that are required to be separately accounted for in accordance with IFRS 9 ‘Financial Instruments’.
176 Pearson plc |
17. Cash and cash equivalents (excluding overdrafts)
| All figures in £ millions | 2022 | 2021 | ||||||
| Cash at bank and in hand | 269 | 660 | ||||||
| Short-term bank deposits | 289 | 277 | ||||||
558 | 937 | |||||||
Short-term bank deposits are invested with banks and earn interest at the prevailing short-term deposit rates.
At the end of 2022, the currency split of cash and cash equivalents was US dollar 31% (2021: 37%), sterling 6% (2021: 24%), and other 63% (2021: 39%).
Cash and cash equivalents have fair values that approximate to their carrying value due to their short-term nature.
There is no cash and cash equivalents balance classified as held for sale (2021: £nil). The Group has certain cash pooling arrangements in US dollars, sterling and Canadian dollars where both the company and the bank have a legal right of offset. Offsetting amounts are presented gross in the balance sheet. Offset arrangements in respect of derivatives are shown in note 16.
For the purpose of the cash flow statement, cash and cash equivalents are £543m (2021: £937m), which includes £15m (2021: £nil) of overdrafts.
18. Financial liabilities – borrowings
The Group’s current and
non-current
borrowings are as follows:| All figures in £ millions | 2022 | 2021 | ||||||
Non-current | ||||||||
3.25% US dollar notes 2023 (nominal amount $94m) | – | 70 | ||||||
1.375% Euro notes 2025 (nominal amount € 300m) | 257 | 257 | ||||||
| 3.75% GBP notes 2030 (nominal amount £350m) | 353 | 353 | ||||||
| Lease liabilities (see note 35) | 534 | 565 | ||||||
1,144 | 1,245 | |||||||
Current (due within one year or on demand) | ||||||||
| 3.75% US dollar notes 2022 (nominal amount $117m) | – | 87 | ||||||
| Lease liabilities (see note 35) | 71 | 68 | ||||||
| Overdrafts | 15 | – | ||||||
86 | 155 | |||||||
Total borrowings | 1,230 | 1,400 | ||||||
Included in the
non-current
borrowings above is £10m of accrued interest (2021: £10m). No accrued interest is included in the current borrowings above (2021: £0.5m). In addition to the above, there are nonon-current
borrowings (2021: £nil) or current borrowings (2021: £nil)classified as held for sale. The maturities of the Group’s
non-current
borrowings are as follows: | All figures in £ millions | 2022 | 2021 | ||||||
| Between one and two years | 72 | 140 | ||||||
| Between two and five years | 442 | 435 | ||||||
| Over five years | 630 | 670 | ||||||
1,144 | 1,245 | |||||||
The carrying amounts and market values of borrowings are as follows:
2022 | 2021 | |||||||||||||||||||||||||||
| All figures in £ millions | Effective interest rate | Carrying value | Market value | Effective interest rate | Carrying value | Market value | ||||||||||||||||||||||
| 3.75% US dollar notes 2022 | n/a | – | – | 3.94% | 87 | 87 | ||||||||||||||||||||||
| 3.25% US dollar notes 2023 | n/a | – | – | 3.36% | 70 | 71 | ||||||||||||||||||||||
| 1.375% Euro notes 2025 | 1.44% | 257 | 252 | 1.44% | 257 | 260 | ||||||||||||||||||||||
| 3.75% GBP notes 2030 | 3.93% | 353 | 310 | 3.93% | 353 | 380 | ||||||||||||||||||||||
| Overdrafts | n/a | 15 | 15 | – | – | – | ||||||||||||||||||||||
625 | 577 | 767 | 798 | |||||||||||||||||||||||||
| Annual report and accounts 2022 Pearson plc 177 |
Financial statements
Notes to the consolidated financial statements
continued
18. Financial liabilities – borrowings continued
The market values stated above are based on clean market prices at the year end or, where these are not available, on the quoted market prices of comparable debt issued by other companies. The effective interest rates above relate to the underlying debt instruments.
The carrying amounts of the Group’s borrowings before the effect of derivatives (see notes 16 and 19 for further information on the impact of derivatives) are denominated in the following currencies:
| All figures in £ millions | 2022 | 2021 | ||||||
| US dollar | 276 | 434 | ||||||
| Sterling | 672 | 674 | ||||||
| Euro | 262 | 268 | ||||||
| Other | 20 | 24 | ||||||
1,230 | 1,400 | |||||||
The Group had $1.19bn (£0.9bn) of undrawn capacity on its committed borrowing facilities as at 31 December 2022 (2021: $1.19bn (£0.9bn) undrawn).
The committed borrowing facilities have subsequently been reduced to $1bn. In addition, there are a number of short-term facilities that are utilised in the normal course of business. All of the Group’s borrowings are unsecured. In respect of lease obligations, the rights to the leased asset revert to the lessor in the event of default.
19. Financial risk management
The Group’s approach to the management of financial risks together with sensitivity analyses of its financial instruments is set out below.
Treasury policy
Pearson’s treasury policies set out the Group’s principles for addressing key financial risks including capital risk, liquidity risk, foreign exchange risk and interest rate risk, and sets out measurable targets for each. The Audit Committee receives quarterly reports incorporating compliance with measurable targets and reviews and approves any changes to treasury policies annually.
The treasury function is permitted to use derivatives where their use reduces a risk or allows a transaction to be undertaken more cost effectively. Derivatives permitted include swaps, forwards and collars to manage foreign exchange and interest rate risk, with
foreign exchange swap and forward contracts the most commonly executed. Speculative transactions are not permitted.
Capital risk
The Group’s objectives when managing capital are:
| — | To maintain a strong balance sheet and a solid investment grade rating; |
| — | To continue to invest in the business organically and through acquisitions; and |
| — | To have a sustainable and progressive dividend policy. |
At 31 December 2022 the Group and its bonds were rated
BBB-(stable
outlook) with Fitch Ratings Limited and Baa3 (stable outlook) with Moody’s Investor Services.Net debt
The Group’s net debt position is set out below:
| All figures in £ millions | 2022 | 2021 | ||||||
| Cash and cash equivalents | 558 | 937 | ||||||
| Overdrafts | (15 | ) | – | |||||
| Derivative financial instruments | (6 | ) | (2 | ) | ||||
| Bonds | (610 | ) | (767 | ) | ||||
| Investment in finance lease receivable | 121 | 115 | ||||||
| Lease liabilities | (605 | ) | (633 | ) | ||||
Net debt | (557 | ) | (350 | ) | ||||
There are no balances held for sale as at 31 December 2022 or 31 December 2021.
178 Pearson plc |
Interest and foreign exchange rate management
The Group’s principal currency exposure is to the US dollar which represents almost 70% of the Group’s sales.
The Group’s long-term debt is primarily held in US dollars to provide a natural hedge of this exposure, which is achieved through issued US dollar debt or converting euro debt to US dollars using cross-currency swaps, forwards and collars. As at 31 December 2022 and 2021, the Group’s debt of £1,230m (2021: £1,400m) is all held at fixed rates.
See note 16 for details of the Group’s hedging programme which addresses interest rate risk and foreign currency risk.
Overseas profits are converted to sterling to satisfy sterling cash outflows such as dividends at the prevailing spot rate at the time of the transaction. To the extent the Group has sufficient sterling, US dollars may be held as dollar cash to provide a natural offset to the Group’s debt or to satisfy future US dollar cash outflows.
The Group does not have significant cross-border foreign exchange transactional exposures.
As at 31 December 2022, the sensitivity of the carrying value of the Group’s financial instruments to fluctuations in interest rates and exchange rates is as follows:
2022 | ||||||||||||||||||||
| All figures in £ millions | Carrying value | Impact of 1% increase in interest rates | Impact of 1% decrease in interest rates | Impact of 10% strengthening in sterling | Impact of 10% weakening in sterling | |||||||||||||||
| Investments in unlisted securities | 133 | – | – | (10 | ) | 12 | ||||||||||||||
| Other receivable | 3 | – | – | – | – | |||||||||||||||
| Cash and cash equivalents | 558 | – | – | (25 | ) | 31 | ||||||||||||||
| Derivative financial instruments | (6 | ) | 7 | (6 | ) | (10 | ) | 12 | ||||||||||||
| Bonds | (610 | ) | 4 | (4 | ) | 24 | (30 | ) | ||||||||||||
| Other borrowings | (620 | ) | – | – | 26 | (32 | ) | |||||||||||||
| Investment in finance lease receivable | 121 | – | – | (11 | ) | 13 | ||||||||||||||
| Deferred and contingent consideration | (79 | ) | – | – | 4 | (5 | ) | |||||||||||||
| Other net financial assets | 477 | – | – | (38 | ) | 47 | ||||||||||||||
Total | (23 | ) | 11 | (10 | ) | (40 | ) | 48 | ||||||||||||
| 2021 | ||||||||||||||||||||
| All figures in £ millions | Carrying value | Impact of 1% increase in interest rates | Impact of 1% decrease in interest rates | Impact of 10% strengthening in sterling | Impact of 10% weakening in sterling | |||||||||||||||
| Investments in unlisted securities | 113 | – | – | (9 | ) | 11 | ||||||||||||||
| Other receivable | 87 | – | – | (8 | ) | 10 | ||||||||||||||
| Cash and cash equivalents | 937 | – | – | (43 | ) | 53 | ||||||||||||||
| Derivative financial instruments | (2 | ) | 6 | (6 | ) | (1 | ) | 1 | ||||||||||||
| Bonds | (767 | ) | 5 | (5 | ) | 37 | (45 | ) | ||||||||||||
| Other borrowings | (633 | ) | – | – | 57 | (70 | ) | |||||||||||||
| Investment in finance lease receivable | 115 | – | – | (11 | ) | 13 | ||||||||||||||
| Other net financial assets | 503 | – | – | (42 | ) | 51 | ||||||||||||||
Total | 353 | 11 | (11 | ) | (20 | ) | 24 | |||||||||||||
The table above shows the sensitivities of the fair values of each class of financial instrument to an isolated change in either interest rates or foreign exchange rates. Other net financial assets comprise trade receivables less trade payables. A significant proportion of the movements shown above would impact equity rather than the income statement due to the location and functional currency of the entities in which they arise and the availability of net investment hedging.
The Group’s income statement is reported at average rates for the year while the balance sheet is translated at the
year-end
closing rate. Differences between these rates can distort ratio calculations such as debt to EBITDA and interest cover. | Annual report and accounts 2022 Pearson plc 179 |
Financial statements
Notes to the consolidated financial statements
continued
19. Financial risk management continued
Liquidity and refinancing risk management
The Group regularly reviews the level of cash and debt facilities required to fund its activities. This involves preparing a prudent cash flow forecast for the next three to five years, determining the level of debt facilities required to fund the business, planning for shareholder returns and repayments of maturing debt, and identifying an appropriate amount of headroom to provide a reserve against unexpected outflows.
At 31 December 2022, the Group had cash of £0.5bn (2021: £0.9bn) and no outstanding drawings (2021: £nil) on the US dollar denominated revolving credit facility due 2026 of $1.19bn (2021: $1.19bn).
The $1.19bn facility contains interest cover and leverage covenants which the Group has complied with for the year ended 31 December 2022. The maturity of the carrying values of the Group’s borrowings and trade payables are set out in notes 18 and 24 respectively.
At the end of 2022, the currency split of the Group’s trade payables was US dollar £234m (2021: £199m), sterling £71m (2021: £76m) and other currencies £43m (2021: £76m). Trade payables are all due within one year (2021: all due within one year).
The table below analyses the Group’s bonds and derivative assets and liabilities into relevant maturity groupings based on the remaining period at the balance sheet date to the contractual maturity date. Short dated derivative instruments have not been included in this table. The amounts disclosed in the table are the contractual undiscounted cash flows (including interest) and as such may differ from the amounts disclosed on the balance sheet.
Any cash flows based on a floating rate are calculated using interest rates as set at the date of the last rate reset. Where this is not possible, floating rates are based on interest rates prevailing at 31 December in the relevant year.
Financial counterparty and credit risk management
Financial counterparty and credit risk arises from cash and cash equivalents, favourable derivative financial instruments and deposits with banks and financial institutions, as well as credit exposures to customers, including outstanding receivables. Counterparty credit limits, which take published credit rating and other factors into account, are set to cover the Group’s total aggregate exposure to a single financial institution. The limits applicable to published credit rating bands are approved by the Chief Financial Officer within guidelines approved by the Board. Exposures and limits applicable to each financial institution are reviewed on a regular basis.
| Analysed by maturity | Analysed by currency | |||||||||||||||||||||||||||||||
| All figures in £ millions | Greater than one month and less than one year | Later than one year but less than five years | Five years or more | Total | USD | GBP | Other | Total | ||||||||||||||||||||||||
| At 31 December 2022 | ||||||||||||||||||||||||||||||||
| Bonds | – | 342 | 389 | 731 | – | 455 | 276 | 731 | ||||||||||||||||||||||||
| Rate derivatives – inflows | (11 | ) | (471 | ) | – | (482 | ) | (24 | ) | (170 | ) | (288 | ) | (482 | ) | |||||||||||||||||
| Rate derivatives – outflows | 1 | 490 | – | 491 | 224 | 255 | 12 | 491 | ||||||||||||||||||||||||
| FX forwards – inflows | (304 | ) | – | – | (304 | ) | – | (304 | ) | – | (304 | ) | ||||||||||||||||||||
| FX forwards – outflows | 313 | – | – | 313 | – | 313 | – | 313 | ||||||||||||||||||||||||
Total | (1 | ) | 361 | 389 | 749 | 200 | 549 | – | 749 | |||||||||||||||||||||||
| At 31 December 2021 | ||||||||||||||||||||||||||||||||
| Bonds | 107 | 386 | 403 | 896 | 162 | 468 | 266 | 896 | ||||||||||||||||||||||||
| Rate derivatives – inflows | (7 | ) | (331 | ) | – | (338 | ) | (9 | ) | (150 | ) | (179 | ) | (338 | ) | |||||||||||||||||
| Rate derivatives – outflows | 12 | 339 | 4 | 355 | 203 | 150 | 2 | 355 | ||||||||||||||||||||||||
| FX forwards – inflows | (148 | ) | – | – | (148 | ) | – | (148 | ) | – | (148 | ) | ||||||||||||||||||||
| FX forwards – outflows | 148 | – | – | 148 | 90 | – | 58 | 148 | ||||||||||||||||||||||||
Total | 112 | 394 | 407 | 913 | 446 | 320 | 147 | 913 | ||||||||||||||||||||||||
Cash deposits and derivative transactions are made with approved counterparties up to
pre-agreed
limits. To manage counterparty risk associated with cash and cash equivalents, the Group uses a mixture of money market funds as well as bank deposits. As at 31 December 2022, 77% (2021: 81%) of cash and cash equivalents was held with investment grade bank counterparties, 8% (2021: 9%) with AAA money market funds and 15% (2021: 10%) withnon-investment
grade bank counterparties.For trade receivables and contract assets, the Group’s exposure to credit risk is influenced mainly by the individual characteristics of each customer. However, risk associated with the industry and country in which customers operate may also influence the credit risk. The credit quality of customers is assessed by taking into account financial position, past experience and other relevant factors. Individual credit limits are set for each customer based on internal ratings. The compliance with credit limits is regularly monitored by the Group. A default on a trade receivable is when the counterparty fails to make contractual payments within the stated payment terms. Trade receivables and contract assets are written off when there is no reasonable expectation of recovery.
The carrying amounts of financial assets, trade receivables and contract assets represent the maximum credit exposure.
Trade receivables and contract assets are subject to impairment using the expected credit loss model. The Group applies the IFRS 9 simplified approach to measuring expected credit losses which uses a lifetime expected credit loss allowance for all trade receivables and contract assets. To measure the expected credit losses, trade receivables and contract assets have been grouped based on shared credit risk characteristics and the days past due. See note 22 for further details about trade receivables and contract assets including movements in provisions for bad and doubtful debts.
180 Pearson plc |
20. Intangible assets – product development
| All figures in £ millions | 2022 | 2021 | ||||||
Cost | ||||||||
| At 1 January | 2,698 | 2,514 | ||||||
| Exchange differences | 235 | – | ||||||
| Additions | 357 | 287 | ||||||
| Disposals and retirements | (191 | ) | (92 | ) | ||||
| Disposal of subsidiary (note 31) | (186 | ) | (9 | ) | ||||
| Transfers | 5 | (2 | ) | |||||
At 31 December | 2,918 | 2,698 | ||||||
Amortisation | ||||||||
| At 1 January | (1,804 | ) | (1,609 | ) | ||||
| Exchange differences | (174 | ) | (3 | ) | ||||
| Charge for the year | (288 | ) | (260 | ) | ||||
| Impairment | (15 | ) | (19 | ) | ||||
| Disposals and retirements | 191 | 92 | ||||||
| Disposal of subsidiary (note 31) | 147 | 3 | ||||||
| Transfers | – | (8 | ) | |||||
At 31 December | (1,943 | ) | (1,804 | ) | ||||
Carrying amounts at 31 December | 975 | 894 | ||||||
Product development assets are amortised over their estimated useful economic lives. Product development assets relating to content are amortised over seven years or less, being an estimate of the expected operating lifecycle of the title, with a higher proportion of the amortisation taken in the earlier years. Product development assets relating to product platforms are amortised over 10 years or less. Amortisation is included in the income statement in cost of goods sold.
Product development assets are assessed for impairment triggers on an annual basis or when triggering events occur. In 2022, of the £15m (2021: £19m) impairment charges, £13m (2021: £14m; 2020: £have been recognised as a result of asset write-offs related to the major restructuring programme. The full annual impairment test showed that there is adequate headroom across all product development assets and accordingly no further impairment charges were recognised in 2022 (2021: £nil; 2020: £nil).
nil)
21. Inventories
| All figures in £ millions | 2022 | 2021 | ||||||
| Raw materials | 5 | 7 | ||||||
| Work in progress | 2 | 2 | ||||||
| Finished goods | 93 | 84 | ||||||
| Returns asset | 5 | 5 | ||||||
105 | 98 | |||||||
The cost of inventories recognised as an expense and included in the income statement in cost of goods sold amounted to £166m (2021: £171m; 2020: £219m) including £16m (2021: £22m; 2020: £41m) of inventory provisions. None of the inventory is pledged as security. Included within the inventory balance is the estimation of the right to receive goods from contracts with customers via returns. The value of the returns asset is measured at the carrying amount of the assets at the time of sale aligned to the Group’s normal inventory valuation methodology less any expected costs to recover the asset and any expected reduction in value. Impairment charges against the inventory returns asset are £nil in 2022 (2021: £nil; 2020: £nil). The returns asset all relates to finished goods. The obsolescence provision takes account of the Group’s digital first strategy and the increasing shift towards print on demand. Thereduction in inventories is due to increased provisions for obsolescence and a reduction in the production of inventory due to the Group’s digital first strategy and the increasing shift towards print on demand.
year-on-year
| Annual report and accounts 2022 Pearson plc 181 |
Financial statements
Notes to the consolidated financial statements
continued
22. Trade and other receivables
| All figures in £ millions | 2022 | 2021 | ||||||
Current | ||||||||
| Trade receivables | 824 | 853 | ||||||
| Royalty advances | 1 | 2 | ||||||
| Prepayments | 200 | 198 | ||||||
| Investment in finance lease receivable | 17 | 15 | ||||||
| Accrued income | 15 | 14 | ||||||
| Other receivables | 82 | 175 | ||||||
1,139 | 1,257 | |||||||
Non-current | ||||||||
| Trade receivables | 1 | 1 | ||||||
| Royalty advances | 5 | 5 | ||||||
| Prepayments | 12 | 10 | ||||||
| Investment in finance lease receivable | 104 | 100 | ||||||
| Accrued income | 2 | 1 | ||||||
| Interest receivable | 3 | 8 | ||||||
| Other receivables | 12 | 4 | ||||||
139 | 129 | |||||||
Accrued income represents contract assets which are unbilled amounts generally resulting from assessments and services revenue streams where revenue to be recognised over time has been recognised in excess of customer billings to date. Impairment charges on accrued income assets are £nil (2021: £nil). The carrying value of the Group’s trade and other receivables approximates its fair value. Trade receivables are stated net of provisions for bad and doubtful debts. In addition to the above, there are trade receivables of £nil (2021: nil) classified as held for sale (see note 32).
The movements in the provision for bad and doubtful debts are as follows:
| All figures in £ millions | 2022 | 2021 | ||||||
| At beginning of year | (63 | ) | (74 | ) | ||||
| Exchange differences | (3 | ) | – | |||||
| Income statement movements | (18 | ) | (15 | ) | ||||
| Utilised | 12 | 26 | ||||||
| Disposal of subsidiary | 3 | – | ||||||
At end of year | (69 | ) | (63 | ) | ||||
Concentrations of credit risk with respect to trade receivables are limited due to the Group’s large number of customers, who are internationally dispersed.
The ageing of the Group’s gross trade receivables is as follows:
| All figures in £ millions | 2022 | 2021 | ||||||
| Within due date and one month past due date | 663 | 766 | ||||||
| One to three months past due date | 118 | 58 | ||||||
| Three to six months past due date | 25 | 20 | ||||||
| Six to nine months past due date | 14 | 13 | ||||||
| Nine to 12 months past due date | 14 | 5 | ||||||
| More than 12 months past due date | 60 | 55 | ||||||
Gross trade receivables | 894 | 917 | ||||||
The Group reviews its bad debt provision at least twice a year following a detailed review of receivable balances, historical payment profiles, and assessment of relevant forward-looking risk factors including macroeconomic trends. Management believes all the remaining receivable balances are fully recoverable.
The decrease in trade receivables held by the Group is driven by current year disposals. Other current receivables have decreased due to the receipt of deferred proceeds in relation to the US
K-12
disposal.182 Pearson plc |
23. Provisions for other liabilities and charges
| All figures in £ millions | Property | Disposals and closures | Legal and other | Total | ||||||||||||
| At 1 January 2022 | 15 | 2 | 30 | 47 | ||||||||||||
| Exchange differences | – | – | 4 | 4 | ||||||||||||
| Provisions made during the year | 9 | – | 78 | 87 | ||||||||||||
| Provisions reversed during the year | (1 | ) | – | (6 | ) | (7 | ) | |||||||||
| Provisions used during the year | (1 | ) | – | (30 | ) | (31 | ) | |||||||||
| Disposal of subsidiary | – | – | (1 | ) | (1 | ) | ||||||||||
At 31 December 2022 | 22 | 2 | 75 | 99 | ||||||||||||
Analysis of provisions:
| 2022 | ||||||||||||||||
| All figures in £ millions | Property | Disposals and closures | Legal and other | Total | ||||||||||||
| Current | 9 | 2 | 74 | 85 | ||||||||||||
Non-current | 13 | – | 1 | 14 | ||||||||||||
22 | 2 | 75 | 99 | |||||||||||||
| 2021 | ||||||||||||||||
| Current | 11 | 2 | 27 | 40 | ||||||||||||
Non-current | 4 | – | 3 | 7 | ||||||||||||
| 15 | 2 | 30 | 47 | |||||||||||||
Property provisions in 2022 and 2021 relate to the simplification of the Group’s property portfolio (see note 4). Disposals and closures relate to the disposal of the Pearson Institute of Higher Education.
Legal and other includes legal claims, contract disputes and potential contract losses with the provisions utilised as the cases are settled. Also included in legal and other are other restructuring provisions that are generally utilised within one year.
The year on year increase in provisions is mainly due to the 2022 restructuring programme (see note 4).
24. Trade and other liabilities
| All figures in £ millions | 2022 | 2021 | ||||||
Current | ||||||||
| Trade payables | 348 | 351 | ||||||
| Sales return liability | 53 | 83 | ||||||
| Deferred income | 340 | 330 | ||||||
| Interest payable | 10 | 42 | ||||||
| Accruals and other liabilities | 503 | 450 | ||||||
1,254 | 1,256 | |||||||
Non-current | ||||||||
| Deferred income | 60 | 56 | ||||||
| Accruals and other liabilities | 60 | 39 | ||||||
120 | 95 | |||||||
The carrying value of the Group’s trade and other liabilities approximates its fair value. The deferred income balance comprises contract liabilities in respect of advance payments in assessment, testing and training businesses; subscription income in school and college businesses; and obligations to deliver digital content in future periods. In addition to the above, there are accruals of £nil (2021: £nil) and deferred income of £nil (2021; £nil) classified as held for sale (see note 32). The increase in trade and other liabilities held by the Group is driven by an increase in accruals related to severance arising from the 2022 restructuring programme and the recognition of deferred consideration in relation to acquisitions made in 2022.
| Annual report and accounts 2022 Pearson plc 183 |
Financial statements
Notes to the consolidated financial statements
continued
25. Retirement benefit and other post-retirement obligations
Background
The Group operates a number of defined benefit and defined contribution retirement plans throughout the world.
The largest plan is the Pearson Pension Plan (UK Group plan) in the UK, which is sectionalised to provide both defined benefit and defined contribution pension benefits. The defined benefit section was largely closed to new members from 1 November 2006. The defined contribution section, opened in 2003, is open to new and existing employees. Finally, there is a separate section within the UK Group plan set up for auto-enrolment.
The defined benefit section of the UK Group plan is a final salary pension plan which provides benefits to members in the form of a guaranteed level of pension payable for life. The level of benefits depends on the length of service and final pensionable pay.
The defined contribution section of the UK Group plan operates a Reference Scheme Test (RST) pension underpin for its members. Where a member’s fund value is insufficient to purchase the RST pension upon retirement, the UK Group plan is liable for the shortfall to cover the member’s RST pension. In addition, in recent years, the scheme rules were amended to enable members who have sufficient funds to purchase an RST pension the ability to convert their fund value into a pension in the UK Group plan as an alternative to purchasing an annuity with an insurer. The Group recognises any assets and liabilities relating to these features of the defined contribution section as part of the overall UK Group plan obligation. From 1 January 2021, the Group also recognised the assets and liabilities for all members of the defined contribution section of the UK Group plan, accounting for the whole defined contribution section as a defined benefit scheme under IAS 19 ‘Employee Benefits’ as there is a risk the underpin will require the Group to pay further contributions to the scheme.
The UK Group plan is funded with benefit payments from trustee-administered funds. The UK Group plan is administered in accordance with the Trust Deed and Rules in the interests of its beneficiaries by Pearson Pension Trustee Limited.
At 31 December 2022, the UK Group plan had approximately 26,500 members, analysed in the following table:
| All figures in % | Active | Deferred | Pensioners | Total | ||||||||||||
| Defined benefit | – | 16 | 33 | 49 | ||||||||||||
| Defined contribution | 12 | 39 | – | 51 | ||||||||||||
Total | 12 | 55 | 33 | 100 | ||||||||||||
The other major defined benefit plans are based in the US. These are also final salary pension plans which provide benefits to members in the form of a guaranteed pension payable for life, with the level of benefits dependent on length of service and final pensionable pay. The majority of the US plans are fully funded.
The Group also has several post-retirement medical benefit plans (PRMBs), principally in the US. PRMBs are unfunded but are accounted for and valued similarly to defined benefit pension plans.
The defined benefit schemes expose the Group to actuarial risks, such as life expectancy, inflation risks and investment risk including asset volatility and changes in bond yields. The Group is not exposed to any unusual, entity-specific or plan-specific risks.
 | Key judgements | |||||||
Whether the Group will be eligible to receive the surplus associated with the UK Group Pension Plan in recognising a pension asset. | ||||||||
 | Key areas of estimation | |||||||
The determination of the pension cost and defined benefit obligation of the Group’s defined benefit pension schemes depends on the selection of certain assumptions, which include the discount rate, inflation rate, salary growth and longevity. | ||||||||
184 Pearson plc |
Assumptions
The principal assumptions used for the UK Group plan and the US PRMB are shown below. Weighted average assumptions have been shown for the other plans, which primarily relate to US pension plans.
2022 | 2021 | 2020 | ||||||||||||||||||||||||||||||||||||||
| All figures in % | UK Group plan | Other plans | PRMB | UK Group plan | Other plans | PRMB | UK Group plan | Other plans | PRMB | |||||||||||||||||||||||||||||||
| Inflation | 3.4 | 2.0 | – | 3.3 | 1.4 | – | 2.9 | 0.6 | – | |||||||||||||||||||||||||||||||
| Rate used to discount plan liabilities | 4.9 | 5.3 | 5.3 | 1.9 | 2.8 | 2.6 | 1.4 | 2.2 | 2.1 | |||||||||||||||||||||||||||||||
| Expected rate of increase in salaries | 3.9 | 2.9 | – | 3.8 | 2.7 | – | 3.4 | 2.2 | – | |||||||||||||||||||||||||||||||
Expected rate of increase for pensions in payment and deferred pensions | 1.95 to 5.20 | | – | – | 2.35 to 5.10 | – | – | 2.05 to 5.05 | – | – | ||||||||||||||||||||||||||||||
| Initial rate of increase in healthcare rate | – | – | 6.5 | – | – | 6.3 | – | – | 6.5 | |||||||||||||||||||||||||||||||
| Ultimate rate of increase in healthcare rate | – | – | 5.0 | – | – | 5.0 | – | – | 5.0 | |||||||||||||||||||||||||||||||
The UK discount rate is based on corporate bond yields adjusted to reflect the duration of liabilities.
The inflation rate for the UK Group plan of 3.4% (2021: 3.3%) reflects the RPI rate. In line with changes to legislation in 2010, certain benefits have been calculated with reference to CPI as the inflationary measure and in these instances a rate of 2.7% (2021: 2.6%) has been used. The CPI rate is determined as a weighted average deduction from the RPI rate, and allows for the expected change to the formula for calculating RPI to be in line with CPIH from 2030 onwards.
For the UK Group plan, the mortality base table assumptions are derived from the SAPS S3 for males and females, adjusted to reflect the observed experience of the plan, with CMI model improvement factors. A 1.5% long-term rate improvement on the CMI 2021 model is applied for both males and females, with a weighting to 2021 mortality experience in the CMI model of 10% to make an approximate allowance for the impact of the
COVID-19
pandemic. The analysis of experience, and standard tables, do not reflect the impact of the ongoingCOVID-19
pandemic, the ultimate impact of which remains uncertain.For the US plans, a mortality table (Pri – 2012) and 2021 improvement scale (MP – 2021) with generational projection for male and female annuitants has been adopted.
Using the above tables, the remaining average life expectancy in years of a pensioner retiring at age 65 on the balance sheet date for the UK Group plan and US plans is as follows:
| UK | US | |||||||||||||||||||||||||||
| All figures in years | 2022 | 2021 | 2020 | 2022 | 2021 | 2020 | ||||||||||||||||||||||
| Male | 22.5 | 22.6 | 24.0 | 20.6 | 20.5 | 20.4 | ||||||||||||||||||||||
| Female | 24.7 | 24.8 | 24.3 | 22.6 | 22.5 | 22.4 | ||||||||||||||||||||||
The remaining average life expectancy in years of a pensioner retiring at age 65, 20 years after the balance sheet date, for the UK and US Group plans is as follows:
| UK | US | |||||||||||||||||||||||||||
| All figures in years | 2022 | 2021 | 2020 | 2022 | 2021 | 2020 | ||||||||||||||||||||||
| Male | 24.1 | 24.2 | 25.6 | 22.1 | 22.0 | 21.9 | ||||||||||||||||||||||
| Female | 26.4 | 26.5 | 26.1 | 24.0 | 23.9 | 23.8 | ||||||||||||||||||||||
Although the Group anticipates that plan surpluses will be utilised during the life of the plan to address member benefits, the Group recognises it’s pension surplus in full in respect of the UK Group plan on the basis that it is management’s judgement that there are no substantive restrictions on the return of residual plan assets in the event of a winding up of the plan after all member obligations have been met.
| Annual report and accounts 2022 Pearson plc 185 |
Financial statements
Notes to the consolidated financial statements
continued
25. Retirement benefit and other post-retirement obligations continued
Financial statement information
The amounts recognised in the income statement are as follows:
2022 | ||||||||||||||||||||||||
| All figures in £ millions | UK Group plan | Defined benefit other | Sub-total | Defined contribution | PRMB | Total | ||||||||||||||||||
| Current service cost | 17 | 2 | 19 | 46 | – | 65 | ||||||||||||||||||
| Past service cost | 3 | – | 3 | – | – | 3 | ||||||||||||||||||
| Administration expenses | 7 | – | 7 | – | – | 7 | ||||||||||||||||||
Total operating expense | 27 | 2 | 29 | 46 | – | 75 | ||||||||||||||||||
| Interest on plan assets | (77 | ) | (3 | ) | (80 | ) | – | – | (80 | ) | ||||||||||||||
| Interest on plan liabilities | 67 | 3 | 70 | – | 1 | 71 | ||||||||||||||||||
Net finance (income)/expense | (10 | ) | – | (10 | ) | – | 1 | (9 | ) | |||||||||||||||
Net income statement charge | 17 | 2 | 19 | 46 | 1 | 66 | ||||||||||||||||||
| 2021 | ||||||||||||||||||||||||
| All figures in £ millions | UK Group plan | Defined benefit other | Sub-total | Defined contribution | PRMB | Total | ||||||||||||||||||
| Current service cost | 17 | 2 | 19 | 37 | – | 56 | ||||||||||||||||||
| Past service cost | – | – | – | – | – | – | ||||||||||||||||||
| Administration expenses | 6 | – | 6 | – | – | 6 | ||||||||||||||||||
Total operating expense | 23 | 2 | 25 | 37 | – | 62 | ||||||||||||||||||
| Interest on plan assets | (55 | ) | (2 | ) | (57 | ) | – | – | (57 | ) | ||||||||||||||
| Interest on plan liabilities | 49 | 3 | 52 | – | 1 | 53 | ||||||||||||||||||
Net finance (income)/expense | (6 | ) | 1 | (5 | ) | – | 1 | (4 | ) | |||||||||||||||
Net income statement charge | 17 | 3 | 20 | 37 | 1 | 58 | ||||||||||||||||||
| 2020 | ||||||||||||||||||||||||
| All figures in £ millions | UK Group plan | Defined benefit other | Sub-total | Defined contribution | PRMB | Total | ||||||||||||||||||
| Current service cost | 6 | 2 | 8 | 47 | – | 55 | ||||||||||||||||||
| Past service cost | 1 | – | 1 | – | – | 1 | ||||||||||||||||||
| Curtailments | – | (1 | ) | (1 | ) | – | – | (1 | ) | |||||||||||||||
| Administration expenses | 5 | – | 5 | – | – | 5 | ||||||||||||||||||
Total operating expense | 12 | 1 | 13 | 47 | – | 60 | ||||||||||||||||||
| Interest on plan assets | (66 | ) | (3 | ) | (69 | ) | – | – | (69 | ) | ||||||||||||||
| Interest on plan liabilities | 57 | 5 | 62 | – | 1 | 63 | ||||||||||||||||||
Net finance (income)/expense | (9 | ) | 2 | (7 | ) | – | 1 | (6 | ) | |||||||||||||||
Net income statement charge | 3 | 3 | 6 | 47 | 1 | 54 | ||||||||||||||||||
186 Pearson plc |
The amounts recognised in the balance sheet are as follows:
2022 | 2021 | |||||||||||||||||||||||||||||||||||
| All figures in £ millions | UK Group plan | Other funded plans | Other unfunded plans | Total | UK Group plan | Other funded plans | Other unfunded plans | Total | ||||||||||||||||||||||||||||
| Fair value of plan assets | 3,088 | 104 | – | 3,192 | 4,125 | 120 | – | 4,245 | ||||||||||||||||||||||||||||
| Present value of defined benefit obligation | (2,514 | ) | (106 | ) | (17 | ) | (2,637 | ) | (3,588 | ) | (123 | ) | (20 | ) | (3,731 | ) | ||||||||||||||||||||
Net pension asset/(liability) | 574 | (2 | ) | (17 | ) | 555 | 537 | (3 | ) | (20 | ) | 514 | ||||||||||||||||||||||||
| Other post-retirement medical benefit obligation | (25 | ) | (34 | ) | ||||||||||||||||||||||||||||||||
| Other pension accruals | (10 | ) | (9 | ) | ||||||||||||||||||||||||||||||||
Net retirement benefit asset | 520 | 471 | ||||||||||||||||||||||||||||||||||
Analysed as: | ||||||||||||||||||||||||||||||||||||
| Retirement benefit assets | 581 | 537 | ||||||||||||||||||||||||||||||||||
| Retirement benefit obligations | (61 | ) | (66 | ) | ||||||||||||||||||||||||||||||||
The following gains/(losses) have been recognised in other comprehensive income: | ||||||||||||
| All figures in £ millions | 2022 | 2021 | 2020 | |||||||||
| Amounts recognised for defined benefit plans | 44 | 145 | (24 | ) | ||||||||
| Amounts recognised for post-retirement medical benefit plans | 10 | 4 | 1 | |||||||||
Total recognised in year | 54 | 149 | (23 | ) | ||||||||
The fair value of plan assets comprises the following: | ||||||||||||||||||||||||||||
2022 | 2021 | |||||||||||||||||||||||||||
| All figures in % | UK Group plan | Other funded plans | Total | UK Group plan | Other funded plans | Total | ||||||||||||||||||||||
| Insurance | 33 | – | 33 | 35 | – | 35 | ||||||||||||||||||||||
| Equities | 15 | 1 | 16 | 11 | 1 | 12 | ||||||||||||||||||||||
| Fixed interest securities | 7 | 2 | 9 | 7 | 2 | 9 | ||||||||||||||||||||||
| Property | 6 | – | 6 | 5 | – | 5 | ||||||||||||||||||||||
| Pooled asset investment funds (including LDI) | 22 | – | 22 | 30 | – | 30 | ||||||||||||||||||||||
| Other | 14 | – | 14 | 9 | – | 9 | ||||||||||||||||||||||
The plan assets do not include any of the Group’s own financial instruments, or any property occupied by the Group. The table below further disaggregates the plan assets into those assets which have a quoted market price in an active market and those that do not: | ||||||||||||||||||||
2022 | 2021 | |||||||||||||||||||
| All figures in % | Quoted market price | No quoted market price | Quoted market price | No quoted market price | ||||||||||||||||
| Insurance | 33 | – | 35 | – | ||||||||||||||||
| Equities | 16 | – | 11 | 1 | ||||||||||||||||
| Fixed-interest securities | 9 | – | 9 | – | ||||||||||||||||
| Property | – | 6 | – | 5 | ||||||||||||||||
| Pooled asset investment funds (including LDI) | 22 | – | 30 | – | ||||||||||||||||
| Other | 1 | 13 | – | 9 | ||||||||||||||||
Total | 81 | 19 | 85 | 15 | ||||||||||||||||
| Annual report and accounts 2022 Pearson plc 187 |
Financial statements
Notes to the consolidated financial statements
continued
25. Retirement benefit and other post-retirement obligations continued
Financial statement information continued
The liquidity profile of the UK Group plan assets is as follows:
| All figures in % | 2022 | 2021 | ||||||
| Liquid – call <1 month | 47 | 51 | ||||||
| Less liquid – call 1–3 months | 2 | – | ||||||
| Illiquid – call >3 months | 51 | 49 | ||||||
Changes in the values of plan assets and liabilities of the retirement benefit plans are as follows:
2022 | 2021 | |||||||||||||||||||||||||||
| All figures in £ millions | UK Group plan | Other plans | Total | UK Group plan | Other plans | Total | ||||||||||||||||||||||
Fair value of plan assets | ||||||||||||||||||||||||||||
| Opening fair value of plan assets | 4,125 | 120 | 4,245 | 3,588 | 119 | 3,707 | ||||||||||||||||||||||
| Recognition of Money Purchase assets | – | – | – | 513 | – | 513 | ||||||||||||||||||||||
| Exchange differences | – | 12 | 12 | – | 2 | 2 | ||||||||||||||||||||||
| Interest on plan assets | 77 | 3 | 80 | 55 | 2 | 57 | ||||||||||||||||||||||
| Return on plan assets excluding interest | (1,000 | ) | (18 | ) | (1,018 | ) | 71 | 6 | 77 | |||||||||||||||||||
| Contributions by employer | 15 | 2 | 17 | 14 | 1 | 15 | ||||||||||||||||||||||
| Benefits paid | (136 | ) | (15 | ) | (151 | ) | (123 | ) | (10 | ) | (133 | ) | ||||||||||||||||
| Contributions by employees | 7 | – | 7 | 7 | – | 7 | ||||||||||||||||||||||
Closing fair value of plan assets | 3,088 | 104 | 3,192 | 4,125 | 120 | 4,245 | ||||||||||||||||||||||
Present value of defined benefit obligation | ||||||||||||||||||||||||||||
| Opening defined benefit obligation | (3,588 | ) | (143 | ) | (3,731 | ) | (3,178 | ) | (156 | ) | (3,334 | ) | ||||||||||||||||
| Recognition of Money Purchase liabilities | – | – | – | (513 | ) | – | (513 | ) | ||||||||||||||||||||
| Exchange differences | – | (14 | ) | (14 | ) | – | (1 | ) | (1 | ) | ||||||||||||||||||
| Disposals | – | 1 | 1 | – | – | – | ||||||||||||||||||||||
| Current service cost | (17 | ) | (2 | ) | (19 | ) | (17 | ) | (2 | ) | (19 | ) | ||||||||||||||||
| Past service cost | (3 | ) | – | (3 | ) | – | – | – | ||||||||||||||||||||
| Administration expenses | (7 | ) | – | (7 | ) | (6 | ) | – | (6 | ) | ||||||||||||||||||
| Interest on plan liabilities | (67 | ) | (3 | ) | (70 | ) | (49 | ) | (3 | ) | (52 | ) | ||||||||||||||||
| Actuarial (losses)/gains – experience | (25 | ) | (2 | ) | (27 | ) | (100 | ) | 3 | (97 | ) | |||||||||||||||||
| Actuarial gains/(losses) – demographic | 14 | – | 14 | (1 | ) | – | (1 | ) | ||||||||||||||||||||
| Actuarial gains – financial | 1,050 | 25 | 1,075 | 160 | 6 | 166 | ||||||||||||||||||||||
| Contributions by employees | (7 | ) | – | (7 | ) | (7 | ) | – | (7 | ) | ||||||||||||||||||
| Benefits paid | 136 | 15 | 151 | 123 | 10 | 133 | ||||||||||||||||||||||
Closing defined benefit obligation | (2,514 | ) | (123 | ) | (2,637 | ) | (3,588 | ) | (143 | ) | (3,731 | ) | ||||||||||||||||
From 1 January 2021, the Group has recognised the assets and liabilities for all members of the defined contribution section of the UK Group plan, accounting for the whole defined contribution section as a defined benefit scheme under IAS 19 ‘Employee Benefits’. The net impact on the balance sheet was £nil, however, the gross amounts of £513m can be seen in the table above. Subsequent movements to those assets and liabilities are included in the relevant lines in the table above.
The weighted average duration of the defined benefit obligation is 13 years for the UK and six years for the US.
188 Pearson plc |
Changes in the value of the US PRMB are as follows: | ||||||||
| All figures in £ millions | 2022 | 2021 | ||||||
| Opening defined benefit obligation | (34 | ) | (39 | ) | ||||
| Exchange differences | (3 | ) | (1 | ) | ||||
| Interest on plan liabilities | (1 | ) | (1 | ) | ||||
| Actuarial gains – experience | 5 | 2 | ||||||
| Actuarial gains – financial | 5 | 2 | ||||||
| Benefits paid | 3 | 3 | ||||||
Closing defined benefit obligation | (25 | ) | (34 | ) | ||||
Funding
The UK Group plan is self-administered with the plan’s assets being held independently of the Group in trust. The trustee of the UK Group plan is required to act in the best interest of the plan’s beneficiaries. The most recent triennial actuarial valuation for funding purposes was completed as at 1 January 2021 and this valuation revealed a technical provision funding surplus of £160m. The UK Group plan expects to be able to provide benefits (in accordance with the plan rules) with a very low level of reliance on future funding from the Group.
Assets of the UK Group plan are divided into two main elements: liability matching assets and return seeking assets. The UK Group plan’s investment strategy allocates approximately 95% to matching assets and 5% to return-seeking assets.
Liability matching assets are assets that produce cash flows that can be expected to match the cash flows for a proportion of the membership, and include a liability-driven investment mandate (LDI) for which a Qualifying Investor Alternative Investment Fund (QIAIF) was established, managed by a subsidiary of Legal & General Investment Management. The QIAIF invests in UK bonds, interest rate/inflation swaps and other derivative instruments in order to reduce interest rate and inflation risks using accurate cash flow matching and risk control. Other liability matching assets include pensioner
buy-in
insurance policies, bonds and inflation-linked property and infrastructure.Following the purchase of
buy-in
policies with Legal & General and Aviva in 2017 and 2019, 95% of the UK Group plan’s pensioner liabilities were matched withbuy-in
policies. These transfer significant longevity risk to Aviva and Legal & General, reducing the pension risks being underwritten by the Group and providing additional security for members.Return-seeking assets are assets invested with a longer-term horizon to generate the returns needed to provide the remaining expected cash flows for the beneficiaries, and include diversified growth funds, property and alternative asset classes.
Recent economic and geopolitical uncertainty has increased volatility in the valuation of certain assets, in particular the LDI and insurance contracts. However, these movements are offset by equivalent movements in the defined benefit obligation. The UK Group plan divides its assets between a number of investment managers and across different types of assets, as such there is no significant concentration of risk.
Regular employer contributions to the UK Group plan in respect of the defined benefit sections are estimated to be £nil for 2023.
Sensitivities
The effect of a one percentage point increase and decrease in the discount rate on the defined benefit obligation and the total pension expense is as follows: | ||||||||
2022 | ||||||||
| All figures in £ millions | 1% increase | 1% decrease | ||||||
Effect: | ||||||||
| (Decrease)/increase in defined benefit obligation – UK Group plan | (209 | ) | 261 | |||||
| (Decrease)/increase in defined benefit obligation – US plan | (7 | ) | 7 | |||||
The effect of members living one year more or one year less on the defined benefit obligation is as follows: | ||||||||
2022 | ||||||||
| All figures in £ millions | One year increase | One year decrease | ||||||
Effect: | ||||||||
| Increase/(decrease) in defined benefit obligation – UK Group plan | 59 | (59 | ) | |||||
| Increase/(decrease) in defined benefit obligation – US plan | 3 | (2 | ) | |||||
| Annual report and accounts 2022 Pearson plc 189 |
Financial statements
Notes to the consolidated financial statements
continued
25. Retirement benefit and other post-retirement obligations continued
The effect of a half percentage point increase and decrease in the inflation rate is as follows:
2022 | ||||||||
| All figures in £ millions | 0.5% increase | 0.5% decrease | ||||||
Effect: | ||||||||
| Increase/(decrease) in defined benefit obligation – UK Group plan | 59 | (57 | ) | |||||
| Increase/(decrease) in defined benefit obligation – US plan | – | – | ||||||
The above sensitivity analyses are based on a change in an assumption while holding all other assumptions constant, although in practice this is unlikely to occur and changes in some assumptions may be correlated. When calculating these sensitivities, the same method has been applied to calculate the defined benefit obligation as has been applied when calculating the liability recognised in the balance sheet. This methodology is the same as prior periods.
26. Share-based payments
The Group recognised the following charges in the income statement in respect of its equity-settled share-based payment plans: | ||||||||||||
| All figures in £ millions | 2022 | 2021 | 2020 | |||||||||
| Pearson plans | 38 | 28 | 29 | |||||||||
The Group operates the following equity-settled employee option and share plans:
Worldwide Save for Shares Plan – The Group has a Worldwide Save for Shares Plan. Under these plans, employees can save a portion of their monthly salary over a period of three years. At the end of this period, the employee has the option to purchase ordinary shares with the accumulated funds at a purchase price equal to 80% of the market price prevailing at the time of the commencement of the employee’s participation in the plan. Options that are not exercised within six months of the end of the savings period lapse unconditionally.
Employee Stock Purchase Plan – In 2000, the Group established an Employee Stock Purchase Plan which allows all employees in the US to save a portion of their monthly salary over
six-month
periods. At the end of the period, the employee has the option to purchase American Depositary Receipts (ADRs) with their accumulated funds at a purchase price equal to 85% of the lower of the market prices prevailing at the beginning or end of the period.Long-Term Incentive Plan – The plan was first introduced in 2001 and from time to time the plan rules are renewed. The plan consists of restricted shares. The vesting of restricted shares is normally dependent on continuing service over a three to five-year period, and in the case of Executive Directors and senior management upon the satisfaction of corporate performance targets over a three-year period. These targets may be based on market and/or
non-market
performance criteria. Restricted shares awarded to Executive Directors in May 2022, May 2021 and May 2020 vest dependent on relative total shareholder return, return on invested capital and adjusted earnings per share growth. These awards are in addition to the 2020one-off
co-investment
award for the Chief Executive, vesting in three equal tranches based on market andnon-market
performance criteria. The applicable market condition for the vesting of the final tranche is on total shareholder return. Other restricted shares awarded in 2022, 2021 and 2020 generally vest depending on continuing service over periods of up to four years. Included within the total share-based payments charge in 2022 was £3m (2021: £nil; 2020: £nil) in respect of remuneration for post-acquisition services for recent acquisitions, which was included within other net gains and losses in the income statement.Management Incentive Plan – The plan was introduced in 2017 combining the Group’s Annual Incentive Plan and Long-Term Incentive Plan for senior management. The number of shares to be granted to participants is dependent on Group performance in the calendar year preceding the date of grant (on the same basis as the Annual Incentive Plan). Subsequently, the shares vest dependent on continuing service over a three-year period, and additionally, in the case of the Pearson Executive Management team, upon satisfaction of
non-market
based performance criteria as determined by the Remuneration Committee. Restricted shares awarded as part of the 2020 Management Incentive Plan were granted in April 2021. In 2021 this scheme was replaced by the Long-Term Incentive Plan for senior management.The following shares were granted under restricted share arrangements: | ||||||||||||||||
2022 | 2021 | |||||||||||||||
Number of shares 000s | Weighted average fair value £ | Number of shares 000s | Weighted average fair value £ | |||||||||||||
| Long-Term Incentive Plan | 7,584 | 7.61 | 6,394 | 7.27 | ||||||||||||
| Management Incentive Plan | – | – | 630 | 7.71 | ||||||||||||
In 2022, £26m of shares vested across the Worldwide Save for Shares Plan, the Long-Term Incentive Plan and the Management Incentive Plan.
The fair value of shares granted under the Long-Term Incentive Plan and the Management Incentive Plan that vest unconditionally is determined using the share price at the date of grant. Participants under the plans are entitled to dividends during the vesting period and therefore the share price is not discounted.
Restricted shares with a market performance condition were valued by an independent actuary using a Monte Carlo model. Restricted shares with a
non-market
performance condition were fair valued based on the share price at the date of grant.Non-market
performance conditions are taken into consideration by adjusting the number of shares expected to vest based on the most likely outcome of the relevant performance criteria.190 Pearson plc |
27. Share capital and share premium
Number of shares 000s | Share capital £m | Share premium £m | ||||||||||
| At 1 January 2021 | 753,258 | 188 | 2,620 | |||||||||
| Issue of ordinary shares – share option schemes | 3,544 | 1 | 6 | |||||||||
| Purchase of own shares | – | – | – | |||||||||
At 31 December 2021 | 756,802 | 189 | 2,626 | |||||||||
| Issue of ordinary shares – share option schemes | 1,199 | – | 7 | |||||||||
| Purchase of own shares | (42,268 | ) | (10 | ) | – | |||||||
At 31 December 2022 | 715,733 | 179 | 2,633 | |||||||||
The ordinary shares have a par value of 25p per share (2021: 25p per share). All issued shares are fully paid. All shareholders are entitled to receive dividends and vote at general meetings of the company. All shares have the same rights.
On 24 February 2022, the Board approved a £350m share buyback programme in order to return capital to shareholders. During the year, approximately 42m shares were bought back and cancelled at a cost of £353m. The nominal value of these shares, £10m, was transferred to the capital redemption reserve, and the remainder of the purchase price is recorded within retained earnings. In 2021, no shares were bought back.
The Group manages its capital to ensure that entities in the Group will be able to continue as a going concern while maximising the return to shareholders through the optimisation of the debt and equity balance.
The capital structure of the Group consists of debt (see note 18), cash and cash equivalents (see note 17) and equity attributable to equity holders of the parent, comprising issued capital, reserves and retained earnings.
The Group reviews its capital structure on a regular basis and will balance its overall capital structure through payments of dividends, new share issues as well as the issue of new debt or the redemption of existing debt in line with the financial risk policies outlined in note 19.
28. Treasury shares
Number of shares 000s | £m | |||||||
| At 1 January 2021 | 903 | 7 | ||||||
| Purchase of treasury shares | 2,158 | 16 | ||||||
| Newly issued treasury shares | 2,500 | 1 | ||||||
| Release of treasury shares | (3,990 | ) | (12 | ) | ||||
At 31 December 2021 | 1,571 | 12 | ||||||
| Purchase of treasury shares | 4,513 | 37 | ||||||
| Release of treasury shares | (4,220 | ) | (34 | ) | ||||
At 31 December 2022 | 1,864 | 15 | ||||||
The Group holds Pearson plc shares in trust to satisfy its obligations under its restricted share plans (see note 26). These shares, representing 0.3% (2021: 0.2%) of
called-up
share capital, are treated as treasury shares for accounting purposes and have a par value of 25p per share.The nominal value of Pearson plc treasury shares amounts to £0.5m (2021: £0.4m). Dividends on treasury shares are waived.
At 31 December 2022, the market value of Pearson plc treasury shares was £18m (2021: £10m).
| Annual report and accounts 2022 Pearson plc 191 |
Financial statements
Notes to the consolidated financial statements
continued
29. Other comprehensive income
2022 | ||||||||||||||||||||||||
Attributable to equity holders of the company | Non- controlling interest | |||||||||||||||||||||||
| All figures in £ millions | Fair value reserve | Translation reserve | Retained earnings | Total | Total | |||||||||||||||||||
Items that may be reclassified to the income statement | ||||||||||||||||||||||||
| Net exchange differences on translation of foreign operations | – | 328 | – | 328 | 2 | 330 | ||||||||||||||||||
| Currency translation adjustment disposed | – | (5 | ) | – | (5 | ) | – | (5 | ) | |||||||||||||||
| Attributable tax | – | – | 4 | 4 | – | 4 | ||||||||||||||||||
Items that are not reclassified to the income statement | ||||||||||||||||||||||||
| Fair value gain on other financial assets | 18 | – | – | 18 | – | 18 | ||||||||||||||||||
| Attributable tax | – | – | 1 | 1 | – | 1 | ||||||||||||||||||
| Remeasurement of retirement benefit obligations | – | – | 54 | 54 | – | 54 | ||||||||||||||||||
| Attributable tax | – | – | (12 | ) | (12 | ) | – | (12 | ) | |||||||||||||||
Other comprehensive income/(expense) for the year | 18 | 323 | 47 | 388 | 2 | 390 | ||||||||||||||||||
2021 1 | ||||||||||||||||||||||||
| Attributable to equity holders of the company | Non- controlling interest | |||||||||||||||||||||||
| All figures in £ millions | Fair value reserve | Translation reserve | Retained earnings | Total | Total | |||||||||||||||||||
Items that may be reclassified to the income statement | ||||||||||||||||||||||||
| Net exchange differences on translation of foreign operations | – | (6 | ) | – | (6 | ) | – | (6 | ) | |||||||||||||||
| Currency translation adjustment disposed | – | 4 | – | 4 | – | 4 | ||||||||||||||||||
| Attributable tax | – | – | 10 | 10 | – | 10 | ||||||||||||||||||
Items that are not reclassified to the income statement | ||||||||||||||||||||||||
| Fair value gain on other financial assets | 4 | – | – | 4 | – | 4 | ||||||||||||||||||
| Attributable tax | – | – | (1 | ) | (1 | ) | – | (1 | ) | |||||||||||||||
| Remeasurement of retirement benefit obligations | – | – | 149 | 149 | – | 149 | ||||||||||||||||||
| Attributable tax | – | – | (61 | ) | (61 | ) | – | (61 | ) | |||||||||||||||
Other comprehensive income/(expense) for the year | 4 | (2 | ) | 97 | 99 | – | 99 | |||||||||||||||||
1. Comparative balances have been restated – see Note 1b.
2020 1 | ||||||||||||||||||||||||
| Attributable to equity holders of the company | Non- controlling interest | |||||||||||||||||||||||
| All figures in £ millions | Fair value reserve | Translation reserve | Retained earnings | Total | Total | |||||||||||||||||||
Items that may be reclassified to the income statement | ||||||||||||||||||||||||
| Net exchange differences on translation of foreign operations | – | (109 | ) | – | (109 | ) | – | (109 | ) | |||||||||||||||
| Currency translation adjustment disposed | – | (70 | ) | – | (70 | ) | – | (70 | ) | |||||||||||||||
| Attributable tax | – | – | (13 | ) | (13 | ) | – | (13 | ) | |||||||||||||||
Items that are not reclassified to the income statement | ||||||||||||||||||||||||
| Fair value gain/(loss) on other financial assets | (12 | ) | – | – | (12 | ) | – | (12 | ) | |||||||||||||||
| Attributable tax | – | – | – | – | – | – | ||||||||||||||||||
| Remeasurement of retirement benefit obligations | – | – | (23 | ) | (23 | ) | – | (23 | ) | |||||||||||||||
| Attributable tax | – | – | 2 | 2 | – | 2 | ||||||||||||||||||
Other comprehensive income/(expense) for the year | (12 | ) | (179 | ) | (34 | ) | (225 | ) | – | (225 | ) | |||||||||||||
1. Comparative balances have been restated – see Note 1b.
192 Pearson plc |
30. Business combinations
On 28 January 2022, the Group acquired 100% of the share capital in Credly Inc (Credly), having previously held a 19.9% interest in the company. Credly was founded in 2012 in New York and is a digital credential service provider whose platform enables customers to design, create, issue and manage digital credentials. It now forms part of the Workforce Skills division. Total consideration was £149m comprising upfront cash consideration of £107m, Pearson’s existing interest valued at £31m and £11m of deferred consideration. The deferred consideration is payable in two years, with additional amounts being payable if certain revenue and
non-financial
targets are met, and dependent on continuing employment, and therefore these additional amounts will be expensed over the period and are not treated as consideration.On 28 April 2022, the Group acquired 100% of the share capital of ATI STUDIOS A.P.P.S S.R.L (Mondly), a global online learning platform offering customers learning in English and 40 other languages via its app, website, virtual reality and augmented reality products. It now forms part of the English Language Learning division. Total consideration was £135m comprising upfront cash consideration of £105m, and deferred consideration of £30m. The deferred consideration is payable over the next two years with no performance conditions attached. In addition, a further $29.6m (c£24m) of cash and $10m (c£8m) in shares will be paid over the next four years, dependent on continuing employment, and therefore these additional amounts will be expensed over the period and are not treated as consideration.
These transactions have resulted in the recognition of £202m of goodwill, which represents the expected growth through new products and customers, the workforce and
know-how
acquired and the anticipated synergies, none of which can be recognised as separate intangible assets. The goodwill is not deductible for tax purposes.Intangible assets of £m have been recognised in respect of Credly and Mondly. The valuations of these assets were carried out by third party specialists, and were based on discounted cash flow models. The key assumptions that feed into the valuations are the cash flow forecasts, revenue projections from existing customers, forecasted profit margins and discount rates. For Credly, £m of intangible assets were recognised, mainly relating to the existing customer relationships that will be amortised over 20 years, and technology which will be amortised overm of intangible assets were recognised, the majority of which relates to acquired technology, and will be amortised over periods up to
99
49
five
years. For Mondly, £50
seven
years.In 2022, the Group also made three smaller acquisitions in the period for total consideration of £11m. In December 2022, the Group announced that it had signed a deal to acquire
100
% of Personnel Decisions Research Institutes, LLC, the transaction has not yet completed.In September 2021, Pearson completed the acquisition of 100% of the share capital of Faethm Holdings Pty Limited (Faethm), having already held 9% of the share capital previously. Faethm uses artificial intelligence and analytics services to help governments, companies and workers understand the dynamic forces shaping the labour market. Faethm now forms part of the Workforce Skills division. The total consideration for the transaction was £65m, which included £10m of contingent consideration, dependent upon meeting certain earnings targets. The contingent consideration was valued at the net present value of the Group’s best estimate of the amount that will be payable. In 2022, contingent consideration amounts have been settled resulting in the recognition of an £8m gain in the income statement within other net gains and losses.
In addition, the Group made two additional acquisitions of subsidiaries for total consideration of £11m. In both cases, the Group acquired 100% of the share capital of the respective entities. Opinion Interactive LLC (also known as Spotlight Education) was acquired in February 2021. MZ Development Inc. was acquired in July 2021. Both form part of the Assessment & Qualifications division.
The Group also made additional investments in associates, which are detailed in note 12, and are not included below.
Details of the fair values of the assets and liabilities recognised at the acquisition date and the related consideration is shown in the table below. Amounts for intangible assets and goodwill for Mondly are provisional as management finalise reviews of the asset valuations. There were no significant acquisitions in 2020.
| All figures in £ millions | 2022 Credly | 2022 Mondly | 2022 Other | 2022 Total | 2021 Total | 2020 Total | ||||||||||||||||||
| Intangible assets | 49 | 50 | 11 | 110 | 27 | – | ||||||||||||||||||
| Deferred tax asset | 7 | 1 | – | 8 | 11 | – | ||||||||||||||||||
| Trade and other receivables | 6 | 2 | – | 8 | 2 | – | ||||||||||||||||||
| Cash and cash equivalents | 12 | 1 | – | 13 | 4 | – | ||||||||||||||||||
| Trade and other liabilities | (18 | ) | (8 | ) | – | (26 | ) | (5 | ) | – | ||||||||||||||
| Deferred tax liabilities | (12 | ) | (8 | ) | (2 | ) | (22 | ) | (6 | ) | – | |||||||||||||
Net assets acquired | 44 | 38 | 9 | 91 | 33 | – | ||||||||||||||||||
| Goodwill | 105 | 97 | 2 | 204 | 43 | – | ||||||||||||||||||
Total | 149 | 135 | 11 | 295 | 76 | – | ||||||||||||||||||
Satisfied by: | ||||||||||||||||||||||||
| Cash consideration | 107 | 105 | 11 | 223 | 54 | – | ||||||||||||||||||
| Contingent or deferred consideration | 11 | 30 | – | 41 | 16 | – | ||||||||||||||||||
| Fair value of existing investment | 31 | – | – | 31 | 6 | – | ||||||||||||||||||
Total consideration | 149 | 135 | 11 | 295 | 76 | – | ||||||||||||||||||
Credly generated revenues of £
13
m and a loss after tax of £4
m for the period from acquisition date to 31 December 2022. Mondly generated revenues of £11
m and a profit after tax of £3
m for the period from acquisition date to 31 December 2022. If the acquisitions had occurred on 1 January 2022, the Group’s revenue would have been £7
m higher and the profit after tax would not have been materially different.| Annual report and accounts 2022 Pearson plc 193 |
Financial statements
Notes to the consolidated financial statements
continued
30. Business combinations continued
Total acquisition related costs of £20m were recognised in 2022 within other net gains and losses.
The net cash outflows related to the acquisitions are set out in the table below. In addition to the current year acquisitions, the other net cash outflows on acquisition of subsidiaries in 2022 and 2021 relate to deferred payments for prior year acquisitions.
| All figures in £ millions | 2022 Total | 2021 Total | 2020 Total | |||||||||
Cash flow on acquisitions | ||||||||||||
| Cash – current year acquisitions | (223 | ) | (54 | ) | – | |||||||
| Cash and cash equivalents acquired | 13 | 4 | – | |||||||||
| Deferred payments for prior year acquisitions and other items | (10 | ) | (4 | ) | (6 | ) | ||||||
| Acquisition costs paid | (8 | ) | (1 | ) | – | |||||||
Net cash outflow | (228 | ) | (55 | ) | (6 | ) | ||||||
31. Disposals and business closures
In March 2021, the Group announced that it was launching a strategic review of its international courseware local publishing businesses. In 2022, the Group disposed of its interests in the Canadian educational publisher (ERPI), Pearson Italia S.p.A, Stark Verlag GmbH, Austin Education (Hong Kong) Limited, Pearson South Africa (Pty) Ltd and various other South African companies. Total cash consideration received was £287m resulting in a
pre-tax
gain on disposal of £42m. All entities disposed of were previously in the Strategic Review segment. £5m of losses arose from other immaterial disposals and costs related to the wind-down of certain businesses.Whether the associated results and cash flows of the businesses disposed in 2022 should be classified and presented as discontinued operations is a significant judgement. The Group’s judgement is that the results and cash flows of the related businesses should not be classified and presented as discontinued operations. The basis of this judgement is that the businesses disposed do not constitute a separate major line of business or geographical area of operations. The Group will continue to operate in the international K12 courseware market and in all geographical areas where disposals have taken place. All of the businesses subject to this judgement are within the Strategic Review segment and represent £126m of sales for the year ended 31 December 2022 out of the total sales in the Strategic Review segment of £154m. If the Group had concluded that these businesses represented discontinued operations, their results and the related gains on disposal would not have been included within each of the continuing operations income statement lines. Profit for the period from continuing operations would have been £52m lower and this amount would have been separately presented as profit for the period from discontinued operations as a single line item.
In February 2021, the Group completed the sale of its interests in the Pearson Institute of Higher Education (PIHE) in South Africa resulting in a
pre-tax
loss of £5m. In October 2021, the sale of the Group’s interests in K12 Sistemas in Brazil was also completed for consideration of £108 million, resulting in a gain on sale of £84m. There were no other business disposals in 2021 and additional losses of £14m relate to other disposal costs including costs related to the wind-down of certain businesses under strategic review.In April 2020, the Group completed the sale of the remaining 25% interest in Penguin Random House resulting in a
pre-tax
profit of £180m. There were no other material disposals in 2020. Deferred proceeds relating to the K12 sale were received in 2022, 2021 and 2020 (see note 14).None of the 2021 or 2020 disposals met the criteria to be considered a discontinued operation on the basis that they did not represent major lines of business or geographical areas of operations.
194 Pearson plc |
The table below shows a summary of the assets and liabilities disposed of:
| All figures in £ millions | Notes | 2022 | 2021 | 2020 | ||||||||||||
Disposal of subsidiaries and associates | ||||||||||||||||
| Intangible assets, including goodwill | (77 | ) | (3 | ) | – | |||||||||||
| Property, plant and equipment | (11 | ) | (48 | ) | – | |||||||||||
| Investments in joint ventures and associates | – | – | (418 | ) | ||||||||||||
| Intangible assets – product development | (39 | ) | (6 | ) | – | |||||||||||
| Inventories | (33 | ) | (2 | ) | – | |||||||||||
| Trade and other receivables | (106 | ) | (6 | ) | – | |||||||||||
| Deferred tax | (12 | ) | – | – | ||||||||||||
| Cash and cash equivalents (excluding overdrafts) | (21 | ) | (24 | ) | – | |||||||||||
| Provisions for other liabilities and charges | 1 | 3 | – | |||||||||||||
| Retirement benefit obligations | 2 | – | – | |||||||||||||
| Trade and other liabilities | 52 | 4 | – | |||||||||||||
| Financial liabilities – borrowings | 8 | 67 | – | |||||||||||||
Net assets disposed | (236 | ) | (15 | ) | (418 | ) | ||||||||||
| Cumulative currency translation adjustment | 5 | (4 | ) | 70 | ||||||||||||
| Cash proceeds | 291 | 108 | 531 | |||||||||||||
| Deferred proceeds | 2 | – | – | |||||||||||||
| Costs of disposal | (25 | ) | (24 | ) | 1 | |||||||||||
Gain on disposal | 37 | 65 | 184 | |||||||||||||
| All figures in £ millions | 2022 | 2021 | 2020 | |||||||||||||
Cash flow from disposals | ||||||||||||||||
| Proceeds – current year disposals | 291 | 108 | 531 | |||||||||||||
| Proceeds – prior year disposals | 86 | 16 | 105 | |||||||||||||
| Cash and cash equivalents disposed | (21 | ) | (24 | ) | – | |||||||||||
| Costs and other disposal liabilities paid | (23 | ) | (17 | ) | (5 | ) | ||||||||||
Net cash inflow | 333 | 83 | 631 | |||||||||||||
Analysed as: | ||||||||||||||||
| Cash inflow from disposal of subsidiaries | 333 | 83 | 100 | |||||||||||||
| Cash inflow from disposal of joint ventures and associates | – | – | 531 | |||||||||||||
| Annual report and accounts 2022 Pearson plc 195 |
Financial statements
Notes to the consolidated financial statements
continued
32. Held for sale
At 31 December 2022, the Group has entered into an agreement to dispose of a property that was previously accounted for as investment property. The sale is expected to complete in 2023. Two other properties are currently also in the process of being sold, with the sales also expected to complete in 2023. The properties are all classified as held for sale and have a carrying value of £16m as at 31 December 2022.
At 31 December 2021, only one property, which was disposed of in 2022, was classified as held for sale, and had a carrying value of £7m as at 31 December 2021. The businesses that were included in the Strategic Review segment as at 31 December 2021 did not meet the criteria for classification as held for sale as at 31 December 2021 on the basis that the Group was not sufficiently advanced in the sales process at that time for the sale to be considered highly probable.
The held for sale balances are analysed as follows:
| All figures in £ millions | 2022 Total | 2021 Total | ||||||
Non-current assets | ||||||||
| Property, plant and equipment | 16 | 7 | ||||||
16 | 7 | |||||||
Assets classified as held for sale | 16 | 7 | ||||||
Net assets classified as held for sale | 16 | 7 | ||||||
196 Pearson plc |
Page intentionally left blank
Annual report and accounts 2022 Pearson plc 197 |
Financial statements
Notes to the consolidated financial statements
continued
33. Cash generated from operations
In the cash flow statement, proceeds from sale of property, plant and equipment comprise:
| All figures in £ millions | 2022 | 2021 | ||||||
| Net book amount | 9 | 4 | ||||||
| Profit/(loss) on sale of property, plant and equipment | 5 | (4 | ) | |||||
Proceeds from sale of property, plant and equipment | 14 | – | ||||||
The movements in the Group’s current and
non-current
borrowings are as follows:| All figures in £ millions | 2021 | Fair value and other movements | Foreign exchange movements | Financing cash flows | Transfer from non-current to current | New leases/ disposal of leases | 2022 | |||||||||||||||||||||
Financial liabilities | ||||||||||||||||||||||||||||
Non-current borrowings | 1,245 | (14 | ) | 61 | (76 | ) | (92 | ) | 31 | 1,155 | ||||||||||||||||||
| Current borrowings | 157 | (10 | ) | 16 | (188 | ) | 92 | (1 | ) | 66 | ||||||||||||||||||
Total | 1,402 | (24 | ) | 77 | (264 | ) | – | 30 | 1,221 | |||||||||||||||||||
| All figures in £ millions | 2020 | Fair value and other movements | Foreign exchange movements | Financing cash flows | Transfer from non-current to current | New leases/ disposal of leases | 2021 | |||||||||||||||||||||
Financial liabilities | ||||||||||||||||||||||||||||
Non-current borrowings | 1,458 | (20 | ) | 3 | – | (160 | ) | (36 | ) | 1,245 | ||||||||||||||||||
| Current borrowings | 248 | 9 | (4 | ) | (255 | ) | 160 | (1 | ) | 157 | ||||||||||||||||||
Total | 1,706 | (11 | ) | (1 | ) | (255 | ) | – | (37 | ) | 1,402 | |||||||||||||||||
Non-current
borrowings include bonds, derivative financial instruments and leases. Current borrowings include loans repayable within one year, derivative financial instruments and leases, but exclude overdrafts classified within cash and cash equivalents.34. Contingencies, other liabilities and commitments
 Key judgements Key judgements | ||||
| — The application of tax legislation in relation to provisions for uncertain tax positions. | ||||
 Key areas of estimation Key areas of estimation | ||||
| — The level of provisions required in relation to uncertain tax positions is complex and each matter is separately assessed. The estimation of future settlement amounts is based on a number of factors including the status of the unresolved matter, clarity of legislation, range of possible outcomes and the statute of limitations. | ||||
There are contingent Group liabilities that arise in the normal course of business in respect of indemnities, warranties and guarantees in relation to former subsidiaries and in respect of guarantees in relation to subsidiaries, joint ventures and associates. In addition, there are contingent liabilities of the Group in respect of unsettled or disputed tax liabilities, legal claims, contract disputes, royalties, copyright fees, permissions and other rights. None of these claims are expected to result in a material gain or loss to the Group.
On 25 April 2019, the European Commission published the full decision that the United Kingdom controlled foreign company group financing partial exemption (FCPE) partially constitutes State Aid. This decision was appealed by the UK Government and other parties. On 8 June 2022, the EU General Court dismissed the appeal following which it has been concluded that a provision is now required in relation to this issue.
The total exposure in relation to this issue is calculated to be £105m (excluding interest) with a provision of £63m now included in the results representing our estimate of the expected value. At 31 December 2021, it was considered to be a contingent liability. This issue is specific to periods up to 2018 and is not a continuing exposure.
The Group is under assessment from the tax authorities in Brazil challenging the deduction for tax purposes of goodwill amortisation for the years 2012 to 2017. Similar assessments may be raised for other years. Potential total exposure (including possible interest and penalties) could be up to BRL 1,212m (£190m) up to 31 December 2022. Such assessments are common in Brazil. The Group believes that the likelihood that the tax authorities will ultimately prevail is low and that the Group’s position is strong. At present, the Group believes no provision is required.
The Group is also under assessment from the UK tax authorities in relation to an issue related to the UK’s FCPE legislation with the relevant years being 2019 to 2021. The maximum exposure is calculated to be £44m, with a provision of £13m currently held in relation to this issue. The provision is calculated considering a range of possible outcomes and applying a probability to each, resulting in a weighted average outcome. The possible outcomes considered range from no liability through to the full exposure (£44m). This issue is specific to 2019 to 2021 and is not a continuing exposure.
At the balance sheet date there were no commitments for capital expenditure contracted for but not yet incurred. Commitments in respect of leases are shown in note 35.
198 Pearson plc |
35. Leases
The Group’s lease portfolio consists of approximately 720 property leases, mainly offices and test centres, together with a number of vehicle and equipment leases. The Group has elected not to recogniseassets and lease liabilities for short-term leases that have a lease term of 12 months or less and leases of
right-of-use
low-value
assets. The Group recognises the lease payments associated with these leases as an expense on a straight-line basis over the lease term.As a lessee:
The amounts recognised in the income statement are as follows:
| All figures in £ millions | Note | 2022 | 2021 | 2020 | ||||||||||||
| Interest on lease liabilities | (25 | ) | (27 | ) | (41 | ) | ||||||||||
| Expenses relating to short-term leases | – | – | (1 | ) | ||||||||||||
Depreciation of right-of-use | 10 | (46 | ) | (49 | ) | (68 | ) | |||||||||
Impairment of right-of-use | 10 | (34 | ) | (119 | ) | (4 | ) | |||||||||
Lease liabilities are included within financial liabilities – borrowings in the balance sheet, see note 18. The maturities of the Group’s lease liabilities are as follows:
| All figures in £ millions | 2022 | 2021 | ||||||
| Less than one year | 94 | 92 | ||||||
| One to five years | 320 | 318 | ||||||
| More than five years | 332 | 394 | ||||||
Total undiscounted lease liabilities | 746 | 804 | ||||||
Lease liabilities included in the balance sheet | 605 | 633 | ||||||
| Analysed as: | ||||||||
| Current | 71 | 68 | ||||||
Non-current | 534 | 565 | ||||||
There are no lease liabilities classified as held for sale.
The amounts recognised in the cash flow statement are as follows:
| All figures in £ millions | 2022 | 2021 | 2020 | |||||||||
| Total cash outflow for leases as a lessee | 118 | 115 | 133 | |||||||||
At the balance sheet date commitments for capital leases contracted for but not yet incurred were £5m (2021: £3m). Extension and termination options and variable lease payments are not significant within the lease portfolio. Short-term leases to which the Group is committed at the balance sheet date are similar to the portfolio of short-term leases to which the short-term lease expense is disclosed above.
As a lessor:
In the event that the Group has excess capacity in its leased offices and warehouses, the Group subleases some of its properties under operating and finance leases.
The amounts recognised in the income statement are as follows:
| All figures in £ millions | 2022 | 2021 | 2020 | |||||||||
| Interest on lease receivables | 5 | 6 | 9 | |||||||||
Income from subleasing right-of-use | 4 | 2 | 7 | |||||||||
The amounts recognised in the cash flow statement are as follows:
| All figures in £ millions | 2022 | 2021 | 2020 | |||||||||
| Total cash inflow for leases as a lessor | 23 | 27 | 50 | |||||||||
| Annual report and accounts 2022 Pearson plc 199 |
Financial statements
Notes to the consolidated financial statements
continued
35. Leases continued
The following table sets out the maturity analysis of lease payments receivable for subleases classified as operating leases, showing the undiscounted lease payments to be received after the reporting date, and subleases classified as finance leases showing the undiscounted lease payments to be received after the reporting date and the net investment in the finance lease receivable. During the year, the investment in finance lease receivable increased by £6m (2021: decreased £15m), primarily due to new finance subleases entered into in excess of payments received.
| All figures in £ millions | Operating leases | Finance leases | 2022 Total | 2021 Total | 2020 Total | |||||||||||||||
| Less than one year | 3 | 21 | 24 | 21 | 24 | |||||||||||||||
| One to two years | 5 | 23 | 28 | 18 | 24 | |||||||||||||||
| Two to three years | 5 | 23 | 28 | 20 | 18 | |||||||||||||||
| Three to four years | 5 | 23 | 28 | 21 | 18 | |||||||||||||||
| Four to five years | 5 | 24 | 29 | 20 | 18 | |||||||||||||||
| More than five years | 21 | 23 | 44 | 41 | 56 | |||||||||||||||
| Total undiscounted lease payments receivable | 44 | 137 | 181 | 141 | 158 | |||||||||||||||
| Unearned finance income | (16 | ) | ||||||||||||||||||
| Net investment in finance lease receivable | 121 | |||||||||||||||||||
36. Related party transactions
Joint ventures and associates
In 2021, the Group acquired a 40% interest in Academy of Pop and is accounting for the investment as an associate. At 31 December 2022, the Group had a current liability payable to Academy of Pop of £5m (2021: £7m), which relates to the Group’s initial capital contribution that had not yet been paid as at 31 December 2022. This balance was paid in early 2023.
Key management personnel
Key management personnel are deemed to be the members of the Pearson Executive Management team (see pages
60-61).
It is this Committee which had responsibility for planning, directing and controlling the activities of the Group in 2022. Key management personnel compensation is disclosed below:| All figures in £ millions | 2022 | 2021 | 2020 | |||||||||
| Short-term employee benefits | 7 | 6 | 6 | |||||||||
| Retirement benefits | 1 | 1 | 1 | |||||||||
| Share-based payment costs | 9 | 8 | 6 | |||||||||
Total | 17 | 15 | 13 | |||||||||
Short-term employee benefits and retirement benefits exclude Executive Directors which are shown on page 101 of the Directors Remuneration Report.
There were no other material related party transactions. No guarantees have been provided to related parties.
37. Events after the balance sheet date
In February 2023, the Group renegotiated its revolving credit facility, reducing the maximum facility to $
1
bn.Pearson holds investments in unlisted securities with a value at 22 December 2022 of £
133
m.Some of the businesses relevant to this investment, bank with Silicon Valley Bank which collapsed in early March 2023. Given the US Government has announced that it will guarantee all deposits held at Silicon Valley Bank, any subsequent risk to the valuation of these investments is considered by management to be low, but possible.
On 21 March 2023, the Group agreed to sell its international Online Program Management (‘OPM’) business, Pearson Online Learning Services (‘POLS’) to Regent, a global private equity firm. The consideration to be received by Pearson is deferred and comprises (i) each year, for a period of 6-years from completion of the transaction, 27.5% of POLS positive adjusted EBITDA in each calendar year; and (ii) a further contingent payment equal to 27.5% of the proceeds received by Regent in relation to any monetisation event, such as a future disposal of POLS, following completion of the transaction.
On 22 March 2023, the Group completed the acquisition of 100% of the share capital of SHL US Management LLC, the parent company of Personnel Decisions Research Institutes LLC (PDRI), a provider of workforce assessment services. The total consideration paid is $187 million, all of which was paid upfront. The net assets acquired will mainly comprise goodwill and intangible assets, principally comprising customer contracts and technology, recognised on acquisition. Given the proximity of the acquisition to the publication of this Form 20-F, the full valuation exercise has not been completed, and therefore, the financial impact on the Group’s balance sheet has not been disclosed.
200 Pearson plc |
Page intentionally left blank
Annual report and accounts 2022 Pearson plc 201 |
Page intentionally left blank
202 Pearson plc |
Page intentionally left blank
Annual report and accounts 2022 Pearson plc 203 |
Page intentionally left blank
204 Pearson plc |
Page intentionally left blank
Annual report and accounts 2022 Pearson plc 205 |
Page intentionally left blank
206 Pearson plc |
Page intentionally left blank
Annual report and accounts 2022 Pearson plc 207 |
Page intentionally left blank
208 Pearson plc |
Page intentionally left blank
Annual report and accounts 2022 Pearson plc 209 |
Page intentionally left blank
210 Pearson plc |
Page intentionally left blank
Annual report and accounts 2022 Pearson plc 211 |
Page intentionally left blank
212 Pearson plc |
Five-year summary
| All figures in £ millions | 2022 | 2021 | 2020 | 2019 | 2018 | |||||||||||||||
Sales: By operating segment | ||||||||||||||||||||
| Assessment & Qualifications* | 1,444 | 1,238 | 1,118 | |||||||||||||||||
| Virtual Learning | 820 | 713 | 692 | |||||||||||||||||
| English Language Learning | 321 | 238 | 218 | |||||||||||||||||
| Workforce Skills | 204 | 172 | 163 | |||||||||||||||||
| Higher Education | 898 | 849 | 956 | |||||||||||||||||
| Strategic review* | 154 | 218 | 250 | |||||||||||||||||
Total sales | 3,841 | 3,428 | 3,397 | 3,869 | 4,129 | |||||||||||||||
Adjusted operating profit: By operating segment | ||||||||||||||||||||
| Assessment & Qualifications* | 258 | 219 | 147 | |||||||||||||||||
| Virtual Learning | 70 | 32 | 29 | |||||||||||||||||
| English Language Learning | 25 | 15 | 1 | |||||||||||||||||
| Workforce Skills | (3 | ) | 27 | 26 | ||||||||||||||||
| Higher Education | 91 | 73 | 93 | |||||||||||||||||
| Strategic review* | 15 | 19 | 16 | |||||||||||||||||
| Penguin Random House | – | – | 1 | |||||||||||||||||
Total adjusted operating profit | 456 | 385 | 313 | 581 | 546 | |||||||||||||||
Operating margin – continuing | 11.9% | 11.2% | 9.2% | 15.0% | 13.2% | |||||||||||||||
Adjusted earnings | ||||||||||||||||||||
| Total adjusted operating profit | 456 | 385 | 313 | 581 | 546 | |||||||||||||||
| Net finance costs | (1 | ) | (57 | ) | (61 | ) | (41 | ) | (24 | ) | ||||||||||
| Income tax | (71 | ) | (64 | ) | (35 | ) | (89 | ) | 27 | |||||||||||
Non-controlling interest | (2 | ) | (1 | ) | – | (2 | ) | (2 | ) | |||||||||||
Adjusted earnings | 382 | 263 | 217 | 449 | 547 | |||||||||||||||
| Weighted average number of shares (millions) | 738.1 | 754.1 | 755.4 | 777.0 | 778.1 | |||||||||||||||
Adjusted earnings per share | 51.8p | 34.9p | 28.7p | 57.8p | 70.3p | |||||||||||||||
Prior periods have not been restated to reflect the adoption of IFRS 16 in 2019.
Sales and adjusted operating profit for periods prior to 2020 have not been restated to reflect the new organisational structure including the transfer of retained English-speaking Canadian and Australian K12 Courseware businesses from Strategic review to the Assessment & Qualifications division.
* Comparative amounts for 2021 and 2020 have been restated to reflect the move between operating segments.
| Annual report and accounts 2022 Pearson plc 213 |
Other information
| All figures in £ millions | 2022 | 2021 | 2020 | 2019 | 2018 | |||||||||||||||
Cash flow | ||||||||||||||||||||
| Operating cash flow | 401 | 388 | 315 | 418 | 513 | |||||||||||||||
| Operating cash conversion | 88% | 101% | 101% | 72% | 94% | |||||||||||||||
| Net assets | 4,415 | 4,280 | 4,134 | 4,323 | 4,525 | |||||||||||||||
| Net debt | 557 | 350 | 463 | 1,016 | 143 | |||||||||||||||
Return on invested capital | ||||||||||||||||||||
| Total adjusted operating profit | 456 | 385 | 313 | 581 | 546 | |||||||||||||||
| Operating tax paid | (95 | ) | (60 | ) | (10 | ) | (9 | ) | (43 | ) | ||||||||||
Return | 361 | 325 | 303 | 572 | 503 | |||||||||||||||
Gross basis: | ||||||||||||||||||||
| Average invested capital | 10,896 | 9,857 | 10,625 | 11,096 | 10,672 | |||||||||||||||
| Return on invested capital | 3.3% | 3.3% | 2.9% | 5.2% | 4.7% | |||||||||||||||
Net basis: | ||||||||||||||||||||
| Average invested capital | 7,896 | 7,161 | 7,708 | 8,097 | 7,544 | |||||||||||||||
| Return on invested capital | 4.6% | 4.5% | 3.9% | 7.1% | 6.7% | |||||||||||||||
| Dividend per share | 21.5p | 20.5p | 19.5p | 19.5p | 18.5p | |||||||||||||||
214 Pearson plc |
Financial key performance indicators
The following tables and narrative provide further analysis of the financial key performance indicators which are described in the financial review of the annual report on pages
20-25,
shown within the key performance indicators on page 19 of the annual report and shown in notes 2 and 8 of the notes to the consolidated financial statements.Adjusted performance measures
The annual report and accounts reports results and performance on a headline basis which compares the reported results both on a statutory and on a
non-GAAP
(non-statutory)
basis. The Group’s adjusted performance measures arenon-GAAP
(non-statutory)
financial measures and are also included in the annual report as they are key financial measures used by management to evaluate performance. The measures also enable investors to more easily, and consistently, track the underlying operational performance of the Group and its business segments by separating out those items of income and expenditure relating to acquisition and disposal transactions, major restructuring programmes and certain other items that are also not representative of underlying performance.The Group’s definition of adjusted performance measures may not be comparable to other similarly titled measures reported by other companies. A reconciliation of the adjusted measures to their corresponding statutory measures is shown below.
Sales
Underlying sales movements exclude the effect of exchange, the impact of portfolio changes arising from acquisitions and disposals and the impact of adopting new accounting standards that are not retrospectively applied. Portfolio changes are calculated by taking account of the additional sales (at constant exchange rates) from acquisitions made in both the current year and the prior year. For acquisitions made in the prior year, the additional sales excluded is calculated as the sales made in the period of the current year that corresponds to the
pre-acquisition
period in the prior year. Sales made by businesses disposed in either the current year or the prior year are also excluded. Constant exchange rates are calculated by assuming the average exchange rates in the prior year prevailed throughout the current year. Thesenon-GAAP
measures enable management and investors to track more easily, and consistently, the underlying sales performance of the Group.| All figures in £ millions | Assessment & Qualifications | Virtual Learning | English Language Learning | Workforce Skills | Higher Education | Strategic Review | Total | |||||||||||||||||||||
| Statutory sales 2022 | 1,444 | 820 | 321 | 204 | 898 | 154 | 3,841 | |||||||||||||||||||||
| Statutory sales 2021 | 1,238 | 713 | 238 | 172 | 849 | 218 | 3,428 | |||||||||||||||||||||
Statutory sales increase/(decrease) | 206 | 107 | 83 | 32 | 49 | (64) | 413 | |||||||||||||||||||||
Comprising: | ||||||||||||||||||||||||||||
| Underlying increase/(decrease) | 95 | 28 | 57 | 12 | (33 | ) | (5) | 154 | ||||||||||||||||||||
| Portfolio changes | – | – | 9 | 15 | – | (61) | (37 | ) | ||||||||||||||||||||
| Exchange differences | 111 | 79 | 17 | 5 | 82 | 2 | 296 | |||||||||||||||||||||
Statutory sales increase/(decrease) | 206 | 107 | 83 | 32 | 49 | (64) | 413 | |||||||||||||||||||||
| Statutory increase/(decrease) | 17% | 15% | 35% | 19% | 6% | (29)% | 12% | |||||||||||||||||||||
| Constant exchange rate increase/(decrease) | 8% | 4% | 28% | 16% | (4)% | (30)% | 3% | |||||||||||||||||||||
| Underlying increase/(decrease) | 8% | 4% | 24% | 7% | (4)% | (16)% | 5% | |||||||||||||||||||||
| Annual report and accounts 2022 Pearson plc 215 |
Other information
Financial key performance indicators
continued
Adjusted operating profit
Adjusted operating profit excludes the cost of major restructuring; other net gains and losses on the sale or closure of subsidiaries, joint ventures, associates and other financial assets; and intangible charges, including impairment, relating only to goodwill and intangible assets acquired through business combinations or relating to associates. Other net gains and losses also includes costs related to business closures and acquisitions. Further details are given below under ‘Adjusted earnings per share’. Underlying adjusted operating profit movements exclude the effect of exchange, the impact of portfolio changes arising from acquisitions and disposals and the impact of adopting new accounting standards that are not retrospectively applied. Portfolio changes are calculated by taking account of the additional contribution (at constant exchange rates) from acquisitions made in both the current year and the prior year.
For acquisitions made in the prior year the additional contribution excluded is calculated as the operating profit made in the period of the current year that corresponds to the
pre-acquisition
period in the prior year. Operating profit made by businesses disposed in either the current year or the prior year is also excluded. Constant exchange rates are calculated by assuming the average exchange rates in the prior year prevailed throughout the current year. Thisnon-GAAP
measure enables management and investors to track more easily, and consistently, the underlying operating profit performance of the Group.| All figures in £ millions | 2022 | 2021 | ||||||
| Operating profit | 271 | 183 | ||||||
| Cost of major restructuring | 150 | 214 | ||||||
| Other net gains and losses | (24 | ) | (63 | ) | ||||
| Intangible charges | 56 | 51 | ||||||
| UK pension discretionary increase | 3 | – | ||||||
Adjusted operating profit | 456 | 385 | ||||||
| All figures in £ millions | Assessment & Qualifications | Virtual Learning | English Language Learning | Workforce Skills | Higher Education | Strategic Review | Total | |||||||||||||||||||||
Adjusted operating profit increase/(decrease) | 39 | 38 | 10 | (30 | ) | 18 | (4 | ) | 71 | |||||||||||||||||||
Comprising: | ||||||||||||||||||||||||||||
| Underlying increase/(decrease) | 14 | 28 | 5 | (18 | ) | 9 | – | 38 | ||||||||||||||||||||
| Portfolio changes | – | – | 2 | (10 | ) | – | (5 | ) | (13 | ) | ||||||||||||||||||
| Exchange differences | 25 | 10 | 3 | (2 | ) | 9 | 1 | 46 | ||||||||||||||||||||
Adjusted operating profit increase/(decrease) | 39 | 38 | 10 | (30 | ) | 18 | (4 | ) | 71 | |||||||||||||||||||
| Constant exchange rate increase/(decrease) | 6% | 88% | 47% | (104)% | 12% | (26)% | 6% | |||||||||||||||||||||
| Underlying increase/(decrease) | 6% | 88% | 33% | (67)% | 12% | – | 11% | |||||||||||||||||||||
Adjusted earnings per share
Adjusted earnings includes adjusted operating profit and adjusted finance and tax charges. Adjusted earnings is included as a non-GAAP measure as it is used by management to evaluate performance and by investors to more easily, and consistently, track the underlying operational performance of the Group over time. Adjusted earnings per share is calculated as adjusted earnings divided by the weighted average number of shares in issue on an undiluted basis.
The following items are excluded from adjusted earnings:
Cost of major restructuring – In August 2022, the Group announced a major restructuring programme to run in 2022. The programme includes efficiencies in product and content, support costs, technology and corporate property. The restructuring costs in 2022 of £150m mainly relate to severance and impairment ofproperty assets. In March 2021, the Group announced a restructuring programme to run primarily in 2021. The programme includes the reorganisation of the Group into five global business divisions and the simplification of the Group’s property portfolio to drive significant cost savings. The costs of these restructuring programmes are significant enough to exclude from the adjusted operating profit measure so as to better highlight the underlying performance (see note 4).
right-of-use
Other net gains and losses – These represent profits and losses on the sale of subsidiaries, joint ventures, associates and other financial assets and are excluded from adjusted earnings as they distort the performance of the Group as reported on a statutory basis.
Intangible charges – These represent charges in respect of intangible assets acquired through business combinations or relating to associates. These charges are excluded as they reflect past acquisition activity and do not necessarily reflect the current year performance of the Group.
216 Pearson plc |
Other net finance income/costs – These include finance costs in respect of retirement benefits, finance costs of deferred consideration, fair value movements in relation to financial assets held at fair value through profit and loss and foreign exchange and other gains and losses. Finance income relating to retirement benefits is excluded as management does not believe that the consolidated income statement presentation under IAS 19 reflects the economic substance of the underlying assets and liabilities. Finance costs relating to acquisition transactions are excluded as these relate to future earn-outs or acquisition expenses and are not part of the underlying financing. Foreign exchange and other gains and losses are excluded as they represent short-term fluctuations in market value and are subject to significant volatility. Other gains and losses may not be realised in due course as it is normally the intention to hold the related instruments to maturity.
Tax – Tax on the above items is excluded from adjusted earnings. Where relevant the Group also excludes the benefit from recognising previously unrecognised
pre-acquisition
and capital losses. The tax benefit from tax deductible goodwill and intangibles is added to the adjusted income tax charge as this benefit more accurately aligns the adjusted tax charge with the expected rate of cash tax payments.In addition, one off items such as the impact of the UK tax rate change and changes in local tax law have been excluded.
| All figures in £ millions | 2022 | 2021 | ||||||
| Profit for the year | 244 | 178 | ||||||
Non-controlling interest | (2 | ) | (1 | ) | ||||
| Cost of major restructuring | 150 | 214 | ||||||
| Other net gains and losses | (24 | ) | (63 | ) | ||||
| Intangible charges | 56 | 51 | ||||||
| Other net finance income | (53 | ) | (51 | ) | ||||
| UK pension discretionary increase | 3 | – | ||||||
| Tax | 8 | (65 | ) | |||||
Adjusted earnings | 382 | 263 | ||||||
| Weighted average number of shares (millions) | 738.1 | 754.1 | ||||||
| Adjusted earnings per share | 51.8p | 34.9p | ||||||
Return on invested capital
Return on invested capital (ROIC) is included as a
non-GAAP
measure as it is used by management to help inform capital allocation decisions within the business. ROIC is calculated as adjusted operating profit less operating cash tax paid expressed as a percentage of average invested capital. Invested capital includes the original unamortised goodwill and intangibles. Average values for total invested capital are calculated as the average monthly balance for the year. ROIC is also presented on a net basis after removing impaired goodwill from the invested capital balance. The net approach assumes that goodwill which has been impaired is treated consistently to goodwill disposed as it is no longer being used to generate returns.| All figures in £ millions | 2022 Gross | 2021 Gross | �� 2022 Net | 2021 Net | ||||||||||||
| Adjusted operating profit | 456 | 385 | 456 | 385 | ||||||||||||
| Operating tax paid | (95 | ) | (60 | ) | (95 | ) | (60 | ) | ||||||||
Return | 361 | 325 | 361 | 325 | ||||||||||||
| Average goodwill | 6,490 | 5,758 | 3,490 | 3,063 | ||||||||||||
Average other non-current intangibles | 2,012 | 1,970 | 2,012 | 1,970 | ||||||||||||
| Average intangible assets – product development | 948 | 892 | 948 | 892 | ||||||||||||
| Average tangible fixed assets and working capital | 1,446 | 1,237 | 1,446 | 1,237 | ||||||||||||
Average invested capital | 10,896 | 9,857 | 7,896 | 7,162 | ||||||||||||
Return on invested capital | 3.3% | 3.3% | 4.6% | 4.5% | ||||||||||||
| Annual report and accounts 2022 Pearson plc 217 |
Other information
Financial key performance indicators
continued
Return on capital
Return on capital (ROC) is included as a
non-GAAP
measure of how efficiently we are generating returns from our asset base. ROC is calculated as adjusted operating profit less adjusted income tax as a proportion of capital, where capital adjusts net statutory assets for net debt, retirement benefit assets, other post-retirement medical obligations and othernon-operating
items. These adjustments to net statutory assets have been made to better reflect the asset base that generates returns.| All figures in £ millions | 2022 | 2021 | ||||||
| Adjusted operating profit | 456 | 385 | ||||||
| Adjusted income tax charge | (71 | ) | (64 | ) | ||||
Return | 385 | 321 | ||||||
| Net statutory assets | 4,415 | 4,280 | ||||||
Adjustments for: | ||||||||
| Net debt | 557 | 350 | ||||||
| Retirement benefit assets | (581 | ) | (537 | ) | ||||
| Other post-retirement medical benefit obligation | 25 | 34 | ||||||
Other non-operating assets | 23 | (41 | ) | |||||
Capital | 4,439 | 4,086 | ||||||
Return on capital | 8.7% | 7.9% | ||||||
Operating cash flow
Operating cash flow is calculated as net cash generated from operations before the impact of items excluded from the adjusted income statement plus dividends from joint ventures and associates (less the re-capitalisation dividends from Penguin Random House); less capital expenditure on property, plant and equipment (including additions toassets) and intangible software assets; plus proceeds from the sale of property, plant and equipment (including the impacts of transfers to/from investment in finance lease receivable) and intangible software assets; plus special pension contributions paid; and plus costs of major restructuring paid. Operating cash flow is included as a
right-of-use
non-GAAP
measure in order to align the cash flows with the corresponding adjusted operating profit measures.| All figures in £ millions | 2022 | 2021 | ||||||
| Net cash generated from operations | 527 | 570 | ||||||
| Dividends from joint ventures and associates | 1 | – | ||||||
| Purchase / disposal of PPE and software | (133 | ) | (176 | ) | ||||
Net addition of right-of-use | (29 | ) | (30 | ) | ||||
| Net costs paid for major restructuring | 35 | 24 | ||||||
Operating cash flow | 401 | 388 | ||||||
Cash conversion, calculated as operating cash flow as a percentage of adjusted operating profit, is also shown as a
non-GAAP
measure as this is used by management and investors to measure cash generation by the Group.| All figures in £ millions | 2022 | 2021 | ||||||
| Adjusted operating profit | 456 | 385 | ||||||
| Operating cash flow | 401 | 388 | ||||||
Cash conversion | 88% | 101% | ||||||
218 Pearson plc |
Net debt and adjusted earnings before interest, tax, depreciation and amortisation (EBITDA)
For information, the net debt/adjusted EBITDA ratio is shown as a
non-GAAP
measure as it is commonly used by investors to measure balance sheet strength. Adjusted EBITDA is calculated as adjusted operating profit less depreciation on property, plant and equipment, and amortisation on intangible software assets.| All figures in £ millions | 2022 | 2021 | ||||||
| Adjusted operating profit | 456 | 385 | ||||||
| Depreciation (excluding items included in ‘cost of major restructuring’) | 88 | 100 | ||||||
| Amortisation on intangible software assets (excluding items included in ‘cost of major restructuring’) | 123 | 113 | ||||||
Adjusted EBITDA | 667 | 598 | ||||||
| Cash and cash equivalents | 558 | 937 | ||||||
| Overdrafts | (15 | ) | – | |||||
| Investment in finance lease receivable | 121 | 115 | ||||||
| Derivative financial instruments | (6 | ) | (2 | ) | ||||
| Bonds | (610 | ) | (767 | ) | ||||
| Lease liabilities | (605 | ) | (633 | ) | ||||
Net debt | (557 | ) | (350 | ) | ||||
Net debt/adjusted EBITDA ratio | 0.8x | 0.6x | ||||||
| Annual report and accounts 2022 Pearson plc 219 |
Shareholder Information
Shareholder Information
Shareholder Information
Pearson ordinary shares are listed on the London Stock Exchange and on the New York Stock Exchange in the form of American Depositary Receipts.
Corporate website
The investors’ section of our corporate website www.pearsonplc.com/investors provides a wealth of information for shareholders. It is also possible to sign up to receive email alerts for reports and press releases relating to Pearson at www.pearsonplc.com.
Shareholder information online
Shareholder information can be found on our website at www.pearsonplc.com/investors.
Our registrar, Equiniti, also provides a range of shareholder information online. You can check your holding and find practical help on transferring shares or updating your details at www.shareview.co.uk. For more information, please contact our registrar, Equiniti, Aspect House, Spencer Road, Lancing, West Sussex, BN99 6DA. Telephone 0371 384 2043* or, for those shareholders with hearing difficulties, text phone number 0371 384 2255*.
Information about the Pearson share price
The company’s share price can be found on our website at www.pearsonplc.com/investors/performance/share-price-dividend. It also appears in the financial columns of the national press.
2022 dividends
Payment Date | Amount per share | |||||||
| Interim | 20 September 2022 | 6.6 pence | ||||||
Final 1 | 5 May 2023 | 14.9 pence | ||||||
| 1. | Subject to approval by shareholders at the 2023 Annual General Meeting. |
2023 financial calendar | ||||
Ex-dividend date | 23 March 2023 | |||
| Record date | 24 March 2023 | |||
| Last date for dividend reinvestment election | 13 April 2023 | |||
| Annual General Meeting | 28 April 2023 | |||
| Payment date for dividend and share purchase date for dividend reinvestment | 5 May 2023 | |||
Payment of dividends to mandated accounts
Should you elect to have your dividends paid through BACS, this can be done directly into a bank or building society account, with the dividend confirmation voucher sent to the shareholder’s registered address. Equiniti can be contacted for information on 0371 384 2043*.
Dividend reinvestment plan (DRIP)
The DRIP gives shareholders the right to buy the company’s shares on the London stock market with their cash dividend. For further information, please contact Equiniti on 0371 384 2268*.
Individual Savings Accounts (ISAs)
Equiniti offers a Flexible Stocks and Shares ISA. For more information, please visit www.eqi.co.uk or call customer services on 0345 070 0720*.
Share dealing facilities
Equiniti offers telephone and internet services for dealing in Pearson shares. For further information, please contact their telephone dealing helpline on 0345 603 7037* or, for online dealing, log on to www.shareview.co.uk/dealing. You will need your shareholder reference number as shown on your share certificate.
A postal dealing service is also available through Equiniti. Please telephone 0371 384 2248* for details or log on to www.shareview.co.uk to download a form.
ShareGift
Shareholders with small holdings of shares, whose value makes them uneconomic to sell, may wish to donate them to ShareGift, the share donation charity (registered charity number 1052686).
Further information about ShareGift and the charities it has supported may be obtained from their website, www.ShareGift.org, or by contacting them at ShareGift, PO Box 72253, London, SW1P 9LQ.
American Depositary Receipts (ADRs)
Pearson’s ADRs are listed on the New York Stock Exchange and traded under the symbol PSO. Each ADR represents one ordinary share. For enquiries regarding registered ADR holder accounts and dividends, please contact BNY Mellon Shareowner Services, PO Box 43006, Providence, RI 02940-3078, telephone 1 (866) 259 2289 (toll free within the US) or 001 201 680 6825 (outside the US). Alternatively, you may email shrrelations@ cpushareownerservices.com.
Voting rights for registered ADR holders can be exercised through Bank of New York Mellon, and for beneficial ADR holders (and/or nominee accounts) through your US brokerage institution. Pearson will file with the Securities and Exchange Commission a Form
20-F.
Share register fraud: protecting your investment
Pearson does not contact its shareholders directly to provide recommendations or investment advice and neither does it appoint third parties to do so. As required by law, our shareholder register is available for public inspection, but we cannot control the use of information obtained by persons inspecting the register. Please treat any approaches purporting to originate from Pearson with caution.
For more information, please log on to our website at www.pearsonplc.com/en-GB/investors/shareholders/shares-shareholding
Tips on protecting your shares
| — | Keep any documentation that contains your shareholder reference number in a safe place and shred any unwanted documentation |
| — | Inform our registrar, Equiniti, promptly when you change address |
| — | Be aware of dividend payment dates and contact the registrar if you do not receive your dividend cheque or, better still, make arrangements to have the dividend paid directly into your bank account |
| — | Consider holding your shares electronically in a CREST account via a nominee. |
* Lines open 8.30 am to 5.30 pm Monday to Friday (excluding UK public holidays).
220 Pearson plc |
ESG data
Our performance
About our reporting
This report provides a summary of Pearson’s sustainable business strategy and our environmental, social, and governance (ESG) performance for the calendar year ended 31 December 2022. Our Reputation and Responsibility Committee, the highest Board Committee responsible for our sustainability agenda, has reviewed the reported information, including the list of material topics on page 30.
Global Reporting Initiative (GRI)
Our report is in accordance with the GRI standards, using the GRI 1: Foundation 2021 guidance. There is no relevant GRI sector standard for our industry.
Sustainability Accounting Standards Board (SASB)
We continue to report in line with the SASB’s standards to provide industry-based insights into the most relevant sustainability-related risks and opportunities for the media, and professional services sectors.
UN Global Compact (UNGC) and the UN Sustainable Development Goals (SDGs)
We were proud to participate in the Early Adopter Programme of the UN Global Communication on Progress (CoP) designed to add value and streamline sustainability reporting for all participating companies of the UN GC. Our CoP is publicly available on our participant profile at:
https://unglobalcompact.org/what-is-gc/participants/7319-Pearson-plc
Lifelong learning and education have an important role to play in achieving all the UN SDGs, but we focus our efforts on those where we have the greatest impact. Our priority SDGs are: 4 quality education, 8 decent work and economic growth, and 10 reducing inequalities.
ESG material issues reporting against GRI and SASB
Material issues | GRI | SASB | Page/web reference | Comments/omissions | ||||
| Product effectiveness | GRI 203-2: significant indirect impacts | Risks, opportunities, and management approach: Pages 30-38 Performance: Page 18 Social Bond Reporting: https://plc.pearson.com/en-GB/investors/debt-investors/social-bond-framework | ||||||
| Consumer engagement | GRI 203-2: significant indirect impacts | Risks, opportunities, and management approach: Pages 18, 30-38 Performance: Page 18 | ||||||
| Digital growth | GRI 203-2: significant indirect impacts | Risks, opportunities, and management approach: Pages 30-38 Performance: non-financial KPIs - Page 18 | ||||||
| Employee learning and development | GRI 404-1: average hours of training per year, per employeeGRI 404-2: programmes for upgrading employee skills and transition assistance programmesGRI 404-3: percentage of employees receiving regular performance and career development reviews | Risks, opportunities, and management approach: Pages 30-38 Performance: Pages 18, 221-226 | We do not report on average hours of training. In 2022, we launched a new approach to engagement as a driver of growth and retention, including a set of performance measures. 100% of direct employees covered by Gallup survey. | |||||
| Employee engagement | SV-PS-330a.2. SV-PS-330a.3. | Risks, opportunities, and management approach: Pages 30-36 Performance: Pages 18, 221-226 | ||||||
| Inclusion and diversity | 405-1 Diversity of governance bodies and employees | SV-PS-330a.1. SV-ME-260a.1. SV-ME-260a.2. | Risks, opportunities, and management approach: Pages 30-36 Performance: Pages 18, 221-226 Social Equity portal: https://www.pearson.com/en-us/social-equity.html | |||||
| Annual report and accounts 2022 Pearson plc 221 |
ESG data
continued
Material issues | GRI | SASB | Page/web reference | Comments/omissions | ||||
Reducing our environmental impact | GHG Emission scope 1, 2, 3. Baseline and methodology. Any offsets including type, amount, criteria | Risks, opportunities, and management approach: Pages 30, 36-38 TCFD Report: Pages 39-41 Performance: Pages 18, 36-41, 221-226 | ||||||
Data privacy and cyber security | GRI 418 -1 Substantiated complaints received concerning breaches of customer privacy, and losses of customer data | SV-PS-230a.1 SV-PS-230a.2. SV-PS-230a.3. | The following sections of our report detail: — our approach to data security risks: Pages 43-52 — governance of data privacy, cyber security and technology resilience: Page 82 — approach to customer data and safeguarding and training provided: Pages 30, 36 — consumer-facing privacy center explaining how Pearson uses personal information: https://www.pearson.com/en-us/privacy-center. html | In the event of a reportable breach, we would disclose information about the incident and commit to contact any affected data subjects in a timely way. In line with regulations, we will disclose material lapses to the relevant regulators. To the extent that any relevant regulator should find fault with our data management and/or data security practices, they will publish their findings/ sanctions. | ||||
GRI General Disclosures Index
Disclosure | Page/Location | Comment | ||
2-1 Organisational details | 120, 140, 150 | |||
2-2 Entities included in the organisation’s sustainability reporting | 209-211 | |||
2-3 Reporting period, frequency and contact point | 2022 annual report, sustainability@pearson.com | |||
2-4 Restatements of information | 223 | |||
2-5 External assurance | https://plc.pearson.com/en-GB/purpose/our-esg-reporting | |||
2-6 Activities, value chain and other business relationships | 16-17 | |||
2-7 Employees | 224-226 | |||
2-8 Workers who are not employees | We do not currently report on workers who are not employees, Most common type of workers are regular employees (19,051) and most common type of work performed is in testing centres, technology, sales, customer services, and prof. development | |||
2-9 Governance structure and composition | 56-66 | |||
2-10 Nomination and selection of the highest governance body | 74-77 | |||
2-11 Chair of the highest governance body | 56 | |||
2-12 Role of the highest governance body in overseeing the management of impacts | 56-66 | |||
2-13 Delegation of responsibility for managing impacts | 65-66 | |||
2-14 Role of the highest governance body in sustainability reporting | 66 | |||
2-15 Conflicts of interest | 59 | |||
2-16 Communication of critical concerns | 65 | |||
2-17 Collective knowledge of the highest governance body | 56-59 | |||
2-18 Evaluation of the performance of the highest governance body | 71-73 | |||
2-19 Remuneration policies | 92-93 | |||
2-20 Process to determine remuneration | 88-119 | |||
2-21 Annual total compensation ratio | 109 | |||
2-22 Statement on sustainable development strategy | 8 | |||
2-23 Policy commitments | 42 | |||
222 Pearson plc |
Disclosure | Page/Location | Comment | ||
2-24 Embedding policy commitments | 30-42 | |||
2-25 Processes to remediate negative impacts | https://plc.pearson.com/ en-GB/corporate-policies | |||
2-26 Mechanisms for seeking advice and raising concerns | https://plc.pearson.com/ en-GB/corporate-policies | |||
2-27 Compliance with laws and regulations | 80-87 | |||
2-28 Membership associations | 38 | We are also members of the Global Business Coalition for Education, and the Corporate Consultive Group of the World Resource Institute (WRI). | ||
2-29 Approach to stakeholder engagement | 26-29 | |||
2-30 Collective bargaining agreements | 68 | Our Employee Engagement Network (EEN) champion the voice of our employees at board level. Members represent diverse genders, ethnicity groups, geographies, ages and tenures. | ||
ESG performance tables
Environment
Re-baselining:
Following ourre-baselining
policy, in line with best practices standards, we havere-based
our emissions to reflect the change in reporting scope and categories, as well as reviewed and updated calculation methodologies for the reporting period 2018 – 2022. This process has been verified and assured by a third-party auditor, Corporate Citizenship.Methodology: We follow the requirements from the GHG Protocol Corporate Accounting and Reporting Standard (revised edition) to calculate our emissions. For scope 2, we use the dual reporting methodology (location and market-based approach), together with some of the latest emission factors from recognised public sources, including, but not limited to, the UK Department for Business, Energy and Industrial Strategy, the International Energy Agency, the US Energy Information Administration, the US Environmental Protection Agency, and the Intergovernmental Panel on Climate Change (IPCC). Energy use includes gas and electricity consumption in MWh and vehicle fuel use converted from mileage into MWh using BEIS conversion factor. For 2022, we are also using the latest global warming potential from the IPCC’s Sixth Assessment Report.
Corporate Citizenship, an independent third party has verified our energy consumption; scope 1, 2 and 3 GHG emissions; and renewable electricity claims, as well as our social KPIs. See Corporate Citizenship assurance statement here:
https://plc.pearson.com/en-GB/purpose/our-esg-reporting
Greenhouse gas (GHG) (carbon dioxide equivalent) emissions overview (metric tons CO
2
e)2022 | 2021 | 2018 rebaselined figures | 2018 previously reported | |||||||||||||
| Scope 1 | 4,622 | 8,342 | 12,206 | 12,209 | ||||||||||||
| Scope 2 (market-based) | 182 | 440 | 4,583 | 4,583 | ||||||||||||
| Scope 2 (location-based) | 29,034 | 22,801 | 40,779 | 41,586 | ||||||||||||
| Scope 3 | 362,473 | 370,853 | 531,663 | 410,164 | ||||||||||||
| Total - Location-based | 396,128 | 401,995 | 584,648 | 463,959 | ||||||||||||
| Total - Market-based | 367,276 | 379,634 | 548,452 | 426,956 | ||||||||||||
| Total global scope 1 and 2 (location-based) | 33,656 | 31,143 | ||||||||||||||
| Total UK scope 1 and 2 (location-based) | 5,671 | 3,829 | ||||||||||||||
| Total global scope 1 and 2 (market-based) | 4,804 | 8,782 | 16,789 | 16,792 | ||||||||||||
| Total UK scope 1 and 2 (market-based) | 1,662 | 1,352 | ||||||||||||||
| Intensity ratio | 2022 | 2021 | ||||||||||||||
tCO 2 / m£ sales revenue (scope 1, 2 market-based and 3) | 95.6 | 110.7 | 132.8 | |||||||||||||
| Energy | 2022 | 2021 | ||||||||||||||
| % electricity from renewable sources | 99% | 99% | ||||||||||||||
| Total electricity consumption from renewable sources only (MWh) | 83,523 | 57,120 | ||||||||||||||
Total electricity consumption from non-renewable sources only (MWh) | 957 | 794 | ||||||||||||||
On-site generated electricity (MWh) | 184 | 150 | ||||||||||||||
| Total gas consumption (MWh) | 24,170 | 23,985 | ||||||||||||||
| Total fuel oil consumption (MWh) | 159 | 48 | ||||||||||||||
| Vehicles (MWh) | 347 | 10,437 | ||||||||||||||
| Total energy consumption (MWh) | 109,340 | 92,535 | ||||||||||||||
| Global (gas, electricity and transport) | 108,997 | 92,336 | ||||||||||||||
| UK (gas, electricity and transport) | 29,811 | 17,491 | ||||||||||||||
| Annual report and accounts 2022 Pearson plc 223 |
ESG data
continued
| Resource use | 2022 | 2021 | ||||||||||
| Paper used (t) | 24,187 | 29,056 | ||||||||||
| % FSC | 33% | 29% | ||||||||||
| % PEFC | 20% | 28% | ||||||||||
| % SFI | 9% | |||||||||||
| Waste | 2022 | 2021 | ||||||||||
| Total waste generated (t) | 1,298* | 875 | ||||||||||
| Share of waste recycled in office space | 17.7% | 25.9% | ||||||||||
| Water | 2022 | 2021 | ||||||||||
Total water consumption (m 3 ) | 538,556* | 152,702 | ||||||||||
| * | We report estimated water and waste in some of our properties by applying an intensity ratio per sqm based on all actual data available. |
| This year, we extended the scope of sites with actual data that are included in 2022 figures. |
Social
All employee figures, with the exception of total average number of employees (as noted below) are based on employee volumes as at 31
st
December 2022.| Our Employees | 2022 | 2021 | ||||||
Total average number of employees for the year* | 20,438 | 20,744 | ||||||
Employees by geography (Regional Representation) | 20,169 | 21,350 | ||||||
| US as of 31 December | 10,694 | 11,670 | ||||||
| UK as of 31 December | 3,931 | 3,826 | ||||||
Rest of World as of 31 December | 5,544 | 5,854 | ||||||
| * | Total average number of employees is calculated using a Full-time Equivalent (FTE) methodology, as an average across the reporting period. |
| Gender diversity breakdown | 2022 | 2021 | ||||||
| Total number of permanent, regular employees | 97% | 97% | ||||||
| Male | 40% | 40% | ||||||
| Female | 59% | 59% | ||||||
Non-binary | 0% | 0% | ||||||
| No data | 1% | 1% | ||||||
| Total number of temporary, limited term employees | 3% | 3% | ||||||
| Male | 32% | 32% | ||||||
| Female | 66% | 65% | ||||||
Non-binary | 0% | 0% | ||||||
| No data | 2% | 3% | ||||||
| Total full-time, regular, employees | 79% | 75% | ||||||
| Male | 44% | 44% | ||||||
| Female | 55% | 55% | ||||||
Non-binary | 0% | 0% | ||||||
| Not Disclosed | 1% | 1% | ||||||
| Total part-time, regular, employees | 21% | 21% | ||||||
| Male | 27% | 27% | ||||||
| Female | 72% | 73% | ||||||
Non-binary | 0% | 0% | ||||||
| Not Disclosed | 1% | 1% | ||||||
224 Pearson plc |
| Board and Executive Team’s gender identity or sex | Number of board members | Percentage of the board | Number of senior positions on the board (CEO, CFO, SID and Chair) | Number in executive management* | Percentage of executive management | |||||||||||||||
| Men | 5 | 50 | 3 | 6 | 54.5 | |||||||||||||||
| Women | 5 | 50 | 1 | 5 | 45.5 | |||||||||||||||
| Other categories | ||||||||||||||||||||
| Not specified / prefer not to say | ||||||||||||||||||||
| Board and Executive Team’s ethnic background | Number of board members | Percentage of the board | Number of senior positions on the board (CEO, CFO, SID and Chair) | Number in executive management* | Percentage of executive management | |||||||||||||||
| White British or other White | ||||||||||||||||||||
| (including minority-white groups) | 7 | 70 | 4 | 8 | 72.73 | |||||||||||||||
| Mixed/Multiple Ethnic Groups | 2 | 20 | 1 | 9.09 | ||||||||||||||||
| Asian/Asian British | 1 | 10 | 1 | 9.09 | ||||||||||||||||
| Black/African/Caribbean/Black British | ||||||||||||||||||||
| Other ethnic group, including Arab | 1 | 9.09 | ||||||||||||||||||
| Not specified/ prefer not to say | ||||||||||||||||||||
| Female leadership breakdown | 2022 | 2021 | ||||||
| Senior leadership | 41% | 37% | ||||||
| VP & Director | 48% | 47% | ||||||
| Manager | 51% | 50% | ||||||
| Percentage of women in technology roles (IT/engineering) | 31% | 29% | ||||||
| Employee racial and ethnic diversity breakdown | 2022 | 2021 | ||||||
| Total workforce (US and UK) | 32% (US) / 18% (UK) | 31% (US) / 19% (UK) | ||||||
| Senior leadership (US and UK) | 19% (US) / 12% (UK) | 20% (US) / 9% (UK) | ||||||
| VP and Director (US and UK) | 18% (US) / 13% (UK) | 17% (US) / 13% (UK) | ||||||
| Manager (US and UK) | 25% (US) / 14% (UK) | 23% (US) /16% (UK) | ||||||
| Employee racial and ethnic diversity breakdown - US | 2022 | 2021 | ||||||
| % of total workforce | 32% | 31% | ||||||
| Asian | 10% | 9% | ||||||
| Black or African American | 11% | 10% | ||||||
| Hispanic or Latino | 9% | 9% | ||||||
| Other | 2% | 3% | ||||||
| White | 67% | 69% | ||||||
| Not Stated | 1% | 0% | ||||||
| Employee racial and ethnic diversity breakdown - UK | 2022 | 2021 | ||||||
| % of total workforce | 18% | 19% | ||||||
| Asian | 10% | 10% | ||||||
| Black | 4% | 4% | ||||||
| Hispanic or Latino | 0% | 0% | ||||||
| Other | 4% | 5% | ||||||
| White | 66% | 70% | ||||||
| Not Stated | 16% | 11% | ||||||
| * | As prescribed by LR9.8.6R(10), for the purpose of this disclosure, the Executive Management includes the Company Secretary. |
| Annual report and accounts 2022 Pearson plc 225 |
ESG data
continued
| % of total management workforce (US and UK) | 2022 | 2021 | ||||||
| Asian | 10% | 10% | ||||||
| Black or African American | 4% | 4% | ||||||
| Hispanic or Latino | 4% | 3% | ||||||
| Other | 2% | 2% | ||||||
| White | 77% | 78% | ||||||
| Not Stated | 3% | 3% | ||||||
| Turnover | 2022 | 2021 | ||||||
| Turnover rate, total average for the year* | 6,974 /33% | 7,232 /33% | ||||||
| Voluntary turnover | 4,658 /22% | 5,062 /23% | ||||||
| Involuntary turnover | 2,316 /11% | 2,170 /10% | ||||||
| *% | calculated using average 2022 H/C of 21,342, not 2022 year end position. |
| Turnover by gender | 2022 | 2021 | ||||||
| Total female | 4,233 / 20% | 4,512 /20% | ||||||
| Total male | 2,659 / 12% | 2,709 /12% | ||||||
Non-binary | 6 / 0% | - | ||||||
| Not disclosed | 76 / 0% | - | ||||||
| Turnover by age group | 2022 | 2021 | ||||||
| Under 30 years old | 1,720 / 8% | 2,019 / 9% | ||||||
30-50 years old | 3,449 / 16% | 3,428 / 15% | ||||||
| Over 50 years old | 1,785 / 8% | 1,764 / 8% | ||||||
| No date | 20 / 0% | 21 / 0% | ||||||
| New hires | 2022 | 2021 | ||||||
| Total number and rate of new employee hires (number of hires/average headcount)* | 5,600 / 26% | 5,934 / 27% | ||||||
| Total number of new hires - female | 3,378 / 60% | 3,528 / 60% | ||||||
| Total number of new hires - male | 2,076 / 37% | 2,261 / 38% | ||||||
| Total number of new hires - non binary | 24 / 0% | 0 / 0% | ||||||
| Total number of new hires - not disclosed | 122 / 2% | 145 / 2% | ||||||
| *% | calculated using average 2022 H/C of 21,342, not 2022 year end position. |
| New hires by age group | 2022 | 2021 | ||||||
| Under 30 years old | 38% | 40% | ||||||
30-50 years old | 44% | 42% | ||||||
| Over 50 years old | 17% | 17% | ||||||
| No date | 1% | 1% | ||||||
| Employee engagement measures* | 2022 | 2021 | ||||||
| Engagement | 3.96^ | - | ||||||
| Inclusion | 4.12^ | - | ||||||
| Progress | 67% | - | ||||||
| Learning and Growth | 72% | - | ||||||
*Sourced from Gallup Access.Propriety data.
^GrandMean on a
5-point
Likert scale.| Governance | 2022 | 2021 | ||||||
| Total number of concerns raised & investigated | 92 | 110 | ||||||
| Percentage of employees completing code of conduct certification or training | 100% | 100% | ||||||
226 Pearson plc |
Reliance on this document | ||||
| The intention of this document is to provide information to shareholders and is not designed to be relied upon by any other party or for any other purpose. | ||||
Forward-looking statements | ||||
This document includes forward-looking statements concerning Pearson’s financial condition, business and operations and its strategy, plans and objectives. In particular, all statements that express forecasts, expectations and projections, including trends in results of operations, margins, growth rates, overall market trends, the impact of interest or exchange rates, the availability of financing, anticipated cost savings and synergies and the execution of Pearson’s strategy, are forward-looking statements. By their nature, forward-looking statements involve known and unknown risks and uncertainties because they relate to events and depend on circumstances that may occur in the future. They are based on numerous expectations, assumptions and beliefs regarding Pearson’s present and future business strategies and the environment in which it will operate in the future. There are various factors which could cause Pearson’s actual financial condition, results and development to differ materially from the plans, goals, objectives and expectations expressed or implied by these forward-looking statements, many of which are outside Pearson’s control. These include international, national and local conditions, as well as the impact of competition. They also include other risks detailed from time to time in Pearson’s publicly-filed documents and, in particular, the risk factors set out in this document, which you are advised to read. Any forward-looking statements speak only as of the date they are made and, except as required by law, Pearson gives no undertaking to update any forward-looking statements in this document whether as a result of new information, future developments, changes in its expectations or otherwise. Readers are cautioned not to place undue reliance on such forward-looking statements. | ||||

Designed and produced by Black Sun Plc.
This Report is printed on Edixion Off set which has been
independently certified according to the rules of the Forest
Stewardship Council
®
(FSC®
).Printed in the UK by Pureprint, a CarbonNeutral
®
company.Both manufacturing paper mill and the printer are registered to
the Environmental Management System ISO 14001:2004 and are
Forest Stewardship Councilcertified.
®
(FSC)chain-of-custody