UNITED STATES
SECURITIES AND EXCHANGE COMMISSION
Washington, D.C. 20549
FORM N-CSR
CERTIFIED SHAREHOLDER REPORT OF REGISTERED
MANAGEMENT INVESTMENT COMPANIES
Investment Company Act file number 811-07319
Fidelity Covington Trust
(Exact name of registrant as specified in charter)
245 Summer St., Boston, MA 02210
(Address of principal executive offices) (Zip code)
Cynthia Lo Bessette, Secretary
245 Summer St.
Boston, Massachusetts 02210
(Name and address of agent for service)
Registrant's telephone number, including area code:
617-563-7000
Date of fiscal year end: | June 30 |
Date of reporting period: | December 31, 2022 |
Item 1.
Reports to Stockholders


Contents
Top Holdings (% of Fund's net assets) | ||
| Vestas Wind Systems A/S | 5.2 | |
| Enphase Energy, Inc. | 4.1 | |
| ORSTED A/S | 3.9 | |
| First Solar, Inc. | 3.6 | |
| Northland Power, Inc. | 2.9 | |
| Xinyi Solar Holdings Ltd. | 2.6 | |
| Drax Group PLC | 2.6 | |
| China Longyuan Power Grid Corp. Ltd. (H Shares) | 2.5 | |
| EDP Renovaveis SA | 2.5 | |
| Plug Power, Inc. | 2.5 | |
| 32.4 | ||
| Market Sectors (% of Fund's net assets) | ||
| Utilities | 52.5 | |
| Industrials | 27.9 | |
| Information Technology | 19.5 | |
Asset Allocation (% of Fund's net assets) |
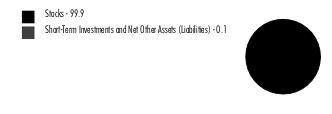 |
Foreign investments - 73.7% |
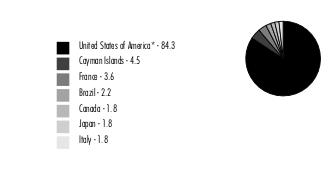
Geographic Diversification (% of Fund's net assets) |
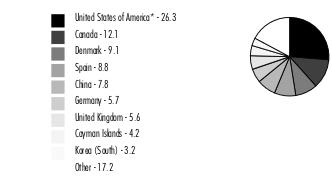 |
* Includes Short-Term investments and Net Other Assets (Liabilities). Percentages are based on country or territory of incorporation and are adjusted for the effect of derivatives, if applicable. |
| Common Stocks - 99.9% | |||
| Shares | Value ($) | ||
| INDUSTRIALS - 27.9% | |||
| Construction & Engineering - 2.8% | |||
| OX2 AB (a) | 70,635 | 596,223 | |
| Xinte Energy Co. Ltd. (H Shares) | 248,400 | 459,567 | |
| 1,055,790 | |||
| Electrical Equipment - 25.1% | |||
| Array Technologies, Inc. (a) | 41,307 | 798,464 | |
| Bloom Energy Corp. Class A (a) | 43,149 | 825,009 | |
| CS Wind Corp. | 12,316 | 670,099 | |
| Doosan Fuel Cell Co. Ltd. (a) | 23,156 | 537,468 | |
| Nordex SE (a) | 54,221 | 763,849 | |
| Plug Power, Inc. (a) | 76,237 | 943,052 | |
| PowerCell Sweden AB (a) | 39,755 | 454,228 | |
| Shoals Technologies Group, Inc. (a) | 34,503 | 851,189 | |
| Sunrun, Inc. (a) | 35,857 | 861,285 | |
| TPI Composites, Inc. (a) | 38,950 | 394,953 | |
| Vestas Wind Systems A/S | 68,852 | 1,997,030 | |
| Xinjiang Goldwind Science & Technology Co. Ltd. (H Shares) | 519,600 | 462,683 | |
| 9,559,309 | |||
TOTAL INDUSTRIALS | 10,615,099 | ||
| INFORMATION TECHNOLOGY - 19.5% | |||
| Electronic Equipment & Components - 1.8% | |||
| Landis+Gyr Group AG | 9,637 | 679,652 | |
| Semiconductors & Semiconductor Equipment - 17.7% | |||
| Canadian Solar, Inc. (a) | 20,743 | 640,959 | |
| Enphase Energy, Inc. (a) | 5,952 | 1,577,042 | |
| First Solar, Inc. (a) | 9,031 | 1,352,753 | |
| Flat Glass Group Co. Ltd. | 233,000 | 563,622 | |
| JinkoSolar Holdings Co. Ltd. ADR (a) | 14,975 | 612,178 | |
| Maxeon Solar Technologies Ltd. (a) | 21,663 | 347,908 | |
| SMA Solar Technology AG (a) | 9,156 | 653,241 | |
| Xinyi Solar Holdings Ltd. | 888,000 | 983,007 | |
| 6,730,710 | |||
TOTAL INFORMATION TECHNOLOGY | 7,410,362 | ||
| UTILITIES - 52.5% | |||
| Electric Utilities - 8.5% | |||
| Acciona SA | 5,089 | 933,629 | |
| ORSTED A/S (b) | 16,584 | 1,502,541 | |
| Verbund AG | 9,382 | 787,518 | |
| 3,223,688 | |||
| Independent Power and Renewable Electricity Producers - 44.0% | |||
| Atlantica Sustainable Infrastructure PLC | 26,081 | 675,498 | |
| Boralex, Inc. Class A | 28,416 | 839,299 | |
| Brookfield Renewable Corp. | 29,468 | 810,563 | |
| China Datang Corp. Renewable Power Co. Ltd. | 1,825,000 | 540,138 | |
| China Longyuan Power Grid Corp. Ltd. (H Shares) | 786,000 | 960,729 | |
| Clearway Energy, Inc. Class C | 24,193 | 771,031 | |
| Corp. ACCIONA Energias Renovables SA | 19,542 | 753,743 | |
| Drax Group PLC | 114,875 | 971,427 | |
| EDP Renovaveis SA | 42,969 | 943,771 | |
| Encavis AG | 38,403 | 757,619 | |
| Enlight Renewable Energy Ltd. (a) | 337,008 | 687,674 | |
| ERG SpA | 22,545 | 696,811 | |
| Innergex Renewable Energy, Inc. | 59,670 | 713,424 | |
| Neoen SA (b) | 18,411 | 739,004 | |
| Northland Power, Inc. | 39,974 | 1,095,417 | |
| Ormat Technologies, Inc. | 10,850 | 938,308 | |
| ReNew Energy Global PLC (a) | 81,432 | 447,876 | |
| RENOVA, Inc. (a) | 28,700 | 513,118 | |
| Scatec Solar AS (b) | 66,907 | 533,843 | |
| Solaria Energia y Medio Ambiente SA (a) | 37,287 | 681,283 | |
| Sunnova Energy International, Inc. (a) | 35,065 | 631,521 | |
| TransAlta Renewables, Inc. | 58,270 | 483,809 | |
| West Holdings Corp. | 16,300 | 542,324 | |
| 16,728,230 | |||
TOTAL UTILITIES | 19,951,918 | ||
| TOTAL COMMON STOCKS (Cost $41,513,387) | 37,977,379 | ||
| Money Market Funds - 0.0% | |||
| Shares | Value ($) | ||
Fidelity Cash Central Fund 4.37% (c) (Cost $2,753) | 2,753 | 2,753 | |
| TOTAL INVESTMENT IN SECURITIES - 99.9% (Cost $41,516,140) | 37,980,132 |
NET OTHER ASSETS (LIABILITIES) - 0.1% | 25,276 |
| NET ASSETS - 100.0% | 38,005,408 |
| (a) | Non-income producing |
| (b) | Security exempt from registration under Rule 144A of the Securities Act of 1933. These securities may be resold in transactions exempt from registration, normally to qualified institutional buyers. At the end of the period, the value of these securities amounted to $2,775,388 or 7.3% of net assets. |
| (c) | Affiliated fund that is generally available only to investment companies and other accounts managed by Fidelity Investments. The rate quoted is the annualized seven-day yield of the fund at period end. A complete unaudited listing of the fund's holdings as of its most recent quarter end is available upon request. In addition, each Fidelity Central Fund's financial statements are available on the SEC's website or upon request. |
| Affiliate | Value, beginning of period ($) | Purchases ($) | Sales Proceeds ($) | Dividend Income ($) | Realized Gain (loss) ($) | Change in Unrealized appreciation (depreciation) ($) | Value, end of period ($) | % ownership, end of period |
| Fidelity Cash Central Fund 4.37% | - | 1,860,061 | 1,857,308 | 498 | - | - | 2,753 | 0.0% |
| Total | - | 1,860,061 | 1,857,308 | 498 | - | - | 2,753 | |
| Valuation Inputs at Reporting Date: | ||||
| Description | Total ($) | Level 1 ($) | Level 2 ($) | Level 3 ($) |
Investments in Securities: | ||||
| Equities: | ||||
Industrials | 10,615,099 | 8,155,386 | 2,459,713 | - |
Information Technology | 7,410,362 | 5,863,733 | 1,546,629 | - |
Utilities | 19,951,918 | 15,893,068 | 4,058,850 | - |
| Money Market Funds | 2,753 | 2,753 | - | - |
| Total Investments in Securities: | 37,980,132 | 29,914,940 | 8,065,192 | - |
| Statement of Assets and Liabilities | ||||
December 31, 2022 (Unaudited) | ||||
| Assets | ||||
| Investment in securities, at value - See accompanying schedule: | $ | |||
Unaffiliated issuers (cost $41,513,387) | 37,977,379 | |||
Fidelity Central Funds (cost $2,753) | 2,753 | |||
| Total Investment in Securities (cost $41,516,140) | $ | 37,980,132 | ||
| Foreign currency held at value (cost $22,970) | 23,027 | |||
| Dividends receivable | 19,394 | |||
| Distributions receivable from Fidelity Central Funds | 74 | |||
Total assets | 38,022,627 | |||
| Liabilities | ||||
| Payable for investments purchased | $4,451 | |||
| Accrued management fee | 12,768 | |||
| Total Liabilities | 17,219 | |||
| Net Assets | $ | 38,005,408 | ||
| Net Assets consist of: | ||||
| Paid in capital | $ | 43,454,982 | ||
| Total accumulated earnings (loss) | (5,449,574) | |||
| Net Assets | $ | 38,005,408 | ||
Net Asset Value , offering price and redemption price per share ($38,005,408 ÷ 1,750,000 shares) | $ | 21.72 | ||
| Statement of Operations | ||||
Six months ended December 31, 2022 (Unaudited) | ||||
| Investment Income | ||||
| Dividends | $ | 109,570 | ||
| Income from Fidelity Central Funds | 498 | |||
| Total Income | 110,068 | |||
| Expenses | ||||
| Management fee | $ | 71,657 | ||
| Independent trustees' fees and expenses | 61 | |||
| Total expenses before reductions | 71,718 | |||
| Expense reductions | (29) | |||
| Total expenses after reductions | 71,689 | |||
| Net Investment income (loss) | 38,379 | |||
| Realized and Unrealized Gain (Loss) | ||||
| Net realized gain (loss) on: | ||||
| Investment Securities: | ||||
| Unaffiliated issuers | (869,071) | |||
| Foreign currency transactions | (594) | |||
| Total net realized gain (loss) | (869,665) | |||
| Change in net unrealized appreciation (depreciation) on: | ||||
| Investment Securities: | ||||
| Unaffiliated issuers | 934,682 | |||
| Assets and liabilities in foreign currencies | 6,285 | |||
| Total change in net unrealized appreciation (depreciation) | 940,967 | |||
| Net gain (loss) | 71,302 | |||
| Net increase (decrease) in net assets resulting from operations | $ | 109,681 | ||
| Statement of Changes in Net Assets | ||||
Six months ended December 31, 2022 (Unaudited) | For the period October 5, 2021 (commencement of operations) through June 30, 2022 | |||
| Increase (Decrease) in Net Assets | ||||
| Operations | ||||
| Net investment income (loss) | $ | 38,379 | $ | 144,270 |
| Net realized gain (loss) | (869,665) | (1,012,499) | ||
| Change in net unrealized appreciation (depreciation) | 940,967 | (4,471,106) | ||
| Net increase (decrease) in net assets resulting from operations | 109,681 | (5,339,335) | ||
| Distributions to shareholders | (75,550) | (145,750) | ||
| Share transactions | ||||
| Proceeds from sales of shares | 9,683,566 | 33,772,796 | ||
Net increase (decrease) in net assets resulting from share transactions | 9,683,566 | 33,772,796 | ||
| Total increase (decrease) in net assets | 9,717,697 | 28,287,711 | ||
| Net Assets | ||||
| Beginning of period | 28,287,711 | - | ||
| End of period | $ | 38,005,408 | $ | 28,287,711 |
| Other Information | ||||
| Shares | ||||
| Sold | 400,000 | 1,350,000 | ||
| Redeemed | - | - | ||
| Net increase (decrease) | 400,000 | 1,350,000 | ||
| Fidelity® Clean Energy ETF |
Six months ended (Unaudited) December 31, 2022 | Years ended June 30, 2022 A | |||
Selected Per-Share Data | ||||
| Net asset value, beginning of period | $ | 20.95 | $ | 25.12 |
| Income from Investment Operations | ||||
Net investment income (loss) B,C | .02 | .15 | ||
| Net realized and unrealized gain (loss) | .80 | (4.20) | ||
| Total from investment operations | .82 | (4.05) | ||
| Distributions from net investment income | (.05) | (.12) | ||
| Total distributions | (.05) | (.12) | ||
| Net asset value, end of period | $ | 21.72 | $ | 20.95 |
Total Return D,E,F | 3.84% | (16.12)% | ||
Ratios to Average Net Assets C,G,H | ||||
| Expenses before reductions | .39% I | .39% | ||
| Expenses net of fee waivers, if any | .39% I | .39% | ||
| Expenses net of all reductions | .39% I | .39% | ||
| Net investment income (loss) | .21% I | .90% | ||
| Supplemental Data | ||||
| Net assets, end of period (000 omitted) | $ | 38,005 | $ | 28,288 |
Portfolio turnover rate J,K | 50% I | 30% L |
Top Holdings (% of Fund's net assets) | ||
| SAP SE | 4.3 | |
| Salesforce.com, Inc. | 4.2 | |
| ServiceNow, Inc. | 4.1 | |
| Equinix, Inc. | 3.9 | |
| Snowflake, Inc. | 3.3 | |
| Workday, Inc. Class A | 3.3 | |
| VMware, Inc. Class A | 3.0 | |
| Digital Realty Trust, Inc. | 2.9 | |
| MongoDB, Inc. Class A | 2.8 | |
| Hewlett Packard Enterprise Co. | 2.7 | |
| 34.5 | ||
| Market Sectors (% of Fund's net assets) | ||
| Information Technology | 93.0 | |
| Real Estate | 6.8 | |
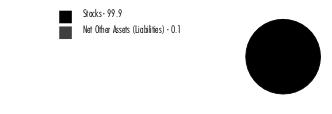
Asset Allocation (% of Fund's net assets) |
 |
Foreign investments - 18.4% |
Futures - 0.1% |
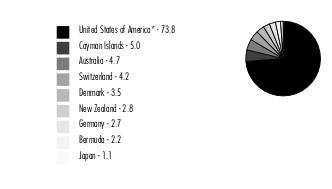
Geographic Diversification (% of Fund's net assets) |
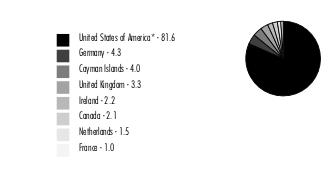 |
* Includes Short-Term investments and Net Other Assets (Liabilities). Percentages are based on country or territory of incorporation and are adjusted for the effect of derivatives, if applicable. |
| Common Stocks - 99.8% | |||
| Shares | Value ($) | ||
| INFORMATION TECHNOLOGY - 93.0% | |||
| Communications Equipment - 1.2% | |||
| NetScout Systems, Inc. (a) | 7,704 | 250,457 | |
| IT Services - 11.0% | |||
| Atos SE (a) | 20,870 | 200,729 | |
| Kingsoft Cloud Holdings Ltd. ADR (a) | 50,752 | 194,380 | |
| MongoDB, Inc. Class A (a) | 2,928 | 576,348 | |
| Snowflake, Inc. (a) | 4,868 | 698,753 | |
| Twilio, Inc. Class A (a) | 8,818 | 431,729 | |
| Vnet Group, Inc. ADR (a) | 33,814 | 191,725 | |
| 2,293,664 | |||
| Software - 69.8% | |||
| Alteryx, Inc. Class A (a) | 6,496 | 329,152 | |
| Atlassian Corp. PLC (a) | 4,149 | 533,893 | |
| Box, Inc. Class A (a) | 11,773 | 366,493 | |
| C3.ai, Inc. (a) | 16,534 | 185,015 | |
| CommVault Systems, Inc. (a) | 4,571 | 287,242 | |
| Confluent, Inc. (a) | 13,833 | 307,646 | |
| Coupa Software, Inc. (a) | 5,604 | 443,669 | |
| Datadog, Inc. Class A (a) | 7,326 | 538,461 | |
| Dropbox, Inc. Class A (a) | 16,774 | 375,402 | |
| Dynatrace, Inc. (a) | 10,779 | 412,836 | |
| Elastic NV (a) | 6,103 | 314,305 | |
| Five9, Inc. (a) | 5,302 | 359,794 | |
| GitLab, Inc. (a) | 6,551 | 297,677 | |
| HubSpot, Inc. (a) | 1,706 | 493,256 | |
| Informatica, Inc. (a) | 10,726 | 174,727 | |
| Kingdee International Software Group Co. Ltd. (a) | 208,500 | 447,189 | |
| LivePerson, Inc. (a) | 15,855 | 160,770 | |
| Micro Focus International PLC | 44,127 | 281,007 | |
| MicroStrategy, Inc. Class A (a) | 1,316 | 186,306 | |
| New Relic, Inc. (a) | 5,468 | 308,669 | |
| Nutanix, Inc. Class A (a) | 13,249 | 345,136 | |
| Open Text Corp. | 14,458 | 428,101 | |
| Pegasystems, Inc. | 6,568 | 224,888 | |
| Qualtrics International, Inc. (a) | 21,119 | 219,215 | |
| Sage Group PLC | 47,534 | 426,324 | |
| Salesforce.com, Inc. (a) | 6,629 | 878,939 | |
| SAP SE | 8,741 | 899,204 | |
| ServiceNow, Inc. (a) | 2,209 | 857,688 | |
| Splunk, Inc. (a) | 5,551 | 477,886 | |
| Sumo Logic, Inc. (a) | 25,280 | 204,768 | |
| Teradata Corp. (a) | 9,372 | 315,462 | |
| UiPath, Inc. Class A (a) | 27,183 | 345,496 | |
| Verint Systems, Inc. (a) | 7,328 | 265,860 | |
| VMware, Inc. Class A (a) | 5,128 | 629,513 | |
| Workday, Inc. Class A (a) | 4,061 | 679,527 | |
| Zoom Video Communications, Inc. Class A (a) | 7,096 | 480,683 | |
| 14,482,199 | |||
| Technology Hardware, Storage & Peripherals - 11.0% | |||
| Hewlett Packard Enterprise Co. | 35,414 | 565,207 | |
| NetApp, Inc. | 7,712 | 463,183 | |
| Pure Storage, Inc. Class A (a) | 14,327 | 383,391 | |
| Seagate Technology Holdings PLC | 8,728 | 459,180 | |
| Western Digital Corp. (a) | 13,310 | 419,931 | |
| 2,290,892 | |||
TOTAL INFORMATION TECHNOLOGY | 19,317,212 | ||
| REAL ESTATE - 6.8% | |||
| Equity Real Estate Investment Trusts (REITs) - 6.8% | |||
| Digital Realty Trust, Inc. | 6,062 | 607,837 | |
| Equinix, Inc. | 1,218 | 797,827 | |
| 1,405,664 | |||
| TOTAL COMMON STOCKS (Cost $29,792,508) | 20,722,876 | ||
| Money Market Funds - 0.0% | |||
| Shares | Value ($) | ||
Fidelity Cash Central Fund 4.37% (b) (Cost $3,483) | 3,482 | 3,483 | |
| TOTAL INVESTMENT IN SECURITIES - 99.8% (Cost $29,795,991) | 20,726,359 |
NET OTHER ASSETS (LIABILITIES) - 0.2% | 32,084 |
| NET ASSETS - 100.0% | 20,758,443 |
| Futures Contracts | |||||
Number of contracts | Expiration Date | Notional Amount ($) | Value ($) | Unrealized Appreciation/ (Depreciation) ($) | |
| Purchased | |||||
| Equity Index Contracts | |||||
| CME E-mini NASDAQ 100 Index Contracts (United States) | 1 | Mar 2023 | 22,045 | (1,331) | (1,331) |
| The notional amount of futures purchased as a percentage of Net Assets is 0.1% | |||||
| (a) | Non-income producing |
| (b) | Affiliated fund that is generally available only to investment companies and other accounts managed by Fidelity Investments. The rate quoted is the annualized seven-day yield of the fund at period end. A complete unaudited listing of the fund's holdings as of its most recent quarter end is available upon request. In addition, each Fidelity Central Fund's financial statements are available on the SEC's website or upon request. |
| Affiliate | Value, beginning of period ($) | Purchases ($) | Sales Proceeds ($) | Dividend Income ($) | Realized Gain (loss) ($) | Change in Unrealized appreciation (depreciation) ($) | Value, end of period ($) | % ownership, end of period |
| Fidelity Cash Central Fund 4.37% | - | 677,455 | 673,972 | 229 | - | - | 3,483 | 0.0% |
| Total | - | 677,455 | 673,972 | 229 | - | - | 3,483 | |
| Valuation Inputs at Reporting Date: | ||||
| Description | Total ($) | Level 1 ($) | Level 2 ($) | Level 3 ($) |
Investments in Securities: | ||||
| Equities: | ||||
Information Technology | 19,317,212 | 17,689,812 | 1,627,400 | - |
Real Estate | 1,405,664 | 1,405,664 | - | - |
| Money Market Funds | 3,483 | 3,483 | - | - |
| Total Investments in Securities: | 20,726,359 | 19,098,959 | 1,627,400 | - |
Derivative Instruments: | ||||
| Liabilities | ||||
Futures Contracts | (1,331) | (1,331) | - | - |
| Total Liabilities | (1,331) | (1,331) | - | - |
| Total Derivative Instruments: | (1,331) | (1,331) | - | - |
Primary Risk Exposure / Derivative Type | Value | |
| Asset ($) | Liability ($) | |
| Equity Risk | ||
Futures Contracts (a) | 0 | (1,331) |
| Total Equity Risk | 0 | (1,331) |
| Total Value of Derivatives | 0 | (1,331) |
| Statement of Assets and Liabilities | ||||
December 31, 2022 (Unaudited) | ||||
| Assets | ||||
| Investment in securities, at value - See accompanying schedule: | $ | |||
Unaffiliated issuers (cost $29,792,508) | 20,722,876 | |||
Fidelity Central Funds (cost $3,483) | 3,483 | |||
| Total Investment in Securities (cost $29,795,991) | $ | 20,726,359 | ||
| Segregated cash with brokers for derivative instruments | 1,580 | |||
| Cash | 520 | |||
| Foreign currency held at value (cost $15,378) | 15,391 | |||
| Dividends receivable | 21,408 | |||
| Distributions receivable from Fidelity Central Funds | 53 | |||
Total assets | 20,765,311 | |||
| Liabilities | ||||
| Accrued management fee | 6,841 | |||
| Payable for daily variation margin on futures contracts | 21 | |||
| Other payables and accrued expenses | 6 | |||
| Total Liabilities | 6,868 | |||
| Net Assets | $ | 20,758,443 | ||
| Net Assets consist of: | ||||
| Paid in capital | $ | 32,550,158 | ||
| Total accumulated earnings (loss) | (11,791,715) | |||
| Net Assets | $ | 20,758,443 | ||
Net Asset Value , offering price and redemption price per share ($20,758,443 ÷ 1,400,000 shares) | $ | 14.83 | ||
| Statement of Operations | ||||
Six months ended December 31, 2022 (Unaudited) | ||||
| Investment Income | ||||
| Dividends | $ | 50,210 | ||
| Income from Fidelity Central Funds | 229 | |||
| Total Income | 50,439 | |||
| Expenses | ||||
| Management fee | $ | 39,242 | ||
| Independent trustees' fees and expenses | 34 | |||
| Total expenses before reductions | 39,276 | |||
| Expense reductions | (75) | |||
| Total expenses after reductions | 39,201 | |||
| Net Investment income (loss) | 11,238 | |||
| Realized and Unrealized Gain (Loss) | ||||
| Net realized gain (loss) on: | ||||
| Investment Securities: | ||||
| Unaffiliated issuers | (1,328,881) | |||
| Foreign currency transactions | (1,937) | |||
| Futures contracts | 763 | |||
| Total net realized gain (loss) | (1,330,055) | |||
| Change in net unrealized appreciation (depreciation) on: | ||||
| Investment Securities: | ||||
| Unaffiliated issuers | (255,782) | |||
| Assets and liabilities in foreign currencies | 117 | |||
| Futures contracts | (1,331) | |||
| Total change in net unrealized appreciation (depreciation) | (256,996) | |||
| Net gain (loss) | (1,587,051) | |||
| Net increase (decrease) in net assets resulting from operations | $ | (1,575,813) | ||
| Statement of Changes in Net Assets | ||||
Six months ended December 31, 2022 (Unaudited) | For the period October 5, 2021 (commencement of operations) through June 30, 2022 | |||
| Increase (Decrease) in Net Assets | ||||
| Operations | ||||
| Net investment income (loss) | $ | 11,238 | $ | 55,996 |
| Net realized gain (loss) | (1,330,055) | (1,531,664) | ||
| Change in net unrealized appreciation (depreciation) | (256,996) | (8,813,883) | ||
| Net increase (decrease) in net assets resulting from operations | (1,575,813) | (10,289,551) | ||
| Distributions to shareholders | (16,400) | (57,350) | ||
| Share transactions | ||||
| Proceeds from sales of shares | 4,057,727 | 29,456,208 | ||
| Cost of shares redeemed | - | (816,378) | ||
Net increase (decrease) in net assets resulting from share transactions | 4,057,727 | 28,639,830 | ||
| Total increase (decrease) in net assets | 2,465,514 | 18,292,929 | ||
| Net Assets | ||||
| Beginning of period | 18,292,929 | - | ||
| End of period | $ | 20,758,443 | $ | 18,292,929 |
| Other Information | ||||
| Shares | ||||
| Sold | 250,000 | 1,200,000 | ||
| Redeemed | - | (50,000) | ||
| Net increase (decrease) | 250,000 | 1,150,000 | ||
| Fidelity® Cloud Computing ETF |
Six months ended (Unaudited) December 31, 2022 | Years ended June 30, 2022 A | |||
Selected Per-Share Data | ||||
| Net asset value, beginning of period | $ | 15.91 | $ | 25.20 |
| Income from Investment Operations | ||||
Net investment income (loss) B,C | .01 | .06 | ||
| Net realized and unrealized gain (loss) | (1.08) | (9.29) | ||
| Total from investment operations | (1.07) | (9.23) | ||
| Distributions from net investment income | (.01) | (.06) | ||
| Total distributions | (.01) | (.06) | ||
| Net asset value, end of period | $ | 14.83 | $ | 15.91 |
Total Return D,E,F | (6.71)% | (36.69)% | ||
Ratios to Average Net Assets C,G,H | ||||
| Expenses before reductions | .39% I | .39% | ||
| Expenses net of fee waivers, if any | .39% I | .39% | ||
| Expenses net of all reductions | .39% I | .39% | ||
| Net investment income (loss) | .11% I | .41% | ||
| Supplemental Data | ||||
| Net assets, end of period (000 omitted) | $ | 20,758 | $ | 18,293 |
Portfolio turnover rate J,K | 27% I | 31% L |
Top Holdings (% of Fund's net assets) | ||
| Block, Inc. Class A | 16.6 | |
| Coinbase Global, Inc. | 12.4 | |
| Riot Blockchain, Inc. | 5.9 | |
| Marathon Digital Holdings, Inc. | 5.2 | |
| Applied Digital Corp. | 3.8 | |
| Hut 8 Mining Corp. | 3.5 | |
| Cleanspark, Inc. | 3.5 | |
| Dlocal Ltd. | 2.7 | |
| Galaxy Digital Holdings Ltd. | 2.7 | |
| Shift4 Payments, Inc. | 2.6 | |
| 58.9 | ||
| Market Sectors (% of Fund's net assets) | ||
| Information Technology | 79.1 | |
| Financials | 20.8 | |
Asset Allocation (% of Fund's net assets) |
 |
Foreign investments - 15.7% |
Futures - 0.1% |
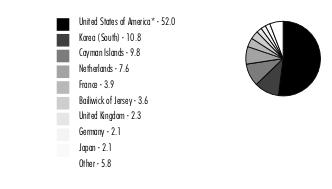
Geographic Diversification (% of Fund's net assets) |
 |
* Includes Short-Term investments and Net Other Assets (Liabilities). Percentages are based on country or territory of incorporation and are adjusted for the effect of derivatives, if applicable. |
| Common Stocks - 99.9% | |||
| Shares | Value ($) | ||
| FINANCIALS - 20.8% | |||
| Capital Markets - 17.4% | |||
| Bakkt Holdings, Inc. Class A (a) | 328,508 | 390,925 | |
| Coinbase Global, Inc. (a) | 59,138 | 2,092,894 | |
| Galaxy Digital Holdings Ltd. (a) | 156,156 | 446,012 | |
| 2,929,831 | |||
| Consumer Finance - 3.4% | |||
| Bread Financial Holdings, Inc. | 9,488 | 357,318 | |
| Green Dot Corp. Class A (a) | 12,957 | 204,980 | |
| 562,298 | |||
TOTAL FINANCIALS | 3,492,129 | ||
| INFORMATION TECHNOLOGY - 79.1% | |||
| IT Services - 53.4% | |||
| Block, Inc. Class A (a) | 44,415 | 2,791,037 | |
| Cielo SA | 373,200 | 370,390 | |
| Dlocal Ltd. (a) | 29,011 | 451,701 | |
| Edenred SA | 6,033 | 327,602 | |
| FleetCor Technologies, Inc. (a) | 1,956 | 359,278 | |
| Flywire Corp. (a) | 14,778 | 361,618 | |
| Global Payments, Inc. | 3,708 | 368,279 | |
| GMO Payment Gateway, Inc. | 3,600 | 297,942 | |
| Marqeta, Inc. Class A (a) | 57,550 | 351,631 | |
| MasterCard, Inc. Class A | 1,064 | 369,985 | |
| Nexi SpA (a)(b) | 37,726 | 296,578 | |
| Nuvei Corp. (a)(b) | 8,696 | 220,965 | |
| Payoneer Global, Inc. (a) | 61,219 | 334,868 | |
| Shift4 Payments, Inc. (a) | 7,696 | 430,437 | |
| Shopify, Inc. Class A (a) | 8,845 | 307,010 | |
| StoneCo Ltd. Class A (a) | 32,669 | 308,395 | |
| Visa, Inc. Class A | 1,769 | 367,527 | |
| WEX, Inc. (a) | 2,241 | 366,740 | |
| Worldline SA (a)(b) | 7,548 | 294,271 | |
| 8,976,254 | |||
| Software - 25.7% | |||
| Applied Digital Corp. | 342,767 | 630,691 | |
| Bitfarms Ltd. (a) | 640,779 | 281,943 | |
| Cleanspark, Inc. (a) | 285,089 | 581,582 | |
| HIVE Blockchain Technologies Ltd. (a) | 250,663 | 360,955 | |
| Hut 8 Mining Corp. (a) | 701,422 | 596,209 | |
| Marathon Digital Holdings, Inc. (a) | 257,040 | 879,077 | |
| Riot Blockchain, Inc. (a) | 293,623 | 995,382 | |
| 4,325,839 | |||
TOTAL INFORMATION TECHNOLOGY | 13,302,093 | ||
| TOTAL COMMON STOCKS (Cost $23,946,702) | 16,794,222 | ||
| TOTAL INVESTMENT IN SECURITIES - 99.9% (Cost $23,946,702) | 16,794,222 |
NET OTHER ASSETS (LIABILITIES) - 0.1% | 24,545 |
| NET ASSETS - 100.0% | 16,818,767 |
| Futures Contracts | |||||
Number of contracts | Expiration Date | Notional Amount ($) | Value ($) | Unrealized Appreciation/ (Depreciation) ($) | |
| Purchased | |||||
| Equity Index Contracts | |||||
| CME E-mini NASDAQ 100 Index Contracts (United States) | 1 | Mar 2023 | 22,045 | 209 | 209 |
| The notional amount of futures purchased as a percentage of Net Assets is 0.1% | |||||
| (a) | Non-income producing |
| (b) | Security exempt from registration under Rule 144A of the Securities Act of 1933. These securities may be resold in transactions exempt from registration, normally to qualified institutional buyers. At the end of the period, the value of these securities amounted to $811,814 or 4.8% of net assets. |
| Affiliate | Value, beginning of period ($) | Purchases ($) | Sales Proceeds ($) | Dividend Income ($) | Realized Gain (loss) ($) | Change in Unrealized appreciation (depreciation) ($) | Value, end of period ($) | % ownership, end of period |
| Fidelity Cash Central Fund 4.37% | - | 85,310 | 85,310 | 5 | - | - | - | 0.0% |
| Total | - | 85,310 | 85,310 | 5 | - | - | - | |
| Valuation Inputs at Reporting Date: | ||||
| Description | Total ($) | Level 1 ($) | Level 2 ($) | Level 3 ($) |
Investments in Securities: | ||||
| Equities: | ||||
Financials | 3,492,129 | 3,492,129 | - | - |
Information Technology | 13,302,093 | 12,709,880 | 592,213 | - |
| Total Investments in Securities: | 16,794,222 | 16,202,009 | 592,213 | - |
Derivative Instruments: | ||||
| Assets | ||||
Futures Contracts | 209 | 209 | - | - |
| Total Assets | 209 | 209 | - | - |
| Total Derivative Instruments: | 209 | 209 | - | - |
Primary Risk Exposure / Derivative Type | Value | |
| Asset ($) | Liability ($) | |
| Equity Risk | ||
Futures Contracts (a) | 209 | 0 |
| Total Equity Risk | 209 | 0 |
| Total Value of Derivatives | 209 | 0 |
| Statement of Assets and Liabilities | ||||
December 31, 2022 (Unaudited) | ||||
| Assets | ||||
Investment in securities, at value - See accompanying schedule Unaffiliated issuers (cost $23,946,702): | $ | 16,794,222 | ||
| Segregated cash with brokers for derivative instruments | 1,580 | |||
| Cash | 19,967 | |||
| Foreign currency held at value (cost $2,219) | 2,223 | |||
| Dividends receivable | 6,270 | |||
| Other receivables | 11 | |||
Total assets | 16,824,273 | |||
| Liabilities | ||||
| Accrued management fee | 5,485 | |||
| Payable for daily variation margin on futures contracts | 21 | |||
| Total Liabilities | 5,506 | |||
| Net Assets | $ | 16,818,767 | ||
| Net Assets consist of: | ||||
| Paid in capital | $ | 27,237,158 | ||
| Total accumulated earnings (loss) | (10,418,391) | |||
| Net Assets | $ | 16,818,767 | ||
Net Asset Value , offering price and redemption price per share ($16,818,767 ÷ 1,600,000 shares) | $ | 10.51 | ||
| Statement of Operations | ||||
Six months ended December 31, 2022 (Unaudited) | ||||
| Investment Income | ||||
| Dividends | $ | 19,857 | ||
| Income from Fidelity Central Funds | 5 | |||
| Total Income | 19,862 | |||
| Expenses | ||||
| Management fee | $ | 34,680 | ||
| Independent trustees' fees and expenses | 30 | |||
| Total expenses before reductions | 34,710 | |||
| Expense reductions | (98) | |||
| Total expenses after reductions | 34,612 | |||
| Net Investment income (loss) | (14,750) | |||
| Realized and Unrealized Gain (Loss) | ||||
| Net realized gain (loss) on: | ||||
| Investment Securities: | ||||
| Redemptions in-kind | (19,406) | |||
| Unaffiliated issuers | (2,344,590) | |||
| Foreign currency transactions | (365) | |||
| Futures contracts | (2,987) | |||
| Total net realized gain (loss) | (2,367,348) | |||
| Change in net unrealized appreciation (depreciation) on: | ||||
| Investment Securities: | ||||
| Unaffiliated issuers | (2,242,562) | |||
| Assets and liabilities in foreign currencies | 25 | |||
| Futures contracts | 209 | |||
| Total change in net unrealized appreciation (depreciation) | (2,242,328) | |||
| Net gain (loss) | (4,609,676) | |||
| Net increase (decrease) in net assets resulting from operations | $ | (4,624,426) | ||
| Statement of Changes in Net Assets | ||||
Six months ended December 31, 2022 (Unaudited) | For the period April 19, 2022 (commencement of operations) through June 30, 2022 | |||
| Increase (Decrease) in Net Assets | ||||
| Operations | ||||
| Net investment income (loss) | $ | (14,750) | $ | (5,137) |
| Net realized gain (loss) | (2,367,348) | (884,217) | ||
| Change in net unrealized appreciation (depreciation) | (2,242,328) | (4,910,077) | ||
| Net increase (decrease) in net assets resulting from operations | (4,624,426) | (5,799,431) | ||
| Share transactions | ||||
| Proceeds from sales of shares | 9,706,463 | 18,803,995 | ||
| Cost of shares redeemed | (1,267,834) | - | ||
Net increase (decrease) in net assets resulting from share transactions | 8,438,629 | 18,803,995 | ||
| Total increase (decrease) in net assets | 3,814,203 | 13,004,564 | ||
| Net Assets | ||||
| Beginning of period | 13,004,564 | - | ||
| End of period | $ | 16,818,767 | $ | 13,004,564 |
| Other Information | ||||
| Shares | ||||
| Sold | 650,000 | 1,050,000 | ||
| Redeemed | (100,000) | - | ||
| Net increase (decrease) | 550,000 | 1,050,000 | ||
| Fidelity® Crypto Industry and Digital Payments ETF |
Six months ended (Unaudited) December 31, 2022 | Years ended June 30, 2022 A | |||
Selected Per-Share Data | ||||
| Net asset value, beginning of period | $ | 12.39 | $ | 25.76 |
| Income from Investment Operations | ||||
Net investment income (loss) B,C | (.01) | (.01) | ||
| Net realized and unrealized gain (loss) | (1.87) | (13.36) | ||
| Total from investment operations | (1.88) | (13.37) | ||
| Net asset value, end of period | $ | 10.51 | $ | 12.39 |
Total Return D,E,F | (15.13)% | (51.92)% | ||
Ratios to Average Net Assets C,G,H | ||||
| Expenses before reductions | .39% I | .39% | ||
| Expenses net of fee waivers, if any | .39% I | .39% | ||
| Expenses net of all reductions | .38% I | .39% | ||
| Net investment income (loss) | (.16)% I | (.29)% | ||
| Supplemental Data | ||||
| Net assets, end of period (000 omitted) | $ | 16,819 | $ | 13,005 |
Portfolio turnover rate J,K | 47% I | 28% L |
Top Holdings (% of Fund's net assets) | ||
| Intuitive Surgical, Inc. | 4.6 | |
| DexCom, Inc. | 4.5 | |
| ResMed, Inc. | 4.3 | |
| Insulet Corp. | 3.9 | |
| Veeva Systems, Inc. Class A | 3.7 | |
| JD Health International, Inc. | 3.3 | |
| Sonova Holding AG | 3.2 | |
| Cochlear Ltd. | 3.0 | |
| Inspire Medical Systems, Inc. | 2.9 | |
| Fisher & Paykel Healthcare Corp. | 2.8 | |
| 36.2 | ||
| Market Sectors (% of Fund's net assets) | ||
| Health Care | 83.6 | |
| Consumer Discretionary | 7.2 | |
| Information Technology | 7.0 | |
| Consumer Staples | 2.2 | |
Asset Allocation (% of Fund's net assets) |
 |
Foreign investments - 26.2% |
Geographic Diversification (% of Fund's net assets) |
 |
* Includes Short-Term investments and Net Other Assets (Liabilities). Percentages are based on country or territory of incorporation and are adjusted for the effect of derivatives, if applicable. |
| Common Stocks - 100.0% | |||
| Shares | Value ($) | ||
| CONSUMER DISCRETIONARY - 7.2% | |||
| Internet & Direct Marketing Retail - 7.2% | |||
| Alibaba Health Information Technology Ltd. (a) | 244,000 | 207,894 | |
| JD Health International, Inc. (a)(b) | 33,450 | 305,788 | |
| Ping An Healthcare and Technology Co. Ltd. (a)(b) | 57,500 | 156,920 | |
| 670,602 | |||
| CONSUMER STAPLES - 2.2% | |||
| Food & Staples Retailing - 2.2% | |||
| Shop Apotheke Europe NV (a)(b) | 2,380 | 112,042 | |
| Zur Rose Group AG (a) | 3,243 | 89,593 | |
| 201,635 | |||
| HEALTH CARE - 83.6% | |||
| Biotechnology - 1.5% | |||
| Zealand Pharma A/S (a) | 4,817 | 139,231 | |
| Health Care Equipment & Supplies - 41.9% | |||
| Axonics Modulation Technologies, Inc. (a) | 2,913 | 182,150 | |
| Cochlear Ltd. | 1,991 | 275,602 | |
| Demant A/S (a) | 6,615 | 182,799 | |
| DexCom, Inc. (a) | 3,722 | 421,479 | |
| Fisher & Paykel Healthcare Corp. | 18,190 | 259,996 | |
| Inspire Medical Systems, Inc. (a) | 1,067 | 268,756 | |
| Insulet Corp. (a) | 1,227 | 361,217 | |
| Integra LifeSciences Holdings Corp. (a) | 3,867 | 216,823 | |
| Intuitive Surgical, Inc. (a) | 1,599 | 424,294 | |
| iRhythm Technologies, Inc. (a) | 1,863 | 174,507 | |
| Nevro Corp. (a) | 3,391 | 134,284 | |
| ResMed, Inc. | 1,916 | 398,777 | |
| Senseonics Holdings, Inc. (a) | 95,633 | 98,502 | |
| Sonova Holding AG | 1,243 | 294,628 | |
| Tandem Diabetes Care, Inc. (a) | 4,471 | 200,971 | |
| 3,894,785 | |||
| Health Care Providers & Services - 12.9% | |||
| Apollo Medical Holdings, Inc. (a) | 4,981 | 147,388 | |
| Cigna Corp. | 618 | 204,768 | |
| Corvel Corp. (a) | 995 | 144,603 | |
| Hims & Hers Health, Inc. (a) | 19,602 | 125,649 | |
| Premier, Inc. | 6,434 | 225,061 | |
| R1 Rcm, Inc. (a) | 16,220 | 177,609 | |
| Signify Health, Inc. (a) | 5,968 | 171,043 | |
| 1,196,121 | |||
| Health Care Technology - 27.3% | |||
| American Well Corp. (a) | 34,982 | 98,999 | |
| CompuGroup Medical AG | 3,544 | 136,088 | |
| Computer Programs & Systems, Inc. (a) | 3,518 | 95,760 | |
| Definitive Healthcare Corp. (a) | 8,586 | 94,360 | |
| Doximity, Inc. (a) | 6,130 | 205,723 | |
| Evolent Health, Inc. (a) | 6,409 | 179,965 | |
| Health Catalyst, Inc. (a) | 10,692 | 113,656 | |
| HealthStream, Inc. (a) | 4,525 | 112,401 | |
| JMDC, Inc. | 3,500 | 100,269 | |
| MultiPlan Corp. Class A (a) | 62,562 | 71,946 | |
| Nextgen Healthcare, Inc. (a) | 6,900 | 129,582 | |
| OptimizeRx Corp. (a) | 4,790 | 80,472 | |
| Phreesia, Inc. (a) | 5,496 | 177,851 | |
| Pro Medicus Ltd. | 4,244 | 159,042 | |
| Sharecare, Inc. Class A (a) | 57,164 | 91,462 | |
| Teladoc Health, Inc. (a) | 7,853 | 185,723 | |
| Allscripts Healthcare Solutions, Inc. (a) | 9,217 | 162,588 | |
| Veeva Systems, Inc. Class A (a) | 2,128 | 343,417 | |
| 2,539,304 | |||
TOTAL HEALTH CARE | 7,769,441 | ||
| INFORMATION TECHNOLOGY - 7.0% | |||
| IT Services - 4.1% | |||
| Cognizant Technology Solutions Corp. Class A | 3,195 | 182,722 | |
| Maximus, Inc. | 2,751 | 201,731 | |
| 384,453 | |||
| Software - 2.9% | |||
| EngageSmart, Inc. (a) | 6,331 | 111,426 | |
| Model N, Inc. (a) | 3,762 | 152,587 | |
| 264,013 | |||
TOTAL INFORMATION TECHNOLOGY | 648,466 | ||
| TOTAL COMMON STOCKS (Cost $11,985,302) | 9,290,144 | ||
| TOTAL INVESTMENT IN SECURITIES - 100.0% (Cost $11,985,302) | 9,290,144 |
NET OTHER ASSETS (LIABILITIES) - 0.0% | 3,045 |
| NET ASSETS - 100.0% | 9,293,189 |
| (a) | Non-income producing |
| (b) | Security exempt from registration under Rule 144A of the Securities Act of 1933. These securities may be resold in transactions exempt from registration, normally to qualified institutional buyers. At the end of the period, the value of these securities amounted to $574,750 or 6.2% of net assets. |
| Affiliate | Value, beginning of period ($) | Purchases ($) | Sales Proceeds ($) | Dividend Income ($) | Realized Gain (loss) ($) | Change in Unrealized appreciation (depreciation) ($) | Value, end of period ($) | % ownership, end of period |
| Fidelity Cash Central Fund 4.37% | - | 416,614 | 416,614 | 152 | - | - | - | 0.0% |
| Total | - | 416,614 | 416,614 | 152 | - | - | - | |
| Valuation Inputs at Reporting Date: | ||||
| Description | Total ($) | Level 1 ($) | Level 2 ($) | Level 3 ($) |
Investments in Securities: | ||||
| Equities: | ||||
Consumer Discretionary | 670,602 | - | 670,602 | - |
Consumer Staples | 201,635 | 201,635 | - | - |
Health Care | 7,769,441 | 6,974,532 | 794,909 | - |
Information Technology | 648,466 | 648,466 | - | - |
| Total Investments in Securities: | 9,290,144 | 7,824,633 | 1,465,511 | - |
| Statement of Assets and Liabilities | ||||
December 31, 2022 (Unaudited) | ||||
| Assets | ||||
Investment in securities, at value - See accompanying schedule Unaffiliated issuers (cost $11,985,302): | $ | 9,290,144 | ||
| Foreign currency held at value (cost $7,630) | 7,686 | |||
| Receivable for investments sold | 28 | |||
| Dividends receivable | 1,231 | |||
| Distributions receivable from Fidelity Central Funds | 10 | |||
Total assets | 9,299,099 | |||
| Liabilities | ||||
| Payable to custodian bank | 2,763 | |||
| Accrued management fee | 3,116 | |||
| Other payables and accrued expenses | 31 | |||
| Total Liabilities | 5,910 | |||
| Net Assets | $ | 9,293,189 | ||
| Net Assets consist of: | ||||
| Paid in capital | $ | 12,749,375 | ||
| Total accumulated earnings (loss) | (3,456,186) | |||
| Net Assets | $ | 9,293,189 | ||
Net Asset Value , offering price and redemption price per share ($9,293,189 ÷ 500,000 shares) | $ | 18.59 | ||
| Statement of Operations | ||||
Six months ended December 31, 2022 (Unaudited) | ||||
| Investment Income | ||||
| Dividends | $ | 12,198 | ||
| Special dividends | 19,416 | |||
| Income from Fidelity Central Funds | 152 | |||
| Total Income | 31,766 | |||
| Expenses | ||||
| Management fee | $ | 18,313 | ||
| Independent trustees' fees and expenses | 16 | |||
| Total expenses before reductions | 18,329 | |||
| Expense reductions | (8) | |||
| Total expenses after reductions | 18,321 | |||
| Net Investment income (loss) | 13,445 | |||
| Realized and Unrealized Gain (Loss) | ||||
| Net realized gain (loss) on: | ||||
| Investment Securities: | ||||
| Unaffiliated issuers | (426,216) | |||
| Foreign currency transactions | (61) | |||
| Total net realized gain (loss) | (426,277) | |||
| Change in net unrealized appreciation (depreciation) on: | ||||
| Investment Securities: | ||||
| Unaffiliated issuers | 428,745 | |||
| Assets and liabilities in foreign currencies | 88 | |||
| Total change in net unrealized appreciation (depreciation) | 428,833 | |||
| Net gain (loss) | 2,556 | |||
| Net increase (decrease) in net assets resulting from operations | $ | 16,001 | ||
| Statement of Changes in Net Assets | ||||
Six months ended December 31, 2022 (Unaudited) | For the period October 5, 2021 (commencement of operations) through June 30, 2022 | |||
| Increase (Decrease) in Net Assets | ||||
| Operations | ||||
| Net investment income (loss) | $ | 13,445 | $ | (3,322) |
| Net realized gain (loss) | (426,277) | (485,420) | ||
| Change in net unrealized appreciation (depreciation) | 428,833 | (3,123,941) | ||
| Net increase (decrease) in net assets resulting from operations | 16,001 | (3,612,683) | ||
| Distributions to shareholders | (11,500) | - | ||
| Share transactions | ||||
| Proceeds from sales of shares | - | 13,779,066 | ||
| Cost of shares redeemed | - | (877,695) | ||
Net increase (decrease) in net assets resulting from share transactions | - | 12,901,371 | ||
| Total increase (decrease) in net assets | 4,501 | 9,288,688 | ||
| Net Assets | ||||
| Beginning of period | 9,288,688 | - | ||
| End of period | $ | 9,293,189 | $ | 9,288,688 |
| Other Information | ||||
| Shares | ||||
| Sold | - | 550,000 | ||
| Redeemed | - | (50,000) | ||
| Net increase (decrease) | - | 500,000 | ||
| Fidelity® Digital Health ETF |
Six months ended (Unaudited) December 31, 2022 | Years ended June 30, 2022 A | |||
Selected Per-Share Data | ||||
| Net asset value, beginning of period | $ | 18.58 | $ | 25.10 |
| Income from Investment Operations | ||||
Net investment income (loss) B,C | .03 D | (.01) | ||
| Net realized and unrealized gain (loss) | - E | (6.51) | ||
| Total from investment operations | .03 | (6.52) | ||
| Distributions from net investment income | (.02) | - | ||
| Total distributions | (.02) | - | ||
| Net asset value, end of period | $ | 18.59 | $ | 18.58 |
Total Return F,G,H | .17% | (25.99)% | ||
Ratios to Average Net Assets C,I,J | ||||
| Expenses before reductions | .39% K | .39% | ||
| Expenses net of fee waivers, if any | .39% K | .39% | ||
| Expenses net of all reductions | .39% K | .39% | ||
| Net investment income (loss) | .08% D,K | (.05)% | ||
| Supplemental Data | ||||
| Net assets, end of period (000 omitted) | $ | 9,293 | $ | 9,289 |
Portfolio turnover rate L | 39% K | 48% M,N |
Top Holdings (% of Fund's net assets) | ||
| NXP Semiconductors NV | 4.2 | |
| Aptiv PLC | 3.6 | |
| Samsung SDI Co. Ltd. | 3.5 | |
| onsemi | 3.5 | |
| STMicroelectronics NV (Italy) | 3.4 | |
| Tesla, Inc. | 3.3 | |
| Garmin Ltd. | 3.2 | |
| Skyworks Solutions, Inc. | 3.1 | |
| Li Auto, Inc. ADR | 3.0 | |
| NIO, Inc. sponsored ADR | 2.8 | |
| 33.6 | ||
| Market Sectors (% of Fund's net assets) | ||
| Consumer Discretionary | 37.8 | |
| Information Technology | 36.7 | |
| Industrials | 17.7 | |
| Materials | 7.7 | |
Asset Allocation (% of Fund's net assets) |
|
Foreign investments - 48% |
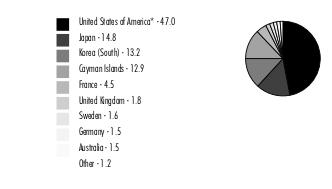
Geographic Diversification (% of Fund's net assets) |
 |
* Includes Short-Term investments and Net Other Assets (Liabilities). Percentages are based on country or territory of incorporation and are adjusted for the effect of derivatives, if applicable. |
| Common Stocks - 99.9% | |||
| Shares | Value ($) | ||
| CONSUMER DISCRETIONARY - 37.8% | |||
| Auto Components - 15.2% | |||
| Aptiv PLC (a) | 15,441 | 1,438,020 | |
| Faurecia SA (a) | 45,617 | 687,915 | |
| Gentex Corp. | 34,695 | 946,133 | |
| Lear Corp. | 7,665 | 950,613 | |
| Luminar Technologies, Inc. (a) | 82,061 | 406,202 | |
| Valeo SA | 46,554 | 829,735 | |
| Visteon Corp. (a) | 5,775 | 755,543 | |
| 6,014,161 | |||
| Automobiles - 16.7% | |||
| Li Auto, Inc. ADR (a) | 57,383 | 1,170,613 | |
| Lucid Group, Inc. Class A (a) | 96,938 | 662,087 | |
| NIO, Inc. sponsored ADR (a) | 113,446 | 1,106,099 | |
| Rivian Automotive, Inc. (a) | 43,565 | 802,903 | |
| Tesla, Inc. (a) | 10,752 | 1,324,431 | |
| XPeng, Inc. ADR (a) | 92,566 | 920,106 | |
| Yadea Group Holdings Ltd. (b) | 372,000 | 622,467 | |
| 6,608,706 | |||
| Household Durables - 3.2% | |||
| Garmin Ltd. | 13,759 | 1,269,818 | |
| Internet & Direct Marketing Retail - 2.0% | |||
| Lyft, Inc. (a) | 71,604 | 789,076 | |
| Specialty Retail - 0.7% | |||
| EVgo, Inc. Class A (a) | 65,439 | 292,512 | |
TOTAL CONSUMER DISCRETIONARY | 14,974,273 | ||
| INDUSTRIALS - 17.7% | |||
| Commercial Services & Supplies - 1.0% | |||
| Aurora Innovation, Inc. (a) | 310,085 | 375,203 | |
| Electrical Equipment - 16.0% | |||
| Ballard Power Systems, Inc. (a) | 99,431 | 475,525 | |
| Blink Charging Co. (a) | 31,828 | 349,153 | |
| Bloom Energy Corp. Class A (a) | 38,538 | 736,847 | |
| ChargePoint Holdings, Inc. Class A (a) | 64,033 | 610,234 | |
| Doosan Fuel Cell Co. Ltd. (a) | 20,678 | 479,952 | |
| FuelCell Energy, Inc. (a) | 167,071 | 464,457 | |
| LG Energy Solution (a) | 3,150 | 1,084,875 | |
| Plug Power, Inc. (a) | 68,092 | 842,298 | |
| PowerCell Sweden AB (a) | 35,490 | 405,498 | |
| Sensata Technologies, Inc. PLC | 22,403 | 904,633 | |
| 6,353,472 | |||
| Road & Rail - 0.7% | |||
| TuSimple Holdings, Inc. (a) | 160,018 | 262,430 | |
TOTAL INDUSTRIALS | 6,991,105 | ||
| INFORMATION TECHNOLOGY - 36.7% | |||
| Electronic Equipment & Components - 3.5% | |||
| Samsung SDI Co. Ltd. | 2,982 | 1,393,722 | |
| Semiconductors & Semiconductor Equipment - 33.2% | |||
| Allegro MicroSystems LLC (a) | 20,768 | 623,455 | |
| Ambarella, Inc. (a) | 9,603 | 789,655 | |
| Himax Technologies, Inc. sponsored ADR | 68,190 | 423,460 | |
| indie Semiconductor, Inc. (a) | 51,652 | 301,131 | |
| Infineon Technologies AG | 27,961 | 848,390 | |
| Lattice Semiconductor Corp. (a) | 15,374 | 997,465 | |
| Lx Semicon Co. Ltd. | 6,800 | 385,575 | |
| NVIDIA Corp. | 5,532 | 808,446 | |
| NXP Semiconductors NV | 10,527 | 1,663,584 | |
| onsemi (a) | 21,951 | 1,369,084 | |
| Renesas Electronics Corp. (a) | 94,500 | 847,632 | |
| SiTime Corp. (a) | 5,814 | 590,819 | |
| Skyworks Solutions, Inc. | 13,348 | 1,216,403 | |
| STMicroelectronics NV (Italy) | 38,848 | 1,368,405 | |
| Wolfspeed, Inc. (a) | 13,057 | 901,455 | |
| 13,134,959 | |||
TOTAL INFORMATION TECHNOLOGY | 14,528,681 | ||
| MATERIALS - 7.7% | |||
| Chemicals - 4.1% | |||
| Chunbo Co. Ltd. | 2,674 | 461,632 | |
| Livent Corp. (a) | 33,371 | 663,082 | |
| SK IE Technology Co. Ltd. (a)(b) | 11,653 | 488,422 | |
| 1,613,136 | |||
| Metals & Mining - 3.6% | |||
| Allkem Ltd. (a) | 99,474 | 758,231 | |
| Ganfeng Lithium Group Co. Ltd. (H Shares) (b) | 91,880 | 686,309 | |
| 1,444,540 | |||
TOTAL MATERIALS | 3,057,676 | ||
| TOTAL COMMON STOCKS (Cost $56,766,774) | 39,551,735 | ||
| TOTAL INVESTMENT IN SECURITIES - 99.9% (Cost $56,766,774) | 39,551,735 |
NET OTHER ASSETS (LIABILITIES) - 0.1% | 41,142 |
| NET ASSETS - 100.0% | 39,592,877 |
| (a) | Non-income producing |
| (b) | Security exempt from registration under Rule 144A of the Securities Act of 1933. These securities may be resold in transactions exempt from registration, normally to qualified institutional buyers. At the end of the period, the value of these securities amounted to $1,797,198 or 4.5% of net assets. |
| Affiliate | Value, beginning of period ($) | Purchases ($) | Sales Proceeds ($) | Dividend Income ($) | Realized Gain (loss) ($) | Change in Unrealized appreciation (depreciation) ($) | Value, end of period ($) | % ownership, end of period |
| Fidelity Cash Central Fund 4.37% | - | 2,243,076 | 2,243,076 | 202 | - | - | - | 0.0% |
| Total | - | 2,243,076 | 2,243,076 | 202 | - | - | - | |
| Valuation Inputs at Reporting Date: | ||||
| Description | Total ($) | Level 1 ($) | Level 2 ($) | Level 3 ($) |
Investments in Securities: | ||||
| Equities: | ||||
Consumer Discretionary | 14,974,273 | 14,351,806 | 622,467 | - |
Industrials | 6,991,105 | 6,991,105 | - | - |
Information Technology | 14,528,681 | 11,464,254 | 3,064,427 | - |
Materials | 3,057,676 | 1,613,136 | 1,444,540 | - |
| Total Investments in Securities: | 39,551,735 | 34,420,301 | 5,131,434 | - |
| Statement of Assets and Liabilities | ||||
December 31, 2022 (Unaudited) | ||||
| Assets | ||||
Investment in securities, at value - See accompanying schedule Unaffiliated issuers (cost $56,766,774): | $ | 39,551,735 | ||
| Cash | 17,217 | |||
| Foreign currency held at value (cost $298) | 299 | |||
| Dividends receivable | 37,470 | |||
| Distributions receivable from Fidelity Central Funds | 20 | |||
Total assets | 39,606,741 | |||
| Liabilities | ||||
| Accrued management fee | 13,864 | |||
| Total Liabilities | 13,864 | |||
| Net Assets | $ | 39,592,877 | ||
| Net Assets consist of: | ||||
| Paid in capital | $ | 66,823,551 | ||
| Total accumulated earnings (loss) | (27,230,674) | |||
| Net Assets | $ | 39,592,877 | ||
Net Asset Value , offering price and redemption price per share ($39,592,877 ÷ 2,600,000 shares) | $ | 15.23 | ||
| Statement of Operations | ||||
Six months ended December 31, 2022 (Unaudited) | ||||
| Investment Income | ||||
| Dividends | $ | 124,559 | ||
| Income from Fidelity Central Funds | 202 | |||
| Total Income | 124,761 | |||
| Expenses | ||||
| Management fee | $ | 82,683 | ||
| Independent trustees' fees and expenses | 73 | |||
| Total expenses before reductions | 82,756 | |||
| Expense reductions | (24) | |||
| Total expenses after reductions | 82,732 | |||
| Net Investment income (loss) | 42,029 | |||
| Realized and Unrealized Gain (Loss) | ||||
| Net realized gain (loss) on: | ||||
| Investment Securities: | ||||
| Unaffiliated issuers | (5,705,943) | |||
| Foreign currency transactions | (5,701) | |||
| Total net realized gain (loss) | (5,711,644) | |||
| Change in net unrealized appreciation (depreciation) on: | ||||
| Investment Securities: | ||||
| Unaffiliated issuers | (1,058,200) | |||
| Assets and liabilities in foreign currencies | 211 | |||
| Total change in net unrealized appreciation (depreciation) | (1,057,989) | |||
| Net gain (loss) | (6,769,633) | |||
| Net increase (decrease) in net assets resulting from operations | $ | (6,727,604) | ||
| Statement of Changes in Net Assets | ||||
Six months ended December 31, 2022 (Unaudited) | For the period October 5, 2021 (commencement of operations) through June 30, 2022 | |||
| Increase (Decrease) in Net Assets | ||||
| Operations | ||||
| Net investment income (loss) | $ | 42,029 | $ | 67,784 |
| Net realized gain (loss) | (5,711,644) | (3,782,899) | ||
| Change in net unrealized appreciation (depreciation) | (1,057,989) | (16,156,923) | ||
| Net increase (decrease) in net assets resulting from operations | (6,727,604) | (19,872,038) | ||
| Distributions to shareholders | (71,400) | (64,350) | ||
| Share transactions | ||||
| Proceeds from sales of shares | 8,074,078 | 62,232,758 | ||
| Cost of shares redeemed | - | (3,978,567) | ||
Net increase (decrease) in net assets resulting from share transactions | 8,074,078 | 58,254,191 | ||
| Total increase (decrease) in net assets | 1,275,074 | 38,317,803 | ||
| Net Assets | ||||
| Beginning of period | 38,317,803 | - | ||
| End of period | $ | 39,592,877 | $ | 38,317,803 |
| Other Information | ||||
| Shares | ||||
| Sold | 450,000 | 2,300,000 | ||
| Redeemed | - | (150,000) | ||
| Net increase (decrease) | 450,000 | 2,150,000 | ||
| Fidelity® Electric Vehicles and Future Transportation ETF |
Six months ended (Unaudited) December 31, 2022 | Years ended June 30, 2022 A | |||
Selected Per-Share Data | ||||
| Net asset value, beginning of period | $ | 17.82 | $ | 25.20 |
| Income from Investment Operations | ||||
Net investment income (loss) B,C | .02 | .04 | ||
| Net realized and unrealized gain (loss) | (2.58) | (7.39) | ||
| Total from investment operations | (2.56) | (7.35) | ||
| Distributions from net investment income | (.03) | (.03) | ||
| Total distributions | (.03) | (.03) | ||
| Net asset value, end of period | $ | 15.23 | $ | 17.82 |
Total Return D,E,F | (14.41)% | (29.15)% | ||
Ratios to Average Net Assets C,G,H | ||||
| Expenses before reductions | .39% I | .39% | ||
| Expenses net of fee waivers, if any | .39% I | .39% | ||
| Expenses net of all reductions | .39% I | .39% | ||
| Net investment income (loss) | .20% I | .25% | ||
| Supplemental Data | ||||
| Net assets, end of period (000 omitted) | $ | 39,593 | $ | 38,318 |
Portfolio turnover rate J,K | 77% I | 31% L |
Top Holdings (% of Fund's net assets) | ||
| Tencent Holdings Ltd. | 5.2 | |
| Meta Platforms, Inc. Class A | 4.6 | |
| Adobe, Inc. | 4.5 | |
| Apple, Inc. | 4.0 | |
| Alphabet, Inc. Class A | 4.0 | |
| NVIDIA Corp. | 3.9 | |
| Nintendo Co. Ltd. | 3.9 | |
| NetEase, Inc. ADR | 3.3 | |
| Electronic Arts, Inc. | 3.3 | |
| Dassault Systemes SA | 3.0 | |
| 39.7 | ||
| Market Sectors (% of Fund's net assets) | ||
| Communication Services | 61.4 | |
| Information Technology | 34.9 | |
| Industrials | 2.7 | |
| Consumer Discretionary | 0.8 | |
Asset Allocation (% of Fund's net assets) |
|
Foreign investments - 53% |
Futures - 0.2% |
Geographic Diversification (% of Fund's net assets) |
 |
* Includes Short-Term investments and Net Other Assets (Liabilities). Percentages are based on country or territory of incorporation and are adjusted for the effect of derivatives, if applicable. |
| Common Stocks - 99.8% | |||
| Shares | Value ($) | ||
| COMMUNICATION SERVICES - 61.4% | |||
| Entertainment - 39.8% | |||
| Capcom Co. Ltd. | 7,100 | 226,541 | |
| Com2uS Corp. | 1,953 | 92,051 | |
| Electronic Arts, Inc. | 3,204 | 391,465 | |
| Embracer Group AB (a) | 43,633 | 198,033 | |
| GungHo Online Entertainment, Inc. | 7,800 | 126,034 | |
| iDreamSky Technology Holdings Ltd. (a)(b) | 179,600 | 89,053 | |
| Kakao Games Corp. (a) | 4,437 | 156,672 | |
| Koei Tecmo Holdings Co. Ltd. | 9,400 | 170,410 | |
| Konami Group Corp. | 4,600 | 208,132 | |
| KRAFTON, Inc. (a) | 1,386 | 184,142 | |
| NCSOFT Corp. | 644 | 228,163 | |
| Neowiz (a) | 3,093 | 90,381 | |
| NetEase, Inc. ADR | 5,534 | 401,934 | |
| Netmarble Corp. (b) | 3,310 | 158,105 | |
| Nexon Co. Ltd. | 12,900 | 289,589 | |
| Nintendo Co. Ltd. | 11,200 | 469,577 | |
| Pearl Abyss Corp. (a) | 4,047 | 134,260 | |
| Roblox Corp. (a) | 8,863 | 252,241 | |
| Square Enix Holdings Co. Ltd. | 4,500 | 209,064 | |
| Take-Two Interactive Software, Inc. (a) | 3,102 | 323,011 | |
| Ubisoft Entertainment SA (a) | 6,242 | 175,937 | |
| WeMade Entertainment Co. Ltd. | 3,620 | 90,321 | |
| XD, Inc. (a) | 42,200 | 116,787 | |
| 4,781,903 | |||
| Interactive Media & Services - 21.6% | |||
| Alphabet, Inc. Class A (a) | 5,488 | 484,206 | |
| Bumble, Inc. (a) | 6,569 | 138,277 | |
| GREE, Inc. | 16,300 | 85,981 | |
| Meitu, Inc. (a)(b) | 628,500 | 110,320 | |
| Meta Platforms, Inc. Class A (a) | 4,601 | 553,684 | |
| NAVER Corp. | 2,492 | 349,806 | |
| Snap, Inc. Class A (a) | 26,604 | 238,106 | |
| Tencent Holdings Ltd. | 14,600 | 624,791 | |
| 2,585,171 | |||
TOTAL COMMUNICATION SERVICES | 7,367,074 | ||
| CONSUMER DISCRETIONARY - 0.8% | |||
| Leisure Products - 0.8% | |||
| Golfzon Co. Ltd. | 1,046 | 93,309 | |
| INDUSTRIALS - 2.7% | |||
| Aerospace & Defense - 2.7% | |||
| Maxar Technologies, Inc. | 6,384 | 330,308 | |
| INFORMATION TECHNOLOGY - 34.9% | |||
| IT Services - 3.3% | |||
| GDS Holdings Ltd. ADR (a) | 10,365 | 213,726 | |
| NEXTDC Ltd. (a) | 28,689 | 177,045 | |
| 390,771 | |||
| Semiconductors & Semiconductor Equipment - 8.4% | |||
| ams-OSRAM AG (a) | 19,946 | 145,520 | |
| Cirrus Logic, Inc. (a) | 2,775 | 206,682 | |
| NVIDIA Corp. | 3,235 | 472,763 | |
| Synaptics, Inc. (a) | 1,976 | 188,036 | |
| 1,013,001 | |||
| Software - 17.6% | |||
| Adobe, Inc. (a) | 1,610 | 541,813 | |
| Aveva Group PLC | 5,590 | 216,049 | |
| Bentley Systems, Inc. Class B | 6,414 | 237,061 | |
| Dassault Systemes SA | 10,048 | 359,191 | |
| Matterport, Inc. (a) | 35,245 | 98,686 | |
| Nemetschek SE | 3,507 | 178,496 | |
| PTC, Inc. (a) | 2,412 | 289,536 | |
| Unity Software, Inc. (a) | 6,593 | 188,494 | |
| 2,109,326 | |||
| Technology Hardware, Storage & Peripherals - 5.6% | |||
| Apple, Inc. | 3,737 | 485,548 | |
| Super Micro Computer, Inc. (a) | 2,282 | 187,352 | |
| 672,900 | |||
TOTAL INFORMATION TECHNOLOGY | 4,185,998 | ||
| TOTAL COMMON STOCKS (Cost $13,792,220) | 11,976,689 | ||
| Money Market Funds - 0.1% | |||
| Shares | Value ($) | ||
Fidelity Cash Central Fund 4.37% (c) (Cost $18,299) | 18,296 | 18,299 | |
| TOTAL INVESTMENT IN SECURITIES - 99.9% (Cost $13,810,519) | 11,994,988 |
NET OTHER ASSETS (LIABILITIES) - 0.1% | 11,207 |
| NET ASSETS - 100.0% | 12,006,195 |
| Futures Contracts | |||||
Number of contracts | Expiration Date | Notional Amount ($) | Value ($) | Unrealized Appreciation/ (Depreciation) ($) | |
| Purchased | |||||
| Equity Index Contracts | |||||
| CME E-mini NASDAQ 100 Index Contracts (United States) | 1 | Mar 2023 | 22,045 | (672) | (672) |
| The notional amount of futures purchased as a percentage of Net Assets is 0.2% | |||||
| (a) | Non-income producing |
| (b) | Security exempt from registration under Rule 144A of the Securities Act of 1933. These securities may be resold in transactions exempt from registration, normally to qualified institutional buyers. At the end of the period, the value of these securities amounted to $357,478 or 3.0% of net assets. |
| (c) | Affiliated fund that is generally available only to investment companies and other accounts managed by Fidelity Investments. The rate quoted is the annualized seven-day yield of the fund at period end. A complete unaudited listing of the fund's holdings as of its most recent quarter end is available upon request. In addition, each Fidelity Central Fund's financial statements are available on the SEC's website or upon request. |
| Affiliate | Value, beginning of period ($) | Purchases ($) | Sales Proceeds ($) | Dividend Income ($) | Realized Gain (loss) ($) | Change in Unrealized appreciation (depreciation) ($) | Value, end of period ($) | % ownership, end of period |
| Fidelity Cash Central Fund 4.37% | - | 123,587 | 105,288 | 147 | - | - | 18,299 | 0.0% |
| Total | - | 123,587 | 105,288 | 147 | - | - | 18,299 | |
| Valuation Inputs at Reporting Date: | ||||
| Description | Total ($) | Level 1 ($) | Level 2 ($) | Level 3 ($) |
Investments in Securities: | ||||
| Equities: | ||||
Communication Services | 7,367,074 | 4,575,178 | 2,791,896 | - |
Consumer Discretionary | 93,309 | 93,309 | - | - |
Industrials | 330,308 | 330,308 | - | - |
Information Technology | 4,185,998 | 3,649,762 | 536,236 | - |
| Money Market Funds | 18,299 | 18,299 | - | - |
| Total Investments in Securities: | 11,994,988 | 8,666,856 | 3,328,132 | - |
Derivative Instruments: | ||||
| Liabilities | ||||
Futures Contracts | (672) | (672) | - | - |
| Total Liabilities | (672) | (672) | - | - |
| Total Derivative Instruments: | (672) | (672) | - | - |
Primary Risk Exposure / Derivative Type | Value | |
| Asset ($) | Liability ($) | |
| Equity Risk | ||
Futures Contracts (a) | 0 | (672) |
| Total Equity Risk | 0 | (672) |
| Total Value of Derivatives | 0 | (672) |
| Statement of Assets and Liabilities | ||||
December 31, 2022 (Unaudited) | ||||
| Assets | ||||
| Investment in securities, at value - See accompanying schedule: | $ | |||
Unaffiliated issuers (cost $13,792,220) | 11,976,689 | |||
Fidelity Central Funds (cost $18,299) | 18,299 | |||
| Total Investment in Securities (cost $13,810,519) | $ | 11,994,988 | ||
| Segregated cash with brokers for derivative instruments | 1,580 | |||
| Foreign currency held at value (cost $12,189) | 12,172 | |||
| Receivable for investments sold | 7 | |||
| Dividends receivable | 12,589 | |||
| Distributions receivable from Fidelity Central Funds | 53 | |||
Total assets | 12,021,389 | |||
| Liabilities | ||||
| Payable for investments purchased | 11,279 | |||
| Accrued management fee | 3,894 | |||
| Payable for daily variation margin on futures contracts | 21 | |||
| Total Liabilities | 15,194 | |||
| Net Assets | $ | 12,006,195 | ||
| Net Assets consist of: | ||||
| Paid in capital | $ | 14,348,282 | ||
| Total accumulated earnings (loss) | (2,342,087) | |||
| Net Assets | $ | 12,006,195 | ||
Net Asset Value , offering price and redemption price per share ($12,006,195 ÷ 600,000 shares) | $ | 20.01 | ||
| Statement of Operations | ||||
Six months ended December 31, 2022 (Unaudited) | ||||
| Investment Income | ||||
| Dividends | $ | 33,191 | ||
| Income from Fidelity Central Funds | 147 | |||
| Total Income | 33,338 | |||
| Expenses | ||||
| Management fee | $ | 23,305 | ||
| Independent trustees' fees and expenses | 20 | |||
| Total expenses before reductions | 23,325 | |||
| Expense reductions | (86) | |||
| Total expenses after reductions | 23,239 | |||
| Net Investment income (loss) | 10,099 | |||
| Realized and Unrealized Gain (Loss) | ||||
| Net realized gain (loss) on: | ||||
| Investment Securities: | ||||
| Unaffiliated issuers | (327,046) | |||
| Foreign currency transactions | (3,570) | |||
| Futures contracts | (2,296) | |||
| Total net realized gain (loss) | (332,912) | |||
| Change in net unrealized appreciation (depreciation) on: | ||||
| Investment Securities: | ||||
| Unaffiliated issuers | (528,163) | |||
| Assets and liabilities in foreign currencies | 168 | |||
| Futures contracts | (349) | |||
| Total change in net unrealized appreciation (depreciation) | (528,344) | |||
| Net gain (loss) | (861,256) | |||
| Net increase (decrease) in net assets resulting from operations | $ | (851,157) | ||
| Statement of Changes in Net Assets | ||||
Six months ended December 31, 2022 (Unaudited) | For the period April 19, 2022 (commencement of operations) through June 30, 2022 | |||
| Increase (Decrease) in Net Assets | ||||
| Operations | ||||
| Net investment income (loss) | $ | 10,099 | $ | 214 |
| Net realized gain (loss) | (332,912) | (123,480) | ||
| Change in net unrealized appreciation (depreciation) | (528,344) | (1,287,738) | ||
| Net increase (decrease) in net assets resulting from operations | (851,157) | (1,411,004) | ||
| Distributions to shareholders | (22,200) | - | ||
| Share transactions | ||||
| Proceeds from sales of shares | 2,221,577 | 13,140,454 | ||
| Cost of shares redeemed | - | (1,071,475) | ||
Net increase (decrease) in net assets resulting from share transactions | 2,221,577 | 12,068,979 | ||
| Total increase (decrease) in net assets | 1,348,220 | 10,657,975 | ||
| Net Assets | ||||
| Beginning of period | 10,657,975 | - | ||
| End of period | $ | 12,006,195 | $ | 10,657,975 |
| Other Information | ||||
| Shares | ||||
| Sold | 100,000 | 550,000 | ||
| Redeemed | - | (50,000) | ||
| Net increase (decrease) | 100,000 | 500,000 | ||
| Fidelity® Metaverse ETF |
Six months ended (Unaudited) December 31, 2022 | Years ended June 30, 2022 A | |||
Selected Per-Share Data | ||||
| Net asset value, beginning of period | $ | 21.32 | $ | 25.28 |
| Income from Investment Operations | ||||
Net investment income (loss) B,C | .02 | - D | ||
| Net realized and unrealized gain (loss) | (1.29) | (3.96) | ||
| Total from investment operations | (1.27) | (3.96) | ||
| Distributions from net investment income | (.04) | - | ||
| Total distributions | (.04) | - | ||
| Net asset value, end of period | $ | 20.01 | $ | 21.32 |
Total Return E,F,G | (5.95)% | (15.67)% | ||
Ratios to Average Net Assets C,H,I | ||||
| Expenses before reductions | .39% J | .39% | ||
| Expenses net of fee waivers, if any | .39% J | .39% | ||
| Expenses net of all reductions | .38% J | .39% | ||
| Net investment income (loss) | .17% J | .01% | ||
| Supplemental Data | ||||
| Net assets, end of period (000 omitted) | $ | 12,006 | $ | 10,658 |
Portfolio turnover rate K,L | 37% J | 8% M |
| Fidelity Central Fund | Investment Manager | Investment Objective | Investment Practices | Expense Ratio A |
| Fidelity Money Market Central Funds | Fidelity Management & Research Company LLC (FMR) | Each fund seeks to obtain a high level of current income consistent with the preservation of capital and liquidity. | Short-term Investments | Less than .005% |
| Tax cost | Gross unrealized appreciation | Gross unrealized depreciation | Net unrealized appreciation (depreciation) | |
| Fidelity Clean Energy ETF | $ 41,841,184 | $ 3,109,258 | $ (6,970,310) | $ (3,861,052) |
| Fidelity Cloud Computing ETF | 30,013,296 | 554,577 | (9,842,845) | (9,288,268) |
| Fidelity Crypto Industry and Digital Payments ETF | 24,117,884 | 419,819 | (7,743,272) | (7,323,453) |
| Fidelity Digital Health ETF | 12,087,387 | 569,530 | (3,366,773) | (2,797,243) |
| Fidelity Electric Vehicles and Future Transportation ETF | 56,982,937 | 1,097,598 | (18,528,800) | (17,431,202) |
| Fidelity Metaverse ETF | 13,824,370 | 578,494 | (2,408,548) | (1,830,054) |
Short-term | Long-term | Total capital loss carryforward | |
| Fidelity Clean Energy ETF | $ (963,004) | $ - | $ (963,004) |
| Fidelity Cloud Computing ETF | (1,007,817) | - | (1,007,817) |
| Fidelity Crypto Industry and Digital Payments ETF | (857,128) | - | (857,128) |
| Fidelity Digital Health ETF | (118,201) | - | (118,201) |
| Fidelity Electric Vehicles and Future Transportation ETF | (3,904,483) | - | (3,904,483) |
| Fidelity Metaverse ETF | (175,908) | (193) | (176,101) |
Ordinary losses | |
| Fidelity Clean Energy ETF | $(8,013) |
| Fidelity Digital Health ETF | (2,724) |
| Equity Risk | Equity risk relates to the fluctuations in the value of financial instruments as a result of changes in market prices (other than those arising from interest rate risk or foreign exchange risk), whether caused by factors specific to an individual investment, its issuer, or all factors affecting all instruments traded in a market or market segment. |
| Purchases ($) | Sales ($) | |
| Fidelity Clean Energy ETF | 11,300,111 | 8,827,006 |
| Fidelity Cloud Computing ETF | 3,074,487 | 2,661,708 |
| Fidelity Crypto Industry and Digital Payments ETF | 3,938,964 | 3,823,182 |
| Fidelity Digital Health ETF | 2,185,105 | 1,844,901 |
| Fidelity Electric Vehicles and Future Transportation ETF | 17,527,196 | 15,862,748 |
| Fidelity Metaverse ETF | 2,446,840 | 2,151,230 |
| In-Kind Subscriptions($) | In-Kind Redemptions ($) | |
| Fidelity Clean Energy ETF | 7,797,700 | - |
| Fidelity Cloud Computing ETF | 4,017,473 | - |
| Fidelity Crypto Industry and Digital Payments ETF | 9,556,112 | 1,258,592 |
| Fidelity Electric Vehicles and Future Transportation ETF | 6,337,894 | - |
| Fidelity Metaverse ETF | 1,907,247 | - |
| Fee Rate | |
| Fidelity Clean Energy ETF | .39% |
| Fidelity Cloud Computing ETF | .39% |
| Fidelity Crypto Industry and Digital Payments ETF | .39% |
| Fidelity Digital Health ETF | .39% |
| Fidelity Electric Vehicles and Future Transportation ETF | .39% |
| Fidelity Metaverse ETF | .39% |
| Custodian credits | |
| Fidelity Clean Energy ETF | $29 |
| Fidelity Cloud Computing ETF | 75 |
Fidelity Crypto Industry and Digital Payments ETF | 98 |
| Fidelity Digital Health ETF | 8 |
Fidelity Electric Vehicles and Future Transportation ETF | 24 |
| Fidelity Metaverse ETF | 86 |
| The Example is based on an investment of $1,000 invested at the beginning of the period and held for the entire period (July 1, 2022 to December 31, 2022). |
Annualized Expense Ratio- A | Beginning Account Value July 1, 2022 | Ending Account Value December 31, 2022 | Expenses Paid During Period- C July 1, 2022 to December 31, 2022 | |||||||
| Fidelity® Clean Energy ETF | .39% | |||||||||
| Actual | $ 1,000 | $ 1,038.40 | $ 2.00 | |||||||
Hypothetical- B | $ 1,000 | $ 1,023.24 | $ 1.99 | |||||||
| Fidelity® Cloud Computing ETF | .39% | |||||||||
| Actual | $ 1,000 | $ 932.90 | $ 1.90 | |||||||
Hypothetical- B | $ 1,000 | $ 1,023.24 | $ 1.99 | |||||||
| Fidelity® Crypto Industry and Digital Payments ETF | .39% | |||||||||
| Actual | $ 1,000 | $ 848.70 | $ 1.82 | |||||||
Hypothetical- B | $ 1,000 | $ 1,023.24 | $ 1.99 | |||||||
| Fidelity® Digital Health ETF | .39% | |||||||||
| Actual | $ 1,000 | $ 1,001.70 | $ 1.97 | |||||||
Hypothetical- B | $ 1,000 | $ 1,023.24 | $ 1.99 | |||||||
| Fidelity® Electric Vehicles and Future Transportation ETF | .39% | |||||||||
| Actual | $ 1,000 | $ 855.90 | $ 1.82 | |||||||
Hypothetical- B | $ 1,000 | $ 1,023.24 | $ 1.99 | |||||||
| Fidelity® Metaverse ETF | .39% | |||||||||
| Actual | $ 1,000 | $ 940.50 | $ 1.91 | |||||||
Hypothetical- B | $ 1,000 | $ 1,023.24 | $ 1.99 | |||||||
|
Item 2.
Code of Ethics
Not applicable.
Item 3.
Audit Committee Financial Expert
Not applicable.
Item 4.
Principal Accountant Fees and Services
Not applicable.
Item 5.
Audit Committee of Listed Registrants
Not applicable.
Item 6.
Investments
(a)
Not applicable.
(b)
Not applicable
Item 7.
Disclosure of Proxy Voting Policies and Procedures for Closed-End Management Investment Companies
Not applicable.
Item 8.
Portfolio Managers of Closed-End Management Investment Companies
Not applicable.
Item 9.
Purchase of Equity Securities by Closed-End Management Investment Company and Affiliated Purchasers
Not applicable.
Item 10.
Submission of Matters to a Vote of Security Holders
There were no material changes to the procedures by which shareholders may recommend nominees to the Fidelity Covington Trust ’s Board of Trustees.
Item 11.
Controls and Procedures
(a)(i) The President and Treasurer and the Chief Financial Officer have concluded that the Fidelity Covington Trust ’s (the “Trust ”) disclosure controls and procedures (as
defined in Rule 30a-3(c) under the Investment Company Act) provide reasonable assurances that material information relating to the Trust is made known to them by the appropriate persons, based on their evaluation of these controls and procedures as of a date within 90 days of the filing date of this report.
(a)(ii) There was no change in the Trust ’s internal control over financial reporting (as defined in Rule 30a-3(d) under the Investment Company Act) that occurred during the period covered by this report that has materially affected, or is reasonably likely to materially affect, the Trust ’s internal control over financial reporting.
Item 12.
Disclosure of Securities Lending Activities for Closed-End Management
Investment Companies
Not applicable.
Item 13.
Exhibits
(a) | (1) | Not applicable. |
(a) | (2) | |
(a) | (3) | Not applicable. |
(b) |
SIGNATURES
Pursuant to the requirements of the Securities Exchange Act of 1934 and the Investment Company Act of 1940, the registrant has duly caused this report to be signed on its behalf by the undersigned, thereunto duly authorized.
Fidelity Covington Trust
By: | /s/Stacie M. Smith |
Stacie M. Smith | |
President and Treasurer | |
Date: | February 21, 2023 |
Pursuant to the requirements of the Securities Exchange Act of 1934 and the Investment Company Act of 1940, this report has been signed below by the following persons on behalf of the registrant and in the capacities and on the dates indicated.
By: | /s/Stacie M. Smith |
Stacie M. Smith | |
President and Treasurer | |
Date: | February 21, 2023 |
By: | /s/John J. Burke III |
John J. Burke III | |
Chief Financial Officer | |
Date: | February 21, 2023 |