UNITED STATES
SECURITIES AND EXCHANGE COMMISSION
Washington, D.C. 20549
FORM N-CSR
CERTIFIED SHAREHOLDER REPORT OF REGISTERED
MANAGEMENT INVESTMENT COMPANIES
Investment Company Act file number 811-07319
Fidelity Covington Trust
(Exact name of registrant as specified in charter)
245 Summer St., Boston, Massachusetts 02210
(Address of principal executive offices) (Zip code)
Margaret Carey, Secretary
245 Summer St.
Boston, Massachusetts 02210
(Name and address of agent for service)
Registrant's telephone number, including area code:
617-563-7000
Date of fiscal year end: | August 31 |
Date of reporting period: | August 31, 2023 |
Item 1. Reports to Stockholders


Contents
| Average Annual Total Returns | |||
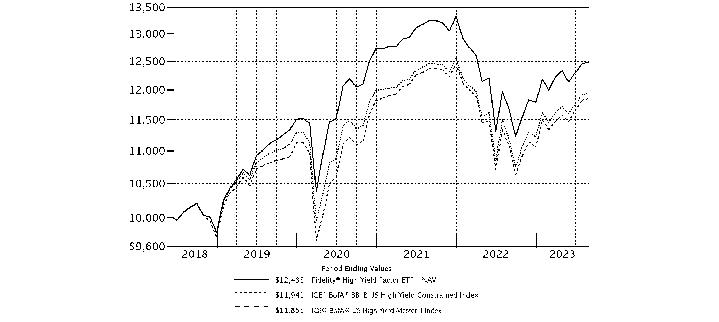
Periods ended August 31, 2023 | Past 1 year | Past 5 years | Life of Fund |
Fidelity® High Yield Factor ETF - NAV A | 6.90% | 4.21% | 4.34% |
Fidelity® High Yield Factor ETF - Market Price B | 7.63% | 4.20% | 4.30% |
ICE® BofA® BB-B US High Yield Constrained Index A | 6.72% | 3.31% | 3.46% |
ICE® BofA® US High Yield Master II Index A | 7.01% | 3.16% | 3.31% |
| $10,000 Over Life of Fund |
Let's say hypothetically that $10,000 was invested in Fidelity® High Yield Factor ETF - NAV, on June 12, 2018, when the fund started. The chart shows how the value of your investment would have changed, and also shows how the ICE® BofA® BB-B US High Yield Constrained Index and ICE® BofA® US High Yield Master II Index performed over the same period. |
 |
| Top Bond Issuers (% of Fund's net assets) | ||
(with maturities greater than one year) | ||
| TransDigm, Inc. | 3.3 | |
| Royal Caribbean Cruises Ltd. | 2.3 | |
| Ford Motor Credit Co. LLC | 2.2 | |
| FMG Resources Pty Ltd. | 2.1 | |
| CCO Holdings LLC/CCO Holdings Capital Corp. | 1.7 | |
| Carnival Corp. | 1.6 | |
| Mineral Resources Ltd. | 1.6 | |
| Performance Food Group, Inc. | 1.6 | |
| LPL Holdings, Inc. | 1.4 | |
| Asbury Automotive Group, Inc. | 1.4 | |
| 19.2 | ||
| Market Sectors (% of Fund's net assets) | ||
| Energy | 16.7 | |
| Diversified Financial Services | 5.8 | |
| Metals/Mining | 5.5 | |
| Services | 5.2 | |
| Healthcare | 4.9 | |
Quality Diversification (% of Fund's net assets) |
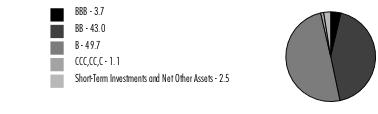 |
| We have used ratings from Moody's Investors Service, Inc. Where Moody's® ratings are not available, we have used S&P® ratings. All ratings are as of the date indicated and do not reflect subsequent changes. |
Asset Allocation (% of Fund's net assets) |
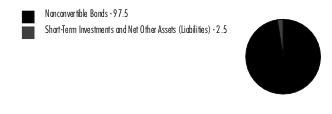 |
Geographic Diversification (% of Fund's net assets) |
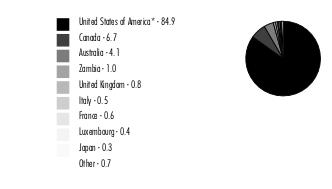 |
* Includes Short-Term investments and Net Other Assets (Liabilities). Percentages are adjusted for the effect of derivatives, if applicable. |
| Nonconvertible Bonds - 97.5% | |||
Principal Amount (a) | Value ($) | ||
| Aerospace - 4.4% | |||
| Bombardier, Inc.: | |||
| 7.5% 2/1/29 (b) | 1,572,000 | 1,540,380 | |
| 7.875% 4/15/27 (b) | 750,000 | 748,598 | |
| Hexcel Corp. 4.95% 8/15/25 | 269,000 | 262,348 | |
| TransDigm, Inc.: | |||
| 4.875% 5/1/29 | 3,982,000 | 3,582,948 | |
| 6.25% 3/15/26 (b) | 3,018,000 | 2,989,237 | |
| 6.875% 12/15/30 (b) | 3,000,000 | 3,019,800 | |
| VistaJet Malta Finance PLC / XO Management Holding, Inc. 9.5% 6/1/28 (b) | 500,000 | 461,401 | |
TOTAL AEROSPACE | 12,604,712 | ||
| Air Transportation - 1.7% | |||
| Air Canada 3.875% 8/15/26 (b) | 600,000 | 554,053 | |
| Allegiant Travel Co. 7.25% 8/15/27 (b) | 270,000 | 264,263 | |
| American Airlines, Inc.: | |||
| 7.25% 2/15/28 (b) | 215,000 | 211,198 | |
| 11.75% 7/15/25 (b) | 534,900 | 585,471 | |
| American Airlines, Inc. / AAdvantage Loyalty IP Ltd. 5.5% 4/20/26 (b) | 591,831 | 580,754 | |
| Bristow Group, Inc. 6.875% 3/1/28 (b) | 166,000 | 155,273 | |
| Rand Parent LLC 8.5% 2/15/30 (b) | 300,000 | 285,602 | |
| Spirit Loyalty Cayman Ltd. / Spirit IP Cayman Ltd. 8% 9/20/25 (b) | 1,102,000 | 1,103,284 | |
| United Airlines, Inc. 4.375% 4/15/26 (b) | 982,900 | 926,316 | |
| United Continental Holdings, Inc. 4.875% 1/15/25 | 369,000 | 359,971 | |
TOTAL AIR TRANSPORTATION | 5,026,185 | ||
| Automotive & Auto Parts - 3.6% | |||
| Allison Transmission, Inc. 3.75% 1/30/31 (b) | 3,214,000 | 2,684,542 | |
| Ford Motor Credit Co. LLC: | |||
| 3.37% 11/17/23 | 787,000 | 780,471 | |
| 4.687% 6/9/25 | 1,143,000 | 1,100,256 | |
| 6.8% 5/12/28 | 3,000,000 | 2,998,797 | |
| 6.95% 3/6/26 | 1,400,000 | 1,403,535 | |
| Gates Global LLC/Gates Global Co. 6.25% 1/15/26 (b) | 175,000 | 173,256 | |
| Jaguar Land Rover Automotive PLC 7.75% 10/15/25 (b) | 175,000 | 175,608 | |
| LCM Investments Holdings 8.25% 8/1/31 (b) | 165,000 | 165,106 | |
| Tenneco, Inc. 8% 11/17/28 (b) | 500,000 | 410,625 | |
| Thor Industries, Inc. 4% 10/15/29 (b) | 443,000 | 372,160 | |
TOTAL AUTOMOTIVE & AUTO PARTS | 10,264,356 | ||
| Banks & Thrifts - 0.8% | |||
| AG TTMT Escrow Issuer LLC 8.625% 9/30/27 (b) | 500,000 | 515,304 | |
| PennyMac Financial Services, Inc. 5.75% 9/15/31 (b) | 700,000 | 588,349 | |
| Quicken Loans LLC/Quicken Loans Co-Issuer, Inc. 3.625% 3/1/29 (b) | 1,200,000 | 1,021,359 | |
| UniCredit SpA 7.296% 4/2/34 (b)(c) | 89,693 | 86,276 | |
TOTAL BANKS & THRIFTS | 2,211,288 | ||
| Broadcasting - 4.8% | |||
| AMC Networks, Inc. 4.75% 8/1/25 | 300,000 | 281,207 | |
| Clear Channel Outdoor Holdings, Inc. 9% 9/15/28 (b) | 300,000 | 301,500 | |
| DISH Network Corp. 11.75% 11/15/27 (b) | 2,608,000 | 2,646,184 | |
| Gray Television, Inc. 7% 5/15/27 (b) | 955,000 | 857,169 | |
| iHeartCommunications, Inc. 4.75% 1/15/28 (b) | 500,000 | 385,350 | |
| Nexstar Media, Inc. 4.75% 11/1/28 (b) | 4,348,000 | 3,814,116 | |
| Sinclair Television Group, Inc. 4.125% 12/1/30 (b) | 500,000 | 322,220 | |
| Sirius XM Radio, Inc.: | |||
| 3.125% 9/1/26 (b) | 1,947,000 | 1,757,557 | |
| 3.875% 9/1/31 (b) | 1,000,000 | 778,310 | |
| TEGNA, Inc.: | |||
| 4.625% 3/15/28 | 1,500,000 | 1,339,745 | |
| 5% 9/15/29 | 500,000 | 440,000 | |
| Univision Communications, Inc.: | |||
| 7.375% 6/30/30 (b) | 505,000 | 488,753 | |
| 8% 8/15/28 (b) | 420,000 | 419,769 | |
TOTAL BROADCASTING | 13,831,880 | ||
| Building Materials - 0.6% | |||
| Beacon Roofing Supply, Inc. 6.5% 8/1/30 (b) | 290,000 | 286,474 | |
| Griffon Corp. 5.75% 3/1/28 | 600,000 | 559,202 | |
| Jeld-Wen, Inc. 4.625% 12/15/25 (b) | 235,000 | 227,821 | |
| Standard Industries, Inc./New Jersey 4.375% 7/15/30 (b) | 867,000 | 743,205 | |
TOTAL BUILDING MATERIALS | 1,816,702 | ||
| Cable/Satellite TV - 2.9% | |||
| CCO Holdings LLC/CCO Holdings Capital Corp.: | |||
| 4.25% 1/15/34 (b) | 1,211,000 | 927,380 | |
| 4.5% 8/15/30 (b) | 750,000 | 630,898 | |
| 4.5% 5/1/32 | 1,982,000 | 1,606,797 | |
| 6.375% 9/1/29 (b) | 1,821,000 | 1,723,953 | |
| CSC Holdings LLC: | |||
| 4.5% 11/15/31 (b) | 1,550,000 | 1,102,153 | |
| 11.25% 5/15/28 (b) | 500,000 | 493,162 | |
| DIRECTV Financing LLC / DIRECTV Financing Co-Obligor, Inc. 5.875% 8/15/27 (b) | 673,000 | 596,425 | |
| Dolya Holdco 18 DAC 5% 7/15/28 (b) | 450,000 | 397,820 | |
| Ziggo BV 4.875% 1/15/30 (b) | 1,000,000 | 840,551 | |
TOTAL CABLE/SATELLITE TV | 8,319,139 | ||
| Capital Goods - 0.8% | |||
| ATS Corp. 4.125% 12/15/28 (b) | 440,000 | 390,646 | |
| EnerSys 4.375% 12/15/27 (b) | 1,232,000 | 1,127,280 | |
| Patrick Industries, Inc. 4.75% 5/1/29 (b) | 897,000 | 766,935 | |
TOTAL CAPITAL GOODS | 2,284,861 | ||
| Chemicals - 1.9% | |||
| Avient Corp. 5.75% 5/15/25 (b) | 105,000 | 103,603 | |
| CVR Partners LP 6.125% 6/15/28 (b) | 320,000 | 286,486 | |
| INEOS Quattro Finance 2 PLC 3.375% 1/15/26 (b) | 480,000 | 438,737 | |
| Nufarm Australia Ltd. 5% 1/27/30 (b) | 455,000 | 404,720 | |
| Olin Corp. 5% 2/1/30 | 2,104,300 | 1,926,843 | |
| Olympus Water U.S. Holding Corp. 9.75% 11/15/28 (b) | 700,000 | 705,129 | |
| The Chemours Co. LLC 5.75% 11/15/28 (b) | 1,927,000 | 1,731,061 | |
TOTAL CHEMICALS | 5,596,579 | ||
| Consumer Products - 2.6% | |||
| BlueLinx Corp. 6% 11/15/29 (b) | 225,000 | 200,858 | |
| Ferrellgas LP/Ferrellgas Finance Corp. 5.375% 4/1/26 (b) | 556,000 | 522,657 | |
| Grubhub Holdings, Inc. 5.5% 7/1/27 (b) | 86,000 | 59,448 | |
| HFC Prestige Products, Inc./HFC Prestige International U.S. LLC 6.625% 7/15/30 (b) | 1,700,000 | 1,696,804 | |
| Newell Brands, Inc. 6.375% 9/15/27 | 300,000 | 293,891 | |
| Rakuten Group, Inc. 10.25% 11/30/24 (b) | 1,000,000 | 1,002,500 | |
| Tempur Sealy International, Inc. 3.875% 10/15/31 (b) | 3,015,000 | 2,422,971 | |
| TripAdvisor, Inc. 7% 7/15/25 (b) | 1,386,000 | 1,382,695 | |
TOTAL CONSUMER PRODUCTS | 7,581,824 | ||
| Containers - 0.9% | |||
| Ardagh Packaging Finance PLC/Ardagh MP Holdings U.S.A., Inc. 5.25% 4/30/25 (b) | 161,000 | 156,886 | |
| Ball Corp.: | |||
| 5.25% 7/1/25 | 263,000 | 259,333 | |
| 6.875% 3/15/28 | 750,000 | 761,242 | |
| BWAY Holding Co. 7.875% 8/15/26 (b) | 800,000 | 787,796 | |
| LABL, Inc. 9.5% 11/1/28 (b) | 300,000 | 308,781 | |
| Sealed Air Corp./Sealed Air Cor 6.125% 2/1/28 (b) | 390,000 | 383,205 | |
TOTAL CONTAINERS | 2,657,243 | ||
| Diversified Financial Services - 5.8% | |||
| BrightSphere Investment Group, Inc. 4.8% 7/27/26 | 1,687,000 | 1,610,048 | |
| Castlelake Aviation Finance 5% 4/15/27 (b) | 414,000 | 381,664 | |
| Coinbase Global, Inc. 3.625% 10/1/31 (b) | 500,000 | 336,620 | |
| Credit Acceptance Corp. 6.625% 3/15/26 | 1,462,000 | 1,423,023 | |
| Emerald Debt Merger Sub LLC 6.625% 12/15/30 (b) | 200,000 | 196,884 | |
| Enova International, Inc. 8.5% 9/15/25 (b) | 325,000 | 319,768 | |
| First Cash Financial Services, Inc. 5.625% 1/1/30 (b) | 3,023,000 | 2,744,374 | |
| Icahn Enterprises LP/Icahn Enterprises Finance Corp. 4.375% 2/1/29 | 1,203,000 | 949,582 | |
| Ladder Capital Finance Holdings LLLP/Ladder Capital Finance Corp. 4.75% 6/15/29 (b) | 498,000 | 418,674 | |
| LPL Holdings, Inc.: | |||
| 4% 3/15/29 (b) | 3,063,000 | 2,722,801 | |
| 4.375% 5/15/31 (b) | 1,679,000 | 1,475,004 | |
| MidCap Financial Issuer Trust 5.625% 1/15/30 (b) | 250,000 | 201,250 | |
| Nationstar Mortgage Holdings, Inc. 6% 1/15/27 (b) | 500,000 | 476,250 | |
| Navient Corp. 9.375% 7/25/30 | 700,000 | 703,129 | |
| OneMain Finance Corp.: | |||
| 3.875% 9/15/28 | 1,014,000 | 831,480 | |
| 6.625% 1/15/28 | 471,000 | 440,385 | |
| PRA Group, Inc. 8.375% 2/1/28 (b) | 337,000 | 307,687 | |
| StoneX Group, Inc. 8.625% 6/15/25 (b) | 1,225,000 | 1,240,423 | |
TOTAL DIVERSIFIED FINANCIAL SERVICES | 16,779,046 | ||
| Diversified Media - 0.5% | |||
| Lamar Media Corp. 3.625% 1/15/31 | 1,625,000 | 1,356,875 | |
| Energy - 16.7% | |||
| Aethon United BR LP / Aethon United Finance Corp. 8.25% 2/15/26 (b) | 185,000 | 185,925 | |
| AmeriGas Partners LP/AmeriGas Finance Corp. 9.375% 6/1/28 (b) | 500,000 | 512,515 | |
| Antero Midstream Partners LP/Antero Midstream Finance Corp. 5.375% 6/15/29 (b) | 633,000 | 593,150 | |
| Antero Resources Corp. 8.375% 7/15/26 (b) | 275,000 | 285,311 | |
| Baytex Energy Corp.: | |||
| 8.5% 4/30/30 (b) | 3,027,000 | 3,069,215 | |
| 8.75% 4/1/27 (b) | 145,000 | 148,389 | |
| Buckeye Partners LP 4.5% 3/1/28 (b) | 1,550,000 | 1,406,625 | |
| California Resources Corp. 7.125% 2/1/26 (b) | 140,000 | 140,360 | |
| Chord Energy Corp. 6.375% 6/1/26 (b) | 508,000 | 500,695 | |
| Citgo Petroleum Corp.: | |||
| 6.375% 6/15/26 (b) | 715,000 | 698,240 | |
| 7% 6/15/25 (b) | 624,000 | 617,760 | |
| Civitas Resources, Inc. 5% 10/15/26 (b) | 1,275,000 | 1,210,026 | |
| CNX Midstream Partners LP 4.75% 4/15/30 (b) | 403,000 | 347,765 | |
| Comstock Resources, Inc.: | |||
| 5.875% 1/15/30 (b) | 476,000 | 420,418 | |
| 6.75% 3/1/29 (b) | 600,000 | 561,406 | |
| Coronado Finance Pty Ltd. 10.75% 5/15/26 (b) | 160,000 | 165,578 | |
| CVR Energy, Inc. 5.75% 2/15/28 (b) | 3,113,000 | 2,833,826 | |
| Delek Logistics Partners LP 7.125% 6/1/28 (b) | 2,236,000 | 2,078,541 | |
| DT Midstream, Inc. 4.125% 6/15/29 (b) | 800,000 | 708,735 | |
| Energy Ventures GoM LLC / EnVen Finance Corp. 11.75% 4/15/26 (b) | 160,000 | 165,929 | |
| EnLink Midstream LLC 6.5% 9/1/30 (b) | 300,000 | 300,767 | |
| EQM Midstream Partners LP 7.5% 6/1/27 (b) | 750,000 | 756,986 | |
| Genesis Energy LP/Genesis Energy Finance Corp. 8.875% 4/15/30 | 600,000 | 597,593 | |
| Harvest Midstream I LP 7.5% 9/1/28 (b) | 50,000 | 50,110 | |
| Hilcorp Energy I LP/Hilcorp Finance Co. 6.25% 11/1/28 (b) | 500,000 | 482,338 | |
| Holly Energy Partners LP/Holly Energy Finance Corp. 5% 2/1/28 (b) | 460,000 | 431,510 | |
| Howard Midstream Energy Partners LLC 8.875% 7/15/28 (b) | 500,000 | 517,795 | |
| Independence Energy Finance LLC: | |||
| 7.25% 5/1/26 (b) | 402,000 | 396,018 | |
| 9.25% 2/15/28 (b) | 500,000 | 511,485 | |
| Matador Resources Co.: | |||
| 5.875% 9/15/26 | 165,300 | 161,223 | |
| 6.875% 4/15/28 (b) | 1,976,000 | 1,972,876 | |
| Moss Creek Resources Holdings, Inc. 7.5% 1/15/26 (b) | 362,000 | 346,513 | |
| Murphy Oil Corp. 5.75% 8/15/25 | 543,000 | 536,379 | |
| Nabors Industries, Inc. 7.375% 5/15/27 (b) | 200,000 | 195,180 | |
| New Fortress Energy, Inc. 6.5% 9/30/26 (b) | 3,849,000 | 3,577,733 | |
| Northern Oil & Gas, Inc.: | |||
| 8.125% 3/1/28 (b) | 306,000 | 306,737 | |
| 8.75% 6/15/31 (b) | 2,000,000 | 2,043,037 | |
| NuStar Logistics LP 5.625% 4/28/27 | 160,000 | 155,240 | |
| Oceaneering International, Inc. 4.65% 11/15/24 | 301,000 | 294,709 | |
| Patterson-UTI Energy, Inc. 5.15% 11/15/29 | 270,000 | 248,802 | |
| PBF Holding Co. LLC/PBF Finance Corp.: | |||
| 6% 2/15/28 | 465,000 | 439,848 | |
| 7.875% 9/15/30 (b) | 450,000 | 447,773 | |
| Perenti Finance Pty Ltd. 6.5% 10/7/25 (b) | 530,000 | 514,895 | |
| Range Resources Corp. 8.25% 1/15/29 | 599,000 | 621,852 | |
| Rockies Express Pipeline LLC 4.8% 5/15/30 (b) | 504,000 | 440,291 | |
| Seadrill Finance Ltd. 8.375% 8/1/30 (b) | 120,000 | 123,000 | |
| SM Energy Co. 6.75% 9/15/26 | 450,000 | 448,110 | |
| Summit Midstream Holdings LLC 9% 10/15/26 (b) | 300,000 | 289,500 | |
| Sunoco LP/Sunoco Finance Corp.: | |||
| 4.5% 5/15/29 | 1,708,000 | 1,544,629 | |
| 4.5% 4/30/30 | 1,781,000 | 1,587,923 | |
| Tallgrass Energy Partners LP / Tallgrass Energy Finance Corp.: | |||
| 6% 9/1/31 (b) | 500,000 | 444,060 | |
| 7.5% 10/1/25 (b) | 105,000 | 105,639 | |
| Talos Production, Inc. 12% 1/15/26 | 105,000 | 109,463 | |
| Tervita Corp. 11% 12/1/25 (b) | 510,000 | 532,165 | |
| Transocean Titan Finance Ltd. 8.375% 2/1/28 (b) | 222,000 | 228,152 | |
| U.S.A. Compression Partners LP: | |||
| 6.875% 4/1/26 | 2,106,000 | 2,082,350 | |
| 6.875% 9/1/27 | 296,000 | 288,549 | |
| Valaris Ltd. 8.375% 4/30/30 (b) | 300,000 | 305,565 | |
| Venture Global Calcasieu Pass LLC 6.25% 1/15/30 (b) | 928,000 | 904,021 | |
| Venture Global LNG, Inc. 8.125% 6/1/28 (b) | 1,000,000 | 1,008,744 | |
| Vital Energy, Inc.: | |||
| 7.75% 7/31/29 (b) | 214,000 | 192,600 | |
| 10.125% 1/15/28 | 176,000 | 178,640 | |
| Weatherford International Ltd.: | |||
| 6.5% 9/15/28 (b) | 522,000 | 523,227 | |
| 8.625% 4/30/30 (b) | 2,124,000 | 2,172,832 | |
| Western Gas Partners LP 3.1% 2/1/25 | 2,249,000 | 2,153,763 | |
TOTAL ENERGY | 48,221,031 | ||
| Entertainment/Film - 0.6% | |||
| Live Nation Entertainment, Inc. 4.875% 11/1/24 (b) | 1,348,000 | 1,324,145 | |
| Resorts World Las Vegas LLC / RWLV Capital, Inc. 8.45% 7/27/30 (b) | 500,000 | 493,713 | |
TOTAL ENTERTAINMENT/FILM | 1,817,858 | ||
| Environmental - 1.3% | |||
| GFL Environmental, Inc. 4% 8/1/28 (b) | 4,209,000 | 3,757,450 | |
| Food & Drug Retail - 1.6% | |||
| Albertsons Companies LLC/Safeway, Inc./New Albertson's, Inc./Albertson's LLC 6.5% 2/15/28 (b) | 988,000 | 983,434 | |
| Murphy Oil U.S.A., Inc.: | |||
| 3.75% 2/15/31 (b) | 400,000 | 336,480 | |
| 4.75% 9/15/29 | 2,850,000 | 2,615,103 | |
| Parkland Corp. 5.875% 7/15/27 (b) | 614,000 | 593,412 | |
TOTAL FOOD & DRUG RETAIL | 4,528,429 | ||
| Food/Beverage/Tobacco - 3.2% | |||
| HLF Financing SARL LLC / Herbalife International, Inc. 4.875% 6/1/29 (b) | 300,000 | 224,469 | |
| Lamb Weston Holdings, Inc. 4.125% 1/31/30 (b) | 1,000,000 | 879,437 | |
| Performance Food Group, Inc. 4.25% 8/1/29 (b) | 5,099,000 | 4,487,418 | |
| Post Holdings, Inc. 4.5% 9/15/31 (b) | 1,000,000 | 861,487 | |
| Turning Point Brands, Inc. 5.625% 2/15/26 (b) | 1,603,000 | 1,496,208 | |
| Vector Group Ltd. 5.75% 2/1/29 (b) | 1,414,000 | 1,230,948 | |
TOTAL FOOD/BEVERAGE/TOBACCO | 9,179,967 | ||
| Gaming - 2.7% | |||
| Caesars Entertainment, Inc.: | |||
| 6.25% 7/1/25 (b) | 822,300 | 815,917 | |
| 8.125% 7/1/27 (b) | 750,000 | 761,499 | |
| Carnival Corp. 10.5% 6/1/30 (b) | 750,000 | 798,848 | |
| CDI Escrow Issuer, Inc. 5.75% 4/1/30 (b) | 1,701,000 | 1,581,941 | |
| Churchill Downs, Inc. 5.5% 4/1/27 (b) | 246,000 | 237,006 | |
| International Game Technology PLC 4.125% 4/15/26 (b) | 205,000 | 194,608 | |
| Las Vegas Sands Corp. 3.9% 8/8/29 | 750,000 | 660,275 | |
| MGM Resorts International 6.75% 5/1/25 | 151,000 | 151,251 | |
| Ontario Gaming GTA LP 8% 8/1/30 (b) | 145,000 | 146,565 | |
| Premier Entertainment Sub LLC 5.625% 9/1/29 (b) | 400,000 | 319,280 | |
| Raptor Acquisition Corp. / Raptor Co-Issuer LLC 4.875% 11/1/26 (b) | 677,000 | 638,668 | |
| Scientific Games Corp. 7.5% 9/1/31 (b) | 210,000 | 212,933 | |
| Wynn Resorts Finance LLC / Wynn Resorts Capital Corp. 7.125% 2/15/31 (b) | 1,350,000 | 1,326,653 | |
TOTAL GAMING | 7,845,444 | ||
| Healthcare - 4.9% | |||
| AMN Healthcare 4% 4/15/29 (b) | 866,000 | 740,680 | |
| Bausch Health Companies, Inc. 4.875% 6/1/28 (b) | 2,828,000 | 1,678,116 | |
| Community Health Systems, Inc. 4.75% 2/15/31 (b) | 1,976,000 | 1,472,120 | |
| CTR Partnership LP/CareTrust Capital Corp. 3.875% 6/30/28 (b) | 545,000 | 474,834 | |
| DaVita HealthCare Partners, Inc. 4.625% 6/1/30 (b) | 2,099,000 | 1,800,424 | |
| IQVIA, Inc. 6.5% 5/15/30 (b) | 2,465,000 | 2,478,193 | |
| Mozart Borrower LP: | |||
| 3.875% 4/1/29 (b) | 800,000 | 698,380 | |
| 5.25% 10/1/29 (b) | 845,000 | 750,382 | |
| Organon & Co. / Organon Foreign Debt Co-Issuer BV 5.125% 4/30/31 (b) | 650,000 | 553,802 | |
| RegionalCare Hospital Partners Holdings, Inc. 9.875% 8/15/30 (b) | 300,000 | 296,250 | |
| Tenet Healthcare Corp.: | |||
| 4.375% 1/15/30 | 2,960,000 | 2,629,480 | |
| 6.75% 5/15/31 (b) | 450,000 | 447,773 | |
TOTAL HEALTHCARE | 14,020,434 | ||
| Homebuilders/Real Estate - 2.5% | |||
| Anywhere Real Estate Group LLC 7% 4/15/30 (b) | 304,000 | 273,980 | |
| Arcosa, Inc. 4.375% 4/15/29 (b) | 230,000 | 206,878 | |
| DTZ U.S. Borrower LLC 8.875% 9/1/31 (b) | 500,000 | 504,100 | |
| Greystar Real Estate Partners 7.75% 9/1/30 (b) | 130,000 | 131,307 | |
| HAT Holdings I LLC/HAT Holdings II LLC 6% 4/15/25 (b) | 889,000 | 872,619 | |
| Kennedy-Wilson, Inc. 4.75% 2/1/30 | 1,250,000 | 962,963 | |
| LGI Homes, Inc. 4% 7/15/29 (b) | 860,000 | 711,094 | |
| MPT Operating Partnership LP/MPT Finance Corp. 3.5% 3/15/31 | 1,000,000 | 649,373 | |
| Office Properties Income Trust 2.65% 6/15/26 | 153,000 | 114,452 | |
| Realogy Group LLC/Realogy Co.-Issuer Corp. 5.25% 4/15/30 (b) | 20,000 | 13,883 | |
| RHP Hotel Properties LP/RHP Finance Corp. 7.25% 7/15/28 (b) | 400,000 | 401,999 | |
| Service Properties Trust: | |||
| 4.65% 3/15/24 | 113,000 | 111,441 | |
| 4.75% 10/1/26 | 355,000 | 308,183 | |
| 5.25% 2/15/26 | 181,000 | 166,682 | |
| 7.5% 9/15/25 | 408,300 | 403,418 | |
| Starwood Property Trust, Inc. 4.375% 1/15/27 (b) | 502,000 | 448,316 | |
| Uniti Group LP / Uniti Group Finance, Inc. 10.5% 2/15/28 (b) | 850,000 | 847,989 | |
TOTAL HOMEBUILDERS/REAL ESTATE | 7,128,677 | ||
| Hotels - 0.6% | |||
| Carnival Holdings (Bermuda) Ltd. 10.375% 5/1/28 (b) | 575,000 | 625,361 | |
| Travel+Leisure Co. 6.625% 7/31/26 (b) | 370,000 | 367,210 | |
| Wyndham Hotels & Resorts, Inc. 4.375% 8/15/28 (b) | 882,000 | 804,383 | |
TOTAL HOTELS | 1,796,954 | ||
| Insurance - 0.4% | |||
| HUB International Ltd. 7.25% 6/15/30 (b) | 500,000 | 508,945 | |
| NMI Holdings, Inc. 7.375% 6/1/25 (b) | 747,000 | 752,057 | |
TOTAL INSURANCE | 1,261,002 | ||
| Leisure - 3.9% | |||
| Carnival Corp.: | |||
| 4% 8/1/28 (b) | 3,273,000 | 2,928,473 | |
| 6% 5/1/29 (b) | 272,000 | 246,191 | |
| 7% 8/15/29 (b) | 145,000 | 147,123 | |
| 7.625% 3/1/26 (b) | 102,000 | 101,690 | |
| 9.875% 8/1/27 (b) | 410,000 | 432,921 | |
| NCL Corp. Ltd. 8.375% 2/1/28 (b) | 500,000 | 515,365 | |
| Royal Caribbean Cruises Ltd.: | |||
| 5.5% 8/31/26 (b) | 1,355,000 | 1,298,384 | |
| 8.25% 1/15/29 (b) | 750,000 | 783,797 | |
| 11.625% 8/15/27 (b) | 4,152,000 | 4,522,090 | |
| Viking Cruises Ltd. 9.125% 7/15/31 (b) | 300,000 | 309,941 | |
TOTAL LEISURE | 11,285,975 | ||
| Metals/Mining - 5.5% | |||
| Arsenal AIC Parent LLC 8% 10/1/30 (b) | 170,000 | 173,611 | |
| Cleveland-Cliffs, Inc. 5.875% 6/1/27 | 596,000 | 573,958 | |
| Eldorado Gold Corp. 6.25% 9/1/29 (b) | 300,000 | 255,732 | |
| ERO Copper Corp. 6.5% 2/15/30 (b) | 500,000 | 434,280 | |
| First Quantum Minerals Ltd.: | |||
| 6.875% 10/15/27 (b) | 390,000 | 376,869 | |
| 8.625% 6/1/31 (b) | 2,500,000 | 2,544,056 | |
| FMG Resources Pty Ltd.: | |||
| 4.375% 4/1/31 (b) | 203,000 | 170,128 | |
| 5.875% 4/15/30 (b) | 6,484,000 | 6,018,890 | |
| HudBay Minerals, Inc. 4.5% 4/1/26 (b) | 859,000 | 810,780 | |
| Mineral Resources Ltd.: | |||
| 8% 11/1/27 (b) | 500,000 | 498,253 | |
| 8.125% 5/1/27 (b) | 923,000 | 921,006 | |
| 8.5% 5/1/30 (b) | 3,064,000 | 3,074,958 | |
TOTAL METALS/MINING | 15,852,521 | ||
| Paper - 0.3% | |||
| Ardagh Metal Packaging Finance U.S.A. LLC/Ardagh Metal Packaging Finance PLC 6% 6/15/27 (b) | 360,000 | 351,042 | |
| Louisiana-Pacific Corp. 3.625% 3/15/29 (b) | 483,000 | 415,619 | |
TOTAL PAPER | 766,661 | ||
| Restaurants - 0.9% | |||
| 1011778 BC Unlimited Liability Co./New Red Finance, Inc. 4% 10/15/30 (b) | 2,980,000 | 2,524,511 | |
| Services - 5.2% | |||
| Allied Universal Holdco LLC / Allied Universal Finance Corp. 6.625% 7/15/26 (b) | 923,000 | 877,906 | |
| Aramark Services, Inc. 5% 4/1/25 (b) | 150,000 | 148,167 | |
| Avis Budget Car Rental LLC/Avis Budget Finance, Inc. 5.75% 7/15/27 (b) | 518,000 | 494,338 | |
| Brand Energy & Infrastructure Services, Inc. 10.375% 8/1/30 (b) | 400,000 | 412,512 | |
| CoreCivic, Inc. 8.25% 4/15/26 | 429,000 | 430,702 | |
| Fair Isaac Corp. 4% 6/15/28 (b) | 1,959,000 | 1,791,404 | |
| Iron Mountain, Inc.: | |||
| 5% 7/15/28 (b) | 2,527,000 | 2,340,158 | |
| 5.25% 7/15/30 (b) | 821,000 | 740,810 | |
| Neptune BidCo U.S., Inc. 9.29% 4/15/29 (b) | 700,000 | 653,672 | |
| Ritchie Bros. Holdings, Inc. 7.75% 3/15/31 (b) | 2,026,000 | 2,095,431 | |
| TriNet Group, Inc. 3.5% 3/1/29 (b) | 2,619,000 | 2,254,907 | |
| WASH Multifamily Acquisition, Inc. 5.75% 4/15/26 (b) | 270,000 | 250,396 | |
| Williams Scotsman International, Inc. 4.625% 8/15/28 (b) | 2,700,000 | 2,463,750 | |
TOTAL SERVICES | 14,954,153 | ||
| Steel - 0.5% | |||
| ATI, Inc. 7.25% 8/15/30 | 1,000,000 | 1,010,200 | |
| Carpenter Technology Corp. 7.625% 3/15/30 | 500,000 | 506,105 | |
TOTAL STEEL | 1,516,305 | ||
| Super Retail - 3.3% | |||
| Asbury Automotive Group, Inc.: | |||
| 4.75% 3/1/30 | 1,535,000 | 1,345,691 | |
| 5% 2/15/32 (b) | 3,142,000 | 2,695,479 | |
| Bath & Body Works, Inc.: | |||
| 6.875% 11/1/35 | 687,000 | 642,372 | |
| 9.375% 7/1/25 (b) | 968,000 | 1,012,730 | |
| Gap, Inc. 3.625% 10/1/29 (b) | 300,000 | 228,385 | |
| Group 1 Automotive, Inc. 4% 8/15/28 (b) | 2,579,000 | 2,289,895 | |
| Nordstrom, Inc. 4.25% 8/1/31 | 600,000 | 451,368 | |
| QVC, Inc. 4.375% 9/1/28 | 500,000 | 282,887 | |
| Sally Holdings LLC 5.625% 12/1/25 | 105,000 | 104,289 | |
| Staples, Inc. 7.5% 4/15/26 (b) | 500,000 | 413,699 | |
TOTAL SUPER RETAIL | 9,466,795 | ||
| Technology - 4.5% | |||
| Alteryx, Inc. 8.75% 3/15/28 (b) | 435,000 | 419,769 | |
| Atkore, Inc. 4.25% 6/1/31 (b) | 792,000 | 681,078 | |
| Cloud Software Group, Inc. 6.5% 3/31/29 (b) | 1,135,000 | 1,015,206 | |
| CNT PRNT/CDK GLO II/FIN 8% 6/15/29 (b) | 300,000 | 301,950 | |
| CommScope, Inc. 4.75% 9/1/29 (b) | 500,000 | 371,569 | |
| Consensus Cloud Solutions, Inc. 6.5% 10/15/28 (b) | 1,176,000 | 1,062,881 | |
| Gen Digital, Inc. 5% 4/15/25 (b) | 193,000 | 189,196 | |
| Go Daddy Operating Co. LLC / GD Finance Co., Inc. 3.5% 3/1/29 (b) | 540,000 | 464,153 | |
| Hughes Satellite Systems Corp. 6.625% 8/1/26 | 500,000 | 433,750 | |
| Iron Mountain Information Management Services, Inc. 5% 7/15/32 (b) | 3,089,000 | 2,667,239 | |
| MicroStrategy, Inc. 6.125% 6/15/28 (b) | 195,000 | 174,569 | |
| Open Text Corp. 3.875% 12/1/29 (b) | 2,964,000 | 2,513,536 | |
| PTC, Inc. 3.625% 2/15/25 (b) | 440,000 | 424,658 | |
| Seagate HDD Cayman: | |||
| 3.125% 7/15/29 | 203 | 154 | |
| 8.25% 12/15/29 (b) | 255,000 | 267,495 | |
| Uber Technologies, Inc. 7.5% 5/15/25 (b) | 1,371,000 | 1,384,235 | |
| Veritas U.S., Inc./Veritas Bermuda Ltd. 7.5% 9/1/25 (b) | 400,000 | 327,765 | |
| Xerox Corp. 4.8% 3/1/35 | 250,000 | 168,633 | |
| Xerox Holdings Corp. 5% 8/15/25 (b) | 105,000 | 100,138 | |
TOTAL TECHNOLOGY | 12,967,974 | ||
| Telecommunications - 4.6% | |||
| Altice Financing SA 5.75% 8/15/29 (b) | 800,000 | 633,733 | |
| Altice France SA: | |||
| 5.5% 10/15/29 (b) | 1,810,000 | 1,302,326 | |
| 8.125% 2/1/27 (b) | 199,000 | 168,182 | |
| Cogent Communications Group, Inc. 7% 6/15/27 (b) | 2,030,000 | 1,970,521 | |
| Consolidated Communications, Inc. 5% 10/1/28 (b) | 300,000 | 224,826 | |
| Dycom Industries, Inc. 4.5% 4/15/29 (b) | 1,101,000 | 983,061 | |
| Frontier Communications Holdings LLC: | |||
| 5% 5/1/28 (b) | 1,149,000 | 984,525 | |
| 6% 1/15/30 (b) | 555,000 | 410,032 | |
| 8.75% 5/15/30 (b) | 443,000 | 430,567 | |
| Intelsat Jackson Holdings SA 6.5% 3/15/30 (b) | 700,000 | 641,838 | |
| Level 3 Financing, Inc.: | |||
| 3.875% 11/15/29 (b) | 1,482,000 | 1,308,745 | |
| 10.5% 5/15/30 (b) | 415,000 | 421,553 | |
| Sabre GLBL, Inc. 9.25% 4/15/25 (b) | 31,900 | 31,425 | |
| Telecom Italia Capital SA 7.2% 7/18/36 | 1,741,000 | 1,573,396 | |
| ViaSat, Inc. 5.625% 4/15/27 (b) | 700,000 | 625,363 | |
| Virgin Media Finance PLC 5% 7/15/30 (b) | 500,000 | 405,654 | |
| Virgin Media Secured Finance PLC 5.5% 5/15/29 (b) | 800,000 | 731,280 | |
| Windstream Escrow LLC 7.75% 8/15/28 (b) | 300,000 | 243,214 | |
| Zayo Group Holdings, Inc. 4% 3/1/27 (b) | 400,000 | 299,775 | |
TOTAL TELECOMMUNICATIONS | 13,390,016 | ||
| Textiles/Apparel - 0.1% | |||
| Foot Locker, Inc. 4% 10/1/29 (b) | 127,000 | 95,589 | |
| Kontoor Brands, Inc. 4.125% 11/15/29 (b) | 50,000 | 42,469 | |
TOTAL TEXTILES/APPAREL | 138,058 | ||
| Transportation Ex Air/Rail - 0.7% | |||
| XPO Escrow Sub LLC 7.5% 11/15/27 (b) | 1,927,000 | 1,959,295 | |
| Utilities - 2.2% | |||
| Calpine Corp.: | |||
| 3.75% 3/1/31 (b) | 1,162,000 | 968,790 | |
| 5.25% 6/1/26 (b) | 105,000 | 103,023 | |
| NRG Energy, Inc. 3.375% 2/15/29 (b) | 1,000,000 | 824,267 | |
| PG&E Corp. 5.25% 7/1/30 | 3,000,000 | 2,665,265 | |
| Talen Energy Supply LLC 8.625% 6/1/30 (b) | 450,000 | 468,544 | |
| Vistra Operations Co. LLC 5.625% 2/15/27 (b) | 1,334,000 | 1,284,255 | |
TOTAL UTILITIES | 6,314,144 | ||
| TOTAL NONCONVERTIBLE BONDS (Cost $289,867,754) | 281,024,344 | ||
| Money Market Funds - 2.2% | |||
| Shares | Value ($) | ||
Fidelity Cash Central Fund 5.43% (d) (Cost $6,320,516) | 6,319,252 | 6,320,516 | |
| TOTAL INVESTMENT IN SECURITIES - 99.7% (Cost $296,188,270) | 287,344,860 |
NET OTHER ASSETS (LIABILITIES) - 0.3% | 905,062 |
| NET ASSETS - 100.0% | 288,249,922 |
| (a) | Amount is stated in United States dollars unless otherwise noted. |
| (b) | Security exempt from registration under Rule 144A of the Securities Act of 1933. These securities may be resold in transactions exempt from registration, normally to qualified institutional buyers. At the end of the period, the value of these securities amounted to $225,342,772 or 78.2% of net assets. |
| (c) | Coupon rates for floating and adjustable rate securities reflect the rates in effect at period end. |
| (d) | Affiliated fund that is generally available only to investment companies and other accounts managed by Fidelity Investments. The rate quoted is the annualized seven-day yield of the fund at period end. A complete unaudited listing of the fund's holdings as of its most recent quarter end is available upon request. In addition, each Fidelity Central Fund's financial statements, which are not covered by the Fund's Report of Independent Registered Public Accounting Firm, are available on the SEC's website or upon request. |
| Affiliate | Value, beginning of period ($) | Purchases ($) | Sales Proceeds ($) | Dividend Income ($) | Realized Gain (loss) ($) | Change in Unrealized appreciation (depreciation) ($) | Value, end of period ($) | % ownership, end of period |
| Fidelity Cash Central Fund 5.43% | 7,518,427 | 119,964,171 | 121,162,082 | 288,186 | - | - | 6,320,516 | 0.0% |
| Total | 7,518,427 | 119,964,171 | 121,162,082 | 288,186 | - | - | 6,320,516 | |
| Valuation Inputs at Reporting Date: | ||||
| Description | Total ($) | Level 1 ($) | Level 2 ($) | Level 3 ($) |
Investments in Securities: | ||||
| Corporate Bonds | 281,024,344 | - | 281,024,344 | - |
| Money Market Funds | 6,320,516 | 6,320,516 | - | - |
| Total Investments in Securities: | 287,344,860 | 6,320,516 | 281,024,344 | - |
| Statement of Assets and Liabilities | ||||
| August 31, 2023 | ||||
| Assets | ||||
| Investment in securities, at value - See accompanying schedule: | ||||
Unaffiliated issuers (cost $289,867,754) | $ | 281,024,344 | ||
Fidelity Central Funds (cost $6,320,516) | 6,320,516 | |||
| Total Investment in Securities (cost $296,188,270) | $ | 287,344,860 | ||
| Interest receivable | 4,647,155 | |||
| Distributions receivable from Fidelity Central Funds | 20,914 | |||
Total assets | 292,012,929 | |||
| Liabilities | ||||
| Payable for investments purchased | $ | 2,062,278 | ||
| Distributions payable | 1,593,400 | |||
| Accrued management fee | 107,329 | |||
| Total Liabilities | 3,763,007 | |||
| Net Assets | $ | 288,249,922 | ||
| Net Assets consist of: | ||||
| Paid in capital | $ | 326,677,295 | ||
| Total accumulated earnings (loss) | (38,427,373) | |||
| Net Assets | $ | 288,249,922 | ||
Net Asset Value, offering price and redemption price per share ($288,249,922 ÷ 6,200,000 shares) | $ | 46.49 | ||
| Statement of Operations | ||||
Year ended August 31, 2023 | ||||
| Investment Income | ||||
| Dividends | $ | 5,273 | ||
| Interest | 17,256,598 | |||
| Income from Fidelity Central Funds | 288,186 | |||
| Total Income | 17,550,057 | |||
| Expenses | ||||
| Management fee | $ | 1,221,361 | ||
| Independent trustees' fees and expenses | 1,395 | |||
| Total expenses before reductions | 1,222,756 | |||
| Expense reductions | (3,154) | |||
| Total expenses after reductions | 1,219,602 | |||
| Net Investment income (loss) | 16,330,455 | |||
| Realized and Unrealized Gain (Loss) | ||||
| Net realized gain (loss) on: | ||||
| Investment Securities: | ||||
| Unaffiliated issuers | (14,212,104) | |||
| Redemptions in-kind | (2,915,270) | |||
| Total net realized gain (loss) | (17,127,374) | |||
| Change in net unrealized appreciation (depreciation) on investment securities | 18,328,525 | |||
| Net gain (loss) | 1,201,151 | |||
| Net increase (decrease) in net assets resulting from operations | $ | 17,531,606 | ||
| Statement of Changes in Net Assets | ||||
Year ended August 31, 2023 | Year ended August 31, 2022 | |||
| Increase (Decrease) in Net Assets | ||||
| Operations | ||||
| Net investment income (loss) | $ | 16,330,455 | $ | 13,042,306 |
| Net realized gain (loss) | (17,127,374) | (16,010,975) | ||
| Change in net unrealized appreciation (depreciation) | 18,328,525 | (32,513,552) | ||
| Net increase (decrease) in net assets resulting from operations | 17,531,606 | (35,482,221) | ||
| Distributions to shareholders | (16,489,950) | (19,199,200) | ||
| Share transactions | ||||
| Proceeds from sales of shares | 46,271,158 | 122,215,264 | ||
| Cost of shares redeemed | (34,058,789) | (70,069,896) | ||
Net increase (decrease) in net assets resulting from share transactions | 12,212,369 | 52,145,368 | ||
| Total increase (decrease) in net assets | 13,254,025 | (2,536,053) | ||
| Net Assets | ||||
| Beginning of period | 274,995,897 | 277,531,950 | ||
| End of period | $ | 288,249,922 | $ | 274,995,897 |
| Other Information | ||||
| Shares | ||||
| Sold | 1,000,000 | 2,350,000 | ||
| Redeemed | (750,000) | (1,350,000) | ||
| Net increase (decrease) | 250,000 | 1,000,000 | ||
| Fidelity® High Yield Factor ETF |
| Years ended August 31, | 2023 | 2022 | 2021 | 2020 | 2019 | |||||
Selected Per-Share Data | ||||||||||
| Net asset value, beginning of period | $ | 46.22 | $ | 56.07 | $ | 54.49 | $ | 52.32 | $ | 50.21 |
| Income from Investment Operations | ||||||||||
Net investment income (loss) A,B | 2.781 | 2.383 | 2.250 | 2.518 | 2.589 | |||||
| Net realized and unrealized gain (loss) | .297 | (8.748) | 2.335 | 2.323 | 2.006 | |||||
| Total from investment operations | 3.078 | (6.365) | 4.585 | 4.841 | 4.595 | |||||
| Distributions from net investment income | (2.808) | (2.355) | (2.195) | (2.429) | (2.485) | |||||
| Distributions from net realized gain | - | (1.128) | (.808) | (.242) | - | |||||
| Total distributions | (2.808) | (3.483) | (3.003) | (2.671) | (2.485) | |||||
| Net asset value, end of period | $ | 46.49 | $ | 46.22 | $ | 56.07 | $ | 54.49 | $ | 52.32 |
Total Return C,D | 6.90% | (11.85)% | 8.66% | 9.61% | 9.48% | |||||
Ratios to Average Net Assets B,E,F | ||||||||||
| Expenses before reductions | .45% | .45% | .45% | .45% | .44% G | |||||
| Expenses net of fee waivers, if any | .45% | .45% | .45% | .45% | .44% G | |||||
| Expenses net of all reductions | .45% | .45% | .45% | .45% | .44% G | |||||
| Net investment income (loss) | 6.02% | 4.64% | 4.07% | 4.84% | 5.03% | |||||
| Supplemental Data | ||||||||||
| Net assets, end of period (000 omitted) | $ | 288,250 | $ | 274,996 | $ | 277,532 | $ | 114,421 | $ | 68,016 |
Portfolio turnover rate H | 84% I | 72% I | 177% I | 179% I | 76% |
| Average Annual Total Returns | |||
Periods ended August 31, 2023 | Past 1 year | Life of Fund |
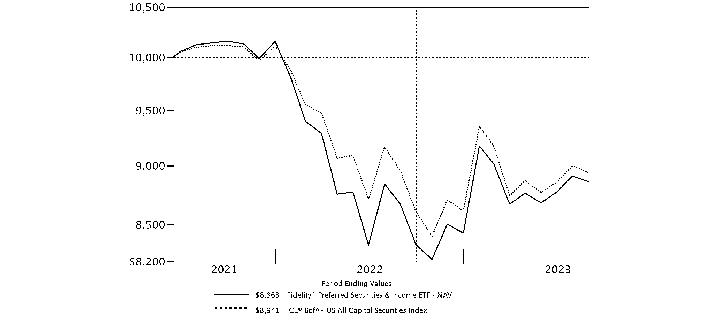
Fidelity® Preferred Securities & Income ETF - NAV A | 2.19% | -5.31% |
Fidelity® Preferred Securities & Income ETF - Market Price B | 2.70% | -5.12% |
ICE® BofA® US All Capital Securities Index A | -0.19% | -4.94% |
ICE U.S. All Capital Securities Constrained Custom Index A | -0.56% | -5.15% |
| $10,000 Over Life of Fund |
Let's say hypothetically that $10,000 was invested in Fidelity® Preferred Securities & Income ETF - NAV, on June 15, 2021, when the fund started. The chart shows how the value of your investment would have changed, and also shows how the ICE® BofA® US All Capital Securities Index performed over the same period. |
 |
Top Holdings (% of Fund's net assets) | ||
| Wells Fargo & Co. 5.9% | 3.7 | |
| Bank of America Corp. 5.875% | 2.9 | |
| Morgan Stanley 3 month U.S. LIBOR + 3.160% 8.712% | 2.5 | |
| Goldman Sachs Group, Inc. 4.4% | 2.4 | |
| Citigroup, Inc. 6.3% | 2.3 | |
| Charles Schwab Corp. 4% | 2.0 | |
| Goldman Sachs Group, Inc. CME Term SOFR 3 Month Index + 3.130% 8.5009% | 1.9 | |
| PNC Financial Services Group, Inc. 5% | 1.5 | |
| BP Capital Markets PLC 4.875% | 1.5 | |
| Citigroup, Inc. 3.875% | 1.4 | |
| 22.1 | ||
| Market Sectors (% of Fund's net assets) | ||
| Financials | 66.1 | |
| Utilities | 14.4 | |
| Energy | 8.1 | |
| Communication Services | 4.2 | |
| Industrials | 3.0 | |
| Real Estate | 2.2 | |
| Consumer Discretionary | 1.1 | |
Quality Diversification (% of Fund's net assets) |
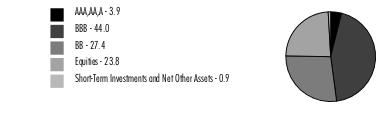 |
| We have used ratings from Moody's Investors Service, Inc. Where Moody's® ratings are not available, we have used S&P® ratings. All ratings are as of the date indicated and do not reflect subsequent changes. |
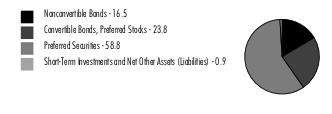
Asset Allocation (% of Fund's net assets) |
 |
Geographic Diversification (% of Fund's net assets) |
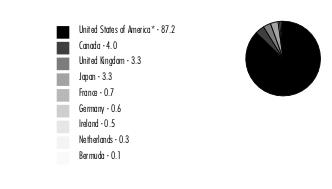 |
* Includes Short-Term investments and Net Other Assets (Liabilities). Percentages are adjusted for the effect of derivatives, if applicable. |
| Nonconvertible Bonds - 16.5% | |||
Principal Amount (a) | Value ($) | ||
| COMMUNICATION SERVICES - 1.6% | |||
| Diversified Telecommunication Services - 0.1% | |||
| British Telecommunications PLC 4.875% 11/23/81 (b)(c) | 50,000 | 41,016 | |
| Media - 0.2% | |||
| Paramount Global 6.25% 2/28/57 (c) | 78,000 | 61,072 | |
| Wireless Telecommunication Services - 1.3% | |||
| Vodafone Group PLC 7% 4/4/79 (c) | 400,000 | 402,886 | |
TOTAL COMMUNICATION SERVICES | 504,974 | ||
| ENERGY - 2.0% | |||
| Oil, Gas & Consumable Fuels - 2.0% | |||
| Enterprise Products Operating LP: | |||
| CME Term SOFR 3 Month Index + 2.980% 8.6194% 8/16/77 (c)(d) | 33,000 | 32,390 | |
| 5.25% 8/16/77 (c) | 126,000 | 110,860 | |
| 5.375% 2/15/78 (c) | 67,000 | 55,603 | |
| Transcanada Trust: | |||
| 5.3% 3/15/77 (c) | 161,000 | 140,070 | |
| 5.5% 9/15/79 (c) | 128,000 | 107,523 | |
| 5.625% 5/20/75 (c) | 95,000 | 89,154 | |
| 5.875% 8/15/76 (c) | 129,000 | 118,958 | |
| 654,558 | |||
| FINANCIALS - 8.7% | |||
| Capital Markets - 0.1% | |||
| Ares Finance Co. III LLC 4.125% 6/30/51 (b)(c) | 50,000 | 37,869 | |
| Financial Services - 0.9% | |||
| Apollo Management Holdings LP 4.95% 1/14/50 (b)(c) | 324,000 | 298,157 | |
| Insurance - 7.7% | |||
| American International Group, Inc. 5.75% 4/1/48 (c) | 129,000 | 121,808 | |
| Assurant, Inc. 7% 3/27/48 (c) | 61,000 | 59,092 | |
| Liberty Mutual Group, Inc.: | |||
| 4.125% 12/15/51 (b)(c) | 150,000 | 121,126 | |
| 4.3% 2/1/61 (b) | 125,000 | 76,501 | |
| Meiji Yasuda Life Insurance Co. 5.2% 10/20/45 (b)(c) | 200,000 | 194,546 | |
| MetLife, Inc.: | |||
| 6.4% 12/15/66 (c) | 319,000 | 315,593 | |
| 10.75% 8/1/69 (c) | 128,000 | 163,840 | |
| Muenchener Rueckversicherungs-Gesellschaft AG in Muenchen 5.875% 5/23/42 (b)(c) | 200,000 | 196,356 | |
| Nippon Life Insurance Co.: | |||
| 3.4% 1/23/50 (b)(c) | 100,000 | 86,193 | |
| 4.7% 1/20/46 (b)(c) | 200,000 | 192,488 | |
| 5.1% 10/16/44 (b)(c) | 200,000 | 196,000 | |
| PartnerRe Finance B LLC 4.5% 10/1/50 (c) | 67,000 | 56,182 | |
| Prudential Financial, Inc.: | |||
| 3.7% 10/1/50 (c) | 200,000 | 170,199 | |
| 5.125% 3/1/52 (c) | 150,000 | 134,009 | |
| 6% 9/1/52 (c) | 200,000 | 191,032 | |
| Sumitomo Life Insurance Co. 4% 9/14/77 (b)(c) | 200,000 | 185,294 | |
| 2,460,259 | |||
TOTAL FINANCIALS | 2,796,285 | ||
| UTILITIES - 4.2% | |||
| Electric Utilities - 2.3% | |||
| Emera, Inc. 6.75% 6/15/76 (c) | 125,000 | 120,000 | |
| NextEra Energy Capital Holdings, Inc. 5.65% 5/1/79 (c) | 104,000 | 96,389 | |
| PPL Capital Funding, Inc. 3 month U.S. LIBOR + 2.660% 8.2029% 3/30/67 (c)(d) | 30,000 | 27,171 | |
| Southern Co.: | |||
| 3.75% 9/15/51 (c) | 150,000 | 129,555 | |
| 4% 1/15/51 (c) | 400,000 | 370,926 | |
| 744,041 | |||
| Multi-Utilities - 1.9% | |||
| CMS Energy Corp.: | |||
| 3.75% 12/1/50 (c) | 409,000 | 308,036 | |
| 4.75% 6/1/50 (c) | 300,000 | 262,026 | |
| Sempra 4.125% 4/1/52 (c) | 25,000 | 20,215 | |
| 590,277 | |||
TOTAL UTILITIES | 1,334,318 | ||
| TOTAL NONCONVERTIBLE BONDS (Cost $5,705,442) | 5,290,135 | ||
| Nonconvertible Preferred Stocks - 23.8% | |||
| Shares | Value ($) | ||
| COMMUNICATION SERVICES - 2.6% | |||
| Diversified Telecommunication Services - 1.5% | |||
| AT&T, Inc.: | |||
| 4.75% | 20,000 | 387,500 | |
| 5.35% | 4,500 | 101,565 | |
| 489,065 | |||
| Wireless Telecommunication Services - 1.1% | |||
| Telephone & Data Systems, Inc.: | |||
| 6.00% | 3,500 | 53,375 | |
| 6.625% | 2,000 | 34,900 | |
| U.S. Cellular Corp. | 3,000 | 52,500 | |
| U.S. Cellular Corp.: | |||
| 5.50% | 3,000 | 53,190 | |
| 6.25% | 8,000 | 152,600 | |
| 346,565 | |||
TOTAL COMMUNICATION SERVICES | 835,630 | ||
| CONSUMER DISCRETIONARY - 0.3% | |||
| Automobiles - 0.3% | |||
| Ford Motor Co. 6.50% | 4,000 | 95,200 | |
| ENERGY - 1.2% | |||
| Oil, Gas & Consumable Fuels - 1.2% | |||
| DCP Midstream Partners LP 7.95% (c) | 775 | 19,608 | |
| Energy Transfer LP: | |||
| 7.60% (c) | 8,005 | 198,764 | |
| 7.625% (c) | 3,460 | 87,849 | |
| Series C, 3 month U.S. LIBOR + 4.530% 7.375% (c)(d) | 2,623 | 66,887 | |
| 373,108 | |||
| FINANCIALS - 12.9% | |||
| Banks - 3.9% | |||
| Bank of America Corp.: | |||
| 4.25% | 3,000 | 53,220 | |
| 4.375% | 20,000 | 362,600 | |
| Cadence Bank 5.50% | 2,000 | 37,980 | |
| Fifth Third Bancorp Series K 4.95% | 1,000 | 20,480 | |
| JPMorgan Chase & Co. 4.55% | 22,900 | 444,260 | |
| KeyCorp: | |||
| 6.125% (c) | 2,000 | 42,240 | |
| 6.20% (c) | 2,000 | 39,620 | |
| PacWest Bancorp 7.75% (c) | 1,000 | 20,690 | |
| Regions Financial Corp.: | |||
| 4.45% | 1,500 | 25,275 | |
| 5.75% (c) | 3,000 | 61,350 | |
| U.S. Bancorp Series M, 4.00% | 2,500 | 41,650 | |
| Webster Financial Corp. Series F, 5.25% | 250 | 4,583 | |
| Western Alliance Bancorp. (c) | 700 | 11,109 | |
| Wintrust Financial Corp.: | |||
| 6.50% (c) | 2,000 | 44,504 | |
| Series E, 6.875% (c) | 2,000 | 46,760 | |
| 1,256,321 | |||
| Capital Markets - 2.7% | |||
| Affiliated Managers Group, Inc. 4.75% | 3,000 | 53,130 | |
| Charles Schwab Corp. 4.45% | 4,500 | 87,503 | |
| Morgan Stanley: | |||
| 6.875% (c) | 1,250 | 31,650 | |
| Series K, 5.85% (c) | 13,275 | 316,742 | |
| Series O, 4.50% | 2,300 | 42,665 | |
| Northern Trust Corp. Series E, 4.70% | 1,500 | 31,005 | |
| Oaktree Capital Group LLC 6.55% | 2,000 | 43,000 | |
| SCE Trust III 5.75% (c) | 1,550 | 37,510 | |
| State Street Corp. Series G, 5.35% (c) | 1,000 | 22,650 | |
| Stifel Financial Corp. Series D, 4.50% | 12,000 | 194,280 | |
| 860,135 | |||
| Consumer Finance - 0.2% | |||
| Capital One Financial Corp. 4.25% | 1,000 | 16,080 | |
| Navient Corp. 6.00% | 1,500 | 28,905 | |
| Synchrony Financial Series A, 5.625% | 1,000 | 16,330 | |
| 61,315 | |||
| Financial Services - 0.9% | |||
| Carlyle Finance LLC 4.625% | 2,500 | 41,400 | |
| Equitable Holdings, Inc.: | |||
| 4.30% | 1,000 | 15,450 | |
| Series A 5.25% | 3,000 | 60,000 | |
| KKR Group Finance Co. IX LLC 4.625% | 5,000 | 87,450 | |
| Voya Financial, Inc. Series B, 5.35% (c) | 3,500 | 82,600 | |
| 286,900 | |||
| Insurance - 5.2% | |||
| Aegon Funding Co. LLC 5.10% | 3,950 | 81,370 | |
| Allstate Corp.: | |||
| 5.10% | 10,000 | 199,800 | |
| Series I, 4.75% | 2,000 | 38,080 | |
| Series J, 7.375% | 1,000 | 26,490 | |
| American Financial Group, Inc.: | |||
| 4.50% | 6,000 | 105,240 | |
| 5.125% | 1,000 | 20,100 | |
| Arch Capital Group Ltd.: | |||
| 5.45% | 4,000 | 85,760 | |
| Series G, 4.55% | 2,250 | 41,659 | |
| Assurant, Inc. 5.25% | 3,250 | 64,870 | |
| Athene Holding Ltd.: | |||
| Series C, 6.375% (c) | 9,000 | 219,060 | |
| Series D, 4.875% | 4,000 | 67,960 | |
| Series E, 7.75% (c) | 1,000 | 25,280 | |
| Brighthouse Financial, Inc. | 4,000 | 69,640 | |
| Brighthouse Financial, Inc. Series D, 0.00% | 2,500 | 38,075 | |
| Globe Life, Inc. Series D, 4.25% | 2,500 | 48,600 | |
| Hartford Financial Services Group, Inc. Series G, 6.00% | 1,000 | 25,000 | |
| Prudential Financial, Inc.: | |||
| 5.625% | 2,000 | 48,191 | |
| 5.95% | 1,500 | 37,065 | |
| Reinsurance Group of America, Inc. 7.125% (c) | 5,000 | 130,100 | |
| RenaissanceRe Holdings Ltd. Series G, 4.20% | 1,550 | 25,591 | |
| Unum Group 6.25% | 3,000 | 68,310 | |
| W.R. Berkley Corp. 4.25% | 11,000 | 213,950 | |
| 1,680,191 | |||
TOTAL FINANCIALS | 4,144,862 | ||
| INDUSTRIALS - 1.3% | |||
| Trading Companies & Distributors - 1.3% | |||
| FTAI Aviation Ltd.: | |||
| 8.00% (c) | 2,000 | 48,640 | |
| 8.25% (c) | 1,500 | 36,975 | |
| 8.25% (c) | 5,000 | 119,600 | |
| WESCO International, Inc. (c) | 8,000 | 218,000 | |
| 423,215 | |||
| REAL ESTATE - 2.2% | |||
| Equity Real Estate Investment Trusts (REITs) - 2.2% | |||
| American Homes 4 Rent 6.25% | 1,750 | 39,988 | |
| Digital Realty Trust, Inc.: | |||
| 5.25% | 1,750 | 36,873 | |
| Series L, 5.20% | 10,000 | 209,900 | |
| Public Storage: | |||
| 4.00% | 17,500 | 320,250 | |
| Series F, 5.15% | 1,500 | 35,805 | |
| Series G, 5.05% | 1,000 | 24,080 | |
| Series I, 4.875% | 1,500 | 33,555 | |
| Summit Hotel Properties, Inc. Series F, 5.875% | 775 | 14,609 | |
| 715,060 | |||
| UTILITIES - 3.3% | |||
| Electric Utilities - 1.4% | |||
| Entergy Louisiana LLC 4.875% | 1,500 | 32,520 | |
| Entergy Mississippi LLC 4.90% | 1,250 | 28,025 | |
| Entergy New Orleans LLC 5.50% | 2,000 | 46,200 | |
| Entergy, Inc. 4.875% | 1,250 | 27,400 | |
| Pacific Gas & Electric Co. Series A | 6,000 | 124,800 | |
| SCE Trust V 5.45% (c) | 1,550 | 35,495 | |
| Southern Co.: | |||
| 4.20% | 4,500 | 91,260 | |
| Series A, 4.95% | 2,500 | 56,000 | |
| 441,700 | |||
| Independent Power and Renewable Electricity Producers - 0.1% | |||
| Brookfield Renewable Partners LP 5.25% | 2,395 | 46,631 | |
| Multi-Utilities - 1.8% | |||
| Algonquin Power & Utilities Corp. Series A, 6.20% (c) | 9,000 | 218,520 | |
| Brookfield Infrastructure Partners LP: | |||
| 5.125% | 825 | 14,883 | |
| Class A 5.00% | 825 | 14,372 | |
| DTE Energy Co.: | |||
| 4.375% | 2,825 | 58,732 | |
| 4.375% | 3,000 | 60,570 | |
| Series E, 5.25% | 1,000 | 23,810 | |
| NiSource, Inc. 6.50% (c) | 5,000 | 124,500 | |
| SCE Trust VI | 2,375 | 45,101 | |
| 560,488 | |||
TOTAL UTILITIES | 1,048,819 | ||
| TOTAL NONCONVERTIBLE PREFERRED STOCKS (Cost $8,236,856) | 7,635,894 | ||
| Preferred Securities - 58.8% | |||
Principal Amount (a) | Value ($) | ||
| CONSUMER DISCRETIONARY - 0.8% | |||
| Automobiles - 0.8% | |||
| General Motors Financial Co., Inc. 5.7% (c)(e) | 302,000 | 265,996 | |
| ENERGY - 4.9% | |||
| Oil, Gas & Consumable Fuels - 4.9% | |||
| BP Capital Markets PLC: | |||
| 4.375% (c)(e) | 125,000 | 122,016 | |
| 4.875% (c)(e) | 525,000 | 480,385 | |
| Enbridge, Inc.: | |||
| 5.5% 7/15/77 (c) | 126,000 | 113,996 | |
| 5.75% 7/15/80 (c) | 126,000 | 115,623 | |
| 6% 1/15/77 (c) | 68,000 | 64,602 | |
| 6.25% 3/1/78 (c) | 123,000 | 118,414 | |
| Energy Transfer LP: | |||
| 3 month U.S. LIBOR + 4.020% 9.6542% (c)(d)(e) | 225,000 | 208,026 | |
| 7.125% (c)(e) | 350,000 | 317,094 | |
| EnLink Midstream Partners LP 3 month U.S. LIBOR + 4.110% 9.6184% (c)(d)(e) | 31,000 | 28,157 | |
| 1,568,313 | |||
| FINANCIALS - 44.5% | |||
| Banks - 23.6% | |||
| Bank of America Corp.: | |||
| 5.875% (c)(e) | 963,000 | 914,888 | |
| 6.1% (c)(e) | 200,000 | 202,157 | |
| 6.125% (c)(e) | 100,000 | 97,599 | |
| Citigroup, Inc.: | |||
| 3.875% (c)(e) | 511,000 | 447,899 | |
| 4.15% (c)(e) | 89,000 | 74,378 | |
| 5.95% (c)(e) | 418,000 | 410,371 | |
| 6.3% (c)(e) | 745,000 | 746,051 | |
| Fifth Third Bancorp 4.5% (c)(e) | 50,000 | 45,876 | |
| Huntington Bancshares, Inc. 5.625% (c)(e) | 226,000 | 207,249 | |
| JPMorgan Chase & Co.: | |||
| 4.6% (c)(e) | 300,000 | 282,623 | |
| 5% (c)(e) | 401,000 | 394,422 | |
| 6.1% (c)(e) | 321,000 | 327,580 | |
| 6.125% (c)(e) | 150,000 | 151,987 | |
| KeyCorp 5% (c)(e) | 100,000 | 78,600 | |
| M&T Bank Corp. 5.125% (c)(e) | 50,000 | 42,241 | |
| PNC Financial Services Group, Inc.: | |||
| CME Term SOFR 3 Month Index + 3.930% 9.3115% (c)(d)(e) | 50,000 | 50,737 | |
| 5% (c)(e) | 542,000 | 482,029 | |
| Regions Financial Corp. 5.75% (c)(e) | 75,000 | 72,402 | |
| Truist Financial Corp.: | |||
| 4.8% (c)(e) | 50,000 | 45,475 | |
| 4.95% (c)(e) | 135,000 | 127,115 | |
| 5.1% (c)(e) | 403,000 | 362,861 | |
| 5.125% (c)(e) | 60,000 | 48,355 | |
| U.S. Bancorp: | |||
| 3.7% (c)(e) | 400,000 | 303,158 | |
| 5.3% (c)(e) | 115,000 | 100,090 | |
| Wells Fargo & Co.: | |||
| 3.9% (c)(e) | 266,000 | 238,008 | |
| 5.875% (c)(e) | 80,000 | 80,302 | |
| 5.9% (c)(e) | 1,171,000 | 1,173,596 | |
| 7.625% (c)(e) | 75,000 | 77,377 | |
| 7,585,426 | |||
| Capital Markets - 14.9% | |||
| Bank of New York Mellon Corp.: | |||
| 3.7% (c)(e) | 425,000 | 379,776 | |
| 3.75% (c)(e) | 96,000 | 78,958 | |
| 4.625% (c)(e) | 200,000 | 183,610 | |
| 4.7% (c)(e) | 65,000 | 64,430 | |
| Charles Schwab Corp.: | |||
| 4% (c)(e) | 831,000 | 635,748 | |
| 4% (c)(e) | 200,000 | 175,060 | |
| 5% (c)(e) | 100,000 | 88,694 | |
| Goldman Sachs Group, Inc.: | |||
| CME Term SOFR 3 Month Index + 3.130% 8.5009% (c)(d)(e) | 616,000 | 617,238 | |
| 4.125% (c)(e) | 29,000 | 24,728 | |
| 4.4% (c)(e) | 894,000 | 777,942 | |
| 5.3% (c)(e) | 279,000 | 273,467 | |
| Morgan Stanley: | |||
| 3 month U.S. LIBOR + 3.160% 8.712% (c)(d)(e) | 765,000 | 791,471 | |
| 5.875% (c)(e) | 400,000 | 384,897 | |
| Northern Trust Corp. 4.6% (c)(e) | 60,000 | 54,126 | |
| State Street Corp. 5.625% (c)(e) | 248,000 | 238,573 | |
| 4,768,718 | |||
| Consumer Finance - 3.7% | |||
| Ally Financial, Inc.: | |||
| 4.7% (c)(e) | 470,000 | 331,174 | |
| 4.7% (c)(e) | 220,000 | 142,091 | |
| American Express Co. 3.55% (c)(e) | 382,000 | 320,953 | |
| Capital One Financial Corp. 3.95% (c)(e) | 400,000 | 310,950 | |
| Discover Financial Services 5.5% (c)(e) | 100,000 | 76,288 | |
| 1,181,456 | |||
| Financial Services - 0.2% | |||
| Equitable Holdings, Inc. 4.95% (c)(e) | 75,000 | 72,717 | |
| Insurance - 2.1% | |||
| Dai-Ichi Life Insurance Co. Ltd. 4% (b)(c)(e) | 200,000 | 189,122 | |
| Markel Group, Inc. 6% (c)(e) | 200,000 | 196,962 | |
| MetLife, Inc. 3.85% (c)(e) | 275,000 | 258,469 | |
| SBL Holdings, Inc. 6.5% (b)(c)(e) | 34,000 | 19,799 | |
| 664,352 | |||
TOTAL FINANCIALS | 14,272,669 | ||
| INDUSTRIALS - 1.7% | |||
| Trading Companies & Distributors - 1.7% | |||
| AerCap Holdings NV 5.875% 10/10/79 (c) | 150,000 | 148,293 | |
| Air Lease Corp.: | |||
| 4.125% (c)(e) | 56,000 | 40,863 | |
| 4.65% (c)(e) | 300,000 | 264,054 | |
| Aircastle Ltd. 5.25% (b)(c)(e) | 126,000 | 100,706 | |
| 553,916 | |||
| UTILITIES - 6.9% | |||
| Electric Utilities - 4.0% | |||
| Duke Energy Corp. 4.875% (c)(e) | 425,000 | 423,773 | |
| Edison International: | |||
| 5% (c)(e) | 344,000 | 303,786 | |
| 5.375% (c)(e) | 366,000 | 332,443 | |
| Electricite de France SA 9.125% (b)(c)(e) | 200,000 | 213,436 | |
| 1,273,438 | |||
| Independent Power and Renewable Electricity Producers - 1.1% | |||
| Vistra Corp.: | |||
| 7% (b)(c)(e) | 295,000 | 277,441 | |
| 8% (b)(c)(e) | 90,000 | 88,704 | |
| 366,145 | |||
| Multi-Utilities - 1.8% | |||
| Dominion Energy, Inc.: | |||
| 4.35% (c)(e) | 225,000 | 193,785 | |
| 4.65% (c)(e) | 75,000 | 68,993 | |
| Sempra 4.875% (c)(e) | 325,000 | 313,312 | |
| 576,090 | |||
TOTAL UTILITIES | 2,215,673 | ||
| TOTAL PREFERRED SECURITIES (Cost $20,231,883) | 18,876,567 | ||
| Money Market Funds - 1.0% | |||
| Shares | Value ($) | ||
Fidelity Cash Central Fund 5.43% (f) (Cost $325,515) | 325,450 | 325,515 | |
| TOTAL INVESTMENT IN SECURITIES - 100.1% (Cost $34,499,696) | 32,128,111 |
NET OTHER ASSETS (LIABILITIES) - (0.1)% | (32,873) |
| NET ASSETS - 100.0% | 32,095,238 |
| (a) | Amount is stated in United States dollars unless otherwise noted. |
| (b) | Security exempt from registration under Rule 144A of the Securities Act of 1933. These securities may be resold in transactions exempt from registration, normally to qualified institutional buyers. At the end of the period, the value of these securities amounted to $2,514,754 or 7.8% of net assets. |
| (c) | Coupon rates for floating and adjustable rate securities reflect the rates in effect at period end. |
| (d) | Coupon is indexed to a floating interest rate which may be multiplied by a specified factor and/or subject to caps or floors. |
| (e) | Security is perpetual in nature with no stated maturity date. |
| (f) | Affiliated fund that is generally available only to investment companies and other accounts managed by Fidelity Investments. The rate quoted is the annualized seven-day yield of the fund at period end. A complete unaudited listing of the fund's holdings as of its most recent quarter end is available upon request. In addition, each Fidelity Central Fund's financial statements, which are not covered by the Fund's Report of Independent Registered Public Accounting Firm, are available on the SEC's website or upon request. |
| Affiliate | Value, beginning of period ($) | Purchases ($) | Sales Proceeds ($) | Dividend Income ($) | Realized Gain (loss) ($) | Change in Unrealized appreciation (depreciation) ($) | Value, end of period ($) | % ownership, end of period |
| Fidelity Cash Central Fund 5.43% | 1,165,886 | 10,246,690 | 11,087,061 | 36,018 | - | - | 325,515 | 0.0% |
| Total | 1,165,886 | 10,246,690 | 11,087,061 | 36,018 | - | - | 325,515 | |
| Valuation Inputs at Reporting Date: | ||||
| Description | Total ($) | Level 1 ($) | Level 2 ($) | Level 3 ($) |
Investments in Securities: | ||||
| Equities: | ||||
Communication Services | 835,630 | 835,630 | - | - |
Consumer Discretionary | 95,200 | 95,200 | - | - |
Energy | 373,108 | 373,108 | - | - |
Financials | 4,144,862 | 4,144,862 | - | - |
Industrials | 423,215 | 423,215 | - | - |
Real Estate | 715,060 | 715,060 | - | - |
Utilities | 1,048,819 | 1,048,819 | - | - |
| Corporate Bonds | 5,290,135 | - | 5,290,135 | - |
| Preferred Securities | 18,876,567 | - | 18,876,567 | - |
| Money Market Funds | 325,515 | 325,515 | - | - |
| Total Investments in Securities: | 32,128,111 | 7,961,409 | 24,166,702 | - |
| Statement of Assets and Liabilities | ||||
| August 31, 2023 | ||||
| Assets | ||||
| Investment in securities, at value - See accompanying schedule: | ||||
Unaffiliated issuers (cost $34,174,181) | $ | 31,802,596 | ||
Fidelity Central Funds (cost $325,515) | 325,515 | |||
| Total Investment in Securities (cost $34,499,696) | $ | 32,128,111 | ||
| Dividends receivable | 37,093 | |||
| Interest receivable | 80,627 | |||
| Distributions receivable from Fidelity Central Funds | 748 | |||
| Other receivables | 43 | |||
Total assets | 32,246,622 | |||
| Liabilities | ||||
| Distributions payable | $ | 136,000 | ||
| Accrued management fee | 15,384 | |||
| Total Liabilities | 151,384 | |||
| Net Assets | $ | 32,095,238 | ||
| Net Assets consist of: | ||||
| Paid in capital | $ | 39,147,209 | ||
| Total accumulated earnings (loss) | (7,051,971) | |||
| Net Assets | $ | 32,095,238 | ||
Net Asset Value, offering price and redemption price per share ($32,095,238 ÷ 1,600,000 shares) | $ | 20.06 | ||
| Statement of Operations | ||||
Year ended August 31, 2023 | ||||
| Investment Income | ||||
| Dividends | $ | 1,545,845 | ||
| Interest | 59,013 | |||
| Income from Fidelity Central Funds | 36,018 | |||
| Total Income | 1,640,876 | |||
| Expenses | ||||
| Management fee | $ | 184,887 | ||
| Independent trustees' fees and expenses | 160 | |||
| Total expenses before reductions | 185,047 | |||
| Expense reductions | (933) | |||
| Total expenses after reductions | 184,114 | |||
| Net Investment income (loss) | 1,456,762 | |||
| Realized and Unrealized Gain (Loss) | ||||
| Net realized gain (loss) on: | ||||
| Investment Securities: | ||||
| Unaffiliated issuers | (3,256,717) | |||
| Total net realized gain (loss) | (3,256,717) | |||
| Change in net unrealized appreciation (depreciation) on investment securities | 2,451,438 | |||
| Net gain (loss) | (805,279) | |||
| Net increase (decrease) in net assets resulting from operations | $ | 651,483 | ||
| Statement of Changes in Net Assets | ||||
Year ended August 31, 2023 | Year ended August 31, 2022 | |||
| Increase (Decrease) in Net Assets | ||||
| Operations | ||||
| Net investment income (loss) | $ | 1,456,762 | $ | 1,028,374 |
| Net realized gain (loss) | (3,256,717) | (1,304,286) | ||
| Change in net unrealized appreciation (depreciation) | 2,451,438 | (4,847,016) | ||
| Net increase (decrease) in net assets resulting from operations | 651,483 | (5,122,928) | ||
| Distributions to shareholders | (1,416,301) | (1,189,250) | ||
| Distributions to shareholders from tax return of capital | (195,299) | - | ||
| Total Distributions | (1,611,600) | (1,189,250) | ||
| Share transactions | ||||
| Proceeds from sales of shares | 1,002,305 | 34,118,167 | ||
| Cost of shares redeemed | (1,015,599) | (1,037,642) | ||
Net increase (decrease) in net assets resulting from share transactions | (13,294) | 33,080,525 | ||
| Total increase (decrease) in net assets | (973,411) | 26,768,347 | ||
| Net Assets | ||||
| Beginning of period | 33,068,649 | 6,300,302 | ||
| End of period | $ | 32,095,238 | $ | 33,068,649 |
| Other Information | ||||
| Shares | ||||
| Sold | 50,000 | 1,400,000 | ||
| Redeemed | (50,000) | (50,000) | ||
| Net increase (decrease) | - | 1,350,000 | ||
| Fidelity® Preferred Securities & Income ETF |
| Years ended August 31, | 2023 | 2022 | 2021 A | |||
Selected Per-Share Data | ||||||
| Net asset value, beginning of period | $ | 20.67 | $ | 25.20 | $ | 25.00 |
| Income from Investment Operations | ||||||
Net investment income (loss) B,C | .937 | .886 | .170 | |||
| Net realized and unrealized gain (loss) | (.510) | (4.485) | .187 | |||
| Total from investment operations | .427 | (3.599) | .357 | |||
| Distributions from net investment income | (.856) | (.931) | (.157) | |||
| Tax return of capital | (.181) | - | - | |||
| Total distributions | (1.037) | (.931) | (.157) | |||
| Net asset value, end of period | $ | 20.06 | $ | 20.67 | $ | 25.20 |
Total Return D,E | 2.19% | (14.50)% | 1.44% | |||
Ratios to Average Net Assets C,F,G | ||||||
| Expenses before reductions | .59% | .59% | .59% H | |||
| Expenses net of fee waivers, if any | .59% | .59% | .59% H | |||
| Expenses net of all reductions | .59% | .59% | .59% H | |||
| Net investment income (loss) | 4.65% | 3.98% | 3.16% H | |||
| Supplemental Data | ||||||
| Net assets, end of period (000 omitted) | $ | 32,095 | $ | 33,069 | $ | 6,300 |
Portfolio turnover rate I | 50% | 21% | -% |
| Fidelity Central Fund | Investment Manager | Investment Objective | Investment Practices | Expense RatioA |
| Fidelity Money Market Central Funds | Fidelity Management & Research Company LLC (FMR) | Each fund seeks to obtain a high level of current income consistent with the preservation of capital and liquidity. | Short-term Investments | Less than .005% |
| Tax cost | Gross unrealized appreciation | Gross unrealized depreciation | Net unrealized appreciation (depreciation) | |
| Fidelity High Yield Factor ETF | $296,188,270 | $2,509,581 | $(11,352,991) | $(8,843,410) |
Fidelity Preferred Securities & Income ETF | 34,481,727 | 275,697 | (2,629,313) | (2,353,616) |
| Capital loss carryforward | Net unrealized appreciation (depreciation) on securities and other investments | |
| Fidelity High Yield Factor ETF | $(29,567,669) | $(8,843,410) |
Fidelity Preferred Securities & Income ETF | (4,548,334) | (2,353,616) |
| Short-term | Long-term | Total capital loss carryforward | |
| Fidelity High Yield Factor ETF | $(12,626,744) | $(16,940,925) | $(29,567,669) |
Fidelity Preferred Securities & Income ETF | (2,091,775) | (2,456,559) | (4,548,334) |
| August 31, 2023 | |||
| Ordinary Income | Tax Return of Capital | Total | |
| Fidelity High Yield Factor ETF | $16,489,950 | $- | $16,489,950 |
Fidelity Preferred Securities & Income ETF | 1,416,301 | 195,299 | 1,611,600 |
| August 31, 2022 | |||
| Ordinary Income | Long-term Capital Gains | Total | |
| Fidelity High Yield Factor ETF | $18,235,536 | $963,664 | $19,199,200 |
Fidelity Preferred Securities & Income ETF | 1,189,250 | - | 1,189,250 |
| Purchases ($) | Sales ($) | |
| Fidelity High Yield Factor ETF | 250,640,798 | 223,983,403 |
| Fidelity Preferred Securities & Income ETF | 15,955,839 | 15,112,626 |
| In-Kind Subscriptions ($) | In-Kind Redemptions ($) | |
| Fidelity High Yield Factor ETF | 40,593,400 | 29,103,218 |
| Fee Rate | |
| Fidelity High Yield Factor ETF | .45% |
| Fidelity Preferred Securities & Income ETF | .59% |
| Amount | |
| Fidelity Preferred Securities & Income ETF | 347 |
| Custodian credits | |
| Fidelity High Yield Factor ETF | $3,154 |
Fidelity Preferred Securities & Income ETF | 933 |
| The Example is based on an investment of $1,000 invested at the beginning of the period and held for the entire period (March 1, 2023 to August 31, 2023). |
Annualized Expense Ratio- A | Beginning Account Value March 1, 2023 | Ending Account Value August 31, 2023 | Expenses Paid During Period- C March 1, 2023 to August 31, 2023 | |||||||
| Fidelity® High Yield Factor ETF | .45% | |||||||||
| Actual | $ 1,000 | $ 1,040.80 | $ 2.31 | |||||||
Hypothetical-B | $ 1,000 | $ 1,022.94 | $ 2.29 | |||||||
| Fidelity® Preferred Securities & Income ETF | .59% | |||||||||
| Actual | $ 1,000 | $ 982.90 | $ 2.95 | |||||||
Hypothetical-B | $ 1,000 | $ 1,022.23 | $ 3.01 | |||||||
| Fidelity High Yield Factor ETF | 0.01% |
| Fidelity Preferred Securities & Income ETF | 0.01% |
| Fidelity Preferred Securities & Income ETF | |
| September 2022 | 2% |
| October 2022 | 36% |
| November 2022 | 36% |
| December 2022 | 36% |
| January 2023 | 24% |
| February 2023 | 24% |
| March 2023 | 24% |
| April 2023 | 24% |
| May 2023 | 24% |
| June 2023 | 24% |
| July 2023 | 24% |
| August 2023 | 24% |
| Fidelity Preferred Securities & Income ETF | |
| September 2022 | 1.77% |
| October 2022 | 36.43% |
| November 2022 | 36.43% |
| December 2022 | 36.43% |
| January 2023 | 24.86% |
| February 2023 | 24.86% |
| March 2023 | 24.86% |
| April 2023 | 24.86% |
| May 2023 | 24.86% |
| June 2023 | 24.86% |
| July 2023 | 24.86% |
| August 2023 | 24.86% |
| Fidelity Preferred Securities & Income ETF | |
| September 2022 | 0.11% |
| October 2022 | 2.24% |
| November 2022 | 2.24% |
| December 2022 | 2.24% |
| January 2023 | 1.25% |
| February 2023 | 1.25% |
| March 2023 | 1.25% |
| April 2023 | 1.25% |
| May 2023 | 1.25% |
| June 2023 | 1.25% |
| July 2023 | 1.25% |
| August 2023 | 1.25% |
| Fidelity High Yield Factor ETF | $10,765,285 |
| Fidelity Preferred Securities & Income ETF | $605,333 |
| Fidelity High Yield Factor ETF | $15,245,316 |
| Fidelity Preferred Securities & Income ETF | $1,079,835 |
 |


Contents
| Average Annual Total Returns | |||
Periods ended August 31, 2023 | Past 1 year | Life of Fund |
Fidelity® Sustainable High Yield ETF - NAV A | 6.83% | -0.27% |
Fidelity® Sustainable High Yield ETF - Market Price B | 7.59% | -0.08% |
ICE® BofA® US High Yield Constrained Index A | 7.03% | -0.34% |
ICE US High Yield Best-in-Class ESG Index A | 6.54% | -0.95% |
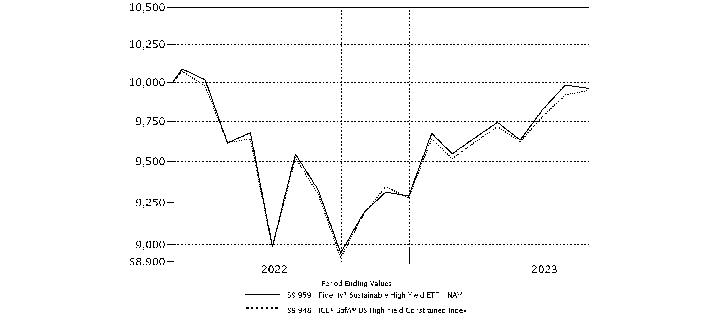
| $10,000 Over Life of Fund |
Let's say hypothetically that $10,000 was invested in Fidelity® Sustainable High Yield ETF - NAV, on February 15, 2022, when the fund started. The chart shows how the value of your investment would have changed, and also shows how the ICE® BofA® US High Yield Constrained Index performed over the same period. |
 |
| Top Bond Issuers (% of Fund's net assets) | ||
(with maturities greater than one year) | ||
| Uber Technologies, Inc. | 2.6 | |
| New Fortress Energy, Inc. | 1.9 | |
| Community Health Systems, Inc. | 1.9 | |
| MPT Operating Partnership LP/MPT Finance Corp. | 1.9 | |
| Tenet Healthcare Corp. | 1.7 | |
| CCO Holdings LLC/CCO Holdings Capital Corp. | 1.6 | |
| Stericycle, Inc. | 1.6 | |
| Go Daddy Operating Co. LLC / GD Finance Co., Inc. | 1.5 | |
| The Chemours Company LLC | 1.5 | |
| Methanex Corp. | 1.4 | |
| 17.6 | ||
| Market Sectors (% of Fund's net assets) | ||
| Energy | 14.6 | |
| Technology | 12.1 | |
| Services | 8.7 | |
| Healthcare | 8.0 | |
| Chemicals | 5.1 | |
Quality Diversification (% of Fund's net assets) |
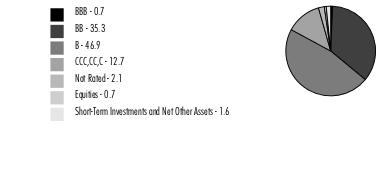 |
| We have used ratings from Moody's Investors Service, Inc. Where Moody's® ratings are not available, we have used S&P® ratings. All ratings are as of the date indicated and do not reflect subsequent changes. |
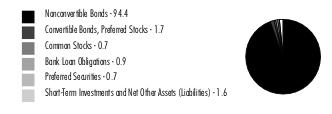
Asset Allocation (% of Fund's net assets) |
 |
Geographic Diversification (% of Fund's net assets) |
 |
* Includes Short-Term investments and Net Other Assets (Liabilities). Percentages are adjusted for the effect of derivatives, if applicable. |
| Corporate Bonds - 96.1% | |||
Principal Amount (a) | Value ($) | ||
| Convertible Bonds - 1.7% | |||
| Broadcasting - 1.0% | |||
| DISH Network Corp.: | |||
| 2.375% 3/15/24 | 20,000 | 18,900 | |
| 3.375% 8/15/26 | 120,000 | 72,600 | |
| 91,500 | |||
| Homebuilders/Real Estate - 0.4% | |||
| Redfin Corp. 0.5% 4/1/27 | 61,000 | 38,735 | |
| Super Retail - 0.1% | |||
| Wayfair LLC 0.625% 10/1/25 | 12,000 | 10,410 | |
| Technology - 0.2% | |||
| MicroStrategy, Inc. 0% 2/15/27 | 18,000 | 12,398 | |
TOTAL CONVERTIBLE BONDS | 153,043 | ||
| Nonconvertible Bonds - 94.4% | |||
| Aerospace - 1.5% | |||
| ATI, Inc. 4.875% 10/1/29 | 50,000 | 45,142 | |
| Bombardier, Inc. 6% 2/15/28 (b) | 80,000 | 74,770 | |
| TransDigm, Inc. 4.875% 5/1/29 | 20,000 | 17,996 | |
| 137,908 | |||
| Air Transportation - 0.3% | |||
| Rand Parent LLC 8.5% 2/15/30 (b) | 30,000 | 28,560 | |
| Automotive & Auto Parts - 1.3% | |||
| Ford Motor Credit Co. LLC 4.687% 6/9/25 | 25,000 | 24,065 | |
| Macquarie AirFinance Holdings 8.375% 5/1/28 (b) | 10,000 | 10,210 | |
| McLaren Finance PLC 7.5% 8/1/26 (b) | 5,000 | 4,400 | |
| PECF USS Intermediate Holding III Corp. 8% 11/15/29 (b) | 10,000 | 6,378 | |
| Rivian Holdco & Rivian LLC & Rivian Automotive LLC 6 month U.S. LIBOR + 5.620% 10.9311% 10/15/26 (b)(c)(d) | 70,000 | 69,769 | |
| 114,822 | |||
| Banks & Thrifts - 0.1% | |||
| Western Alliance Bancorp. 3% 6/15/31 (c) | 10,000 | 7,909 | |
| Broadcasting - 1.3% | |||
| Clear Channel Outdoor Holdings, Inc.: | |||
| 5.125% 8/15/27 (b) | 5,000 | 4,478 | |
| 7.5% 6/1/29 (b) | 6,000 | 4,472 | |
| 9% 9/15/28 (b) | 10,000 | 10,050 | |
| DISH Network Corp. 11.75% 11/15/27 (b) | 20,000 | 20,293 | |
| Univision Communications, Inc.: | |||
| 5.125% 2/15/25 (b) | 42,000 | 41,423 | |
| 7.375% 6/30/30 (b) | 31,000 | 30,003 | |
| 8% 8/15/28 (b) | 5,000 | 4,997 | |
| 115,716 | |||
| Building Materials - 0.8% | |||
| Advanced Drain Systems, Inc. 6.375% 6/15/30 (b) | 10,000 | 9,850 | |
| Beacon Roofing Supply, Inc. 6.5% 8/1/30 (b) | 9,000 | 8,891 | |
| Cornerstone Building Brands, Inc. 6.125% 1/15/29 (b) | 40,000 | 32,474 | |
| Eco Material Technologies, Inc. 7.875% 1/31/27 (b) | 15,000 | 14,625 | |
| Oscar Acquisition Co. LLC / Oscar Finance, Inc. 9.5% 4/15/30 (b) | 5,000 | 4,680 | |
| 70,520 | |||
| Cable/Satellite TV - 2.2% | |||
| CCO Holdings LLC/CCO Holdings Capital Corp.: | |||
| 4.25% 1/15/34 (b) | 50,000 | 38,290 | |
| 4.75% 3/1/30 (b) | 25,000 | 21,495 | |
| 4.75% 2/1/32 (b) | 110,000 | 91,025 | |
| DIRECTV Financing LLC / DIRECTV Financing Co-Obligor, Inc. 5.875% 8/15/27 (b) | 50,000 | 44,311 | |
| DISH DBS Corp. 5.75% 12/1/28 (b) | 5,000 | 3,881 | |
| 199,002 | |||
| Capital Goods - 0.8% | |||
| Chart Industries, Inc. 9.5% 1/1/31 (b) | 18,000 | 19,381 | |
| Patrick Industries, Inc. 4.75% 5/1/29 (b) | 42,000 | 35,910 | |
| Vertical Holdco GmbH 7.625% 7/15/28 (b) | 14,000 | 12,974 | |
| 68,265 | |||
| Chemicals - 5.1% | |||
| Axalta Coating Systems LLC 3.375% 2/15/29 (b) | 20,000 | 16,963 | |
| Kobe U.S. Midco 2, Inc. 9.25% 11/1/26 pay-in-kind (b)(c) | 15,000 | 10,950 | |
| Methanex Corp.: | |||
| 5.125% 10/15/27 | 70,000 | 65,661 | |
| 5.65% 12/1/44 | 75,000 | 61,344 | |
| NOVA Chemicals Corp.: | |||
| 4.25% 5/15/29 (b) | 50,000 | 40,545 | |
| 4.875% 6/1/24 (b) | 20,000 | 19,671 | |
| Nufarm Australia Ltd. 5% 1/27/30 (b) | 45,000 | 40,027 | |
| Olympus Water U.S. Holding Corp.: | |||
| 6.25% 10/1/29 (b) | 60,000 | 48,304 | |
| 9.75% 11/15/28 (b) | 15,000 | 15,110 | |
| SCIH Salt Holdings, Inc. 6.625% 5/1/29 (b) | 5,000 | 4,412 | |
| The Chemours Co. LLC 4.625% 11/15/29 (b) | 165,000 | 137,172 | |
| 460,159 | |||
| Consumer Products - 0.5% | |||
| Macy's Retail Holdings LLC 5.875% 4/1/29 (b) | 16,000 | 14,464 | |
| Tempur Sealy International, Inc. 4% 4/15/29 (b) | 35,000 | 30,064 | |
| 44,528 | |||
| Containers - 2.2% | |||
| Ardagh Packaging Finance PLC/Ardagh MP Holdings U.S.A., Inc.: | |||
| 5.25% 8/15/27 (b) | 77,000 | 65,505 | |
| 5.25% 8/15/27 (b) | 27,000 | 22,969 | |
| Ball Corp. 6% 6/15/29 | 5,000 | 4,926 | |
| Crown Americas LLC/Crown Americas Capital Corp. IV 4.75% 2/1/26 | 50,000 | 48,213 | |
| Graphic Packaging International, Inc. 4.75% 7/15/27 (b) | 25,000 | 23,747 | |
| LABL, Inc. 10.5% 7/15/27 (b) | 15,000 | 14,357 | |
| OI European Group BV 4.75% 2/15/30 (b) | 20,000 | 18,230 | |
| 197,947 | |||
| Diversified Financial Services - 3.1% | |||
| Aercap Global Aviation Trust 6.5% 6/15/45 (b)(c) | 50,000 | 49,302 | |
| Coinbase Global, Inc. 3.625% 10/1/31 (b) | 20,000 | 13,465 | |
| Fortress Transportation & Infrastructure Investors LLC 5.5% 5/1/28 (b) | 40,000 | 37,157 | |
| GGAM Finance Ltd.: | |||
| 7.75% 5/15/26 (b) | 10,000 | 10,000 | |
| 8% 6/15/28 (b) | 15,000 | 15,212 | |
| Hightower Holding LLC 6.75% 4/15/29 (b) | 20,000 | 17,408 | |
| HTA Group Ltd. 7% 12/18/25 (b) | 38,000 | 35,911 | |
| OneMain Finance Corp.: | |||
| 3.5% 1/15/27 | 20,000 | 17,405 | |
| 3.875% 9/15/28 | 105,000 | 86,100 | |
| 281,960 | |||
| Energy - 14.5% | |||
| Archrock Partners LP / Archrock Partners Finance Corp. 6.25% 4/1/28 (b) | 30,000 | 28,639 | |
| Atlantica Sustainable Infrastructure PLC 4.125% 6/15/28 (b) | 105,000 | 93,628 | |
| California Resources Corp. 7.125% 2/1/26 (b) | 100,000 | 100,257 | |
| Centennial Resource Production LLC 5.875% 7/1/29 (b) | 30,000 | 28,800 | |
| CGG SA 8.75% 4/1/27 (b) | 67,000 | 57,660 | |
| CNX Resources Corp.: | |||
| 6% 1/15/29 (b) | 40,000 | 38,095 | |
| 7.375% 1/15/31 (b) | 5,000 | 4,991 | |
| Crestwood Midstream Partners LP/Crestwood Midstream Finance Corp. 6% 2/1/29 (b) | 80,000 | 78,538 | |
| CVR Energy, Inc. 5.75% 2/15/28 (b) | 20,000 | 18,206 | |
| Energean PLC 6.5% 4/30/27 (b) | 40,000 | 36,484 | |
| Global Partners LP/GLP Finance Corp. 6.875% 1/15/29 | 35,000 | 33,075 | |
| Holly Energy Partners LP/Holly Energy Finance Corp. 5% 2/1/28 (b) | 40,000 | 37,523 | |
| MEG Energy Corp. 5.875% 2/1/29 (b) | 100,000 | 95,533 | |
| Murphy Oil Corp. 6.375% 7/15/28 | 30,000 | 29,981 | |
| New Fortress Energy, Inc. 6.5% 9/30/26 (b) | 178,000 | 165,455 | |
| Northern Oil & Gas, Inc. 8.125% 3/1/28 (b) | 30,000 | 30,072 | |
| Oceaneering International, Inc. 6% 2/1/28 | 50,000 | 47,004 | |
| SM Energy Co. 6.5% 7/15/28 | 30,000 | 29,325 | |
| Southwestern Energy Co. 5.375% 3/15/30 | 20,000 | 18,724 | |
| Sunnova Energy Corp. 5.875% 9/1/26 (b) | 80,000 | 70,397 | |
| Sunoco LP/Sunoco Finance Corp. 4.5% 5/15/29 | 90,000 | 81,391 | |
| Tallgrass Energy Partners LP / Tallgrass Energy Finance Corp.: | |||
| 6% 3/1/27 (b) | 25,000 | 23,956 | |
| 7.5% 10/1/25 (b) | 35,000 | 35,213 | |
| Teine Energy Ltd. 6.875% 4/15/29 (b) | 70,000 | 64,925 | |
| Transocean Titan Finance Ltd. 8.375% 2/1/28 (b) | 8,000 | 8,222 | |
| Transocean, Inc.: | |||
| 8% 2/1/27 (b) | 45,000 | 43,898 | |
| 8.75% 2/15/30 (b) | 9,500 | 9,719 | |
| 1,309,711 | |||
| Environmental - 2.9% | |||
| Covanta Holding Corp. 4.875% 12/1/29 (b) | 106,000 | 91,160 | |
| Darling Ingredients, Inc. 6% 6/15/30 (b) | 5,000 | 4,887 | |
| Madison IAQ LLC 5.875% 6/30/29 (b) | 30,000 | 25,260 | |
| Stericycle, Inc.: | |||
| 3.875% 1/15/29 (b) | 80,000 | 69,655 | |
| 5.375% 7/15/24 (b) | 70,000 | 69,754 | |
| 260,716 | |||
| Food & Drug Retail - 1.8% | |||
| Albertsons Companies LLC/Safeway, Inc./New Albertson's, Inc./Albertson's LLC: | |||
| 3.25% 3/15/26 (b) | 50,000 | 46,474 | |
| 4.875% 2/15/30 (b) | 25,000 | 22,938 | |
| Emergent BioSolutions, Inc. 3.875% 8/15/28 (b) | 35,000 | 16,800 | |
| Murphy Oil U.S.A., Inc. 3.75% 2/15/31 (b) | 25,000 | 21,030 | |
| Parkland Corp. 4.625% 5/1/30 (b) | 60,000 | 52,894 | |
| 160,136 | |||
| Food/Beverage/Tobacco - 1.7% | |||
| Performance Food Group, Inc. 4.25% 8/1/29 (b) | 20,000 | 17,601 | |
| Post Holdings, Inc.: | |||
| 4.5% 9/15/31 (b) | 30,000 | 25,845 | |
| 4.625% 4/15/30 (b) | 20,000 | 17,720 | |
| TreeHouse Foods, Inc. 4% 9/1/28 | 30,000 | 25,678 | |
| Triton Water Holdings, Inc. 6.25% 4/1/29 (b) | 45,000 | 38,252 | |
| U.S. Foods, Inc. 4.625% 6/1/30 (b) | 30,000 | 26,665 | |
| 151,761 | |||
| Healthcare - 7.9% | |||
| Akumin Escrow, Inc. 7.5% 8/1/28 (b) | 30,000 | 19,875 | |
| Cano Health, Inc. 6.25% 10/1/28 (b) | 59,000 | 20,060 | |
| Charles River Laboratories International, Inc. 3.75% 3/15/29 (b) | 10,000 | 8,826 | |
| Community Health Systems, Inc.: | |||
| 4.75% 2/15/31 (b) | 104,000 | 77,480 | |
| 5.25% 5/15/30 (b) | 70,000 | 55,204 | |
| 6.875% 4/15/29 (b) | 35,000 | 21,466 | |
| 8% 3/15/26 (b) | 20,000 | 19,523 | |
| DaVita HealthCare Partners, Inc. 3.75% 2/15/31 (b) | 67,000 | 53,355 | |
| Encompass Health Corp. 4.625% 4/1/31 | 30,000 | 26,308 | |
| Horizon Pharma U.S.A., Inc. 5.5% 8/1/27 (b) | 30,000 | 30,640 | |
| Jazz Securities DAC 4.375% 1/15/29 (b) | 20,000 | 17,919 | |
| Omega Healthcare Investors, Inc. 3.25% 4/15/33 | 17,000 | 12,688 | |
| Organon & Co. / Organon Foreign Debt Co-Issuer BV 5.125% 4/30/31 (b) | 45,000 | 38,340 | |
| Owens & Minor, Inc. 6.625% 4/1/30 (b) | 20,000 | 18,194 | |
| Pediatrix Medical Group, Inc. 5.375% 2/15/30 (b) | 95,000 | 86,635 | |
| RegionalCare Hospital Partners Holdings, Inc.: | |||
| 5.375% 1/15/29 (b) | 50,000 | 34,567 | |
| 9.875% 8/15/30 (b) | 10,000 | 9,875 | |
| RP Escrow Issuer LLC 5.25% 12/15/25 (b) | 15,000 | 11,553 | |
| Tenet Healthcare Corp. 6.125% 10/1/28 | 160,000 | 154,101 | |
| 716,609 | |||
| Homebuilders/Real Estate - 4.4% | |||
| Anywhere Real Estate Group LLC 7% 4/15/30 (b) | 8,000 | 7,210 | |
| Greystar Real Estate Partners 7.75% 9/1/30 (b) | 5,000 | 5,050 | |
| Howard Hughes Corp. 4.375% 2/1/31 (b) | 65,000 | 51,802 | |
| MPT Operating Partnership LP/MPT Finance Corp.: | |||
| 4.625% 8/1/29 | 25,000 | 18,054 | |
| 5% 10/15/27 | 190,000 | 150,096 | |
| Railworks Holdings LP 8.25% 11/15/28 (b) | 30,000 | 28,650 | |
| Realogy Group LLC/Realogy Co.-Issuer Corp. 5.25% 4/15/30 (b) | 1,000 | 694 | |
| Rithm Capital Corp. 6.25% 10/15/25 (b) | 10,000 | 9,425 | |
| Taylor Morrison Communities, Inc./Monarch Communities, Inc. 5.125% 8/1/30 (b) | 50,000 | 45,857 | |
| TRI Pointe Homes, Inc. 5.25% 6/1/27 | 40,000 | 38,150 | |
| Uniti Group LP / Uniti Group Finance, Inc. 10.5% 2/15/28 (b) | 45,000 | 44,894 | |
| 399,882 | |||
| Hotels - 0.9% | |||
| Hilton Domestic Operating Co., Inc. 3.625% 2/15/32 (b) | 100,000 | 83,630 | |
| Leisure - 3.3% | |||
| Carnival Corp.: | |||
| 5.75% 3/1/27 (b) | 6,000 | 5,637 | |
| 6% 5/1/29 (b) | 125,000 | 113,139 | |
| Constellation Merger Sub, Inc. 8.5% 9/15/25 (b) | 25,000 | 20,875 | |
| MajorDrive Holdings IV LLC 6.375% 6/1/29 (b) | 35,000 | 28,842 | |
| Royal Caribbean Cruises Ltd.: | |||
| 5.375% 7/15/27 (b) | 30,000 | 28,230 | |
| 5.5% 4/1/28 (b) | 95,000 | 88,906 | |
| Viking Cruises Ltd. 9.125% 7/15/31 (b) | 10,000 | 10,331 | |
| 295,960 | |||
| Metals/Mining - 3.8% | |||
| Coeur d'Alene Mines Corp. 5.125% 2/15/29 (b) | 30,000 | 26,297 | |
| Constellium NV 3.75% 4/15/29 (b) | 20,000 | 17,183 | |
| Eldorado Gold Corp. 6.25% 9/1/29 (b) | 35,000 | 29,835 | |
| ERO Copper Corp. 6.5% 2/15/30 (b) | 75,000 | 65,142 | |
| First Quantum Minerals Ltd. 6.875% 10/15/27 (b) | 30,000 | 28,990 | |
| FMG Resources Pty Ltd. 6.125% 4/15/32 (b) | 60,000 | 55,831 | |
| HudBay Minerals, Inc. 6.125% 4/1/29 (b) | 18,000 | 16,923 | |
| IAMGOLD Corp. 5.75% 10/15/28 (b) | 40,000 | 30,687 | |
| Mineral Resources Ltd. 8.5% 5/1/30 (b) | 75,000 | 75,268 | |
| 346,156 | |||
| Paper - 2.4% | |||
| Berry Global, Inc. 5.625% 7/15/27 (b) | 70,000 | 68,617 | |
| Clydesdale Acquisition Holdings, Inc. 6.625% 4/15/29 (b) | 40,000 | 38,062 | |
| Domtar Corp. 6.75% 10/1/28 (b) | 30,000 | 25,952 | |
| Mercer International, Inc. 5.125% 2/1/29 | 100,000 | 81,806 | |
| 214,437 | |||
| Publishing/Printing - 0.2% | |||
| Mcgraw-Hill Education, Inc. 8% 8/1/29 (b) | 23,000 | 20,478 | |
| Restaurants - 0.5% | |||
| Yum! Brands, Inc. 4.625% 1/31/32 | 50,000 | 44,738 | |
| Services - 8.3% | |||
| AECOM 5.125% 3/15/27 | 50,000 | 47,972 | |
| APX Group, Inc. 5.75% 7/15/29 (b) | 40,000 | 34,460 | |
| Aramark Services, Inc.: | |||
| 5% 4/1/25 (b) | 35,000 | 34,572 | |
| 5% 2/1/28 (b) | 40,000 | 37,317 | |
| Avis Budget Car Rental LLC/Avis Budget Finance, Inc.: | |||
| 5.375% 3/1/29 (b) | 12,000 | 11,016 | |
| 5.75% 7/15/27 (b) | 31,000 | 29,598 | |
| Brand Energy & Infrastructure Services, Inc. 10.375% 8/1/30 (b) | 35,000 | 36,095 | |
| Dun & Bradstreet Corp. 5% 12/15/29 (b) | 12,000 | 10,770 | |
| GEMS MENASA Cayman Ltd. 7.125% 7/31/26 (b) | 25,000 | 24,231 | |
| Hertz Corp. 4.625% 12/1/26 (b) | 50,000 | 45,270 | |
| Life Time, Inc. 8% 4/15/26 (b) | 85,000 | 84,363 | |
| Neptune BidCo U.S., Inc. 9.29% 4/15/29 (b) | 20,000 | 18,676 | |
| Sotheby's 7.375% 10/15/27 (b) | 30,000 | 27,311 | |
| StoneMor, Inc. 8.5% 5/15/29 (b) | 30,000 | 25,035 | |
| Uber Technologies, Inc. 4.5% 8/15/29 (b) | 233,000 | 213,335 | |
| WASH Multifamily Acquisition, Inc. 5.75% 4/15/26 (b) | 80,000 | 74,191 | |
| 754,212 | |||
| Steel - 0.2% | |||
| ATI, Inc. 7.25% 8/15/30 | 10,000 | 10,102 | |
| Infrabuild Australia Pty Ltd. 12% 10/1/24 (b) | 10,000 | 9,708 | |
| 19,810 | |||
| Super Retail - 4.4% | |||
| At Home Group, Inc. 4.875% 7/15/28 (b) | 30,000 | 14,427 | |
| Bath & Body Works, Inc.: | |||
| 6.75% 7/1/36 | 30,000 | 27,693 | |
| 6.95% 3/1/33 | 30,000 | 28,039 | |
| Carvana Co.: | |||
| 4.875% 9/1/29 (b) | 65,000 | 38,792 | |
| 9% 12/1/28 pay-in-kind (b) | 9,000 | 7,740 | |
| 9% 6/1/30 pay-in-kind (b) | 14,000 | 12,040 | |
| 9% 6/1/31 pay-in-kind (b) | 17,000 | 14,620 | |
| EG Global Finance PLC 6.75% 2/7/25 (b) | 90,000 | 88,679 | |
| LBM Acquisition LLC 6.25% 1/15/29 (b) | 40,000 | 34,903 | |
| Michaels Companies, Inc. 5.25% 5/1/28 (b) | 70,000 | 58,363 | |
| Nordstrom, Inc. 4.375% 4/1/30 | 30,000 | 23,969 | |
| Upbound Group, Inc. 6.375% 2/15/29 (b) | 50,000 | 45,425 | |
| 394,690 | |||
| Technology - 11.4% | |||
| Athenahealth Group, Inc. 6.5% 2/15/30 (b) | 30,000 | 26,054 | |
| Atkore, Inc. 4.25% 6/1/31 (b) | 30,000 | 25,798 | |
| Black Knight InfoServ LLC 3.625% 9/1/28 (b) | 30,000 | 27,600 | |
| Block, Inc. 3.5% 6/1/31 | 107,000 | 87,736 | |
| Cloud Software Group, Inc. 9% 9/30/29 (b) | 20,000 | 17,878 | |
| Coherent Corp. 5% 12/15/29 (b) | 15,000 | 13,323 | |
| CommScope, Inc. 4.75% 9/1/29 (b) | 45,000 | 33,441 | |
| Elastic NV 4.125% 7/15/29 (b) | 55,000 | 47,280 | |
| Entegris Escrow Corp. 5.95% 6/15/30 (b) | 76,000 | 72,779 | |
| Entegris, Inc. 3.625% 5/1/29 (b) | 60,000 | 51,569 | |
| Gen Digital, Inc.: | |||
| 5% 4/15/25 (b) | 55,000 | 53,916 | |
| 7.125% 9/30/30 (b) | 30,000 | 30,202 | |
| Go Daddy Operating Co. LLC / GD Finance Co., Inc. 3.5% 3/1/29 (b) | 160,000 | 137,527 | |
| GrafTech Global Enterprises, Inc. 9.875% 12/15/28 (b) | 5,000 | 4,875 | |
| MicroStrategy, Inc. 6.125% 6/15/28 (b) | 10,000 | 8,952 | |
| NCR Corp.: | |||
| 5.125% 4/15/29 (b) | 20,000 | 18,189 | |
| 6.125% 9/1/29 (b) | 27,500 | 28,323 | |
| ON Semiconductor Corp. 3.875% 9/1/28 (b) | 15,000 | 13,353 | |
| Open Text Corp.: | |||
| 3.875% 2/15/28 (b) | 30,000 | 26,698 | |
| 3.875% 12/1/29 (b) | 55,000 | 46,641 | |
| Open Text Holdings, Inc.: | |||
| 4.125% 2/15/30 (b) | 10,000 | 8,617 | |
| 4.125% 12/1/31 (b) | 18,000 | 14,941 | |
| Rackspace Hosting, Inc. 3.5% 2/15/28 (b) | 15,000 | 7,120 | |
| Seagate HDD Cayman: | |||
| 4.125% 1/15/31 | 20,000 | 16,335 | |
| 4.75% 1/1/25 | 35,000 | 34,282 | |
| 5.75% 12/1/34 | 15,000 | 13,284 | |
| 8.25% 12/15/29 (b) | 10,000 | 10,490 | |
| Sensata Technologies BV: | |||
| 4% 4/15/29 (b) | 30,000 | 26,343 | |
| 5% 10/1/25 (b) | 35,000 | 34,111 | |
| TTM Technologies, Inc. 4% 3/1/29 (b) | 30,000 | 26,058 | |
| Uber Technologies, Inc. 8% 11/1/26 (b) | 20,000 | 20,364 | |
| Virtusa Corp. 7.125% 12/15/28 (b) | 40,000 | 32,750 | |
| VM Consolidated, Inc. 5.5% 4/15/29 (b) | 20,000 | 18,229 | |
| 1,035,058 | |||
| Telecommunications - 4.8% | |||
| Altice Financing SA 5.75% 8/15/29 (b) | 90,000 | 71,295 | |
| Altice France Holding SA 6% 2/15/28 (b) | 75,000 | 32,813 | |
| Altice France SA 5.125% 7/15/29 (b) | 35,000 | 24,741 | |
| C&W Senior Financing Designated Activity Co. 6.875% 9/15/27 (b) | 50,000 | 46,000 | |
| Frontier Communications Holdings LLC 8.75% 5/15/30 (b) | 25,000 | 24,298 | |
| IHS Netherlands Holdco BV 8% 9/18/27 (b) | 10,000 | 8,937 | |
| Level 3 Financing, Inc. 3.75% 7/15/29 (b) | 110,000 | 65,616 | |
| Millicom International Cellular SA 4.5% 4/27/31 (b) | 40,000 | 31,414 | |
| SBA Communications Corp. 3.125% 2/1/29 | 15,000 | 12,843 | |
| Uniti Group, Inc. 6% 1/15/30 (b) | 130,000 | 85,874 | |
| Virgin Media Finance PLC 5% 7/15/30 (b) | 30,000 | 24,339 | |
| Zayo Group Holdings, Inc. 6.125% 3/1/28 (b) | 15,000 | 9,750 | |
| 437,920 | |||
| Textiles/Apparel - 0.2% | |||
| Crocs, Inc. 4.125% 8/15/31 (b) | 10,000 | 7,925 | |
| Victoria's Secret & Co. 4.625% 7/15/29 (b) | 15,000 | 10,860 | |
| 18,785 | |||
| Transportation Ex Air/Rail - 0.3% | |||
| Seaspan Corp. 5.5% 8/1/29 (b) | 40,000 | 31,090 | |
| Utilities - 1.3% | |||
| DPL, Inc. 4.35% 4/15/29 | 30,000 | 25,838 | |
| PG&E Corp.: | |||
| 5% 7/1/28 | 50,000 | 45,995 | |
| 5.25% 7/1/30 | 25,000 | 22,211 | |
| TerraForm Power Operating LLC 4.75% 1/15/30 (b) | 30,000 | 25,710 | |
| 119,754 | |||
TOTAL NONCONVERTIBLE BONDS | 8,542,829 | ||
| TOTAL CORPORATE BONDS (Cost $9,158,660) | 8,695,872 | ||
| Common Stocks - 0.7% | |||
| Shares | Value ($) | ||
| Automotive & Auto Parts - 0.1% | |||
| Aptiv PLC (e) | 100 | 10,145 | |
| Capital Goods - 0.2% | |||
| Regal Rexnord Corp. | 80 | 12,975 | |
| Energy - 0.1% | |||
| New Fortress Energy, Inc. | 400 | 12,416 | |
| Healthcare - 0.1% | |||
| Centene Corp. (e) | 205 | 12,638 | |
| Technology - 0.2% | |||
| Coherent Corp. (e) | 380 | 14,299 | |
| TOTAL COMMON STOCKS (Cost $62,888) | 62,473 | ||
| Bank Loan Obligations - 0.9% | |||
Principal Amount (a) | Value ($) | ||
| Leisure - 0.2% | |||
| ClubCorp Holdings, Inc. Tranche B 1LN, term loan 3 month U.S. LIBOR + 2.750% 8.2879% 9/18/24 (c)(d)(f) | 24,934 | 24,573 | |
| Services - 0.4% | |||
| Ascend Learning LLC 2LN, term loan CME Term SOFR 1 Month Index + 5.750% 11.1811% 12/10/29 (c)(d)(f) | 5,000 | 4,265 | |
| Finastra U.S.A., Inc. Tranche 2LN, term loan 3 month U.S. LIBOR + 7.250% 12.981% 6/13/25 (c)(d)(f) | 18,000 | 17,974 | |
| Neptune BidCo U.S., Inc. Tranche B 1LN, term loan CME Term SOFR 1 Month Index + 5.000% 10.3985% 4/11/29 (c)(d)(f) | 14,963 | 13,610 | |
TOTAL SERVICES | 35,849 | ||
| Technology - 0.3% | |||
| Ultimate Software Group, Inc.: | |||
| 1LN, term loan 1 month U.S. LIBOR + 3.250% 8.6184% 5/3/26 (c)(d)(f) | 19,949 | 19,926 | |
| 2LN, term loan CME Term SOFR 3 Month Index + 5.250% 10.6184% 5/3/27 (c)(d)(f) | 5,000 | 4,965 | |
TOTAL TECHNOLOGY | 24,891 | ||
| TOTAL BANK LOAN OBLIGATIONS (Cost $81,491) | 85,313 | ||
| Preferred Securities - 0.7% | |||
Principal Amount (a) | Value ($) | ||
| Air Transportation - 0.3% | |||
| AerCap Holdings NV 5.875% 10/10/79 (c) | 30,000 | 29,659 | |
| Banks & Thrifts - 0.4% | |||
| Ally Financial, Inc. 4.7% (c)(g) | 50,000 | 35,231 | |
| TOTAL PREFERRED SECURITIES (Cost $76,118) | 64,890 | ||
| Money Market Funds - 0.9% | |||
| Shares | Value ($) | ||
Fidelity Cash Central Fund 5.43% (h) (Cost $76,427) | 76,411 | 76,427 | |
| TOTAL INVESTMENT IN SECURITIES - 99.3% (Cost $9,455,584) | 8,984,975 |
NET OTHER ASSETS (LIABILITIES) - 0.7% | 61,258 |
| NET ASSETS - 100.0% | 9,046,233 |
| (a) | Amount is stated in United States dollars unless otherwise noted. |
| (b) | Security exempt from registration under Rule 144A of the Securities Act of 1933. These securities may be resold in transactions exempt from registration, normally to qualified institutional buyers. At the end of the period, the value of these securities amounted to $6,976,650 or 77.1% of net assets. |
| (c) | Coupon rates for floating and adjustable rate securities reflect the rates in effect at period end. |
| (d) | Coupon is indexed to a floating interest rate which may be multiplied by a specified factor and/or subject to caps or floors. |
| (e) | Non-income producing |
| (f) | Remaining maturities of bank loan obligations may be less than the stated maturities shown as a result of contractual or optional prepayments by the borrower. Such prepayments cannot be predicted with certainty. |
| (g) | Security is perpetual in nature with no stated maturity date. |
| (h) | Affiliated fund that is generally available only to investment companies and other accounts managed by Fidelity Investments. The rate quoted is the annualized seven-day yield of the fund at period end. A complete unaudited listing of the fund's holdings as of its most recent quarter end is available upon request. In addition, each Fidelity Central Fund's financial statements, which are not covered by the Fund's Report of Independent Registered Public Accounting Firm, are available on the SEC's website or upon request. |
| Affiliate | Value, beginning of period ($) | Purchases ($) | Sales Proceeds ($) | Dividend Income ($) | Realized Gain (loss) ($) | Change in Unrealized appreciation (depreciation) ($) | Value, end of period ($) | % ownership, end of period |
| Fidelity Cash Central Fund 5.43% | 299,904 | 1,891,622 | 2,115,099 | 5,622 | - | - | 76,427 | 0.0% |
| Total | 299,904 | 1,891,622 | 2,115,099 | 5,622 | - | - | 76,427 | |
| Valuation Inputs at Reporting Date: | ||||
| Description | Total ($) | Level 1 ($) | Level 2 ($) | Level 3 ($) |
Investments in Securities: | ||||
| Equities: | ||||
Consumer Discretionary | 10,145 | 10,145 | - | - |
Energy | 12,416 | 12,416 | - | - |
Health Care | 12,638 | 12,638 | - | - |
Industrials | 12,975 | 12,975 | - | - |
Information Technology | 14,299 | 14,299 | - | - |
| Corporate Bonds | 8,695,872 | - | 8,695,872 | - |
| Bank Loan Obligations | 85,313 | - | 85,313 | - |
| Preferred Securities | 64,890 | - | 64,890 | - |
| Money Market Funds | 76,427 | 76,427 | - | - |
| Total Investments in Securities: | 8,984,975 | 138,900 | 8,846,075 | - |
| Statement of Assets and Liabilities | ||||
| August 31, 2023 | ||||
| Assets | ||||
| Investment in securities, at value - See accompanying schedule: | ||||
Unaffiliated issuers (cost $9,379,157) | $ | 8,908,548 | ||
Fidelity Central Funds (cost $76,427) | 76,427 | |||
| Total Investment in Securities (cost $9,455,584) | $ | 8,984,975 | ||
| Dividends receivable | 35 | |||
| Interest receivable | 141,399 | |||
| Distributions receivable from Fidelity Central Funds | 454 | |||
Total assets | 9,126,863 | |||
| Liabilities | ||||
| Payable for investments purchased | $ | 23,487 | ||
| Distributions payable | 53,000 | |||
| Accrued management fee | 4,143 | |||
| Total Liabilities | 80,630 | |||
| Net Assets | $ | 9,046,233 | ||
| Net Assets consist of: | ||||
| Paid in capital | $ | 10,029,341 | ||
| Total accumulated earnings (loss) | (983,108) | |||
| Net Assets | $ | 9,046,233 | ||
Net Asset Value, offering price and redemption price per share ($9,046,233 ÷ 200,000 shares) | $ | 45.23 | ||
| Statement of Operations | ||||
Year ended August 31, 2023 | ||||
| Investment Income | ||||
| Dividends | $ | 5,378 | ||
| Interest | 647,133 | |||
| Income from Fidelity Central Funds | 5,622 | |||
| Total Income | 658,133 | |||
| Expenses | ||||
| Management fee | $ | 49,401 | ||
| Independent trustees' fees and expenses | 44 | |||
| Total expenses before reductions | 49,445 | |||
| Expense reductions | (353) | |||
| Total expenses after reductions | 49,092 | |||
| Net Investment income (loss) | 609,041 | |||
| Realized and Unrealized Gain (Loss) | ||||
| Net realized gain (loss) on: | ||||
| Investment Securities: | ||||
| Unaffiliated issuers | (359,381) | |||
| Total net realized gain (loss) | (359,381) | |||
| Change in net unrealized appreciation (depreciation) on investment securities | 341,668 | |||
| Net gain (loss) | (17,713) | |||
| Net increase (decrease) in net assets resulting from operations | $ | 591,328 | ||
| Statement of Changes in Net Assets | ||||
Year ended August 31, 2023 | For the period February 15, 2022 (commencement of operations) through August 31, 2022 | |||
| Increase (Decrease) in Net Assets | ||||
| Operations | ||||
| Net investment income (loss) | $ | 609,041 | $ | 280,716 |
| Net realized gain (loss) | (359,381) | (169,092) | ||
| Change in net unrealized appreciation (depreciation) | 341,668 | (812,277) | ||
| Net increase (decrease) in net assets resulting from operations | 591,328 | (700,653) | ||
| Distributions to shareholders | (596,600) | (277,200) | ||
| Share transactions | ||||
| Proceeds from sales of shares | - | 10,029,358 | ||
Net increase (decrease) in net assets resulting from share transactions | - | 10,029,358 | ||
| Total increase (decrease) in net assets | (5,272) | 9,051,505 | ||
| Net Assets | ||||
| Beginning of period | 9,051,505 | - | ||
| End of period | $ | 9,046,233 | $ | 9,051,505 |
| Other Information | ||||
| Shares | ||||
| Sold | - | 200,000 | ||
| Net increase (decrease) | - | 200,000 | ||
| Fidelity® Sustainable High Yield ETF |
| Years ended August 31, | 2023 | 2022 A | ||
Selected Per-Share Data | ||||
| Net asset value, beginning of period | $ | 45.26 | $ | 50.00 |
| Income from Investment Operations | ||||
Net investment income (loss) B,C | 3.045 | 1.404 | ||
| Net realized and unrealized gain (loss) | (.092) | (4.758) | ||
| Total from investment operations | 2.953 | (3.354) | ||
| Distributions from net investment income | (2.983) | (1.386) | ||
| Total distributions | (2.983) | (1.386) | ||
| Net asset value, end of period | $ | 45.23 | $ | 45.26 |
Total Return D,E,F | 6.83% | (6.78)% | ||
Ratios to Average Net Assets C,G,H | ||||
| Expenses before reductions | .55% | .55% I | ||
| Expenses net of fee waivers, if any | .55% | .55% I | ||
| Expenses net of all reductions | .55% | .55% I | ||
| Net investment income (loss) | 6.78% | 5.49% I | ||
| Supplemental Data | ||||
| Net assets, end of period (000 omitted) | $ | 9,046 | $ | 9,052 |
Portfolio turnover rate J | 48% | 24% K |
| Fidelity Central Fund | Investment Manager | Investment Objective | Investment Practices | Expense RatioA |
| Fidelity Money Market Central Funds | Fidelity Management & Research Company LLC (FMR) | Each fund seeks to obtain a high level of current income consistent with the preservation of capital and liquidity. | Short-term Investments | Less than .005% |
| Gross unrealized appreciation | $156,196 |
| Gross unrealized depreciation | (627,881) |
| Net unrealized appreciation (depreciation) | $(471,685) |
| Tax Cost | $9,456,660 |
| Undistributed ordinary income | $15,457 |
| Capital loss carryforward | $(526,881) |
| Net unrealized appreciation (depreciation) on securities and other investments | $(471,685) |
Short-term | $(352,215) |
Long-term | (174,666) |
| Total capital loss carryforward | $(526,881) |
| August 31, 2023 | August 31, 2022 | |
| Ordinary Income | $596,600 | $277,200 |
| Purchases ($) | Sales ($) | |
| Fidelity Sustainable High Yield ETF | 4,308,412 | 4,155,925 |
| Purchases ($) | Sales ($) | Realized Gain (Loss) ($) | |
| Fidelity Sustainable High Yield ETF | 9,020 | - | - |
| The Example is based on an investment of $1,000 invested at the beginning of the period and held for the entire period (March 1, 2023 to August 31, 2023). |
Annualized Expense Ratio- A | Beginning Account Value March 1, 2023 | Ending Account Value August 31, 2023 | Expenses Paid During Period- C March 1, 2023 to August 31, 2023 | |||||||
| Fidelity® Sustainable High Yield ETF | .55% | |||||||||
| Actual | $ 1,000 | $ 1,043.10 | $ 2.83 | |||||||
Hypothetical-B | $ 1,000 | $ 1,022.43 | $ 2.80 | |||||||
 |
Item 2.
Code of Ethics
As of the end of the period, August 31, 2023, Fidelity Covington Trust (the trust) has adopted a code of ethics, as defined in Item 2 of Form N-CSR, that applies to its President and Treasurer and its Chief Financial Officer. A copy of the code of ethics is filed as an exhibit to this Form N-CSR.
Item 3.
Audit Committee Financial Expert
The Board of Trustees of the trust has determined that Donald F. Donahue is an audit committee financial expert, as defined in Item 3 of Form N-CSR. Mr. Donahue is independent for purposes of Item 3 of Form N-CSR.
Item 4.
Principal Accountant Fees and Services
Fees and Services
The following table presents fees billed by PricewaterhouseCoopers LLP (“PwC”) in each of the last two fiscal years for services rendered to Fidelity High Yield Factor ETF, Fidelity Preferred Securities & Income ETF, and Fidelity Sustainable High Yield ETF (the “Funds”):
Services Billed by PwC
August 31, 2023 FeesA
Audit Fees | Audit-Related Fees | Tax Fees | All Other Fees | |
Fidelity High Yield Factor ETF | $37,900 | $- | $7,600 | $1,200 |
Fidelity Preferred Securities & Income ETF | $38,200 | $- | $7,600 | $1,200 |
Fidelity Sustainable High Yield ETF | $37,100 | $- | $7,700 | $1,100 |
August 31, 2022 FeesA,B
Audit Fees | Audit-Related Fees | Tax Fees | All Other Fees | |
Fidelity High Yield Factor ETF | $36,300 | $- | $7,400 | $1,100 |
Fidelity Preferred Securities & Income ETF | $36,400 | $- | $7,400 | $1,100 |
Fidelity Sustainable High Yield ETF | $30,600 | $- | $7,100 | $600 |
A Amounts may reflect rounding.
B Fidelity Sustainable High Yield ETF commenced operations on February 15, 2022.
The following table(s) present(s) fees billed by PwC that were required to be approved by the Audit Committee for services that relate directly to the operations and financial reporting of the Fund(s) and that are rendered on behalf of Fidelity Management & Research Company LLC ("FMR") and entities controlling, controlled by, or under common control with FMR (not including any sub-adviser whose role is primarily portfolio management and is subcontracted with or overseen by another investment adviser) that provide ongoing services to the Fund(s) (“Fund Service Providers”):
Services Billed by PwC
August 31, 2023A | August 31, 2022A,B | |
Audit-Related Fees | $8,284,200 | $7,914,600 |
Tax Fees | $1,000 | $353,200 |
All Other Fees | $- | $- |
A Amounts may reflect rounding.
B May include amounts billed prior to the Fidelity Sustainable High Yield ETF’s commencement of operations.
“Audit-Related Fees” represent fees billed for assurance and related services that are reasonably related to the performance of the fund audit or the review of the fund's financial statements and that are not reported under Audit Fees.
“Tax Fees” represent fees billed for tax compliance, tax advice or tax planning that relate directly to the operations and financial reporting of the fund.
“All Other Fees” represent fees billed for services provided to the fund or Fund Service Provider, a significant portion of which are assurance related, that relate directly to the operations and financial reporting of the fund, excluding those services that are reported under Audit Fees, Audit-Related Fees or Tax Fees.
Assurance services must be performed by an independent public accountant.
* * *
The aggregate non-audit fees billed by PwC for services rendered to the Fund(s), FMR (not including any sub-adviser whose role is primarily portfolio management and is subcontracted with or overseen by another investment adviser), and any Fund Service Provider for each of the last two fiscal years of the Fund(s) are as follows:
Billed By | August 31, 2023A | August 31, 2022A,B | |
PwC | $13,614,200 | $13,259,900 | |
A Amounts may reflect rounding.
B May include amounts billed prior to the Fidelity Sustainable High Yield ETF’s commencement of operations.
The trust's Audit Committee has considered non-audit services that were not pre-approved that were provided by PwC to Fund Service Providers to be compatible with maintaining the independence of PwC in its(their) audit of the Fund(s), taking into account representations from PwC, in accordance with Public Company Accounting Oversight Board rules, regarding its independence from the Fund(s) and its(their) related entities and FMR’s review of the appropriateness and permissibility under applicable law of such non-audit services prior to their provision to the Fund(s) Service Providers.
Audit Committee Pre-Approval Policies and Procedures
The trust’s Audit Committee must pre-approve all audit and non-audit services provided by a fund’s independent registered public accounting firm relating to the operations or financial reporting of the fund. Prior to the commencement of any audit or non-audit services to a fund, the Audit Committee reviews the services to determine whether they are appropriate and permissible under applicable law.
The Audit Committee has adopted policies and procedures to, among other purposes, provide a framework for the Committee’s consideration of non-audit services by the audit firms that audit the Fidelity funds. The policies and procedures require that any non-audit service provided by a fund audit firm to a Fidelity fund and any non-audit service provided by a fund auditor to a Fund Service Provider that relates directly to the operations and financial reporting of a Fidelity fund (“Covered Service”) are subject to approval by the Audit Committee before such service is provided.
All Covered Services must be approved in advance of provision of the service either: (i) by formal resolution of the Audit Committee, or (ii) by oral or written approval of the service by the Chair of the Audit Committee (or if the Chair is unavailable, such other member of the Audit Committee as may be designated by the Chair to act in the Chair’s absence). The approval contemplated by (ii) above is permitted where the Treasurer determines that action on such an engagement is necessary before the next meeting of the Audit Committee.
Non-audit services provided by a fund audit firm to a Fund Service Provider that do not relate directly to the operations and financial reporting of a Fidelity fund are reported to the Audit Committee periodically.
Non-Audit Services Approved Pursuant to Rule 2-01(c)(7)(i)(C) and (ii) of Regulation S-X (“De Minimis Exception”)
There were no non-audit services approved or required to be approved by the Audit Committee pursuant to the De Minimis Exception during the Fund’s(s’) last two fiscal years relating to services provided to (i) the Fund(s) or (ii) any Fund Service Provider that relate directly to the operations and financial reporting of the Fund(s).
The Registrant has not retained, for the preparation of the audit report on the financial statements included in the Form N-CSR, a registered public accounting firm that has a branch or office that is located in a foreign jurisdiction and that the Public Company Accounting Oversight Board (the “PCAOB”) has determined that the PCAOB is unable to inspect or investigate completely because of a position taken by an authority in the foreign jurisdiction.
The Registrant is not a “foreign issuer,” as defined in 17 CFR 240.3b-4.
Item 5.
Audit Committee of Listed Registrants
The Audit Committee is a separately-designated standing audit committee in accordance with Section 3(a)(58)(A) of the Securities Exchange Act of 1934. As of August 31, 2023, the members of the Audit Committee were Donald F. Donahue, Thomas Bostick, Thomas Kennedy and Susan Tomasky.
Item 6.
Investments
(a)
Not applicable.
(b)
Not applicable.
Item 7.
Disclosure of Proxy Voting Policies and Procedures for Closed-End Management Investment Companies
Not applicable.
Item 8.
Portfolio Managers of Closed-End Management Investment Companies
Not applicable.
Item 9.
Purchase of Equity Securities by Closed-End Management Investment Company and Affiliated Purchasers
Not applicable.
Item 10.
Submission of Matters to a Vote of Security Holders
There were no material changes to the procedures by which shareholders may recommend nominees to the trust’s Board of Trustees.
Item 11.
Controls and Procedures
(a)(i) The President and Treasurer and the Chief Financial Officer have concluded that the trust’s disclosure controls and procedures (as defined in Rule 30a-3(c) under the Investment Company Act) provide reasonable assurances that material information relating to the trust is made known to them by the appropriate persons, based on their evaluation of these controls and procedures as of a date within 90 days of the filing date of this report.
(a)(ii) There was no change in the trust’s internal control over financial reporting (as defined in Rule 30a-3(d) under the Investment Company Act) that occurred during the period covered by this report that has materially affected, or is reasonably likely to materially affect, the trust’s internal control over financial reporting.
Item 12.
Disclosure of Securities Lending Activities for Closed-End Management
Investment Companies
Not applicable.
Item 13.
Exhibits
(a) | (1) | Code of Ethics pursuant to Item 2 of Form N-CSR is filed and attached hereto as EX-99.CODE ETH. |
(a) | (2) | |
(a) | (3) | Not applicable. |
(b) |
SIGNATURES
Pursuant to the requirements of the Securities Exchange Act of 1934 and the Investment Company Act of 1940, the registrant has duly caused this report to be signed on its behalf by the undersigned, thereunto duly authorized.
Fidelity Covington Trust
By: | /s/Stacie M. Smith |
Stacie M. Smith | |
President and Treasurer | |
Date: | October 23, 2023 |
Pursuant to the requirements of the Securities Exchange Act of 1934 and the Investment Company Act of 1940, this report has been signed below by the following persons on behalf of the registrant and in the capacities and on the dates indicated.
By: | /s/Stacie M. Smith |
Stacie M. Smith | |
President and Treasurer | |
Date: | October 23, 2023 |
By: | /s/John J. Burke III |
John J. Burke III | |
Chief Financial Officer | |
Date: | October 23, 2023 |