UNITED STATES
SECURITIES AND EXCHANGE COMMISSION
Washington, D.C. 20549
FORM N-CSR
CERTIFIED SHAREHOLDER REPORT OF REGISTERED
MANAGEMENT INVESTMENT COMPANIES
Investment Company Act file number 811-07319
Fidelity Covington Trust
(Exact name of registrant as specified in charter)
245 Summer St., Boston, Massachusetts 02210
(Address of principal executive offices) (Zip code)
Margaret Carey, Secretary
245 Summer St.
Boston, Massachusetts 02210
(Name and address of agent for service)
Registrant's telephone number, including area code:
617-563-7000
Date of fiscal year end: | October 31 |
Date of reporting period: | October 31, 2023 |
Item 1.
Reports to Stockholders


Contents
| Average Annual Total Returns | |||
Periods ended October 31, 2023 | Past 1 year | Life of Fund |
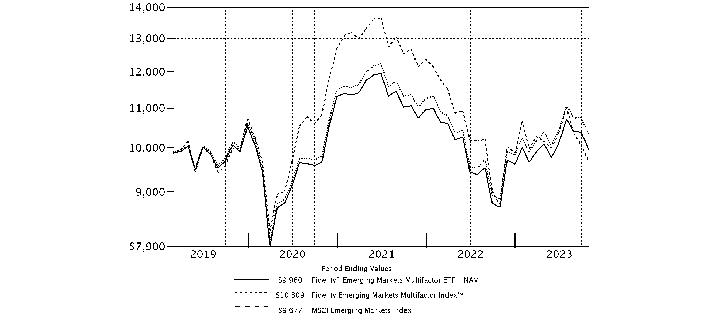
Fidelity® Emerging Markets Multifactor ETF - NAV A | 14.76% | -0.08% |
Fidelity® Emerging Markets Multifactor ETF - Market Price B | 15.48% | 0.15% |
Fidelity Emerging Markets Multifactor Index℠ A | 16.37% | 0.65% |
MSCI Emerging Markets Index A | 10.84% | -0.70% |
| $10,000 Over Life of Fund |
Let's say hypothetically that $10,000 was invested in Fidelity® Emerging Markets Multifactor ETF - NAV, on February 26, 2019, when the fund started. The chart shows how the value of your investment would have changed, and also shows how the Fidelity Emerging Markets Multifactor Index℠ and the MSCI Emerging Markets Index performed over the same period. |
 |
Top Holdings (% of Fund's net assets) | ||
| Tencent Holdings Ltd. (China, Interactive Media & Services) | 3.7 | |
| Samsung Electronics Co. Ltd. (Korea (South), Technology Hardware, Storage & Peripherals) | 3.4 | |
| Alibaba Group Holding Ltd. (China, Broadline Retail) | 1.8 | |
| Emaar Properties PJSC (United Arab Emirates, Real Estate Management & Development) | 1.7 | |
| C&D International Investment Group Ltd. (China, Real Estate Management & Development) | 1.6 | |
| Terrafina (Mexico, Equity Real Estate Investment Trusts (REITs)) | 1.5 | |
| Turkiye Petrol Rafinerileri A/S (Turkey, Oil, Gas & Consumable Fuels) | 1.4 | |
| HDFC Bank Ltd. (India, Banks) | 1.4 | |
| Ruentex Development Co. Ltd. (Taiwan, Real Estate Management & Development) | 1.4 | |
| Coal India Ltd. (India, Oil, Gas & Consumable Fuels) | 1.3 | |
| 19.2 | ||
| Market Sectors (% of Fund's net assets) | ||
| Financials | 20.3 | |
| Information Technology | 15.5 | |
| Communication Services | 13.5 | |
| Energy | 11.0 | |
| Consumer Staples | 9.8 | |
| Consumer Discretionary | 9.5 | |
| Utilities | 7.5 | |
| Real Estate | 6.2 | |
| Materials | 3.7 | |
| Industrials | 2.8 | |
Asset Allocation (% of Fund's net assets) |
 |
Futures - 0.2% |
Geographic Diversification (% of Fund's net assets) |
 |
* Includes Short-Term investments and Net Other Assets (Liabilities). Percentages are adjusted for the effect of derivatives, if applicable. |
| Common Stocks - 98.2% | |||
| Shares | Value ($) | ||
| Brazil - 2.7% | |||
| Banco do Brasil SA | 12,900 | 123,679 | |
| BB Seguridade Participacoes SA | 14,900 | 90,883 | |
| CPFL Energia SA (a) | 35,200 | 233,410 | |
| Itausa-Investimentos Itau SA | 1,011 | 1,720 | |
| TIM SA | 35,200 | 105,886 | |
| Vale SA | 9,200 | 125,877 | |
TOTAL BRAZIL | 681,455 | ||
| Chile - 0.4% | |||
| Banco de Chile | 906,616 | 92,843 | |
| China - 25.3% | |||
| Agricultural Bank of China Ltd. (H Shares) | 299,000 | 110,435 | |
| Alibaba Group Holding Ltd. (a) | 45,700 | 467,536 | |
| Anta Sports Products Ltd. | 7,600 | 85,814 | |
| Autohome, Inc. ADR Class A | 3,278 | 87,687 | |
| Baidu, Inc. Class A (a) | 13,850 | 181,785 | |
| Bank of China Ltd. (H Shares) | 417,000 | 146,024 | |
| Bank of Communications Co. Ltd. (H Shares) | 169,000 | 100,001 | |
| Beijing Enterprises Holdings Ltd. | 78,000 | 259,681 | |
| Bosideng International Holdings Ltd. | 110,000 | 43,440 | |
| Brilliance China Automotive Holdings Ltd. | 98,000 | 44,963 | |
| C&D International Investment Group Ltd. | 179,175 | 402,105 | |
| China CITIC Bank Corp. Ltd. (H Shares) | 140,000 | 62,444 | |
| China Construction Bank Corp. (H Shares) | 407,000 | 230,949 | |
| China Pacific Insurance (Group) Co. Ltd. (H Shares) | 29,400 | 72,442 | |
| China Railway Group Ltd. (H Shares) | 81,000 | 38,199 | |
| China Shenhua Energy Co. Ltd. (H Shares) | 96,000 | 294,456 | |
| China Tower Corp. Ltd. (H Shares) (b) | 1,022,000 | 95,348 | |
| CITIC Pacific Ltd. | 53,000 | 45,044 | |
| Daqo New Energy Corp. ADR (a) | 3,052 | 77,704 | |
| Fuyao Glass Industries Group Co. Ltd. (H Shares) (b) | 12,800 | 58,319 | |
| Haier Smart Home Co. Ltd. | 22,400 | 64,126 | |
| Hello Group, Inc. ADR | 9,502 | 67,274 | |
| Hengan International Group Co. Ltd. | 64,000 | 214,298 | |
| Industrial & Commercial Bank of China Ltd. (H Shares) | 369,000 | 177,318 | |
| Inner Mongolia Yitai Coal Co. Ltd. (B Shares) (a) | 163,437 | 224,236 | |
| Jiangxi Copper Co. Ltd. (H Shares) | 45,000 | 63,722 | |
| Jiumaojiu International Holdings Ltd. (b) | 28,000 | 30,417 | |
| Kingboard Chemical Holdings Ltd. | 34,000 | 82,647 | |
| Lenovo Group Ltd. | 102,000 | 118,626 | |
| MINISO Group Holding Ltd. ADR | 1,895 | 47,962 | |
| NetEase, Inc. | 11,400 | 245,204 | |
| PDD Holdings, Inc. ADR (a) | 1,832 | 185,801 | |
| People's Insurance Co. of China Group Ltd. (H Shares) | 170,000 | 56,054 | |
| PetroChina Co. Ltd. (H Shares) | 428,000 | 278,966 | |
| PICC Property & Casualty Co. Ltd. (H Shares) | 68,000 | 77,693 | |
| Pop Mart International Group Ltd. (b) | 19,200 | 52,879 | |
| Shenzhou International Group Holdings Ltd. | 6,800 | 66,700 | |
| Tencent Holdings Ltd. | 25,400 | 938,791 | |
| Tencent Music Entertainment Group ADR (a) | 16,970 | 123,202 | |
| Tongcheng Travel Holdings Ltd. (a) | 22,800 | 43,533 | |
| Topsports International Holdings Ltd. (b) | 58,000 | 48,774 | |
| TravelSky Technology Ltd. (H Shares) | 27,000 | 42,581 | |
| Trip.com Group Ltd. (a) | 2,600 | 89,318 | |
| Vipshop Holdings Ltd. ADR (a) | 2,750 | 39,215 | |
| Yadea Group Holdings Ltd. (b) | 24,000 | 43,862 | |
| Yangzijiang Shipbuilding Holdings Ltd. | 33,600 | 35,561 | |
| Yum China Holdings, Inc. | 1,699 | 89,299 | |
| Zhongsheng Group Holdings Ltd. Class H | 16,500 | 38,042 | |
TOTAL CHINA | 6,490,477 | ||
| Czech Republic - 1.2% | |||
| CEZ A/S | 7,159 | 305,860 | |
| Egypt - 0.5% | |||
| Commercial International Bank SAE | 67,584 | 131,890 | |
| Greece - 0.8% | |||
| Jumbo SA | 3,477 | 91,365 | |
| OPAP SA | 6,027 | 101,929 | |
TOTAL GREECE | 193,294 | ||
| Hong Kong - 1.1% | |||
| WH Group Ltd. (b) | 490,500 | 292,748 | |
| Hungary - 1.1% | |||
| MOL Hungarian Oil and Gas PLC Series A (For. Reg.) | 34,763 | 275,991 | |
| India - 15.2% | |||
| Apollo Tyres Ltd. | 16,721 | 76,577 | |
| Bajaj Auto Ltd. | 1,614 | 103,015 | |
| Bank of Baroda | 32,715 | 77,093 | |
| Bharat Electronics Ltd. | 48,481 | 77,591 | |
| Canara Bank Ltd. | 18,557 | 85,665 | |
| Coal India Ltd. | 90,755 | 342,544 | |
| Eicher Motors Ltd. | 2,427 | 96,066 | |
| Federal Bank Ltd. | 48,654 | 82,192 | |
| GAIL India Ltd. | 199,250 | 285,980 | |
| HCL Technologies Ltd. | 4,732 | 72,521 | |
| HDFC Asset Management Co. Ltd. (b) | 2,693 | 88,431 | |
| HDFC Bank Ltd. | 20,376 | 361,345 | |
| Hindustan Aeronautics Ltd. | 3,050 | 66,783 | |
| Hindustan Unilever Ltd. | 10,248 | 305,746 | |
| Infosys Ltd. | 12,180 | 200,185 | |
| ITC Ltd. | 49,534 | 254,873 | |
| NHPC Ltd. | 451,987 | 272,521 | |
| NMDC Ltd. | 44,473 | 82,367 | |
| Oil & Natural Gas Corp. Ltd. | 126,120 | 281,979 | |
| Pidilite Industries Ltd. | 2,088 | 61,643 | |
| Power Finance Corp. Ltd. | 31,626 | 93,672 | |
| REC Ltd. | 32,316 | 111,629 | |
| State Bank of India | 15,222 | 103,398 | |
| Steel Authority of India Ltd. | 54,101 | 54,485 | |
| Tata Consultancy Services Ltd. | 3,581 | 144,892 | |
| Union Bank of India Ltd. | 68,165 | 83,181 | |
| Wipro Ltd. | 8,735 | 40,056 | |
TOTAL INDIA | 3,906,430 | ||
| Indonesia - 4.4% | |||
| Indofood Sukses Makmur Tbk PT | 469,400 | 196,507 | |
| PT Adaro Energy Indonesia Tbk | 1,530,800 | 246,701 | |
| PT Astra International Tbk | 104,500 | 37,991 | |
| PT Bank Central Asia Tbk | 272,900 | 150,323 | |
| PT Bank Mandiri (Persero) Tbk | 300,400 | 107,319 | |
| PT Indah Kiat Pulp & Paper Tbk | 76,000 | 45,930 | |
| PT Telkom Indonesia Persero Tbk | 566,500 | 124,462 | |
| PT United Tractors Tbk | 134,300 | 212,420 | |
TOTAL INDONESIA | 1,121,653 | ||
| Korea (South) - 10.0% | |||
| Cosmo AM&T Co. Ltd. (a) | 81 | 8,361 | |
| Cosmo AM&T Co. Ltd. rights 11/7/23 (a) | 4 | 49 | |
| DB HiTek Co. Ltd. | 185 | 6,630 | |
| Db Insurance Co. Ltd. | 1,446 | 94,112 | |
| Doosan Bobcat, Inc. | 1,236 | 35,463 | |
| EO Technics Co. Ltd. | 49 | 5,054 | |
| GS Holdings Corp. | 1,785 | 52,074 | |
| Hankook Tire Co. Ltd. | 3,308 | 93,566 | |
| Hanmi Semiconductor Co. Ltd. | 213 | 8,280 | |
| Hanwha Corp. | 2,256 | 37,084 | |
| Hyundai Marine & Fire Insurance Co. Ltd. | 3,581 | 83,523 | |
| Hyundai Steel Co. | 1,566 | 37,975 | |
| Isupetasys Co. Ltd. | 221 | 3,543 | |
| Kangwon Land, Inc. | 8,250 | 89,613 | |
| KT&G Corp. | 3,628 | 229,143 | |
| Kumho Petro Chemical Co. Ltd. | 448 | 42,029 | |
| LG Corp. | 958 | 54,761 | |
| LG Innotek Co. Ltd. | 56 | 9,247 | |
| LG Uplus Corp. | 13,001 | 97,323 | |
| NCSOFT Corp. | 513 | 88,314 | |
| Orion Corp./Republic of Korea | 2,389 | 211,915 | |
| POSCO | 223 | 67,946 | |
| POSCO ICT Co. Ltd. | 229 | 8,317 | |
| Samsung Electro-Mechanics Co. Ltd. | 193 | 17,763 | |
| Samsung Electronics Co. Ltd. | 17,646 | 874,101 | |
| Samsung SDI Co. Ltd. | 176 | 55,450 | |
| Samsung SDS Co. Ltd. | 148 | 15,145 | |
| SK Hynix, Inc. | 1,685 | 145,101 | |
| Woori Financial Group, Inc. | 10,358 | 91,267 | |
TOTAL KOREA (SOUTH) | 2,563,149 | ||
| Malaysia - 1.3% | |||
| CelcomDigi Bhd | 108,900 | 96,683 | |
| Maxis Bhd | 117,700 | 97,826 | |
| Petronas Chemicals Group Bhd | 35,500 | 54,690 | |
| TIME dotCom Bhd | 83,900 | 93,682 | |
TOTAL MALAYSIA | 342,881 | ||
| Mexico - 4.6% | |||
| Arca Continental S.A.B. de CV | 28,900 | 258,808 | |
| Banco del Bajio SA (b) | 31,000 | 94,753 | |
| El Puerto de Liverpool S.A.B. Dcv Series C | 5,600 | 28,433 | |
| Grupo Aeroportuario del Sureste S.A.B. de CV Series B | 2,035 | 43,799 | |
| Grupo Aeroportuario Norte S.A.B. de CV | 4,800 | 36,594 | |
| Grupo Financiero Inbursa S.A.B. de CV Series O (a) | 42,200 | 86,911 | |
| Kimberly-Clark de Mexico SA de CV Series A | 121,300 | 222,066 | |
| Promotora y Operadora de Infraestructura S.A.B. de CV | 5,035 | 41,160 | |
| Terrafina | 234,700 | 380,398 | |
TOTAL MEXICO | 1,192,922 | ||
| Philippines - 0.3% | |||
| BDO Unibank, Inc. | 29,560 | 66,424 | |
| Qatar - 1.2% | |||
| Mesaieed Petrochemical Holding Co. (a) | 102,980 | 44,971 | |
| Qatar Electricity & Water Co. (a) | 59,334 | 269,537 | |
TOTAL QATAR | 314,508 | ||
| Russia - 0.3% | |||
| Gazprom OAO (c) | 14,450 | 1,504 | |
| Inter Rao Ues JSC (c) | 7,348,600 | 40,287 | |
| MMC Norilsk Nickel PJSC (a)(c) | 188 | 1,243 | |
| Mobile TeleSystems OJSC sponsored ADR (a)(c) | 15,647 | 15,584 | |
| Sberbank of Russia (c) | 38,410 | 235 | |
| Surgutneftegas OJSC (c) | 56,600 | 689 | |
| TCS Group Holding PLC GDR (a)(c) | 789 | 9,152 | |
| VTB Bank OJSC (a)(c) | 91,900,000 | 3,491 | |
TOTAL RUSSIA | 72,185 | ||
| Saudi Arabia - 2.6% | |||
| Al Rajhi Bank | 8,597 | 153,763 | |
| Luberef | 1,250 | 42,982 | |
| Sabic Agriculture-Nutrients Co. | 1,679 | 59,881 | |
| Saudi Telecom Co. | 21,913 | 224,293 | |
| The Co. for Cooperative Insurance | 1,752 | 56,414 | |
| The Saudi National Bank | 13,856 | 123,912 | |
TOTAL SAUDI ARABIA | 661,245 | ||
| South Africa - 2.5% | |||
| Exxaro Resources Ltd. | 32,429 | 323,410 | |
| Kumba Iron Ore Ltd. | 2,200 | 57,951 | |
| Momentum Metropolitan Holdings | 110,246 | 123,320 | |
| Standard Bank Group Ltd. | 14,934 | 145,692 | |
TOTAL SOUTH AFRICA | 650,373 | ||
| Taiwan - 13.6% | |||
| ASE Technology Holding Co. Ltd. | 38,000 | 132,974 | |
| ASPEED Tech, Inc. | 1,000 | 79,235 | |
| Catcher Technology Co. Ltd. | 19,000 | 106,320 | |
| Chicony Electronics Co. Ltd. | 32,000 | 122,830 | |
| Chipbond Technology Corp. | 48,000 | 100,632 | |
| Chunghwa Telecom Co. Ltd. | 41,000 | 146,632 | |
| Compal Electronics, Inc. | 116,000 | 100,318 | |
| eMemory Technology, Inc. | 2,000 | 124,249 | |
| Far Eastern International Bank | 258,000 | 91,475 | |
| Far Eastern New Century Corp. | 82,000 | 74,580 | |
| Far EasTone Telecommunications Co. Ltd. | 49,000 | 114,663 | |
| Formosa Plastics Corp. | 25,000 | 59,349 | |
| Foxconn Technology Co. Ltd. | 59,000 | 95,317 | |
| Gigabyte Technology Co. Ltd. | 11,000 | 73,763 | |
| Global Unichip Corp. | 2,000 | 88,485 | |
| International Games Systems Co. Ltd. | 5,000 | 96,038 | |
| Largan Precision Co. Ltd. | 2,000 | 127,640 | |
| Lite-On Technology Corp. | 29,000 | 89,410 | |
| Lotes Co. Ltd. | 4,077 | 103,449 | |
| Micro-Star International Co. Ltd. | 19,000 | 96,655 | |
| Novatek Microelectronics Corp. | 9,000 | 126,114 | |
| Pegatron Corp. | 47,000 | 109,259 | |
| Pou Chen Corp. | 94,000 | 83,610 | |
| Radiant Opto-Electronics Corp. | 28,000 | 107,045 | |
| Ruentex Development Co. Ltd. | 359,100 | 358,713 | |
| Simplo Technology Co. Ltd. | 10,000 | 102,821 | |
| SINBON Electronics Co. Ltd. | 10,000 | 85,402 | |
| Taichung Commercial Bank Co. Ltd. | 204,305 | 92,594 | |
| Taishin Financial Holdings Co. Ltd. | 197,000 | 104,771 | |
| Taiwan Business Bank | 225,280 | 88,556 | |
| Taiwan Cooperative Financial Holding Co. Ltd. | 137,550 | 106,656 | |
| Wiwynn Corp. | 2,000 | 93,726 | |
TOTAL TAIWAN | 3,483,281 | ||
| Thailand - 1.5% | |||
| Advanced Information Service PCL NVDR | 19,200 | 117,521 | |
| Bangkok Bank PCL NVDR | 13,800 | 60,472 | |
| Home Product Center PCL NVDR | 147,100 | 48,703 | |
| Intouch Holdings PCL NVDR | 49,000 | 96,793 | |
| Krung Thai Bank PCL NVDR | 118,800 | 62,139 | |
TOTAL THAILAND | 385,628 | ||
| Turkey - 5.5% | |||
| Akbank TAS | 107,714 | 112,158 | |
| Bim Birlesik Magazalar A/S JSC | 34,320 | 329,945 | |
| Enka Insaat ve Sanayi A/S | 38,095 | 40,959 | |
| Haci Omer Sabanci Holding A/S | 52,054 | 98,431 | |
| Koc Holding A/S | 10,990 | 53,138 | |
| Turkcell Iletisim Hizmet A/S | 92,715 | 157,295 | |
| Turkiye Is Bankasi A/S Series C | 185,007 | 137,189 | |
| Turkiye Petrol Rafinerileri A/S | 72,395 | 363,091 | |
| Yapi ve Kredi Bankasi A/S | 198,446 | 120,922 | |
TOTAL TURKEY | 1,413,128 | ||
| United Arab Emirates - 2.1% | |||
| Abu Dhabi Islamic Bank (a) | 37,488 | 105,126 | |
| Emaar Properties PJSC | 237,778 | 433,089 | |
TOTAL UNITED ARAB EMIRATES | 538,215 | ||
| TOTAL COMMON STOCKS (Cost $25,857,122) | 25,176,580 | ||
| Nonconvertible Preferred Stocks - 1.6% | |||
| Shares | Value ($) | ||
| Brazil - 1.6% | |||
| Bradespar SA (PN) | 7,700 | 34,110 | |
| Companhia Energetica de Minas Gerais (CEMIG) (PN) | 104,900 | 244,205 | |
| Itausa-Investimentos Itau SA (PN) | 56,731 | 97,195 | |
| Metalurgica Gerdau SA (PN) | 13,700 | 28,063 | |
TOTAL BRAZIL | 403,573 | ||
| Russia - 0.0% | |||
| AK Transneft OAO (c) | 12 | 3,462 | |
| TOTAL NONCONVERTIBLE PREFERRED STOCKS (Cost $406,874) | 407,035 | ||
| TOTAL INVESTMENT IN SECURITIES - 99.8% (Cost $26,263,996) | 25,583,615 |
NET OTHER ASSETS (LIABILITIES) - 0.2% | 59,115 |
| NET ASSETS - 100.0% | 25,642,730 |
| Futures Contracts | |||||
Number of contracts | Expiration Date | Notional Amount ($) | Value ($) | Unrealized Appreciation/ (Depreciation) ($) | |
| Purchased | |||||
| Equity Index Contracts | |||||
| ICE MSCI Emerging Markets Index Contracts (United States) | 1 | Dec 2023 | 45,960 | (762) | (762) |
| The notional amount of futures purchased as a percentage of Net Assets is 0.2% | |||||
| (a) | Non-income producing |
| (b) | Security exempt from registration under Rule 144A of the Securities Act of 1933. These securities may be resold in transactions exempt from registration, normally to qualified institutional buyers. At the end of the period, the value of these securities amounted to $805,531 or 3.1% of net assets. |
| (c) | Level 3 security |
| Affiliate | Value, beginning of period ($) | Purchases ($) | Sales Proceeds ($) | Dividend Income ($) | Realized Gain (loss) ($) | Change in Unrealized appreciation (depreciation) ($) | Value, end of period ($) | % ownership, end of period |
| Fidelity Cash Central Fund 5.40% | - | 3,310,856 | 3,310,856 | 2,035 | - | - | - | 0.0% |
| Total | - | 3,310,856 | 3,310,856 | 2,035 | - | - | - | |
| Valuation Inputs at Reporting Date: | ||||
| Description | Total ($) | Level 1 ($) | Level 2 ($) | Level 3 ($) |
Investments in Securities: | ||||
| Equities: | ||||
Communication Services | 3,412,286 | 3,396,702 | - | 15,584 |
Consumer Discretionary | 2,395,458 | 2,395,458 | - | - |
Consumer Staples | 2,516,049 | 2,516,049 | - | - |
Energy | 2,849,449 | 2,843,794 | - | 5,655 |
Financials | 5,229,276 | 5,216,398 | - | 12,878 |
Industrials | 770,781 | 770,781 | - | - |
Information Technology | 3,959,316 | 3,959,267 | 49 | - |
Materials | 965,214 | 963,971 | - | 1,243 |
Real Estate | 1,574,305 | 1,574,305 | - | - |
Utilities | 1,911,481 | 1,871,194 | - | 40,287 |
| Total Investments in Securities: | 25,583,615 | 25,507,919 | 49 | 75,647 |
Derivative Instruments: Liabilities | ||||
Futures Contracts | (762) | (762) | - | - |
| Total Liabilities | (762) | (762) | - | - |
| Total Derivative Instruments: | (762) | (762) | - | - |
Primary Risk Exposure / Derivative Type | Value | |
| Asset ($) | Liability ($) | |
| Equity Risk | ||
Futures Contracts (a) | 0 | (762) |
| Total Equity Risk | 0 | (762) |
| Total Value of Derivatives | 0 | (762) |
| Statement of Assets and Liabilities | ||||
| October 31, 2023 | ||||
| Assets | ||||
Investment in securities, at value - See accompanying schedule Unaffiliated issuers (cost $26,263,996): | $ | 25,583,615 | ||
| Segregated cash with brokers for derivative instruments | 4,242 | |||
| Cash | 40,904 | |||
| Foreign currency held at value (cost $181,876) | 169,667 | |||
| Dividends receivable | 43,867 | |||
| Other receivables | 465 | |||
Total assets | 25,842,760 | |||
| Liabilities | ||||
| Payable for investments purchased | $ | 97,849 | ||
| Accrued management fee | 9,823 | |||
| Payable for daily variation margin on futures contracts | 674 | |||
| Deferred taxes | 91,591 | |||
| Other payables and accrued expenses | 93 | |||
| Total Liabilities | 200,030 | |||
| Net Assets | $ | 25,642,730 | ||
| Net Assets consist of: | ||||
| Paid in capital | $ | 30,085,189 | ||
| Total accumulated earnings (loss) | (4,442,459) | |||
| Net Assets | $ | 25,642,730 | ||
Net Asset Value, offering price and redemption price per share ($25,642,730 ÷ 1,200,000 shares) | $ | 21.37 | ||
| Statement of Operations | ||||
Year ended October 31, 2023 | ||||
| Investment Income | ||||
| Dividends | $ | 1,300,532 | ||
| Income from Fidelity Central Funds | 2,035 | |||
| Income before foreign taxes withheld | $ | 1,302,567 | ||
| Less foreign taxes withheld | (160,653) | |||
| Total Income | 1,141,914 | |||
| Expenses | ||||
| Management fee | $ | 108,260 | ||
| Independent trustees' fees and expenses | 130 | |||
| Total expenses before reductions | 108,390 | |||
| Expense reductions | (418) | |||
| Total expenses after reductions | 107,972 | |||
| Net Investment income (loss) | 1,033,942 | |||
| Realized and Unrealized Gain (Loss) | ||||
| Net realized gain (loss) on: | ||||
| Investment Securities: | ||||
| Unaffiliated issuers (net of foreign taxes of $33,802) | (1,225,311) | |||
| Foreign currency transactions | (17,409) | |||
| Futures contracts | 6,183 | |||
| Total net realized gain (loss) | (1,236,537) | |||
| Change in net unrealized appreciation (depreciation) on: | ||||
| Investment Securities: | ||||
| Unaffiliated issuers(net of increase in deferred foreign taxes of $47,832) | 3,117,128 | |||
| Assets and liabilities in foreign currencies | (12,852) | |||
| Futures contracts | (1,385) | |||
| Total change in net unrealized appreciation (depreciation) | 3,102,891 | |||
| Net gain (loss) | 1,866,354 | |||
| Net increase (decrease) in net assets resulting from operations | $ | 2,900,296 | ||
| Statement of Changes in Net Assets | ||||
Year ended October 31, 2023 | Year ended October 31, 2022 | |||
| Increase (Decrease) in Net Assets | ||||
| Operations | ||||
| Net investment income (loss) | $ | 1,033,942 | $ | 823,731 |
| Net realized gain (loss) | (1,236,537) | (1,875,585) | ||
| Change in net unrealized appreciation (depreciation) | 3,102,891 | (3,937,671) | ||
| Net increase (decrease) in net assets resulting from operations | 2,900,296 | (4,989,525) | ||
| Distributions to shareholders | (1,198,769) | (826,772) | ||
| Distributions to shareholders from tax return of capital | (11,231) | (29,228) | ||
| Total Distributions | (1,210,000) | (856,000) | ||
| Share transactions | ||||
| Proceeds from sales of shares | 4,445,155 | 4,649,878 | ||
Net increase (decrease) in net assets resulting from share transactions | 4,445,155 | 4,649,878 | ||
| Total increase (decrease) in net assets | 6,135,451 | (1,195,647) | ||
| Net Assets | ||||
| Beginning of period | 19,507,279 | 20,702,926 | ||
| End of period | $ | 25,642,730 | $ | 19,507,279 |
| Other Information | ||||
| Shares | ||||
| Sold | 200,000 | 200,000 | ||
| Net increase (decrease) | 200,000 | 200,000 | ||
| Fidelity® Emerging Markets Multifactor ETF |
| Years ended October 31, | 2023 | 2022 | 2021 | 2020 | 2019 A | |||||
Selected Per-Share Data | ||||||||||
| Net asset value, beginning of period | $ | 19.51 | $ | 25.88 | $ | 23.12 | $ | 24.68 | $ | 25.00 |
| Income from Investment Operations | ||||||||||
Net investment income (loss) B,C | .95 | .89 | .72 | .55 | .50 | |||||
| Net realized and unrealized gain (loss) | 1.96 | (6.37) | 2.67 | (1.57) | (.34) | |||||
| Total from investment operations | 2.91 | (5.48) | 3.39 | (1.02) | .16 | |||||
| Distributions from net investment income | (1.04) | (.86) | (.63) | (.54) | (.48) | |||||
| Tax return of capital | (.01) | (.03) | - | - | - | |||||
| Total distributions | (1.05) | (.89) | (.63) | (.54) | (.48) | |||||
| Net asset value, end of period | $ | 21.37 | $ | 19.51 | $ | 25.88 | $ | 23.12 | $ | 24.68 |
Total Return D,E,F | 14.76% | (21.56)% | 14.55% | (4.03)% | .66% | |||||
Ratios to Average Net Assets C,G,H | ||||||||||
| Expenses before reductions | .45% | .45% | .45% | .45% | .45% I | |||||
| Expenses net of fee waivers, if any | .45% | .45% | .45% | .45% | .45% I | |||||
| Expenses net of all reductions | .45% | .45% | .45% | .45% | .45% I | |||||
| Net investment income (loss) | 4.29% | 3.84% | 2.64% | 2.39% | 3.05% I | |||||
| Supplemental Data | ||||||||||
| Net assets, end of period (000 omitted) | $ | 25,643 | $ | 19,507 | $ | 20,703 | $ | 9,249 | $ | 9,872 |
Portfolio turnover rate J | 82% K | 91% K | 65% K | 66% | 34% K,L |
| Average Annual Total Returns | |||
Periods ended October 31, 2023 | Past 1 year | Past 5 years | Life of Fund |
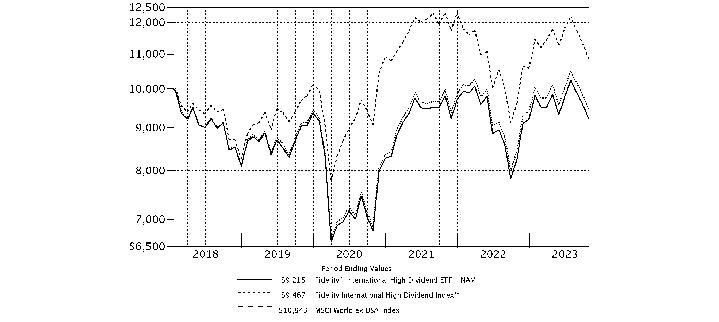
Fidelity® International High Dividend ETF - NAV A | 11.57% | 1.73% | -1.40% |
Fidelity® International High Dividend ETF - Market Price B | 12.57% | 1.87% | -1.51% |
Fidelity International High Dividend Index℠ A | 12.10% | 2.21% | -0.94% |
MSCI World ex USA Index A | 12.82% | 4.49% | 1.41% |
| $10,000 Over Life of Fund |
Let's say hypothetically that $10,000 was invested in Fidelity® International High Dividend ETF - NAV, on January 16, 2018, when the fund started. The chart shows how the value of your investment would have changed, and also shows how the Fidelity International High Dividend Index℠ and the MSCI World ex USA Index performed over the same period. |
 |
Top Holdings (% of Fund's net assets) | ||
| Enel SpA (Italy, Electric Utilities) | 3.9 | |
| Daiwa House Industry Co. Ltd. (Japan, Real Estate Management & Development) | 3.5 | |
| Terna - Rete Elettrica Nazionale (Italy, Electric Utilities) | 3.2 | |
| Telefonica SA (Spain, Diversified Telecommunication Services) | 2.9 | |
| Nintendo Co. Ltd. (Japan, Entertainment) | 2.6 | |
| SoftBank Corp. (Japan, Wireless Telecommunication Services) | 2.5 | |
| JFE Holdings, Inc. (Japan, Metals & Mining) | 2.4 | |
| Power Assets Holdings Ltd. (Hong Kong, Electric Utilities) | 2.4 | |
| Vodafone Group PLC (United Kingdom, Wireless Telecommunication Services) | 2.3 | |
| Vonovia SE (Germany, Real Estate Management & Development) | 2.2 | |
| 27.9 | ||
| Market Sectors (% of Fund's net assets) | ||
| Financials | 28.2 | |
| Materials | 13.7 | |
| Communication Services | 12.3 | |
| Utilities | 11.3 | |
| Industrials | 11.2 | |
| Real Estate | 9.3 | |
| Consumer Discretionary | 4.5 | |
| Health Care | 4.4 | |
| Consumer Staples | 2.5 | |
| Information Technology | 1.8 | |
Asset Allocation (% of Fund's net assets) |
 |
Futures - 0.7% |
Geographic Diversification (% of Fund's net assets) |
 |
* Includes Short-Term investments and Net Other Assets (Liabilities). Percentages are adjusted for the effect of derivatives, if applicable. |
| Common Stocks - 99.2% | |||
| Shares | Value ($) | ||
| Australia - 9.4% | |||
| ANZ Group Holdings Ltd. | 77,863 | 1,218,177 | |
| BHP Group Ltd. | 61,614 | 1,735,985 | |
| Coles Group Ltd. | 16,208 | 156,702 | |
| Rio Tinto Ltd. | 16,016 | 1,192,324 | |
| Rio Tinto PLC | 27,714 | 1,767,233 | |
| Sonic Healthcare Ltd. | 12,984 | 236,349 | |
| Wesfarmers Ltd. | 6,116 | 195,631 | |
| Westpac Banking Corp. | 84,858 | 1,106,794 | |
TOTAL AUSTRALIA | 7,609,195 | ||
| Belgium - 1.0% | |||
| KBC Group NV | 14,870 | 815,743 | |
| Canada - 11.6% | |||
| Algonquin Power & Utilities Corp. (a) | 287,047 | 1,443,247 | |
| Bank of Montreal | 12,645 | 954,489 | |
| Bank of Nova Scotia | 22,575 | 913,082 | |
| Barrick Gold Corp. (Canada) | 108,091 | 1,724,629 | |
| BCE, Inc. | 42,645 | 1,581,390 | |
| Canadian Imperial Bank of Commerce (a) | 24,378 | 858,871 | |
| Canadian National Railway Co. | 4,290 | 453,428 | |
| Canadian Tire Ltd. Class A (non-vtg.) | 1,164 | 112,153 | |
| Finning International, Inc. | 10,968 | 293,586 | |
| Manulife Financial Corp. | 55,976 | 973,355 | |
TOTAL CANADA | 9,308,230 | ||
| Denmark - 0.4% | |||
| A.P. Moller - Maersk A/S Series B | 194 | 322,127 | |
| Finland - 1.6% | |||
| Kesko Oyj | 5,951 | 100,423 | |
| Nokia Corp. | 22,080 | 73,283 | |
| Nordea Bank Abp | 100,172 | 1,051,691 | |
| TietoEVRY Oyj | 2,681 | 56,053 | |
TOTAL FINLAND | 1,281,450 | ||
| France - 6.4% | |||
| BNP Paribas SA | 20,438 | 1,172,825 | |
| Bouygues SA | 16,613 | 583,166 | |
| Compagnie Generale des Etablissements Michelin SCA Series B | 5,871 | 173,882 | |
| Credit Agricole SA | 88,202 | 1,060,765 | |
| Danone SA | 3,189 | 189,269 | |
| LVMH Moet Hennessy Louis Vuitton SE | 676 | 481,952 | |
| Societe Generale Series A | 37,047 | 828,010 | |
| VINCI SA | 6,300 | 695,743 | |
TOTAL FRANCE | 5,185,612 | ||
| Germany - 8.4% | |||
| Allianz SE | 6,142 | 1,434,104 | |
| BASF AG | 32,965 | 1,516,934 | |
| Bayer AG | 6,341 | 272,521 | |
| Bayerische Motoren Werke AG (BMW) | 3,298 | 305,477 | |
| DHL Group | 15,994 | 621,452 | |
| Fresenius SE & Co. KGaA | 10,027 | 256,909 | |
| Mercedes-Benz Group AG (Germany) | 5,001 | 293,006 | |
| SAP SE | 1,757 | 235,375 | |
| Vonovia SE | 78,226 | 1,794,262 | |
TOTAL GERMANY | 6,730,040 | ||
| Hong Kong - 4.4% | |||
| Jardine Matheson Holdings Ltd. | 6,882 | 278,377 | |
| New World Development Co. Ltd. | 721,000 | 1,321,363 | |
| Power Assets Holdings Ltd. | 402,500 | 1,923,868 | |
TOTAL HONG KONG | 3,523,608 | ||
| Italy - 8.6% | |||
| Enel SpA | 496,727 | 3,143,942 | |
| Intesa Sanpaolo SpA | 456,011 | 1,184,042 | |
| Terna - Rete Elettrica Nazionale | 337,426 | 2,577,220 | |
TOTAL ITALY | 6,905,204 | ||
| Japan - 22.4% | |||
| Astellas Pharma, Inc. | 21,000 | 263,462 | |
| Bridgestone Corp. | 6,700 | 250,711 | |
| Canon, Inc. | 6,900 | 161,787 | |
| Daiwa House Industry Co. Ltd. | 102,300 | 2,787,759 | |
| Daiwa Securities Group, Inc. | 299,800 | 1,710,371 | |
| Honda Motor Co. Ltd. | 34,800 | 346,173 | |
| Isuzu Motors Ltd. | 17,900 | 196,262 | |
| Japan Tobacco, Inc. | 16,900 | 392,914 | |
| JFE Holdings, Inc. | 140,800 | 1,937,981 | |
| Kawasaki Kisen Kaisha Ltd. | 22,100 | 750,505 | |
| Kyocera Corp. | 2,900 | 141,204 | |
| Mitsubishi Corp. | 18,200 | 835,822 | |
| Mitsui OSK Lines Ltd. | 19,300 | 494,846 | |
| Nintendo Co. Ltd. | 50,100 | 2,057,989 | |
| Nippon Yusen KK | 20,300 | 492,873 | |
| SBI Holdings, Inc. Japan | 66,600 | 1,419,117 | |
| SoftBank Corp. | 181,400 | 2,042,240 | |
| Sumitomo Corp. | 30,000 | 582,093 | |
| Takeda Pharmaceutical Co. Ltd. | 11,200 | 300,476 | |
| Tokyo Electron Ltd. | 1,500 | 195,665 | |
| Toyota Motor Corp. | 38,535 | 659,022 | |
TOTAL JAPAN | 18,019,272 | ||
| Netherlands - 2.9% | |||
| ASML Holding NV (Netherlands) | 524 | 313,102 | |
| ING Groep NV (Certificaten Van Aandelen) | 90,439 | 1,149,805 | |
| Koninklijke Ahold Delhaize NV | 5,713 | 169,082 | |
| Koninklijke Philips Electronics NV | 16,783 | 317,504 | |
| Stellantis NV (Italy) | 20,740 | 385,830 | |
TOTAL NETHERLANDS | 2,335,323 | ||
| Singapore - 4.8% | |||
| CapitaMall Trust | 1,278,700 | 1,642,650 | |
| Oversea-Chinese Banking Corp. Ltd. | 120,900 | 1,118,946 | |
| United Overseas Bank Ltd. | 51,400 | 1,013,706 | |
| Venture Corp. Ltd. | 12,100 | 103,332 | |
TOTAL SINGAPORE | 3,878,634 | ||
| South Africa - 1.5% | |||
| Anglo American PLC (United Kingdom) | 46,820 | 1,191,100 | |
| Spain - 3.5% | |||
| ACS Actividades de Construccion y Servicios SA | 13,879 | 501,277 | |
| Telefonica SA | 603,972 | 2,327,601 | |
TOTAL SPAIN | 2,828,878 | ||
| Sweden - 0.9% | |||
| Ericsson (B Shares) | 16,531 | 73,995 | |
| Volvo AB (B Shares) | 33,712 | 666,537 | |
TOTAL SWEDEN | 740,532 | ||
| Switzerland - 1.3% | |||
| Adecco SA (Reg.) | 11,992 | 451,191 | |
| Galenica AG (b) | 1,149 | 86,549 | |
| Novartis AG | 5,653 | 525,141 | |
| Sandoz Group AG | 1,128 | 29,314 | |
TOTAL SWITZERLAND | 1,092,195 | ||
| United Kingdom - 7.8% | |||
| BAE Systems PLC | 44,329 | 593,853 | |
| Barclays PLC | 517,852 | 826,958 | |
| British American Tobacco PLC (United Kingdom) | 5,635 | 167,799 | |
| DCC PLC (United Kingdom) | 6,459 | 357,790 | |
| Imperial Brands PLC | 5,362 | 113,929 | |
| Legal & General Group PLC | 350,873 | 900,071 | |
| M&G PLC | 411,180 | 988,912 | |
| Persimmon PLC | 17,077 | 210,536 | |
| Unilever PLC | 5,529 | 260,919 | |
| Vodafone Group PLC | 2,045,079 | 1,878,572 | |
TOTAL UNITED KINGDOM | 6,299,339 | ||
| United States of America - 2.3% | |||
| GSK PLC | 23,492 | 415,452 | |
| Nestle SA (Reg. S) | 4,743 | 511,069 | |
| Roche Holding AG (participation certificate) | 1,707 | 438,637 | |
| Sanofi SA | 5,147 | 466,240 | |
TOTAL UNITED STATES OF AMERICA | 1,831,398 | ||
| TOTAL COMMON STOCKS (Cost $92,823,050) | 79,897,880 | ||
| Money Market Funds - 2.6% | |||
| Shares | Value ($) | ||
| Fidelity Cash Central Fund 5.40% (c) | 30,629 | 30,635 | |
| Fidelity Securities Lending Cash Central Fund 5.40% (c)(d) | 2,024,658 | 2,024,860 | |
| TOTAL MONEY MARKET FUNDS (Cost $2,055,495) | 2,055,495 | ||
| TOTAL INVESTMENT IN SECURITIES - 101.8% (Cost $94,878,545) | 81,953,375 |
NET OTHER ASSETS (LIABILITIES) - (1.8)% | (1,440,295) |
| NET ASSETS - 100.0% | 80,513,080 |
| Futures Contracts | |||||
Number of contracts | Expiration Date | Notional Amount ($) | Value ($) | Unrealized Appreciation/ (Depreciation) ($) | |
| Purchased | |||||
| Equity Index Contracts | |||||
| ICE MSCI EAFE Index Contracts (United States) | 6 | Dec 2023 | 592,230 | (31,700) | (31,700) |
| The notional amount of futures purchased as a percentage of Net Assets is 0.7% | |||||
| (a) | Security or a portion of the security is on loan at period end. |
| (b) | Security exempt from registration under Rule 144A of the Securities Act of 1933. These securities may be resold in transactions exempt from registration, normally to qualified institutional buyers. At the end of the period, the value of these securities amounted to $86,549 or 0.1% of net assets. |
| (c) | Affiliated fund that is generally available only to investment companies and other accounts managed by Fidelity Investments. The rate quoted is the annualized seven-day yield of the fund at period end. A complete unaudited listing of the fund's holdings as of its most recent quarter end is available upon request. In addition, each Fidelity Central Fund's financial statements, which are not covered by the Fund's Report of Independent Registered Public Accounting Firm, are available on the SEC's website or upon request. |
| (d) | Investment made with cash collateral received from securities on loan. |
| Affiliate | Value, beginning of period ($) | Purchases ($) | Sales Proceeds ($) | Dividend Income ($) | Realized Gain (loss) ($) | Change in Unrealized appreciation (depreciation) ($) | Value, end of period ($) | % ownership, end of period |
| Fidelity Cash Central Fund 5.40% | 48,989 | 5,998,297 | 6,016,651 | 5,863 | - | - | 30,635 | 0.0% |
| Fidelity Securities Lending Cash Central Fund 5.40% | - | 10,383,160 | 8,358,300 | 20,496 | - | - | 2,024,860 | 0.0% |
| Total | 48,989 | 16,381,457 | 14,374,951 | 26,359 | - | - | 2,055,495 | |
| Valuation Inputs at Reporting Date: | ||||
| Description | Total ($) | Level 1 ($) | Level 2 ($) | Level 3 ($) |
Investments in Securities: | ||||
| Equities: | ||||
Communication Services | 9,887,792 | 9,887,792 | - | - |
Consumer Discretionary | 3,610,635 | 3,610,635 | - | - |
Consumer Staples | 2,062,106 | 2,062,106 | - | - |
Financials | 22,699,834 | 22,699,834 | - | - |
Health Care | 3,608,554 | 3,608,554 | - | - |
Industrials | 8,974,666 | 8,974,666 | - | - |
Information Technology | 1,353,796 | 1,353,796 | - | - |
Materials | 11,066,186 | 11,066,186 | - | - |
Real Estate | 7,546,034 | 7,546,034 | - | - |
Utilities | 9,088,277 | 9,088,277 | - | - |
| Money Market Funds | 2,055,495 | 2,055,495 | - | - |
| Total Investments in Securities: | 81,953,375 | 81,953,375 | - | - |
Derivative Instruments: Liabilities | ||||
Futures Contracts | (31,700) | (31,700) | - | - |
| Total Liabilities | (31,700) | (31,700) | - | - |
| Total Derivative Instruments: | (31,700) | (31,700) | - | - |
Primary Risk Exposure / Derivative Type | Value | |
| Asset ($) | Liability ($) | |
| Equity Risk | ||
Futures Contracts (a) | 0 | (31,700) |
| Total Equity Risk | 0 | (31,700) |
| Total Value of Derivatives | 0 | (31,700) |
| Statement of Assets and Liabilities | ||||
| October 31, 2023 | ||||
| Assets | ||||
| Investment in securities, at value (including securities loaned of $1,882,962) - See accompanying schedule: | ||||
Unaffiliated issuers (cost $92,823,050) | $ | 79,897,880 | ||
Fidelity Central Funds (cost $2,055,495) | 2,055,495 | |||
| Total Investment in Securities (cost $94,878,545) | $ | 81,953,375 | ||
| Segregated cash with brokers for derivative instruments | 27,333 | |||
| Cash | 28,559 | |||
| Foreign currency held at value (cost $27,434) | 27,366 | |||
| Dividends receivable | 351,431 | |||
| Reclaims receivable | 173,217 | |||
| Distributions receivable from Fidelity Central Funds | 1,401 | |||
| Receivable for daily variation margin on futures contracts | 1,770 | |||
Total assets | 82,564,452 | |||
| Liabilities | ||||
| Accrued management fee | $ | 26,512 | ||
| Collateral on securities loaned | 2,024,860 | |||
| Total Liabilities | 2,051,372 | |||
| Net Assets | $ | 80,513,080 | ||
| Net Assets consist of: | ||||
| Paid in capital | $ | 102,771,006 | ||
| Total accumulated earnings (loss) | (22,257,926) | |||
| Net Assets | $ | 80,513,080 | ||
Net Asset Value, offering price and redemption price per share ($80,513,080 ÷ 4,500,000 shares) | $ | 17.89 | ||
| Statement of Operations | ||||
Year ended October 31, 2023 | ||||
| Investment Income | ||||
| Dividends | $ | 4,894,308 | ||
| Income from Fidelity Central Funds (including $20,496 from security lending) | 26,359 | |||
| Income before foreign taxes withheld | $ | 4,920,667 | ||
| Less foreign taxes withheld | (499,911) | |||
| Total Income | 4,420,756 | |||
| Expenses | ||||
| Management fee | $ | 340,336 | ||
| Independent trustees' fees and expenses | 497 | |||
| Total expenses before reductions | 340,833 | |||
| Expense reductions | (232) | |||
| Total expenses after reductions | 340,601 | |||
| Net Investment income (loss) | 4,080,155 | |||
| Realized and Unrealized Gain (Loss) | ||||
| Net realized gain (loss) on: | ||||
| Investment Securities: | ||||
| Unaffiliated issuers | (1,655,744) | |||
| Redemptions in-kind | (197,460) | |||
| Foreign currency transactions | (112,310) | |||
| Futures contracts | 83,203 | |||
| Total net realized gain (loss) | (1,882,311) | |||
| Change in net unrealized appreciation (depreciation) on: | ||||
| Investment Securities: | ||||
| Unaffiliated issuers | 7,138,307 | |||
| Assets and liabilities in foreign currencies | 152,380 | |||
| Futures contracts | (30,694) | |||
| Total change in net unrealized appreciation (depreciation) | 7,259,993 | |||
| Net gain (loss) | 5,377,682 | |||
| Net increase (decrease) in net assets resulting from operations | $ | 9,457,837 | ||
| Statement of Changes in Net Assets | ||||
Year ended October 31, 2023 | Year ended October 31, 2022 | |||
| Increase (Decrease) in Net Assets | ||||
| Operations | ||||
| Net investment income (loss) | $ | 4,080,155 | $ | 4,486,859 |
| Net realized gain (loss) | (1,882,311) | 5,237,224 | ||
| Change in net unrealized appreciation (depreciation) | 7,259,993 | (26,568,820) | ||
| Net increase (decrease) in net assets resulting from operations | 9,457,837 | (16,844,737) | ||
| Distributions to shareholders | (4,144,700) | (4,783,300) | ||
| Share transactions | ||||
| Proceeds from sales of shares | - | 55,975,704 | ||
| Cost of shares redeemed | (5,529,770) | (35,815,029) | ||
Net increase (decrease) in net assets resulting from share transactions | (5,529,770) | 20,160,675 | ||
| Total increase (decrease) in net assets | (216,633) | (1,467,362) | ||
| Net Assets | ||||
| Beginning of period | 80,729,713 | 82,197,075 | ||
| End of period | $ | 80,513,080 | $ | 80,729,713 |
| Other Information | ||||
| Shares | ||||
| Sold | - | 2,600,000 | ||
| Redeemed | (300,000) | (1,700,000) | ||
| Net increase (decrease) | (300,000) | 900,000 | ||
| Fidelity® International High Dividend ETF |
| Years ended October 31, | 2023 | 2022 | 2021 | 2020 | 2019 | |||||
Selected Per-Share Data | ||||||||||
| Net asset value, beginning of period | $ | 16.82 | $ | 21.08 | $ | 15.10 | $ | 20.96 | $ | 20.56 |
| Income from Investment Operations | ||||||||||
Net investment income (loss) A,B | .89 | .97 | .77 | .60 | 1.04 | |||||
| Net realized and unrealized gain (loss) | 1.08 | (4.22) | 5.95 | (5.81) | .31 | |||||
| Total from investment operations | 1.97 | (3.25) | 6.72 | (5.21) | 1.35 | |||||
| Distributions from net investment income | (.90) | (1.01) | (.74) | (.65) | (.95) | |||||
| Total distributions | (.90) | (1.01) | (.74) | (.65) | (.95) | |||||
| Net asset value, end of period | $ | 17.89 | $ | 16.82 | $ | 21.08 | $ | 15.10 | $ | 20.96 |
Total Return C,D,E | 11.57% | (15.83)% | 44.78% | (24.98)% | 6.84% | |||||
Ratios to Average Net Assets B,F,G | ||||||||||
| Expenses before reductions | .39% | .39% | .39% | .39% | .39% | |||||
| Expenses net of fee waivers, if any | .39% | .39% | .39% | .39% | .39% | |||||
| Expenses net of all reductions | .39% | .39% | .39% | .39% | .39% | |||||
| Net investment income (loss) | 4.68% | 4.96% | 3.82% | 3.38% | 5.07% | |||||
| Supplemental Data | ||||||||||
| Net assets, end of period (000 omitted) | $ | 80,513 | $ | 80,730 | $ | 82,197 | $ | 45,290 | $ | 44,022 |
Portfolio turnover rate H,I | 67% | 71% | 67% | 82% | 47% |
| Average Annual Total Returns | |||
Periods ended October 31, 2023 | Past 1 year | Life of Fund |
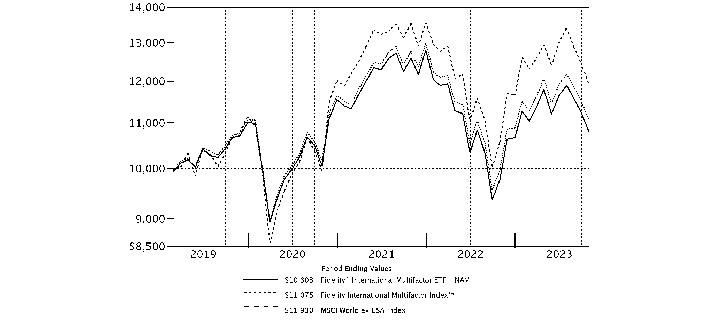
Fidelity® International Multifactor ETF - NAV A | 10.58% | 1.66% |
Fidelity® International Multifactor ETF - Market Price B | 11.43% | 1.98% |
Fidelity International Multifactor Index℠ A | 11.02% | 2.21% |
MSCI World ex USA Index A | 12.82% | 3.84% |
| $10,000 Over Life of Fund |
Let's say hypothetically that $10,000 was invested in Fidelity® International Multifactor ETF - NAV, on February 26, 2019, when the fund started. The chart shows how the value of your investment would have changed, and also shows how the Fidelity International Multifactor Index℠ and the MSCI World ex USA Index performed over the same period. |
 |
Top Holdings (% of Fund's net assets) | ||
| Novo Nordisk A/S Series B (Denmark, Pharmaceuticals) | 2.2 | |
| Novartis AG (Switzerland, Pharmaceuticals) | 1.6 | |
| PSP Swiss Property AG (Switzerland, Real Estate Management & Development) | 1.6 | |
| AstraZeneca PLC (United Kingdom) (United Kingdom, Pharmaceuticals) | 1.4 | |
| Tokyo Gas Co. Ltd. (Japan, Gas Utilities) | 1.4 | |
| Roche Holding AG (participation certificate) (United States of America, Pharmaceuticals) | 1.4 | |
| E.ON SE (Germany, Multi-Utilities) | 1.3 | |
| Daito Trust Construction Co. Ltd. (Japan, Real Estate Management & Development) | 1.3 | |
| L'Oreal SA (France, Personal Care Products) | 1.2 | |
| KDDI Corp. (Japan, Wireless Telecommunication Services) | 1.2 | |
| 14.6 | ||
| Market Sectors (% of Fund's net assets) | ||
| Financials | 16.5 | |
| Health Care | 16.3 | |
| Consumer Staples | 14.1 | |
| Industrials | 12.7 | |
| Communication Services | 8.9 | |
| Utilities | 8.1 | |
| Consumer Discretionary | 7.0 | |
| Real Estate | 6.7 | |
| Information Technology | 3.5 | |
| Materials | 3.7 | |
| Energy | 1.8 | |
Asset Allocation (% of Fund's net assets) |
 |
Futures - 0.6% |
Geographic Diversification (% of Fund's net assets) |
 |
* Includes Short-Term investments and Net Other Assets (Liabilities). Percentages are adjusted for the effect of derivatives, if applicable. |
| Common Stocks - 99.3% | |||
| Shares | Value ($) | ||
| Australia - 5.0% | |||
| BHP Group Ltd. | 5,426 | 152,879 | |
| Flutter Entertainment PLC (Ireland) (a) | 545 | 85,229 | |
| Glencore PLC | 18,053 | 95,326 | |
| Insurance Australia Group Ltd. | 34,439 | 123,635 | |
| JB Hi-Fi Ltd. | 1,361 | 38,924 | |
| Medibank Private Ltd. | 57,370 | 124,591 | |
| QBE Insurance Group Ltd. | 13,846 | 136,759 | |
| Rio Tinto Ltd. | 753 | 56,058 | |
| Rio Tinto PLC | 1,777 | 113,314 | |
| Sonic Healthcare Ltd. | 5,067 | 92,235 | |
| South32 Ltd. | 16,777 | 35,266 | |
| Telstra Group Ltd. | 121,831 | 293,893 | |
| Washington H. Soul Pattinson & Co. Ltd. | 6,036 | 127,721 | |
| Wesfarmers Ltd. | 2,436 | 77,920 | |
TOTAL AUSTRALIA | 1,553,750 | ||
| Austria - 0.0% | |||
| OMV AG | 293 | 12,809 | |
| Belgium - 0.3% | |||
| UCB SA | 1,476 | 107,743 | |
| Brazil - 0.2% | |||
| Yara International ASA | 1,529 | 49,955 | |
| Canada - 8.8% | |||
| B2Gold Corp. | 27,028 | 86,443 | |
| Boyd Group Services, Inc. | 376 | 64,036 | |
| Brookfield Asset Management Ltd. Class A | 3,926 | 112,414 | |
| Canadian Apartment Properties (REIT) unit | 7,909 | 232,556 | |
| Canadian National Railway Co. | 1,332 | 140,785 | |
| Canadian Natural Resources Ltd. | 1,037 | 65,779 | |
| Canadian Pacific Kansas City Ltd. | 2,019 | 143,195 | |
| CGI, Inc. Class A (sub. vtg.) (a) | 725 | 69,918 | |
| Constellation Software, Inc. | 44 | 88,111 | |
| Constellation Software, Inc. warrants 8/22/28 (a)(b) | 40 | 0 | |
| Dollarama, Inc. | 1,339 | 91,340 | |
| Fairfax Financial Holdings Ltd. (sub. vtg.) | 168 | 139,656 | |
| Great-West Lifeco, Inc. | 4,075 | 112,776 | |
| iA Financial Corp., Inc. | 1,796 | 104,390 | |
| Imperial Oil Ltd. | 671 | 38,199 | |
| Intact Financial Corp. | 1,024 | 143,718 | |
| Loblaw Companies Ltd. | 2,558 | 208,989 | |
| Manulife Financial Corp. | 8,389 | 145,875 | |
| Metro, Inc. | 4,230 | 214,631 | |
| Northland Power, Inc. | 19,079 | 267,855 | |
| PrairieSky Royalty Ltd. | 1,658 | 29,081 | |
| Teck Resources Ltd. Class B (sub. vtg.) | 2,363 | 83,405 | |
| TMX Group Ltd. | 5,441 | 113,190 | |
| Whitecap Resources, Inc./Alberta | 4,079 | 31,468 | |
TOTAL CANADA | 2,727,810 | ||
| Denmark - 3.9% | |||
| A.P. Moller - Maersk A/S Series B | 63 | 104,608 | |
| Carlsberg A/S Series B | 1,547 | 184,027 | |
| Coloplast A/S Series B | 1,126 | 117,203 | |
| Novo Nordisk A/S Series B | 7,193 | 689,619 | |
| Ringkjoebing Landbobank A/S | 706 | 96,032 | |
TOTAL DENMARK | 1,191,489 | ||
| Finland - 0.8% | |||
| Kone OYJ (B Shares) | 2,599 | 112,331 | |
| Orion Oyj (B Shares) | 3,078 | 122,134 | |
TOTAL FINLAND | 234,465 | ||
| France - 7.1% | |||
| Compagnie de St.-Gobain | 2,037 | 110,670 | |
| Dassault Aviation SA | 494 | 97,905 | |
| Edenred SA | 2,499 | 132,706 | |
| Eiffage SA | 993 | 89,951 | |
| Hermes International SCA | 53 | 98,575 | |
| Ipsen SA | 936 | 110,313 | |
| L'Oreal SA | 907 | 379,789 | |
| La Francaise des Jeux SAEM (c) | 853 | 27,427 | |
| LVMH Moet Hennessy Louis Vuitton SE | 332 | 236,698 | |
| Publicis Groupe SA | 3,934 | 298,229 | |
| SCOR SE | 4,780 | 142,227 | |
| Sodexo SA | 357 | 37,690 | |
| Sopra Steria Group | 145 | 25,948 | |
| Thales SA | 752 | 110,605 | |
| TotalEnergies SE | 1,291 | 86,242 | |
| Verallia SA (c) | 1,317 | 42,792 | |
| VINCI SA | 1,528 | 168,745 | |
TOTAL FRANCE | 2,196,512 | ||
| Germany - 6.7% | |||
| Allianz SE | 996 | 232,557 | |
| Bayerische Motoren Werke AG (BMW) | 1,043 | 96,608 | |
| Beiersdorf AG | 1,728 | 226,577 | |
| Deutsche Borse AG | 795 | 130,417 | |
| DHL Group | 2,126 | 82,606 | |
| E.ON SE | 34,472 | 408,822 | |
| Fresenius Medical Care AG & Co. KGaA | 2,453 | 81,207 | |
| Fresenius SE & Co. KGaA | 4,220 | 108,123 | |
| Gerresheimer AG | 1,001 | 93,003 | |
| Hannover Reuck SE | 548 | 120,655 | |
| Knorr-Bremse AG | 634 | 35,209 | |
| Merck KGaA | 836 | 125,788 | |
| SAP SE | 1,147 | 153,657 | |
| Siemens AG | 1,256 | 165,896 | |
TOTAL GERMANY | 2,061,125 | ||
| Hong Kong - 1.2% | |||
| Jardine Matheson Holdings Ltd. | 1,977 | 79,970 | |
| Sino Land Ltd. | 299,322 | 298,763 | |
TOTAL HONG KONG | 378,733 | ||
| Ireland - 0.7% | |||
| Glanbia PLC | 13,418 | 211,040 | |
| Israel - 1.4% | |||
| Bank Hapoalim BM (Reg.) | 12,589 | 89,838 | |
| Bank Leumi le-Israel BM | 14,391 | 92,453 | |
| Icl Group Ltd. | 9,564 | 46,336 | |
| Israel Discount Bank Ltd. (Class A) | 20,843 | 91,449 | |
| Mizrahi Tefahot Bank Ltd. | 2,906 | 89,790 | |
| NICE Ltd. (a) | 189 | 29,180 | |
TOTAL ISRAEL | 439,046 | ||
| Italy - 2.9% | |||
| Assicurazioni Generali SpA | 6,461 | 128,015 | |
| BPER Banca | 32,196 | 104,442 | |
| Eni SpA | 1,868 | 30,462 | |
| Ferrari NV (Italy) | 365 | 110,147 | |
| Moncler SpA | 1,241 | 64,196 | |
| Recordati SpA | 2,401 | 110,651 | |
| Snam SpA | 76,928 | 352,085 | |
TOTAL ITALY | 899,998 | ||
| Japan - 23.1% | |||
| Advance Residence Investment Corp. | 161 | 349,226 | |
| Astellas Pharma, Inc. | 16,600 | 208,260 | |
| Canon, Inc. | 3,500 | 82,066 | |
| Dai Nippon Printing Co. Ltd. | 3,500 | 90,340 | |
| Daito Trust Construction Co. Ltd. | 3,700 | 394,566 | |
| Fast Retailing Co. Ltd. | 600 | 130,820 | |
| GOLDWIN, Inc. | 1,100 | 68,668 | |
| INPEX Corp. | 3,800 | 54,762 | |
| Itochu Corp. | 4,300 | 152,556 | |
| Japan Tobacco, Inc. | 12,100 | 281,317 | |
| Kajima Corp. | 6,300 | 103,125 | |
| KDDI Corp. | 12,700 | 376,275 | |
| McDonald's Holdings Co. (Japan) Ltd. | 2,300 | 89,452 | |
| Mitsubishi Corp. | 3,700 | 169,920 | |
| Mitsubishi UFJ Lease & Finance Co. Ltd. | 13,600 | 88,805 | |
| Mitsui & Co. Ltd. | 4,400 | 157,383 | |
| Mizuho Financial Group, Inc. | 8,500 | 142,869 | |
| NEC Corp. | 1,500 | 71,363 | |
| Nexon Co. Ltd. | 16,700 | 302,749 | |
| Nippon Telegraph & Telephone Corp. | 309,200 | 360,966 | |
| NOF Corp. | 1,500 | 58,764 | |
| Obayashi Corp. | 10,600 | 90,150 | |
| OBIC Co. Ltd. | 500 | 73,443 | |
| Ono Pharmaceutical Co. Ltd. | 11,000 | 188,956 | |
| Otsuka Corp. | 1,700 | 67,609 | |
| Otsuka Holdings Co. Ltd. | 6,100 | 203,407 | |
| Sanrio Co. Ltd. | 1,700 | 71,841 | |
| Secom Co. Ltd. | 1,600 | 110,403 | |
| Sega Sammy Holdings, Inc. | 4,300 | 66,610 | |
| Sekisui House Ltd. | 5,200 | 100,913 | |
| SHIMANO, Inc. | 700 | 99,630 | |
| Shin-Etsu Chemical Co. Ltd. | 3,600 | 106,209 | |
| Shionogi & Co. Ltd. | 5,000 | 230,678 | |
| Sojitz Corp. | 4,400 | 90,240 | |
| Sompo Holdings, Inc. | 2,500 | 107,415 | |
| Sumitomo Corp. | 5,900 | 114,478 | |
| Sumitomo Forestry Co. Ltd. | 4,000 | 93,341 | |
| Sumitomo Mitsui Financial Group, Inc. | 3,700 | 176,394 | |
| Suntory Beverage & Food Ltd. | 6,500 | 192,195 | |
| Taisei Corp. | 2,600 | 87,539 | |
| TIS, Inc. | 2,900 | 61,372 | |
| Tokio Marine Holdings, Inc. | 6,700 | 147,896 | |
| Tokyo Gas Co. Ltd. | 19,300 | 430,616 | |
| Toppan Holdings, Inc. | 4,300 | 98,013 | |
| Toyo Suisan Kaisha Ltd. | 5,400 | 248,169 | |
| Trend Micro, Inc. | 1,600 | 59,607 | |
| USS Co. Ltd. | 5,400 | 93,652 | |
TOTAL JAPAN | 7,145,028 | ||
| Jordan - 0.3% | |||
| Hikma Pharmaceuticals PLC | 4,448 | 102,632 | |
| Luxembourg - 0.2% | |||
| ArcelorMittal SA (Netherlands) | 2,480 | 54,734 | |
| Netherlands - 4.1% | |||
| ASML Holding NV (Netherlands) | 386 | 230,644 | |
| BE Semiconductor Industries NV | 311 | 31,985 | |
| Heineken Holding NV | 2,693 | 204,379 | |
| Koninklijke Ahold Delhaize NV | 7,843 | 232,121 | |
| Koninklijke KPN NV | 86,352 | 289,795 | |
| Shell PLC (London) | 3,751 | 120,459 | |
| Wolters Kluwer NV | 1,184 | 151,555 | |
TOTAL NETHERLANDS | 1,260,938 | ||
| Norway - 0.7% | |||
| Equinor ASA | 834 | 27,954 | |
| Orkla ASA | 27,623 | 190,241 | |
TOTAL NORWAY | 218,195 | ||
| Portugal - 0.7% | |||
| Galp Energia SGPS SA Class B | 977 | 14,675 | |
| Jeronimo Martins SGPS SA | 8,198 | 188,730 | |
TOTAL PORTUGAL | 203,405 | ||
| Singapore - 2.4% | |||
| CapitaMall Trust | 244,700 | 314,348 | |
| Oversea-Chinese Banking Corp. Ltd. | 16,981 | 157,161 | |
| Singapore Exchange Ltd. | 16,500 | 114,051 | |
| United Overseas Bank Ltd. | 7,100 | 140,026 | |
TOTAL SINGAPORE | 725,586 | ||
| Spain - 3.1% | |||
| CaixaBank SA | 29,495 | 119,561 | |
| Endesa SA | 18,473 | 346,879 | |
| Industria de Diseno Textil SA | 3,175 | 109,237 | |
| Redeia Corp. SA | 23,433 | 364,223 | |
| Repsol SA | 1,305 | 19,070 | |
TOTAL SPAIN | 958,970 | ||
| Sweden - 2.5% | |||
| Atlas Copco AB (A Shares) | 10,302 | 132,963 | |
| Epiroc AB (A Shares) | 4,862 | 79,854 | |
| Ericsson (B Shares) | 8,407 | 37,631 | |
| Essity AB (B Shares) | 9,679 | 220,303 | |
| Evolution AB (c) | 807 | 71,645 | |
| Industrivarden AB (A Shares) | 4,091 | 105,528 | |
| Securitas AB (B Shares) | 8,777 | 70,121 | |
| SSAB AB (B Shares) | 10,314 | 59,746 | |
TOTAL SWEDEN | 777,791 | ||
| Switzerland - 7.7% | |||
| Baloise Holdings AG | 701 | 100,291 | |
| BKW AG | 2,115 | 354,650 | |
| Bucher Industries AG | 240 | 85,288 | |
| Galenica AG (c) | 1,450 | 109,222 | |
| Kuehne & Nagel International AG | 404 | 108,541 | |
| Novartis AG | 5,396 | 501,267 | |
| PSP Swiss Property AG | 4,015 | 492,803 | |
| Sandoz Group AG | 1,077 | 27,989 | |
| Swatch Group AG (Bearer) | 267 | 68,125 | |
| Swisscom AG | 513 | 306,656 | |
| UBS Group AG | 9,771 | 227,834 | |
TOTAL SWITZERLAND | 2,382,666 | ||
| United Kingdom - 10.5% | |||
| AstraZeneca PLC (United Kingdom) | 3,575 | 444,654 | |
| Auto Trader Group PLC (c) | 37,047 | 279,258 | |
| BAE Systems PLC | 10,013 | 134,139 | |
| Barclays PLC | 82,187 | 131,244 | |
| Beazley PLC | 19,068 | 119,045 | |
| British American Tobacco PLC (United Kingdom) | 8,953 | 266,603 | |
| CK Hutchison Holdings Ltd. | 16,500 | 83,400 | |
| Compass Group PLC | 4,479 | 112,668 | |
| IG Group Holdings PLC | 13,898 | 107,596 | |
| Imperial Brands PLC | 8,683 | 184,492 | |
| InterContinental Hotel Group PLC | 1,083 | 76,353 | |
| J Sainsbury PLC | 50,009 | 156,138 | |
| Man Group PLC | 44,162 | 117,626 | |
| RELX PLC (London Stock Exchange) | 4,979 | 173,278 | |
| Rightmove PLC | 40,933 | 234,940 | |
| Sage Group PLC | 3,346 | 39,408 | |
| Smith & Nephew PLC | 9,178 | 102,550 | |
| Standard Chartered PLC (United Kingdom) | 15,809 | 120,856 | |
| Unilever PLC | 7,818 | 368,940 | |
TOTAL UNITED KINGDOM | 3,253,188 | ||
| United States of America - 5.0% | |||
| CSL Ltd. | 1,414 | 208,017 | |
| Experian PLC | 3,364 | 101,684 | |
| GSK PLC | 13,544 | 239,523 | |
| Haleon PLC | 48,212 | 192,767 | |
| Holcim AG | 1,286 | 79,247 | |
| Roche Holding AG (participation certificate) | 1,672 | 429,644 | |
| Sanofi SA | 3,143 | 284,708 | |
TOTAL UNITED STATES OF AMERICA | 1,535,590 | ||
| TOTAL COMMON STOCKS (Cost $31,707,656) | 30,683,198 | ||
| Money Market Funds - 0.7% | |||
| Shares | Value ($) | ||
Fidelity Cash Central Fund 5.40% (d) (Cost $208,816) | 208,775 | 208,816 | |
| TOTAL INVESTMENT IN SECURITIES - 100.0% (Cost $31,916,472) | 30,892,014 |
NET OTHER ASSETS (LIABILITIES) - 0.0% | (5,812) |
| NET ASSETS - 100.0% | 30,886,202 |
| Futures Contracts | |||||
Number of contracts | Expiration Date | Notional Amount ($) | Value ($) | Unrealized Appreciation/ (Depreciation) ($) | |
| Purchased | |||||
| Equity Index Contracts | |||||
| ICE MSCI EAFE Index Contracts (United States) | 2 | Dec 2023 | 197,410 | (4,498) | (4,498) |
| The notional amount of futures purchased as a percentage of Net Assets is 0.6% | |||||
| (a) | Non-income producing |
| (b) | Level 3 security |
| (c) | Security exempt from registration under Rule 144A of the Securities Act of 1933. These securities may be resold in transactions exempt from registration, normally to qualified institutional buyers. At the end of the period, the value of these securities amounted to $530,344 or 1.7% of net assets. |
| (d) | Affiliated fund that is generally available only to investment companies and other accounts managed by Fidelity Investments. The rate quoted is the annualized seven-day yield of the fund at period end. A complete unaudited listing of the fund's holdings as of its most recent quarter end is available upon request. In addition, each Fidelity Central Fund's financial statements, which are not covered by the Fund's Report of Independent Registered Public Accounting Firm, are available on the SEC's website or upon request. |
| Affiliate | Value, beginning of period ($) | Purchases ($) | Sales Proceeds ($) | Dividend Income ($) | Realized Gain (loss) ($) | Change in Unrealized appreciation (depreciation) ($) | Value, end of period ($) | % ownership, end of period |
| Fidelity Cash Central Fund 5.40% | - | 1,882,741 | 1,673,925 | 3,031 | - | - | 208,816 | 0.0% |
| Total | - | 1,882,741 | 1,673,925 | 3,031 | - | - | 208,816 | |
| Valuation Inputs at Reporting Date: | ||||
| Description | Total ($) | Level 1 ($) | Level 2 ($) | Level 3 ($) |
Investments in Securities: | ||||
| Equities: | ||||
Communication Services | 2,742,761 | 2,742,761 | - | - |
Consumer Discretionary | 2,217,709 | 2,217,709 | - | - |
Consumer Staples | 4,351,448 | 4,351,448 | - | - |
Energy | 530,960 | 530,960 | - | - |
Financials | 5,059,504 | 5,059,504 | - | - |
Health Care | 5,039,526 | 5,039,526 | - | - |
Industrials | 3,891,482 | 3,891,482 | - | - |
Information Technology | 1,121,942 | 1,121,942 | - | - |
Materials | 1,120,474 | 1,120,474 | - | - |
Real Estate | 2,082,262 | 2,082,262 | - | - |
Utilities | 2,525,130 | 2,525,130 | - | - |
| Money Market Funds | 208,816 | 208,816 | - | - |
| Total Investments in Securities: | 30,892,014 | 30,892,014 | - | - |
Derivative Instruments: Liabilities | ||||
Futures Contracts | (4,498) | (4,498) | - | - |
| Total Liabilities | (4,498) | (4,498) | - | - |
| Total Derivative Instruments: | (4,498) | (4,498) | - | - |
Primary Risk Exposure / Derivative Type | Value | |
| Asset ($) | Liability ($) | |
| Equity Risk | ||
Futures Contracts (a) | 0 | (4,498) |
| Total Equity Risk | 0 | (4,498) |
| Total Value of Derivatives | 0 | (4,498) |
| Statement of Assets and Liabilities | ||||
| October 31, 2023 | ||||
| Assets | ||||
| Investment in securities, at value - See accompanying schedule: | ||||
Unaffiliated issuers (cost $31,707,656) | $ | 30,683,198 | ||
Fidelity Central Funds (cost $208,816) | 208,816 | |||
| Total Investment in Securities (cost $31,916,472) | $ | 30,892,014 | ||
| Segregated cash with brokers for derivative instruments | 8,994 | |||
| Foreign currency held at value (cost $7,792) | 7,767 | |||
| Dividends receivable | 85,613 | |||
| Reclaims receivable | 45,446 | |||
| Distributions receivable from Fidelity Central Funds | 262 | |||
| Receivable for daily variation margin on futures contracts | 590 | |||
Total assets | 31,040,686 | |||
| Liabilities | ||||
| Payable for investments purchased | $ | 145,016 | ||
| Accrued management fee | 9,468 | |||
| Total Liabilities | 154,484 | |||
| Net Assets | $ | 30,886,202 | ||
| Net Assets consist of: | ||||
| Paid in capital | $ | 34,104,710 | ||
| Total accumulated earnings (loss) | (3,218,508) | |||
| Net Assets | $ | 30,886,202 | ||
Net Asset Value, offering price and redemption price per share ($30,886,202 ÷ 1,300,000 shares) | $ | 23.76 | ||
| Statement of Operations | ||||
Year ended October 31, 2023 | ||||
| Investment Income | ||||
| Dividends | $ | 793,612 | ||
| Income from Fidelity Central Funds | 3,031 | |||
| Income before foreign taxes withheld | $ | 796,643 | ||
| Less foreign taxes withheld | (80,548) | |||
| Total Income | 716,095 | |||
| Expenses | ||||
| Management fee | $ | 87,727 | ||
| Independent trustees' fees and expenses | 113 | |||
| Total expenses before reductions | 87,840 | |||
| Expense reductions | (367) | |||
| Total expenses after reductions | 87,473 | |||
| Net Investment income (loss) | 628,622 | |||
| Realized and Unrealized Gain (Loss) | ||||
| Net realized gain (loss) on: | ||||
| Investment Securities: | ||||
| Unaffiliated issuers | (558,946) | |||
| Foreign currency transactions | (606) | |||
| Futures contracts | 10,021 | |||
| Total net realized gain (loss) | (549,531) | |||
| Change in net unrealized appreciation (depreciation) on: | ||||
| Investment Securities: | ||||
| Unaffiliated issuers | 530,593 | |||
| Assets and liabilities in foreign currencies | 29,656 | |||
| Futures contracts | 230 | |||
| Total change in net unrealized appreciation (depreciation) | 560,479 | |||
| Net gain (loss) | 10,948 | |||
| Net increase (decrease) in net assets resulting from operations | $ | 639,570 | ||
| Statement of Changes in Net Assets | ||||
Year ended October 31, 2023 | Year ended October 31, 2022 | |||
| Increase (Decrease) in Net Assets | ||||
| Operations | ||||
| Net investment income (loss) | $ | 628,622 | $ | 389,711 |
| Net realized gain (loss) | (549,531) | (1,163,840) | ||
| Change in net unrealized appreciation (depreciation) | 560,479 | (3,143,159) | ||
| Net increase (decrease) in net assets resulting from operations | 639,570 | (3,917,288) | ||
| Distributions to shareholders | (626,600) | (524,400) | ||
| Share transactions | ||||
| Proceeds from sales of shares | 17,630,620 | 2,824,049 | ||
| Cost of shares redeemed | - | (2,787,735) | ||
Net increase (decrease) in net assets resulting from share transactions | 17,630,620 | 36,314 | ||
| Total increase (decrease) in net assets | 17,643,590 | (4,405,374) | ||
| Net Assets | ||||
| Beginning of period | 13,242,612 | 17,647,986 | ||
| End of period | $ | 30,886,202 | $ | 13,242,612 |
| Other Information | ||||
| Shares | ||||
| Sold | 700,000 | 100,000 | ||
| Redeemed | - | (100,000) | ||
| Net increase (decrease) | 700,000 | - | ||
| Fidelity® International Multifactor ETF |
| Years ended October 31, | 2023 | 2022 | 2021 | 2020 | 2019 A | |||||
Selected Per-Share Data | ||||||||||
| Net asset value, beginning of period | $ | 22.07 | $ | 29.41 | $ | 24.01 | $ | 26.18 | $ | 25.05 |
| Income from Investment Operations | ||||||||||
Net investment income (loss) B,C | .70 | .65 | .65 | .57 | .55 | |||||
| Net realized and unrealized gain (loss) | 1.67 | (7.12) | 5.34 | (2.07) | 1.12 | |||||
| Total from investment operations | 2.37 | (6.47) | 5.99 | (1.50) | 1.67 | |||||
| Distributions from net investment income | (.68) | (.87) | (.59) | (.67) | (.54) | |||||
| Total distributions | (.68) | (.87) | (.59) | (.67) | (.54) | |||||
| Net asset value, end of period | $ | 23.76 | $ | 22.07 | $ | 29.41 | $ | 24.01 | $ | 26.18 |
Total Return D,E | 10.58% | (22.36)% | 25.08% | (5.73)% | 6.72% | |||||
Ratios to Average Net Assets C,F,G | ||||||||||
| Expenses before reductions | .39% | .39% | .39% | .39% | .39% H | |||||
| Expenses net of fee waivers, if any | .39% | .39% | .39% | .39% | .39% H | |||||
| Expenses net of all reductions | .39% | .39% | .39% | .39% | .39% H | |||||
| Net investment income (loss) | 2.78% | 2.51% | 2.28% | 2.29% | 3.18% H | |||||
| Supplemental Data | ||||||||||
| Net assets, end of period (000 omitted) | $ | 30,886 | $ | 13,243 | $ | 17,648 | $ | 7,202 | $ | 10,473 |
Portfolio turnover rate I,J | 60% | 61% | 74% | 69% | 35% K |
| Average Annual Total Returns | |||
Periods ended October 31, 2023 | Past 1 year | Past 5 years | Life of Fund |
Fidelity® International Value Factor ETF - NAV A | 18.72% | 4.45% | 1.06% |
Fidelity® International Value Factor ETF - Market Price B | 20.20% | 4.63% | 1.01% |
Fidelity International Value Factor Index℠ A | 19.32% | 5.03% | 1.62% |
MSCI World ex USA Index A | 12.82% | 4.49% | 1.41% |
| $10,000 Over Life of Fund |
Let's say hypothetically that $10,000 was invested in Fidelity® International Value Factor ETF - NAV, on January 16, 2018, when the fund started. The chart shows how the value of your investment would have changed, and also shows how the Fidelity International Value Factor Index℠ and the MSCI World ex USA Index performed over the same period. |
 |
Top Holdings (% of Fund's net assets) | ||
| Nestle SA (Reg. S) (United States of America, Food Products) | 2.2 | |
| Shell PLC (London) (Netherlands, Oil, Gas & Consumable Fuels) | 1.8 | |
| Novartis AG (Switzerland, Pharmaceuticals) | 1.7 | |
| SAP SE (Germany, Software) | 1.6 | |
| Mitsubishi UFJ Financial Group, Inc. (Japan, Banks) | 1.6 | |
| Japan Tobacco, Inc. (Japan, Tobacco) | 1.6 | |
| KDDI Corp. (Japan, Wireless Telecommunication Services) | 1.6 | |
| AstraZeneca PLC (United Kingdom) (United Kingdom, Pharmaceuticals) | 1.5 | |
| Roche Holding AG (participation certificate) (United States of America, Pharmaceuticals) | 1.5 | |
| LVMH Moet Hennessy Louis Vuitton SE (France, Textiles, Apparel & Luxury Goods) | 1.4 | |
| 16.5 | ||
| Market Sectors (% of Fund's net assets) | ||
| Financials | 20.8 | |
| Industrials | 15.9 | |
| Health Care | 11.1 | |
| Consumer Discretionary | 10.7 | |
| Consumer Staples | 9.0 | |
| Information Technology | 8.2 | |
| Materials | 7.6 | |
| Energy | 6.7 | |
| Communication Services | 4.2 | |
| Utilities | 3.3 | |
| Real Estate | 2.0 | |
Asset Allocation (% of Fund's net assets) |
 |
Futures - 0.4% |
Geographic Diversification (% of Fund's net assets) |
 |
* Includes Short-Term investments and Net Other Assets (Liabilities). Percentages are adjusted for the effect of derivatives, if applicable. |
| Common Stocks - 99.5% | |||
| Shares | Value ($) | ||
| Australia - 5.5% | |||
| BHP Group Ltd. | 31,196 | 878,953 | |
| Glencore PLC | 161,072 | 850,513 | |
| Macquarie Group Ltd. | 7,639 | 778,601 | |
| QBE Insurance Group Ltd. | 73,045 | 721,476 | |
| Rio Tinto Ltd. | 5,278 | 392,925 | |
| Sonic Healthcare Ltd. | 23,915 | 435,326 | |
TOTAL AUSTRALIA | 4,057,794 | ||
| Canada - 9.9% | |||
| Bank of Nova Scotia | 17,181 | 694,913 | |
| Canadian Apartment Properties (REIT) unit | 1,509 | 44,371 | |
| Canadian National Railway Co. | 5,147 | 544,008 | |
| Canadian Natural Resources Ltd. | 13,251 | 840,542 | |
| Canadian Pacific Kansas City Ltd. | 7,750 | 549,660 | |
| Canadian Tire Ltd. Class A (non-vtg.) | 2,395 | 230,762 | |
| CGI, Inc. Class A (sub. vtg.) (a) | 8,139 | 784,909 | |
| Fairfax Financial Holdings Ltd. (sub. vtg.) | 809 | 672,509 | |
| iA Financial Corp., Inc. | 9,071 | 527,239 | |
| Manulife Financial Corp. | 37,996 | 660,705 | |
| Northland Power, Inc. | 15,203 | 213,439 | |
| Nutrien Ltd. | 14,639 | 785,386 | |
| Suncor Energy, Inc. | 22,461 | 726,615 | |
TOTAL CANADA | 7,275,058 | ||
| China - 1.5% | |||
| BOC Hong Kong (Holdings) Ltd. | 198,000 | 523,810 | |
| Wilmar International Ltd. | 224,400 | 583,091 | |
TOTAL CHINA | 1,106,901 | ||
| Denmark - 0.7% | |||
| A.P. Moller - Maersk A/S Series B | 330 | 547,948 | |
| Finland - 0.8% | |||
| Nokia Corp. | 171,996 | 570,851 | |
| France - 9.7% | |||
| Capgemini SA | 3,907 | 687,595 | |
| Carrefour SA | 25,358 | 444,400 | |
| Compagnie de St.-Gobain | 15,439 | 838,798 | |
| Engie SA | 54,888 | 870,481 | |
| Kering SA | 841 | 340,641 | |
| Klepierre SA | 17,545 | 424,682 | |
| LVMH Moet Hennessy Louis Vuitton SE | 1,464 | 1,043,754 | |
| Societe Generale Series A | 33,665 | 752,422 | |
| Teleperformance | 6,508 | 743,959 | |
| TotalEnergies SE | 15,256 | 1,019,137 | |
TOTAL FRANCE | 7,165,869 | ||
| Germany - 11.6% | |||
| Allianz SE | 4,209 | 982,765 | |
| Bayer AG | 9,872 | 424,275 | |
| Bayerische Motoren Werke AG (BMW) | 7,631 | 706,821 | |
| Commerzbank AG | 51,996 | 557,842 | |
| Deutsche Bank AG | 61,082 | 668,621 | |
| Deutsche Telekom AG | 40,584 | 878,322 | |
| Fresenius Medical Care AG & Co. KGaA | 6,989 | 231,373 | |
| Fresenius SE & Co. KGaA | 11,973 | 306,768 | |
| K+S AG | 36,734 | 616,198 | |
| Mercedes-Benz Group AG (Germany) | 12,073 | 707,351 | |
| Merck KGaA | 2,324 | 349,678 | |
| SAP SE | 9,099 | 1,218,940 | |
| Siemens AG | 6,915 | 913,352 | |
TOTAL GERMANY | 8,562,306 | ||
| Hong Kong - 2.1% | |||
| CK Asset Holdings Ltd. | 77,500 | 387,272 | |
| Hong Kong Exchanges and Clearing Ltd. | 18,300 | 643,164 | |
| Jardine Matheson Holdings Ltd. | 12,700 | 513,715 | |
TOTAL HONG KONG | 1,544,151 | ||
| Italy - 3.9% | |||
| Assicurazioni Generali SpA | 33,049 | 654,815 | |
| Enel SpA | 145,867 | 923,238 | |
| Eni SpA | 31,044 | 506,247 | |
| UniCredit SpA | 31,792 | 793,898 | |
TOTAL ITALY | 2,878,198 | ||
| Japan - 23.5% | |||
| Dai-ichi Mutual Life Insurance Co. | 41,900 | 878,698 | |
| Daiwa House Industry Co. Ltd. | 20,700 | 564,092 | |
| Fujitsu Ltd. | 6,200 | 794,830 | |
| Honda Motor Co. Ltd. | 93,300 | 928,102 | |
| INPEX Corp. | 34,500 | 497,185 | |
| Japan Tobacco, Inc. | 50,800 | 1,181,068 | |
| KDDI Corp. | 38,800 | 1,149,563 | |
| Marubeni Corp. | 47,300 | 680,243 | |
| Mitsubishi Corp. | 19,900 | 913,893 | |
| Mitsubishi UFJ Financial Group, Inc. | 143,600 | 1,191,886 | |
| Mitsui & Co. Ltd. | 24,500 | 876,335 | |
| NEC Corp. | 15,300 | 727,898 | |
| Nippon Steel & Sumitomo Metal Corp. | 39,500 | 842,973 | |
| Nippon Yusen KK | 28,400 | 689,536 | |
| Ono Pharmaceutical Co. Ltd. | 38,500 | 661,347 | |
| Panasonic Holdings Corp. | 72,400 | 625,782 | |
| Shionogi & Co. Ltd. | 17,200 | 793,532 | |
| Subaru Corp. | 42,100 | 711,512 | |
| Sumco Corp. | 50,800 | 649,067 | |
| Sumitomo Corp. | 38,200 | 741,198 | |
| Sumitomo Forestry Co. Ltd. | 32,200 | 751,394 | |
| Tokyo Gas Co. Ltd. | 21,500 | 479,702 | |
TOTAL JAPAN | 17,329,836 | ||
| Luxembourg - 0.8% | |||
| ArcelorMittal SA (Netherlands) | 27,352 | 603,663 | |
| Netherlands - 4.3% | |||
| Koninklijke Ahold Delhaize NV | 17,789 | 526,483 | |
| Randstad NV | 10,594 | 546,903 | |
| Shell PLC (London) | 41,007 | 1,316,897 | |
| Stellantis NV (Italy) | 43,930 | 817,239 | |
TOTAL NETHERLANDS | 3,207,522 | ||
| Singapore - 1.0% | |||
| Genting Singapore Ltd. | 646,200 | 405,629 | |
| Singapore Telecommunications Ltd. | 209,500 | 363,936 | |
TOTAL SINGAPORE | 769,565 | ||
| Spain - 1.1% | |||
| Banco Santander SA (Spain) | 217,978 | 798,576 | |
| Sweden - 3.7% | |||
| Ericsson (B Shares) | 130,512 | 584,186 | |
| Essity AB (B Shares) | 21,763 | 495,346 | |
| SSAB AB (B Shares) | 123,101 | 713,089 | |
| Volvo AB (B Shares) | 46,036 | 910,201 | |
TOTAL SWEDEN | 2,702,822 | ||
| Switzerland - 4.0% | |||
| ABB Ltd. (Reg.) | 18,612 | 622,547 | |
| Novartis AG | 13,538 | 1,257,626 | |
| Sandoz Group AG | 2,707 | 70,348 | |
| UBS Group AG | 42,361 | 987,748 | |
TOTAL SWITZERLAND | 2,938,269 | ||
| United Kingdom - 9.8% | |||
| 3i Group PLC | 19,317 | 453,451 | |
| Ashtead Group PLC | 8,899 | 507,961 | |
| AstraZeneca PLC (United Kingdom) | 9,010 | 1,120,651 | |
| BAE Systems PLC | 52,872 | 708,299 | |
| Barclays PLC | 255,048 | 407,286 | |
| British American Tobacco PLC (United Kingdom) | 20,027 | 596,365 | |
| HSBC Holdings PLC (United Kingdom) | 132,641 | 953,326 | |
| Imperial Brands PLC | 18,749 | 398,370 | |
| Kingfisher PLC | 233,268 | 593,858 | |
| Unilever PLC | 17,864 | 843,021 | |
| Vodafone Group PLC | 689,749 | 633,591 | |
TOTAL UNITED KINGDOM | 7,216,179 | ||
| United States of America - 5.6% | |||
| GSK PLC | 35,912 | 635,097 | |
| Nestle SA (Reg. S) | 15,363 | 1,655,399 | |
| Roche Holding AG (participation certificate) | 4,208 | 1,081,304 | |
| Sanofi SA | 8,121 | 735,640 | |
TOTAL UNITED STATES OF AMERICA | 4,107,440 | ||
| TOTAL COMMON STOCKS (Cost $76,456,870) | 73,382,948 | ||
| Money Market Funds - 0.1% | |||
| Shares | Value ($) | ||
Fidelity Cash Central Fund 5.40% (b) (Cost $74,181) | 74,166 | 74,181 | |
| TOTAL INVESTMENT IN SECURITIES - 99.6% (Cost $76,531,051) | 73,457,129 |
NET OTHER ASSETS (LIABILITIES) - 0.4% | 310,469 |
| NET ASSETS - 100.0% | 73,767,598 |
| Futures Contracts | |||||
Number of contracts | Expiration Date | Notional Amount ($) | Value ($) | Unrealized Appreciation/ (Depreciation) ($) | |
| Purchased | |||||
| Equity Index Contracts | |||||
| ICE MSCI EAFE Index Contracts (United States) | 3 | Dec 2023 | 296,115 | (11,139) | (11,139) |
| The notional amount of futures purchased as a percentage of Net Assets is 0.4% | |||||
| (a) | Non-income producing |
| (b) | Affiliated fund that is generally available only to investment companies and other accounts managed by Fidelity Investments. The rate quoted is the annualized seven-day yield of the fund at period end. A complete unaudited listing of the fund's holdings as of its most recent quarter end is available upon request. In addition, each Fidelity Central Fund's financial statements, which are not covered by the Fund's Report of Independent Registered Public Accounting Firm, are available on the SEC's website or upon request. |
| Affiliate | Value, beginning of period ($) | Purchases ($) | Sales Proceeds ($) | Dividend Income ($) | Realized Gain (loss) ($) | Change in Unrealized appreciation (depreciation) ($) | Value, end of period ($) | % ownership, end of period |
| Fidelity Cash Central Fund 5.40% | 34,107 | 3,180,127 | 3,140,053 | 4,120 | - | - | 74,181 | 0.0% |
| Fidelity Securities Lending Cash Central Fund 5.40% | - | 1,360,459 | 1,360,459 | 4,117 | - | - | - | 0.0% |
| Total | 34,107 | 4,540,586 | 4,500,512 | 8,237 | - | - | 74,181 | |
| Valuation Inputs at Reporting Date: | ||||
| Description | Total ($) | Level 1 ($) | Level 2 ($) | Level 3 ($) |
Investments in Securities: | ||||
| Equities: | ||||
Communication Services | 3,025,412 | 3,025,412 | - | - |
Consumer Discretionary | 7,862,845 | 7,862,845 | - | - |
Consumer Staples | 6,723,543 | 6,723,543 | - | - |
Energy | 4,906,623 | 4,906,623 | - | - |
Financials | 15,303,751 | 15,303,751 | - | - |
Health Care | 8,102,965 | 8,102,965 | - | - |
Industrials | 11,848,556 | 11,848,556 | - | - |
Information Technology | 6,018,276 | 6,018,276 | - | - |
Materials | 5,683,700 | 5,683,700 | - | - |
Real Estate | 1,420,417 | 1,420,417 | - | - |
Utilities | 2,486,860 | 2,486,860 | - | - |
| Money Market Funds | 74,181 | 74,181 | - | - |
| Total Investments in Securities: | 73,457,129 | 73,457,129 | - | - |
Derivative Instruments: Liabilities | ||||
Futures Contracts | (11,139) | (11,139) | - | - |
| Total Liabilities | (11,139) | (11,139) | - | - |
| Total Derivative Instruments: | (11,139) | (11,139) | - | - |
Primary Risk Exposure / Derivative Type | Value | |
| Asset ($) | Liability ($) | |
| Equity Risk | ||
Futures Contracts (a) | 0 | (11,139) |
| Total Equity Risk | 0 | (11,139) |
| Total Value of Derivatives | 0 | (11,139) |
| Statement of Assets and Liabilities | ||||
| October 31, 2023 | ||||
| Assets | ||||
| Investment in securities, at value - See accompanying schedule: | ||||
Unaffiliated issuers (cost $76,456,870) | $ | 73,382,948 | ||
Fidelity Central Funds (cost $74,181) | 74,181 | |||
| Total Investment in Securities (cost $76,531,051) | $ | 73,457,129 | ||
| Segregated cash with brokers for derivative instruments | 19,311 | |||
| Cash | 3,825 | |||
| Foreign currency held at value (cost $8,155) | 8,119 | |||
| Dividends receivable | 214,911 | |||
| Reclaims receivable | 85,560 | |||
| Distributions receivable from Fidelity Central Funds | 1,101 | |||
| Receivable for daily variation margin on futures contracts | 885 | |||
Total assets | 73,790,841 | |||
| Liabilities | ||||
| Accrued management fee | $ | 23,243 | ||
| Total Liabilities | 23,243 | |||
| Net Assets | $ | 73,767,598 | ||
| Net Assets consist of: | ||||
| Paid in capital | $ | 83,486,109 | ||
| Total accumulated earnings (loss) | (9,718,511) | |||
| Net Assets | $ | 73,767,598 | ||
Net Asset Value, offering price and redemption price per share ($73,767,598 ÷ 3,400,000 shares) | $ | 21.70 | ||
| Statement of Operations | ||||
Year ended October 31, 2023 | ||||
| Investment Income | ||||
| Dividends | $ | 2,121,664 | ||
| Income from Fidelity Central Funds (including $4,117 from security lending) | 8,237 | |||
| Income before foreign taxes withheld | $ | 2,129,901 | ||
| Less foreign taxes withheld | (199,850) | |||
| Total Income | 1,930,051 | |||
| Expenses | ||||
| Management fee | $ | 191,928 | ||
| Independent trustees' fees and expenses | 253 | |||
| Total expenses before reductions | 192,181 | |||
| Expense reductions | (350) | |||
| Total expenses after reductions | 191,831 | |||
| Net Investment income (loss) | 1,738,220 | |||
| Realized and Unrealized Gain (Loss) | ||||
| Net realized gain (loss) on: | ||||
| Investment Securities: | ||||
| Unaffiliated issuers | (1,205,445) | |||
| Redemptions in-kind | 1,707,252 | |||
| Foreign currency transactions | (37,906) | |||
| Futures contracts | 38,331 | |||
| Total net realized gain (loss) | 502,232 | |||
| Change in net unrealized appreciation (depreciation) on: | ||||
| Investment Securities: | ||||
| Unaffiliated issuers | 2,926,649 | |||
| Assets and liabilities in foreign currencies | 67,988 | |||
| Futures contracts | (24,315) | |||
| Total change in net unrealized appreciation (depreciation) | 2,970,322 | |||
| Net gain (loss) | 3,472,554 | |||
| Net increase (decrease) in net assets resulting from operations | $ | 5,210,774 | ||
| Statement of Changes in Net Assets | ||||
Year ended October 31, 2023 | Year ended October 31, 2022 | |||
| Increase (Decrease) in Net Assets | ||||
| Operations | ||||
| Net investment income (loss) | $ | 1,738,220 | $ | 1,515,077 |
| Net realized gain (loss) | 502,232 | (1,837,712) | ||
| Change in net unrealized appreciation (depreciation) | 2,970,322 | (8,191,270) | ||
| Net increase (decrease) in net assets resulting from operations | 5,210,774 | (8,513,905) | ||
| Distributions to shareholders | (1,727,100) | (1,749,900) | ||
| Share transactions | ||||
| Proceeds from sales of shares | 41,390,748 | 18,476,821 | ||
| Cost of shares redeemed | (8,989,408) | (11,779,865) | ||
Net increase (decrease) in net assets resulting from share transactions | 32,401,340 | 6,696,956 | ||
| Total increase (decrease) in net assets | 35,885,014 | (3,566,849) | ||
| Net Assets | ||||
| Beginning of period | 37,882,584 | 41,449,433 | ||
| End of period | $ | 73,767,598 | $ | 37,882,584 |
| Other Information | ||||
| Shares | ||||
| Sold | 1,800,000 | 800,000 | ||
| Redeemed | (400,000) | (500,000) | ||
| Net increase (decrease) | 1,400,000 | 300,000 | ||
| Fidelity® International Value Factor ETF |
| Years ended October 31, | 2023 | 2022 | 2021 | 2020 | 2019 | |||||
Selected Per-Share Data | ||||||||||
| Net asset value, beginning of period | $ | 18.94 | $ | 24.38 | $ | 17.82 | $ | 21.89 | $ | 20.89 |
| Income from Investment Operations | ||||||||||
Net investment income (loss) A,B | .79 | .83 | .79 | .51 | .80 | |||||
| Net realized and unrealized gain (loss) | 2.78 | (5.32) | 6.54 | (4.09) | 1.05 | |||||
| Total from investment operations | 3.57 | (4.49) | 7.33 | (3.58) | 1.85 | |||||
| Distributions from net investment income | (.81) | (.95) | (.77) | (.49) | (.85) | |||||
| Total distributions | (.81) | (.95) | (.77) | (.49) | (.85) | |||||
| Net asset value, end of period | $ | 21.70 | $ | 18.94 | $ | 24.38 | $ | 17.82 | $ | 21.89 |
Total Return C,D | 18.72% | (18.82)% | 41.36% | (16.32)% | 9.04% | |||||
Ratios to Average Net Assets B,E,F | ||||||||||
| Expenses before reductions | .39% | .39% | .39% | .39% | .39% | |||||
| Expenses net of fee waivers, if any | .39% | .39% | .39% | .39% | .39% | |||||
| Expenses net of all reductions | .39% | .39% | .39% | .39% | .39% | |||||
| Net investment income (loss) | 3.52% | 3.79% | 3.32% | 2.60% | 3.74% | |||||
| Supplemental Data | ||||||||||
| Net assets, end of period (000 omitted) | $ | 73,768 | $ | 37,883 | $ | 41,449 | $ | 14,254 | $ | 13,135 |
Portfolio turnover rate G | 81% H | 69% H | 101% H | 76% H | 56% |
| Fidelity Central Fund | Investment Manager | Investment Objective | Investment Practices | Expense RatioA |
| Fidelity Money Market Central Funds | Fidelity Management & Research Company LLC (FMR) | Each fund seeks to obtain a high level of current income consistent with the preservation of capital and liquidity. | Short-term Investments | Less than .005% |
| Tax cost | Gross unrealized appreciation | Gross unrealized depreciation | Net unrealized appreciation (depreciation) | |
Fidelity Emerging Markets Multifactor ETF | $26,481,304 | $2,025,494 | $(2,923,183) | $(897,689) |
Fidelity International High Dividend ETF | 95,376,206 | 2,475,567 | (15,898,398) | (13,422,831) |
Fidelity International Multifactor ETF | 32,056,211 | 1,439,270 | (2,603,467) | (1,164,197) |
| Fidelity International Value Factor ETF | 76,826,790 | 2,835,084 | (6,204,745) | (3,369,661) |
| Undistributed ordinary income | Capital loss carryforward | Net unrealized appreciation (depreciation) on securities and other investments | |
Fidelity Emerging Markets Multifactor ETF | $- | $(3,440,732) | $(910,136) |
Fidelity International High Dividend ETF | 177,123 | (9,135,767) | (13,299,282) |
Fidelity International Multifactor ETF | 103,008 | (2,185,323) | (1,136,193) |
| Fidelity International Value Factor ETF | 350,812 | (6,754,672) | (3,314,651) |
| Short-term | Long-term | Total capital loss carryforward | |
Fidelity Emerging Markets Multifactor ETF | $ (1,719,663) | $ (1,721,069) | $(3,440,732) |
Fidelity International High Dividend ETF | (4,953,437) | (4,182,330) | (9,135,767) |
Fidelity International Multifactor ETF | (1,527,752) | (657,571) | (2,185,323) |
| Fidelity International Value Factor ETF | (2,954,147) | (3,800,525) | (6,754,672) |
| October 31, 2023 | |||
| Ordinary Income | Tax Return of Capital | Total | |
Fidelity Emerging Markets Multifactor ETF | $1,198,769 | $11,231 | $1,210,000 |
Fidelity International High Dividend ETF | 4,144,700 | - | 4,144,700 |
Fidelity International Multifactor ETF | 626,600 | - | 626,600 |
| Fidelity International Value Factor ETF | 1,727,100 | - | 1,727,100 |
| October 31, 2022 | |||
| Ordinary Income | Tax Return of Capital | Total | |
Fidelity Emerging Markets Multifactor ETF | $826,772 | $29,228 | $856,000 |
Fidelity International High Dividend ETF | 4,783,300 | - | 4,783,300 |
Fidelity International Multifactor ETF | 524,400 | - | 524,400 |
| Fidelity International Value Factor ETF | 1,749,900 | - | 1,749,900 |
| Equity Risk | Equity risk relates to the fluctuations in the value of financial instruments as a result of changes in market prices (other than those arising from interest rate risk or foreign exchange risk), whether caused by factors specific to an individual investment, its issuer, or all factors affecting all instruments traded in a market or market segment. |
| Purchases ($) | Sales ($) | |
| Fidelity Emerging Markets Multifactor ETF | 22,505,230 | 19,543,108 |
| Fidelity International High Dividend ETF | 57,412,199 | 57,648,736 |
| Fidelity International Multifactor ETF | 13,483,922 | 12,575,707 |
| Fidelity International Value Factor ETF | 38,672,081 | 37,200,813 |
| In-Kind Subscriptions ($) | In-Kind Redemptions ($) | |
| Fidelity Emerging Markets Multifactor ETF | 1,184,413 | - |
| Fidelity International High Dividend ETF | - | 5,344,937 |
| Fidelity International Multifactor ETF | 16,632,017 | - |
| Fidelity International Value Factor ETF | 39,670,907 | 8,817,309 |
| Fee Rate | |
| Fidelity Emerging Markets Multifactor ETF | .45% |
| Fidelity International High Dividend ETF | .39% |
| Fidelity International Multifactor ETF | .39% |
| Fidelity International Value Factor ETF | .39% |
| Fee Rate | |
| Fidelity Emerging Markets Multifactor ETF | .25% |
| Fidelity International High Dividend ETF | .18% |
| Fidelity International Multifactor ETF | .18% |
| Fidelity International Value Factor ETF | .18% |
| Total Security Lending Fees Paid to NFS | Security Lending Income From Securities Loaned to NFS | Value of Securities Loaned to NFS at Period End | |
| Fidelity International High Dividend ETF | $2,224 | $- | $- |
| Fidelity International Value Factor ETF | $447 | $- | $- |
| Custodian credits | |
Fidelity Emerging Markets Multifactor ETF | $418 |
Fidelity International High Dividend ETF | 232 |
Fidelity International Multifactor ETF | 367 |
Fidelity International Value Factor ETF | 350 |
| The Example is based on an investment of $1,000 invested at the beginning of the period and held for the entire period (May 1, 2023 to October 31, 2023). |
Annualized Expense Ratio- A | Beginning Account Value May 1, 2023 | Ending Account Value October 31, 2023 | Expenses Paid During Period- C May 1, 2023 to October 31, 2023 | |||||||
Fidelity® Emerging Markets Multifactor ETF ** | .45% | |||||||||
| Actual | $ 1,000 | $ 987.00 | $ 2.25 | |||||||
Hypothetical-B | $ 1,000 | $ 1,022.94 | $ 2.29 | |||||||
Fidelity® International High Dividend ETF ** | .39% | |||||||||
| Actual | $ 1,000 | $ 936.30 | $ 1.90 | |||||||
Hypothetical-B | $ 1,000 | $ 1,023.24 | $ 1.99 | |||||||
Fidelity® International Multifactor ETF ** | .39% | |||||||||
| Actual | $ 1,000 | $ 916.00 | $ 1.88 | |||||||
Hypothetical-B | $ 1,000 | $ 1,023.24 | $ 1.99 | |||||||
Fidelity® International Value Factor ETF ** | .39% | |||||||||
| Actual | $ 1,000 | $ 953.60 | $ 1.92 | |||||||
Hypothetical-B | $ 1,000 | $ 1,023.24 | $ 1.99 | |||||||
Annualized Expense Ratio- A | Expenses Paid | |||||
| Fidelity® Emerging Markets Multifactor ETF | .25% | |||||
| Actual | $ 1.25 | |||||
Hypothetical- B | $ 1.28 | |||||
| Fidelity® International High Dividend ETF | .18% | |||||
| Actual | $ 0.88 | |||||
Hypothetical- B | $ 0.92 | |||||
| Fidelity® International Multifactor ETF | .18% | |||||
| Actual | $ 0.87 | |||||
Hypothetical- B | $ 0.92 | |||||
| Fidelity® International Value Factor ETF | .18% | |||||
| Actual | $ 0.89 | |||||
Hypothetical- B | $ 0.92 | |||||
| A Annualized expense ratio reflects expenses net of applicable fee waivers. | ||||||
| B 5% return per year before expenses |
| Fidelity Emerging Markets Multifactor ETF | |
| December 2022 | 59.71% |
| March 2023 | 60.04% |
| June 2023 | 60.04% |
| September 2023 | 60.04% |
| Fidelity International High Dividend ETF | |
| December 2022 | 90.37% |
| March 2023 | 97.51% |
| June 2023 | 97.51% |
| September 2023 | 97.51% |
| Fidelity International Multifactor ETF | |
| December 2022 | 100% |
| March 2023 | 100% |
| June 2023 | 100% |
| September 2023 | 100% |
| Fidelity International Value Factor ETF | |
| December 2022 | 86.19% |
| March 2023 | 100% |
| June 2023 | 100% |
| September 2023 | 100% |
| Pay Date | Income | Taxes | |
| Fidelity Emerging Markets Multifactor ETF | |||
| 03/23/22 | $0.1105 | $0.0126 | |
| 06/23/22 | $0.4052 | $0.0463 | |
| 09/21/22 | $0.2687 | $0.0307 | |
| 12/21/22 | $0.1400 | $0.0160 | |
| Fidelity International High Dividend ETF | |||
| 03/23/22 | $0.2644 | $0.0204 | |
| 06/23/22 | $0.3967 | $0.0307 | |
| 09/21/22 | $0.2514 | $0.0194 | |
| 12/21/22 | $0.1170 | $0.0090 | |
| Fidelity International Multifactor ETF | |||
| 03/23/22 | $0.2191 | $0.0191 | |
| 06/23/22 | $0.2180 | $0.0190 | |
| 09/21/22 | $0.2048 | $0.0178 | |
| 12/21/22 | $0.0613 | $0.0053 | |
| Fidelity International Value Factor ETF | |||
| 03/23/22 | $0.2337 | $0.0167 | |
| 06/23/22 | $0.2984 | $0.0214 | |
| 09/21/22 | $0.2025 | $0.0145 | |
| 12/21/22 | $0.0883 | $0.0063 | |
 |
Item 2.
Code of Ethics
As of the end of the period, October 31, 2023, Fidelity Covington Trust (the trust) has adopted a code of ethics, as defined in Item 2 of Form N-CSR, that applies to its President and Treasurer and its Chief Financial Officer. A copy of the code of ethics is filed as an exhibit to this Form N-CSR.
Item 3.
Audit Committee Financial Expert
The Board of Trustees of the trust has determined that Donald F. Donahue is an audit committee financial expert, as defined in Item 3 of Form N-CSR. Mr. Donahue is independent for purposes of Item 3 of Form N-CSR.
Item 4.
Principal Accountant Fees and Services
Fees and Services
The following table presents fees billed by Deloitte & Touche LLP, the member firms of Deloitte Touche Tohmatsu, and their respective affiliates (collectively, “Deloitte Entities”) in each of the last two fiscal years for services rendered to Fidelity Emerging Markets Multifactor ETF, Fidelity International High Dividend ETF, Fidelity International Multifactor ETF and Fidelity International Value Factor ETF (the “Fund(s)”):
Services Billed by Deloitte Entities
October 31, 2023 FeesA
Audit Fees | Audit-Related Fees | Tax Fees | All Other Fees | |
Fidelity Emerging Markets Multifactor ETF | $19,100 | $- | $3,800 | $400 |
Fidelity International High Dividend ETF | $19,100 | $- | $3,800 | $400 |
Fidelity International Multifactor ETF | $19,100 | $- | $3,800 | $400 |
Fidelity International Value Factor ETF | $19,100 | $- | $3,800 | $400 |
October 31, 2022 FeesA
Audit Fees | Audit-Related Fees | Tax Fees | All Other Fees | |
Fidelity Emerging Markets Multifactor ETF | $16,300 | $- | $4,600 | $400 |
Fidelity International High Dividend ETF | $16,300 | $- | $4,600 | $400 |
Fidelity International Multifactor ETF | $16,300 | $- | $4,600 | $400 |
Fidelity International Value Factor ETF | $16,300 | $- | $4,600 | $400 |
A Amounts may reflect rounding.
The following table(s) present(s) fees billed by Deloitte Entities that were required to be approved by the Audit Committee for services that relate directly to the operations and financial reporting of the Fund(s) and that are rendered on behalf of Fidelity Management & Research Company LLC ("FMR") and entities controlling, controlled by, or under common control with FMR (not including any sub-adviser whose role is primarily portfolio management and is subcontracted with or overseen by another investment adviser) that provide ongoing services to the Fund(s) (“Fund Service Providers”):
Services Billed by Deloitte Entities
October 31, 2023A | October 31, 2022A | |
Audit-Related Fees | $- | $- |
Tax Fees | $- | $- |
All Other Fees | $- | $- |
A Amounts may reflect rounding.
“Audit-Related Fees” represent fees billed for assurance and related services that are reasonably related to the performance of the fund audit or the review of the fund's financial statements and that are not reported under Audit Fees.
“Tax Fees” represent fees billed for tax compliance, tax advice or tax planning that relate directly to the operations and financial reporting of the fund.
“All Other Fees” represent fees billed for services provided to the fund or Fund Service Provider, a significant portion of which are assurance related, that relate directly to the operations and financial reporting of the fund, excluding those services that are reported under Audit Fees, Audit-Related Fees or Tax Fees.
Assurance services must be performed by an independent public accountant.
* * *
The aggregate non-audit fees billed by Deloitte Entities for services rendered to the Fund(s), FMR (not including any sub-adviser whose role is primarily portfolio
management and is subcontracted with or overseen by another investment adviser), and any Fund Service Provider for each of the last two fiscal years of the Fund(s) are as follows:
Billed By | October 31, 2023A | October 31, 2022A |
Deloitte Entities | $259,400 | $477,600 |
A Amounts may reflect rounding.
The trust's Audit Committee has considered non-audit services that were not pre-approved that were provided by Deloitte Entities to Fund Service Providers to be compatible with maintaining the independence of Deloitte Entities in its(their) audit of the Fund(s), taking into account representations from Deloitte Entities, in accordance with Public Company Accounting Oversight Board rules, regarding its independence from the Fund(s) and its(their) related entities and FMR’s review of the appropriateness and permissibility under applicable law of such non-audit services prior to their provision to the Fund(s) Service Providers.
Audit Committee Pre-Approval Policies and Procedures
The trust’s Audit Committee must pre-approve all audit and non-audit services provided by a fund’s independent registered public accounting firm relating to the operations or financial reporting of the fund. Prior to the commencement of any audit or non-audit services to a fund, the Audit Committee reviews the services to determine whether they are appropriate and permissible under applicable law.
The Audit Committee has adopted policies and procedures to, among other purposes, provide a framework for the Committee’s consideration of non-audit services by the audit firms that audit the Fidelity funds. The policies and procedures require that any non-audit service provided by a fund audit firm to a Fidelity fund and any non-audit service provided by a fund auditor to a Fund Service Provider that relates directly to the operations and financial reporting of a Fidelity fund (“Covered Service”) are subject to approval by the Audit Committee before such service is provided.
All Covered Services must be approved in advance of provision of the service either: (i) by formal resolution of the Audit Committee, or (ii) by oral or written approval of the service by the Chair of the Audit Committee (or if the Chair is unavailable, such other member of the Audit Committee as may be designated by the Chair to act in the Chair’s absence). The approval contemplated by (ii) above is permitted where the Treasurer determines that action on such an engagement is necessary before the next meeting of the Audit Committee.
Non-audit services provided by a fund audit firm to a Fund Service Provider that do not relate directly to the operations and financial reporting of a Fidelity fund are reported to the Audit Committee periodically.
Non-Audit Services Approved Pursuant to Rule 2-01(c)(7)(i)(C) and (ii) of Regulation S-X (“De Minimis Exception”)
There were no non-audit services approved or required to be approved by the Audit Committee pursuant to the De Minimis Exception during the Fund’s(s’) last two fiscal years relating to services provided to (i) the Fund(s) or (ii) any Fund Service Provider that relate directly to the operations and financial reporting of the Fund(s).
The Registrant has not retained, for the preparation of the audit report on the financial statements included in the Form N-CSR, a registered public accounting firm that has a branch or office that is located in a foreign jurisdiction and that the Public Company Accounting Oversight Board (the “PCAOB”) has determined that the PCAOB is unable to inspect or investigate completely because of a position taken by an authority in the foreign jurisdiction.
The Registrant is not a “foreign issuer,” as defined in 17 CFR 240.3b-4.
Item 5.
Audit Committee of Listed Registrants
The Audit Committee is a separately-designated standing audit committee in accordance with Section 3(a)(58)(A) of the Securities Exchange Act of 1934. As of October 31, 2023, the members of the Audit Committee were Donald F. Donahue, Thomas P. Bostick, Thomas Kennedy, and Susan Tomasky.
Item 6.
Investments
(a)
Not applicable.
(b)
Not applicable.
Item 7.
Disclosure of Proxy Voting Policies and Procedures for Closed-End Management Investment Companies
Not applicable.
Item 8.
Portfolio Managers of Closed-End Management Investment Companies
Not applicable.
Item 9.
Purchase of Equity Securities by Closed-End Management Investment Company and Affiliated Purchasers
Not applicable.
Item 10.
Submission of Matters to a Vote of Security Holders
There were no material changes to the procedures by which shareholders may recommend nominees to the trust’s Board of Trustees.
Item 11.
Controls and Procedures
(a)(i) The President and Treasurer and the Chief Financial Officer have concluded that the trust’s disclosure controls and procedures (as defined in Rule 30a-3(c) under the Investment Company Act) provide reasonable assurances that material information relating to the trust is made known to them by the appropriate persons, based on their evaluation of these controls and procedures as of a date within 90 days of the filing date of this report.
(a)(ii) There was no change in the trust’s internal control over financial reporting (as defined in Rule 30a-3(d) under the Investment Company Act) that occurred during the period covered by this report that has materially affected, or is reasonably likely to materially affect, the trust’s internal control over financial reporting.
Item 12.
Disclosure of Securities Lending Activities for Closed-End Management
Investment Companies
Not applicable.
Item 18.
Recovery of Erroneously Awarded Compensation
(a)
Not applicable.
(b)
Not applicable.
Item 19.
Exhibits
(a) | (1) | Code of Ethics pursuant to Item 2 of Form N-CSR is filed and attached hereto as EX-99.CODE ETH. |
(a) | (2) | |
(a) | (3) | Not applicable. |
(b) |
SIGNATURES
Pursuant to the requirements of the Securities Exchange Act of 1934 and the Investment Company Act of 1940, the registrant has duly caused this report to be signed on its behalf by the undersigned, thereunto duly authorized.
Fidelity Covington Trust
By: | /s/Stacie M. Smith |
Stacie M. Smith | |
President and Treasurer | |
Date: | December 21, 2023 |
Pursuant to the requirements of the Securities Exchange Act of 1934 and the Investment Company Act of 1940, this report has been signed below by the following persons on behalf of the registrant and in the capacities and on the dates indicated.
By: | /s/Stacie M. Smith |
Stacie M. Smith | |
President and Treasurer | |
Date: | December 21, 2023 |
By: | /s/John J. Burke III |
John J. Burke III | |
Chief Financial Officer | |
Date: | December 21, 2023 |