UNITED STATES
SECURITIES AND EXCHANGE COMMISSION
Washington, D.C. 20549
FORM N-CSR
CERTIFIED SHAREHOLDER REPORT OF REGISTERED
MANAGEMENT INVESTMENT COMPANIES
Investment Company Act file number 811-07319
Fidelity Covington Trust
(Exact name of registrant as specified in charter)
245 Summer St., Boston, Massachusetts 02210
(Address of principal executive offices) (Zip code)
Cynthia Lo Bessette, Secretary
245 Summer St.
Boston, Massachusetts 02210
(Name and address of agent for service)
Registrant’s telephone number, including area code: 617-563-7000
Date of fiscal year end: August 31
Date of reporting period: August 31, 2021
| Item 1. | Reports to Stockholders |


| Annual Report | 2 |
| 3 | Annual Report |
| Annual Report | 4 |
| Average Annual Total Returns | Past 1 Year | Life of fund |
| Fidelity High Yield Factor ETF – NAVA | 8.66% | 9.12% |
| Fidelity High Yield Factor ETF – Market PriceB | 8.63% | 9.00% |
| ICE BofA BB-B US High Yield Constrained IndexA | 8.47% | 7.07% |
| ICE BofA US High Yield Master II IndexA | 10.26% | 6.82% |
| B | From June 14, 2018, date initially listed on the NYSE ARCA exchange. |
| * | Total returns are historical and include changes in share price and reinvestment of dividends and capital gains distributions, if any. |

| 5 | Annual Report |
| Annual Report | 6 |
| (by issuer, excluding cash equivalents) | % of fund’s net assets |
| Occidental Petroleum Corp. | 2.5 |
| CCO Holdings LLC / CCO Holdings Capital Corp. | 2.5 |
| Carvana Co. | 2.4 |
| LPL Holdings, Inc. | 1.9 |
| GFL Environmental, Inc. | 1.7 |
| 11.0 |
| % of fund's net assets | ||
| Industrials | 16.8 | |
| Consumer Discretionary | 15.1 | |
| Energy | 13.5 | |
| Communication Services | 12.4 | |
| Financials | 10.7 | |
| 7 | Annual Report |
| (excluding cash equivalents) | % of fund's net assets |
| Ally Financial, Inc. | 4.8 |
| Wells Fargo & Co. | 4.0 |
| Apollo Management Holdings LP | 3.7 |
| KKR Group Finance Co. IX LLC | 3.7 |
| Morgan Stanley | 3.5 |
| Citizens Financial Group, Inc. | 3.2 |
| Truist Financial Corp. | 3.2 |
| JPMorgan Chase & Co. | 3.1 |
| The Charles Schwab Corp. | 2.8 |
| The Goldman Sachs Group, Inc. | 2.5 |
| 34.5 |
| % of fund's net assets | ||
| Financials | 76.8 | |
| Energy | 6.2 | |
| Communication Services | 5.4 | |
| Utilities | 5.2 | |
| Consumer Discretionary | 2.6 | |
| Annual Report | 8 |
| Nonconvertible Bonds – 97.8% | |||
| Principal Amount | Value | ||
| COMMUNICATION SERVICES – 12.4% | |||
| Diversified Telecommunication Services – 2.2% | |||
| Acuris Finance U.S., Inc. / Acuris Finance Sarl 5.00% 5/1/28 (a) | $ 500,000 | $ 496,250 | |
| Altice France SA 7.375% 5/1/26 (a) | 443,000 | 459,821 | |
| CSC Holdings LLC: | |||
4.50% 11/15/31 (a) | 1,300,000 | 1,308,424 | |
5.00% 11/15/31 (a) | 1,015,000 | 1,009,925 | |
| Frontier Communications Holdings LLC 5.00% 5/1/28 (a) | 407,000 | 425,315 | |
| Lumen Technologies, Inc.: | |||
4.50% 1/15/29 (a) | 740,000 | 723,350 | |
5.375% 6/15/29 (a) | 375,000 | 385,057 | |
5.80% 3/15/22 | 36,000 | 36,810 | |
6.875% 1/15/28 | 80,000 | 89,914 | |
| Telecom Italia Capital SA 7.721% 6/4/38 | 858,000 | 1,113,126 | |
| 6,047,992 | |||
| Entertainment – 0.6% | |||
| Live Nation Entertainment, Inc.: | |||
3.75% 1/15/28 (a) | 210,000 | 210,080 | |
4.875% 11/1/24 (a) | 1,414,000 | 1,433,442 | |
| Playtika Holding Corp. 4.25% 3/15/29 (a) | 130,000 | 131,138 | |
| 1,774,660 | |||
| Interactive Media & Services – 1.2% | |||
| Match Group, Inc.: | |||
4.125% 8/1/30 (a) | 270,000 | 282,825 | |
4.625% 6/1/28 (a) | 1,409,000 | 1,471,278 | |
| TripAdvisor, Inc. 7.00% 7/15/25 (a) | 1,450,000 | 1,533,520 | |
| 3,287,623 | |||
| Media – 7.9% | |||
| Altice Financing SA 5.75% 8/15/29 (a) | 700,000 | 719,040 | |
| Cable One, Inc. 4.00% 11/15/30 (a) | 2,003,000 | 2,026,435 | |
| CCO Holdings LLC / CCO Holdings Capital Corp.: | |||
4.25% 1/15/34 (a) | 3,000,000 | 3,027,000 | |
4.50% 5/1/32 | 2,645,000 | 2,763,628 | |
5.50% 5/1/26 (a) | 1,000,000 | 1,030,110 | |
| Cimpress PLC 7.00% 6/15/26 (a) | 650,000 | 679,250 | |
| Deluxe Corp. 8.00% 6/1/29 (a)(b) | 500,000 | 535,375 | |
| | |||
| Principal Amount | Value | ||
| DIRECTV Holdings LLC / DIRECTV Financing Co., Inc. 5.875% 8/15/27 (a) | $ 1,000,000 | $ 1,045,000 | |
| DISH DBS Corp.: | |||
5.125% 6/1/29 (b) | 1,515,000 | 1,507,395 | |
5.875% 11/15/24 | 456,000 | 490,200 | |
7.375% 7/1/28 | 1,106,000 | 1,190,197 | |
| Lamar Media Corp.: | |||
3.625% 1/15/31 (a) | 2,054,000 | 2,048,865 | |
4.875% 1/15/29 | 143,000 | 152,116 | |
| Liberty Interactive LLC 8.25% 2/1/30 | 144,000 | 162,000 | |
| Nexstar Broadcasting, Inc. 4.75% 11/1/28 (a) | 1,924,000 | 2,000,537 | |
| Summer BC Bidco B LLC 5.50% 10/31/26 (a) | 600,000 | 608,250 | |
| Univision Communications, Inc. 4.50% 5/1/29 (a) | 345,000 | 349,968 | |
| Virgin Media Vendor Financing Notes IV DAC 5.00% 7/15/28 (a) | 300,000 | 310,875 | |
| Windstream Escrow LLC / Windstream Escrow Finance Corp. 7.75% 8/15/28 (a) | 266,000 | 274,814 | |
| Ziggo BV 5.50% 1/15/27 (a) | 1,000,000 | 1,033,590 | |
| 21,954,645 | |||
| Wireless Telecommunication Services – 0.5% | |||
| Altice France SA 5.125% 7/15/29 (a) | 1,340,000 | 1,354,767 | |
| Vodafone Group PLC 7.00% 4/4/79 (c) | 54,000 | 66,692 | |
| 1,421,459 | |||
| TOTAL COMMUNICATION SERVICES | 34,486,379 | ||
| CONSUMER DISCRETIONARY – 15.1% | |||
| Auto Components – 0.0% | |||
| Tenneco, Inc. 5.125% 4/15/29 (a) | 80,000 | 82,992 | |
| Automobiles – 1.2% | |||
| Ford Motor Co.: | |||
6.375% 2/1/29 | 280,000 | 326,900 | |
9.625% 4/22/30 | 1,033,000 | 1,472,944 | |
| Ford Motor Credit Co. LLC: | |||
2.90% 2/16/28 | 170,000 | 169,363 | |
2.979% 8/3/22 | 150,000 | 151,913 | |
3.664% 9/8/24 | 164,000 | 170,970 | |
4.25% 9/20/22 | 267,000 | 274,676 | |
| Jaguar Land Rover Automotive PLC 5.50% 7/15/29 (a) | 650,000 | 645,021 | |
| 9 | Annual Report |
| Nonconvertible Bonds – continued | |||
| Principal Amount | Value | ||
| CONSUMER DISCRETIONARY – continued | |||
| Automobiles – continued | |||
| Winnebago Industries, Inc. 6.25% 7/15/28 (a) | $ 128,000 | $ 137,600 | |
| 3,349,387 | |||
| Diversified Consumer Services – 0.6% | |||
| Adtalem Global Education, Inc. 5.50% 3/1/28 (a) | 1,500,000 | 1,535,625 | |
| Hotels, Restaurants & Leisure – 5.9% | |||
| 1011778 BC ULC / New Red Finance, Inc.: | |||
4.00% 10/15/30 (a) | 545,000 | 541,992 | |
4.375% 1/15/28 (a) | 258,000 | 261,870 | |
| Aramark Services, Inc. 6.375% 5/1/25 (a) | 76,000 | 80,450 | |
| Bloomin' Brands, Inc. / OSI Restaurant Partners LLC 5.125% 4/15/29 (a) | 95,000 | 98,907 | |
| Boyd Gaming Corp. 4.75% 6/15/31 (a)(b) | 260,000 | 268,510 | |
| Caesars Entertainment, Inc. 6.25% 7/1/25 (a) | 869,000 | 918,490 | |
| Carnival Corp.: | |||
4.00% 8/1/28 (a) | 500,000 | 502,500 | |
5.75% 3/1/27 (a) | 1,015,000 | 1,038,051 | |
7.625% 3/1/26 (a) | 250,000 | 264,995 | |
9.875% 8/1/27 (a) | 410,000 | 472,525 | |
| Churchill Downs, Inc. 4.75% 1/15/28 (a) | 2,437,000 | 2,548,615 | |
| Cinemark USA, Inc. 5.875% 3/15/26 (a) | 300,000 | 298,500 | |
| Everi Holdings, Inc. 5.00% 7/15/29 (a) | 265,000 | 271,227 | |
| Full House Resorts, Inc. 8.25% 2/15/28 (a) | 300,000 | 322,500 | |
| Hilton Grand Vacations Borrower Escrow LLC / Hilton Grand Vacations Borrower Esc: | |||
4.875% 7/1/31 (a) | 600,000 | 594,750 | |
5.00% 6/1/29 (a)(b) | 500,000 | 506,250 | |
| Marriott Ownership Resorts, Inc. 4.50% 6/15/29 (a) | 240,000 | 242,376 | |
| Marriott Ownership Resorts, Inc. / ILG LLC 6.50% 9/15/26 | 58,000 | 59,978 | |
| MGM Resorts International 6.75% 5/1/25 | 351,000 | 372,060 | |
| NCL Corp. Ltd. 10.25% 2/1/26 (a) | 376,000 | 434,355 | |
| | |||
| Principal Amount | Value | ||
| Peninsula Pacific Entertainment LLC / Peninsula Pacific Entertainment Finance In 8.50% 11/15/27 (a) | $ 75,000 | $ 80,156 | |
| Penn National Gaming, Inc. 4.125% 7/1/29 (a) | 615,000 | 614,231 | |
| Premier Entertainment Sub LLC / Premier Entertainment Finance Corp. 5.875% 9/1/31 (a) | 1,000,000 | 1,025,000 | |
| Raptor Acquisition Corp. / Raptor Co-Issuer LLC 4.875% 11/1/26 (a) | 205,000 | 207,675 | |
| Royal Caribbean Cruises Ltd.: | |||
5.25% 11/15/22 | 376,000 | 384,930 | |
5.50% 8/31/26 (a) | 1,000,000 | 1,013,750 | |
9.125% 6/15/23 (a) | 222,000 | 241,980 | |
11.50% 6/1/25 (a) | 843,000 | 967,342 | |
| TKC Holdings, Inc. 6.875% 5/15/28 (a) | 300,000 | 313,074 | |
| Travel + Leisure Co.: | |||
3.90% 3/1/23 | 65,000 | 66,973 | |
6.60% 10/1/25 | 214,000 | 239,680 | |
| Viking Ocean Cruises Ship VII Ltd. 5.625% 2/15/29 (a) | 85,000 | 84,575 | |
| Wyndham Hotels & Resorts, Inc. 4.375% 8/15/28 (a) | 533,000 | 551,490 | |
| Wynn Las Vegas LLC / Wynn Las Vegas Capital Corp. 5.50% 3/1/25 (a) | 75,000 | 79,500 | |
| Wynn Resorts Finance LLC / Wynn Resorts Capital Corp. 7.75% 4/15/25 (a) | 34,000 | 36,125 | |
| Yum! Brands, Inc.: | |||
3.625% 3/15/31 | 140,000 | 143,826 | |
4.75% 1/15/30 (a) | 150,000 | 165,563 | |
| 16,314,771 | |||
| Household Durables – 2.3% | |||
| Century Communities, Inc. 3.875% 8/15/29 (a) | 3,000,000 | 3,045,600 | |
| LGI Homes, Inc. 4.00% 7/15/29 (a) | 860,000 | 864,317 | |
| M/I Homes, Inc. 3.95% 2/15/30 (a) | 2,000,000 | 2,021,060 | |
| Tempur Sealy International, Inc. 4.00% 4/15/29 (a) | 270,000 | 276,750 | |
| WASH Multifamily Acquisition, Inc. 5.75% 4/15/26 (a) | 165,000 | 172,636 | |
| 6,380,363 | |||
| Household Products – 1.1% | |||
| Resideo Funding, Inc. 4.00% 9/1/29 (a)(b) | 3,000,000 | 3,001,050 | |
| Annual Report | 10 |
| Nonconvertible Bonds – continued | |||
| Principal Amount | Value | ||
| CONSUMER DISCRETIONARY – continued | |||
| Leisure Products – 0.1% | |||
| Vista Outdoor, Inc. 4.50% 3/15/29 (a)(b) | $ 310,000 | $ 313,488 | |
| Specialty Retail – 3.5% | |||
| Ambience Merger Sub, Inc. 4.875% 7/15/28 (a) | 135,000 | 135,787 | |
| Asbury Automotive Group, Inc. 4.75% 3/1/30 | 1,414,000 | 1,491,770 | |
| Carvana Co.: | |||
4.875% 9/1/29 (a) | 2,000,000 | 1,979,820 | |
5.50% 4/15/27 (a) | 3,015,000 | 3,111,872 | |
5.625% 10/1/25 (a) | 665,000 | 691,600 | |
5.875% 10/1/28 (a) | 890,000 | 928,937 | |
| Foundation Building Materials, Inc. 6.00% 3/1/29 (a) | 70,000 | 69,006 | |
| LSF9 Atlantis Holdings LLC / Victra Finance Corp. 7.75% 2/15/26 (a) | 300,000 | 312,810 | |
| Macy's Retail Holdings LLC 3.625% 6/1/24 | 114,000 | 118,275 | |
| Magic Mergeco, Inc. 5.25% 5/1/28 (a) | 240,000 | 246,300 | |
| Murphy Oil USA, Inc.: | |||
3.75% 2/15/31 (a) | 45,000 | 45,401 | |
4.75% 9/15/29 | 40,000 | 42,300 | |
| PetSmart, Inc. / PetSmart Finance Corp. 4.75% 2/15/28 (a) | 145,000 | 150,981 | |
| Specialty Building Products Holdings LLC / SBP Finance Corp. 6.375% 9/30/26 (a) | 85,000 | 89,463 | |
| The Gap, Inc. 8.875% 5/15/27 (a) | 200,000 | 229,750 | |
| Victoria's Secret & Co. 4.625% 7/15/29 (a) | 180,000 | 180,267 | |
| 9,824,339 | |||
| Textiles, Apparel & Luxury Goods – 0.4% | |||
| Crocs, Inc.: | |||
4.125% 8/15/31 (a) | 285,000 | 286,425 | |
4.25% 3/15/29 (a) | 150,000 | 154,605 | |
| Wolverine World Wide, Inc. 4.00% 8/15/29 (a) | 515,000 | 522,019 | |
| 963,049 | |||
| TOTAL CONSUMER DISCRETIONARY | 41,765,064 | ||
| CONSUMER STAPLES – 2.3% | |||
| Food Products – 0.5% | |||
| C&S Group Enterprises LLC 5.00% 12/15/28 (a) | 100,000 | 99,000 | |
| Kraft Heinz Foods Co. 4.875% 10/1/49 | 200,000 | 248,420 | |
| | |||
| Principal Amount | Value | ||
| Performance Food Group, Inc. 4.25% 8/1/29 (a) | $ 360,000 | $ 361,220 | |
| Post Holdings, Inc. 4.50% 9/15/31 (a) | 505,000 | 509,419 | |
| US Foods, Inc. 4.75% 2/15/29 (a) | 240,000 | 245,700 | |
| 1,463,759 | |||
| Household Products – 0.1% | |||
| Kronos Acquisition Holdings, Inc. / KIK Custom Products, Inc. 5.00% 12/31/26 (a) | 35,000 | 34,825 | |
| Spectrum Brands, Inc. 3.875% 3/15/31 (a) | 150,000 | 148,088 | |
| 182,913 | |||
| Personal Products – 0.7% | |||
| Edgewell Personal Care Co. 5.50% 6/1/28 (a) | 160,000 | 169,400 | |
| HLF Financing Sarl LLC / Herbalife International, Inc. 4.875% 6/1/29 (a) | 1,515,000 | 1,518,787 | |
| Prestige Brands, Inc. 3.75% 4/1/31 (a) | 110,000 | 108,625 | |
| 1,796,812 | |||
| Tobacco – 1.0% | |||
| Turning Point Brands, Inc. 5.625% 2/15/26 (a) | 2,000,000 | 2,101,000 | |
| Vector Group Ltd. 5.75% 2/1/29 (a) | 770,000 | 783,475 | |
| 2,884,475 | |||
| TOTAL CONSUMER STAPLES | 6,327,959 | ||
| ENERGY – 13.5% | |||
| Electric Utilities – 0.2% | |||
| Leeward Renewable Energy Operations LLC 4.25% 7/1/29 (a) | 700,000 | 714,322 | |
| Energy Equipment & Services – 0.7% | |||
| Bristow Group, Inc. 6.875% 3/1/28 (a) | 300,000 | 314,877 | |
| CGG SA 8.75% 4/1/27 (a) | 300,000 | 291,750 | |
| Oceaneering International, Inc. 4.65% 11/15/24 | 260,000 | 264,883 | |
| Patterson-UTI Energy, Inc. 5.15% 11/15/29 | 150,000 | 151,467 | |
| TechnipFMC PLC 6.50% 2/1/26 (a) | 600,000 | 637,415 | |
| Tervita Corp. 11.00% 12/1/25 (a) | 114,000 | 131,481 | |
| 11 | Annual Report |
| Nonconvertible Bonds – continued | |||
| Principal Amount | Value | ||
| ENERGY – continued | |||
| Energy Equipment & Services – continued | |||
| USA Compression Partners LP / USA Compression Finance Corp. 6.875% 4/1/26 | $ 49,000 | $ 50,914 | |
| 1,842,787 | |||
| Oil, Gas & Consumable Fuels – 12.6% | |||
| Aethon United BR LP / Aethon United Finance Corp. 8.25% 2/15/26 (a) | 85,000 | 92,225 | |
| Antero Midstream Partners LP / Antero Midstream Finance Corp. 5.375% 6/15/29 (a)(b) | 500,000 | 511,857 | |
| Antero Resources Corp. 8.375% 7/15/26 (a) | 260,000 | 294,450 | |
| Apache Corp. 4.25% 1/15/30 | 2,150,000 | 2,314,088 | |
| Ascent Resources Utica Holdings LLC / ARU Finance Corp. 5.875% 6/30/29 (a) | 500,000 | 479,320 | |
| Baytex Energy Corp. 8.75% 4/1/27 (a) | 145,000 | 142,448 | |
| Buckeye Partners LP: | |||
3.95% 12/1/26 | 156,000 | 160,920 | |
4.125% 3/1/25 (a) | 100,000 | 103,375 | |
4.50% 3/1/28 (a) | 230,000 | 238,432 | |
5.85% 11/15/43 | 100,000 | 100,211 | |
| California Resources Corp. 7.125% 2/1/26 (a) | 290,000 | 304,219 | |
| Chesapeake Energy Corp. 5.875% 2/1/29 (a) | 180,000 | 192,150 | |
| CITGO Petroleum Corp.: | |||
6.375% 6/15/26 (a) | 215,000 | 218,225 | |
7.00% 6/15/25 (a) | 374,000 | 383,350 | |
| CNX Resources Corp. 6.00% 1/15/29 (a) | 200,000 | 208,266 | |
| Colgate Energy Partners III LLC: | |||
5.875% 7/1/29 (a) | 145,000 | 146,813 | |
7.75% 2/15/26 (a) | 300,000 | 318,000 | |
| Comstock Resources, Inc. 5.875% 1/15/30 (a) | 270,000 | 270,726 | |
| Continental Resources, Inc. 5.75% 1/15/31 (a) | 90,000 | 109,688 | |
| Coronado Finance Pty Ltd. 10.75% 5/15/26 (a) | 200,000 | 219,800 | |
| CQP Holdco LP / BIP-V Chinook Holdco LLC 5.50% 6/15/31 (a) | 500,000 | 515,625 | |
| Crestwood Midstream Partners LP / Crestwood Midstream Finance Corp. 6.00% 2/1/29 (a) | 275,000 | 280,500 | |
| | |||
| Principal Amount | Value | ||
| DCP Midstream LP 7.375% (c)(d) | $ 143,000 | $ 137,995 | |
| Delek Logistics Partners LP / Delek Logistics Finance Corp. 7.125% 6/1/28 (a) | 195,000 | 206,689 | |
| Devon Energy Corp. 4.50% 1/15/30 (a) | 133,000 | 145,279 | |
| DT Midstream, Inc. 4.125% 6/15/29 (a)(b) | 800,000 | 820,000 | |
| Encino Acquisition Partners Holdings LLC 8.50% 5/1/28 (a) | 300,000 | 301,092 | |
| Energy Ventures Gom LLC / EnVen Finance Corp. 11.75% 4/15/26 (a) | 200,000 | 205,482 | |
| EnLink Midstream Partners LP 5.45% 6/1/47 | 415,000 | 390,876 | |
| Enviva Partners LP / Enviva Partners Finance Corp. 6.50% 1/15/26 (a) | 222,000 | 230,924 | |
| EQM Midstream Partners LP: | |||
4.50% 1/15/29 (a) | 400,000 | 406,000 | |
4.75% 1/15/31 (a) | 90,000 | 91,575 | |
6.50% 7/15/48 | 155,000 | 175,042 | |
| EQT Corp. 7.50% 2/1/30 | 171,000 | 222,175 | |
| Ferrellgas LP / Ferrellgas Finance Corp. 5.375% 4/1/26 (a) | 500,000 | 491,250 | |
| Genesis Energy LP / Genesis Energy Finance Corp. 8.00% 1/15/27 | 625,000 | 620,644 | |
| Hess Midstream Operations LP 4.25% 2/15/30 (a) | 175,000 | 177,188 | |
| Hilcorp Energy I LP / Hilcorp Finance Co. 6.00% 2/1/31 (a) | 410,000 | 421,275 | |
| Holly Energy Partners LP / Holly Energy Finance Corp. 5.00% 2/1/28 (a) | 65,000 | 66,320 | |
| Independence Energy Finance LLC 7.25% 5/1/26 (a) | 500,000 | 505,000 | |
| Ithaca Energy North Sea PLC 9.00% 7/15/26 (a) | 500,000 | 496,200 | |
| Laredo Petroleum, Inc. 7.75% 7/31/29 (a) | 500,000 | 484,000 | |
| MEG Energy Corp. 5.875% 2/1/29 (a) | 330,000 | 339,870 | |
| Murphy Oil Corp.: | |||
5.75% 8/15/25 | 480,000 | 490,800 | |
5.875% 12/1/27 | 110,000 | 114,400 | |
6.375% 7/15/28 | 300,000 | 315,750 | |
| Annual Report | 12 |
| Nonconvertible Bonds – continued | |||
| Principal Amount | Value | ||
| ENERGY – continued | |||
| Oil, Gas & Consumable Fuels – continued | |||
| New Fortress Energy, Inc.: | |||
6.50% 9/30/26 (a) | $ 615,000 | $ 618,198 | |
6.75% 9/15/25 (a) | 1,323,000 | 1,342,845 | |
| Northern Oil and Gas, Inc. 8.125% 3/1/28 (a) | 160,000 | 166,200 | |
| NuStar Logistics LP 6.375% 10/1/30 | 225,000 | 248,787 | |
| Oasis Midstream Partners LP / OMP Finance Corp. 8.00% 4/1/29 (a) | 600,000 | 621,000 | |
| Oasis Petroleum, Inc. 6.375% 6/1/26 (a)(b) | 300,000 | 313,125 | |
| Occidental Petroleum Corp.: | |||
6.125% 1/1/31 | 3,430,000 | 4,147,556 | |
6.625% 9/1/30 | 2,001,000 | 2,495,547 | |
7.50% 5/1/31 | 241,000 | 315,332 | |
| Parkland Fuel Corp. 5.875% 7/15/27 (a) | 512,000 | 545,536 | |
| PBF Holding Co. LLC / PBF Finance Corp.: | |||
6.00% 2/15/28 | 315,000 | 206,325 | |
9.25% 5/15/25 (a) | 270,000 | 260,550 | |
| PDC Energy, Inc. 6.125% 9/15/24 | 866,000 | 880,072 | |
| Range Resources Corp.: | |||
5.00% 3/15/23 | 211,000 | 216,397 | |
8.25% 1/15/29 (a) | 400,000 | 444,024 | |
| Renewable Energy Group, Inc. 5.875% 6/1/28 (a) | 220,000 | 227,810 | |
| Rockies Express Pipeline LLC 4.80% 5/15/30 (a) | 545,000 | 563,631 | |
| SM Energy Co. 6.50% 7/15/28 | 95,000 | 95,463 | |
| Solaris Midstream Holdings LLC 7.625% 4/1/26 (a) | 260,000 | 275,623 | |
| Southwestern Energy Co.: | |||
5.375% 3/15/30 | 300,000 | 312,069 | |
7.75% 10/1/27 | 300,000 | 325,125 | |
| Sunoco LP / Sunoco Finance Corp. 4.50% 5/15/29 | 301,000 | 304,762 | |
| Superior Plus LP / Superior General Partner, Inc. 4.50% 3/15/29 (a) | 145,000 | 150,191 | |
| Tallgrass Energy Partners LP / Tallgrass Energy Finance Corp.: | |||
6.00% 12/31/30 (a) | 480,000 | 488,218 | |
6.00% 9/1/31 (a) | 500,000 | 500,625 | |
| Talos Production, Inc. 12.00% 1/15/26 | 500,000 | 516,250 | |
| | |||
| Principal Amount | Value | ||
| Targa Resources Partners LP / Targa Resources Partners Finance Corp.: | |||
4.00% 1/15/32 (a) | $ 420,000 | $ 439,879 | |
5.00% 1/15/28 | 61,000 | 64,050 | |
| Teine Energy Ltd. 6.875% 4/15/29 (a) | 300,000 | 304,251 | |
| Venture Global Calcasieu Pass LLC 4.125% 8/15/31 (a) | 330,000 | 346,087 | |
| Vine Energy Holdings LLC 6.75% 4/15/29 (a) | 300,000 | 324,000 | |
| Warrior Met Coal, Inc. 8.00% 11/1/24 (a) | 1,183,000 | 1,191,121 | |
| Western Midstream Operating LP 6.50% 2/1/50 | 250,000 | 294,736 | |
| 35,005,899 | |||
| TOTAL ENERGY | 37,563,008 | ||
| FINANCIALS – 10.7% | |||
| Capital Markets – 3.2% | |||
| ION Trading Technologies Sarl 5.75% 5/15/28 (a) | 500,000 | 516,250 | |
| LPL Holdings, Inc.: | |||
4.00% 3/15/29 (a) | 3,100,000 | 3,166,030 | |
4.375% 5/15/31 (a) | 1,950,000 | 2,018,250 | |
| MSCI, Inc. 3.25% 8/15/33 (a) | 3,025,000 | 3,119,531 | |
| 8,820,061 | |||
| Consumer Finance – 3.6% | |||
| Credit Acceptance Corp. 6.625% 3/15/26 | 371,000 | 392,333 | |
| Curo Group Holdings Corp. 7.50% 8/1/28 (a) | 500,000 | 498,712 | |
| Enova International, Inc. 8.50% 9/15/25 (a) | 180,000 | 185,850 | |
| FirstCash, Inc. 4.625% 9/1/28 (a) | 450,000 | 467,960 | |
| Ford Motor Credit Co. LLC: | |||
3.55% 10/7/22 | 131,000 | 134,111 | |
4.14% 2/15/23 | 120,000 | 124,050 | |
| goeasy Ltd.: | |||
4.375% 5/1/26 (a) | 2,015,000 | 2,077,969 | |
5.375% 12/1/24 (a) | 582,000 | 599,460 | |
| Icahn Enterprises LP / Icahn Enterprises Finance Corp. 4.375% 2/1/29 | 300,000 | 301,125 | |
| LD Holdings Group LLC 6.125% 4/1/28 (a) | 200,000 | 196,571 | |
| Navient Corp.: | |||
4.875% 3/15/28 | 500,000 | 508,750 | |
6.125% 3/25/24 | 165,000 | 178,893 | |
| 13 | Annual Report |
| Nonconvertible Bonds – continued | |||
| Principal Amount | Value | ||
| FINANCIALS – continued | |||
| Consumer Finance – continued | |||
| OneMain Finance Corp. 3.875% 9/15/28 | $ 3,000,000 | $ 3,014,040 | |
| PennyMac Financial Services, Inc. 5.375% 10/15/25 (a) | 30,000 | 31,043 | |
| PRA Group, Inc. 7.375% 9/1/25 (a) | 1,261,000 | 1,346,117 | |
| 10,056,984 | |||
| Diversified Financial Services – 2.8% | |||
| Burford Capital Global Finance LLC 6.25% 4/15/28 (a) | 1,000,000 | 1,055,000 | |
| Compass Group Diversified Holdings LLC 5.25% 4/15/29 (a) | 250,000 | 261,698 | |
| Deutsche Bank AG: | |||
3.729% 1/14/32 (c) | 150,000 | 154,712 | |
4.296% 5/24/28 (c) | 173,000 | 179,159 | |
4.875% 12/1/32 (c) | 134,000 | 146,641 | |
| Global Aircraft Leasing Co. Ltd. 6.50% 9/15/24 (a) | 410,335 | 406,745 | |
| Icahn Enterprises LP / Icahn Enterprises Finance Corp.: | |||
4.75% 9/15/24 | 1,112,000 | 1,152,963 | |
5.25% 5/15/27 | 450,000 | 467,438 | |
6.25% 5/15/26 | 632,000 | 665,970 | |
| Jefferies Finance LLC / JFIN Co-Issuer Corp. 5.00% 8/15/28 (a) | 800,000 | 820,000 | |
| Midcap Financial Issuer Trust 5.625% 1/15/30 (a) | 650,000 | 646,750 | |
| StoneX Group, Inc. 8.625% 6/15/25 (a) | 1,351,000 | 1,461,782 | |
| UniCredit SpA 7.296% 4/2/34 (a)(c) | 228,000 | 275,829 | |
| 7,694,687 | |||
| Insurance – 0.1% | |||
| AmWINS Group, Inc. 4.875% 6/30/29 (a) | 250,000 | 254,063 | |
| Thrifts & Mortgage Finance – 1.0% | |||
| Freedom Mortgage Corp. 6.625% 1/15/27 (a) | 600,000 | 574,500 | |
| MGIC Investment Corp. 5.25% 8/15/28 | 300,000 | 321,540 | |
| NMI Holdings, Inc. 7.375% 6/1/25 (a) | 1,437,000 | 1,625,606 | |
| | |||
| Principal Amount | Value | ||
| Uniti Group LP / Uniti Group Finance, Inc. / CSL Capital LLC 4.75% 4/15/28 (a) | $ 200,000 | $ 204,250 | |
| 2,725,896 | |||
| TOTAL FINANCIALS | 29,551,691 | ||
| HEALTH CARE – 6.5% | |||
| Biotechnology – 0.1% | |||
| Emergent BioSolutions, Inc. 3.875% 8/15/28 (a) | 195,000 | 190,125 | |
| HCRX Investments Holdco LP 4.50% 8/1/29 (a) | 125,000 | 126,611 | |
| 316,736 | |||
| Health Care Providers & Services – 3.6% | |||
| AMN Healthcare, Inc. 4.00% 4/15/29 (a) | 1,315,000 | 1,356,094 | |
| CHS / Community Health Systems, Inc.: | |||
4.75% 2/15/31 (a) | 225,000 | 229,525 | |
6.00% 1/15/29 (a) | 260,000 | 277,225 | |
6.875% 4/15/29 (a) | 285,000 | 296,044 | |
| DaVita, Inc. 3.75% 2/15/31 (a) | 819,000 | 809,348 | |
| Encompass Health Corp. 4.75% 2/1/30 | 300,000 | 319,872 | |
| ModivCare Escrow Issuer, Inc. 5.00% 10/1/29 (a) | 125,000 | 128,310 | |
| ModivCare, Inc 5.875% 11/15/25 (a) | 935,000 | 993,437 | |
| Molina Healthcare, Inc. 4.375% 6/15/28 (a) | 3,129,000 | 3,281,539 | |
| Tenet Healthcare Corp.: | |||
4.875% 1/1/26 (a) | 204,000 | 211,609 | |
6.125% 10/1/28 (a) | 1,875,000 | 1,979,353 | |
| 9,882,356 | |||
| Life Sciences Tools & Services – 0.1% | |||
| IQVIA, Inc. 5.00% 5/15/27 (a) | 200,000 | 208,986 | |
| Pharmaceuticals – 2.7% | |||
| AdaptHealth LLC 5.125% 3/1/30 (a) | 1,000,000 | 1,012,880 | |
| Bausch Health Cos., Inc.: | |||
4.875% 6/1/28 (a)(b) | 335,000 | 344,213 | |
| 5.00% 1/30/28 to 2/15/29 (a) | 2,770,000 | 2,589,366 | |
| Charles River Laboratories International, Inc.: | |||
3.75% 3/15/29 (a) | 160,000 | 164,934 | |
4.00% 3/15/31 (a) | 205,000 | 218,838 | |
| Jazz Securities DAC 4.375% 1/15/29 (a) | 215,000 | 222,794 | |
| Organon Finance 1 LLC 4.125% 4/30/28 (a) | 490,000 | 505,533 | |
| Annual Report | 14 |
| Nonconvertible Bonds – continued | |||
| Principal Amount | Value | ||
| HEALTH CARE – continued | |||
| Pharmaceuticals – continued | |||
| Par Pharmaceutical, Inc. 7.50% 4/1/27 (a) | $ 375,000 | $379,687 | |
| Syneos Health, Inc. 3.625% 1/15/29 (a) | 2,225,000 | 2,213,230 | |
| 7,651,475 | |||
| TOTAL HEALTH CARE | 18,059,553 | ||
| INDUSTRIALS – 16.8% | |||
| Aerospace & Defense – 1.6% | |||
| Howmet Aerospace, Inc. 6.75% 1/15/28 | 113,000 | 139,335 | |
| Spirit AeroSystems, Inc. 5.50% 1/15/25 (a) | 41,000 | 42,896 | |
| TransDigm, Inc.: | |||
6.25% 3/15/26 (a) | 3,682,000 | 3,866,100 | |
8.00% 12/15/25 (a) | 315,000 | 337,050 | |
| 4,385,381 | |||
| Air Freight & Logistics – 0.4% | |||
| Cargo Aircraft Management, Inc. 4.75% 2/1/28 (a) | 1,000,000 | 1,032,500 | |
| Airlines – 1.4% | |||
| Air Canada 3.875% 8/15/26 (a) | 490,000 | 492,450 | |
| American Airlines, Inc. 11.75% 7/15/25 (a) | 704,000 | 874,016 | |
| American Airlines, Inc. / AAdvantage Loyalty IP Ltd. 5.50% 4/20/26 (a) | 600,000 | 632,400 | |
| Delta Air Lines, Inc.: | |||
2.90% 10/28/24 | 230,000 | 234,405 | |
4.375% 4/19/28 | 798,000 | 851,910 | |
| United Airlines Holdings, Inc. 4.875% 1/15/25 | 125,000 | 127,969 | |
| United Airlines, Inc. 4.375% 4/15/26 (a) | 650,000 | 674,310 | |
| 3,887,460 | |||
| Building Products – 0.4% | |||
| PGT Innovations, Inc. 6.75% 8/1/26 (a) | 540,000 | 566,568 | |
| Williams Scotsman International, Inc. 4.625% 8/15/28 (a) | 400,000 | 415,000 | |
| 981,568 | |||
| Commercial Services & Supplies – 4.9% | |||
| Allied Universal Holdco LLC / Allied Universal Finance Corp. 6.00% 6/1/29 (a) | 230,000 | 229,979 | |
| Aramark Services, Inc. 5.00% 4/1/25 (a) | 150,000 | 153,872 | |
| | |||
| Principal Amount | Value | ||
| Avis Budget Car Rental LLC / Avis Budget Finance, Inc. 5.75% 7/15/27 (a) | $ 376,000 | $ 391,510 | |
| CoreCivic, Inc. 8.25% 4/15/26 | 200,000 | 211,120 | |
| CoreLogic, Inc. 4.50% 5/1/28 (a) | 615,000 | 613,438 | |
| Garda World Security Corp. 6.00% 6/1/29 (a)(b) | 300,000 | 289,827 | |
| GFL Environmental, Inc.: | |||
4.375% 8/15/29 (a) | 3,000,000 | 3,015,000 | |
4.75% 6/15/29 (a) | 1,700,000 | 1,746,750 | |
| Legends Hospitality Holding Co. LLC / Legends Hospitality Co-Issuer, Inc. 5.00% 2/1/26 (a) | 100,000 | 103,000 | |
| Madison IAQ LLC 4.125% 6/30/28 (a) | 290,000 | 291,592 | |
| Nielsen Finance LLC / Nielsen Finance Co.: | |||
4.50% 7/15/29 (a) | 580,000 | 574,722 | |
5.625% 10/1/28 (a) | 200,000 | 210,250 | |
| Paysafe Finance PLC / Paysafe Holdings US Corp. 4.00% 6/15/29 (a) | 1,000,000 | 962,250 | |
| Rent-A-Center, Inc. 6.375% 2/15/29 (a) | 55,000 | 59,263 | |
| Ritchie Bros Auctioneers, Inc. 5.375% 1/15/25 (a) | 153,000 | 156,634 | |
| Shift4 Payments LLC / Shift4 Payments Finance Sub, Inc. 4.625% 11/1/26 (a) | 525,000 | 544,540 | |
| United Rentals North America, Inc. 3.75% 1/15/32 | 4,000,000 | 4,085,000 | |
| 13,638,747 | |||
| Construction & Engineering – 2.1% | |||
| Arcosa, Inc. 4.375% 4/15/29 (a) | 170,000 | 175,029 | |
| Dycom Industries, Inc. 4.50% 4/15/29 (a) | 1,000,000 | 1,027,500 | |
| Global Infrastructure Solutions, Inc. 5.625% 6/1/29 (a)(b) | 600,000 | 612,570 | |
| Great Lakes Dredge & Dock Corp. 5.25% 6/1/29 (a) | 180,000 | 185,850 | |
| IEA Energy Services LLC 6.625% 8/15/29 (a) | 500,000 | 495,750 | |
| MasTec, Inc. 4.50% 8/15/28 (a) | 110,000 | 115,775 | |
| PowerTeam Services LLC 9.033% 12/4/25 (a) | 105,000 | 114,713 | |
| 15 | Annual Report |
| Nonconvertible Bonds – continued | |||
| Principal Amount | Value | ||
| INDUSTRIALS – continued | |||
| Construction & Engineering – continued | |||
| TopBuild Corp. 3.625% 3/15/29 (a) | $ 3,150,000 | $ 3,153,087 | |
| 5,880,274 | |||
| Electrical Equipment – 0.5% | |||
| EnerSys 4.375% 12/15/27 (a) | 1,437,000 | 1,508,850 | |
| Machinery – 0.8% | |||
| ATS Automation Tooling Systems, Inc. 4.125% 12/15/28 (a) | 140,000 | 144,264 | |
| Meritor, Inc. 6.25% 6/1/25 (a) | 391,000 | 415,895 | |
| Mueller Water Products, Inc. 4.00% 6/15/29 (a) | 280,000 | 291,357 | |
| RBS Global, Inc. / Rexnord LLC 4.875% 12/15/25 (a) | 281,000 | 286,620 | |
| Terex Corp. 5.00% 5/15/29 (a) | 700,000 | 735,875 | |
| United Rentals North America, Inc.: | |||
3.875% 2/15/31 | 200,000 | 207,018 | |
5.875% 9/15/26 | 222,000 | 228,749 | |
| 2,309,778 | |||
| Marine – 0.4% | |||
| Danaos Corp. 8.50% 3/1/28 (a) | 650,000 | 710,223 | |
| Seaspan Corp. 5.50% 8/1/29 (a) | 430,000 | 439,675 | |
| 1,149,898 | |||
| Professional Services – 1.3% | |||
| ASGN, Inc. 4.625% 5/15/28 (a) | 270,000 | 281,885 | |
| TriNet Group, Inc. 3.50% 3/1/29 (a) | 3,325,000 | 3,349,938 | |
| 3,631,823 | |||
| Road & Rail – 1.7% | |||
| Uber Technologies, Inc.: | |||
4.50% 8/15/29 (a) | 3,000,000 | 2,952,240 | |
6.25% 1/15/28 (a) | 131,000 | 140,498 | |
7.50% 5/15/25 (a) | 1,457,000 | 1,553,526 | |
| 4,646,264 | |||
| Trading Companies & Distributors – 0.9% | |||
| Fortress Transportation and Infrastructure Investors LLC: | |||
6.50% 10/1/25 (a) | 1,500,000 | 1,545,000 | |
9.75% 8/1/27 (a) | 854,000 | 963,952 | |
| H&E Equipment Services Co. 3.875% 12/15/28 (a) | 24,000 | 24,101 | |
| 2,533,053 | |||
| | |||
| Principal Amount | Value | ||
| Transportation Infrastructure – 0.4% | |||
| First Student Bidco Inc. / First Transit Parent Inc. 4.00% 7/31/29 (a) | $ 1,000,000 | $ 992,360 | |
| TOTAL INDUSTRIALS | 46,577,956 | ||
| INFORMATION TECHNOLOGY – 5.1% | |||
| Communications Equipment – 0.1% | |||
| CommScope Technologies LLC 6.00% 6/15/25 (a) | 207,000 | 210,519 | |
| Electronic Equipment, Instruments & Components – 0.5% | |||
| Atkore, Inc. 4.25% 6/1/31 (a) | 1,100,000 | 1,137,125 | |
| TTM Technologies, Inc. 4.00% 3/1/29 (a)(b) | 305,000 | 308,813 | |
| 1,445,938 | |||
| IT Services – 1.0% | |||
| Arches Buyer, Inc. 4.25% 6/1/28 (a) | 95,000 | 96,544 | |
| Booz Allen Hamilton, Inc.: | |||
3.875% 9/1/28 (a) | 363,000 | 374,166 | |
4.00% 7/1/29 (a) | 500,000 | 518,125 | |
| Gartner, Inc. 3.625% 6/15/29 (a) | 245,000 | 252,172 | |
| Go Daddy Operating Co. LLC / GD Finance Co., Inc. 3.50% 3/1/29 (a) | 380,000 | 375,250 | |
| Northwest Fiber LLC / Northwest Fiber Finance Sub, Inc. 6.00% 2/15/28 (a) | 35,000 | 34,825 | |
| Unisys Corp. 6.875% 11/1/27 (a) | 985,000 | 1,074,881 | |
| 2,725,963 | |||
| Semiconductors & Semiconductor Equipment – 0.0% | |||
| Synaptics, Inc. 4.00% 6/15/29 (a) | 135,000 | 137,531 | |
| Software – 3.1% | |||
| Clarivate Science Holdings Corp. 4.875% 7/1/29 (a) | 185,000 | 190,822 | |
| Elastic N.V. 4.125% 7/15/29 (a) | 2,040,000 | 2,071,559 | |
| Fair Isaac Corp. 4.00% 6/15/28 (a) | 3,018,000 | 3,123,630 | |
| J2 Global, Inc. 4.625% 10/15/30 (a) | 945,000 | 1,000,670 | |
| MicroStrategy, Inc. 6.125% 6/15/28 (a) | 410,000 | 421,763 | |
| Open Text Corp. 3.875% 2/15/28 (a) | 256,000 | 267,200 | |
| PTC, Inc.: | |||
3.625% 2/15/25 (a) | 325,000 | 332,313 | |
| Annual Report | 16 |
| Nonconvertible Bonds – continued | |||
| Principal Amount | Value | ||
| INFORMATION TECHNOLOGY – continued | |||
| Software – continued | |||
4.00% 2/15/28 (a) | $ 570,000 | $589,237 | |
| Veritas U.S., Inc. / Veritas Bermuda Ltd. 7.50% 9/1/25 (a) | 630,000 | 655,017 | |
| 8,652,211 | |||
| Technology Hardware, Storage & Peripherals – 0.4% | |||
| NCR Corp. 5.125% 4/15/29 (a) | 630,000 | 653,208 | |
| Seagate HDD Cayman 3.125% 7/15/29 (a) | 351,000 | 344,518 | |
| 997,726 | |||
| TOTAL INFORMATION TECHNOLOGY | 14,169,888 | ||
| MATERIALS – 10.6% | |||
| Chemicals – 5.9% | |||
| Ashland LLC 3.375% 9/1/31 (a) | 2,000,000 | 2,055,560 | |
| CVR Partners LP / CVR Nitrogen Finance Corp. 6.125% 6/15/28 (a) | 320,000 | 327,200 | |
| GPD Cos., Inc. 10.125% 4/1/26 (a) | 200,000 | 215,750 | |
| HB Fuller Co. 4.00% 2/15/27 | 274,000 | 283,590 | |
| INEOS Quattro Finance 2 PLC 3.375% 1/15/26 (a) | 500,000 | 506,250 | |
| Minerals Technologies, Inc. 5.00% 7/1/28 (a) | 260,000 | 272,350 | |
| NOVA Chemicals Corp. 4.25% 5/15/29 (a) | 310,000 | 311,550 | |
| Olin Corp.: | |||
5.125% 9/15/27 | 104,000 | 108,030 | |
5.625% 8/1/29 | 202,000 | 222,917 | |
| SBA Communications Corp. 3.875% 2/15/27 | 4,401,000 | 4,573,871 | |
| SCIH Salt Holdings, Inc. 4.875% 5/1/28 (a) | 500,000 | 503,650 | |
| Sunnova Energy Corp. 5.875% 9/1/26 (a) | 1,000,000 | 1,007,200 | |
| The Chemours Co. 4.625% 11/15/29 (a) | 2,000,000 | 1,986,040 | |
| The Scotts Miracle-Gro Co.: | |||
4.375% 2/1/32 (a) | 3,000,000 | 3,042,090 | |
4.50% 10/15/29 | 265,000 | 276,925 | |
| Trinseo Materials Operating SCA / Trinseo Materials Finance, Inc. 5.125% 4/1/29 (a) | 300,000 | 302,940 | |
| WR Grace Holdings LLC 5.625% 8/15/29 (a) | 270,000 | 281,138 | |
| 16,277,051 | |||
| | |||
| Principal Amount | Value | ||
| Construction Materials – 0.9% | |||
| Patrick Industries, Inc. 4.75% 5/1/29 (a) | $ 2,500,000 | $ 2,556,250 | |
| Containers & Packaging – 0.1% | |||
| Intertape Polymer Group, Inc. 4.375% 6/15/29 (a)(b) | 270,000 | 275,505 | |
| Owens-Brockway Glass Container, Inc. 5.375% 1/15/25 (a) | 151,000 | 161,979 | |
| 437,484 | |||
| Metals & Mining – 3.0% | |||
| Cleveland-Cliffs, Inc. 5.875% 6/1/27 | 596,000 | 622,820 | |
| Coeur Mining, Inc. 5.125% 2/15/29 (a) | 100,000 | 99,250 | |
| Compass Minerals International, Inc. 6.75% 12/1/27 (a) | 576,000 | 609,840 | |
| Eldorado Gold Corp. 6.25% 9/1/29 (a) | 1,000,000 | 1,010,000 | |
| First Quantum Minerals Ltd. 6.875% 10/15/27 (a) | 500,000 | 538,750 | |
| FMG Resources August 2006 Pty Ltd. 5.125% 5/15/24 (a) | 211,000 | 226,952 | |
| Freeport-McMoRan, Inc. 3.55% 3/1/22 | 77,000 | 77,289 | |
| Hudbay Minerals, Inc. 4.50% 4/1/26 (a) | 110,000 | 110,572 | |
| Kaiser Aluminum Corp. 4.625% 3/1/28 (a) | 510,000 | 529,125 | |
| Mineral Resources Ltd. 8.125% 5/1/27 (a) | 883,000 | 962,470 | |
| New Gold, Inc. 7.50% 7/15/27 (a) | 1,319,000 | 1,384,950 | |
| Novelis Corp. 3.875% 8/15/31 (a) | 700,000 | 706,370 | |
| Perenti Finance Pty Ltd. 6.50% 10/7/25 (a) | 800,000 | 841,191 | |
| Tacora Resources, Inc. 8.25% 5/15/26 (a) | 300,000 | 312,834 | |
| United States Steel Corp.: | |||
6.25% 3/15/26 | 130,000 | 133,897 | |
6.875% 3/1/29 | 200,000 | 218,500 | |
| 8,384,810 | |||
| Paper & Forest Products – 0.7% | |||
| Boise Cascade Co. 4.875% 7/1/30 (a) | 100,000 | 106,500 | |
| Louisiana Pacific Corp. 3.625% 3/15/29 (a) | 600,000 | 604,500 | |
| Resolute Forest Products, Inc. 4.875% 3/1/26 (a) | 615,000 | 631,144 | |
| 17 | Annual Report |
| Nonconvertible Bonds – continued | |||
| Principal Amount | Value | ||
| MATERIALS – continued | |||
| Paper & Forest Products – continued | |||
| Sylvamo Corp. 7.00% 9/1/29 (a)(b) | $ 500,000 | $ 517,260 | |
| 1,859,404 | |||
| TOTAL MATERIALS | 29,514,999 | ||
| REAL ESTATE – 3.6% | |||
| Equity Real Estate Investment Trusts (REITs) – 3.0% | |||
| Apollo Commercial Real Estate Finance, Inc. 4.625% 6/15/29 (a) | 1,000,000 | 973,800 | |
| CTR Partnership LP / CareTrust Capital Corp. 3.875% 6/30/28 (a) | 300,000 | 308,250 | |
| HAT Holdings I LLC / HAT Holdings II LLC: | |||
3.375% 6/15/26 (a) | 2,000,000 | 2,038,100 | |
6.00% 4/15/25 (a) | 1,240,000 | 1,306,650 | |
| Iron Mountain, Inc.: | |||
4.50% 2/15/31 (a) | 270,000 | 277,679 | |
5.00% 7/15/28 (a) | 238,000 | 248,710 | |
5.25% 7/15/30 (a) | 200,000 | 213,000 | |
| iStar, Inc. 4.25% 8/1/25 | 365,000 | 380,512 | |
| Kennedy-Wilson, Inc. 4.75% 2/1/30 | 795,000 | 815,964 | |
| Ladder Capital Finance Holdings LLLP / Ladder Capital Finance Corp. 4.75% 6/15/29 (a) | 440,000 | 449,900 | |
| RHP Hotel Properties LP / RHP Finance Corp. 4.50% 2/15/29 (a) | 700,000 | 708,750 | |
| Service Properties Trust: | |||
4.375% 2/15/30 | 385,000 | 369,814 | |
4.95% 2/15/27 | 230,000 | 230,000 | |
| 8,321,129 | |||
| Real Estate Management & Development – 0.6% | |||
| Brookfield Residential Properties, Inc. / Brookfield Residential U.S. LLC 5.00% 6/15/29 (a) | 500,000 | 506,875 | |
| The Howard Hughes Corp. 4.125% 2/1/29 (a) | 1,100,000 | 1,105,500 | |
| 1,612,375 | |||
| TOTAL REAL ESTATE | 9,933,504 | ||
| UTILITIES – 1.2% | |||
| Electric Utilities – 0.3% | |||
| TransAlta Corp. 4.50% 11/15/22 | 206,000 | 214,010 | |
| | |||
| Principal Amount | Value | ||
| Vistra Operations Co. LLC 5.625% 2/15/27 (a) | $ 500,000 | $ 520,655 | |
| 734,665 | |||
| Independent Power and Renewable Electricity Producers – 0.1% | |||
| NRG Energy, Inc. 6.625% 1/15/27 | 206,000 | 213,667 | |
| Multi-Utilities – 0.8% | |||
| Calpine Corp. 3.75% 3/1/31 (a) | 1,061,000 | 1,040,640 | |
| FirstEnergy Transmission LLC 2.866% 9/15/28 (a) | 200,000 | 211,513 | |
| NRG Energy, Inc. 3.875% 2/15/32 (a) | 1,000,000 | 1,013,950 | |
| Talen Energy Supply LLC 6.50% 6/1/25 | 200,000 | 86,000 | |
| 2,352,103 | |||
| TOTAL UTILITIES | 3,300,435 | ||
| TOTAL NONCONVERTIBLE BONDS (Cost $265,908,819) | 271,250,436 | ||
| Money Market Fund – 2.7% | |||
| Shares | |||
| Fidelity Cash Central Fund, 0.06% (e) (Cost $7,567,723) | 7,566,210 | 7,567,723 | |
| TOTAL INVESTMENT IN SECURITIES – 100.5% (Cost $273,476,542) | 278,818,159 | ||
| NET OTHER ASSETS (LIABILITIES) – (0.5%) | (1,286,209) | ||
| NET ASSETS – 100.0% | $277,531,950 | ||
| Legend | ||
| (a) | Security is exempt from registration under Rule 144A of the Securities Act of 1933. These securities may be resold in transactions exempt from registration, normally to qualified institutional buyers. At the end of the period, the value of these securities amounted to $219,035,835 or 78.9% of net assets. | |
| (b) | Security or a portion of the security purchased on a delayed delivery or when-issued basis. | |
| (c) | Coupon rates for floating and adjustable rate securities reflect the rates in effect at period end. | |
| (d) | Security is perpetual in nature with no stated maturity date. | |
| (e) | Affiliated fund that is generally available only to investment companies and other accounts managed by Fidelity Investments. The rate quoted is the annualized seven-day yield of the fund at period end. A complete unaudited listing of the fund's holdings as of its most recent quarter end is available upon request. In addition, each Fidelity Central Fund's financial statements, which are not covered by the Fund's Report of Independent Registered Public Accounting Firm, are available on the SEC's website or upon request. | |
| Annual Report | 18 |
| Fund | Value, beginning of period | Purchases | Sales Proceeds | Dividend Income | Realized Gain/Loss | Change in Unrealized appreciation (depreciation) | Value, end of period | % ownership, end of period | ||||||
| Fidelity Cash Central Fund, 0.06% | $6,883,841 | $211,912,477 | $211,228,354 | $10,919 | $(241) | $- | $7,567,723 | 0.0% |
| Description | Total | Level 1 | Level 2 | Level 3 |
| Investments in Securities: | ||||||||
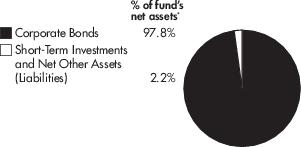
| Corporate Bonds | $ 271,250,436 | $ — | $ 271,250,436 | $ — | ||||
| Money Market Funds | 7,567,723 | 7,567,723 | — | — | ||||
| Total Investments in Securities: | $ 278,818,159 | $ 7,567,723 | $ 271,250,436 | $ — |
| United States of America | 85.3 |
| Canada | 6.8 |
| Netherlands | 1.4 |
| Others (Individually Less Than 1%) | 7.0 |
| 100.5% |
| 19 | Annual Report |
| Nonconvertible Bonds – 62.0% | |||
| Principal Amount | Value | ||
| COMMUNICATION SERVICES – 2.7% | |||
| Media – 2.0% | |||
| ViacomCBS, Inc. 6.25% 2/28/57 (a) | $ 109,000 | $ 124,312 | |
| Wireless Telecommunication Services – 0.7% | |||
| Vodafone Group PLC 7.00% 4/4/79 (a) | 36,000 | 44,462 | |
| TOTAL COMMUNICATION SERVICES | 168,774 | ||
| CONSUMER DISCRETIONARY – 1.0% | |||
| Automobiles – 1.0% | |||
| General Motors Financial Co., Inc. 5.70% (a)(b) | 55,000 | 63,113 | |
| ENERGY – 4.3% | |||
| Energy Equipment & Services – 0.2% | |||
| DCP Midstream Operating LP 5.85% 5/21/43 (a)(c) | 10,000 | 9,250 | |
| Oil, Gas & Consumable Fuels – 4.1% | |||
| BP Capital Markets PLC 4.875% (a)(b) | 85,000 | 93,698 | |
| Buckeye Partners LP 6.375% 1/22/78 (a) | 5,000 | 4,550 | |
| DCP Midstream LP 7.375% (a)(b) | 9,000 | 8,685 | |
| EnLink Midstream Partners LP 6.00% (a)(b) | 6,000 | 4,503 | |
| Enterprise Products Operating LLC: | |||
4.875% 8/16/77 (a) | 13,000 | 12,747 | |
5.25% 8/16/77 (a) | 18,000 | 18,802 | |
5.375% 2/15/78 (a) | 13,000 | 13,423 | |
| Plains All American Pipeline LP 6.125% (a)(b) | 14,000 | 12,495 | |
| TransCanada Trust: | |||
5.30% 3/15/77 (a) | 26,000 | 27,867 | |
5.50% 9/15/79 (a) | 20,000 | 22,200 | |
5.625% 5/20/75 (a) | 14,000 | 15,157 | |
5.875% 8/15/76 (a) | 21,000 | 23,546 | |
| 257,673 | |||
| TOTAL ENERGY | 266,923 | ||
| FINANCIALS – 50.2% | |||
| Banks – 12.4% | |||
| Huntington Bancshares, Inc.: | |||
4.45% (a)(b) | 88,000 | 94,160 | |
5.625% (a)(b) | 54,000 | 63,855 | |
5.70% (a)(b) | 60,000 | 62,087 | |
| Truist Financial Corp.: | |||
5.10% (a)(b) | 73,000 | 83,965 | |
5.125% (a)(b) | 185,000 | 199,846 | |
| | |||
| Principal Amount | Value | ||
| Wells Fargo & Co.: | |||
3.90% (a)(b) | $ 24,000 | $24,951 | |
5.90% (a)(b) | 230,000 | 250,109 | |
| 778,973 | |||
| Capital Markets – 2.3% | |||
| State Street Corp. 5.625% (a)(b) | 9,000 | 9,595 | |
| The Charles Schwab Corp. 4.00% (a)(b) | 129,000 | 134,160 | |
| 143,755 | |||
| Consumer Finance – 10.5% | |||
| Ally Financial, Inc. 4.70% (a)(b) | 288,000 | 303,120 | |
| American Express Co. 3.55% (a)(b) | 5,000 | 5,088 | |
| Capital One Financial Corp. 3.95% (a)(b) | 50,000 | 51,812 | |
| Citizens Financial Group, Inc. 6.00% (a)(b) | 194,000 | 202,245 | |
| Discover Financial Services 5.50% (a)(b) | 92,000 | 99,130 | |
| M&T Bank Corp. 3.50% (a)(b) | 3,000 | 3,060 | |
| 664,455 | |||
| Diversified Financial Services – 22.2% | |||
| Aircastle Ltd. 5.25% (a)(b)(c) | 37,000 | 37,185 | |
| Apollo Management Holdings LP 4.95% 1/14/50 (a)(c) | 228,000 | 236,932 | |
| Bank of America Corp. 5.875% (a)(b) | 134,000 | 152,760 | |
| Citigroup, Inc.: | |||
3.875% (a)(b) | 100,000 | 102,875 | |
5.95% (a)(b) | 68,000 | 74,630 | |
6.30% (a)(b) | 121,000 | 129,751 | |
| JPMorgan Chase & Co.: | |||
5.00% (a)(b) | 54,000 | 57,072 | |
6.10% (a)(b) | 51,000 | 55,654 | |
| Morgan Stanley: | |||
5.30% (a)(b) | 209,000 | 219,450 | |
5.875% (a)(b) | 21,000 | 24,147 | |
| The Goldman Sachs Group, Inc.: | |||
4.40% (a)(b) | 150,000 | 156,750 | |
5.00% (a)(b) | 99,000 | 99,841 | |
5.30% (a)(b) | 45,000 | 50,143 | |
| 1,397,190 | |||
| Insurance – 2.8% | |||
| American International Group, Inc.: | |||
5.75% 4/1/48 (a) | 6,000 | 6,925 | |
8.175% 5/15/68 (a) | 3,000 | 4,470 | |
| Annual Report | 20 |
| Nonconvertible Bonds – continued | |||
| Principal Amount | Value | ||
| FINANCIALS – continued | |||
| Insurance – continued | |||
| Assurant, Inc. 7.00% 3/27/48 (a) | $ 11,000 | $ 12,883 | |
| MetLife, Inc.: | |||
6.40% 12/15/66 | 49,000 | 62,980 | |
10.75% 8/1/69 | 36,000 | 63,718 | |
| Nationwide Financial Services, Inc. 6.75% 5/15/87 | 6,000 | 7,470 | |
| PartnerRe Finance B LLC 4.50% 10/1/50 (a) | 13,000 | 13,630 | |
| SBL Holdings, Inc. 6.50% (a)(b)(c) | 7,000 | 6,930 | |
| 179,006 | |||
| TOTAL FINANCIALS | 3,163,379 | ||
| INDUSTRIALS – 0.6% | |||
| Trading Companies & Distributors – 0.6% | |||
| Air Lease Corp. 4.65% (a)(b) | 36,000 | 37,764 | |
| UTILITIES – 3.2% | |||
| Multi-Utilities – 3.2% | |||
| CenterPoint Energy, Inc. 6.125% (a)(b) | 15,000 | 15,863 | |
| CMS Energy Corp. 3.75% 12/1/50 (a) | 43,000 | 43,537 | |
| Edison International 5.375% (a)(b) | 29,000 | 29,471 | |
| Emera, Inc. 6.75% 6/15/76 (a) | 17,000 | 20,172 | |
| NextEra Energy Capital Holdings, Inc. 5.65% 5/1/79 (a) | 54,000 | 63,335 | |
| Sempra Energy 4.875% (a)(b) | 29,000 | 31,491 | |
| TOTAL UTILITIES | 203,869 | ||
| TOTAL NONCONVERTIBLE BONDS (Cost $3,879,519) | 3,903,822 | ||
| Preferred Stock – 34.8% | |||
| COMMUNICATION SERVICES – 2.7% | |||
| Diversified Telecommunication Services – 1.5% | |||
| AT&T, Inc. 4.75% (b) | 3,550 | 93,294 | |
| Wireless Telecommunication Services – 1.2% | |||
| United States Cellular Corp.: | |||
| 5.50% 3/01/70 | 1,450 | 37,990 | |
| 6.25% 9/01/69 | 1,400 | 37,450 | |
| 75,440 | |||
| TOTAL COMMUNICATION SERVICES | 168,734 | ||
| | |||
| Principal Amount | Value | ||
| CONSUMER DISCRETIONARY – 1.6% | |||
| Automobiles – 1.6% | |||
| Ford Motor Co. 6.00% 12/1/59 | $ 3,700 | $ 100,233 | |
| ENERGY – 0.8% | |||
| Oil, Gas & Consumable Fuels – 0.8% | |||
| DCP Midstream LP: | |||
| 7.875% (a)(b) | 100 | 2,492 | |
| 7.95% (a)(b) | 100 | 2,506 | |
| Enbridge, Inc. 6.375% 4/15/78 (a) | 400 | 10,844 | |
| Energy Transfer LP: | |||
| 7.375% (a)(b) | 315 | 7,818 | |
| 7.60% (a)(b) | 555 | 13,953 | |
| 7.625% (a)(b) | 310 | 7,806 | |
| NuStar Energy LP: | |||
| 7.625% (a)(b) | 250 | 5,487 | |
| 9.00% (a)(b) | 100 | 2,491 | |
| TOTAL ENERGY | 53,397 | ||
| FINANCIALS – 26.6% | |||
| Banks – 12.2% | |||
| Bank of America Corp. 4.375% (b) | 5,950 | 155,176 | |
| Bank of Hawaii Corp. 4.375% (b) | 100 | 2,592 | |
| Citizens Financial Group, Inc. 5.00% (b) | 3,550 | 94,536 | |
| Cullen/Frost Bankers, Inc. 4.45% (b) | 500 | 13,220 | |
| First Republic Bank: | |||
| 4.00% (b) | 2,600 | 64,402 | |
| 4.125% (b) | 3,050 | 77,287 | |
| 4.70% (b) | 2,950 | 79,679 | |
| Huntington Bancshares, Inc. 4.50% (b) | 1,200 | 30,924 | |
| JPMorgan Chase & Co.: | |||
| 4.20% (b) | 50 | 1,276 | |
| 4.55% (b) | 7,400 | 193,214 | |
| SVB Financial Group 5.25% (b) | 250 | 6,813 | |
| Truist Financial Corp. 4.75% (b) | 650 | 17,062 | |
| Wells Fargo & Co.: | |||
| 4.25% (b) | 100 | 2,501 | |
| 4.70% (b) | 600 | 15,498 | |
| 4.75% (b) | 600 | 15,522 | |
| 769,702 | |||
| Capital Markets – 3.9% | |||
| Morgan Stanley 5.85% (a)(b) | 1,950 | 58,266 | |
| Stifel Financial Corp.: | |||
| 4.50% (b) | 100 | 2,555 | |
| 6.125% (b) | 150 | 4,215 | |
| The Charles Schwab Corp. 4.45% (b) | 6,700 | 177,014 | |
| 242,050 | |||
| Consumer Finance – 4.4% | |||
| Capital One Financial Corp.: | |||
| 4.25% (b) | 60 | 1,519 | |
| 4.625% (b) | 250 | 6,522 | |
| 21 | Annual Report |
| Preferred Stock – continued | |||
| Principal Amount | Value | ||
| FINANCIALS continued | |||
| Consumer Finance continued | |||
| 4.80% (b) | $ 4,800 | $ 124,464 | |
| Navient Corp. 6.00% 12/15/43 | 500 | 12,735 | |
| Synchrony Financial 5.625% (b) | 5,000 | 133,050 | |
| 278,290 | |||
| Diversified Financial Services – 0.2% | |||
| Equitable Holdings, Inc. 4.30% (b) | 200 | 5,036 | |
| Voya Financial, Inc. 5.35% (a)(b) | 200 | 5,940 | |
| 10,976 | |||
| Insurance – 5.8% | |||
| AEGON Funding Co. LLC 5.10% 12/15/49 | 1,200 | 32,340 | |
| Assurant, Inc. 5.25% 1/15/61 | 1,000 | 27,100 | |
| Athene Holding Ltd. 4.875% (b) | 400 | 10,428 | |
| KKR Group Finance Co. IX LLC 4.625% 4/1/61 | 9,030 | 235,232 | |
| PartnerRe Ltd. 4.875% (b) | 450 | 12,267 | |
| RenaissanceRe Holdings Ltd. 4.20% (b) | 200 | 5,090 | |
| W R Berkley Corp. 4.25% 9/30/60 | 1,650 | 44,220 | |
| 366,677 | |||
| Real Estate Investment Trusts (Reits) – 0.1% | |||
| Brookfield Property Partners LP: | |||
| 5.75% (b) | 200 | 4,902 | |
| 6.375% (b) | 150 | 3,857 | |
| 8,759 | |||
| TOTAL FINANCIALS | 1,676,454 | ||
| REAL ESTATE – 1.1% | |||
| Equity Real Estate Investment Trusts (Reits) – 1.1% | |||
| Public Storage: | |||
| 3.95% (b) | 100 | 2,507 | |
| 4.00% (b) | 2,500 | 63,481 | |
| Summit Hotel Properties, Inc. 5.875% (b) | 100 | 2,539 | |
| TOTAL REAL ESTATE | 68,527 | ||
| UTILITIES – 2.0% | |||
| Electric Utilities – 0.0% | |||
| Pacific Gas and Electric Co. 6.00% (b) | 30 | 876 | |
| Independent Power And Renewable Electricity Producers – 0.2% | |||
| Brookfield Renewable Partners LP 5.25% (b) | 370 | 9,609 | |
| Multi-Utilities – 1.8% | |||
| Brookfield Infrastructure Partners LP: | |||
| 5.00% (b) | 150 | 3,794 | |
| 5.125% (b) | 150 | 3,867 | |
| DTE Energy Co. 4.375% 10/15/80 | 150 | 3,960 | |
| Integrys Holding, Inc. 6.00% 8/1/73 (a) | 300 | 7,893 | |
| SCE Trust II 5.10% (b) | 30 | 750 | |
| | |||
| Principal Amount | Value | ||
| SCE Trust III 5.75% (a)(b) | $ 200 | $ 5,222 | |
| SCE Trust V 5.45% (a)(b) | 200 | 5,106 | |
| SCE Trust VI 5.00% (b) | 350 | 8,718 | |
| The Southern Co.: | |||
| 4.20% 10/15/60 | 1,450 | 37,845 | |
| 4.95% 1/30/80 | 1,400 | 37,422 | |
| 114,577 | |||
| TOTAL UTILITIES | 125,062 | ||
| TOTAL PREFERRED STOCKS (Cost $2,193,349) | 2,192,407 | ||
| Convertible Bonds – 1.1% | |||
| ENERGY – 1.1% | |||
| Oil, Gas & Consumable Fuels – 1.1% | |||
| Enbridge, Inc.: | |||
| 5.50% 7/15/77 (a) | 18,000 | 19,398 | |
| 5.75% 7/15/80 (a) | 18,000 | 20,322 | |
| 6.00% 1/15/77 (a) | 14,000 | 15,507 | |
| 6.25% 3/01/78 (a) | 15,000 | 16,493 | |
| TOTAL ENERGY | 71,720 | ||
| TOTAL CONVERTIBLE BONDS (Cost $71,088) | 71,720 | ||
| Money Market Fund – 1.4% | |||
| Shares | |||
| Fidelity Cash Central Fund, 0.06% (d) (Cost $90,574) | 90,556 | 90,574 | |
| TOTAL INVESTMENT IN SECURITIES – 99.3% (Cost $6,234,530) | 6,258,523 | ||
| NET OTHER ASSETS (LIABILITIES) – 0.7% | 41,779 | ||
| NET ASSETS – 100.0% | $ 6,300,302 | ||
| Legend | ||
| (a) | Coupon rates for floating and adjustable rate securities reflect the rates in effect at period end. | |
| (b) | Security is perpetual in nature with no stated maturity date. | |
| (c) | Security is exempt from registration under Rule 144A of the Securities Act of 1933. These securities may be resold in transactions exempt from registration, normally to qualified institutional buyers. At the end of the period, the value of these securities amounted to $290,297 or 4.6% of net assets. | |
| (d) | Affiliated fund that is generally available only to investment companies and other accounts managed by Fidelity Investments. The rate quoted is the annualized seven-day yield of the fund at period end. A complete unaudited listing of the fund's holdings as of its most recent quarter end is available upon request. In addition, each Fidelity Central Fund's financial statements, which are not covered by the Fund's Report of Independent Registered Public Accounting Firm, are available on the SEC's website or upon request. | |
| Annual Report | 22 |
| Fund | Value, beginning of period | Purchases | Sales Proceeds | Dividend Income | Realized Gain/Loss | Change in Unrealized appreciation (depreciation) | Value, end of period | % ownership, end of period | ||||||
| Fidelity Cash Central Fund, 0.06% | $- | $1,391,446 | $1,300,872 | $12 | $- | $- | $90,574 | 0.0% |
| Description | Total | Level 1 | Level 2 | Level 3 |
| Investments in Securities: | ||||||||
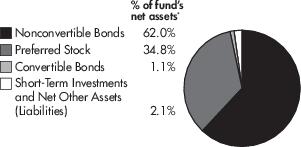
| Corporate Bonds | $ 3,903,822 | $ — | $ 3,903,822 | $ — | ||||
| Preferred Stocks | 2,192,407 | 2,184,514 | 7,893 | — | ||||
| Convertible Bonds | 71,720 | — | 71,720 | — | ||||
| Money Market Funds | 90,574 | 90,574 | — | — | ||||
| Total Investments in Securities: | $ 6,258,523 | $ 2,275,088 | $ 3,983,435 | $ — |
| 23 | Annual Report |
| Fidelity High Yield Factor ETF | Fidelity Preferred Securities & Income ETF | ||
| Assets | |||
| Investments in securities, at value – See accompanying schedule: | |||
| Unaffiliated issuers | $271,250,436 | $6,167,949 | |
| Fidelity Central Funds | 7,567,723 | 90,574 | |
| Total Investments in Securities | $278,818,159 | $6,258,523 | |
| Cash | — | 3,406 | |
| Receivable for investments sold | |||
| Regular delivery | 1,535,684 | — | |
| Dividends receivable | — | 8,343 | |
| Distributions receivable from Fidelity Central Funds | 857 | 4 | |
| Interest receivable | 3,224,468 | 45,954 | |
| Total assets | 283,579,168 | 6,316,230 | |
| Liabilities | |||
| Payable for investments purchased | |||
| Delayed delivery | 5,035,684 | — | |
| Distributions payable | 910,800 | 13,250 | |
| Accrued management fees | 100,734 | 2,678 | |
| Total liabilities | 6,047,218 | 15,928 | |
| Net Assets | $277,531,950 | $6,300,302 | |
| Net Assets consist of: | |||
| Paid in capital | $266,724,282 | $6,275,279 | |
| Total accumulated earnings (loss) | 10,807,668 | 25,023 | |
| Net Assets | $277,531,950 | $6,300,302 | |
| Shares outstanding | 4,950,000 | 250,000 | |
| Net Asset Value per share | $ 56.07 | $ 25.20 | |
| Investments at cost – Unaffiliated issuers | $265,908,819 | $6,143,956 | |
| Investments at cost – Fidelity Central Funds | 7,567,723 | 90,574 | |
| Investments at cost | $273,476,542 | $6,234,530 |
| Annual Report | 24 |
| Fidelity High Yield Factor ETF | Fidelity Preferred Securities & Income ETFA | ||
| Investment Income | |||
| Dividends | $ — | $ 17,146 | |
| Interest | 9,255,805 | 24,408 | |
| Income from Fidelity Central Funds | 10,919 | 12 | |
| Total income | 9,266,724 | 41,566 | |
| Expenses | |||
| Management fees | 921,238 | 6,499 | |
| Independent trustees' fees and expenses | 757 | 2 | |
| Total expenses before reductions | 921,995 | 6,501 | |
| Expense reductions | (47) | — | |
| Total expenses | 921,948 | 6,501 | |
| Net investment income (loss) | 8,344,776 | 35,065 | |
| Realized and Unrealized Gain (Loss) | |||
| Net realized gain (loss) on investment securities | 6,396,979 | 15 | |
| Net realized gain (loss) on Fidelity Central Funds | (241) | — | |
| Net realized gain (loss) on In-kind redemptions | (44,232) | — | |
| Total net realized gain (loss) | 6,352,506 | 15 | |
| Change in net unrealized appreciation (depreciation) on investment securities | 1,726,252 | 23,993 | |
| Net gain (loss) | 8,078,758 | 24,008 | |
| Net increase (decrease) in net assets resulting from operations | $16,423,534 | $ 59,073 |
| A | For the period June 15, 2021 (commencement of operations) to August 31, 2021. |
| 25 | Annual Report |
| Fidelity High Yield Factor ETF | Fidelity Preferred Securities & Income ETF | ||||
| Year ended August 31, 2021 | Year ended August 31, 2020 | Year ended August 31, 2021A | |||
| Increase (Decrease) in Net Assets | |||||
| Operations | |||||
| Net investment income (loss) | $ 8,344,776 | $ 4,815,932 | $ 35,065 | ||
| Net realized gain (loss) | 6,352,506 | 1,618,162 | 15 | ||
| Change in net unrealized appreciation (depreciation) | 1,726,252 | 2,199,562 | 23,993 | ||
| Net increase (decrease) in net assets resulting from operations | 16,423,534 | 8,633,656 | 59,073 | ||
| Distributions to shareholders | (10,587,700) | (5,165,200) | (34,050) | ||
| Share transactions | |||||
| Proceeds from sales of shares | 165,591,594 | 52,988,374 | 6,275,279 | ||
| Cost of shares redeemed | (8,316,699) | (10,051,764) | — | ||
| Net increase (decrease) in net assets resulting from share transactions | 157,274,895 | 42,936,610 | 6,275,279 | ||
| Total increase (decrease) in net assets | 163,110,729 | 46,405,066 | 6,300,302 | ||
| Net Assets | |||||
| Beginning of year | 114,421,221 | 68,016,155 | — | ||
| End of year | $277,531,950 | $114,421,221 | $6,300,302 | ||
| Other Information | |||||
| Shares | |||||
| Sold | 3,000,000 | 1,000,000 | 250,000 | ||
| Redeemed | (150,000) | (200,000) | — | ||
| Net increase (decrease) | 2,850,000 | 800,000 | 250,000 | ||
| A | For the period June 15, 2021 (commencement of operations) to August 31, 2021. |
| Annual Report | 26 |
| Fidelity High Yield Factor ETF | |||||||
| Year ended August 31, 2021 | Year ended August 31, 2020 | Year ended August 31, 2019 | Year ended August 31, 2018A | ||||
| Selected Per-Share Data | |||||||
| Net asset value, beginning of period | $ 54.49 | $ 52.32 | $ 50.21 | $ 50.00 | |||
| Income from Investment Operations | |||||||
| Net investment income (loss)B | 2.250 | 2.518 | 2.589 | 0.578 | |||
| Net realized and unrealized gain (loss) | 2.335 | 2.323 | 2.006 | 0.209 | |||
| Total from investment operations | 4.585 | 4.841 | 4.595 | 0.787 | |||
| Distributions from net investment income | (2.195) | (2.429) | (2.485) | (0.577) | |||
| Distributions from net realized gain | (0.808) | (0.242) | — | — | |||
| Total distributions | (3.003) | (2.671) | (2.485) | (0.577) | |||
| Net asset value, end of period | $ 56.07 | $ 54.49 | $ 52.32 | $ 50.21 | |||
| Total ReturnC,D,E | 8.66% | 9.61% | 9.48% | 1.59% | |||
| Ratios to Average Net AssetsF,G | |||||||
| Expenses before reductions | .45% | .45% | .44% H | .45% I | |||
| Expenses net of fee waivers, if any | .45% | .45% | .44% H | .45% I | |||
| Expenses net of all reductions | .45% | .45% | .44% H | .45% I | |||
| Net investment income (loss) | 4.07% | 4.84% | 5.03% | 5.21% I | |||
| Supplemental Data | |||||||
| Net assets, end of period (000 omitted) | $277,532 | $114,421 | $68,016 | $12,553 | |||
| Portfolio turnover rateJ | 177% K | 179% K | 76% | 8% L | |||
| A | For the period June 12, 2018 (commencement of operations) to August 31, 2018. |
| B | Calculated based on average shares outstanding during the period. |
| C | Based on net asset value. |
| D | Total returns for periods of less than one year are not annualized. |
| E | Total returns would have been lower if certain expenses had not been reduced during the applicable periods shown. |
| F | Expense ratios reflect operating expenses of the class. Expenses before reductions do not reflect amounts reimbursed, waived, or reduced through arrangements with the investment advisor, brokerage services, or other offset arrangements, if applicable, and do not represent the amount paid by the class during periods when reimbursements, waivers or reductions occur. |
| G | Fees and expenses of any underlying mutual funds or exchange-traded funds (ETFs) are not included in the Fund’s expense ratio. The Fund indirectly bears its proportionate share of these expenses. For additional expense information related to investments in Fidelity Central Funds, please refer to the "Investments in Fidelity Central Funds" note found in the Notes to Financial Statements section of the most recent Annual or Semi-Annual report. |
| H | The size and fluctuation of net assets and expense amounts may cause ratios to differ from contractual rates. |
| I | Annualized. |
| J | Amount does not include the portfolio activity of any underlying mutual funds or exchange-traded funds (ETFs). |
| K | Portfolio turnover rate excludes securities received or delivered in-kind. |
| L | Amount not annualized. |
| 27 | Annual Report |
| Fidelity Preferred Securities & Income ETF | |
| Year ended August 31, 2021A | |
| Selected Per-Share Data | |
| Net asset value, beginning of period | $ 25.00 |
| Income from Investment Operations | |
| Net investment income (loss)B | 0.170 |
| Net realized and unrealized gain (loss) | 0.187 |
| Total from investment operations | 0.357 |
| Distributions from net investment income | (0.157) |
| Total distributions | (0.157) |
| Net asset value, end of period | $ 25.20 |
| Total ReturnC,D | 1.44% |
| Ratios to Average Net AssetsE,F,G | |
| Expenses before reductions | .59% |
| Expenses net of fee waivers, if any | .59% |
| Expenses net of all reductions | .59% |
| Net investment income (loss) | 3.16% |
| Supplemental Data | |
| Net assets, end of period (000 omitted) | $ 6,300 |
| Portfolio turnover rateH,I | 0% |
| A | For the period June 15, 2021 (commencement of operations) to August 31, 2021. |
| B | Calculated based on average shares outstanding during the period. |
| C | Based on net asset value. |
| D | Total returns for periods of less than one year are not annualized. |
| E | Annualized. |
| F | Expense ratios reflect operating expenses of the class. Expenses before reductions do not reflect amounts reimbursed, waived, or reduced through arrangements with the investment advisor, brokerage services, or other offset arrangements, if applicable, and do not represent the amount paid by the class during periods when reimbursements, waivers or reductions occur. |
| G | Fees and expenses of any underlying mutual funds or exchange-traded funds (ETFs) are not included in the Fund’s expense ratio. The Fund indirectly bears its proportionate share of these expenses. For additional expense information related to investments in Fidelity Central Funds, please refer to the "Investments in Fidelity Central Funds" note found in the Notes to Financial Statements section of the most recent Annual or Semi-Annual report. |
| H | Amount does not include the portfolio activity of any underlying mutual funds or exchange-traded funds (ETFs). |
| I | Amount not annualized. |
| Annual Report | 28 |
For the year ended August 31, 2021
| Fidelity Central Fund | Investment Manager | Investment Objective | Investment Practices | Expense Ratio(a) |
| Fidelity Money Market Central Funds | Fidelity Management & Research Company LLC (FMR) | Each fund seeks to obtain a high level of current income consistent with the preservation of capital and liquidity. | Short-term Investments | Less than .005% to .01% |
| 29 | Annual Report |
Debt securities, including restricted securities, are valued based on evaluated prices received from third party pricing vendors or from brokers who make markets in such securities. Corporate bonds are valued by pricing vendors who utilize matrix pricing which considers yield or price of bonds of comparable quality, coupon, maturity and type or by broker-supplied prices. When independent prices are unavailable or unreliable, debt securities may be valued utilizing pricing methodologies which consider similar factors that would be used by third party pricing vendors. For foreign debt securities, when significant market or security specific events arise, valuations may be determined in good faith in accordance with procedures adopted by the Board. Debt securities are generally categorized as Level 2 in the hierarchy but may be Level 3 depending on the circumstances. Certain Funds invest a significant portion of its assets in below investment grade securities. The value of these securities can be more volatile due to changes in the credit quality of the issuer and is sensitive to changes in economic, market and regulatory conditions.
| Annual Report | 30 |
Book-tax differences are primarily due to prior period premium and discount on debt securities, redemptions in kind and losses deferred due to wash sales and excise tax regulations.
| Tax cost | Gross unrealized appreciation | Gross unrealized depreciation | Net unrealized appreciation (depreciation) | |
| Fidelity High Yield Factor ETF | $ 273,408,565 | $ 6,109,991 | $ (700,397) | $ 5,409,594 |
| Fidelity Preferred Securities & Income ETF | 6,234,429 | 34,622 | (10,528) | 24,094 |
| Undistributed ordinary income | Undistributed capital gains | Capital loss carryforward | Net unrealized appreciation (depreciation) | |
| Fidelity High Yield Factor ETF | $ 4,834,916 | $ 563,158 | $ — | $ 5,409,594 |
| Fidelity Preferred Securities & Income ETF | 929 | — | — | 24,094 |
| August 31, 2021 | ||||
| Ordinary Income | Long-Term Capital Gain | Tax Return Of Capital | Total | |
| Fidelity High Yield Factor ETF | $ 10,030,900 | $ 556,800 | $ — | $ 10,587,700 |
| Fidelity Preferred Securities & Income ETFA | 34,050 | — | — | 34,050 |
| A | For the period June 15, 2021 (commencement of operations) to August 31, 2021. |
| August 31, 2020 | ||||
| Fidelity High Yield Factor ETF | $ 5,128,450 | $ 36,750 | $ — | $ 5,165,200 |
| Purchases ($) | Sales ($) | |
| Fidelity High Yield Factor ETF | 350,451,214 | 341,957,773 |
| Fidelity Preferred Securities & Income ETF | 6,155,448 | 3,009 |
| 31 | Annual Report |
Securities received and delivered in-kind through subscriptions and redemptions are noted in the table below.
| In-kind Subscriptions ($) | In-kind Redemptions ($) | |
| Fidelity High Yield Factor ETF | 155,584,995 | 7,977,598 |
| Fidelity Preferred Securities & Income ETF | — | — |
| Fee Rate | |
| Fidelity High Yield Factor ETF | .45% |
| Fidelity Preferred Securities & Income ETF | .59% |
| Amount | |
| Fidelity Preferred Securities & Income ETF | $ 48 |
| Amount | |
| Fidelity High Yield Factor ETF | $ 47 |
| Annual Report | 32 |
| Fund Name | Statements of operation | Statements of changes in net assets | Financial highlights |
| Fidelity High Yield Factor ETF | For the year ended August 31, 2021 | For the years ended August 31, 2021 and 2020 | For the years ended August 31, 2021, 2020, 2019 and the period from June 12, 2018 (commencement of operations) through August 31, 2018 |
| Fidelity Preferred Securities & Income ETF | For the period June 15, 2021 (commencement of operations) through August 31, 2021 | For the period June 15, 2021 (commencement of operations) through August 31, 2021 | For the period June 15, 2021 (commencement of operations) through August 31, 2021 |
| 33 | Annual Report |
| Annual Report | 34 |
| 35 | Annual Report |
| Annual Report | 36 |
| 37 | Annual Report |
| Annual Report | 38 |
| 39 | Annual Report |
| Annual Report | 40 |
| Annualized Expense RatioA | Beginning Account Value | Ending Account Value August 31, 2021 | Expenses Paid During Period | |
| Fidelity High Yield Factor ETF | 0.45% | |||
| Actual | $ 1,000.00 | $ 1,037.30 | $ 2.31B | |
| Hypothetical C | $ 1,000.00 | $ 1,022.94 | $ 2.29D | |
| Fidelity Preferred Securities & Income ETF | 0.59% | |||
| Actual | $ 1,000.00 | $ 1,014.40 | $ 1.27 | |
| Hypothetical C | $ 1,000.00 | $ 1,022.23 | $ 3.01D |
| A | Annualized expense ratio reflects expenses net of applicable fee waivers. |
| B | Actual expenses are equal to the Fund's annualized expense ratio, multiplied by the average account value over the period, multiplied by 184/365 (to reflect the one-half year period) for Fidelity High Yield Factor ETF and multiplied by 78/365 (to reflect the period June 15, 2021 to August 31, 2021) for Fidelity Preferred Securities & Income ETF. |
| C | 5% return per year before expenses. |
| D | Hypothetical expenses are equal to the Fund's annualized expense ratio, multiplied by the average account value over the period, multiplied by 184/365 (to reflect the one-half year period). |
| 41 | Annual Report |
| Pay Date | Record Date | Dividends | Capital Gains | |
| Fidelity High Yield Factor ETF | 10/1/2021 | 9/29/2021 | $0.189 | $0.00 |
| Fidelity Preferred Securities & Income ETF | 10/1/2021 | 9/29/2021 | $0.055 | $0.00 |
| Fidelity High Yield Factor ETF | $715,093 |
| Fidelity High Yield Factor ETF | $5,411,552 |
| Fidelity Preferred Securities & Income ETF | $ 18,883 |
| Fidelity High Yield Factor ETF | $5,523,688 |
| Annual Report | 42 |
| 43 | Annual Report |
| Annual Report | 44 |

| 45 | Annual Report |

| Annual Report | 46 |
| 47 | Annual Report |
| Annual Report | 48 |
| Item 2. | Code of Ethics |
As of the end of the period, August 31, 2021, Fidelity Covington Trust (the trust) has adopted a code of ethics, as defined in Item 2 of Form N-CSR, that applies to its President and Treasurer and its Chief Financial Officer. A copy of the code of ethics is filed as an exhibit to this Form N-CSR.
| Item 3. | Audit Committee Financial Expert |
The Board of Trustees of the trust has determined that Donald F. Donahue is an audit committee financial expert, as defined in Item 3 of Form N-CSR. Mr. Donahue is independent for purposes of Item 3 of Form N-CSR.
| Item 4. | Principal Accountant Fees and Services |
Fees and Services
The following table presents fees billed by PricewaterhouseCoopers LLP (“PwC”) in each of the last two fiscal years for services rendered to Fidelity High Yield Factor ETF and Fidelity Preferred Securities & Income ETF (the “Funds”):
Services Billed by PwC
August 31, 2021 FeesA,B
| Audit Fees | Audit- Related Fees | Tax Fees | All Other Fees | |||||||||||||
Fidelity High Yield Factor ETF | $ | 35,400 | $ | — | $ | 7,200 | $ | 1,100 | ||||||||
Fidelity Preferred Securities & Income ETF | $ | 31,000 | $ | — | $ | 7,200 | $ | 100 | ||||||||
August 31, 2020 FeesA,B
| Audit Fees | Audit- Related Fees | Tax Fees | All Other Fees | |||||||||||||
Fidelity High Yield Factor ETF | $ | 36,200 | $ | — | $ | 7,200 | $ | 1,400 | ||||||||
Fidelity Preferred Securities & Income ETF | $ | — | $ | — | $ | — | $ | — | ||||||||
| A | Amounts may reflect rounding. |
| B | Fidelity Preferred Securities & Income ETF commenced operations on June 15, 2021. |
The following table(s) present(s) fees billed by PwC that were required to be approved by the Audit Committee for services that relate directly to the operations and financial reporting of the Fund(s) and that are rendered on behalf of Fidelity Management & Research Company LLC (“FMR”) and entities controlling, controlled by, or under common control with FMR (not including any sub-adviser whose role is primarily portfolio management and is subcontracted with or overseen by another investment adviser) that provide ongoing services to the Fund(s) (“Fund Service Providers”):
Services Billed by PwC
| August 31, 2021A,B | August 31, 2020A,B | |||||||
Audit-Related Fees | $ | 8,959,700 | $ | 8,940,200 | ||||
Tax Fees | $ | 11,200 | $ | 20,800 | ||||
All Other Fees | $ | — | $ | — | ||||
| A | Amounts may reflect rounding. |
| B | May include amounts billed prior to the Fidelity Preferred Securities & Income ETF’s commencement of operations. |
“Audit-Related Fees” represent fees billed for assurance and related services that are reasonably related to the performance of the fund audit or the review of the fund’s financial statements and that are not reported under Audit Fees.
“Tax Fees” represent fees billed for tax compliance, tax advice or tax planning that relate directly to the operations and financial reporting of the fund.
“All Other Fees” represent fees billed for services provided to the fund or Fund Service Provider, a significant portion of which are assurance related, that relate directly to the operations and financial reporting of the fund, excluding those services that are reported under Audit Fees, Audit-Related Fees or Tax Fees.
Assurance services must be performed by an independent public accountant.
* * *
The aggregate non-audit fees billed by PwC for services rendered to the Fund(s), FMR (not including any sub-adviser whose role is primarily portfolio management and is subcontracted with or overseen by another investment adviser), and any Fund Service Provider for each of the last two fiscal years of the Fund(s) are as follows:
Billed By | August 31, 2021A,B | August 31, 2020A,B | ||||||
PwC | $ | 14,289,200 | $ | 14,050,800 | ||||
| A | Amounts may reflect rounding. |
| B | May include amounts billed prior to the Fidelity Preferred Securities & Income ETF’s commencement of operations. |
The trust’s Audit Committee has considered non-audit services that were not pre-approved that were provided by PwC to Fund Service Providers to be compatible with maintaining the independence of PwC in its(their) audit of the Fund(s), taking into account representations from PwC, in accordance with Public Company Accounting Oversight Board rules, regarding its independence from the Fund(s) and its(their) related entities and FMR’s review of the appropriateness and permissibility under applicable law of such non-audit services prior to their provision to the Fund(s) Service Providers.
Audit Committee Pre-Approval Policies and Procedures
The trust’s Audit Committee must pre-approve all audit and non-audit services provided by a fund’s independent registered public accounting firm relating to the operations or financial reporting of the fund. Prior to the commencement of any audit or non-audit services to a fund, the Audit Committee reviews the services to determine whether they are appropriate and permissible under applicable law.
The Audit Committee has adopted policies and procedures to, among other purposes, provide a framework for the Committee’s consideration of non-audit services by the audit firms that audit the Fidelity funds. The policies and procedures require that any non-audit service provided by a fund audit firm to a Fidelity fund and any non-audit service provided by a fund auditor to a Fund Service Provider that relates directly to the operations and financial reporting of a Fidelity fund (“Covered Service”) are subject to approval by the Audit Committee before such service is provided.
All Covered Services must be approved in advance of provision of the service either: (i) by formal resolution of the Audit Committee, or (ii) by oral or written approval of the service by the Chair of the Audit Committee (or if the Chair is unavailable, such other member of the Audit Committee as may be designated by the Chair to act in the Chair’s absence). The approval contemplated by (ii) above is permitted where the Treasurer determines that action on such an engagement is necessary before the next meeting of the Audit Committee.
Non-audit services provided by a fund audit firm to a Fund Service Provider that do not relate directly to the operations and financial reporting of a Fidelity fund are reported to the Audit Committee periodically.
Non-Audit Services Approved Pursuant to Rule 2-01(c)(7)(i)(C) and (ii) of Regulation S-X (“De Minimis Exception”)
There were no non-audit services approved or required to be approved by the Audit Committee pursuant to the De Minimis Exception during the Fund’s(s’) last two fiscal years relating to services provided to (i) the Fund(s) or (ii) any Fund Service Provider that relate directly to the operations and financial reporting of the Fund(s).
| Item 5. | Audit Committee of Listed Registrants |
The Audit Committee is a separately-designated standing audit committee in accordance with Section 3(a)(58)(A) of the Securities Exchange Act of 1934. As of August 31, 2021, the members of the Audit Committee were Donald F. Donahue, Thomas Kennedy, Garnett A. Smith and Susan Tomasky.
| Item 6. | Investments |
| (a) | Not applicable. |
| (b) | Not applicable. |
| Item 7. | Disclosure of Proxy Voting Policies and Procedures for Closed-End Management Investment Companies |
Not applicable.
| Item 8. | Portfolio Managers of Closed-End Management Investment Companies |
Not applicable.
| Item 9. | Purchase of Equity Securities by Closed-End Management Investment Company and Affiliated Purchasers |
Not applicable.
| Item 10. | Submission of Matters to a Vote of Security Holders |
There were no material changes to the procedures by which shareholders may recommend nominees to the trust’s Board of Trustees.
| Item 11. | Controls and Procedures |
(a)(i) The President and Treasurer and the Chief Financial Officer have concluded that the trust’s disclosure controls and procedures (as defined in Rule 30a-3(c) under the Investment Company Act) provide reasonable assurances that material information relating to the trust is made known to them by the appropriate persons, based on their evaluation of these controls and procedures as of a date within 90 days of the filing date of this report.
(a)(ii) There was no change in the trust’s internal control over financial reporting (as defined in Rule 30a-3(d) under the Investment Company Act) that occurred during the period covered by this report that has materially affected, or is reasonably likely to materially affect, the trust’s internal control over financial reporting.
| Item 12. | Disclosure of Securities Lending Activities for Closed-End Management Investment Companies |
Not applicable.
| Item 13. | Exhibits |
SIGNATURES
Pursuant to the requirements of the Securities Exchange Act of 1934 and the Investment Company Act of 1940, the registrant has duly caused this report to be signed on its behalf by the undersigned, thereunto duly authorized.
Fidelity Covington Trust
| By: | /s/ Stacie M. Smith | |
| Stacie M. Smith | ||
| President and Treasurer | ||
| Date: | October 21, 2021 | |
Pursuant to the requirements of the Securities Exchange Act of 1934 and the Investment Company Act of 1940, this report has been signed below by the following persons on behalf of the registrant and in the capacities and on the dates indicated.
| By: | /s/ Stacie M. Smith | |
| Stacie M. Smith | ||
| President and Treasurer | ||
| Date: | October 21, 2021 | |
| By: | /s/ John J. Burke III | |
| John J. Burke III | ||
| Chief Financial Officer | ||
| Date: | October 21, 2021 | |