UNITED STATES
SECURITIES AND EXCHANGE COMMISSION
Washington, D.C. 20549
FORM N-CSR
CERTIFIED SHAREHOLDER REPORT OF REGISTERED
MANAGEMENT INVESTMENT COMPANIES
Investment Company Act file number 811-07319
Fidelity Covington Trust
(Exact name of registrant as specified in charter)
245 Summer St., Boston, Massachusetts 02210
(Address of principal executive offices) (Zip code)
Cynthia Lo Bessette, Secretary
245 Summer St.
Boston, Massachusetts 02210
(Name and address of agent for service)
Registrant’s telephone number, including area code: 617-563-7000
Date of fiscal year end: June 30
Date of reporting period: June 30, 2022
| Item 1. | Reports to Stockholders |


| Annual Report | 2 |
| 3 | Annual Report |
| Annual Report | 4 |

| 5 | Annual Report |
| Annual Report | 6 |
| % of fund's net assets | |
| Enphase Energy, Inc. | 4.5 |
| Orsted AS | 4.0 |
| Vestas Wind Systems A/S | 3.7 |
| Plug Power, Inc. | 2.9 |
| Northland Power, Inc. | 2.8 |
| Verbund AG | 2.8 |
| First Solar, Inc. | 2.7 |
| Xinyi Solar Holdings Ltd. | 2.7 |
| EDP Renovaveis S.A. | 2.6 |
| China Longyuan Power Group Corp. Ltd. | 2.6 |
| 31.3 |
| % of fund's net assets | ||
| Utilities | 52.5 | |
| Industrials | 26.4 | |
| Information Technology | 20.9 | |

| 7 | Annual Report |
| Annual Report | 8 |
| 9 | Annual Report |
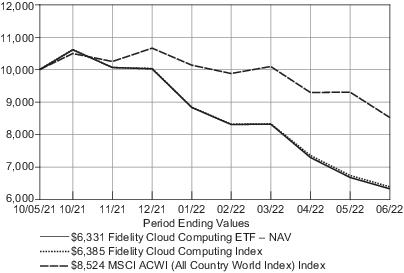
| % of fund's net assets | |
| ServiceNow, Inc. | 4.7 |
| SAP SE | 4.6 |
| Salesforce.com, Inc. | 4.5 |
| Equinix, Inc. | 4.0 |
| Snowflake, Inc. Class A | 3.4 |
| Digital Realty Trust, Inc. | 3.4 |
| Atlassian Corp. PLC Class A | 3.1 |
| Zoom Video Communications, Inc. Class A | 3.0 |
| Datadog, Inc. Class A | 2.8 |
| Workday, Inc. Class A | 2.8 |
| 36.3 |
| % of fund's net assets | ||
| Information Technology | 92.5 | |
| Real Estate | 7.4 | |

| Annual Report | 10 |
| % of fund's net assets | |
| Square, Inc. Class A | 17.2 |
| Coinbase Global, Inc. Class A | 10.7 |
| Marathon Digital Holdings, Inc. | 5.7 |
| Riot Blockchain, Inc. | 5.3 |
| Bakkt Holdings, Inc. | 4.2 |
| Cleanspark, Inc. | 3.3 |
| Hut 8 Mining Corp. | 3.1 |
| Bit Digital, Inc. | 2.9 |
| Hive Blockchain Technologies Ltd. | 2.8 |
| Bitfarms Ltd. | 2.7 |
| 57.9 |
| % of fund's net assets | ||
| Information Technology | 78.9 | |
| Financials | 18.9 | |
| Consumer Discretionary | 2.1 | |

| 11 | Annual Report |
| Annual Report | 12 |
| 13 | Annual Report |
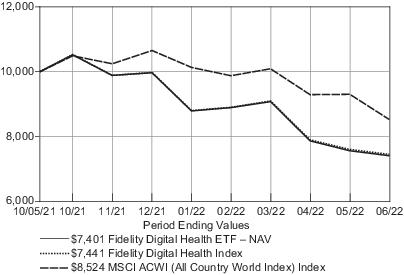
| % of fund's net assets | |
| ResMed, Inc. | 4.5 |
| Veeva Systems, Inc. Class A | 4.5 |
| DexCom, Inc. | 4.3 |
| Intuitive Surgical, Inc. | 4.2 |
| Insulet Corp. | 3.6 |
| Sonova Holding AG | 3.5 |
| JD Health International, Inc. | 3.4 |
| Cochlear Ltd. | 2.7 |
| Fisher & Paykel Healthcare Corp. Ltd. | 2.7 |
| Change Healthcare, Inc. | 2.6 |
| 36.0 |
| % of fund's net assets | ||
| Health Care | 87.1 | |
| Consumer Discretionary | 8.9 | |
| Consumer Staples | 2.5 | |
| Information Technology | 1.4 | |
| Annual Report | 14 |
| 15 | Annual Report |
| Annual Report | 16 |
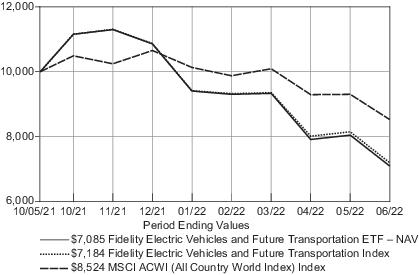
| % of fund's net assets | |
| NIO, Inc. ADR | 4.6 |
| Tesla, Inc. | 4.5 |
| QUALCOMM, Inc. | 4.0 |
| NVIDIA Corp. | 4.0 |
| Intel Corp. | 4.0 |
| Li Auto, Inc. ADR | 3.8 |
| Samsung SDI Co. Ltd. | 3.6 |
| XPeng, Inc. ADR | 3.4 |
| Aptiv PLC | 3.4 |
| Garmin Ltd. | 3.2 |
| 38.5 |
| % of fund's net assets | ||
| Consumer Discretionary | 36.9 | |
| Information Technology | 33.0 | |
| Industrials | 16.4 | |
| Materials | 13.7 | |
| 17 | Annual Report |
| % of fund's net assets | |
| Tencent Holdings Ltd. | 5.0 |
| Alphabet, Inc. Class A | 4.7 |
| Apple, Inc. | 4.6 |
| Nintendo Co. Ltd. | 4.5 |
| Adobe, Inc. | 4.2 |
| Meta Platforms, Inc. Class A | 4.2 |
| NVIDIA Corp. | 4.0 |
| NetEase, Inc. ADR | 3.8 |
| Electronic Arts, Inc. | 3.6 |
| Dassault Systemes SE | 3.3 |
| 41.9 |
| % of fund's net assets | ||
| Communication Services | 64.2 | |
| Information Technology | 33.4 | |
| Industrials | 1.4 | |
| Consumer Discretionary | 0.7 | |
| Annual Report | 18 |
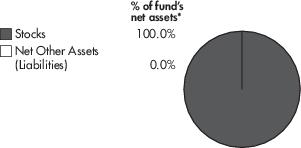
| Common Stocks – 99.8% | ||
| Shares | Value | |
| INDUSTRIALS – 26.4% | ||
| Electrical Equipment – 26.4% | ||
| Array Technologies, Inc. (a) | 41,390 | $ 455,704 |
| Ballard Power Systems, Inc. (a) | 70,162 | 442,201 |
| Bloom Energy Corp. Class A (a) | 32,379 | 534,253 |
| CS Wind Corp. | 9,805 | 436,483 |
| Doosan Fuel Cell Co. Ltd. (a) | 15,171 | 351,116 |
| Nordex SE (a) | 39,186 | 333,308 |
| Plug Power, Inc. (a) | 49,662 | 822,899 |
| PowerCell Sweden AB (a) | 25,179 | 333,184 |
| Shoals Technologies Group, Inc. (a) | 32,268 | 531,777 |
| Siemens Gamesa Renewable Energy S.A. (a) | 36,230 | 678,371 |
| Sunrun, Inc. (a) | 28,215 | 659,102 |
| TPI Composites, Inc. (a) | 23,918 | 298,975 |
| Vestas Wind Systems A/S | 49,995 | 1,053,547 |
| Xinjiang Goldwind Science & Technology Co. Ltd. | 285,400 | 533,924 |
| TOTAL INDUSTRIALS | 7,464,844 | |
| INFORMATION TECHNOLOGY – 20.9% | ||
| Electronic Equipment, Instruments & Components – 3.4% | ||
| Itron, Inc. (a) | 10,819 | 534,783 |
| Landis+Gyr Group AG | 7,869 | 411,389 |
| 946,172 | ||
| Semiconductors & Semiconductor Equipment – 17.5% | ||
| Canadian Solar, Inc. (a) | 14,836 | 461,993 |
| Enphase Energy, Inc. (a) | 6,442 | 1,257,736 |
| First Solar, Inc. (a) | 11,232 | 765,236 |
| Flat Glass Group Co. Ltd. | 124,000 | 436,144 |
| JinkoSolar Holding Co. Ltd. (a) | 9,418 | 651,537 |
| Maxeon Solar Technologies Ltd. (a) | 21,839 | 290,241 |
| SMA Solar Technology AG (a) | 8,510 | 344,661 |
| Xinyi Solar Holdings Ltd. | 486,000 | 750,651 |
| 4,958,199 | ||
| TOTAL INFORMATION TECHNOLOGY | 5,904,371 | |
| UTILITIES – 52.5% | ||
| Electric Utilities – 6.8% | ||
| Orsted AS (b) | 10,756 | 1,121,817 |
| Verbund AG | 8,096 | 790,111 |
| 1,911,928 | ||
| Independent Power and Renewable Electricity Producers – 45.7% | ||
| Albioma S.A. | 9,035 | 471,148 |
| | ||
| Shares | Value | |
| Atlantica Sustainable Infrastructure PLC | 16,234 | $ 523,709 |
| Boralex, Inc. | 19,241 | 639,602 |
| Brookfield Renewable Corp. Class A | 19,590 | 696,307 |
| China Datang Corp. Renewable Power Co. Ltd. | 1,193,000 | 405,930 |
| China Longyuan Power Group Corp. Ltd. | 385,000 | 743,805 |
| Clearway Energy, Inc. Class C | 17,339 | 604,091 |
| Corp. ACCIONA Energias Renovables S.A. | 14,186 | 545,475 |
| Drax Group PLC | 75,444 | 589,136 |
| EDP Renovaveis S.A. | 31,691 | 746,118 |
| Encavis AG | 26,406 | 482,417 |
| eRex Co. Ltd. | 24,600 | 398,185 |
| ERG SpA | 15,414 | 477,636 |
| Innergex Renewable Energy, Inc. | 39,371 | 528,019 |
| Meridian Energy Ltd. | 216,355 | 629,548 |
| Neoen S.A. (b) | 12,939 | 486,434 |
| Northland Power, Inc. | 26,931 | 800,028 |
| Ormat Technologies, Inc. | 8,011 | 627,662 |
| RENOVA, Inc. (a) | 25,500 | 459,490 |
| Scatec ASA (b) | 46,159 | 395,538 |
| Solaria Energia y Medio Ambiente S.A. (a) | 21,898 | 463,588 |
| Sunnova Energy International, Inc. (a) | 25,259 | 465,523 |
| TransAlta Renewables, Inc. | 35,323 | 450,454 |
| West Holdings Corp. | 11,400 | 306,282 |
| 12,936,125 | ||
| TOTAL UTILITIES | 14,848,053 | |
| TOTAL COMMON STOCKS (Cost $32,687,958) | 28,217,268 | |
| TOTAL INVESTMENT IN SECURITIES – 99.8% (Cost $32,687,958) | 28,217,268 | |
| NET OTHER ASSETS (LIABILITIES) – 0.2% | 70,443 | |
| NET ASSETS – 100.0% | $ 28,287,711 | |
| Legend | ||
| (a) | Non-income producing. | |
| (b) | Security is exempt from registration under Rule 144A of the Securities Act of 1933. These securities may be resold in transactions exempt from registration, normally to qualified institutional buyers. At the end of the period, the value of these securities amounted to $2,003,789 or 7.1% of net assets. | |
| Fund | Value, beginning of period | Purchases | Sales Proceeds | Dividend Income | Realized Gain/Loss | Change in Unrealized appreciation (depreciation) | Value, end of period | % ownership, end of period | ||||||
| Fidelity Cash Central Fund, 1.58% | $— | $4,105,856 | $4,105,856 | $58 | $— | $— | $— | 0.0% |
| 19 | Annual Report |
| Description | Total | Level 1 | Level 2 | Level 3 |
| Investments in Securities: | ||||||||
| Equities: | ||||||||
| Industrials | $ 7,464,844 | $ 7,464,844 | $ — | $ — | ||||
| Information Technology | 5,904,371 | 5,904,371 | — | — | ||||
| Utilities | 14,848,053 | 14,848,053 | — | — | ||||
| Total Investments in Securities: | $ 28,217,268 | $ 28,217,268 | $ — | $ — |
| United States of America | 29.2% |
| China | 12.5% |
| Canada | 11.7% |
| Spain | 8.6% |
| Denmark | 7.7% |
| Japan | 4.1% |
| Germany | 4.1% |
| United Kingdom | 3.9% |
| France | 3.4% |
| Austria | 2.8% |
| South Korea | 2.8% |
| New Zealand | 2.2% |
| Italy | 1.7% |
| Switzerland | 1.5% |
| Norway | 1.4% |
| Sweden | 1.2% |
| Singapore | 1.0% |
| 99.8% |
| Annual Report | 20 |
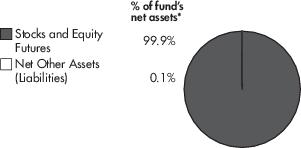
| Common Stocks – 99.9% | ||
| Shares | Value | |
| INFORMATION TECHNOLOGY – 92.5% | ||
| Communications Equipment – 1.4% | ||
| Netscout Systems, Inc. (a) | 7,579 | $ 256,549 |
| IT Services – 9.7% | ||
| Atos SE (a) | 9,808 | 131,094 |
| Kingsoft Cloud Holdings Ltd. (a) | 31,815 | 141,577 |
| MongoDB, Inc. (a) | 1,818 | 471,771 |
| Snowflake, Inc. Class A (a) | 4,504 | 626,326 |
| Twilio, Inc. Class A (a) | 4,711 | 394,829 |
| 1,765,597 | ||
| Software – 70.2% | ||
| Alteryx, Inc. Class A (a) | 5,032 | 243,649 |
| Atlassian Corp. PLC Class A (a) | 3,001 | 562,387 |
| Avaya Holdings Corp. (a) | 28,004 | 62,729 |
| Box, Inc. Class A (a) | 11,533 | 289,940 |
| C3.ai, Inc. (a) | 11,922 | 217,696 |
| Citrix Systems, Inc. | 4,479 | 435,224 |
| CommVault Systems, Inc. (a) | 4,265 | 268,269 |
| Confluent, Inc. Class A (a) | 9,562 | 222,221 |
| Coupa Software, Inc. (a) | 4,617 | 263,631 |
| Datadog, Inc. Class A (a) | 5,396 | 513,915 |
| Dropbox, Inc. Class A (a) | 16,538 | 347,133 |
| Dynatrace, Inc. (a) | 9,489 | 374,246 |
| Elastic N.V. (a) | 4,634 | 313,583 |
| Five9, Inc. (a) | 3,608 | 328,833 |
| Gitlab, Inc. (a) | 3,466 | 184,183 |
| HubSpot, Inc. (a) | 1,336 | 401,668 |
| Kingdee International Software Group Co. Ltd. (a) | 176,000 | 412,695 |
| MicroStrategy, Inc. Class A (a) | 1,049 | 172,351 |
| New Relic, Inc. (a) | 5,597 | 280,130 |
| Nutanix, Inc. Class A (a) | 17,926 | 262,257 |
| Open Text Corp. | 10,582 | 399,424 |
| Pegasystems, Inc. | 4,656 | 222,743 |
| Qualtrics International, Inc. (a) | 14,286 | 178,718 |
| Salesforce.com, Inc. (a) | 5,030 | 830,151 |
| SAP SE | 9,283 | 843,648 |
| ServiceNow, Inc. (a) | 1,798 | 854,985 |
| | ||
| Shares | Value | |
| Splunk, Inc. (a) | 4,641 | $ 410,543 |
| Sumo Logic, Inc. (a) | 21,037 | 157,567 |
| Teradata Corp. (a) | 8,075 | 298,856 |
| The Sage Group PLC | 49,787 | 383,824 |
| UiPath, Inc. (a) | 17,210 | 313,050 |
| Verint Systems, Inc. (a) | 5,596 | 236,991 |
| VMware, Inc. Class A | 4,416 | 503,336 |
| Workday, Inc. Class A (a) | 3,678 | 513,375 |
| Zoom Video Communications, Inc. Class A (a) | 5,041 | 544,277 |
| 12,848,228 | ||
| Technology Hardware, Storage & Peripherals – 11.2% | ||
| Hewlett Packard Enterprise Co. | 34,973 | 463,742 |
| NetApp, Inc. | 6,765 | 441,349 |
| Pure Storage, Inc. Class A (a) | 13,584 | 349,245 |
| Seagate Technology Holdings PLC | 5,926 | 423,353 |
| Western Digital Corp. (a) | 8,452 | 378,903 |
| 2,056,592 | ||
| TOTAL INFORMATION TECHNOLOGY | 16,926,966 | |
| REAL ESTATE – 7.4% | ||
| Equity Real Estate Investment Trusts (REITs) – 7.4% | ||
| Digital Realty Trust, Inc. | 4,787 | 621,496 |
| Equinix, Inc. | 1,114 | 731,921 |
| TOTAL REAL ESTATE | 1,353,417 | |
| TOTAL COMMON STOCKS (Cost $27,094,233) | 18,280,383 | |
| TOTAL INVESTMENT IN SECURITIES – 99.9% (Cost $27,094,233) | 18,280,383 | |
| NET OTHER ASSETS (LIABILITIES) – 0.1% | 12,546 | |
| NET ASSETS – 100.0% | $ 18,292,929 | |
| Legend | ||
| (a) | Non-income producing. | |
| Fund | Value, beginning of period | Purchases | Sales Proceeds | Dividend Income | Realized Gain/Loss | Change in Unrealized appreciation (depreciation) | Value, end of period | % ownership, end of period | ||||||
| Fidelity Cash Central Fund, 1.58% | $— | $2,400,009 | $2,400,009 | $47 | $— | $— | $— | 0.0% |
| 21 | Annual Report |
| Description | Total | Level 1 | Level 2 | Level 3 |
| Investments in Securities: | ||||||||
| Equities: | ||||||||
| Information Technology | $ 16,926,966 | $ 16,926,966 | $ — | $ — | ||||
| Real Estate | 1,353,417 | 1,353,417 | — | — | ||||
| Total Investments in Securities: | $ 18,280,383 | $ 18,280,383 | $ — | $ — |
| United States of America | 81.9% |
| Germany | 4.6% |
| Australia | 3.1% |
| Ireland | 2.3% |
| Cayman Islands | 2.2% |
| Canada | 2.2% |
| United Kingdom | 2.1% |
| Others (Individually Less Than 1%) | 1.5% |
| 99.9% |
| Annual Report | 22 |
| Common Stocks – 99.9% | ||
| Shares | Value | |
| CONSUMER DISCRETIONARY – 2.1% | ||
| Automobiles – 2.1% | ||
| Mullen Automotive, Inc. (a) | 260,524 | $ 265,734 |
| FINANCIALS – 18.9% | ||
| Capital Markets – 17.4% | ||
| Bakkt Holdings, Inc. (a) | 258,142 | 542,098 |
| Coinbase Global, Inc. Class A (a) | 29,738 | 1,398,281 |
| Galaxy Digital Holdings Ltd. (a) | 77,769 | 291,193 |
| Voyager Digital Ltd. (a) | 85,720 | 37,717 |
| 2,269,289 | ||
| Consumer Finance – 1.5% | ||
| Green Dot Corp. Class A (a) | 7,682 | 192,895 |
| TOTAL FINANCIALS | 2,462,184 | |
| INFORMATION TECHNOLOGY – 78.9% | ||
| IT Services – 50.6% | ||
| Alliance Data Systems Corp. | 5,739 | 212,687 |
| Dlocal Ltd. (a) | 10,591 | 278,014 |
| Edenred | 5,403 | 254,016 |
| FleetCor Technologies, Inc. (a) | 1,307 | 274,614 |
| Flywire Corp. (a) | 11,221 | 197,826 |
| Global Payments, Inc. | 2,436 | 269,519 |
| GMO Payment Gateway, Inc. | 3,100 | 217,916 |
| Marqeta, Inc. Class A (a) | 28,921 | 234,549 |
| Mastercard, Inc. Class A | 883 | 278,569 |
| Nexi SpA (a)(b) | 26,482 | 218,827 |
| Nuvei Corp. (a)(b) | 5,151 | 186,312 |
| Paysafe Ltd. (a) | 86,193 | 168,076 |
| Shift4 Payments, Inc. (a) | 6,817 | 225,370 |
| Shopify, Inc. (a) | 8,040 | 251,170 |
| Square, Inc. Class A (a) | 36,401 | 2,237,206 |
| StoneCo Ltd. (a) | 30,753 | 236,798 |
| Visa, Inc. Class A | 1,490 | 293,366 |
| | ||
| Shares | Value | |
| WEX, Inc. (a) | 1,847 | $ 287,319 |
| Worldline S.A. (a)(b) | 7,061 | 261,172 |
| 6,583,326 | ||
| Software – 28.3% | ||
| Argo Blockchain PLC (a) | 31,880 | 119,869 |
| Bit Digital, Inc. (a) | 283,909 | 371,921 |
| Bitfarms Ltd. (a) | 315,100 | 352,912 |
| Cipher Mining, Inc. (a) | 79,050 | 108,298 |
| Cleanspark, Inc. (a) | 108,231 | 424,266 |
| Hive Blockchain Technologies Ltd. (a) | 122,649 | 366,720 |
| Hut 8 Mining Corp. (a) | 302,012 | 401,676 |
| Iris Energy Ltd. (a) | 29,927 | 100,255 |
| Marathon Digital Holdings, Inc. (a) | 139,928 | 747,216 |
| Riot Blockchain, Inc. (a) | 163,303 | 684,240 |
| 3,677,373 | ||
| TOTAL INFORMATION TECHNOLOGY | 10,260,699 | |
| TOTAL COMMON STOCKS (Cost $17,898,535) | 12,988,617 | |
| TOTAL INVESTMENT IN SECURITIES – 99.9% (Cost $17,898,535) | 12,988,617 | |
| NET OTHER ASSETS (LIABILITIES) – 0.1% | 15,947 | |
| NET ASSETS – 100.0% | $ 13,004,564 | |
| Legend | ||
| (a) | Non-income producing. | |
| (b) | Security is exempt from registration under Rule 144A of the Securities Act of 1933. These securities may be resold in transactions exempt from registration, normally to qualified institutional buyers. At the end of the period, the value of these securities amounted to $666,311 or 5.1% of net assets. | |
| Fund | Value, beginning of period | Purchases | Sales Proceeds | Dividend Income | Realized Gain/Loss | Change in Unrealized appreciation (depreciation) | Value, end of period | % ownership, end of period | ||||||
| Fidelity Cash Central Fund, 1.58% | $— | $226,096 | $226,096 | $5 | $— | $— | $— | 0.0% |
| 23 | Annual Report |
| Description | Total | Level 1 | Level 2 | Level 3 |
| Investments in Securities: | ||||||||
| Equities: | ||||||||
| Consumer Discretionary | $ 265,734 | $ 265,734 | $ — | $ — | ||||
| Financials | 2,462,184 | 2,462,184 | — | — | ||||
| Information Technology | 10,260,699 | 10,260,699 | — | — | ||||
| Total Investments in Securities: | $ 12,988,617 | $ 12,988,617 | $ — | $ — |
| United States of America | 73.6% |
| Canada | 12.0% |
| France | 4.0% |
| United Kingdom | 2.2% |
| Uruguay | 2.1% |
| Brazil | 1.8% |
| Italy | 1.7% |
| Japan | 1.7% |
| Others (Individually Less Than 1%) | 0.8% |
| 99.9% |
| Annual Report | 24 |
| Common Stocks – 99.9% | ||
| Shares | Value | |
| CONSUMER DISCRETIONARY – 8.9% | ||
| Household Durables – 1.1% | ||
| Vuzix Corp. (a) | 14,664 | $ 104,114 |
| Internet & Direct Marketing Retail – 7.8% | ||
| Alibaba Health Information Technology Ltd. (a) | 340,000 | 233,976 |
| JD Health International, Inc. (a)(b) | 40,800 | 320,028 |
| Ping An Healthcare and Technology Co. Ltd. (a)(b) | 58,300 | 172,739 |
| 726,743 | ||
| TOTAL CONSUMER DISCRETIONARY | 830,857 | |
| CONSUMER STAPLES – 2.5% | ||
| Food & Staples Retailing – 2.5% | ||
| Shop Apotheke Europe N.V. (a)(b) | 1,464 | 129,820 |
| Zur Rose Group AG (a) | 1,304 | 97,594 |
| TOTAL CONSUMER STAPLES | 227,414 | |
| HEALTH CARE – 87.1% | ||
| Biotechnology – 1.1% | ||
| Zealand Pharma A/S (a) | 8,081 | 105,424 |
| Health Care Equipment & Supplies – 40.7% | ||
| Axonics, Inc. (a) | 3,371 | 191,035 |
| Cochlear Ltd. | 1,865 | 254,826 |
| Demant A/S (a) | 5,071 | 189,841 |
| DexCom, Inc. (a) | 5,386 | 401,419 |
| Fisher & Paykel Healthcare Corp. Ltd. | 19,878 | 246,936 |
| Inogen, Inc. (a) | 4,139 | 100,081 |
| Insulet Corp. (a) | 1,545 | 336,717 |
| Integra LifeSciences Holdings Corp. (a) | 3,600 | 194,508 |
| Intuitive Surgical, Inc. (a) | 1,936 | 388,575 |
| iRhythm Technologies, Inc. (a) | 1,521 | 164,314 |
| Natus Medical, Inc. (a) | 4,261 | 139,633 |
| Nevro Corp. (a) | 3,339 | 146,348 |
| ResMed, Inc. | 2,002 | 419,679 |
| Senseonics Holdings, Inc. (a) | 89,702 | 92,393 |
| Sonova Holding AG | 1,018 | 323,259 |
| Tandem Diabetes Care, Inc. (a) | 3,255 | 192,663 |
| 3,782,227 | ||
| Health Care Providers & Services – 9.7% | ||
| Apollo Medical Holdings, Inc. (a) | 3,982 | 153,665 |
| Cigna Corp. | 753 | 198,431 |
| CorVel Corp. (a) | 1,006 | 148,154 |
| Premier, Inc. Class A | 5,939 | 211,903 |
| R1 RCM, Inc. (a) | 8,773 | 183,882 |
| 896,035 | ||
| | ||
| Shares | Value | |
| Health Care Technology – 35.6% | ||
| Allscripts Healthcare Solutions, Inc. (a) | 10,010 | $ 148,448 |
| American Well Corp. Class A (a) | 31,802 | 137,385 |
| Change Healthcare, Inc. (a) | 10,280 | 237,057 |
| CompuGroup Medical SE & Co. KgaA | 2,771 | 117,732 |
| Computer Programs & Systems, Inc. (a) | 3,206 | 102,496 |
| Definitive Healthcare Corp. (a) | 5,446 | 124,877 |
| Doximity, Inc. Class A (a) | 5,397 | 187,924 |
| Evolent Health, Inc. Class A (a) | 5,974 | 183,462 |
| Health Catalyst, Inc. (a) | 8,170 | 118,383 |
| Inspire Medical Systems, Inc. (a) | 1,249 | 228,155 |
| JMDC, Inc. | 3,400 | 147,908 |
| Multiplan Corp. (a) | 28,262 | 155,158 |
| NextGen Healthcare, Inc. (a) | 7,385 | 128,794 |
| OptimizeRx Corp. (a) | 3,961 | 108,492 |
| Phreesia, Inc. (a) | 7,031 | 175,845 |
| Pro Medicus Ltd. | 5,102 | 148,229 |
| Sectra AB | 11,343 | 152,090 |
| Sharecare, Inc. (a) | 41,261 | 65,192 |
| Teladoc Health, Inc. (a) | 6,709 | 222,806 |
| Veeva Systems, Inc. Class A (a) | 2,094 | 414,696 |
| 3,305,129 | ||
| TOTAL HEALTH CARE | 8,088,815 | |
| INFORMATION TECHNOLOGY – 1.4% | ||
| Software – 1.4% | ||
| Model N, Inc. (a) | 5,057 | 129,358 |
| TOTAL COMMON STOCKS (Cost $12,400,347) | 9,276,444 | |
| TOTAL INVESTMENT IN SECURITIES – 99.9% (Cost $12,400,347) | 9,276,444 | |
| NET OTHER ASSETS (LIABILITIES) – 0.1% | 12,244 | |
| NET ASSETS – 100.0% | $ 9,288,688 | |
| Legend | ||
| (a) | Non-income producing. | |
| (b) | Security is exempt from registration under Rule 144A of the Securities Act of 1933. These securities may be resold in transactions exempt from registration, normally to qualified institutional buyers. At the end of the period, the value of these securities amounted to $622,587 or 6.7% of net assets. | |
| 25 | Annual Report |
| Fund | Value, beginning of period | Purchases | Sales Proceeds | Dividend Income | Realized Gain/Loss | Change in Unrealized appreciation (depreciation) | Value, end of period | % ownership, end of period | ||||||
| Fidelity Cash Central Fund, 1.58% | $— | $957,576 | $957,576 | $20 | $— | $— | $— | 0.0% |
| Description | Total | Level 1 | Level 2 | Level 3 |
| Investments in Securities: | ||||||||
| Equities: | ||||||||
| Consumer Discretionary | $ 830,857 | $ 830,857 | $ — | $ — | ||||
| Consumer Staples | 227,414 | 227,414 | — | — | ||||
| Health Care | 8,088,815 | 8,088,815 | — | — | ||||
| Information Technology | 129,358 | 129,358 | — | — | ||||
| Total Investments in Securities: | $ 9,276,444 | $ 9,276,444 | $ — | $ — |
| United States of America | 71.5% |
| China | 5.3% |
| Switzerland | 4.5% |
| Australia | 4.3% |
| Denmark | 3.2% |
| New Zealand | 2.7% |
| Bermuda | 2.5% |
| Sweden | 1.6% |
| Japan | 1.6% |
| Netherlands | 1.4% |
| Germany | 1.3% |
| 99.9% |
| Annual Report | 26 |
| Common Stocks – 100.0% | ||
| Shares | Value | |
| CONSUMER DISCRETIONARY – 36.9% | ||
| Auto Components – 14.0% | ||
| Aptiv PLC (a) | 14,663 | $ 1,306,033 |
| Faurecia SE (a) | 33,228 | 657,073 |
| Hella GmbH & Co. KGaA | 8,441 | 567,866 |
| Lear Corp. | 7,536 | 948,707 |
| Luminar Technologies, Inc. (a) | 68,284 | 404,924 |
| Valeo S.A. | 40,810 | 786,099 |
| Visteon Corp. (a) | 6,758 | 699,994 |
| 5,370,696 | ||
| Automobiles – 19.0% | ||
| Li Auto, Inc. ADR (a) | 38,308 | 1,467,580 |
| Lucid Group, Inc. (a) | 58,613 | 1,005,799 |
| NIO, Inc. ADR (a) | 81,456 | 1,769,224 |
| Tesla, Inc. (a) | 2,547 | 1,715,201 |
| XPeng, Inc. ADR (a) | 41,665 | 1,322,447 |
| 7,280,251 | ||
| Household Durables – 3.2% | ||
| Garmin Ltd. | 12,390 | 1,217,318 |
| Specialty Retail – 0.7% | ||
| EVgo, Inc. (a) | 46,185 | 277,572 |
| TOTAL CONSUMER DISCRETIONARY | 14,145,837 | |
| INDUSTRIALS – 16.4% | ||
| Commercial Services & Supplies – 0.8% | ||
| Aurora Innovation, Inc. (a) | 155,194 | 296,421 |
| Electrical Equipment – 12.3% | ||
| Ballard Power Systems, Inc. (a) | 85,576 | 539,349 |
| Blink Charging Co. (a) | 27,276 | 450,872 |
| Bloom Energy Corp. Class A (a) | 39,493 | 651,635 |
| ChargePoint Holdings, Inc. (a) | 50,676 | 693,754 |
| Doosan Fuel Cell Co. Ltd. (a) | 18,503 | 428,231 |
| FuelCell Energy, Inc. (a) | 141,212 | 529,545 |
| Plug Power, Inc. (a) | 60,572 | 1,003,678 |
| PowerCell Sweden AB (a) | 30,710 | 406,374 |
| 4,703,438 | ||
| Machinery – 0.8% | ||
| The Lion Electric Co. (a) | 76,445 | 321,833 |
| Road & Rail – 2.5% | ||
| Lyft, Inc. Class A (a) | 50,282 | 667,745 |
| TuSimple Holdings, Inc. (a) | 39,397 | 284,840 |
| 952,585 | ||
| TOTAL INDUSTRIALS | 6,274,277 | |
| INFORMATION TECHNOLOGY – 33.0% | ||
| Electronic Equipment, Instruments & Components – 4.5% | ||
| Aeva Technologies, Inc. (a) | 111,368 | 348,582 |
| Samsung SDI Co. Ltd. | 3,367 | 1,379,578 |
| 1,728,160 | ||
| | ||
| Shares | Value | |
| Semiconductors & Semiconductor Equipment – 28.5% | ||
| Allegro MicroSystems, Inc. (a) | 14,059 | $ 290,881 |
| Ambarella, Inc. (a) | 5,396 | 353,222 |
| CEVA, Inc. (a) | 8,071 | 270,863 |
| indie Semiconductor, Inc. (a) | 31,824 | 181,397 |
| Infineon Technologies AG | 35,167 | 848,912 |
| Intel Corp. | 40,735 | 1,523,896 |
| Lattice Semiconductor Corp. (a) | 11,572 | 561,242 |
| Melexis N.V. | 4,350 | 311,290 |
| NVIDIA Corp. | 10,074 | 1,527,118 |
| NXP Semiconductors N.V. | 6,310 | 934,069 |
| ON Semiconductor Corp. (a) | 15,263 | 767,881 |
| QUALCOMM, Inc. | 12,073 | 1,542,205 |
| SiTime Corp. (a) | 2,133 | 347,743 |
| Skyworks Solutions, Inc. | 7,638 | 707,584 |
| STMicroelectronics N.V. | 23,759 | 744,793 |
| 10,913,096 | ||
| TOTAL INFORMATION TECHNOLOGY | 12,641,256 | |
| MATERIALS – 13.7% | ||
| Chemicals – 9.1% | ||
| Albemarle Corp. | 4,441 | 928,080 |
| Chunbo Co. Ltd. | 2,403 | 385,139 |
| LG Chem Ltd. | 2,451 | 974,057 |
| Livent Corp. (a) | 30,066 | 682,198 |
| SK IE Technology Co. Ltd. (a)(b) | 6,805 | 514,149 |
| 3,483,623 | ||
| Metals & Mining – 4.6% | ||
| Allkem Ltd. (a) | 107,459 | 761,849 |
| Ganfeng Lithium Co. Ltd. (b) | 91,480 | 1,006,671 |
| 1,768,520 | ||
| TOTAL MATERIALS | 5,252,143 | |
| TOTAL COMMON STOCKS (Cost $54,470,352) | 38,313,513 | |
| TOTAL INVESTMENT IN SECURITIES – 100.0% (Cost $54,470,352) | 38,313,513 | |
| NET OTHER ASSETS (LIABILITIES) – 0.0% | 4,290 | |
| NET ASSETS – 100.0% | $ 38,317,803 | |
| Legend | ||
| (a) | Non-income producing. | |
| (b) | Security is exempt from registration under Rule 144A of the Securities Act of 1933. These securities may be resold in transactions exempt from registration, normally to qualified institutional buyers. At the end of the period, the value of these securities amounted to $1,520,820 or 4.0% of net assets. | |
| 27 | Annual Report |
| Fund | Value, beginning of period | Purchases | Sales Proceeds | Dividend Income | Realized Gain/Loss | Change in Unrealized appreciation (depreciation) | Value, end of period | % ownership, end of period | ||||||
| Fidelity Cash Central Fund, 1.58% | $— | $5,793,539 | $5,793,539 | $82 | $— | $— | $— | 0.0% |
| Description | Total | Level 1 | Level 2 | Level 3 |
| Investments in Securities: | ||||||||
| Equities: | ||||||||
| Consumer Discretionary | $ 14,145,837 | $ 14,145,837 | $ — | $ — | ||||
| Industrials | 6,274,277 | 6,274,277 | — | — | ||||
| Information Technology | 12,641,256 | 12,641,256 | — | — | ||||
| Materials | 5,252,143 | 5,252,143 | — | — | ||||
| Total Investments in Securities: | $ 38,313,513 | $ 38,313,513 | $ — | $ — |
| United States of America | 51.3% |
| Cayman Islands | 11.9% |
| South Korea | 9.6% |
| Switzerland | 5.1% |
| France | 3.8% |
| Germany | 3.7% |
| United Kingdom | 3.4% |
| China | 2.6% |
| Netherlands | 2.4% |
| Canada | 2.3% |
| Australia | 2.0% |
| Sweden | 1.1% |
| Others (Individually Less Than 1%) | 0.8% |
| 100.0% |
| Annual Report | 28 |
| Common Stocks – 99.7% | ||
| Shares | Value | |
| COMMUNICATION SERVICES – 64.2% | ||
| Entertainment – 41.0% | ||
| Bilibili, Inc. ADR (a) | 9,346 | $ 239,258 |
| Capcom Co. Ltd. | 7,700 | 186,754 |
| Com2uSCorp | 1,574 | 86,919 |
| Electronic Arts, Inc. | 3,181 | 386,969 |
| Embracer Group AB (a) | 26,407 | 200,976 |
| GungHo Online Entertainment, Inc. | 6,800 | 119,878 |
| iDreamSky Technology Holdings Ltd. (a) | 149,600 | 110,575 |
| Kakao Games Corp. (a) | 3,412 | 129,159 |
| Koei Tecmo Holdings Co. Ltd. | 4,800 | 154,753 |
| Konami Holdings Corp. | 3,600 | 199,006 |
| NCSoft Corp. | 651 | 175,234 |
| Neowiz (a) | 4,515 | 80,327 |
| NetEase, Inc. ADR | 4,283 | 399,861 |
| Netmarble Corp. | 2,416 | 128,206 |
| Nexon Co. Ltd. | 12,200 | 249,469 |
| Nintendo Co. Ltd. | 1,100 | 475,124 |
| Pearl Abyss Corp. (a) | 3,316 | 130,505 |
| Square Enix Holdings Co. Ltd. | 4,300 | 190,225 |
| Take-Two Interactive Software, Inc. (a) | 2,792 | 342,104 |
| Ubisoft Entertainment S.A. (a) | 4,317 | 189,103 |
| Wemade Co. Ltd. | 2,165 | 96,211 |
| XD, Inc. (a) | 39,600 | 103,202 |
| 4,373,818 | ||
| Interactive Media & Services – 23.2% | ||
| Alphabet, Inc. Class A (a) | 232 | 505,589 |
| Bumble, Inc. Class A (a) | 5,515 | 155,247 |
| Gree, Inc. | 14,800 | 89,766 |
| Meta Platforms, Inc. Class A (a) | 2,743 | 442,309 |
| NAVER Corp. | 1,844 | 340,850 |
| Snap, Inc. Class A (a) | 22,361 | 293,600 |
| Sohu.com Ltd. ADR (a) | 6,758 | 111,980 |
| Tencent Holdings Ltd. | 11,800 | 532,936 |
| 2,472,277 | ||
| TOTAL COMMUNICATION SERVICES | 6,846,095 | |
| CONSUMER DISCRETIONARY – 0.7% | ||
| Leisure Products – 0.7% | ||
| GOLFZON Co. Ltd. | 758 | 78,462 |
| | ||
| Shares | Value | |
| INDUSTRIALS – 1.4% | ||
| Aerospace & Defense – 1.4% | ||
| Maxar Technologies, Inc. | 5,632 | $ 146,939 |
| INFORMATION TECHNOLOGY – 33.4% | ||
| IT Services – 3.9% | ||
| GDS Holdings Ltd. ADR (a) | 6,835 | 228,221 |
| NEXTDC Ltd. (a) | 25,627 | 187,502 |
| 415,723 | ||
| Semiconductors & Semiconductor Equipment – 5.8% | ||
| Cirrus Logic, Inc. (a) | 2,644 | 191,796 |
| NVIDIA Corp. | 2,784 | 422,026 |
| 613,822 | ||
| Software – 17.9% | ||
| Adobe, Inc. (a) | 1,236 | 452,450 |
| Agora, Inc. ADR (a) | 15,754 | 103,504 |
| AVEVA Group PLC | 7,159 | 195,708 |
| Bentley Systems, Inc. | 6,917 | 230,336 |
| Dassault Systemes SE | 9,620 | 353,160 |
| Matterport, Inc. (a) | 23,225 | 85,003 |
| PTC, Inc. (a) | 2,563 | 272,549 |
| Unity Software, Inc. (a) | 5,777 | 212,709 |
| 1,905,419 | ||
| Technology Hardware, Storage & Peripherals – 5.8% | ||
| Apple, Inc. | 3,607 | 493,149 |
| Super Micro Computer, Inc. (a) | 3,208 | 129,443 |
| 622,592 | ||
| TOTAL INFORMATION TECHNOLOGY | 3,557,556 | |
| TOTAL COMMON STOCKS (Cost $11,916,420) | 10,629,052 | |
| TOTAL INVESTMENT IN SECURITIES – 99.7% (Cost $11,916,420) | 10,629,052 | |
| NET OTHER ASSETS (LIABILITIES) – 0.3% | 28,923 | |
| NET ASSETS – 100.0% | $ 10,657,975 | |
| Legend | ||
| (a) | Non-income producing. | |
| Futures Contracts | |||||
| Number of contracts | Expiration Date | Notional Amount | Value | Unrealized Appreciation/ (Depreciation) | |
| Purchased | |||||
| Equity Index Contract | |||||
| CME E-mini Nasdaq-100 Index Contracts (United States) | 1 | September 2022 | $23,059 | $(323) | $(323) |
| 29 | Annual Report |
| Fund | Value, beginning of period | Purchases | Sales Proceeds | Dividend Income | Realized Gain/Loss | Change in Unrealized appreciation (depreciation) | Value, end of period | % ownership, end of period | ||||||
| Fidelity Cash Central Fund, 1.58% | $— | $887,764 | $887,764 | $17 | $— | $— | $— | 0.0% |
| Description | Total | Level 1 | Level 2 | Level 3 |
| Investments in Securities: | ||||||||
| Equities: | ||||||||
| Communication Services | $ 6,846,095 | $ 6,846,095 | $ — | $ — | ||||
| Consumer Discretionary | 78,462 | 78,462 | — | — | ||||
| Industrials | 146,939 | 146,939 | — | — | ||||
| Information Technology | 3,557,556 | 3,557,556 | — | — | ||||
| Total Investments in Securities: | $ 10,629,052 | $ 10,629,052 | $ — | $ — |
| Derivative Instruments: | ||||||||
| Liabilities | ||||||||
| Futures Contracts | $ (323) | $ (323) | $ — | $ — | ||||
| Total Liabilities | $ (323) | $ (323) | — | $ — | ||||
| Total Derivative Instruments: | $ (323) | $ (323) | $ — | $ — |
| Primary Risk/ Derivative Type | Value | ||
| Asset | Liabilities | ||
| Equity Risk | |||
| Futures Contracts(a) | $0 | $(323) | |
| Total Equity Risk | 0 | (323) | |
| Total Value of Derivatives | $0 | $(323) | |
| (a) | Reflects gross cumulative appreciation (depreciation) on futures contracts as presented in the Schedule of Investments. In the Statement of Assets and Liabilities, the period end daily variation margin is included in receivable or payable for daily variation margin on futures contracts, and the net cumulative appreciation (depreciation) is included in total accumulated earnings (loss). |
| United States of America | 44.9% |
| Japan | 15.6% |
| South Korea | 11.7% |
| Cayman Islands | 9.7% |
| China | 7.4% |
| France | 5.1% |
| Sweden | 1.9% |
| United Kingdom | 1.8% |
| Australia | 1.8% |
| 99.9% |
| Annual Report | 30 |
| Fidelity Clean Energy ETF | Fidelity Cloud Computing ETF | Fidelity Crypto Industry And Digital Payments ETF | Fidelity Digital Health ETF | ||||
| Assets | |||||||
| Investments in securities, at value – See accompanying schedule: | $ 28,217,268 | $ 18,280,383 | $ 12,988,617 | $ 9,276,444 | |||
| Segregated cash with brokers for derivative instruments | — | — | — | — | |||
| Cash | — | 3,422 | 8,060 | 23,946 | |||
| Foreign currency held at value (cost $49,283, $4,225, $11,933 and $3,809, respectively) | 49,055 | 4,225 | 11,774 | 3,809 | |||
| Dividends receivable | 35,901 | 11,045 | 4 | 4,058 | |||
| Total assets | 28,302,224 | 18,299,075 | 13,008,455 | 9,308,257 | |||
| Liabilities | |||||||
| Payable to custodian bank | 5,130 | — | — | — | |||
| Payable for investments purchased | — | — | — | 16,550 | |||
| Accrued management fees | 9,383 | 6,146 | 3,891 | 3,019 | |||
| Payable for daily variation margin on futures contracts | — | — | — | — | |||
| Total liabilities | 14,513 | 6,146 | 3,891 | 19,569 | |||
| Net Assets | $28,287,711 | $ 18,292,929 | $13,004,564 | $ 9,288,688 | |||
| Net Assets consist of: | |||||||
| Paid in capital | $33,771,416 | $ 28,492,431 | $18,798,529 | $12,749,375 | |||
| Total accumulated earnings (loss) | (5,483,705) | (10,199,502) | (5,793,965) | (3,460,687) | |||
| Net Assets | $28,287,711 | $ 18,292,929 | $13,004,564 | $ 9,288,688 | |||
| Shares outstanding | 1,350,000 | 1,150,000 | 1,050,000 | 500,000 | |||
| Net Asset Value per share | $ 20.95 | $ 15.91 | $ 12.39 | $ 18.58 | |||
| Investments at cost | $32,687,958 | $ 27,094,233 | $17,898,535 | $12,400,347 |
| Annual Report | 32 |
| Fidelity Electric Vehicles and Future Transportation ETF | Fidelity Metaverse ETF | ||
| Assets | |||
| Investments in securities, at value – See accompanying schedule: | $ 38,313,513 | $ 10,629,052 | |
| Segregated cash with brokers for derivative instruments | — | 1,500 | |
| Cash | 4,574 | 11,655 | |
| Foreign currency held at value (cost $894 and $17,972, respectively) | 891 | 17,917 | |
| Dividends receivable | 11,759 | 1,698 | |
| Total assets | 38,330,737 | 10,661,822 | |
| Liabilities | |||
| Payable to custodian bank | — | — | |
| Payable for investments purchased | — | — | |
| Accrued management fees | 12,934 | 3,523 | |
| Payable for daily variation margin on futures contracts | — | 324 | |
| Total liabilities | 12,934 | 3,847 | |
| Net Assets | $ 38,317,803 | $10,657,975 | |
| Net Assets consist of: | |||
| Paid in capital | $ 58,749,473 | $12,126,705 | |
| Total accumulated earnings (loss) | (20,431,670) | (1,468,730) | |
| Net Assets | $ 38,317,803 | $10,657,975 | |
| Shares outstanding | 2,150,000 | 500,000 | |
| Net Asset Value per share | $ 17.82 | $ 21.32 | |
| Investments at cost | $ 54,470,352 | $11,916,420 |
| 33 | Annual Report |
| Fidelity Clean Energy ETFA | Fidelity Cloud Computing ETFA | Fidelity Crypto Industry And Digital Payments ETFB | Fidelity Digital Health ETFA | ||||
| Investment Income | |||||||
| Dividends | $ 232,965 | $ 109,553 | $ 1,865 | $ 25,014 | |||
| Income from Fidelity Central Funds | 58 | 47 | 5 | 20 | |||
| Income before foreign taxes withheld | 233,023 | 109,600 | 1,870 | 25,034 | |||
| Less foreign taxes withheld | (26,220) | — | — | — | |||
| Total income | 206,803 | 109,600 | 1,870 | 25,034 | |||
| Expenses | |||||||
| Management fees | 62,493 | 53,568 | 7,004 | 28,338 | |||
| Independent trustees' fees and expenses | 40 | 36 | 3 | 18 | |||
| Total expenses | 62,533 | 53,604 | 7,007 | 28,356 | |||
| Net investment income (loss) | 144,270 | 55,996 | (5,137) | (3,322) | |||
| Realized and Unrealized Gain (Loss) | |||||||
| Net realized gain (loss) on investment securities | (1,004,586) | (1,398,624) | (883,889) | (367,518) | |||
| Net realized gain (loss) on In-kind redemptions | — | (134,569) | — | (117,080) | |||
| Net realized gain (loss) on futures contracts | — | 1,460 | — | — | |||
| Net realized gain (loss) on foreign currency transactions | (7,913) | 69 | (328) | (822) | |||
| Total net realized gain (loss) | (1,012,499) | (1,531,664) | (884,217) | (485,420) | |||
| Change in net unrealized appreciation (depreciation) on investment securities | (4,470,690) | (8,813,850) | (4,909,918) | (3,123,903) | |||
| Change in net unrealized appreciation (depreciation) on futures contracts | — | — | — | — | |||
| Change in net unrealized appreciation (depreciation) on assets and liabilities in foreign currencies | (416) | (33) | (159) | (38) | |||
| Total change in net unrealized appreciation (depreciation) | (4,471,106) | (8,813,883) | (4,910,077) | (3,123,941) | |||
| Net gain (loss) | (5,483,605) | (10,345,547) | (5,794,294) | (3,609,361) | |||
| Net increase (decrease) in net assets resulting from operations | $(5,339,335) | $(10,289,551) | $(5,799,431) | $(3,612,683) |
| A | For the period October 5, 2021 (commencement of operations) through June 30, 2022. |
| B | For the period April 19, 2022 (commencement of operations) through June 30, 2022. |
| Annual Report | 34 |
| Fidelity Electric Vehicles and Future Transportation ETFA | Fidelity Metaverse ETFB | ||
| Investment Income | |||
| Dividends | $ 187,440 | $ 7,246 | |
| Income from Fidelity Central Funds | 82 | 17 | |
| Income before foreign taxes withheld | 187,522 | 7,263 | |
| Less foreign taxes withheld | (12,648) | — | |
| Total income | 174,874 | 7,263 | |
| Expenses | |||
| Management fees | 107,019 | 7,046 | |
| Independent trustees' fees and expenses | 71 | 3 | |
| Total expenses | 107,090 | 7,049 | |
| Net investment income (loss) | 67,784 | 214 | |
| Realized and Unrealized Gain (Loss) | |||
| Net realized gain (loss) on investment securities | (4,277,874) | (180,819) | |
| Net realized gain (loss) on In-kind redemptions | 495,282 | 57,726 | |
| Net realized gain (loss) on futures contracts | — | — | |
| Net realized gain (loss) on foreign currency transactions | (307) | (387) | |
| Total net realized gain (loss) | (3,782,899) | (123,480) | |
| Change in net unrealized appreciation (depreciation) on investment securities | (16,156,839) | (1,287,368) | |
| Change in net unrealized appreciation (depreciation) on futures contracts | — | (323) | |
| Change in net unrealized appreciation (depreciation) on assets and liabilities in foreign currencies | (84) | (47) | |
| Total change in net unrealized appreciation (depreciation) | (16,156,923) | (1,287,738) | |
| Net gain (loss) | (19,939,822) | (1,411,218) | |
| Net increase (decrease) in net assets resulting from operations | $(19,872,038) | $(1,411,004) |
| A | For the period October 5, 2021 (commencement of operations) through June 30, 2022. |
| B | For the period April 19, 2022 (commencement of operations) through June 30, 2022. |
| 35 | Annual Report |
| Fidelity Clean Energy ETF | Fidelity Cloud Computing ETF | Fidelity Crypto Industry And Digital Payments ETF | Fidelity Digital Health ETF | ||||
| Year ended June 30, 2022A | Year ended June 30, 2022A | Year ended June 30, 2022B | Year ended June 30, 2022A | ||||
| Increase (Decrease) in Net Assets | |||||||
| Operations | |||||||
| Net investment income (loss) | $ 144,270 | $ 55,996 | $ (5,137) | $ (3,322) | |||
| Net realized gain (loss) | (1,012,499) | (1,531,664) | (884,217) | (485,420) | |||
| Change in net unrealized appreciation (depreciation) | (4,471,106) | (8,813,883) | (4,910,077) | (3,123,941) | |||
| Net increase (decrease) in net assets resulting from operations | (5,339,335) | (10,289,551) | (5,799,431) | (3,612,683) | |||
| Distributions to shareholders | (145,750) | (57,350) | — | — | |||
| Share transactions | |||||||
| Proceeds from sales of shares | 33,772,796 | 29,456,208 | 18,803,995 | 13,779,066 | |||
| Cost of shares redeemed | — | (816,378) | — | (877,695) | |||
| Net increase (decrease) in net assets resulting from share transactions | 33,772,796 | 28,639,830 | 18,803,995 | 12,901,371 | |||
| Total increase (decrease) in net assets | 28,287,711 | 18,292,929 | 13,004,564 | 9,288,688 | |||
| Net Assets | |||||||
| Beginning of period | — | — | — | — | |||
| End of period | $28,287,711 | $ 18,292,929 | $13,004,564 | $ 9,288,688 | |||
| Other Information | |||||||
| Shares | |||||||
| Sold | 1,350,000 | 1,200,000 | 1,050,000 | 550,000 | |||
| Redeemed | — | (50,000) | — | (50,000) | |||
| Net increase (decrease) | 1,350,000 | 1,150,000 | 1,050,000 | 500,000 |
| A | For the period October 5, 2021 (commencement of operations) through June 30, 2022. |
| B | For the period April 19, 2022 (commencement of operations) through June 30, 2022. |
| Annual Report | 36 |
| Fidelity Electric Vehicles and Future Transportation ETF | Fidelity Metaverse ETF | ||
| Year ended June 30, 2022A | Year ended June 30, 2022B | ||
| Increase (Decrease) in Net Assets | |||
| Operations | |||
| Net investment income (loss) | $ 67,784 | $ 214 | |
| Net realized gain (loss) | (3,782,899) | (123,480) | |
| Change in net unrealized appreciation (depreciation) | (16,156,923) | (1,287,738) | |
| Net increase (decrease) in net assets resulting from operations | (19,872,038) | (1,411,004) | |
| Distributions to shareholders | (64,350) | — | |
| Share transactions | |||
| Proceeds from sales of shares | 62,232,758 | 13,140,454 | |
| Cost of shares redeemed | (3,978,567) | (1,071,475) | |
| Net increase (decrease) in net assets resulting from share transactions | 58,254,191 | 12,068,979 | |
| Total increase (decrease) in net assets | 38,317,803 | 10,657,975 | |
| Net Assets | |||
| Beginning of period | — | — | |
| End of period | $ 38,317,803 | $10,657,975 | |
| Other Information | |||
| Shares | |||
| Sold | 2,300,000 | 550,000 | |
| Redeemed | (150,000) | (50,000) | |
| Net increase (decrease) | 2,150,000 | 500,000 |
| A | For the period October 5, 2021 (commencement of operations) through June 30, 2022. |
| B | For the period April 19, 2022 (commencement of operations) through June 30, 2022. |
| 37 | Annual Report |
| Fidelity Clean Energy ETF | |
| Year ended June 30, 2022A | |
| Selected Per-Share Data | |
| Net asset value, beginning of period | $ 25.12 |
| Income from Investment Operations | |
| Net investment income (loss)B | 0.15 |
| Net realized and unrealized gain (loss) | (4.20) |
| Total from investment operations | (4.05) |
| Distributions from net investment income | (0.12) |
| Total distributions | (0.12) |
| Net asset value, end of period | $ 20.95 |
| Total ReturnC,D | (16.12)% |
| Ratios to Average Net AssetsE,F | |
| Expenses before reductions | .39% |
| Expenses net of fee waivers, if any | .39% |
| Expenses net of all reductions | .39% |
| Net investment income (loss) | .90% |
| Supplemental Data | |
| Net assets, end of period (000 omitted) | $28,288 |
| Portfolio turnover rateG,H,I | 30% |
| A | For the period October 5, 2021 (commencement of operations) through June 30, 2022. |
| B | Calculated based on average shares outstanding during the period. |
| C | Based on net asset value. |
| D | Total returns for periods of less than one year are not annualized. |
| E | Annualized. |
| F | Expense ratios reflect operating expenses of the class. Expenses before reductions do not reflect amounts reimbursed, waived, or reduced through arrangements with the investment adviser, brokerage services, or other offset arrangements, if applicable, and do not represent the amount paid by the class during periods when reimbursements, waivers or reductions occur. |
| G | Amount does not include the portfolio activity of any underlying mutual funds or exchange-traded funds (ETFs). |
| H | Amount not annualized. |
| I | Portfolio turnover rate excludes securities received or delivered in-kind. |
| Annual Report | 38 |
| Fidelity Cloud Computing ETF | |
| Year ended June 30, 2022A | |
| Selected Per-Share Data | |
| Net asset value, beginning of period | $ 25.20 |
| Income from Investment Operations | |
| Net investment income (loss)B | 0.06 |
| Net realized and unrealized gain (loss) | (9.29) |
| Total from investment operations | (9.23) |
| Distributions from net investment income | (0.06) |
| Total distributions | (0.06) |
| Net asset value, end of period | $ 15.91 |
| Total ReturnC,D | (36.69)% |
| Ratios to Average Net AssetsE,F | |
| Expenses before reductions | .39% |
| Expenses net of fee waivers, if any | .39% |
| Expenses net of all reductions | .39% |
| Net investment income (loss) | .41% |
| Supplemental Data | |
| Net assets, end of period (000 omitted) | $18,293 |
| Portfolio turnover rateG,H,I | 31% |
| A | For the period October 5, 2021 (commencement of operations) through June 30, 2022. |
| B | Calculated based on average shares outstanding during the period. |
| C | Based on net asset value. |
| D | Total returns for periods of less than one year are not annualized. |
| E | Annualized. |
| F | Expense ratios reflect operating expenses of the class. Expenses before reductions do not reflect amounts reimbursed, waived, or reduced through arrangements with the investment adviser, brokerage services, or other offset arrangements, if applicable, and do not represent the amount paid by the class during periods when reimbursements, waivers or reductions occur. |
| G | Amount does not include the portfolio activity of any underlying mutual funds or exchange-traded funds (ETFs). |
| H | Amount not annualized. |
| I | Portfolio turnover rate excludes securities received or delivered in-kind. |
| 39 | Annual Report |
| Fidelity Crypto Industry And Digital Payments ETF | |
| Year ended June 30, 2022A | |
| Selected Per-Share Data | |
| Net asset value, beginning of period | $ 25.76 |
| Income from Investment Operations | |
| Net investment income (loss)B | (0.01) |
| Net realized and unrealized gain (loss) | (13.36) |
| Total from investment operations | (13.37) |
| Net asset value, end of period | $ 12.39 |
| Total ReturnC,D | (51.92)% |
| Ratios to Average Net AssetsE,F | |
| Expenses before reductions | .39% |
| Expenses net of fee waivers, if any | .39% |
| Expenses net of all reductions | .39% |
| Net investment income (loss) | (.29)% |
| Supplemental Data | |
| Net assets, end of period (000 omitted) | $13,005 |
| Portfolio turnover rateG,H,I | 28% |
| A | For the period April 19, 2022 (commencement of operations) through June 30, 2022. |
| B | Calculated based on average shares outstanding during the period. |
| C | Based on net asset value. |
| D | Total returns for periods of less than one year are not annualized. |
| E | Annualized. |
| F | Expense ratios reflect operating expenses of the class. Expenses before reductions do not reflect amounts reimbursed, waived, or reduced through arrangements with the investment adviser, brokerage services, or other offset arrangements, if applicable, and do not represent the amount paid by the class during periods when reimbursements, waivers or reductions occur. |
| G | Amount does not include the portfolio activity of any underlying mutual funds or exchange-traded funds (ETFs). |
| H | Amount not annualized. |
| I | Portfolio turnover rate excludes securities received or delivered in-kind. |
| Annual Report | 40 |
| Fidelity Digital Health ETF | |
| Year ended June 30, 2022A | |
| Selected Per-Share Data | |
| Net asset value, beginning of period | $ 25.10 |
| Income from Investment Operations | |
| Net investment income (loss)B | (0.01) |
| Net realized and unrealized gain (loss) | (6.51) |
| Total from investment operations | (6.52) |
| Net asset value, end of period | $ 18.58 |
| Total ReturnC,D | (25.99)% |
| Ratios to Average Net AssetsE,F | |
| Expenses before reductions | .39% |
| Expenses net of fee waivers, if any | .39% |
| Expenses net of all reductions | .39% |
| Net investment income (loss) | (.05)% |
| Supplemental Data | |
| Net assets, end of period (000 omitted) | $ 9,289 |
| Portfolio turnover rateG,H,I | 48% |
| A | For the period October 5, 2021 (commencement of operations) through June 30, 2022. |
| B | Calculated based on average shares outstanding during the period. |
| C | Based on net asset value. |
| D | Total returns for periods of less than one year are not annualized. |
| E | Annualized. |
| F | Expense ratios reflect operating expenses of the class. Expenses before reductions do not reflect amounts reimbursed, waived, or reduced through arrangements with the investment adviser, brokerage services, or other offset arrangements, if applicable, and do not represent the amount paid by the class during periods when reimbursements, waivers or reductions occur. |
| G | Amount does not include the portfolio activity of any underlying mutual funds or exchange-traded funds (ETFs). |
| H | Amount not annualized. |
| I | Portfolio turnover rate excludes securities received or delivered in-kind. |
| 41 | Annual Report |
| Fidelity Electric Vehicles and Future Transportation ETF | |
| Year ended June 30, 2022A | |
| Selected Per-Share Data | |
| Net asset value, beginning of period | $ 25.20 |
| Income from Investment Operations | |
| Net investment income (loss)B | 0.04 |
| Net realized and unrealized gain (loss) | (7.39) |
| Total from investment operations | (7.35) |
| Distributions from net investment income | (0.03) |
| Total distributions | (0.03) |
| Net asset value, end of period | $ 17.82 |
| Total ReturnC,D | (29.15)% |
| Ratios to Average Net AssetsE,F | |
| Expenses before reductions | .39% |
| Expenses net of fee waivers, if any | .39% |
| Expenses net of all reductions | .39% |
| Net investment income (loss) | .25% |
| Supplemental Data | |
| Net assets, end of period (000 omitted) | $38,318 |
| Portfolio turnover rateG,H,I | 31% |
| A | For the period October 5, 2021 (commencement of operations) through June 30, 2022. |
| B | Calculated based on average shares outstanding during the period. |
| C | Based on net asset value. |
| D | Total returns for periods of less than one year are not annualized. |
| E | Annualized. |
| F | Expense ratios reflect operating expenses of the class. Expenses before reductions do not reflect amounts reimbursed, waived, or reduced through arrangements with the investment adviser, brokerage services, or other offset arrangements, if applicable, and do not represent the amount paid by the class during periods when reimbursements, waivers or reductions occur. |
| G | Amount does not include the portfolio activity of any underlying mutual funds or exchange-traded funds (ETFs). |
| H | Amount not annualized. |
| I | Portfolio turnover rate excludes securities received or delivered in-kind. |
| Annual Report | 42 |
| Fidelity Metaverse ETF | |
| Year ended June 30, 2022A | |
| Selected Per-Share Data | |
| Net asset value, beginning of period | $ 25.28 |
| Income from Investment Operations | |
| Net investment income (loss)B | — C |
| Net realized and unrealized gain (loss) | (3.96) |
| Total from investment operations | (3.96) |
| Net asset value, end of period | $ 21.32 |
| Total ReturnD,E | (15.67)% |
| Ratios to Average Net AssetsF,G | |
| Expenses before reductions | .39% |
| Expenses net of fee waivers, if any | .39% |
| Expenses net of all reductions | .39% |
| Net investment income (loss) | .01% |
| Supplemental Data | |
| Net assets, end of period (000 omitted) | $10,658 |
| Portfolio turnover rateH,I,J | 8% |
| A | For the period April 19, 2022 (commencement of operations) through June 30, 2022. |
| B | Calculated based on average shares outstanding during the period. |
| C | Amount represents less than $0.005 per share. |
| D | Based on net asset value. |
| E | Total returns for periods of less than one year are not annualized. |
| F | Annualized. |
| G | Expense ratios reflect operating expenses of the class. Expenses before reductions do not reflect amounts reimbursed, waived, or reduced through arrangements with the investment adviser, brokerage services, or other offset arrangements, if applicable, and do not represent the amount paid by the class during periods when reimbursements, waivers or reductions occur. |
| H | Amount does not include the portfolio activity of any underlying mutual funds or exchange-traded funds (ETFs). |
| I | Amount not annualized. |
| J | Portfolio turnover rate excludes securities received or delivered in-kind. |
| 43 | Annual Report |
For the year ended June 30, 2022
| Fidelity Central Fund | Investment Manager | Investment Objective | Investment Practices | Expense Ratio(a) |
| Fidelity Money Market Central Funds | Fidelity Management & Research Company LLC (FMR) | Each fund seeks to obtain a high level of current income consistent with the preservation of capital and liquidity. | Short-term Investments | Less than .005% |
| Annual Report | 44 |
| 45 | Annual Report |
rebated back to a fund. Any such rebates are included in net realized gain (loss) on investments in the Statement of Operations. Dividend income is recorded on the ex-dividend date, except for certain dividends from foreign securities where the ex-dividend date may have passed, which are recorded as soon as the Funds are informed of the ex-dividend date. Non-cash dividends included in dividend income, if any, are recorded at the fair market value of the securities received. Income and capital gain distributions from Fidelity Central Funds, if any, are recorded on the ex-dividend date. Investment income is recorded net of foreign taxes withheld where recovery of such taxes is uncertain. Funds may file withholding tax reclaims in certain jurisdictions to recover a portion of amounts previously withheld. Any withholding tax reclaims income is included in the Statements of Operations in dividends or foreign taxes withheld, as applicable. Any receivables for withholding tax reclaims are included in the Statements of Assets and Liabilities in dividends receivable.
| Tax cost | Gross unrealized appreciation | Gross unrealized depreciation | Net unrealized appreciation (depreciation) | |
| Fidelity Clean Energy ETF | $ 32,756,540 | $ 642,066 | $ (5,181,338) | $ (4,539,272) |
| Fidelity Cloud Computing ETF | 27,472,035 | 83,797 | (9,275,449) | (9,191,652) |
| Fidelity Crypto Industry and Digital Payments ETF | 17,925,296 | 28,710 | (4,965,389) | (4,936,679) |
| Fidelity Digital Health ETF | 12,616,168 | 240,369 | (3,580,093) | (3,339,724) |
| Fidelity Electric Vehicles and Future Transportation ETF | 54,844,213 | 432,167 | (16,962,867) | (16,530,700) |
| Fidelity Metaverse ETF | 11,930,677 | 86,048 | (1,387,673) | (1,301,625) |
| Undistributed ordinary income | Undistributed capital gains | Capital loss carryforward | Net unrealized appreciation (depreciation) | |
| Fidelity Clean Energy ETF | $ — | $ — | $ (936,004) | $ (4,539,688) |
| Fidelity Cloud Computing ETF | — | — | (1,007,817) | (9,191,685) |
| Fidelity Crypto Industry and Digital Payments ETF | — | — | (857,128) | (4,936,837) |
| Fidelity Digital Health ETF | — | — | (118,201) | (3,339,762) |
| Fidelity Electric Vehicles and Future Transportation ETF | 3,598 | — | (3,904,483) | (16,530,782) |
| Fidelity Metaverse ETF | 9,043 | — | (176,101) | (1,301,672) |
| Annual Report | 46 |
Capital loss carryforwards are only available to offset future capital gains of the Funds to the extent provided by regulations and may be limited. The capital loss carryforward information presented below, including any applicable limitation, is estimated as of fiscal period end and is subject to adjustment.
| Short-term | Long-term | Total capital loss carryforward | |
| Fidelity Clean Energy ETF | $ (936,004) | $ — | $ (936,004) |
| Fidelity Cloud Computing ETF | (1,007,817) | — | (1,007,817) |
| Fidelity Crypto Industry and Digital Payments ETF | (857,128) | — | (857,128) |
| Fidelity Digital Health ETF | (118,201) | — | (118,201) |
| Fidelity Electric Vehicles and Future Transportation ETF | (3,904,483) | — | (3,904,483) |
| Fidelity Metaverse ETF | (175,908) | (193) | (176,101) |
| Ordinary Losses | |
| Fidelity Clean Energy ETF | $ (8,013) |
| Fidelity Digital Health ETF | (2,724) |
| June 30, 2022 | ||||
| Ordinary Income | Long-Term Capital Gain | Tax Return Of Capital | Total | |
| Fidelity Clean Energy ETF | $ 145,750 | $ — | $ — | $ 145,750 |
| Fidelity Cloud Computing ETF | 57,350 | — | — | 57,350 |
| Fidelity Crypto Industry and Digital Payments ETF | — | — | — | — |
| Fidelity Digital Health ETF | — | — | — | — |
| Fidelity Electric Vehicles and Future Transportation ETF | 64,350 | — | — | 64,350 |
| Fidelity Metaverse ETF | — | — | — | — |
| 47 | Annual Report |
Investing in derivatives may involve greater risks than investing in the underlying assets directly and, to varying degrees, may involve risk of loss in excess of any initial investment and collateral received and amounts recognized in the Statements of Assets and Liabilities. In addition, there may be the risk that the change in value of the derivative contract does not correspond to the change in value of the underlying instrument.
| Purchases ($) | Sales ($) | |
| Fidelity Clean Energy ETF | 11,564,381 | 6,963,112 |
| Fidelity Cloud Computing ETF | 6,653,048 | 6,257,725 |
| Fidelity Crypto Industry and Digital Payments ETF | 5,970,841 | 2,770,474 |
| Fidelity Digital Health ETF | 5,384,527 | 4,895,472 |
| Fidelity Electric Vehicles and Future Transportation ETF | 19,343,163 | 12,074,416 |
| Fidelity Metaverse ETF | 4,676,940 | 786,060 |
| In-Kind Subscriptions ($) | In-Kind Redemptions ($) | |
| Fidelity Clean Energy ETF | 29,099,140 | — |
| Fidelity Cloud Computing ETF | 29,067,407 | 800,147 |
| Fidelity Crypto Industry and Digital Payments ETF | 15,582,073 | — |
| Fidelity Digital Health ETF | 13,212,928 | 816,644 |
| Fidelity Electric Vehicles and Future Transportation ETF | 55,204,485 | 3,903,794 |
| Fidelity Metaverse ETF | 9,230,014 | 1,081,382 |
| Fee Rate | |
| Fidelity Clean Energy ETF | .39% |
| Fidelity Cloud Computing ETF | .39% |
| Fidelity Crypto Industry and Digital Payments ETF | .39% |
| Fidelity Digital Health ETF | .39% |
| Fidelity Electric Vehicles and Future Transportation ETF | .39% |
| Fidelity Metaverse ETF | .39% |
| Annual Report | 48 |
Interfund Trades. Funds may purchase from or sell securities to other Fidelity Funds under procedures adopted by the Board. The procedures have been designed to ensure these interfund trades are executed in accordance with Rule 17a-7 of the 1940 Act. Any interfund trades are included within the respective purchases and sales amounts shown in the Purchases and Sales of Investments note. During the period there were no interfund trades.
| 49 | Annual Report |
| Annual Report | 50 |
| 51 | Annual Report |
| Annual Report | 52 |
| 53 | Annual Report |
| Annual Report | 54 |
| 55 | Annual Report |
| Annual Report | 56 |
| 57 | Annual Report |
| Annualized Expense RatioA | Beginning Account Value | Ending Account Value June 30, 2022 | Expenses Paid During Period | |
| Fidelity Clean Energy ETF | 0.39% | |||
| Actual | $ 1,000.00 | $ 838.80 | $ 1.78B | |
| Hypothetical C | $ 1,000.00 | $ 1,022.86 | $ 1.96D | |
| Fidelity Cloud Computing ETF | 0.39% | |||
| Actual | $ 1,000.00 | $ 633.10 | $ 1.58B | |
| Hypothetical C | $ 1,000.00 | $ 1,022.86 | $ 1.96D | |
| Fidelity Crypto Industry And Digital Payments ETF | 0.39% | |||
| Actual | $ 1,000.00 | $ 480.80 | $ 0.57B | |
| Hypothetical C | $ 1,000.00 | $ 1,022.86 | $ 1.96D | |
| Fidelity Digital Health ETF | 0.39% | |||
| Actual | $ 1,000.00 | $ 740.10 | $ 1.68B | |
| Hypothetical C | $ 1,000.00 | $ 1,022.86 | $ 1.96D | |
| Fidelity Electric Vehicles and Future Transportation ETF | 0.39% | |||
| Actual | $ 1,000.00 | $ 708.50 | $ 1.65B | |
| Hypothetical C | $ 1,000.00 | $ 1,022.86 | $ 1.96D | |
| Fidelity Metaverse ETF | 0.39% | |||
| Actual | $ 1,000.00 | $ 843.30 | $ 0.71B | |
| Hypothetical C | $ 1,000.00 | $ 1,022.86 | $ 1.96D |
| Annual Report | 58 |
| A | Annualized expense ratio reflects expenses net of applicable fee waivers. |
| B | Actual expenses are equal to the Fund’s annualized expense ratio, multiplied by the average account value over the period, multiplied by 181/365 (to reflect the one-half year period) for Fidelity Clean Energy ETF, Fidelity Cloud Computing ETF, Fidelity Digital Health ETF and Fidelity Electric Vehicles And Future Transportation ETF and multiplied by 72/365 (to reflect the period April 19, 2022 to June 30, 2022) for Fidelity Crypto Industry and Digital Payments ETF and Fidelity Metaverse ETF. |
| C | 5% return per year before expenses. |
| D | Hypothetical expenses are equal to the Fund's annualized expense ratio, multiplied by the average account value over the period, multiplied by 184/365 (to reflect the one-half year period). |
| 59 | Annual Report |
| December 2021 | March 2022 | June 2022 | |
| Fidelity Clean Energy ETF | 53% | 4% | 4% |
| Fidelity Cloud Computing ETF | 99% | 46% | 46% |
| Fidelity Crypto Industry and Digital Payments ETF | — | — | — |
| Fidelity Digital Health ETF | — | — | — |
| Fidelity Electric Vehicles and Future Transportation ETF | 100% | 100% | 100% |
| Fidelity Metaverse ETF | — | — | — |
| December 2021 | March 2022 | June 2022 | |
| Fidelity Clean Energy ETF | 100% | 100% | 100% |
| Fidelity Cloud Computing ETF | 100% | 100% | 100% |
| Fidelity Crypto Industry and Digital Payments ETF | — | — | — |
| Fidelity Digital Health ETF | — | — | — |
| Fidelity Electric Vehicles and Future Transportation ETF | 100% | 100% | 100% |
| Fidelity Metaverse ETF | — | — | — |
| Ex-Date | Income | Taxes | |
| Fidelity Clean Energy ETF | 12/17/2021 | — | — |
| 3/18/2022 | $0.0190 | $0.0030 | |
| 6/17/2022 | $0.1059 | $0.0169 |
| Annual Report | 60 |
| 61 | Annual Report |
| Annual Report | 62 |
| Item 2. | Code of Ethics |
As of the end of the period, June 30, 2022, Fidelity Covington Trust (the trust) has adopted a code of ethics, as defined in Item 2 of Form N-CSR, that applies to its President and Treasurer and its Chief Financial Officer. A copy of the code of ethics is filed as an exhibit to this Form N-CSR.
| Item 3. | Audit Committee Financial Expert |
The Board of Trustees of the trust has determined that Donald F. Donahue is an audit committee financial expert, as defined in Item 3 of Form N-CSR. Mr. Donahue is independent for purposes of Item 3 of Form N-CSR.
| Item 4. | Principal Accountant Fees and Services |
Fees and Services
The following table presents fees billed by Deloitte & Touche LLP, the member firms of Deloitte Touche Tohmatsu, and their respective affiliates (collectively, “Deloitte Entities”) in each of the last two fiscal years for services rendered to Fidelity Clean Energy ETF, Fidelity Cloud Computing ETF, Fidelity Crypto Industry and Digital Payments ETF, Fidelity Digital Health ETF, Fidelity Electric Vehicles and Future Transportation ETF, and Fidelity Metaverse ETF (the “Funds”):
Services Billed by Deloitte Entities
June 30, 2022 FeesA,B
| Audit Fees | Audit- Related Fees | Tax Fees | All Other Fees | |||||||||||||
Fidelity Clean Energy ETF | $ | 11,100 | $ | — | $ | 5,000 | $ | 200 | ||||||||
Fidelity Cloud Computing ETF | $ | 11,100 | $ | — | $ | 5,000 | $ | 200 | ||||||||
Fidelity Crypto Industry and Digital Payments ETF | $ | 8,800 | $ | — | $ | 3,700 | $ | — | ||||||||
Fidelity Digital Health ETF | $ | 11,100 | $ | — | $ | 5,000 | $ | 200 | ||||||||
Fidelity Electric Vehicles and Future Transportation ETF | $ | 11,100 | $ | — | $ | 5,000 | $ | 200 | ||||||||
Fidelity Metaverse ETF | $ | 8,800 | $ | — | $ | 3,700 | $ | — | ||||||||
June 30, 2021 FeesA,B
| Audit Fees | Audit- Related Fees | Tax Fees | All Other Fees | |||||||||||||
Fidelity Clean Energy ETF | $ | — | $ | — | $ | — | $ | — | ||||||||
Fidelity Cloud Computing ETF | $ | — | $ | — | $ | — | $ | — | ||||||||
Fidelity Crypto Industry and Digital Payments ETF | $ | — | $ | — | $ | — | $ | — | ||||||||
Fidelity Digital Health ETF | $ | — | $ | — | $ | — | $ | — | ||||||||
Fidelity Electric Vehicles and Future Transportation ETF | $ | — | $ | — | $ | — | $ | — | ||||||||
Fidelity Metaverse ETF | $ | — | $ | — | $ | — | $ | — | ||||||||
| A | Amounts may reflect rounding. |
| B | Fidelity Clean Energy ETF, Fidelity Cloud Computing ETF, Fidelity Digital Health ETF and Fidelity Electric Vehicles and Future Transportation ETF commenced operations on October 5, 2021. Fidelity Crypto Industry and Digital Payments ETF and Fidelity Metaverse ETF commenced operations on April 19, 2022. |
The following table(s) present(s) fees billed by Deloitte Entities that were required to be approved by the Audit Committee for services that relate directly to the operations and financial reporting of the Fund(s) and that are rendered on behalf of Fidelity Management & Research Company LLC (“FMR”) and entities controlling, controlled by, or under common control with FMR (not including any sub-adviser whose role is primarily portfolio management and is subcontracted with or overseen by another investment adviser) that provide ongoing services to the Fund(s) (“Fund Service Providers”):
Services Billed by Deloitte Entities
| June 30, 2022A,B | June 30, 2021A,B | |||||||
Audit-Related Fees | $ | — | $ | — | ||||
Tax Fees | $ | — | $ | — | ||||
All Other Fees | $ | — | $ | — | ||||
| A | Amounts may reflect rounding. |
| B | May include amounts billed prior to the Fidelity Clean Energy ETF, Fidelity Cloud Computing ETF, Fidelity Crypto Industry and Digital Payments ETF, Fidelity Digital Health ETF, Fidelity Electric Vehicles and Future Transportation ETF, and Fidelity Metaverse ETF’s commencement of operations. |
“Audit-Related Fees” represent fees billed for assurance and related services that are reasonably related to the performance of the fund audit or the review of the fund’s financial statements and that are not reported under Audit Fees.
“Tax Fees” represent fees billed for tax compliance, tax advice or tax planning that relate directly to the operations and financial reporting of the fund.
“All Other Fees” represent fees billed for services provided to the fund or Fund Service Provider, a significant portion of which are assurance related, that relate directly to the operations and financial reporting of the fund, excluding those services that are reported under Audit Fees, Audit-Related Fees or Tax Fees.
Assurance services must be performed by an independent public accountant.
* * *
The aggregate non-audit fees billed by Deloitte Entities for services rendered to the Fund(s), FMR (not including any sub-adviser whose role is primarily portfolio management and is subcontracted with or overseen by another investment adviser), and any Fund Service Provider for each of the last two fiscal years of the Fund(s) are as follows:
Billed By | June 30, 2022A,B | June 30, 2021A,B | ||||||
Deloitte Entities | $ | 485,800 | $ | 521,600 | ||||
| A | Amounts may reflect rounding. |
| B | May include amounts billed prior to the Fidelity Clean Energy ETF, Fidelity Cloud Computing ETF, Fidelity Crypto Industry and Digital Payments ETF, Fidelity Digital Health ETF, Fidelity Electric Vehicles and Future Transportation ETF, and Fidelity Metaverse ETF’s commencement of operations. |
The trust’s Audit Committee has considered non-audit services that were not pre-approved that were provided by Deloitte Entities to Fund Service Providers to be compatible with maintaining the independence of Deloitte Entities in its(their) audit of the Fund(s), taking into account representations from Deloitte Entities, in accordance with Public Company Accounting Oversight Board rules, regarding its independence from the Fund(s) and its(their) related entities and FMR’s review of the appropriateness and permissibility under applicable law of such non-audit services prior to their provision to the Fund(s) Service Providers.
Audit Committee Pre-Approval Policies and Procedures
The trust’s Audit Committee must pre-approve all audit and non-audit services provided by a fund’s independent registered public accounting firm relating to the operations or financial reporting of the fund. Prior to the commencement of any audit or non-audit services to a fund, the Audit Committee reviews the services to determine whether they are appropriate and permissible under applicable law.
The Audit Committee has adopted policies and procedures to, among other purposes, provide a framework for the Committee’s consideration of non-audit services by the audit firms that audit the Fidelity funds. The policies and procedures require that any non-audit service provided by a fund audit firm to a Fidelity fund and any non-audit service provided by a fund auditor to a Fund Service Provider that relates directly to the operations and financial reporting of a Fidelity fund (“Covered Service”) are subject to approval by the Audit Committee before such service is provided.
All Covered Services must be approved in advance of provision of the service either: (i) by formal resolution of the Audit Committee, or (ii) by oral or written approval of the service by the Chair of the Audit Committee (or if the Chair is unavailable, such other member of the Audit Committee as may be designated by the Chair to act in the Chair’s absence). The approval contemplated by (ii) above is permitted where the Treasurer determines that action on such an engagement is necessary before the next meeting of the Audit Committee.
Non-audit services provided by a fund audit firm to a Fund Service Provider that do not relate directly to the operations and financial reporting of a Fidelity fund are reported to the Audit Committee periodically.
Non-Audit Services Approved Pursuant to Rule 2-01(c)(7)(i)(C) and (ii) of Regulation S-X (“De Minimis Exception”)
There were no non-audit services approved or required to be approved by the Audit Committee pursuant to the De Minimis Exception during the Fund’s(s’) last two fiscal years relating to services provided to (i) the Fund(s) or (ii) any Fund Service Provider that relate directly to the operations and financial reporting of the Fund(s).
| Item 5. | Audit Committee of Listed Registrants |
The Audit Committee is a separately-designated standing audit committee in accordance with Section 3(a)(58)(A) of the Securities Exchange Act of 1934. As of June 30, 2022, the members of the Audit Committee were Donald F. Donahue, Thomas P. Bostick, Thomas Kennedy, Garnett A. Smith, and Susan Tomasky.
| Item 6. | Investments |
(a) Not applicable.
(b) Not applicable.
| Item 7. | Disclosure of Proxy Voting Policies and Procedures for Closed-End Management Investment Companies |
Not applicable.
| Item 8. | Portfolio Managers of Closed-End Management Investment Companies |
Not applicable.
| Item 9. | Purchase of Equity Securities by Closed-End Management Investment Company and Affiliated Purchasers |
Not applicable.
| Item 10. | Submission of Matters to a Vote of Security Holders |
There were no material changes to the procedures by which shareholders may recommend nominees to the trust’s Board of Trustees.
| Item 11. | Controls and Procedures |
(a)(i) The President and Treasurer and the Chief Financial Officer have concluded that the trust’s disclosure controls and procedures (as defined in Rule 30a-3(c) under the Investment Company Act) provide reasonable assurances that material information relating to the trust is made known to them by the appropriate persons, based on their evaluation of these controls and procedures as of a date within 90 days of the filing date of this report.
(a)(ii) There was no change in the trust’s internal control over financial reporting (as defined in Rule 30a-3(d) under the Investment Company Act) that occurred during the period covered by this report that has materially affected, or is reasonably likely to materially affect, the trust’s internal control over financial reporting.
| Item 12. | Disclosure of Securities Lending Activities for Closed-End Management Investment Companies |
Not applicable.
| Item 13. | Exhibits |
SIGNATURES
Pursuant to the requirements of the Securities Exchange Act of 1934 and the Investment Company Act of 1940, the registrant has duly caused this report to be signed on its behalf by the undersigned, thereunto duly authorized.
Fidelity Covington Trust
| By: | /s/ Stacie M. Smith | |
| Stacie M. Smith | ||
| President and Treasurer | ||
| Date: | August 19, 2022 | |
Pursuant to the requirements of the Securities Exchange Act of 1934 and the Investment Company Act of 1940, this report has been signed below by the following persons on behalf of the registrant and in the capacities and on the dates indicated.
| By: | /s/ Stacie M. Smith | |
| Stacie M. Smith | ||
| President and Treasurer | ||
| Date: | August 19, 2022 | |
| By: | /s/ John J. Burke III | |
| John J. Burke III | ||
| Chief Financial Officer | ||
| Date: | August 19, 2022 | |