UNITED STATES
SECURITIES AND EXCHANGE COMMISSION
Washington, D.C. 20549
FORM N-CSR
CERTIFIED SHAREHOLDER REPORT OF REGISTERED
MANAGEMENT INVESTMENT COMPANIES
Investment Company Act file number 811-07319
Fidelity Covington Trust
(Exact name of registrant as specified in charter)
245 Summer St., Boston, Massachusetts 02210
(Address of principal executive offices) (Zip code)
Cynthia Lo Bessette, Secretary
245 Summer St.
Boston, Massachusetts 02210
(Name and address of agent for service)
Registrant’s telephone number, including area code: 617-563-7000
Date of fiscal year end: October 31
Date of reporting period: October 31, 2022
| Item 1. | Reports to Stockholders |


| Annual Report | 2 |
| 3 | Annual Report |
| Average Annual Total Returns | Past 1 Year | Life of Fund |
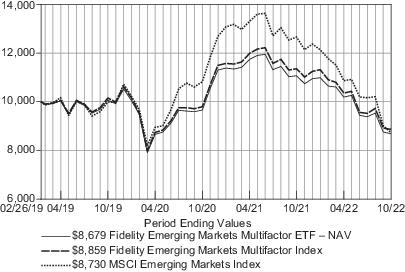
| Fidelity Emerging Markets Multifactor ETF – NAVA | -21.56% | -3.78% |
| Fidelity Emerging Markets Multifactor ETF – Market PriceB | -21.92% | -3.67% |
| Fidelity Emerging Markets Multifactor IndexA | -21.97% | -3.24% |
| MSCI Emerging Markets IndexA | -31.01% | -3.62% |
| B | From February 28, 2019, date initially listed on the CboeBZX exchange. |
| * | Total returns are historical and include changes in share price and reinvestment of dividends and capital gains distributions, if any. |
| Annual Report | 4 |
| 5 | Annual Report |
| % of fund's net assets | |
| Samsung Electronics Co. Ltd. | 3.2 |
| Emaar Properties PJSC | 2.0 |
| Ruentex Development Co. Ltd. | 2.0 |
| CPFL Energia S.A. | 1.6 |
| Kalbe Farma Tbk PT | 1.5 |
| Power Grid Corp. of India Ltd. | 1.5 |
| Alibaba Group Holding Ltd. ADR | 1.4 |
| China Overseas Land & Investment Ltd. | 1.4 |
| GAIL India Ltd. | 1.3 |
| Manila Electric Co. | 1.3 |
| Petroleo Brasileiro S.A. | 1.4 |
| 18.6 |
| % of fund's net assets | ||
| Financials | 19.7 | |
| Information Technology | 14.7 | |
| Consumer Staples | 10.7 | |
| Energy | 10.6 | |
| Health Care | 8.8 | |
| Consumer Discretionary | 8.5 | |
| Utilities | 8.2 | |
| Communication Services | 6.1 | |
| Real Estate | 6.0 | |
| Materials | 4.8 | |
| Industrials | 1.7 | |
| % of funds's net assets | ||
| Stocks and Equity Futures | 100.0% | |
| Net Other Assets (Liabilities) | 0.0% | |
| Annual Report | 6 |
| Average Annual Total Returns | Past 1 Year | Life of Fund |
| Fidelity International High Dividend ETF – NAVA | -15.83% | -3.91% |
| Fidelity International High Dividend ETF – Market PriceB | -16.01% | -4.22% |
| Fidelity International High Dividend IndexA | -15.34% | -3.47% |
| MSCI World ex USA IndexA | -21.87% | -0.82% |
| B | From January 18, 2018, date initially listed on the NYSE Arca exchange. |
| * | Total returns are historical and include changes in share price and reinvestment of dividends and capital gains distributions, if any. |

| 7 | Annual Report |
| Annual Report | 8 |
| % of fund's net assets | |
| BP PLC | 3.0 |
| TotalEnergies SE | 3.0 |
| Endesa S.A. | 2.8 |
| Orange S.A. | 2.5 |
| Enbridge, Inc. | 2.5 |
| Repsol S.A. | 2.5 |
| Nintendo Co. Ltd. | 2.4 |
| Power Assets Holdings Ltd. | 2.4 |
| Enel SpA | 2.3 |
| Telefonica S.A. | 2.3 |
| Emera, Inc. | 2.2 |
| 27.9 |
| % of fund's net assets | ||
| Financials | 27.1 | |
| Energy | 15.1 | |
| Materials | 13.6 | |
| Communication Services | 11.7 | |
| Utilities | 9.7 | |
| Industrials | 9.6 | |
| Health Care | 4.2 | |
| Consumer Discretionary | 3.8 | |
| Consumer Staples | 2.9 | |
| Information Technology | 1.6 | |
| % of funds's net assets | ||
| Stocks and Equity Futures | 100.0% | |
| Short-Term Investments and Net Other Assets (Liabilities) | 0.0% | |
| 9 | Annual Report |
| Average Annual Total Returns | Past 1 Year | Life of Fund |
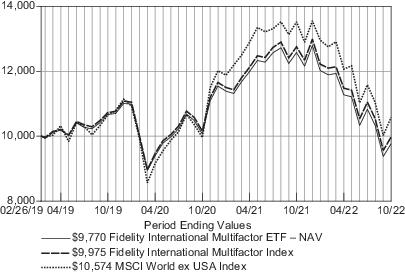
| Fidelity International Multifactor ETF – NAVA | -22.36% | -0.63% |
| Fidelity International Multifactor ETF – Market PriceB | -22.65% | -0.46% |
| Fidelity International Multifactor IndexA | -21.83% | -0.07% |
| MSCI World ex USA IndexA | -21.87% | 1.53% |
| B | From February 28, 2019, date initially listed on the CboeBZX exchange. |
| * | Total returns are historical and include changes in share price and reinvestment of dividends and capital gains distributions, if any. |
| Annual Report | 10 |
| 11 | Annual Report |
| % of fund's net assets | |
| Nestle S.A. | 2.5 |
| Roche Holding AG | 1.9 |
| AstraZeneca PLC | 1.5 |
| Novo Nordisk A/S Class B | 1.5 |
| Novartis AG | 1.5 |
| Daito Trust Construction Co. Ltd. | 1.5 |
| PSP Swiss Property AG | 1.4 |
| KDDI Corp. | 1.3 |
| Osaka Gas Co. Ltd. | 1.3 |
| Publicis Groupe S.A. | 1.2 |
| Nippon Telegraph & Telephone Corp. | 1.2 |
| 16.8 |
| % of fund's net assets | ||
| Health Care | 16.1 | |
| Financials | 15.8 | |
| Consumer Staples | 14.7 | |
| Industrials | 12.1 | |
| Communication Services | 9.4 | |
| Utilities | 8.1 | |
| Real Estate | 7.3 | |
| Consumer Discretionary | 6.4 | |
| Information Technology | 3.8 | |
| Materials | 3.4 | |
| Energy | 2.2 | |
| % of funds's net assets | ||
| Stocks and Equity Futures | 100.0% | |
| Short-Term Investments and Net Other Assets (Liabilities) | 0.0% | |
| Annual Report | 12 |
| Average Annual Total Returns | Past 1 Year | Life of Fund |
| Fidelity International Value Factor ETF – NAVA | -18.82% | -2.27% |
| Fidelity International Value Factor ETF – Market PriceB | -19.24% | -2.59% |
| Fidelity International Value Factor IndexA | -18.35% | -1.73% |
| MSCI World ex USA IndexA | -21.87% | -0.82% |
| B | From January 18, 2018, date initially listed on the NYSE Arca exchange. |
| * | Total returns are historical and include changes in share price and reinvestment of dividends and capital gains distributions, if any. |

| 13 | Annual Report |
| Annual Report | 14 |
| % of fund's net assets | |
| Nestle S.A. | 2.4 |
| Shell PLC | 1.8 |
| Roche Holding AG | 1.8 |
| Toyota Motor Corp. | 1.6 |
| The Toronto-Dominion Bank | 1.5 |
| Japan Tobacco, Inc. | 1.5 |
| Novartis AG | 1.4 |
| SAP SE | 1.4 |
| Canadian Natural Resources Ltd. | 1.4 |
| Sanofi | 1.4 |
| Teck Resources Ltd. Class B | 1.3 |
| 17.5 |
| % of fund's net assets | ||
| Financials | 19.9 | |
| Industrials | 15.2 | |
| Consumer Discretionary | 11.1 | |
| Health Care | 10.6 | |
| Consumer Staples | 9.4 | |
| Materials | 8.0 | |
| Information Technology | 7.8 | |
| Energy | 7.0 | |
| Communication Services | 4.5 | |
| Utilities | 3.6 | |
| Real Estate | 2.2 | |
| % of funds's net assets | ||
| Stocks and Equity Futures | 100.0% | |
| Short-Term Investments and Net Other Assets (Liabilities) | 0.0% | |
| 15 | Annual Report |
| Common Stocks – 97.3% | ||
| Shares | Value | |
| BRAZIL – 3.4% | ||
| Arezzo Industria e Comercio S.A. | 2,200 | $ 43,813 |
| BB Seguridade Participacoes S.A. | 17,100 | 96,755 |
| CPFL Energia S.A. | 45,900 | 309,834 |
| Telefonica Brasil S.A. | 5,800 | 45,662 |
| TIM S.A. | 19,500 | 49,054 |
| Vale S.A. | 8,500 | 108,744 |
| TOTAL BRAZIL | 653,862 | |
| CAYMAN ISLANDS – 7.6% | ||
| Alibaba Group Holding Ltd. ADR (a) | 4,340 | 275,937 |
| Autohome, Inc. ADR | 1,215 | 31,736 |
| Bosideng International Holdings Ltd. | 118,000 | 50,959 |
| China Medical System Holdings Ltd. | 153,000 | 167,036 |
| Hengan International Group Co. Ltd. | 42,000 | 162,920 |
| Huazhu Group Ltd. ADR | 535 | 14,488 |
| JD.com, Inc. ADR | 2,022 | 75,400 |
| JD.com, Inc. Class A | 1,023 | 18,909 |
| Kingboard Holdings Ltd. | 35,000 | 86,320 |
| Li Auto, Inc. ADR (a) | 861 | 11,727 |
| Longfor Group Holdings Ltd. (b) | 109,000 | 138,856 |
| New Oriental Education & Technology, Inc. ADR (a) | 632 | 15,004 |
| Pinduoduo, Inc. ADR (a) | 1,183 | 64,864 |
| TAL Education Group ADR (a) | 2,746 | 12,934 |
| Tongcheng Travel Holdings Ltd. (a) | 34,400 | 53,639 |
| Topsports International Holdings Ltd. (b) | 86,000 | 43,384 |
| Trip.com Group Ltd. ADR (a) | 1,431 | 32,383 |
| Vipshop Holdings Ltd. ADR (a) | 1,599 | 11,145 |
| Want Want China Holdings Ltd. | 254,000 | 166,964 |
| Yadea Group Holdings Ltd. (b) | 32,000 | 48,837 |
| TOTAL CAYMAN ISLANDS | 1,483,442 | |
| CHILE – 1.5% | ||
| Banco de Chile | 1,015,758 | 92,867 |
| Cencosud S.A. | 143,404 | 192,965 |
| TOTAL CHILE | 285,832 | |
| CHINA – 11.2% | ||
| Agricultural Bank of China Ltd. Class H | 231,000 | 65,917 |
| Anhui Conch Cement Co. Ltd. Class H | 18,000 | 46,319 |
| Bank of China Ltd. Class H | 325,000 | 104,747 |
| Bank of Communications Co. Ltd. Class H | 124,000 | 60,501 |
| China Cinda Asset Management Co. Ltd. Class H | 286,000 | 26,597 |
| China CITIC Bank Corp. Ltd. Class H | 110,000 | 41,479 |
| China Coal Energy Co. Ltd. Class H | 270,000 | 198,806 |
| China Construction Bank Corp. Class H | 332,000 | 176,365 |
| China Railway Group Ltd. Class H | 59,000 | 25,630 |
| China Shenhua Energy Co. Ltd. Class H | 85,500 | 224,918 |
| | ||
| Shares | Value | |
| China Tower Corp. Ltd. Class H (b) | 478,000 | $ 43,234 |
| Dongfeng Motor Group Co. Ltd. | 102,000 | 46,128 |
| Guangzhou Automobile Group Co. Ltd. Class H | 76,000 | 46,279 |
| Guangzhou Baiyunshan Pharmaceutical Holdings Co. Ltd. Class H | 88,000 | 196,182 |
| Haier Smart Home Co. Ltd. Class H | 28,400 | 71,056 |
| Industrial & Commercial Bank of China Ltd. Class H | 270,000 | 117,289 |
| Inner Mongolia Yitai Coal Co. Ltd. Class B | 134,100 | 189,617 |
| Jiumaojiu International Holdings Ltd. (b) | 29,000 | 45,514 |
| PICC Property & Casualty Co. Ltd. Class H | 54,000 | 49,805 |
| Postal Savings Bank of China Co. Ltd. Class H (b) | 90,000 | 41,733 |
| Sinopharm Group Co. Ltd. Class H | 103,600 | 197,438 |
| The People's Insurance Co. Group of China Ltd. Class H | 144,000 | 39,807 |
| TravelSky Technology Ltd. Class H | 57,000 | 82,779 |
| Yangzijiang Shipbuilding Holdings Ltd. | 60,900 | 51,643 |
| TOTAL CHINA | 2,189,783 | |
| COLOMBIA – 0.4% | ||
| Grupo de Inversiones Suramericana S.A. | 9,117 | 74,326 |
| TOTAL COLOMBIA | 74,326 | |
| CYPRUS – 0.0% | ||
| TCS Group Holding PLC GDR (a)(c) | 789 | 990 |
| TOTAL CYPRUS | 990 | |
| CZECH – 1.0% | ||
| CEZ AS | 5,803 | 189,758 |
| TOTAL CZECH | 189,758 | |
| EGYPT – 0.4% | ||
| Commercial International Bank Egypt SAE | 62,606 | 83,993 |
| TOTAL EGYPT | 83,993 | |
| GREECE – 0.3% | ||
| JUMBO S.A. | 4,713 | 67,030 |
| TOTAL GREECE | 67,030 | |
| HONG KONG – 2.6% | ||
| Beijing Enterprises Holdings Ltd. | 90,000 | 228,386 |
| China Merchants Port Holdings Co. Ltd. | 21,046 | 24,666 |
| China Overseas Land & Investment Ltd. | 136,000 | 259,531 |
| TOTAL HONG KONG | 512,583 | |
| HUNGARY – 0.6% | ||
| MOL Hungarian Oil & Gas PLC | 20,119 | 120,450 |
| TOTAL HUNGARY | 120,450 | |
| Annual Report | 16 |
| Common Stocks – continued | ||
| Shares | Value | |
| INDIA – 17.5% | ||
| AU Small Finance Bank Ltd. (b) | 9,044 | $ 64,412 |
| Bajaj Auto Ltd. | 1,336 | 59,262 |
| Bank of Baroda | 46,894 | 83,673 |
| Bharat Electronics Ltd. | 28,455 | 36,730 |
| Cipla Ltd. | 15,208 | 214,476 |
| Coal India Ltd. | 82,436 | 244,935 |
| Federal Bank Ltd. | 52,649 | 83,638 |
| GAIL India Ltd. | 231,899 | 255,775 |
| HCL Technologies Ltd. | 3,676 | 46,236 |
| HDFC Asset Management Co. Ltd. (b) | 2,782 | 69,723 |
| Hindustan Aeronautics Ltd. | 1,260 | 38,511 |
| Hindustan Unilever Ltd. | 6,972 | 214,835 |
| Indus Towers Ltd. | 20,962 | 46,975 |
| Infosys Ltd. | 9,984 | 185,460 |
| ITC Ltd. | 44,231 | 186,323 |
| Kotak Mahindra Bank Ltd. | 5,792 | 133,081 |
| Maruti Suzuki India Ltd. | 836 | 96,223 |
| Nestle India Ltd. | 656 | 161,377 |
| NMDC Ltd. | 40,976 | 49,378 |
| NMDC Steel Ltd. (a)(c) | 40,976 | 19,058 |
| Page Industries Ltd. | 109 | 65,534 |
| Pidilite Industries Ltd. | 1,912 | 59,695 |
| Power Finance Corp. Ltd. | 47,214 | 65,735 |
| Power Grid Corp. of India Ltd. | 105,991 | 292,131 |
| SBI Life Insurance Co. Ltd. (b) | 5,277 | 80,703 |
| State Bank of India | 14,625 | 101,378 |
| Sun Pharmaceutical Industries Ltd. | 18,943 | 232,710 |
| Tata Consultancy Services Ltd. | 2,897 | 111,752 |
| Tata Elxsi Ltd. | 182 | 15,382 |
| Vedanta Ltd. | 19,095 | 64,775 |
| Wipro Ltd. | 5,740 | 26,804 |
| TOTAL INDIA | 3,406,680 | |
| INDONESIA – 6.9% | ||
| Adaro Energy Indonesia Tbk PT | 971,100 | 247,795 |
| Astra International Tbk PT | 146,100 | 62,290 |
| Bank Mandiri Persero Tbk PT | 179,200 | 121,209 |
| Bukit Asam Tbk PT | 731,600 | 183,398 |
| Indofood Sukses Makmur Tbk PT | 409,100 | 169,174 |
| Kalbe Farma Tbk PT | 2,257,000 | 296,641 |
| Telkom Indonesia Persero Tbk PT | 254,600 | 71,659 |
| United Tractors Tbk PT | 93,800 | 194,245 |
| TOTAL INDONESIA | 1,346,411 | |
| KUWAIT – 0.4% | ||
| Humansoft Holding Co. KSC | 6,613 | 71,777 |
| TOTAL KUWAIT | 71,777 | |
| | ||
| Shares | Value | |
| MALAYSIA – 2.5% | ||
| DiGi.Com Bhd | 66,900 | $ 53,628 |
| Hong Leong Bank Bhd | 16,700 | 74,740 |
| Nestle Malaysia Bhd | 6,100 | 171,595 |
| Petronas Chemicals Group Bhd | 25,200 | 46,477 |
| Public Bank Bhd | 104,400 | 98,703 |
| TIME dotCom Bhd | 50,700 | 48,791 |
| TOTAL MALAYSIA | 493,934 | |
| MAURITIUS – 0.1% | ||
| MakeMyTrip Ltd. (a) | 351 | 9,768 |
| TOTAL MAURITIUS | 9,768 | |
| MEXICO – 2.0% | ||
| America Movil S.A.B. de C.V. Series L | 89,700 | 84,734 |
| Arca Continental S.A.B. de C.V. | 28,900 | 236,293 |
| Grupo Aeroportuario del Centro Norte S.A.B. de C.V. | 4,100 | 32,603 |
| Promotora y Operadora de Infraestructura S.A.B. de C.V. | 3,840 | 28,833 |
| Sitios Latinoamerica S.A.B. de C.V. (a) | 4,485 | 1,306 |
| TOTAL MEXICO | 383,769 | |
| PHILIPPINES – 1.6% | ||
| Manila Electric Co. | 48,680 | 253,187 |
| PLDT, Inc. | 1,735 | 48,921 |
| TOTAL PHILIPPINES | 302,108 | |
| POLAND – 0.8% | ||
| Asseco Poland S.A. | 6,409 | 92,347 |
| Powszechny Zaklad Ubezpieczen S.A. | 12,731 | 71,508 |
| TOTAL POLAND | 163,855 | |
| QATAR – 0.6% | ||
| Mesaieed Petrochemical Holding Co. | 28,110 | 17,522 |
| Qatar Islamic Bank SAQ | 14,658 | 98,169 |
| TOTAL QATAR | 115,691 | |
| RUSSIA – 0.5% | ||
| Gazprom PJSC (c) | 14,450 | 2,280 |
| Inter RAO UES PJSC (a)(c) | 7,348,600 | 61,099 |
| MMC Norilsk Nickel PJSC (c) | 188 | 1,886 |
| Mobile TeleSystems PJSC ADR (a)(c) | 15,647 | 15,584 |
| Sberbank of Russia PJSC (a)(c) | 38,410 | 356 |
| Surgutneftegas PJSC (c) | 56,600 | 1,045 |
| VTB Bank PJSC (a)(c) | 91,900,000 | 5,295 |
| TOTAL RUSSIA | 87,545 | |
| SAUDI ARABIA – 2.3% | ||
| Al Rajhi Bank (a) | 6,194 | 140,445 |
| 17 | Annual Report |
| Common Stocks – continued | ||
| Shares | Value | |
| SAUDI ARABIA – continued | ||
| Alinma Bank | 4,762 | $ 47,524 |
| Bank AlBilad (a) | 2,917 | 39,358 |
| SABIC Agri-Nutrients Co. | 1,509 | 63,853 |
| Sahara International Petrochemical Co. | 3,903 | 42,120 |
| The Saudi National Bank | 7,029 | 111,116 |
| TOTAL SAUDI ARABIA | 444,416 | |
| SOUTH AFRICA – 5.0% | ||
| African Rainbow Minerals Ltd. | 3,553 | 50,008 |
| AVI Ltd. | 52,953 | 211,697 |
| Capitec Bank Holdings Ltd. | 772 | 79,839 |
| Exxaro Resources Ltd. | 12,967 | 144,307 |
| Investec Ltd. | 12,496 | 61,435 |
| Kumba Iron Ore Ltd. | 1,784 | 33,587 |
| Mediclinic International PLC | 40,294 | 228,926 |
| MultiChoice Group | 7,896 | 51,572 |
| Rand Merchant Investment Holdings Ltd. | 38,341 | 59,501 |
| Vodacom Group Ltd. | 7,413 | 50,547 |
| TOTAL SOUTH AFRICA | 971,419 | |
| SOUTH KOREA – 9.6% | ||
| Cheil Worldwide, Inc. | 3,826 | 65,671 |
| DB HiTek Co. Ltd. | 101 | 3,138 |
| GS Holdings Corp. | 1,161 | 37,492 |
| Hyundai Marine & Fire Insurance Co. Ltd. | 3,395 | 79,366 |
| Iljin Materials Co. Ltd. | 56 | 2,382 |
| Kangwon Land, Inc. (a) | 2,736 | 44,177 |
| Kia Corp. | 1,408 | 65,534 |
| Korea Zinc Co. Ltd. | 154 | 69,192 |
| KT&G Corp. | 3,214 | 215,929 |
| Kumho Petrochemical Co. Ltd. | 528 | 48,558 |
| L&F Co. Ltd. (a) | 62 | 9,793 |
| LG Corp. | 658 | 36,585 |
| LG Display Co. Ltd. | 573 | 5,129 |
| LG Innotek Co. Ltd. | 36 | 7,493 |
| LG Uplus Corp. | 7,092 | 57,007 |
| Samsung Electro-Mechanics Co. Ltd. | 151 | 12,827 |
| Samsung Electronics Co. Ltd. | 14,960 | 623,837 |
| Samsung SDI Co. Ltd. | 144 | 74,505 |
| Samsung SDS Co. Ltd. | 102 | 8,951 |
| Seegene, Inc. | 9,318 | 187,740 |
| Shinsegae, Inc. | 307 | 45,798 |
| SK Hynix, Inc. | 1,393 | 80,874 |
| SK Square Co. Ltd. (a) | 223 | 5,785 |
| Woori Financial Group, Inc. | 10,756 | 88,724 |
| TOTAL SOUTH KOREA | 1,876,487 | |
| TAIWAN – 13.1% | ||
| Advantech Co. Ltd. | 7,000 | 63,651 |
| | ||
| Shares | Value | |
| ASPEED Technology, Inc. | 1,000 | $ 52,137 |
| Asustek Computer, Inc. | 10,000 | 73,241 |
| Catcher Technology Co. Ltd. | 15,000 | 78,905 |
| Chicony Electronics Co. Ltd. | 30,000 | 74,575 |
| Chunghwa Telecom Co. Ltd. | 19,000 | 65,451 |
| E Ink Holdings, Inc. | 14,000 | 89,285 |
| Eva Airways Corp. | 39,000 | 28,322 |
| Far EasTone Telecommunications Co. Ltd. | 23,000 | 50,465 |
| Formosa Plastics Corp. | 21,000 | 54,158 |
| Gigabyte Technology Co. Ltd. | 29,000 | 83,249 |
| International Games System Co. Ltd. | 4,000 | 43,634 |
| Lite-On Technology Corp. | 39,000 | 77,461 |
| Lotes Co. Ltd. | 4,000 | 96,330 |
| Micro-Star International Co. Ltd. | 21,000 | 71,363 |
| Nanya Technology Corp. | 46,000 | 77,803 |
| Novatek Microelectronics Corp. | 10,000 | 74,792 |
| Pegatron Corp. | 41,000 | 75,072 |
| Pou Chen Corp. | 68,000 | 57,506 |
| Radiant Opto-Electronics Corp. | 25,000 | 76,344 |
| Ruentex Development Co. Ltd. | 312,000 | 383,434 |
| Simplo Technology Co. Ltd. | 9,000 | 71,643 |
| Sinbon Electronics Co. Ltd. | 9,000 | 69,967 |
| SinoPac Financial Holdings Co. Ltd. | 155,670 | 77,781 |
| Synnex Technology International Corp. | 44,000 | 71,826 |
| Taichung Commercial Bank Co. Ltd. | 166,900 | 65,004 |
| Taiwan Cooperative Financial Holding Co. Ltd. | 106,000 | 82,241 |
| Taiwan Fertilizer Co. Ltd. | 21,000 | 34,085 |
| Taiwan Mobile Co. Ltd. | 18,000 | 53,124 |
| The Shanghai Commercial & Savings Bank Ltd. | 53,000 | 76,319 |
| Tripod Technology Corp. | 23,000 | 63,670 |
| Union Bank Of Taiwan | 169,602 | 79,742 |
| WPG Holdings Ltd. | 48,000 | 65,470 |
| TOTAL TAIWAN | 2,558,050 | |
| THAILAND – 0.9% | ||
| Advanced Info Service PCL NVDR | 10,900 | 54,700 |
| Intouch Holdings PCL NVDR | 26,800 | 50,699 |
| Krung Thai Bank PCL NVDR | 172,900 | 79,500 |
| TOTAL THAILAND | 184,899 | |
| TURKEY – 2.3% | ||
| Akbank TAS | 151,804 | 119,303 |
| Enka Insaat ve Sanayi AS | 32,573 | 32,813 |
| Haci Omer Sabanci Holding AS | 64,111 | 115,589 |
| Turkcell Iletisim Hizmetleri AS | 53,535 | 73,786 |
| Turkiye Is Bankasi AS Class C | 225,920 | 113,185 |
| TOTAL TURKEY | 454,676 | |
| Annual Report | 18 |
| Common Stocks – continued | ||
| Shares | Value | |
| UNITED ARAB EMIRATES – 2.0% | ||
| Emaar Properties PJSC | 238,264 | $ 393,101 |
| TOTAL UNITED ARAB EMIRATES | 393,101 | |
| UNITED STATES OF AMERICA – 0.2% | ||
| Yum China Holdings, Inc. | 1,140 | 47,139 |
| TOTAL UNITED STATES OF AMERICA | 47,139 | |
| TOTAL COMMON STOCKS (Cost $22,779,366) | 18,973,774 | |
| Preferred Stock – 2.5% | ||
| BRAZIL – 2.2% | ||
| Bradespar S.A. | 6,400 | 29,285 |
| Itausa S.A. | 61,210 | 125,284 |
| Petroleo Brasileiro S.A. | 49,400 | 280,645 |
| TOTAL BRAZIL | 435,214 | |
| CHILE – 0.3% | ||
| Sociedad Quimica y Minera de Chile S.A. Class B | 510 | 48,524 |
| TOTAL CHILE | 48,524 | |
| | ||
| Shares | Value | |
| RUSSIA – 0.0% | ||
| Transneft PJSC (c) | 12 | $ 5,251 |
| TOTAL RUSSIA | 5,251 | |
| TOTAL PREFERRED STOCKS (Cost $528,738) | 488,989 | |
| TOTAL INVESTMENT IN SECURITIES – 99.8% (Cost $23,308,104) | 19,462,763 | |
| NET OTHER ASSETS (LIABILITIES) – 0.2% | 44,516 | |
| NET ASSETS – 100.0% | $ 19,507,279 | |
| Categorizations in the Schedule of Investments are based on country or territory of incorporation. | ||
| Legend | ||
| (a) | Non-income producing. | |
| (b) | Security is exempt from registration under Rule 144A of the Securities Act of 1933. These securities may be resold in transactions exempt from registration, normally to qualified institutional buyers. At the end of the period, the value of these securities amounted to $576,396 or 3.0% of net assets. | |
| (c) | Level 3 security. | |
| Futures Contracts | |||||
| Number of contracts | Expiration Date | Notional Amount | Value | Unrealized Appreciation/ (Depreciation) | |
| Purchased | |||||
| Equity Index Contract | |||||
| ICE MSCI EAFE Index (United States) | 1 | December 2022 | $42,680 | $623 | $623 |
| Fund | Value, beginning of period | Purchases | Sales Proceeds | Dividend Income | Realized Gain/Loss | Change in Unrealized appreciation (depreciation) | Value, end of period | % ownership, end of period | ||||||
| Fidelity Cash Central Fund, 3.10% | $50,336 | $1,148,158 | $1,198,494 | $93 | $— | $— | $— | 0.0% |
| 19 | Annual Report |
| Description | Total | Level 1 | Level 2 | Level 3 |
| Investments in Securities: | ||||||||
| Equities: | ||||||||
| Communication Services | $ 1,157,940 | $ 1,142,356 | $ — | $ 15,584 | ||||
| Consumer Discretionary | 1,674,438 | 1,674,438 | — | — | ||||
| Consumer Staples | 2,090,072 | 2,090,072 | — | — | ||||
| Energy | 1,789,288 | 1,785,963 | — | 3,325 | ||||
| Financials | 3,741,466 | 3,734,825 | — | 6,641 | ||||
| Health Care | 1,721,149 | 1,721,149 | — | — | ||||
| Industrials | 336,336 | 336,336 | — | — | ||||
| Information Technology | 2,888,578 | 2,888,578 | — | — | ||||
| Materials | 809,415 | 788,471 | — | 20,944 | ||||
| Real Estate | 1,174,922 | 1,174,922 | — | — | ||||
| Utilities | 1,590,170 | 1,529,071 | — | 61,099 | ||||
| Preferred Stock | 488,989 | 483,738 | — | 5,251 | ||||
| Total Investments in Securities: | $ 19,462,763 | $ 19,349,919 | $ — | $ 112,844 |
| Derivative Instruments: | ||||||||
| Assets | ||||||||
| Futures Contracts | $ 623 | $ 623 | $ — | $ — | ||||
| Total Assets | $ 623 | $ 623 | — | $ — | ||||
| Total Derivative Instruments: | $ 623 | $ 623 | $ — | $ — |
| Investments in Securities: | |
| Financials | |
| Beginning Balance | $ — |
| Net Realized Gain (Loss) on Investment Securities | — |
| Net Unrealized Gain (Loss) on Investment Securities | (325,955) |
| Cost of Purchases | 16,555 |
| Proceeds of Sales | — |
| Amortization/Accretion | — |
| Transfers into Level 3 | 316,041 |
| Transfers out of Level 3 | — |
| Ending Balance | $ 6,641 |
| The change in unrealized gain (loss) for the period attributable to Level 3 securities held at October 31, 2022 | $ (325,955) |
| Utilities | |
| Beginning Balance | $ — |
| Net Realized Gain (Loss) on Investment Securities | — |
| Net Unrealized Gain (Loss) on Investment Securities | (415,383) |
| Cost of Purchases | 49,799 |
| Proceeds of Sales | — |
| Amortization/Accretion | — |
| Transfers into Level 3 | 426,683 |
| Transfers out of Level 3 | — |
| Ending Balance | $ 61,099 |
| The change in unrealized gain (loss) for the period attributable to Level 3 securities held at October 31, 2022 | $ (415,383) |
| Other Investments in Securities | |
| Beginning Balance | $ — |
| Net Realized Gain (Loss) on Investment Securities | 26 |
| Annual Report | 20 |
| Investments in Securities: | |
| Net Unrealized Gain (Loss) on Investment Securities | (255,997) |
| Cost of Purchases | 213,568 |
| Proceeds of Sales | (2,154) |
| Amortization/Accretion | — |
| Transfers into Level 3 | 89,661 |
| Transfers out of Level 3 | — |
| Ending Balance | $ 45,104 |
| The change in unrealized gain (loss) for the period attributable to Level 3 securities held at October 31, 2022 | $ (255,997) |
| Primary Risk/ Derivative Type | Value | ||
| Asset | Liabilities | ||
| Equity Risk | |||
| Futures Contracts(a) | $623 | $0 | |
| Total Equity Risk | 623 | 0 | |
| Total Value of Derivatives | $623 | $0 | |
| (a) | Reflects gross cumulative appreciation (depreciation) on futures contracts as presented in the Schedule of Investments. In the Statement of Assets and Liabilities, the period end daily variation margin is included in receivable or payable for daily variation margin on futures contracts, and the net cumulative appreciation (depreciation) is included in total accumulated earnings (loss). |
| 21 | Annual Report |
| Common Stocks – 99.3% | ||
| Shares | Value | |
| AUSTRALIA – 7.4% | ||
| Australia & New Zealand Banking Group Ltd. | 71,991 | $ 1,176,646 |
| BHP Group Ltd. | 64,455 | 1,539,821 |
| Fortescue Metals Group Ltd. | 93,243 | 876,476 |
| Sonic Healthcare Ltd. | 9,797 | 205,294 |
| Wesfarmers Ltd. | 10,350 | 300,868 |
| Westpac Banking Corp. | 92,229 | 1,421,907 |
| Woodside Energy Group Ltd. | 11,586 | 266,564 |
| Woolworths Group Ltd. | 8,785 | 185,492 |
| TOTAL AUSTRALIA | 5,973,068 | |
| BERMUDA – 0.4% | ||
| Jardine Matheson Holdings Ltd. | 6,682 | 307,506 |
| TOTAL BERMUDA | 307,506 | |
| CANADA – 17.2% | ||
| Barrick Gold Corp. | 109,807 | 1,649,460 |
| BCE, Inc. | 38,661 | 1,741,665 |
| Canadian National Railway Co. | 6,357 | 752,186 |
| Emera, Inc. | 47,347 | 1,752,538 |
| Enbridge, Inc. | 51,510 | 2,004,436 |
| Great-West Lifeco, Inc. | 33,352 | 771,176 |
| Manulife Financial Corp. | 58,933 | 975,556 |
| Royal Bank of Canada | 16,285 | 1,504,875 |
| TC Energy Corp. | 39,703 | 1,741,745 |
| The Bank of Nova Scotia | 20,184 | 974,390 |
| TOTAL CANADA | 13,868,027 | |
| FINLAND – 0.7% | ||
| Kone Oyj Class B | 8,192 | 335,602 |
| Orion Oyj Class B | 5,016 | 230,775 |
| TOTAL FINLAND | 566,377 | |
| FRANCE – 10.7% | ||
| AXA S.A. | 44,268 | 1,093,807 |
| BNP Paribas S.A. | 20,883 | 980,284 |
| Bouygues S.A. | 14,512 | 414,224 |
| Carrefour S.A. | 8,681 | 139,723 |
| Danone S.A. | 3,443 | 171,301 |
| Euroapi S.A. (a) | 182 | 3,185 |
| La Francaise des Jeux SAEM (b) | 12,180 | 397,258 |
| Orange S.A. | 216,025 | 2,056,299 |
| Sanofi | 4,138 | 357,162 |
| Schneider Electric SE | 4,637 | 587,813 |
| TotalEnergies SE | 44,772 | 2,438,198 |
| TOTAL FRANCE | 8,639,254 | |
| GERMANY – 4.4% | ||
| Allianz SE | 6,389 | 1,150,515 |
| BASF SE | 28,617 | 1,285,066 |
| | ||
| Shares | Value | |
| Daimler AG | 5,662 | $ 327,928 |
| SAP SE | 2,648 | 255,617 |
| Siemens AG | 5,011 | 547,958 |
| TOTAL GERMANY | 3,567,084 | |
| HONG KONG – 4.8% | ||
| BOC Hong Kong Holdings Ltd. | 328,000 | 1,019,535 |
| Hang Seng Bank Ltd. | 64,000 | 900,909 |
| Power Assets Holdings Ltd. | 401,500 | 1,920,588 |
| TOTAL HONG KONG | 3,841,032 | |
| IRELAND – 1.4% | ||
| Smurfit Kappa Group PLC | 35,256 | 1,168,362 |
| TOTAL IRELAND | 1,168,362 | |
| ITALY – 2.3% | ||
| Enel SpA | 420,493 | 1,878,071 |
| TOTAL ITALY | 1,878,071 | |
| JAPAN – 16.8% | ||
| Canon, Inc. | 8,600 | 182,490 |
| ENEOS Holdings, Inc. | 402,200 | 1,325,378 |
| Honda Motor Co. Ltd. | 13,100 | 297,281 |
| Iida Group Holdings Co. Ltd. | 13,600 | 189,038 |
| ITOCHU Corp. | 19,500 | 504,965 |
| Japan Tobacco, Inc. | 19,600 | 324,920 |
| Kajima Corp. | 41,000 | 386,457 |
| Mitsubishi Corp. | 18,900 | 512,570 |
| Mitsui & Co. Ltd. | 24,100 | 533,934 |
| Mizuho Financial Group, Inc. | 108,100 | 1,168,020 |
| Nintendo Co. Ltd. | 47,400 | 1,935,735 |
| Nomura Holdings, Inc. | 292,400 | 947,814 |
| Otsuka Holdings Co. Ltd. | 9,400 | 301,412 |
| Seiko Epson Corp. | 11,500 | 156,753 |
| Sekisui House Ltd. | 15,100 | 251,438 |
| Shin-Etsu Chemical Co. Ltd. | 12,500 | 1,306,893 |
| SoftBank Corp. | 175,800 | 1,733,339 |
| Sumitomo Corp. | 34,300 | 437,418 |
| Takeda Pharmaceutical Co. Ltd. | 13,200 | 347,950 |
| Tokyo Electron Ltd. | 600 | 159,411 |
| Toyota Motor Corp. | 42,135 | 583,826 |
| TOTAL JAPAN | 13,587,042 | |
| NETHERLANDS – 1.7% | ||
| ASR Nederland N.V. | 23,075 | 1,016,928 |
| BE Semiconductor Industries N.V. | 2,136 | 109,187 |
| Koninklijke Ahold Delhaize N.V. | 6,080 | 169,759 |
| Koninklijke Philips N.V. | 7,745 | 98,119 |
| TOTAL NETHERLANDS | 1,393,993 | |
| Annual Report | 22 |
| Common Stocks – continued | ||
| Shares | Value | |
| NORWAY – 2.0% | ||
| Yara International ASA | 35,279 | $ 1,574,463 |
| TOTAL NORWAY | 1,574,463 | |
| SINGAPORE – 0.3% | ||
| Venture Corp. Ltd. | 18,600 | 209,383 |
| TOTAL SINGAPORE | 209,383 | |
| SPAIN – 8.5% | ||
| ACS Actividades de Construccion y Servicios S.A. | 18,036 | 462,582 |
| Endesa S.A. | 134,409 | 2,243,057 |
| Industria de Diseno Textil S.A. | 12,891 | 292,274 |
| Repsol S.A. | 146,598 | 1,991,516 |
| Telefonica S.A. | 542,538 | 1,868,718 |
| TOTAL SPAIN | 6,858,147 | |
| SWEDEN – 4.4% | ||
| Investor AB Class B | 61,844 | 1,009,387 |
| Skandinaviska Enskilda Banken AB Class A | 90,412 | 953,174 |
| Swedbank AB Class A | 63,023 | 939,033 |
| Telefonaktiebolaget LM Ericsson Class B | 16,944 | 94,147 |
| Volvo AB Class B | 34,732 | 568,261 |
| TOTAL SWEDEN | 3,564,002 | |
| SWITZERLAND – 4.6% | ||
| ABB Ltd. | 14,684 | 408,496 |
| Accelleron Industries Ltd. (a) | 734 | 12,454 |
| Cie Financiere Richemont S.A. | 3,228 | 315,913 |
| Lonza Group AG | 241 | 124,118 |
| Nestle S.A. | 5,296 | 577,043 |
| Novartis AG | 5,560 | 449,467 |
| Roche Holding AG | 1,608 | 534,340 |
| Zurich Insurance Group AG | 3,033 | 1,295,030 |
| TOTAL SWITZERLAND | 3,716,861 | |
| UNITED KINGDOM – 11.7% | ||
| AstraZeneca PLC | 4,730 | 558,421 |
| BAE Systems PLC | 61,893 | 580,345 |
| BP PLC | 444,731 | 2,456,772 |
| | ||
| Shares | Value | |
| British American Tobacco PLC | 6,137 | $ 242,605 |
| Direct Line Insurance Group PLC | 292,874 | 680,470 |
| GSK PLC | 14,838 | 244,092 |
| Haleon PLC (a) | 18,693 | 57,679 |
| Imperial Brands PLC | 6,613 | 161,719 |
| Legal & General Group PLC | 333,655 | 894,694 |
| M&G PLC | 423,559 | 854,388 |
| Persimmon PLC | 11,818 | 177,567 |
| RELX PLC | 19,185 | 517,095 |
| Rio Tinto PLC | 30,711 | 1,604,242 |
| The Sage Group PLC | 18,841 | 157,662 |
| Unilever PLC | 6,184 | 282,982 |
| TOTAL UNITED KINGDOM | 9,470,733 | |
| TOTAL COMMON STOCKS (Cost $100,246,882) | 80,183,405 | |
| Money Market Fund – 0.1% | ||
| Fidelity Cash Central Fund, 3.10% (c) (Cost $48,989) | 48,979 | 48,989 |
| TOTAL INVESTMENT IN SECURITIES – 99.4% (Cost $100,295,871) | 80,232,394 | |
| NET OTHER ASSETS (LIABILITIES) – 0.6% | 497,319 | |
| NET ASSETS – 100.0% | $ 80,729,713 | |
| Categorizations in the Schedule of Investments are based on country or territory of incorporation. | ||
| Legend | ||
| (a) | Non-income producing. | |
| (b) | Security is exempt from registration under Rule 144A of the Securities Act of 1933. These securities may be resold in transactions exempt from registration, normally to qualified institutional buyers. At the end of the period, the value of these securities amounted to $397,258 or 0.5% of net assets. | |
| (c) | Affiliated fund that is generally available only to investment companies and other accounts managed by Fidelity Investments. The rate quoted is the annualized seven-day yield of the fund at period end. A complete unaudited listing of the fund's holdings as of its most recent quarter end is available upon request. In addition, each Fidelity Central Fund's financial statements, which are not covered by the Fund's Report of Independent Registered Public Accounting Firm, are available on the SEC's website or upon request. | |
| Futures Contracts | |||||
| Number of contracts | Expiration Date | Notional Amount | Value | Unrealized Appreciation/ (Depreciation) | |
| Purchased | |||||
| Equity Index Contract | |||||
| ICE MSCI EAFE Index (United States) | 6 | December 2022 | $526,770 | $(1,006) | $(1,006) |
| 23 | Annual Report |
| Fund | Value, beginning of period | Purchases | Sales Proceeds | Dividend Income | Realized Gain/Loss | Change in Unrealized appreciation (depreciation) | Value, end of period | % ownership, end of period | ||||||
| Fidelity Cash Central Fund, 3.10% | $ 56,466 | $25,726,305 | $25,733,782 | $ 694 | $— | $— | $48,989 | 0.0% | ||||||
| Fidelity Securities Lending Cash Central Fund, 3.10% | 4,768,155 | 17,340,863 | 22,109,018 | 22,047 | — | — | $ — | 0.0% | ||||||
| Total | $4,824,621 | $43,067,168 | $47,842,800 | $22,741 | $— | $— | $48,989 |
| Description | Total | Level 1 | Level 2 | Level 3 |
| Investments in Securities: | ||||||||
| Equities: | ||||||||
| Communication Services | $ 9,335,756 | $ 9,335,756 | $ — | $ — | ||||
| Consumer Discretionary | 3,133,391 | 3,133,391 | — | — | ||||
| Consumer Staples | 2,313,223 | 2,313,223 | — | — | ||||
| Energy | 12,224,609 | 12,224,609 | — | — | ||||
| Financials | 21,728,538 | 21,728,538 | — | — | ||||
| Health Care | 3,454,335 | 3,454,335 | — | — | ||||
| Industrials | 7,869,866 | 7,869,866 | — | — | ||||
| Information Technology | 1,324,650 | 1,324,650 | — | — | ||||
| Materials | 11,004,783 | 11,004,783 | — | — | ||||
| Utilities | 7,794,254 | 7,794,254 | — | — | ||||
| Money Market Fund | 48,989 | 48,989 | — | — | ||||
| Total Investments in Securities: | $ 80,232,394 | $ 80,232,394 | $ — | $ — |
| Derivative Instruments: | ||||||||
| Liabilities | ||||||||
| Futures Contracts | $ (1,006) | $ (1,006) | $ — | $ — | ||||
| Total Liabilities | $ (1,006) | $ (1,006) | — | $ — | ||||
| Total Derivative Instruments: | $ (1,006) | $ (1,006) | $ — | $ — |
| Primary Risk/ Derivative Type | Value | ||
| Asset | Liabilities | ||
| Equity Risk | |||
| Futures Contracts(a) | $0 | $(1,006) | |
| Total Equity Risk | 0 | (1,006) | |
| Total Value of Derivatives | $0 | $(1,006) | |
| (a) | Reflects gross cumulative appreciation (depreciation) on futures contracts as presented in the Schedule of Investments. In the Statement of Assets and Liabilities, the period end daily variation margin is included in receivable or payable for daily variation margin on futures contracts, and the net cumulative appreciation (depreciation) is included in total accumulated earnings (loss). |
| Annual Report | 24 |
| Common Stocks – 99.3% | ||
| Shares | Value | |
| AUSTRALIA – 5.2% | ||
| ASX Ltd. | 583 | $ 25,238 |
| BHP Group Ltd. | 2,531 | 60,465 |
| Commonwealth Bank of Australia | 1,541 | 103,151 |
| CSL Ltd. | 628 | 112,634 |
| Fortescue Metals Group Ltd. | 1,712 | 16,093 |
| JB Hi-Fi Ltd. | 514 | 14,104 |
| Macquarie Group Ltd. | 466 | 50,508 |
| Medibank Pvt Ltd. | 13,052 | 23,452 |
| Rio Tinto Ltd. | 340 | 19,176 |
| Sonic Healthcare Ltd. | 2,199 | 46,080 |
| Suncorp Group Ltd. | 4,297 | 31,351 |
| Telstra Group Ltd. | 61,041 | 153,008 |
| Wesfarmers Ltd. | 1,020 | 29,651 |
| TOTAL AUSTRALIA | 684,911 | |
| BAILIWICK OF JERSEY – 0.7% | ||
| Experian PLC | 1,628 | 51,996 |
| Man Group PLC | 18,160 | 45,308 |
| TOTAL BAILIWICK OF JERSEY | 97,304 | |
| BELGIUM – 1.5% | ||
| Elia Group S.A. | 1,134 | 143,349 |
| UCB S.A. | 803 | 60,571 |
| TOTAL BELGIUM | 203,920 | |
| BERMUDA – 0.5% | ||
| Jardine Matheson Holdings Ltd. | 1,477 | 67,972 |
| TOTAL BERMUDA | 67,972 | |
| CANADA – 10.2% | ||
| Bank of Montreal | 597 | 54,923 |
| Canadian Apartment Properties REIT | 4,623 | 142,989 |
| Canadian Imperial Bank of Commerce | 887 | 40,232 |
| Canadian National Railway Co. | 568 | 67,208 |
| Canadian Natural Resources Ltd. | 673 | 40,314 |
| Canadian Pacific Railway Ltd. | 894 | 66,563 |
| Canadian Utilities Ltd. Class A | 5,788 | 153,818 |
| CGI, Inc. (a) | 250 | 20,113 |
| Constellation Software, Inc. | 17 | 24,551 |
| Crescent Point Energy Corp. | 2,948 | 23,017 |
| Dollarama, Inc. | 594 | 35,251 |
| Empire Co. Ltd. | 3,412 | 87,548 |
| Fairfax Financial Holdings Ltd. | 43 | 21,092 |
| Intact Financial Corp. | 216 | 32,780 |
| Loblaw Cos. Ltd. | 1,216 | 99,505 |
| Manulife Financial Corp. | 2,092 | 34,630 |
| Open Text Corp. | 446 | 12,902 |
| Royal Bank of Canada | 1,105 | 102,112 |
| Stantec, Inc. | 560 | 27,367 |
| | ||
| Shares | Value | |
| Teck Resources Ltd. Class B (a) | 1,470 | $ 44,691 |
| The Bank of Nova Scotia | 1,046 | 50,496 |
| The Toronto-Dominion Bank | 1,452 | 92,812 |
| Vermilion Energy, Inc. | 894 | 20,835 |
| West Fraser Timber Co. Ltd. | 440 | 32,996 |
| Whitecap Resources, Inc. | 2,965 | 22,954 |
| TOTAL CANADA | 1,351,699 | |
| DENMARK – 3.2% | ||
| AP Moller - Maersk A/S Class B | 21 | 43,937 |
| Coloplast A/S Class B | 541 | 60,330 |
| Novo Nordisk A/S Class B | 1,889 | 205,412 |
| Novozymes A/S Class B | 531 | 27,895 |
| Pandora A/S | 514 | 27,097 |
| Ringkjoebing Landbobank A/S | 398 | 43,327 |
| SimCorp A/S | 302 | 18,042 |
| TOTAL DENMARK | 426,040 | |
| FINLAND – 1.0% | ||
| Kone Oyj Class B | 1,286 | 52,684 |
| Orion Oyj Class B | 1,181 | 54,335 |
| TietoEVRY Oyj | 849 | 20,256 |
| TOTAL FINLAND | 127,275 | |
| FRANCE – 6.4% | ||
| Bureau Veritas S.A. | 2,028 | 50,250 |
| Dassault Aviation S.A. | 370 | 55,000 |
| Dassault Systemes SE | 796 | 26,709 |
| Edenred | 521 | 26,756 |
| EssilorLuxottica S.A. | 211 | 33,440 |
| Gaztransport Et Technigaz S.A. | 48 | 5,584 |
| Hermes International | 25 | 32,381 |
| Ipsen S.A. | 579 | 59,515 |
| La Francaise des Jeux SAEM (b) | 302 | 9,850 |
| LVMH Moet Hennessy Louis Vuitton SE | 152 | 95,997 |
| Publicis Groupe S.A. | 2,866 | 160,722 |
| Sanofi | 1,527 | 131,799 |
| Sodexo S.A. | 149 | 13,215 |
| Teleperformance | 189 | 50,678 |
| Thales S.A. | 470 | 59,761 |
| TotalEnergies SE | 758 | 41,279 |
| TOTAL FRANCE | 852,936 | |
| GERMANY – 2.8% | ||
| Allianz SE | 505 | 90,939 |
| Beiersdorf AG | 759 | 72,900 |
| Deutsche Post AG | 1,445 | 51,286 |
| GEA Group AG | 966 | 33,798 |
| K+S AG | 1,326 | 29,304 |
| Knorr-Bremse AG | 582 | 26,207 |
| 25 | Annual Report |
| Common Stocks – continued | ||
| Shares | Value | |
| GERMANY – continued | ||
| Merck KGaA | 388 | $ 63,274 |
| TOTAL GERMANY | 367,708 | |
| HONG KONG – 1.4% | ||
| BOC Hong Kong Holdings Ltd. | 13,000 | 40,409 |
| Sino Land Co. Ltd. | 129,532 | 138,445 |
| TOTAL HONG KONG | 178,854 | |
| ISRAEL – 2.0% | ||
| Bank Hapoalim BM | 5,226 | 50,634 |
| Bank Leumi Le-Israel BM | 5,229 | 50,143 |
| ICL Group Ltd. | 3,181 | 28,850 |
| Israel Discount Bank Ltd. Class A | 8,079 | 46,185 |
| Mizrahi Tefahot Bank Ltd. | 1,230 | 46,726 |
| Nice Ltd. (a) | 126 | 23,979 |
| Tower Semiconductor Ltd. (a) | 507 | 21,781 |
| TOTAL ISRAEL | 268,298 | |
| ITALY – 2.3% | ||
| Assicurazioni Generali SpA | 3,567 | 53,552 |
| Eni SpA | 1,087 | 14,239 |
| Moncler SpA | 787 | 33,983 |
| Recordati Industria Chimica e Farmaceutica SpA | 1,269 | 47,698 |
| Snam SpA | 34,341 | 152,802 |
| TOTAL ITALY | 302,274 | |
| JAPAN – 22.1% | ||
| Advance Residence Investment Corp. | 67 | 155,966 |
| Astellas Pharma, Inc. | 7,700 | 106,018 |
| Bandai Namco Holdings, Inc. | 500 | 33,108 |
| Canon, Inc. | 1,600 | 33,952 |
| Dai Nippon Printing Co. Ltd. | 2,200 | 44,152 |
| Daito Trust Construction Co. Ltd. | 2,000 | 197,935 |
| FUJIFILM Holdings Corp. | 700 | 32,114 |
| Honda Motor Co. Ltd. | 2,100 | 47,656 |
| Inpex Corp. | 2,500 | 25,532 |
| ITOCHU Corp. | 2,500 | 64,739 |
| Japan Post Holdings Co. Ltd. | 7,100 | 47,749 |
| Japan Tobacco, Inc. | 6,800 | 112,727 |
| Kajima Corp. | 4,400 | 41,473 |
| KDDI Corp. | 5,700 | 168,544 |
| Medipal Holdings Corp. | 6,600 | 81,926 |
| Mitsubishi Corp. | 2,400 | 65,088 |
| Mitsui & Co. Ltd. | 3,100 | 68,680 |
| Nexon Co. Ltd. | 6,300 | 105,837 |
| NGK Spark Plug Co. Ltd. | 1,700 | 30,995 |
| Nippon Telegraph & Telephone Corp. | 5,800 | 159,755 |
| Nissan Chemical Corp. | 700 | 31,554 |
| | ||
| Shares | Value | |
| Nomura Research Institute Ltd. | 1,100 | $ 24,459 |
| Obayashi Corp. | 6,700 | 43,048 |
| Obic Co. Ltd. | 200 | 30,101 |
| Ono Pharmaceutical Co. Ltd. | 4,100 | 96,435 |
| Osaka Gas Co. Ltd. | 11,300 | 167,407 |
| Secom Co. Ltd. | 800 | 45,701 |
| Sekisui House Ltd. | 2,200 | 36,633 |
| Shimano, Inc. | 200 | 31,049 |
| Shionogi & Co. Ltd. | 2,100 | 97,346 |
| Sojitz Corp. | 2,900 | 42,807 |
| Sompo Holdings, Inc. | 1,300 | 54,166 |
| Sony Group Corp. | 1,000 | 67,198 |
| Sumitomo Forestry Co. Ltd. | 2,200 | 34,487 |
| Sumitomo Mitsui Trust Holdings, Inc. | 1,700 | 48,918 |
| Suntory Beverage & Food Ltd. | 2,800 | 93,814 |
| Taisei Corp. | 1,600 | 43,651 |
| TIS, Inc. | 1,000 | 27,013 |
| Tokio Marine Holdings, Inc. | 3,700 | 66,988 |
| TOPPAN, Inc. | 2,900 | 43,295 |
| Tosoh Corp. | 2,800 | 30,499 |
| Toyo Suisan Kaisha Ltd. | 2,500 | 93,854 |
| Trend Micro, Inc. | 500 | 25,263 |
| USS Co. Ltd. | 1,900 | 28,723 |
| TOTAL JAPAN | 2,928,355 | |
| NETHERLANDS – 3.5% | ||
| ASML Holding N.V. | 211 | 99,683 |
| Heineken Holding N.V. | 1,040 | 71,027 |
| Koninklijke Ahold Delhaize N.V. | 3,566 | 99,566 |
| Koninklijke KPN N.V. | 45,834 | 128,244 |
| Wolters Kluwer N.V. | 580 | 61,652 |
| TOTAL NETHERLANDS | 460,172 | |
| NORWAY – 0.8% | ||
| Equinor ASA | 433 | 15,841 |
| Orkla ASA | 9,158 | 61,800 |
| Yara International ASA | 719 | 32,088 |
| TOTAL NORWAY | 109,729 | |
| PORTUGAL – 0.6% | ||
| Galp Energia SGPS S.A. | 654 | 6,642 |
| Jeronimo Martins SGPS S.A. | 3,370 | 69,879 |
| TOTAL PORTUGAL | 76,521 | |
| SINGAPORE – 1.1% | ||
| Oversea-Chinese Banking Corp. Ltd. | 6,981 | 59,840 |
| Singapore Exchange Ltd. | 5,900 | 35,106 |
| United Overseas Bank Ltd. | 2,900 | 56,889 |
| TOTAL SINGAPORE | 151,835 | |
| Annual Report | 26 |
| Common Stocks – continued | ||
| Shares | Value | |
| SOUTH AFRICA – 0.4% | ||
| Investec PLC | 9,782 | $ 49,386 |
| TOTAL SOUTH AFRICA | 49,386 | |
| SPAIN – 3.5% | ||
| Banco de Sabadell S.A. | 67,782 | 53,299 |
| CaixaBank S.A. | 16,801 | 55,677 |
| Enagas S.A. | 9,042 | 146,785 |
| Industria de Diseno Textil S.A. | 1,966 | 44,575 |
| Red Electrica Corp. S.A. | 8,979 | 145,096 |
| Repsol S.A. | 822 | 11,167 |
| TOTAL SPAIN | 456,599 | |
| SWEDEN – 3.3% | ||
| Atlas Copco AB Class A | 5,212 | 55,674 |
| Axfood AB | 2,376 | 58,785 |
| Epiroc AB Class A | 2,400 | 36,715 |
| Essity AB Class B | 3,368 | 71,137 |
| Investor AB Class B | 3,963 | 64,682 |
| Securitas AB Class B | 4,066 | 33,240 |
| SSAB AB | 6,225 | 29,935 |
| Swedish Match AB | 8,145 | 83,732 |
| TOTAL SWEDEN | 433,900 | |
| SWITZERLAND – 12.6% | ||
| Alcon, Inc. | 923 | 56,205 |
| Baloise Holding AG | 293 | 40,052 |
| Cie Financiere Richemont S.A. | 552 | 54,022 |
| EMS-Chemie Holding AG | 38 | 23,903 |
| Galenica AG (b) | 535 | 38,438 |
| Geberit AG | 90 | 40,047 |
| Kuehne + Nagel International AG | 165 | 35,185 |
| Nestle S.A. | 3,027 | 329,817 |
| Novartis AG | 2,529 | 204,443 |
| PSP Swiss Property AG | 1,686 | 180,267 |
| Roche Holding AG | 753 | 250,222 |
| Sonova Holding AG | 152 | 35,951 |
| Straumann Holding AG | 375 | 35,741 |
| Swisscom AG | 286 | 141,264 |
| The Swatch Group AG | 150 | 33,785 |
| UBS Group AG | 5,000 | 79,390 |
| Zurich Insurance Group AG | 197 | 84,115 |
| TOTAL SWITZERLAND | 1,662,847 | |
| | ||
| Shares | Value | |
| UNITED KINGDOM – 14.2% | ||
| Admiral Group PLC | 2,301 | $ 53,435 |
| Anglo American PLC | 1,340 | 40,244 |
| AstraZeneca PLC | 1,744 | 205,896 |
| Auto Trader Group PLC (b) | 18,095 | 108,668 |
| BAE Systems PLC | 5,806 | 54,440 |
| Barclays PLC | 36,452 | 62,013 |
| British American Tobacco PLC | 3,377 | 133,498 |
| Compass Group PLC | 1,900 | 40,175 |
| Diageo PLC | 3,179 | 131,692 |
| GSK PLC | 6,068 | 99,822 |
| IG Group Holdings PLC | 5,374 | 49,220 |
| Imperial Brands PLC | 3,276 | 80,114 |
| InterContinental Hotels Group PLC | 475 | 25,682 |
| RELX PLC | 2,493 | 67,194 |
| Rightmove PLC | 18,054 | 102,228 |
| Rio Tinto PLC | 905 | 47,274 |
| Safestore Holdings PLC | 12,406 | 129,053 |
| Shell PLC | 2,221 | 61,474 |
| SSE PLC | 8,644 | 154,857 |
| Tesco PLC | 23,703 | 58,702 |
| The Sage Group PLC | 2,891 | 24,192 |
| Unilever PLC | 3,404 | 155,768 |
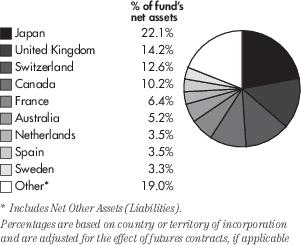
| TOTAL UNITED KINGDOM | 1,885,641 | |
| TOTAL COMMON STOCKS (Cost $14,699,227) | 13,144,176 | |
| TOTAL INVESTMENT IN SECURITIES – 99.3% (Cost $14,699,227) | 13,144,176 | |
| NET OTHER ASSETS (LIABILITIES) – 0.7% | 98,436 | |
| NET ASSETS – 100.0% | $ 13,242,612 | |
| Categorizations in the Schedule of Investments are based on country or territory of incorporation. | ||
| Legend | ||
| (a) | Non-income producing. | |
| (b) | Security is exempt from registration under Rule 144A of the Securities Act of 1933. These securities may be resold in transactions exempt from registration, normally to qualified institutional buyers. At the end of the period, the value of these securities amounted to $156,956 or 1.2% of net assets. | |
| 27 | Annual Report |
| Futures Contracts | |||||
| Number of contracts | Expiration Date | Notional Amount | Value | Unrealized Appreciation/ (Depreciation) | |
| Purchased | |||||
| Equity Index Contract | |||||
| ICE MSCI EAFE Index (United States) | 1 | December 2022 | $87,795 | $(4,728) | $(4,728) |
| Fund | Value, beginning of period | Purchases | Sales Proceeds | Dividend Income | Realized Gain/Loss | Change in Unrealized appreciation (depreciation) | Value, end of period | % ownership, end of period | ||||||
| Fidelity Cash Central Fund, 3.10% | $119,828 | $648,462 | $768,290 | $128 | $— | $— | $— | 0.0% |
| Annual Report | 28 |
| Description | Total | Level 1 | Level 2 | Level 3 |
| Investments in Securities: | ||||||||
| Equities: | ||||||||
| Communication Services | $ 1,228,270 | $ 1,228,270 | $ — | $ — | ||||
| Consumer Discretionary | 799,617 | 799,617 | — | — | ||||
| Consumer Staples | 1,965,865 | 1,965,865 | — | — | ||||
| Energy | 288,878 | 288,878 | — | — | ||||
| Financials | 2,090,925 | 2,090,925 | — | — | ||||
| Health Care | 2,183,531 | 2,183,531 | — | — | ||||
| Industrials | 1,591,488 | 1,591,488 | — | — | ||||
| Information Technology | 491,866 | 491,866 | — | — | ||||
| Materials | 494,967 | 494,967 | — | — | ||||
| Real Estate | 944,655 | 944,655 | — | — | ||||
| Utilities | 1,064,114 | 1,064,114 | — | — | ||||
| Total Investments in Securities: | $ 13,144,176 | $ 13,144,176 | $ — | $ — |
| Derivative Instruments: | ||||||||
| Liabilities | ||||||||
| Futures Contracts | $ (4,728) | $ (4,728) | $ — | $ — | ||||
| Total Liabilities | $ (4,728) | $ (4,728) | — | $ — | ||||
| Total Derivative Instruments: | $ (4,728) | $ (4,728) | $ — | $ — |
| Primary Risk/ Derivative Type | Value | ||
| Asset | Liabilities | ||
| Equity Risk | |||
| Futures Contracts(a) | $0 | $(4,728) | |
| Total Equity Risk | 0 | (4,728) | |
| Total Value of Derivatives | $0 | $(4,728) | |
| (a) | Reflects gross cumulative appreciation (depreciation) on futures contracts as presented in the Schedule of Investments. In the Statement of Assets and Liabilities, the period end daily variation margin is included in receivable or payable for daily variation margin on futures contracts, and the net cumulative appreciation (depreciation) is included in total accumulated earnings (loss). |
| 29 | Annual Report |
| Common Stocks – 99.3% | ||
| Shares | Value | |
| AUSTRALIA – 5.2% | ||
| Aristocrat Leisure Ltd. | 9,054 | $ 214,620 |
| Australia & New Zealand Banking Group Ltd. | 30,107 | 492,079 |
| BHP Group Ltd. | 17,384 | 415,301 |
| Fortescue Metals Group Ltd. | 15,354 | 144,326 |
| Macquarie Group Ltd. | 3,825 | 414,580 |
| Sonic Healthcare Ltd. | 13,576 | 284,482 |
| TOTAL AUSTRALIA | 1,965,388 | |
| BAILIWICK OF JERSEY – 1.9% | ||
| Ferguson PLC | 2,505 | 274,281 |
| Glencore PLC | 80,437 | 462,592 |
| TOTAL BAILIWICK OF JERSEY | 736,873 | |
| BERMUDA – 0.9% | ||
| Hongkong Land Holdings Ltd. | 27,000 | 103,950 |
| Jardine Matheson Holdings Ltd. | 5,500 | 253,110 |
| TOTAL BERMUDA | 357,060 | |
| CANADA – 12.3% | ||
| Alimentation Couche-Tard, Inc. | 8,442 | 377,524 |
| Canadian National Railway Co. | 2,535 | 299,951 |
| Canadian Natural Resources Ltd. | 8,704 | 521,391 |
| Canadian Pacific Railway Ltd. | 3,986 | 296,777 |
| Canadian Tire Corp. Ltd. Class A | 1,232 | 137,908 |
| CGI, Inc. (a) | 4,346 | 349,643 |
| Fairfax Financial Holdings Ltd. | 632 | 310,007 |
| Fortis, Inc. | 4,465 | 173,978 |
| Manulife Financial Corp. | 21,214 | 351,169 |
| Power Corp. of Canada | 12,493 | 309,841 |
| Suncor Energy, Inc. | 13,224 | 454,292 |
| Teck Resources Ltd. Class B (a) | 16,704 | 507,837 |
| The Toronto-Dominion Bank | 9,034 | 577,453 |
| TOTAL CANADA | 4,667,771 | |
| DENMARK – 0.7% | ||
| AP Moller - Maersk A/S Class B | 120 | 251,070 |
| TOTAL DENMARK | 251,070 | |
| FINLAND – 1.5% | ||
| Nokia Oyj | 66,439 | 295,952 |
| TietoEVRY Oyj | 10,657 | 254,263 |
| TOTAL FINLAND | 550,215 | |
| FRANCE – 11.6% | ||
| BNP Paribas S.A. | 8,490 | 398,535 |
| Bouygues S.A. | 13,847 | 395,243 |
| Capgemini SE | 1,829 | 300,529 |
| Carrefour S.A. | 12,563 | 202,205 |
| Cie de Saint-Gobain | 9,866 | 403,694 |
| | ||
| Shares | Value | |
| Engie S.A. | 37,453 | $ 486,917 |
| La Francaise des Jeux SAEM (b) | 12,624 | 411,739 |
| Renault S.A. (a) | 15,306 | 471,530 |
| Sanofi | 5,888 | 508,209 |
| Societe Generale S.A. | 14,118 | 324,071 |
| TotalEnergies SE | 9,243 | 503,356 |
| TOTAL FRANCE | 4,406,028 | |
| GERMANY – 9.1% | ||
| Allianz SE | 2,544 | 458,117 |
| Bayerische Motoren Werke AG | 4,269 | 335,516 |
| Daimler AG | 6,342 | 367,312 |
| Deutsche Bank AG | 37,105 | 354,259 |
| Deutsche Post AG | 11,948 | 424,054 |
| Deutsche Telekom AG | 26,015 | 492,743 |
| Fresenius SE & Co. KGaA | 13,406 | 308,721 |
| SAP SE | 5,584 | 539,036 |
| Vonovia SE | 6,941 | 153,667 |
| TOTAL GERMANY | 3,433,425 | |
| HONG KONG – 1.5% | ||
| AIA Group Ltd. | 48,200 | 365,037 |
| Sun Hung Kai Properties Ltd. | 17,000 | 182,889 |
| TOTAL HONG KONG | 547,926 | |
| ITALY – 3.0% | ||
| Enel SpA | 102,216 | 456,533 |
| Eni SpA | 20,519 | 268,791 |
| UniCredit SpA | 33,869 | 420,037 |
| TOTAL ITALY | 1,145,361 | |
| JAPAN – 21.3% | ||
| Daiwa House Industry Co. Ltd. | 14,800 | 299,913 |
| Fujitsu Ltd. | 2,800 | 322,602 |
| Honda Motor Co. Ltd. | 11,800 | 267,779 |
| Inpex Corp. | 23,200 | 236,940 |
| ITOCHU Corp. | 15,500 | 401,383 |
| Japan Post Holdings Co. Ltd. | 52,100 | 350,383 |
| Japan Tobacco, Inc. | 33,700 | 558,662 |
| KDDI Corp. | 11,300 | 334,131 |
| Marubeni Corp. | 40,200 | 352,411 |
| Medipal Holdings Corp. | 26,700 | 331,426 |
| Mitsubishi Corp. | 14,400 | 390,530 |
| Mitsui & Co. Ltd. | 19,300 | 427,590 |
| NEC Corp. | 9,000 | 298,214 |
| Nippon Steel Corp. | 30,200 | 415,000 |
| Nippon Telegraph & Telephone Corp. | 11,000 | 302,984 |
| Nippon Yusen KK | 13,500 | 245,141 |
| Otsuka Holdings Co. Ltd. | 12,100 | 387,988 |
| Sony Group Corp. | 5,300 | 356,150 |
| Annual Report | 30 |
| Common Stocks – continued | ||
| Shares | Value | |
| JAPAN – continued | ||
| Sumitomo Forestry Co. Ltd. | 13,300 | $ 208,491 |
| Sumitomo Mitsui Financial Group, Inc. | 14,700 | 412,710 |
| Tokyo Electric Power Co. Holdings, Inc. (a) | 73,100 | 238,527 |
| Tokyo Electron Ltd. | 1,300 | 345,390 |
| Toyota Motor Corp. | 43,200 | 598,583 |
| TOTAL JAPAN | 8,082,928 | |
| LUXEMBOURG – 0.8% | ||
| ArcelorMittal S.A. | 13,888 | 310,967 |
| TOTAL LUXEMBOURG | 310,967 | |
| NETHERLANDS – 3.4% | ||
| Heineken Holding N.V. | 2,668 | 182,211 |
| Koninklijke Ahold Delhaize N.V. | 9,310 | 259,943 |
| Koninklijke Philips N.V. | 17,114 | 216,812 |
| Randstad N.V. | 6,296 | 313,871 |
| Stellantis N.V. | 23,227 | 313,585 |
| TOTAL NETHERLANDS | 1,286,422 | |
| SINGAPORE – 1.3% | ||
| Oversea-Chinese Banking Corp. Ltd. | 31,000 | 265,727 |
| Singapore Telecommunications Ltd. | 131,800 | 232,846 |
| TOTAL SINGAPORE | 498,573 | |
| SPAIN – 1.1% | ||
| Banco Santander S.A. | 155,061 | 401,834 |
| TOTAL SPAIN | 401,834 | |
| SWEDEN – 2.3% | ||
| Essity AB Class B | 8,756 | 184,938 |
| Telefonaktiebolaget LM Ericsson Class B | 43,480 | 241,589 |
| Volvo AB Class B | 28,082 | 459,459 |
| TOTAL SWEDEN | 885,986 | |
| SWITZERLAND – 7.9% | ||
| Adecco Group AG | 10,081 | 315,702 |
| Alcon, Inc. | 2,227 | 135,612 |
| Nestle S.A. | 8,283 | 902,501 |
| Novartis AG | 6,745 | 545,261 |
| Roche Holding AG | 2,010 | 667,925 |
| UBS Group AG | 25,945 | 411,957 |
| TOTAL SWITZERLAND | 2,978,958 | |
| | ||
| Shares | Value | |
| UNITED KINGDOM – 13.5% | ||
| 3i Group PLC | 31,751 | $ 424,238 |
| Anglo American PLC | 11,893 | 357,182 |
| Barclays PLC | 267,442 | 454,981 |
| British American Tobacco PLC | 12,690 | 501,656 |
| GSK PLC | 24,909 | 409,765 |
| Hikma Pharmaceuticals PLC | 15,762 | 226,663 |
| Imperial Brands PLC | 14,917 | 364,790 |
| Kingfisher PLC | 109,354 | 275,605 |
| Marks & Spencer Group PLC (a) | 170,245 | 206,792 |
| RELX PLC | 13,142 | 354,218 |
| Rio Tinto PLC | 7,700 | 402,223 |
| Segro PLC | 9,742 | 88,049 |
| Shell PLC | 24,863 | 688,169 |
| Vodafone Group PLC | 299,913 | 350,968 |
| TOTAL UNITED KINGDOM | 5,105,299 | |
| TOTAL COMMON STOCKS (Cost $43,612,655) | 37,612,084 | |
| Money Market Fund – 0.1% | ||
| Fidelity Cash Central Fund, 3.10% (c) (Cost $34,107) | 34,100 | 34,107 |
| TOTAL INVESTMENT IN SECURITIES – 99.4% (Cost $43,646,762) | 37,646,191 | |
| NET OTHER ASSETS (LIABILITIES) – 0.6% | 236,393 | |
| NET ASSETS – 100.0% | $ 37,882,584 | |
| Categorizations in the Schedule of Investments are based on country or territory of incorporation. | ||
| Legend | ||
| (a) | Non-income producing. | |
| (b) | Security is exempt from registration under Rule 144A of the Securities Act of 1933. These securities may be resold in transactions exempt from registration, normally to qualified institutional buyers. At the end of the period, the value of these securities amounted to $411,739 or 1.1% of net assets. | |
| (c) | Affiliated fund that is generally available only to investment companies and other accounts managed by Fidelity Investments. The rate quoted is the annualized seven-day yield of the fund at period end. A complete unaudited listing of the fund's holdings as of its most recent quarter end is available upon request. In addition, each Fidelity Central Fund's financial statements, which are not covered by the Fund's Report of Independent Registered Public Accounting Firm, are available on the SEC's website or upon request. | |
| 31 | Annual Report |
| Futures Contracts | |||||
| Number of contracts | Expiration Date | Notional Amount | Value | Unrealized Appreciation/ (Depreciation) | |
| Purchased | |||||
| Equity Index Contract | |||||
| ICE MSCI EAFE Index (United States) | 3 | December 2022 | $263,385 | $13,176 | $13,176 |
| Fund | Value, beginning of period | Purchases | Sales Proceeds | Dividend Income | Realized Gain/Loss | Change in Unrealized appreciation (depreciation) | Value, end of period | % ownership, end of period | ||||||
| Fidelity Cash Central Fund, 3.10% | $33,305 | $ 8,725,193 | $ 8,724,391 | $ 890 | $— | $— | $34,107 | 0.0% | ||||||
| Fidelity Securities Lending Cash Central Fund, 3.10% | — | 2,367,210 | 2,367,210 | 4,068 | — | — | $ — | 0.0% | ||||||
| Total | $33,305 | $11,092,403 | $11,091,601 | $4,958 | $— | $— | $34,107 |
| Annual Report | 32 |
| Description | Total | Level 1 | Level 2 | Level 3 |
| Investments in Securities: | ||||||||
| Equities: | ||||||||
| Communication Services | $ 1,713,672 | $ 1,713,672 | $ — | $ — | ||||
| Consumer Discretionary | 4,165,610 | 4,165,610 | — | — | ||||
| Consumer Staples | 3,534,430 | 3,534,430 | — | — | ||||
| Energy | 2,672,939 | 2,672,939 | — | — | ||||
| Financials | 7,497,015 | 7,497,015 | — | — | ||||
| Health Care | 4,022,864 | 4,022,864 | — | — | ||||
| Industrials | 5,858,485 | 5,858,485 | — | — | ||||
| Information Technology | 2,947,218 | 2,947,218 | — | — | ||||
| Materials | 3,015,428 | 3,015,428 | — | — | ||||
| Real Estate | 828,468 | 828,468 | — | — | ||||
| Utilities | 1,355,955 | 1,355,955 | — | — | ||||
| Money Market Fund | 34,107 | 34,107 | — | — | ||||
| Total Investments in Securities: | $ 37,646,191 | $ 37,646,191 | $ — | $ — |
| Derivative Instruments: | ||||||||
| Assets | ||||||||
| Futures Contracts | $ 13,176 | $ 13,176 | $ — | $ — | ||||
| Total Assets | $ 13,176 | $ 13,176 | — | $ — | ||||
| Total Derivative Instruments: | $ 13,176 | $ 13,176 | $ — | $ — |
| Primary Risk/ Derivative Type | Value | ||
| Asset | Liabilities | ||
| Equity Risk | |||
| Futures Contracts(a) | $13,176 | $0 | |
| Total Equity Risk | 13,176 | 0 | |
| Total Value of Derivatives | $13,176 | $0 | |
| (a) | Reflects gross cumulative appreciation (depreciation) on futures contracts as presented in the Schedule of Investments. In the Statement of Assets and Liabilities, the period end daily variation margin is included in receivable or payable for daily variation margin on futures contracts, and the net cumulative appreciation (depreciation) is included in total accumulated earnings (loss). |
| 33 | Annual Report |
| Fidelity Emerging Markets Multifactor ETF | Fidelity International High Dividend ETF | Fidelity International Multifactor ETF | Fidelity International Value Factor ETF | ||||
| Assets | |||||||
| Investments in securities, at value – See accompanying schedule: | |||||||
| Unaffiliated issuers | $19,462,763 | $ 80,183,405 | $13,144,176 | $ 37,612,084 | |||
| Fidelity Central Funds | — | 48,989 | — | 34,107 | |||
| Total Investments in Securities | $19,462,763 | $ 80,232,394 | $13,144,176 | $ 37,646,191 | |||
| Segregated cash with brokers for derivative instruments | 2,153 | 27,207 | 4,535 | 13,604 | |||
| Cash | 3,365 | 27,923 | 14,408 | 2,513 | |||
| Foreign currency held at value (cost $79,251, $46,348, $12,008 and $14,297, respectively) | 79,666 | 45,994 | 12,090 | 14,213 | |||
| Dividends receivable | 10,579 | 249,595 | 40,105 | 143,789 | |||
| Reclaims receivable | — | 176,377 | 32,184 | 76,386 | |||
| Total assets | 19,558,526 | 80,759,490 | 13,247,498 | 37,896,696 | |||
| Liabilities | |||||||
| Accrued management fees | 7,386 | 25,416 | 4,159 | 11,931 | |||
| Payable for daily variation margin on futures contracts | 102 | 4,361 | 727 | 2,181 | |||
| Other payables and accrued expenses | 43,759 | — | — | — | |||
| Total liabilities | 51,247 | 29,777 | 4,886 | 14,112 | |||
| Net Assets | $19,507,279 | $ 80,729,713 | $13,242,612 | $ 37,882,584 | |||
| Net Assets consist of: | |||||||
| Paid in capital | $25,651,703 | $108,415,781 | $16,474,199 | $ 49,389,932 | |||
| Total accumulated earnings (loss) | (6,144,424) | (27,686,068) | (3,231,587) | (11,507,348) | |||
| Net Assets | $19,507,279 | $ 80,729,713 | $13,242,612 | $ 37,882,584 | |||
| Shares outstanding | 1,000,000 | 4,800,000 | 600,000 | 2,000,000 | |||
| Net Asset Value per share | $ 19.51 | $ 16.82 | $ 22.07 | $ 18.94 | |||
| Investments at cost – Unaffiliated issuers | $23,308,104 | $100,246,882 | $14,699,227 | $ 43,612,655 | |||
| Investments at cost – Fidelity Central Funds | — | 48,989 | — | 34,107 | |||
| Investments at cost | $23,308,104 | $100,295,871 | $14,699,227 | $ 43,646,762 |
| Annual Report | 34 |
| Fidelity Emerging Markets Multifactor ETF | Fidelity International High Dividend ETF | Fidelity International Multifactor ETF | Fidelity International Value Factor ETF | ||||
| Investment Income | |||||||
| Dividends | $ 972,125 | $ 4,735,912 | $ 462,778 | $ 1,703,163 | |||
| Non-Cash dividends | 57,540 | 522,171 | 40,383 | 109,482 | |||
| Interest | 55 | 188 | 32 | 87 | |||
| Income from Fidelity Central Funds (including $—, $22,047, $— and $4,068, from security lending, respectively) | 93 | 22,741 | 128 | 4,958 | |||
| Income before foreign taxes withheld | 1,029,813 | 5,281,012 | 503,321 | 1,817,690 | |||
| Less foreign taxes withheld | (109,425) | (440,798) | (52,974) | (146,462) | |||
| Total income | 920,388 | 4,840,214 | 450,347 | 1,671,228 | |||
| Expenses | |||||||
| Management fees | 96,586 | 353,053 | 60,629 | 156,069 | |||
| Independent trustees' fees and expenses | 73 | 305 | 54 | 135 | |||
| Total expenses before reductions | 96,659 | 353,358 | 60,683 | 156,204 | |||
| Expense reductions | (2) | (3) | (47) | (53) | |||
| Total expenses | 96,657 | 353,355 | 60,636 | 156,151 | |||
| Net investment income (loss) | 823,731 | 4,486,859 | 389,711 | 1,515,077 | |||
| Realized and Unrealized Gain (Loss) | |||||||
| Net realized gain (loss) on investment securities (net of foreign taxes of $24,041, $-, $-, $-, respectively.) | (1,810,814) | (1,425,978) | (1,493,659) | (3,816,218) | |||
| Net realized gain (loss) on In-kind redemptions | — | 6,994,732 | 376,924 | 2,088,639 | |||
| Net realized gain (loss) on futures contracts | (28,472) | (260,918) | (36,554) | (77,444) | |||
| Net realized gain (loss) on foreign currency transactions | (36,299) | (70,612) | (10,551) | (32,689) | |||
| Total net realized gain (loss) | (1,875,585) | 5,237,224 | (1,163,840) | (1,837,712) | |||
| Change in net unrealized appreciation (depreciation) on investment securities (net of decrease in deferred foreign taxes of $9,906, $-, $- and $-, respectively.) | (3,939,345) | (26,538,731) | (3,137,698) | (8,191,717) | |||
| Change in net unrealized appreciation (depreciation) on futures contracts | 623 | (4,439) | (1,730) | 11,459 | |||
| Change in net unrealized appreciation (depreciation) on assets and liabilities in foreign currencies | 1,051 | (25,650) | (3,731) | (11,012) | |||
| Total change in net unrealized appreciation (depreciation) | (3,937,671) | (26,568,820) | (3,143,159) | (8,191,270) | |||
| Net gain (loss) | (5,813,256) | (21,331,596) | (4,306,999) | (10,028,982) | |||
| Net increase (decrease) in net assets resulting from operations | $(4,989,525) | $(16,844,737) | $(3,917,288) | $ (8,513,905) |
| 35 | Annual Report |
| Fidelity Emerging Markets Multifactor ETF | Fidelity International High Dividend ETF | ||||||
| Year ended October 31, 2022 | Year ended October 31, 2021 | Year ended October 31, 2022 | Year ended October 31, 2021 | ||||
| Increase (Decrease) in Net Assets | |||||||
| Operations | |||||||
| Net investment income (loss) | $ 823,731 | $ 500,688 | $ 4,486,859 | $ 2,736,527 | |||
| Net realized gain (loss) | (1,875,585) | 136,954 | 5,237,224 | 2,501,097 | |||
| Change in net unrealized appreciation (depreciation) | (3,937,671) | 259,838 | (26,568,820) | 16,555,183 | |||
| Net increase (decrease) in net assets resulting from operations | (4,989,525) | 897,480 | (16,844,737) | 21,792,807 | |||
| Distributions to shareholders | (826,772) | (465,600) | (4,783,300) | (2,688,900) | |||
| Return of capital | (29,228) | — | — | — | |||
| Total distributions | (856,000) | (465,600) | (4,783,300) | (2,688,900) | |||
| Share transactions | |||||||
| Proceeds from sales of shares | 4,649,878 | 11,022,150 | 55,975,704 | 17,802,806 | |||
| Cost of shares redeemed | — | — | (35,815,029) | — | |||
| Net increase (decrease) in net assets resulting from share transactions | 4,649,878 | 11,022,150 | 20,160,675 | 17,802,806 | |||
| Total increase (decrease) in net assets | (1,195,647) | 11,454,030 | (1,467,362) | 36,906,713 | |||
| Net Assets | |||||||
| Beginning of year | 20,702,926 | 9,248,896 | 82,197,075 | 45,290,362 | |||
| End of year | $19,507,279 | $20,702,926 | $ 80,729,713 | $82,197,075 | |||
| Other Information | |||||||
| Shares | |||||||
| Sold | 200,000 | 400,000 | 2,600,000 | 900,000 | |||
| Redeemed | — | — | (1,700,000) | — | |||
| Net increase (decrease) | 200,000 | 400,000 | 900,000 | 900,000 | |||
| Annual Report | 36 |
| Fidelity International Multifactor ETF | Fidelity International Value Factor ETF | ||||||
| Year ended October 31, 2022 | Year ended October 31, 2021 | Year ended October 31, 2022 | Year ended October 31, 2021 | ||||
| Increase (Decrease) in Net Assets | |||||||
| Operations | |||||||
| Net investment income (loss) | $ 389,711 | $ 305,654 | $ 1,515,077 | $ 953,166 | |||
| Net realized gain (loss) | (1,163,840) | 299,275 | (1,837,712) | 2,419,526 | |||
| Change in net unrealized appreciation (depreciation) | (3,143,159) | 1,701,847 | (8,191,270) | 3,280,854 | |||
| Net increase (decrease) in net assets resulting from operations | (3,917,288) | 2,306,776 | (8,513,905) | 6,653,546 | |||
| Distributions to shareholders | (524,400) | (291,700) | (1,749,900) | (1,020,000) | |||
| Return of capital | — | — | — | — | |||
| Total distributions | (524,400) | (291,700) | (1,749,900) | (1,020,000) | |||
| Share transactions | |||||||
| Proceeds from sales of shares | 2,824,049 | 8,431,231 | 18,476,821 | 26,441,620 | |||
| Cost of shares redeemed | (2,787,735) | — | (11,779,865) | (4,879,284) | |||
| Net increase (decrease) in net assets resulting from share transactions | 36,314 | 8,431,231 | 6,696,956 | 21,562,336 | |||
| Total increase (decrease) in net assets | (4,405,374) | 10,446,307 | (3,566,849) | 27,195,882 | |||
| Net Assets | |||||||
| Beginning of year | 17,647,986 | 7,201,679 | 41,449,433 | 14,253,551 | |||
| End of year | $13,242,612 | $17,647,986 | $ 37,882,584 | $41,449,433 | |||
| Other Information | |||||||
| Shares | |||||||
| Sold | 100,000 | 300,000 | 800,000 | 1,100,000 | |||
| Redeemed | (100,000) | — | (500,000) | (200,000) | |||
| Net increase (decrease) | — | 300,000 | 300,000 | 900,000 | |||
| 37 | Annual Report |
| Fidelity Emerging Markets Multifactor ETF | |||||||
| Year ended October 31, 2022 | Year ended October 31, 2021 | Year ended October 31, 2020 | Year ended October 31, 2019A | ||||
| Selected Per-Share Data | |||||||
| Net asset value, beginning of period | $ 25.88 | $ 23.12 | $24.68 | $25.00 | |||
| Income from Investment Operations | |||||||
| Net investment income (loss)B | 0.89 | 0.72 | 0.55 | 0.50 | |||
| Net realized and unrealized gain (loss) | (6.37) | 2.67 | (1.57) | (0.34) | |||
| Total from investment operations | (5.48) | 3.39 | (1.02) | 0.16 | |||
| Distributions from net investment income | (0.86) | (0.63) | (0.54) | (0.48) | |||
| Return of capital | (0.03) | — | — | — | |||
| Total distributions | (0.89) | (0.63) | (0.54) | (0.48) | |||
| Net asset value, end of period | $ 19.51 | $ 25.88 | $23.12 | $24.68 | |||
| Total ReturnC,D,E | (21.56)% | 14.55% | (4.03)% | 0.66% | |||
| Ratios to Average Net AssetsF,G,H | |||||||
| Expenses before reductions | .45% | .45% | .45% | .45% I | |||
| Expenses net of fee waivers, if any | .45% | .45% | .45% | .45% I | |||
| Expenses net of all reductions | .45% | .45% | .45% | .45% I | |||
| Net investment income (loss) | 3.84% | 2.64% | 2.39% | 3.05% I | |||
| Supplemental Data | |||||||
| Net assets, end of period (000 omitted) | $19,507 | $20,703 | $9,249 | $9,872 | |||
| Portfolio turnover rateJ | 91% K | 65% K | 66% | 34% K,L | |||
| A | For the period February 26, 2019 (commencement of operations) through October 31, 2019. |
| B | Calculated based on average shares outstanding during the period. |
| C | Based on net asset value. |
| D | Total returns for periods of less than one year are not annualized. |
| E | Total returns would have been lower if certain expenses had not been reduced during the applicable periods shown. |
| F | Expense ratios reflect operating expenses of the class. Expenses before reductions do not reflect amounts reimbursed, waived, or reduced through arrangements with the investment adviser, brokerage services, or other offset arrangements, if applicable, and do not represent the amount paid by the class during periods when reimbursements, waivers or reductions occur. |
| G | Net investment income (loss) is affected by the timing of the declaration of dividends by any underlying mutual funds or exchange-traded funds (ETFs). Net investment income (loss) of any mutual funds or ETFs is not included in the Fund's net investment income (loss) ratio. |
| H | Fees and expenses of any underlying mutual funds or exchange-traded funds (ETFs) are not included in the Fund’s expense ratio. The Fund indirectly bears its proportionate share of these expenses. For additional expense information related to investments in Fidelity Central Funds, please refer to the "Investments in Fidelity Central Funds" note found in the Notes to Financial Statements section of the most recent Annual or Semi-Annual report. |
| I | Annualized. |
| J | Amount does not include the portfolio activity of any underlying mutual funds or exchange-traded funds (ETFs). |
| K | Portfolio turnover rate excludes securities received or delivered in-kind. |
| L | Amount not annualized. |
| Annual Report | 38 |
| Fidelity International High Dividend ETF | |||||||||
| Year ended October 31, 2022 | Year ended October 31, 2021 | Year ended October 31, 2020 | Year ended October 31, 2019 | Year ended October 31, 2018A | |||||
| Selected Per-Share Data | |||||||||
| Net asset value, beginning of period | $ 21.08 | $ 15.10 | $ 20.96 | $ 20.56 | $ 25.08 | ||||
| Income from Investment Operations | |||||||||
| Net investment income (loss)B | 0.97 | 0.77 | 0.60 | 1.04 | 0.82 | ||||
| Net realized and unrealized gain (loss) | (4.22) | 5.95 | (5.81) | 0.31 | (4.63) | ||||
| Total from investment operations | (3.25) | 6.72 | (5.21) | 1.35 | (3.81) | ||||
| Distributions from net investment income | (1.01) | (0.74) | (0.65) | (0.95) | (0.71) | ||||
| Total distributions | (1.01) | (0.74) | (0.65) | (0.95) | (0.71) | ||||
| Net asset value, end of period | $ 16.82 | $ 21.08 | $ 15.10 | $ 20.96 | $ 20.56 | ||||
| Total ReturnC,D,E | (15.83)% | 44.78% | (24.98)% | 6.84% | (15.44)% | ||||
| Ratios to Average Net AssetsF,G,H | |||||||||
| Expenses before reductions | .39% | .39% | .39% | .39% | .39% I | ||||
| Expenses net of fee waivers, if any | .39% | .39% | .39% | .39% | .39% I | ||||
| Expenses net of all reductions | .39% | .39% | .39% | .39% | .39% I | ||||
| Net investment income (loss) | 4.96% | 3.82% | 3.38% | 5.07% | 4.59% I | ||||
| Supplemental Data | |||||||||
| Net assets, end of period (000 omitted) | $80,730 | $82,197 | $45,290 | $44,022 | $18,500 | ||||
| Portfolio turnover rateJ,K | 71% | 67% | 82% | 47% | 42% L | ||||
| A | For the period January 16, 2018 (commencement of operations) through October 31, 2018. |
| B | Calculated based on average shares outstanding during the period. |
| C | Based on net asset value. |
| D | Total returns for periods of less than one year are not annualized. |
| E | Total returns would have been lower if certain expenses had not been reduced during the applicable periods shown. |
| F | Expense ratios reflect operating expenses of the class. Expenses before reductions do not reflect amounts reimbursed, waived, or reduced through arrangements with the investment adviser, brokerage services, or other offset arrangements, if applicable, and do not represent the amount paid by the class during periods when reimbursements, waivers or reductions occur. |
| G | Net investment income (loss) is affected by the timing of the declaration of dividends by any underlying mutual funds or exchange-traded funds (ETFs). Net investment income (loss) of any mutual funds or ETFs is not included in the Fund's net investment income (loss) ratio. |
| H | Fees and expenses of any underlying mutual funds or exchange-traded funds (ETFs) are not included in the Fund’s expense ratio. The Fund indirectly bears its proportionate share of these expenses. For additional expense information related to investments in Fidelity Central Funds, please refer to the "Investments in Fidelity Central Funds" note found in the Notes to Financial Statements section of the most recent Annual or Semi-Annual report. |
| I | Annualized. |
| J | Amount does not include the portfolio activity of any underlying mutual funds or exchange-traded funds (ETFs). |
| K | Portfolio turnover rate excludes securities received or delivered in-kind. |
| L | Amount not annualized. |
| 39 | Annual Report |
| Fidelity International Multifactor ETF | |||||||
| Year ended October 31, 2022 | Year ended October 31, 2021 | Year ended October 31, 2020 | Year ended October 31, 2019A | ||||
| Selected Per-Share Data | |||||||
| Net asset value, beginning of period | $ 29.41 | $ 24.01 | $26.18 | $ 25.05 | |||
| Income from Investment Operations | |||||||
| Net investment income (loss)B | 0.65 | 0.65 | 0.57 | 0.55 | |||
| Net realized and unrealized gain (loss) | (7.12) | 5.34 | (2.07) | 1.12 | |||
| Total from investment operations | (6.47) | 5.99 | (1.50) | 1.67 | |||
| Distributions from net investment income | (0.87) | (0.59) | (0.67) | (0.54) | |||
| Total distributions | (0.87) | (0.59) | (0.67) | (0.54) | |||
| Net asset value, end of period | $ 22.07 | $ 29.41 | $24.01 | $ 26.18 | |||
| Total ReturnC,D,E | (22.36)% | 25.08% | (5.73)% | 6.72% | |||
| Ratios to Average Net AssetsF,G,H | |||||||
| Expenses before reductions | .39% | .39% | .39% | .39% I | |||
| Expenses net of fee waivers, if any | .39% | .39% | .39% | .39% I | |||
| Expenses net of all reductions | .39% | .39% | .39% | .39% I | |||
| Net investment income (loss) | 2.51% | 2.28% | 2.29% | 3.18% I | |||
| Supplemental Data | |||||||
| Net assets, end of period (000 omitted) | $13,243 | $17,648 | $7,202 | $10,473 | |||
| Portfolio turnover rateJ,K | 61% | 74% | 69% | 35% L | |||
| A | For the period February 26, 2019 (commencement of operations) through October 31, 2019. |
| B | Calculated based on average shares outstanding during the period. |
| C | Based on net asset value. |
| D | Total returns for periods of less than one year are not annualized. |
| E | Total returns would have been lower if certain expenses had not been reduced during the applicable periods shown. |
| F | Expense ratios reflect operating expenses of the class. Expenses before reductions do not reflect amounts reimbursed, waived, or reduced through arrangements with the investment adviser, brokerage services, or other offset arrangements, if applicable, and do not represent the amount paid by the class during periods when reimbursements, waivers or reductions occur. |
| G | Net investment income (loss) is affected by the timing of the declaration of dividends by any underlying mutual funds or exchange-traded funds (ETFs). Net investment income (loss) of any mutual funds or ETFs is not included in the Fund's net investment income (loss) ratio. |
| H | Fees and expenses of any underlying mutual funds or exchange-traded funds (ETFs) are not included in the Fund’s expense ratio. The Fund indirectly bears its proportionate share of these expenses. For additional expense information related to investments in Fidelity Central Funds, please refer to the "Investments in Fidelity Central Funds" note found in the Notes to Financial Statements section of the most recent Annual or Semi-Annual report. |
| I | Annualized. |
| J | Amount does not include the portfolio activity of any underlying mutual funds or exchange-traded funds (ETFs). |
| K | Portfolio turnover rate excludes securities received or delivered in-kind. |
| L | Amount not annualized. |
| Annual Report | 40 |
| Fidelity International Value Factor ETF | |||||||||
| Year ended October 31, 2022 | Year ended October 31, 2021 | Year ended October 31, 2020 | Year ended October 31, 2019 | Year ended October 31, 2018A | |||||
| Selected Per-Share Data | |||||||||
| Net asset value, beginning of period | $ 24.38 | $ 17.82 | $ 21.89 | $ 20.89 | $ 25.00 | ||||
| Income from Investment Operations | |||||||||
| Net investment income (loss)B | 0.83 | 0.79 | 0.51 | 0.80 | 0.62 | ||||
| Net realized and unrealized gain (loss) | (5.32) | 6.54 | (4.09) | 1.05 | (4.18) | ||||
| Total from investment operations | (4.49) | 7.33 | (3.58) | 1.85 | (3.56) | ||||
| Distributions from net investment income | (0.95) | (0.77) | (0.49) | (0.85) | (0.55) | ||||
| Total distributions | (0.95) | (0.77) | (0.49) | (0.85) | (0.55) | ||||
| Net asset value, end of period | $ 18.94 | $ 24.38 | $ 17.82 | $ 21.89 | $ 20.89 | ||||
| Total ReturnC,D,E | (18.82)% | 41.36% | (16.32)% | 9.04% | (14.46)% | ||||
| Ratios to Average Net AssetsF,G,H | |||||||||
| Expenses before reductions | .39% | .39% | .39% | .39% | .39% I | ||||
| Expenses net of fee waivers, if any | .39% | .39% | .39% | .39% | .39% I | ||||
| Expenses net of all reductions | .39% | .39% | .39% | .39% | .39% I | ||||
| Net investment income (loss) | 3.79% | 3.32% | 2.60% | 3.74% | 3.38% I | ||||
| Supplemental Data | |||||||||
| Net assets, end of period (000 omitted) | $37,883 | $41,449 | $14,254 | $13,135 | $12,532 | ||||
| Portfolio turnover rateJ | 69% K | 101% K | 76% K | 56% | 65% K,L | ||||
| A | For the period January 16, 2018 (commencement of operations) through October 31, 2018. |
| B | Calculated based on average shares outstanding during the period. |
| C | Based on net asset value. |
| D | Total returns for periods of less than one year are not annualized. |
| E | Total returns would have been lower if certain expenses had not been reduced during the applicable periods shown. |
| F | Expense ratios reflect operating expenses of the class. Expenses before reductions do not reflect amounts reimbursed, waived, or reduced through arrangements with the investment adviser, brokerage services, or other offset arrangements, if applicable, and do not represent the amount paid by the class during periods when reimbursements, waivers or reductions occur. |
| G | Net investment income (loss) is affected by the timing of the declaration of dividends by any underlying mutual funds or exchange-traded funds (ETFs). Net investment income (loss) of any mutual funds or ETFs is not included in the Fund's net investment income (loss) ratio. |
| H | Fees and expenses of any underlying mutual funds or exchange-traded funds (ETFs) are not included in the Fund’s expense ratio. The Fund indirectly bears its proportionate share of these expenses. For additional expense information related to investments in Fidelity Central Funds, please refer to the "Investments in Fidelity Central Funds" note found in the Notes to Financial Statements section of the most recent Annual or Semi-Annual report. |
| I | Annualized. |
| J | Amount does not include the portfolio activity of any underlying mutual funds or exchange-traded funds (ETFs). |
| K | Portfolio turnover rate excludes securities received or delivered in-kind. |
| L | Amount not annualized. |
| 41 | Annual Report |
For the period ended October 31, 2022
| Fidelity Central Fund | Investment Manager | Investment Objective | Investment Practices | Expense Ratio(a) |
| Fidelity Money Market Central Funds | Fidelity Management & Research Company LLC (FMR) | Each fund seeks to obtain a high level of current income consistent with the preservation of capital and liquidity. | Short-term Investments | Less than .005% |
| Annual Report | 42 |
Valuation techniques used to value each Fund’s investments by major category are as follows:
| 43 | Annual Report |
on the jurisdiction. Foreign taxes are provided for based on each Fund’s understanding of the tax rules and rates that exist in the foreign markets in which it invests. Fidelity Emerging Markets Multifactor ETF is subject to a tax imposed on capital gains by certain countries in which it invests. An estimated deferred tax liability for net unrealized appreciation on the applicable securities is included in Other payables and accrued expenses on the Statements of Assets & Liabilities.
| Tax cost | Gross unrealized appreciation | Gross unrealized depreciation | Net unrealized appreciation (depreciation) | |
| Fidelity Emerging Markets Multifactor ETF | $ 23,437,935 | $ 727,787 | $ (4,702,959) | $ (3,975,172) |
| Fidelity International High Dividend ETF | 100,879,403 | 585,940 | (21,232,949) | (20,647,009) |
| Fidelity International Multifactor ETF | 14,764,034 | 354,549 | (1,974,407) | (1,619,858) |
| Fidelity International Value Factor ETF | 43,848,873 | 757,123 | (6,959,805) | (6,202,682) |
| Undistributed ordinary income | Undistributed capital gains | Capital loss carryforward | Net unrealized appreciation (depreciation) | |
| Fidelity Emerging Markets Multifactor ETF | $ — | $ — | $ (2,125,898) | $ (4,018,526) |
| Fidelity International High Dividend ETF | — | — | (7,010,226) | (20,675,839) |
| Fidelity International Multifactor ETF | — | — | (1,608,364) | (1,623,223) |
| Fidelity International Value Factor ETF | — | — | (5,291,688) | (6,215,660) |
| Short-term | Long-term | Total capital loss carryforward | |
| Fidelity Emerging Markets Multifactor ETF | $ (1,574,210) | $ (551,688) | $ (2,125,898) |
| Fidelity International High Dividend ETF | (2,117,907) | (4,892,319) | (7,010,226) |
| Fidelity International Multifactor ETF | (1,247,940) | (360,424) | (1,608,364) |
| Fidelity International Value Factor ETF | (2,905,914) | (2,385,774) | (5,291,688) |
| October 31, 2022 | ||||
| Ordinary Income | Long-Term Capital Gain | Tax Return Of Capital | Total | |
| Fidelity Emerging Markets Multifactor ETF | $ 826,772 | $ — | $ 29,228 | $ 856,000 |
| Fidelity International High Dividend ETF | 4,783,300 | — | — | 4,783,300 |
| Fidelity International Multifactor ETF | 524,400 | — | — | 524,400 |
| Fidelity International Value Factor ETF | 1,749,900 | — | — | 1,749,900 |
| Annual Report | 44 |
| October 31, 2021 | ||||
| Fidelity Emerging Markets Multifactor ETF | $ 465,600 | $ — | $ — | $ 465,600 |
| Fidelity International High Dividend ETF | 2,688,900 | — | — | 2,688,900 |
| Fidelity International Multifactor ETF | 291,700 | — | — | 291,700 |
| Fidelity International Value Factor ETF | 1,020,000 | — | — | 1,020,000 |
| 45 | Annual Report |
| Purchases ($) | Sales ($) | |
| Fidelity Emerging Markets Multifactor ETF | 22,673,638 | 19,171,646 |
| Fidelity International High Dividend ETF | 65,943,525 | 63,169,152 |
| Fidelity International Multifactor ETF | 9,519,150 | 9,404,228 |
| Fidelity International Value Factor ETF | 27,287,503 | 27,328,660 |
| In-Kind Subscriptions ($) | In-Kind Redemptions ($) | |
| Fidelity Emerging Markets Multifactor ETF | 1,041,928 | — |
| Fidelity International High Dividend ETF | 52,059,021 | 35,372,995 |
| Fidelity International Multifactor ETF | 2,689,595 | 2,779,745 |
| Fidelity International Value Factor ETF | 17,920,852 | 11,565,596 |
| Total Security Lending Fees Paid to NFS | Security Lending Income From Securities Loaned to NFS | Value of Securities Loaned to NFS at Period End | |
| Fidelity International High Dividend ETF | $ 2,375 | $ — | $ — |
| Fidelity International Value Factor ETF | 439 | — | — |
| Annual Report | 46 |
| Amount | |
| Fidelity Emerging Markets Multifactor ETF | $ 2 |
| Fidelity International High Dividend ETF | 3 |
| Fidelity International Multifactor ETF | 47 |
| Fidelity International Value Factor ETF | 53 |
| 47 | Annual Report |
| Annual Report | 48 |
| 49 | Annual Report |
| Annual Report | 50 |
| 51 | Annual Report |
| Annual Report | 52 |
| 53 | Annual Report |
| Annual Report | 54 |
| 55 | Annual Report |
| Annualized Expense RatioA | Beginning Account Value May 1, 2022 | Ending Account Value October 31, 2022 | Expenses Paid During PeriodB May 1, 2022 to October 31, 2022 | |
| Fidelity Emerging Markets Multifactor ETF | 0.45% | |||
| Actual | $ 1,000.00 | $ 851.00 | $ 2.10 | |
| Hypothetical C | $ 1,000.00 | $ 1,022.94 | $ 2.29 | |
| Fidelity International High Dividend ETF | 0.39% | |||
| Actual | $ 1,000.00 | $ 862.00 | $ 1.83 | |
| Hypothetical C | $ 1,000.00 | $ 1,023.24 | $ 1.99 | |
| Fidelity International Multifactor ETF | 0.39% | |||
| Actual | $ 1,000.00 | $ 866.40 | $ 1.83 | |
| Hypothetical C | $ 1,000.00 | $ 1,023.24 | $ 1.99 | |
| Fidelity International Value Factor ETF | 0.39% | |||
| Actual | $ 1,000.00 | $ 871.40 | $ 1.84 | |
| Hypothetical C | $ 1,000.00 | $ 1,023.24 | $ 1.99 |
| A | Annualized expense ratio reflects expenses net of applicable fee waivers. |
| B | Expenses are equal to the annualized expense ratio, multiplied by the average account value over the period, multiplied by 184/365 (to reflect the one-half year period). The fees and expenses of any Underlying Funds are not included in each annualized expense ratio. |
| C | 5% return per year before expenses. |
| Annual Report | 56 |
| December 2021 | March 2022 | June 2022 | September 2022 | |
| Fidelity Emerging Markets Multifactor ETF | 41% | 70% | 70% | 70% |
| Fidelity International High Dividend ETF | 53% | 100% | 100% | 100% |
| Fidelity International Multifactor ETF | 36% | 100% | 100% | 100% |
| Fidelity International Value Factor ETF | 44% | 100% | 100% | 100% |
| Ex-Date | Income | Taxes | |
| Fidelity Emerging Markets Multifactor ETF | 9/16/2022 | $ 0.2842 | $ 0.0362 |
| 6/17/2022 | $ 0.4285 | $ 0.0545 | |
| 3/18/2022 | $ 0.1169 | $ 0.0149 | |
| 12/30/2021 | $ 0.0085 | $ 0.0015 | |
| 12/17/2021 | $ 0.1914 | $ 0.0334 | |
| Fidelity International High Dividend ETF | 9/16/2022 | $ 0.2538 | $ 0.0218 |
| 6/17/2022 | $ 0.4005 | $ 0.0345 | |
| 3/18/2022 | $ 0.2670 | $ 0.0230 | |
| 12/30/2021 | $ 0.0000 | $ 0.0000 | |
| 12/17/2021 | $ 0.1824 | $ 0.0134 | |
| Fidelity International Multifactor ETF | 9/16/2022 | $ 0.2065 | $ 0.0195 |
| 6/17/2022 | $ 0.2198 | $ 0.0208 | |
| 3/18/2022 | $ 0.2209 | $ 0.0209 | |
| 12/30/2021 | $ 0.0000 | $ 0.0000 | |
| 12/17/2021 | $ 0.3142 | $ 0.0262 | |
| Fidelity International Value Factor ETF | 9/16/2022 | $ 0.2043 | $ 0.0163 |
| 6/17/2022 | $ 0.3009 | $ 0.0239 | |
| 3/18/2022 | $ 0.2358 | $ 0.0188 | |
| 12/30/2021 | $ 0.0000 | $ 0.0000 | |
| 12/17/2021 | $ 0.2864 | $ 0.0194 |
| 57 | Annual Report |
| Annual Report | 58 |
| 59 | Annual Report |
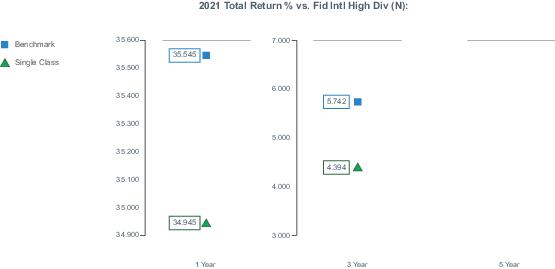
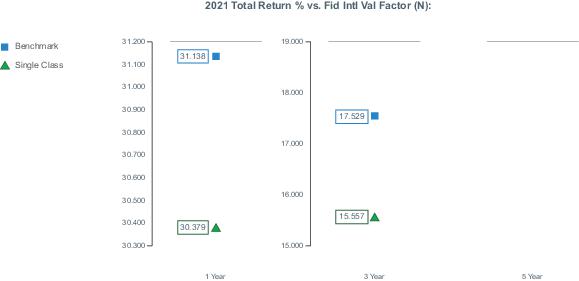
| Annual Report | 60 |
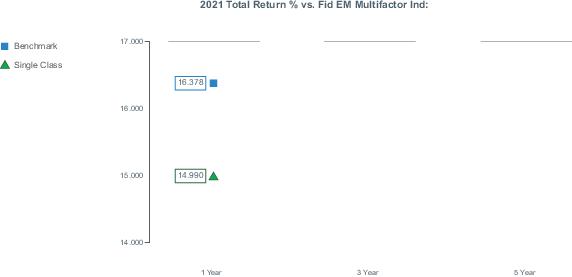
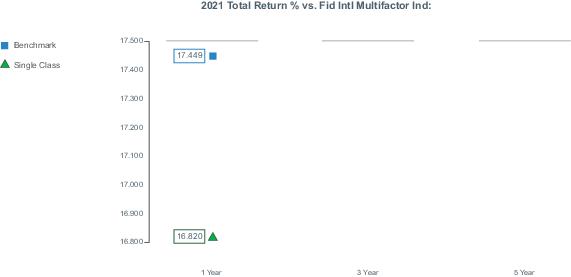
| 61 | Annual Report |
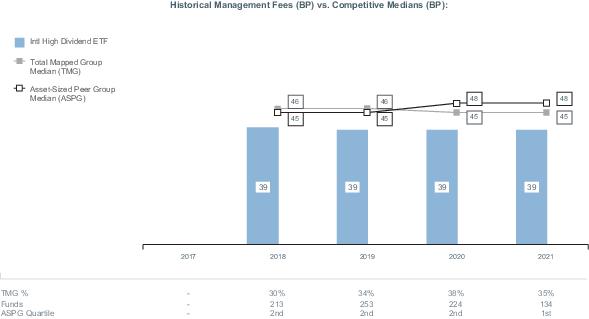
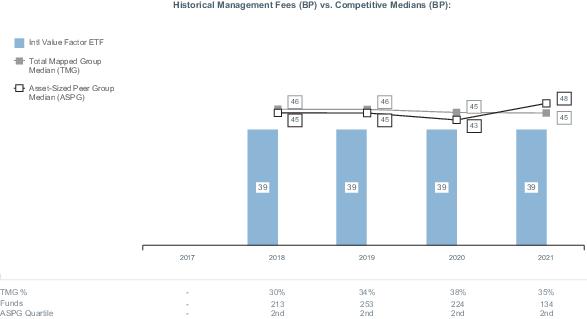
| Annual Report | 62 |
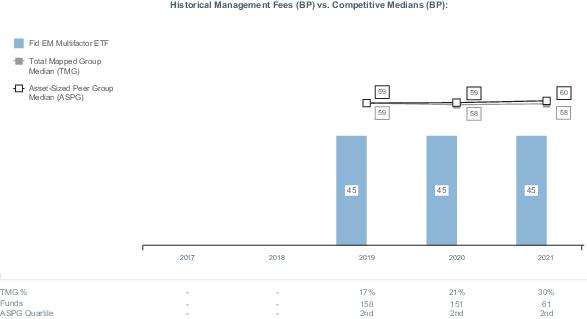

| 63 | Annual Report |
| Annual Report | 64 |
| 65 | Annual Report |
| Item 2. | Code of Ethics |
As of the end of the period, October 31, 2022, Fidelity Covington Trust (the trust) has adopted a code of ethics, as defined in Item 2 of Form N-CSR, that applies to its President and Treasurer and its Chief Financial Officer. A copy of the code of ethics is filed as an exhibit to this Form N-CSR.
| Item 3. | Audit Committee Financial Expert |
The Board of Trustees of the trust has determined that Donald F. Donahue is an audit committee financial expert, as defined in Item 3 of Form N-CSR. Mr. Donahue is independent for purposes of Item 3 of Form N-CSR.
| Item 4. | Principal Accountant Fees and Services |
Fees and Services
The following table presents fees billed by Deloitte & Touche LLP, the member firms of Deloitte Touche Tohmatsu, and their respective affiliates (collectively, “Deloitte Entities”) in each of the last two fiscal years for services rendered to Fidelity Emerging Markets Multifactor ETF, Fidelity International High Dividend ETF, Fidelity International Multifactor ETF and Fidelity International Value Factor ETF (the “Fund(s)”):
Services Billed by Deloitte Entities
October 31, 2022 FeesA
| Audit Fees | Audit- Related Fees | Tax Fees | All Other Fees | |||||||||||||
Fidelity Emerging Markets Multifactor ETF | $ | 16,300 | $ | — | $ | 4,600 | $ | 400 | ||||||||
Fidelity International High Dividend ETF | $ | 16,300 | $ | — | $ | 4,600 | $ | 400 | ||||||||
Fidelity International Multifactor ETF | $ | 16,300 | $ | — | $ | 4,600 | $ | 400 | ||||||||
Fidelity International Value Factor ETF | $ | 16,300 | $ | — | $ | 4,600 | $ | 400 | ||||||||
October 31, 2021 FeesA
| Audit Fees | Audit- Related Fees | Tax Fees | All Other Fees | |||||||||||||
Fidelity Emerging Markets Multifactor ETF | $ | 15,900 | $ | — | $ | 3,500 | $ | 400 | ||||||||
Fidelity International High Dividend ETF | $ | 15,900 | $ | — | $ | 3,500 | $ | 400 | ||||||||
Fidelity International Multifactor ETF | $ | 15,900 | $ | — | $ | 3,500 | $ | 400 | ||||||||
Fidelity International Value Factor ETF | $ | 15,900 | $ | — | $ | 3,500 | $ | 400 | ||||||||
A Amounts may reflect rounding.
The following table(s) present(s) fees billed by Deloitte Entities that were required to be approved by the Audit Committee for services that relate directly to the operations and financial reporting of the Fund(s) and that are rendered on behalf of Fidelity Management & Research Company LLC (“FMR”) and entities controlling, controlled by, or under common control with FMR (not including any sub-adviser whose role is primarily portfolio management and is subcontracted with or overseen by another investment adviser) that provide ongoing services to the Fund(s) (“Fund Service Providers”):
Services Billed by Deloitte Entities
| October 31, 2022A | October 31, 2021A | |||||||
Audit-Related Fees | $ | — | $ | — | ||||
Tax Fees | $ | — | $ | — | ||||
All Other Fees | $ | — | $ | — | ||||
A Amounts may reflect rounding.
“Audit-Related Fees” represent fees billed for assurance and related services that are reasonably related to the performance of the fund audit or the review of the fund’s financial statements and that are not reported under Audit Fees.
“Tax Fees” represent fees billed for tax compliance, tax advice or tax planning that relate directly to the operations and financial reporting of the fund.
“All Other Fees” represent fees billed for services provided to the fund or Fund Service Provider, a significant portion of which are assurance related, that relate directly to the operations and financial reporting of the fund, excluding those services that are reported under Audit Fees, Audit-Related Fees or Tax Fees.
Assurance services must be performed by an independent public accountant.
* * *
The aggregate non-audit fees billed by Deloitte Entities for services rendered to the Fund(s), FMR (not including any sub-adviser whose role is primarily portfolio management and is subcontracted with or overseen by another investment adviser), and any Fund Service Provider for each of the last two fiscal years of the Fund(s) are as follows:
Billed By | October 31, 2022A | October 31, 2021A | ||||||
Deloitte Entities | $ | 477,600 | $ | 537,200 | ||||
A Amounts may reflect rounding.
The trust’s Audit Committee has considered non-audit services that were not pre-approved that were provided by Deloitte Entities to Fund Service Providers to be compatible with maintaining the independence of Deloitte Entities in its(their) audit of the Fund(s), taking into account representations from Deloitte Entities, in accordance with Public Company Accounting Oversight Board rules, regarding its independence from the Fund(s) and its(their) related entities and FMR’s review of the appropriateness and permissibility under applicable law of such non-audit services prior to their provision to the Fund(s) Service Providers.
Audit Committee Pre-Approval Policies and Procedures
The trust’s Audit Committee must pre-approve all audit and non-audit services provided by a fund’s independent registered public accounting firm relating to the operations or financial reporting of the fund. Prior to the commencement of any audit or non-audit services to a fund, the Audit Committee reviews the services to determine whether they are appropriate and permissible under applicable law.
The Audit Committee has adopted policies and procedures to, among other purposes, provide a framework for the Committee’s consideration of non-audit services by the audit firms that audit the Fidelity funds. The policies and procedures require that any non-audit service provided by a fund audit firm to a Fidelity fund and any non-audit service provided by a fund auditor to a Fund Service Provider that relates directly to the operations and financial reporting of a Fidelity fund (“Covered Service”) are subject to approval by the Audit Committee before such service is provided.
All Covered Services must be approved in advance of provision of the service either: (i) by formal resolution of the Audit Committee, or (ii) by oral or written approval of the service by the Chair of the Audit Committee (or if the Chair is unavailable, such other member of the Audit Committee as may be designated by the Chair to act in the Chair’s absence). The approval contemplated by (ii) above is permitted where the Treasurer determines that action on such an engagement is necessary before the next meeting of the Audit Committee.
Non-audit services provided by a fund audit firm to a Fund Service Provider that do not relate directly to the operations and financial reporting of a Fidelity fund are reported to the Audit Committee periodically.
Non-Audit Services Approved Pursuant to Rule 2-01(c)(7)(i)(C) and (ii) of Regulation S-X (“De Minimis Exception”)
There were no non-audit services approved or required to be approved by the Audit Committee pursuant to the De Minimis Exception during the Fund’s(s’) last two fiscal years relating to services provided to (i) the Fund(s) or (ii) any Fund Service Provider that relate directly to the operations and financial reporting of the Fund(s).
| Item 5. | Audit Committee of Listed Registrants |
The Audit Committee is a separately-designated standing audit committee in accordance with Section 3(a)(58)(A) of the Securities Exchange Act of 1934. As of October 31, 2022, the members of the Audit Committee were Donald F. Donahue, Thomas P. Bostick, Thomas Kennedy, Garnett A. Smith, and Susan Tomasky.
| Item 6. | Investments |
(a) Not applicable.
(b) Not applicable.
| Item 7. | Disclosure of Proxy Voting Policies and Procedures for Closed-End Management Investment Companies |
Not applicable.
| Item 8. | Portfolio Managers of Closed-End Management Investment Companies |
Not applicable.
| Item 9. | Purchase of Equity Securities by Closed-End Management Investment Company and Affiliated Purchasers |
Not applicable.
| Item 10. | Submission of Matters to a Vote of Security Holders |
There were no material changes to the procedures by which shareholders may recommend nominees to the trust’s Board of Trustees.
| Item 11. | Controls and Procedures |
(a)(i) The President and Treasurer and the Chief Financial Officer have concluded that the trust’s disclosure controls and procedures (as defined in Rule 30a-3(c) under the Investment Company Act) provide reasonable assurances that material information relating to the trust is made known to them by the appropriate persons, based on their evaluation of these controls and procedures as of a date within 90 days of the filing date of this report.
(a)(ii) There was no change in the trust’s internal control over financial reporting (as defined in Rule 30a-3(d) under the Investment Company Act) that occurred during the period covered by this report that has materially affected, or is reasonably likely to materially affect, the trust’s internal control over financial reporting.
| Item 12. | Disclosure of Securities Lending Activities for Closed-End Management Investment Companies |
Not applicable.
| Item | 13. Exhibits |
SIGNATURES
Pursuant to the requirements of the Securities Exchange Act of 1934 and the Investment Company Act of 1940, the registrant has duly caused this report to be signed on its behalf by the undersigned, thereunto duly authorized.
Fidelity Covington Trust
| By: | /s/ Stacie M. Smith | |
| Stacie M. Smith | ||
| President and Treasurer | ||
| Date: | December 21, 2022 | |
Pursuant to the requirements of the Securities Exchange Act of 1934 and the Investment Company Act of 1940, this report has been signed below by the following persons on behalf of the registrant and in the capacities and on the dates indicated.
| By: | /s/ Stacie M. Smith | |
| Stacie M. Smith | ||
| President and Treasurer | ||
| Date: | December 21, 2022 | |
| By: | /s/ John J. Burke III | |
| John J. Burke III | ||
| Chief Financial Officer | ||
| Date: | December 21, 2022 | |