SECURITIES AND EXCHANGE COMMISSION
Washington, D.C. 20549
(Address of principal executive offices) (Zip code)
(Name and address of agent for service)


| 2 | |
| 4 | |
| 7 | |
| 17 | |
| 19 | |
| 29 | |
| 30 | |
| 31 | |
| 33 | |
| 36 | |
| 49 | |
| 50 | |
| 50 |
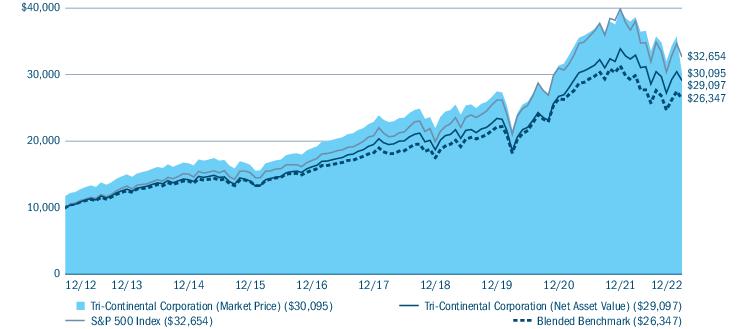
| Average annual total returns (%) (for the period ended December 31, 2022) | |||||
| Inception | 1 Year | 5 Years | 10 Years | ||
| Market Price | 01/05/29 | -16.28 | 7.86 | 11.65 | |
| Net Asset Value | 01/05/29 | -14.10 | 8.34 | 11.27 | |
| S&P 500 Index | -18.11 | 9.42 | 12.56 | ||
| Blended Benchmark | -15.84 | 7.63 | 10.17 | ||
| Price Per Share | ||||
| December 31, 2022 | September 30, 2022 | June 30, 2022 | March 31, 2022 | |
| Market Price ($) | 25.63 | 25.56 | 26.17 | 30.84 |
| Net Asset Value ($) | 29.07 | 28.12 | 29.78 | 35.34 |
Distributions Paid Per Common Share (a) | |
| Payable Date | Per Share Amount ($) |
| March 24, 2022 | 0.2700 |
| June 22, 2022 | 0.8071 (b) |
| September 20, 2022 | 0.2695 |
| December 20, 2022 | 0.8864 (c) |
| 2 | Tri-Continental Corporation | Annual Report 2022 |
| Portfolio breakdown (%) (at December 31, 2022) | |
| Common Stocks | 70.7 |
| Convertible Bonds | 5.8 |
| Convertible Preferred Stocks | 4.8 |
| Corporate Bonds & Notes | 17.4 |
| Money Market Funds | 1.0 |
| Preferred Debt | 0.3 |
| Warrants | 0.0 (a) |
| Total | 100.0 |
| (a) | Rounds to zero. |
| Equity sector breakdown (%) (at December 31, 2022) | |
| Communication Services | 6.0 |
| Consumer Discretionary | 8.2 |
| Consumer Staples | 6.0 |
| Energy | 7.5 |
| Financials | 14.8 |
| Health Care | 15.0 |
| Industrials | 8.3 |
| Information Technology | 21.9 |
| Materials | 3.1 |
| Real Estate | 3.8 |
| Utilities | 5.4 |
| Total | 100.0 |
| Tri-Continental Corporation | Annual Report 2022 | 3 |
| • | Stock selection overall contributed positively to the Fund’s performance relative to the benchmark during the period. |
| • | Stock selection in the consumer discretionary, health care and industrials sectors contributed most positively to the Fund’s relative performance. |
| • | Among the Fund’s greatest individual positive contributors was EOG Resources, Inc., an oil and natural gas exploration and production company, whose shares rose on strong earnings given the elevated price of oil. For investors, a key focus within the exploration and production industry of the energy sector was on companies, like EOG Resources, which have been accelerating the return of cash to equity holders. This focus, in turn, resulted in these companies outperforming exploration and production companies emphasizing debt reduction instead. The portfolio’s overweight in EOG Resources was driven by our quality and catalyst themes, and the models delivered effective stock selection guidance. |
| • | McKesson Corp., a drug distributor and medical services provider, performed well after reporting strong results wherein the company’s profits jumped due to falling expenses and smaller charges for litigation, claims, restructuring and impairment than incurred in prior periods. The portfolio’s overweight in McKesson was based on attractive scores in our catalyst theme, and the model provided positive guidance. |
| 4 | Tri-Continental Corporation | Annual Report 2022 |
| • | Exxon Mobil Corp., the integrated energy producer, generated strong returns during the year, as energy stocks broadly were among the few bright spots in the market turmoil of 2022. Ongoing demand, along with elevated energy prices, boosted returns for Exxon Mobil. The portfolio’s overweight in Exxon Mobil was driven by an attractive catalyst score and an in-line value score, and the models delivered effective stock selection guidance. |
| • | Selections within equities contributed most to performance in the flexible capital segment of the Fund, most notably within the energy, health care and industrials sectors. |
| • | The Fund held a sizable overweight position in energy, which helped the segment capitalize on the sector’s substantial outperformance. Chevron, Exxon Mobil, Pioneer Natural Resources and Valero Energy were all top contributors to performance during the period. |
| • | Our investments in health care stocks, including Bristol Myers Squibb and Abbvie, also outperformed, as we believe investors gravitated toward companies least likely to be affected by broader macroeconomic issues. |
| • | In addition, positions in Raytheon and MetLife were helped by the prospect of increased defense spending and rising interest rates, respectively. |
| • | Positive contributions from the segment’s convertible securities holdings included utilities company South Jersey Industries, construction company Fluor Corporation and communications equipment company Infinera Corporation. |
| • | As usual, the Fund maintained a relatively neutral stance on sector allocation, though sector allocation did detract, albeit modestly, from relative performance during the period. Consumer discretionary (consumer services), communication services and information technology (semiconductors) detracted most during the annual period. |
| • | Stock selection in the information technology, communication services and financials sectors detracted most from the Fund’s relative performance during the period. |
| • | Among the individual stocks detracting most from relative performance was Meta Platforms, Inc., the social media giant and parent company of Facebook, whose share price plummeted amid several headwinds. First, the company reported a sharp decline in profits and said it lost about a million daily users globally. Second, the company forecast higher capital expenditures and no headcount reductions, which contributed to a significantly growing year-over-year operating loss. Further, the company faced increased competition during the annual period from TikTok, less advertising due to a slowing macroeconomic environment and pressures driven by Apple’s privacy changes restricting the sharing of information. The portfolio’s overweight in Meta Platforms was based on its attractive value theme score and in-line quality score, but the models delivered negative stock selection guidance. |
| • | Advanced Micro Devices, Inc., a semiconductor company, saw its shares decline in price as the highly cyclical semiconductor industry faced negative earnings revisions and signs of higher inventory. While the company reported earnings in line with consensus expectations, it lowered its forward guidance on weakness in the personal computer industry. The decision to overweight the portfolio’s position in Advanced Micro Devices was based on strong scores across all three of our investment themes — quality, value and catalyst, but the models provided negative guidance. |
| • | Under Armour Inc. (Class A) is an American sports clothing, footwear and accessories company. Under Armour announced a significant earnings shortfall for its March 2022 quarter and lowered its full-year forward guidance. The earnings shortfall was driven by supply-chain issues, increased freight costs and COVID-19-related lockdowns in China, which resulted in restricted store hours, low inventory and store closures in China. Shortly after this earnings miss, Under Armour’s Chief Executive Officer unexpectedly announced he was stepping down from management of the company, further pressuring its shares. The portfolio’s overweight in Under Armour (Class A) was established based on an attractive quality investment theme score, but the model provided negative guidance. |
| Tri-Continental Corporation | Annual Report 2022 | 5 |
| • | Our fixed-income holdings detracted from performance. Our emphasis on higher yielding segments of the market, while a key contributor from the COVID-19-induced lows of early 2020 through the end of last year, was a key detractor. Individual fixed-income holdings that detracted during the period included Bausch Health, Diebold Nixdorf and Clear Channel Holdings. |
| ○ | Bausch Health failed to provide guidance on how it plans to reduce debt. |
| ○ | ATM producer Diebold Nixdorf reported slower sales due to semiconductor shortages. |
| ○ | Clear Channel Holdings’ debt lagged amid expectations that slowing economic growth would lead to a slowdown in billboard advertising. |
| • | The convertible market remained under pressure from its tilt toward growth companies, which was a headwind at a time in which the value style strongly outperformed. Holdings within the convertible space that weighed most on returns during the period included Clovis Oncology and Arrival. |
| ○ | The FDA did not approve Clovis Oncology’s key drug for new indications, forcing it to declare Chapter 11 bankruptcy. We expected Clovis would come back to investors to negotiate a restructuring, but the company instead surprised us by not doing so. |
| ○ | Electric vehicle maker Arrival struggled with funding during the challenging market environment. The company recorded a significant loss during the period, and cut certain products from its line in order to focus on its highest profit opportunities. |
| 6 | Tri-Continental Corporation | Annual Report 2022 |
| • | it keeps investments in individual issuers within the limits permitted diversified companies under the Investment Company Act of 1940, as amended (the 1940 Act) (i.e., 75% of its total assets must be represented by cash items, government securities, securities of other investment companies, and securities of other issuers which, at the time of investment, do not exceed 5% of the Fund’s total assets at market value in the securities of any issuer and do not exceed 10% of the voting securities of any issuer); |
| • | it does not make investments with a view to exercising control or management; |
| • | it ordinarily does not invest in other investment companies, but it may purchase up to 3% of the voting securities of such investment companies, provided purchases of securities of a single investment company do not exceed in value 5% of the total assets of the Fund and all investments in investment company securities do not exceed 10% of total assets; and |
| • | it has no fixed policy with respect to portfolio turnover and purchases and sales in the light of economic, market and investment considerations. The portfolio turnover rates for the last ten fiscal years are shown under Financial Highlights |
| Tri-Continental Corporation | Annual Report 2022 | 7 |
| • | may issue senior securities such as bonds, notes or other evidences of indebtedness if immediately after issuance the net assets of the Fund provide 300% coverage of the aggregate principal amount of all bonds, notes or other evidences of indebtedness and that amount does not exceed 150% of the capital and surplus of the Fund; |
| • | may issue senior equity securities on a parity with, but not having preference or priority over, the preferred stock if immediately after issuance its net assets are equal to at least 200% of the aggregate amount (exclusive of any dividends accrued or in arrears) to which all shares of the preferred stock, then outstanding, shall be entitled as a preference over the common stock in the event of voluntary or involuntary liquidation, dissolution or winding up of the Fund; |
| • | may borrow money for substantially the same purposes as it may issue senior debt securities, subject to the same restrictions and to any applicable limitations prescribed by law; |
| • | may engage in the business of underwriting securities either directly or through majority-owned subsidiaries subject to any applicable restrictions and limitations prescribed by law; |
| • | does not intend to concentrate its assets in any one industry although it may from time to time invest up to 25% of the value of its assets, taken at market value, in a single industry*; |
| • | may not, with limited exceptions, purchase and sell real estate directly but may do so through majority-owned subsidiaries, so long as its real estate investments do not exceed 10% of the value of the Fund’s total assets; |
| • | may not purchase or sell commodities or commodity contracts; and |
| • | may make money loans (subject to restrictions imposed by law and by charter) (a) only to its subsidiaries, (b) as incidents to its business transactions or (c) for other purposes. The Fund will not lend securities if the total of all such loans would exceed 33 1/3% of the Fund’s total assets, except this fundamental investment policy shall not prohibit the Fund from purchasing money market securities, loans, loan participation or other debt securities, or from entering into repurchase agreements, and it may make loans represented by repurchase agreements, so long as such loans do not exceed 10% of the value of total assets. |
| 8 | Tri-Continental Corporation | Annual Report 2022 |
| Tri-Continental Corporation | Annual Report 2022 | 9 |
| • | An equity future |
| 10 | Tri-Continental Corporation | Annual Report 2022 |
| Tri-Continental Corporation | Annual Report 2022 | 11 |
| 12 | Tri-Continental Corporation | Annual Report 2022 |
| Assumed Return on Portfolio (net of expenses) | -10% | -5% | 0% | 5% | 10% |
| Corresponding Return to Common Stockholders | (10.36)% | (5.24)% | (0.12)% | 5.00% | 10.12% |
| Tri-Continental Corporation | Annual Report 2022 | 13 |
| 14 | Tri-Continental Corporation | Annual Report 2022 |
| Tri-Continental Corporation | Annual Report 2022 | 15 |
• | Information Technology Sector. The Fund is more susceptible to the particular risks that may affect companies in the information technology sector than if it were invested in a wider variety of companies in unrelated sectors. Companies in the information technology sector are subject to certain risks, including the risk that new services, equipment or technologies will not be accepted by consumers and businesses or will become rapidly obsolete. Performance of such companies may be affected by factors including obtaining and protecting patents (or the failure to do so) and significant competitive pressures, including aggressive pricing of their products or services, new market entrants, competition for market share and short product cycles due to an accelerated rate of technological developments. Such competitive pressures may lead to limited earnings and/or falling profit margins. As a result, the value of their securities may fall or fail to rise. In addition, many information technology sector companies have limited operating histories and prices of these companies’ securities historically have been more volatile than other securities, especially over the short term. Some companies in the information technology sector are facing increased government and regulatory scrutiny and may be subject to adverse government or regulatory action, which could negatively impact the value of their securities. |
| 16 | Tri-Continental Corporation | Annual Report 2022 |
| Stockholder Transaction Expenses | |
| Cash Purchase Plan Fees | $2.00 (a) |
| Annual Expenses (as a percentage of net assets attributable to common shares) | |
| Management fees (b) | 0.42% |
| Other expenses | 0.04% |
| Acquired fund fees and expenses | 0.05% |
| Total Annual Expenses Before Impact of Dividends on Preferred Stock (c) | 0.51% |
| Impact of Dividends on Preferred Stock | 0.11% |
| Total Annual Expenses, Including Impact of Dividends on Preferred Stock | 0.62% |
| (a) | Stockholders participating in the Fund’s Cash Purchase Plan (the Cash Purchase Plan) pay a $2.00 fee per cash purchase transaction; there is no fee for automatic dividend re-investment transactions in the Fund’s Automatic Dividend Investment Plan (the Automatic Dividend Investment Plan). See Automatic Dividend Investment Plan and Cash Purchase Plan below for a description of the related services. |
| (b) | The Fund’s management fee is 0.41% of the Fund’s average daily net assets (which includes assets attributable to the Fund’s common and preferred stock) and is borne by the holders of the Fund’s common stock (Common Stockholders). The management fee rate noted in the table reflects the rate paid by Common Stockholders as a percentage of the Fund’s net assets attributable to Common Stock. |
| (c) | “Total Annual Expenses Before Impact of Dividends on Preferred Stock” include acquired fund fees and expenses (expenses the Fund incurs indirectly through its investments in other investment companies) and may be higher than “Expenses to average net assets for Common Stock” shown in theFinancial Highlights |
| • | you invest $1,000 in the Fund for the periods indicated, |
| • | your investment has a 5% return each year, and |
| • | the Fund’s total annual operating expenses remain the same as shown in the Annual Fund Operating Expenses table above (including the impact of dividends on preferred stock). |
| 1 year | 3 years | 5 years | 10 years | |
| Tri-Continental Corporation Common Stock | $6 | $20 | $35 | $77 |
| Tri-Continental Corporation | Annual Report 2022 | 17 |
| Market Price ($) | Corresponding NAV ($) | Corresponding (Discount)/Premium to NAV (%) | ||||
| High | Low | High | Low | High | Low | |
| 2021 | ||||||
| 1 st Quarter | 32.43 | 29.09 | 36.00 | 32.87 | (9.92) | (11.50) |
| 2 nd Quarter | 34.91 | 32.66 | 38.15 | 36.37 | (8.49) | (10.20) |
| 3 rd Quarter | 35.12 | 33.30 | 39.26 | 37.00 | (10.55) | (10.00) |
| 4 th Quarter | 35.68 | 31.75 | 39.82 | 35.61 | (10.40) | (10.84) |
| 2022 | ||||||
| 1 st Quarter | 33.21 | 29.13 | 36.77 | 33.75 | (9.68) | (13.69) |
| 2 nd Quarter | 31.36 | 25.42 | 35.57 | 29.18 | (11.84) | (12.89) |
| 3 rd Quarter | 29.75 | 25.56 | 33.06 | 28.12 | (10.01) | (9.10) |
| 4 th Quarter | 28.24 | 25.53 | 31.47 | 28.29 | (10.26) | (9.76) |
| Year | Total Shares Outstanding | Year-End Asset Coverage Per Share ($) | Involuntary Liquidation Preference Per Share ($) | Average Daily Market Value Per Share ($) |
| 2022 | 752,740 | 2,145 | 50 | 50.54 |
| 2021 | 752,740 | 2,715 | 50 | 56.86 |
| 2020 | 752,740 | 2,368 | 50 | 56.23 |
| 2019 | 752,740 | 2,261 | 50 | 53.19 |
| 2018 | 752,740 | 1,951 | 50 | 50.71 |
| 2017 | 752,740 | 2,225 | 50 | 50.75 |
| 2016 | 752,740 | 2,004 | 50 | 51.61 |
| 2015 | 752,740 | 1,887 | 50 | 49.92 |
| 2014 | 752,740 | 2,058 | 50 | 46.32 |
| 2013 | 752,740 | 1,957 | 50 | 48.50 |
| 18 | Tri-Continental Corporation | Annual Report 2022 |
| Common Stocks 70.4% | ||
| Issuer | Shares | Value ($) |
| Communication Services 4.5% | ||
| Diversified Telecommunication Services 1.0% | ||
| AT&T, Inc. | 475,000 | 8,744,750 |
| Verizon Communications, Inc. | 170,000 | 6,698,000 |
| Total | 15,442,750 | |
| Entertainment 0.4% | ||
| Electronic Arts, Inc. | 59,918 | 7,320,781 |
| Interactive Media & Services 2.7% | ||
| Alphabet, Inc., Class A (a) | 362,599 | 31,992,110 |
| Meta Platforms, Inc., Class A (a) | 92,185 | 11,093,543 |
| Total | 43,085,653 | |
| Media 0.4% | ||
| Comcast Corp., Class A | 125,000 | 4,371,250 |
| Fox Corp., Class A | 82,700 | 2,511,599 |
| Total | 6,882,849 | |
| Total Communication Services | 72,732,033 | |
| Consumer Discretionary 5.9% | ||
| Automobiles 0.2% | ||
| Tesla, Inc. (a) | 31,032 | 3,822,522 |
| Hotels, Restaurants & Leisure 0.9% | ||
| Darden Restaurants, Inc. | 32,500 | 4,495,725 |
| Expedia Group, Inc. (a) | 110,052 | 9,640,555 |
| Total | 14,136,280 | |
| Household Durables 1.3% | ||
| Lennar Corp., Class A | 94,248 | 8,529,444 |
| Newell Brands, Inc. | 340,000 | 4,447,200 |
| PulteGroup, Inc. | 156,103 | 7,107,370 |
| Total | 20,084,014 | |
| Internet & Direct Marketing Retail 0.5% | ||
| Amazon.com, Inc. (a) | 102,945 | 8,647,380 |
| Specialty Retail 2.5% | ||
| AutoZone, Inc. (a) | 4,583 | 11,302,503 |
| Bath & Body Works, Inc. | 142,900 | 6,021,806 |
| Home Depot, Inc. (The) | 21,000 | 6,633,060 |
| Common Stocks (continued) | ||
| Issuer | Shares | Value ($) |
| O’Reilly Automotive, Inc. (a) | 15,087 | 12,733,881 |
| Ulta Beauty, Inc. (a) | 9,065 | 4,252,119 |
| Total | 40,943,369 | |
| Textiles, Apparel & Luxury Goods 0.5% | ||
| PVH Corp. | 19,013 | 1,342,128 |
| Ralph Lauren Corp. | 59,253 | 6,261,264 |
| Total | 7,603,392 | |
| Total Consumer Discretionary | 95,236,957 | |
| Consumer Staples 4.5% | ||
| Food & Staples Retailing 0.7% | ||
| Kroger Co. (The) | 272,660 | 12,155,183 |
| Food Products 1.3% | ||
| Bunge Ltd. | 47,500 | 4,739,075 |
| General Mills, Inc. | 103,244 | 8,657,009 |
| Kraft Heinz Co. (The) | 175,000 | 7,124,250 |
| Total | 20,520,334 | |
| Household Products 0.8% | ||
| Procter & Gamble Co. (The) | 85,874 | 13,015,063 |
| Tobacco 1.7% | ||
| Altria Group, Inc. | 256,495 | 11,724,387 |
| Philip Morris International, Inc. | 152,301 | 15,414,384 |
| Total | 27,138,771 | |
| Total Consumer Staples | 72,829,351 | |
| Energy 5.7% | ||
| Oil, Gas & Consumable Fuels 5.7% | ||
| Chesapeake Energy Corp. | 47,500 | 4,482,575 |
| Chevron Corp. | 50,000 | 8,974,500 |
| ConocoPhillips Co. | 37,500 | 4,425,000 |
| Enviva, Inc. | 80,000 | 4,237,600 |
| EOG Resources, Inc. | 72,500 | 9,390,200 |
| EQT Corp. | 26,412 | 893,518 |
| Exxon Mobil Corp. | 291,526 | 32,155,318 |
| Marathon Petroleum Corp. | 87,235 | 10,153,282 |
| Valero Energy Corp. | 130,996 | 16,618,152 |
| Total | 91,330,145 | |
| Total Energy | 91,330,145 | |
| Tri-Continental Corporation | Annual Report 2022 | 19 |
| Common Stocks (continued) | ||
| Issuer | Shares | Value ($) |
| Financials 10.4% | ||
| Banks 3.2% | ||
| Citigroup, Inc. | 126,055 | 5,701,468 |
| Citizens Financial Group, Inc. | 110,000 | 4,330,700 |
| JPMorgan Chase & Co. | 70,000 | 9,387,000 |
| M&T Bank Corp. | 55,000 | 7,978,300 |
| PNC Financial Services Group, Inc. (The) | 55,000 | 8,686,700 |
| Wells Fargo & Co. | 386,843 | 15,972,747 |
| Total | 52,056,915 | |
| Capital Markets 3.2% | ||
| Ares Capital Corp. | 475,000 | 8,773,250 |
| Bank of New York Mellon Corp. (The) | 35,815 | 1,630,299 |
| BlackRock, Inc. | 6,500 | 4,606,095 |
| Blackstone Secured Lending Fund | 190,000 | 4,246,500 |
| Blackstone, Inc. | 45,000 | 3,338,550 |
| CME Group, Inc. | 35,075 | 5,898,212 |
| Morgan Stanley | 242,809 | 20,643,621 |
| State Street Corp. | 21,500 | 1,667,755 |
| Total | 50,804,282 | |
| Consumer Finance 0.6% | ||
| Capital One Financial Corp. | 102,500 | 9,528,400 |
| Insurance 2.5% | ||
| Aon PLC, Class A | 6,847 | 2,055,058 |
| Lincoln National Corp. | 103,757 | 3,187,415 |
| Marsh & McLennan Companies, Inc. | 89,595 | 14,826,181 |
| MetLife, Inc. | 285,518 | 20,662,938 |
| Total | 40,731,592 | |
| Mortgage Real Estate Investment Trusts (REITS) 0.9% | ||
| Blackstone Mortgage Trust, Inc. | 290,000 | 6,139,300 |
| Starwood Property Trust, Inc. | 450,000 | 8,248,500 |
| Total | 14,387,800 | |
| Total Financials | 167,508,989 | |
| Common Stocks (continued) | ||
| Issuer | Shares | Value ($) |
| Health Care 10.4% | ||
| Biotechnology 2.1% | ||
| AbbVie, Inc. | 109,364 | 17,674,316 |
| Amgen, Inc. | 18,124 | 4,760,087 |
| BioMarin Pharmaceutical, Inc. (a) | 27,304 | 2,825,691 |
| Regeneron Pharmaceuticals, Inc. (a) | 4,934 | 3,559,832 |
| Vertex Pharmaceuticals, Inc. (a) | 17,747 | 5,124,979 |
| Total | 33,944,905 | |
| Health Care Equipment & Supplies 1.2% | ||
| Abbott Laboratories | 94,433 | 10,367,799 |
| Hologic, Inc. (a) | 52,873 | 3,955,429 |
| Medtronic PLC | 55,000 | 4,274,600 |
| Total | 18,597,828 | |
| Health Care Providers & Services 1.8% | ||
| Cardinal Health, Inc. | 84,611 | 6,504,048 |
| Centene Corp. (a) | 33,300 | 2,730,933 |
| CVS Health Corp. | 103,508 | 9,645,910 |
| Humana, Inc. | 7,400 | 3,790,206 |
| McKesson Corp. | 18,249 | 6,845,565 |
| Total | 29,516,662 | |
| Life Sciences Tools & Services 1.0% | ||
| Agilent Technologies, Inc. | 8,408 | 1,258,257 |
| IQVIA Holdings, Inc. (a) | 68,060 | 13,944,813 |
| Total | 15,203,070 | |
| Pharmaceuticals 4.3% | ||
| Amryt Pharma PLC, ADR (a) | 65,000 | 474,500 |
| Bristol-Myers Squibb Co. | 313,930 | 22,587,263 |
| Johnson & Johnson | 37,500 | 6,624,375 |
| Merck & Co., Inc. | 77,500 | 8,598,625 |
| Pfizer, Inc. | 592,032 | 30,335,720 |
| Viatris, Inc. | 124,320 | 1,383,682 |
| Total | 70,004,165 | |
| Total Health Care | 167,266,630 | |
| 20 | Tri-Continental Corporation | Annual Report 2022 |
| Common Stocks (continued) | ||
| Issuer | Shares | Value ($) |
| Industrials 5.7% | ||
| Aerospace & Defense 2.3% | ||
| General Dynamics Corp. | 62,146 | 15,419,044 |
| Lockheed Martin Corp. | 23,327 | 11,348,352 |
| Raytheon Technologies Corp. | 85,000 | 8,578,200 |
| Textron, Inc. | 33,485 | 2,370,738 |
| Total | 37,716,334 | |
| Air Freight & Logistics 0.9% | ||
| United Parcel Service, Inc., Class B | 83,441 | 14,505,384 |
| Airlines 0.1% | ||
| Delta Air Lines, Inc. (a) | 21,911 | 719,996 |
| Southwest Airlines Co. (a) | 20,260 | 682,154 |
| Total | 1,402,150 | |
| Building Products 0.1% | ||
| Masco Corp. | 53,200 | 2,482,844 |
| Commercial Services & Supplies 0.6% | ||
| Cintas Corp. | 22,212 | 10,031,383 |
| Electrical Equipment 0.2% | ||
| Emerson Electric Co. | 27,985 | 2,688,239 |
| Machinery 1.3% | ||
| AGCO Corp. | 35,000 | 4,854,150 |
| Fortive Corp. | 18,200 | 1,169,350 |
| Otis Worldwide Corp. | 14,515 | 1,136,669 |
| Parker-Hannifin Corp. | 20,509 | 5,968,119 |
| Snap-On, Inc. | 12,573 | 2,872,805 |
| Stanley Black & Decker, Inc. | 57,500 | 4,319,400 |
| Total | 20,320,493 | |
| Professional Services 0.1% | ||
| Robert Half International, Inc. | 15,608 | 1,152,339 |
| Road & Rail 0.1% | ||
| CSX Corp. | 75,513 | 2,339,393 |
| Total Industrials | 92,638,559 | |
| Information Technology 16.0% | ||
| Communications Equipment 1.9% | ||
| Cisco Systems, Inc. | 533,274 | 25,405,174 |
| Juniper Networks, Inc. | 140,000 | 4,474,400 |
| Total | 29,879,574 | |
| Common Stocks (continued) | ||
| Issuer | Shares | Value ($) |
| Electronic Equipment, Instruments & Components 0.5% | ||
| Corning, Inc. | 265,000 | 8,464,100 |
| IT Services 1.7% | ||
| International Business Machines Corp. | 60,000 | 8,453,400 |
| MasterCard, Inc., Class A | 55,409 | 19,267,372 |
| Total | 27,720,772 | |
| Semiconductors & Semiconductor Equipment 3.7% | ||
| Advanced Micro Devices, Inc. (a) | 174,504 | 11,302,624 |
| Broadcom, Inc. | 16,000 | 8,946,080 |
| Intel Corp. | 160,000 | 4,228,800 |
| Lam Research Corp. | 19,902 | 8,364,811 |
| QUALCOMM, Inc. | 169,944 | 18,683,643 |
| Texas Instruments, Inc. | 52,500 | 8,674,050 |
| Total | 60,200,008 | |
| Software 4.8% | ||
| Adobe, Inc. (a) | 22,772 | 7,663,461 |
| Autodesk, Inc. (a) | 20,609 | 3,851,204 |
| Fortinet, Inc. (a) | 265,877 | 12,998,726 |
| Microsoft Corp. | 223,574 | 53,617,517 |
| Total | 78,130,908 | |
| Technology Hardware, Storage & Peripherals 3.4% | ||
| Apple, Inc. (b) | 384,067 | 49,901,825 |
| HP, Inc. | 160,000 | 4,299,200 |
| Total | 54,201,025 | |
| Total Information Technology | 258,596,387 | |
| Materials 2.3% | ||
| Chemicals 1.4% | ||
| CF Industries Holdings, Inc. | 38,383 | 3,270,231 |
| Dow, Inc. | 175,000 | 8,818,250 |
| Mosaic Co. (The) | 125,423 | 5,502,307 |
| Nutrien Ltd. | 60,000 | 4,381,800 |
| Total | 21,972,588 | |
| Metals & Mining 0.9% | ||
| Newmont Corp. | 100,000 | 4,720,000 |
| Nucor Corp. | 80,181 | 10,568,658 |
| Total | 15,288,658 | |
| Total Materials | 37,261,246 | |
| Tri-Continental Corporation | Annual Report 2022 | 21 |
| Common Stocks (continued) | ||
| Issuer | Shares | Value ($) |
| Real Estate 2.9% | ||
| Equity Real Estate Investment Trusts (REITS) 2.9% | ||
| Crown Castle, Inc. | 32,500 | 4,408,300 |
| Host Hotels & Resorts, Inc. | 411,692 | 6,607,656 |
| Invitation Homes, Inc. | 150,000 | 4,446,000 |
| Life Storage, Inc. | 37,500 | 3,693,750 |
| SBA Communications Corp. | 10,738 | 3,009,969 |
| Simon Property Group, Inc. | 40,000 | 4,699,200 |
| VICI Properties, Inc. | 200,000 | 6,480,000 |
| Weyerhaeuser Co. | 426,303 | 13,215,393 |
| Total | 46,560,268 | |
| Total Real Estate | 46,560,268 | |
| Utilities 2.1% | ||
| Electric Utilities 2.1% | ||
| American Electric Power Co., Inc. | 145,514 | 13,816,554 |
| Duke Energy Corp. | 45,000 | 4,634,550 |
| Entergy Corp. | 40,000 | 4,500,000 |
| Evergy, Inc. | 111,719 | 7,030,477 |
| FirstEnergy Corp. | 110,000 | 4,613,400 |
| Total | 34,594,981 | |
| Total Utilities | 34,594,981 | |
| Total Common Stocks (Cost $965,775,701) | 1,136,555,546 | |
| Convertible Bonds 5.7% | ||||
| Issuer | Coupon Rate | Principal Amount ($) | Value ($) | |
| Airlines 0.3% | ||||
| American Airlines Group, Inc. | ||||
| 07/01/2025 | 6.500% | 4,200,000 | 4,426,800 | |
| Automotive 0.1% | ||||
| Lucid Group, Inc. (c) | ||||
| 12/15/2026 | 1.250% | 3,500,000 | 1,786,750 | |
| Cable and Satellite 0.5% | ||||
| DISH Network Corp. | ||||
| Subordinated | ||||
| 08/15/2026 | 3.375% | 12,500,000 | 7,831,250 | |
| Diversified Manufacturing 0.3% | ||||
| Greenbrier Companies, Inc. (The) | ||||
| 04/15/2028 | 2.875% | 5,300,000 | 4,671,950 | |
| Convertible Bonds (continued) | ||||
| Issuer | Coupon Rate | Principal Amount ($) | Value ($) | |
| Food and Beverage 0.4% | ||||
| Post Holdings, Inc. (c) | ||||
| 08/15/2027 | 2.500% | 6,300,000 | 6,616,260 | |
| Health Care 0.5% | ||||
| CONMED Corp. (c) | ||||
| 06/15/2027 | 2.250% | 4,500,000 | 4,099,500 | |
| Invacare Corp. | ||||
| 11/15/2024 | 5.000% | 4,000,000 | 3,386,800 | |
| Total | 7,486,300 | |||
| Independent Energy 0.0% | ||||
| Chesapeake Energy Escrow | ||||
| 09/15/2026 | 5.500% | 9,000,000 | 180,000 | |
| Leisure 0.5% | ||||
| NCL Corp Ltd. | ||||
| 08/01/2025 | 5.375% | 4,000,000 | 4,034,000 | |
| Royal Caribbean Cruises Ltd. (c) | ||||
| 08/15/2025 | 6.000% | 3,200,000 | 4,019,200 | |
| Total | 8,053,200 | |||
| Media and Entertainment 0.2% | ||||
| fuboTV, Inc. | ||||
| 02/15/2026 | 3.250% | 6,000,000 | 2,730,000 | |
| Other Financial Institutions 0.3% | ||||
| RWT Holdings, Inc. | ||||
| 10/01/2025 | 5.750% | 6,750,000 | 5,661,563 | |
| Other REIT 0.6% | ||||
| PennyMac Corp. | ||||
| 03/15/2026 | 5.500% | 11,000,000 | 8,903,125 | |
| Redwood Trust, Inc. (c) | ||||
| 06/15/2027 | 7.750% | 1,000,000 | 846,300 | |
| Total | 9,749,425 | |||
| Pharmaceuticals 1.0% | ||||
| Aegerion Pharmaceuticals, Inc. (c) | ||||
| 04/01/2025 | 5.000% | 1,687,570 | 1,628,505 | |
| BridgeBio Pharma, Inc. | ||||
| 02/01/2029 | 2.250% | 10,000,000 | 3,718,750 | |
| Clovis Oncology, Inc. (d) | ||||
| 05/01/2025 | 0.000% | 9,300,000 | 1,860,000 | |
| Cytokinetics, Inc. (c) | ||||
| 07/01/2027 | 3.500% | 3,600,000 | 4,127,400 | |
| Tilray, Inc. | ||||
| 10/01/2023 | 5.000% | 5,250,000 | 5,094,429 | |
| Total | 16,429,084 | |||
| 22 | Tri-Continental Corporation | Annual Report 2022 |
| Convertible Bonds (continued) | ||||
| Issuer | Coupon Rate | Principal Amount ($) | Value ($) | |
| Retailers 0.4% | ||||
| Farfetch Ltd. | ||||
| 05/01/2027 | 3.750% | 4,500,000 | 3,375,000 | |
| Wayfair, Inc. (c) | ||||
| 09/15/2027 | 3.250% | 4,800,000 | 3,660,000 | |
| Total | 7,035,000 | |||
| Technology 0.6% | ||||
| 2U, Inc. | ||||
| 05/01/2025 | 2.250% | 6,500,000 | 4,202,250 | |
| Infinera Corp. (c) | ||||
| 08/01/2028 | 3.750% | 4,600,000 | 5,701,240 | |
| Total | 9,903,490 | |||
| Total Convertible Bonds (Cost $115,403,828) | 92,561,072 | |||
| Convertible Preferred Stocks 4.8% | |||
| Issuer | Shares | Value ($) | |
| Consumer Discretionary 0.3% | |||
| Auto Components 0.3% | |||
| Aptiv PLC | 5.500% | 40,000 | 4,294,749 |
| Total Consumer Discretionary | 4,294,749 | ||
| Financials 0.8% | |||
| Banks 0.5% | |||
| Bank of America Corp. | 7.250% | 7,300 | 8,468,000 |
| Capital Markets 0.3% | |||
| AMG Capital Trust II | 5.150% | 80,000 | 4,060,800 |
| Total Financials | 12,528,800 | ||
| Health Care 0.9% | |||
| Health Care Equipment & Supplies 0.9% | |||
| Becton Dickinson and Co. | 6.000% | 140,000 | 7,014,000 |
| Boston Scientific Corp. | 5.500% | 62,500 | 7,178,278 |
| Total | 14,192,278 | ||
| Total Health Care | 14,192,278 | ||
| Industrials 0.5% | |||
| Machinery 0.3% | |||
| Chart Industries, Inc., ADR | 6.750% | 87,500 | 4,397,750 |
| Professional Services 0.2% | |||
| Clarivate PLC | 5.250% | 100,000 | 3,782,184 |
| Total Industrials | 8,179,934 | ||
| Convertible Preferred Stocks (continued) | |||
| Issuer | Shares | Value ($) | |
| Information Technology 0.4% | |||
| Electronic Equipment, Instruments & Components 0.4% | |||
| Coherent Corp. | 6.000% | 40,000 | 6,388,718 |
| Total Information Technology | 6,388,718 | ||
| Utilities 1.9% | |||
| Electric Utilities 0.6% | |||
| NextEra Energy, Inc. | 6.926% | 185,000 | 9,285,150 |
| Gas Utilities 0.8% | |||
| Spire, Inc. | 7.500% | 135,000 | 6,590,610 |
| UGI Corp. | 7.250% | 75,000 | 6,412,500 |
| Total | 13,003,110 | ||
| Multi-Utilities 0.5% | |||
| NiSource, Inc. | 7.750% | 85,000 | 8,861,250 |
| Total Utilities | 31,149,510 | ||
| Total Convertible Preferred Stocks (Cost $79,768,409) | 76,733,989 | ||
| Corporate Bonds & Notes 17.3% | ||||
| Issuer | Coupon Rate | Principal Amount ($) | Value ($) | |
| Aerospace & Defense 1.1% | ||||
| Bombardier, Inc. (c) | ||||
| 06/15/2026 | 7.125% | 9,000,000 | 8,821,297 | |
| Rolls-Royce PLC (c) | ||||
| 10/15/2027 | 5.750% | 5,167,000 | 4,909,863 | |
| Spirit AeroSystems, Inc. (c) | ||||
| 04/15/2025 | 7.500% | 4,500,000 | 4,446,897 | |
| Total | 18,178,057 | |||
| Cable and Satellite 0.1% | ||||
| Telesat Canada/LLC (c) | ||||
| 10/15/2027 | 6.500% | 5,286,000 | 1,553,145 | |
| Chemicals 0.5% | ||||
| Innophos Holdings, Inc. (c) | ||||
| 02/15/2028 | 9.375% | 4,300,000 | 4,215,890 | |
| Olympus Water US Holding Corp. (c) | ||||
| 10/01/2029 | 6.250% | 5,500,000 | 4,179,398 | |
| Total | 8,395,288 | |||
| Construction Machinery 0.2% | ||||
| PECF USS Intermediate Holding III Corp. (c) | ||||
| 11/15/2029 | 8.000% | 5,150,000 | 3,343,230 | |
| Tri-Continental Corporation | Annual Report 2022 | 23 |
| Corporate Bonds & Notes (continued) | ||||
| Issuer | Coupon Rate | Principal Amount ($) | Value ($) | |
| Consumer Cyclical Services 0.5% | ||||
| Staples, Inc. (c) | ||||
| 04/15/2026 | 7.500% | 5,000,000 | 4,304,134 | |
| Uber Technologies, Inc. (c) | ||||
| 09/15/2027 | 7.500% | 2,100,000 | 2,101,474 | |
| 01/15/2028 | 6.250% | 2,365,000 | 2,278,521 | |
| Total | 8,684,129 | |||
| Consumer Products 0.7% | ||||
| Mattel, Inc. | ||||
| 10/01/2040 | 6.200% | 1,430,000 | 1,235,555 | |
| 11/01/2041 | 5.450% | 745,000 | 607,843 | |
| Newell Brands, Inc. | ||||
| 09/15/2027 | 6.375% | 2,339,000 | 2,322,307 | |
| 09/15/2029 | 6.625% | 2,250,000 | 2,220,767 | |
| SWF Escrow Issuer Corp. (c) | ||||
| 10/01/2029 | 6.500% | 7,500,000 | 4,349,246 | |
| Total | 10,735,718 | |||
| Electric 0.3% | ||||
| Pacific Gas and Electric Co. | ||||
| 06/15/2027 | 5.450% | 4,500,000 | 4,455,843 | |
| Finance Companies 0.3% | ||||
| Curo Group Holdings Corp. (c) | ||||
| 08/01/2028 | 7.500% | 5,500,000 | 2,548,438 | |
| Fortress Transportation and Infrastructure Investors LLC (c) | ||||
| 08/01/2027 | 9.750% | 2,760,000 | 2,769,481 | |
| Total | 5,317,919 | |||
| Food and Beverage 0.8% | ||||
| Triton Water Holdings, Inc. (c) | ||||
| 04/01/2029 | 6.250% | 8,442,000 | 6,839,013 | |
| United Natural Foods, Inc. (c) | ||||
| 10/15/2028 | 6.750% | 6,280,000 | 6,040,443 | |
| Total | 12,879,456 | |||
| Gaming 0.7% | ||||
| Colt Merger Sub, Inc. (c) | ||||
| 07/01/2027 | 8.125% | 4,606,000 | 4,529,799 | |
| Scientific Games Holdings LP/US FinCo, Inc. (c) | ||||
| 03/01/2030 | 6.625% | 7,500,000 | 6,333,056 | |
| Total | 10,862,855 | |||
| Health Care 0.8% | ||||
| Quotient Ltd. (c),(e),(f) | ||||
| 10/15/2025 | 12.000% | 1,989,166 | 1,591,333 | |
| 10/15/2025 | 12.000% | 852,500 | 682,000 | |
| 10/15/2025 | 12.000% | 214,000 | 214,000 | |
| Corporate Bonds & Notes (continued) | ||||
| Issuer | Coupon Rate | Principal Amount ($) | Value ($) | |
| Surgery Center Holdings, Inc. (c) | ||||
| 07/01/2025 | 6.750% | 2,500,000 | 2,477,750 | |
| Tenet Healthcare Corp. (c) | ||||
| 10/01/2028 | 6.125% | 9,479,000 | 8,506,132 | |
| Total | 13,471,215 | |||
| Independent Energy 1.9% | ||||
| Hilcorp Energy I LP/Finance Co. (c) | ||||
| 04/15/2030 | 6.000% | 9,500,000 | 8,501,636 | |
| Oasis Petroleum, Inc. (c) | ||||
| 06/01/2026 | 6.375% | 4,500,000 | 4,359,609 | |
| Occidental Petroleum Corp. | ||||
| 07/15/2044 | 4.500% | 6,500,000 | 5,201,596 | |
| 04/15/2046 | 4.400% | 6,400,000 | 5,025,330 | |
| Southwestern Energy Co. | ||||
| 02/01/2029 | 5.375% | 7,463,000 | 6,912,423 | |
| Total | 30,000,594 | |||
| Leisure 1.3% | ||||
| Carnival Corp. (c) | ||||
| 05/01/2029 | 6.000% | 10,000,000 | 6,700,836 | |
| 06/01/2030 | 10.500% | 1,000,000 | 817,343 | |
| Cedar Fair LP/Canada’s Wonderland Co./Magnum Management Corp./Millennium Operations LLC | ||||
| 10/01/2028 | 6.500% | 4,400,000 | 4,280,139 | |
| NCL Corp., Ltd. (c) | ||||
| 02/15/2029 | 7.750% | 6,000,000 | 4,515,277 | |
| Royal Caribbean Cruises Ltd. (c) | ||||
| 08/15/2027 | 11.625% | 4,662,000 | 4,686,715 | |
| Total | 21,000,310 | |||
| Media and Entertainment 1.4% | ||||
| Clear Channel Outdoor Holdings, Inc. (c) | ||||
| 04/15/2028 | 7.750% | 10,000,000 | 7,339,346 | |
| Deluxe Corp. (c) | ||||
| 06/01/2029 | 8.000% | 5,000,000 | 4,100,702 | |
| Lions Gate Capital Holdings LLC (c) | ||||
| 04/15/2029 | 5.500% | 11,000,000 | 6,367,348 | |
| Mav Acquisition Corp. (c) | ||||
| 08/01/2029 | 8.000% | 5,500,000 | 4,551,934 | |
| Total | 22,359,330 | |||
| Metals and Mining 0.2% | ||||
| CONSOL Energy, Inc. (c) | ||||
| 11/15/2025 | 11.000% | 3,914,000 | 4,018,854 | |
| 24 | Tri-Continental Corporation | Annual Report 2022 |
| Corporate Bonds & Notes (continued) | ||||
| Issuer | Coupon Rate | Principal Amount ($) | Value ($) | |
| Oil Field Services 0.3% | ||||
| Nabors Industries Ltd. (c) | ||||
| 01/15/2026 | 7.250% | 3,447,000 | 3,263,083 | |
| 01/15/2028 | 7.500% | 1,754,000 | 1,598,547 | |
| Total | 4,861,630 | |||
| Other Financial Institutions 0.1% | ||||
| WeWork Companies, Inc. (c) | ||||
| 05/01/2025 | 7.875% | 6,000,000 | 2,242,256 | |
| Packaging 0.8% | ||||
| ARD Finance SA (c),(g) | ||||
| 06/30/2027 | 6.500% | 5,832,350 | 4,077,736 | |
| BWAY Holding Co. (c) | ||||
| 04/15/2025 | 7.250% | 9,500,000 | 8,793,655 | |
| Total | 12,871,391 | |||
| Paper 0.3% | ||||
| Sylvamo Corp. (c) | ||||
| 09/01/2029 | 7.000% | 4,500,000 | 4,296,099 | |
| Pharmaceuticals 0.4% | ||||
| 1375209 BC Ltd. (c) | ||||
| 01/30/2028 | 9.000% | 1,415,000 | 1,378,472 | |
| Bausch Health Companies, Inc. (c) | ||||
| 09/30/2028 | 11.000% | 2,515,000 | 1,972,273 | |
| 10/15/2030 | 14.000% | 502,000 | 298,207 | |
| Organon Finance 1 LLC (c) | ||||
| 04/30/2031 | 5.125% | 2,936,000 | 2,543,235 | |
| Total | 6,192,187 | |||
| Restaurants 0.5% | ||||
| Fertitta Entertainment LLC/Finance Co., Inc. (c) | ||||
| 01/15/2030 | 6.750% | 11,000,000 | 8,879,622 | |
| Retailers 0.8% | ||||
| Academy Ltd. (c) | ||||
| 11/15/2027 | 6.000% | 4,867,000 | 4,675,011 | |
| L Brands, Inc. (c) | ||||
| 10/01/2030 | 6.625% | 5,000,000 | 4,689,635 | |
| Magic MergeCo, Inc. (c) | ||||
| 05/01/2029 | 7.875% | 5,000,000 | 3,374,426 | |
| Total | 12,739,072 | |||
| Supermarkets 0.3% | ||||
| Safeway, Inc. | ||||
| 02/01/2031 | 7.250% | 4,512,000 | 4,469,272 | |
| Corporate Bonds & Notes (continued) | ||||
| Issuer | Coupon Rate | Principal Amount ($) | Value ($) | |
| Technology 2.8% | ||||
| Avaya, Inc. (c) | ||||
| 09/15/2028 | 6.125% | 5,509,000 | 1,679,070 | |
| Consensus Cloud Solutions, Inc. (c) | ||||
| 10/15/2026 | 6.000% | 5,000,000 | 4,717,161 | |
| Diebold Nixdorf, Inc. (c) | ||||
| 07/15/2025 | 9.375% | 2,369,000 | 1,665,214 | |
| Diebold Nixdorf, Inc. (c),(g) | ||||
| 10/15/2026 | 8.500% | 7,732,788 | 4,572,312 | |
| Minerva Merger Sub, Inc. (c) | ||||
| 02/15/2030 | 6.500% | 8,000,000 | 5,926,632 | |
| Neptune Bidco US, Inc. (c) | ||||
| 04/15/2029 | 9.290% | 4,664,000 | 4,394,622 | |
| NortonLifeLock, Inc. (c) | ||||
| 09/30/2027 | 6.750% | 6,000,000 | 5,891,042 | |
| 09/30/2030 | 7.125% | 3,000,000 | 2,955,349 | |
| Picard Midco, Inc. (c) | ||||
| 03/31/2029 | 6.500% | 5,000,000 | 4,233,737 | |
| Rocket Software, Inc. (c) | ||||
| 02/15/2029 | 6.500% | 8,875,000 | 7,026,804 | |
| Sabre GLBL, Inc. (c) | ||||
| 04/15/2025 | 9.250% | 1,800,000 | 1,804,313 | |
| 09/01/2025 | 7.375% | 923,000 | 884,709 | |
| Total | 45,750,965 | |||
| Wirelines 0.2% | ||||
| Front Range BidCo, Inc. (c) | ||||
| 03/01/2028 | 6.125% | 4,500,000 | 2,566,171 | |
| Total Corporate Bonds & Notes (Cost $336,021,794) | 280,124,608 | |||
| Preferred Debt 0.3% | ||||
| Issuer | Coupon Rate | Shares | Value ($) | |
| Banking 0.3% | ||||
| Citigroup Capital XIII (h) | ||||
| 10/30/2040 | 10.785% | 150,000 | 4,260,000 | |
| Total Preferred Debt (Cost $3,917,075) | 4,260,000 | |||
| Tri-Continental Corporation | Annual Report 2022 | 25 |
| Warrants 0.0% | ||
| Issuer | Shares | Value ($) |
| Health Care 0.0% | ||
| Health Care Equipment & Supplies 0.0% | ||
| Quotient Ltd. (a) | 39,425 | 59 |
| Quotient Ltd. (a) | 181,609 | 772 |
| Total | 831 | |
| Total Health Care | 831 | |
| Total Warrants (Cost $—) | 831 | |
| Money Market Funds 1.0% | ||
| Shares | Value ($) | |
| Columbia Short-Term Cash Fund, 4.318% (i),(j) | 16,257,201 | 16,252,323 |
| Total Money Market Funds (Cost $16,250,329) | 16,252,323 | |
| Total Investments in Securities (Cost: $1,517,137,136) | 1,606,488,369 | |
| Other Assets & Liabilities, Net | 8,181,502 | |
| Net Assets | 1,614,669,871 | |
| Long futures contracts | ||||||
| Description | Number of contracts | Expiration date | Trading currency | Notional amount | Value/Unrealized appreciation ($) | Value/Unrealized depreciation ($) |
| S&P 500 Index E-mini | 55 | 03/2023 | USD | 10,617,750 | — | (376,179) |
| (a) | Non-income producing investment. |
| (b) | This security or a portion of this security has been pledged as collateral in connection with derivative contracts. |
| (c) | Represents privately placed and other securities and instruments exempt from Securities and Exchange Commission registration (collectively, private placements), such as Section 4(a)(2) and Rule 144A eligible securities, which are often sold only to qualified institutional buyers. At December 31, 2022, the total value of these securities amounted to $275,878,688, which represents 17.09% of total net assets. |
| (d) | Represents a security in default. |
| (e) | Represents fair value as determined in good faith under procedures approved by the Board of Directors. At December 31, 2022, the total value of these securities amounted to $2,487,333, which represents 0.15% of total net assets. |
| (f) | Valuation based on significant unobservable inputs. |
| (g) | Payment-in-kind security. Interest can be paid by issuing additional par of the security or in cash. |
| (h) | Represents a variable rate security with a step coupon where the rate adjusts according to a schedule for a series of periods, typically lower for an initial period and then increasing to a higher coupon rate thereafter. The interest rate shown was the current rate as of December 31, 2022. |
| (i) | The rate shown is the seven-day current annualized yield at December 31, 2022. |
| (j) | As defined in the Investment Company Act of 1940, as amended, an affiliated company is one in which the Fund owns 5% or more of the company’s outstanding voting securities, or a company which is under common ownership or control with the Fund. The value of the holdings and transactions in these affiliated companies during the year ended December 31, 2022 are as follows: |
| Affiliated issuers | Beginning of period($) | Purchases($) | Sales($) | Net change in unrealized appreciation (depreciation)($) | End of period($) | Realized gain (loss)($) | Dividends($) | End of period shares |
| Columbia Short-Term Cash Fund, 4.318% | ||||||||
| 25,091,482 | 345,837,538 | (354,678,417) | 1,720 | 16,252,323 | (7,729) | 436,565 | 16,257,201 | |
| ADR | American Depositary Receipt |
| USD | US Dollar |
| 26 | Tri-Continental Corporation | Annual Report 2022 |
| ■ | Level 1 — Valuations based on quoted prices for investments in active markets that the Fund has the ability to access at the measurement date. Valuation adjustments are not applied to Level 1 investments. |
| ■ | Level 2 — Valuations based on other significant observable inputs (including quoted prices for similar securities, interest rates, prepayment speeds, credit risks, etc.). |
| ■ | Level 3 — Valuations based on significant unobservable inputs (including the Fund’s own assumptions and judgment in determining the fair value of investments). |
| Level 1 ($) | Level 2 ($) | Level 3 ($) | Total ($) | |
| Investments in Securities | ||||
| Common Stocks | ||||
| Communication Services | 72,732,033 | — | — | 72,732,033 |
| Consumer Discretionary | 95,236,957 | — | — | 95,236,957 |
| Consumer Staples | 72,829,351 | — | — | 72,829,351 |
| Energy | 91,330,145 | — | — | 91,330,145 |
| Financials | 167,508,989 | — | — | 167,508,989 |
| Health Care | 167,266,630 | — | — | 167,266,630 |
| Industrials | 92,638,559 | — | — | 92,638,559 |
| Information Technology | 258,596,387 | — | — | 258,596,387 |
| Materials | 37,261,246 | — | — | 37,261,246 |
| Real Estate | 46,560,268 | — | — | 46,560,268 |
| Utilities | 34,594,981 | — | — | 34,594,981 |
| Total Common Stocks | 1,136,555,546 | — | — | 1,136,555,546 |
| Convertible Bonds | — | 92,561,072 | — | 92,561,072 |
| Convertible Preferred Stocks | ||||
| Consumer Discretionary | — | 4,294,749 | — | 4,294,749 |
| Financials | — | 12,528,800 | — | 12,528,800 |
| Health Care | — | 14,192,278 | — | 14,192,278 |
| Industrials | — | 8,179,934 | — | 8,179,934 |
| Information Technology | — | 6,388,718 | — | 6,388,718 |
| Utilities | — | 31,149,510 | — | 31,149,510 |
| Total Convertible Preferred Stocks | — | 76,733,989 | — | 76,733,989 |
| Corporate Bonds & Notes | — | 277,637,275 | 2,487,333 | 280,124,608 |
| Tri-Continental Corporation | Annual Report 2022 | 27 |
| Level 1 ($) | Level 2 ($) | Level 3 ($) | Total ($) | |
| Preferred Debt | 4,260,000 | — | — | 4,260,000 |
| Warrants | ||||
| Health Care | — | 831 | — | 831 |
| Total Warrants | — | 831 | — | 831 |
| Money Market Funds | 16,252,323 | — | — | 16,252,323 |
| Total Investments in Securities | 1,157,067,869 | 446,933,167 | 2,487,333 | 1,606,488,369 |
| Investments in Derivatives | ||||
| Liability | ||||
| Futures Contracts | (376,179) | — | — | (376,179) |
| Total | 1,156,691,690 | 446,933,167 | 2,487,333 | 1,606,112,190 |
| 28 | Tri-Continental Corporation | Annual Report 2022 |
| Assets | |
| Investments in securities, at value | |
| Unaffiliated issuers (cost $1,500,886,807) | $1,590,236,046 |
| Affiliated issuers (cost $16,250,329) | 16,252,323 |
| Receivable for: | |
| Dividends | 2,165,156 |
| Interest | 7,581,396 |
| Foreign tax reclaims | 24,710 |
| Prepaid expenses | 191,288 |
| Total assets | 1,616,450,919 |
| Liabilities | |
| Due to custodian | 189,551 |
| Payable for: | |
| Common Stock payable | 713,327 |
| Preferred Stock dividends | 470,462 |
| Variation margin for futures contracts | 46,255 |
| Management services fees | 18,160 |
| Stockholder servicing and transfer agent fees | 10,402 |
| Compensation of board members | 282,387 |
| Stockholders’ meeting fees | 602 |
| Compensation of chief compliance officer | 313 |
| Other expenses | 49,589 |
| Total liabilities | 1,781,048 |
| Net assets | $1,614,669,871 |
| Preferred Stock | 37,637,000 |
| Net assets for Common Stock | 1,577,032,871 |
| Represented by | |
| $2.50 Cumulative Preferred Stock, $50 par value, asset coverage per share $2,145 | |
| Shares issued and outstanding — 752,740 | 37,637,000 |
| Common Stock, $0.50 par value: | |
| Shares issued and outstanding — 54,249,198 | 27,124,599 |
| Capital surplus | 1,464,454,527 |
| Total distributable earnings (loss) | 85,453,745 |
| Net assets | $1,614,669,871 |
| Net asset value per share of outstanding Common Stock | $29.07 |
| Market price per share of Common Stock | $25.63 |
| Tri-Continental Corporation | Annual Report 2022 | 29 |
| Net investment income | |
| Income: | |
| Dividends — unaffiliated issuers | $39,748,673 |
| Dividends — affiliated issuers | 436,565 |
| Interest | 28,051,509 |
| Foreign taxes withheld | (23,040) |
| Total income | 68,213,707 |
| Expenses: | |
| Management services fees | 7,266,740 |
| Stockholder servicing and transfer agent fees | 391,972 |
| Compensation of board members | 43,822 |
| Custodian fees | 21,108 |
| Printing and postage fees | 51,009 |
| Stockholders’ meeting fees | 55,491 |
| Audit fees | 49,500 |
| Legal fees | 10,730 |
| Interest on collateral | 208 |
| Compensation of chief compliance officer | 249 |
| Other | 170,379 |
| Total expenses | 8,061,208 |
Net investment income (a) | 60,152,499 |
| Realized and unrealized gain (loss) — net | |
| Net realized gain (loss) on: | |
| Investments — unaffiliated issuers | 40,302,684 |
| Investments — affiliated issuers | (7,729) |
| Foreign currency translations | (24) |
| Futures contracts | (1,773,382) |
| Net realized gain | 38,521,549 |
| Net change in unrealized appreciation (depreciation) on: | |
| Investments — unaffiliated issuers | (390,157,453) |
| Investments — affiliated issuers | 1,720 |
| Futures contracts | (722,385) |
| Net change in unrealized appreciation (depreciation) | (390,878,118) |
| Net realized and unrealized loss | (352,356,569) |
| Net decrease in net assets resulting from operations | $(292,204,070) |
| (a) | Net investment income for Common Stock is $58,270,649, which is net of Preferred Stock dividends of $1,881,850. |
| 30 | Tri-Continental Corporation | Annual Report 2022 |
| Year Ended December 31, 2022 | Year Ended December 31, 2021 | |
| Operations | ||
| Net investment income | $60,152,499 | $55,648,905 |
| Net realized gain | 38,521,549 | 202,034,431 |
| Net change in unrealized appreciation (depreciation) | (390,878,118) | 178,019,119 |
| Net increase (decrease) in net assets resulting from operations | (292,204,070) | 435,702,455 |
| Distributions to stockholders | ||
| Net investment income and net realized gains | ||
| Preferred Stock | (1,881,850) | (1,881,850) |
| Common Stock | (120,129,762) | (242,263,151) |
| Total distributions to stockholders | (122,011,612) | (244,145,001) |
| Increase (decrease) in net assets from capital stock activity | (14,608,703) | 69,164,972 |
| Total increase (decrease) in net assets | (428,824,385) | 260,722,426 |
| Net assets at beginning of year | 2,043,494,256 | 1,782,771,830 |
| Net assets at end of year | $1,614,669,871 | $2,043,494,256 |
| Year Ended | Year Ended | |||
| December 31, 2022 | December 31, 2021 | |||
| Shares | Dollars ($) | Shares | Dollars ($) | |
| Capital stock activity | ||||
| Common Stock issued at market price in distributions | 1,934,544 | 52,472,273 | 3,832,800 | 123,569,819 |
| Common Stock issued to cash purchase plan participants | 53,732 | 1,587,056 | 56,165 | 1,857,233 |
| Common Stock purchased from cash purchase plan participants | (610,768) | (17,333,752) | (520,321) | (17,292,805) |
| Common Stock purchased in the open market | (1,793,484) | (51,334,280) | (1,175,623) | (38,969,275) |
| Total net increase (decrease) | (415,976) | (14,608,703) | 2,193,021 | 69,164,972 |
| Tri-Continental Corporation | Annual Report 2022 | 31 |
| Tri-Continental Corporation | Annual Report 2022 | 33 |
| Year ended December 31, | |||
| 2022 | 2021 | 2020 | |
| Per share data | |||
| Net asset value, beginning of period | $36.69 | $33.26 | $31.03 |
| Income from investment operations: | |||
| Net investment income | 1.11 | 1.07 | 1.05 |
| Net realized and unrealized gain (loss) | (6.53) | 7.28 | 2.86 |
| Total from investment operations | (5.42) | 8.35 | 3.91 |
| Less distributions to Stockholders from: | |||
| Net investment income — Preferred Stock | (0.03) | (0.04) | (0.04) |
| Net investment income — Common Stock | (1.08) | (1.05) | (1.07) |
| Net realized gains — Common Stock | (1.15) | (3.64) | (0.57) |
| Total distributions to Stockholders | (2.26) | (4.73) | (1.68) |
| Dilution in net asset value from share purchases (via dividend reinvestment program and cash purchase plan) (a) | (0.10) | (0.32) | — |
| Anti-dilution in net asset value from share buy-backs (via stock repurchase program and cash purchase plan) (a) | 0.16 | 0.13 | — |
| Net asset value, end of period | $29.07 | $36.69 | $33.26 |
| Adjusted net asset value, end of period (b) | $28.97 | $36.57 | $33.14 |
| Market price, end of period | $25.63 | $33.19 | $29.47 |
| Total return | |||
| Based upon net asset value | (14.10%) | 26.76% | 14.17% |
| Based upon market price | (16.28%) | 29.41% | 11.31% |
| Ratios to average net assets | |||
| Expenses to average net assets for Common Stock (c) | 0.46% (d) | 0.46% (d) | 0.48% |
| Net investment income to average net assets for Common Stock | 3.35% | 2.77% | 3.45% |
| Supplemental data | |||
| Net assets, end of period (000’s): | |||
| Common Stock | $1,577,033 | $2,005,857 | $1,745,135 |
| Preferred Stock | $37,637 | $37,637 | $37,637 |
| Total net assets | $1,614,670 | $2,043,494 | $1,782,772 |
| Portfolio turnover | 48% | 56% | 67% |
| Notes to Financial Highlights | |
| (a) | Prior to the period ended December 31, 2022, per share amounts were only presented if the net dilution/anti-dilution impact was material relative to the Fund’s average net assets for Common Stock. |
| (b) | Assumes the exercise of outstanding warrants. |
| (c) | In addition to the fees and expenses that the Fund bears directly, the Fund indirectly bears a pro rata share of the fees and expenses of any other funds in which it invests. Such indirect expenses are not included in the Fund’s reported expense ratios. |
| (d) | Ratios include interest on collateral expense which is less than 0.01%. |
| 34 | Tri-Continental Corporation | Annual Report 2022 |
| Year ended December 31, | ||||||
| 2019 | 2018 | 2017 | 2016 | 2015 | 2014 | 2013 |
| $26.58 | $29.88 | $25.91 | $23.49 | $24.76 | $23.11 | $18.77 |
| 1.03 | 0.99 | 0.93 | 0.90 | 0.81 | 0.73 | 0.69 |
| 5.39 | (2.35) | 4.24 | 2.33 | (1.37) | 1.70 | 4.36 |
| 6.42 | (1.36) | 5.17 | 3.23 | (0.56) | 2.43 | 5.05 |
| (0.04) | (0.03) | (0.03) | (0.03) | (0.03) | (0.03) | (0.03) |
| (1.01) | (0.96) | (1.07) | (0.91) | (0.81) | (0.75) | (0.68) |
| (0.92) | (0.95) | (0.10) | — | — | — | — |
| (1.97) | (1.94) | (1.20) | (0.94) | (0.84) | (0.78) | (0.71) |
| — | — | — | (0.06) | (0.05) | — | — |
| — | — | — | 0.19 | 0.18 | — | — |
| $31.03 | $26.58 | $29.88 | $25.91 | $23.49 | $24.76 | $23.11 |
| $30.92 | $26.48 | $29.77 | $25.83 | $23.42 | $24.68 | $23.04 |
| $28.20 | $23.52 | $26.94 | $22.05 | $20.02 | $21.41 | $19.98 |
| 25.20% | (4.10%) | 20.82% | 15.25% | (1.36%) | 11.09% | 27.76% |
| 28.59% | (5.88%) | 28.00% | 15.08% | (2.78%) | 11.11% | 29.58% |
| 0.49% | 0.49% | 0.49% | 0.50% | 0.50% | 0.49% | 0.50% |
| 3.32% | 3.14% | 3.21% | 3.59% | 3.16% | 2.91% | 3.12% |
| $1,664,401 | $1,431,211 | $1,637,553 | $1,470,843 | $1,382,712 | $1,511,285 | $1,435,734 |
| $37,637 | $37,637 | $37,637 | $37,637 | $37,637 | $37,637 | $37,637 |
| $1,702,038 | $1,468,848 | $1,675,190 | $1,508,480 | $1,420,349 | $1,548,922 | $1,473,371 |
| 60% | 63% | 95% | 82% | 76% | 76% | 62% |
| Tri-Continental Corporation | Annual Report 2022 | 35 |
| 36 | Tri-Continental Corporation | Annual Report 2022 |
| Tri-Continental Corporation | Annual Report 2022 | 37 |
| 38 | Tri-Continental Corporation | Annual Report 2022 |
| Liability derivatives | ||
| Risk exposure category | Statement of assets and liabilities location | Fair value ($) |
| Equity risk | Component of total distributable earnings (loss) — unrealized depreciation on futures contracts | 376,179* |
| * | Includes cumulative appreciation (depreciation) as reported in the tables following the Portfolio of Investments. Only the current day’s variation margin is reported in receivables or payables in the Statement of Assets and Liabilities. |
| Amount of realized gain (loss) on derivatives recognized in income | |
| Risk exposure category | Futures contracts ($) |
| Equity risk | (1,773,382) |
| Change in unrealized appreciation (depreciation) on derivatives recognized in income | |
| Risk exposure category | Futures contracts ($) |
| Equity risk | (722,385) |
| Derivative instrument | Average notional amounts ($)* |
| Futures contracts — long | 8,763,025 |
| * | Based on the ending quarterly outstanding amounts for the year ended December 31, 2022. |
| Tri-Continental Corporation | Annual Report 2022 | 39 |
| 40 | Tri-Continental Corporation | Annual Report 2022 |
| Tri-Continental Corporation | Annual Report 2022 | 41 |
| Excess of distributions over net investment income ($) | Accumulated net realized (loss) ($) | Paid in capital ($) |
| 1,647,107 | (1,108,336) | (538,771) |
| Year Ended December 31, 2022 | Year Ended December 31, 2021 | ||||
| Ordinary income ($) | Long-term capital gains ($) | Total ($) | Ordinary income ($) | Long-term capital gains ($) | Total ($) |
| 61,988,232 | 60,023,380 | 122,011,612 | 111,151,546 | 132,993,455 | 244,145,001 |
| Undistributed ordinary income ($) | Undistributed long-term capital gains ($) | Capital loss carryforwards ($) | Net unrealized appreciation ($) |
| 2,161,313 | 2,128,715 | — | 81,895,810 |
| Federal tax cost ($) | Gross unrealized appreciation ($) | Gross unrealized (depreciation) ($) | Net unrealized appreciation ($) |
| 1,524,216,380 | 231,146,301 | (149,250,491) | 81,895,810 |
| 42 | Tri-Continental Corporation | Annual Report 2022 |
| Tri-Continental Corporation | Annual Report 2022 | 43 |
| 44 | Tri-Continental Corporation | Annual Report 2022 |
| Tri-Continental Corporation | Annual Report 2022 | 45 |
| 46 | Tri-Continental Corporation | Annual Report 2022 |
| Tri-Continental Corporation | Annual Report 2022 | 47 |
| 48 | Tri-Continental Corporation | Annual Report 2022 |
| Tri-Continental Corporation | Annual Report 2022 | 49 |
| Qualified dividend income | Dividends received deduction | Section 199A dividends | Capital gain dividend |
| 52.86% | 50.17% | 3.65% | $39,201,664 |
| 50 | Tri-Continental Corporation | Annual Report 2022 |
| Name, Address, Year of Birth | Position Held With the Fund and Length of Service | Principal Occupation(s) During the Past Five Years and Other Relevant Professional Experience | Number of Funds in the Columbia Funds Complex Overseen | Other Directorships Held by Director During the Past Five Years |
| George S. Batejan c/o Columbia Management Investment Advisers, LLC 290 Congress Street Boston, MA 02210 1954 | Director since January 2018 | Executive Vice President, Global Head of Technology and Operations, Janus Capital Group, Inc. 2010-2016 | 176 | Former Chairman of the Board, NICSA (National Investment Company Services Association) (Executive Committee, Nominating Committee and Governance Committee), 2014-2016; former Director, Intech Investment Management, 2011-2016; former Board Member, Metro Denver Chamber of Commerce, 2015-2016; former Advisory Board Member, University of Colorado Business School, 2015-2018; former Board Member, Chase Bank International, 1993-1994 |
| Kathleen Blatz c/o Columbia Management Investment Advisers, LLC 290 Congress Street Boston, MA 02210 1954 | Director since November 2008 | Attorney, specializing in arbitration and mediation; Chief Justice, Minnesota Supreme Court, 1998-2006; Associate Justice, Minnesota Supreme Court, 1996-1998; Fourth Judicial District Court Judge, Hennepin County, 1994-1996; Attorney in private practice and public service, 1984-1993; State Representative, Minnesota House of Representatives, 1979-1993, which included service on the Tax and Financial Institutions and Insurance Committees;Member and Interim Chair, Minnesota Sports Facilities Authority, January-July 2017; Interim President and Chief Executive Officer, Blue Cross and Blue Shield of Minnesota (health care insurance), February-July 2018, April-October 2021 | 176 | Former Trustee, Blue Cross and Blue Shield of Minnesota, 2009-2021 (Chair of the Business Development Committee, 2014-2017; Chair of the Governance Committee, 2017-2019); former Member and Chair of the Board, Minnesota Sports Facilities Authority, January 2017-July 2017; former Director, Robina Foundation, 2009-2020 (Chair, 2014-2020); Director, Richard M. Schulze Family Foundation, since 2021 |
| Pamela G. Carlton c/o Columbia Management Investment Advisers, LLC 290 Congress Street Boston, MA 02210 1954 | Director since November 2008; Chair of the Board since January 2023 | President, Springboard-Partners in Cross Cultural Leadership (consulting company), since 2003; Managing Director of US Equity Research, JP Morgan Chase, 1999-2003; Director of US Equity Research, Chase Asset Management, 1996-1999; Co-Director Latin America Research, 1993-1996, COO Global Research, 1992-1996, Co-Director of US Research, 1991-1992, Investment Banker, 1982-1991, Morgan Stanley; Attorney, Cleary Gottlieb Steen & Hamilton LLP, 1980-1982 | 176 | Trustee, New York Presbyterian Hospital Board, since 1996; Director, DR Bank (Audit Committee), since 2017; Director, Evercore Inc. (Audit Committee, Nominating and Governance Committee), since 2019; Director, Apollo Commercial Real Estate Finance, Inc. (Chair, Nominating and Governance Committee), since 2021; the Governing Council of the Independent Directors Council (IDC), since 2021 |
| Tri-Continental Corporation | Annual Report 2022 | 51 |
| Name, Address, Year of Birth | Position Held With the Fund and Length of Service | Principal Occupation(s) During the Past Five Years and Other Relevant Professional Experience | Number of Funds in the Columbia Funds Complex Overseen | Other Directorships Held by Director During the Past Five Years |
| Janet Langford Carrig c/o Columbia Management Investment Advisers, LLC 290 Congress Street Boston, MA 02210 1957 | Director since January 2023 | Senior Vice President, General Counsel and Corporate Secretary, ConocoPhillips (independent energy company), September 2007-October 2018 | 176 | Director, EQT Corporation (natural gas producer), since 2019; former Director, Whiting Petroleum Corporation (independent oil and gas company), 2020-2022 |
| Patricia M. Flynn c/o Columbia Management Investment Advisers, LLC 290 Congress Street Boston, MA 02210 1950 | Director since November 2008 | Professor of Economics and Management, Bentley University, since 2002; Dean, McCallum Graduate School of Business, Bentley University, 1992-2002 | 176 | Trustee, MA Taxpayers Foundation, 1997-2002; Governing Board Member, MA Technology Collaborative, 2010-2020; Board of Directors, The MA Business Roundtable, 2003-2019 |
| Brian J. Gallagher c/o Columbia Management Investment Advisers, LLC 290 Congress Street Boston, MA 02210 1954 | Director since January 2020 | Retired; Partner with Deloitte & Touche LLP and its predecessors, 1977-2016 | 176 | Trustee, Catholic Schools Foundation, since 2004 |
| Douglas A. Hacker c/o Columbia Management Investment Advisers, LLC 290 Congress Street Boston, MA 02210 1955 | Director since January 2022 | Independent business executive, since May 2006; Executive Vice President – Strategy of United Airlines, December 2002-May 2006; President of UAL Loyalty Services (airline marketing company), September 2001-December 2002; Executive Vice President and Chief Financial Officer of United Airlines, July 1999-September 2001 | 176 | Director, Spartan Nash Company (Chair of the Board) (food distributor); Director, Aircastle Limited (Chair of Audit Committee) (aircraft leasing); former Director, Nash Finch Company (food distributor), 2005-2013; former Director, SeaCube Container Leasing Ltd. (container leasing), 2010-2013; and former Director, Travelport Worldwide Limited (travel information technology), 2014-2019 |
| Catherine James Paglia c/o Columbia Management Investment Advisers, LLC 290 Congress Street Boston, MA 02210 1952 | Director since November 2008 | Director, Enterprise Asset Management, Inc. (private real estate and asset management company), since September 1998; Managing Director and Partner, Interlaken Capital, Inc., 1989-1997; Vice President, 1982-1985, Principal, 1985-1987, Managing Director, 1987-1989, Morgan Stanley; Vice President, Investment Banking, 1980-1982, Associate, Investment Banking, 1976-1980, Dean Witter Reynolds, Inc. | 176 | Director, Valmont Industries, Inc. (irrigation systems manufacturer), since 2012; Trustee, Carleton College (on the Investment Committee); Trustee, Carnegie Endowment for International Peace (on the Investment Committee) |
| Sandra L. Yeager c/o Columbia Management Investment Advisers, LLC 290 Congress Street Boston, MA 02210 1964 | Director since 2020 | Retired; President and founder, Hanoverian Capital, LLC (SEC registered investment advisor firm), 2008-2016; Managing Director, DuPont Capital, 2006-2008; Managing Director, Morgan Stanley Investment Management, 2004-2006; Senior Vice President, Alliance Bernstein, 1990-2004 | 175 | Former Director, NAPE Education Foundation, October 2016-October 2020; Advisory Board, Jennersville YMCA, since 2022 |
| 52 | Tri-Continental Corporation | Annual Report 2022 |
| Name, Address, Year of Birth | Position Held With the Fund and Length of Service | Principal Occupation(s) During the Past Five Years and Other Relevant Professional Experience | Number of Funds in the Columbia Funds Complex Overseen | Other Directorships Held by Director During the Past Five Years |
| Daniel J. Beckman c/o Columbia Management Investment Advisers, LLC 290 Congress Street Boston, MA 02210 1962 | Director since November 2021 and President since June 2021 | Vice President – Head of North America Product, Columbia Management Investment Advisers, LLC, since April 2015; President and Principal Executive Officer of the Columbia Funds, since June 2021; officer of Columbia Funds and affiliated funds, 2020-2021 | 176 | Director, Ameriprise Trust Company, since October 2016; Director, Columbia Management Investment Distributors, Inc., since November 2018; Board of Governors, Columbia Wanger Asset Management, LLC, since January 2022; Director, Threadneedle Canada Inc., since December 2022 |
| * | Interested person (as defined under the 1940 Act) by reason of being an officer, director, security holder and/or employee of the Investment Manager or Ameriprise Financial. |
investor.columbiathreadneedleus.com.
| Name, address and year of birth | Position and year first appointed to position for any Fund in the Columbia Funds Complex or a predecessor thereof | Principal occupation(s) during past five years |
| Michael G. Clarke 290 Congress Street Boston, MA 02210 1969 | Chief Financial Officer and Principal Financial Officer (2009) and Senior Vice President (2019) | Senior Vice President and Head of Global Operations & Investor Services, Columbia Management Investment Advisers, LLC, since March 2022 (previously Vice President, Head of North American Operations, and Co-Head of Global Operations, June 2019 to February 2022 and Vice President – Accounting and Tax, May 2010 - May 2019); senior officer of Columbia Funds and affiliated funds, since 2002. |
| Joseph Beranek 5890 Ameriprise Financial Center Minneapolis, MN 55474 1965 | Treasurer and Chief Accounting Officer (Principal Accounting Officer) (2019) and Principal Financial Officer (2020), CFST, CFST I, CFST II, CFVIT and CFVST II; Assistant Treasurer, CET I and CET II | Vice President – Mutual Fund Accounting and Financial Reporting, Columbia Management Investment Advisers, LLC, since December 2018 and March 2017, respectively. |
| Tri-Continental Corporation | Annual Report 2022 | 53 |
| Name, address and year of birth | Position and year first appointed to position for any Fund in the Columbia Funds Complex or a predecessor thereof | Principal occupation(s) during past five years |
| Marybeth Pilat 290 Congress Street Boston, MA 02210 1968 | Treasurer and Chief Accounting Officer (Principal Accounting Officer) and Principal Financial Officer (2020) for CET I and CET II; Assistant Treasurer, CFST, CFST I, CFST II, CFVIT and CFVST II | Vice President – Product Pricing and Administration, Columbia Management Investment Advisers, LLC, since May 2017. |
| William F. Truscott 290 Congress Street Boston, MA 02210 1960 | Senior Vice President (2001) | Formerly, Trustee/Director of Columbia Funds Complex or legacy funds, November 2001-January 1, 2021; Chief Executive Officer, Global Asset Management, Ameriprise Financial, Inc., since September 2012; Chairman of the Board and President, Columbia Management Investment Advisers, LLC, since July 2004 and February 2012, respectively; Chairman of the Board and Chief Executive Officer, Columbia Management Investment Distributors, Inc., since November 2008 and February 2012, respectively; Chairman of the Board and Director, Threadneedle Asset Management Holdings, Sàrl, since March 2013 and December 2008, respectively; senior executive of various entities affiliated with Columbia Threadneedle. |
| Christopher O. Petersen 5228 Ameriprise Financial Center Minneapolis, MN 55474 1970 | Senior Vice President and Assistant Secretary (2021) | Formerly, Trustee/Director of funds within the Columbia Funds Complex, July 1, 2020 - November 22, 2021; Senior Vice President and Assistant General Counsel, Ameriprise Financial, Inc., since September 2021 (previously Vice President and Lead Chief Counsel, January 2015 - September 2021); formerly, President and Principal Executive Officer of the Columbia Funds, 2015 - 2021; officer of Columbia Funds and affiliated funds, since 2007. |
| Thomas P. McGuire 290 Congress Street Boston, MA 02210 1972 | Senior Vice President and Chief Compliance Officer (2012) | Vice President – Asset Management Compliance, Ameriprise Financial, Inc., since May 2010; Chief Compliance Officer, Columbia Acorn/Wanger Funds, since December 2015; formerly, Chief Compliance Officer, Ameriprise Certificate Company, September 2010 – September 2020. |
| Ryan C. Larrenaga 290 Congress Street Boston, MA 02210 1970 | Senior Vice President (2017), Chief Legal Officer (2017), and Secretary (2015) | Vice President and Chief Counsel, Ameriprise Financial, Inc., since August 2018 (previously Vice President and Group Counsel, August 2011 - August 2018); Chief Legal Officer, Columbia Acorn/Wanger Funds, since September 2020; officer of Columbia Funds and affiliated funds, since 2005. |
| Michael E. DeFao 290 Congress Street Boston, MA 02210 1968 | Vice President (2011) and Assistant Secretary (2010) | Vice President and Chief Counsel, Ameriprise Financial, Inc., since May 2010; Vice President, Chief Legal Officer and Assistant Secretary, Columbia Management Investment Advisers, LLC, since October 2021 (previously Vice President and Assistant Secretary, May 2010 – September 2021). |
| Lyn Kephart-Strong 5228 Ameriprise Financial Center Minneapolis, MN 55474 1960 | Vice President (2015) | Vice President, Global Investment Operations Services, Columbia Management Investment Advisers, LLC, since 2010; President, Columbia Management Investment Services Corp., since October 2014; President, Ameriprise Trust Company, since January 2017. |
| 54 | Tri-Continental Corporation | Annual Report 2022 |
Item 2. Code of Ethics.
(a)The registrant has adopted a code of ethics that applies to the registrant's principal executive officer, principal financial officer, principal accounting officer or controller, or persons performing similar functions, regardless of whether these individuals are employed by the registrant or a third party.
(b)During the period covered by this report, there were not any amendments to a provision of the code of ethics that applies to the registrant's principal executive officer, principal financial officer, principal accounting officer or controller, or persons performing similar functions, regardless of whether these individuals are employed by the registrant or a third party, and that relates to any element of the code of ethics definition enumerated in paragraph (b) of this Item.
(c)During the period covered by this report, there were no waivers, including any implicit waivers, from a provision of the code of ethics to the registrant's principal executive officer, principal financial officer, principal accounting officer or controller, or persons performing similar functions, regardless of whether these individuals are employed by the registrant or a third party that relates to one or more of the items set forth in paragraph (b) of this Item.
Item 3. Audit Committee Financial Expert.
The registrant's Board of Directors has determined that Brian J. Gallagher, Douglas A. Hacker and Sandra Yeager, each of whom are members of the registrant's Board of Directors and Audit Committee, each qualify as an audit committee financial expert. Mr. Gallagher, Mr. Hacker and Ms. Yeager are each independent directors, as defined in paragraph (a)(2) of this item's instructions.
Item 4. Principal Accountant Fees and Services.
Fee information below is disclosed for registrant whose report to stockholders is included in this annual filing.
(a)Audit Fees. Aggregate Audit Fees billed by the principal accountant for professional services rendered during the fiscal years ended December 31, 2022 and December 31,
2021 are approximately as follows:
20222021
$49,500 $49,500
Audit Fees include amounts related to the audit of the registrant's annual financial statements or services that are normally provided by the accountant in connection with statutory and regulatory filings or engagements for those fiscal years.
(b)Audit-Related Fees. Aggregate Audit-Related Fees billed to the registrant by the principal accountant for professional services rendered during the fiscal years ended December 31, 2022 and December 31, 2021 are approximately as follows:
2022 | 2021 |
$0 | $0 |
Audit-Related Fees, if any, include amounts for assurance and related services by the principal accountant that are reasonably related to the performance of the audit of the registrant's financial statements and are not reported in Audit Fees above.
During the fiscal years ended December 31, 2022 and December 31, 2021, there were no Audit-Related Fees billed by the registrant's principal accountant to the registrant's investment adviser (not including any sub-adviser whose role is primarily portfolio management and is subcontracted with or overseen by another investment adviser) and any entity controlling, controlled by, or under common control with the adviser that provides ongoing services to the registrant for an engagement that related directly to the operations and financial reporting of the registrant.
(c)Tax Fees. Aggregate Tax Fees billed by the principal accountant to the registrant for professional services rendered during the fiscal years ended December 31, 2022 and December 31, 2021 are approximately as follows:
2022 | 2021 |
$15,600 | $0 |
Tax Fees include amounts for the review of annual tax returns, the review of required shareholder distribution calculations and typically include amounts for professional services by the principal accountant for tax compliance, tax advice and tax planning.
During the fiscal years ended December 31, 2022 and December 31, 2021, there were no Tax Fees billed by the registrant's principal accountant to the registrant's investment adviser (not including any sub-adviser whose role is primarily portfolio management and is subcontracted with or overseen by another investment adviser) and any entity controlling, controlled by, or under common control with the adviser that provides ongoing services to the registrant for an engagement that related directly to the operations and financial reporting of the registrant.
(d)All Other Fees. Aggregate All Other Fees billed by the principal accountant to the registrant for professional services rendered during the fiscal years ended December 31,
2022 and December 31, 2021 are approximately as follows:
2022 | 2021 |
$0 | $0 |
All Other Fees, if any, include amounts for products and services provided by the principal accountant, other than the services reported in paragraphs (a) through (c) above.
Aggregate All Other Fees billed by the registrant's principal accountant to the registrant's investment adviser (not including any sub-adviser whose role is primarily portfolio management and is subcontracted with or overseen by another investment adviser) and any entity controlling, controlled by, or under common control with the adviser that provides ongoing services to the registrant for an engagement that related directly to the operations and financial reporting of the registrant during the fiscal years ended December 31, 2022 and December 31, 2021 are approximately as follows:
20222021
$535,000 $520,000
In both fiscal years 2022 and 2021, All Other Fees primarily consist of fees billed for internal control examinations of the registrant's transfer agent and investment adviser.
(e)(1) Audit Committee Pre-Approval Policies and Procedures
The registrant's Audit Committee is required to pre-approve the engagement of the registrant's independent auditors to provide audit and non-audit services to the registrant and non-audit services to its investment adviser (excluding any sub-adviser whose role is primarily portfolio management and is sub-contracted or overseen by another investment adviser (the "Adviser") or any entity controlling, controlled by or under common control with the Adviser that provides ongoing services to the Fund (a "Control Affiliate") if the engagement relates directly to the operations and financial reporting of the registrant.
The Audit Committee has adopted a Policy for Engagement of Independent Auditors for Audit and Non-Audit Services (the "Policy"). The Policy sets forth the understanding of the Audit Committee regarding the engagement of the registrant's independent accountants to provide (i) audit and permissible audit-related, tax and other services to the registrant ("Fund Services"); (ii) non-audit services to the registrant's Adviser and any Control Affiliates, that relates directly to the operations and financial reporting of a Fund ("Fund-related Adviser Services"); and (iii) certain other audit and non-audit services to the registrant's Adviser and its Control Affiliates. A service will require specific pre-approval by the Audit Committee if it is to be provided by the Fund's independent auditor; provided, however, that pre-approval of non-audit services to the Fund, the Adviser or Control Affiliates may be waived if certain de minimis requirements set forth in the SEC's rules are met.
Under the Policy, the Audit Committee may delegate pre-approval authority to any pre- designated member or members who are independent board members. The member(s) to whom such authority is delegated must report, for informational purposes only, any pre- approval decisions to the Audit Committee at its next regular meeting. The Audit Committee's responsibilities with respect to the pre-approval of services performed by the independent auditor may not be delegated to management.
On an annual basis, at a regularly scheduled Audit Committee meeting, the Fund's Treasurer or other Fund officer shall submit to the Audit Committee a schedule of the
types of Fund Services and Fund-related Adviser Services that are subject to specific pre- approval. This schedule will provide a description of each type of service that is subject to specific pre-approval, along with total projected fees for each service. The pre- approval will generally cover a one-year period. The Audit Committee will review and approve the types of services and the projected fees for the next one-year period and may add to, or subtract from, the list of pre-approved services from time to time, based on subsequent determinations. This specific approval acknowledges that the Audit Committee is in agreement with the specific types of services that the independent auditor will be permitted to perform and the projected fees for each service.
The Fund's Treasurer or other Fund officer shall report to the Audit Committee at each of its regular meetings regarding all Fund Services or Fund-related Adviser Services provided since the last such report was rendered, including a description of the services, by category, with forecasted fees for the annual reporting period, proposed changes requiring specific pre-approval and a description of services provided by the independent auditor, by category, with actual fees during the current reporting period.
*****
(e)(2) None, or 0%, of the Audit-Related Fees, Tax Fees and All Other Fees paid by the Fund or affiliated entities relating directly to the operations and financial reporting of the Registrant disclosed above were approved by the audit committee pursuant to paragraphs (c)(7)(i)(C) of Rule 2-01 of Regulation S-X (which permits audit committee approval after the start of the engagement with respect to services other than audit, review or attest services, if certain conditions are satisfied).
(f)Not applicable.
(g)The aggregate non-audit fees billed by the registrant's accountant for services rendered to the registrant, and rendered to the registrant's investment adviser (not including any sub-adviser whose role is primarily portfolio management and is subcontracted with or overseen by another investment adviser), and any entity controlling, controlled by, or under common control with the adviser that provides ongoing services to the registrant for the fiscal years ended December 31, 2022 and December 31, 2021 are approximately as follows:
20222021
$550,600 $520,000
(h)The registrant's Audit Committee of the Board of Directors has considered whether the provision of non-audit services that were rendered to the registrant's adviser (not including any sub-adviser whose role is primarily portfolio management and is subcontracted with or overseen by another investment adviser), and any entity controlling, controlled by, or under common control with the investment adviser that provides ongoing services to the registrant that were not pre-approved pursuant to paragraph (c)(7)(ii) of Rule 2-01 of Regulation S-X, is compatible with maintaining the principal accountant's independence.
Item 5. Audit Committee of Listed Registrants.
(a)The registrant has a separately-designated standing audit committee established in accordance with Section 3(a)58)(A) of the Exchange Act (15 U.S.C. 78c(a)(58)(A). Brian J. Gallagher, Douglas A. Hacker and Sandra L. Yeager are each independent directors and collectively constitute the entire Audit Committee.
(b)Not applicable.
Item 6. Investments
(a)The registrant's "Schedule I – Investments in securities of unaffiliated issuers" (as set forth in 17 CFR 210.12-12) is included in Item 1 of this Form N-CSR.
(b)Not applicable.
Item 7. Disclosure of Proxy Voting Policies and Procedures for Closed-End Management Investment Companies.
Proxy Voting Policies and Procedures
General. The Funds have delegated to the Investment Manager the responsibility to vote proxies relating to portfolio securities held by the Funds, including Funds managed by subadvisers. In deciding to delegate this responsibility to the Investment Manager, the Board reviewed the policies adopted by the Investment Manager. These included the procedures that the Investment Manager follows when a vote presents a conflict between the interests of the Funds and their shareholders and the Investment Manager and its affiliates.
The Investment Manager's policy is to vote all proxies for Fund securities in a manner considered by the Investment Manager to be in the best economic interests of its clients, including the Funds, without regard to any benefit or detriment to the Investment Manager, its employees or its affiliates. The best economic interests of clients is defined for this purpose as the interest of enhancing or protecting the value of client accounts, considered as a group rather than individually, as the Investment Manager determines in its discretion. The Investment Manager endeavors to vote all proxies of which it becomes aware prior to the vote deadline; provided, however, that in certain circumstances the Investment Manager may refrain from voting securities. For instance, the Investment Manager may refrain from voting foreign securities if it determines that the costs of voting outweigh the expected benefits of voting and typically will not vote securities if voting would impose trading restrictions.
The Board may, in its discretion, vote proxies for the Funds. For instance, the Board may determine to vote on matters that may present a material conflict of interest to the Investment Manager. In addition, the Board may instruct the Investment Manager to vote in accordance with guidelines approved by the Board.
Oversight. The operation of the Investment Manager's proxy voting policy and procedures is overseen by a group of representatives from the Investment Manager and its advisory affiliates. Oversight of Investment Manager proxy voting is also provided by a committee within the investment Manager comprised of
portfolio managers and research analysts. The Board reviews on an annual basis, or more frequently as determined appropriate, the Investment Manager's administration of the proxy voting process.
Corporate Governance and Proxy Voting Principles (the Principles). The Investment Manager has adopted the Principles, which set out voting stances on key issues and the broad principles shaping its approach, as well as the types of related voting action the Investment Manager may take. The Principles also provide indicative examples of key guidelines used in any given region, which illustrate the standards against which voting decisions are considered. The Investment Manager has developed voting stances that align with the Principles and will generally vote in accordance with such voting stances. The Investment Manager may determine to vote differently from the voting stances on particular proposals in the event it determines that doing so is in the clients' best economic interests. The Investment Manager may consider the voting recommendations of analysts, portfolio managers, subadvisers and information obtained from outside resources, including one or more third party research providers. When proposals are not covered by the voting stances or a voting determination must be made on a case-by-case basis, a portfolio manager, subadviser or analyst will make the voting determination based on his or her determination of the clients' best economic interests.
Addressing Conflicts of Interest. The Investment Manager seeks to address potential material conflicts of interest by voting in accordance with predetermined voting stances. In addition, if the Investment Manager determines that a material conflict of interest exists, the Investment Manager will invoke one or more of the following conflict management practices: (i) causing the proxies to be voted in accordance with the recommendations of an independent third party (which may be the Investment Manager's proxy voting administrator or research provider); (ii) causing the proxies to be delegated to an independent third party (which may be the Investment Manager's proxy voting administrator or research provider); and (iii) in infrequent cases, forwarding the proxies to an Independent Director authorized to vote the proxies for the Funds. A member of the governing body responsible for proxy voting is prohibited from voting on any proposal for which he or she has a conflict of interest by reason of a direct relationship with the issuer or other party affected by a given proposal. Persons making recommendations are required to disclose any relationship with a party making a proposal or other matter known to the person that would create a potential conflict of interest.
Voting Proxies of Affiliated Underlying Funds. Certain Funds may invest in shares of other Columbia Funds (referred to in this context as "underlying funds") and may own substantial portions of these underlying funds. If such Funds are in a master-feeder structure, the feeder fund will either seek instructions from its shareholders with regard to the voting of proxies with respect to the master fund's shares and vote such proxies in accordance with such instructions or vote the shares held by it in the same proportion as the vote of all other master fund shareholders. With respect to Funds that hold shares of underlying funds other than in a master-feeder structure, the holding Funds will typically vote proxies of the underlying funds in the same proportion as the vote of all other holders of the underlying fund's shares, unless the Board otherwise instructs.
Proxy Voting Agents. The Investment Manager has retained Institutional Shareholder Services Inc., a third- party vendor, as its proxy voting administrator to implement its proxy voting process and to provide recordkeeping and vote disclosure services. Typically, Institutional Shareholder Services Inc. populates ballots for issuers deemed to present potential material conflicts of interest in accordance with predetermined voting stances, as described above under Addressing Conflicts of Interest. The Investment Manager has retained both Institutional Shareholder Services Inc. and Glass Lewis & Company, LLC to provide proxy research services.
Additional Information. Information regarding how the Columbia Funds (except certain Columbia Funds that do not invest in voting securities) voted proxies relating to portfolio securities during the most recent twelve month period ended June 30 will be available by August 31 of this year free of charge: (i) through the Columbia Funds' website at columbiathreadneedleus.com and/or (ii) on the SEC's website at www.sec.gov. For a copy of the Principles in effect on the date of the SAI, see Appendix B to the SAI.
Item 8. Portfolio Managers of Closed-End Management Investment Companies.
Portfolio Managers
|
|
| Managed the |
Portfolio Manager | Title | Role with the Corporation | Corporation Since |
David King, CFA | Senior Portfolio Manager | Co-Portfolio Manager | 2011 |
Yan Jin | Senior Portfolio Manager | Co-Portfolio Manager | 2012 |
Raghavendran Sivaraman, Ph.D.,Senior Portfolio Manager | Co-Portfolio Manager | 2020 | |
CFA |
|
|
|
Grace Lee, CAIA | Senior Portfolio Manager | Co-Portfolio Manager | 2020 |
Oleg Nusinzon, CFA | Senior Portfolio Manager | Co-Portfolio Manager | 2021 |
Mr. King joined the Investment Manager in 2010. Mr. King began his investment career in 1983 and earned a B.S. from the University of New Hampshire and an M.B.A. from Harvard Business School.
Mr. Jin joined one of the Columbia Management legacy firms or acquired business lines in 2002. Mr. Jin began his investment career in 1998 and earned a M.A. in economics from North Carolina State University.
Dr. Sivaraman joined one of the Columbia Management legacy firms or acquired business lines in 2007. Dr. Sivaraman began his investment career in 2007 and earned a B.Tech. in Computer Science Engineering from the Indian Institute of Technology, Madras and a Ph.D. in Operations Research from the Massachusetts Institute of Technology.
Ms. Lee joined the Investment Manager in 2014. Ms. Lee began her investment career in 1996 and earned a bachelor's degree in political science and economics from Stanford University and an M.B.A. from Harvard Business School.
Mr. Nusinzon joined the Investment Manager in October 2020. Prior to joining the Investment Manager, Mr. Nusinzon was a Director and a Lead Portfolio Manager at PanAgora Asset Management. Mr. Nusinzon began his investment career in 1997 and earned a B.S.E. from the University of Pennsylvania and an M.B.A. from the Chicago Booth School of Business.
Other Accounts Managed by the Portfolio Managers:
|
|
|
| Other Accounts Managed |
| Ownership | |
|
|
|
|
| Approximate | Performance | |
| Fund | Portfolio Manager | Number and type of | of Fund | |||
| Total Net Assets | Based Accounts | |||||
|
|
|
| account | Shares | ||
|
|
|
| (excluding the fund) |
| ||
|
|
|
|
|
|
| |
| For fiscal period ending December 31, 2022, unless otherwise noted |
|
| ||||
Tri-Continental | Yan Jin | 4 | RICs | $6.10 billion | None | $100,001- | |
Corporation |
| 12 Other accounts | $17.23 million |
| $500,000 | ||
|
|
|
|
|
|
| (vested) |
|
| David King | 4 | RICs | $6.10 billion | None | Over |
|
|
| 8 | Other accounts | $38.98 million |
| $1,000,000 |
|
|
|
|
|
|
| (vested) |
|
| Grace Lee | 4 | RICs | $6.10 billion | None | $100,001 - |
|
|
| 9 | Other accounts | $14.59 million |
| $500,000 |
|
|
|
|
|
|
| (vested) |
|
| Oleg Nusinzon | 6 | RICs | $8.20 billion | None | None |
|
|
| 21 Other accounts | $6.32 billion |
|
| |
|
|
|
|
|
|
|
|
|
| Raghavendran | 6 | RICs | $8.20 billion | 1 Other account - | None |
|
| Sivaraman | 16 Other accounts | $6.32 billion | $260 million |
| |
|
|
|
|
|
|
|
|
Potential Conflicts of Interest:
Columbia Management: Like other investment professionals with multiple clients, a Fund's portfolio manager(s) may face certain potential conflicts of interest in connection with managing both the Fund and other accounts at the same time. The Investment Manager and the Funds have adopted compliance policies and procedures that attempt to address certain of the potential conflicts that portfolio managers face in this regard. Certain of these conflicts of interest are summarized below.
The management of funds or other accounts with different advisory fee rates and/or fee structures, including accounts, such as the Investment Manager's hedge funds, that pay advisory fees based on account performance (performance fee accounts), may raise potential conflicts of interest for a portfolio manager by creating an incentive to favor accounts that pay higher fees, including performance fee accounts, such that the portfolio manager may have an incentive to allocate attractive investments disproportionately to performance fee accounts.
Similar conflicts of interest also may arise when a portfolio manager has personal investments in other accounts that may create an incentive to favor those accounts. When the Investment Manager determines it necessary or appropriate in order to ensure compliance with restrictions on joint transactions under the 1940 Act, a Fund may not be able to invest in privately-placed securities in which other accounts advised by the Investment Manager using a similar style, including performance fee accounts, are able to invest, even when the Investment Manager believes such securities would otherwise represent attractive investment opportunities. As a general matter and subject to the Investment Manager's Code of Ethics and certain limited exceptions, including for investments in the Investment Manager's hedge funds, the Investment Manager's investment professionals do not have the opportunity to invest in client accounts, other than the Funds.
A portfolio manager who is responsible for managing multiple funds and/or accounts may devote unequal time and attention to the management of those Funds and/or accounts. The effects of this potential conflict may be more pronounced where Funds and/or accounts managed by a particular portfolio manager have different investment strategies.
A portfolio manager may be able to select or influence the selection of the broker/dealers that are used to execute securities transactions for the Funds. A portfolio manager's decision as to the selection of broker/dealers could produce disproportionate costs and benefits among the Funds and the other accounts the portfolio manager manages.
A potential conflict of interest may arise when a portfolio manager buys or sells the same securities for a Fund and other accounts. On occasions when a portfolio manager considers the purchase or sale of a security to be in the best interests of a Fund as well as other accounts, the Investment Manager's trading desk may, to the extent consistent with applicable laws and regulations, aggregate the securities to be sold or bought in order to obtain the best execution and lower brokerage commissions, if any. Aggregation of trades may create the potential for unfairness to a Fund or another account if a portfolio manager favors one account over another in allocating the securities bought or sold. The Investment Manager and its Participating Affiliates may coordinate their trading operations for certain types of securities and transactions pursuant to personnel-sharing agreements or similar intercompany arrangements. However, typically the Investment Manager does not coordinate trading activities with a Participating Affiliate with respect to accounts of that Participating Affiliate unless such Participating Affiliate is also providing trading services for accounts managed by the Investment Manager. Similarly, a Participating Affiliate typically does not coordinate trading activities with the Investment Manager with respect to accounts of the Investment Manager unless the Investment Manager is also providing trading services for accounts managed by such Participating Affiliate. As a result, it is possible that the Investment Manager and its Participating Affiliates may trade in the same instruments at the same time, in the same or opposite direction or in different sequence, which could negatively impact the prices paid by the Fund on such instruments. Additionally, in circumstances where trading services are being provided on a coordinated basis for the Investment Manager's accounts (including the Funds) and the accounts of one or more Participating Affiliates in accordance with applicable law, it is possible that the allocation opportunities available to the Funds may be decreased, especially for less actively traded securities, or orders may take longer to execute, which may negatively impact Fund performance.
"Cross trades," in which a portfolio manager sells a particular security held by a Fund to another account (potentially saving transaction costs for both accounts), could involve a potential conflict of interest if, for example, a portfolio manager is permitted to sell a security from one account to another account at a higher price than an independent third party would pay. The Investment Manager and the Funds have adopted compliance procedures that provide that any transactions between a Fund and another account managed by the Investment Manager are to be made at a current market price, consistent with applicable laws and regulations.
Another potential conflict of interest may arise based on the different investment objectives and strategies of a Fund and other accounts managed by its portfolio manager(s). Depending on another account's objectives and other factors, a portfolio manager may give advice to and make decisions for a Fund that may differ from advice given, or the timing or nature of decisions made, with respect to another account. A portfolio manager's investment decisions are the product of many factors in addition to basic suitability for the particular account involved. Thus, a portfolio manager may buy or sell a particular security for certain accounts, and not for a Fund, even though it could have been bought or sold for the Fund at the same time. A portfolio manager also may buy a particular security for one or more accounts when one or more other accounts are selling the security (including short sales). There may be circumstances when a portfolio manager's purchases or sales of portfolio securities for one or more accounts may have an adverse effect on other accounts, including the Funds.
To the extent a Fund invests in underlying funds, a portfolio manager will be subject to additional potential conflicts of interest. Because of the structure of funds-of-funds, the potential conflicts of interest for the portfolio managers may be different than the potential conflicts of interest for portfolio managers who manage other Funds. The Investment Manager and its affiliates may receive higher compensation as a result of allocations to underlying funds with higher fees.
A Fund's portfolio manager(s) also may have other potential conflicts of interest in managing the Fund, and the description above is not a complete description of every conflict that could exist in managing the Fund and other accounts. Many of the potential conflicts of interest to which the Investment Manager's portfolio managers are subject are essentially the same or similar to the potential conflicts of interest related to the investment management activities of the Investment Manager and its affiliates.
Structure of Compensation:
Columbia Management: Portfolio manager direct compensation is typically comprised of a base salary, and an annual incentive award that is paid either in the form of a cash bonus if the size of the award is under a specified threshold, or, if the size of the award is over a specified threshold, the award is paid in a combination of a cash bonus, an equity incentive award, and deferred compensation. Equity incentive awards are made in the form of Ameriprise Financial restricted stock or, for more senior employees, both Ameriprise Financial restricted stock and stock options. The investment return credited on deferred compensation is based on the performance of specified Columbia Funds, in most cases including the Columbia Funds the portfolio manager manages.
Base salary is typically determined based on market data relevant to the employee's position, as well as other factors including internal equity. Base salaries are reviewed annually, and increases are typically given as promotional increases, internal equity adjustments, or market adjustments.
Under the Columbia Management annual incentive plan for investment professionals, awards are discretionary, and the amount of incentive awards for investment team members is variable based on (1) an evaluation of the investment performance of the investment team of which the investment professional is a member, reflecting the performance (and client experience) of the funds or accounts the investment professional manages and, if applicable, reflecting the individual's work as an investment research analyst,
(2)the results of a peer and/or management review of the individual, taking into account attributes such as team participation, investment process followed, communications, and leadership, and (3) the amount of aggregate funding of the plan determined by senior management of Columbia Threadneedle Investments and Ameriprise Financial, which takes into account Columbia Threadneedle Investments revenues and profitability, as well as Ameriprise Financial profitability, historical plan funding levels and other factors. Columbia Threadneedle Investments revenues and profitability are largely determined by assets under management. In determining the allocation of incentive compensation to investment teams, the amount of assets and related revenues managed by the team is also considered, alongside investment performance. Individual awards are subject to a comprehensive risk adjustment review process to ensure proper reflection in remuneration of adherence to our controls and Code of Conduct.
Investment performance for a fund or other account is measured using a scorecard that compares account performance against benchmarks, custom indexes and/or peer groups. Account performance may also be compared to unaffiliated passively managed ETFs, taking into consideration the management fees of comparable passively managed ETFs, when available and as determined by the Investment Manager. Consideration is given to relative performance over the one-, three- and five-year periods, with the largest weighting on the three-year comparison. For individuals and teams that manage multiple strategies and accounts, relative asset size is a key determinant in calculating the aggregate score, with weighting typically proportionate to actual assets. For investment leaders who have group management responsibilities, another factor in their evaluation is an assessment of the group's overall investment performance. Exceptions to this general approach to bonuses exist for certain teams and individuals. Equity incentive awards are designed to align participants' interests with those of the shareholders of
Ameriprise Financial. Equity incentive awards vest over multiple years, so they help retain employees. Deferred compensation awards are designed to align participants' interests with the investors in the Columbia Funds and other accounts they manage. The value of the deferral account is based on the performance of Columbia Funds. Employees have the option of selecting from various Columbia Funds for their deferral account, however portfolio managers must (other than by strict exception) allocate a minimum of 25% of their incentive awarded through the deferral program to the Columbia Fund(s) they manage. Deferrals vest over multiple years, so they help retain employees.
For all employees the benefit programs generally are the same and are competitive within the financial services industry. Employees participate in a wide variety of plans, including options in Medical, Dental, Vision, Health Care and Dependent Spending Accounts, Life Insurance, Long Term Disability Insurance, 401(k), and a cash balance pension plan.
Item 9. Purchases of Equity Securities by Closed-End Management Investment Company and Affiliated Purchasers.
|
|
|
| Total Number of |
|
|
|
|
| Shares Purchased as | Maximum Number of |
| Total Number of | Average Price | Part of Publicly | Shares that May Yet Be | |
| Shares |
| Paid Per | Announced Plans or | Purchased Under the |
Period | Purchased |
| Share | Programs(1) | Plans or Programs(1) |
01-01-22 to 01-31-22 | 222,361 | $ | 31.65 | 222,361 | 2,510,931 |
02-01-22 to 02-28-22 | 203,725 | $ | 31.10 | 203,725 | 2,307,207 |
03-01-22 to 03-31-22 | 166,825 | $ | 30.61 | 166,825 | 2,140,382 |
04-01-22 to 04-30-22 | 227,337 | $ | 30.52 | 227,337 | 1,913,045 |
05-01-22 to 05-31-22 | 229,476 | $ | 28.63 | 229,476 | 1,683,569 |
06-01-22 to 06-30-22 | 181,224 | $ | 27.04 | 181,224 | 1,502,346 |
07-01-22 to 07-31-22 | 177,627 | $ | 26.93 | 177,627 | 1,324,719 |
08-01-22 to 08-31-22 | 227,701 | $ | 28.79 | 227,701 | 1,097,018 |
09-01-22 to 09-30-22 | 210,354 | $ | 26.96 | 210,354 | 886,665 |
10-01-22 to 10-31-22 | 126,745 | $ | 26.09 | 126,745 | 759,920 |
11-01-22 to 11-30-22 | 167,266 | $ | 27.20 | 167,266 | 592,654 |
12-01-22 to 12-31-22 | 252,553 | $ | 26.27 | 252,553 | 340,100 |
(1)The registrant has a stock repurchase program approved by the Board of Directors that authorizes the Fund to repurchase up to 5% of its outstanding Common Stock directly from stockholders and in the open market, provided that, with respect to shares repurchased in the open market the excess of the net asset value of a share of Common Stock over its market price (the discount) is greater than 10%. The table reflects trade date + 1, rather than trade date, which is used for financial statement purposes; therefore, shares reflected may vary from capital stock activity presented in the shareholder report.
Item 10. Submission of Matters to a Vote of Security Holders.
There were no material changes to the procedures by which shareholders may recommend nominees to the registrant's board of directors.
Item 11. Controls and Procedures.
(a)The registrant's principal executive officer and principal financial officer, based on their evaluation of the registrant's disclosure controls and procedures as of a date within 90 days of the filing of this report, have concluded that such controls and procedures are adequately designed to ensure that information required to be disclosed by the registrant in Form N-CSR is accumulated and communicated to the registrant's management, including the principal executive officer and principal financial officer, or persons performing similar functions, as appropriate to allow timely decisions regarding required disclosure.
(b)There was no change in the registrant's internal control over financial reporting that occurred during the period covered by this report that has materially affected, or is reasonably likely to materially affect, the registrant's internal control over financial reporting.
Item 12. Disclosure of Securities Lending Activities for Closed-End Management Investment Companies
Not applicable.
Item 13. Exhibits.
SIGNATURES
Pursuant to the requirements of the Securities Exchange Act of 1934 and the Investment Company Act of 1940, the registrant has duly caused this report to be signed on its behalf by the undersigned, thereunto duly authorized.
(registrant) | Tri-Continental Corporation |
|
|
By (Signature and Title) | /s/ Daniel J. Beckman |
| Daniel J. Beckman, President and Principal Executive Officer |
|
|
Date | February 22, 2023 |
|
|
|
|
Pursuant to the requirements of the Securities Exchange Act of 1934 and the Investment Company Act of 1940, this report has been signed below by the following persons on behalf of the registrant and in the capacities and on the dates indicated.
By (Signature and Title) | /s/ Daniel J. Beckman |
| Daniel J. Beckman, President and Principal Executive Officer |
|
|
Date | February 22, 2023 |
By (Signature and Title) | /s/ Michael G. Clarke |
| Michael G. Clarke, Chief Financial Officer, |
| Principal Financial Officer and Senior Vice President |
|
|
Date | February 22, 2023 |
By (Signature and Title) | /s/ Joseph Beranek |
| Joseph Beranek, Treasurer, Chief Accounting |
| Officer and Principal Financial Officer |
|
|
Date | February 22, 2023 |