UNITED STATES
SECURITIES AND EXCHANGE COMMISSION
Washington, D.C. 20549
FORM 10-K
(Mark One)
| | | | | |
| ☒ | Annual Report Pursuant to Section 13 or 15(d) of the Securities Exchange Act of 1934 |
| |
For the fiscal year ended December 31, 2024
| | | | | | | | |
| | |
| or |
| ☐ | Transition Report Pursuant to Section 13 or 15(d) of the Securities Exchange Act of 1934 |
| | |
| For the transition period from _______________ to _______________ |
Commission File No. 1-13998
Insperity, Inc.
(Exact name of registrant as specified in its charter)
| | | | | | | | |
| Delaware | | 76-0479645 |
| (State or other jurisdiction of incorporation or organization) | | (I.R.S. Employer Identification No.) |
| | | | | | | | |
| 19001 Crescent Springs Drive |
| Kingwood, | Texas | 77339 |
| (Address of principal executive offices) |
(Registrant’s Telephone Number, Including Area Code): (281) 358-8986
| | | | | | | | |
| Securities registered pursuant to Section 12(b) of the Act: |
| Title of each class | Trading symbol(s) | Name of each exchange on which registered |
| Common Stock, $0.01 par value per share | NSP | New York Stock Exchange |
Securities Registered Pursuant to Section 12(g) of the Act: NONE
Indicate by check mark if the registrant is a well-known seasoned issuer, as defined in Rule 405 of the Securities Act.
Yes ☒ No ☐
Indicate by check mark if the registrant is not required to file reports pursuant to Section 13 or Section 15(d) of the Act. Yes ☐ No ☒
Indicate by check mark whether the registrant (1) has filed all reports required to be filed by Section 13 or 15(d) of the Securities Exchange Act of 1934 during the preceding 12 months (or for such shorter period that the registrant was required to file such reports) and (2) has been subject to such filing requirements for the past 90 days. Yes ☒ No ☐
Indicate by check mark whether the registrant has submitted electronically every Interactive Data File required to be submitted pursuant to Rule 405 of Regulation S-T during the preceding 12 months (or for such shorter period that the registrant was required to submit such files). Yes ☒ No ☐
Indicate by check mark whether the registrant is a large accelerated filer, an accelerated filer, a non-accelerated filer, a smaller reporting company, or an emerging growth company. See the definitions of “large accelerated filer,” “accelerated filer,” “smaller reporting company,” and “emerging growth company” in Rule 12b-2 of the Exchange Act.
| | | | | | | | | | | |
| Large accelerated filer | ☒ | Accelerated filer | ☐ |
| Non-accelerated filer | ☐ | Emerging growth company | ☐ |
| Smaller reporting company | ☐ | | |
If an emerging growth company, indicate by check mark if the registrant has elected not to use the extended transition period for complying with any new or revised financial accounting standards provided pursuant to Section 13(a) of the Exchange Act. ☐
Indicate by check mark whether the registrant has filed a report on and attestation to its management’s assessment of the effectiveness of its internal control over financial reporting under Section 404(b) of the Sarbanes-Oxley Act (15 U.S.C. 7262(b)) by the registered public accounting firm that prepared or issued its audit report. ☒
If securities are registered pursuant to Section 12(b) of the Act, indicate by check mark whether the financial statements of the registrant included in the filing reflect the correction of an error to previously issued financial statements. ☐
Indicate by check mark whether any of those error corrections are restatements that required a recovery analysis of incentive-based compensation received by any of the registrant’s executive officers during the relevant recovery period pursuant to §240.10D-1(b). ☐
Indicate by check mark whether the registrant is a shell company (as defined in Rule 12b-2 of the Exchange Act).
Yes ☐ No ☒
As of February 3, 2025, 37,230,174 shares of the registrant’s common stock, par value $0.01 per share, were outstanding. As of the last business day of the registrant’s most recently completed second quarter, the aggregate market value of the common stock held by non-affiliates (based upon the June 30, 2024 closing price of the common stock as reported by the New York Stock Exchange) was approximately $3.4 billion.
DOCUMENTS INCORPORATED BY REFERENCE
Part III information is incorporated by reference from the proxy statement for the 2025 annual meeting of stockholders, which the registrant intends to file within 120 days of the end of the fiscal year.
| | | | | | | | | | | |
| | | Page |
| | | |
| Part I |
| Item 1. | | |
| Item 1A. | | |
| Item 1B. | | |
| Item 1C. | | |
| Item 2. | | |
| Item 3. | | |
| Item 4. | | |
| Item S-K 401(b). | | |
| | | |
| Part II |
| Item 5. | | |
| Item 6. | | |
| Item 7. | | |
| Item 7A. | | |
| Item 8. | | |
| Item 9. | | |
| Item 9A. | | |
| Item 9B. | | |
| Item 9C. | | |
| | | |
| Part III |
| Item 10. | | |
| Item 11. | | |
| Item 12. | | |
| Item 13. | | |
| Item 14. | | |
| | | |
| Part IV |
| Item 15. | | |
| Item 16. | | |
PART I
Unless otherwise indicated, “Insperity,” “we,” “our” and “us” are used in this annual report to refer to Insperity, Inc. and its consolidated subsidiaries. This annual report contains forward-looking statements within the meaning of Section 27A of the Securities Act of 1933 (the “Securities Act”) and Section 21E of the Securities Exchange Act of 1934 (the “Exchange Act”). You can identify such forward-looking statements by the words “anticipates,” “expects,” “intends,” “plans,” “projects,” “believes,” “estimates,” “likely,” “possibly,” “probably,” “could,” “goal,” “opportunity,” “objective,” “target,” “assume,” “outlook,” “guidance,” “predicts,” “appears,” “indicator” and similar expressions. In the normal course of business, in an effort to help keep our stockholders and the public informed about our operations, from time to time, we may issue such forward-looking statements, either orally or in writing. Generally, these statements relate to business plans or strategies; projected or anticipated benefits or other consequences of such plans or strategies; or projections involving anticipated revenues, earnings, average number of worksite employees, benefits and workers’ compensation costs, or other operating results. We base the forward-looking statements on our current expectations, estimates and projections. We caution you that these statements are not guarantees of future performance and involve risks, uncertainties and assumptions that we cannot predict. In addition, we have based many of these forward-looking statements on assumptions about future events that may prove to be inaccurate. Therefore, the actual results of the future events described in such forward-looking statements in this annual report, or elsewhere, could differ materially from those stated in such forward-looking statements. Among the factors that could cause actual results to differ materially are the risks and uncertainties discussed in this annual report, including, without limitation, factors discussed in Item 1, “Business,” Item 1A, “Risk Factors,” and Item 7, “Management’s Discussion and Analysis of Financial Condition and Results of Operations.” Item 1. Business.
General
We provide an array of human resources (“HR”) and business solutions designed to help improve business performance. Since our formation in 1986, we have evolved from being solely a professional employer organization (“PEO”), an industry we pioneered, to our current position as a comprehensive business performance solutions provider.
Our long-term strategy is to provide the best small and medium-sized businesses in the United States with our specialized human resources service offerings and to leverage our buying power and expertise to provide additional valuable services to clients. Our most comprehensive HR services offerings are provided through our Workforce Optimization® and Workforce SynchronizationTM solutions (together, our “PEO HR Outsourcing Solutions”), which encompass a broad range of human resources functions, including payroll and employment administration, employee benefits, workers’ compensation, government compliance, performance management, and training and development services, along with our cloud-based human capital management platform, our Insperity PremierTM platform. Workforce Optimization is our most comprehensive HR outsourcing solution and is our primary offering. Workforce Synchronization, which generally is offered only to our middle market client segment, is a lower cost offering with a typically longer commitment that includes the same compliance and administrative services as Workforce Optimization and allows those clients to select, for an additional fee, from the strategic HR products and services that are included with Workforce Optimization.
In addition to our PEO HR Outsourcing Solutions, we offer a comprehensive traditional payroll and human capital management solution, known as our Workforce AccelerationTM solution. We also offer a number of other business performance solutions, including Recruiting Services, Employment Screening, Retirement Services, and Insurance Services. These other products and services generally are offered only with our other solutions.
Our PEO HR Outsourcing Solutions are designed to improve the productivity and profitability of small and medium-sized businesses. These solutions relieve business owners and key executives of many employer-related administrative and regulatory burdens, which enable them to focus on the core competencies of their businesses. Our PEO HR Outsourcing Solutions also promote employee performance through human capital management techniques designed to improve employee engagement and satisfaction. We enter into a Client Service Agreement (“CSA”) with each of our PEO HR Outsourcing Solutions clients under which we and our client act as co-employers of the employees who work at the client’s worksite, or worksite employees (“WSEEs”). Under the CSA, we assume responsibility for personnel administration and assist our clients in complying with employment-related governmental regulations, while the client retains the employees’ services in its business and remains the employer for other purposes. We charge a comprehensive service fee (“comprehensive service fee” or “gross billing”), which is invoiced concurrently with the processing of payroll for the WSEEs of the client. The comprehensive service fee consists of the payroll of our WSEEs plus an additional amount reflected as a percentage of the payroll cost of the WSEEs.
We accomplish the objectives of our PEO HR Outsourcing Solutions through a “high-touch/high-tech” approach to service delivery. In advisory areas, such as recruiting, employee performance management and employee training, we employ a high-touch approach designed to ensure that our clients receive the personal attention and expertise needed to create a customized human resources solution. We utilize a variety of information technology capabilities to deliver our PEO HR Outsourcing Solutions, including Insperity Premier through which we, along with our clients and WSEEs, manage employee administration, payroll, payroll tax, benefits, retirement solutions and other HR-related information, creating efficiencies for all parties.
As of December 31, 2024, we had 83 physical office locations in 48 markets. To take advantage of economic efficiencies, multiple sales offices may share a physical location. In addition, we had four regional service centers along with human resources and client service personnel located in a majority of our 48 sales markets, which serviced an average of 309,093 WSEEs per month in the fourth quarter of 2024. Our service centers coordinate PEO HR Outsourcing Solutions for clients on a regional basis and localized face-to-face human resources services.
We were organized as a corporation in 1986. Our principal executive offices are located at 19001 Crescent Springs Drive, Kingwood, Texas 77339. Our telephone number at that address is (281) 358-8986, and our website address is www.insperity.com. Our stock is traded on the New York Stock Exchange under the symbol “NSP.” We file or furnish periodic reports with the Securities and Exchange Commission (“SEC”), including our annual reports on Form 10-K, quarterly reports on Form 10-Q, current reports on Form 8-K, and if applicable, amendments to those reports filed or furnished pursuant to Section 13(a) or 15(d) of the Exchange Act. Through the investor relations section of our website, we make available electronic copies of the documents that we file or furnish to the SEC, the charters of the standing committees of our Board of Directors (“Board”) and other documents related to our corporate governance, including our Code of Conduct, and other information that could be deemed to be material. Access to these electronic filings is available free of charge as soon as reasonably practicable after filing or furnishing them to the SEC. Printed copies of our committee charters and other governance documents and filings can be requested by writing to our corporate secretary at the address above. Information on our website is not a part of, and is not incorporated into, this report or any other report we may file with or furnish to the SEC, whether before or after the date of this report and irrespective of any general incorporation language therein.
PEO Industry
The PEO industry began to evolve in the early 1980s largely in response to the burdens placed on small and medium-sized employers by an increasingly complex legal and regulatory environment. While various service providers were available to assist these businesses with specific tasks, PEOs emerged as providers of a more comprehensive range of services relating to the employer/employee relationship. In a PEO arrangement, the PEO assumes certain aspects of the employer/employee relationship as defined in the contract between the PEO and its client. Because PEOs provide employer-related services to a large number of employees, they can achieve economies of scale that allow them to perform employment-related functions more efficiently, provide a greater variety of employee benefits, and devote more attention to human resources management than a client can individually.
We believe the key factors driving demand for PEO services include:
•the focus on growth and productivity of the small and medium-sized business community in the United States, utilizing outsourcing to concentrate on core competencies
•the need to provide competitive health care and related benefits to attract and retain employees
•the increasing costs associated with health and workers’ compensation insurance coverage, workplace safety programs, employee-related complaints and litigation
•complex regulation of payroll, payroll tax and employment issues and the related costs of compliance, including the allocation of time and effort to such functions by owners and key executives
•the significant costs, time and specialized knowledge required to purchase or develop the technology infrastructure to administer benefits, HR and payroll processing on an integrated basis
A significant factor in the development of the PEO industry has been increasing recognition and acceptance of PEOs and the co-employer relationship by federal and state governmental authorities. Insperity and other industry leaders, in concert with the National Association of Professional Employer Organizations (“NAPEO”), have worked with the relevant
governmental entities for the establishment of a regulatory framework that protects clients and employees, discourages unscrupulous and financially unsound PEOs, and promotes further development of the industry. Currently, 42 states have enacted legislation either recognizing PEOs or requiring licensing, registration, or certification, and several others are considering such regulation. Such laws vary from state to state but generally provide for monitoring the fiscal responsibility of PEOs. State regulation assists in screening insufficiently capitalized PEO operations and helps to resolve interpretive issues concerning employer/employee status for specific purposes under applicable state law. We have actively supported such regulatory efforts and are currently recognized, licensed, registered, certified or pursuing registration in all of these states. The cost of compliance with these regulations is not material to our financial position or results of operations.
The Small Business Efficiency Act (“SBEA”) created a federal regulatory framework for the payment of wages to WSEEs and the reporting and remittance of federal payroll taxes on those wages paid by PEOs certified under the Internal Revenue Code as meeting certain requirements (“CPEOs”). We actively supported the enactment of this law. The SBEA clarified that a CPEO, rather than the client, is treated as the employer for purposes of reporting and remitting payroll taxes. It also clarified that a CPEO is treated as a successor employer for purposes of the wage base of WSEEs on which federal payroll taxes are applied. In addition, the law clarified that clients of a CPEO remain eligible for specified tax credits for which they would have been eligible absent the CPEO relationship. Following the establishment of the voluntary certification program by the Internal Revenue Service of the United States (“IRS”) and Treasury Department, our PEO subsidiary, Insperity PEO Services, L.P., received its designation as a CPEO from the IRS.
Service Offerings
PEO HR Outsourcing Solutions
We serve small and medium-sized businesses by providing our PEO HR Outsourcing Solutions, which encompass a broad range of services. Both of our PEO HR Outsourcing Solutions offer the following:
•payroll and benefits administration
•general HR advice
•health and workers’ compensation insurance programs
•401(k) retirement plan sponsored by us
•employer liability management
•assistance with government compliance
•personnel records management
•access to Insperity Premier for employees, managers, and client owners
Our Workforce Optimization solution also provides additional services that our Workforce Synchronization clients can purchase for an additional fee, including the following:
•employee recruiting and support
•employee performance management
•training and development services
•strategic HR projects
Our PEO HR Outsourcing Solutions are designed to attract and retain high-quality employees, while relieving client owners and key executives of many employer-related administrative and regulatory burdens. As a co-employer in the PEO relationship, we assume or share many of the employer-related responsibilities and assist our clients in complying with many employment-related governmental laws and regulations. Historically, we believe that we have successfully marketed the compliance component of our service offering and that our compliance-related services have increased the value proposition of our service offering. Among the employment-related laws and regulations that may affect a client are the following:
| | | | | | | | | | | |
| • | Internal Revenue Code (the “Code”) | • | Occupational Safety and Health Act (OSHA) |
| • | Federal Income Contribution Act (FICA) | • | Worker Adjustment and Retraining Notification Act (WARN) |
| • | Federal Unemployment Tax Act (FUTA) | • | Uniformed Services Employment and Reemployment Rights Act (USERRA) |
| • | Fair Labor Standards Act (FLSA) | • | State unemployment and employment security laws |
| • | Employee Retirement Income Security Act, as amended (ERISA) | • | State workers’ compensation laws |
| • | Consolidated Omnibus Budget Reconciliation Act of 1985 (COBRA) | • | Health Care and Education Reconciliation Act of 2010 (the “Reconciliation Act”) |
| • | Immigration Reform and Control Act (IRCA) | • | Patient Protection and Affordable Care Act (PPACA) |
| • | Title VII (Civil Rights Act of 1964) | • | State and local law equivalents of the foregoing |
| • | Health Insurance Portability and Accountability Act (HIPAA) | • | The Families First Coronavirus Response Act (FFCRA) |
| • | Age Discrimination in Employment Act (ADEA) | • | The Coronavirus Aid, Relief and Economic Security Act, also known as the CARES Act |
| • | Americans with Disabilities Act (ADA) | • | The Consolidated Appropriations Act, 2021 (CAA) |
| • | The Family and Medical Leave Act (FMLA) | • | The American Rescue Plan Act of 2021 (ARPA) |
| • | Genetic Information Nondiscrimination Act of 2008 | • | Paycheck Protection Program and Healthcare Enhancement Act (PPP) |
| • | Drug-Free Workplace Act | • | SECURE 2.0 Act of 2022, as part of The Consolidated Appropriations Act, 2023 |
These laws and regulations are complex, and in some instances overlapping. We assist our PEO HR Outsourcing Solutions clients in complying with these laws and regulations by providing services in the categories set forth below:
Administrative Functions. Administrative functions encompass a wide variety of processing and recordkeeping tasks, mostly related to payroll administration and regulatory compliance. Specific examples include:
•payroll processing
•payroll tax deposits
•payroll tax reporting
•employee file maintenance
•unemployment claims processing
•workers’ compensation claims reporting and monitoring
Benefit Plans Administration. We maintain numerous benefit plans for eligible WSEEs including the following:
•a group health plan
•a health savings account program
•a health care flexible spending account plan
•a 401(k) retirement plan
•an employee well-being program
•cafeteria plans for group health and health savings account contributions
•short-term and long-term disability insurance
•an educational assistance program
•an adoption assistance program
•group term life insurance
•accidental death and dismemberment insurance
•critical illness and accident insurance
The group health plan includes medical, dental, vision and prescription drug coverage. All benefit plans are provided to eligible employees based on the specific eligibility provisions of each plan. We are the policyholder responsible for the costs and premiums associated with any group insurance policies that provide benefits under these plans, and we act as plan sponsor and administrator of the plans. We negotiate the terms and costs of the plans, maintain the plans in accordance with applicable federal and state regulations and serve as liaison for the delivery of these benefits to WSEEs and corporate employees. COBRA coverage is extended to eligible terminated WSEEs and other eligible individuals in accordance with applicable law. We believe that the variety and comprehensive nature of our benefit plan offerings are generally not available to employees in our small and medium-sized business target market and allow our clients to compete with the type and level of benefits usually offered only by companies with a larger group of employees. As a result, we believe the availability of these benefit plans provides our clients with a competitive advantage that small and medium-sized businesses are typically unable to attain on their own.
Insperity Premier. Insperity Premier is our cloud-based human capital management platform for our PEO HR Outsourcing Solutions and is available to our clients with minimal implementation effort. It is designed to provide our service providers with insight into client and WSEE HR information to better support their needs. Insperity Premier provides role-based access to a wide range of human capital management functions, along with personalized content to the managers, owners and WSEEs of our PEO HR Outsourcing Solutions clients, including:
For managers and client owners:
•WebPayroll for the submission, approval, and reporting of payroll data
•mobile access to review and approve payroll transactions and employee time entry
•tools to manage the onboarding of new employees
•employee administration functions such as viewing or changing information about employees
•access to client-specific compliance-related information relevant to many HR areas
•reporting and analytics tools to create, view, save, and export reports and data about employees and to perform more complex analysis and visualization of their workforce data with the Insperity People Analytics solution
•ability to manage employee time and attendance information, absences, and paid time off
•access to talent management tools in the areas of recruiting, performance management, and learning management
•access to a library of online human resources forms
•access to a wide range of best-practices human resources management content
For WSEEs:
•access to view, edit, and change a range of employee profile information
•online check stubs, pay history, W-2 forms, W-4 forms, and other state forms
•employee-specific benefits content, including summary plan descriptions, enrollment status, and tools to assist with benefits selection for Insperity-sponsored plans
•access to 401(k) retirement plan information for covered plans
•e-learning web-based training
•links to benefits providers and other key vendors
•performance management tools including self-reviews and review history, if offered by client
•ability to submit time and attendance information, absences, and paid time off requests, if offered by client
•mobile access to perform a wide range of employee-specific activities such as reporting time and attendance and paid time off, view pay stubs, insurance coverage and ID cards, view 401(k) balances and other commonly accessed data
People Management. In addition to the services we deliver through Insperity Premier, we provide a wide variety of human capital management services that give our clients access to HR advisors and additional resources normally found only in the human resources departments of large companies. All PEO HR Outsourcing Solutions clients have access to our advice concerning personnel policies and practices, including recruiting, discipline, and termination procedures. Other human capital management services we provide include:
•drafting and reviewing personnel policies and employee handbooks
•designing job descriptions
•performing prospective employee screening and background investigations
•designing performance appraisal processes and tools
•professional development and issues-oriented training
•diversity, equity and inclusion training
•employee coaching and counseling
•substance abuse awareness training
•outplacement services
•compensation guidance
Employer Liability Management. Under the CSA, we assume many of the employment-related responsibilities associated with the administrative functions, benefit plans administration, and human capital management services we provide. For many of those employment-related responsibilities that are the responsibility of the client or of both the client and us, we may assist our clients in managing and limiting liability. This assistance may include safety-related risk management reviews as well as the implementation by our clients of safety programs, for which our clients are responsible, that are designed to reduce workplace accidents and, consequently, workers’ compensation claims. We also provide guidance to clients for avoiding discrimination, sexual harassment and civil rights violations, and we assist with termination decisions when consulted to attempt to minimize liability on those grounds. While we do not provide legal services to our clients, we employ in-house and external counsel who specialize in several areas of employment law, have broad experience in disputes concerning the employer/employee relationship, and provide support to our internal human resources professionals. As part of our comprehensive service, we also maintain employment practice liability insurance coverage for ourselves and our clients, monitor developments in HR-related laws and regulations, and notify clients of the potential effect of such changes on employer liability.
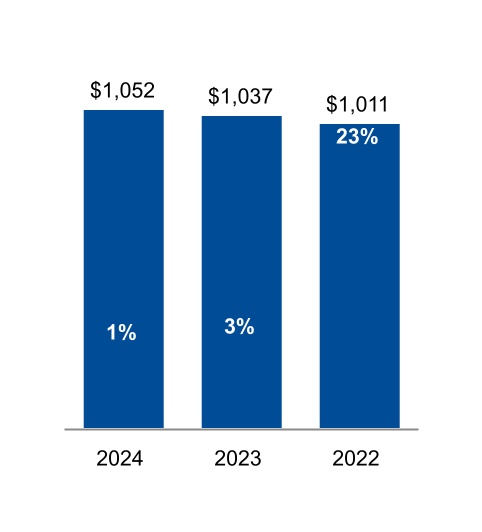
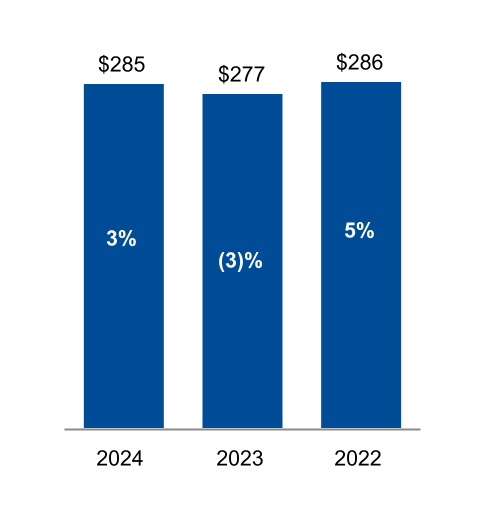
Middle Market Solutions. We believe the middle market sector, which we generally define as those companies with employee populations ranging from approximately 150 to 5,000 WSEEs, has historically been under-served by the PEO industry. Currently, we have a dedicated sales management, service personnel and consulting staff who concentrate solely on the middle market sector. Our average number of WSEEs per month in our middle market sector in 2024 decreased 3% from 2023, and the middle market sector as a percentage of our overall WSEE count remained consistent over this period, representing approximately 26% of our total average paid WSEEs during both 2024 and 2023. Clients exceeding 1,000 paid WSEEs represented 3% and 5% of our total average paid WSEEs during 2024 and 2023, respectively.
Other Product and Services Offerings
We offer other product and services offerings on a stand-alone basis and to our PEO HR Outsourcing Solutions clients. We also strive to leverage our relationships with our customers to enable cross-selling of our various products and services.
Following are the key components of our other products and services, which are offered separately or as a bundle:
Comprehensive Traditional Payroll and Human Capital Management Solution. Our Workforce Acceleration solution is a comprehensive human capital management and payroll services solution for clients that do not choose our PEO HR Outsourcing Solutions. This solution combines a third-party cloud-based human resources software suite that provides integrated payroll, HR administration and employee onboarding, benefits administration, performance management, and time and attendance functionality with HR guidance and tools, as well as reporting and analytics.
Recruiting Services. Our Recruiting Services offer direct hire placement on an as-needed basis and provide outsourced support for individual requisitions or large-scale hiring projects. In addition, we provide consulting services to assist in the creation and maintenance of consistent hiring practices and retention strategies. We also provide compensation services, behavior-based interview training and talent assessment.
Employment Screening. Our Employment Screening services offer a customized approach to background-check reporting for companies. Services include criminal records checks; verification of employment history or education; driving record, civil record and credit history checks; and confirmation of extraordinary credentials.
Retirement Services. Our Retirement Services solutions deliver comprehensive 401(k) retirement plan recordkeeping and administrative services to small and medium-sized businesses, primarily in connection with a 401(k) retirement plan we sponsor for our PEO HR Outsourcing Solutions clients. Services include employee education and enrollment, participant communications, elective deferral withholding and transmission, matching contribution calculation, loan and distribution processing, regulatory filing preparation and nondiscrimination testing.
Insurance Services. Our Insurance Services solutions offer assistance through our licensed insurance agency to small and medium-sized businesses throughout the United States to secure affordable, customizable business insurance packages and life, health and disability insurance policies. Insurance Services also assists individuals in obtaining insurance coverages.
Client Service Agreement
All PEO HR Outsourcing Solutions clients execute a CSA with us. The CSA provides for an ongoing relationship between Insperity and the PEO HR Outsourcing Solutions client. For most clients, the CSA generally establishes pricing for a period of one year and is subject to termination by Insperity or the client upon 30 days’ written notice or upon shorter notice in the event of default. CSAs for our middle market clients generally establish pricing for two years and are subject to termination by clients upon payment of a termination fee or otherwise by the parties upon an event of default. The CSA establishes our comprehensive service fee, which is subject to periodic adjustments to account for changes in the composition of the client’s workforce, employee benefit election changes, and statutory changes that affect our costs. Under the CSA, clients are obligated to pay the estimated payroll tax component of the comprehensive service fee in a manner that reflects the pattern of incurred payroll tax costs. This practice aligns clients’ payments to us with our obligations to make payments to tax authorities, which are higher in the earlier part of the year and decrease as limits on wages subject to payroll tax are reached.
The CSA also establishes the division of responsibilities between us and the client as co-employers. Pursuant to the CSA, we are responsible for personnel administration and for compliance with certain employment-related government regulations. In addition, we assume liability for payment of salaries and wages (as well as related payroll taxes) of our WSEEs and responsibility for providing specified employee benefits to such persons. These liabilities are not contingent on the prepayment by the client of the associated comprehensive service fee. Instead, as a result of our employment relationship with each of our WSEEs, we are liable for payment of salary and wages to the WSEEs as reported by the client and are responsible for providing specified employee benefits to such persons regardless of whether the client pays the associated comprehensive service fee. The client retains the employees’ services and remains liable for complying with certain government regulations that require control of the worksite or daily supervisory responsibility or is otherwise beyond our ability to assume. A third group of responsibilities and liabilities are assumed by both Insperity and the client
where such concurrent responsibility is appropriate. The specific division of applicable responsibilities under our CSAs generally is as follows:
Insperity Responsibilities
•Payment of wages and salaries as reported by the client and related tax reporting and remittance (local, state and federal withholding, FICA, FUTA, state unemployment)
•Workers’ compensation compliance, procurement, management and reporting
•Compliance with the Code, COBRA, ERISA and PPACA for Insperity-sponsored employee benefit plans, as well as monitoring changes in other governmental laws and regulations governing the employer/employee relationship and updating the client when necessary
•Offering benefits under Insperity-sponsored employee benefit plans
•Administration of Insperity-sponsored employee benefit plans
Client Responsibilities
•Payment, through Insperity, of commissions, bonuses, vacations, paid time off, sick pay, paid leaves of absence, and severance payments
•Payment and related tax reporting and remittance of non-qualified deferred compensation and equity-based compensation
•Products produced and/or services provided
•Compliance with OSHA regulations, EPA regulations, FLSA, FMLA, WARN, USERRA, and state and local equivalents and compliance with government contracting provisions
•Compliance with federal, state, and local pay-or-play health care mandates and all such other similar federal, state and local legislation
•Compliance with the National Labor Relations Act, including all organizing efforts and expenses related to a collective bargaining agreement and related benefits
•Professional licensing requirements, fidelity bonding, and professional liability insurance
•Ownership and protection of all client intellectual property rights
•Compliance with the Code, COBRA, PPACA, and ERISA for client-sponsored employee benefit plans
•For clients electing payroll tax deferrals and claiming tax credits under the FFCRA, the CARES Act, PPP, CAA, and ARPA (collectively, the “COVID Relief Programs”), the client has sole responsibility for determining eligibility under the programs and depositing deferred payroll tax amounts with the U.S. Treasury as they become due
Concurrent Responsibilities
•Implementation of policies and practices relating to the employee/employer relationship
•Internal compliance with all federal, state and local employment laws, including Title VII of the Civil Rights Act of 1964, ADEA, Title I of ADA, the Consumer Credit Protection Act and immigration laws and regulations
We maintain employment practice liability insurance coverages (including coverages for our clients) to manage our exposure for various employee-related claims.
Because we are a co-employer with the client for some purposes, it is possible that we could incur liability for violations of such laws, even if we are not responsible for the conduct giving rise to such liability. Our CSA ordinarily addresses this issue by providing that the client will indemnify us for liability incurred to the extent the liability is attributable to conduct by
the client. Notwithstanding this contractual right to indemnification, it is possible that we could be unable to collect on a claim for indemnification and may therefore be ultimately responsible for satisfying the liability in question.
In most instances, clients are required to remit their comprehensive service fees no later than the same day as the applicable payroll date by wire transfer or automated clearinghouse transaction. Although we are ultimately liable, as the employer for payroll purposes, to pay employees for work previously performed, we retain the ability to immediately terminate the CSA and associated WSEEs or to require prepayment, letters of credit, or other collateral upon deterioration in a client’s financial condition or upon non-payment by a client. These rights, the periodic nature of payroll, and the overall quality of our client base have resulted in an excellent overall collections history.
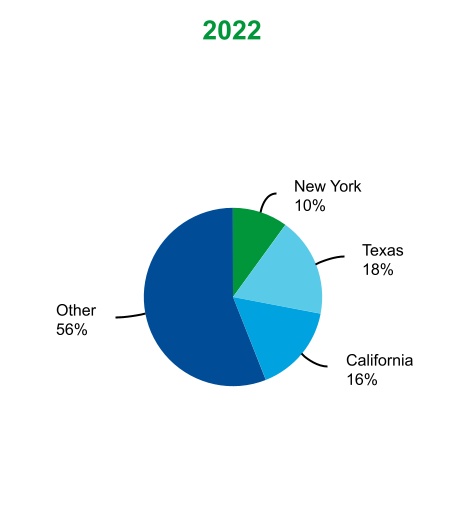
PEO HR Outsourcing Solutions Clients
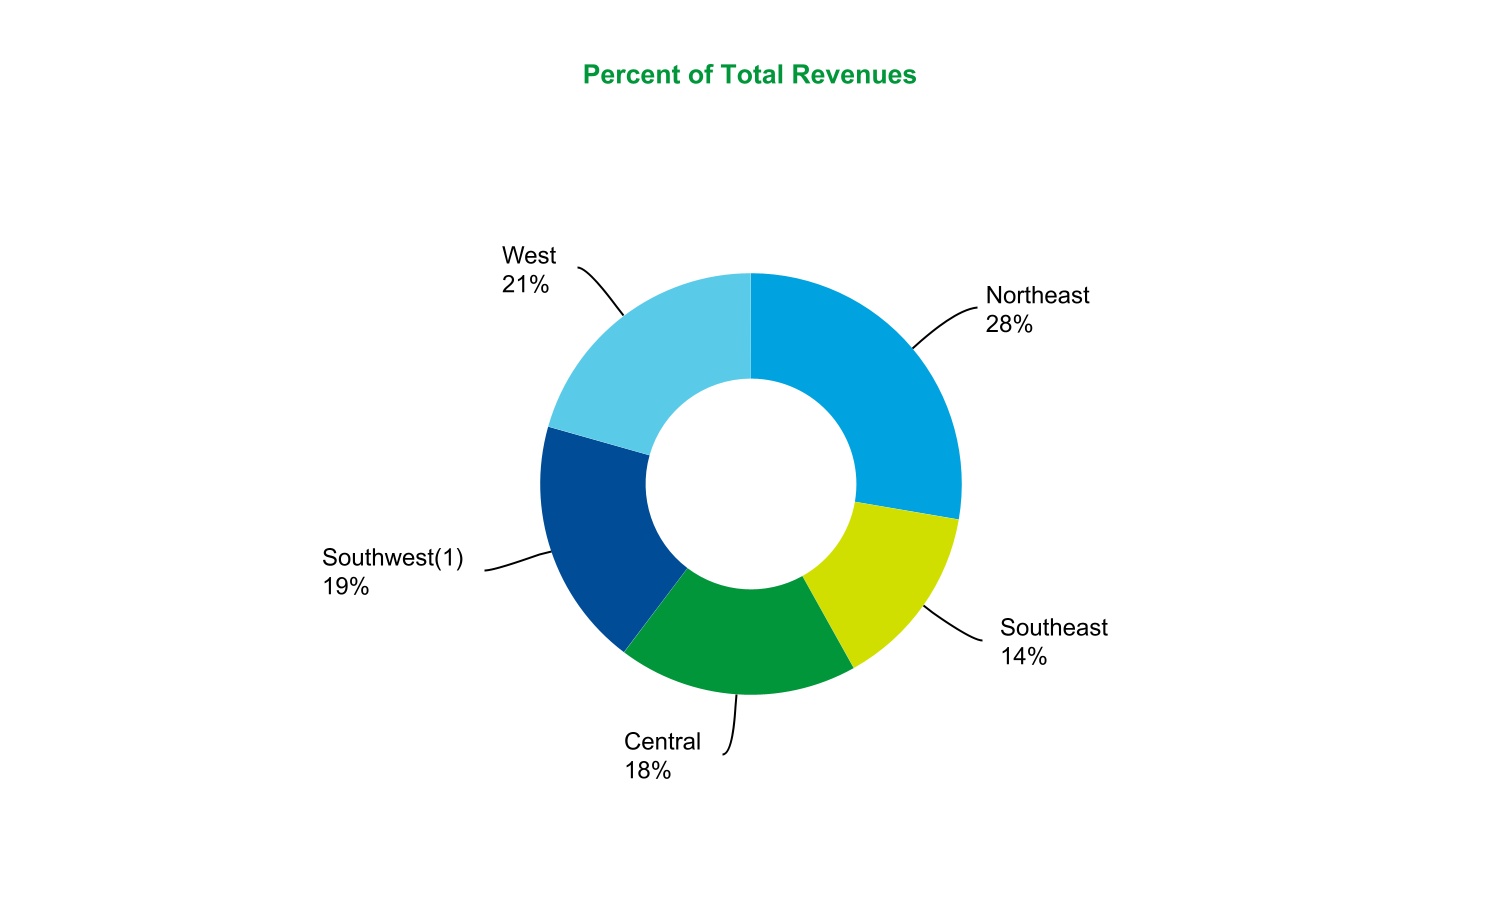
Insperity’s PEO HR Outsourcing Solutions provide value-added, full-service human resources solutions we believe are most suitable to a specific segment of the small and medium-sized business community. We target successful businesses with approximately 10 to 5,000 employees that recognize the advantage in the strategic use of high-performance human resources practices. We believe approximately 10% of the overall small and medium-sized business community in terms of WSEEs are “good fit” companies for our PEO services. We serve clients and WSEEs located throughout the United States.
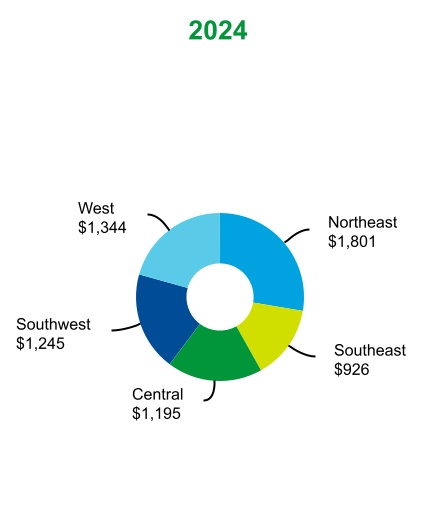
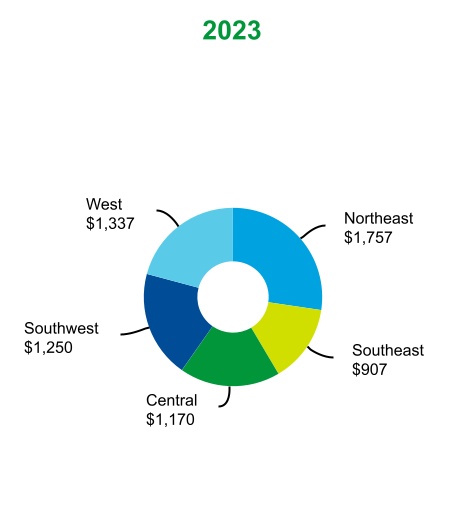
By region, our revenue distribution for the year ended December 31, 2024, was as follows:
________________________________________________________
(1)The Southwest region includes Texas.
Please read Note 1 to the Consolidated Financial Statements, “Accounting Policies,” for additional information related to the change in revenues by region. All prospective PEO HR Outsourcing Solutions clients are evaluated on the basis of a comprehensive analysis of employer-related risks entailing many factors, including (where permitted) industry and operations, workplace safety and workers’ compensation, unemployment history, operating stability, group medical information, human resources practices
and other employer risks. As part of our client selection strategy, we strive to minimize offering our PEO HR Outsourcing Solutions to businesses falling within certain specified NAICS (North American Industry Classification System) codes for those industries that we believe present a higher employer risk such as employee injury, high turnover or litigation.
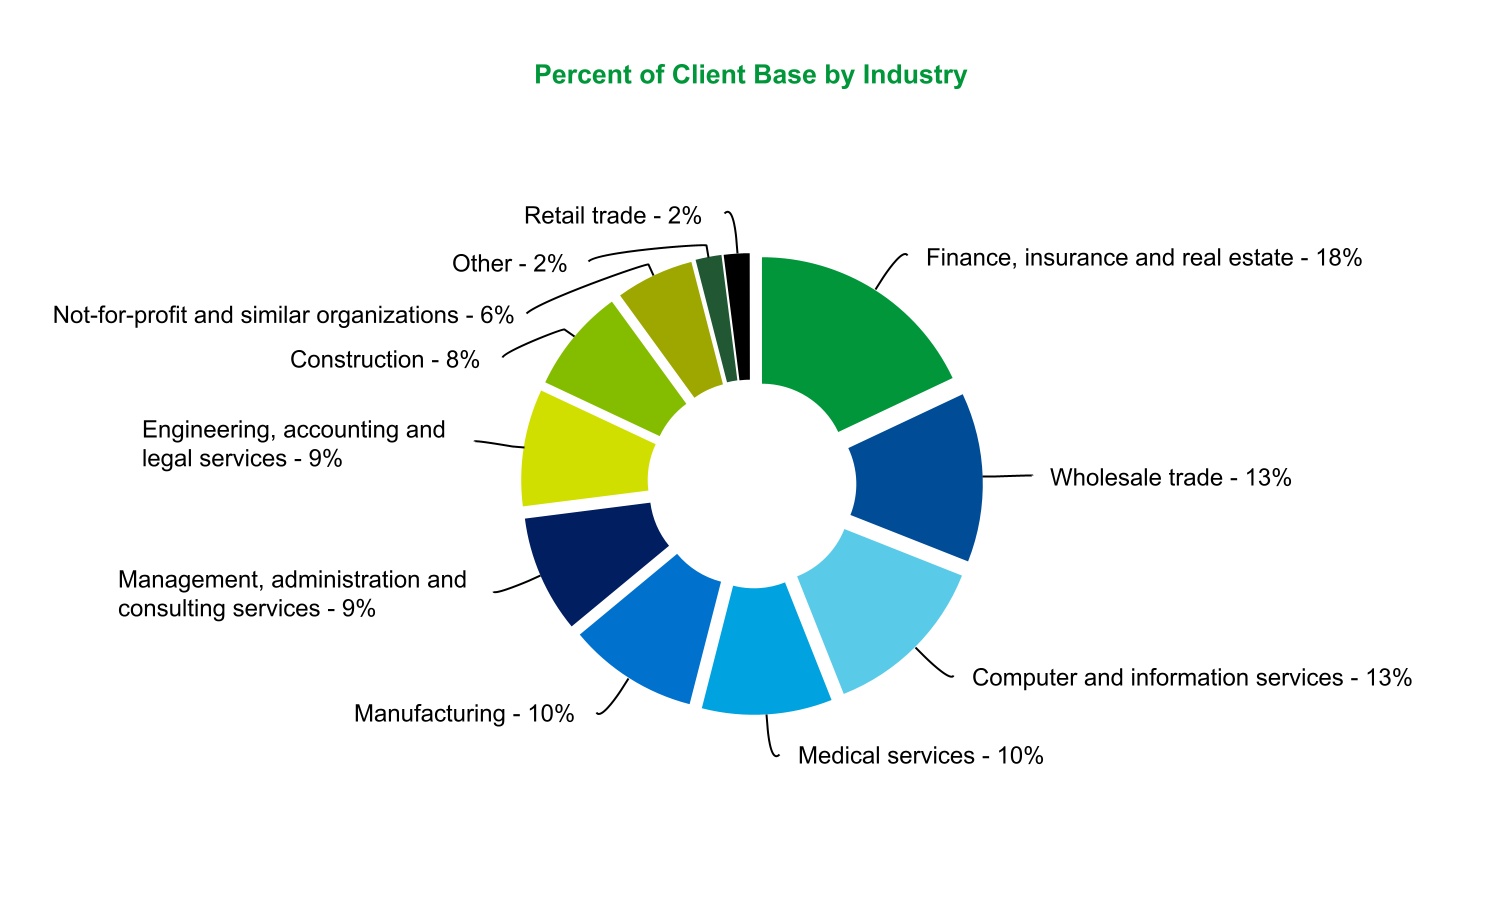
Our PEO HR Outsourcing Solutions client base is broadly distributed throughout a wide variety of industries as follows:
This diverse client base lowers our exposure to downturns or volatility in any particular industry. However, our performance could be affected by a downturn in one of these industries or by general economic conditions within the small and medium-sized business community.
We focus heavily on client retention. During 2024 and 2023, our retention rate was approximately 81% and 83%, respectively. For all PEO HR Outsourcing Solutions clients, the average annual retention rate over the last five years was approximately 84%. Client attrition is attributable to a variety of factors, including: (1) client non-renewal due to price or service factors; (2) client business failure, sale, merger or disposition; (3) our termination of the CSA resulting from the client’s non-compliance or inability to make timely payments; (4) competition from other PEOs or business services firms; and (5) clients electing to bring HR in-house.
Marketing and Sales
As of December 31, 2024, we had 106 sales offices located in 48 markets. Our sales offices typically consist of Business Performance Advisors (“BPAs”), a district sales manager, and an office administrator. To take advantage of economic efficiencies, multiple sales offices may share a physical location.
We identify markets using a systematic market evaluation and selection process. We continue to evaluate a broad range of factors in the selection process, using a market selection model that weighs various criteria that, based on our experience, we believe are reliable predictors of successful penetration. Among the factors we consider are:
•market size, in terms of small and medium-sized businesses engaged in selected industries that meet our risk profile
•market receptivity to PEO services, including the regulatory environment and relevant history with other PEO providers
•existing relationships within a given market, such as vendor or client relationships
•expansion cost issues, such as advertising and overhead costs
•direct cost issues that bear on our effectiveness in controlling and managing the cost of our services, such as workers’ compensation and health insurance costs, unemployment risks, and various legal and other factors
•a comparison of the services we offer to alternatives available to small and medium-sized businesses in the relevant market, such as the cost to the target clients of procuring services directly or through other PEOs
•long-term strategy issues, such as the general perception of markets and our estimate of the long-term revenue growth potential of the market
We develop a mix of national and local advertising media and a placement strategy tailored to each individual market. After selecting a market and developing our marketing mix, but prior to entering the market, we engage in an organized media and public relations campaign to prepare the market for our entry and to begin the process of generating sales leads. We market our services through various business promotions and a broad range of media outlets, including digital marketing, television, radio, newspapers, periodicals and direct mail. We employ public relations firms for most of our markets as well as advertising consultants to coordinate and implement our marketing campaigns. We have developed an inventory of television, radio and newsprint advertisements, which are utilized in this effort.
We routinely seek to develop new marketing approaches and campaigns to capitalize on changes in the competitive landscape for our human resources services and to more successfully reach our target market. We have an agreement with the PGA Tour Champions to be the title sponsor of the Insperity Invitational™ presented by UnitedHealthcare® professional golf tournament held annually in The Woodlands, Texas (a suburb of Houston). In addition, we have an arrangement with Jim Nantz, a sports commentator, to serve as our national spokesperson. Our marketing campaigns use this event and the relationship with Mr. Nantz as a focal point of our brand marketing efforts.
Our organic growth model generates sales leads from six primary sources: direct sales efforts, digital advertising, traditional advertising, third-party channel programs, referrals, and marketing alliances. These leads result in initial presentations to prospective PEO HR Outsourcing Solutions clients, and ultimately, prospective PEO HR Outsourcing Solutions client business profiles. A prospective PEO HR Outsourcing Solutions client’s business profile reflects information gathered by the BPA about the prospect’s employees, including base compensation, level of benefits, coverage options, job classification, state of employment and workers’ compensation classification. This information is used to generate a bid from our customized bid system, which applies Insperity’s proprietary pricing model to the census data. Concurrent with this process, we evaluate prospective clients through the previously described comprehensive employer risk analysis. Upon completion of a favorable employer risk evaluation, the BPA presents the bid and attempts to complete the sale and enroll the prospect. Our selling process typically takes approximately 90 days for clients with fewer than 150 employees, and 180 days or longer for middle market clients. The process can be extended during economic downturns.
We have implemented a sales process that allows our BPAs to offer our PEO HR Outsourcing Solutions or refer our Workforce Acceleration, our traditional payroll solution, to each prospective client with which they meet. This strategy allows us to leverage the same sales force for all of our primary offerings and increases the ability of our BPAs to add clients to our Workforce Acceleration solution when the client is not prepared for PEO HR Outsourcing Solutions. This dual channel approach to selling attempts to reduce barriers to a company becoming a client and allows us to offer solutions better tailored to the specific needs of the business, including at renewal.
Competition
We provide a value-added, full-service human resources solution through our PEO HR Outsourcing Solutions, which we believe is most suitable to a specific segment of the small and medium-sized business community. This full-service approach is exemplified by our commitment to provide a high level of service and technology personnel, which has produced a ratio of corporate staff to WSEEs (the “staff support ratio”) that is higher than average for the PEO industry. Based on an analysis of the 2021 through 2023 annual NAPEO surveys of the PEO industry, we have successfully leveraged our full-service approach into significantly higher returns for Insperity on a per WSEE per month basis. During
the three-year period from 2021 through 2023, our staff support ratio averaged 57% higher than the PEO industry average. During the same three-year period, our gross profit per WSEE and operating income per WSEE exceeded industry averages by 119% and 146%, respectively.
Competition in the PEO industry revolves primarily around quality of services, scope of services, choice and quality of benefits packages, reputation, and price. We believe reputation, national presence, regulatory expertise, financial resources, risk management, and information technology capabilities distinguish leading PEOs from the rest of the industry. We also believe we compete favorably in these areas; however, other PEOs may offer their PEO services at lower prices than we offer.
Due to the differing geographic regions and market segments in which most PEOs operate, and the relatively low level of market penetration by the industry, we consider our primary competition for our PEO HR Outsourcing Solutions to be the traditional in-house provision of human resources services. The PEO industry is highly fragmented and we have seen competition intensify; however, we believe Insperity is one of the largest PEO service providers in the United States. Our largest national competitors include the PEO divisions of large business services companies such as Automatic Data Processing, Inc. and Paychex, Inc., and other national PEOs, such as TriNet Group, Inc, Vensure and Rippling. In addition, we also face competition from: (1) fee-for-service providers such as payroll processors and human resources consultants; (2) human resources technology solution companies; and (3) large regional PEOs in certain areas of the country.
Benefits and Workers’ Compensation Relationships
Insperity provides benefits to its WSEEs under arrangements with a variety of vendors. We consider our contracts with UnitedHealthcare (“United”) and the Chubb Group of Insurance Companies (“Chubb”) to be the most significant elements of our employee benefits package, as they would be the most difficult to replace.
We provide group health insurance coverage to our WSEEs through a national network of carriers including United, UnitedHealthcare of California, Kaiser Permanente, Blue Shield of California, HMSA BlueCross BlueShield of Hawaii, and Harvard Pilgrim Health Care, formerly known as Tufts, all of which provide fully insured policies or service contracts. The health insurance contract with United provides approximately 86% of our participants’ health insurance coverage and expires on December 31, 2026, subject to cancellation by either party upon 180 days’ notice. For a discussion of our contract with United, which is accounted for using a partially self-funded insurance accounting model, please read Item 7. “Management’s Discussion and Analysis of Financial Condition and Results of Operations—Critical Accounting Policies and Estimates—Benefits Costs.” Our workers’ compensation coverage (the “Chubb Program”) has been provided through an arrangement with Chubb (formerly ACE) since 2007. The Chubb Program is a fully insured program whereby Chubb has the responsibility to pay all claims incurred under the policies regardless of whether we satisfy our responsibilities. The current workers’ compensation coverage with Chubb expires on September 30, 2025. In the event we are unable to secure replacement coverage on competitive terms, significant disruption to our business could occur. For additional discussion of the Chubb Program, which includes terms shifting some of the financial responsibility for claims to us, please read Item 7. “Management’s Discussion and Analysis of Financial Condition and Results of Operations—Critical Accounting Policies and Estimates—Workers’ Compensation Costs.” Information Technology
Insperity utilizes a variety of information technology capabilities to provide its PEO HR Outsourcing Solutions and business performance improvement services to its clients and WSEEs and for its own administrative and management information requirements.
Insperity’s PEO HR Outsourcing Solutions information systems, which include Insperity Premier, are a proprietary mix of applications that includes both internally developed software, licensed software applications and cloud-based services. These systems manage a wide range of transactions and information specific to our PEO HR Outsourcing Solutions, to Insperity and to our clients and WSEEs, including:
•WSEE enrollment
•human resources management and employee administration
•benefits and defined contribution plan administration
•time and attendance collection and administration
•payroll processing
•client invoicing and collection
•management information and reporting
•sales bid calculations
Central to these systems are transaction processing capabilities that allow us to process a high volume of employee enrollment, employee administration, payroll, invoice and bid transactions that meet the specific needs of our clients and prospects. We administer our employee benefits through a proprietary application designed to process employee eligibility and enrollments, manage carrier relationships and maintain a variety of plan offerings. Our retirement services operations are conducted utilizing an industry-leading retirement plan administration application in a third-party hosted environment. Aspects of all of these components are delivered to our PEO HR Outsourcing Solutions clients and WSEEs through Insperity Premier. We utilize commercially available software and cloud-based solutions for other business functions such as finance and accounting, sales force activity management and customer relationship management.
Insperity operates from two separate leased hosting facilities, one of which serves as our primary facility. These facilities host the majority of our business applications, information security and network infrastructure. Each hosting facility houses a mix of primary production applications, disaster recovery, replication and back-up applications, and pre-production environments. These hosting facilities have the capacity to run all of our critical business applications and have sufficient capacity to handle all of our operations on a stand-alone basis, if required. We have an active Business Continuity Plan, which includes information technology capabilities and we utilize a variety of measures to ensure our Business Continuity Plan remains effective and available.
Our network infrastructure is designed to ensure appropriate connectivity exists among all of our facilities and provides appropriate Internet connectivity to conduct business with our clients and WSEEs. The network infrastructure is provided through industry standard core network hardware and via high-speed network services provided by multiple vendors.
We have incorporated a variety of measures designed to maintain the security and privacy of the information managed through our systems and applications. These measures include industry standard technologies designed to protect, monitor and assess our data centers and network environment; best practice security policies and procedures; annual corporate employee training on data security and privacy; SOC-1 reports prepared by independent firms regarding key systems; and a variety of measures designed to control access to sensitive and private information.
Industry Laws and Regulations
The operations for our PEO HR Outsourcing Solutions are affected by numerous federal, state, and local laws and regulations relating to tax, insurance and employment matters. By entering into a co-employer relationship with our WSEEs, we assume certain obligations and responsibilities of an employer under these federal and state laws and regulations. Because many of these federal and state laws and regulations were enacted prior to the development of nontraditional employment relationships, such as PEOs, temporary employment and outsourcing arrangements, many of these laws and regulations do not specifically address the obligations and responsibilities of nontraditional employers. Currently, the federal government and 42 states have passed laws that either recognize PEOs, require licensing or registration of PEOs, or provide voluntary certification programs for PEOs, and several others are considering such regulation. The SBEA established a voluntary certification program and created a federal regulatory framework for the payment of wages to WSEEs and for the reporting and remittance of federal payroll taxes on those wages paid by CPEOs. Our PEO subsidiary, Insperity PEO Services, L.P., is a CPEO. Please read Item 1. “Business—PEO Industry” for further information. As an employer, we are subject to federal statutes and regulations governing the employer/employee relationship. Subject to the issues discussed below, we believe that our operations are in compliance, in all material respects, with all applicable federal statutes and regulations.
Employee Benefit Plans
We offer various employee benefits plans to eligible employees, including our WSEEs. These plans include:
•a group health plan, which includes medical, dental, vision and prescription drug coverage
•a 401(k) retirement plan
•cafeteria plans under Code Section 125
•a health savings account program
•a welfare benefits plan, which includes life, disability, accidental death and dismemberment, critical illness, and accident insurance, as well as an employee well-being program
•a health care flexible spending account plan
•an educational assistance program
•an adoption assistance program
•a commuter benefits program
Generally, employee benefit plans are subject to provisions of the Code, ERISA, and COBRA. The number and complex nature of federal and state regulations relating to employer-sponsored health plans has continued to increase over time. We believe that additional regulatory burdens placed on employers can increase the demand for our services because small and medium-sized businesses are especially challenged in their efforts to comply with governmental regulations due to limited resources and a lack of expertise.
401(k) Retirement Plans. Our 401(k) Retirement Plan for WSEEs is operated pursuant to guidance provided by the IRS under Revenue Procedure 2002-21 and Revenue Procedure 2003-86, each of which provides guidance for the operation of defined contribution plans maintained by PEOs that benefit WSEEs. This guidance provides qualification standards for PEO plans that, if met, negate the inquiry of common law employer status for purposes of the exclusive benefit rule. All of Insperity’s 401(k) Retirement Plans have received determination letters from the IRS confirming the qualified status of the plans.
Employment Taxes
As a co-employer, and under the terms of the CSA, Insperity generally assumes responsibility and liability for the payment of federal and state employment taxes with respect to wages and salaries paid to our WSEEs. There are essentially three types of federal employment tax obligations included in Subtitle C — Employment Taxes of the Code:
•withholding of income tax requirements governed by Code Section 3401, et seq.
•obligations under FICA, governed by Code Section 3101, et seq.
•obligations under FUTA, governed by Code Section 3301, et seq.
Under these Code sections, employers have the obligation to withhold and remit the employer portion and, where applicable, the employee portion of these taxes.
The SBEA provides a CPEO shall be treated as the employer under Subtitle C – Employment Taxes of the Code and shall be responsible for reporting federal employment taxes on remuneration paid by the CPEO rather than the CPEO clients.
For any client CSA that is not a CPEO contract, Code Section 3401, which applies to federal income tax withholding requirements, contains an exception to the general common law test applied to determine whether an entity is an “employer” for purposes of federal income tax withholding. Code Section 3401(d)(1) states that if the person for whom services are rendered does not have control of the payment of wages, the “employer” for this purpose is the person having control of the payment of wages. The Treasury regulations issued under Code Section 3401(d)(1) state that a third party can be deemed to be the employer of workers under this section for income tax withholding purposes where the person for whom services are rendered does not have legal control of the payment of wages. While several courts have examined Code Section 3401(d)(1), its ultimate scope has not been delineated. Moreover, the IRS has to date relied extensively on the common law test of employment in determining liability for failure to comply with federal income tax withholding requirements.
Accordingly, while we believe that we can assume the withholding obligations for WSEEs, in the event we fail to meet these obligations, the client may be held ultimately liable for those obligations. While this interpretive issue has not to our knowledge discouraged clients from enrolling with Insperity, there can be no assurance that a definitive adverse resolution of this issue would not do so in the future. These interpretive uncertainties may also impact our ability to report employment taxes on our own account rather than the accounts of our clients.
Clients who elected to defer the employer portion of social security under the CARES Act have sole responsibility for reporting and depositing deferred amounts with the U.S. Treasury.
Unemployment Taxes
We record our state unemployment insurance (“SUI”) tax expense based on taxable wages and tax rates assigned by each state. State unemployment tax rates vary by state and are determined, in part, based on Insperity’s prior years’ compensation and unemployment experience in each state. Certain rates are determined, in part, by each client’s own compensation and unemployment experience. In addition, states have the ability under law to increase unemployment tax rates, including retroactively, to cover deficiencies in the unemployment tax funds. Rate notices are typically provided by the states during, or prior to, the first quarter of each year; however, some notices are received later. Until we receive the final tax rate notices, we estimate our expected SUI rate in those particular states.
State Regulation
While some states do not explicitly regulate PEOs, 42 states have adopted provisions for licensing, registration, certification or recognition of PEOs, and several others are considering such regulation. Such laws vary from state to state but generally provide for monitoring the fiscal responsibility of PEOs, and in some cases codify and clarify the co-employment relationship for unemployment, workers’ compensation and other purposes under state law. We believe that we are in compliance with the material requirements in all 42 states that have such laws. Regardless of whether a state has licensing, registration or certification requirements for PEOs, we must comply with a number of other state and local regulations that could impact our operations.
Human Capital
We believe that our ability to attract and retain highly motivated and skilled corporate employees with diverse backgrounds and experiences is critical to our continued success. Our human capital management objective is to attract, develop, and retain qualified corporate employees as appropriate to support our growth, client service initiatives, and technology investments, while furthering our commitment to our culture, mission, and values.
We had approximately 4,500 corporate employees as of December 31, 2024. We believe our relations with our corporate employees are good. None of our corporate employees are covered by a collective bargaining agreement. The number of BPAs and trained BPAs impacts our ability to grow our customer base. We refer to BPAs who have been employed for two months and completed initial sales training as “trained BPAs.” During 2024 and 2023, the average number of BPAs were 769 and 748, respectively, while the average number of trained BPAs were 698 and 685, respectively.
We offer numerous programs and benefits in furtherance of our human capital management objective, including: competitive compensation and benefits; corporate 401(k) retirement plan with a matching component; employee stock purchase program; leadership development programs; the Insperity MVP (Mission Values Performance) employee recognition program; flexible remote working arrangements; and employee well-being programs to provide additional assistance to corporate employees in times of need.
We monitor and evaluate the effectiveness of our human capital management efforts by seeking formal and informal feedback from our corporate employees, including periodic surveys of our corporate employees to obtain their opinions on key topics.
Intellectual Property
Insperity currently has registered trademarks, copyrights and other intellectual property. We believe that our trademarks as a whole are of considerable importance to our business.
Item 1A. Risk Factors.
The statements in this section describe the known material risks to our business and should be considered carefully.
Economic Risks
Adverse economic conditions could negatively affect our industry, business, and results of operations.
The small and medium-sized business market is sensitive to changes in economic activity levels as well as the credit markets. As a result, the demand for the outsourced HR services we provide clients could be adversely impacted by weak economic conditions or difficulty obtaining credit. Current and prospective clients may respond to such conditions by reducing employment levels, compensation levels, employee benefit levels and outsourced HR services. In addition, during periods of weak economic conditions, current clients may have difficulty meeting their financial obligations to us and may select alternative HR services at more competitive rates than we offer. Further, our growth is partially dependent on hiring of new employees by our existing clients, which may be negatively impacted during periods of tight labor markets, such as the low unemployment environment experienced during 2022 and 2023, and during economic slowdowns, such as the high unemployment levels experienced during 2020. Such developments could adversely impact our financial condition, results of operations and future growth rates.
If we are unable to comply with or meet client expectations regarding certain COVID-19 relief programs, our business, financial condition, and results of operations could be materially adversely affected.
A number of governmental programs and incentives were created to assist businesses and individuals during the COVID-19 pandemic. Certain of these programs and incentives have required us to make changes to our systems that manage leave, payroll and payroll-related tax calculation, invoicing and collection of service fees, COBRA participation, and client reporting. For example, the CARES Act allowed companies to defer certain payroll taxes, which were reflected in the payrolls we processed for those clients. Client companies are liable for repaying the deferred amounts to the IRS; however, the IRS has not yet clarified how such deferred amounts will be properly applied to companies utilizing a PEO and, if and when issued, such guidance may require further revisions to our systems or processes. In addition, further legislation may be enacted at the federal, state or local level that may require further changes to our processes and systems or that may expand the coverage afforded to WSEEs under our health and workers’ compensation insurance programs.
Further, PEO clients are dependent on their PEO to process Employee Retention Tax Credits (“ERC”) on a consolidated basis, including through amending previously filed payroll tax forms with the IRS. The IRS has experienced significant backlogs in processing amended tax forms from employers seeking ERC refunds and we are currently awaiting IRS review of a number of ERC claims with respect to our PEO clients. Currently, the deadline to submit any ERC claims for relevant periods in 2021 is April 2025. A pending federal bill, The Tax Relief for American Families and Workers Act of 2024 (H.R. 7024), however, would retroactively accelerate the deadline for all claims to January 31, 2024. If any of the ERC claims that we made on behalf of our clients were denied or otherwise deemed insufficient, we may not be able to perfect our filings on a timely basis. Further, eligibility for the ERC is dependent on certain operational information of our clients. The lack of guidance from the IRS on the application of deferred payroll taxes discussed above may also impact the amount of ERC refunds received on behalf of our clients if those deferred payroll taxes are deducted from ERC funds received or delay our receipt of the ERC funds. Further, if the IRS were to determine that any of our clients were not eligible for the ERC requested on their behalf or we do not perfect our filings on a timely basis, the IRS may conclude that we are responsible for those claims. Furthermore,if the IRS were to otherwise challenge the claims we requested, we could face penalties or other liabilities. If any those events were to occur, our clients may seek recourse against us or choose not to renew.
If we experience rejection of any COVID-19 relief program claims on behalf of clients, are unable to timely make system changes needed to comply with other regulations, incur substantial additional costs in doing so, or are otherwise adversely affected by these requirements, then we may face fines, penalties, other regulatory action, or litigation relating to such failure, and we may not have insurance coverage for all or some of these liabilities. These events could further adversely impact our PEO state licenses or registrations, or our CPEO status, as well as our ability to attract and retain clients. As a result of the foregoing, our business, results of operations and financial condition could be materially adversely affected.
Bank failures or other events affecting financial institutions could have a material adverse effect on our business, results of operations or financial condition, or have other adverse consequences.
We use a U.S.-based global systemically important bank (or G-SIB) for our PEO operations, including our cash balances associated with that portion of our business. All of our cash deposits are held by Federal Deposit Insurance Corporation (“FDIC”) insured banks, which amounts exceed the FDIC insurance limits. Through various overnight “sweep account” programs, we also invest a significant portion of our cash balances in U.S. Treasury-based funds, which are invested through brokerage firms affiliated with the banks at which our deposits are held. The failure of a bank or related brokerage firm that we use, or events involving limited liquidity, non-performance or other adverse conditions in the financial or credit markets impacting financial institutions at which we maintain balances, or concerns or rumors about such events, may lead to disruptions in access to our cash balances, adversely impact our liquidity, including our ability to borrow under our credit facility, or limit our ability to process transactions related to our clients. In the event of a failure of a bank or other financial institution that holds our cash deposits, there can be no assurance that our deposits in excess of the FDIC or other comparable insurance limits will be recoverable or, even if ultimately recoverable, there may be significant delays in our ability to access those funds. Furthermore, bank failures, non-performance, or other adverse developments that affect financial institutions could impair the ability of one or more of the banks participating in our credit facility from honoring their commitments. Such events could have a material adverse effect on our financial condition or results of operations.
Similarly, our clients may be adversely affected by any bank failure or other event affecting financial institutions. For example, in early 2023, some of our clients had deposits with banks that were placed into receivership. If those clients had been unable, or if our clients in the future are unable, to meet their obligations to us as a result of a bank failure or other event affecting financial institutions, we may be exposed to potential risks that could impact our financial condition or results of operations. If we were to fail to pay the liabilities that we have assumed associated with our WSEEs, we may be subject to fines or other penalties.
Labor shortages, increasing competition for highly skilled workers, and evolving employee expectations regarding the workplace could have a material adverse effect on our business, financial condition or results of operations.
The success of our business is heavily dependent on our ability to attract and retain a skilled workforce, including in our service and sales positions. Several factors may limit the labor force available to us or increase our labor costs, including high employment levels, strong macroeconomic conditions, federal unemployment subsidies, and other governmental regulation. As macroeconomic conditions improved from 2021 through 2024, the labor market tightened, resulting in increased employee turnover and skilled labor shortages. Increasing competition for highly skilled and talented workers may make it increasingly difficult and expensive for us to attract and retain a service team capable of supporting our clients or a sales team that is effective in selling our complex service offerings to clients. An overall or prolonged labor shortage, increased turnover, or labor inflation could have a material adverse impact on our growth plans, client service delivery, results of operations and financial condition.
In addition, following the remote work environment that we implemented during the COVID-19 pandemic and a resulting shift in the expectations of our employees, many of our departments have now switched to a “hybrid” mode in which remote work is permitted one or more days per week. These changes may impact productivity or have other material impacts on our operations.
Inflation may reduce our profitability.
Inflationary pressure could adversely impact our profitability. Our operating costs have increased, and may continue to increase, due to the recent growth in inflation. We may not be able to fully offset these cost increases by raising prices for our services, particularly because our client agreements generally fix our pricing for a period of time, which could result in downward pressure on our profit margins. Further, our clients may choose to reduce their business with us if we increase our pricing.
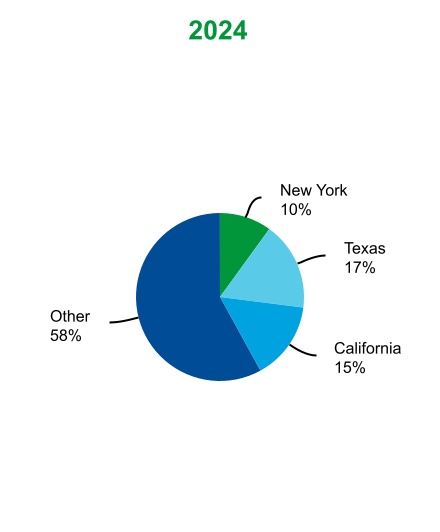
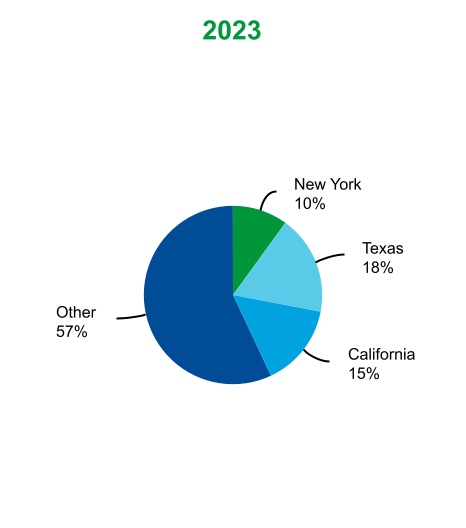
Geographic market concentration makes our results of operations vulnerable to regional economic factors.
Our New York, California and Texas markets accounted for approximately 10%, 15% and 17% (including 7% in Houston), respectively, of our WSEEs for the year ended December 31, 2024. Accordingly, unless we are successful in expanding in our current markets and into new markets, which we believe will take additional time, for the foreseeable future, a significant portion of our revenues may be subject to economic, statutory, and regulatory factors specific to New York, California, and Texas.
We are subject to covenants under our credit facility that may restrict our business and financing activities. Our failure to comply with these covenants may result in an acceleration of our indebtedness, which could have a material adverse effect on our business, financial condition or results of operations.
Our credit facility contains, and any future indebtedness of ours likely would contain, covenants that, subject to certain exceptions, impose significant operating and financial restrictions, including restricting our ability to:
•incur additional indebtedness,
•sell material assets,
•retire, redeem or otherwise reacquire our capital stock,
•acquire the capital stock or assets of another business,
•enter into new lines of business,
•make investments, and
•pay dividends.
In addition, we are required to maintain certain financial covenants. Our ability to comply with the financial covenants may be affected by financial, business, economic, regulatory and other factors beyond our control.
Our failure to comply with these covenants, or any other terms of our indebtedness, could result in a default that may limit our ability to borrow additional amounts under our credit facility, which may adversely affect our liquidity. In addition, a default may allow our lenders to accelerate our obligation to repay the outstanding amounts under our credit facility. If we were unable to repay or refinance the accelerated indebtedness on favorable terms, then our business, financial condition and results of operations would be materially adversely affected.
A future outbreak of highly infectious or contagious diseases could have a material and adverse impact on our business, results of operations, financial condition and cash flows.
The spread of a highly infectious or contagious disease could create significant volatility, uncertainty and economic disruption, including as a result of actions taken by businesses and governments in response to such a pandemic that may result in a significant reduction in commercial activity, such as occurred during the COVID-19 pandemic. The extent to which future pandemics impact our business, operations, financial results and financial condition will depend on numerous evolving factors that are highly uncertain and that we may not be able to accurately predict. While such a pandemic is continuing and even after it has subsided, we may experience material adverse impacts to our business, operations and financial results due to any existing or continuing negative economic impact, including a recession, depression, or periods of supply shortages or high inflation, such as experienced in 2022 following the COVID-19 pandemic. Additionally, future pandemics may change how and when we incur health insurance costs under our health insurance contract with United, such as changes in quarterly levels and timing of both medical and pharmaceutical health insurance claims and processing payment patterns. Accordingly, future pandemics may present, material uncertainty and risk with respect to our business, and may have a material adverse effect on our financial condition, results of operations, cash flows and business.
PEO HR Outsourcing Solutions Risks
We assume liability for WSEE payroll, payroll taxes, benefits costs and workers’ compensation costs and are responsible for their payment regardless of the amount billed to or paid by our clients.
Under the CSA, we become a co-employer of WSEEs and assume the obligations to pay the salaries, wages and related benefits costs and payroll taxes of such WSEEs. Our obligations include responsibility for the following even if our costs exceed the fees the client pays us and the amounts collected from WSEEs:
•payment of the salaries and wages for work performed by WSEEs, regardless of whether the client timely pays us the associated service fee
•withholding and payment of federal and state payroll taxes with respect to wages and salaries reported by Insperity
•providing benefits to WSEEs
•providing workers’ compensation coverage to WSEEs
Further, the increase in remote work, including by WSEEs, has complicated the calculation of payroll and unemployment taxes applicable to those individuals. We are dependent on our PEO Outsourcing Solutions clients to properly report the locations in which WSEEs perform services. If a regulatory authority were to determine that we did not properly calculate or transmit these amounts, then we could be subject to fines, penalties, or other liabilities, which we may not be able to recover from our clients. We may also need to devote additional resources and incur additional costs to modify our systems to address any such compliance issues.
If a client does not pay us, if the costs of services we provide to WSEEs exceed the fees a client pays us, or if we incur fines and penalties as a result of an adverse determination related to our payroll and unemployment tax calculations, our ultimate liability for WSEE payroll, payroll taxes, workers’ compensation and/or benefits costs, as well as any fines or penalties, could have a material adverse effect on our financial condition or results of operations.
Increases in health insurance costs or our inability to secure replacement health insurance coverage on competitive terms could have a material adverse effect on our business, financial condition or results of operations.
Maintaining health insurance plans that cover WSEEs is a significant part of our business. Our primary health insurance contract expires on December 31, 2026, subject to cancellation by either party upon 180 days’ notice. In the event we are unable to secure replacement contracts on competitive terms, significant disruption and harm to our business could occur.
Health insurance costs are in part determined by our plans’ claims experience and comprise a significant portion of our direct costs. Our health insurance coverage is provided under policies or service contracts that are fully insured. United is the carrier that insures the majority of our coverage. Although all of our carriers remain responsible to pay all covered claims, under our health insurance contract with United, we retain an obligation to United to fund the cost of the plan. The profitability of our PEO HR Outsourcing Solutions is affected by the overall expenses associated with the cost of delivering our services, one of the largest of which is the cost of our health insurance. Our ability to accurately anticipate the expenses associated with the plans, including claims costs on a quarterly or annual basis, can impact our results of operations. If the plans experience an unexpected increase in the number or severity of claims, our associated health insurance costs could increase beyond anticipated levels, as we experienced in 2021 and 2023. These costs are further impacted by a number of factors, including coverage options elected by employees, macro-economic changes, proposed and enacted regulatory changes and wide-spread health-related outbreaks. Contractual arrangements and competitive market conditions may limit or delay our ability to increase service fees to offset any associated potential increased costs associated with the plans, which could substantially impair our financial condition or results of operations. Further, if the overall pricing of our services includes cost assumptions based on inaccurate forecasts of plan expenses, our profitability or our ability to attract and retain clients may be adversely impacted. As a result, if we do not accurately forecast the costs of our plans, our business, financial condition or results of operations may be materially adversely affected. For additional information related to our health insurance costs, please read Item 7. “Management’s Discussion and Analysis of Financial Condition and Results of Operations—Critical Accounting Policies and Estimates—Benefits Costs.” Health care reform could affect our health insurance plan and could lead to a significant disruption in our business.
Many of our clients select a PEO Outsourcing Solution pursuant to which we offer the health and welfare benefit plans sponsored by us to the WSEEs co-employed by those clients. The future impact and direction of healthcare reform, including future legislative or executive actions, is unknown and, if any such developments were to reduce our ability to make health care benefits available to WSEEs or were to make our offerings less attractive to our clients, then our business, financial condition, and results of operations may be materially adversely affected.
Supporters in various states have advocated and continue to advocate for adoption of health care-related reforms at the state level, which has the potential to significantly change the insurance marketplace for small and medium-sized businesses and how employers provide insurance to employees. Additionally, guidance by the IRS and the U.S. Department of Health and Human Services (“HHS”) has not addressed or in some instances is unclear as to the application of certain aspects of federal health care reform laws in the PEO relationship or whether such provisions should be applied at the PEO or client level.
Various states have adopted or are considering reforms that may impact the requirements for or availability of PEO-sponsored health plans. At this time, the insurance market reforms have not had a material adverse impact on our business operations, and if any future changes impact our ability to attract and retain clients, or our ability to increase service fees to offset any increased costs, then our business may be materially adversely affected.
Subsequent changes resulting from action that may be taken at the federal or state level may impact our benefit plans, business model and future results of operations, including repeal or repeal and replacement of current healthcare reform provisions as has been advocated by some in the new Presidential administration and Congressional leaders. In future periods, changes may result in increased costs to us and could affect our ability to attract and retain clients. Additionally, contractual arrangements and competitive market conditions may limit or delay our ability to increase service fees to offset any associated potential increased costs. We are currently unable to determine whether potential future healthcare reform changes or other regulatory action, including at the state level, may adversely affect our business or market conditions.
A determination that we are not the employer of our WSEEs and an inability to offer alternate benefit plans could have a material adverse effect on our business.
In order to qualify for favorable tax treatment under the Code, employee benefit plans must be established and maintained by an employer for the exclusive benefit of its employees. Generally, an entity is an “employer” of individuals for federal employment tax purposes if an employment relationship exists between the entity and the individuals under the common law test of employment. In addition, the officers of a corporation are deemed to be employees of that corporation for federal employment tax purposes. The common law test of employment, as applied by the IRS, involves an examination of approximately 20 factors to ascertain whether an employment relationship exists between a worker and a purported employer. Generally, the test is applied to determine whether an individual is an independent contractor or an employee for federal employment tax purposes and not to determine whether each of two or more companies is a “co-employer.” Substantial weight is typically given to the question of whether the purported employer has the right to direct and control the details of an individual’s work. Among the factors that appear to have been considered more important by the IRS are:
•the employer’s degree of behavioral control (the extent of instructions, training and the nature of the work)
•the financial control or the economic aspects of the relationship
•the intended relationship of the parties (whether employee benefits are provided, whether any contracts exist, whether services are ongoing or for a project, whether there are any penalties for discharge/termination, and the frequency of the business activity)
Employee retirement and welfare benefit plans are also governed by ERISA. ERISA defines “employer” as “any person acting directly as an employer, or indirectly in the interest of an employer, in relation to an employee benefit plan.” ERISA defines the term “employee” as “any individual employed by an employer.” The United States Supreme Court has held that the common law test of employment must be applied to determine whether an individual is an employee or an independent contractor under ERISA. A definitive judicial interpretation of “employer” in the context of a PEO or employee leasing arrangement has not been established.
If Insperity were found not to be an employer with respect to WSEEs for ERISA purposes, its plans would not comply with ERISA and/or the Code. Further, as a result of such finding, Insperity and its plans would not enjoy, with respect to WSEEs, the preemption of state laws provided by ERISA and could be subject to varying state laws and regulations as well as to claims based upon state common laws. In addition, if Insperity were found not to be the employer sponsoring a single-employer plan under ERISA for purposes of its health benefits plan, we could be subject to additional requirements under state and federal laws that could restrict our ability to provide benefits to our WSEEs in the same manner that we do today, which could negatively impact our business. In the case of any such events, we would endeavor to make available similar benefits at comparable costs in a manner that complied with applicable state laws. However, if we were unable to promptly transition our benefit plans to a compliant structure with terms that were acceptable to our clients and at a comparable cost to us, then our business, financial condition, and results of operations could be materially adversely affected.
Increases in workers’ compensation costs or inability to secure replacement coverage on competitive terms could lead to a significant disruption and harm to our business.
Our workers’ compensation coverage has been provided through an arrangement with Chubb since 2007. Under our current arrangement with Chubb for claims incurred on or before September 30, 2019, we have a financial responsibility to
Chubb for the first $1 million layer of claims per occurrence and for claims over $1 million, up to a maximum aggregate amount of $6 million per policy year for claims that exceed the first $1 million. Effective for claims incurred on or after October 1, 2019, our financial responsibility increased as we have financial responsibility to Chubb for the first $1.5 million layer of claims per occurrence and for claims over $1.5 million, up to a maximum aggregate amount of $6 million per policy year for claims that exceed $1.5 million. Chubb bears the financial responsibility for all claims in excess of these levels. The Chubb Program is a fully insured program whereby Chubb has the responsibility to pay all claims incurred under the policies regardless of whether we satisfy our responsibilities. For additional discussion of our policy with Chubb, please read Item 7. “Management’s Discussion and Analysis of Financial Condition and Results of Operations—Critical Accounting Policies and Estimates—Workers’ Compensation Costs.” Workers’ compensation costs are a significant portion of our direct costs and contractual arrangements and competitive market conditions may limit or delay our ability to increase service fees to offset any associated potential increased costs. If we were to experience an unexpected large increase in the number or severity of claims, our workers’ compensation costs could increase, which could have a material adverse effect on our results of operations or financial condition. Further, if the overall pricing of our services includes cost assumptions based on inaccurate forecasts of our workers’ compensation costs, our profitability or our ability to attract and retain clients may be adversely impacted.
The current workers’ compensation coverage with Chubb expires on September 30, 2025. In the event we are unable to secure replacement coverage on competitive terms, significant disruption to our business could occur.
Our ability to adjust and collect service fees for increases in unemployment tax rates may be limited.
We record our SUI expense based on taxable wages and tax rates assigned by each state. SUI tax rates vary by state and are determined, in part, based on prior years’ compensation experience in each state. Prior to the receipt of final rate notices, we estimate our expected SUI rate in those states for which rate notices have not yet been received for purposes of forecasting and pricing. In a period of adverse economic conditions, state unemployment funds may experience a significant increase in the number of unemployment claims. Accordingly, SUI rates would likely increase substantially. Some states have the ability under law to increase SUI rates retroactively to cover deficiencies in the unemployment fund. In addition, FUTA may be retroactively increased in certain states in the event the state fails to timely repay federal unemployment loans, as we recently experienced with California and New York in 2024.
Generally, our contractual agreements allow us to incorporate such statutory increases into our service fees upon the effective date of the rate change. However, this right does not extend to our former clients and, even with respect to our existing clients, our ability to fully adjust service fees in our billing systems and collect such increases over the remaining term of the clients’ contracts could be limited, resulting in a potential increase not being fully recovered. As a result, such increases could have a material adverse effect on our financial condition or results of operations.
Many of our contracts for our PEO HR Outsourcing Solutions may be canceled on short notice. Our inability to renew client contracts or attract new clients could materially and adversely affect our financial condition or results of operations.
Our standard CSA can generally be canceled by us or the client with 30 days’ notice. Accordingly, the short-term nature of the CSA makes us vulnerable to potential cancellations by existing PEO HR Outsourcing solution clients, which could materially and adversely affect our financial condition or results of operations. Our middle market sector, which we generally define as those companies with employees ranging from approximately 150 to 5,000 WSEEs, represented 26% of our average paid WSEEs, and clients with an average number of WSEEs that exceed 1,000 WSEEs represented 3% during 2024. In the event we have large clients that terminate or an increase in terminating clients from our middle market client base, the financial impact of such an event could be significant. Also, our results of operations are dependent in part upon our ability to retain or replace our clients upon the termination or cancellation of the CSA. Our client attrition rate was approximately 19% in 2024. There can be no assurance that the number of contract cancellations will continue at these levels and such cancellations may increase in the future due to various factors, including economic conditions in the markets we operate. Clients electing to purchase our services or electing an alternative solution often do so at the beginning of the calendar year. As a result, we typically experience our largest concentration of new client additions and attrition in the first quarter of each year.
Our loss of insurance coverage, the failure of our insurance carriers or increased insurance costs or deductibles could have a material adverse effect on us.
As part of our PEO HR Outsourcing Solutions, in addition to our health insurance carriers, we contract with other
insurance carriers to provide workers’ compensation insurance and employment practices liability insurance. In addition, we obtain insurance coverage for various commercial risks in our business such as property insurance, errors and omissions insurance, cyber liability insurance, general liability insurance, fiduciary liability insurance and ERISA bond coverage, automobile liability insurance, and directors’ and officers’ liability insurance. The failure of any insurance carrier, such as occurred in 2001 with respect to a previous workers’ compensation insurance provider, providing such coverage could leave us exposed to uninsured risk and could have a material adverse effect on our business and results of operations. In addition, in the event that our primary health carriers in any key market make material changes to their network of health care providers or facilities, such as the discontinuation of prominent hospital networks in key markets on occasion by a carrier in connection with their ongoing negotiations with those networks, then our ability to attract and retain clients in that market may be adversely affected, which could have a material adverse effect on our business and results of operations. Further, we have experienced an increase in insurance premiums for our corporate policies as well as an increase in the deductible amounts for which we retain liability and a decrease in coverage limits. If these premiums or deductible amounts continue to increase, or coverage limits continue to decrease we would have increased exposure with respect to costs and insurance claims, which could have a material adverse effect on our business and results of operations.
A determination that a client is liable for employment taxes not paid by a PEO may discourage clients from contracting with us in the future.
Under the CSA, we assume sole responsibility and liability for paying federal employment taxes imposed under the Code with respect to wages and salaries we pay our WSEEs. There are essentially three types of federal employment tax obligations:
•income tax withholding requirements
•FICA
•FUTA
Under the Code, employers have the obligation to withhold and remit the employer portion and, where applicable, the employee portion of these taxes. The SBEA clarifies that a CPEO is treated as the employer for purposes of federal payroll taxes on wages it pays to WSEEs. Most states impose similar employment tax obligations on the employer. While the CSA provides that we have sole legal responsibility for making these tax contributions, the applicable state taxing authority could conclude that such liability cannot be completely transferred to us. Accordingly, in the event that we fail to meet our tax withholding and payment obligations, the client may be held jointly and severally liable for those obligations. While this interpretive issue has not, to our knowledge, discouraged clients from enrolling with Insperity, a definitive adverse resolution of this issue may discourage clients from enrolling in the future.
New and higher federal, state and local taxes could have a material adverse impact on our financial condition and results of operations.
In times of economic slowdowns, the federal government and states and municipalities in which we operate may experience reductions in tax revenues and corresponding budget deficits. In response to budget shortfalls, such as those experienced during the COVID-19 pandemic, the federal government and many states and municipalities have in the past and may in the future increase or enact new taxes on businesses operating within their tax jurisdiction, including business activity taxes and income taxes. In addition, federal, state and local taxing agencies may increase their audit activity in an effort to identify additional tax revenues. New tax assessments on our operations could result in increased costs. Our ability to adjust our service fees and incorporate additional tax assessments into our billing system could be limited. As a result, such higher taxes could have a material adverse impact on our financial condition or results of operations.
We may be subject to liabilities for client and employee actions.
As a co-employer in the PEO relationship, we assume or share many of the employer-related responsibilities and assist our clients in complying with many employment-related governmental regulations. A number of legal issues remain unresolved with respect to the co-employment arrangement between a PEO and its WSEEs, including questions concerning the ultimate liability for violations of employment, payroll, discrimination, and workplace safety laws. Our CSA establishes the contractual division of responsibilities between Insperity and our clients for various human capital management matters, including compliance with and liability under various governmental regulations.
Because we act as a co-employer, we may be subject to liability for violations of various employment, payroll, discrimination, and workplace safety laws despite these contractual provisions, even if we do not participate in such violations. Although the CSA generally requires the client to indemnify us for certain liabilities attributable to the client’s conduct, we may not be able to collect on such a contractual indemnification claim and thus may be responsible for satisfying such liabilities to the extent that such liabilities are not covered or insured against under our insurance policies. In addition, WSEEs may be deemed to be our agents, which may subject us to liability for the actions of such WSEEs.
Changes in federal, state and local regulation or our inability to obtain licenses under new regulatory frameworks could have a material adverse effect on our results of operations or financial condition.
As a major employer, our operations are affected by numerous federal, state and local laws and regulations relating to labor, tax, benefit, insurance and employment matters. By entering into a co-employer relationship with employees assigned to work at client locations, we assume certain obligations and responsibilities of an employer under these laws. However, many of these current laws (such as the Act, ERISA, and some state insurance codes and employment tax laws) do not specifically address the obligations and responsibilities of non-traditional employers such as PEOs, and the definition of “employer” under these laws is not uniform despite the SBEA having provided clarification under federal employment tax laws for CPEOs. In addition, many of the states in which we operate have not addressed the PEO relationship for purposes of compliance with applicable state laws governing the employer/employee relationship or PEO health insurance plans. Any adverse application of, or adverse legislative/regulatory response to, new or existing federal or state laws to the PEO relationship with our WSEEs and client companies could have a material adverse effect on our results of operations or financial condition.
While some states do not explicitly regulate PEOs, 42 states have passed laws that have recognition, licensing, certification or registration requirements for PEOs and several other states are considering such regulation. Such laws vary from state to state, but generally provide for monitoring the fiscal responsibility of PEOs, and in some cases codify and clarify the co-employment relationship for unemployment, workers’ compensation and other purposes under state law. In addition, the SBEA provides certain benefits for companies that qualify as a CPEO. While we generally support licensing regulation because it serves to validate the PEO relationship, we may not be able to satisfy licensing requirements or other applicable regulations for all states. In addition, there can be no assurance that we will be able to renew our licenses in all states or that we will be able to maintain our CPEO designation.
Certain state and federal regulators are more closely evaluating the existing regulatory framework governing money services businesses and money transmitters in their jurisdictions, particularly following the high-profile failures in 2019 of several national payroll companies. While we maintain that we are not a money services business or money transmitter, the adoption of new, or changes in interpretations of existing, state and federal money transmitter or money services business statutes, or disagreements by regulatory authorities with our interpretation of such statutes or regulations, could subject us to registration or licensing or result in limitations on our business activities until we are appropriately licensed, and such additional regulation and the actions of the regulatory authorities could have a material adverse effect on our results of operations or financial condition. These occurrences could also require changes to the manner in which we conduct some aspects of our business. In addition, should any state or federal regulators make a determination that we have operated as an unlicensed money services business or money transmitter, we could be subject to civil and criminal fines, penalties, costs, legal fees, reputational damage or other negative consequences, which could be material.
Further, if we were to be deemed to be subject to other regulatory requirements applicable to other businesses, such as rules or regulations applicable to new services that we may offer such as earned wage access, then we may need to hire additional personnel, incur additional costs in order to maintain compliance, or be subjected to fines, penalties, or other liabilities, which could be material.
Competition and other developments in the HR services industry may impact our growth and/or profitability.
The human resources services industry, including the PEO industry, is highly fragmented. Many PEOs have limited operations and fewer than 2,500 WSEEs, but there are several industry participants that are comparable to our size or larger. We also encounter competition from “fee for service” companies such as payroll processing firms, insurance companies, human resources consultants and human resources technology solutions as well as cloud-based self-service bundled human resources offerings. Our competitors include the PEO divisions of large business services companies, such as Automatic Data Processing, Inc. and Paychex, Inc., and other national PEOs such as TriNet Group, Inc., Vensure, and Rippling. In many cases, these competitors offer a reduced service PEO offering at a lower price than our PEO HR Outsourcing Solutions. We expect that as the PEO industry grows and its regulatory framework becomes better established, well organized competition with greater resources than we have may enter the PEO market, possibly including large “fee for service” companies currently providing a more limited range of services. In addition, competitors may be able to offer or develop new technology-based lower service models that may require us to make substantial investments in order to effectively compete.
We offer a lower priced reduced service level PEO offering referred to as Workforce Synchronization in response to certain middle market client needs and the evolving PEO marketplace. As of December 2024, approximately 15% of our WSEEs were co-employed by Workforce Synchronization clients. In the event we were to experience a significant increase in the number of clients using the Workforce Synchronization offering or increased pricing pressures in the PEO marketplace without corresponding reductions in operating costs, our operating margins may decline, which could have a material adverse impact on our financial condition or results of operations.
Technology Risks
Evolving regulations, market trends and client expectations require us to constantly enhance and expand our service and technology offerings.
The HR services industry is experiencing rapid technological advances to meet client expectations and expanding regulations. As new regulations are adopted, we must modify our systems to address these changes in the law, such as our recent efforts to implement the assistance provided to businesses and employees under the Covid Relief Programs and Secure 2.0 Act of 2022. In order to make these types of modifications, we may be required to reallocate resources, potentially resulting in delays to planned competitive improvements to our systems. If we do not successfully or timely deploy these types of modifications, we may be unable to comply with regulations, which could subject us to penalties, damage our reputation or result in decreased sales. Further, in order to effectively compete in this environment, we must identify and predict trends, and adapt our technology and service offerings accordingly. In addition, as a larger portion of our client base falls within the middle market segment, we must also develop different technology and services to meet the more complex needs and demands of this key group. These efforts require us to devote substantial resources to develop new functionality, or to integrate third-party solutions, into our offerings. If we fail to respond successfully to these developments or we make investments in enhancements that are not accepted by the market, then the demand for our solutions and services may diminish.
Disruptions of our information technology systems could damage our reputation and materially disrupt our business operations.
Many of the HR services offerings we provide to clients are conducted through a technology infrastructure using both internally developed and purchased commercial software, a wide variety of hardware infrastructure technologies, and a multi-carrier wide area network. The processing of payroll, benefits and other transactions is dependent upon this complex infrastructure, some of which is provided by third-party vendors. We must manage all of these systems, and are dependent on third parties to manage the systems that we obtain from them, including any upgrades, replacements or enhancements, to ensure that they continue to support our services. For example, in connection with our strategic partnership with Workday, Inc. (“Workday”), we are currently working to develop a joint solution with Workday that requires integrations with third parties and with our proprietary systems for our PEO HR Outsourcing Solutions. We also continue to monitor and make changes to our proprietary system for our PEO HR Outsourcing Solutions for compliance and modernization. Any delays or failures resulting from network outages; planned upgrades, enhancements, or replacements of software, hardware, or other systems, including in connection with our project with Workday or any updated for compliance and modernization of systems; or other data processing disruptions, even for a brief period of time, could result in our inability to timely process transactions. The speed with which we, or third-party vendors, are able to address significant cybersecurity incidents may be influenced by the cooperation of certain government agencies. We may also
incur significant costs in the future to protect against damage or disruptions that could be caused by cybersecurity incidents. If such failures cause us to not meet client service expectations or to breach our obligations to our clients, we may lose existing clients, have difficulty attracting new clients, incur regulatory penalties or liability to our clients, or suffer other financial losses, which may have a material adverse effect on our business and financial condition.
We could be subject to reduced revenues, increased costs, liability claims, or harm to our competitive position as a result of data theft, cyberattacks or other security vulnerabilities.
In connection with our offerings, we collect, use, transmit and store large amounts of personal and business information about our WSEEs, employees paid under our traditional payroll solution, and clients, including payroll information, personal and business financial data, social security numbers, bank account numbers, tax information and other sensitive personal and business information. Attacks on information technology systems continue to grow in frequency and sophistication (including the use of emerging artificial intelligence technologies), and we and our third-party vendors are targeted by unauthorized parties using malicious tactics, code and viruses. Hardware or applications we develop or procure from third-party vendors may contain defects in design or other problems that could unexpectedly compromise the confidentiality, integrity or availability of data or our systems. Because the techniques used to obtain unauthorized access and disable or sabotage systems change frequently and may be difficult to detect for long periods of time, we and our third-party vendors may be unable to anticipate these techniques or implement adequate preventive measures. Further, increased reliance by us and our clients on remote workforces impacts our control over cybersecurity protection and service stability and performance, which increases our exposure to cybersecurity and privacy issues. As these threats continue to evolve, we may be required to invest significant additional resources to modify and enhance our information security and controls or to investigate and remediate any security vulnerabilities. We have limited ability to monitor the implementation of similar safeguards by our vendors and do not have the ability to monitor such implementation by our clients or their employees, including WSEEs.
In addition, our services also involve the use and disclosure of personal and business information to us that could be used by a malicious party to commit identity theft or otherwise gain access to the data or funds of our clients or their employees, including WSEEs. If any person, including any corporate employee or WSEE, misappropriates or misuses such funds, documents or data, we may have liability for damages, and our reputation could be substantially harmed and we may have other liabilities that could have a material adverse effect on our business.
Any cyberattack, unauthorized intrusion, malicious software infiltration, network disruption, denial of service attack, ransomware attack, corruption of data, theft of private or other sensitive information, or similar malicious act by a party (including our corporate employees or WSEEs), or inadvertent acts or omissions by our vendors or clients, our own corporate employees or WSEEs, could result in the loss, disclosure or misuse of confidential or proprietary information, and could have a material adverse effect on our business operations or that of our clients, result in liability or regulatory sanction, or cause a loss of confidence in our ability to serve clients. We may not have adequate insurance coverage to compensate us for losses from a security incident. Accordingly, the impact of a data security incident could have a material adverse effect on our business, results of operations and financial condition.
Failure to comply with privacy, data protection and cybersecurity laws and regulations could have a material adverse effect on our reputation, results of operations or financial condition, or have other adverse consequences.
We are subject to various laws, rules and regulations relating to the collection, use, transmission and security and privacy of personal and business information. Most states and the District of Columbia have enacted notification rules that may require notification to regulators, clients or employees in the event of a privacy breach. In addition, new laws and regulations governing data privacy and the unauthorized disclosure of confidential information pose increasingly complex compliance challenges and potentially elevate our costs. It is possible that these laws and regulations may be interpreted and applied in a manner that is inconsistent with our data practices. If so, in addition to the possibility of fines, this could result in an order requiring that we change our data practices, which could have a material adverse effect on our business. Complying with these various laws and regulations could cause us to incur substantial costs or require us to change our business practices in a manner adverse to our business. For example, we incurred additional costs and reallocated internal resources in order to comply with the requirements of the California Privacy Rights Act (“CPRA”), which amended the California Consumer Privacy Act of 2018 (“CCPA”) and became effective on January 1, 2023, which has required us to reallocate additional resources in order to manage compliance in light of the changes implemented by the CPRA. Other states have adopted or are currently contemplating additional privacy requirements. Generally, these laws do not address the coemployment relationship, which requires us to make determinations as to the requirements applicable to our
WSEEs and our PEO Outsourcing Solutions clients. The future enactment of similar laws, rules or regulations, or an adverse determination as to the applicability of these laws, rules, or regulations to us, could have a material adverse impact on us through increased costs or restrictions on our businesses and noncompliance could result in regulatory penalties and significant liability. Additionally, any failure by us to comply with these laws and regulations, including as a result of a security or privacy breach, could result in significant penalties and liabilities for us.
The failure of third-party providers, such as financial institutions, data centers, or cloud-service providers, could have a material adverse effect on us.
In conjunction with providing services to clients, we communicate and rely on financial institutions to electronically transfer funds for the collection of our comprehensive service fee as well as the payment of wages and associated payroll tax withholdings. Communication failures or other failures involving these financial institutions, for any reason, could cause material interruptions to our operations, impact client retention, and result in significant penalties or liabilities to us.
We lease hosting facilities for our data centers at two separate facilities with one facility acting as our primary data center. These facilities host the majority of our business applications, telecommunications equipment, information security infrastructure, and network equipment. If our data centers experience any interruptions or outages, and our business continuity plan is delayed or fails, then our operations may be materially impacted, which could result in our failure to meet our obligations to our clients, WSEEs, tax authorities, and/or other vendors, which could damage our reputation, subject us to liability, and have a material adverse effect on our business and financial condition.
In addition, some of our systems and services rely upon third-party technology. Examples include, the human capital management system on which our Workforce Acceleration solution is based, the data analytics solution on which our Insperity People Analytics solution is based, and the payroll tax calculation and reporting tools that provide the rates used to calculate payroll taxes for our PEO HR Outsourcing Solutions, among others. In addition, the joint solution that we are developing with Workday will be based on Workday’s human capital management solution. Any failure by these service providers to deliver their services in a timely manner and in compliance with applicable laws could result in material interruptions to our operations; subject us to substantial fines, penalties, and other liabilities; damage our reputation; and result in a loss of clients.
Other Operational Risks
We may not fully realize the anticipated benefits of our strategic partnership and plans to develop a joint solution with Workday, which could have a material adverse impact on our financial condition or results of operations.
We have announced a strategic partnership and are developing a joint solution with Workday. The joint solution would involve, among other things, the offering of our PEO services using Workday’s human capital management solution, as well as joint marketing and sales efforts. The joint solution also requires integration with other third-party vendors and with our proprietary system for our PEO HR Outsourcing Solutions. The success of the strategic partnership and joint solution will depend on many factors, and we may not realize all, or any, of the anticipated benefits. We have devoted substantial resources and incurred significant costs to develop the joint solution, and expect to continue to devote substantial resources and to incur significant costs. The strategic partnership and plans to develop a joint solution involve numerous risks, including that we may be unable to complete the development and implementation of the joint solution, or that development and implementation of the joint solution may be more difficult, time-consuming, or costly than expected, including due to difficulties with integrations with third party vendors. We may also not receive the expected sales, marketing, and other benefits from the strategic partnership.
The full benefit of the strategic partnership requires the cooperation of the two companies on sales, marketing, and technology matters, as well as our ability to successfully integrate and implement the Workday-based solution with our other processes and systems in a manner that allows us to maintain compliance as a professional employer organization and incorporate appropriate financial and management systems and controls. In addition, we may fail to effectively market or sell the joint solution, or there may be less demand than anticipated for the joint solution. The initiatives related to the strategic partnership, including the development of the joint solution, may divert the attention of our technology, service, compliance, marketing, sales, management, and other teams away from our existing business solutions, which could result in the loss of existing or prospective clients or fines, penalties, or other liabilities if our existing business solutions and compliance are disrupted. We may also have conflicts or disagreements with Workday, which could disrupt the strategic partnership, could impact the development of the joint solution, and could lead to termination of the strategic partnership.
The occurrence of one or more of these events could result in our failure to achieve anticipated growth or revenues, or require us to devote additional resources to the strategic partnership or the development of the joint solution, or to lose the investments made relating to the development of the joint solution, any of which could result in a material adverse effect on our business, financial condition, and results of operations, as well as reputational damage that could negatively impact our sales and retention efforts.
Failure to integrate or realize the expected return on future product offerings, including through acquisitions, strategic partnerships, and investments, could have a material adverse impact on our financial condition or results of operations.
We have adopted a strategy to market and sell additional solutions within and outside of our PEO HR Outsourcing Solutions. As part of this strategy, periodically we make strategic long-term decisions to partner with (including as a reseller arrangement), invest in and/or acquire new companies, business units or assets in order to offer new or enhanced solutions. Offering new solutions involves a number of risks such as entering markets or businesses in which we have no prior experience and that may be highly regulated; failing to integrate the new solution into our product and service offerings; diversion of technology, service, compliance, marketing, sales, management and other teams from other business concerns; in the case of a partnership or reseller arrangement, reliance on the service and technology of the third party; in the case of an investment or acquisition, over-valuation of the targeted business; and litigation or government action resulting from the activities of an acquired company or of our partner or from offering the new solution in a non-compliant manner. The occurrence of one or more of these events could result in the loss of existing or prospective clients or employees, not achieving anticipated revenues or profitability, impairment of acquired assets, and substantial liability. Such developments could have a material impact to our business, financial condition, results of operations, and future growth rates, and could also result in reputational damage that could negatively impact our sales and retention efforts.
Item 1B. Unresolved Staff Comments.
None.
Item 1C. Cybersecurity.
We recognize the critical importance of developing, implementing, and maintaining a robust cybersecurity risk management, strategy, and governance program in order to safeguard the confidentiality, integrity, and availability of our systems and information.
Board Oversight of Cybersecurity Matters
Our Board has established oversight mechanisms to help ensure effective governance in managing risks associated with cybersecurity threats.
In addition to the updates that our Board receives on cybersecurity matters, the Board’s Finance, Risk Management and Audit Committee (the “FRMA Committee”) is tasked with overseeing enterprise risk management. The FRMA Committee reviews and discusses major risk exposures with management, including cybersecurity risks, and steps management has taken to monitor and control such exposures, including our guidelines and policies concerning risk assessment and management.
Management of and Reporting on Cybersecurity Matters
Our management assumes responsibility for assessing, identifying, and managing cybersecurity risks, threats, and incidents.
In particular, our Senior Vice President of Innovative Technology Solutions (“SVP-ITS”) is responsible for our overall technology strategy, including overseeing our information security function and plays a pivotal role in assessing and managing all cybersecurity risks, threats, and incidents. The SVP-ITS reports directly to our President and Chief Operating Officer (“President and COO”) and maintains regular dialogue with our President and COO and other key members of our senior management to ensure these individuals are appropriately apprised of our latest cybersecurity posture and developments, such as new threats, incidents, risks, and risk management solutions. Our SVP-ITS prepares reports for each regular Board meeting regarding significant developments in these topics to support the Board in its efforts to have appropriate information to exercise oversight on critical cybersecurity issues. Our current SVP-ITS has decades of experience overseeing leading systems and software development efforts with critical cybersecurity components.
The SVP-ITS is supported by dedicated information technology and security personnel and resources, including team members that have numerous cybersecurity certifications. Collectively, these personnel and resources allow us to strategically integrate cybersecurity into our broader risk management framework and decision-making process.
We also have an Enterprise Risk Management Steering Committee (the “ERM Steering Committee”), which is responsible for formally identifying and evaluating risks that may affect our ability to execute our corporate strategy and fulfill our business objectives, including cybersecurity risks. The ERM Steering Committee is chaired by the Company’s chief financial officer and includes the Company’s SVP-ITS, general counsel, internal audit director, and other members of management. The ERM Steering Committee conducts an annual comprehensive risk review of our overall risk profile and analyzes any significant identified risks, including consideration of risks relating to cybersecurity matters, which the ERM Steering Committee then presents and discusses with the FRMA Committee and the entire Board. In addition to the formal annual review, members of the ERM Steering Committee review and provide periodic updates as appropriate regarding our overall risk profile and any significant identified risks to both the FRMA Committee and the entire Board.
We have processes in place that we believe are designed to allow our information security team and management to be informed of and monitor the prevention, detection, mitigation, and remediation of cybersecurity risks. These processes include establishing a formal incident response team, penetration testing, system vulnerability scanning, phishing simulations, tabletop exercises, employee security and compliance training, disaster recovery planning, and other exercises to evaluate the effectiveness of our information security program and improve our security measures and planning.
Engagement of Third Parties on Risk Management
Recognizing the complexity and evolving nature of cybersecurity threats, we engage with a range of external experts, including cybersecurity consultants and systems auditors, in evaluating and testing our risk management systems. Our collaboration with these third parties includes regular audits, threat and vulnerability assessments, incident response plan design and testing, penetration testing, and consultation on improving our defense-in-depth security posture.
Overseeing Third-Party Risk
We have processes in place designed to help us identify and oversee cybersecurity risks associated with our use of vendors, service providers, business partners, and other third parties that process our data on our behalf or have access to our systems. These processes include a vendor management policy designed to identify and consider potential risks from third parties as part of the vendor section process, which considers vendor cybersecurity standards and other factors based on the nature of the services that the vendor will provide.
Impact on the Company
We have experienced, and may continue to experience, cyber incidents in the normal course of our business. However, prior cybersecurity incidents have not had a material adverse effect on our business, financial condition, results of operations, or cash flows. For further discussion, see Item 1A. “Risk Factors – Disruptions of our information technology systems could damage our reputation and materially disrupt our business operations” and Item 1A. “Risk Factors - We could be subject to reduced revenues, increased costs, liability claims, or harm to our competitive position as a result of data theft, cyberattacks or other security vulnerabilities.”
Item 2. Properties.
We believe our current real estate and facilities are adequate for the purposes for which they are intended and provide for further expansion to accommodate our long-term growth and expansion goals. We believe that short-term leased facilities are readily available if needed to accommodate near-term needs if they arise. We will continue to evaluate the need for additional facilities based on the extent of our product and service offerings, the rate of client growth, the geographic distribution of our client base and our long-term service delivery requirements.
Corporate Facilities
Our corporate headquarters is located in Kingwood, Texas, in a campus-style facility. This 33-acre company-owned office campus includes 700,000 square feet of office space and approximately 6 acres of undeveloped land for future expansion. Development and support operations are located in the Kingwood facility.
We currently lease two hosting facilities, totaling approximately 1,800 square feet, that are in different locations. The hosting facilities house the majority of our business applications, telecommunications equipment and network equipment. The facilities, located in Allen, Texas and Austin, Texas, are under lease until 2028 and 2030, respectively.
Service Centers
We currently have four regional service centers located in Atlanta, Dallas, Houston and Los Angeles.
The Atlanta service center, which currently services approximately 34% of our WSEE base, is located in a 50,600 square foot facility under lease until 2035.
The Dallas service center, which currently services approximately 22% of our WSEE base, is located in a 45,000 square foot facility under lease until 2031. In addition to the service center operations, the facility also contains sales operations.
The Houston service center, which currently services approximately 23% of our WSEE base, is located on our corporate campus.
The Los Angeles service center, which currently services approximately 21% of our WSEE base, is located in a 39,000 square foot facility under lease until 2029. In addition to the service center operations, the facility also contains sales operations.
Sales and Service Offices
As of December 31, 2024, we had sales and service personnel in 83 facilities located in 48 sales markets throughout the United States. All of the facilities are leased and some are shared by multiple sales offices and/or client service personnel. As of December 31, 2024, we had 106 sales offices in these 48 markets. To take advantage of economic efficiencies, multiple sales offices may share a physical location. Each sales office is typically staffed by BPAs, a district sales manager and an office administrator. In addition, we have placed certain client service personnel in a majority of our sales markets to provide high-quality, localized service to our clients in those major markets. We expect to continue placing client service personnel in sales markets as a critical mass of clients is attained in each market.
Item 3. Legal Proceedings.
We are not a party to any material pending legal proceedings other than ordinary routine litigation incidental to our business that we believe would not have a material adverse effect on our financial condition or results of operations, except as discussed in Note 12 to the Consolidated Financial Statements, “Commitments and Contingencies,” which is incorporated herein by reference.
Item 4. Mine Safety Disclosures.
Not applicable.
Item S-K 401 (b). Executive Officers of the Registrant.
The following table sets forth the names, ages (as of February 3, 2025) and positions of Insperity’s executive officers:
| | | | | | | | | | | | | | |
| Name | | Age | | Position |
| | | | |
| Paul J. Sarvadi | | 68 | | Chairman of the Board & Chief Executive Officer |
| A. Steve Arizpe | | 67 | | President & Chief Operating Officer |
| | | | |
| James D. Allison | | 56 | | Executive Vice President of Finance, Chief Financial Officer & Treasurer |
| Christian P. Callens | | 53 | | Senior Vice President of Legal, General Counsel & Secretary |
Paul J. Sarvadi has served as Chairman of the Board & Chief Executive Officer since August 2003. Mr. Sarvadi co-founded Insperity in 1986 and served as Vice President and Treasurer of Insperity from its inception in 1986 through April 1987, as Vice President from April 1987 through 1989 and as President and Chief Executive Officer from 1989 to August 2003. Prior to founding Insperity, Mr. Sarvadi started and operated several small businesses. Mr. Sarvadi has served as President of NAPEO and was a member of its Board of Directors for five years. Mr. Sarvadi was selected as the 2001 National Ernst & Young Entrepreneur Of The Year® for service industries. In 2004, he received the Conn Family Distinguished New Venture Leader Award from Mays Business School at Texas A&M University. In 2007, he was inducted into the Texas Business Hall of Fame.
A. Steve Arizpe has served as President & Chief Operating Officer since May 2019. He is responsible for providing strategic leadership to sales, marketing, human resources, client services, traditional employment solutions and information technology to drive growth, customer satisfaction and client retention. Mr. Arizpe joined Insperity in 1989 as Houston Sales Manager. Since then, he has served in various roles, including Regional Sales Manager, National Sales Manager, Vice President of Sales, and Executive Vice President of Client Services. Prior to joining Insperity, Mr. Arizpe served in sales and sales management roles for NCR Corporation and Clarke-American. He has also served as a director of the Texas Chapter of NAPEO, on the board of CultureShapers, an organization devoted to area high school students pursuing their interests in the visual and performing arts, on the board of the Cynthia Woods Mitchell Pavilion and Somebody Cares America, a nonprofit organization that engages in disaster response, compassions outreach and leadership development. Mr. Arizpe earned his Bachelor’s degree in Business Management from Texas A&M University.
James D. Allison has served as Executive Vice President of Finance, Chief Financial Officer & Treasurer since November 2024. He previously served as Executive Vice President of Comprehensive Benefits Solutions and Chief Profitability Officer from May 2023 until his promotion to the current position. Mr. Allison joined Insperity in 1997 and held various roles of increasing responsibility in the finance department until 2011. In that same year, he was promoted to Senior Vice President of Pricing and Cost Analysis. In May 2018, Mr. Allison was promoted to Senior Vice President of Gross Profit Operations and assumed responsibilities for the Company’s gross profit drivers, including pricing, benefit plans and workers’ compensation programs. He served in this capacity until his subsequent promotion to Executive Vice President of Gross Profit Operations in May 2022. Mr. Allison has served on the Accounting Practices Committee of NAPEO and, prior to joining Insperity, he worked in the audit practice of Ernst & Young LLP. Mr. Allison earned his Bachelor of Business Administration and Master in Professional Accounting degrees from The University of Texas at Austin and is a certified public accountant.
Christian P. Callens has served as Senior Vice President of Legal, General Counsel & Secretary since January 2024. Mr. Callens joined Insperity in January 2014 as Managing Counsel and Assistant Secretary, in which role he led the Transactions and Corporate Law Practice Group. He was promoted to Deputy General Counsel, Managing Counsel & Assistant Secretary in October 2022. Prior to joining Insperity in 2014, Mr. Callens was counsel in the corporate practice of Skadden, Arps, Slate, Meagher & Flom LLP. He also previously held an executive position at a privately-held technology company. Mr. Callens began his legal career as a law clerk for the Honorable John Minor Wisdom of the United States Fifth Circuit Court of Appeals. He holds a Bachelor of Arts degree from The University of Texas at Austin and a Juris Doctor degree from Tulane University Law School, where he was senior managing editor of the Tulane Law Review and a member of the Order of the Coif.
PART II
Item 5. Market for Registrant’s Common Equity, Related Stockholder Matters and Issuer Purchases of Equity Securities.
Common Stock
Our common stock is traded on the New York Stock Exchange under the symbol “NSP.” As of February 3, 2025, there were 60 holders of record of our common stock. This number does not include stockholders for whom shares were held in “nominee” or “street name.”
Dividend Policy
During 2024, we paid dividends of $89 million. The payment of dividends is made at the discretion of our Board and depends upon our operating results, financial condition, capital requirements, general business conditions and such other factors as our Board deems relevant.
Issuer Purchases of Equity Securities
The following table provides information about purchases by Insperity during the three months ended December 31, 2024 of equity securities that are registered by Insperity pursuant to Section 12 of the Exchange Act:
| | | | | | | | | | | | | | | | | |
| Period | Total Number of Shares Purchased(1)(2) | | Average Price Paid per Share | Total Number of Shares Purchased Under Announced Program(2) | Maximum Number of Shares Available for Purchase under Announced Program(2) |
| 10/01/2024 — 10/31/2024 | 98 | | | $ | 88.91 | | — | | 1,598,559 | |
| 11/01/2024 — 11/30/2024 | 40,000 | | | 78.24 | | 40,000 | | 1,558,559 | |
| 12/01/2024 — 12/31/2024 | 105,815 | | | 80.92 | | 105,795 | | 1,452,764 | |
| Total | 145,913 | | | $ | 80.19 | | 145,795 | | |
____________________________________
(1)During the three months ended December 31, 2024, 118 shares of stock were withheld to satisfy tax-withholding obligations arising in conjunction with the vesting of restricted stock units. The required withholding is calculated using the closing sales price reported by the New York Stock Exchange on the date prior to the applicable vesting date. These shares are not subject to the repurchase program.
(2)Our Board of Directors has approved a program to repurchase shares of our outstanding common stock. During the three months ended December 31, 2024, 145,795 shares were repurchased under the program. On August 1, 2023, we announced our Board of Directors had authorized an increase of 2,000,000 shares that may be repurchased under the program. As of December 31, 2024, we were authorized to repurchase an additional 1,452,764 shares under the program. Unless terminated earlier by resolution of our Board, the repurchase program will expire when we have repurchased all shares authorized for repurchase under the repurchase program.
Performance Graph
The following graph compares our cumulative total stockholder return since December 31, 2019, with the S&P Smallcap 600 Index, the S&P Midcap 400 Index, and the S&P Composite 1500 – Human Resource & Employment Services Index. The graph assumes that the value of the investment in our common stock and each index (including reinvestment of dividends) was $100 on December 31, 2019.
COMPARISON OF 5 YEAR CUMULATIVE TOTAL RETURN*
Among Insperity, Inc., the S&P Smallcap 600 Index, the S&P Midcap 400 Index and the S&P Composite 1500 – Human Resource and Employment Services Index
*$100 invested on 12/31/19 in Insperity stock or in the specified index, including reinvestment of dividends.
Fiscal year ending December 31.
Copyright© 2024 Standard & Poor's, a division of S&P Global. All rights reserved.
| | | | | | | | | | | | | | | | | | | | |
| 12/19 | 12/20 | 12/21 | 12/22 | 12/23 | 12/24 |
| | | | | | |
| Insperity, Inc. | 100.00 | | 96.84 | | 145.44 | | 142.65 | | 150.11 | | 101.83 | |
| S&P Smallcap 600 | 100.00 | | 111.29 | | 141.13 | | 118.41 | | 137.42 | | 149.37 | |
| S&P Midcap 400 | 100.00 | | 113.66 | | 141.80 | | 123.28 | | 143.54 | | 163.54 | |
| S&P Composite 1500 – Human Resource & Employment Services | 100.00 | | 100.85 | | 152.43 | | 113.87 | | 121.22 | | 143.93 | |
This graph shall not be deemed “filed” for purposes of Section 18 of the Exchange Act, or otherwise subject to the liabilities of that section, nor shall it be deemed incorporated by reference in any filing under the Securities Act or the Exchange Act, regardless of any general incorporation language in such filing.
Item 6. [Reserved].
| | |
| MANAGEMENT’S DISCUSSION AND ANALYSIS OF FINANCIAL CONDITION AND RESULTS OF OPERATIONS |
Item 7. Management’s Discussion and Analysis of Financial Condition and Results of Operations.
You should read the following discussion in conjunction with our Consolidated Financial Statements and related Notes included elsewhere in this annual report. Historical results are not necessarily indicative of trends in operating results for any future period. The statements contained in this annual report that are not historical facts are forward-looking statements that involve a number of risks and uncertainties. The actual results of the future events described in such forward-looking statements in this annual report could differ materially from those stated in such forward-looking statements. Among the factors that could cause actual results to differ materially are the risks and uncertainties discussed in Item 1A. Risk Factors and the uncertainties set forth from time to time in our other public reports and filings and public statements. Executive Summary
Overview
Our long-term strategy is to provide the best small and medium-sized businesses in the United States with our specialized human resources service offering and to leverage our buying power and expertise to provide additional valuable services to clients. Our most comprehensive HR services offerings are provided through our Workforce Optimization® and Workforce SynchronizationTM solutions (together, our “PEO HR Outsourcing Solutions”), which encompass a broad range of human resources functions, including payroll and employment administration, employee benefits, workers’ compensation, government compliance, performance management and training and development services, along with our cloud-based human capital management solution, our Insperity PremierTM platform. Our overall operating results can be measured in terms of revenues, gross profit or adjusted EBITDA per WSEE per month. We often use the average number of WSEEs paid during a period as our unit of measurement in analyzing and discussing our results of operations.
In addition to our PEO HR Outsourcing Solutions, we offer a comprehensive traditional payroll and human capital management solution, known as our Workforce AccelerationTM solution, our traditional payroll solution. We also offer a number of other business performance solutions, including Recruiting Services, Employment Screening, Retirement Services, and Insurance Services. These other products or services generally are offered only with our other solutions.
2024 Highlights
•Average number of WSEEs paid per month decreased 2% to 307,261. Revenues increased 1% on a 3% increase in revenue per WSEE, partially offset by the 2% decrease in average WSEEs paid.
•We ended 2024 averaging 309,093 paid WSEEs in the fourth quarter of 2024, which represents a 2% decrease over the fourth quarter of 2023.
•Approximately 26% of our average paid WSEEs were in our middle market sector for the years ended December 31, 2024 and 2023, which is generally defined as companies with 150 to 5,000 WSEEs.
•Gross profit increased 1% to $1.1 billion. The increase was primarily due to a 3% increase in gross profit per WSEE, which was partially offset by a 2% decline in the average number of WSEEs paid per month. Gross profit per WSEE paid per month reflected, in part, a 3% pricing increase offset by a 3% increase in direct costs per WSEE. The increase in direct costs per WSEE was primarily attributable to a 4% increase in benefits costs per participant.
•Operating expenses increased 14% in 2024 to $935 million, and included increases in travel and event costs, salary and wages, and the implementation of our Workday strategic partnership. On a per WSEE per month basis, operating expenses increased from $219 in 2023 to $253 in 2024.
•Net income and diluted earnings per share (“Diluted EPS”) decreased 47% and 46% to $91 million and $2.42, respectively.
•Adjusted net income and adjusted EPS decreased 36% and 35% to $135 million and $3.58, respectively.
•Adjusted EBITDA decreased 24% to $270 million.
| | |
| MANAGEMENT’S DISCUSSION AND ANALYSIS OF FINANCIAL CONDITION AND RESULTS OF OPERATIONS |
•Our net income per WSEE per month decreased 46% from $46 in 2023 to $25 in 2024.
•Our adjusted EBITDA per WSEE per month decreased 22% from $94 in 2023 to $73 in 2024.
•We ended 2024 with working capital of $155 million.
•During 2024, we paid $89 million in dividends, repurchased approximately 697,000 shares of our common stock at a cost of $63 million and paid $38 million in capital expenditures.
Please read “Non-GAAP Financial Measures” for a reconciliation of adjusted EBITDA, adjusted net income, and adjusted EPS to their most directly comparable financial measures calculated and presented in accordance with accounting principles generally accepted in the United States (“GAAP”). Revenues
We account for our revenues in accordance with Accounting Standards Codification (“ASC”) 606, Revenue from Contracts with Customers. Our PEO HR Outsourcing Solutions gross billings to clients include the payroll cost of each WSEE at the client location and a markup computed as a percentage of each WSEEs payroll cost. We invoice the gross billings concurrently with each periodic payroll of our WSEEs. Revenues, which exclude the payroll cost component of gross billings, and therefore, consist solely of the markup, are recognized ratably over the payroll period as WSEEs perform their service at the client worksite. This markup includes pricing components associated with our estimates of payroll taxes, benefits and workers’ compensation costs, plus a separate component related to our HR services. Revenues that have been recognized but not invoiced represent unbilled accounts receivable included in accounts receivable, net on our Consolidated Balance Sheets.
Our revenues are primarily dependent on the number of clients enrolled, the resulting number of WSEEs paid each period and the number of WSEEs enrolled in our benefit plans. Because our total markup is computed as a percentage of payroll cost, certain revenues are also affected by the payroll cost of WSEEs, which may fluctuate based on the composition of the WSEE base, inflationary effects on wage levels and differences in the local economies of our markets.
Direct Costs
The primary direct costs associated with revenue-generating activities for our PEO HR Outsourcing Solutions are:
•employment-related taxes (“payroll taxes”)
•costs of employee benefit plans
•workers’ compensation costs
Payroll taxes consist of the employer’s portion of Social Security and Medicare taxes under FICA, federal unemployment taxes and state unemployment taxes. Payroll taxes are generally paid as a percentage of payroll cost. The federal unemployment tax rates are defined by federal regulations. State unemployment tax rates are subject to claim histories and vary from state to state.
Employee benefits costs are comprised primarily of health insurance premiums and claims costs (including dental and pharmacy costs), but also include costs of other employee benefits such as life insurance, vision care, disability insurance, education assistance, adoption assistance, a flexible spending account program and an employee well-being program.
Workers’ compensation costs include administrative and risk charges paid to the insurance carrier, and claims costs, which are driven primarily by the frequency and severity of claims.
Gross Profit
Our gross profit per WSEE is primarily determined by our ability to accurately estimate direct costs and our ability to incorporate changes in these costs into the gross billings charged to PEO HR Outsourcing Solutions clients, which are subject to pricing arrangements that are typically renewed annually. We use gross profit per WSEE per month as our principal measurement of relative performance at the gross profit level.
| | |
| MANAGEMENT’S DISCUSSION AND ANALYSIS OF FINANCIAL CONDITION AND RESULTS OF OPERATIONS |
Operating Expenses
•Salaries, wages and payroll taxes — Salaries, wages and payroll taxes (“salaries”) are primarily a function of the number of corporate employees, their associated average pay and any additional cash incentive compensation. Our corporate employees include client services, sales and marketing, benefits, legal, finance, information technology, administrative support personnel and those associated with our other products and services.
•Stock-based compensation — Our stock-based compensation relates to the recognition of non-cash compensation expense over the requisite service period of time-based and performance-based incentive plan awards.
•Commissions — Commissions expense consists primarily of amounts paid to sales managers and other sales personnel, including BPAs as well as channel referral fees. Commissions are based on new accounts sold and a percentage of revenue generated by such personnel.
•Advertising — Advertising expense primarily consists of media advertising and other business promotions in our current and anticipated sales markets, including the Insperity Invitational™ presented by UnitedHealthcare® sponsorship.
•General and administrative expenses — Our general and administrative expenses primarily include:
◦rent expenses related to our service centers and sales offices
◦outside professional service fees related to legal, consulting and accounting services
◦administrative costs, such as postage, printing and supplies
◦employee travel and training expenses
◦facility costs, including repairs and maintenance
◦technology costs, including software-as-a-service (“SaaS”) subscription costs, amortization of SaaS implementation costs, and costs associated with the development and implementation of the Workday joint solution.
•Depreciation and amortization — Depreciation and amortization expense is primarily a function of our capital investments in corporate facilities, service centers, sales offices, software development and technology infrastructure.
Other Income (Expense)
Other income (expense) includes interest charges incurred in connection with borrowings under our credit facility and interest income earned on our cash, cash equivalents, marketable securities, restricted cash and deposits. Please read “—Liquidity and Capital Resources” for additional information. Income Taxes
Our provision for income taxes typically differs from the U.S. statutory rate of 21%, due primarily to state income taxes, non-deductible expenses, vesting of equity awards and various tax credits. Deferred income taxes reflect the net tax effects of temporary differences between the carrying amounts of assets and liabilities used for financial reporting purposes and the amounts used for income tax purposes. Significant items resulting in deferred income taxes include prepaid assets, accruals for workers’ compensation expenses, stock-based compensation, software development costs, accrued incentive compensation, operating lease assets and liabilities and depreciation. Changes in these items are reflected in our financial statements through a deferred income tax provision. Please read Note 7 to the Consolidated Financial Statements, “Income Taxes,” for additional information. Critical Accounting Policies and Estimates
The discussion and analysis of our financial condition and results of operations is based upon our Consolidated Financial Statements, which have been prepared in accordance with GAAP. The preparation of these financial statements requires
| | |
| MANAGEMENT’S DISCUSSION AND ANALYSIS OF FINANCIAL CONDITION AND RESULTS OF OPERATIONS |
our management to make estimates and judgments that affect the reported amounts of assets, liabilities, revenues and expenses, and related disclosure of contingent assets and liabilities. On an ongoing basis, we evaluate these estimates, including those related to health and workers’ compensation insurance claims experience, client bad debts, income taxes, property and equipment, goodwill and other intangibles, and contingent liabilities. We base these estimates on historical experience and on various other assumptions that we believe to be reasonable under the circumstances, the results of which form the basis for making judgments about the carrying values of assets and liabilities that are not readily apparent from other sources. Actual results may differ from these estimates.
We believe the following accounting policies are critical and/or require judgments and estimates used in the preparation of our Consolidated Financial Statements:
•Benefits costs — We provide group health insurance coverage under a single-employer plan that covers both our WSEEs in our PEO HR Outsourcing Solutions and our corporate employees and utilizes a national network of carriers including United, UnitedHealthcare of California, Kaiser Permanente, Blue Shield of California, HMSA BlueCross BlueShield of Hawaii, and Harvard Pilgrim Health Care, formerly known as Tufts, all of which provide fully insured policies or service contracts.
The health insurance contract with United provides the majority of our health insurance coverage. As a result of certain contractual terms, we have accounted for this plan since its inception using a partially self-funded insurance accounting model. Accordingly, we record the costs of the United plan, including an estimate of the incurred claims, taxes and administrative fees (collectively the “Plan Costs”), as benefits expense in the Consolidated Statements of Income. The estimated incurred but not reported claims are based upon: (1) the level of claims processed during the quarter; (2) estimated completion rates based upon recent claim development patterns under the plan; and (3) the number of participants in the plan, including both active and COBRA enrollees. Each reporting period, changes in the estimated ultimate costs resulting from claim trends, plan design and migration, participant demographics and other factors are incorporated into benefits costs.
Our financial responsibility with United is limited to the first $1 million of paid claims per claimant per year. Additionally, since the plan’s inception, under the terms of the contract, United establishes cash funding rates 90 days in advance of the beginning of a reporting quarter. If the Plan Costs for a reporting quarter are greater than the premiums paid and owed to United, a deficit in the plan would be incurred and we would accrue a liability for the excess costs on our Consolidated Balance Sheets. On the other hand, if the Plan Costs for the reporting quarter are less than the premiums paid and owed to United, a surplus in the plan would be incurred and we would record an asset for the excess premiums in our Consolidated Balance Sheets. The terms of the arrangement with United require us to maintain an accumulated cash surplus in the plan of $9 million, which is reported as long-term prepaid insurance. As of December 31, 2024, Plan Costs were more than the net premiums paid and owed to United by $5 million. As this amount is less than the agreed-upon $9 million surplus maintenance level, the $14 million difference is included in accrued health insurance costs, a current liability, in our Consolidated Balance Sheets. In addition, the premiums owed to United at December 31, 2024, were less than $1 million, which is also included in accrued health insurance costs, a current liability, on our Consolidated Balance Sheets.
We believe that recent claim development patterns are representative of incurred but not reported claims costs during the reporting period. The estimated completion rate used to compute incurred but not reported claims involves a significant level of judgment. Accordingly, an increase (or decrease) in the completion rate used to estimate the incurred claims would result in an increase (or decrease) in benefits costs and net income would decrease (or increase) accordingly.
The following table illustrates the sensitivity of changes in the completion rate on our estimate of total benefits costs of $3.0 billion in 2024:
| | | | | | | | | | | | | | |
Change in
Completion Rate | | Change in Benefits Costs
(in millions) | | Change in Net Income
(in millions) |
| | | | |
| (2.5)% | | $ | (31) | | | $ | 22 | |
| (1.0)% | | (12) | | | 9 | |
| 1.0% | | 12 | | | (9) | |
| 2.5% | | 31 | | | (22) | |
| | |
| MANAGEMENT’S DISCUSSION AND ANALYSIS OF FINANCIAL CONDITION AND RESULTS OF OPERATIONS |
•Workers’ compensation costs — Since 2007, our workers’ compensation coverage has been provided through an arrangement with Chubb. The Chubb Program is fully insured in that Chubb has the responsibility to pay all claims incurred under the policy regardless of whether we satisfy our responsibilities. Under the Chubb Program for claims incurred on or before September 30, 2019, we have financial responsibility to Chubb for the first $1 million layer of claims per occurrence and, for claims over $1 million, up to a maximum aggregate amount of $6 million per policy year for claims that exceed $1 million. Effective for claims incurred on or after October 1, 2019, we have financial responsibility to Chubb for the first $1.5 million layer of claims per occurrence and, for claims over $1.5 million, up to a maximum aggregate amount of $6 million per policy year for claims that exceed $1.5 million.
Because we bear the financial responsibility for claims up to the levels noted above, such claims, which are the primary component of our workers’ compensation costs, are recorded in the period incurred. Workers’ compensation insurance includes ongoing health care and indemnity coverage whereby claims are paid over numerous years following the date of injury. Accordingly, the accrual of related incurred costs in each reporting period includes estimates, which take into account the ongoing development of claims and therefore requires judgment.
We utilize a third-party actuary to estimate our loss development rate, which is primarily based upon the nature of WSEEs’ job responsibilities, the location of WSEEs, the historical frequency and severity of workers’ compensation claims, and an estimate of future cost trends. Each reporting period, changes in the actuarial assumptions resulting from changes in actual claims experience and other trends are incorporated into our workers’ compensation claims cost estimates. During the years ended December 31, 2024 and 2023, we reduced accrued workers’ compensation costs by $32 million and $33 million, respectively, for changes in estimated losses related to prior reporting periods. Workers’ compensation cost estimates are discounted to present value at a rate based upon the U.S. Treasury rates that correspond with the weighted average estimated claim payout period (the average discount rate was 4.3% in both 2024 and 2023) and are accreted over the estimated claim payment period and included as a component of direct costs in our Consolidated Statements of Income.
Our claim trends could be greater than or less than our prior estimates, in which case we would revise our claims estimates and record an adjustment to workers’ compensation costs in the period such determination is made. If we were to experience any significant changes in actuarial assumptions, our loss development rates could increase (or decrease), which would result in an increase (or decrease) in workers’ compensation costs and a resulting decrease (or increase) in net income reported in our Consolidated Statements of Income.
The following table illustrates the sensitivity of changes in the loss development rate on our estimate of workers’ compensation costs totaling $75 million in 2024:
| | | | | | | | | | | | | | |
| Change in Loss Development Rate | | Change in Workers’ Compensation Costs
(in millions) | | Change in Net Income
(in millions) |
| | | | |
| (5.0)% | | $ | (4) | | | $ | 3 | |
| (2.5)% | | (2) | | | 1 | |
| 2.5% | | 2 | | | (1) | |
| 5.0% | | 4 | | | (3) | |
At the beginning of each policy period, the workers’ compensation insurance carrier establishes monthly funding requirements comprised of premium costs and funds to be set aside for payment of future claims (“claim funds”). The level of claim funds is primarily based upon anticipated WSEE payroll levels and expected workers’ compensation loss rates, as determined by the insurance carrier. Monies funded into the program for incurred claims expected to be paid within one year are recorded as restricted cash, a short-term asset, while the remainder of claim funds are included in deposits, a long-term asset in our Consolidated Balance Sheets. In 2024, we received $39 million for the return of excess claim funds related to the workers’ compensation program, which decreased deposits – workers’ compensation. As of December 31, 2024, we had restricted cash of $69 million and deposits – workers’ compensation of $178 million. We have estimated and accrued $204 million in incurred workers’ compensation claim costs as of December 31, 2024. Our estimate of incurred claim costs expected to be paid within one year is recorded as accrued workers’ compensation costs and is included in short-term liabilities, while our estimate of incurred claim costs expected to be paid beyond one year is included in long-term liabilities in our Consolidated Balance Sheets.
| | |
| MANAGEMENT’S DISCUSSION AND ANALYSIS OF FINANCIAL CONDITION AND RESULTS OF OPERATIONS |
New Accounting Pronouncements
We believe that we have implemented the accounting pronouncements with a material impact on our financial statements and do not believe there are any new or pending pronouncements that will materially impact our financial position or results of operations. Please read Note 1 to the Consolidated Financial Statements, “Accounting Policies,” for additional information. Results of Operations
Key Financial and Statistical Data
| | | | | | | | | | | | | | | | | | | | |
| (in millions, except per share, WSEE, and statistical data) | Year Ended December 31, | | % Change |
| 2024 | 2023 | 2022 | | 2024 v 2023 | 2023 v 2022 |
| | | | | | |
| Financial data: | | | | | | |
Revenues(1) | $ | 6,581 | | $ | 6,486 | | $ | 5,939 | | | 1 | % | 9 | % |
| Gross profit | 1,052 | | 1,037 | | 1,011 | | | 1 | % | 3 | % |
| Operating expenses | 935 | | 818 | | 761 | | | 14 | % | 7 | % |
| Operating income | 117 | | 219 | | 250 | | | (47) | % | (12) | % |
| Other income (expense), net | 9 | | 6 | | (5) | | | 50 | % | 220 | % |
| Net income | 91 | | 171 | | 179 | | | (47) | % | (4) | % |
| Diluted EPS | 2.42 | | 4.47 | | 4.64 | | | (46) | % | (4) | % |
| | | | | | |
Non-GAAP financial measures(2): | | | | | | |
| Adjusted net income | $ | 135 | | $ | 212 | | $ | 216 | | | (36) | % | (2) | % |
| Adjusted EBITDA | 270 | | 354 | | 352 | | | (24) | % | 1 | % |
| Adjusted EPS | 3.58 | | 5.52 | | 5.59 | | | (35) | % | (1) | % |
| | | | | | |
| Average WSEEs paid | 307,261 | | 312,102 | | 295,005 | | | (2) | % | 6 | % |
| | | | | | |
Statistical data (per WSEE per month): | | | | | | |
Revenues(3) | $ | 1,785 | | $ | 1,732 | | $ | 1,678 | | | 3 | % | 3 | % |
| Gross profit | 285 | | 277 | | 286 | | | 3 | % | (3) | % |
| Operating expenses | 253 | | 219 | | 215 | | | 16 | % | 2 | % |
| Operating income | 32 | | 58 | | 71 | | | (45) | % | (18) | % |
| Net income | 25 | | 46 | | 51 | | | (46) | % | (10) | % |
Adjusted EBITDA(2) | 73 | | 94 | | 100 | | | (22) | % | (6) | % |
____________________________________
(1)Revenues are comprised of gross billings less WSEE payroll costs as follows:
| | | | | | | | | | | |
| Year Ended December 31, |
| (in millions) | 2024 | 2023 | 2022 |
| Gross billings | $ | 43,752 | | $ | 43,141 | | $ | 40,127 | |
| Less: WSEE payroll cost | 37,171 | | 36,655 | | 34,188 | |
| Revenues | $ | 6,581 | | $ | 6,486 | | $ | 5,939 | |
(2)Please read “Non-GAAP Financial Measures” for a reconciliation of the non-GAAP financial measures to their most directly comparable financial measures calculated and presented in accordance with GAAP. (3)Revenues per WSEE per month are comprised of gross billings per WSEE per month less WSEE payroll costs per WSEE per month as follows:
| | |
| MANAGEMENT’S DISCUSSION AND ANALYSIS OF FINANCIAL CONDITION AND RESULTS OF OPERATIONS |
| | | | | | | | | | | |
| Year Ended December 31, |
| (per WSEE per month) | 2024 | 2023 | 2022 |
| Gross billings | $ | 11,866 | | $ | 11,519 | | $ | 11,335 | |
| Less: WSEE payroll cost | 10,081 | | 9,787 | | 9,657 | |
| Revenues | $ | 1,785 | | $ | 1,732 | | $ | 1,678 | |
Key Operating Metrics
We monitor certain key metrics to measure our performance, including:
•WSEEs
•Adjusted EBITDA
•Adjusted EPS
Our growth in the number of WSEEs paid is affected by three primary sources: new client sales, client retention and the net change in WSEEs paid at existing clients through new hires and employee terminations.
•During 2024, the average number of WSEEs paid from new client sales increased 2% from 2023. Average client retention declined from 83% in 2023 to 81% in 2024, while the net change in our client base remained positive, although lower than 2023.
•During 2023, the average number of WSEEs paid from new client sales and the net change in our client base declined compared to 2022. Average client retention also declined from 85% in 2022 to 83% in 2023.
| | | | | | | | |
Average WSEEs Paid and
Year-over-Year Growth Percentage
| Net Income and Year-over-Year Growth Percentage (in millions) | EPS and Year-over-Year Growth Percentage (amounts per share) |
| | |
| MANAGEMENT’S DISCUSSION AND ANALYSIS OF FINANCIAL CONDITION AND RESULTS OF OPERATIONS |
| | | | | |
Adjusted EBITDA and Year-over-Year Growth Percentage (in millions) | Adjusted EPS and Year-over-Year Growth Percentage (amounts per share) |
Revenues
2024 Compared to 2023
Our revenues for 2024 were $6.6 billion, an increase of 1%, primarily due to the following:
•Revenues per WSEE per month increased 3%, or $53, partially offset by a 2% decrease in average WSEEs paid.
2023 Compared to 2022
Our revenues for 2023 were $6.5 billion, an increase of 9%, primarily due to the following:
•Average WSEEs paid increased 6%.
•Revenues per WSEE per month increased 3%, or $54.
| | |
| MANAGEMENT’S DISCUSSION AND ANALYSIS OF FINANCIAL CONDITION AND RESULTS OF OPERATIONS |
We provide our PEO HR Outsourcing Solutions to small and medium-sized businesses throughout the United States. PEO HR Outsourcing Solutions revenue distribution by region follows:
PEO HR Outsourcing Solutions Revenue by Region
(in millions)
____________________________________
Note: Texas is included in the Southwest region.
The percentage of total PEO HR Outsourcing Solutions revenues in our significant markets include the following:
Significant Markets
Gross Profit
In determining the pricing of the markup component of our gross billings, we take into consideration our estimates of the costs directly associated with our WSEEs, including payroll taxes, benefits and workers’ compensation costs, plus an acceptable gross profit margin. As a result, our operating results are significantly impacted by our ability to accurately estimate our direct costs relative to the revenues derived from the markup component of our gross billings.
Our gross profit per WSEE is primarily determined by our ability to accurately estimate direct costs and our ability to incorporate changes in these costs into the gross billings charged to PEO HR Outsourcing Solutions clients, which are subject to pricing arrangements that are typically renewed annually. We use gross profit per WSEE per month as our principal measurement of relative performance at the gross profit level.
| | |
| MANAGEMENT’S DISCUSSION AND ANALYSIS OF FINANCIAL CONDITION AND RESULTS OF OPERATIONS |
| | | | | |
Gross Profit and Year-over-Year Growth Percentage (in millions) | Gross Profit per WSEE per Month and Year-over-Year Growth Percentage (per WSEE per month) |
2024 Compared to 2023
Our pricing objectives attempt to achieve a level of revenue per WSEE that matches or exceeds changes in primary direct costs and operating expenses. Our revenues per WSEE per month increased $53 due to higher average pricing of 3%.
The net decrease in direct costs between 2024 and 2023 attributable to the changes in cost estimates for benefits and workers’ compensation totaled $15 million as discussed below. The $45 per WSEE per month increase in direct costs is due primarily to the direct cost component changes as follows:
Benefits costs
•The cost of group health insurance and related employee benefits increased $20 per WSEE per month, or 4.3% on a cost per covered employee basis.
•The percentage of WSEEs covered under our health insurance plans was 64% in 2024 compared to 65% in 2023.
•Reported results include changes in estimated claims run-off related to prior periods, which was a decrease in costs of $29 million, or $8 per WSEE per month, in 2024 compared to a decrease in costs of $13 million, or $3 per WSEE per month, in 2023.
Workers’ compensation costs
Our continued discipline around our client selection, workplace safety and claims management has allowed for claims within our policy periods to be closed out at amounts below our original cost estimates.
•Workers’ compensation costs increased 2%, or $1 per WSEE per month, in 2024 compared to 2023.
•As a percentage of non-bonus payroll cost, workers’ compensation costs were 0.24% in 2024 and 0.23% in 2023.
•We recorded a reduction in workers’ compensation costs of $32 million, or 0.10% of non-bonus payroll costs, in 2024 compared to a reduction of $33 million, or 0.11% of non-bonus payroll costs, in 2023, primarily as a result of closing out claims at lower than expected costs.
| | |
| MANAGEMENT’S DISCUSSION AND ANALYSIS OF FINANCIAL CONDITION AND RESULTS OF OPERATIONS |
Payroll tax costs
•Payroll taxes increased 2% on a 1% increase in payroll costs, or $24 per WSEE per month.
•Payroll taxes as a percentage of payroll costs increased to 7% in 2024 compared to 6% in 2023.
2023 Compared to 2022
The net decrease in direct costs between 2023 and 2022 attributable to the changes in cost estimates for benefits and workers’ compensation totaled $16 million as discussed below. The $63 per WSEE per month increase in direct costs is due primarily to the direct cost component changes as follows:
Benefits costs
•The cost of group health insurance and related employee benefits increased $44 per WSEE per month, or 7% on a cost per covered employee basis.
•The percentage of WSEEs covered under our health insurance plans was 65% in both 2023 and 2022.
•Reported results include changes in estimated claims run-off related to prior periods, which was a decrease in costs of $13 million, or $3 per WSEE per month, in 2023 compared to an increase in costs of $12 million, or $3 per WSEE per month, in 2022.
Workers’ compensation costs
Our continued discipline around our client selection, workplace safety and claims management contributed to the small increase in our cost per WSEE and, as a result, has allowed for claims within our policy periods to be closed out at amounts below our original cost estimates.
•Workers’ compensation costs increased 12%, or $1 per WSEE per month, in 2023 compared to 2022.
•As a percentage of non-bonus payroll cost, workers’ compensation costs were 0.23% in both 2023 and 2022.
•We recorded a reduction in workers’ compensation costs of $33 million, or 0.11% of non-bonus payroll costs, in 2023 compared to a reduction of $42 million, or 0.14% of non-bonus payroll costs, in 2022, primarily as a result of closing out claims at lower than expected costs.
Payroll tax costs
•Payroll taxes increased 9% on a 7% increase in payroll costs, or $18 per WSEE per month.
•Payroll taxes as a percentage of payroll costs were 6% in both 2023 and 2022.
| | |
| MANAGEMENT’S DISCUSSION AND ANALYSIS OF FINANCIAL CONDITION AND RESULTS OF OPERATIONS |
Operating Expenses
2024 Compared to 2023
The following table presents certain information related to our operating expenses:
| | | | | | | | | | | | | | | | | | | | | | | |
| Year Ended December 31, |
| | | per WSEE |
| (in millions, except per WSEE) | 2024 | 2023 | % Change | | 2024 | 2023 | % Change |
| | | | | | | |
| Salaries | $ | 521 | | $ | 461 | | 13 | % | | $ | 141 | | $ | 123 | | 15 | % |
| Stock-based compensation | 61 | | 53 | | 15 | % | | 17 | | 14 | | 21 | % |
| Commissions | 47 | | 47 | | — | | | 13 | | 13 | | — | |
| Advertising | 38 | | 37 | | 3 | % | | 10 | | 10 | | — | |
| General and administrative: | | | | | | | |
| Amortization of SaaS implementation costs | 11 | | 6 | | 83 | % | | 3 | | 2 | | 50 | % |
| Workday SaaS licensing and implementation expenses | 29 | | — | | — | | | 8 | | — | | — | |
| All other general and administrative | 184 | | 171 | | 8 | % | | 49 | | 46 | | 7 | % |
| Total general and administrative | 224 | | 177 | | 27 | % | | 60 | | 48 | | 25 | % |
| Depreciation and amortization | 44 | | 43 | | 2 | % | | 12 | | 11 | | 9 | % |
| Total operating expenses | $ | 935 | | $ | 818 | | 14 | % | | $ | 253 | | $ | 219 | | 16 | % |
Operating expenses for 2024 increased 14% to $935 million compared to $818 million in 2023. Operating expenses per WSEE per month for 2024 increased 16% to $253 compared to $219 in 2023.
•Salaries of corporate and sales staff for 2024 increased 13% to $521 million, or $18 per WSEE per month, compared to 2023. The increase was primarily due to a 5% increase in BPA, service, technology and support headcount and staff compensation levels in 2024 compared to 2023.
•Stock-based compensation expense for 2024 increased 15% to $61 million, or $3 per WSEE per month, compared to 2023. The increase was primarily due to time-based restricted stock unit awards issued under our incentive plan. Please read Note 1 “Accounting Policies” and Note 9 “Incentive Plans,” to the Consolidated Financial Statements for additional information. •General and administrative expenses for 2024 increased 27% to $224 million, or $12 per WSEE per month, compared to 2023. The increase was primarily due to increased professional services fees, which includes expenses related to the implementation of our Workday strategic partnership, software licensing and maintenance costs, and amortization of SaaS implementation costs.
| | |
| MANAGEMENT’S DISCUSSION AND ANALYSIS OF FINANCIAL CONDITION AND RESULTS OF OPERATIONS |
2023 Compared to 2022
The following table presents certain information related to our operating expenses:
| | | | | | | | | | | | | | | | | | | | | | | |
| Year Ended December 31, |
| | | per WSEE |
| (in millions, except per WSEE) | 2023 | 2022 | % Change | | 2023 | 2022 | % Change |
| | | | | | | |
| Salaries | $ | 461 | | $ | 431 | | 7 | % | | $ | 123 | | $ | 122 | | 1 | % |
| Stock-based compensation | 53 | | 50 | | 6 | % | | 14 | | 14 | | — | |
| Commissions | 47 | | 46 | | 2 | % | | 13 | | 13 | | — | |
| Advertising | 37 | | 37 | | — | | | 10 | | 11 | | (9) | % |
| General and administrative | 177 | | 156 | | 13 | % | | 48 | | 44 | | 9 | % |
| Depreciation and amortization | 43 | | 41 | | 5 | % | | 11 | | 11 | | — | |
| Total operating expenses | $ | 818 | | $ | 761 | | 7 | % | | $ | 219 | | $ | 215 | | 2 | % |
Operating expenses for 2023 increased 7% to $818 million compared to $761 million in 2022. Operating expenses per WSEE per month for 2023 increased 2% to $219 compared to $215 in 2022.
•Salaries of corporate and sales staff for 2023 increased 7% to $461 million, or $1 per WSEE per month, compared to 2022. The increase was primarily due to an increase in BPA, service and support headcount and staff compensation levels, which was partially offset by lower incentive compensation expense in 2023 compared to 2022.
•Stock-based compensation expense for 2023 increased 6% to $53 million, but remained flat on a per WSEE per month basis, compared to 2022. The increase was primarily due to awards issued under our long-term incentive and restricted stock unit programs. Please read Note 1 “Accounting Policies” and Note 9 “Incentive Plans,” to the Consolidated Financial Statements for additional information. •Commissions expense for 2023 increased 2% to $47 million, but remained flat on a per WSEE per month basis, compared to 2022. The increase was primarily due to commissions associated with our PEO HR Outsourcing Solutions, as well as an increase in the amount of sales channel referral fees paid during 2023.
•General and administrative expenses for 2023 increased 13% to $177 million, or $4 per WSEE per month, compared to 2022. The increase was primarily due to increased travel and event costs, software licensing and maintenance costs, and amortization of SaaS implementation costs.
•Depreciation and amortization expense for 2023 increased 5% to $43 million, but remained flat on a per WSEE per month basis, compared to 2022. The increase was primarily due to increased capital expenditures related to computer hardware and software and software development costs.
Other Income (Expense)
Other income (expense) was net income of $9 million and $6 million in 2024 and 2023, respectively, and net expense of $5 million in 2022.
In 2024 and 2023, the increase in other income was due to an increase in interest rates on our marketable securities investments and workers’ compensation deposits, which was partially offset by an increase in interest expense related to higher average interest rates on borrowings under our credit facility. Please read Note 2 to the Consolidated Financial Statements, “Other Balance Sheet Information,” for additional information. Income Tax Expense
Our effective income tax rate was 28% in 2024, 24% in 2023 and 27% in 2022. Our provision for income taxes differed from the U.S. statutory rate of 21% primarily due to state income taxes and non-deductible expenses, offset by excess tax benefits associated with the vesting of equity compensation of less than $1 million, $5 million and less than $1 million, in 2024, 2023 and 2022, respectively. Please read Note 1 “Accounting Policies” and Note 7 “Income Taxes,” to the Consolidated Financial Statements for additional information.
| | |
| MANAGEMENT’S DISCUSSION AND ANALYSIS OF FINANCIAL CONDITION AND RESULTS OF OPERATIONS |
Non-GAAP Financial Measures
Non-GAAP financial measures are not prepared in accordance with GAAP and may be different from non-GAAP financial measures used by other companies. Non-GAAP financial measures should not be considered as a substitute for, or superior to, measures of financial performance prepared in accordance with GAAP. Investors are encouraged to review the reconciliation of the non-GAAP financial measures used to their most directly comparable GAAP financial measures as provided in the tables below.
| | | | | | | | |
| Non-GAAP Measure | Definition | Benefit of Non-GAAP Measure |
| Non-bonus payroll cost | Non-bonus payroll cost is a non-GAAP financial measure that excludes the impact of bonus payrolls paid to our WSEEs.
Bonus payroll cost varies from period to period, but has no direct impact to our ultimate workers’ compensation costs under the current program. | Our management refers to non-bonus payroll cost in analyzing, reporting and forecasting our workers’ compensation costs.
We include these non-GAAP financial measures because we believe they are useful to investors in allowing for greater transparency related to the costs incurred under our current workers’ compensation program. |
| Adjusted cash, cash equivalents and marketable securities | Excludes funds associated with:
• federal and state income tax withholdings,
• employment taxes,
• other payroll deductions, and
• client prepayments. | We believe that the exclusion of the identified items helps us reflect the fundamentals of our underlying business model and analyze results against our expectations, against prior periods, and to plan for future periods by focusing on our underlying operations. We believe that the adjusted results provide relevant and useful information for investors because they allow investors to view performance in a manner similar to the method used by management and improves their ability to understand and assess our operating performance. Adjusted EBITDA is used by our lenders to assess our leverage and ability to make interest payments. |
| |
| |
| |
| EBITDA | Represents net income computed in accordance with GAAP, plus:
• interest expense,
• income tax expense,
• depreciation and amortization expense, and
• amortization of SaaS implementation costs. |
| |
| Adjusted EBITDA | Represents EBITDA plus:
• non-cash stock-based compensation. |
| |
| Adjusted net income | Represents net income computed in accordance with GAAP, excluding:
• non-cash stock-based compensation. |
| |
| Adjusted EPS | Represents diluted net income per share computed in accordance with GAAP, excluding:
• non-cash stock-based compensation. |
Following is a reconciliation of payroll cost (GAAP) to non-bonus payroll costs (non-GAAP):
| | | | | | | | | | | | | | | | | | | | | | | | | | |
| (in millions, except per WSEE per month) | Year Ended December 31, |
| 2024 | | 2023 | | 2022 |
| Per WSEE | | | Per WSEE | | | Per WSEE |
| | | | | | | | |
| Payroll cost | $ | 37,171 | | $ | 10,081 | | | $ | 36,655 | | $ | 9,787 | | | $ | 34,188 | | $ | 9,657 | |
| Less: Bonus payroll cost | 5,101 | | 1,383 | | | 4,978 | | 1,329 | | | 4,960 | | 1,401 | |
| Non-bonus payroll cost | $ | 32,070 | | $ | 8,698 | | | $ | 31,677 | | $ | 8,458 | | | $ | 29,228 | | $ | 8,256 | |
| Payroll cost % change year over year | 1 | % | 3 | % | | 7 | % | 1 | % | | 21 | % | 3 | % |
| Non-bonus payroll cost % change year over year | 1 | % | 3 | % | | 8 | % | 2 | % | | 24 | % | 5 | % |
| | |
| MANAGEMENT’S DISCUSSION AND ANALYSIS OF FINANCIAL CONDITION AND RESULTS OF OPERATIONS |
Following is a reconciliation of cash, cash equivalents and marketable securities (GAAP) to adjusted cash, cash equivalents and marketable securities (non-GAAP):
| | | | | | | | | | | |
| (in millions) | December 31, 2024 | | December 31, 2023 |
| | | |
| Cash, cash equivalents and marketable securities | $ | 1,055 | | | $ | 709 | |
| Less: | | | |
| Amounts payable for withheld federal and state income taxes, employment taxes and other payroll deductions | 830 | | | 510 | |
| Client prepayments | 91 | | | 28 | |
| Adjusted cash, cash equivalents and marketable securities | $ | 134 | | | $ | 171 | |
Following is a reconciliation of net income (GAAP) to EBITDA (non-GAAP) and adjusted EBITDA (non-GAAP):
| | | | | | | | | | | | | | | | | | | | | | | | | | |
| Year Ended December 31, |
| (in millions, except per WSEE per month) | 2024 | | 2023 | | 2022 |
| Per WSEE | | | Per WSEE | | | Per WSEE |
| | | | | | | | |
| Net income | $ | 91 | | $ | 25 | | | $ | 171 | | $ | 46 | | | $ | 179 | | $ | 51 | |
| Income tax expense | 35 | | 8 | | | 54 | | 14 | | | 66 | | 19 | |
| Interest expense | 28 | | 8 | | | 27 | | 7 | | | 14 | | 4 | |
| Amortization of SaaS implementation costs | 11 | | 3 | | | 6 | | 2 | | | 2 | | 1 | |
| Depreciation and amortization | 44 | | 12 | | | 43 | | 11 | | | 41 | | 11 | |
| EBITDA | 209 | | 56 | | | 301 | | 80 | | | 302 | | 86 | |
| Stock-based compensation | 61 | | 17 | | | 53 | | 14 | | | 50 | | 14 | |
| Adjusted EBITDA | $ | 270 | | $ | 73 | | | $ | 354 | | $ | 94 | | | $ | 352 | | $ | 100 | |
| Net income % change year over year | (47) | % | (46) | % | | (4) | % | (10) | % | | 44 | % | 24 | % |
| Adjusted EBITDA % change year over year | (24) | % | (22) | % | | 1 | % | (6) | % | | 38 | % | 18 | % |
Following is a reconciliation of net income (GAAP) to adjusted net income (non-GAAP):
| | | | | | | | | | | |
| Year Ended December 31, |
| (in millions) | 2024 | 2023 | 2022 |
| | | |
| Net income | $ | 91 | | $ | 171 | | $ | 179 | |
| Non-GAAP adjustments: | | | |
| Stock-based compensation | 61 | | 53 | | 50 | |
| Tax effect | (17) | | (12) | | (13) | |
| Total non-GAAP adjustments, net | 44 | | 41 | | 37 | |
| Adjusted net income | $ | 135 | | $ | 212 | | $ | 216 | |
| Net income % change year over year | (47) | % | (4) | % | 44 | % |
| Adjusted net income % change year over year | (36) | % | (2) | % | 40 | % |
| | |
| MANAGEMENT’S DISCUSSION AND ANALYSIS OF FINANCIAL CONDITION AND RESULTS OF OPERATIONS |
Following is a reconciliation of diluted EPS (GAAP) to adjusted EPS (non-GAAP):
| | | | | | | | | | | |
| Year Ended December 31, |
| (amounts per share) | 2024 | 2023 | 2022 |
| | | |
| Diluted EPS | $ | 2.42 | | $ | 4.47 | | $ | 4.64 | |
| Non-GAAP adjustments: | | | |
| Stock-based compensation | 1.61 | | 1.38 | | 1.30 | |
| Tax effect | (0.45) | | (0.33) | | (0.35) | |
| Total non-GAAP adjustments, net | 1.16 | | 1.05 | | 0.95 | |
| Adjusted EPS | $ | 3.58 | | $ | 5.52 | | $ | 5.59 | |
| Diluted EPS % change year over year | (46) | % | (4) | % | 46 | % |
| Adjusted EPS % change year over year | (35) | % | (1) | % | 42 | % |
Liquidity and Capital Resources
We periodically evaluate our liquidity requirements, capital needs and availability of resources in view of, among other things, our expansion plans, stock repurchases, potential acquisitions, debt service requirements and other operating cash needs. To meet short-term liquidity requirements, which are primarily the payment of direct costs and operating expenses, we rely primarily on cash from operations. Longer-term projects, large stock repurchases or significant acquisitions may be financed with public or private debt or equity. We have a revolving credit facility (“Facility”) with a syndicate of financial institutions with a current borrowing capacity of $650 million. The Facility is available for working capital and general corporate purposes, including acquisitions and stock repurchases. We have in the past sought, and may in the future seek, to raise additional capital or take other steps to increase or manage our liquidity and capital resources.
We had $1.1 billion in cash, cash equivalents and marketable securities at December 31, 2024, of which approximately $390 million was payable in early January 2025 for withheld federal and state income taxes, employment taxes and other payroll deductions, approximately $91 million represented client prepayments that were payable in January 2025, and $440 million of funds we received in late December 2024 from the Internal Revenue Service related to employee retention tax credits claimed by our PEO clients under COVID relief programs that are expected to be distributed to clients in early 2025. At December 31, 2024, we had working capital of $155 million compared to $159 million at December 31, 2023. We currently believe that our cash on hand, marketable securities, cash flows from operations, and availability under the Facility will be adequate to meet our liquidity requirements for 2025. We intend to rely on these same sources, as well as public and private debt or equity financing, to meet our longer-term liquidity and capital needs.
As of December 31, 2024, we had outstanding letters of credit and borrowings totaling $370 million under the Facility. Please read Note 6 to the Consolidated Financial Statements, “Long-Term Debt,” for additional information. Cash Flows from Operating Activities
Net cash provided by operating activities in 2024 was $520 million. Our primary source of cash from operations is the comprehensive service fee and payroll funding we collect from our clients. Our cash and cash equivalents, and thus our reported cash flows from operating activities, are significantly impacted by various external and internal factors, which are reflected in part by the changes in our balance sheet accounts. These include the following:
•Timing of client payments / payroll taxes — We typically collect our comprehensive service fee, along with the client’s payroll funding, from clients no later than the same day as the payment of WSEE payrolls and associated payroll taxes. Therefore, the last business day of a reporting period has a substantial impact on our reporting of operating cash flows. For example, many WSEEs are paid on Fridays; therefore, operating cash flows decrease in the reporting periods that end on a Friday or a Monday. In the year ended December 31, 2024, the last business day of the reporting period was a Tuesday, client prepayments were $91 million and employment taxes and other deductions were $830 million, which included $440 million of funds related to client employee retention tax credits received on their behalf from the Internal Revenue Service that are expected to be distributed to clients in early 2025. In the year ended December 31, 2023, the last business day of the reporting period was a Friday, client prepayments were $28 million and employment taxes and other deductions were $510 million.
| | |
| MANAGEMENT’S DISCUSSION AND ANALYSIS OF FINANCIAL CONDITION AND RESULTS OF OPERATIONS |
•Workers’ compensation plan funding — During 2024 and 2023, we received $39 million and $46 million, respectively, for the return of excess claim funds related to the workers’ compensation program, which resulted in an increase in working capital.
•Medical plan funding — Our health care contract with United establishes participant cash funding rates 90 days in advance of the beginning of a reporting quarter. Therefore, changes in the participation level of the United plan have a direct impact on our operating cash flows. In addition, changes to the funding rates, which are solely determined by United based primarily upon recent claim history and anticipated cost trends, also have a significant impact on our operating cash flows. As of December 31, 2024, Plan Costs were more than the net premiums paid and owed to United by $5 million, which is $14 million less than our agreed-upon $9 million surplus maintenance level. The $14 million difference is therefore reflected as a current liability and $9 million is reflected as a long-term asset on our Consolidated Balance Sheet at December 31, 2024. In addition, the premiums owed to United at December 31, 2024, were less than $1 million, which is included in accrued health insurance costs, a current liability, on our Consolidated Balance Sheet. In addition, the premiums owed to United at December 31, 2024, were less than $1 million, which is included in accrued health insurance costs, a current liability, on our Consolidated Balance Sheet.
•Operating results — Our net income and adjusted net income has a significant impact on our operating cash flows. Our net income and adjusted net income decreased 47% and 36% to $91 million and $135 million in 2024, respectively, compared to $171 million and $212 million in 2023, respectively. Please read “Results of Operations.” Cash Flows from Investing Activities
Net cash flows used in investing activities were $38 million for the year ended December 31, 2024, primarily due to property and equipment purchases.
Cash Flows from Financing Activities
Net cash flows used in financing activities were $173 million for the year ended December 31, 2024. We paid $89 million in dividends and repurchased or withheld $63 million in stock. In addition, client funds liability and other financing activities decreased by $21 million.
Seasonality, Inflation and Quarterly Fluctuations
Our quarterly earnings are impacted by the seasonal nature of our medical claims costs and payroll taxes. Typically, medical claims costs tend to increase throughout the year with the fourth quarter being the period with the highest costs, which has a negative impact on our fourth quarter earnings. This trend is primarily the result of many WSEEs’ medical plan deductibles being fully met by the fourth quarter, which increases our liability with respect to those claims. We have also experienced variability on a quarterly basis in medical claims costs based on the unpredictable nature of large claims. Payroll taxes and associated billings are computed based on an employee’s annual taxable wage base. The annual payroll tax wage bases are frequently met in the first two quarters of each year depending on the employee’s compensation levels. As a result, the gross profit contribution from payroll taxes is typically higher in the first two quarters and declines in the latter half of each year. These historical trends may change and other seasonal trends may develop in the future. For further information related to our health insurance costs, please read “—Critical Accounting Policies and Estimates—Benefits Costs.” We believe the effects of inflation have not had a significant impact on our results of operations or financial condition; however, inflationary pressure could adversely impact our profitability in the future.
| | |
QUANTITATIVE AND QUALITATIVE DISCLOSURES
|
Item 7A. Quantitative and Qualitative Disclosures About Market Risk.
We are primarily exposed to market risks from fluctuations in interest rates and the effects of those fluctuations on the market values of our cash equivalent short-term investments and our available-for-sale marketable securities. In addition, borrowings under our Facility bear interest at a variable market rate. As of December 31, 2024, we had outstanding letters of credit and borrowings totaling $370 million under the Facility. Please read Note 6 to the Consolidated Financial Statements, “Long-Term Debt,” for additional information. Our cash equivalent short-term investments consist primarily of overnight investments, which are not significantly exposed to interest rate risk, except to the extent that changes in interest rates will ultimately affect the amount of interest income earned on these investments. Our available-for-sale marketable securities are subject to interest rate risk because these securities generally include a fixed interest rate. As a result, the market values of these securities are affected by changes in prevailing interest rates. We attempt to limit our exposure to interest rate risk primarily through diversification and low investment turnover. Our investment policy is designed to maximize after-tax interest income while preserving our principal investment. As a result, our marketable securities consist of tax-exempt short and intermediate-term debt securities, which are primarily U.S. Treasury bills and our workers’ compensation - deposits consist of cash and highly-liquid investments, primarily money market funds.
Item 8. Financial Statements and Supplementary Data.
| | |
DISCLOSURE CONTROLS AND PROCEDURES
|
Item 9. Changes in and Disagreements with Accountants on Accounting and Financial Disclosure.
None.
Item 9A. Controls and Procedures.
Evaluation of Disclosure Controls and Procedures
In accordance with Exchange Act Rules 13a-15 and 15a-15, we carried out an evaluation, under the supervision and with the participation of management, including our Chief Executive Officer and Chief Financial Officer, of the effectiveness of our disclosure controls and procedures as of the end of the period covered by this report. Based on that evaluation, our Chief Executive Officer and Chief Financial Officer concluded that our disclosure controls and procedures were effective as of December 31, 2024.
Design and Evaluation of Internal Control over Financial Reporting
Pursuant to Section 404 of the Sarbanes-Oxley Act of 2002, we included a report of management’s assessment of the design and effectiveness of our internal controls as part of this Annual Report on Form 10-K for the fiscal year ended December 31, 2024. Ernst & Young LLP, our independent registered public accounting firm, also audited our internal control over financial reporting. Management’s report and the independent registered public accounting firm’s audit report are included in our 2024 Consolidated Financial Statements under the captions entitled “Management’s Report on Internal Control” and “Report of Independent Registered Public Accounting Firm,” and are incorporated herein by reference.
There has been no change in our internal control over financial reporting that occurred during the three months ended December 31, 2024, that has materially affected, or is reasonably likely to materially affect, our internal control over financial reporting.
Item 9B. Other Information.
Trading Plans
During the fourth quarter of 2024, none of our directors or executive officers adopted or terminated a “Rule 10b5-1 trading arrangement” or a “non-Rule 10b5-1 trading arrangement” (as each term is defined in Item 408 of Regulation S-K).
Item 9C. Disclosure Regarding Foreign Jurisdictions that Prevent Inspections.
Not applicable.
| | |
MANAGEMENT AND CERTAIN SECURITY HOLDERS
|
PART III
Item 10. Directors, Executive Officers and Corporate Governance.
Some of the information required by this item is incorporated by reference to the Insperity Proxy Statement.
Code of Business Conduct and Ethics
Our Board adopted our Code of Business Conduct and Ethics (the “Code of Ethics”), which meets the requirements of Rule 303A.10 of the New York Stock Exchange Listed Company Manual and Item 406 of Regulation S-K. You can access our Code of Ethics on the Corporate Governance page of our website at insperity.com. Changes in and waivers to the Code of Ethics for our directors, executive officers and certain senior financial officers will be posted on our website within five business days and maintained for at least 12 months.
Insider Trading
We have adopted a policy on the prevention of insider trading, governing the purchase, sale and other dispositions of our securities by directors, officers, and employees. We believe that our trading policy is reasonably designed to promote compliance with insider trading laws, rules and regulations, and any applicable listing standards. A copy of our policy on the prevention of insider trading is filed as Exhibit 19 to this Form 10-K.
Item 11. Executive Compensation.
The information required by this item is incorporated by reference to the Insperity Proxy Statement.
Item 12. Security Ownership of Certain Beneficial Owners and Management and Related Stockholder Matters.
The information required by this item is incorporated by reference to the Insperity Proxy Statement.
Item 13. Certain Relationships and Related Transactions, and Director Independence.
The information required by this item is incorporated by reference to the Insperity Proxy Statement.
Item 14. Principal Accounting Fees and Services.
The information required by this item is incorporated by reference to the Insperity Proxy Statement.
| | |
EXHIBITS AND FINANCIAL STATEMENT SCHEDULES
|
PART IV
Item 15. Exhibits, Financial Statement Schedules.
| | | | | | | | |
| (a) | 1. | Financial Statements of the Company |
| | |
| | The Consolidated Financial Statements listed by the Registrant on the accompanying Index to Consolidated Financial Statements are filed as part of this Annual Report. |
| | |
| (a) | 2. | Financial Statement Schedules |
| | |
| | Schedules have been omitted since they are not applicable, not required, not material, or the information is included elsewhere herein. |
| | |
| (a) | 3. | List of Exhibits |
| | | | | | | | | | | |
| Exhibit No. | | Exhibit |
| 3.1 | | | |
| 3.2 | | | |
| 4.1 | | | |
| 4.2 | | | |
| 4.3 | | | |
| 4.4 | | | |
| 4.5 | | | |
| 10.1 | † | | |
| 10.2 | † | | |
| 10.3 | † | | |
| 10.4 | † | | |
| 10.5 | † | | |
| 10.6 | † | | |
| 10.7 | † | | |
| | |
EXHIBITS AND FINANCIAL STATEMENT SCHEDULES
|
| | | | | | | | | | | |
| Exhibit No. | | Exhibit |
| 10.8 | † | | |
| 10.9 | † | | |
| 10.10 | † | | |
| 10.11 | † | | |
| 10.12 | † | | |
| 10.13 | † | | |
| 10.14 | *† | | |
| 10.15 | | | |
| 10.16 | | | |
| 10.17 | | | |
| 10.18 | | | |
| 10.19 | | | |
| 10.20 | | | |
| 10.21 | | | |
| 10.22 | | | |
| 10.23 | | | |
| 10.24 | | | |
| 10.25 | † | | |
| 10.26 | † | | |
| 10.27 | (+) | | |
| 10.28 | (+) | | |
| | |
EXHIBITS AND FINANCIAL STATEMENT SCHEDULES
|
| | | | | | | | | | | |
| Exhibit No. | | Exhibit |
| 10.29 | (+) | | |
| 10.30 | (+) | | |
| 10.31 | (+) | | |
| 10.32 | (+) | | |
| 10.33 | (+) | | |
| 10.34 | (+) | | |
| 10.35 | (+) | | |
| 10.36 | (+) | | |
| 10.37 | (+) | | |
| 10.38 | (+) | | |
| 10.39 | (+) | | |
| 10.40 | (+) | | |
| 10.41 | (+) | | |
| 10.42 | *(+) | | |
| | |
EXHIBITS AND FINANCIAL STATEMENT SCHEDULES
|
| | | | | | | | | | | |
| Exhibit No. | | Exhibit |
| 10.43 | | | |
| 10.44 | | | |
| 10.45 | | | |
| 10.46 | | | |
| 10.47 | | | |
| 10.48 | | | |
| 10.49 | | | |
| 19 | * | | |
| 21.1 | * | | |
| 23.1 | * | | |
| 24.1 | * | | |
| 31.1 | * | | |
| 31.2 | * | | |
| 32.1 | ** | | |
| 32.2 | ** | | |
| 97 | | | |
| 101.INS | * | | Inline XBRL Instance Document - the instance document does not appear in the Interactive Data File because its XBRL tags are embedded within the Inline XBRL document. |
| 101.SCH | * | | Inline XBRL Taxonomy Extension Schema Document. |
| 101.CAL | * | | Inline XBRL Taxonomy Extension Calculation Linkbase Document. |
| 101.DEF | * | | Inline XBRL Extension Definition Linkbase Document. |
| 101.LAB | * | | Inline XBRL Taxonomy Extension Label Linkbase Document. |
| 101.PRE | | | Inline XBRL Taxonomy Extension Presentation Linkbase Document. |
| 104 | | | Cover Page Interactive Data File (embedded with the Inline XBRL document). |
| | | |
| * | | Filed herewith. |
| ** | | Furnished with this report. |
| † | | Management contract or compensatory plan or arrangement required to be filed as an exhibit to this Form 10-K. |
| (+) | | Certain portions of the exhibit have been omitted pursuant to an order granting confidential treatment or Item 601(b)(10) of Regulation S-K. The omitted information is (i) not material and (ii) the type of information the Company treats as private or confidential. |
ITEM 16. FORM 10-K SUMMARY.
None.
SIGNATURES
Pursuant to the requirements of Section 13 or 15(d) of the Securities Exchange Act of 1934, Insperity, Inc. has duly caused this report to be signed on its behalf by the undersigned, thereunto duly authorized, on February 10, 2025.
| | | | | | | | |
| | INSPERITY, INC. |
| | | |
| By: | /s/ James D. Allison |
| | | James D. Allison |
| | | Executive Vice President of Finance,
Chief Financial Officer & Treasurer |
| | | (Principal Financial Officer) |
| | |
| By: | /s/ Sean P. Duffy |
| | Sean P. Duffy |
| | Senior Vice President of Finance
and Accounting |
| | (Principal Accounting Officer) |
Pursuant to the requirements of the Securities Exchange Act of 1934, this report has been signed by the following persons on behalf of Insperity, Inc. in the capacities indicated on February 10, 2025:
| | | | | | | | |
| Signature | | Title |
| /s/ Paul J. Sarvadi | | Chairman of the Board, Chief Executive Officer |
| Paul J. Sarvadi | | and Director |
| | (Principal Executive Officer) |
| | |
| /s/ James D. Allison | | Executive Vice President of Finance, |
| James D. Allison | | Chief Financial Officer & Treasurer |
| | (Principal Financial Officer) |
| | |
| /s/ Sean P. Duffy | | Senior Vice President of Finance |
| Sean P. Duffy | | and Accounting |
| | (Principal Accounting Officer) |
| | |
| * | | Director |
| Timothy Clifford | | |
| | |
| * | | Director |
| Eli Jones | | |
| | |
| * | | Director |
| Carol R. Kaufman | | |
| | |
| * | | Director |
| John L. Lumelleau | | |
| | |
| * | | Director |
| Ellen H. Masterson | | |
| | |
| * | | Director |
| Randall Mehl | | |
| | |
| * | | Director |
| John Morphy | | |
| | |
| * | | Director |
| Latha Ramchand | | |
| | |
| * | | Director |
| Richard G. Rawson | | |
| | |
| * | | Director |
| W. Philip Wilmington | | |
| | |
| *By: /s/ Christian P. Callens | | |
| Christian P. Callens, attorney-in-fact | | |
| | |
CONSOLIDATED FINANCIAL STATEMENTS
|
INSPERITY, INC.
INDEX TO CONSOLIDATED FINANCIAL STATEMENTS
| | |
CONSOLIDATED FINANCIAL STATEMENTS
|
REPORT OF INDEPENDENT REGISTERED PUBLIC ACCOUNTING FIRM
To the Stockholders and the Board of Directors of Insperity, Inc.
Opinion on the Financial Statements
We have audited the accompanying consolidated balance sheets of Insperity, Inc. (the Company) as of December 31, 2024 and 2023, the related consolidated statements of income, stockholders' equity, and cash flows for each of the three years in the period ended December 31, 2024, and the related notes (collectively referred to as the “consolidated financial statements”). In our opinion, the consolidated financial statements present fairly, in all material respects, the financial position of the Company at December 31, 2024 and 2023, and the results of its operations and its cash flows for each of the three years in the period ended December 31, 2024, in conformity with U.S. generally accepted accounting principles.
We also have audited, in accordance with the standards of the Public Company Accounting Oversight Board (United States) (PCAOB), the Company's internal control over financial reporting as of December 31, 2024, based on criteria established in Internal Control-Integrated Framework issued by the Committee of Sponsoring Organizations of the Treadway Commission (2013 framework), and our report dated February 10, 2025 expressed an unqualified opinion thereon.
Basis for Opinion
These financial statements are the responsibility of the Company's management. Our responsibility is to express an opinion on the Company’s financial statements based on our audits. We are a public accounting firm registered with the PCAOB and are required to be independent with respect to the Company in accordance with the U.S. federal securities laws and the applicable rules and regulations of the Securities and Exchange Commission and the PCAOB.
We conducted our audits in accordance with the standards of the PCAOB. Those standards require that we plan and perform the audit to obtain reasonable assurance about whether the financial statements are free of material misstatement, whether due to error or fraud. Our audits included performing procedures to assess the risks of material misstatement of the financial statements, whether due to error or fraud, and performing procedures that respond to those risks. Such procedures included examining, on a test basis, evidence regarding the amounts and disclosures in the financial statements. Our audits also included evaluating the accounting principles used and significant estimates made by management, as well as evaluating the overall presentation of the financial statements. We believe that our audits provide a reasonable basis for our opinion.
Critical Audit Matter
The critical audit matter communicated below is a matter arising from the current period audit of the financial statements that was communicated or required to be communicated to the audit committee and that: (1) relates to accounts or disclosures that are material to the financial statements and (2) involved our especially challenging, subjective, or complex judgments. The communication of the critical audit matter does not alter in any way our opinion on the consolidated financial statements, taken as a whole, and we are not, by communicating the critical audit matter below, providing a separate opinion on the critical audit matter or on the account or disclosure to which it relates.
| | |
CONSOLIDATED FINANCIAL STATEMENTS
|
| | | | | |
| Estimation of the Cost of Incurred but Not Reported Health Insurance Claims |
| |
| Description of the Matter | As discussed in Note 1 of the consolidated financial statements under “Health Insurance Costs,” the Company provides the majority of its health insurance coverage to its employees through a fully insured health insurance policy with UnitedHealthcare (“United”). While the policy with United is a fully insured plan, as a result of certain contractual terms, the Company accounts for this plan using a partially self-funded insurance accounting model. Accordingly, the Company records the cost of the United plan, including an estimate of the incurred claims, taxes and administrative fees, as benefits expense, which is a component of Payroll taxes, benefits and workers’ compensation costs in the consolidated statement of income. The estimated incurred but not reported claims under the Company’s United insurance policy are based upon: (i) the level of claims processed during each quarter; (ii) estimated completion rates based upon recent claim development patterns under the plan; and (iii) the number of participants in the plan. Auditing management’s estimate of the cost of incurred but not reported health insurance claims was subjective and judgmental due to the significant estimation required in determining the medical reserve. Estimating incurred but not reported claims is subjective due to the large number of plan participants and the possibility that the number, nature, magnitude, and the timing of processing of current period claims may not be comparable to historical results experienced by the Company. |
| |
| How We Addressed the Matter in Our Audit | We obtained an understanding, evaluated the design and tested the operating effectiveness of controls over the estimation process, including, among others, controls over the completeness and accuracy of the data used to estimate the cost of incurred health insurance claims and the review and approval processes that management has in place for the assumptions applied and the calculation of the cost of incurred health insurance claims. Our audit procedures included, among others, assessing (i) the Company’s health insurance cost estimation methodology, (ii) significant assumptions used to develop the medical completion rates, which includes the incurred but not reported component, (iii) the accuracy and completeness of the claims processed data used in the Company’s computation, as well as (iv) the historical accuracy of management’s estimates of the cost of incurred health insurance claims. Our testing of the medical completion rate assumptions included comparing the completion rate assumptions used by management to the completion rates experienced in historical periods and assessing whether contrary evidence exists with respect to the completion rate assumptions utilized by the Company to estimate the cost of incurred health insurance claims. Furthermore, we involved our actuarial specialists to assist in our evaluation of the Company’s methodology and compared the Company’s estimate to a range developed by our actuarial specialists based on the historical claim data and independently selected assumptions. |
/s/ Ernst & Young LLP
We have served as the Company’s auditor since 1991.
Houston, Texas
February 10, 2025
| | |
CONSOLIDATED FINANCIAL STATEMENTS
|
MANAGEMENT’S REPORT ON INTERNAL CONTROL
The Company has assessed the effectiveness of its internal control over financial reporting as of December 31, 2024, based on criteria established in Internal Control — Integrated Framework issued by the Committee of Sponsoring Organizations of the Treadway Commission (“COSO”) (2013 framework). The Company’s management is responsible for establishing and maintaining adequate internal controls over financial reporting. The effectiveness of the Company’s internal control over financial reporting as of December 31, 2024, has been audited by the Company’s independent registered public accounting firm, as stated in their report that is included herein.
Internal control over financial reporting is a process designed to provide reasonable assurance regarding the reliability of financial reporting and the preparation of financial statements for external purposes in accordance with generally accepted accounting principles. Internal control over financial reporting includes those policies and procedures that: (1) pertain to the maintenance of records that, in reasonable detail, accurately and fairly reflect the transactions and dispositions of the assets of the company; (2) provide reasonable assurance that transactions are recorded as necessary to permit preparation of financial statements in accordance with generally accepted accounting principles, and that receipts and expenditures of the company are being made only in accordance with authorizations of management and directors of the company; and (3) provide reasonable assurance regarding prevention or timely detection of unauthorized acquisition, use, or disposition of the company’s assets that could have a material effect on the financial statements. Because of the inherent limitations, internal control over financial reporting may not prevent or detect misstatements. Also, projections of any evaluation of effectiveness to future periods are subject to the risk that controls may become inadequate because of changes in conditions, or that the degree of compliance with the policies and procedures may deteriorate.
The Company’s assessment of the effectiveness of its internal control over financial reporting included testing and evaluating the design and operating effectiveness of its internal controls. In management’s opinion, the Company has maintained effective internal control over financial reporting as of December 31, 2024, based on criteria established in the COSO 2013 framework.
| | | | | | | | |
| /s/ Paul J. Sarvadi | | /s/ James D. Allison |
| Paul J. Sarvadi | | James D. Allison |
Chairman of the Board &
Chief Executive Officer | | Executive Vice President, Finance,
Chief Financial Officer & Treasurer |
| | |
CONSOLIDATED FINANCIAL STATEMENTS
|
REPORT OF INDEPENDENT REGISTERED PUBLIC ACCOUNTING FIRM
To the Stockholders and the Board of Directors of Insperity, Inc.
Opinion on Internal Control Over Financial Reporting
We have audited Insperity, Inc.’s internal control over financial reporting as of December 31, 2024, based on criteria established in Internal Control—Integrated Framework issued by the Committee of Sponsoring Organizations of the Treadway Commission (2013 framework) (the COSO criteria). In our opinion, Insperity, Inc. (the Company) maintained, in all material respects, effective internal control over financial reporting as of December 31, 2024, based on the COSO criteria.
We also have audited, in accordance with the standards of the Public Company Accounting Oversight Board (United States) (PCAOB), the consolidated balance sheets of the Company as of December 31, 2024 and 2023, the related consolidated statements of income, stockholders’ equity, and cash flows for each of the three years in the period ended December 31, 2024, and the related notes and our report dated February 10, 2025 expressed an unqualified opinion thereon.
Basis for Opinion
The Company’s management is responsible for maintaining effective internal control over financial reporting and for its assessment of the effectiveness of internal control over financial reporting included in the accompanying Management’s Report on Internal Control. Our responsibility is to express an opinion on the Company’s internal control over financial reporting based on our audit. We are a public accounting firm registered with the PCAOB and are required to be independent with respect to the Company in accordance with the U.S. federal securities laws and the applicable rules and regulations of the Securities and Exchange Commission and the PCAOB.
We conducted our audit in accordance with the standards of the PCAOB. Those standards require that we plan and perform the audit to obtain reasonable assurance about whether effective internal control over financial reporting was maintained in all material respects.
Our audit included obtaining an understanding of internal control over financial reporting, assessing the risk that a material weakness exists, testing and evaluating the design and operating effectiveness of internal control based on the assessed risk, and performing such other procedures as we considered necessary in the circumstances. We believe that our audit provides a reasonable basis for our opinion.
Definition and Limitations of Internal Control Over Financial Reporting
A company’s internal control over financial reporting is a process designed to provide reasonable assurance regarding the reliability of financial reporting and the preparation of financial statements for external purposes in accordance with generally accepted accounting principles. A company’s internal control over financial reporting includes those policies and procedures that (1) pertain to the maintenance of records that, in reasonable detail, accurately and fairly reflect the transactions and dispositions of the assets of the company; (2) provide reasonable assurance that transactions are recorded as necessary to permit preparation of financial statements in accordance with generally accepted accounting principles, and that receipts and expenditures of the company are being made only in accordance with authorizations of management and directors of the company; and (3) provide reasonable assurance regarding prevention or timely detection of unauthorized acquisition, use, or disposition of the company’s assets that could have a material effect on the financial statements.
Because of its inherent limitations, internal control over financial reporting may not prevent or detect misstatements. Also, projections of any evaluation of effectiveness to future periods are subject to the risk that controls may become inadequate because of changes in conditions, or that the degree of compliance with the policies or procedures may deteriorate.
/s/ Ernst & Young LLP
Houston, Texas
February 10, 2025
| | |
CONSOLIDATED FINANCIAL STATEMENTS
|
INSPERITY, INC.
CONSOLIDATED BALANCE SHEETS | | | | | | | | | | | |
| (in millions, except per share amounts) | December 31, 2024 | | December 31, 2023 |
| Assets | | | |
| Cash and cash equivalents | $ | 1,039 | | | $ | 693 | |
| Restricted cash | 69 | | | 57 | |
| Marketable securities | 16 | | | 16 | |
| Accounts receivable, net | 829 | | | 694 | |
| Prepaid insurance and related assets | 25 | | | 7 | |
| | | |
| | | |
| Funds held for clients and other current assets | 107 | | | 128 | |
| Total current assets | 2,085 | | | 1,595 | |
| Property and equipment, net of accumulated depreciation | 192 | | | 197 | |
| Right-of-use (“ROU”) leased assets | 65 | | | 57 | |
| Deposits and prepaid health insurance | 195 | | | 215 | |
| Goodwill and other intangible assets, net | 13 | | | 13 | |
| Deferred income taxes, net | 34 | | | 20 | |
| Other assets | 13 | | | 23 | |
| Total assets | $ | 2,597 | | | $ | 2,120 | |
| Liabilities and stockholders' equity | | | |
| Accounts payable | $ | 10 | | | $ | 11 | |
| Payroll taxes and other payroll deductions payable | 901 | | | 566 | |
| Accrued worksite employee payroll costs | 730 | | | 559 | |
| Accrued health insurance costs | 19 | | | 46 | |
| Accrued workers’ compensation costs | 71 | | | 60 | |
| Accrued corporate payroll and commissions | 82 | | | 64 | |
| Client funds liability and other accrued liabilities | 117 | | | 130 | |
| Total current liabilities | 1,930 | | | 1,436 | |
| Accrued workers’ compensation costs, net of current | 135 | | | 163 | |
| Long-term debt | 369 | | | 369 | |
| Operating lease liabilities, net of current | 66 | | | 58 | |
| | | |
| | | |
| Total noncurrent liabilities | 570 | | | 590 | |
| Commitments and contingencies | | | |
| Stockholders' equity: | | | |
Preferred stock ($0.01 per share par value; 20 shares authorized; no shares issued and outstanding) | — | | | — | |
Common stock ($0.01 per share par value; 120 shares authorized; 55.5 shares issued and 37.2 shares and 37.3 shares outstanding, respectively) | 1 | | | 1 | |
| Additional paid-in capital | 222 | | | 185 | |
Treasury stock, at cost (18.3 and 18.2 shares held in treasury, respectively) | (864) | | | (831) | |
| | | |
| Retained earnings | 738 | | | 739 | |
| Total stockholders' equity | 97 | | | 94 | |
| Total liabilities and stockholders’ equity | $ | 2,597 | | | $ | 2,120 | |
See accompanying notes.
| | |
CONSOLIDATED FINANCIAL STATEMENTS
|
INSPERITY, INC.
CONSOLIDATED STATEMENTS OF INCOME | | | | | | | | | | | |
| Year Ended December 31, |
| (in millions, except per share amounts) | 2024 | 2023 | 2022 |
| | | |
| Revenues | $ | 6,581 | | $ | 6,486 | | $ | 5,939 | |
| Payroll taxes, benefits and workers’ compensation costs | 5,529 | | 5,449 | | 4,928 | |
| Gross profit | 1,052 | | 1,037 | | 1,011 | |
| Salaries, wages and payroll taxes | 521 | | 461 | | 431 | |
| Stock-based compensation | 61 | | 53 | | 50 | |
| Commissions | 47 | | 47 | | 46 | |
| Advertising | 38 | | 37 | | 37 | |
| General and administrative expenses | 224 | | 177 | | 156 | |
| Depreciation and amortization | 44 | | 43 | | 41 | |
| Total operating expenses | 935 | | 818 | | 761 | |
| Operating income | 117 | | 219 | | 250 | |
| Other income (expense): | | | |
| Interest income | 37 | | 33 | | 9 | |
| Interest expense | (28) | | (27) | | (14) | |
| Income before income tax expense | 126 | | 225 | | 245 | |
| Income tax expense | 35 | | 54 | | 66 | |
| Net income | $ | 91 | | $ | 171 | | $ | 179 | |
| | | |
| | | |
| | | |
| Net income per share of common stock | | | |
| Basic | $ | 2.44 | | $ | 4.53 | | $ | 4.70 | |
| Diluted | $ | 2.42 | | $ | 4.47 | | $ | 4.64 | |
See accompanying notes.
| | |
CONSOLIDATED FINANCIAL STATEMENTS
|
INSPERITY, INC.
CONSOLIDATED STATEMENTS OF STOCKHOLDERS' EQUITY
| | | | | | | | | | | | | | | | | | | | | |
| Common Stock Issued | Additional Paid-In Capital | Treasury Stock | | Retained Earnings | Total |
| (in millions) | Shares | Amount |
| | | | | | | |
| Balance at December 31, 2021 | 55 | | $ | 1 | | $ | 109 | | $ | (665) | | | $ | 553 | | $ | (2) | |
| Purchase of treasury stock, at cost | — | | — | | — | | (73) | | | — | | (73) | |
| Issuance of equity-based incentive awards and dividend equivalents | — | | — | | (9) | | 10 | | | (1) | | — | |
| Stock-based compensation expense | — | | — | | 49 | | 1 | | | — | | 50 | |
| | | | | | | |
| Other | — | | — | | 2 | | 1 | | | 1 | | 4 | |
| Dividends paid | — | | — | | — | | — | | | (77) | | (77) | |
| | | | | | | |
| Net income | — | | — | | — | | — | | | 179 | | 179 | |
| Balance at December 31, 2022 | 55 | | $ | 1 | | $ | 151 | | $ | (726) | | | $ | 655 | | $ | 81 | |
| Purchase of treasury stock, at cost | — | | — | | — | | (132) | | | — | | (132) | |
| Issuance of equity-based incentive awards and dividend equivalents | — | | — | | (21) | | 25 | | | (4) | | — | |
| Stock-based compensation expense | — | | — | | 53 | | — | | | — | | 53 | |
| | | | | | | |
| Other | — | | — | | 2 | | 2 | | | 1 | | 5 | |
| Dividends paid | — | | — | | — | | — | | | (84) | | (84) | |
| | | | | | | |
| Net income | — | | — | | — | | — | | | 171 | | 171 | |
| Balance at December 31, 2023 | 55 | | $ | 1 | | $ | 185 | | $ | (831) | | | $ | 739 | | $ | 94 | |
| Purchase of treasury stock, at cost | — | | — | | — | | (63) | | | — | | (63) | |
| Issuance of equity-based incentive awards and dividend equivalents | — | | — | | (24) | | 27 | | | (3) | | — | |
| Stock-based compensation expense | — | | — | | 60 | | 1 | | | — | | 61 | |
| | | | | | | |
| Other | — | | — | | 1 | | 2 | | | — | | 3 | |
| Dividends paid | — | | — | | — | | — | | | (89) | | (89) | |
| | | | | | | |
| Net income | — | | — | | — | | — | | | 91 | | 91 | |
| Balance at December 31, 2024 | 55 | | $ | 1 | | $ | 222 | | $ | (864) | | | $ | 738 | | $ | 97 | |
See accompanying notes.
| | |
CONSOLIDATED FINANCIAL STATEMENTS
|
INSPERITY, INC.
CONSOLIDATED STATEMENTS OF CASH FLOWS | | | | | | | | | | | |
| Year Ended December 31, |
| (in millions) | 2024 | 2023 | 2022 |
| | | |
| Cash flows from operating activities | | | |
| Net income | $ | 91 | | $ | 171 | | $ | 179 | |
| Adjustments to reconcile net income to net cash provided by operating activities: | | | |
| Depreciation and amortization | 44 | | 43 | | 41 | |
| Stock-based compensation | 61 | | 53 | | 50 | |
| Deferred income taxes | (14) | | (4) | | (11) | |
| Changes in operating assets and liabilities: | | | |
| Accounts receivable | (135) | | (71) | | (110) | |
| Prepaid insurance and related assets | (18) | | 5 | | — | |
| Other current assets | (8) | | (15) | | (5) | |
| Other assets and ROU assets | 25 | | 23 | | 2 | |
| Accounts payable | (1) | | 3 | | 2 | |
| Payroll taxes and other payroll deductions payable | 335 | | 10 | | 88 | |
| Accrued worksite employee payroll costs | 171 | | 46 | | 104 | |
| Accrued health insurance costs | (27) | | (7) | | 3 | |
| Accrued workers’ compensation costs | (17) | | (10) | | (10) | |
| Accrued corporate payroll, commissions and other accrued liabilities | (2) | | (45) | | (5) | |
| Income taxes payable/receivable | 15 | | (4) | | 19 | |
| Total adjustments | 429 | | 27 | | 168 | |
| Net cash provided by operating activities | 520 | | 198 | | 347 | |
| | | |
| Cash flows from investing activities | | | |
| Marketable securities: | | | |
| Purchases | (23) | | (48) | | (47) | |
| Proceeds from maturities | 23 | | 38 | | 45 | |
| Proceeds from dispositions | — | | 28 | | — | |
| Property and equipment purchases | (38) | | (40) | | (30) | |
| Net cash used in investing activities | (38) | | (22) | | (32) | |
| | | |
| Cash flows from financing activities | | | |
| Purchase of treasury stock | (63) | | (131) | | (73) | |
| Dividends paid | (89) | | (84) | | (77) | |
| | | |
| Client funds liability and other | (21) | | 60 | | 9 | |
| Net cash used in financing activities | (173) | | (155) | | (141) | |
| Net increase in cash, cash equivalents, restricted cash, funds held for clients, and deposits – workers’ compensation | 309 | | 21 | | 174 | |
| Cash, cash equivalents, restricted cash, funds held for clients, and deposits – workers’ compensation beginning of year | 1,035 | | 1,014 | | 840 | |
| Cash, cash equivalents, restricted cash, funds held for clients, and deposits – workers’ compensation end of year | $ | 1,344 | | $ | 1,035 | | $ | 1,014 | |
See accompanying notes.
| | |
CONSOLIDATED FINANCIAL STATEMENTS
|
INSPERITY, INC.
CONSOLIDATED STATEMENTS OF CASH FLOWS (Continued)
| | | | | | | | | | | |
| Year Ended December 31, |
| (in millions) | 2024 | 2023 | 2022 |
| | | |
| Supplemental cash flow information: | | | |
| Income taxes, net | $ | 33 | | $ | 63 | | $ | 57 | |
| Cash paid for interest | 32 | | 22 | | 13 | |
| ROU assets obtained in exchange for lease obligations | 29 | | 22 | | 10 | |
| | | |
See accompanying notes.
| | |
NOTES TO CONSOLIDATED FINANCIAL STATEMENTS
|
Description of Business
Insperity, Inc. (“Insperity” or “we”, “our”, and “us”) provides an array of human resources (“HR”) and business solutions designed to help improve business performance. Since our formation in 1986, we have evolved from being solely a professional employer organization (“PEO”), an industry we pioneered, to our current position as a comprehensive business performance solutions provider. We were organized as a corporation in 1986 and have provided PEO services since inception.
Our most comprehensive HR services offerings are provided through our Workforce Optimization® and Workforce SynchronizationTM solutions (together, our “PEO HR Outsourcing Solutions”), which encompass a broad range of human resources functions, including payroll and employment administration, employee benefits, workers’ compensation, government compliance, performance management and training and development services, along with our cloud-based human capital management platform solution, the Insperity PremierTM platform.
In addition to our PEO HR Outsourcing Solutions, we offer a comprehensive traditional payroll and human capital management solution, known as our Workforce AccelerationTM solution (our “Traditional Payroll Solution”). We also offer a number of other business performance solutions, including Recruiting Services, Employment Screening, Retirement Services, and Insurance Services. These other products and services generally are offered only with our other solutions.
We provide our PEO HR Outsourcing Solutions by entering into a co-employment relationship with our clients, under which Insperity and its clients each take responsibility for certain portions of the employer-employee relationship. Insperity and its clients designate each party’s responsibilities through its Client Service Agreement (“CSA”), under which Insperity becomes an employer of the employees who work at the client’s location (“WSEE”) for most administrative and regulatory purposes.
As a co-employer of our WSEEs, we assume many of the rights and obligations associated with being an employer. We enter into an employment agreement with each WSEE, thereby maintaining a variety of employer rights, including the right to hire or terminate employees, the right to evaluate employee qualifications or performance, and the right to establish employee compensation levels. Typically, Insperity only exercises these rights in consultation with its clients or when necessary to ensure regulatory compliance. The responsibilities associated with our role as employer include the following obligations with regard to our WSEEs: (1) to compensate our WSEEs through wages and salaries; (2) to pay the employer portion of payroll-related taxes; (3) to withhold and remit (where applicable) the employee portion of payroll-related taxes; (4) to provide employee benefit programs; and (5) to provide workers’ compensation insurance coverage.
In addition to our assumption of employer status for our WSEEs, our PEO HR Outsourcing Solutions also includes other human resources functions for our clients to support the effective and efficient use of personnel in their business operations. To provide these functions, we maintain a significant staff of professionals trained in a wide variety of HR functions, including employee training, employee recruiting, employee performance management, employee compensation and employer liability management. These professionals interact and consult with clients on a daily basis to help identify each client’s service requirements and to ensure that we are providing appropriate and timely human capital management services.
Revenue and Direct Cost Recognition
We enter into contracts with our customers for human resources services based on a stated rate and price in the contract. Our contracts generally establish pricing for a period of 12 months and are generally cancellable at any time by either party with 30-days’ notice. Our performance obligations are satisfied as services are rendered each month. The term between invoicing and when our performance obligations are satisfied is not significant. Our payment terms typically require payment concurrently with the invoicing of our PEO services. We do not have significant financing components or significant payment terms.
Our revenue is generally recognized ratably over the payroll period as WSEEs perform their service at the client worksite in accordance with Accounting Standards Codification (“ASC”) 606, Revenue from Contracts with Customers. Customers are invoiced concurrently with each periodic payroll of its WSEEs. Revenues that have been recognized but not invoiced
| | |
| NOTES TO CONSOLIDATED FINANCIAL STATEMENTS |
represent unbilled accounts receivable of $810 million and $669 million at December 31, 2024 and December 31, 2023, respectively, and are included in accounts receivable, net on our Consolidated Balance Sheets.
Pursuant to the “practical expedients” provided under ASC 340-40, Other Assets and Deferred Costs - Contracts with Customers, we expense sales commissions when incurred because the terms of our contracts are cancellable by either party with a 30-day notice. These costs are recorded in commissions in our Consolidated Statements of Income.
Our revenue for our PEO HR Outsourcing Solutions by geographic region and for our other products and services offerings are as follows:
| | | | | | | | | | | |
| Year Ended December 31, |
| (in millions) | 2024 | 2023 | 2022 |
| | | |
| Northeast | $ | 1,801 | | $ | 1,757 | | $ | 1,625 | |
| Southeast | 926 | | 907 | | 796 | |
| Central | 1,195 | | 1,170 | | 1,045 | |
| Southwest | 1,245 | | 1,250 | | 1,163 | |
| West | 1,344 | | 1,337 | | 1,251 | |
| 6,511 | | 6,421 | | 5,880 | |
| Other revenue | 70 | | 65 | | 59 | |
| Total revenue | $ | 6,581 | | $ | 6,486 | | $ | 5,939 | |
Our PEO HR Outsourcing Solutions revenues are primarily derived from our gross billings, which are based on (1) the payroll cost of our WSEEs; and (2) a markup computed as a percentage of the payroll cost. The gross billings are invoiced concurrently with each periodic payroll of our WSEEs. Revenues, which exclude the payroll cost component of gross billings and therefore consist solely of the markup, are recognized ratably over the payroll period as WSEEs perform their service at the client worksite.
In determining the pricing of the markup component of our gross billings, we take into consideration our estimates of the costs directly associated with our WSEEs, including payroll taxes, benefits and workers’ compensation costs, plus an acceptable gross profit margin. As a result, our operating results are significantly impacted by our ability to accurately estimate our direct costs relative to the revenues derived from the markup component of our gross billings.
Revenues are comprised of gross billings less WSEE payroll costs as follows:
| | | | | | | | | | | |
| Year Ended December 31, |
| (in millions) | 2024 | 2023 | 2022 |
| | | |
| Gross billings | $ | 43,752 | | $ | 43,141 | | $ | 40,127 | |
| Less: WSEE payroll cost | 37,171 | | 36,655 | | 34,188 | |
| Revenues | $ | 6,581 | | $ | 6,486 | | $ | 5,939 | |
Consistent with our revenue recognition policy, our direct costs do not include the payroll cost of our WSEEs. Our direct costs associated with our revenue generating activities are primarily comprised of all other costs related to our WSEEs, such as the employer portion of payroll-related taxes, employee benefit plan premiums and workers’ compensation insurance costs.
Segment Reporting
ASC 280, Segment Reporting establishes standards for reporting information about operating segments on a basis consistent with our internal organizational structure as well as information about geographical areas and business segments. We use the management approach to determine reportable operating segments. The management approach considers the internal organization and reporting used by our chief operating decision maker (“CODM”) for making decisions, allocating resources and assessing performance.
| | |
| NOTES TO CONSOLIDATED FINANCIAL STATEMENTS |
Our CODM has been identified as our chief executive officer, who reviews results when making decisions about allocating resources and assessing performance, in addition to considering our geographical footprint, which is based in the United States, and the management of our business activities, which is done on a consolidated basis. Based on management’s assessment, we determined that we have only one operating segment and therefore one reportable segment, HR Solutions, as defined by ASC 280.
The HR Solutions segment derives revenue from customers by providing various human resource services through professional service contracts. The accounting policies of the HR Solutions segment are the same as those described in the summary of significant accounting policies. The measure of segment assets is reported on our Consolidated Balance Sheets as total assets, and the CODM assesses performance and decides how to allocate resources based on net income as reported on our Consolidated Statements of Income.
The CODM reviews revenues and expenses at the consolidated level as disclosed in our Consolidated Statements of Income and uses net income to evaluate income generated from segment assets (return on assets) in deciding whether to reinvest profits into our HR Solutions segment or into other areas of the entity, such as for acquisitions or to pay dividends. Net income is also used to monitor budget versus actual results and in competitive analysis by benchmarking to our competitors. The competitive analysis and the monitoring of budgeted versus actual results are used in assessing the segment’s performance and in establishing management’s compensation.
Since we have only one operating segment, we do not have intra-segment sales or transfers.
Principles of Consolidation
The Consolidated Financial Statements include the accounts of Insperity, Inc. and its wholly owned subsidiaries. Intercompany accounts and transactions have been eliminated in consolidation.
Use of Estimates
The preparation of financial statements in conformity with United States Generally Accepted Accounting Principles (“GAAP”) requires management to make estimates and assumptions that affect the amounts reported in the financial statements and accompanying notes. Actual results could differ from those estimates.
Concentrations of Credit Risk
Financial instruments that could potentially subject us to concentration of credit risk include accounts receivable and marketable securities.
Cash, Cash Equivalents and Marketable Securities
We invest our excess cash in federal government and municipal-based money market funds. All highly liquid investments with original maturities of three months or less from date of purchase are classified as cash equivalents. Liquid investments with original maturities of greater than three months from the date of purchase are classified as marketable securities in current assets.
We account for marketable securities in accordance with ASC 320, Investments — Debt and Equity Securities. We determine the appropriate classification of all marketable securities as held-to-maturity, available-for-sale or trading at the time of purchase, and re-evaluate such classification as of each balance sheet date. At December 31, 2024 and 2023, all of our investments in marketable securities were classified as available-for-sale, and as a result, were reported at fair value. The amortized cost of debt securities is adjusted for amortization of premiums and accretion of discounts from the date of purchase to maturity. Such amortization is included in interest income as an addition to or deduction from the coupon interest earned on the investments. We use the specific identification method of determining the cost basis in computing realized gains and losses on the sale of our available-for-sale securities. Realized gains and losses are included in other income.
Property and Equipment
Property and equipment are recorded at cost and are depreciated over the estimated useful lives of the related assets using the straight-line method.
Property and equipment, net consisted of the following:
| | |
| NOTES TO CONSOLIDATED FINANCIAL STATEMENTS |
| | | | | | | | |
| (in millions) | December 31, 2024 | December 31, 2023 |
| | |
| Land | $ | 6 | | $ | 6 | |
| Buildings and improvements | 225 | | 217 | |
| Computer hardware and software | 145 | | 145 | |
| Software development costs | 149 | | 137 | |
| Furniture, fixtures and other | 56 | | 53 | |
| | |
| Property and equipment, gross | 581 | | 558 | |
| Accumulated depreciation and amortization | (389) | | (361) | |
| Property and equipment, net | $ | 192 | | $ | 197 | |
The estimated useful lives of property and equipment for purposes of computing depreciation are as follows:
| | | | | | | | | | | | | | |
| Useful Life |
| | | | |
| Buildings and improvements | 4 | — | 30 | years |
| Computer hardware and software | 2 | — | 5 | years |
| Software development costs | 3 | — | 5 | years |
| Furniture, fixtures and other | 5 | — | 7 | years |
Software development costs relate primarily to software code development, systems integration and testing of our proprietary professional employer information systems and are accounted for in accordance with ASC 350-40, Internal Use Software. Capitalized software development costs are amortized using the straight-line method over the estimated useful lives of the software, generally three years. We recognized $13 million, $14 million and $13 million in amortization of capitalized software development costs in 2024, 2023 and 2022, respectively. Unamortized software development costs were $32 million and $33 million at December 31, 2024 and 2023, respectively.
We periodically evaluate our long-lived assets for impairment in accordance with ASC 360-10, Property, Plant, and Equipment. ASC 360-10 requires that an impairment loss be recognized for assets to be disposed of or held-for-use when the carrying amount of an asset is deemed to not be recoverable. If events or circumstances were to indicate that any of our long-lived assets might be impaired, we would assess recoverability based on the estimated undiscounted future cash flows to be generated from the applicable asset or asset group. In addition, we may record an impairment loss to the extent that the carrying value of the asset exceeded the fair value of the asset. Fair value is generally determined using an estimate of discounted future net cash flows from operating activities or upon disposal of the asset.
Cloud Computing Arrangements
We incur costs to implement cloud computing arrangements that are hosted by third-party vendors. SaaS implementation costs associated with cloud computing arrangements are capitalized when incurred during the application development phase. The capitalized costs are recorded in our short-term and long-term other assets on our Consolidated Balance Sheets. Amortization is calculated on a straight-line basis over the contractual term of the cloud computing arrangement, typically a one to five year period. We recognized $11 million, $6 million, and $2 million in amortization of SaaS implementation costs in 2024, 2023, and 2022, respectively. These costs are recorded in general and administrative expenses in our Consolidated Statements of Income. Unamortized SaaS implementation costs were $16 million and $24 million at December 31, 2024 and 2023, respectively.
Leases
We determine if an arrangement is a lease at inception of a contract in accordance with ASC 842, Leases, as well as the Financial Accounting Standards Board (“FASB”) issued Accounting Standards Updates clarifying the lease guidance. ROU assets represent our right to use an underlying asset for the lease term and lease liabilities represent our obligation to make lease payments arising from the lease. ROU assets and lease liabilities are recognized at the lease commencement date based on the present value of lease payments over the lease term. As most of our leases do not provide an implicit interest rate, we use our incremental borrowing rate based on the information available at commencement date in determining the present value of lease payments. The lease terms used to calculate the ROU asset and related lease liability include options to extend or terminate the lease when it is reasonably certain that we will exercise that option.
| | |
| NOTES TO CONSOLIDATED FINANCIAL STATEMENTS |
Lease expense for operating leases is recognized on a straight-line basis over the lease term as an operating expense. We have lease agreements which require payments for lease and non-lease components and have elected to account for these as a single lease component related to our other operating facilities. Please read Note 11, “Leases,” for additional information. Leases with an initial term of 12 months or less are not recorded on the balance sheet; instead, lease payments are recognized as lease expense on a straight-line basis over the lease term.
Goodwill and Other Intangible Assets
Our goodwill is not amortized, but is tested for impairment on an annual basis or when there is an indication that there has been a potential decline in the fair value of a reporting unit. Annually, we perform a qualitative analysis to determine if it is more likely than not that the fair value has declined below its carrying value. This analysis considers various qualitative factors. Due to the nature of our business, all of our goodwill is associated with one reporting unit. We perform our annual impairment testing during the fourth quarter. Based on the results of our analysis, no impairment loss was recognized in 2024, 2023 or 2022.
Health Insurance Costs
We provide group health insurance coverage under a single-employer plan that covers both our WSEEs in our PEO HR Outsourcing Solutions and our corporate employees and utilizes a national network of carriers, including UnitedHealthcare (“United”), UnitedHealthcare of California, Kaiser Permanente, Blue Shield of California, HMSA BlueCross BlueShield of Hawaii, and Harvard Pilgrim Health Care, formerly known as Tufts, all of which provide fully insured policies or service contracts.
Approximately 86% of our costs related to health insurance coverage are provided under our policy with United. While the policy with United is a fully insured plan, as a result of certain contractual terms, we have accounted for this plan since its inception using a partially self-funded insurance accounting model. Effective January 1, 2020, under the amended agreement with United, we no longer have financial responsibilities for a participant’s annual claim costs that exceed $1 million (“Individual Claims Limit”). Accordingly, we record the cost of the United plan, including an estimate of the incurred claims, taxes and administrative fees (collectively the “Plan Costs”), as benefits expense, which is a component of direct costs, in our Consolidated Statements of Income. The estimated incurred but not reported claims are based upon: (1) the level of claims processed during each quarter; (2) estimated completion rates based upon recent claim development patterns under the plan; and (3) the number of participants in the plan, including both active and COBRA enrollees. Each reporting period, changes in the estimated ultimate costs resulting from claim trends, plan design and migration, participant demographics, and other factors are incorporated into the benefits costs, which requires a significant level of judgment.
Additionally, since the plan’s inception, under the terms of the contract, United establishes cash funding rates 90 days in advance of the beginning of a reporting quarter. If the Plan Costs for a reporting quarter are greater than the premiums paid and owed to United, a deficit in the plan would be incurred and a liability for the excess costs would be accrued in our Consolidated Balance Sheets. On the other hand, if the Plan Costs for the reporting quarter are less than the premiums paid and owed to United, a surplus in the plan would be incurred and we would record an asset for the excess premiums in our Consolidated Balance Sheets. The terms of the arrangement require us to maintain an accumulated cash surplus in the plan of $9 million, which is reported as long-term prepaid health insurance. In addition, United requires a deposit equal to approximately one day of claims funding activity, which was $7 million at December 31, 2024, and is included in deposits - health insurance as a long-term asset on our Consolidated Balance Sheets. As of December 31, 2024, Plan Costs were more than the net premiums paid and owed to United by $5 million. As this amount is less than the agreed-upon $9 million surplus maintenance level, the $14 million difference is included in accrued health insurance costs, a current liability, in our Consolidated Balance Sheets. The premiums, including the additional quarterly premiums, owed to United at December 31, 2024 were less than $1 million, which is included in accrued health insurance costs, a current liability in our Consolidated Balance Sheets. Our benefits costs incurred in 2024 included a decrease of $29 million for changes in estimated run-off related to prior periods, net of Individual Claims Limit. Our benefits costs incurred in 2023 included a decrease of $13 million for changes in estimated run-off related to prior periods, net of Individual Claims Limit.
Workers’ Compensation Costs
Our workers’ compensation coverage for our WSEEs in our PEO HR Outsourcing Solutions has been provided through arrangements with the Chubb Group of Insurance Companies or its predecessors (the “Chubb Program”) since 2007. The
| | |
| NOTES TO CONSOLIDATED FINANCIAL STATEMENTS |
Chubb Program is fully insured in that Chubb has the responsibility to pay all claims incurred under the policy regardless of whether we satisfy our responsibilities. Under the Chubb Program, for claims incurred on or before September 30, 2019, we have financial responsibility to Chubb for the first $1 million layer of claims per occurrence and, for claims over $1 million, up to a maximum aggregate amount of $6 million per policy year for claims that exceed $1 million. Chubb bears the financial responsibility for all claims in excess of these levels. Effective for claims incurred on or after October 1, 2019, we have financial responsibility to Chubb for the first $1.5 million layer of claims per occurrence and, for claims over $1.5 million, up to a maximum aggregate amount of $6 million per policy year for claims that exceed $1.5 million.
Because we bear the financial responsibility for claims up to the levels noted above, such claims, which are the primary component of our workers’ compensation costs, are recorded in the period incurred. Workers’ compensation insurance includes ongoing health care and indemnity coverage whereby claims are paid over numerous years following the date of injury. Accordingly, the accrual of related incurred costs in each reporting period includes estimates, which take into account the ongoing development of claims and therefore requires a significant level of judgment.
We utilize a third-party actuary to estimate our loss development rate, which is primarily based upon the nature of WSEEs’ job responsibilities, the location of WSEEs, the historical frequency and severity of workers’ compensation claims, and an estimate of future cost trends. Each reporting period, changes in the actuarial assumptions resulting from changes in actual claims experience and other trends are incorporated into our workers’ compensation claims cost estimates. During the year ended December 31, 2024 and 2023, we reduced accrued workers’ compensation costs by $32 million and $33 million, respectively, for changes in estimated losses related to prior periods. Workers’ compensation cost estimates are discounted to present value at a rate based upon the U.S. Treasury rates that correspond with the weighted average estimated claim payout period (the average discount rate utilized was 4.3% in both 2024 and 2023) and are accreted over the estimated claim payment period and included as a component of direct costs in our Consolidated Statements of Income.
The following table provides the activity and balances related to incurred but not paid workers’ compensation claims:
| | | | | | | | | | | |
| Year Ended December 31, |
| (in millions) | 2024 | | 2023 |
| | | |
| Beginning balance, January 1, | $ | 220 | | | $ | 229 | |
| Accrued claims, net | 65 | | | 61 | |
| Present value discount, net of accretion | (12) | | | (13) | |
| Paid claims | (69) | | | (57) | |
| Ending balance | $ | 204 | | | $ | 220 | |
| | | |
| Current portion of accrued claims | $ | 69 | | | $ | 57 | |
| Long-term portion of accrued claims | 135 | | | 163 | |
| Total accrued claims | $ | 204 | | | $ | 220 | |
The current portion of accrued workers’ compensation costs on our Consolidated Balance Sheets at December 31, 2024 and 2023 includes $2 million and $3 million, respectively, of workers’ compensation administrative fees.
The undiscounted accrued workers’ compensation costs were $240 million as of December 31, 2024 and $250 million as of December 31, 2023.
At the beginning of each policy period, the workers’ compensation insurance carrier establishes monthly funding requirements comprised of premium costs and funds to be set aside for payment of future claims (“claim funds”). The level of claim funds is primarily based upon anticipated WSEE payroll levels and expected workers’ compensation loss rates, as determined by the insurance carrier. Monies funded into the program for incurred claims expected to be paid within one year are primarily held as cash and money market funds (cash equivalents) and are recorded as restricted cash, a short-term asset, while the remainder of claim funds are included in deposits – workers’ compensation, a long-term asset in our Consolidated Balance Sheets. During 2024, we received $39 million for the return of excess claim funds related to the workers’ compensation program, which resulted in a decrease to deposits - workers’ compensation. At December 31, 2024, we had restricted cash of $69 million and deposits – workers’ compensation of $178 million, of which $241 million was held in trust bank accounts.
| | |
| NOTES TO CONSOLIDATED FINANCIAL STATEMENTS |
Our estimate of incurred claim costs expected to be paid within one year is included in short-term liabilities, while our estimate of incurred claim costs expected to be paid beyond one year is included in long-term liabilities on our Consolidated Balance Sheets.
Stock-Based Compensation
At December 31, 2024, we have one stock-based employee compensation plan under which we may issue awards. We account for this plan under the recognition and measurement principles of ASC 718, Compensation — Stock Compensation, which requires all share-based payments to employees to be recognized in the income statement based on their fair values.
We generally make annual grants of unrestricted stock under our stock-based incentive compensation plan to our non-employee directors, and grants of restricted stock units to our officers and certain other employees. Restricted stock unit grants to officers and other employees generally vest over a period of three years from the date of grant. Restricted stock units are valued based on the fair value on date of grant and the associated expense, net of estimated forfeitures, is recognized over the requisite service period. Stock grants issued to non-employee directors are 100% vested on the grant date. All shares are issued out of treasury.
Our Insperity Long-Term Incentive Program (the “LTIP”) provides for performance based long-term compensation awards in the form of performance units to certain employees based on the achievement of pre-established performance goals. Each performance unit represents the right to receive one common share at a future date based on our performance against certain targets. Performance units have a vesting schedule of three years. A portion of the LTIP grant to employees was considered a market-based performance award that cliff vests at the end of three years assuming continued employment and achievement of market-based performance goals. The fair value of each performance unit is the market price of our common stock on the date of grant. The fair value of each market-based performance unit was determined through use of the Monte Carlo simulation method. The compensation expense for such awards is recognized on a straight-line basis over the vesting term. Over the performance period the number of shares expected to be issued is adjusted upward or downward based on the probability of achievement of the performance target.
Company-Sponsored 401(k) Retirement Plans
Under our 401(k) retirement plan for corporate employees (the “Corporate Plan”), we matched 100% of eligible corporate employees’ contributions, up to 6% of the employees’ eligible compensation in 2024, 2023, and 2022. Matching contributions under the Corporate Plan are immediately vested. During 2024, 2023 and 2022, we made matching contributions on behalf of corporate employees to the Corporate Plan of $19 million, $17 million, and $14 million, respectively, and are included in salaries, wages and payroll taxes in our Consolidated Statements of Income.
Under our separate 401(k) retirement plan for WSEEs (the “Worksite Employee Plan”), the match percentage for WSEEs ranges from 0% to 6%, as determined by each client company. Matching contributions under the Worksite Employee Plan are immediately vested. During 2024, 2023 and 2022, we made matching contributions on behalf of WSEEs to the Worksite Employee Plan of $390 million, $375 million, and $329 million, respectively.
Advertising
We expense all advertising costs as incurred.
Income Taxes
We use the liability method in accounting for income taxes. Under this method, deferred tax assets and liabilities are determined based on differences between financial reporting and income tax carrying amounts of assets and liabilities and are measured using the enacted tax rates and laws in effect when the differences are expected to reverse. Please read Note 7, “Income Taxes,” for additional information. Recent Accounting Pronouncements
In December 2023, the FASB issued Accounting Standards Update (“ASU”) No. 2023-09, Income Taxes (Topic 740): Improvements to Income Tax Disclosures. ASU 2023-09 expands the disclosure requirements for income taxes, specifically related to the rate reconciliation and income taxes paid. ASU 2023-09 is effective for fiscal years beginning
| | |
| NOTES TO CONSOLIDATED FINANCIAL STATEMENTS |
after December 15, 2024, with early adoption permitted. We are currently evaluating the guidance, but do not expect this ASU to materially impact our Consolidated Financial Statements.
In November 2024, the FASB issued ASU No. 2024-03, Disaggregation of Income Statement Expenses. ASU 2024-03 requires public companies to disaggregate key expense categories such as employee compensation and depreciation in their financial statements. ASU 2024-03 is effective for fiscal years beginning after December 15, 2026, and interim periods within fiscal years beginning after December 15, 2027, with early adoption permitted. We are currently evaluating the guidance, but do not expect this ASU to materially impact our Consolidated Financial Statements.
| | | | | |
| 2. | Other Balance Sheet Information |
Cash, Cash Equivalents and Marketable Securities
The following table summarizes our cash and investments in cash equivalents and marketable securities held by investment managers and overnight investments:
| | | | | | | | | | | | | | | | | | | | | | | |
| December 31, 2024 | | December 31, 2023 |
| (in millions) | Cash & Cash Equivalents | Marketable Securities | Total | | Cash & Cash Equivalents | Marketable Securities | Total |
| | | | | | | |
| Overnight holdings | $ | 931 | | $ | — | | $ | 931 | | | $ | 611 | | $ | — | | $ | 611 | |
| Investment holdings | 117 | | 16 | | 133 | | | 119 | | 16 | | 135 | |
| 1,048 | | 16 | | 1,064 | | | 730 | | 16 | | 746 | |
| Cash in demand accounts | 27 | | — | | 27 | | | 27 | | — | | 27 | |
| Outstanding checks | (36) | | — | | (36) | | | (64) | | — | | (64) | |
| Total | $ | 1,039 | | $ | 16 | | $ | 1,055 | | | $ | 693 | | $ | 16 | | $ | 709 | |
Our cash and overnight holdings fluctuate based on the timing of clients’ payroll processing cycles. Our cash, cash equivalents and marketable securities at December 31, 2024 and December 31, 2023 included $830 million and $510 million, respectively, of funds associated with federal and state income tax withholdings, employment taxes, and other payroll deductions, as well as $91 million and $28 million, respectively, in client prepayments. At December 31, 2024 included in our $830 million of funds associated with federal and state income tax withholdings was $440 million of funds we received in late December 2024 from the Internal Revenue Service related to employee retention tax credits claimed by our PEO clients under the COVID relief programs, that are expected to be distributed to clients in early 2025.
| | |
| NOTES TO CONSOLIDATED FINANCIAL STATEMENTS |
Cash, Cash Equivalents, Restricted Cash, Funds Held for Clients, and Deposits – Workers’ Compensation
The following table summarizes our cash, cash equivalents, restricted cash, funds held for clients, and deposits – workers’ compensation as reported in our Consolidated Statements of Cash Flows:
| | | | | | | | | | | | | | | | | | | | |
| Year Ended December 31, | |
| (in millions) | 2024 | | 2023 | | 2022 | |
| | | | | | |
| Supplemental schedule of cash and cash equivalents, restricted cash, funds held for clients, and deposits – workers’ compensation | |
| Cash and cash equivalents | $ | 693 | | | $ | 733 | | | $ | 576 | | |
| Restricted cash | 57 | | | 50 | | | 47 | | |
Other current assets - funds held for clients(1) | 87 | | | 35 | | | 32 | | |
| Deposits – workers’ compensation | 198 | | | 196 | | | 185 | | |
| Cash, cash equivalents, restricted cash, funds held for clients, and deposits – workers’ compensation beginning of year | $ | 1,035 | | | $ | 1,014 | | | $ | 840 | | |
| | | | | | |
| Cash and cash equivalents | $ | 1,039 | | | $ | 693 | | | $ | 733 | | |
| Restricted cash | 69 | | | 57 | | | 50 | | |
Other current assets - funds held for clients(1) | 58 | | | 87 | | | 35 | | |
| Deposits – workers’ compensation | 178 | | | 198 | | | 196 | | |
| Cash, cash equivalents, restricted cash, funds held for clients, and , and deposits – workers’ compensation end of year | $ | 1,344 | | | $ | 1,035 | | | $ | 1,014 | | |
____________________________________(1)Funds held for clients represent amounts held on behalf of our Traditional Payroll Solution customers that are restricted for the purpose of satisfying obligations to remit funds to clients’ employees and various tax authorities.
Please read Note 1. “Accounting Policies,” for a discussion of our accounting policies for deposits — workers’ compensation and restricted cash. Payroll Taxes and Other Payroll Deductions Payable
As a co-employer, we generally assume responsibility for the withholding and remittance of federal and state payroll taxes and other payroll deductions with respect to wages and salaries paid to our WSEEs. As of December 31, 2024 and December 31, 2023, payroll taxes and other payroll deductions payable were $901 million and $566 million, respectively. The balance at December 31, 2024 includes $440 million of funds we received in late December 2024 from the Internal Revenue Service related to employee retention tax credits claimed by our PEO clients under the COVID relief programs, that are expected to be distributed to clients in early 2025.
| | | | | |
| 3. | Fair Value Measurements |
We account for our financial assets in accordance with ASC 820, Fair Value Measurement. This standard defines fair value, establishes a framework for measuring fair value and expands disclosures about fair value measurements. The fair value measurement disclosures are grouped into three levels based on valuation factors:
•Level 1 - quoted prices in active markets using identical assets
•Level 2 - significant other observable inputs, such as quoted prices for similar assets or liabilities, quoted prices in markets that are not active, or other observable inputs
•Level 3 - significant unobservable inputs
| | |
| NOTES TO CONSOLIDATED FINANCIAL STATEMENTS |
Fair Value of Instruments Measured and Recognized at Fair Value
The following table summarizes the levels of fair value measurements of our financial assets:
| | | | | | | | | | | | | | | | | | | | | | | |
| December 31, 2024 | | December 31, 2023 |
| (in millions) | Total | Level 1 | Level 2 | | Total | Level 1 | Level 2 |
| | | | | | | |
| Money market funds | $ | 1,048 | | $ | 1,048 | | $ | — | | | $ | 730 | | $ | 730 | | $ | — | |
| U.S. Treasury bills | 16 | | 16 | | — | | | 16 | | 16 | | — | |
| | | | | | | |
| 1,064 | | 1,064 | | — | | | 746 | | 746 | | — | |
| Deposits - money market funds | 241 | | 241 | | — | | | 22 | | 22 | | — | |
| Total | $ | 1,305 | | $ | 1,305 | | $ | — | | | $ | 768 | | $ | 768 | | $ | — | |
During 2024, we transferred $158 million of claim funds previously held with Chubb to a trust account and those funds were subsequently invested in money market funds. Both before and after the transfer, these funds were included in restricted cash and deposits - workers’ compensation on our Consolidated Balance Sheet.
Our valuation techniques used to measure fair value for these securities during the period consisted primarily of third-party pricing services that utilized actual market data such as trades of comparable bond issues, broker/dealer quotations for the same or similar investments in active markets and other observable inputs.
The following is a summary of our available-for-sale marketable securities:
| | | | | | | | | | | | | | |
| (in millions) | Amortized Cost | Gross Unrealized Gains | Gross Unrealized Losses | Estimated Fair Value |
| | | | |
| December 31, 2024 | | | | |
| U.S. Treasury bills | $ | 16 | | $ | — | | $ | — | | $ | 16 | |
| | | | |
| | | | |
| December 31, 2023 | | | | |
| U.S. Treasury bills | $ | 16 | | $ | — | | $ | — | | $ | 16 | |
| | | | |
As of December 31, 2024, the contractual maturities of all marketable securities in our portfolio were less than one year.
Fair Value of Other Financial Instruments
The carrying amounts of cash, cash equivalents, restricted cash, accounts receivable, deposits and accounts payable approximate their fair values due to the short-term maturities of these instruments.
As of December 31, 2024, the carrying value of borrowings under our revolving credit facility approximates fair value and was classified as Level 2 in the fair value hierarchy. Please read Note 6, “Long-Term Debt,” for additional information.
| | |
| NOTES TO CONSOLIDATED FINANCIAL STATEMENTS |
Accounts receivable, net consisted of the following:
| | | | | | | | | | | |
| December 31, |
| (in millions) | 2024 | | 2023 |
| | | |
| Trade, net | $ | 9 | | | $ | 16 | |
| Unbilled | 810 | | | 669 | |
| Other | 10 | | | 9 | |
| Accounts receivable, net | $ | 829 | | | $ | 694 | |
Our accounts receivable is primarily composed of trade receivables and unbilled receivables. Our trade receivables, which represent outstanding gross billings to clients, are reported net of allowance for doubtful accounts of $1 million as of both December 31, 2024 and 2023. We establish an allowance for doubtful accounts based on management’s assessment of the collectability of specific accounts and by making a general provision for other potentially uncollectible amounts.
We make an accrual at the end of each accounting period for our obligations associated with the earned but unpaid wages of our WSEEs and for the accrued gross billings associated with such wages. These accruals are included in accrued worksite employee payroll cost and unbilled accounts receivable; however, these amounts are presented net in the Consolidated Statements of Income. We generally require clients to pay invoices for service fees no later than the same day as the applicable payroll date. As such, we generally do not require collateral. Client prepayments directly attributable to accrued worksite employee payroll costs and unbilled revenues have been netted as we have the legal right of offset for these amounts. Unbilled accounts receivable consisted of the following:
| | | | | | | | | | | |
| | December 31, |
| (in millions) | 2024 | | 2023 |
| | | |
| Accrued worksite employee payroll cost | $ | 730 | | | $ | 559 | |
| Unbilled revenues | 171 | | | 138 | |
| Client prepayments | (91) | | | (28) | |
| Unbilled accounts receivable | $ | 810 | | | $ | 669 | |
| | | | | |
| 5. | Deposits and Prepaid Health Insurance |
Deposits and prepaid health insurance consisted of the following:
| | | | | | | | | | | |
| December 31, |
| (in millions) | 2024 | | 2023 |
| | | |
| Prepaid health insurance | $ | 9 | | | $ | 9 | |
| Deposits — health insurance | 8 | | | 8 | |
| Deposits — workers’ compensation | 178 | | | 198 | |
| Deposits and prepaid health insurance | $ | 195 | | | $ | 215 | |
The contractual arrangement with United for health insurance coverage requires us to maintain an accumulated cash surplus in the plan of $9 million, which is reported as deposits and prepaid health insurance in our Consolidated Balance Sheets. Please read Note 1, “Accounting Policies,” for a discussion of our accounting policies for health insurance costs and workers’ compensation costs.
| | |
| NOTES TO CONSOLIDATED FINANCIAL STATEMENTS |
We have a revolving credit facility (the “Facility”) with a borrowing capacity of up to $650 million. The Facility may be further increased to $700 million based on the terms and subject to the conditions set forth in the agreement relating to the Facility (as amended, the “Credit Agreement”). The Facility is available for working capital and general corporate purposes, including acquisitions, stock repurchases and issuances of letters of credit. Our obligations under the Facility are secured by 100% of the stock of our captive insurance subsidiary and are guaranteed by all of our subsidiaries other than our captive insurance subsidiary and certain other excluded subsidiaries. At December 31, 2024, our outstanding balance on the Facility was $369 million, and we had an outstanding $1 million letter of credit issued under the Facility, resulting in an available borrowing capacity of $280 million.
The Facility matures on June 30, 2027. Borrowings under the Facility bear interest at an annual rate equal to an alternate base rate or Adjusted Term SOFR for term SOFR loans, in either case plus an applicable margin. Adjusted Term SOFR is a forward-looking term rate based on the secured overnight financing rate plus a spread adjustment, which ranges from 0.10% to 0.25% depending on the interest period and type of loan. Depending on our leverage ratio, the applicable margin varies (1) in the case of SOFR loans, from 1.50% to 2.25% and (2) in the case of alternate base rate loans, from 0.00% to 0.50%. The alternate base rate is the highest of (1) the prime rate most recently published in The Wall Street Journal, (2) the federal funds rate plus 0.50%; and (3) the Adjusted Term SOFR rate plus 2.00%. We also pay an unused commitment fee on the average daily unused portion of the Facility at a rate of 0.25% per year. The average interest rate for 2024 was 7.1%. Interest expense and unused commitment fees are recorded in other income (expense).
The Facility contains both affirmative and negative covenants that we believe are customary for arrangements of this nature. Covenants include, but are not limited to, limitations on our ability to incur additional indebtedness, sell material assets, retire, redeem or otherwise reacquire our capital stock, acquire the capital stock or assets of another business, make investments and pay dividends. In addition, the Credit Agreement requires us to comply with financial covenants limiting our total funded debt, minimum interest coverage ratio, and maximum leverage ratio. We were in compliance with all financial covenants under the Credit Agreement at December 31, 2024.
| | |
| NOTES TO CONSOLIDATED FINANCIAL STATEMENTS |
Deferred taxes reflect the net tax effects of temporary differences between the carrying amounts of assets and liabilities used for financial reporting purposes and the amounts used for income tax purposes.
Significant components of the net deferred tax assets as reflected on the Consolidated Balance Sheets are as follows:
| | | | | | | | |
| December 31, |
| (in millions) | 2024 | 2023 |
| | |
| Deferred tax liabilities | | |
| Prepaid assets | $ | (4) | | $ | (4) | |
| Depreciation | (5) | | (6) | |
| | |
| Tenant improvements | (3) | | (3) | |
| Right-of-use leased assets | (19) | | (17) | |
| Intangibles | (3) | | (3) | |
| Total deferred tax liabilities | (34) | | (33) | |
| | |
| Deferred tax assets | | |
| Accrued incentive compensation | 12 | | 9 | |
| | |
| Workers’ compensation accruals | 4 | | 5 | |
| Accrued rent | 2 | | 2 | |
| Software development costs | 13 | | 4 | |
| Stock-based compensation | 15 | | 14 | |
| Operating lease liabilities | 22 | | 20 | |
| | |
| Other | 1 | | — | |
| Total deferred tax assets | 69 | | 54 | |
| Valuation allowance | (1) | | (1) | |
| Total net deferred tax assets | 68 | | 53 | |
| Net deferred tax assets | $ | 34 | | $ | 20 | |
| | |
| NOTES TO CONSOLIDATED FINANCIAL STATEMENTS |
The components of income tax expense are as follows:
| | | | | | | | | | | |
| Year Ended December 31, |
| (in millions) | 2024 | 2023 | 2022 |
| | | | |
| Current income tax expense | | | |
| Federal | $ | 41 | | $ | 49 | | $ | 62 | |
| State | 8 | | 9 | | 15 | |
| Total current income tax expense | 49 | | 58 | | 77 | |
| | | |
| Deferred income tax benefit | | | |
| Federal | (11) | | (3) | | (9) | |
| State | (3) | | (1) | | (2) | |
| Total deferred income tax benefit | (14) | | (4) | | (11) | |
| Total income tax expense | $ | 35 | | $ | 54 | | $ | 66 | |
The reconciliation of income tax expense computed at U.S. federal statutory tax rates to the reported income tax expense from continuing operations is as follows: | | | | | | | | | | | |
| Year Ended December 31, |
| (in millions) | 2024 | 2023 | 2022 |
| | | |
| Expected income tax expense at 21% | $ | 26 | | $ | 47 | | $ | 52 | |
| State income taxes, net of federal benefit | 4 | | 7 | | 10 | |
| Nondeductible expenses | 5 | | 5 | | 4 | |
| | | |
| Equity compensation, net | 1 | | (4) | | 1 | |
| Research and development credit | (1) | | (1) | | (1) | |
| | | |
| | | |
| | | |
| Reported total income tax expense | $ | 35 | | $ | 54 | | $ | 66 | |
At December 31, 2024, we had net operating loss carryforwards totaling $1 million that expire from 2026 to 2030 related to an acquisition that occurred in 2010.
We recognize interest and penalties related to uncertain tax positions in income tax expense. As of December 31, 2024, 2023 and 2022, we had no uncertain tax positions, and as a result, have made no provisions for interest or penalties related to uncertain tax positions. The tax years 2021 through 2023 remain open to examination by the Internal Revenue Service of the United States. The tax years 2020 through 2023 remain open to examination by various state tax authorities.
During 2024, we repurchased or withheld an aggregate of 697,177 shares of our common stock, as described below.
Repurchase Program
Our Board of Directors (the “Board”) has authorized a program to repurchase shares of our outstanding common stock (“Repurchase Program”). The purchases may be made from time to time in the open market or directly from stockholders at prevailing market prices based on market conditions and other factors. During 2024, 516,798 shares were repurchased under the Repurchase Program. As of December 31, 2024, we were authorized to repurchase an additional 1,452,764 shares under the Repurchase Program.
The Inflation Reduction Act of 2022, which was enacted into law on August 16, 2022, imposes a nondeductible 1% excise tax on the net value of certain stock repurchases made after December 31, 2022. During 2023, we recorded the applicable excise tax in treasury stock of $1 million as part of the cost basis of stock repurchased and recorded a corresponding liability for the excise tax payable in other accrued liabilities in our Consolidated Balance Sheets.
| | |
| NOTES TO CONSOLIDATED FINANCIAL STATEMENTS |
Withheld Shares
During 2024, we withheld 180,379 shares to satisfy tax withholding obligations for the vesting of long-term incentive and restricted stock unit awards.
Dividends
The Board declared and paid quarterly dividends as follows:
| | | | | | | | | | | |
| (amounts per share) | 2024 | | 2023 |
| | | |
| First quarter | $ | 0.57 | | | $ | 0.52 | |
| Second quarter | 0.60 | | | 0.57 | |
| Third quarter | 0.60 | | | 0.57 | |
| Fourth quarter | 0.60 | | | 0.57 | |
During 2024 and 2023, we declared and paid dividends totaling $89 million and $84 million, respectively.
Preferred Stock
At December 31, 2024, 20 million shares of preferred stock were authorized.
The Insperity, Inc. Incentive Plan, as amended, (the “Incentive Plan”) provides for options and other stock-based awards that have been and may be granted to eligible employees and non-employee directors of Insperity or its subsidiaries. The Incentive Plan permits stock options, including nonqualified stock options and options intended to qualify as “incentive stock options” within the meaning of Section 422 of the Internal Revenue Code, stock awards, restricted stock units, phantom stock awards, stock appreciation rights, performance units, and other stock-based awards and cash awards, all of which may or may not be subject to the achievement of one or more performance objectives. The purpose of the Incentive Plan generally is to retain and attract persons of training, experience and ability to serve as employees of Insperity and its subsidiaries and to serve as non-employee directors of Insperity, to encourage the sense of proprietorship of such persons and to stimulate the active interest of such persons in the development and financial success of Insperity and its subsidiaries.
The Incentive Plan is administered by the Compensation Committee of the Board (the “Committee”). The Committee has the power to determine which eligible employees will receive awards, the timing and manner of the grant of such awards, the exercise price of stock options (which may not be less than market value on the date of grant), the number of shares and all of the terms of the awards. The Board may at any time amend or terminate the Incentive Plan. However, no amendment that would impair the rights of any participant, with respect to outstanding grants, can be made without the participant’s prior consent. Stockholder approval of amendments to the Incentive Plan is necessary only when required by applicable law or stock exchange rules. Assuming all outstanding performance-based awards are paid at maximum achievement of pre-established performance goals, at December 31, 2024, 1.4 million shares of common stock were available for future grants under the Incentive Plan.
We also maintain the LTIP under the Incentive Plan. The LTIP provides for performance-based long-term compensation awards in the form of performance units to certain employees based on the achievement of pre-established performance goals. We granted performance units under the LTIP to our named executive officers and certain other officers in 2024, 2023 and 2022.
Employees who attain a minimum age of 62 and have provided 15 years or more of continuous service may continue to vest in awards following a qualifying retirement as defined under the Incentive Plan award agreement, as though they were still an employee, provided the grant date of the award is six months or more before the employee’s last day of employment, the employee provides the Company with six months advance notice of retirement, the employee continues to work full-time during such six (6) month period, and the employee signs a waiver and release of claims. In addition, in order to avoid forfeiting any outstanding award, a retired employee must refrain from providing any services, including but not limited to, as an employee, director, advisor, or independent contractor to a business engaged in providing any
| | |
| NOTES TO CONSOLIDATED FINANCIAL STATEMENTS |
services offered by the Company and its subsidiaries and affiliates at the time of the employee’s retirement, including but not limited to PEO services, payroll services, retirement services or insurances services. For a termination following a qualifying retirement, time-based awards will continue to vest in the normal course. For a termination following a qualifying retirement, performance-based awards with completed or in-process performance periods are adjusted for achievement of the performance criteria, prorated through the date of termination and paid in the normal course, while performance-based awards for performance periods that have not started are forfeited. Stock-based compensation expense related to time-based and performance-based awards is accelerated over the requisite service period for employees who meet the requirements for continued vesting.
Stock-based compensation expense and other disclosures for stock-based awards follows:
| | | | | | | | | | | |
| Year Ended December 31, |
| (in millions) | 2024 | 2023 | 2022 |
| | | |
| Stock-based compensation expense recognized | $ | 61 | | $ | 53 | | $ | 50 | |
| Income tax benefit realized from stock-based compensation expense | 17 | | 13 | | 13 | |
Time-Based Restricted Stock Units
Time-based restricted stock units (“RSUs”), under equity plan accounting, are generally measured at fair value on the date of grant based on the number of shares granted, estimated forfeitures and the quoted price of the common stock. Such value is recognized as compensation expense over the corresponding vesting period, generally three years to five years for awards currently outstanding. However, for some RSUs currently outstanding, compensation expense is accelerated over the shortened requisite service period for employees who meet the requirements for continued vesting.
The following is a summary of time-based RSU award activity for 2024:
| | | | | | | | | | | |
| Total Awards (in thousands) | | Weighted Average
Grant Date Fair
Value |
| | | |
| Non-vested — December 31, 2023 | 1,038 | | | $ | 106.98 | |
| Granted | 630 | | | 98.86 | |
| Vested | (506) | | | 101.80 | |
| Canceled | (28) | | | 106.20 | |
| Non-vested — December 31, 2024 | 1,134 | | | $ | 104.96 | |
Additional disclosures for time-based RSUs:
| | | | | | | | | | | |
| Year Ended December 31, |
| 2024 | 2023 | 2022 |
| | | |
| Weighted average grant date fair value of awards granted | $ | 98.86 | | $ | 123.66 | | $ | 90.06 | |
Fair value of awards vested during the year (in millions) | 49 | | 59 | | 30 | |
As of December 31, 2024, unrecognized compensation expense associated with the unvested RSUs outstanding was $59 million and is expected to be recognized over a weighted average period of 22 months.
Long-Term Incentive Program Awards
Each performance unit represents the right to receive common shares at a future date based on our performance against specified targets. The ultimate number of shares issued and the related compensation cost recognized is based on a comparison of the final performance metrics to the specified targets, which can range from 0% to 200% of the targeted amounts. A performance unit may be comprised of either a performance-based award or a market-based award. For performance-based awards, performance units have a vesting schedule of three years and compensation expense is recognized based on the number of common shares expected to be issued and the market price per common share on
| | |
| NOTES TO CONSOLIDATED FINANCIAL STATEMENTS |
the date of grant. Over the performance period, the number of shares expected to be issued is adjusted upward or downward based upon the probability of achievement of the performance targets. For market-based awards, performance units vest at the end of a three-year period assuming continued employment and achievement of market-based performance goals. The fair value of market-based performance awards was determined through the use of the Monte Carlo simulation method. The compensation expense for the LTIP awards is recognized on a straight-line basis over the vesting terms.
The following is a summary of LTIP award activity, at 100% of targeted amount, for 2024:
| | | | | | | | | | | |
| Number of Performance Units | | Weighted Average
Grant Date Fair
Value |
| (in thousands) | |
| | | |
| Non-vested — December 31, 2023 | 227 | | | $ | 105.92 | |
| Granted | 91 | | | 97.70 | |
| Vested | (60) | | | 98.44 | |
| Canceled | (65) | | | 98.79 | |
| Non-vested — December 31, 2024 | 193 | | | $ | 106.79 | |
The determination of achievement results and corresponding vesting of the 2021 LTIP awards occurred in February 2024 resulting in recipients receiving approximately 101,000 shares of common stock with a fair value of $10 million. As of December 31, 2024, we estimate that approximately 60,000, 36,000 and 91,000 shares will vest with less than $1 million, $1 million and $5 million in unamortized compensation expense related to the 2022, 2023 and 2024 LTIP grants, respectively, and is expected to be recognized over a weighted average period of 18 months.
Employee Stock Purchase Plan
Our employee stock purchase plan (the “ESPP”) enables employees to purchase shares of Insperity stock at a 5% discount from the stock price at the end of the offering period. The ESPP is a non-compensatory plan under GAAP for stock-based compensation. As a result, no compensation expense is recognized in conjunction with this plan. Approximately 46,000, 39,000 and 36,000 shares were issued from treasury under the ESPP during fiscal years 2024, 2023 and 2022, respectively.
Basic EPS is computed by dividing net income by the weighted average number of common shares outstanding during the period. Diluted EPS is computed by dividing net income by the weighted average number of common shares outstanding during the period, plus the dilutive effect of time-based and performance-based RSUs.
The following table summarizes the net income and the basic and diluted shares used in the earnings per share computations:
| | | | | | | | | | | |
| Year Ended December 31, |
| (in millions) | 2024 | 2023 | 2022 |
| | | |
| Net income | $ | 91 | | $ | 171 | | $ | 179 | |
| | | |
| Weighted average common shares outstanding | 38 | | 38 | | 38 | |
| Incremental shares from assumed time-based and performance-based RSU awards | — | | — | | 1 | |
| Adjusted weighted average common shares outstanding | 38 | | 38 | | 39 | |
| | | |
| | | |
An immaterial number of shares of time-based and performance-based RSU awards were excluded from the calculation of diluted earnings per share due to such shares being anti-dilutive during the years ended December 31, 2024 and 2023, respectively.
| | |
| NOTES TO CONSOLIDATED FINANCIAL STATEMENTS |
We have operating leases for office space, other operating facilities, vehicles and office equipment. Our fixed operating lease costs for 2024, 2023 and 2022 were $20 million, $19 million, and $19 million, respectively, and are included in general and administrative expenses on our Consolidated Statements of Income. During 2024, cash paid for amounts included in the measurement of operating lease liabilities was $24 million.
The following table presents the lease balances within our Consolidated Balance Sheets, weighted average lease term and weighted average discount rates related to our operating leases:
| | | | | | | | |
| (dollars in millions) | Classification in Consolidated Balance Sheets | December 31, 2024 |
| | |
| | |
| | |
| Lease liabilities: | | |
| Current operating lease liabilities | Other accrued liabilities | $ | 19 | |
| Long-term operating lease liabilities | Operating lease liabilities, net of current | 66 | |
| Total operating lease liabilities | | 85 | |
| Less: | | |
| Landlord funded tenant improvements | | 13 | |
| Deferred rent | | 7 | |
| Operating lease ROU assets | Right-of-use leased assets | $ | 65 | |
| | |
| Weighted average remaining lease term | 5 years |
| Weighted average discount rate | | 5 | % |
The following presents the maturity of our operating lease liabilities as of December 31, 2024:
| | | | | |
| (in millions) | Operating Leases |
| |
| 2025 | $ | 23 | |
| 2026 | 20 | |
| 2027 | 18 | |
| 2028 | 13 | |
| 2029 | 8 | |
| Thereafter | 16 | |
| Total remaining obligation | 98 | |
| Less imputed interest | 13 | |
| Present value of lease liabilities | $ | 85 | |
As of December 31, 2024, we have additional operating leases that have not yet commenced of $22 million with lease terms between two and eight years.
| | | | | |
| 12. | Commitments and Contingencies |
We enter into fixed purchase and service obligations in the ordinary course of business. These arrangements primarily consist of advertising commitments and service contracts. At December 31, 2024, future purchase and service obligations greater than $100,000 and one year were as follows:
| | |
| NOTES TO CONSOLIDATED FINANCIAL STATEMENTS |
| | | | | |
| (in millions) | |
| |
| 2025 | $ | 60 | |
| 2026 | 40 | |
| 2027 | 31 | |
| 2028 | 21 | |
| |
| |
| Total obligations | $ | 152 | |
Litigation
We are a defendant in various lawsuits and claims arising in the normal course of business. Management believes it has valid defenses in these cases and is defending them vigorously. While the results of litigation cannot be predicted with certainty, management believes the final outcome of such litigation will not have a material adverse effect on our financial position or results of operations.