UNITED STATES
SECURITIES AND EXCHANGE COMMISSION
Washington, D.C. 20549
FORM N-CSR
CERTIFIED SHAREHOLDER REPORT OF REGISTERED
MANAGEMENT INVESTMENT COMPANIES
|
| | | | | | |
Investment Company Act file number | 811-00816 |
| |
AMERICAN CENTURY MUTUAL FUNDS, INC. |
(Exact name of registrant as specified in charter) |
| |
4500 MAIN STREET, KANSAS CITY, MISSOURI | 64111 |
(Address of principal executive offices) | (Zip Code) |
| |
CHARLES A. ETHERINGTON 4500 MAIN STREET, KANSAS CITY, MISSOURI 64111 |
(Name and address of agent for service) |
| |
Registrant’s telephone number, including area code: | 816-531-5575 |
| |
Date of fiscal year end: | 10-31 |
| |
Date of reporting period: | 10-31-2017 |
ITEM 1. REPORTS TO STOCKHOLDERS.
|
| |
| |
| Annual Report |
| |
| October 31, 2017 |
| |
| Adaptive Equity Fund |
|
| | |
President’s Letter | 2 |
|
Performance | 3 |
|
Portfolio Commentary | |
|
Fund Characteristics | |
|
Shareholder Fee Example | |
|
Schedule of Investments | |
|
Statement of Assets and Liabilities | |
|
Statement of Operations | |
|
Statement of Changes in Net Assets | |
|
Notes to Financial Statements | |
|
Financial Highlights | |
|
Report of Independent Registered Public Accounting Firm | |
|
Management | |
|
Approval of Management Agreement | |
|
Proxy Voting Results | |
|
Additional Information | |
|
Any opinions expressed in this report reflect those of the author as of the date of the report, and do not necessarily represent the opinions of American Century Investments® or any other person in the American Century Investments organization. Any such opinions are subject to change at any time based upon market or other conditions and American Century Investments disclaims any responsibility to update such opinions. These opinions may not be relied upon as investment advice and, because investment decisions made by American Century Investments funds are based on numerous factors, may not be relied upon as an indication of trading intent on behalf of any American Century Investments fund. Security examples are used for representational purposes only and are not intended as recommendations to purchase or sell securities. Performance information for comparative indices and securities is provided to American Century Investments by third party vendors. To the best of American Century Investments’ knowledge, such information is accurate at the time of printing.
 Jonathan Thomas
Dear Investor:
Thank you for reviewing this annual report for the period ended October 31, 2017. Annual reports help convey important information about fund returns, including market factors that affected performance during the reporting period. For additional, updated investment and market insights, we encourage you to visit our website, americancentury.com.
‘Risk-On’ Sentiment Sparked Strong Gains Among Stocks
U.S. stocks delivered robust double-digit gains for the reporting period. The “risk-on” rally began early in the period, following Donald Trump’s election victory in November 2016. Investor expectations for President Trump’s administration to usher in pro-growth policies and reforms drove stock prices higher. In addition, healthy corporate earnings growth and improving gross domestic product (GDP) and other economic data provided additional support for stocks. Against this backdrop, the S&P 500 Index reached several milestone levels during the period and returned 23.63%. In terms of equity styles, riskier and economically sensitive stocks generally remained in favor. For example, small-cap stocks generally outperformed their mid- and large-cap peers, while growth stocks broadly outperformed their value counterparts across the capitalization spectrum. Real estate investment trusts (REITs) advanced, but global property stocks significantly underperformed the broader stock market as interest rates increased, most notably in the U.S., where the Federal Reserve (Fed) raised rates three times during the period.
As stocks soared in the post-election environment, global bonds sold off sharply. President Trump’s policy agenda fueled inflation fears that sent global bond yields sharply higher in late 2016. However, broad bond market performance generally recovered beginning in early 2017, advancing on subdued inflation and continued central bank accommodation to post modest gains for the entire reporting period. Investor preferences for risk also extended to the global fixed-income market, where high-yield corporate and emerging markets bonds were top performers.
As Congress considers tax cuts and other pro-growth reforms and the Fed and other central banks pursue policy normalization, investors likely will face new opportunities and challenges in the months ahead. We continue to believe in a disciplined, diversified, and risk-aware approach, using professionally managed portfolios in pursuit of investment goals. We appreciate your continued trust in us.
Sincerely,
Jonathan Thomas
President and Chief Executive Officer
American Century Investments
|
| | | | | | |
Total Returns as of October 31, 2017 |
| | | Average Annual Returns | |
| Ticker Symbol | 1 year | 5 years | 10 years | Since Inception | Inception Date |
Investor Class | AMVIX | 24.92% | 15.52% | 4.55% | — | 11/30/99 |
Russell 1000 Index | — | 23.67% | 15.17% | 7.60% | — | — |
I Class | AVDIX | 25.19% | 15.75% | 4.76% | — | 8/1/00 |
A Class | AVDAX | | | | | 12/1/16 |
No sales charge | | — | — | — | 19.50% | |
With sales charge | | — | — | — | 12.68% | |
R Class | AVDRX | — | — | — | 19.28% | 12/1/16 |
R6 Class | AVDMX | — | — | — | 20.17% | 12/1/16 |
Average annual returns since inception are presented when ten years of performance history is not available. Fund returns would have been lower if a portion of the fees had not been waived. Prior to April 10, 2017, the
I Class was referred to as the Institutional Class.
Sales charges include initial sales charges and contingent deferred sales charges (CDSCs), as applicable. A Class shares have a 5.75% maximum initial sales charge and may be subject to a maximum CDSC of 1.00%. The SEC requires that mutual funds provide performance information net of maximum sales charges in all cases where charges could be applied.
Data presented reflect past performance. Past performance is no guarantee of future results. Current performance may be higher or lower than the performance shown. Total returns for periods less than one year are not annualized. Investment return and principal value will fluctuate, and redemption value may be more or less than original cost. Data assumes reinvestment of dividends and capital gains, and none of the charts reflect the deduction of taxes that a shareholder would pay on fund distributions or the redemption of fund shares. To obtain performance data current to the most recent month end, please call 1-800-345-2021 or visit americancentury.com. For additional information about the fund, please consult the prospectus.
|
|
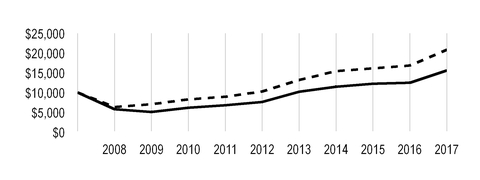
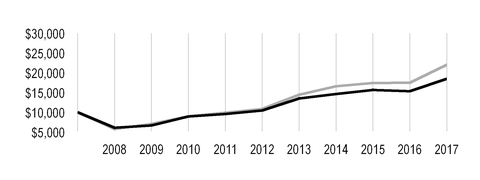
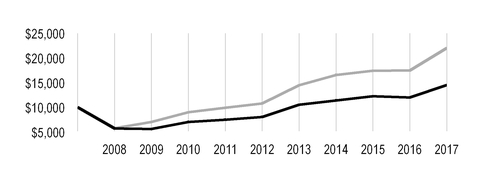
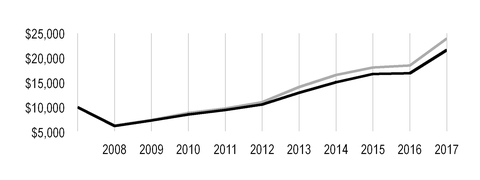
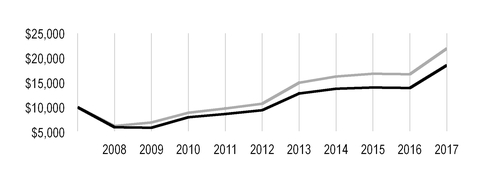
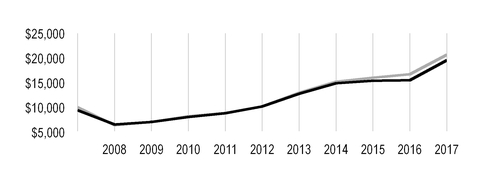
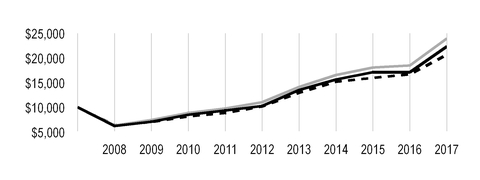
Growth of $10,000 Over 10 Years |
$10,000 investment made October 31, 2007 |
Performance for other share classes will vary due to differences in fee structure. |
|
| |
Value on October 31, 2017 |
| Investor Class — $15,604 |
|
| Russell 1000 Index — $20,818 |
|
Ending value of Investor Class would have been lower if a portion of the fees had not been waived.
|
| | | | |
Total Annual Fund Operating Expenses |
Investor Class | I Class | A Class | R Class | R6 Class |
1.25% | 1.05% | 1.50% | 1.75% | 0.90% |
The total annual fund operating expenses shown is as stated in the fund’s prospectus current as of the date of this report. The prospectus may vary from the expense ratio shown elsewhere in this report because it is based on a different time period, includes acquired fund fees and expenses, and, if applicable, does not include fee waivers or expense reimbursements.
Data presented reflect past performance. Past performance is no guarantee of future results. Current performance may be higher or lower than the performance shown. Total returns for periods less than one year are not annualized. Investment return and principal value will fluctuate, and redemption value may be more or less than original cost. Data assumes reinvestment of dividends and capital gains, and none of the charts reflect the deduction of taxes that a shareholder would pay on fund distributions or the redemption of fund shares. To obtain performance data current to the most recent month end, please call 1-800-345-2021 or visit americancentury.com. For additional information about the fund, please consult the prospectus.
Portfolio Managers: Stephen Pool and Joe Reiland
In January 2017, portfolio manager Don Owen retired from American Century Investments and portfolio manager Joe Reiland was added to the fund’s management team.
Performance Summary
Adaptive Equity returned 24.92%* for the 12 months ended October 31, 2017, outpacing the 23.67% return of the portfolio’s benchmark, the Russell 1000 Index.
U.S. stock indices posted positive returns during the reporting period. Growth stocks outperformed value stocks by a wide margin across the capitalization spectrum. Within the Russell 1000 Index, all sectors except telecommunication services posted gains. Information technology, financials, materials, and industrials all recorded total returns greater than the index average.
In this environment, Adaptive Equity’s highly systematic investment process delivered positive portfolio returns and outperformed its benchmark, the Russell 1000 Index. The fund received the best absolute contributions from information technology and financials stocks, while only our energy holdings generated a modest negative contribution. Relative to the Russell benchmark, stock selection in the real estate sector led results, and stock choices in materials, financials, consumer staples, and consumer discretionary were also positive. Stock selection in the energy, health care, and information technology sectors hampered performance.
Real Estate Led Contributors
Stock selection among equity real estate investment trusts was a significant contributor to fund performance in the real estate sector. Although none of our holdings were top-10 contributors, data center real estate trust DuPont Fabros Technology was a solid contributor in the sector, benefiting from a merger that brought shareholders a premium for their shares. As a result of the merger, the holding was eliminated.
Stock decisions in the chemicals industry boosted performance in the materials sector. Titanium dioxide producer Tronox was a significant contributor. Titanium dioxide is used in a variety of products including paint and food coloring, and the company benefited from strong demand and cost-cutting initiatives.
In financials, exposure to Green Dot was a strong contributor. The company, which provides prepaid credit cards through various retail stores and offers other banking services, posted strong quarterly results, and it recently signed deals with Apple and Uber. Mobile payment firm Square reported very good results in topline growth. The company has historically focused on smaller merchants but it is successfully moving up to larger businesses. Although energy was a detractor overall, Resolute Energy was a top contributor, aided by positive investor sentiment regarding a major acquisition. Resolute Energy was eliminated.
*All fund returns referenced in this commentary are for Investor Class shares. Fund returns would have been lower if a portion of the fees had not been waived. Performance for other share classes will vary due to differences in fee structure; when Investor Class performance exceeds that of the fund’s benchmark, other share classes may not. See page 3 for returns for all share classes.
Energy Holdings Hampered Performance
Clean Energy Fuels was a major detractor in the energy sector. The supplier of fuel for natural gas-fueled vehicles fell on increased costs and lower revenue. The holding was eliminated. EP Energy, an exploration and production company, fell sharply early in 2017 on concerns about the firm’s balance sheet.
Among other significant detractors, shares of life sciences company Cambrex declined as investors became concerned about its reliance on one customer, Gilead Sciences, whose hepatitis C drug has come under competitive pressure and lower demand. Information technology software and services company Unisys detracted after reporting disappointing earnings. The consumer credit reporting company Equifax fell sharply after it revealed that hackers had breached its data, compromising the information of as many as 143 million people. The holding was eliminated.
Outlook
Using a systematic and quantitatively driven process, Adaptive Equity combines market factors and company-specific information in a unique model to underpin its stock selection process. Looking ahead, we remain confident that this systematic process will continue to successfully identify risk-adjusted opportunities across investment styles and industry sectors.
|
| |
OCTOBER 31, 2017 | |
Top Ten Holdings | % of net assets |
Microsoft Corp. | 2.5% |
Apple, Inc. | 2.2% |
Amazon.com, Inc. | 2.1% |
Tronox Ltd., Class A | 2.0% |
Essent Group Ltd. | 1.9% |
RealPage, Inc. | 1.9% |
Alphabet, Inc., Class A | 1.9% |
Monster Beverage Corp. | 1.9% |
Corning, Inc. | 1.7% |
Intel Corp. | 1.6% |
| |
Top Five Industries | % of net assets |
Equity Real Estate Investment Trusts (REITs) | 5.8% |
Oil, Gas and Consumable Fuels | 5.8% |
IT Services | 5.6% |
Software | 5.5% |
Internet Software and Services | 5.3% |
| |
Types of Investments in Portfolio | % of net assets |
Common Stocks | 99.0% |
Temporary Cash Investments | 1.0% |
Other Assets and Liabilities | —* |
*Category is less than 0.05% of total net assets.
Fund shareholders may incur two types of costs: (1) transaction costs, including sales charges (loads) on purchase payments and redemption/exchange fees; and (2) ongoing costs, including management fees; distribution and service (12b-1) fees; and other fund expenses. This example is intended to help you understand your ongoing costs (in dollars) of investing in your fund and to compare these costs with the ongoing cost of investing in other mutual funds.
The example is based on an investment of $1,000 made at the beginning of the period and held for the entire period from May 1, 2017 to October 31, 2017.
Actual Expenses
The table provides information about actual account values and actual expenses for each class. You may use the information, together with the amount you invested, to estimate the expenses that you paid over the period. First, identify the share class you own. Then simply divide your account value by $1,000 (for example, an $8,600 account value divided by $1,000 = 8.6), then multiply the result by the number under the heading “Expenses Paid During Period” to estimate the expenses you paid on your account during this period.
If you hold Investor Class shares of any American Century Investments fund, or I Class shares of the American Century Diversified Bond Fund, in an American Century Investments account (i.e., not a financial intermediary or retirement plan account), American Century Investments may charge you a $12.50 semiannual account maintenance fee if the value of those shares is less than $10,000. We will redeem shares automatically in one of your accounts to pay the $12.50 fee. In determining your total eligible investment amount, we will include your investments in all personal accounts (including American Century Investments Brokerage accounts) registered under your Social Security number. Personal accounts include individual accounts, joint accounts, UGMA/UTMA accounts, personal trusts, Coverdell Education Savings Accounts and IRAs (including traditional, Roth, Rollover, SEP-, SARSEP- and SIMPLE-IRAs), and certain other retirement accounts. If you have only business, business retirement, employer-sponsored or American Century Investments Brokerage accounts, you are currently not subject to this fee. If you are subject to the Account Maintenance Fee, your account value could be reduced by the fee amount.
Hypothetical Example for Comparison Purposes
The table also provides information about hypothetical account values and hypothetical expenses based on the actual expense ratio of each class of your fund and an assumed rate of return of 5% per year before expenses, which is not the actual return of a fund’s share class. The hypothetical account values and expenses may not be used to estimate the actual ending account balance or expenses you paid for the period. You may use this information to compare the ongoing costs of investing in your fund and other funds. To do so, compare this 5% hypothetical example with the 5% hypothetical examples that appear in the shareholder reports of the other funds.
Please note that the expenses shown in the table are meant to highlight your ongoing costs only and do not reflect any transactional costs, such as sales charges (loads) or redemption/exchange fees. Therefore, the table is useful in comparing ongoing costs only, and will not help you determine the relative total costs of owning different funds. In addition, if these transactional costs were included, your costs would have been higher.
|
| | | | |
| Beginning
Account Value
5/1/17 | Ending
Account Value
10/31/17 | Expenses Paid
During Period(1)
5/1/17 - 10/31/17 | Annualized
Expense Ratio(1) |
Actual | | | | |
Investor Class | $1,000 | $1,088.70 | $6.11 | 1.16% |
I Class | $1,000 | $1,090.30 | $5.06 | 0.96% |
A Class | $1,000 | $1,087.10 | $7.42 | 1.41% |
R Class | $1,000 | $1,086.30 | $8.73 | 1.66% |
R6 Class | $1,000 | $1,091.10 | $4.27 | 0.81% |
Hypothetical | | | | |
Investor Class | $1,000 | $1,019.36 | $5.90 | 1.16% |
I Class | $1,000 | $1,020.37 | $4.89 | 0.96% |
A Class | $1,000 | $1,018.10 | $7.17 | 1.41% |
R Class | $1,000 | $1,016.84 | $8.44 | 1.66% |
R6 Class | $1,000 | $1,021.12 | $4.13 | 0.81% |
| |
(1) | Expenses are equal to the class's annualized expense ratio listed in the table above, multiplied by the average account value over the period, multiplied by 184, the number of days in the most recent fiscal half-year, divided by 365, to reflect the one-half year period. Annualized expense ratio reflects actual expenses, including any applicable fee waivers or expense reimbursements and excluding any acquired fund fees and expenses. |
OCTOBER 31, 2017
|
| | | | | |
| Shares | Value |
COMMON STOCKS — 99.0% | | |
Aerospace and Defense — 2.2% | | |
Aerojet Rocketdyne Holdings, Inc.(1) | 10,909 |
| $ | 344,506 |
|
Boeing Co. (The) | 2,822 |
| 728,019 |
|
Curtiss-Wright Corp. | 2,259 |
| 267,127 |
|
General Dynamics Corp. | 4,766 |
| 967,403 |
|
| | 2,307,055 |
|
Airlines — 1.5% | | |
Hawaiian Holdings, Inc.(1) | 15,958 |
| 534,593 |
|
Southwest Airlines Co. | 18,319 |
| 986,661 |
|
| | 1,521,254 |
|
Automobiles — 0.4% | | |
Ford Motor Co. | 33,102 |
| 406,162 |
|
Banks — 0.6% | | |
1st Source Corp. | 554 |
| 28,426 |
|
U.S. Bancorp | 11,151 |
| 606,391 |
|
| | 634,817 |
|
Beverages — 1.9% | | |
Monster Beverage Corp.(1) | 33,184 |
| 1,922,349 |
|
Biotechnology — 2.9% | | |
AbbVie, Inc. | 10,569 |
| 953,852 |
|
Amgen, Inc. | 6,574 |
| 1,151,897 |
|
Gilead Sciences, Inc. | 11,474 |
| 860,091 |
|
| | 2,965,840 |
|
Building Products — 0.4% | | |
Simpson Manufacturing Co., Inc. | 7,317 |
| 407,850 |
|
Capital Markets — 1.7% | | |
Janus Henderson Group plc | 37,256 |
| 1,294,646 |
|
Moelis & Co., Class A | 11,722 |
| 501,116 |
|
| | 1,795,762 |
|
Chemicals — 2.2% | | |
AgroFresh Solutions, Inc.(1) | 42,967 |
| 253,505 |
|
Tronox Ltd., Class A | 76,931 |
| 2,036,364 |
|
| | 2,289,869 |
|
Communications Equipment — 1.7% | | |
Cisco Systems, Inc. | 35,049 |
| 1,196,923 |
|
Palo Alto Networks, Inc.(1) | 3,577 |
| 526,535 |
|
| | 1,723,458 |
|
Consumer Finance — 2.8% | | |
American Express Co. | 15,385 |
| 1,469,575 |
|
Green Dot Corp., Class A(1) | 24,700 |
| 1,398,514 |
|
| | 2,868,089 |
|
|
| | | | | |
| Shares | Value |
Diversified Financial Services — 1.1% | | |
Berkshire Hathaway, Inc., Class B(1) | 5,837 |
| $ | 1,091,169 |
|
Diversified Telecommunication Services — 1.2% | | |
AT&T, Inc. | 37,179 |
| 1,251,073 |
|
Electric Utilities — 2.0% | | |
Exelon Corp. | 32,515 |
| 1,307,428 |
|
Great Plains Energy, Inc. | 24,157 |
| 793,074 |
|
| | 2,100,502 |
|
Electrical Equipment — 1.0% | | |
Rockwell Automation, Inc. | 5,128 |
| 1,029,805 |
|
Electronic Equipment, Instruments and Components — 1.7% | | |
Corning, Inc. | 55,108 |
| 1,725,431 |
|
Energy Equipment and Services — 0.6% | | |
Oceaneering International, Inc. | 31,973 |
| 646,494 |
|
Equity Real Estate Investment Trusts (REITs) — 5.8% | | |
American Tower Corp. | 11,595 |
| 1,665,854 |
|
Apple Hospitality REIT, Inc. | 68,926 |
| 1,305,458 |
|
Ashford Hospitality Prime, Inc. | 34,908 |
| 339,306 |
|
Brixmor Property Group, Inc. | 8,766 |
| 153,142 |
|
CareTrust REIT, Inc. | 36,003 |
| 680,457 |
|
CBL & Associates Properties, Inc. | 24,794 |
| 194,385 |
|
InfraREIT, Inc.(1) | 60,563 |
| 1,356,611 |
|
LaSalle Hotel Properties | 11,245 |
| 317,221 |
|
| | 6,012,434 |
|
Food and Staples Retailing — 2.6% | | |
CVS Health Corp. | 15,617 |
| 1,070,233 |
|
Wal-Mart Stores, Inc. | 18,473 |
| 1,612,878 |
|
| | 2,683,111 |
|
Food Products — 1.3% | | |
Blue Buffalo Pet Products, Inc.(1) | 29,290 |
| 847,360 |
|
General Mills, Inc. | 5,319 |
| 276,162 |
|
Post Holdings, Inc.(1) | 2,134 |
| 176,973 |
|
| | 1,300,495 |
|
Gas Utilities — 0.6% | | |
ONE Gas, Inc. | 7,595 |
| 584,663 |
|
Health Care Equipment and Supplies — 1.2% | | |
Haemonetics Corp.(1) | 25,078 |
| 1,192,710 |
|
Health Care Providers and Services — 3.7% | | |
Anthem, Inc. | 7,700 |
| 1,610,917 |
|
Cardinal Health, Inc. | 9,473 |
| 586,379 |
|
HCA Healthcare, Inc.(1) | 8,287 |
| 626,912 |
|
Premier, Inc., Class A(1) | 9,139 |
| 298,571 |
|
UnitedHealth Group, Inc. | 3,242 |
| 681,533 |
|
| | 3,804,312 |
|
Hotels, Restaurants and Leisure — 1.6% | | |
Buffalo Wild Wings, Inc.(1) | 10,366 |
| 1,225,261 |
|
|
| | | | | |
| Shares | Value |
Wynn Resorts Ltd. | 3,081 |
| $ | 454,417 |
|
| | 1,679,678 |
|
Independent Power and Renewable Electricity Producers — 1.3% | | |
Ormat Technologies, Inc. | 20,040 |
| 1,301,197 |
|
Industrial Conglomerates — 1.2% | | |
3M Co. | 5,577 |
| 1,283,770 |
|
Insurance — 3.3% | | |
Aon plc | 8,036 |
| 1,152,603 |
|
Chubb Ltd. | 10,782 |
| 1,626,141 |
|
Kemper Corp. | 10,597 |
| 679,268 |
|
| | 3,458,012 |
|
Internet and Direct Marketing Retail — 2.8% | | |
Amazon.com, Inc.(1) | 1,932 |
| 2,135,401 |
|
Liberty TripAdvisor Holdings, Inc., Class A(1) | 8,630 |
| 93,204 |
|
Netflix, Inc.(1) | 3,321 |
| 652,344 |
|
| | 2,880,949 |
|
Internet Software and Services — 5.3% | | |
Alphabet, Inc., Class A(1) | 1,896 |
| 1,958,644 |
|
Facebook, Inc., Class A(1) | 7,443 |
| 1,340,186 |
|
GoDaddy, Inc., Class A(1) | 7,908 |
| 369,304 |
|
NIC, Inc. | 37,001 |
| 629,017 |
|
Yelp, Inc.(1) | 24,838 |
| 1,160,431 |
|
| | 5,457,582 |
|
IT Services — 5.6% | | |
Alliance Data Systems Corp. | 168 |
| 37,587 |
|
Conduent, Inc.(1) | 32,741 |
| 506,831 |
|
CoreLogic, Inc.(1) | 21,828 |
| 1,023,733 |
|
EVERTEC, Inc. | 38,642 |
| 579,630 |
|
FleetCor Technologies, Inc.(1) | 1,632 |
| 269,721 |
|
PayPal Holdings, Inc.(1) | 21,522 |
| 1,561,636 |
|
Square, Inc., Class A(1) | 14,838 |
| 551,825 |
|
Unisys Corp.(1) | 100,591 |
| 880,171 |
|
Visa, Inc., Class A | 3,941 |
| 433,431 |
|
| | 5,844,565 |
|
Leisure Products — 0.6% | | |
Callaway Golf Co. | 45,172 |
| 651,832 |
|
Life Sciences Tools and Services — 2.2% | | |
Cambrex Corp.(1) | 24,743 |
| 1,070,135 |
|
Quintiles IMS Holdings, Inc.(1) | 11,656 |
| 1,260,013 |
|
| | 2,330,148 |
|
Machinery — 0.7% | | |
IDEX Corp. | 1,295 |
| 166,032 |
|
Xylem Inc. | 9,048 |
| 601,963 |
|
| | 767,995 |
|
Marine — 0.1% | | |
Costamare, Inc. | 15,137 |
| 94,001 |
|
|
| | | | | |
| Shares | Value |
Media — 2.7% | | |
Comcast Corp., Class A | 30,632 |
| $ | 1,103,671 |
|
Omnicom Group, Inc. | 10,765 |
| 723,300 |
|
Walt Disney Co. (The) | 9,666 |
| 945,432 |
|
| | 2,772,403 |
|
Metals and Mining — 0.1% | | |
Newmont Mining Corp. | 3,512 |
| 126,994 |
|
Multi-Utilities — 0.3% | | |
Consolidated Edison, Inc. | 3,872 |
| 333,186 |
|
Oil, Gas and Consumable Fuels — 5.8% | | |
EP Energy Corp., Class A(1) | 175,652 |
| 474,261 |
|
Exxon Mobil Corp. | 14,432 |
| 1,202,907 |
|
Laredo Petroleum, Inc.(1) | 74,233 |
| 884,857 |
|
Marathon Petroleum Corp. | 8,460 |
| 505,401 |
|
Occidental Petroleum Corp. | 9,472 |
| 611,607 |
|
Williams Cos., Inc. (The) | 40,512 |
| 1,154,592 |
|
Williams Partners LP | 31,529 |
| 1,167,834 |
|
| | 6,001,459 |
|
Paper and Forest Products — 1.1% | | |
Domtar Corp. | 24,377 |
| 1,153,520 |
|
Personal Products — 0.4% | | |
Estee Lauder Cos., Inc. (The), Class A | 4,157 |
| 464,794 |
|
Pharmaceuticals — 3.3% | | |
Merck & Co., Inc. | 7,453 |
| 410,586 |
|
Mylan NV(1) | 9,564 |
| 341,530 |
|
Pfizer, Inc. | 40,955 |
| 1,435,882 |
|
Phibro Animal Health Corp., Class A | 18,324 |
| 689,899 |
|
Prestige Brands Holdings, Inc.(1) | 11,864 |
| 556,422 |
|
| | 3,434,319 |
|
Professional Services — 0.6% | | |
Exponent, Inc. | 8,286 |
| 611,921 |
|
Road and Rail — 1.6% | | |
Genesee & Wyoming, Inc., Class A(1) | 12,006 |
| 861,790 |
|
Saia, Inc.(1) | 11,626 |
| 753,365 |
|
| | 1,615,155 |
|
Semiconductors and Semiconductor Equipment — 2.7% | | |
Diodes, Inc.(1) | 3,537 |
| 121,461 |
|
First Solar, Inc.(1) | 5,622 |
| 308,198 |
|
Intel Corp. | 36,852 |
| 1,676,397 |
|
QUALCOMM, Inc. | 5,390 |
| 274,944 |
|
Texas Instruments, Inc. | 4,281 |
| 413,930 |
|
| | 2,794,930 |
|
Software — 5.5% | | |
Intuit, Inc. | 3,224 |
| 486,888 |
|
Manhattan Associates, Inc.(1) | 10,460 |
| 437,856 |
|
Microsoft Corp. | 31,545 |
| 2,623,913 |
|
Nuance Communications, Inc.(1) | 8,059 |
| 118,790 |
|
|
| | | | | |
| Shares | Value |
RealPage, Inc.(1) | 45,887 |
| $ | 1,986,907 |
|
| | 5,654,354 |
|
Specialty Retail — 1.8% | | |
Home Depot, Inc. (The) | 6,721 |
| 1,114,208 |
|
L Brands, Inc. | 928 |
| 39,941 |
|
Lowe's Cos., Inc. | 9,013 |
| 720,589 |
|
| | 1,874,738 |
|
Technology Hardware, Storage and Peripherals — 2.4% | | |
Apple, Inc. | 13,509 |
| 2,283,562 |
|
Hewlett Packard Enterprise Co. | 13,573 |
| 188,936 |
|
| | 2,472,498 |
|
Thrifts and Mortgage Finance — 3.5% | | |
Essent Group Ltd.(1) | 47,198 |
| 2,011,579 |
|
Federal Agricultural Mortgage Corp., Class C | 1,358 |
| 100,818 |
|
Northwest Bancshares, Inc. | 90,841 |
| 1,532,487 |
|
| | 3,644,884 |
|
Tobacco — 0.9% | | |
Altria Group, Inc. | 14,774 |
| 948,786 |
|
Wireless Telecommunication Services — 0.5% | | |
T-Mobile US, Inc.(1) | 8,737 |
| 522,210 |
|
TOTAL COMMON STOCKS
(Cost $82,095,525) | | 102,440,584 |
|
TEMPORARY CASH INVESTMENTS — 1.0% | | |
Repurchase Agreement, BMO Capital Markets Corp., (collateralized by various U.S. Treasury obligations, 0.375% - 1.375%, 1/15/27 - 2/15/45, valued at $565,107), in a joint trading account at 0.88%, dated 10/31/17, due 11/1/17 (Delivery value $552,771) | | 552,757 |
|
Repurchase Agreement, Fixed Income Clearing Corp., (collateralized by various U.S. Treasury obligations, 2.50%, 5/15/46, valued at $473,090), at 0.34%, dated 10/31/17, due 11/1/17 (Delivery value $460,004) | | 460,000 |
|
State Street Institutional U.S. Government Money Market Fund, Premier Class | 1,325 |
| 1,325 |
|
TOTAL TEMPORARY CASH INVESTMENTS
(Cost $1,014,082) | | 1,014,082 |
|
TOTAL INVESTMENT SECURITIES — 100.0%
(Cost $83,109,607) | | 103,454,666 |
|
OTHER ASSETS AND LIABILITIES† | | (10,385 | ) |
TOTAL NET ASSETS — 100.0% | | $ | 103,444,281 |
|
|
| | |
NOTES TO SCHEDULE OF INVESTMENTS |
† Category is less than 0.05% of total net assets.
See Notes to Financial Statements.
|
|
Statement of Assets and Liabilities |
|
| | | |
OCTOBER 31, 2017 | |
Assets | |
Investment securities, at value (cost of $83,109,607) | $ | 103,454,666 |
|
Receivable for investments sold | 1,859,937 |
|
Receivable for capital shares sold | 1,005 |
|
Dividends and interest receivable | 58,396 |
|
| 105,374,004 |
|
| |
Liabilities | |
Payable for investments purchased | 1,795,959 |
|
Payable for capital shares redeemed | 33,463 |
|
Accrued management fees | 99,112 |
|
Distribution and service fees payable | 31 |
|
Accrued other expenses | 1,158 |
|
| 1,929,723 |
|
| |
Net Assets | $ | 103,444,281 |
|
| |
Net Assets Consist of: | |
Capital (par value and paid-in surplus) | $ | 76,141,033 |
|
Undistributed net investment income | 271,903 |
|
Undistributed net realized gain | 6,686,286 |
|
Net unrealized appreciation | 20,345,059 |
|
| $ | 103,444,281 |
|
|
| | | | |
| Net Assets | Shares Outstanding | Net Asset Value Per Share |
Investor Class, $0.01 Par Value | $98,584,706 | 8,113,332 |
| $12.15 |
I Class, $0.01 Par Value | $4,568,217 | 367,247 |
| $12.44 |
A Class, $0.01 Par Value | $29,882 | 2,443 |
| $12.23* |
R Class, $0.01 Par Value | $60,930 | 4,992 |
| $12.21 |
R6 Class, $0.01 Par Value | $200,546 | 15,940 |
| $12.58 |
*Maximum offering price $12.98 (net asset value divided by 0.9425).
See Notes to Financial Statements.
|
| | | |
YEAR ENDED OCTOBER 31, 2017 | |
Investment Income (Loss) | |
Income: | |
Dividends (net of foreign taxes withheld of $6,307) | $ | 1,718,163 |
|
Interest | 2,246 |
|
| 1,720,409 |
|
| |
Expenses: | |
Management fees | 1,223,807 |
|
Distribution and service fees: | |
A Class | 63 |
|
R Class | 190 |
|
Directors' fees and expenses | 3,029 |
|
Other expenses | 3,276 |
|
| 1,230,365 |
|
Fees waived(1) | (98,454 | ) |
| 1,131,911 |
|
| |
Net investment income (loss) | 588,498 |
|
| |
Realized and Unrealized Gain (Loss) | |
Net realized gain (loss) on: | |
Investment transactions | 8,029,881 |
|
Forward foreign currency exchange contract transactions | (37,666 | ) |
Foreign currency translation transactions | 34 |
|
| 7,992,249 |
|
| |
Change in net unrealized appreciation (depreciation) on: | |
Investments | 13,194,971 |
|
Forward foreign currency exchange contracts | (36,235 | ) |
| 13,158,736 |
|
| |
Net realized and unrealized gain (loss) | 21,150,985 |
|
| |
Net Increase (Decrease) in Net Assets Resulting from Operations | $ | 21,739,483 |
|
| |
(1) | Amount consists of $95,048, $3,219, $25, $38 and $124 for the Investor Class, I Class, A Class, R Class and R6 Class, respectively. |
See Notes to Financial Statements.
|
|
Statement of Changes in Net Assets |
|
| | | | | | |
YEARS ENDED OCTOBER 31, 2017 AND OCTOBER 31, 2016 |
Increase (Decrease) in Net Assets | October 31, 2017 | October 31, 2016 |
Operations | | |
Net investment income (loss) | $ | 588,498 |
| $ | 993,300 |
|
Net realized gain (loss) | 7,992,249 |
| (1,249,801 | ) |
Change in net unrealized appreciation (depreciation) | 13,158,736 |
| 2,029,647 |
|
Net increase (decrease) in net assets resulting from operations | 21,739,483 |
| 1,773,146 |
|
| | |
Distributions to Shareholders | | |
From net investment income: | | |
Investor Class | (897,365 | ) | (1,053,460 | ) |
I Class | (33,360 | ) | (32,985 | ) |
A Class | (15 | ) | — |
|
R Class | (10 | ) | — |
|
R6 Class | (28 | ) | — |
|
From net realized gains: | | |
Investor Class | — |
| (9,000,208 | ) |
I Class | — |
| (238,821 | ) |
Decrease in net assets from distributions | (930,778 | ) | (10,325,474 | ) |
| | |
Capital Share Transactions | | |
Net increase (decrease) in net assets from capital share transactions (Note 5) | (7,982,654 | ) | (2,638,765 | ) |
| | |
Redemption Fees | | |
Increase in net assets from redemption fees | 1,332 |
| 2,101 |
|
| | |
Net increase (decrease) in net assets | 12,827,383 |
| (11,188,992 | ) |
| | |
Net Assets | | |
Beginning of period | 90,616,898 |
| 101,805,890 |
|
End of period | $ | 103,444,281 |
| $ | 90,616,898 |
|
| | |
Undistributed net investment income | $ | 271,903 |
| $ | 702,891 |
|
See Notes to Financial Statements.
|
|
Notes to Financial Statements |
OCTOBER 31, 2017
1. Organization
American Century Mutual Funds, Inc. (the corporation) is registered under the Investment Company Act of 1940, as amended (the 1940 Act), as an open-end management investment company and is organized as a Maryland corporation. Adaptive Equity Fund (the fund) is one fund in a series issued by the corporation. The fund's investment objective is to seek long-term capital growth.
The fund offers the Investor Class, I Class (formerly Institutional Class), A Class, R Class and R6 Class. The A Class may incur an initial sales charge and may be subject to a contingent deferred sales charge. Sale of the A Class, R Class and R6 Class commenced on December 1, 2016.
2. Significant Accounting Policies
The following is a summary of significant accounting policies consistently followed by the fund in preparation of its financial statements. The fund is an investment company and follows accounting and reporting guidance in accordance with accounting principles generally accepted in the United States of America. This may require management to make certain estimates and assumptions at the date of the financial statements. Actual results could differ from these estimates. Management evaluated the impact of events or transactions occurring through the date the financial statements were issued that would merit recognition or disclosure.
Investment Valuations — The fund determines the fair value of its investments and computes its net asset value per share at the close of regular trading (usually 4 p.m. Eastern time) on the New York Stock Exchange (NYSE) on each day the NYSE is open. The Board of Directors has adopted valuation policies and procedures to guide the investment advisor in the fund’s investment valuation process and to provide methodologies for the oversight of the fund’s pricing function.
Equity securities that are listed or traded on a domestic securities exchange are valued at the last reported sales price or at the official closing price as provided by the exchange. Equity securities traded on foreign securities exchanges are generally valued at the closing price of such securities on the exchange where primarily traded or at the close of the NYSE, if that is earlier. If no last sales price is reported, or if local convention or regulation so provides, the mean of the latest bid and asked prices may be used. Securities traded over-the-counter are valued at the mean of the latest bid and asked prices, the last sales price, or the official closing price. Equity securities initially expressed in local currencies are translated into U.S. dollars at the mean of the appropriate currency exchange rate at the close of the NYSE as provided by an independent pricing service.
Open-end management investment companies are valued at the reported net asset value per share. Repurchase agreements are valued at cost, which approximates fair value. Forward foreign currency exchange contracts are valued at the mean of the appropriate forward exchange rate at the close of the NYSE as provided by an independent pricing service.
If the fund determines that the market price for an investment is not readily available or the valuation methods mentioned above do not reflect an investment’s fair value, such investment is valued as determined in good faith by the Board of Directors or its delegate, in accordance with policies and procedures adopted by the Board of Directors. In its determination of fair value, the fund may review several factors including, but not limited to, market information regarding the specific investment or comparable investments and correlation with other investment types, futures indices or general market indicators. Circumstances that may cause the fund to use these procedures to value an investment include, but are not limited to: an investment has been declared in default or is distressed; trading in a security has been suspended during the trading day or a security is not actively trading on its principal exchange; prices received from a regular pricing source are deemed unreliable; or there is a foreign market holiday and no trading occurred.
The fund monitors for significant events occurring after the close of an investment’s primary exchange but before the fund’s net asset value per share is determined. Significant events may include, but are not limited to: corporate announcements and transactions; governmental action and political unrest that could impact a specific investment or an investment sector; or armed conflicts, natural disasters and similar events that could affect investments in a specific country or region. The fund also monitors for significant fluctuations between
domestic and foreign markets, as evidenced by the U.S. market or such other indicators that the Board of Directors, or its delegate, deems appropriate. If significant fluctuations in foreign markets are identified, the fund may apply a model-derived factor to the closing price of equity securities traded on foreign securities exchanges. The factor is based on observable market data as provided by an independent pricing service.
Security Transactions — Security transactions are accounted for as of the trade date. Net realized gains and losses are determined on the identified cost basis, which is also used for federal income tax purposes.
Investment Income — Dividend income less foreign taxes withheld, if any, is recorded as of the ex-dividend date. Distributions received on securities that represent a return of capital or long-term capital gain are recorded as a reduction of cost of investments and/or as a realized gain. The fund may estimate the components of distributions received that may be considered nontaxable distributions or long-term capital gain distributions for income tax purposes. Interest income is recorded on the accrual basis and includes accretion of discounts and amortization of premiums.
Foreign Currency Translations — All assets and liabilities initially expressed in foreign currencies are translated into U.S. dollars at prevailing exchange rates at period end. The fund may enter into spot foreign currency exchange contracts to facilitate transactions denominated in a foreign currency. Purchases and sales of investment securities, dividend and interest income, spot foreign currency exchange contracts, and expenses are translated at the rates of exchange prevailing on the respective dates of such transactions. Net realized and unrealized foreign currency exchange gains or losses related to investment securities are a component of net realized gain (loss) on investment transactions and change in net unrealized appreciation (depreciation) on investments, respectively.
Repurchase Agreements — The fund may enter into repurchase agreements with institutions that American Century Investment Management, Inc. (ACIM) (the investment advisor) has determined are creditworthy pursuant to criteria adopted by the Board of Directors. The fund requires that the collateral, represented by securities, received in a repurchase transaction be transferred to the custodian in a manner sufficient to enable the fund to obtain those securities in the event of a default under the repurchase agreement. ACIM monitors, on a daily basis, the securities transferred to ensure the value, including accrued interest, of the securities under each repurchase agreement is equal to or greater than amounts owed to the fund under each repurchase agreement.
Joint Trading Account — Pursuant to an Exemptive Order issued by the Securities and Exchange Commission, the fund, along with certain other funds in the American Century Investments family of funds, may transfer uninvested cash balances into a joint trading account. These balances are invested in one or more repurchase agreements that are collateralized by U.S. Treasury or Agency obligations.
Income Tax Status — It is the fund’s policy to distribute substantially all net investment income and net realized gains to shareholders and to otherwise qualify as a regulated investment company under provisions of the Internal Revenue Code. Accordingly, no provision has been made for income taxes. The fund files U.S. federal, state, local and non-U.S. tax returns as applicable. The fund's tax returns are subject to examination by the relevant taxing authority until expiration of the applicable statute of limitations, which is generally three years from the date of filing but can be longer in certain jurisdictions. At this time, management believes there are no uncertain tax positions which, based on their technical merit, would not be sustained upon examination and for which it is reasonably possible that the total amounts of unrecognized tax benefits will significantly change in the next twelve months.
Multiple Class — All shares of the fund represent an equal pro rata interest in the net assets of the class to which such shares belong, and have identical voting, dividend, liquidation and other rights and the same terms and conditions, except for class specific expenses and exclusive rights to vote on matters affecting only individual classes. Income, non-class specific expenses, and realized and unrealized capital gains and losses of the fund are allocated to each class of shares based on their relative net assets.
Distributions to Shareholders — Distributions from net investment income and net realized gains, if any, are generally declared and paid annually.
Redemption Fees — Prior to October 9, 2017, the fund may have imposed a 2.00% redemption fee on shares held less than 60 days. The fee was not applicable to all classes. The redemption fee was retained by the fund to help cover transaction costs that long-term investors may bear when the fund sells securities to meet investor redemptions.
Indemnifications — Under the corporation’s organizational documents, its officers and directors are indemnified against certain liabilities arising out of the performance of their duties to the fund. In addition, in the normal course of business, the fund enters into contracts that provide general indemnifications. The maximum exposure under these arrangements is unknown as this would involve future claims that may be made against a fund. The risk of material loss from such claims is considered by management to be remote.
3. Fees and Transactions with Related Parties
Certain officers and directors of the corporation are also officers and/or directors of American Century Companies, Inc. (ACC). The corporation’s investment advisor, ACIM, the corporation's distributor, American Century Investment Services, Inc. (ACIS), and the corporation’s transfer agent, American Century Services, LLC, are wholly owned, directly or indirectly, by ACC.
Management Fees — The corporation has entered into a management agreement with ACIM, under which ACIM provides the fund with investment advisory and management services in exchange for a single, unified management fee (the fee) per class. The agreement provides that all expenses of managing and operating the fund, except distribution and service fees, brokerage expenses, taxes, interest, fees and expenses of the independent directors (including legal counsel fees), and extraordinary expenses, will be paid by ACIM. The fee is computed and accrued daily based on each class's daily net assets and paid monthly in arrears. The difference in the fee among the classes is a result of their separate arrangements for non-Rule 12b-1 shareholder services It is not the result of any difference in advisory or custodial fees or other expenses related to the management of the fund’s assets, which do not vary by class. The rate of the fee is determined by applying a fee rate calculation formula. This formula takes into account the fund’s assets as well as certain assets, if any, of other clients of the investment advisor outside the American Century Investments family of funds (such as subadvised funds and separate accounts) that use very similar investment teams and strategies (strategy assets). During the period ended October 31, 2017, the investment advisor agreed to waive 0.10% of the fund's management fee. The investment advisor expects this waiver to continue until July 31, 2018 and cannot terminate it prior to such date without the approval of the Board of Directors.
The management fee schedule range and the effective annual management fee before and after waiver for each class for the period ended October 31, 2017 are as follows:
|
| | | |
| | Effective Annual Management Fee |
| Management Fee Schedule Range | Before Waiver | After Waiver |
Investor Class | 1.000% to 1.250% | 1.25% | 1.15% |
I Class | 0.800% to 1.050% | 1.05% | 0.95% |
A Class | 1.000% to 1.250% | 1.25% | 1.15% |
R Class | 1.000% to 1.250% | 1.25% | 1.15% |
R6 Class | 0.650% to 0.900% | 0.90% | 0.80% |
Distribution and Service Fees — The Board of Directors has adopted a separate Master Distribution and Individual Shareholder Services Plan for each of the A Class and R Class (collectively the plans), pursuant to Rule 12b-1 of the 1940 Act. The plans provide that the A Class will pay ACIS an annual distribution and service fee of 0.25%. The plans provide that the R Class will pay ACIS an annual distribution and service fee of 0.50%. The fees are computed and accrued daily based on each class’s daily net assets and paid monthly in arrears. The fees are used to pay financial intermediaries for distribution and individual shareholder services. Fees incurred under the plans during the period ended October 31, 2017 are detailed in the Statement of Operations.
Directors' Fees and Expenses — The Board of Directors is responsible for overseeing the investment advisor’s management and operations of the fund. The directors receive detailed information about the fund and its investment advisor regularly throughout the year, and meet at least quarterly with management of the investment advisor to review reports about fund operations. The fund’s officers do not receive compensation from the fund.
Interfund Transactions — The fund may enter into security transactions with other American Century Investments funds and other client accounts of the investment advisor, in accordance with the 1940 Act rules and procedures adopted by the Board of Directors. The rules and procedures require, among other things, that these transactions be effected at the independent current market price of the security. During the period, the interfund purchases and sales were $1,711,956 and $1,041,089, respectively. The effect of interfund transactions on the Statement of Operations was $304,785 in net realized gain (loss) on investment transactions.
4. Investment Transactions
Purchases and sales of investment securities, excluding short-term investments, for the period ended October 31, 2017 were $82,548,437 and $91,085,314, respectively.
5. Capital Share Transactions
Transactions in shares of the fund were as follows:
|
| | | | | | | | | | |
| Year ended October 31, 2017(1) | Year ended
October 31, 2016 |
| Shares | Amount | Shares | Amount |
Investor Class/Shares Authorized | 140,000,000 |
| | 200,000,000 |
| |
Sold | 423,033 |
| $ | 4,625,253 |
| 611,237 |
| $ | 5,868,811 |
|
Issued in reinvestment of distributions | 82,377 |
| 870,726 |
| 1,052,445 |
| 9,808,781 |
|
Redeemed | (1,345,235 | ) | (14,879,140 | ) | (1,942,395 | ) | (18,588,341 | ) |
| (839,825 | ) | (9,383,161 | ) | (278,713 | ) | (2,910,749 | ) |
I Class/Shares Authorized | 70,000,000 |
| | 90,000,000 |
| |
Sold | 119,781 |
| 1,416,036 |
| 19,452 |
| 191,524 |
|
Issued in reinvestment of distributions | 3,089 |
| 33,360 |
| 28,551 |
| 271,806 |
|
Redeemed | (27,307 | ) | (304,458 | ) | (19,365 | ) | (191,346 | ) |
| 95,563 |
| 1,144,938 |
| 28,638 |
| 271,984 |
|
A Class/Shares Authorized | 40,000,000 |
| | N/A |
| |
Sold | 2,442 |
| 25,000 |
| | |
Issued in reinvestment of distributions | 1 |
| 15 |
| | |
| 2,443 |
| 25,015 |
| | |
R Class/Shares Authorized | 40,000,000 |
| | N/A |
| |
Sold | 4,992 |
| 53,749 |
| | |
Issued in reinvestment of distributions | 1 |
| 10 |
| | |
Redeemed | (1 | ) | (15 | ) | | |
| 4,992 |
| 53,744 |
| | |
R6 Class/Shares Authorized | 40,000,000 |
| | N/A |
| |
Sold | 26,971 |
| 304,642 |
| | |
Issued in reinvestment of distributions | 3 |
| 28 |
| | |
Redeemed | (11,034 | ) | (127,860 | ) | | |
| 15,940 |
| 176,810 |
| | |
Net increase (decrease) | (720,887 | ) | $ | (7,982,654 | ) | (250,075 | ) | $ | (2,638,765 | ) |
| |
(1) | December 1, 2016 (commencement of sale) through October 31, 2017 for the A Class, R Class and R6 Class. |
6. Fair Value Measurements
The fund’s investments valuation process is based on several considerations and may use multiple inputs to determine the fair value of the investments held by the fund. In conformity with accounting principles generally accepted in the United States of America, the inputs used to determine a valuation are classified into three broad levels.
• Level 1 valuation inputs consist of unadjusted quoted prices in an active market for identical investments.
• Level 2 valuation inputs consist of direct or indirect observable market data (including quoted prices for
comparable investments, evaluations of subsequent market events, interest rates, prepayment speeds,
credit risk, etc.). These inputs also consist of quoted prices for identical investments initially expressed in
local currencies that are adjusted through translation into U.S. dollars.
• Level 3 valuation inputs consist of unobservable data (including a fund’s own assumptions).
The level classification is based on the lowest level input that is significant to the fair valuation measurement. The valuation inputs are not necessarily an indication of the risks associated with investing in these securities or other financial instruments. There were no significant transfers between levels during the period.
The following is a summary of the level classifications as of period end. The Schedule of Investments provides additional information on the fund’s portfolio holdings.
|
| | | | | | | | |
| Level 1 | Level 2 | Level 3 |
Assets | | | |
Investment Securities | | | |
Common Stocks | $ | 102,440,584 |
| — |
| — |
|
Temporary Cash Investments | 1,325 |
| $ | 1,012,757 |
| — |
|
| $ | 102,441,909 |
| $ | 1,012,757 |
| — |
|
7. Derivative Instruments
Foreign Currency Risk — The fund is subject to foreign currency exchange rate risk in the normal course of pursuing its investment objectives. The value of foreign investments held by a fund may be significantly affected by changes in foreign currency exchange rates. The dollar value of a foreign security generally decreases when the value of the dollar rises against the foreign currency in which the security is denominated and tends to increase when the value of the dollar declines against such foreign currency. A fund may enter into forward foreign currency exchange contracts to reduce a fund's exposure to foreign currency exchange rate fluctuations. The net U.S. dollar value of foreign currency underlying all contractual commitments held by a fund and the resulting unrealized appreciation or depreciation are determined daily. Realized gain or loss is recorded upon the termination of the contract. Net realized and unrealized gains or losses occurring during the holding period of forward foreign currency exchange contracts are a component of net realized gain (loss) on forward foreign currency exchange contract transactions and change in net unrealized appreciation (depreciation) on forward foreign currency exchange contracts, respectively. A fund bears the risk of an unfavorable change in the foreign currency exchange rate underlying the forward contract. Additionally, losses, up to the fair value, may arise if the counterparties do not perform under the contract terms. The fund's average U.S. dollar exposure to foreign currency risk derivative instruments held during the period was $2,270,205.
At period end, the fund did not have any derivative instruments disclosed on the Statement of Assets and Liabilities. For the year ended October 31, 2017, the effect of foreign currency risk derivative instruments on the Statement of Operations was $(37,666) in net realized gain (loss) on forward foreign currency exchange contract transactions and $(36,235) in change in net unrealized appreciation (depreciation) on forward foreign currency exchange contracts.
8. Federal Tax Information
The tax character of distributions paid during the years ended October 31, 2017 and October 31, 2016 were as follows:
|
| | | | | | |
| 2017 | 2016 |
Distributions Paid From | | |
Ordinary income | $ | 930,778 |
| $ | 3,902,759 |
|
Long-term capital gains | — |
| $ | 6,422,715 |
|
The book-basis character of distributions made during the year from net investment income or net realized gains may differ from their ultimate characterization for federal income tax purposes. These differences reflect the differing character of certain income items and net realized gains and losses for financial statement and tax purposes, and may result in reclassification among certain capital accounts on the financial statements.
As of period end, the federal tax cost of investments and the components of distributable earnings on a tax-basis were as follows:
|
| | | |
Federal tax cost of investments | $ | 83,318,944 |
|
Gross tax appreciation of investments | $ | 22,724,011 |
|
Gross tax depreciation of investments | (2,588,289 | ) |
Net tax appreciation (depreciation) of investments | $ | 20,135,722 |
|
Undistributed ordinary income | $ | 2,960,432 |
|
Accumulated long-term gains | $ | 4,207,094 |
|
The difference between book-basis and tax-basis unrealized appreciation (depreciation) is attributable primarily to the tax deferral of losses on wash sales.
|
| | | | | | | | | | | | | | | | | |
For a Share Outstanding Throughout the Years Ended October 31 (except as noted) | | | | | |
Per-Share Data | | | | | | | | | Ratios and Supplemental Data |
| | Income From Investment Operations: | Distributions From: | | | Ratio to Average Net Assets of: | | |
| Net Asset
Value,
Beginning
of Period | Net
Investment
Income
(Loss)(1) | Net
Realized
and
Unrealized
Gain (Loss) | Total From
Investment
Operations | Net
Investment
Income | Net
Realized
Gains | Total
Distributions | Net Asset
Value,
End
of Period | Total
Return(2) | Operating
Expenses | Operating
Expenses
(before
expense
waiver) | Net
Investment
Income
(Loss) | Net
Investment
Income
(Loss)
(before
expense
waiver) | Portfolio
Turnover
Rate | Net
Assets,
End of
Period
(in thousands) |
Investor Class | | | | | | | | | | | | | | |
2017 | $9.82 | 0.07 | 2.36 | 2.43 | (0.10) | — | (0.10) | $12.15 | 24.92% | 1.16% | 1.26% | 0.58% | 0.48% | 85% |
| $98,585 |
|
2016 | $10.74 | 0.10 | 0.08 | 0.18 | (0.12) | (0.98) | (1.10) | $9.82 | 2.20% | 1.23% | 1.25% | 1.04% | 1.02% | 116% |
| $87,888 |
|
2015 | $10.15 | 0.06 | 0.59 | 0.65 | (0.06) | — | (0.06) | $10.74 | 6.40% | 1.26% | 1.26% | 0.54% | 0.54% | 185% |
| $99,141 |
|
2014 | $9.08 | 0.06 | 1.11 | 1.17 | (0.10) | — | (0.10) | $10.15 | 12.96% | 1.25% | 1.25% | 0.59% | 0.59% | 184% |
| $91,093 |
|
2013 | $6.90 | 0.06 | 2.25 | 2.31 | (0.13) | — | (0.13) | $9.08 | 34.11% | 1.25% | 1.25% | 0.80% | 0.80% | 158% |
| $88,256 |
|
I Class(3) | | | | | | | | | | | | | | |
2017 | $10.05 | 0.09 | 2.42 | 2.51 | (0.12) | — | (0.12) | $12.44 | 25.19% | 0.96% | 1.06% | 0.78% | 0.68% | 85% |
| $4,568 |
|
2016 | $10.96 | 0.12 | 0.09 | 0.21 | (0.14) | (0.98) | (1.12) | $10.05 | 2.47% | 1.03% | 1.05% | 1.24% | 1.22% | 116% |
| $2,729 |
|
2015 | $10.36 | 0.08 | 0.60 | 0.68 | (0.08) | — | (0.08) | $10.96 | 6.58% | 1.06% | 1.06% | 0.74% | 0.74% | 185% |
| $2,665 |
|
2014 | $9.27 | 0.09 | 1.11 | 1.20 | (0.11) | — | (0.11) | $10.36 | 13.13% | 1.05% | 1.05% | 0.79% | 0.79% | 184% |
| $2,501 |
|
2013 | $7.03 | 0.07 | 2.31 | 2.38 | (0.14) | — | (0.14) | $9.27 | 34.41% | 1.05% | 1.05% | 1.00% | 1.00% | 158% |
| $317 |
|
A Class | | | | | | | | | | | | | | |
2017(4) | $10.24 | 0.03 | 1.97 | 2.00 | (0.01) | — | (0.01) | $12.23 | 19.50% | 1.41%(6) | 1.51%(6) | 0.26%(6) | 0.16%(6) | 85%(7) |
| $30 |
|
|
| | | | | | | | | | | | | | | | | |
For a Share Outstanding Throughout the Years Ended October 31 (except as noted) | | | | | |
Per-Share Data | | | | | | | | | Ratios and Supplemental Data |
| | Income From Investment Operations: | Distributions From: | | | Ratio to Average Net Assets of: | | |
| Net Asset
Value,
Beginning
of Period | Net
Investment
Income
(Loss)(1) | Net
Realized
and
Unrealized
Gain (Loss) | Total From
Investment
Operations | Net
Investment
Income | Net
Realized
Gains | Total
Distributions | Net Asset
Value,
End
of Period | Total
Return(2) | Operating
Expenses | Operating
Expenses
(before
expense
waiver) | Net
Investment
Income
(Loss) | Net
Investment
Income
(Loss)
(before
expense
waiver) | Portfolio
Turnover
Rate | Net
Assets,
End of
Period
(in thousands) |
R Class | | | | | | | | | | | | | | |
2017(4) | $10.24 | —(5) | 1.97 | 1.97 | —(5) | — | —(5) | $12.21 | 19.28% | 1.66%(6) | 1.76%(6) | (0.01)%(6) | (0.11)%(6) | 85%(7) |
| $61 |
|
R6 Class | | | | | | | | | | | | | | |
2017(4) | $10.48 | 0.09 | 2.02 | 2.11 | (0.01) | — | (0.01) | $12.58 | 20.17% | 0.81%(6) | 0.91%(6) | 0.82%(6) | 0.72%(6) | 85%(7) |
| $201 |
|
|
|
Notes to Financial Highlights |
| |
(1) | Computed using average shares outstanding throughout the period. |
| |
(2) | Total returns are calculated based on the net asset value of the last business day and do not reflect applicable sales charges, if any. Total returns for periods less than one year are not annualized. |
| |
(3) | Prior to April 10, 2017, the I Class was referred to as the Institutional Class. |
| |
(4) | December 1, 2016 (commencement of sale) through October 31, 2017. |
| |
(5) | Per share amount was less than $0.005. |
| |
(7) | Portfolio turnover is calculated at the fund level. Percentage indicated was calculated for the year ended October 31, 2017. |
See Notes to Financial Statements.
|
|
Report of Independent Registered Public Accounting Firm |
To the Board of Directors and Shareholders of American Century Mutual Funds, Inc.:
We have audited the accompanying statement of assets and liabilities, including the schedule of investments, of Adaptive Equity Fund (the “Fund”), one of the funds constituting American Century Mutual Funds, Inc., as of October 31, 2017, and the related statement of operations for the year then ended, the statements of changes in net assets for each of the two years in the period then ended, and the financial highlights for each of the periods presented. These financial statements and financial highlights are the responsibility of the Fund’s management. Our responsibility is to express an opinion on these financial statements and financial highlights based on our audits.
We conducted our audits in accordance with the standards of the Public Company Accounting Oversight Board (United States). Those standards require that we plan and perform the audit to obtain reasonable assurance about whether the financial statements and financial highlights are free of material misstatement. The Fund is not required to have, nor were we engaged to perform, an audit of its internal control over financial reporting. Our audits included consideration of internal control over financial reporting as a basis for designing audit procedures that are appropriate in the circumstances, but not for the purpose of expressing an opinion on the effectiveness of the Fund’s internal control over financial reporting. Accordingly, we express no such opinion. An audit also includes examining, on a test basis, evidence supporting the amounts and disclosures in the financial statements, assessing the accounting principles used and significant estimates made by management, as well as evaluating the overall financial statement presentation. Our procedures included confirmation of securities owned as of October 31, 2017, by correspondence with the custodian and brokers; when replies were not received from brokers, we performed other auditing procedures. We believe that our audits provide a reasonable basis for our opinion.
In our opinion, the financial statements and financial highlights referred to above present fairly, in all material respects, the financial position of Adaptive Equity Fund of American Century Mutual Funds, Inc. as of October 31, 2017, the results of its operations for the year then ended, the changes in its net assets for each of the two years in the period then ended, and the financial highlights for each of the periods presented, in conformity with accounting principles generally accepted in the United States of America.
DELOITTE & TOUCHE LLP
Kansas City, Missouri
December 15, 2017
The Board of Directors
The individuals listed below serve as directors of the funds. Each director will continue to serve in this capacity until death, retirement, resignation or removal from office. The board has adopted a mandatory retirement age for directors who are not “interested persons,” as that term is defined in the Investment Company Act (independent directors). Independent directors shall retire by December 31 of the year in which they reach their 75th birthday.
Mr. Thomas is an “interested person” because he currently serves as President and Chief Executive Officer of American Century Companies, Inc. (ACC), the parent company of American Century Investment Management, Inc. (ACIM or the advisor). The other directors (more than three-fourths of the total number) are independent. They are not employees, directors or officers of, and have no financial interest in, ACC or any of its wholly owned, direct or indirect, subsidiaries, including ACIM, American Century Investment Services, Inc. (ACIS) and American Century Services, LLC (ACS), and they do not have any other affiliations, positions or relationships that would cause them to be considered “interested persons” under the Investment Company Act. The directors serve in this capacity for seven (in the case of Mr. Thomas, 15) registered investment companies in the American Century Investments family of funds.
The following table presents additional information about the directors. The mailing address for each director is 4500 Main Street, Kansas City, Missouri 64111.
|
| | | | | |
Name
(Year of Birth) | Position(s) Held with Funds | Length of Time Served | Principal Occupation(s) During Past 5 Years | Number of American Century Portfolios Overseen by Director | Other Directorships Held During Past 5 Years |
Independent Directors |
|
|
Thomas W. Bunn (1953) | Director | Since 2017 | Retired | 69 | SquareTwo Financial; Barings (formerly Babson Capital Funds Trust) (2013 to 2016) |
Barry Fink
(1955) | Director | Since 2012 (independent since 2016) | Retired; Executive Vice President, ACC (2007 to 2013); President, ACS (2007 to 2013); Chief Operating Officer, ACC (2007 to 2012) | 69 | None |
Andrea C. Hall
(1945) | Director | Since 1997 | Retired | 69 | None |
Jan M. Lewis
(1957) | Director | Since 2011 | Retired; President and Chief Executive Officer, Catholic Charities of Northeast Kansas (human services organization) (2006 to 2013) | 69 | None |
James A. Olson
(1942) | Director and Chairman of the Board | Since 2007 (Chairman since 2014) | Member, Plaza Belmont LLC (private equity fund manager) (1999 to present) | 69 | Saia, Inc. (2002 to 2012) and EPR Properties (2003 to 2013) |
|
| | | | | |
Name
(Year of Birth) | Position(s) Held with Funds | Length of Time Served | Principal Occupation(s) During Past 5 Years | Number of American Century Portfolios Overseen by Director | Other Directorships Held During Past 5 Years |
Independent Directors |
|
|
M. Jeannine Strandjord
(1945) | Director | Since 1994 | Retired | 69 | Euronet Worldwide Inc.; MGP Ingredients, Inc.; and DST Systems Inc. (1996 to 2012) |
John R. Whitten
(1946) | Director | Since 2008 | Retired | 69 | Rudolph Technologies, Inc. |
Stephen E. Yates
(1948) | Director | Since 2012 | Retired | 69 | None |
Interested Director |
|
|
Jonathan S. Thomas
(1963) | Director and President | Since 2007 | President and Chief Executive Officer, ACC (2007 to present). Also serves as Chief Executive Officer, ACS; Executive Vice President, ACIM; Director, ACC, ACIM and other ACC subsidiaries | 114 | BioMed Valley Discoveries, Inc. |
The Statement of Additional Information has additional information about the fund's directors and is available without charge, upon request, by calling 1-800-345-2021.
Officers
The following table presents certain information about the executive officers of the funds. Each officer serves as an officer for each of the 15 investment companies in the American Century family of funds, unless otherwise noted. No officer is compensated for his or her service as an officer of the funds. The listed officers are interested persons of the funds and are appointed or re-appointed on an annual basis. The mailing address for each officer listed below is 4500 Main Street, Kansas City, Missouri 64111.
|
| | |
Name
(Year of Birth) | Offices with the Funds | Principal Occupation(s) During the Past Five Years |
Jonathan S. Thomas
(1963) | Director and President since 2007 | President and Chief Executive Officer, ACC (2007 to present). Also serves as Chief Executive Officer, ACS; Executive Vice President, ACIM; Director, ACC, ACIM and other ACC subsidiaries |
Amy D. Shelton
(1964) | Chief Compliance Officer and Vice President since 2014 | Chief Compliance Officer, American Century funds, (2014 to present); Chief Compliance Officer, ACIM (2014 to present); Chief Compliance Officer, ACIS (2009 to present); Vice President, Client Interactions and Marketing, ACIS (2013 to 2014); Director, Client Interactions and Marketing, ACIS (2007 to 2013). Also serves as Vice President, ACIS |
Charles A. Etherington
(1957) | General Counsel since 2007 and Senior Vice President since 2006 | Attorney, ACC (1994 to present); Vice President, ACC (2005 to present); General Counsel, ACC (2007 to present). Also serves as General Counsel, ACIM, ACS, ACIS and other ACC subsidiaries; and Senior Vice President, ACIM and ACS |
C. Jean Wade
(1964) | Vice President,Treasurer and Chief Financial Officer since 2012 | Vice President, ACS (2000 to present) |
Robert J. Leach
(1966) | Vice President since 2006 and Assistant Treasurer since 2012 | Vice President, ACS (2000 to present) |
David H. Reinmiller
(1963) | Vice President since 2000 | Attorney, ACC (1994 to present); Associate General Counsel, ACC (2001 to present). Also serves as Vice President, ACIM and ACS |
Ward D. Stauffer
(1960) | Secretary since 2005 | Attorney, ACC (2003 to present) |
|
|
Approval of Management Agreement |
At a meeting held on June 29, 2017, the Fund’s Board of Directors (the "Board") unanimously approved the renewal of the management agreement pursuant to which American Century Investment Management, Inc. (the “Advisor”) acts as the investment advisor for the Fund. Under Section 15(c) of the Investment Company Act, contracts for investment advisory services are required to be reviewed, evaluated, and approved by a majority of a fund’s directors (the “Directors”), including a majority of the independent Directors, each year.
Prior to its consideration of the renewal of the management agreement, the Directors requested and reviewed extensive data and information compiled by the Advisor and certain independent providers of evaluation data concerning the Fund and the services provided to the Fund by the Advisor. This review was in addition to the oversight and evaluation undertaken by the Board and its committees on a continual basis and the information received was supplemental to the extensive information that the Board and its committees receive and consider throughout the year.
In connection with its consideration of the renewal of the management agreement, the Board’s review and evaluation of the services provided by the Advisor included, but was not limited to, the following:
| |
• | the nature, extent, and quality of investment management, shareholder services, and other services provided and to be provided to the Fund; |
| |
• | the wide range of other programs and services provided and to be provided to the Fund and its shareholders on a routine and non-routine basis; |
| |
• | the investment performance of the Fund, including data comparing the Fund's performance to appropriate benchmarks and/or a peer group of other mutual funds with similar investment objectives and strategies; |
| |
• | the cost of owning the Fund compared to the cost of owning similar funds; |
| |
• | the compliance policies, procedures, and regulatory experience of the Advisor and the Fund's service providers; |
| |
• | financial data showing the cost of services provided to the Fund, the profitability of the Fund to the Advisor, and the overall profitability of the Advisor; |
| |
• | strategic plans of the Advisor |
| |
• | possible economies of scale associated with the Advisor’s management of the Fund and other accounts under its management; |
| |
• | data comparing services provided and charges to the Advisor's other investment management clients; |
| |
• | acquired fund fees and expenses; |
| |
• | payments and practices by the Fund and the Advisor regarding financial intermediaries, the nature of services provided by intermediaries, and the terms of share classes utilized; and |
| |
• | any collateral benefits derived by the Advisor from the management of the Fund. |
The Directors held three in-person meetings and one telephonic meeting to review and discuss the information provided. The independent Directors also reviewed responses to supplemental information requests and held active discussions with the Advisor regarding the renewal of the management agreement. The independent Directors had the benefit of the advice of their independent counsel throughout the process.
Factors Considered
The Directors considered all of the information provided by the Advisor, the independent data providers, and independent counsel in connection with the approval. They determined that the
information was sufficient for them to evaluate the management agreement for the Fund. In connection with their review, the Directors did not identify any single factor as being all-important or controlling, and each Director may have attributed different levels of importance to different factors. In deciding to renew the management agreement, the Board based its decision on a number of factors, including without limitation the following:
Nature, Extent and Quality of Services - Generally. Under the management agreement, the Advisor is responsible for providing or arranging for all services necessary for the operation of the Fund. The Board noted that the Advisor provides or arranges at its own expense a wide variety of services including without limitation the following:
| |
• | portfolio research and security selection |
| |
• | daily valuation of the Fund’s portfolio |
| |
• | shareholder servicing and transfer agency, including shareholder confirmations, recordkeeping, and communications |
| |
• | legal services (except the independent Directors’ counsel) |
| |
• | regulatory and portfolio compliance |
| |
• | marketing and distribution (except amounts paid by the Fund under Rule 12b-1 plans) |
The Board noted that many of these services have expanded over time in terms of both quantity and complexity in response to shareholder demands, competition in the industry, changing distribution channels, and the changing regulatory environment. The Board noted specifically the resources the Advisor has committed during the year to compliance with the Department of Labor fiduciary rule and share class modernization.
Investment Management Services. The nature of the investment management services provided to the Fund is quite complex and allows Fund shareholders access to professional money management, instant diversification of their investments within an asset class, the opportunity to easily diversify among asset classes by investing in or exchanging among various American Century Investments funds, and liquidity. In evaluating investment performance, the Board expects the Advisor to manage the Fund in accordance with its investment objectives and approved strategies. Further, the Directors recognize that the Advisor has an obligation to monitor trading activities, and in particular to seek the best execution of fund trades, and to evaluate the use of and payment for research. In providing these services, the Advisor utilizes teams of investment professionals (portfolio managers, analysts, research assistants, and securities traders) who require extensive information technology, research, training, compliance, and other systems to conduct their business. The Board, directly and through its Fund Performance Review Committee, provides oversight of the investment performance process. It regularly reviews investment performance information for the Fund, together with comparative information for appropriate benchmarks and/or peer groups of similarly-managed funds, over different time horizons. The Directors also review detailed performance information provided by the Advisor during the management agreement renewal process. If performance concerns are identified, the Fund receives special reviews until performance improves, during which the Board receives a report from the Advisor regarding the reasons for such results (e.g., market conditions, security selection) and any efforts being undertaken to improve performance. The Fund’s performance was above its benchmark for the one-, three-, five-, and ten-year periods reviewed by the Board. The Board found the investment management services provided by the Advisor to the Fund to be satisfactory and consistent with the management agreement.
Shareholder and Other Services. Under the management agreement, the Advisor provides the Fund with a comprehensive package of transfer agency, shareholder, and other services. The Board, directly and through various committees of the Board, regularly reviews reports and
evaluations of such services at its regular meetings. These reports include, but are not limited to, information regarding the operational efficiency and accuracy of the shareholder and transfer agency services provided, staffing levels, shareholder satisfaction (as measured by external as well as internal sources), technology support, new products and services offered to Fund shareholders, securities trading activities, portfolio valuation services, auditing services, and legal and operational compliance activities. Certain aspects of shareholder and transfer agency service level efficiency and the quality of securities trading activities are measured by independent third party providers and are presented in comparison to other fund groups not managed by the Advisor. The Board found the services provided by the Advisor to the Fund under the management agreement to be competitive and of high quality.
Costs of Services and Profitability. The Advisor provides detailed information concerning its cost of providing various services to the Fund, its profitability in managing the Fund (pre- and post-distribution), its overall profitability, and its financial condition. The Directors have reviewed with the Advisor the methodology used to prepare this financial information. This information is considered in evaluating the Advisor’s financial condition, its ability to continue to provide services under the management agreement, and the reasonableness of the current management fee. The Board concluded that the Advisor’s profits were reasonable in light of the services provided to the Fund.
Ethics. The Board generally considers the Advisor’s commitment to providing quality services to shareholders and to conducting its business ethically. They noted that the Advisor’s practices generally meet or exceed industry best practices.
Economies of Scale. The Board also reviewed information provided by the Advisor regarding the possible existence of economies of scale in connection with the management of the Fund. The Board concluded that economies of scale are difficult to measure and predict with precision, especially on a fund-by-fund basis. The Board concluded that the Advisor is appropriately sharing economies of scale through its competitive fee structure, offering competitive fees from fund inception, and through reinvestment in its business to provide shareholders additional content and services. The Board also noted that economies of scale are shared with the Fund and its shareholders through management fee breakpoints that serve to reduce the effective management fee as the assets of the Fund grow.
Comparison to Other Funds’ Fees. The management agreement provides that the Fund pays the Advisor a single, all-inclusive (or unified) management fee for providing all services necessary for the management and operation of the Fund, other than brokerage expenses, expenses attributable to short sales, taxes, interest, extraordinary expenses, and the fees and expenses of the Fund’s independent Directors (including their independent legal counsel) and expenses incurred in connection with the provision of shareholder services and distribution services under a plan adopted pursuant to Rule 12b-1 under the 1940 Act. Under the unified fee structure, the Advisor is responsible for providing all investment advisory, custody, audit, administrative, compliance, recordkeeping, marketing and shareholder services, or arranging and supervising third parties to provide such services. By contrast, most other funds are charged a variety of fees, including an investment advisory fee, a transfer agency fee, an administrative fee, distribution charges, and other expenses. Other than their investment advisory fees and any applicable Rule 12b-1 distribution fees, all other components of the total fees charged by these other funds may be increased without shareholder approval. The Board believes the unified fee structure is a benefit to Fund shareholders because it clearly discloses to shareholders the cost of owning Fund shares, and, since the unified fee cannot be increased without a vote of Fund shareholders, it shifts to the Advisor the risk of increased costs of operating the Fund and provides a direct incentive to minimize administrative inefficiencies. Part of the Board’s analysis of fee levels involves reviewing certain evaluative data compiled by an independent provider comparing the Fund’s unified fee to the total expense ratios of its peers. The unified fee charged to shareholders of the Fund was above the median of the total expense ratios of the Fund’s peer expense universe and was within the range of its peer expense group. The Board discussed with the Advisor the factors that impacted the level of the fee in relation to its peers. The Board and the Advisor agreed to a
temporary reduction of the Fund's annual unified management fee of 0.10% (e.g., the Investor Class unified fee will be reduced from 1.25% to 1.15%) for at least one year, beginning August 1, 2017. The Board concluded that the management fee paid by the Fund to the Advisor under the management agreement is reasonable in light of the services provided to the Fund.
Comparison to Fees and Services Provided to Other Clients of the Advisor. The Directors also requested and received information from the Advisor concerning the nature of the services, fees, costs, and profitability of its advisory services to advisory clients other than the Fund. They observed that these varying types of client accounts require different services and involve different regulatory and entrepreneurial risks than the management of the Fund. The Board analyzed this information and concluded that the fees charged and services provided to the Fund were reasonable by comparison.
Payments to Intermediaries. The Directors also requested and received a description of payments made to intermediaries by the Fund and the Advisor and services provided in response thereto. These payments include various payments made by the Fund or the Advisor to different types of intermediaries and recordkeepers for distribution and service activities provided for the Fund. The Board reviewed such information and received representations from the Advisor that all such payments by the Fund were made pursuant to the Fund's Rule 12b-1 Plan and that all such payments by the Advisor were made from the Advisor's resources and reasonable profits. The Board found the payments to be reasonable in scope and purpose.
Collateral or “Fall-Out” Benefits Derived by the Advisor. The Board considered the existence of collateral benefits the Advisor may receive as a result of its relationship with the Fund. They concluded that the Advisor’s primary business is managing mutual funds and it generally does not use fund or shareholder information to generate profits in other lines of business, and therefore does not derive any significant collateral benefits from them. The Board noted that additional assets from other clients may offer the Advisor some benefit from increased leverage with service providers and counterparties. Additionally, the Advisor receives proprietary research from broker-dealers that execute fund portfolio transactions, which the Board concluded is likely to benefit other clients of the Advisor, as well as Fund shareholders. The Board also determined that the Advisor is able to provide investment management services to certain clients other than the Fund, at least in part, due to its existing infrastructure built to serve the fund complex. The Board concluded that appropriate allocation methodologies had been employed to assign resources and the cost of those resources to these other clients and, where expressly provided, these other client assets may be included with the assets of the Fund to determine breakpoints in the management fee schedule.
Existing Relationship. The Board also considered whether there was any reason for not continuing the existing arrangement with the Advisor. In this regard, the Board was mindful of the potential disruptions of the Fund’s operations and various risks, uncertainties, and other effects that could occur as a result of a decision not to continue such relationship. In particular, the Board recognized that most shareholders have invested in the Fund on the strength of the Advisor’s industry standing and reputation and in the expectation that the Advisor will have a continuing role in providing advisory services to the Fund.
Conclusion of the Directors. As a result of this process, the Board, including all of the independent Directors, taking into account all of the factors discussed above and the information provided by the Advisor and others in connection with its review and throughout the year, determined that the management fee is fair and reasonable in light of the services provided and that the investment management agreement between the Fund and the Advisor should be renewed.
A special meeting of shareholders was held on October 18, 2017, to vote on the following proposal. The proposal received the required votes and was adopted. A summary of voting results is listed below.
To elect four directors to the Board of Directors of American Century Mutual Funds, Inc.: |
| | | | | | | |
| Affirmative |
| Withhold |
Thomas W. Bunn | $ | 19,547,896,641 |
|
| $ | 402,531,816 |
|
Barry Fink | $ | 19,543,961,253 |
|
| $ | 406,467,204 |
|
Jan M. Lewis | $ | 19,556,221,886 |
|
| $ | 394,206,571 |
|
Stephen E. Yates | $ | 19,543,817,152 |
|
| $ | 406,611,305 |
|
The other directors whose term of office continued after the meeting include Jonathan S. Thomas, Andrea C. Hall, James A. Olson, M. Jeannine Strandjord, and John R. Whitten.
Retirement Account Information
As required by law, distributions you receive from certain retirement accounts are subject to federal income tax withholding, unless you elect not to have withholding apply*. Tax will be withheld on the total amount withdrawn even though you may be receiving amounts that are not subject to withholding, such as nondeductible contributions. In such case, excess amounts of withholding could occur. You may adjust your withholding election so that a greater or lesser amount will be withheld.
If you don’t want us to withhold on this amount, you must notify us to not withhold the federal income tax. You may notify us in writing or in certain situations by telephone or through other electronic means. For systematic withdrawals, your withholding election will remain in effect until revoked or changed by filing a new election. You have the right to revoke your election at any time and change your withholding percentage for future distributions.
Remember, even if you elect not to have income tax withheld, you are liable for paying income tax on the taxable portion of your withdrawal. If you elect not to have income tax withheld or you don’t have enough income tax withheld, you may be responsible for payment of estimated tax. You may incur penalties under the estimated tax rules if your withholding and estimated tax payments are not sufficient. You can reduce or defer the income tax on a distribution by directly or indirectly rolling such distribution over to another IRA or eligible plan. You should consult your tax advisor for additional information.
State tax will be withheld if, at the time of your distribution, your address is within one of the mandatory withholding states and you have federal income tax withheld (or as otherwise required by state law). State taxes will be withheld from your distribution in accordance with the respective state rules.
*Some 403(b), 457 and qualified retirement plan distributions may be subject to 20% mandatory withholding, as they are subject to special tax and withholding rules. Your plan administrator or plan sponsor is required to provide you with a special tax notice explaining those rules at the time you request a distribution. If applicable, federal and/or state taxes may be withheld from your distribution amount.
Proxy Voting Policies
A description of the policies that the fund's investment advisor uses in exercising the voting rights associated with the securities purchased and/or held by the fund is available without charge, upon request, by calling 1-800-345-2021. It is also available on the "About Us" page of American Century Investments’ website at americancentury.com and on the Securities and Exchange Commission’s website at sec.gov. Information regarding how the investment advisor voted proxies relating to portfolio securities during the most recent 12-month period ended June 30 is available on the "About Us" page at americancentury.com. It is also available at sec.gov.
Quarterly Portfolio Disclosure
The fund files its complete schedule of portfolio holdings with the Securities and Exchange Commission (SEC) for the first and third quarters of each fiscal year on Form N-Q. The fund’s Forms N-Q are available on the SEC’s website at sec.gov, and may be reviewed and copied at the SEC’s Public Reference Room in Washington, DC. Information on the operation of the Public Reference Room may be obtained by calling 1-800-SEC-0330. The fund also makes its complete schedule of portfolio holdings for the most recent quarter of its fiscal year available on its website at americancentury.com and, upon request, by calling 1-800-345-2021.
Other Tax Information
The following information is provided pursuant to provisions of the Internal Revenue Code.
The fund hereby designates up to the maximum amount allowable as qualified dividend income for the fiscal year ended October 31, 2017.
For corporate taxpayers, the fund hereby designates $930,778, or up to the maximum amount allowable, of ordinary income distributions paid during the fiscal year ended October 31, 2017 as qualified for the corporate dividends received deduction.
|
| | |
| |
| | |
Contact Us | americancentury.com | |
Automated Information Line | 1-800-345-8765 | |
Investor Services Representative | 1-800-345-2021 or 816-531-5575 | |
Investors Using Advisors | 1-800-378-9878 | |
Business, Not-For-Profit, Employer-Sponsored Retirement Plans | 1-800-345-3533 | |
Banks and Trust Companies, Broker-Dealers, Financial Professionals, Insurance Companies | 1-800-345-6488 | |
Telecommunications Relay Service for the Deaf | 711 | |
| | |
American Century Mutual Funds, Inc. | |
| | |
Investment Advisor: American Century Investment Management, Inc. Kansas City, Missouri | |
| | |
This report and the statements it contains are submitted for the general information of our shareholders. The report is not authorized for distribution to prospective investors unless preceded or accompanied by an effective prospectus. | |
| | |
©2017 American Century Proprietary Holdings, Inc. All rights reserved.
CL-ANN-90976 1712 | |
|
| |
| |
| Annual Report |
| |
| October 31, 2017 |
| |
| All Cap Growth Fund |
|
| | |
President’s Letter | 2 |
|
Performance | 3 |
|
Portfolio Commentary | |
|
Fund Characteristics | |
|
Shareholder Fee Example | |
|
Schedule of Investments | |
|
Statement of Assets and Liabilities | |
|
Statement of Operations | |
|
Statement of Changes in Net Assets | |
|
Notes to Financial Statements | |
|
Financial Highlights | |
|
Report of Independent Registered Public Accounting Firm | |
|
Management | |
|
Approval of Management Agreement | |
|
Proxy Voting Results | |
|
Additional Information | |
|
Any opinions expressed in this report reflect those of the author as of the date of the report, and do not necessarily represent the opinions of American Century Investments® or any other person in the American Century Investments organization. Any such opinions are subject to change at any time based upon market or other conditions and American Century Investments disclaims any responsibility to update such opinions. These opinions may not be relied upon as investment advice and, because investment decisions made by American Century Investments funds are based on numerous factors, may not be relied upon as an indication of trading intent on behalf of any American Century Investments fund. Security examples are used for representational purposes only and are not intended as recommendations to purchase or sell securities. Performance information for comparative indices and securities is provided to American Century Investments by third party vendors. To the best of American Century Investments’ knowledge, such information is accurate at the time of printing.
Jonathan Thomas
Dear Investor:
Thank you for reviewing this annual report for the period ended October 31, 2017. Annual reports help convey important information about fund returns, including market factors that affected performance during the reporting period. For additional, updated investment and market insights, we encourage you to visit our website, americancentury.com.
‘Risk-On’ Sentiment Sparked Strong Gains Among Stocks
U.S. stocks delivered robust double-digit gains for the reporting period. The “risk-on” rally began early in the period, following Donald Trump’s election victory in November 2016. Investor expectations for President Trump’s administration to usher in pro-growth policies and reforms drove stock prices higher. In addition, healthy corporate earnings growth and improving gross domestic product (GDP) and other economic data provided additional support for stocks. Against this backdrop, the S&P 500 Index reached several milestone levels during the period and returned 23.63%. In terms of equity styles, riskier and economically sensitive stocks generally remained in favor. For example, small-cap stocks generally outperformed their mid- and large-cap peers, while growth stocks broadly outperformed their value counterparts across the capitalization spectrum. Real estate investment trusts (REITs) advanced, but global property stocks significantly underperformed the broader stock market as interest rates increased, most notably in the U.S., where the Federal Reserve (Fed) raised rates three times during the period.
As stocks soared in the post-election environment, global bonds sold off sharply. President Trump’s policy agenda fueled inflation fears that sent global bond yields sharply higher in late 2016. However, broad bond market performance generally recovered beginning in early 2017, advancing on subdued inflation and continued central bank accommodation to post modest gains for the entire reporting period. Investor preferences for risk also extended to the global fixed-income market, where high-yield corporate and emerging markets bonds were top performers.
As Congress considers tax cuts and other pro-growth reforms and the Fed and other central banks pursue policy normalization, investors likely will face new opportunities and challenges in the months ahead. We continue to believe in a disciplined, diversified, and risk-aware approach, using professionally managed portfolios in pursuit of investment goals. We appreciate your continued trust in us.
Sincerely,
Jonathan Thomas
President and Chief Executive Officer
American Century Investments
|
| | | | | | |
Total Returns as of October 31, 2017 |
| | | Average Annual Returns | |
| Ticker Symbol | 1 year | 5 years | 10 years | Since Inception | Inception Date |
Investor Class | TWGTX | 22.43% | 13.47% | 6.47% | — | 11/25/83 |
Russell 3000 Growth Index | — | 29.80% | 16.70% | 9.05% | — | — |
I Class | ACAJX | 22.64% | 13.69% | — | 15.07% | 9/30/11 |
A Class | ACAQX | | | | | 9/30/11 |
No sales charge | | 22.12% | 13.19% | — | 14.56% | |
With sales charge | | 15.09% | 11.86% | — | 13.45% | |
C Class | ACAHX | 21.21% | 12.34% | — | 13.70% | 9/30/11 |
R Class | ACAWX | 21.79% | 12.91% | — | 14.27% | 9/30/11 |
Average annual returns since inception are presented when ten years of performance history is not available.
Prior to April 10, 2017, the I Class was referred to as the Institutional Class.
Sales charges include initial sales charges and contingent deferred sales charges (CDSCs), as applicable. A Class shares have a 5.75% maximum initial sales charge and may be subject to a maximum CDSC of 1.00%. C Class shares redeemed within 12 months of purchase are subject to a maximum CDSC of 1.00%. The SEC requires that mutual funds provide performance information net of maximum sales charges in all cases where charges could be applied.
Data presented reflect past performance. Past performance is no guarantee of future results. Current performance may be higher or lower than the performance shown. Total returns for periods less than one year are not annualized. Investment return and principal value will fluctuate, and redemption value may be more or less than original cost. Data assumes reinvestment of dividends and capital gains, and none of the charts reflect the deduction of taxes that a shareholder would pay on fund distributions or the redemption of fund shares. To obtain performance data current to the most recent month end, please call 1-800-345-2021 or visit americancentury.com. For additional information about the fund, please consult the prospectus.
|
|
Growth of $10,000 Over 10 Years |
$10,000 investment made October 31, 2007 |
Performance for other share classes will vary due to differences in fee structure. |
|
| |
Value on October 31, 2017 |
| Investor Class — $18,725 |
|
| Russell 3000 Growth Index — $23,794 |
|
|
| | | | |
Total Annual Fund Operating Expenses |
Investor Class | I Class | A Class | C Class | R Class |
1.00% | 0.80% | 1.25% | 2.00% | 1.50% |
The total annual fund operating expenses shown is as stated in the fund’s prospectus current as of the date of this report. The prospectus may vary from the expense ratio shown elsewhere in this report because it is based on a different time period, includes acquired fund fees and expenses, and, if applicable, does not include fee waivers or expense reimbursements.
Data presented reflect past performance. Past performance is no guarantee of future results. Current performance may be higher or lower than the performance shown. Total returns for periods less than one year are not annualized. Investment return and principal value will fluctuate, and redemption value may be more or less than original cost. Data assumes reinvestment of dividends and capital gains, and none of the charts reflect the deduction of taxes that a shareholder would pay on fund distributions or the redemption of fund shares. To obtain performance data current to the most recent month end, please call 1-800-345-2021 or visit americancentury.com. For additional information about the fund, please consult the prospectus.
Portfolio Managers: Michael Orndorff and Marc Scott
Portfolio manager David Hollond retired in April 2017.
Performance Summary
All Cap Growth returned 22.43%* for the 12 months ended October 31, 2017, lagging the 29.80% return of the portfolio’s benchmark, the Russell 3000 Growth Index.
U.S. stock indices posted strong returns during the reporting period. Growth stocks outperformed value stocks by a wide margin across all capitalization ranges. Within the Russell 3000 Growth Index, all sectors posted gains except for energy, which continued to struggle with low oil prices. Information technology, financials, and health care were leading performers in the index.
Our investment process focuses on improving growth instead of the high absolute growth rates that were rewarded by the market. Among sectors, stock selection in the health care sector also helped drive the fund’s underperformance relative to the Russell 3000 Growth Index. Stock choices in the consumer discretionary sector also weighed on results, as did stock selection and an overweight to energy. Stock decisions in the financials and real estate sectors were beneficial, as was avoiding the weak telecommunication services sector. Underweighting real estate was positive as well.
Health Care Stocks Were Key Detractors
Within the health care sector, stock selection among biotechnology stocks detracted from relative performance. Exposure to Shire was a significant detractor. Although the company reported good results, investor concerns over competitive threats to the company’s hemophilia franchise weighed on the shares.
Holdings in the household durables industry hampered performance in the consumer discretionary sector. Newell Brands, which owns solid consumer brands such as Rubbermaid, was a major detractor. Although Newell has executed well and continues to take share from peers, its end markets have decelerated and its core customers are reducing inventory.
Exposure to Range Resources was a major detractor. The mild winter was a headwind for natural gas prices, but prices have since rebounded on more normal weather, exports to Mexico, and strength in liquefied natural gas. Range Resources initially sold off on well issues in the acquired Terryville field, but we have started to see early signs of improvement.
Elsewhere, exposure to Mondelez International detracted as the company’s topline difficulties continued. The food and beverage company has struggled due to weakness in consumer staples and the rejection of its bid for Hershey. However, we have begun to see improvement in emerging markets, where the company has a large presence. Not owning benchmark component NVIDIA hindered results. The visual computing chip company’s gaming and data center businesses have continued to perform well, with the data center segment accelerating.
*All fund returns referenced in this commentary are for Investor Class shares. Performance for other share classes will vary due to differences in fee structure; when Investor Class performance exceeds that of the fund’s benchmark, other share classes may not. See page 3 for returns for all share classes.
Financials Stocks Aided Performance
The financials sector performed well following the 2016 elections on anticipated stronger economic growth, higher interest rates, and deregulation. SVB Financial was a significant contributor that benefited from its strategic focus on the innovation economy and a rising rate environment.
Avoiding several weak real estate investment trusts also benefited performance. We think the sector is likely to struggle as interest rates rise.
Other top contributors included Teleflex. The medical device maker outperformed on solid quarterly earnings results and a positive outlook that topped expectations. Teleflex also announced the acquisition of a large urology treatment provider, which we think will augment growth and profitability. Panera Bread was a significant contributor and was eliminated from the portfolio following the announcement that it would be acquired by JAB Holding.
Not owning Altria benefited performance as the tobacco company’s stock sold off after the Food and Drug Administration began considering regulations to lower nicotine levels in cigarettes to nonaddictive levels. We don’t own the stock because it has been losing share to competing firms such as RJ Reynolds. Exposure to Alibaba Group, China’s largest online marketplace, benefited results. The company’s revenues continued to accelerate as it increased monetization of the online marketplace with more advertisements.
Outlook
Our investment process focuses on companies of all capitalization sizes with improving business fundamentals. The fund’s positioning remains largely stock specific. As of October 31, 2017, the largest overweight allocations relative to the benchmark were in the financials, health care, and information technology sectors. The portfolio was underweight industrials, materials, and telecommunication services.
|
| |
OCTOBER 31, 2017 | |
Top Ten Holdings | % of net assets |
Alphabet, Inc.* | 7.5% |
Amazon.com, Inc. | 4.9% |
Apple, Inc. | 4.5% |
Facebook, Inc., Class A | 4.4% |
Microsoft Corp. | 4.0% |
MasterCard, Inc., Class A | 3.0% |
FedEx Corp. | 2.4% |
Broadcom Ltd. | 1.9% |
Home Depot, Inc. (The) | 1.8% |
Teleflex, Inc. | 1.8% |
*Includes all classes of the issuer held by the fund. | |
| |
Top Five Industries | % of net assets |
Internet Software and Services | 13.2% |
Software | 9.5% |
IT Services | 6.7% |
Internet and Direct Marketing Retail | 6.0% |
Biotechnology | 5.0% |
| |
Types of Investments in Portfolio | % of net assets |
Common Stocks | 99.6% |
Temporary Cash Investments | 0.5% |
Other Assets and Liabilities | (0.1)% |
Fund shareholders may incur two types of costs: (1) transaction costs, including sales charges (loads) on purchase payments and redemption/exchange fees; and (2) ongoing costs, including management fees; distribution and service (12b-1) fees; and other fund expenses. This example is intended to help you understand your ongoing costs (in dollars) of investing in your fund and to compare these costs with the ongoing cost of investing in other mutual funds.
The example is based on an investment of $1,000 made at the beginning of the period and held for the entire period from May 1, 2017 to October 31, 2017.
Actual Expenses
The table provides information about actual account values and actual expenses for each class. You may use the information, together with the amount you invested, to estimate the expenses that you paid over the period. First, identify the share class you own. Then simply divide your account value by $1,000 (for example, an $8,600 account value divided by $1,000 = 8.6), then multiply the result by the number under the heading “Expenses Paid During Period” to estimate the expenses you paid on your account during this period.
If you hold Investor Class shares of any American Century Investments fund, or I Class shares of the American Century Diversified Bond Fund, in an American Century Investments account (i.e., not a financial intermediary or retirement plan account), American Century Investments may charge you a $12.50 semiannual account maintenance fee if the value of those shares is less than $10,000. We will redeem shares automatically in one of your accounts to pay the $12.50 fee. In determining your total eligible investment amount, we will include your investments in all personal accounts (including American Century Investments Brokerage accounts) registered under your Social Security number. Personal accounts include individual accounts, joint accounts, UGMA/UTMA accounts, personal trusts, Coverdell Education Savings Accounts and IRAs (including traditional, Roth, Rollover, SEP-, SARSEP- and SIMPLE-IRAs), and certain other retirement accounts. If you have only business, business retirement, employer-sponsored or American Century Investments Brokerage accounts, you are currently not subject to this fee. If you are subject to the Account Maintenance Fee, your account value could be reduced by the fee amount.
Hypothetical Example for Comparison Purposes
The table also provides information about hypothetical account values and hypothetical expenses based on the actual expense ratio of each class of your fund and an assumed rate of return of 5% per year before expenses, which is not the actual return of a fund’s share class. The hypothetical account values and expenses may not be used to estimate the actual ending account balance or expenses you paid for the period. You may use this information to compare the ongoing costs of investing in your fund and other funds. To do so, compare this 5% hypothetical example with the 5% hypothetical examples that appear in the shareholder reports of the other funds.
Please note that the expenses shown in the table are meant to highlight your ongoing costs only and do not reflect any transactional costs, such as sales charges (loads) or redemption/exchange fees. Therefore, the table is useful in comparing ongoing costs only, and will not help you determine the relative total costs of owning different funds. In addition, if these transactional costs were included, your costs would have been higher.
|
| | | | |
| Beginning
Account Value
5/1/17 | Ending
Account Value
10/31/17 | Expenses Paid
During Period(1)
5/1/17 - 10/31/17 |
Annualized
Expense Ratio(1) |
Actual | | | | |
Investor Class | $1,000 | $1,072.70 | $5.28 | 1.01% |
I Class | $1,000 | $1,073.60 | $4.23 | 0.81% |
A Class | $1,000 | $1,071.50 | $6.58 | 1.26% |
C Class | $1,000 | $1,067.40 | $10.47 | 2.01% |
R Class | $1,000 | $1,070.20 | $7.88 | 1.51% |
Hypothetical | | | | |
Investor Class | $1,000 | $1,020.11 | $5.14 | 1.01% |
I Class | $1,000 | $1,021.12 | $4.13 | 0.81% |
A Class | $1,000 | $1,018.85 | $6.41 | 1.26% |
C Class | $1,000 | $1,015.07 | $10.21 | 2.01% |
R Class | $1,000 | $1,017.59 | $7.68 | 1.51% |
| |
(1) | Expenses are equal to the class's annualized expense ratio listed in the table above, multiplied by the average account value over the period, multiplied by 184, the number of days in the most recent fiscal half-year, divided by 365, to reflect the one-half year period. Annualized expense ratio reflects actual expenses, including any applicable fee waivers or expense reimbursements and excluding any acquired fund fees and expenses. |
OCTOBER 31, 2017
|
| | | | | |
| Shares | Value |
COMMON STOCKS — 99.6% | | |
Aerospace and Defense — 1.3% | | |
Boeing Co. (The) | 22,841 |
| $ | 5,892,521 |
|
L3 Technologies, Inc. | 44,382 |
| 8,307,423 |
|
| | 14,199,944 |
|
Air Freight and Logistics — 3.1% | | |
FedEx Corp. | 118,059 |
| 26,658,903 |
|
XPO Logistics, Inc.(1) | 117,988 |
| 8,182,468 |
|
| | 34,841,371 |
|
Airlines — 0.3% | | |
American Airlines Group, Inc. | 77,857 |
| 3,645,265 |
|
Automobiles — 0.6% | | |
Tesla, Inc.(1) | 21,096 |
| 6,993,957 |
|
Banks — 2.2% | | |
BankUnited, Inc. | 91,377 |
| 3,184,488 |
|
SVB Financial Group(1) | 44,149 |
| 9,680,993 |
|
Zions Bancorporation | 256,623 |
| 11,922,705 |
|
| | 24,788,186 |
|
Beverages — 2.7% | | |
Constellation Brands, Inc., Class A | 39,549 |
| 8,664,790 |
|
Molson Coors Brewing Co., Class B | 70,066 |
| 5,666,238 |
|
Monster Beverage Corp.(1) | 271,873 |
| 15,749,603 |
|
| | 30,080,631 |
|
Biotechnology — 5.0% | | |
AbbVie, Inc. | 150,199 |
| 13,555,460 |
|
Acceleron Pharma, Inc.(1) | 15,172 |
| 591,708 |
|
Alexion Pharmaceuticals, Inc.(1) | 108,990 |
| 13,041,743 |
|
Celgene Corp.(1) | 125,259 |
| 12,647,401 |
|
Incyte Corp.(1) | 42,788 |
| 4,845,741 |
|
Shire plc | 218,940 |
| 10,820,116 |
|
| | 55,502,169 |
|
Capital Markets — 3.2% | | |
Affiliated Managers Group, Inc. | 17,158 |
| 3,199,967 |
|
Cboe Global Markets, Inc. | 55,096 |
| 6,229,154 |
|
Charles Schwab Corp. (The) | 253,762 |
| 11,378,688 |
|
S&P Global, Inc. | 44,894 |
| 7,024,564 |
|
SEI Investments Co. | 115,215 |
| 7,432,520 |
|
| | 35,264,893 |
|
Chemicals — 0.5% | | |
Scotts Miracle-Gro Co. (The) | 55,158 |
| 5,494,840 |
|
Commercial Services and Supplies — 0.7% | | |
Brink's Co. (The) | 94,510 |
| 7,192,211 |
|
Communications Equipment — 0.7% | | |
Palo Alto Networks, Inc.(1) | 51,938 |
| 7,645,274 |
|
Construction and Engineering — 0.5% | | |
Jacobs Engineering Group, Inc. | 93,483 |
| 5,441,645 |
|
|
| | | | | |
| Shares | Value |
Construction Materials — 0.8% | | |
Vulcan Materials Co. | 70,811 |
| $ | 8,621,239 |
|
Consumer Finance — 0.3% | | |
Discover Financial Services | 50,675 |
| 3,371,408 |
|
Containers and Packaging — 1.3% | | |
Ball Corp. | 338,534 |
| 14,533,265 |
|
Electrical Equipment — 0.6% | | |
AMETEK, Inc. | 101,681 |
| 6,862,451 |
|
Electronic Equipment, Instruments and Components — 1.4% | | |
Dolby Laboratories, Inc., Class A | 204,709 |
| 11,860,839 |
|
National Instruments Corp. | 86,835 |
| 3,907,575 |
|
| | 15,768,414 |
|
Equity Real Estate Investment Trusts (REITs) — 1.9% | | |
Crown Castle International Corp. | 101,113 |
| 10,827,180 |
|
SBA Communications Corp.(1) | 65,443 |
| 10,286,331 |
|
| | 21,113,511 |
|
Food Products — 1.2% | | |
Mondelez International, Inc., Class A | 317,746 |
| 13,164,217 |
|
Health Care Equipment and Supplies — 4.0% | | |
Align Technology, Inc.(1) | 16,461 |
| 3,933,850 |
|
Baxter International, Inc. | 174,664 |
| 11,260,588 |
|
Hill-Rom Holdings, Inc. | 46,930 |
| 3,787,720 |
|
Teleflex, Inc. | 83,252 |
| 19,729,059 |
|
West Pharmaceutical Services, Inc. | 62,478 |
| 6,335,269 |
|
| | 45,046,486 |
|
Health Care Providers and Services — 3.2% | | |
Aetna, Inc. | 54,942 |
| 9,341,788 |
|
Amedisys, Inc.(1) | 214,933 |
| 10,340,426 |
|
Envision Healthcare Corp.(1) | 55,595 |
| 2,368,347 |
|
Humana, Inc. | 52,322 |
| 13,360,423 |
|
| | 35,410,984 |
|
Hotels, Restaurants and Leisure — 2.6% | | |
Las Vegas Sands Corp. | 97,867 |
| 6,202,811 |
|
MGM Resorts International | 330,020 |
| 10,346,127 |
|
Starbucks Corp. | 219,380 |
| 12,030,799 |
|
| | 28,579,737 |
|
Household Durables — 1.6% | | |
Newell Brands, Inc. | 437,554 |
| 17,843,452 |
|
Internet and Direct Marketing Retail — 6.0% | | |
Amazon.com, Inc.(1) | 49,359 |
| 54,555,516 |
|
Expedia, Inc. | 35,246 |
| 4,393,766 |
|
Priceline Group, Inc. (The)(1) | 4,239 |
| 8,104,798 |
|
| | 67,054,080 |
|
Internet Software and Services — 13.2% | | |
Alibaba Group Holding Ltd. ADR(1) | 52,413 |
| 9,690,640 |
|
Alphabet, Inc., Class A(1) | 76,573 |
| 79,102,972 |
|
Alphabet, Inc., Class C(1) | 4,676 |
| 4,753,809 |
|
Facebook, Inc., Class A(1) | 270,057 |
| 48,626,463 |
|
LogMeIn, Inc. | 35,503 |
| 4,297,638 |
|
| | 146,471,522 |
|
|
| | | | | |
| Shares | Value |
IT Services — 6.7% | | |
Alliance Data Systems Corp. | 69,047 |
| $ | 15,447,885 |
|
Booz Allen Hamilton Holding Corp. | 142,833 |
| 5,397,659 |
|
DXC Technology Co. | 46,716 |
| 4,275,448 |
|
MasterCard, Inc., Class A | 228,111 |
| 33,936,074 |
|
Visa, Inc., Class A | 139,893 |
| 15,385,432 |
|
| | 74,442,498 |
|
Life Sciences Tools and Services — 0.8% | | |
Bio-Techne Corp. | 38,973 |
| 5,106,243 |
|
Illumina, Inc.(1) | 15,976 |
| 3,278,115 |
|
| | 8,384,358 |
|
Machinery — 3.2% | | |
Ingersoll-Rand plc | 73,417 |
| 6,504,746 |
|
John Bean Technologies Corp. | 8,710 |
| 931,099 |
|
Kennametal, Inc. | 305,329 |
| 13,327,611 |
|
Middleby Corp. (The)(1) | 86,589 |
| 10,035,665 |
|
Snap-on, Inc. | 29,956 |
| 4,726,458 |
|
| | 35,525,579 |
|
Media — 1.2% | | |
Comcast Corp., Class A | 361,340 |
| 13,019,080 |
|
Multiline Retail — 0.5% | | |
Dollar Tree, Inc.(1) | 66,312 |
| 6,050,970 |
|
Oil, Gas and Consumable Fuels — 0.9% | | |
Concho Resources, Inc.(1) | 32,920 |
| 4,418,193 |
|
Pioneer Natural Resources Co. | 20,932 |
| 3,132,893 |
|
Range Resources Corp. | 147,727 |
| 2,675,336 |
|
| | 10,226,422 |
|
Pharmaceuticals — 2.3% | | |
Eli Lilly & Co. | 25,093 |
| 2,056,120 |
|
Jazz Pharmaceuticals plc(1) | 75,651 |
| 10,706,886 |
|
Zoetis, Inc. | 198,918 |
| 12,694,947 |
|
| | 25,457,953 |
|
Road and Rail — 1.0% | | |
Canadian Pacific Railway Ltd. | 33,041 |
| 5,730,631 |
|
Norfolk Southern Corp. | 44,616 |
| 5,863,435 |
|
| | 11,594,066 |
|
Semiconductors and Semiconductor Equipment — 2.6% | | |
Broadcom Ltd. | 79,782 |
| 21,055,267 |
|
KLA-Tencor Corp. | 67,120 |
| 7,308,697 |
|
| | 28,363,964 |
|
Software — 9.5% | | |
Adobe Systems, Inc.(1) | 98,395 |
| 17,234,868 |
|
Autodesk, Inc.(1) | 53,378 |
| 6,670,115 |
|
Electronic Arts, Inc.(1) | 131,295 |
| 15,702,882 |
|
Microsoft Corp. | 529,370 |
| 44,032,996 |
|
Oracle Corp. (New York) | 136,219 |
| 6,933,547 |
|
salesforce.com, Inc.(1) | 151,567 |
| 15,511,367 |
|
| | 106,085,775 |
|
Specialty Retail — 4.7% | | |
Burlington Stores, Inc.(1) | 73,605 |
| 6,910,774 |
|
Home Depot, Inc. (The) | 123,898 |
| 20,539,810 |
|
|
| | | | | |
| Shares | Value |
Lowe's Cos., Inc. | 209,492 |
| $ | 16,748,885 |
|
O'Reilly Automotive, Inc.(1) | 37,917 |
| 7,998,591 |
|
| | 52,198,060 |
|
Technology Hardware, Storage and Peripherals — 4.5% | | |
Apple, Inc. | 298,323 |
| 50,428,520 |
|
Textiles, Apparel and Luxury Goods — 0.5% | | |
NIKE, Inc., Class B | 106,937 |
| 5,880,466 |
|
Tobacco — 2.3% | | |
British American Tobacco plc | 132,702 |
| 8,585,048 |
|
Philip Morris International, Inc. | 166,671 |
| 17,440,453 |
|
| | 26,025,501 |
|
TOTAL COMMON STOCKS
(Cost $712,495,403) | | 1,108,614,364 |
|
TEMPORARY CASH INVESTMENTS — 0.5% | | |
Repurchase Agreement, BMO Capital Markets Corp., (collateralized by various U.S. Treasury obligations, 0.375% - 1.375%, 1/15/27 - 2/15/45, valued at $3,371,837), in a joint trading account at 0.88%, dated 10/31/17, due 11/1/17 (Delivery value $3,298,231) | | 3,298,150 |
|
Repurchase Agreement, Fixed Income Clearing Corp., (collateralized by various U.S. Treasury obligations, 2.50%, 5/15/46, valued at $2,805,752), at 0.34%, dated 10/31/17, due 11/1/17 (Delivery value $2,749,026) | | 2,749,000 |
|
State Street Institutional U.S. Government Money Market Fund, Premier Class | 3,874 |
| 3,874 |
|
TOTAL TEMPORARY CASH INVESTMENTS
(Cost $6,051,024) | | 6,051,024 |
|
TOTAL INVESTMENT SECURITIES — 100.1%
(Cost $718,546,427) | | 1,114,665,388 |
|
OTHER ASSETS AND LIABILITIES — (0.1)% | | (1,098,876 | ) |
TOTAL NET ASSETS — 100.0% | | $ | 1,113,566,512 |
|
|
| | | | | | | | | | |
FORWARD FOREIGN CURRENCY EXCHANGE CONTRACTS |
Currency Purchased | Currency Sold | Counterparty | Settlement Date | Unrealized Appreciation
(Depreciation) |
USD | 4,956,864 |
| CAD | 6,129,707 |
| Morgan Stanley | 12/29/17 | $ | 202,633 |
|
USD | 113,786 |
| CAD | 142,660 |
| Morgan Stanley | 12/29/17 | 3,138 |
|
USD | 233,523 |
| CAD | 291,153 |
| Morgan Stanley | 12/29/17 | 7,703 |
|
GBP | 332,149 |
| USD | 439,569 |
| Morgan Stanley | 12/29/17 | 2,386 |
|
USD | 15,891,465 |
| GBP | 11,765,268 |
| Morgan Stanley | 12/29/17 | 236,667 |
|
USD | 467,864 |
| GBP | 352,118 |
| Morgan Stanley | 12/29/17 | (662 | ) |
USD | 766,477 |
| GBP | 580,959 |
| Morgan Stanley | 12/29/17 | (6,544 | ) |
USD | 666,211 |
| GBP | 506,718 |
| Morgan Stanley | 12/29/17 | (8,025 | ) |
| | | | | | $ | 437,296 |
|
|
| | |
NOTES TO SCHEDULE OF INVESTMENTS |
ADR | - | American Depositary Receipt |
CAD | - | Canadian Dollar |
GBP | - | British Pound |
USD | - | United States Dollar |
See Notes to Financial Statements.
|
|
Statement of Assets and Liabilities |
|
| | | |
OCTOBER 31, 2017 | |
Assets | |
Investment securities, at value (cost of $718,546,427) | $ | 1,114,665,388 |
|
Receivable for investments sold | 3,775,331 |
|
Receivable for capital shares sold | 50,925 |
|
Unrealized appreciation on forward foreign currency exchange contracts | 452,527 |
|
Dividends and interest receivable | 281,832 |
|
| 1,119,226,003 |
|
| |
Liabilities | |
Payable for investments purchased | 4,393,352 |
|
Payable for capital shares redeemed | 294,969 |
|
Unrealized depreciation on forward foreign currency exchange contracts | 15,231 |
|
Accrued management fees | 931,311 |
|
Distribution and service fees payable | 12,067 |
|
Accrued other expenses | 12,561 |
|
| 5,659,491 |
|
| |
Net Assets | $ | 1,113,566,512 |
|
| |
Net Assets Consist of: | |
Capital (par value and paid-in surplus) | $ | 629,967,919 |
|
Accumulated net investment loss | (1,158,503 | ) |
Undistributed net realized gain | 88,200,839 |
|
Net unrealized appreciation | 396,556,257 |
|
| $ | 1,113,566,512 |
|
|
| | | | | | |
| Net Assets | Shares Outstanding | Net Asset Value Per Share |
Investor Class, $0.01 Par Value |
| $1,081,685,667 |
| 31,347,074 |
| $34.51 |
I Class, $0.01 Par Value |
| $1,963,589 |
| 56,082 |
| $35.01 |
A Class, $0.01 Par Value |
| $10,184,708 |
| 300,786 |
| $33.86* |
C Class, $0.01 Par Value |
| $4,461,124 |
| 139,543 |
| $31.97 |
R Class, $0.01 Par Value |
| $15,271,424 |
| 459,707 |
| $33.22 |
*Maximum offering price $35.93 (net asset value divided by 0.9425).
See Notes to Financial Statements.
|
| | | |
YEAR ENDED OCTOBER 31, 2017 | |
Investment Income (Loss) | |
Income: | |
Dividends (net of foreign taxes withheld of $10,617) | $ | 10,440,820 |
|
Interest | 22,270 |
|
| 10,463,090 |
|
| |
Expenses: | |
Management fees | 10,617,670 |
|
Distribution and service fees: | |
A Class | 26,294 |
|
C Class | 44,892 |
|
R Class | 72,160 |
|
Directors' fees and expenses | 32,751 |
|
Other expenses | 33,890 |
|
| 10,827,657 |
|
| |
Net investment income (loss) | (364,567 | ) |
| |
Realized and Unrealized Gain (Loss) | |
Net realized gain (loss) on: | |
Investment transactions | 88,218,375 |
|
Forward foreign currency exchange contract transactions | (760,113 | ) |
Foreign currency translation transactions | (20,213 | ) |
| 87,438,049 |
|
| |
Change in net unrealized appreciation (depreciation) on: | |
Investments | 127,381,436 |
|
Forward foreign currency exchange contracts | (818,457 | ) |
Translation of assets and liabilities in foreign currencies | 7,245 |
|
| 126,570,224 |
|
| |
Net realized and unrealized gain (loss) | 214,008,273 |
|
| |
Net Increase (Decrease) in Net Assets Resulting from Operations | $ | 213,643,706 |
|
See Notes to Financial Statements.
|
|
Statement of Changes in Net Assets |
|
| | | | | | |
YEARS ENDED OCTOBER 31, 2017 AND OCTOBER 31, 2016 |
Increase (Decrease) in Net Assets | October 31, 2017 | October 31, 2016 |
Operations | | |
Net investment income (loss) | $ | (364,567 | ) | $ | (1,153,911 | ) |
Net realized gain (loss) | 87,438,049 |
| 79,210,812 |
|
Change in net unrealized appreciation (depreciation) | 126,570,224 |
| (77,603,568 | ) |
Net increase (decrease) in net assets resulting from operations | 213,643,706 |
| 453,333 |
|
| | |
Distributions to Shareholders | | |
From net realized gains: | | |
Investor Class | (76,992,389 | ) | (66,713,169 | ) |
I Class | (24,235 | ) | (17,255 | ) |
A Class | (892,906 | ) | (698,339 | ) |
C Class | (367,332 | ) | (308,984 | ) |
R Class | (1,122,342 | ) | (870,358 | ) |
Decrease in net assets from distributions | (79,399,204 | ) | (68,608,105 | ) |
| | |
Capital Share Transactions | | |
Net increase (decrease) in net assets from capital share transactions (Note 5) | (21,459,622 | ) | (42,618,561 | ) |
| | |
Net increase (decrease) in net assets | 112,784,880 |
| (110,773,333 | ) |
| | |
Net Assets | | |
Beginning of period | 1,000,781,632 |
| 1,111,554,965 |
|
End of period | $ | 1,113,566,512 |
| $ | 1,000,781,632 |
|
| | |
Accumulated net investment loss | $ | (1,158,503 | ) | $ | (1,483,054 | ) |
See Notes to Financial Statements.
|
|
Notes to Financial Statements |
OCTOBER 31, 2017
1. Organization
American Century Mutual Funds, Inc. (the corporation) is registered under the Investment Company Act of 1940, as amended (the 1940 Act), as an open-end management investment company and is organized as a Maryland corporation. All Cap Growth Fund (the fund) is one fund in a series issued by the corporation. The fund's investment objective is to seek long-term capital growth.
The fund offers the Investor Class, I Class (formerly Institutional Class), A Class, C Class and R Class. The A Class may incur an initial sales charge. The A Class and C Class may be subject to a contingent deferred sales charge.
2. Significant Accounting Policies
The following is a summary of significant accounting policies consistently followed by the fund in preparation of its financial statements. The fund is an investment company and follows accounting and reporting guidance in accordance with accounting principles generally accepted in the United States of America. This may require management to make certain estimates and assumptions at the date of the financial statements. Actual results could differ from these estimates. Management evaluated the impact of events or transactions occurring through the date the financial statements were issued that would merit recognition or disclosure.
Investment Valuations — The fund determines the fair value of its investments and computes its net asset value per share at the close of regular trading (usually 4 p.m. Eastern time) on the New York Stock Exchange (NYSE) on each day the NYSE is open. The Board of Directors has adopted valuation policies and procedures to guide the investment advisor in the fund’s investment valuation process and to provide methodologies for the oversight of the fund’s pricing function.
Equity securities that are listed or traded on a domestic securities exchange are valued at the last reported sales price or at the official closing price as provided by the exchange. Equity securities traded on foreign securities exchanges are generally valued at the closing price of such securities on the exchange where primarily traded or at the close of the NYSE, if that is earlier. If no last sales price is reported, or if local convention or regulation so provides, the mean of the latest bid and asked prices may be used. Securities traded over-the-counter are valued at the mean of the latest bid and asked prices, the last sales price, or the official closing price. Equity securities initially expressed in local currencies are translated into U.S. dollars at the mean of the appropriate currency exchange rate at the close of the NYSE as provided by an independent pricing service.
Open-end management investment companies are valued at the reported net asset value per share. Repurchase agreements are valued at cost, which approximates fair value. Forward foreign currency exchange contracts are valued at the mean of the appropriate forward exchange rate at the close of the NYSE as provided by an independent pricing service.
If the fund determines that the market price for an investment is not readily available or the valuation methods mentioned above do not reflect an investment’s fair value, such investment is valued as determined in good faith by the Board of Directors or its delegate, in accordance with policies and procedures adopted by the Board of Directors. In its determination of fair value, the fund may review several factors including, but not limited to, market information regarding the specific investment or comparable investments and correlation with other investment types, futures indices or general market indicators. Circumstances that may cause the fund to use these procedures to value an investment include, but are not limited to: an investment has been declared in default or is distressed; trading in a security has been suspended during the trading day or a security is not actively trading on its principal exchange; prices received from a regular pricing source are deemed unreliable; or there is a foreign market holiday and no trading occurred.
The fund monitors for significant events occurring after the close of an investment’s primary exchange but before the fund’s net asset value per share is determined. Significant events may include, but are not limited to: corporate announcements and transactions; governmental action and political unrest that could impact a specific investment or an investment sector; or armed conflicts, natural disasters and similar events that could affect investments in a specific country or region. The fund also monitors for significant fluctuations between
domestic and foreign markets, as evidenced by the U.S. market or such other indicators that the Board of Directors, or its delegate, deems appropriate. If significant fluctuations in foreign markets are identified, the fund may apply a model-derived factor to the closing price of equity securities traded on foreign securities exchanges. The factor is based on observable market data as provided by an independent pricing service.
Security Transactions — Security transactions are accounted for as of the trade date. Net realized gains and losses are determined on the identified cost basis, which is also used for federal income tax purposes.
Investment Income — Dividend income less foreign taxes withheld, if any, is recorded as of the ex-dividend date. Distributions received on securities that represent a return of capital or long-term capital gain are recorded as a reduction of cost of investments and/or as a realized gain. The fund may estimate the components of distributions received that may be considered nontaxable distributions or long-term capital gain distributions for income tax purposes. Interest income is recorded on the accrual basis and includes accretion of discounts and amortization of premiums.
Foreign Currency Translations — All assets and liabilities initially expressed in foreign currencies are translated into U.S. dollars at prevailing exchange rates at period end. The fund may enter into spot foreign currency exchange contracts to facilitate transactions denominated in a foreign currency. Purchases and sales of investment securities, dividend and interest income, spot foreign currency exchange contracts, and expenses are translated at the rates of exchange prevailing on the respective dates of such transactions. Net realized and unrealized foreign currency exchange gains or losses related to investment securities are a component of net realized gain (loss) on investment transactions and change in net unrealized appreciation (depreciation) on investments, respectively.
Repurchase Agreements — The fund may enter into repurchase agreements with institutions that American Century Investment Management, Inc. (ACIM) (the investment advisor) has determined are creditworthy pursuant to criteria adopted by the Board of Directors. The fund requires that the collateral, represented by securities, received in a repurchase transaction be transferred to the custodian in a manner sufficient to enable the fund to obtain those securities in the event of a default under the repurchase agreement. ACIM monitors, on a daily basis, the securities transferred to ensure the value, including accrued interest, of the securities under each repurchase agreement is equal to or greater than amounts owed to the fund under each repurchase agreement.
Joint Trading Account — Pursuant to an Exemptive Order issued by the Securities and Exchange Commission, the fund, along with certain other funds in the American Century Investments family of funds, may transfer uninvested cash balances into a joint trading account. These balances are invested in one or more repurchase agreements that are collateralized by U.S. Treasury or Agency obligations.
Income Tax Status — It is the fund’s policy to distribute substantially all net investment income and net realized gains to shareholders and to otherwise qualify as a regulated investment company under provisions of the Internal Revenue Code. Accordingly, no provision has been made for income taxes. The fund files U.S. federal, state, local and non-U.S. tax returns as applicable. The fund's tax returns are subject to examination by the relevant taxing authority until expiration of the applicable statute of limitations, which is generally three years from the date of filing but can be longer in certain jurisdictions. At this time, management believes there are no uncertain tax positions which, based on their technical merit, would not be sustained upon examination and for which it is reasonably possible that the total amounts of unrecognized tax benefits will significantly change in the next twelve months.
Multiple Class — All shares of the fund represent an equal pro rata interest in the net assets of the class to which such shares belong, and have identical voting, dividend, liquidation and other rights and the same terms and conditions, except for class specific expenses and exclusive rights to vote on matters affecting only individual classes. Income, non-class specific expenses, and realized and unrealized capital gains and losses of the fund are allocated to each class of shares based on their relative net assets.
Distributions to Shareholders — Distributions from net investment income and net realized gains, if any, are generally declared and paid annually. The fund may elect to treat a portion of its payment to a redeeming shareholder, which represents the pro rata share of undistributed net investment income and net realized gains, as a distribution for federal income tax purposes (tax equalization).
Indemnifications — Under the corporation’s organizational documents, its officers and directors are indemnified against certain liabilities arising out of the performance of their duties to the fund. In addition, in the normal course of business, the fund enters into contracts that provide general indemnifications. The maximum exposure under these arrangements is unknown as this would involve future claims that may be made against a fund. The risk of material loss from such claims is considered by management to be remote.
3. Fees and Transactions with Related Parties
Certain officers and directors of the corporation are also officers and/or directors of American Century Companies, Inc. (ACC). The corporation’s investment advisor, ACIM, the corporation's distributor, American Century Investment Services, Inc. (ACIS), and the corporation’s transfer agent, American Century Services, LLC, are wholly owned, directly or indirectly, by ACC.
Management Fees — The corporation has entered into a management agreement with ACIM, under which ACIM provides the fund with investment advisory and management services in exchange for a single, unified management fee (the fee) per class. The agreement provides that all expenses of managing and operating the fund, except distribution and service fees, brokerage expenses, taxes, interest, fees and expenses of the independent directors (including legal counsel fees), and extraordinary expenses, will be paid by ACIM. The fee is computed and accrued daily based on each class's daily net assets and paid monthly in arrears. The difference in the fee among the classes is a result of their separate arrangements for non-Rule 12b-1 shareholder services. It is not the result of any difference in advisory or custodial fees or other expenses related to the management of the fund’s assets, which do not vary by class.
The annual management fee for each class is as follows:
|
| | | | |
Investor Class | I Class | A Class | C Class | R Class |
1.000% | 0.800% | 1.000% | 1.000% | 1.000% |
Distribution and Service Fees — The Board of Directors has adopted a separate Master Distribution and Individual Shareholder Services Plan for each of the A Class, C Class and R Class (collectively the plans), pursuant to Rule 12b-1 of the 1940 Act. The plans provide that the A Class will pay ACIS an annual distribution and service fee of 0.25%. The plans provide that the C Class will pay ACIS an annual distribution and service fee of 1.00%, of which 0.25% is paid for individual shareholder services and 0.75% is paid for distribution services. The plans provide that the R Class will pay ACIS an annual distribution and service fee of 0.50%. The fees are computed and accrued daily based on each class’s daily net assets and paid monthly in arrears. The fees are used to pay financial intermediaries for distribution and individual shareholder services. Fees incurred under the plans during the period ended October 31, 2017 are detailed in the Statement of Operations.
Directors' Fees and Expenses — The Board of Directors is responsible for overseeing the investment advisor’s management and operations of the fund. The directors receive detailed information about the fund and its investment advisor regularly throughout the year, and meet at least quarterly with management of the investment advisor to review reports about fund operations. The fund’s officers do not receive compensation from the fund.
Interfund Transactions — The fund may enter into security transactions with other American Century Investments funds and other client accounts of the investment advisor, in accordance with the 1940 Act rules and procedures adopted by the Board of Directors. The rules and procedures require, among other things, that these transactions be effected at the independent current market price of the security. During the period, the interfund purchases and sales were $4,093,260 and $6,280,379, respectively. The effect of interfund transactions on the Statement of Operations was $941,689 in net realized gain (loss) on investment transactions.
4. Investment Transactions
Purchases and sales of investment securities, excluding short-term investments, for the period ended October 31, 2017 were $464,712,658 and $567,959,782, respectively.
5. Capital Share Transactions
Transactions in shares of the fund were as follows:
|
| | | | | | | | | | |
| Year ended October 31, 2017 | Year ended
October 31, 2016 |
| Shares | Amount | Shares | Amount |
Investor Class/Shares Authorized | 275,000,000 |
| | 275,000,000 |
| |
Sold | 1,210,817 |
| $ | 38,104,988 |
| 1,072,643 |
| $ | 32,383,996 |
|
Issued in reinvestment of distributions | 2,577,725 |
| 75,140,689 |
| 2,166,415 |
| 65,165,760 |
|
Redeemed | (4,234,620 | ) | (133,767,212 | ) | (4,719,984 | ) | (142,192,350 | ) |
| (446,078 | ) | (20,521,535 | ) | (1,480,926 | ) | (44,642,594 | ) |
I Class/Shares Authorized | 20,000,000 |
| | 20,000,000 |
| |
Sold | 50,801 |
| 1,694,156 |
| 2,512 |
| 75,506 |
|
Issued in reinvestment of distributions | 821 |
| 24,235 |
| 568 |
| 17,255 |
|
Redeemed | (5,816 | ) | (190,795 | ) | (1,339 | ) | (39,989 | ) |
| 45,806 |
| 1,527,596 |
| 1,741 |
| 52,772 |
|
A Class/Shares Authorized | 20,000,000 |
| | 20,000,000 |
| |
Sold | 119,170 |
| 3,718,038 |
| 108,895 |
| 3,249,461 |
|
Issued in reinvestment of distributions | 30,812 |
| 883,069 |
| 23,456 |
| 696,394 |
|
Redeemed | (206,118 | ) | (6,452,655 | ) | (106,911 | ) | (3,133,904 | ) |
| (56,136 | ) | (1,851,548 | ) | 25,440 |
| 811,951 |
|
C Class/Shares Authorized | 20,000,000 |
| | 20,000,000 |
| |
Sold | 31,689 |
| 924,752 |
| 41,379 |
| 1,195,441 |
|
Issued in reinvestment of distributions | 13,485 |
| 367,332 |
| 10,826 |
| 308,984 |
|
Redeemed | (56,018 | ) | (1,659,903 | ) | (51,903 | ) | (1,488,220 | ) |
| (10,844 | ) | (367,819 | ) | 302 |
| 16,205 |
|
R Class/Shares Authorized | 20,000,000 |
| | 20,000,000 |
| |
Sold | 80,291 |
| 2,431,503 |
| 148,513 |
| 4,392,248 |
|
Issued in reinvestment of distributions | 39,828 |
| 1,122,342 |
| 29,705 |
| 870,358 |
|
Redeemed | (126,203 | ) | (3,800,161 | ) | (138,739 | ) | (4,119,501 | ) |
| (6,084 | ) | (246,316 | ) | 39,479 |
| 1,143,105 |
|
Net increase (decrease) | (473,336 | ) | $ | (21,459,622 | ) | (1,413,964 | ) | $ | (42,618,561 | ) |
6. Fair Value Measurements
The fund’s investments valuation process is based on several considerations and may use multiple inputs to determine the fair value of the investments held by the fund. In conformity with accounting principles generally accepted in the United States of America, the inputs used to determine a valuation are classified into three broad levels.
| |
• | Level 1 valuation inputs consist of unadjusted quoted prices in an active market for identical investments. |
| |
• | Level 2 valuation inputs consist of direct or indirect observable market data (including quoted prices for comparable investments, evaluations of subsequent market events, interest rates, prepayment speeds, credit risk, etc.). These inputs also consist of quoted prices for identical investments initially expressed in local currencies that are adjusted through translation into U.S. dollars. |
| |
• | Level 3 valuation inputs consist of unobservable data (including a fund’s own assumptions). |
The level classification is based on the lowest level input that is significant to the fair valuation measurement. The valuation inputs are not necessarily an indication of the risks associated with investing in these securities or other financial instruments. There were no significant transfers between levels during the period.
The following is a summary of the level classifications as of period end. The Schedule of Investments provides additional information on the fund’s portfolio holdings.
|
| | | | | | | | |
| Level 1 | Level 2 | Level 3 |
Assets | | | |
Investment Securities | | | |
Common Stocks | $ | 1,089,209,200 |
| $ | 19,405,164 |
| — |
|
Temporary Cash Investments | 3,874 |
| 6,047,150 |
| — |
|
| $ | 1,089,213,074 |
| $ | 25,452,314 |
| — |
|
Other Financial Instruments | | | |
Forward Foreign Currency Exchange Contracts | — |
| $ | 452,527 |
| — |
|
| | | |
Liabilities | | | |
Other Financial Instruments | | | |
Forward Foreign Currency Exchange Contracts | — |
| $ | 15,231 |
| — |
|
7. Derivative Instruments
Foreign Currency Risk — The fund is subject to foreign currency exchange rate risk in the normal course of pursuing its investment objectives. The value of foreign investments held by a fund may be significantly affected by changes in foreign currency exchange rates. The dollar value of a foreign security generally decreases when the value of the dollar rises against the foreign currency in which the security is denominated and tends to increase when the value of the dollar declines against such foreign currency. A fund may enter into forward foreign currency exchange contracts to reduce a fund's exposure to foreign currency exchange rate fluctuations. The net U.S. dollar value of foreign currency underlying all contractual commitments held by a fund and the resulting unrealized appreciation or depreciation are determined daily. Realized gain or loss is recorded upon the termination of the contract. Net realized and unrealized gains or losses occurring during the holding period of forward foreign currency exchange contracts are a component of net realized gain (loss) on forward foreign currency exchange contract transactions and change in net unrealized appreciation (depreciation) on forward foreign currency exchange contracts, respectively. A fund bears the risk of an unfavorable change in the foreign currency exchange rate underlying the forward contract. Additionally, losses, up to the fair value, may arise if the counterparties do not perform under the contract terms. The fund's average U.S. dollar exposure to foreign currency risk derivative instruments held during the period was $29,760,406.
The value of foreign currency risk derivative instruments as of October 31, 2017, is disclosed on the Statement of Assets and Liabilities as an asset of $452,527 in unrealized appreciation on forward foreign currency exchange contracts and a liability of $15,231 in unrealized depreciation on forward foreign currency exchange contracts. For the year ended October 31, 2017, the effect of foreign currency risk derivative instruments on the Statement of Operations was $(760,113) in net realized gain (loss) on forward foreign currency exchange contract transactions and $(818,457) in change in net unrealized appreciation (depreciation) on forward foreign currency exchange contracts.
8. Federal Tax Information
The tax character of distributions paid during the years ended October 31, 2017 and October 31, 2016 were as follows:
|
| | | | | | |
| 2017 | 2016 |
Distributions Paid From | | |
Ordinary income | — |
| — |
|
Long-term capital gains | $ | 79,399,204 |
| $ | 68,608,105 |
|
The book-basis character of distributions made during the year from net investment income or net realized gains may differ from their ultimate characterization for federal income tax purposes. These differences reflect the differing character of certain income items and net realized gains and losses for financial statement and tax purposes, and may result in reclassification among certain capital accounts on the financial statements.
As of period end, the federal tax cost of investments and the components of distributable earnings on a tax-basis were as follows:
|
| | | |
Federal tax cost of investments | $ | 719,126,515 |
|
Gross tax appreciation of investments | $ | 411,142,633 |
|
Gross tax depreciation of investments | (15,603,760 | ) |
Net tax appreciation (depreciation) | $ | 395,538,873 |
|
Undistributed ordinary income | — |
|
Accumulated long-term gains | $ | 88,780,927 |
|
Late-year ordinary loss deferral | $ | (721,207 | ) |
The difference between book-basis and tax-basis unrealized appreciation (depreciation) is attributable primarily to the tax deferral of losses on wash sales.
Loss deferrals represent certain qualified losses that the fund has elected to treat as having been incurred in the following fiscal year for federal income tax purposes.
|
| | | | | | | | | | | | | | | |
For a Share Outstanding Throughout the Years Ended October 31 (except as noted) |
Per-Share Data | | | | | | | | Ratios and Supplemental Data | |
| | Income From Investment Operations: | Distributions From: | | | Ratio to Average Net Assets of: | | |
| Net Asset
Value,
Beginning
of Period | Net
Investment
Income
(Loss)(1) | Net
Realized
and
Unrealized
Gain (Loss) | Total From
Investment
Operations | Net
Investment
Income | Net
Realized
Gains | Total
Distributions | Net Asset
Value,
End
of Period | Total
Return(2) | Operating
Expenses | Net
Investment
Income
(Loss) | Portfolio
Turnover
Rate | Net
Assets,
End of
Period
(in thousands) |
Investor Class | | | | | | | | | | | | |
2017 | $30.56 | (0.01) | 6.41 | 6.40 | — | (2.45) | (2.45) | $34.51 | 22.43% | 1.01% | (0.03)% | 44% |
| $1,081,686 |
|
2016 | $32.53 | (0.03) | 0.08 | 0.05 | — | (2.02) | (2.02) | $30.56 | 0.24% | 1.00% | (0.09)% | 49% |
| $971,588 |
|
2015 | $34.71 | (0.05) | 2.71 | 2.66 | — | (4.84) | (4.84) | $32.53 | 9.40% | 1.00% | (0.15)% | 43% |
| $1,082,419 |
|
2014 | $35.63 | (0.06) | 3.64 | 3.58 | — | (4.50) | (4.50) | $34.71 | 11.50% | 1.00% | (0.18)% | 56% |
| $1,079,950 |
|
2013 | $30.44 | 0.12 | 7.22 | 7.34 | (0.10) | (2.05) | (2.15) | $35.63 | 25.72% | 1.00% | 0.38% | 60% |
| $1,081,599 |
|
I Class(3) | | | | | | | | | | | | |
2017 | $30.92 | 0.02 | 6.52 | 6.54 | — | (2.45) | (2.45) | $35.01 | 22.64% | 0.81% | 0.17% | 44% |
| $1,964 |
|
2016 | $32.83 | 0.03 | 0.08 | 0.11 | — | (2.02) | (2.02) | $30.92 | 0.46% | 0.80% | 0.11% | 49% |
| $318 |
|
2015 | $34.92 | 0.01 | 2.74 | 2.75 | — | (4.84) | (4.84) | $32.83 | 9.60% | 0.80% | 0.05% | 43% |
| $280 |
|
2014 | $35.76 | —(4) | 3.66 | 3.66 | — | (4.50) | (4.50) | $34.92 | 11.71% | 0.80% | 0.02% | 56% |
| $191 |
|
2013 | $30.50 | 0.16 | 7.26 | 7.42 | (0.11) | (2.05) | (2.16) | $35.76 | 25.98% | 0.80% | 0.58% | 60% |
| $110 |
|
A Class | | | | | | | | | | | | |
2017 | $30.10 | (0.09) | 6.30 | 6.21 | — | (2.45) | (2.45) | $33.86 | 22.12% | 1.26% | (0.28)% | 44% |
| $10,185 |
|
2016 | $32.15 | (0.10) | 0.07 | (0.03) | — | (2.02) | (2.02) | $30.10 | (0.02)% | 1.25% | (0.34)% | 49% |
| $10,743 |
|
2015 | $34.44 | (0.13) | 2.68 | 2.55 | — | (4.84) | (4.84) | $32.15 | 9.12% | 1.25% | (0.40)% | 43% |
| $10,657 |
|
2014 | $35.47 | (0.14) | 3.61 | 3.47 | — | (4.50) | (4.50) | $34.44 | 11.22% | 1.25% | (0.43)% | 56% |
| $8,837 |
|
2013 | $30.36 | 0.04 | 7.19 | 7.23 | (0.07) | (2.05) | (2.12) | $35.47 | 25.42% | 1.25% | 0.13% | 60% |
| $8,517 |
|
|
| | | | | | | | | | | | | | | |
For a Share Outstanding Throughout the Years Ended October 31 (except as noted) |
Per-Share Data | | | | | | | | Ratios and Supplemental Data | |
| | Income From Investment Operations: | Distributions From: | | | Ratio to Average Net Assets of: | | |
| Net Asset
Value,
Beginning
of Period | Net
Investment
Income
(Loss)(1) | Net
Realized
and
Unrealized
Gain (Loss) | Total From
Investment
Operations | Net
Investment
Income | Net
Realized
Gains | Total
Distributions | Net Asset
Value,
End
of Period | Total
Return(2) | Operating
Expenses | Net
Investment
Income
(Loss) | Portfolio
Turnover
Rate | Net
Assets,
End of
Period
(in thousands) |
C Class | | | | | | | | | | | | |
2017 | $28.75 | (0.30) | 5.97 | 5.67 | — | (2.45) | (2.45) | $31.97 | 21.21% | 2.01% | (1.03)% | 44% |
| $4,461 |
|
2016 | $31.02 | (0.31) | 0.06 | (0.25) | — | (2.02) | (2.02) | $28.75 | (0.77)% | 2.00% | (1.09)% | 49% |
| $4,324 |
|
2015 | $33.62 | (0.35) | 2.59 | 2.24 | — | (4.84) | (4.84) | $31.02 | 8.32% | 2.00% | (1.15)% | 43% |
| $4,656 |
|
2014 | $34.96 | (0.38) | 3.54 | 3.16 | — | (4.50) | (4.50) | $33.62 | 10.40% | 2.00% | (1.18)% | 56% |
| $3,932 |
|
2013 | $30.11 | (0.20) | 7.11 | 6.91 | (0.01) | (2.05) | (2.06) | $34.96 | 24.45% | 2.00% | (0.62)% | 60% |
| $3,321 |
|
R Class | | | | | | | | | | | | |
2017 | $29.65 | (0.16) | 6.18 | 6.02 | — | (2.45) | (2.45) | $33.22 | 21.79% | 1.51% | (0.53)% | 44% |
| $15,271 |
|
2016 | $31.77 | (0.18) | 0.08 | (0.10) | — | (2.02) | (2.02) | $29.65 | (0.25)% | 1.50% | (0.59)% | 49% |
| $13,809 |
|
2015 | $34.16 | (0.20) | 2.65 | 2.45 | — | (4.84) | (4.84) | $31.77 | 8.87% | 1.50% | (0.65)% | 43% |
| $13,544 |
|
2014 | $35.30 | (0.22) | 3.58 | 3.36 | — | (4.50) | (4.50) | $34.16 | 10.93% | 1.50% | (0.68)% | 56% |
| $9,743 |
|
2013 | $30.27 | (0.09) | 7.22 | 7.13 | (0.05) | (2.05) | (2.10) | $35.30 | 25.12% | 1.50% | (0.12)% | 60% |
| $5,828 |
|
|
|
Notes to Financial Highlights |
| |
(1) | Computed using average shares outstanding throughout the period. |
| |
(2) | Total returns are calculated based on the net asset value of the last business day and do not reflect applicable sales charges, if any. Total returns for periods less than one year are not annualized. |
| |
(3) | Prior to April 10, 2017, the I Class was referred to as the Institutional Class. |
| |
(4) | Per-share amount was less than $0.005. |
See Notes to Financial Statements.
|
|
Report of Independent Registered Public Accounting Firm |
To the Board of Directors and Shareholders of American Century Mutual Funds, Inc.:
We have audited the accompanying statement of assets and liabilities, including the schedule of investments, of All Cap Growth Fund (the “Fund”), one of the funds constituting American Century Mutual Funds, Inc., as of October 31, 2017, and the related statement of operations for the year then ended, the statements of changes in net assets for each of the two years in the period then ended, and the financial highlights for each of the five years in the period then ended. These financial statements and financial highlights are the responsibility of the Fund’s management. Our responsibility is to express an opinion on these financial statements and financial highlights based on our audits.
We conducted our audits in accordance with the standards of the Public Company Accounting Oversight Board (United States). Those standards require that we plan and perform the audit to obtain reasonable assurance about whether the financial statements and financial highlights are free of material misstatement. The Fund is not required to have, nor were we engaged to perform, an audit of its internal control over financial reporting. Our audits included consideration of internal control over financial reporting as a basis for designing audit procedures that are appropriate in the circumstances, but not for the purpose of expressing an opinion on the effectiveness of the Fund’s internal control over financial reporting. Accordingly, we express no such opinion. An audit also includes examining, on a test basis, evidence supporting the amounts and disclosures in the financial statements, assessing the accounting principles used and significant estimates made by management, as well as evaluating the overall financial statement presentation. Our procedures included confirmation of securities owned as of October 31, 2017, by correspondence with the custodian and brokers; when replies were not received from brokers, we performed other auditing procedures. We believe that our audits provide a reasonable basis for our opinion.
In our opinion, the financial statements and financial highlights referred to above present fairly, in all material respects, the financial position of All Cap Growth Fund of American Century Mutual Funds, Inc. as of October 31, 2017, the results of its operations for the year then ended, the changes in its net assets for each of the two years in the period then ended, and the financial highlights for each of the five years in the period then ended, in conformity with accounting principles generally accepted in the United States of America.
DELOITTE & TOUCHE LLP
Kansas City, Missouri
December 15, 2017
The Board of Directors
The individuals listed below serve as directors of the funds. Each director will continue to serve in this capacity until death, retirement, resignation or removal from office. The board has adopted a mandatory retirement age for directors who are not “interested persons,” as that term is defined in the Investment Company Act (independent directors). Independent directors shall retire by December 31 of the year in which they reach their 75th birthday.
Mr. Thomas is an “interested person” because he currently serves as President and Chief Executive Officer of American Century Companies, Inc. (ACC), the parent company of American Century Investment Management, Inc. (ACIM or the advisor). The other directors (more than three-fourths of the total number) are independent. They are not employees, directors or officers of, and have no financial interest in, ACC or any of its wholly owned, direct or indirect, subsidiaries, including ACIM, American Century Investment Services, Inc. (ACIS) and American Century Services, LLC (ACS), and they do not have any other affiliations, positions or relationships that would cause them to be considered “interested persons” under the Investment Company Act. The directors serve in this capacity for seven (in the case of Mr. Thomas, 15) registered investment companies in the American Century Investments family of funds.
The following table presents additional information about the directors. The mailing address for each director is 4500 Main Street, Kansas City, Missouri 64111.
|
| | | | | |
Name
(Year of Birth) | Position(s) Held with Funds | Length of Time Served | Principal Occupation(s) During Past 5 Years | Number of American Century Portfolios Overseen by Director | Other Directorships Held During Past 5 Years |
Independent Directors |
|
|
Thomas W. Bunn (1953) | Director | Since 2017 | Retired | 69 | SquareTwo Financial; Barings (formerly Babson Capital Funds Trust) (2013 to 2016) |
Barry Fink
(1955) | Director | Since 2012 (independent since 2016) | Retired; Executive Vice President, ACC (2007 to 2013); President, ACS (2007 to 2013); Chief Operating Officer, ACC (2007 to 2012) | 69 | None |
Andrea C. Hall
(1945) | Director | Since 1997 | Retired | 69 | None |
Jan M. Lewis
(1957) | Director | Since 2011 | Retired; President and Chief Executive Officer, Catholic Charities of Northeast Kansas (human services organization) (2006 to 2013) | 69 | None |
James A. Olson
(1942) | Director and Chairman of the Board | Since 2007 (Chairman since 2014) | Member, Plaza Belmont LLC (private equity fund manager) (1999 to present) | 69 | Saia, Inc. (2002 to 2012) and EPR Properties (2003 to 2013) |
|
| | | | | |
Name
(Year of Birth) | Position(s) Held with Funds | Length of Time Served | Principal Occupation(s) During Past 5 Years | Number of American Century Portfolios Overseen by Director | Other Directorships Held During Past 5 Years |
Independent Directors |
|
|
M. Jeannine Strandjord
(1945) | Director | Since 1994 | Retired | 69 | Euronet Worldwide Inc.; MGP Ingredients, Inc.; and DST Systems Inc. (1996 to 2012) |
John R. Whitten
(1946) | Director | Since 2008 | Retired | 69 | Rudolph Technologies, Inc. |
Stephen E. Yates
(1948) | Director | Since 2012 | Retired | 69 | None |
Interested Director |
|
|
Jonathan S. Thomas
(1963) | Director and President | Since 2007 | President and Chief Executive Officer, ACC (2007 to present). Also serves as Chief Executive Officer, ACS; Executive Vice President, ACIM; Director, ACC, ACIM and other ACC subsidiaries | 114 | BioMed Valley Discoveries, Inc. |
The Statement of Additional Information has additional information about the fund's directors and is available without charge, upon request, by calling 1-800-345-2021.
Officers
The following table presents certain information about the executive officers of the funds. Each officer serves as an officer for each of the 15 investment companies in the American Century family of funds, unless otherwise noted. No officer is compensated for his or her service as an officer of the funds. The listed officers are interested persons of the funds and are appointed or re-appointed on an annual basis. The mailing address for each officer listed below is 4500 Main Street, Kansas City, Missouri 64111.
|
| | |
Name
(Year of Birth) | Offices with the Funds | Principal Occupation(s) During the Past Five Years |
Jonathan S. Thomas
(1963) | Director and President since 2007 | President and Chief Executive Officer, ACC (2007 to present). Also serves as Chief Executive Officer, ACS; Executive Vice President, ACIM; Director, ACC, ACIM and other ACC subsidiaries |
Amy D. Shelton
(1964) | Chief Compliance Officer and Vice President since 2014 | Chief Compliance Officer, American Century funds, (2014 to present); Chief Compliance Officer, ACIM (2014 to present); Chief Compliance Officer, ACIS (2009 to present); Vice President, Client Interactions and Marketing, ACIS (2013 to 2014); Director, Client Interactions and Marketing, ACIS (2007 to 2013). Also serves as Vice President, ACIS |
Charles A. Etherington
(1957) | General Counsel since 2007 and Senior Vice President since 2006 | Attorney, ACC (1994 to present); Vice President, ACC (2005 to present); General Counsel, ACC (2007 to present). Also serves as General Counsel, ACIM, ACS, ACIS and other ACC subsidiaries; and Senior Vice President, ACIM and ACS |
C. Jean Wade
(1964) | Vice President,Treasurer and Chief Financial Officer since 2012 | Vice President, ACS (2000 to present) |
Robert J. Leach
(1966) | Vice President since 2006 and Assistant Treasurer since 2012 | Vice President, ACS (2000 to present) |
David H. Reinmiller
(1963) | Vice President since 2000 | Attorney, ACC (1994 to present); Associate General Counsel, ACC (2001 to present). Also serves as Vice President, ACIM and ACS |
Ward D. Stauffer
(1960) | Secretary since 2005 | Attorney, ACC (2003 to present) |
|
|
Approval of Management Agreement |
At a meeting held on June 29, 2017, the Fund’s Board of Directors (the "Board") unanimously approved the renewal of the management agreement pursuant to which American Century Investment Management, Inc. (the “Advisor”) acts as the investment advisor for the Fund. Under Section 15(c) of the Investment Company Act, contracts for investment advisory services are required to be reviewed, evaluated, and approved by a majority of a fund’s directors (the “Directors”), including a majority of the independent Directors, each year.
Prior to its consideration of the renewal of the management agreement, the Directors requested and reviewed extensive data and information compiled by the Advisor and certain independent providers of evaluation data concerning the Fund and the services provided to the Fund by the Advisor. This review was in addition to the oversight and evaluation undertaken by the Board and its committees on a continual basis and the information received was supplemental to the extensive information that the Board and its committees receive and consider throughout the year.
In connection with its consideration of the renewal of the management agreement, the Board’s review and evaluation of the services provided by the Advisor included, but was not limited to, the following:
| |
• | the nature, extent, and quality of investment management, shareholder services, and other services provided and to be provided to the Fund; |
| |
• | the wide range of other programs and services provided and to be provided to the Fund and its shareholders on a routine and non-routine basis; |
| |
• | the investment performance of the Fund, including data comparing the Fund's performance to appropriate benchmarks and/or a peer group of other mutual funds with similar investment objectives and strategies; |
| |
• | the cost of owning the Fund compared to the cost of owning similar funds; |
| |
• | the compliance policies, procedures, and regulatory experience of the Advisor and the Fund's service providers; |
| |
• | financial data showing the cost of services provided to the Fund, the profitability of the Fund to the Advisor, and the overall profitability of the Advisor; |
| |
• | strategic plans of the Advisor |
| |
• | possible economies of scale associated with the Advisor’s management of the Fund and other accounts under its management; |
| |
• | data comparing services provided and charges to the Advisor's other investment management clients; |
| |
• | acquired fund fees and expenses; |
| |
• | payments and practices by the Fund and the Advisor regarding financial intermediaries, the nature of services provided by intermediaries, and the terms of share classes utilized; and |
| |
• | any collateral benefits derived by the Advisor from the management of the Fund. |
The Directors held three in-person meetings and one telephonic meeting to review and discuss the information provided. The independent Directors also reviewed responses to supplemental information requests and held active discussions with the Advisor regarding the renewal of the management agreement. The independent Directors had the benefit of the advice of their independent counsel throughout the process.
Factors Considered
The Directors considered all of the information provided by the Advisor, the independent data providers, and independent counsel in connection with the approval. They determined that the
information was sufficient for them to evaluate the management agreement for the Fund. In connection with their review, the Directors did not identify any single factor as being all-important or controlling, and each Director may have attributed different levels of importance to different factors. In deciding to renew the management agreement, the Board based its decision on a number of factors, including without limitation the following:
Nature, Extent and Quality of Services - Generally. Under the management agreement, the Advisor is responsible for providing or arranging for all services necessary for the operation of the Fund. The Board noted that the Advisor provides or arranges at its own expense a wide variety of services including without limitation the following:
| |
• | portfolio research and security selection |
| |
• | daily valuation of the Fund’s portfolio |
| |
• | shareholder servicing and transfer agency, including shareholder confirmations, recordkeeping, and communications |
| |
• | legal services (except the independent Directors’ counsel) |
| |
• | regulatory and portfolio compliance |
| |
• | marketing and distribution (except amounts paid by the Fund under Rule 12b-1 plans) |
The Board noted that many of these services have expanded over time in terms of both quantity and complexity in response to shareholder demands, competition in the industry, changing distribution channels, and the changing regulatory environment. The Board noted specifically the resources the Advisor has committed during the year to compliance with the Department of Labor fiduciary rule and share class modernization.
Investment Management Services. The nature of the investment management services provided to the Fund is quite complex and allows Fund shareholders access to professional money management, instant diversification of their investments within an asset class, the opportunity to easily diversify among asset classes by investing in or exchanging among various American Century Investments funds, and liquidity. In evaluating investment performance, the Board expects the Advisor to manage the Fund in accordance with its investment objectives and approved strategies. Further, the Directors recognize that the Advisor has an obligation to monitor trading activities, and in particular to seek the best execution of fund trades, and to evaluate the use of and payment for research. In providing these services, the Advisor utilizes teams of investment professionals (portfolio managers, analysts, research assistants, and securities traders) who require extensive information technology, research, training, compliance, and other systems to conduct their business. The Board, directly and through its Fund Performance Review Committee, provides oversight of the investment performance process. It regularly reviews investment performance information for the Fund, together with comparative information for appropriate benchmarks and/or peer groups of similarly-managed funds, over different time horizons. The Directors also review detailed performance information provided by the Advisor during the management agreement renewal process. If performance concerns are identified, the Fund receives special reviews until performance improves, during which the Board receives a report from the Advisor regarding the reasons for such results (e.g., market conditions, security selection) and any efforts being undertaken to improve performance. The Fund’s performance was above its benchmark for the ten-year period and below its benchmark for the one-, three-, and five-year periods reviewed by the Board. The Board discussed the Fund's performance with the Advisor and was satisfied with the efforts being undertaken by the Advisor. The Board found the investment management services provided by the Advisor to the Fund to be satisfactory and consistent with the management agreement.
Shareholder and Other Services. Under the management agreement, the Advisor provides the Fund with a comprehensive package of transfer agency, shareholder, and other services. The Board, directly and through various committees of the Board, regularly reviews reports and evaluations of such services at its regular meetings. These reports include, but are not limited to, information regarding the operational efficiency and accuracy of the shareholder and transfer agency services provided, staffing levels, shareholder satisfaction (as measured by external as well as internal sources), technology support, new products and services offered to Fund shareholders, securities trading activities, portfolio valuation services, auditing services, and legal and operational compliance activities. Certain aspects of shareholder and transfer agency service level efficiency and the quality of securities trading activities are measured by independent third party providers and are presented in comparison to other fund groups not managed by the Advisor. The Board found the services provided by the Advisor to the Fund under the management agreement to be competitive and of high quality.
Costs of Services and Profitability. The Advisor provides detailed information concerning its cost of providing various services to the Fund, its profitability in managing the Fund (pre- and post-distribution), its overall profitability, and its financial condition. The Directors have reviewed with the Advisor the methodology used to prepare this financial information. This information is considered in evaluating the Advisor’s financial condition, its ability to continue to provide services under the management agreement, and the reasonableness of the current management fee. The Board concluded that the Advisor’s profits were reasonable in light of the services provided to the Fund.
Ethics. The Board generally considers the Advisor’s commitment to providing quality services to shareholders and to conducting its business ethically. They noted that the Advisor’s practices generally meet or exceed industry best practices.
Economies of Scale. The Board also reviewed information provided by the Advisor regarding the possible existence of economies of scale in connection with the management of the Fund. The Board concluded that economies of scale are difficult to measure and predict with precision, especially on a fund-by-fund basis. The Board concluded that the Advisor is appropriately sharing economies of scale through its competitive fee structure, offering competitive fees from fund inception, and through reinvestment in its business to provide shareholders additional content and services.
Comparison to Other Funds’ Fees. The management agreement provides that the Fund pays the Advisor a single, all-inclusive (or unified) management fee for providing all services necessary for the management and operation of the Fund, other than brokerage expenses, expenses attributable to short sales, taxes, interest, extraordinary expenses, and the fees and expenses of the Fund’s independent Directors (including their independent legal counsel) and expenses incurred in connection with the provision of shareholder services and distribution services under a plan adopted pursuant to Rule 12b-1 under the 1940 Act. Under the unified fee structure, the Advisor is responsible for providing all investment advisory, custody, audit, administrative, compliance, recordkeeping, marketing and shareholder services, or arranging and supervising third parties to provide such services. By contrast, most other funds are charged a variety of fees, including an investment advisory fee, a transfer agency fee, an administrative fee, distribution charges, and other expenses. Other than their investment advisory fees and any applicable Rule 12b-1 distribution fees, all other components of the total fees charged by these other funds may be increased without shareholder approval. The Board believes the unified fee structure is a benefit to Fund shareholders because it clearly discloses to shareholders the cost of owning Fund shares, and, since the unified fee cannot be increased without a vote of Fund shareholders, it shifts to the Advisor the risk of increased costs of operating the Fund and provides a direct incentive to minimize administrative inefficiencies. Part of the Board’s analysis of fee levels involves reviewing certain evaluative data compiled by an independent provider comparing the Fund’s unified fee to the total expense ratios of its peers. The unified fee charged to shareholders of the Fund was below the median of the total expense ratios of the Fund’s peer expense universe and was within the range of its peer expense group. The Board concluded that the management fee paid by the
Fund to the Advisor under the management agreement is reasonable in light of the services provided to the Fund.
Comparison to Fees and Services Provided to Other Clients of the Advisor. The Directors also requested and received information from the Advisor concerning the nature of the services, fees, costs, and profitability of its advisory services to advisory clients other than the Fund. They observed that these varying types of client accounts require different services and involve different regulatory and entrepreneurial risks than the management of the Fund. The Board analyzed this information and concluded that the fees charged and services provided to the Fund were reasonable by comparison.
Payments to Intermediaries. The Directors also requested and received a description of payments made to intermediaries by the Fund and the Advisor and services provided in response thereto. These payments include various payments made by the Fund or the Advisor to different types of intermediaries and recordkeepers for distribution and service activities provided for the Fund. The Board reviewed such information and received representations from the Advisor that all such payments by the Fund were made pursuant to the Fund's Rule 12b-1 Plan and that all such payments by the Advisor were made from the Advisor's resources and reasonable profits. The Board found the payments to be reasonable in scope and purpose.
Collateral or “Fall-Out” Benefits Derived by the Advisor. The Board considered the existence of collateral benefits the Advisor may receive as a result of its relationship with the Fund. They concluded that the Advisor’s primary business is managing mutual funds and it generally does not use fund or shareholder information to generate profits in other lines of business, and therefore does not derive any significant collateral benefits from them. The Board noted that additional assets from other clients may offer the Advisor some benefit from increased leverage with service providers and counterparties. Additionally, the Advisor receives proprietary research from broker-dealers that execute fund portfolio transactions, which the Board concluded is likely to benefit other clients of the Advisor, as well as Fund shareholders. The Board also determined that the Advisor is able to provide investment management services to certain clients other than the Fund, at least in part, due to its existing infrastructure built to serve the fund complex. The Board concluded that appropriate allocation methodologies had been employed to assign resources and the cost of those resources to these other clients and, where expressly provided, these other client assets may be included with the assets of the Fund to determine breakpoints in the management fee schedule.
Existing Relationship. The Board also considered whether there was any reason for not continuing the existing arrangement with the Advisor. In this regard, the Board was mindful of the potential disruptions of the Fund’s operations and various risks, uncertainties, and other effects that could occur as a result of a decision not to continue such relationship. In particular, the Board recognized that most shareholders have invested in the Fund on the strength of the Advisor’s industry standing and reputation and in the expectation that the Advisor will have a continuing role in providing advisory services to the Fund.
Conclusion of the Directors. As a result of this process, the Board, including all of the independent Directors, taking into account all of the factors discussed above and the information provided by the Advisor and others in connection with its review and throughout the year, determined that the management fee is fair and reasonable in light of the services provided and that the investment management agreement between the Fund and the Advisor should be renewed.
A special meeting of shareholders was held on October 18, 2017, to vote on the following proposal. The proposal received the required votes and was adopted. A summary of voting results is listed below.
To elect four directors to the Board of Directors of American Century Mutual Funds, Inc.:
|
| | | | | | | |
| Affirmative |
| Withhold |
Thomas W. Bunn | $ | 19,547,896,641 |
|
| $ | 402,531,816 |
|
Barry Fink | $ | 19,543,961,253 |
|
| $ | 406,467,204 |
|
Jan M. Lewis | $ | 19,556,221,886 |
|
| $ | 394,206,571 |
|
Stephen E. Yates | $ | 19,543,817,152 |
|
| $ | 406,611,305 |
|
The other directors whose term of office continued after the meeting include Jonathan S. Thomas, Andrea C. Hall, James A. Olson, M. Jeannine Strandjord, and John R. Whitten.
Retirement Account Information
As required by law, distributions you receive from certain retirement accounts are subject to federal income tax withholding, unless you elect not to have withholding apply*. Tax will be withheld on the total amount withdrawn even though you may be receiving amounts that are not subject to withholding, such as nondeductible contributions. In such case, excess amounts of withholding could occur. You may adjust your withholding election so that a greater or lesser amount will be withheld.
If you don’t want us to withhold on this amount, you must notify us to not withhold the federal income tax. You may notify us in writing or in certain situations by telephone or through other electronic means. For systematic withdrawals, your withholding election will remain in effect until revoked or changed by filing a new election. You have the right to revoke your election at any time and change your withholding percentage for future distributions.
Remember, even if you elect not to have income tax withheld, you are liable for paying income tax on the taxable portion of your withdrawal. If you elect not to have income tax withheld or you don’t have enough income tax withheld, you may be responsible for payment of estimated tax. You may incur penalties under the estimated tax rules if your withholding and estimated tax payments are not sufficient. You can reduce or defer the income tax on a distribution by directly or indirectly rolling such distribution over to another IRA or eligible plan. You should consult your tax advisor for additional information.
State tax will be withheld if, at the time of your distribution, your address is within one of the mandatory withholding states and you have federal income tax withheld (or as otherwise required by state law). State taxes will be withheld from your distribution in accordance with the respective state rules.
*Some 403(b), 457 and qualified retirement plan distributions may be subject to 20% mandatory withholding, as they are subject to special tax and withholding rules. Your plan administrator or plan sponsor is required to provide you with a special tax notice explaining those rules at the time you request a distribution. If applicable, federal and/or state taxes may be withheld from your distribution amount.
Proxy Voting Policies
A description of the policies that the fund's investment advisor uses in exercising the voting rights associated with the securities purchased and/or held by the fund is available without charge, upon request, by calling 1-800-345-2021. It is also available on the "About Us" page of American Century Investments’ website at americancentury.com and on the Securities and Exchange Commission’s website at sec.gov. Information regarding how the investment advisor voted proxies relating to portfolio securities during the most recent 12-month period ended June 30 is available on the "About Us" page at americancentury.com. It is also available at sec.gov.
Quarterly Portfolio Disclosure
The fund files its complete schedule of portfolio holdings with the Securities and Exchange Commission (SEC) for the first and third quarters of each fiscal year on Form N-Q. The fund’s Forms N-Q are available on the SEC’s website at sec.gov, and may be reviewed and copied at the SEC’s Public Reference Room in Washington, DC. Information on the operation of the Public Reference Room may be obtained by calling 1-800-SEC-0330. The fund also makes its complete schedule of portfolio holdings for the most recent quarter of its fiscal year available on its website at americancentury.com and, upon request, by calling 1-800-345-2021.
Other Tax Information
The following information is provided pursuant to provisions of the Internal Revenue Code.
The fund hereby designates $79,399,256, or up to the maximum amount allowable, as long-term capital gain distributions (20% rate gain distributions) for the fiscal year ended October 31, 2017.
The fund utilized earnings and profits of $52 distributed to shareholders on redemption of shares as part of the dividends paid deduction (tax equalization).
|
| | |
| |
| | |
Contact Us | americancentury.com | |
Automated Information Line | 1-800-345-8765 | |
Investor Services Representative | 1-800-345-2021 or 816-531-5575 | |
Investors Using Advisors | 1-800-378-9878 | |
Business, Not-For-Profit, Employer-Sponsored Retirement Plans | 1-800-345-3533 | |
Banks and Trust Companies, Broker-Dealers, Financial Professionals, Insurance Companies | 1-800-345-6488 | |
Telecommunications Relay Service for the Deaf | 711 | |
| | |
American Century Mutual Funds, Inc. | |
| | |
Investment Advisor: American Century Investment Management, Inc. Kansas City, Missouri | |
| | |
This report and the statements it contains are submitted for the general information of our shareholders. The report is not authorized for distribution to prospective investors unless preceded or accompanied by an effective prospectus. | |
| | |
©2017 American Century Proprietary Holdings, Inc. All rights reserved.
CL-ANN-90973 1712 | |
|
| |
| |
| Annual Report |
| |
| October 31, 2017 |
| |
| Balanced Fund |
|
| | |
President’s Letter | 2 |
|
Performance | 3 |
|
Portfolio Commentary | |
|
Fund Characteristics | |
|
Shareholder Fee Example | |
|
Schedule of Investments | |
|
Statement of Assets and Liabilities | |
|
Statement of Operations | |
|
Statement of Changes in Net Assets | |
|
Notes to Financial Statements | |
|
Financial Highlights | |
|
Report of Independent Registered Public Accounting Firm | |
|
Management | |
|
Approval of Management Agreement | |
|
Proxy Voting Results | |
|
Additional Information | |
|
Any opinions expressed in this report reflect those of the author as of the date of the report, and do not necessarily represent the opinions of American Century Investments® or any other person in the American Century Investments organization. Any such opinions are subject to change at any time based upon market or other conditions and American Century Investments disclaims any responsibility to update such opinions. These opinions may not be relied upon as investment advice and, because investment decisions made by American Century Investments funds are based on numerous factors, may not be relied upon as an indication of trading intent on behalf of any American Century Investments fund. Security examples are used for representational purposes only and are not intended as recommendations to purchase or sell securities. Performance information for comparative indices and securities is provided to American Century Investments by third party vendors. To the best of American Century Investments’ knowledge, such information is accurate at the time of printing.
Jonathan Thomas
Dear Investor:
Thank you for reviewing this annual report for the period ended October 31, 2017. Annual reports help convey important information about fund returns, including market factors that affected performance during the reporting period. For additional, updated investment and market insights, we encourage you to visit our website, americancentury.com.
‘Risk-On’ Sentiment Sparked Strong Gains Among Stocks
U.S. stocks delivered robust double-digit gains for the reporting period. The “risk-on” rally began early in the period, following Donald Trump’s election victory in November 2016. Investor expectations for President Trump’s administration to usher in pro-growth policies and reforms drove stock prices higher. In addition, healthy corporate earnings growth and improving gross domestic product (GDP) and other economic data provided additional support for stocks. Against this backdrop, the S&P 500 Index reached several milestone levels during the period and returned 23.63%. In terms of equity styles, riskier and economically sensitive stocks generally remained in favor. For example, small-cap stocks generally outperformed their mid- and large-cap peers, while growth stocks broadly outperformed their value counterparts across the capitalization spectrum. Real estate investment trusts (REITs) advanced, but global property stocks significantly underperformed the broader stock market as interest rates increased, most notably in the U.S., where the Federal Reserve (Fed) raised rates three times during the period.
As stocks soared in the post-election environment, global bonds sold off sharply. President Trump’s policy agenda fueled inflation fears that sent global bond yields sharply higher in late 2016. However, broad bond market performance generally recovered beginning in early 2017, advancing on subdued inflation and continued central bank accommodation to post modest gains for the entire reporting period. Investor preferences for risk also extended to the global fixed-income market, where high-yield corporate and emerging markets bonds were top performers.
As Congress considers tax cuts and other pro-growth reforms and the Fed and other central banks pursue policy normalization, investors likely will face new opportunities and challenges in the months ahead. We continue to believe in a disciplined, diversified, and risk-aware approach, using professionally managed portfolios in pursuit of investment goals. We appreciate your continued trust in us.
Sincerely,
Jonathan Thomas
President and Chief Executive Officer
American Century Investments
|
| | | | | | |
Total Returns as of October 31, 2017 | | |
| | | Average Annual Returns | |
| Ticker Symbol | 1 year | 5 years | 10 years | Since Inception | Inception Date |
Investor Class | TWBIX | 13.78% | 8.62% | 5.99% | — | 10/20/88 |
Blended Index | — | 14.08% | 9.88% | 6.48% | — | — |
S&P 500 Index | — | 23.63% | 15.17% | 7.51% | — | — |
Bloomberg Barclays U.S. Aggregate Bond Index | — | 0.90% | 2.03% | 4.18% | — | — |
I Class | ABINX | 13.99% | 8.84% | 6.20% | — | 5/1/00 |
R5 Class | ABGNX | — | — | — | 7.21% | 4/10/17 |
Average annual returns since inception are presented when ten years of performance history is not available.
The blended index combines monthly returns of two widely known indices in proportion to the asset mix of the fund. The S&P 500 Index represents 60% of the index and the remaining 40% is represented by the Barclays U.S. Aggregate Bond Index. Prior to April 10, 2017, the I Class was referred to as the Institutional Class.
Data presented reflect past performance. Past performance is no guarantee of future results. Current performance may be higher or lower than the performance shown. Total returns for periods less than one year are not annualized. Investment return and principal value will fluctuate, and redemption value may be more or less than original cost. Data assumes reinvestment of dividends and capital gains, and none of the charts reflect the deduction of taxes that a shareholder would pay on fund distributions or the redemption of fund shares. To obtain performance data current to the most recent month end, please call 1-800-345-2021 or visit americancentury.com. For additional information about the fund, please consult the prospectus.
|
|
Growth of $10,000 Over 10 Years |
$10,000 investment made October 31, 2007 |
Performance for other share classes will vary due to differences in fee structure. |
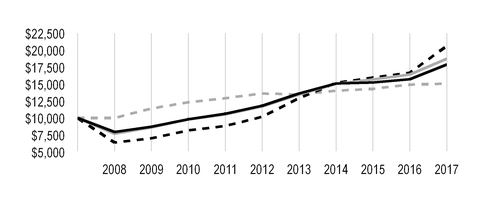
|
| |
Value on October 31, 2017 |
| Investor Class — $17,892 |
|
| Blended Index — $18,734 |
|
| S&P 500 Index — $20,638 |
|
| Bloomberg Barclays U.S. Aggregate Bond Index — $15,070 |
|
|
| | |
Total Annual Fund Operating Expenses |
Investor Class | I Class | R5 Class |
0.91% | 0.71% | 0.71% |
The total annual fund operating expenses shown is as stated in the fund’s prospectus current as of the date of this report. The prospectus may vary from the expense ratio shown elsewhere in this report because it is based on a different time period, includes acquired fund fees and expenses, and, if applicable, does not include fee waivers or expense reimbursements.
Data presented reflect past performance. Past performance is no guarantee of future results. Current performance may be higher or lower than the performance shown. Total returns for periods less than one year are not annualized. Investment return and principal value will fluctuate, and redemption value may be more or less than original cost. Data assumes reinvestment of dividends and capital gains, and none of the charts reflect the deduction of taxes that a shareholder would pay on fund distributions or the redemption of fund shares. To obtain performance data current to the most recent month end, please call 1-800-345-2021 or visit americancentury.com. For additional information about the fund, please consult the prospectus.
Equity Portfolio Managers: Claudia Musat and Steven Rossi
Fixed-Income Portfolio Managers: Dave MacEwen, Bob Gahagan, and Brian Howell
Performance Summary
Balanced returned 13.78%* for the 12 months ended October 31, 2017. By comparison, the fund’s benchmark (a blended index consisting of 60% S&P 500 Index and 40% Bloomberg Barclays U.S. Aggregate Bond Index) returned 14.08%. Balanced seeks long-term capital growth and current income by investing approximately 60% of its assets in equity securities and the remainder in bonds and other fixed-income securities. The purpose of the broad bond market exposure is to reduce the volatility of the equity portfolio, providing a more attractive overall risk-return profile for investors. The total fund’s drivers of both absolute and relative returns, however, are typically a function of the equity allocation. Therefore, the performance attribution discussion focuses primarily on the equity segment.
Industrials, Real Estate, Telecommunication Services Led Equity Gains
Stock selection in the industrials sector, particularly in the industrial conglomerates and the aerospace and defense industries, was a key contributor to performance. Leading individual holdings in the sector included an underweight in conglomerate General Electric and an overweight in aircraft manufacturer Boeing. GE reported weak earnings and revenues and had low ratings in our growth and quality factors. In contrast, Boeing had strong earnings and scored strongly across all factors.
Real estate, telecommunication services, and consumer discretionary stocks also added to the fund’s relative performance. An underweight to real estate investment trusts (REITs) combined with stock selection to produce positive relative results. In telecommunication services, significant underweights to wireless service providers Verizon Communications and AT&T drove performance as they faced an increasingly competitive landscape. Verizon scored poorly on growth and quality factors. Within consumer discretionary, stock selection in specialty retail was strong.
Other top individual holdings included chipmaker Applied Materials, on average the fund’s second-largest overweight after Boeing during the period, and semiconductor manufacturing equipment maker Lam Research, the largest overweight at period-end, both of which scored very well on all factors.
Financials and Consumer Staples Largest Equity Detractors
The largest detractors from relative performance were the financials and consumer staples sectors along with health care. In financials, selection among banks was weak, and an underweight to the sector hurt as it had strong performance. An underweight to Bank of America hurt relative results. We added to our position in BoA over the course of the fiscal year, but nevertheless held less than the benchmark on average in a period when the stock performed very well. In consumer staples, selection in household products stocks was weak, with Spectrum Brand Holdings disappointing as it missed quarterly earnings estimates. Consequently, its ratings in growth, quality, and sentiment eroded during the 12-month period.
*All fund returns referenced in this commentary are for Investor Class shares. Performance for other share classes will vary due to differences in fee structure; when Investor Class performance exceeds that of the fund's benchmark, other share classes may not. See page 3 for returns for all share classes.
Elsewhere, positions in mobile chipmaker Qualcomm and Barrick Gold were other major individual detractors. Qualcomm had a rocky year, facing tough competition and handling a costly lawsuit from Apple. Barrick underperformed amid production disruptions at one of its mines and higher-than-expected production costs, resulting in disappointing earnings. Our alpha forecasts updated quickly to reflect the new information, so we eliminated our stake in Qualcomm and began to reduce our position in Barrick.
Bonds Performance Subdued
Bond market performance was modestly positive during the year. Global bonds sold off immediately after the President Trump’s surprise election win last November, which sparked a strong stock rally. Anticipation of inflationary pro-growth economic policies and rising expectations of more hawkish monetary policy by the Federal Reserve led to a bond market pullback. However, as the year progressed, benign inflation and continued central bank accommodative policies led to modest fixed-income market gains.
High-yield corporate and emerging markets bonds led the market in a “risk-on” environment in which investors sought out yield. Lower-rated corporate bonds outpaced higher-quality bonds. At the other extreme, U.S. Treasuries lagged the overall market, particularly longer-duration Treasuries. The yield curve flattened over the period as the Fed’s three quarter-point interest rate increases caused yields on shorter-term bonds to rise while a lack of inflationary pressure held longer-term rates down. In this environment, the fixed-income portion of Balanced Fund advanced, but slightly trailed the 0.9% return of its benchmark. One detracting aspect was the fund’s relatively long duration (bond price sensitivity to interest rate changes) positioning during the early post-election sell-off. The fund soon adopted a neutral duration with respect to its benchmark. On the positive side, the portfolio benefited from its overweight to higher-yielding credit sectors.
Outlook
The U.S. continues to enjoy modest but positive economic growth, a strong job market, low interest rates, and relatively muted inflation. Looking ahead, with strong economic fundamentals unchanged, a synchronized global recovery underway, and a cautious approach to rate normalization by the Fed, we anticipate little change in the interest-rate environment at either end of the yield curve. A successful adoption of the Trump administration’s tax and fiscal agenda could boost U.S. stocks, and lead to higher rates, rising inflation, and a steeper yield curve. However, in the absence of wage inflation pressures, we believe inflation risks remain low. Also, if efforts to pass tax reform or other U.S. government policy initiatives fail, rates may remain low longer, and stock prices could sag. We see growing opportunities in non-U.S. markets, particularly in Europe. We believe that with continued uncertainty on many fronts, a diversified approach, involving exposure to a wide range of non-correlating asset classes, is a prudent approach.
|
| |
OCTOBER 31, 2017 | |
Key Fixed-Income Portfolio Statistics | |
Weighted Average Life | 8.0 years |
Average Duration (effective) | 6.0 years |
| |
Top Ten Common Stocks | % of net assets |
Alphabet, Inc., Class A | 2.2% |
Microsoft Corp. | 2.1% |
Apple, Inc. | 2.1% |
Amazon.com, Inc. | 1.7% |
Facebook, Inc., Class A | 1.7% |
Exxon Mobil Corp. | 1.4% |
Intel Corp. | 1.2% |
UnitedHealth Group, Inc. | 1.1% |
Pfizer, Inc. | 1.0% |
JPMorgan Chase & Co. | 1.0% |
| |
Top Five Common Stocks Industries | % of net assets |
Software | 4.6% |
Banks | 4.1% |
Internet Software and Services | 3.9% |
Semiconductors and Semiconductor Equipment | 3.7% |
Pharmaceuticals | 2.8% |
| |
Types of Investments in Portfolio | % of net assets |
Common Stocks | 60.7% |
Corporate Bonds | 11.7% |
U.S. Treasury Securities | 11.6% |
U.S. Government Agency Mortgage-Backed Securities | 9.3% |
Collateralized Mortgage Obligations | 2.8% |
Asset-Backed Securities | 2.3% |
Commercial Mortgage-Backed Securities | 1.9% |
U.S. Government Agency Securities | 0.8% |
Municipal Securities | 0.5% |
Sovereign Governments and Agencies | 0.4% |
Temporary Cash Investments | 2.3% |
Other Assets and Liabilities | (4.3)% |
Fund shareholders may incur two types of costs: (1) transaction costs, including sales charges (loads) on purchase payments and redemption/exchange fees; and (2) ongoing costs, including management fees; distribution and service (12b-1) fees; and other fund expenses. This example is intended to help you understand your ongoing costs (in dollars) of investing in your fund and to compare these costs with the ongoing cost of investing in other mutual funds.
The example is based on an investment of $1,000 made at the beginning of the period and held for the entire period from May 1, 2017 to October 31, 2017.
Actual Expenses
The table provides information about actual account values and actual expenses for each class. You may use the information, together with the amount you invested, to estimate the expenses that you paid over the period. First, identify the share class you own. Then simply divide your account value by $1,000 (for example, an $8,600 account value divided by $1,000 = 8.6), then multiply the result by the number under the heading “Expenses Paid During Period” to estimate the expenses you paid on your account during this period.
If you hold Investor Class shares of any American Century Investments fund, or I Class shares of the American Century Diversified Bond Fund, in an American Century Investments account (i.e., not a financial intermediary or retirement plan account), American Century Investments may charge you a $12.50 semiannual account maintenance fee if the value of those shares is less than $10,000. We will redeem shares automatically in one of your accounts to pay the $12.50 fee. In determining your total eligible investment amount, we will include your investments in all personal accounts (including American Century Investments Brokerage accounts) registered under your Social Security number. Personal accounts include individual accounts, joint accounts, UGMA/UTMA accounts, personal trusts, Coverdell Education Savings Accounts and IRAs (including traditional, Roth, Rollover, SEP-, SARSEP- and SIMPLE-IRAs), and certain other retirement accounts. If you have only business, business retirement, employer-sponsored or American Century Investments Brokerage accounts, you are currently not subject to this fee. If you are subject to the Account Maintenance Fee, your account value could be reduced by the fee amount.
Hypothetical Example for Comparison Purposes
The table also provides information about hypothetical account values and hypothetical expenses based on the actual expense ratio of each class of your fund and an assumed rate of return of 5% per year before expenses, which is not the actual return of a fund’s share class. The hypothetical account values and expenses may not be used to estimate the actual ending account balance or expenses you paid for the period. You may use this information to compare the ongoing costs of investing in your fund and other funds. To do so, compare this 5% hypothetical example with the 5% hypothetical examples that appear in the shareholder reports of the other funds.
Please note that the expenses shown in the table are meant to highlight your ongoing costs only and do not reflect any transactional costs, such as sales charges (loads) or redemption/exchange fees. Therefore, the table is useful in comparing ongoing costs only, and will not help you determine the relative total costs of owning different funds. In addition, if these transactional costs were included, your costs would have been higher.
|
| | | | |
| Beginning
Account Value
5/1/17 | Ending
Account Value
10/31/17 | Expenses Paid
During Period(1)
5/1/17 - 10/31/17 |
Annualized
Expense Ratio(1) |
Actual | | | | |
Investor Class | $1,000 | $1,059.50 | $4.72 | 0.91% |
I Class | $1,000 | $1,060.60 | $3.69 | 0.71% |
R5 Class | $1,000 | $1,061.00 | $3.69 | 0.71% |
Hypothetical | | | | |
Investor Class | $1,000 | $1,020.62 | $4.63 | 0.91% |
I Class | $1,000 | $1,021.63 | $3.62 | 0.71% |
R5 Class | $1,000 | $1,021.63 | $3.62 | 0.71% |
| |
(1) | Expenses are equal to the class's annualized expense ratio listed in the table above, multiplied by the average account value over the period, multiplied by 184, the number of days in the most recent fiscal half-year, divided by 365, to reflect the one-half year period. Annualized expense ratio reflects actual expenses, including any applicable fee waivers or expense reimbursements and excluding any acquired fund fees and expenses. |
OCTOBER 31, 2017
|
| | | | | | | |
| | Shares/
Principal Amount | Value |
COMMON STOCKS — 60.7% | | | |
Aerospace and Defense — 1.6% | | | |
Boeing Co. (The) | | 34,035 |
| $ | 8,780,349 |
|
Curtiss-Wright Corp. | | 7,242 |
| 856,367 |
|
General Dynamics Corp. | | 13,038 |
| 2,646,453 |
|
United Technologies Corp. | | 19,439 |
| 2,328,015 |
|
| | | 14,611,184 |
|
Auto Components — 0.8% | | | |
BorgWarner, Inc. | | 39,831 |
| 2,099,890 |
|
Delphi Automotive plc | | 49,947 |
| 4,963,733 |
|
| | | 7,063,623 |
|
Automobiles — 0.6% | | | |
Ford Motor Co. | | 411,772 |
| 5,052,442 |
|
Banks — 4.1% | | | |
Bank of America Corp. | | 228,934 |
| 6,270,502 |
|
Citigroup, Inc. | | 21,344 |
| 1,568,784 |
|
First Citizens BancShares, Inc., Class A | | 963 |
| 390,015 |
|
JPMorgan Chase & Co. | | 89,402 |
| 8,994,735 |
|
PNC Financial Services Group, Inc. (The) | | 10,787 |
| 1,475,554 |
|
SunTrust Banks, Inc. | | 83,474 |
| 5,025,970 |
|
U.S. Bancorp | | 114,862 |
| 6,246,196 |
|
Wells Fargo & Co. | | 109,503 |
| 6,147,498 |
|
| | | 36,119,254 |
|
Beverages — 0.1% | | | |
Boston Beer Co., Inc. (The), Class A(1) | | 2,376 |
| 423,047 |
|
Coca-Cola Co. (The) | | 1,209 |
| 55,590 |
|
| | | 478,637 |
|
Biotechnology — 2.7% | | | |
AbbVie, Inc. | | 91,702 |
| 8,276,106 |
|
Amgen, Inc. | | 40,984 |
| 7,181,217 |
|
Biogen, Inc.(1) | | 8,171 |
| 2,546,574 |
|
Celgene Corp.(1) | | 50,418 |
| 5,090,705 |
|
Gilead Sciences, Inc. | | 12,241 |
| 917,585 |
|
| | | 24,012,187 |
|
Building Products — 0.6% | | | |
Allegion plc | | 12,259 |
| 1,022,278 |
|
Owens Corning | | 50,602 |
| 4,184,279 |
|
| | | 5,206,557 |
|
Capital Markets — 1.1% | | | |
Affiliated Managers Group, Inc. | | 9,294 |
| 1,733,331 |
|
Evercore, Inc., Class A | | 52,069 |
| 4,170,727 |
|
Moelis & Co., Class A | | 6,612 |
| 282,663 |
|
MSCI, Inc. | | 7,590 |
| 890,762 |
|
|
| | | | | | | |
| | Shares/
Principal Amount | Value |
Nasdaq, Inc. | | 42,355 |
| $ | 3,077,091 |
|
| | | 10,154,574 |
|
Chemicals — 2.6% | | | |
Air Products & Chemicals, Inc. | | 32,663 |
| 5,207,462 |
|
Cabot Corp. | | 64,813 |
| 3,951,000 |
|
Eastman Chemical Co. | | 18,965 |
| 1,722,212 |
|
FMC Corp. | | 48,357 |
| 4,490,431 |
|
Huntsman Corp. | | 49,329 |
| 1,579,515 |
|
Monsanto Co. | | 10,809 |
| 1,308,970 |
|
PPG Industries, Inc. | | 42,568 |
| 4,948,104 |
|
| | | 23,207,694 |
|
Commercial Services and Supplies — 0.4% | | | |
Waste Management, Inc. | | 42,275 |
| 3,473,737 |
|
Communications Equipment — 0.9% | | | |
Cisco Systems, Inc. | | 243,908 |
| 8,329,458 |
|
Consumer Finance — 0.1% | | | |
OneMain Holdings, Inc.(1) | | 25,396 |
| 806,831 |
|
Diversified Consumer Services — 0.4% | | | |
H&R Block, Inc. | | 129,921 |
| 3,214,246 |
|
Diversified Financial Services — 0.9% | | | |
Berkshire Hathaway, Inc., Class B(1) | | 21,469 |
| 4,013,415 |
|
Leucadia National Corp. | | 148,078 |
| 3,746,373 |
|
| | | 7,759,788 |
|
Diversified Telecommunication Services — 0.2% | | | |
AT&T, Inc. | | 40,144 |
| 1,350,845 |
|
Verizon Communications, Inc. | | 11,171 |
| 534,756 |
|
| | | 1,885,601 |
|
Electric Utilities — 0.6% | | | |
ALLETE, Inc. | | 2,603 |
| 203,945 |
|
FirstEnergy Corp. | | 138,450 |
| 4,561,927 |
|
Portland General Electric Co. | | 10,762 |
| 513,778 |
|
| | | 5,279,650 |
|
Electrical Equipment — 0.5% | | | |
Eaton Corp. plc | | 59,223 |
| 4,739,025 |
|
Energy Equipment and Services — 0.3% | | | |
Halliburton Co. | | 57,569 |
| 2,460,499 |
|
TechnipFMC plc(1) | | 12,986 |
| 355,687 |
|
| | | 2,816,186 |
|
Equity Real Estate Investment Trusts (REITs) — 0.7% | | | |
Gaming and Leisure Properties, Inc. | | 24,567 |
| 897,678 |
|
Potlatch Corp. | | 26,137 |
| 1,353,897 |
|
WP Carey, Inc. | | 54,746 |
| 3,730,940 |
|
| | | 5,982,515 |
|
Food and Staples Retailing — 1.0% | | | |
CVS Health Corp. | | 74,961 |
| 5,137,077 |
|
Walgreens Boots Alliance, Inc. | | 62,333 |
| 4,130,808 |
|
| | | 9,267,885 |
|
|
| | | | | | | |
| | Shares/
Principal Amount | Value |
Food Products — 1.1% | | | |
Campbell Soup Co. | | 32,511 |
| $ | 1,540,046 |
|
Conagra Brands, Inc. | | 130,695 |
| 4,464,541 |
|
Tyson Foods, Inc., Class A | | 49,343 |
| 3,597,598 |
|
| | | 9,602,185 |
|
Gas Utilities — 0.1% | | | |
National Fuel Gas Co. | | 7,814 |
| 453,603 |
|
Health Care Equipment and Supplies — 2.1% | | | |
Cooper Cos., Inc. (The) | | 18,382 |
| 4,416,459 |
|
Globus Medical, Inc., Class A(1) | | 10,296 |
| 328,134 |
|
Intuitive Surgical, Inc.(1) | | 13,763 |
| 5,166,080 |
|
LivaNova plc(1) | | 16,450 |
| 1,215,655 |
|
Masimo Corp.(1) | | 6,212 |
| 545,165 |
|
Medtronic plc | | 11,706 |
| 942,567 |
|
Teleflex, Inc. | | 2,126 |
| 503,819 |
|
Varian Medical Systems, Inc.(1) | | 6,930 |
| 722,037 |
|
Zimmer Biomet Holdings, Inc. | | 39,203 |
| 4,767,869 |
|
| | | 18,607,785 |
|
Health Care Providers and Services — 2.1% | | | |
Cigna Corp. | | 28,604 |
| 5,641,281 |
|
Humana, Inc. | | 13,835 |
| 3,532,767 |
|
UnitedHealth Group, Inc. | | 44,996 |
| 9,459,059 |
|
| | | 18,633,107 |
|
Hotels, Restaurants and Leisure — 1.2% | | | |
Carnival Corp. | | 26,583 |
| 1,764,845 |
|
Las Vegas Sands Corp. | | 63,986 |
| 4,055,433 |
|
Royal Caribbean Cruises Ltd. | | 38,708 |
| 4,790,889 |
|
| | | 10,611,167 |
|
Household Durables — 0.3% | | | |
Garmin Ltd. | | 26,817 |
| 1,518,110 |
|
NVR, Inc.(1) | | 484 |
| 1,588,183 |
|
| | | 3,106,293 |
|
Household Products — 0.8% | | | |
Kimberly-Clark Corp. | | 43,057 |
| 4,844,343 |
|
Procter & Gamble Co. (The) | | 16,766 |
| 1,447,576 |
|
Spectrum Brands Holdings, Inc. | | 10,153 |
| 1,116,018 |
|
| | | 7,407,937 |
|
Independent Power and Renewable Electricity Producers — 0.4% | |
AES Corp. (The) | | 339,198 |
| 3,605,675 |
|
Industrial Conglomerates — 1.5% | | | |
3M Co. | | 8,068 |
| 1,857,173 |
|
Carlisle Cos., Inc. | | 36,474 |
| 4,005,940 |
|
General Electric Co. | | 23,014 |
| 463,962 |
|
Honeywell International, Inc. | | 46,275 |
| 6,671,004 |
|
| | | 12,998,079 |
|
Insurance — 0.8% | | | |
Allstate Corp. (The) | | 53,718 |
| 5,041,971 |
|
|
| | | | | | | |
| | Shares/
Principal Amount | Value |
Hanover Insurance Group, Inc. (The) | | 15,257 |
| $ | 1,500,984 |
|
Loews Corp. | | 15,398 |
| 762,355 |
|
| | | 7,305,310 |
|
Internet and Direct Marketing Retail — 2.7% | | | |
Amazon.com, Inc.(1) | | 13,683 |
| 15,123,546 |
|
Expedia, Inc. | | 17,422 |
| 2,171,826 |
|
Priceline Group, Inc. (The)(1) | | 3,360 |
| 6,424,186 |
|
| | | 23,719,558 |
|
Internet Software and Services — 3.9% | | | |
Alphabet, Inc., Class A(1) | | 19,038 |
| 19,667,015 |
|
Facebook, Inc., Class A(1) | | 81,827 |
| 14,733,770 |
|
| | | 34,400,785 |
|
IT Services — 1.5% | | | |
Amdocs Ltd. | | 7,623 |
| 496,257 |
|
Fidelity National Information Services, Inc. | | 13,844 |
| 1,284,169 |
|
International Business Machines Corp. | | 46,741 |
| 7,200,919 |
|
Total System Services, Inc. | | 63,392 |
| 4,567,394 |
|
| | | 13,548,739 |
|
Leisure Products — 0.2% | | | |
Brunswick Corp. | | 36,964 |
| 1,872,227 |
|
Life Sciences Tools and Services — 0.7% | | | |
Thermo Fisher Scientific, Inc. | | 13,621 |
| 2,640,158 |
|
Waters Corp.(1) | | 16,153 |
| 3,166,796 |
|
| | | 5,806,954 |
|
Machinery — 2.1% | | | |
Caterpillar, Inc. | | 19,062 |
| 2,588,620 |
|
Cummins, Inc. | | 28,980 |
| 5,125,982 |
|
Oshkosh Corp. | | 51,333 |
| 4,700,050 |
|
Parker-Hannifin Corp. | | 14,502 |
| 2,648,210 |
|
Toro Co. (The) | | 64,315 |
| 4,042,198 |
|
| | | 19,105,060 |
|
Media — 0.4% | | | |
AMC Networks, Inc., Class A(1) | | 12,394 |
| 630,607 |
|
Comcast Corp., Class A | | 21,663 |
| 780,518 |
|
MSG Networks, Inc., Class A(1) | | 18,063 |
| 313,393 |
|
Time Warner, Inc. | | 19,925 |
| 1,958,428 |
|
| | | 3,682,946 |
|
Metals and Mining — 0.1% | | | |
Barrick Gold Corp. | | 68,196 |
| 985,432 |
|
Oil, Gas and Consumable Fuels — 1.9% | | | |
Chevron Corp. | | 9,737 |
| 1,128,421 |
|
Exxon Mobil Corp. | | 152,172 |
| 12,683,536 |
|
HollyFrontier Corp. | | 40,249 |
| 1,487,201 |
|
Phillips 66 | | 5,641 |
| 513,782 |
|
Valero Energy Corp. | | 9,699 |
| 765,154 |
|
| | | 16,578,094 |
|
Personal Products — 0.1% | | | |
Nu Skin Enterprises, Inc., Class A | | 14,038 |
| 892,957 |
|
Pharmaceuticals — 2.8% | | | |
Eli Lilly & Co. | | 31,887 |
| 2,612,821 |
|
|
| | | | | | | |
| | Shares/
Principal Amount | Value |
Johnson & Johnson | | 39,774 |
| $ | 5,544,893 |
|
Merck & Co., Inc. | | 131,557 |
| 7,247,475 |
|
Pfizer, Inc. | | 259,363 |
| 9,093,267 |
|
| | | 24,498,456 |
|
Professional Services — 0.1% | | | |
ManpowerGroup, Inc. | | 9,925 |
| 1,223,554 |
|
Real Estate Management and Development — 0.3% | | | |
Realogy Holdings Corp. | | 84,822 |
| 2,742,295 |
|
Road and Rail — 0.7% | | | |
Union Pacific Corp. | | 56,560 |
| 6,549,082 |
|
Semiconductors and Semiconductor Equipment — 3.7% | | | |
Applied Materials, Inc. | | 94,249 |
| 5,318,471 |
|
Broadcom Ltd. | | 17,354 |
| 4,579,894 |
|
Intel Corp. | | 227,902 |
| 10,367,262 |
|
Lam Research Corp. | | 29,551 |
| 6,163,452 |
|
Texas Instruments, Inc. | | 68,432 |
| 6,616,690 |
|
| | | 33,045,769 |
|
Software — 4.6% | | | |
Activision Blizzard, Inc. | | 67,124 |
| 4,395,951 |
|
Adobe Systems, Inc.(1) | | 34,945 |
| 6,120,966 |
|
Electronic Arts, Inc.(1) | | 7,216 |
| 863,034 |
|
Intuit, Inc. | | 25,608 |
| 3,867,320 |
|
Microsoft Corp. | | 227,989 |
| 18,964,125 |
|
Oracle Corp. (New York) | | 113,411 |
| 5,772,620 |
|
Synopsys, Inc.(1) | | 8,733 |
| 755,579 |
|
| | | 40,739,595 |
|
Specialty Retail — 1.4% | | | |
Aaron's, Inc. | | 14,429 |
| 530,987 |
|
Best Buy Co., Inc. | | 76,643 |
| 4,290,475 |
|
Lowe's Cos., Inc. | | 69,965 |
| 5,593,702 |
|
Williams-Sonoma, Inc. | | 32,189 |
| 1,660,953 |
|
| | | 12,076,117 |
|
Technology Hardware, Storage and Peripherals — 2.1% | | |
Apple, Inc. | | 110,534 |
| 18,684,667 |
|
Western Digital Corp. | | 3,728 |
| 332,799 |
|
| | | 19,017,466 |
|
Textiles, Apparel and Luxury Goods — 0.2% | | | |
Ralph Lauren Corp. | | 18,398 |
| 1,645,333 |
|
Thrifts and Mortgage Finance — 0.5% | | | |
Essent Group Ltd.(1) | | 105,627 |
| 4,501,823 |
|
Trading Companies and Distributors — 0.1% | | | |
United Rentals, Inc.(1) | | 5,234 |
| 740,506 |
|
Wireless Telecommunication Services† | | | |
T-Mobile US, Inc.(1) | | 3,514 |
| 210,032 |
|
TOTAL COMMON STOCKS
(Cost $406,990,239) | | | 539,374,995 |
|
CORPORATE BONDS — 11.7% | | | |
Aerospace and Defense — 0.2% | | | |
Boeing Co. (The), 2.20%, 10/30/22 | | $ | 190,000 |
| 188,943 |
|
Lockheed Martin Corp., 4.25%, 11/15/19 | | 250,000 |
| 261,819 |
|
|
| | | | | | | |
| | Shares/
Principal Amount | Value |
Lockheed Martin Corp., 3.55%, 1/15/26 | | $ | 300,000 |
| $ | 312,569 |
|
Lockheed Martin Corp., 3.80%, 3/1/45 | | 80,000 |
| 79,011 |
|
Rockwell Collins, Inc., 4.35%, 4/15/47 | | 80,000 |
| 86,068 |
|
United Technologies Corp., 6.05%, 6/1/36 | | 250,000 |
| 320,458 |
|
United Technologies Corp., 3.75%, 11/1/46 | | 100,000 |
| 97,688 |
|
| | | 1,346,556 |
|
Auto Components† | | | |
Tenneco, Inc., 5.00%, 7/15/26 | | 90,000 |
| 92,700 |
|
ZF North America Capital, Inc., 4.00%, 4/29/20(2) | | 150,000 |
| 155,437 |
|
| | | 248,137 |
|
Automobiles — 0.4% | | | |
American Honda Finance Corp., 2.125%, 10/10/18 | | 150,000 |
| 150,728 |
|
Ford Motor Co., 4.35%, 12/8/26 | | 240,000 |
| 250,536 |
|
Ford Motor Credit Co. LLC, 5.00%, 5/15/18 | | 400,000 |
| 406,949 |
|
Ford Motor Credit Co. LLC, 8.125%, 1/15/20 | | 150,000 |
| 168,180 |
|
Ford Motor Credit Co. LLC, 5.875%, 8/2/21 | | 440,000 |
| 490,176 |
|
Ford Motor Credit Co. LLC, 2.98%, 8/3/22 | | 200,000 |
| 200,768 |
|
General Motors Co., 5.15%, 4/1/38 | | 210,000 |
| 218,963 |
|
General Motors Financial Co., Inc., 3.25%, 5/15/18 | | 350,000 |
| 352,740 |
|
General Motors Financial Co., Inc., 3.10%, 1/15/19 | | 110,000 |
| 111,390 |
|
General Motors Financial Co., Inc., 3.20%, 7/6/21 | | 620,000 |
| 633,072 |
|
General Motors Financial Co., Inc., 5.25%, 3/1/26 | | 260,000 |
| 284,487 |
|
Jaguar Land Rover Automotive plc, 4.125%, 12/15/18(2) | | 150,000 |
| 153,562 |
|
| | | 3,421,551 |
|
Banks — 1.7% | | | |
Banco Inbursa SA Institucion de Banca Multiple, 4.375%, 4/11/27(2) | | 230,000 |
| 228,850 |
|
Bank of America Corp., 4.10%, 7/24/23 | | 70,000 |
| 74,469 |
|
Bank of America Corp., MTN, 5.625%, 7/1/20 | | 310,000 |
| 336,456 |
|
Bank of America Corp., MTN, 4.00%, 4/1/24 | | 420,000 |
| 445,355 |
|
Bank of America Corp., MTN, 4.20%, 8/26/24 | | 380,000 |
| 401,620 |
|
Bank of America Corp., MTN, 4.00%, 1/22/25 | | 600,000 |
| 621,752 |
|
Bank of America Corp., MTN, 5.00%, 1/21/44 | | 110,000 |
| 127,484 |
|
Bank of America Corp., MTN, VRN, 4.44%, 1/20/47(3) | | 140,000 |
| 152,087 |
|
Barclays Bank plc, 5.14%, 10/14/20 | | 200,000 |
| 213,771 |
|
Barclays plc, 4.375%, 1/12/26 | | 200,000 |
| 209,959 |
|
BPCE SA, 3.00%, 5/22/22(2) | | 250,000 |
| 251,498 |
|
BPCE SA, 5.15%, 7/21/24(2) | | 200,000 |
| 218,116 |
|
Branch Banking & Trust Co., 3.625%, 9/16/25 | | 113,000 |
| 117,751 |
|
Branch Banking & Trust Co., 3.80%, 10/30/26 | | 130,000 |
| 136,989 |
|
Capital One Financial Corp., 4.20%, 10/29/25 | | 445,000 |
| 459,558 |
|
Capital One N.A., 2.35%, 8/17/18 | | 250,000 |
| 250,870 |
|
Citigroup, Inc., 2.90%, 12/8/21 | | 650,000 |
| 657,810 |
|
Citigroup, Inc., 4.05%, 7/30/22 | | 70,000 |
| 73,626 |
|
Citigroup, Inc., 3.20%, 10/21/26 | | 365,000 |
| 361,611 |
|
Citigroup, Inc., 4.45%, 9/29/27 | | 650,000 |
| 687,802 |
|
Citigroup, Inc., VRN, 3.52%, 10/27/27(3) | | 390,000 |
| 390,113 |
|
|
| | | | | | | |
| | Shares/
Principal Amount | Value |
Commerzbank AG, 8.125%, 9/19/23(2) | | $ | 200,000 |
| $ | 243,358 |
|
Cooperatieve Rabobank UA, 3.875%, 2/8/22 | | 430,000 |
| 456,627 |
|
Fifth Third Bancorp, 4.30%, 1/16/24 | | 110,000 |
| 117,052 |
|
Fifth Third Bank, 2.875%, 10/1/21 | | 250,000 |
| 254,783 |
|
HBOS plc, MTN, 6.75%, 5/21/18(2) | | 300,000 |
| 307,781 |
|
Huntington Bancshares, Inc., 2.30%, 1/14/22 | | 260,000 |
| 256,952 |
|
Intesa Sanpaolo SpA, 3.125%, 7/14/22(2) | | 220,000 |
| 220,783 |
|
Intesa Sanpaolo SpA, 5.02%, 6/26/24(2) | | 230,000 |
| 235,676 |
|
JPMorgan Chase & Co., 2.55%, 3/1/21 | | 420,000 |
| 422,798 |
|
JPMorgan Chase & Co., 4.625%, 5/10/21 | | 460,000 |
| 494,859 |
|
JPMorgan Chase & Co., 3.25%, 9/23/22 | | 220,000 |
| 226,524 |
|
JPMorgan Chase & Co., 3.875%, 9/10/24 | | 770,000 |
| 804,400 |
|
JPMorgan Chase & Co., 3.125%, 1/23/25 | | 570,000 |
| 573,844 |
|
JPMorgan Chase & Co., 4.95%, 6/1/45 | | 100,000 |
| 114,115 |
|
JPMorgan Chase & Co., VRN, 3.54%, 5/1/27(3) | | 320,000 |
| 324,081 |
|
JPMorgan Chase & Co., VRN, 3.88%, 7/24/37(3) | | 200,000 |
| 202,251 |
|
KeyCorp, MTN, 2.30%, 12/13/18 | | 220,000 |
| 220,991 |
|
Kreditanstalt fuer Wiederaufbau, 2.00%, 10/4/22 | | 300,000 |
| 297,782 |
|
PNC Financial Services Group, Inc. (The), 4.375%, 8/11/20 | | 200,000 |
| 211,881 |
|
Regions Financial Corp., 2.75%, 8/14/22 | | 160,000 |
| 160,425 |
|
SunTrust Bank, 3.30%, 5/15/26 | | 200,000 |
| 198,333 |
|
Turkiye Garanti Bankasi AS, 5.875%, 3/16/23(2) | | 350,000 |
| 361,057 |
|
U.S. Bancorp, MTN, 3.00%, 3/15/22 | | 110,000 |
| 113,111 |
|
U.S. Bancorp, MTN, 3.60%, 9/11/24 | | 330,000 |
| 343,441 |
|
Wells Fargo & Co., 3.07%, 1/24/23 | | 210,000 |
| 212,901 |
|
Wells Fargo & Co., 4.125%, 8/15/23 | | 200,000 |
| 211,425 |
|
Wells Fargo & Co., 3.00%, 4/22/26 | | 350,000 |
| 343,618 |
|
Wells Fargo & Co., MTN, 2.60%, 7/22/20 | | 320,000 |
| 324,359 |
|
Wells Fargo & Co., MTN, 3.55%, 9/29/25 | | 160,000 |
| 164,379 |
|
Wells Fargo & Co., MTN, 4.10%, 6/3/26 | | 210,000 |
| 218,853 |
|
Wells Fargo & Co., MTN, 4.65%, 11/4/44 | | 200,000 |
| 215,160 |
|
Wells Fargo & Co., MTN, 4.75%, 12/7/46 | | 120,000 |
| 131,157 |
|
| | | 15,402,304 |
|
Beverages — 0.3% | | | |
Anheuser-Busch InBev Finance, Inc., 3.30%, 2/1/23 | | 670,000 |
| 691,933 |
|
Anheuser-Busch InBev Finance, Inc., 3.65%, 2/1/26 | | 250,000 |
| 258,375 |
|
Anheuser-Busch InBev Finance, Inc., 4.90%, 2/1/46 | | 500,000 |
| 563,431 |
|
Anheuser-Busch InBev Worldwide, Inc., 7.75%, 1/15/19 | | 390,000 |
| 416,832 |
|
Constellation Brands, Inc., 4.75%, 12/1/25 | | 330,000 |
| 364,920 |
|
Molson Coors Brewing Co., 3.00%, 7/15/26 | | 250,000 |
| 243,915 |
|
| | | 2,539,406 |
|
Biotechnology — 0.5% | | | |
AbbVie, Inc., 2.90%, 11/6/22 | | 620,000 |
| 627,165 |
|
AbbVie, Inc., 3.60%, 5/14/25 | | 120,000 |
| 123,544 |
|
AbbVie, Inc., 4.40%, 11/6/42 | | 240,000 |
| 250,757 |
|
Amgen, Inc., 2.65%, 5/11/22 | | 390,000 |
| 391,803 |
|
Amgen, Inc., 4.66%, 6/15/51 | | 289,000 |
| 313,771 |
|
|
| | | | | | | |
| | Shares/
Principal Amount | Value |
Biogen, Inc., 3.625%, 9/15/22 | | $ | 520,000 |
| $ | 544,949 |
|
Celgene Corp., 3.25%, 8/15/22 | | 190,000 |
| 194,294 |
|
Celgene Corp., 3.625%, 5/15/24 | | 300,000 |
| 309,887 |
|
Celgene Corp., 3.875%, 8/15/25 | | 300,000 |
| 312,406 |
|
Celgene Corp., 5.00%, 8/15/45 | | 90,000 |
| 99,355 |
|
Gilead Sciences, Inc., 4.40%, 12/1/21 | | 310,000 |
| 334,540 |
|
Gilead Sciences, Inc., 3.65%, 3/1/26 | | 840,000 |
| 875,199 |
|
| | | 4,377,670 |
|
Building Products† | | | |
Masco Corp., 4.45%, 4/1/25 | | 170,000 |
| 182,587 |
|
Capital Markets† | | | |
Jefferies Group LLC, 4.85%, 1/15/27 | | 180,000 |
| 191,637 |
|
Chemicals — 0.1% | | | |
Ashland LLC, 4.75%, 8/15/22 | | 160,000 |
| 169,232 |
|
Dow Chemical Co. (The), 4.375%, 11/15/42 | | 170,000 |
| 177,420 |
|
Eastman Chemical Co., 3.60%, 8/15/22 | | 95,000 |
| 98,841 |
|
Ecolab, Inc., 4.35%, 12/8/21 | | 250,000 |
| 269,386 |
|
LyondellBasell Industries NV, 5.00%, 4/15/19 | | 200,000 |
| 206,930 |
|
Sherwin-Williams Co. (The), 3.45%, 6/1/27 | | 150,000 |
| 152,670 |
|
| | | 1,074,479 |
|
Commercial Services and Supplies — 0.1% | | | |
Republic Services, Inc., 3.55%, 6/1/22 | | 220,000 |
| 228,991 |
|
Waste Management, Inc., 3.15%, 11/15/27(4) | | 140,000 |
| 140,294 |
|
Waste Management, Inc., 4.10%, 3/1/45 | | 150,000 |
| 158,648 |
|
| | | 527,933 |
|
Communications Equipment† | | | |
Cisco Systems, Inc., 5.90%, 2/15/39 | | 130,000 |
| 173,676 |
|
CommScope Technologies LLC, 5.00%, 3/15/27(2) | | 160,000 |
| 156,200 |
|
| | | 329,876 |
|
Construction Materials† | | | |
Owens Corning, 4.20%, 12/15/22 | | 160,000 |
| 169,616 |
|
Consumer Finance — 0.3% | | | |
American Express Co., 1.55%, 5/22/18 | | 220,000 |
| 219,935 |
|
American Express Credit Corp., MTN, 2.60%, 9/14/20 | | 115,000 |
| 116,481 |
|
American Express Credit Corp., MTN, 2.25%, 5/5/21 | | 450,000 |
| 450,533 |
|
American Express Credit Corp., MTN, 3.30%, 5/3/27 | | 140,000 |
| 141,702 |
|
Capital One Bank USA N.A., 2.30%, 6/5/19 | | 250,000 |
| 250,543 |
|
Capital One Bank USA N.A., 3.375%, 2/15/23 | | 250,000 |
| 254,567 |
|
CIT Group, Inc., 5.00%, 8/15/22 | | 240,000 |
| 258,600 |
|
Discover Bank, 3.45%, 7/27/26 | | 250,000 |
| 246,969 |
|
GLP Capital LP / GLP Financing II, Inc., 4.875%, 11/1/20 | | 150,000 |
| 159,356 |
|
PNC Bank N.A., 1.95%, 3/4/19 | | 300,000 |
| 300,263 |
|
Synchrony Financial, 2.60%, 1/15/19 | | 160,000 |
| 160,975 |
|
Synchrony Financial, 3.00%, 8/15/19 | | 90,000 |
| 91,317 |
|
Visa, Inc., 2.75%, 9/15/27 | | 190,000 |
| 186,607 |
|
| | | 2,837,848 |
|
|
| | | | | | | |
| | Shares/
Principal Amount | Value |
Containers and Packaging — 0.1% | | | |
Ball Corp., 4.00%, 11/15/23 | | $ | 180,000 |
| $ | 185,625 |
|
Crown Americas LLC / Crown Americas Capital Corp. IV, 4.50%, 1/15/23 | | 250,000 |
| 260,900 |
|
WestRock RKT Co., 4.00%, 3/1/23 | | 240,000 |
| 251,279 |
|
| | | 697,804 |
|
Diversified Consumer Services† | | | |
Catholic Health Initiatives, 2.95%, 11/1/22 | | 110,000 |
| 110,348 |
|
George Washington University (The), 3.55%, 9/15/46 | | 115,000 |
| 108,669 |
|
| | | 219,017 |
|
Diversified Financial Services — 1.1% | | | |
Ally Financial, Inc., 3.50%, 1/27/19 | | 100,000 |
| 101,470 |
|
Ally Financial, Inc., 4.625%, 3/30/25 | | 100,000 |
| 106,750 |
|
Banco Santander SA, 3.50%, 4/11/22 | | 400,000 |
| 410,217 |
|
BNP Paribas SA, 4.375%, 9/28/25(2) | | 200,000 |
| 210,461 |
|
Credit Suisse Group Funding Guernsey Ltd., 3.125%, 12/10/20 | 250,000 |
| 254,890 |
|
Credit Suisse Group Funding Guernsey Ltd., 3.45%, 4/16/21 | | 280,000 |
| 288,012 |
|
GE Capital International Funding Co. Unlimited Co., 2.34%, 11/15/20 | | 694,000 |
| 697,595 |
|
Goldman Sachs Group, Inc. (The), 2.30%, 12/13/19 | | 860,000 |
| 862,843 |
|
Goldman Sachs Group, Inc. (The), 5.375%, 3/15/20 | | 110,000 |
| 117,781 |
|
Goldman Sachs Group, Inc. (The), 5.75%, 1/24/22 | | 460,000 |
| 515,180 |
|
Goldman Sachs Group, Inc. (The), 3.50%, 1/23/25 | | 460,000 |
| 467,569 |
|
Goldman Sachs Group, Inc. (The), 3.50%, 11/16/26 | | 230,000 |
| 230,728 |
|
Goldman Sachs Group, Inc. (The), 5.15%, 5/22/45 | | 100,000 |
| 114,094 |
|
Goldman Sachs Group, Inc. (The), MTN, 4.80%, 7/8/44 | | 400,000 |
| 447,383 |
|
HSBC Holdings plc, 2.95%, 5/25/21 | | 800,000 |
| 813,977 |
|
HSBC Holdings plc, 4.30%, 3/8/26 | | 400,000 |
| 429,762 |
|
HSBC Holdings plc, 4.375%, 11/23/26 | | 220,000 |
| 231,775 |
|
HSBC Holdings plc, VRN, 3.26%, 3/13/22(3) | | 220,000 |
| 224,940 |
|
Morgan Stanley, 2.75%, 5/19/22 | | 200,000 |
| 200,499 |
|
Morgan Stanley, 4.375%, 1/22/47 | | 90,000 |
| 96,032 |
|
Morgan Stanley, MTN, 5.625%, 9/23/19 | | 870,000 |
| 925,457 |
|
Morgan Stanley, MTN, 3.70%, 10/23/24 | | 460,000 |
| 478,438 |
|
Morgan Stanley, MTN, 4.00%, 7/23/25 | | 810,000 |
| 852,589 |
|
S&P Global, Inc., 3.30%, 8/14/20 | | 120,000 |
| 123,112 |
|
UBS Group Funding Switzerland AG, 3.49%, 5/23/23(2) | | 300,000 |
| 307,746 |
|
UBS Group Funding Switzerland AG, 4.125%, 9/24/25(2) | | 200,000 |
| 211,139 |
|
| | | 9,720,439 |
|
Diversified Telecommunication Services — 0.6% | | | |
AT&T, Inc., 5.00%, 3/1/21 | | 250,000 |
| 271,204 |
|
AT&T, Inc., 3.60%, 2/17/23 | | 200,000 |
| 206,999 |
|
AT&T, Inc., 3.40%, 5/15/25 | | 890,000 |
| 881,260 |
|
AT&T, Inc., 3.90%, 8/14/27 | | 730,000 |
| 728,131 |
|
AT&T, Inc., 6.55%, 2/15/39 | | 287,000 |
| 346,808 |
|
AT&T, Inc., 4.75%, 5/15/46 | | 130,000 |
| 122,939 |
|
AT&T, Inc., 5.45%, 3/1/47 | | 80,000 |
| 83,804 |
|
|
| | | | | | | |
| | Shares/
Principal Amount | Value |
AT&T, Inc., 5.15%, 2/14/50 | | $ | 50,000 |
| $ | 49,494 |
|
British Telecommunications plc, 5.95%, 1/15/18 | | 480,000 |
| 484,347 |
|
CenturyLink, Inc., 6.15%, 9/15/19 | | 140,000 |
| 147,175 |
|
Deutsche Telekom International Finance BV, 3.60%, 1/19/27(2) | 290,000 |
| 295,073 |
|
Frontier Communications Corp., 8.50%, 4/15/20 | | 59,000 |
| 58,484 |
|
Orange SA, 4.125%, 9/14/21 | | 210,000 |
| 224,716 |
|
Orange SA, 5.50%, 2/6/44 | | 80,000 |
| 97,504 |
|
Telefonica Emisiones SAU, 5.46%, 2/16/21 | | 100,000 |
| 109,398 |
|
Telefonica Emisiones SAU, 5.21%, 3/8/47 | | 180,000 |
| 198,830 |
|
Verizon Communications, Inc., 2.45%, 11/1/22 | | 130,000 |
| 129,317 |
|
Verizon Communications, Inc., 2.625%, 8/15/26 | | 160,000 |
| 151,200 |
|
Verizon Communications, Inc., 4.125%, 3/16/27 | | 150,000 |
| 156,840 |
|
Verizon Communications, Inc., 4.75%, 11/1/41 | | 150,000 |
| 150,999 |
|
Verizon Communications, Inc., 4.86%, 8/21/46 | | 250,000 |
| 253,058 |
|
Verizon Communications, Inc., 5.01%, 8/21/54 | | 199,000 |
| 199,698 |
|
| | | 5,347,278 |
|
Electric Utilities† | | | |
AEP Transmission Co. LLC, 3.75%, 12/1/47(2) | | 100,000 |
| 101,198 |
|
NextEra Energy Operating Partners LP, 4.25%, 9/15/24(2) | | 150,000 |
| 151,875 |
|
| | | 253,073 |
|
Energy Equipment and Services† | | | |
Ensco plc, 5.20%, 3/15/25 | | 40,000 |
| 33,900 |
|
Halliburton Co., 3.80%, 11/15/25 | | 220,000 |
| 228,735 |
|
| | | 262,635 |
|
Equity Real Estate Investment Trusts (REITs) — 0.3% | | | |
American Tower Corp., 5.05%, 9/1/20 | | 130,000 |
| 139,652 |
|
American Tower Corp., 3.375%, 10/15/26 | | 200,000 |
| 197,941 |
|
AvalonBay Communities, Inc., MTN, 3.35%, 5/15/27 | | 80,000 |
| 81,212 |
|
Boston Properties LP, 3.65%, 2/1/26 | | 160,000 |
| 163,164 |
|
Crown Castle International Corp., 5.25%, 1/15/23 | | 180,000 |
| 199,077 |
|
Crown Castle International Corp., 4.45%, 2/15/26 | | 40,000 |
| 42,330 |
|
Essex Portfolio LP, 3.625%, 8/15/22 | | 150,000 |
| 155,458 |
|
Essex Portfolio LP, 3.25%, 5/1/23 | | 50,000 |
| 50,815 |
|
Hospitality Properties Trust, 4.65%, 3/15/24 | | 190,000 |
| 200,952 |
|
Hudson Pacific Properties LP, 3.95%, 11/1/27 | | 180,000 |
| 180,511 |
|
Kilroy Realty LP, 3.80%, 1/15/23 | | 140,000 |
| 144,493 |
|
Kilroy Realty LP, 4.375%, 10/1/25 | | 140,000 |
| 147,284 |
|
Kimco Realty Corp., 2.80%, 10/1/26 | | 240,000 |
| 226,300 |
|
Simon Property Group LP, 3.25%, 11/30/26 | | 150,000 |
| 150,449 |
|
Ventas Realty LP, 4.125%, 1/15/26 | | 100,000 |
| 104,186 |
|
VEREIT Operating Partnership LP, 4.125%, 6/1/21 | | 230,000 |
| 240,484 |
|
Welltower, Inc., 3.75%, 3/15/23 | | 130,000 |
| 135,150 |
|
| | | 2,559,458 |
|
Food and Staples Retailing — 0.2% | | | |
CVS Health Corp., 3.50%, 7/20/22 | | 220,000 |
| 226,801 |
|
CVS Health Corp., 2.75%, 12/1/22 | | 170,000 |
| 169,433 |
|
CVS Health Corp., 5.125%, 7/20/45 | | 160,000 |
| 179,347 |
|
|
| | | | | | | |
| | Shares/
Principal Amount | Value |
Kroger Co. (The), 3.30%, 1/15/21 | | $ | 330,000 |
| $ | 338,550 |
|
Kroger Co. (The), 3.70%, 8/1/27 | | 100,000 |
| 99,587 |
|
Kroger Co. (The), 3.875%, 10/15/46 | | 150,000 |
| 133,363 |
|
Mondelez International Holdings Netherlands BV, 1.625%, 10/28/19(2) | | 350,000 |
| 346,650 |
|
Target Corp., 2.50%, 4/15/26 | | 310,000 |
| 298,238 |
|
| | | 1,791,969 |
|
Food Products — 0.1% | | | |
Kraft Heinz Foods Co., 5.20%, 7/15/45 | | 140,000 |
| 153,128 |
|
Kraft Heinz Foods Co., 4.375%, 6/1/46 | | 70,000 |
| 68,578 |
|
Lamb Weston Holdings, Inc., 4.625%, 11/1/24(2) | | 210,000 |
| 220,500 |
|
| | | 442,206 |
|
Gas Utilities — 0.6% | | | |
Boardwalk Pipelines LP, 4.45%, 7/15/27 | | 110,000 |
| 112,992 |
|
Enbridge Energy Partners LP, 6.50%, 4/15/18 | | 130,000 |
| 132,757 |
|
Enbridge Energy Partners LP, 5.20%, 3/15/20 | | 100,000 |
| 106,282 |
|
Enbridge, Inc., 4.00%, 10/1/23 | | 140,000 |
| 146,485 |
|
Enbridge, Inc., 4.50%, 6/10/44 | | 120,000 |
| 123,348 |
|
Energy Transfer Equity LP, 7.50%, 10/15/20 | | 150,000 |
| 169,500 |
|
Energy Transfer LP, 4.15%, 10/1/20 | | 200,000 |
| 208,905 |
|
Energy Transfer LP, 3.60%, 2/1/23 | | 160,000 |
| 163,257 |
|
Energy Transfer LP, 4.90%, 3/15/35 | | 70,000 |
| 69,450 |
|
Energy Transfer LP, 6.50%, 2/1/42 | | 180,000 |
| 206,079 |
|
Enterprise Products Operating LLC, 4.85%, 3/15/44 | | 460,000 |
| 500,389 |
|
Enterprise Products Operating LLC, VRN, 7.03%, 1/15/18(3) | | 140,000 |
| 140,700 |
|
Kinder Morgan Energy Partners LP, 6.50%, 4/1/20 | | 210,000 |
| 229,235 |
|
Kinder Morgan Energy Partners LP, 5.30%, 9/15/20 | | 170,000 |
| 182,778 |
|
Kinder Morgan Energy Partners LP, 6.50%, 9/1/39 | | 210,000 |
| 243,763 |
|
Kinder Morgan, Inc., 5.55%, 6/1/45 | | 150,000 |
| 163,516 |
|
Magellan Midstream Partners LP, 6.55%, 7/15/19 | | 100,000 |
| 107,193 |
|
MPLX LP, 4.875%, 6/1/25 | | 410,000 |
| 444,729 |
|
MPLX LP, 5.20%, 3/1/47 | | 90,000 |
| 96,660 |
|
ONEOK, Inc., 4.00%, 7/13/27 | | 120,000 |
| 122,344 |
|
Plains All American Pipeline LP / PAA Finance Corp., 3.65%, 6/1/22 | | 310,000 |
| 313,663 |
|
Sabine Pass Liquefaction LLC, 5.625%, 3/1/25 | | 590,000 |
| 656,403 |
|
Sunoco Logistics Partners Operations LP, 3.45%, 1/15/23 | | 330,000 |
| 333,878 |
|
Sunoco Logistics Partners Operations LP, 4.00%, 10/1/27 | | 100,000 |
| 99,656 |
|
Targa Resources Partners LP / Targa Resources Partners Finance Corp., 5.00%, 1/15/28(2) | | 160,000 |
| 161,200 |
|
Williams Cos., Inc. (The), 3.70%, 1/15/23 | | 100,000 |
| 101,375 |
|
Williams Partners LP, 4.125%, 11/15/20 | | 200,000 |
| 208,771 |
|
Williams Partners LP, 5.10%, 9/15/45 | | 200,000 |
| 215,384 |
|
| | | 5,760,692 |
|
Health Care Equipment and Supplies — 0.3% | | | |
Abbott Laboratories, 2.00%, 9/15/18 | | 110,000 |
| 110,173 |
|
Abbott Laboratories, 3.75%, 11/30/26 | | 300,000 |
| 310,008 |
|
Becton Dickinson and Co., 3.73%, 12/15/24 | | 280,000 |
| 288,180 |
|
|
| | | | | | | |
| | Shares/
Principal Amount | Value |
Becton Dickinson and Co., 3.70%, 6/6/27 | | $ | 120,000 |
| $ | 120,941 |
|
Medtronic, Inc., 2.50%, 3/15/20 | | 130,000 |
| 131,808 |
|
Medtronic, Inc., 3.50%, 3/15/25 | | 230,000 |
| 239,051 |
|
Medtronic, Inc., 4.375%, 3/15/35 | | 360,000 |
| 398,175 |
|
Thermo Fisher Scientific, Inc., 3.60%, 8/15/21 | | 150,000 |
| 155,972 |
|
Thermo Fisher Scientific, Inc., 3.30%, 2/15/22 | | 148,000 |
| 152,772 |
|
Thermo Fisher Scientific, Inc., 2.95%, 9/19/26 | | 130,000 |
| 127,484 |
|
Thermo Fisher Scientific, Inc., 5.30%, 2/1/44 | | 110,000 |
| 131,001 |
|
Zimmer Biomet Holdings, Inc., 2.70%, 4/1/20 | | 120,000 |
| 121,074 |
|
| | | 2,286,639 |
|
Health Care Providers and Services — 0.3% | | | |
Aetna, Inc., 2.75%, 11/15/22 | | 130,000 |
| 129,767 |
|
Anthem, Inc., 4.65%, 1/15/43 | | 140,000 |
| 151,953 |
|
Duke University Health System, Inc., 3.92%, 6/1/47 | | 160,000 |
| 163,665 |
|
Express Scripts Holding Co., 3.40%, 3/1/27 | | 80,000 |
| 78,729 |
|
HCA, Inc., 3.75%, 3/15/19 | | 310,000 |
| 315,425 |
|
Johns Hopkins Health System Corp. (The), 3.84%, 5/15/46 | | 100,000 |
| 100,973 |
|
Kaiser Foundation Hospitals, 4.15%, 5/1/47 | | 80,000 |
| 85,656 |
|
Mylan NV, 3.95%, 6/15/26 | | 130,000 |
| 130,073 |
|
Northwell Healthcare, Inc., 4.26%, 11/1/47 | | 120,000 |
| 120,182 |
|
NYU Hospitals Center, 4.43%, 7/1/42 | | 90,000 |
| 94,119 |
|
Tenet Healthcare Corp., 4.625%, 7/15/24(2) | | 158,000 |
| 156,025 |
|
UnitedHealth Group, Inc., 2.875%, 12/15/21 | | 230,000 |
| 235,349 |
|
UnitedHealth Group, Inc., 2.875%, 3/15/22 | | 310,000 |
| 316,711 |
|
UnitedHealth Group, Inc., 3.75%, 7/15/25 | | 210,000 |
| 222,348 |
|
UnitedHealth Group, Inc., 4.75%, 7/15/45 | | 140,000 |
| 162,296 |
|
UnitedHealth Group, Inc., 3.75%, 10/15/47 | | 110,000 |
| 108,048 |
|
Universal Health Services, Inc., 4.75%, 8/1/22(2) | | 130,000 |
| 134,550 |
|
| | | 2,705,869 |
|
Hotels, Restaurants and Leisure — 0.1% | | | |
Aramark Services, Inc., 5.00%, 4/1/25(2) | | 100,000 |
| 107,125 |
|
Hilton Domestic Operating Co., Inc., 4.25%, 9/1/24 | | 170,000 |
| 174,037 |
|
McDonald's Corp., MTN, 3.25%, 6/10/24 | | 100,000 |
| 103,052 |
|
McDonald's Corp., MTN, 3.375%, 5/26/25 | | 80,000 |
| 82,341 |
|
McDonald's Corp., MTN, 4.45%, 3/1/47 | | 330,000 |
| 354,124 |
|
Royal Caribbean Cruises Ltd., 5.25%, 11/15/22 | | 130,000 |
| 144,014 |
|
| | | 964,693 |
|
Household Durables — 0.2% | | | |
D.R. Horton, Inc., 3.625%, 2/15/18 | | 270,000 |
| 270,398 |
|
D.R. Horton, Inc., 5.75%, 8/15/23 | | 110,000 |
| 124,735 |
|
Lennar Corp., 4.75%, 12/15/17 | | 210,000 |
| 210,630 |
|
Lennar Corp., 4.75%, 4/1/21 | | 152,000 |
| 159,790 |
|
M.D.C. Holdings, Inc., 5.50%, 1/15/24 | | 80,000 |
| 86,500 |
|
Newell Brands, Inc., 4.20%, 4/1/26 | | 110,000 |
| 116,036 |
|
Newell Brands, Inc., 5.50%, 4/1/46 | | 260,000 |
| 309,097 |
|
Toll Brothers Finance Corp., 6.75%, 11/1/19 | | 100,000 |
| 108,625 |
|
|
| | | | | | | |
| | Shares/
Principal Amount | Value |
TRI Pointe Group, Inc. / TRI Pointe Homes, Inc., 4.375%, 6/15/19 | | $ | 100,000 |
| $ | 103,125 |
|
| | | 1,488,936 |
|
Industrial Conglomerates — 0.1% | | | |
FedEx Corp., 4.40%, 1/15/47 | | 170,000 |
| 177,410 |
|
General Electric Co., 2.70%, 10/9/22 | | 210,000 |
| 212,984 |
|
General Electric Co., 4.125%, 10/9/42 | | 180,000 |
| 186,537 |
|
General Electric Co., MTN, 4.375%, 9/16/20 | | 250,000 |
| 266,347 |
|
| | | 843,278 |
|
Insurance — 0.5% | | | |
AerCap Ireland Capital DAC / AerCap Global Aviation Trust, 3.75%, 5/15/19 | | 150,000 |
| 153,477 |
|
AerCap Ireland Capital DAC / AerCap Global Aviation Trust, 5.00%, 10/1/21 | | 300,000 |
| 324,541 |
|
American International Group, Inc., 4.125%, 2/15/24 | | 550,000 |
| 585,784 |
|
American International Group, Inc., 4.50%, 7/16/44 | | 120,000 |
| 125,106 |
|
Berkshire Hathaway Finance Corp., 3.00%, 5/15/22 | | 230,000 |
| 237,308 |
|
Berkshire Hathaway, Inc., 4.50%, 2/11/43 | | 220,000 |
| 249,073 |
|
Chubb INA Holdings, Inc., 3.15%, 3/15/25 | | 280,000 |
| 285,121 |
|
Chubb INA Holdings, Inc., 3.35%, 5/3/26 | | 110,000 |
| 112,872 |
|
CNP Assurances, VRN, 4.00%, 11/18/24(3) | EUR | 300,000 |
| 388,232 |
|
Hartford Financial Services Group, Inc. (The), 5.95%, 10/15/36 | | $ | 50,000 |
| 62,845 |
|
International Lease Finance Corp., 6.25%, 5/15/19 | | 100,000 |
| 106,072 |
|
Markel Corp., 4.90%, 7/1/22 | | 190,000 |
| 206,910 |
|
MetLife, Inc., 4.125%, 8/13/42 | | 110,000 |
| 114,886 |
|
MetLife, Inc., 4.875%, 11/13/43 | | 110,000 |
| 126,360 |
|
Metropolitan Life Global Funding I, 3.00%, 1/10/23(2) | | 200,000 |
| 203,745 |
|
Principal Financial Group, Inc., 3.30%, 9/15/22 | | 70,000 |
| 71,909 |
|
Prudential Financial, Inc., MTN, 5.375%, 6/21/20 | | 70,000 |
| 75,867 |
|
Prudential Financial, Inc., MTN, 5.625%, 5/12/41 | | 370,000 |
| 457,779 |
|
Voya Financial, Inc., 5.70%, 7/15/43 | | 160,000 |
| 190,175 |
|
WR Berkley Corp., 4.625%, 3/15/22 | | 130,000 |
| 139,657 |
|
WR Berkley Corp., 4.75%, 8/1/44 | | 90,000 |
| 95,877 |
|
| | | 4,313,596 |
|
Internet and Direct Marketing Retail — 0.1% | | | |
Amazon.com, Inc., 3.15%, 8/22/27(2) | | 390,000 |
| 393,110 |
|
Amazon.com, Inc., 3.875%, 8/22/37(2) | | 100,000 |
| 103,731 |
|
| | | 496,841 |
|
IT Services — 0.1% | | | |
Fidelity National Information Services, Inc., 3.00%, 8/15/26 | | 200,000 |
| 194,429 |
|
Hewlett Packard Enterprise Co., 3.60%, 10/15/20 | | 280,000 |
| 289,741 |
|
Hewlett Packard Enterprise Co., 4.90%, 10/15/25 | | 70,000 |
| 74,543 |
|
| | | 558,713 |
|
Machinery† | | | |
Oshkosh Corp., 5.375%, 3/1/22 | | 290,000 |
| 301,962 |
|
Media — 0.7% | | | |
21st Century Fox America, Inc., 3.70%, 10/15/25 | | 220,000 |
| 226,815 |
|
|
| | | | | | | |
| | Shares/
Principal Amount | Value |
21st Century Fox America, Inc., 6.90%, 8/15/39 | | $ | 70,000 |
| $ | 95,085 |
|
21st Century Fox America, Inc., 4.75%, 9/15/44 | | 80,000 |
| 85,554 |
|
CBS Corp., 3.50%, 1/15/25 | | 120,000 |
| 122,009 |
|
CBS Corp., 4.85%, 7/1/42 | | 60,000 |
| 62,778 |
|
Charter Communications Operating LLC / Charter Communications Operating Capital, 4.91%, 7/23/25 | | 870,000 |
| 926,921 |
|
Charter Communications Operating LLC / Charter Communications Operating Capital, 6.48%, 10/23/45 | | 70,000 |
| 80,979 |
|
Comcast Corp., 6.40%, 5/15/38 | | 310,000 |
| 416,639 |
|
Comcast Corp., 4.75%, 3/1/44 | | 260,000 |
| 289,534 |
|
Discovery Communications LLC, 5.625%, 8/15/19 | | 56,000 |
| 59,403 |
|
Discovery Communications LLC, 3.95%, 3/20/28 | | 520,000 |
| 516,793 |
|
Interpublic Group of Cos., Inc. (The), 4.00%, 3/15/22 | | 160,000 |
| 167,894 |
|
Lamar Media Corp., 5.375%, 1/15/24 | | 180,000 |
| 189,900 |
|
NBCUniversal Media LLC, 4.375%, 4/1/21 | | 380,000 |
| 407,072 |
|
NBCUniversal Media LLC, 2.875%, 1/15/23 | | 120,000 |
| 121,992 |
|
Nielsen Finance LLC / Nielsen Finance Co., 5.00%, 4/15/22(2) | | 160,000 |
| 165,180 |
|
Omnicom Group, Inc., 3.60%, 4/15/26 | | 270,000 |
| 274,205 |
|
TEGNA, Inc., 5.125%, 7/15/20 | | 330,000 |
| 338,663 |
|
Time Warner Cable LLC, 6.75%, 7/1/18 | | 130,000 |
| 134,157 |
|
Time Warner Cable LLC, 5.50%, 9/1/41 | | 70,000 |
| 73,761 |
|
Time Warner Cable LLC, 4.50%, 9/15/42 | | 100,000 |
| 92,358 |
|
Time Warner, Inc., 4.70%, 1/15/21 | | 140,000 |
| 149,457 |
|
Time Warner, Inc., 3.60%, 7/15/25 | | 400,000 |
| 400,845 |
|
Time Warner, Inc., 3.80%, 2/15/27 | | 150,000 |
| 150,251 |
|
Time Warner, Inc., 5.35%, 12/15/43 | | 120,000 |
| 128,401 |
|
Viacom, Inc., 3.125%, 6/15/22 | | 190,000 |
| 187,743 |
|
Viacom, Inc., 4.25%, 9/1/23 | | 160,000 |
| 164,922 |
|
Virgin Media Secured Finance plc, 5.25%, 1/15/26(2) | | 200,000 |
| 208,290 |
|
Walt Disney Co. (The), MTN, 4.125%, 6/1/44 | | 80,000 |
| 85,159 |
|
| | | 6,322,760 |
|
Metals and Mining — 0.1% | | | |
Barrick North America Finance LLC, 5.75%, 5/1/43 | | 70,000 |
| 87,263 |
|
Glencore Finance Canada Ltd., 4.95%, 11/15/21(2) | | 110,000 |
| 119,019 |
|
Southern Copper Corp., 5.25%, 11/8/42 | | 100,000 |
| 108,885 |
|
Steel Dynamics, Inc., 5.00%, 12/15/26 | | 200,000 |
| 212,000 |
|
Vale Overseas Ltd., 6.25%, 8/10/26 | | 150,000 |
| 173,178 |
|
| | | 700,345 |
|
Multi-Utilities — 0.6% | | | |
AmeriGas Partners LP / AmeriGas Finance Corp., 5.625%, 5/20/24 | | 180,000 |
| 190,575 |
|
Berkshire Hathaway Energy Co., 3.50%, 2/1/25 | | 160,000 |
| 166,426 |
|
CMS Energy Corp., 8.75%, 6/15/19 | | 180,000 |
| 198,646 |
|
Consolidated Edison Co. of New York, Inc., 3.95%, 3/1/43 | | 150,000 |
| 155,483 |
|
Dominion Energy, Inc., 6.40%, 6/15/18 | | 190,000 |
| 195,359 |
|
Dominion Energy, Inc., 2.75%, 9/15/22 | | 210,000 |
| 210,803 |
|
Dominion Energy, Inc., 3.625%, 12/1/24 | | 300,000 |
| 310,895 |
|
|
| | | | | | | |
| | Shares/
Principal Amount | Value |
Dominion Energy, Inc., 4.90%, 8/1/41 | | $ | 120,000 |
| $ | 133,617 |
|
Duke Energy Corp., 3.55%, 9/15/21 | | 90,000 |
| 93,807 |
|
Duke Energy Corp., 3.15%, 8/15/27 | | 60,000 |
| 59,685 |
|
Duke Energy Florida LLC, 6.35%, 9/15/37 | | 110,000 |
| 149,565 |
|
Duke Energy Florida LLC, 3.85%, 11/15/42 | | 220,000 |
| 225,577 |
|
Duke Energy Progress LLC, 4.15%, 12/1/44 | | 130,000 |
| 139,688 |
|
Exelon Corp., 5.15%, 12/1/20 | | 220,000 |
| 236,652 |
|
Exelon Corp., 4.45%, 4/15/46 | | 140,000 |
| 148,818 |
|
Exelon Generation Co. LLC, 4.25%, 6/15/22 | | 120,000 |
| 127,662 |
|
Exelon Generation Co. LLC, 5.60%, 6/15/42 | | 70,000 |
| 73,908 |
|
FirstEnergy Corp., 4.25%, 3/15/23 | | 180,000 |
| 190,691 |
|
FirstEnergy Corp., 4.85%, 7/15/47 | | 90,000 |
| 97,342 |
|
Florida Power & Light Co., 4.125%, 2/1/42 | | 140,000 |
| 151,908 |
|
Georgia Power Co., 4.30%, 3/15/42 | | 70,000 |
| 73,349 |
|
MidAmerican Energy Co., 4.40%, 10/15/44 | | 250,000 |
| 280,997 |
|
NextEra Energy Capital Holdings, Inc., 3.55%, 5/1/27 | | 290,000 |
| 299,842 |
|
NiSource Finance Corp., 5.65%, 2/1/45 | | 140,000 |
| 173,650 |
|
Pacific Gas & Electric Co., 4.00%, 12/1/46 | | 170,000 |
| 170,528 |
|
Potomac Electric Power Co., 3.60%, 3/15/24 | | 120,000 |
| 126,072 |
|
Progress Energy, Inc., 3.15%, 4/1/22 | | 90,000 |
| 92,066 |
|
Sempra Energy, 2.875%, 10/1/22 | | 200,000 |
| 201,874 |
|
Sempra Energy, 3.25%, 6/15/27 | | 180,000 |
| 179,181 |
|
Southern Co. Gas Capital Corp., 3.95%, 10/1/46 | | 90,000 |
| 88,320 |
|
Southern Power Co., 5.15%, 9/15/41 | | 40,000 |
| 43,536 |
|
Southwestern Public Service Co., 3.70%, 8/15/47 | | 100,000 |
| 100,167 |
|
Virginia Electric & Power Co., 3.45%, 2/15/24 | | 160,000 |
| 166,280 |
|
Xcel Energy, Inc., 3.35%, 12/1/26 | | 100,000 |
| 101,510 |
|
| | | 5,354,479 |
|
Multiline Retail† | | | |
Macy's Retail Holdings, Inc., 2.875%, 2/15/23 | | 190,000 |
| 174,092 |
|
Oil, Gas and Consumable Fuels — 0.7% | | | |
Anadarko Petroleum Corp., 5.55%, 3/15/26 | | 180,000 |
| 202,851 |
|
Anadarko Petroleum Corp., 6.45%, 9/15/36 | | 110,000 |
| 133,881 |
|
Antero Resources Corp., 5.00%, 3/1/25 | | 230,000 |
| 234,600 |
|
Apache Corp., 4.75%, 4/15/43 | | 120,000 |
| 122,748 |
|
BP Capital Markets plc, 4.50%, 10/1/20 | | 100,000 |
| 106,668 |
|
BP Capital Markets plc, 2.75%, 5/10/23 | | 200,000 |
| 201,477 |
|
Cenovus Energy, Inc., 4.25%, 4/15/27(2) | | 110,000 |
| 110,576 |
|
Chevron Corp., 2.10%, 5/16/21 | | 280,000 |
| 279,980 |
|
Cimarex Energy Co., 4.375%, 6/1/24 | | 220,000 |
| 234,814 |
|
CNOOC Nexen Finance 2014 ULC, 4.25%, 4/30/24 | | 140,000 |
| 149,481 |
|
Concho Resources, Inc., 4.375%, 1/15/25 | | 200,000 |
| 211,532 |
|
Concho Resources, Inc., 4.875%, 10/1/47 | | 50,000 |
| 53,242 |
|
ConocoPhillips Holding Co., 6.95%, 4/15/29 | | 40,000 |
| 52,395 |
|
Ecopetrol SA, 5.875%, 5/28/45 | | 90,000 |
| 89,325 |
|
Encana Corp., 6.50%, 2/1/38 | | 210,000 |
| 261,822 |
|
EOG Resources, Inc., 5.625%, 6/1/19 | | 150,000 |
| 158,507 |
|
|
| | | | | | | |
| | Shares/
Principal Amount | Value |
EOG Resources, Inc., 4.10%, 2/1/21 | | $ | 130,000 |
| $ | 137,507 |
|
Exxon Mobil Corp., 2.71%, 3/6/25 | | 280,000 |
| 282,148 |
|
Exxon Mobil Corp., 3.04%, 3/1/26 | | 100,000 |
| 102,257 |
|
Hess Corp., 6.00%, 1/15/40 | | 190,000 |
| 207,407 |
|
Marathon Oil Corp., 3.85%, 6/1/25 | | 210,000 |
| 212,270 |
|
Marathon Oil Corp., 5.20%, 6/1/45 | | 90,000 |
| 93,898 |
|
Newfield Exploration Co., 5.75%, 1/30/22 | | 220,000 |
| 237,600 |
|
Noble Energy, Inc., 4.15%, 12/15/21 | | 290,000 |
| 306,154 |
|
Petroleos Mexicanos, 6.00%, 3/5/20 | | 120,000 |
| 128,130 |
|
Petroleos Mexicanos, 4.875%, 1/24/22 | | 240,000 |
| 250,176 |
|
Petroleos Mexicanos, 3.50%, 1/30/23 | | 60,000 |
| 58,752 |
|
Petroleos Mexicanos, 6.625%, 6/15/35 | | 50,000 |
| 52,988 |
|
Petroleos Mexicanos, 5.50%, 6/27/44 | | 230,000 |
| 208,357 |
|
Phillips 66, 4.30%, 4/1/22 | | 250,000 |
| 268,023 |
|
Shell International Finance BV, 2.375%, 8/21/22 | | 130,000 |
| 130,367 |
|
Shell International Finance BV, 3.25%, 5/11/25 | | 200,000 |
| 205,956 |
|
Shell International Finance BV, 3.625%, 8/21/42 | | 140,000 |
| 135,266 |
|
Statoil ASA, 2.45%, 1/17/23 | | 190,000 |
| 190,429 |
|
Statoil ASA, 3.95%, 5/15/43 | | 150,000 |
| 153,898 |
|
Suncor Energy, Inc., 6.50%, 6/15/38 | | 70,000 |
| 93,180 |
|
Total Capital Canada Ltd., 2.75%, 7/15/23 | | 120,000 |
| 121,589 |
|
| | | 6,180,251 |
|
Paper and Forest Products — 0.1% | | | |
Georgia-Pacific LLC, 5.40%, 11/1/20(2) | | 350,000 |
| 382,265 |
|
International Paper Co., 4.40%, 8/15/47 | | 190,000 |
| 197,098 |
|
| | | 579,363 |
|
Pharmaceuticals — 0.2% | | | |
AbbVie, Inc., 4.70%, 5/14/45 | | 60,000 |
| 65,304 |
|
Actavis, Inc., 3.25%, 10/1/22 | | 200,000 |
| 203,445 |
|
Allergan Funding SCS, 3.85%, 6/15/24 | | 320,000 |
| 332,718 |
|
Allergan Funding SCS, 4.55%, 3/15/35 | | 150,000 |
| 158,125 |
|
Baxalta, Inc., 4.00%, 6/23/25 | | 230,000 |
| 241,376 |
|
Celgene Corp., 3.45%, 11/15/27(4) | | 70,000 |
| 69,894 |
|
Forest Laboratories LLC, 4.875%, 2/15/21(2) | | 126,000 |
| 134,867 |
|
Shire Acquisitions Investments Ireland DAC, 2.40%, 9/23/21 | | 460,000 |
| 457,265 |
|
Zoetis, Inc., 3.00%, 9/12/27 | | 100,000 |
| 98,100 |
|
| | | 1,761,094 |
|
Road and Rail — 0.2% | | | |
Burlington Northern Santa Fe LLC, 3.60%, 9/1/20 | | 176,000 |
| 182,899 |
|
Burlington Northern Santa Fe LLC, 4.95%, 9/15/41 | | 50,000 |
| 58,506 |
|
Burlington Northern Santa Fe LLC, 4.45%, 3/15/43 | | 220,000 |
| 242,421 |
|
Burlington Northern Santa Fe LLC, 4.15%, 4/1/45 | | 180,000 |
| 192,180 |
|
CSX Corp., 3.40%, 8/1/24 | | 180,000 |
| 186,069 |
|
CSX Corp., 3.25%, 6/1/27 | | 250,000 |
| 250,734 |
|
Norfolk Southern Corp., 5.75%, 4/1/18 | | 40,000 |
| 40,649 |
|
Norfolk Southern Corp., 3.25%, 12/1/21 | | 200,000 |
| 205,700 |
|
Union Pacific Corp., 4.00%, 2/1/21 | | 100,000 |
| 105,578 |
|
|
| | | | | | | |
| | Shares/
Principal Amount | Value |
Union Pacific Corp., 4.75%, 9/15/41 | | $ | 150,000 |
| $ | 172,493 |
|
Union Pacific Corp., 4.05%, 11/15/45 | | 80,000 |
| 84,193 |
|
| | | 1,721,422 |
|
Semiconductors and Semiconductor Equipment — 0.1% | | | |
Broadcom Corp. / Broadcom Cayman Finance Ltd., 3.125%, 1/15/25(2) | | 210,000 |
| 208,572 |
|
Broadcom Corp. / Broadcom Cayman Finance Ltd., 3.50%, 1/15/28(2) | | 100,000 |
| 99,670 |
|
Intel Corp., 3.15%, 5/11/27 | | 190,000 |
| 193,122 |
|
NXP BV / NXP Funding LLC, 4.125%, 6/15/20(2) | | 200,000 |
| 208,750 |
|
QUALCOMM, Inc., 3.25%, 5/20/27 | | 170,000 |
| 169,973 |
|
Sensata Technologies UK Financing Co. plc, 6.25%, 2/15/26(2) | | 200,000 |
| 220,500 |
|
| | | 1,100,587 |
|
Software — 0.3% | | | |
Microsoft Corp., 2.70%, 2/12/25 | | 570,000 |
| 573,147 |
|
Microsoft Corp., 3.125%, 11/3/25 | | 110,000 |
| 113,125 |
|
Microsoft Corp., 3.45%, 8/8/36 | | 220,000 |
| 222,588 |
|
Microsoft Corp., 4.25%, 2/6/47 | | 340,000 |
| 376,211 |
|
Oracle Corp., 2.50%, 10/15/22 | | 260,000 |
| 261,447 |
|
Oracle Corp., 3.625%, 7/15/23 | | 280,000 |
| 297,593 |
|
Oracle Corp., 2.65%, 7/15/26 | | 100,000 |
| 98,073 |
|
Oracle Corp., 4.30%, 7/8/34 | | 160,000 |
| 176,514 |
|
Oracle Corp., 4.00%, 7/15/46 | | 150,000 |
| 155,717 |
|
| | | 2,274,415 |
|
Specialty Retail — 0.2% | | | |
Ashtead Capital, Inc., 4.125%, 8/15/25(2) | | 200,000 |
| 201,750 |
|
Home Depot, Inc. (The), 3.75%, 2/15/24 | | 150,000 |
| 159,321 |
|
Home Depot, Inc. (The), 5.95%, 4/1/41 | | 360,000 |
| 476,844 |
|
Home Depot, Inc. (The), 3.90%, 6/15/47 | | 50,000 |
| 51,267 |
|
Lowe's Cos., Inc., 3.10%, 5/3/27 | | 190,000 |
| 190,204 |
|
Lowe's Cos., Inc., 4.05%, 5/3/47 | | 80,000 |
| 82,655 |
|
United Rentals North America, Inc., 4.625%, 7/15/23 | | 170,000 |
| 178,394 |
|
| | | 1,340,435 |
|
Technology Hardware, Storage and Peripherals — 0.2% | | | |
Apple, Inc., 2.85%, 5/6/21 | | 180,000 |
| 184,529 |
|
Apple, Inc., 3.00%, 2/9/24 | | 100,000 |
| 102,064 |
|
Apple, Inc., 2.50%, 2/9/25 | | 540,000 |
| 532,366 |
|
Apple, Inc., 3.20%, 5/11/27 | | 250,000 |
| 254,111 |
|
Apple, Inc., 2.90%, 9/12/27 | | 120,000 |
| 118,876 |
|
Dell International LLC / EMC Corp., 6.02%, 6/15/26(2) | | 670,000 |
| 749,165 |
|
Seagate HDD Cayman, 4.75%, 6/1/23 | | 210,000 |
| 216,169 |
|
| | | 2,157,280 |
|
Textiles, Apparel and Luxury Goods† | | | |
PVH Corp., 4.50%, 12/15/22 | | 210,000 |
| 214,200 |
|
Wireless Telecommunication Services† | | | |
America Movil SAB de CV, 3.125%, 7/16/22 | | 310,000 |
| 316,412 |
|
|
| | | | | | | |
| | Shares/
Principal Amount | Value |
Sprint Communications, Inc., 9.00%, 11/15/18(2) | | $ | 74,000 |
| $ | 78,532 |
|
| | | 394,944 |
|
TOTAL CORPORATE BONDS
(Cost $100,629,852) | | | 103,940,365 |
|
U.S. TREASURY SECURITIES — 11.6% | | | |
U.S. Treasury Bonds, 3.50%, 2/15/39 | | 1,050,000 |
| 1,182,132 |
|
U.S. Treasury Bonds, 4.375%, 11/15/39 | | 2,500,000 |
| 3,171,533 |
|
U.S. Treasury Bonds, 4.375%, 5/15/41 | | 1,600,000 |
| 2,039,281 |
|
U.S. Treasury Bonds, 3.125%, 11/15/41 | | 2,200,000 |
| 2,320,785 |
|
U.S. Treasury Bonds, 3.00%, 5/15/42 | | 200,000 |
| 206,340 |
|
U.S. Treasury Bonds, 2.75%, 11/15/42 | | 2,180,000 |
| 2,145,810 |
|
U.S. Treasury Bonds, 2.875%, 5/15/43 | | 1,420,000 |
| 1,427,017 |
|
U.S. Treasury Bonds, 3.75%, 11/15/43 | | 250,000 |
| 292,002 |
|
U.S. Treasury Bonds, 3.125%, 8/15/44 | | 1,830,000 |
| 1,923,788 |
|
U.S. Treasury Bonds, 3.00%, 11/15/44 | | 1,580,000 |
| 1,622,524 |
|
U.S. Treasury Bonds, 2.50%, 2/15/45 | | 5,520,000 |
| 5,132,522 |
|
U.S. Treasury Bonds, 3.00%, 5/15/45 | | 350,000 |
| 359,064 |
|
U.S. Treasury Bonds, 3.00%, 11/15/45 | | 350,000 |
| 358,832 |
|
U.S. Treasury Notes, 0.875%, 1/31/18 | | 2,000,000 |
| 1,998,434 |
|
U.S. Treasury Notes, 1.00%, 3/15/18 | | 7,150,000 |
| 7,142,976 |
|
U.S. Treasury Notes, 0.75%, 4/15/18 | | 1,200,000 |
| 1,197,241 |
|
U.S. Treasury Notes, 2.625%, 4/30/18 | | 875,000 |
| 880,717 |
|
U.S. Treasury Notes, 1.375%, 7/31/18(5) | | 1,130,000 |
| 1,129,647 |
|
U.S. Treasury Notes, 1.125%, 1/31/19 | | 2,000,000 |
| 1,990,547 |
|
U.S. Treasury Notes, 1.50%, 2/28/19 | | 3,000,000 |
| 2,999,004 |
|
U.S. Treasury Notes, 1.625%, 7/31/19 | | 1,350,000 |
| 1,351,160 |
|
U.S. Treasury Notes, 1.625%, 8/31/19 | | 2,800,000 |
| 2,801,586 |
|
U.S. Treasury Notes, 1.75%, 9/30/19 | | 2,600,000 |
| 2,607,465 |
|
U.S. Treasury Notes, 1.50%, 10/31/19 | | 5,650,000 |
| 5,638,965 |
|
U.S. Treasury Notes, 1.50%, 11/30/19 | | 2,600,000 |
| 2,593,398 |
|
U.S. Treasury Notes, 1.375%, 1/15/20 | | 3,000,000 |
| 2,982,891 |
|
U.S. Treasury Notes, 1.375%, 3/31/20 | | 2,950,000 |
| 2,929,315 |
|
U.S. Treasury Notes, 1.375%, 4/30/20 | | 1,500,000 |
| 1,488,750 |
|
U.S. Treasury Notes, 1.50%, 5/15/20 | | 9,800,000 |
| 9,754,828 |
|
U.S. Treasury Notes, 1.625%, 6/30/20 | | 2,350,000 |
| 2,345,135 |
|
U.S. Treasury Notes, 2.25%, 4/30/21 | | 2,000,000 |
| 2,028,438 |
|
U.S. Treasury Notes, 2.00%, 10/31/21 | | 12,380,000 |
| 12,428,601 |
|
U.S. Treasury Notes, 1.875%, 1/31/22 | | 4,600,000 |
| 4,587,961 |
|
U.S. Treasury Notes, 1.875%, 4/30/22 | | 3,500,000 |
| 3,484,756 |
|
U.S. Treasury Notes, 1.50%, 2/28/23 | | 2,100,000 |
| 2,040,199 |
|
U.S. Treasury Notes, 1.375%, 6/30/23 | | 780,000 |
| 749,562 |
|
U.S. Treasury Notes, 1.375%, 8/31/23 | | 1,350,000 |
| 1,294,629 |
|
U.S. Treasury Notes, 2.25%, 11/15/25 | | 2,000,000 |
| 1,992,305 |
|
U.S. Treasury Notes, 2.25%, 8/15/27 | | 400,000 |
| 395,617 |
|
TOTAL U.S. TREASURY SECURITIES
(Cost $102,469,023) | | | 103,015,757 |
|
|
| | | | | | | |
| | Shares/
Principal Amount | Value |
U.S. GOVERNMENT AGENCY MORTGAGE-BACKED SECURITIES(6) — 9.3% | |
Adjustable-Rate U.S. Government Agency Mortgage-Backed Securities(7) — 1.2% | |
FHLMC, VRN, 1.81%, 11/15/17 | | $ | 79,269 |
| $ | 81,970 |
|
FHLMC, VRN, 1.91%, 11/15/17 | | 148,622 |
| 153,363 |
|
FHLMC, VRN, 2.01%, 11/15/17 | | 115,014 |
| 119,166 |
|
FHLMC, VRN, 2.32%, 11/15/17 | | 544,783 |
| 548,305 |
|
FHLMC, VRN, 2.37%, 11/15/17 | | 656,454 |
| 664,221 |
|
FHLMC, VRN, 2.48%, 11/15/17 | | 535,425 |
| 545,465 |
|
FHLMC, VRN, 2.59%, 11/15/17 | | 247,903 |
| 251,807 |
|
FHLMC, VRN, 2.84%, 11/15/17 | | 293,273 |
| 298,552 |
|
FHLMC, VRN, 3.09%, 11/15/17 | | 999,723 |
| 1,027,327 |
|
FHLMC, VRN, 3.09%, 11/15/17 | | 529,531 |
| 558,702 |
|
FHLMC, VRN, 3.12%, 11/15/17 | | 214,463 |
| 226,421 |
|
FHLMC, VRN, 3.23%, 11/15/17 | | 248,587 |
| 262,218 |
|
FHLMC, VRN, 3.49%, 11/15/17 | | 63,797 |
| 66,807 |
|
FHLMC, VRN, 3.53%, 11/15/17 | | 102,268 |
| 107,436 |
|
FHLMC, VRN, 3.61%, 11/15/17 | | 59,429 |
| 63,084 |
|
FHLMC, VRN, 3.63%, 11/15/17 | | 24,276 |
| 25,497 |
|
FHLMC, VRN, 3.65%, 11/15/17 | | 96,789 |
| 100,449 |
|
FHLMC, VRN, 4.06%, 11/15/17 | | 231,803 |
| 241,169 |
|
FHLMC, VRN, 4.07%, 11/15/17 | | 87,878 |
| 91,256 |
|
FNMA, VRN, 2.23%, 11/25/17 | | 562,986 |
| 581,740 |
|
FNMA, VRN, 2.63%, 11/25/17 | | 412,682 |
| 419,136 |
|
FNMA, VRN, 2.93%, 11/25/17 | | 367,889 |
| 376,925 |
|
FNMA, VRN, 2.94%, 11/25/17 | | 228,523 |
| 237,451 |
|
FNMA, VRN, 2.94%, 11/25/17 | | 394,065 |
| 409,693 |
|
FNMA, VRN, 2.94%, 11/25/17 | | 183,779 |
| 191,185 |
|
FNMA, VRN, 2.94%, 11/25/17 | | 313,222 |
| 325,847 |
|
FNMA, VRN, 3.15%, 11/25/17 | | 186,602 |
| 195,577 |
|
FNMA, VRN, 3.18%, 11/25/17 | | 489,949 |
| 501,934 |
|
FNMA, VRN, 3.20%, 11/25/17 | | 807,965 |
| 825,867 |
|
FNMA, VRN, 3.21%, 11/25/17 | | 333,865 |
| 341,374 |
|
FNMA, VRN, 3.26%, 11/25/17 | | 729,017 |
| 753,314 |
|
FNMA, VRN, 3.32%, 11/25/17 | | 31,958 |
| 33,284 |
|
FNMA, VRN, 3.32%, 11/25/17 | | 92,316 |
| 95,628 |
|
FNMA, VRN, 3.35%, 11/25/17 | | 50,801 |
| 53,374 |
|
FNMA, VRN, 3.53%, 11/25/17 | | 153,203 |
| 159,375 |
|
FNMA, VRN, 3.93%, 11/25/17 | | 145,906 |
| 151,285 |
|
| | | 11,086,204 |
|
Fixed-Rate U.S. Government Agency Mortgage-Backed Securities — 8.1% | |
FHLMC, 4.50%, 1/1/19 | | 26,190 |
| 26,703 |
|
FHLMC, 6.50%, 1/1/28 | | 15,061 |
| 16,719 |
|
FHLMC, 5.50%, 12/1/33 | | 120,189 |
| 135,233 |
|
FHLMC, 5.00%, 7/1/35 | | 995,692 |
| 1,087,676 |
|
FHLMC, 5.50%, 1/1/38 | | 106,063 |
| 118,013 |
|
FHLMC, 6.00%, 8/1/38 | | 59,240 |
| 66,936 |
|
FHLMC, 3.00%, 2/1/43 | | 928,606 |
| 935,071 |
|
|
| | | | | | | |
| | Shares/
Principal Amount | Value |
FHLMC, 6.50%, 7/1/47 | | $ | 7,098 |
| $ | 7,612 |
|
FNMA, 3.00%, 11/13/17(8) | | 5,250,000 |
| 5,252,666 |
|
FNMA, 3.50%, 11/13/17(8) | | 13,900,000 |
| 14,286,594 |
|
FNMA, 4.00%, 11/13/17(8) | | 7,450,000 |
| 7,817,844 |
|
FNMA, 4.50%, 11/13/17(8) | | 1,705,000 |
| 1,822,685 |
|
FNMA, 4.50%, 5/1/19 | | 13,558 |
| 13,793 |
|
FNMA, 4.50%, 5/1/19 | | 31,676 |
| 32,227 |
|
FNMA, 5.00%, 9/1/20 | | 105,365 |
| 107,115 |
|
FNMA, 6.50%, 1/1/29 | | 21,477 |
| 24,368 |
|
FNMA, 7.50%, 7/1/29 | | 54,608 |
| 60,392 |
|
FNMA, 7.50%, 9/1/30 | | 12,698 |
| 15,176 |
|
FNMA, 5.00%, 7/1/31 | | 617,287 |
| 670,702 |
|
FNMA, 6.50%, 9/1/31 | | 15,398 |
| 17,078 |
|
FNMA, 7.00%, 9/1/31 | | 7,922 |
| 8,651 |
|
FNMA, 6.50%, 1/1/32 | | 14,628 |
| 16,223 |
|
FNMA, 6.50%, 8/1/32 | | 22,018 |
| 25,020 |
|
FNMA, 5.50%, 6/1/33 | | 64,971 |
| 72,561 |
|
FNMA, 5.50%, 7/1/33 | | 109,847 |
| 122,629 |
|
FNMA, 5.50%, 8/1/33 | | 194,381 |
| 217,310 |
|
FNMA, 5.50%, 9/1/33 | | 125,005 |
| 140,386 |
|
FNMA, 5.00%, 11/1/33 | | 368,919 |
| 404,819 |
|
FNMA, 5.00%, 4/1/35 | | 482,463 |
| 529,503 |
|
FNMA, 4.50%, 9/1/35 | | 219,587 |
| 235,736 |
|
FNMA, 5.00%, 2/1/36 | | 313,501 |
| 344,026 |
|
FNMA, 5.50%, 4/1/36 | | 117,539 |
| 131,292 |
|
FNMA, 5.50%, 5/1/36 | | 227,364 |
| 253,775 |
|
FNMA, 5.00%, 11/1/36 | | 832,332 |
| 913,567 |
|
FNMA, 5.50%, 2/1/37 | | 57,677 |
| 64,309 |
|
FNMA, 6.00%, 7/1/37 | | 464,883 |
| 525,946 |
|
FNMA, 6.50%, 8/1/37 | | 82,143 |
| 90,753 |
|
FNMA, 5.50%, 7/1/39 | | 385,424 |
| 430,227 |
|
FNMA, 5.00%, 4/1/40 | | 924,964 |
| 1,005,650 |
|
FNMA, 5.00%, 6/1/40 | | 765,701 |
| 832,967 |
|
FNMA, 4.50%, 8/1/40 | | 1,129,631 |
| 1,215,522 |
|
FNMA, 4.50%, 9/1/40 | | 2,109,085 |
| 2,280,026 |
|
FNMA, 3.50%, 1/1/41 | | 1,185,353 |
| 1,224,290 |
|
FNMA, 4.00%, 1/1/41 | | 1,076,321 |
| 1,146,586 |
|
FNMA, 4.00%, 5/1/41 | | 1,162,530 |
| 1,225,630 |
|
FNMA, 4.50%, 7/1/41 | | 399,767 |
| 432,369 |
|
FNMA, 4.50%, 9/1/41 | | 425,997 |
| 458,375 |
|
FNMA, 4.50%, 9/1/41 | | 1,828,241 |
| 1,969,915 |
|
FNMA, 4.00%, 12/1/41 | | 1,085,233 |
| 1,152,038 |
|
FNMA, 4.00%, 1/1/42 | | 643,368 |
| 678,269 |
|
FNMA, 4.00%, 1/1/42 | | 862,421 |
| 909,115 |
|
FNMA, 3.50%, 5/1/42 | | 1,718,743 |
| 1,775,501 |
|
FNMA, 3.50%, 6/1/42 | | 588,948 |
| 609,557 |
|
FNMA, 3.00%, 11/1/42 | | 1,428,013 |
| 1,436,803 |
|
|
| | | | | | | |
| | Shares/
Principal Amount | Value |
FNMA, 3.50%, 5/1/45 | | $ | 1,603,785 |
| $ | 1,654,498 |
|
FNMA, 6.50%, 8/1/47 | | 13,762 |
| 14,844 |
|
FNMA, 6.50%, 9/1/47 | | 16,171 |
| 17,385 |
|
FNMA, 6.50%, 9/1/47 | | 1,183 |
| 1,275 |
|
FNMA, 6.50%, 9/1/47 | | 23,366 |
| 25,137 |
|
FNMA, 6.50%, 9/1/47 | | 6,233 |
| 6,689 |
|
GNMA, 3.00%, 11/20/17(8) | | 3,150,000 |
| 3,186,914 |
|
GNMA, 3.50%, 11/20/17(8) | | 3,300,000 |
| 3,423,106 |
|
GNMA, 4.00%, 11/20/17(8) | | 2,000,000 |
| 2,100,078 |
|
GNMA, 7.00%, 4/20/26 | | 39,307 |
| 44,869 |
|
GNMA, 7.50%, 8/15/26 | | 21,359 |
| 24,236 |
|
GNMA, 7.00%, 2/15/28 | | 8,803 |
| 8,824 |
|
GNMA, 7.50%, 2/15/28 | | 10,659 |
| 10,739 |
|
GNMA, 7.00%, 12/15/28 | | 9,489 |
| 9,512 |
|
GNMA, 7.00%, 5/15/31 | | 45,685 |
| 53,064 |
|
GNMA, 5.50%, 11/15/32 | | 147,552 |
| 165,607 |
|
GNMA, 4.50%, 5/20/41 | | 456,844 |
| 491,173 |
|
GNMA, 4.50%, 6/15/41 | | 494,315 |
| 535,108 |
|
GNMA, 4.00%, 12/15/41 | | 805,149 |
| 850,323 |
|
GNMA, 3.50%, 6/20/42 | | 962,579 |
| 1,004,922 |
|
GNMA, 3.50%, 7/20/42 | | 469,952 |
| 490,194 |
|
GNMA, 4.50%, 11/20/43 | | 619,109 |
| 657,058 |
|
GNMA, 2.50%, 7/20/46 | | 1,374,519 |
| 1,345,707 |
|
| | | 71,515,211 |
|
TOTAL U.S. GOVERNMENT AGENCY MORTGAGE-BACKED SECURITIES
(Cost $82,186,891) | 82,601,415 |
|
COLLATERALIZED MORTGAGE OBLIGATIONS(6) — 2.8% | | |
Private Sponsor Collateralized Mortgage Obligations — 1.8% | | |
ABN Amro Mortgage Corp., Series 2003-4, Class A4, 5.50%, 3/25/33 | | 18,411 |
| 18,604 |
|
Adjustable Rate Mortgage Trust, Series 2004-4, Class 4A1, VRN, 3.41%, 11/1/17(7) | | 241,786 |
| 244,044 |
|
Agate Bay Mortgage Loan Trust, Series 2016-3, Class A3, VRN, 3.50%, 11/1/17(2)(7) | | 401,205 |
| 409,429 |
|
Agate Bay Mortgage Trust, Series 2014-2, Class A14, VRN, 3.75%, 11/1/17(2)(7) | | 327,742 |
| 336,649 |
|
Banc of America Mortgage Trust, Series 2004-E, Class 2A6 SEQ, VRN, 3.83%, 11/1/17(7) | | 217,075 |
| 216,719 |
|
Citigroup Mortgage Loan Trust, Inc., Series 2004-UST1, Class A4, VRN, 3.29%, 11/1/17(7) | | 337,482 |
| 329,035 |
|
Citigroup Mortgage Loan Trust, Inc., Series 2004-UST1, Class A5, VRN, 3.08%, 11/1/17(7) | | 661,681 |
| 656,174 |
|
Citigroup Mortgage Loan Trust, Inc., Series 2005-4, Class A, VRN, 3.55%, 11/1/17(7) | | 92,148 |
| 91,548 |
|
Citigroup Mortgage Loan Trust, Inc., Series 2005-6, Class A2, VRN, 3.18%, 4/1/18, resets annually off the 1-year H15T1Y plus 2.15% | | 177,287 |
| 179,292 |
|
Countrywide Home Loan Mortgage Pass-Through Trust, Series 2005-17, Class 1A11, 5.50%, 9/25/35 | | 5,435 |
| 5,291 |
|
Credit Suisse Mortgage Trust, Series 2017-HL1, Class A3 SEQ, VRN, 3.50%, 11/1/17(2)(7) | | 526,730 |
| 538,347 |
|
|
| | | | | | | |
| | Shares/
Principal Amount | Value |
Credit Suisse Mortgage Trust, Series 2017-HL2, Class A3 SEQ, VRN, 3.50%, 11/1/17(2)(7) | | $ | 1,000,000 |
| $ | 1,016,250 |
|
First Horizon Alternative Mortgage Securities Trust, Series 2004-AA4, Class A1, VRN, 3.35%, 11/1/17(7) | | 372,815 |
| 373,008 |
|
First Horizon Mortgage Pass-Through Trust, Series 2005-AR3, Class 4A1, VRN, 3.34%, 11/1/17(7) | | 72,164 |
| 71,516 |
|
Flagstar Mortgage Trust 2017-2, Series 2017-2, Class A5 SEQ, VRN, 3.50%, 11/1/17(2)(7) | | 1,000,000 |
| 1,016,250 |
|
GSR Mortgage Loan Trust, Series 2004-7, Class 3A1, VRN, 3.24%, 11/1/17(7) | | 150,714 |
| 149,626 |
|
GSR Mortgage Loan Trust, Series 2004-AR5, Class 3A3, VRN, 3.56%, 11/1/17(7) | | 146,168 |
| 147,307 |
|
GSR Mortgage Loan Trust, Series 2005-AR1, Class 3A1, VRN, 3.60%, 11/1/17(7) | | 267,711 |
| 269,830 |
|
GSR Mortgage Loan Trust, Series 2005-AR6, Class 2A1, VRN, 3.28%, 11/1/17(7) | | 248,635 |
| 254,335 |
|
GSR Mortgage Loan Trust, Series 2005-AR6, Class 4A5, VRN, 3.51%, 11/1/17(7) | | 338,447 |
| 341,750 |
|
JPMorgan Mortgage Trust, Series 2005-A4, Class 1A1, VRN, 3.46%, 11/1/17(7) | | 84,300 |
| 84,560 |
|
JPMorgan Mortgage Trust, Series 2005-A4, Class 2A1, VRN, 3.67%, 11/1/17(7) | | 42,403 |
| 42,484 |
|
JPMorgan Mortgage Trust, Series 2006-A3, Class 7A1, VRN, 3.61%, 11/1/17(7) | | 212,288 |
| 215,389 |
|
JPMorgan Mortgage Trust, Series 2013-1, Class 2A2 SEQ, VRN, 2.50%, 11/1/17(2)(7) | | 90,030 |
| 89,953 |
|
JPMorgan Mortgage Trust, Series 2016-4, Class A3, VRN, 3.50%, 11/1/17(2)(7) | | 300,951 |
| 306,909 |
|
JPMorgan Mortgage Trust, Series 2017-1, Class A2, VRN, 3.50%, 11/1/17(2)(7) | | 805,228 |
| 820,035 |
|
MASTR Adjustable Rate Mortgages Trust, Series 2004-13, Class 3A7, VRN, 3.47%, 11/1/17(7) | | 322,935 |
| 331,996 |
|
Merrill Lynch Mortgage Investors Trust, Series 2005-3, Class 2A, VRN, 3.22%, 11/27/17(7) | | 145,497 |
| 144,223 |
|
Merrill Lynch Mortgage Investors Trust, Series 2005-A2, Class A1, VRN, 2.97%, 11/1/17(7) | | 245,564 |
| 243,430 |
|
New Residential Mortgage Loan Trust, Series 2017-2A, Class A3, VRN, 4.00%, 11/1/17(2)(7) | | 514,455 |
| 535,853 |
|
PHHMC Mortgage Pass-Through Certificates, Series 2007-6, Class A1, VRN, 5.82%, 11/1/17(7) | | 7,681 |
| 7,931 |
|
Sequoia Mortgage Trust, Series 2012-1, Class 1A1, VRN, 2.87%, 11/1/17(7) | | 25,734 |
| 25,939 |
|
Sequoia Mortgage Trust, Series 2013-12, Class A1 SEQ, 4.00%, 12/25/43(2) | | 142,807 |
| 149,032 |
|
Sequoia Mortgage Trust, Series 2017-1, Class A1, VRN, 3.50%, 11/1/17(2)(7) | | 595,861 |
| 608,057 |
|
Sequoia Mortgage Trust, Series 2017-5, Class A4 SEQ, VRN, 3.50%, 11/1/17(2)(7) | | 479,767 |
| 490,761 |
|
Sequoia Mortgage Trust, Series 2017-7, Class A4 SEQ, VRN, 3.50%, 11/1/17(2)(7) | | 747,088 |
| 766,576 |
|
Sofi Mortgage Trust, Series 2016-1A, Class 1A4 SEQ, VRN, 3.00%, 11/1/17(2)(7) | | 302,348 |
| 296,681 |
|
Structured Adjustable Rate Mortgage Loan Trust, Series 2004-6, Class 3A2, VRN, 3.36%, 11/1/17(7) | | 182,679 |
| 190,909 |
|
Structured Adjustable Rate Mortgage Loan Trust, Series 2004-8, Class 2A1, VRN, 3.33%, 11/1/17(7) | | 135,143 |
| 135,903 |
|
|
| | | | | | | |
| | Shares/
Principal Amount | Value |
Thornburg Mortgage Securities Trust, Series 2004-3, Class A, VRN, 1.98%, 11/27/17, resets monthly off the 1-month LIBOR plus 0.74% | | $ | 680,229 |
| $ | 649,901 |
|
Towd Point Mortgage Trust, Series 2016-1, Class A1, VRN, 3.50%, 11/1/17(2)(7) | | 348,616 |
| 356,291 |
|
WaMu Mortgage Pass-Through Certificates, Series 2005-AR3, Class A1, VRN, 3.07%, 11/1/17(7) | | 476,740 |
| 470,239 |
|
Wells Fargo Mortgage-Backed Securities Trust, Series 2004-4, Class A9, 5.50%, 5/25/34 | | 48,946 |
| 50,025 |
|
Wells Fargo Mortgage-Backed Securities Trust, Series 2004-S, Class A1, VRN, 3.47%, 11/1/17(7) | | 117,697 |
| 120,468 |
|
Wells Fargo Mortgage-Backed Securities Trust, Series 2004-Z, Class 2A2, VRN, 3.08%, 11/1/17(7) | | 114,362 |
| 116,741 |
|
Wells Fargo Mortgage-Backed Securities Trust, Series 2005-17, Class 1A1, 5.50%, 1/25/36 | | 61,339 |
| 60,665 |
|
Wells Fargo Mortgage-Backed Securities Trust, Series 2005-9, Class 2A6, 5.25%, 10/25/35 | | 198,114 |
| 203,902 |
|
Wells Fargo Mortgage-Backed Securities Trust, Series 2005-AR10, Class 1A1, VRN, 3.38%, 11/1/17(7) | | 431,349 |
| 454,020 |
|
Wells Fargo Mortgage-Backed Securities Trust, Series 2005-AR10, Class 2A15, VRN, 3.37%, 11/1/17(7) | | 42,314 |
| 43,608 |
|
Wells Fargo Mortgage-Backed Securities Trust, Series 2005-AR10, Class 2A17, VRN, 3.37%, 11/1/17(7) | | 282,092 |
| 290,016 |
|
Wells Fargo Mortgage-Backed Securities Trust, Series 2005-AR16, Class 3A2, VRN, 3.45%, 11/1/17(7) | | 218,773 |
| 221,505 |
|
Wells Fargo Mortgage-Backed Securities Trust, Series 2005-AR7, Class 1A1, VRN, 3.34%, 11/1/17(7) | | 209,608 |
| 211,165 |
|
Wells Fargo Mortgage-Backed Securities Trust, Series 2006-10, Class A4 SEQ, 6.00%, 8/25/36 | | 97,798 |
| 97,917 |
|
Wells Fargo Mortgage-Backed Securities Trust, Series 2006-13, Class A5, 6.00%, 10/25/36 | | 117,307 |
| 116,503 |
|
Wells Fargo Mortgage-Backed Securities Trust, Series 2007-13, Class A1, 6.00%, 9/25/37 | | 62,166 |
| 62,767 |
|
Wells Fargo Mortgage-Backed Securities Trust, Series 2007-14, Class 2A2, 5.50%, 10/25/22 | | 47,828 |
| 49,053 |
|
Wells Fargo Mortgage-Backed Securities Trust, Series 2007-16, Class 1A1, 6.00%, 12/28/37 | | 34,564 |
| 36,211 |
|
Wells Fargo Mortgage-Backed Securities Trust, Series 2007-AR10, Class 1A1, VRN, 5.73%, 11/1/17(7) | | 81,726 |
| 78,796 |
|
Wells Fargo Mortgage-Backed Securities Trust, Series 2008-1, Class 4A1, 5.75%, 2/25/38 | | 158,300 |
| 167,059 |
|
| | | 16,008,477 |
|
U.S. Government Agency Collateralized Mortgage Obligations — 1.0% | |
FHLMC, Series 2016-DNA4, Class M2, VRN, 2.54%, 11/27/17, resets monthly off the 1-month LIBOR plus 1.30% | | 40,000 |
| 40,550 |
|
FHLMC, Series 2016-HQA3, Class M2, VRN, 2.59%, 11/27/17, resets monthly off the 1-month LIBOR plus 1.35% | | 475,000 |
| 480,869 |
|
FHLMC, Series 2017-DNA2, Class M1, VRN, 2.44%, 11/27/17, resets monthly off the 1-month LIBOR plus 1.20% | | 68,135 |
| 69,047 |
|
FHLMC, Series 77, Class H, 8.50%, 9/15/20 | | 499 |
| 511 |
|
FHLMC, Series KF29, Class A, VRN, 1.59%, 11/25/17, resets monthly off the 1-month LIBOR plus 0.36% | | 1,779,804 |
| 1,781,765 |
|
FHLMC, Series KF31, Class A, VRN, 1.60%, 11/25/17, resets monthly off the 1-month LIBOR plus 0.37% | | 1,950,000 |
| 1,954,042 |
|
FHLMC, Series KF32, Class A, VRN, 1.60%, 11/25/17, resets monthly off the 1-month LIBOR plus 0.37% | | 1,774,848 |
| 1,777,985 |
|
|
| | | | | | | |
| | Shares/
Principal Amount | Value |
FNMA, Series 2014-C02, Class 1M2, VRN, 3.84%, 11/27/17, resets monthly off the 1-month LIBOR plus 2.60% | | $ | 125,000 |
| $ | 131,196 |
|
FNMA, Series 2014-C02, Class 2M2, VRN, 3.84%, 11/27/17, resets monthly off the 1-month LIBOR plus 2.60% | | 650,000 |
| 676,793 |
|
FNMA, Series 2016-C04, Class 1M1, VRN, 2.69%, 11/27/17, resets monthly off the 1-month LIBOR plus 1.45% | | 487,264 |
| 492,508 |
|
FNMA, Series 2016-C05, Class 2M1, VRN, 2.59%, 11/27/17, resets monthly off the 1-month LIBOR plus 1.35% | | 420,387 |
| 423,218 |
|
FNMA, Series 2017-C01, Class 1M1, VRN, 2.54%, 11/27/17, resets monthly off the 1-month LIBOR plus 1.30% | | 714,683 |
| 721,698 |
|
FNMA, Series 2017-C03, Class 1M1, VRN, 2.19%, 11/27/17, resets monthly off the 1-month LIBOR plus 0.95% | | 659,120 |
| 663,521 |
|
| | | 9,213,703 |
|
TOTAL COLLATERALIZED MORTGAGE OBLIGATIONS
(Cost $25,121,101) | | | 25,222,180 |
|
ASSET-BACKED SECURITIES(6) — 2.3% | | | |
Avis Budget Rental Car Funding AESOP LLC, Series 2014-1A, Class A SEQ, 2.46%, 7/20/20(2) | | 1,500,000 |
| 1,506,386 |
|
BRE Grand Islander Timeshare Issuer LLC, Series 2017-1A, Class A SEQ, 2.94%, 5/25/29(2) | | 539,368 |
| 539,473 |
|
Citibank Credit Card Issuance Trust, Series 2017-A5, Class A5, VRN, 1.86%, 11/22/17, resets monthly off the 1-month LIBOR plus 0.62% | | 1,250,000 |
| 1,265,538 |
|
Colony American Homes, Series 2014-2A, Class A, VRN, 2.19%, 11/17/17, resets monthly off the 1-month LIBOR plus 0.95%(2) | | 602,458 |
| 605,146 |
|
Colony Starwood Homes, Series 2016-2A, Class A, VRN, 2.49%, 11/17/17, resets monthly off the 1-month LIBOR plus 1.25%(2) | | 1,393,276 |
| 1,406,289 |
|
Enterprise Fleet Financing LLC, Series 2015-2, Class A2 SEQ, 1.59%, 2/22/21(2) | | 337,587 |
| 337,537 |
|
Enterprise Fleet Financing LLC, Series 2016-1, Class A2 SEQ, 1.83%, 9/20/21(2) | | 435,692 |
| 435,807 |
|
Enterprise Fleet Financing LLC, Series 2016-2, Class A2 SEQ, 1.74%, 2/22/22(2) | | 1,426,514 |
| 1,425,682 |
|
Enterprise Fleet Financing LLC, Series 2017-1, Class A2 SEQ, 2.13%, 7/20/22(2) | | 650,000 |
| 651,680 |
|
Enterprise Fleet Financing LLC, Series 2017-2, Class A2 SEQ, 1.97%, 1/20/23(2) | | 1,300,000 |
| 1,300,285 |
|
Hertz Vehicle Financing LLC, Series 2013-1A, Class A2 SEQ, 1.83%, 8/25/19(2) | | 2,250,000 |
| 2,248,658 |
|
Hilton Grand Vacations Trust, Series 2013-A, Class A SEQ, 2.28%, 1/25/26(2) | | 88,001 |
| 87,621 |
|
Hilton Grand Vacations Trust, Series 2014-AA, Class A SEQ, 1.77%, 11/25/26(2) | | 484,914 |
| 479,015 |
|
Hilton Grand Vacations Trust, Series 2017-AA, Class A SEQ, 2.66%, 12/26/28(2) | | 499,565 |
| 499,234 |
|
Honda Auto Receivables Owner Trust, Series 2017-1, Class A2 SEQ, 1.42%, 7/22/19 | | 672,721 |
| 672,370 |
|
Hyundai Auto Receivables Trust, Series 2017-A, Class A2A SEQ, 1.48%, 2/18/20 | | 1,500,000 |
| 1,500,861 |
|
Invitation Homes Trust, Series 2014-SFR3, Class A, VRN, 2.44%, 11/17/17, resets monthly off the 1-month LIBOR plus 1.20%(2) | | 143,309 |
| 143,420 |
|
MVW Owner Trust, Series 2014-1A, Class A, 2.25%, 9/22/31(2) | | 287,297 |
| 284,732 |
|
|
| | | | | | | |
| | Shares/
Principal Amount | Value |
MVW Owner Trust, Series 2015-1A, Class A SEQ, 2.52%, 12/20/32(2) | | $ | 319,587 |
| $ | 319,753 |
|
MVW Owner Trust, Series 2016-1A, Class A SEQ, 2.25%, 12/20/33(2) | | 512,806 |
| 504,314 |
|
MVW Owner Trust, Series 2017-1A, Class A SEQ, 2.42%, 12/20/34(2) | | 1,055,892 |
| 1,051,942 |
|
Progress Residential Trust, Series 2016-SFR2, Class A, VRN, 2.64%, 11/17/17, resets monthly off the 1-month LIBOR plus 1.40%(2) | | 550,000 |
| 556,070 |
|
Sierra Receivables Funding Co. LLC, Series 2017-1A, Class A SEQ, 2.91%, 3/20/34(2) | | 353,252 |
| 354,714 |
|
Sierra Timeshare Receivables Funding LLC, Series 2014-1A, Class A SEQ, 2.07%, 3/20/30(2) | | 342,205 |
| 341,684 |
|
Sierra Timeshare Receivables Funding LLC, Series 2015-1A, Class A, 2.40%, 3/22/32(2) | | 188,409 |
| 188,205 |
|
Towd Point Mortgage Trust, Series 2017-2, Class A1, VRN, 2.75%, 11/1/17(2)(7) | | 547,070 |
| 550,507 |
|
US Airways Pass-Through Trust, Series 2013-1, Class A, 3.95%, 5/15/27 | | 136,943 |
| 142,763 |
|
VSE VOI Mortgage LLC, Series 2016-A, Class A SEQ, 2.54%, 7/20/33(2) | | 690,387 |
| 687,599 |
|
TOTAL ASSET-BACKED SECURITIES
(Cost $20,057,246) | | | 20,087,285 |
|
COMMERCIAL MORTGAGE-BACKED SECURITIES(6) — 1.9% | | |
Bank of America Merrill Lynch Commercial Mortgage Securities Trust, Series 2014-ICTS, Class A, VRN, 2.04%, 11/15/17, resets monthly off the 1-month LIBOR plus 0.80%(2) | | 825,000 |
| 826,289 |
|
Bank of America Merrill Lynch Commercial Mortgage Securities Trust, Series 2015-200P, Class B, 3.49%, 4/14/33(2) | | 625,000 |
| 637,075 |
|
BB-UBS Trust, Series 2012-SHOW, Class A SEQ, 3.43%, 11/5/36(2) | | 1,000,000 |
| 1,021,809 |
|
COMM Mortgage Trust, Series 2017-PANW, Class A, 3.24%, 11/10/34(2) | | 800,000 |
| 809,469 |
|
Commercial Mortgage Pass-Through Certificates, Series 2014-CR15, Class AM SEQ, VRN, 4.43%, 11/1/17(7) | | 675,000 |
| 725,639 |
|
Commercial Mortgage Pass-Through Certificates, Series 2014-LC17, Class AM, VRN, 4.19%, 11/1/17(7) | | 775,000 |
| 826,227 |
|
Commercial Mortgage Pass-Through Certificates, Series 2014-UBS5, Class AM, VRN, 4.19%, 11/1/17(7) | | 900,000 |
| 955,798 |
|
Commercial Mortgage Trust, Series 2016-CD1, Class AM, 2.93%, 8/10/49 | | 400,000 |
| 389,927 |
|
Core Industrial Trust, Series 2015-WEST, Class A SEQ, 3.29%, 2/10/37(2) | | 1,100,000 |
| 1,124,271 |
|
DBCG Mortgage Trust, Series 2017-BBG, Class A, VRN, 1.94%, 11/15/17, resets monthly off the 1-month LIBOR plus 0.70%(2) | | 1,250,000 |
| 1,257,595 |
|
GS Mortgage Securities Corp. II, Series 2016-GS2, Class B, VRN, 3.76%, 11/1/17(7) | | 1,000,000 |
| 1,025,341 |
|
Hudson Yards Mortgage Trust, Series 2016-10HY, Class B, VRN, 2.98%, 11/1/17(2)(7) | | 1,275,000 |
| 1,241,496 |
|
JPMBB Commercial Mortgage Securities Trust, Series 2014-C21, Class B, VRN, 4.34%, 11/1/17(7) | | 475,000 |
| 491,879 |
|
JPMDB Commercial Mortgage Securities Trust, Series 2017-C5, Class A4, 3.41%, 3/15/50 | | 920,000 |
| 949,514 |
|
JPMorgan Chase Commercial Mortgage Securities Trust, Series 2013-C16, Class A4, 4.17%, 12/15/46 | | 275,000 |
| 295,338 |
|
|
| | | | | | | |
| | Shares/
Principal Amount | Value |
JPMorgan Chase Commercial Mortgage Securities Trust, Series 2013-C16, Class AS, 4.52%, 12/15/46 | | $ | 450,000 |
| $ | 485,032 |
|
JPMorgan Chase Commercial Mortgage Securities Trust, Series 2014-CBM, Class A, VRN, 2.14%, 11/15/17, resets monthly off the 1-month LIBOR plus 0.90%(2) | | 925,000 |
| 925,658 |
|
JPMorgan Chase Commercial Mortgage Securities Trust, Series 2016-JP2, Class A4, 2.82%, 8/15/49 | | 600,000 |
| 592,789 |
|
Morgan Stanley Bank of America Merrill Lynch Trust, Series 2017-C34, Class A3 SEQ, 3.28%, 11/15/52 | | 675,000 |
| 690,414 |
|
Morgan Stanley Capital I Trust, Series 2014-CPT, Class C, VRN, 3.45%, 11/1/17(2)(7) | | 725,000 |
| 736,998 |
|
UBS Commercial Mortgage Trust, Series 2017-C1, Class A3, 3.20%, 6/15/50 | | 700,000 |
| 709,085 |
|
TOTAL COMMERCIAL MORTGAGE-BACKED SECURITIES
(Cost $16,628,635) | | 16,717,643 |
|
U.S. GOVERNMENT AGENCY SECURITIES — 0.8% | | | |
FNMA, 2.125%, 4/24/26 | | 270,000 |
| 262,846 |
|
FNMA, 6.625%, 11/15/30 | | 4,870,000 |
| 6,916,179 |
|
TOTAL U.S. GOVERNMENT AGENCY SECURITIES
(Cost $6,968,508) | | | 7,179,025 |
|
MUNICIPAL SECURITIES — 0.5% | | | |
Bay Area Toll Authority Rev., 6.92%, 4/1/40 | | 195,000 |
| 277,545 |
|
Los Angeles Community College District GO, 6.68%, 8/1/36 | | 100,000 |
| 139,811 |
|
Metropolitan Transportation Authority Rev., 6.69%, 11/15/40 | | 105,000 |
| 147,299 |
|
Metropolitan Transportation Authority Rev., 6.81%, 11/15/40 | | 60,000 |
| 84,942 |
|
Missouri Highway & Transportation Commission Rev., 5.45%, 5/1/33 | | 130,000 |
| 152,096 |
|
New Jersey Turnpike Authority Rev., 7.41%, 1/1/40 | | 200,000 |
| 305,038 |
|
New Jersey Turnpike Authority Rev., 7.10%, 1/1/41 | | 95,000 |
| 140,468 |
|
New York City GO, 6.27%, 12/1/37 | | 95,000 |
| 127,507 |
|
Ohio Water Development Authority Water Pollution Control Loan Fund Rev., 4.88%, 12/1/34 | | 110,000 |
| 127,170 |
|
Port Authority of New York & New Jersey Rev., 4.93%, 10/1/51 | | 50,000 |
| 60,380 |
|
Port Authority of New York & New Jersey Rev., 4.46%, 10/1/62 | | 245,000 |
| 275,515 |
|
Rutgers The State University of New Jersey Rev., 5.67%, 5/1/40 | | 205,000 |
| 249,274 |
|
Sacramento Municipal Utility District Electric Rev., 6.16%, 5/15/36 | | 210,000 |
| 266,316 |
|
Salt River Project Agricultural Improvement & Power District Rev., 4.84%, 1/1/41 | | 95,000 |
| 112,843 |
|
San Francisco Public Utilities Commission Water Rev., 6.00%, 11/1/40 | | 105,000 |
| 133,578 |
|
San Francisco Public Utilities Commission Water Rev., 6.95%, 11/1/50 | | 65,000 |
| 95,678 |
|
Santa Clara Valley Transportation Authority Rev., 5.88%, 4/1/32 | | 120,000 |
| 146,069 |
|
State of California GO, 7.55%, 4/1/39 | | 100,000 |
| 154,550 |
|
State of California GO, 7.30%, 10/1/39 | | 290,000 |
| 428,904 |
|
State of California GO, (Building Bonds), 7.60%, 11/1/40 | | 80,000 |
| 125,878 |
|
State of Illinois GO, 5.10%, 6/1/33 | | 245,000 |
| 247,457 |
|
State of Oregon Department of Transportation Rev., Series 2010 A, (Building Bonds), 5.83%, 11/15/34 | | 70,000 |
| 89,678 |
|
|
| | | | | | | |
| | Shares/
Principal Amount | Value |
State of Texas GO, 5.52%, 4/1/39 | | $ | 50,000 |
| $ | 64,218 |
|
State of Washington GO, 5.14%, 8/1/40 | | 20,000 |
| 24,965 |
|
TOTAL MUNICIPAL SECURITIES
(Cost $3,244,952) | | | 3,977,179 |
|
SOVEREIGN GOVERNMENTS AND AGENCIES — 0.4% | | | |
Chile† | | | |
Chile Government International Bond, 3.25%, 9/14/21 | | 100,000 |
| 104,150 |
|
Chile Government International Bond, 3.625%, 10/30/42 | | 100,000 |
| 99,500 |
|
| | | 203,650 |
|
Colombia — 0.1% | | | |
Colombia Government International Bond, 4.375%, 7/12/21 | | 310,000 |
| 329,375 |
|
Colombia Government International Bond, 7.375%, 9/18/37 | | 300,000 |
| 397,500 |
|
Colombia Government International Bond, 6.125%, 1/18/41 | | 100,000 |
| 117,950 |
|
| | | 844,825 |
|
Italy† | | | |
Republic of Italy Government International Bond, 6.875%, 9/27/23 | | 220,000 |
| 262,713 |
|
Mexico — 0.1% | | | |
Mexico Government International Bond, 4.15%, 3/28/27 | | 600,000 |
| 624,450 |
|
Mexico Government International Bond, MTN, 4.75%, 3/8/44 | | 400,000 |
| 400,748 |
|
| | | 1,025,198 |
|
Peru — 0.1% | | | |
Peruvian Government International Bond, 6.55%, 3/14/37 | | 70,000 |
| 94,500 |
|
Peruvian Government International Bond, 5.625%, 11/18/50 | | 170,000 |
| 214,795 |
|
| | | 309,295 |
|
Philippines — 0.1% | | | |
Philippine Government International Bond, 4.00%, 1/15/21 | | 300,000 |
| 317,419 |
|
Philippine Government International Bond, 6.375%, 10/23/34 | | 150,000 |
| 201,303 |
|
| | | 518,722 |
|
Poland† | | | |
Republic of Poland Government International Bond, 3.00%, 3/17/23 | | 140,000 |
| 143,145 |
|
Republic of Poland Government International Bond, 5.125%, 4/21/21 | | 140,000 |
| 153,072 |
|
| | | 296,217 |
|
South Africa† | | | |
Republic of South Africa Government International Bond, 4.67%, 1/17/24 | | 110,000 |
| 111,669 |
|
Uruguay† | | | |
Uruguay Government International Bond, 4.125%, 11/20/45 | | 120,000 |
| 118,800 |
|
TOTAL SOVEREIGN GOVERNMENTS AND AGENCIES
(Cost $3,514,627) | | | 3,691,089 |
|
TEMPORARY CASH INVESTMENTS — 2.3% | | | |
State Street Institutional U.S. Government Money Market Fund, Premier Class
(Cost $20,181,451) | | 20,181,451 |
| 20,181,451 |
|
TOTAL INVESTMENT SECURITIES — 104.3%
(Cost $787,992,525) | | | 925,988,384 |
|
OTHER ASSETS AND LIABILITIES — (4.3)% | | | (38,029,548 | ) |
TOTAL NET ASSETS — 100.0% | | | $ | 887,958,836 |
|
|
| | | | | | | | | | |
FORWARD FOREIGN CURRENCY EXCHANGE CONTRACTS |
Currency Purchased | Currency Sold | Counterparty | Settlement Date | Unrealized Appreciation
(Depreciation) |
USD | 394,105 |
| EUR | 326,620 |
| JPMorgan Chase Bank N.A. | 12/20/17 | $ | 12,596 |
|
USD | 8,141 |
| EUR | 6,905 |
| JPMorgan Chase Bank N.A. | 12/20/17 | 76 |
|
| | | | | | $ | 12,672 |
|
|
| | | | | | | | | | | |
FUTURES CONTRACTS PURCHASED |
Reference Entity | Contracts | Expiration
Date | Notional
Amount | Underlying
Contract
Value | Unrealized
Appreciation
(Depreciation) |
U.S. Treasury 5-Year Notes | 75 | December 2017 | USD | 7,500,000 |
| $ | 8,789,062 |
| $ | (99,192 | ) |
U.S. Treasury 10-Year Notes | 20 | December 2017 | USD | 2,000,000 |
| 2,498,750 |
| (43,014 | ) |
U.S. Treasury 10-Year Ultra Notes | 12 | December 2017 | USD | 1,200,000 |
| 1,607,063 |
| (33,777 | ) |
U.S. Treasury Long Bonds | 3 | December 2017 | USD | 300,000 |
| 457,406 |
| (2,163 | ) |
| | | | | $ | 13,352,281 |
| $ | (178,146 | ) |
|
| | | | | | | | | | | | | | | |
CENTRALLY CLEARED CREDIT DEFAULT SWAP AGREEMENTS |
Reference Entity | Type* | Fixed Rate
Received
(Paid) | Termination
Date | Notional
Amount | Premiums Paid (Received) | Unrealized
Appreciation
(Depreciation) | Value** |
Markit CDX North America Investment Grade Index Series 29 | Sell | 1.00% | 12/20/22 | $ | 2,000,000 |
| $ | 39,296 |
| $ | 9,031 |
| $ | 48,327 |
|
| |
* | The maximum potential amount the fund could be required to deliver as a seller of credit protection if a credit event occurs as defined under the terms of the agreement is the notional amount. The maximum potential amount may be partially offset by any recovery values of the reference entities and upfront payments received upon entering into the agreement.
|
| |
** | The value for credit default swap agreements serve as an indicator of the current status of the payment/performance risk and represent the likelihood of an expected liability or profit at the period end. Increasing values in absolute terms when compared to the notional amount of the credit default swap agreement represent a deterioration of the referenced entity's credit soundness and an increased likelihood or risk of a credit event occurring as defined in the agreement. |
|
| | | | | | | | | | | | | | | |
CENTRALLY CLEARED TOTAL RETURN SWAP AGREEMENTS |
Floating Rate Index | Pay/Receive Floating Rate Index | Fixed Rate | Termination
Date | Notional
Amount | Premiums Paid (Received) | Unrealized
Appreciation
(Depreciation) | Value |
CPURNSA | Receive | 2.24% | 11/15/26 | $ | 1,300,000 |
| $ | 514 |
| $ | (17,400 | ) | $ | (16,886 | ) |
CPURNSA | Receive | 2.28% | 11/16/26 | $ | 1,300,000 |
| 514 |
| (21,721 | ) | (21,207 | ) |
CPURNSA | Receive | 2.27% | 11/21/26 | $ | 1,300,000 |
| 514 |
| (21,187 | ) | (20,673 | ) |
CPURNSA | Receive | 2.17% | 5/10/27 | $ | 1,100,000 |
| 487 |
| (7,965 | ) | (7,478 | ) |
| | | | | $ | 2,029 |
| $ | (68,273 | ) | $ | (66,244 | ) |
|
| | | | | | | | | | |
TOTAL RETURN SWAP AGREEMENTS |
Counterparty | Floating
Rate Index | Pay/Receive
Floating Rate Index | Fixed Rate | Termination
Date | Notional
Amount | Value* |
Bank of America N.A. | CPURNSA | Receive | 2.26% | 11/15/26 | $ | 1,000,000 |
| $ | (14,715 | ) |
Bank of America N.A. | CPURNSA | Receive | 2.29% | 11/16/26 | $ | 1,000,000 |
| (17,342 | ) |
Bank of America N.A. | CPURNSA | Receive | 2.28% | 11/21/26 | $ | 1,000,000 |
| (16,293 | ) |
Barclays Bank plc | CPURNSA | Receive | 2.25% | 11/15/26 | $ | 1,000,000 |
| (13,496 | ) |
Barclays Bank plc | CPURNSA | Receive | 2.28% | 11/16/26 | $ | 1,000,000 |
| (16,730 | ) |
Barclays Bank plc | CPURNSA | Receive | 2.26% | 11/21/26 | $ | 1,000,000 |
| (15,022 | ) |
| | | | | | $ | (93,598 | ) |
* Amount represents value and unrealized appreciation (depreciation).
|
| | |
NOTES TO SCHEDULE OF INVESTMENTS |
CDX | - | Credit Derivatives Indexes |
CPURNSA | - | U.S. Consumer Price Index Urban Consumers Not Seasonally Adjusted Index |
EUR | - | Euro |
FHLMC | - | Federal Home Loan Mortgage Corporation |
FNMA | - | Federal National Mortgage Association |
GNMA | - | Government National Mortgage Association |
GO | - | General Obligation |
H15T1Y | - | Constant Maturity U.S. Treasury Note Yield Curve Rate Index |
LIBOR | - | London Interbank Offered Rate |
MTN | - | Medium Term Note |
resets | - | The frequency with which a security's coupon changes, based on current market conditions or an underlying index. |
SEQ | - | Sequential Payer |
USD | - | United States Dollar |
VRN | - | Variable Rate Note. Interest reset date is indicated. Rate shown is effective at the period end. |
| |
† | Category is less than 0.05% of total net assets. |
| |
(2) | Security was purchased pursuant to Rule 144A under the Securities Act of 1933 and may be sold in transactions exempt from registration, normally to qualified institutional investors. The aggregate value of these securities at the period end was $41,347,068, which represented 4.7% of total net assets. |
| |
(3) | Coupon rate adjusts periodically based upon a predetermined schedule. Interest reset date is indicated. Rate shown is effective at the period end. |
| |
(4) | When-issued security. The issue price and yield are fixed on the date of the commitment, but payment and delivery are scheduled for a future date. |
| |
(5) | Security, or a portion thereof, has been pledged at the custodian bank or with a broker for margin requirements on forward commitments, forward foreign currency exchange contracts, futures contracts, and/or swap agreements. At the period end, the aggregate value of securities pledged was $472,527. |
| |
(6) | Final maturity date indicated, unless otherwise noted. |
| |
(7) | The interest rate resets periodically based on the weighted average coupons of the underlying mortgage-related or asset-backed obligations. |
| |
(8) | Forward commitment. Settlement date is indicated. |
See Notes to Financial Statements.
|
|
Statement of Assets and Liabilities |
|
| | | |
OCTOBER 31, 2017 | |
Assets | |
Investment securities, at value (cost of $787,992,525) | $ | 925,988,384 |
|
Receivable for investments sold | 6,193,133 |
|
Receivable for capital shares sold | 79,296 |
|
Receivable for variation margin on swap agreements | 2,741 |
|
Unrealized appreciation on forward foreign currency exchange contracts | 12,672 |
|
Dividends and interest receivable | 2,498,243 |
|
| 934,774,469 |
|
| |
Liabilities | |
Payable for investments purchased | 43,909,179 |
|
Payable for capital shares redeemed | 2,134,051 |
|
Payable for variation margin on futures contracts | 7,117 |
|
Swap agreements, at value | 93,598 |
|
Accrued management fees | 661,679 |
|
Accrued other expenses | 10,009 |
|
| 46,815,633 |
|
| |
Net Assets | $ | 887,958,836 |
|
| |
Net Assets Consist of: | |
Capital (par value and paid-in surplus) | $ | 712,657,981 |
|
Undistributed net investment income | 1,170,091 |
|
Undistributed net realized gain | 36,452,609 |
|
Net unrealized appreciation | 137,678,155 |
|
| $ | 887,958,836 |
|
|
| | | | |
| Net Assets | Shares Outstanding | Net Asset Value Per Share |
Investor Class, $0.01 Par Value | $814,568,595 | 42,185,777 |
| $19.31 |
I Class, $0.01 Par Value | $73,384,888 | 3,798,240 |
| $19.32 |
R5 Class, $0.01 Par Value | $5,353 | 277 |
| $19.32 |
See Notes to Financial Statements.
|
| | | |
YEAR ENDED OCTOBER 31, 2017 | |
Investment Income (Loss) | |
Income: | |
Dividends (net of foreign taxes withheld of $3,053) | $ | 11,163,964 |
|
Interest | 8,954,772 |
|
| 20,118,736 |
|
| |
Expenses: | |
Management fees | 7,574,405 |
|
Directors' fees and expenses | 26,357 |
|
Other expenses | 27,870 |
|
| 7,628,632 |
|
| |
Net investment income (loss) | 12,490,104 |
|
| |
Realized and Unrealized Gain (Loss) | |
Net realized gain (loss) on: | |
Investment transactions | 39,795,927 |
|
Forward foreign currency exchange contract transactions | 188,725 |
|
Futures contract transactions | 19,999 |
|
Swap agreement transactions | 38,873 |
|
Foreign currency translation transactions | (2,032 | ) |
| 40,041,492 |
|
| |
Change in net unrealized appreciation (depreciation) on: | |
Investments | 58,256,680 |
|
Forward foreign currency exchange contracts | (160,848 | ) |
Futures contracts | (160,762 | ) |
Swap agreements | (152,840 | ) |
Translation of assets and liabilities in foreign currencies | 1,567 |
|
| 57,783,797 |
|
| |
Net realized and unrealized gain (loss) | 97,825,289 |
|
| |
Net Increase (Decrease) in Net Assets Resulting from Operations | $ | 110,315,393 |
|
See Notes to Financial Statements.
|
|
Statement of Changes in Net Assets |
|
| | | | | | |
YEARS ENDED OCTOBER 31, 2017 AND OCTOBER 31, 2016 |
Increase (Decrease) in Net Assets | October 31, 2017 | October 31, 2016 |
Operations | | |
Net investment income (loss) | $ | 12,490,104 |
| $ | 11,746,695 |
|
Net realized gain (loss) | 40,041,492 |
| 7,899,815 |
|
Change in net unrealized appreciation (depreciation) | 57,783,797 |
| 5,014,397 |
|
Net increase (decrease) in net assets resulting from operations | 110,315,393 |
| 24,660,907 |
|
| | |
Distributions to Shareholders | | |
From net investment income: | | |
Investor Class | (12,032,665 | ) | (11,708,828 | ) |
I Class | (1,102,956 | ) | (933,774 | ) |
R5 Class | (46 | ) | — |
|
From net realized gains: | | |
Investor Class | (7,066,911 | ) | (33,526,043 | ) |
I Class | (560,856 | ) | (2,302,749 | ) |
Decrease in net assets from distributions | (20,763,434 | ) | (48,471,394 | ) |
| | |
Capital Share Transactions | | |
Net increase (decrease) in net assets from capital share transactions (Note 5) | (15,464,903 | ) | (5,756,686 | ) |
| | |
Net increase (decrease) in net assets | 74,087,056 |
| (29,567,173 | ) |
| | |
Net Assets | | |
Beginning of period | 813,871,780 |
| 843,438,953 |
|
End of period | $ | 887,958,836 |
| $ | 813,871,780 |
|
| | |
Undistributed net investment income | $ | 1,170,091 |
| $ | 1,089,271 |
|
See Notes to Financial Statements.
|
|
Notes to Financial Statements |
OCTOBER 31, 2017
1. Organization
American Century Mutual Funds, Inc. (the corporation) is registered under the Investment Company Act of 1940, as amended (the 1940 Act), as an open-end management investment company and is organized as a Maryland corporation. Balanced Fund (the fund) is one fund in a series issued by the corporation. The fund’s investment objective is to seek long-term capital growth and current income by investing approximately 60% of its assets in equity securities and the remainder in bonds and other fixed-income securities. The fund offers the Investor Class, I Class (formerly Institutional Class) and R5 Class. Sale of the R5 Class commenced on April 10, 2017.
2. Significant Accounting Policies
The following is a summary of significant accounting policies consistently followed by the fund in preparation of its financial statements. The fund is an investment company and follows accounting and reporting guidance in accordance with accounting principles generally accepted in the United States of America. This may require management to make certain estimates and assumptions at the date of the financial statements. Actual results could differ from these estimates. Management evaluated the impact of events or transactions occurring through the date the financial statements were issued that would merit recognition or disclosure.
Investment Valuations — The fund determines the fair value of its investments and computes its net asset value per share at the close of regular trading (usually 4 p.m. Eastern time) on the New York Stock Exchange (NYSE) on each day the NYSE is open. The Board of Directors has adopted valuation policies and procedures to guide the investment advisor in the fund’s investment valuation process and to provide methodologies for the oversight of the fund’s pricing function.
Equity securities that are listed or traded on a domestic securities exchange are valued at the last reported sales price or at the official closing price as provided by the exchange. Equity securities traded on foreign securities exchanges are generally valued at the closing price of such securities on the exchange where primarily traded or at the close of the NYSE, if that is earlier. If no last sales price is reported, or if local convention or regulation so provides, the mean of the latest bid and asked prices may be used. Securities traded over-the-counter are valued at the mean of the latest bid and asked prices, the last sales price, or the official closing price. Equity securities initially expressed in local currencies are translated into U.S. dollars at the mean of the appropriate currency exchange rate at the close of the NYSE as provided by an independent pricing service.
Fixed income securities are valued at the evaluated mean as provided by independent pricing services or at the mean of the most recent bid and asked prices as provided by investment dealers. Corporate bonds, U.S. Treasury and Government Agency securities, convertible bonds, municipal securities, and sovereign governments and agencies are valued using market models that consider trade data, quotations from dealers and active market makers, relevant yield curve and spread data, creditworthiness, trade data or market information on comparable securities, and other relevant security specific information. Mortgage-related and asset-backed securities are valued based on models that consider trade data, prepayment and default projections, benchmark yield and spread data and estimated cash flows of each tranche of the issuer. Fixed income securities initially expressed in local currencies are translated into U.S. dollars at the mean of the appropriate currency exchange rate at the close of the NYSE as provided by an independent pricing service.
Open-end management investment companies are valued at the reported net asset value per share. Exchange-traded futures contracts are valued at the settlement price as provided by the appropriate clearing corporation. Swap agreements are valued at an evaluated mean as provided by independent pricing services or independent brokers. Forward foreign currency exchange contracts are valued at the mean of the appropriate forward exchange rate at the close of the NYSE as provided by an independent pricing service.
If the fund determines that the market price for an investment is not readily available or the valuation methods mentioned above do not reflect an investment’s fair value, such investment is valued as determined in good faith by the Board of Directors or its delegate, in accordance with policies and procedures adopted by the Board of Directors. In its determination of fair value, the fund may review several factors including, but not limited to, market information regarding the specific investment or comparable investments and correlation
with other investment types, futures indices or general market indicators. Circumstances that may cause the fund to use these procedures to value an investment include, but are not limited to: an investment has been declared in default or is distressed; trading in a security has been suspended during the trading day or a security is not actively trading on its principal exchange; prices received from a regular pricing source are deemed unreliable; or there is a foreign market holiday and no trading occurred.
The fund monitors for significant events occurring after the close of an investment’s primary exchange but before the fund’s net asset value per share is determined. Significant events may include, but are not limited to: corporate announcements and transactions; governmental action and political unrest that could impact a specific investment or an investment sector; or armed conflicts, natural disasters and similar events that could affect investments in a specific country or region. The fund also monitors for significant fluctuations between domestic and foreign markets, as evidenced by the U.S. market or such other indicators that the Board of Directors, or its delegate, deems appropriate. If significant fluctuations in foreign markets are identified, the fund may apply a model-derived factor to the closing price of equity securities traded on foreign securities exchanges. The factor is based on observable market data as provided by an independent pricing service.
Security Transactions — Security transactions are accounted for as of the trade date. Net realized gains and losses are determined on the identified cost basis, which is also used for federal income tax purposes.
Investment Income — Dividend income less foreign taxes withheld, if any, is recorded as of the ex-dividend date. Distributions received on securities that represent a return of capital or long-term capital gain are recorded as a reduction of cost of investments and/or as a realized gain. The fund may estimate the components of distributions received that may be considered nontaxable distributions or long-term capital gain distributions for income tax purposes. Interest income is recorded on the accrual basis and includes paydown gain (loss) and accretion of discounts and amortization of premiums. Inflation adjustments related to inflation-linked debt securities are reflected as interest income.
Foreign Currency Translations — All assets and liabilities initially expressed in foreign currencies are translated into U.S. dollars at prevailing exchange rates at period end. The fund may enter into spot foreign currency exchange contracts to facilitate transactions denominated in a foreign currency. Purchases and sales of investment securities, dividend and interest income, spot foreign currency exchange contracts, and expenses are translated at the rates of exchange prevailing on the respective dates of such transactions. Net realized and unrealized foreign currency exchange gains or losses related to investment securities are a component of net realized gain (loss) on investment transactions and change in net unrealized appreciation (depreciation) on investments, respectively.
Forward Commitments — The fund may engage in securities transactions on a forward commitment basis. In these transactions, the securities’ prices and yields are fixed on the date of the commitment. The fund may sell a to-be-announced (TBA) security and at the same time make a commitment to purchase the same security at a future date at a specified price. Conversely, the fund may purchase a TBA security and at the same time make a commitment to sell the same security at a future date at a specified price. These types of transactions are known as “TBA roll” transactions and are accounted for as purchases and sales. The fund will segregate cash, cash equivalents or other appropriate liquid securities on its records in amounts sufficient to meet the purchase price.
Segregated Assets — In accordance with the 1940 Act, the fund segregates assets on its books and records to cover certain types of investments, including, but not limited to, futures contracts, forward commitments, when-issued securities, swap agreements and certain forward foreign currency exchange contracts. American Century Investment Management, Inc. (ACIM) (the investment advisor) monitors, on a daily basis, the securities segregated to ensure the fund designates a sufficient amount of liquid assets, marked-to-market daily. The fund may also receive assets or be required to pledge assets at the custodian bank or with a broker for margin requirements on futures contracts, forward commitments, swap agreements and certain forward foreign currency exchange contracts.
Income Tax Status — It is the fund’s policy to distribute substantially all net investment income and net realized gains to shareholders and to otherwise qualify as a regulated investment company under provisions of the Internal Revenue Code. Accordingly, no provision has been made for income taxes. The fund files U.S. federal, state, local and non-U.S. tax returns as applicable. The fund's tax returns are subject to examination by the relevant taxing authority until expiration of the applicable statute of limitations, which is generally three years from the date of filing but can be longer in certain jurisdictions. At this time, management believes there are no uncertain tax positions which, based on their technical merit, would not be sustained upon examination and for which it is reasonably possible that the total amounts of unrecognized tax benefits will significantly change in the next twelve months.
Multiple Class — All shares of the fund represent an equal pro rata interest in the net assets of the class to which such shares belong, and have identical voting, dividend, liquidation and other rights and the same terms and conditions, except for class specific expenses and exclusive rights to vote on matters affecting only individual classes. Income, non-class specific expenses, and realized and unrealized capital gains and losses of the fund are allocated to each class of shares based on their relative net assets.
Distributions to Shareholders — Distributions from net investment income, if any, are generally declared and paid quarterly. Distributions from net realized gains, if any, are generally declared and paid annually.
Indemnifications — Under the corporation’s organizational documents, its officers and directors are indemnified against certain liabilities arising out of the performance of their duties to the fund. In addition, in the normal course of business, the fund enters into contracts that provide general indemnifications. The maximum exposure under these arrangements is unknown as this would involve future claims that may be made against a fund. The risk of material loss from such claims is considered by management to be remote.
3. Fees and Transactions with Related Parties
Certain officers and directors of the corporation are also officers and/or directors of American Century Companies, Inc. (ACC). The corporation’s investment advisor, ACIM, the corporation's distributor, American Century Investment Services, Inc., and the corporation’s transfer agent, American Century Services, LLC, are wholly owned, directly or indirectly, by ACC.
Management Fees — The corporation has entered into a management agreement with ACIM, under which ACIM provides the fund with investment advisory and management services in exchange for a single, unified management fee (the fee) per class. The agreement provides that all expenses of managing and operating the fund, except distribution and service fees, brokerage expenses, taxes, interest, fees and expenses of the independent directors (including legal counsel fees), and extraordinary expenses, will be paid by ACIM. The fee is computed and accrued daily based on each class's daily net assets and paid monthly in arrears. The difference in the fee among the classes is a result of their separate arrangements for non-Rule 12b-1 shareholder services. It is not the result of any difference in advisory or custodial fees or other expenses related to the management of the fund’s assets, which do not vary by class. The rate of the fee is determined by applying a fee rate calculation formula. This formula takes into account the fund’s assets as well as certain assets, if any, of other clients of the investment advisor outside the American Century Investments family of funds (such as subadvised funds and separate accounts) that use very similar investment teams and strategies (strategy assets).
The management fee schedule range and the effective annual management fee for each class for the period ended October 31, 2017 are as follows:
|
| | |
| Management Fee Schedule Range | Effective Annual Management Fee |
Investor Class | 0.800% to 0.900% | 0.90% |
I Class | 0.600% to 0.700% | 0.70% |
R5 Class | 0.600% to 0.700% | 0.70% |
Directors' Fees and Expenses — The Board of Directors is responsible for overseeing the investment advisor’s management and operations of the fund. The directors receive detailed information about the fund and its investment advisor regularly throughout the year, and meet at least quarterly with management of the investment advisor to review reports about fund operations. The fund’s officers do not receive compensation from the fund.
Interfund Transactions — The fund may enter into security transactions with other American Century Investments funds and other client accounts of the investment advisor, in accordance with the 1940 Act rules and procedures adopted by the Board of Directors. The rules and procedures require, among other things, that these transactions be effected at the independent current market price of the security. During the period, the interfund purchases and sales were $6,792,671 and $5,306,659, respectively. The effect of interfund transactions on the Statement of Operations was $377,227 in net realized gain (loss) on investment transactions.
4. Investment Transactions
Purchases of investment securities, excluding short-term investments, for the period ended October 31, 2017 totaled $980,300,669, of which $493,540,881 represented U.S. Treasury and Government Agency obligations.
Sales of investment securities, excluding short-term investments, for the period ended October 31, 2017 totaled $999,860,616, of which $478,919,137 represented U.S. Treasury and Government Agency obligations.
5. Capital Share Transactions
Transactions in shares of the fund were as follows:
|
| | | | | | | | | | |
| Year ended
October 31, 2017(1) | Year ended
October 31, 2016 |
| Shares | Amount | Shares | Amount |
Investor Class/Shares Authorized | 360,000,000 |
| | 350,000,000 |
| |
Sold | 3,792,164 |
| $ | 68,827,438 |
| 3,304,995 |
| $ | 56,554,508 |
|
Issued in reinvestment of distributions | 1,033,181 |
| 18,655,112 |
| 2,618,200 |
| 44,184,540 |
|
Redeemed | (6,045,243 | ) | (110,644,072 | ) | (6,581,040 | ) | (112,672,745 | ) |
| (1,219,898 | ) | (23,161,522 | ) | (657,845 | ) | (11,933,697 | ) |
I Class/Shares Authorized | 40,000,000 |
| | 25,000,000 |
| |
Sold | 1,099,075 |
| 20,321,149 |
| 603,519 |
| 10,443,061 |
|
Issued in reinvestment of distributions | 91,815 |
| 1,661,482 |
| 191,542 |
| 3,236,523 |
|
Redeemed | (777,932 | ) | (14,291,058 | ) | (435,815 | ) | (7,502,573 | ) |
| 412,958 |
| 7,691,573 |
| 359,246 |
| 6,177,011 |
|
R5 Class/Shares Authorized | 50,000,000 |
| | N/A |
| |
Sold | 275 |
| 5,000 |
| | |
Issued in reinvestment of distributions | 2 |
| 46 |
| | |
| 277 |
| 5,046 |
| | |
Net increase (decrease) | (806,663 | ) | $ | (15,464,903 | ) | (298,599 | ) | $ | (5,756,686 | ) |
| |
(1) | April 10, 2017 (commencement of sale) through October 31, 2017 for the R5 Class. |
6. Fair Value Measurements
The fund’s investments valuation process is based on several considerations and may use multiple inputs to determine the fair value of the investments held by the fund. In conformity with accounting principles generally accepted in the United States of America, the inputs used to determine a valuation are classified into three broad levels.
| |
• | Level 1 valuation inputs consist of unadjusted quoted prices in an active market for identical investments. |
| |
• | Level 2 valuation inputs consist of direct or indirect observable market data (including quoted prices for comparable investments, evaluations of subsequent market events, interest rates, prepayment speeds, credit risk, etc.). These inputs also consist of quoted prices for identical investments initially expressed in local currencies that are adjusted through translation into U.S. dollars. |
| |
• | Level 3 valuation inputs consist of unobservable data (including a fund’s own assumptions). |
The level classification is based on the lowest level input that is significant to the fair valuation measurement. The valuation inputs are not necessarily an indication of the risks associated with investing in these securities or other financial instruments. There were no significant transfers between levels during the period.
The following is a summary of the level classifications as of period end. The Schedule of Investments provides additional information on the fund’s portfolio holdings.
|
| | | | | | | | |
| Level 1 | Level 2 | Level 3 |
Assets | | | |
Investment Securities | | | |
Common Stocks | $ | 539,374,995 |
| — |
| — |
|
Corporate Bonds | — |
| $ | 103,940,365 |
| — |
|
U.S. Treasury Securities | — |
| 103,015,757 |
| — |
|
U.S. Government Agency Mortgage-Backed Securities | — |
| 82,601,415 |
| — |
|
Collateralized Mortgage Obligations | — |
| 25,222,180 |
| — |
|
Asset-Backed Securities | — |
| 20,087,285 |
| — |
|
Commercial Mortgage-Backed Securities | — |
| 16,717,643 |
| — |
|
U.S. Government Agency Securities | — |
| 7,179,025 |
| — |
|
Municipal Securities | — |
| 3,977,179 |
| — |
|
Sovereign Governments and Agencies | — |
| 3,691,089 |
| — |
|
Temporary Cash Investments | 20,181,451 |
| — |
| — |
|
| $ | 559,556,446 |
| $ | 366,431,938 |
| — |
|
Other Financial Instruments | | | |
Swap Agreements | — |
| $ | 48,327 |
| — |
|
Forward Foreign Currency Exchange Contracts | — |
| 12,672 |
| — |
|
| — |
| $ | 60,999 |
| — |
|
| | | |
Liabilities | | | |
Other Financial Instruments | | | |
Futures Contracts | $ | 178,146 |
| — |
| — |
|
Swap Agreements | — |
| $ | 159,842 |
| — |
|
| $ | 178,146 |
| $ | 159,842 |
| — |
|
7. Derivative Instruments
Credit Risk — The fund is subject to credit risk in the normal course of pursuing its investment objectives. The value of a bond generally declines as the credit quality of its issuer declines. Credit default swap agreements enable a fund to buy/sell protection against a credit event of a specific issuer or index. A fund may attempt to enhance returns by selling protection or attempt to mitigate credit risk by buying protection. The
buyer/seller of credit protection against a security or basket of securities may pay/receive an up-front or
periodic payment to compensate for/against potential default events. Changes in value, including the periodic
amounts of interest to be paid or received on swap agreements, are recorded as unrealized appreciation
(depreciation) on swap agreements. Upon entering into a centrally cleared swap, a fund is required to deposit cash or securities (initial margin) with a financial intermediary in an amount equal to a certain percentage of the notional amount. Subsequent payments (variation margin) are made or received daily, in cash, by a fund. The variation margin is equal to the daily change in the value and is a component of unrealized gains and losses. Realized gain or loss is recorded upon receipt or payment of a periodic settlement or termination of swap agreements. Net realized and unrealized gains or losses occurring during the holding period of swap agreements are a component of net realized gain (loss) on swap agreement transactions and change in net unrealized appreciation (depreciation) on swap agreements, respectively. The risks of entering into swap agreements include the possible lack of liquidity, failure of the counterparty to meet its obligations, and that there may be unfavorable changes in the underlying investments or instruments. The fund's average notional amount held during the period was $2,000,000.
Foreign Currency Risk — The fund is subject to foreign currency exchange rate risk in the normal course of pursuing its investment objectives. The value of foreign investments held by a fund may be significantly affected by changes in foreign currency exchange rates. The dollar value of a foreign security generally decreases when the value of the dollar rises against the foreign currency in which the security is denominated and tends to increase when the value of the dollar declines against such foreign currency. A fund may enter into forward foreign currency exchange contracts to reduce a fund's exposure to foreign currency exchange rate fluctuations. The net U.S. dollar value of foreign currency underlying all contractual commitments held by a fund and the resulting unrealized appreciation or depreciation are determined daily. Realized gain or loss is
recorded upon the termination of the contract. Net realized and unrealized gains or losses occurring during the holding period of forward foreign currency exchange contracts are a component of net realized gain (loss) on forward foreign currency exchange contract transactions and change in net unrealized appreciation (depreciation) on forward foreign currency exchange contracts, respectively. A fund bears the risk of an unfavorable change in the foreign currency exchange rate underlying the forward contract. Additionally, losses, up to the fair value, may arise if the counterparties do not perform under the contract terms. The fund's average U.S. dollar exposure to foreign currency risk derivative instruments held during the period was $4,152,899.
Interest Rate Risk — The fund is subject to interest rate risk in the normal course of pursuing its investment objectives. The value of bonds generally declines as interest rates rise. A fund may enter into futures contracts based on a bond index or a specific underlying security. A fund may purchase futures contracts to gain exposure to increases in market value or sell futures contracts to protect against a decline in market value. Upon entering into a futures contract, a fund will segregate cash, cash equivalents or other appropriate liquid securities on its records in amounts sufficient to meet requirements. Subsequent payments (variation margin) are made or received daily, in cash, by a fund. The variation margin is equal to the daily change in the contract value and is recorded as unrealized gains and losses. A fund recognizes a realized gain or loss when the futures contract is closed or expires. Net realized and unrealized gains or losses occurring during the holding period of futures contracts are a component of net realized gain (loss) on futures contract transactions and change in net unrealized appreciation (depreciation) on futures contracts, respectively. One of the risks of entering into futures contracts is the possibility that the change in value of the contract may not correlate with the changes in value of the underlying securities. The fund's average notional exposure to these interest rate risk derivative instruments held during the period was $9,016,667 futures contracts purchased.
Other Contracts — A fund may enter into total return swap agreements in order to attempt to obtain or preserve a particular return or spread at a lower cost than obtaining a return or spread through purchases and/or sales of instruments in other markets or gain exposure to certain markets in the most economical way possible. A fund will segregate cash, cash equivalents or other appropriate liquid securities on its records in amounts sufficient to meet requirements. Changes in value, including the periodic amounts of interest to be paid or received on swap agreements, are recorded as unrealized appreciation (depreciation) on swap agreements. Upon entering into a centrally cleared swap, a fund is required to deposit cash or securities (initial margin) with a financial intermediary in an amount equal to a certain percentage of the notional amount. Subsequent payments (variation margin) are made or received daily, in cash, by a fund. The variation margin is equal to the daily change in the value and is a component of unrealized gains and losses. Realized gain or loss is recorded upon receipt or payment of a periodic settlement or termination of swap agreements. Net realized and unrealized gains or losses occurring during the holding period of swap agreements are a component of net realized gain (loss) on swap agreement transactions and change in net unrealized appreciation (depreciation) on swap agreements, respectively. The risks of entering into swap agreements include the possible lack of liquidity, failure of the counterparty to meet its obligations, and that there may be unfavorable changes in the underlying investments or instruments, including inflationary risk. The fund's average notional amount held during the period was $10,450,000.
Value of Derivative Instruments as of October 31, 2017
|
| | | | | | | | |
| Asset Derivatives | Liability Derivatives |
Type of Risk Exposure | Location on Statement of Assets and Liabilities | Value | Location on Statement of Assets and Liabilities | Value |
Credit Risk | Receivable for variation margin on swap agreements* | $ | 748 |
| Payable for variation margin on swap agreements* | — |
|
Foreign Currency Risk | Unrealized appreciation on forward foreign currency exchange contracts | 12,672 |
| Unrealized depreciation on forward foreign currency exchange contracts | — |
|
Interest Rate Risk | Receivable for variation margin on futures contracts* | — |
| Payable for variation margin on futures contracts* | $ | 7,117 |
|
Other Contracts | Receivable for variation margin on swap agreements* | 1,993 |
| Payable for variation margin on swap agreements* | — |
|
Other Contracts | Swap agreements | — |
| Swap agreements | 93,598 |
|
| | $ | 15,413 |
| | $ | 100,715 |
|
* Included in the unrealized appreciation (depreciation) on futures contracts or centrally cleared swap agreements, as applicable, as reported in the Schedule of Investments.
Effect of Derivative Instruments on the Statement of Operations for the Year Ended October 31, 2017
|
| | | | | | | | |
| Net Realized Gain (Loss) | Change in Net Unrealized Appreciation (Depreciation) |
Type of Risk Exposure | Location on Statement of Operations | Value | Location on Statement of Operations | Value |
Credit Risk | Net realized gain (loss) on swap agreement transactions | $ | 38,873 |
| Change in net unrealized appreciation (depreciation) on swap agreements | $ | 9,031 |
|
Foreign Currency Risk | Net realized gain (loss) on forward foreign currency exchange contract transactions | 188,725 |
| Change in net unrealized appreciation (depreciation) on forward foreign currency exchange contracts | (160,848 | ) |
Interest Rate Risk | Net realized gain (loss) on futures contract transactions | 19,999 |
| Change in net unrealized appreciation (depreciation) on futures contracts | (160,762 | ) |
Other Contracts | Net realized gain (loss) on swap agreement transactions | — |
| Change in net unrealized appreciation (depreciation) on swap agreements | (161,871 | ) |
| | $ | 247,597 |
| | $ | (474,450 | ) |
8. Risk Factors
The fund’s investment process may result in high portfolio turnover, which could mean high transaction costs, affecting both performance and capital gains tax liabilities to investors.
9. Federal Tax Information
The tax character of distributions paid during the years ended October 31, 2017 and October 31, 2016 were as follows:
|
| | | | | | |
| 2017 | 2016 |
Distributions Paid From | | |
Ordinary income | $ | 13,135,667 |
| $ | 12,596,005 |
|
Long-term capital gains | $ | 7,627,767 |
| $ | 35,875,389 |
|
The book-basis character of distributions made during the year from net investment income or net realized gains may differ from their ultimate characterization for federal income tax purposes. These differences reflect the differing character of certain income items and net realized gains and losses for financial statement and tax purposes, and may result in reclassification among certain capital accounts on the financial statements.
As of period end, the federal tax cost of investments and the components of distributable earnings on a tax-basis were as follows:
|
| | | |
Federal tax cost of investments | $ | 790,591,053 |
|
Gross tax appreciation of investments | $ | 143,034,354 |
|
Gross tax depreciation of investments | (7,637,023 | ) |
Net tax appreciation (depreciation) of investments | 135,397,331 |
|
Net tax appreciation (depreciation) on derivatives and translation of assets and liabilities in foreign currencies | (154,563 | ) |
Net tax appreciation (depreciation) | $ | 135,242,768 |
|
Other book-to-tax adjustments | $ | (104,872 | ) |
Undistributed ordinary income | $ | 13,886,110 |
|
Accumulated long-term gains
| $ | 26,276,849 |
|
The difference between book-basis and tax-basis unrealized appreciation (depreciation) is attributable primarily to the tax deferral of losses on wash sales. Other book-to-tax adjustments are attributable primarily to the tax deferral of losses on straddle positions.
10. Recently Issued Accounting Standards
In March 2017, the Financial Accounting Standards Board (FASB) issued Accounting Standards Update No.2017-08, “Receivables - Nonrefundable Fees and Other Costs (Subtopic 310-20), Premium Amortization on Purchased Callable Debt Securities” (ASU 2017-08). ASU 2017-08 amends the amortization period for certain purchased callable debt securities held at a premium, shortening such period to the earliest call date. The amendments are effective for fiscal years, and interim periods within those fiscal years, beginning after December 15, 2018. Management is currently evaluating the impact that adopting ASU 2017-08 will have on
the financial statements.
|
| | | | | | | | | | | | | | | |
For a Share Outstanding Throughout the Years Ended October 31 (except as noted) | | | | | | | |
Per-Share Data | | | | | | | | | Ratios and Supplemental Data |
| | Income From Investment Operations: | Distributions From: | | | Ratio to Average Net Assets of: | | |
| Net Asset
Value,
Beginning
of Period | Net
Investment
Income
(Loss)(1) | Net
Realized
and
Unrealized
Gain (Loss) | Total From
Investment
Operations | Net
Investment
Income | Net
Realized
Gains | Total
Distributions | Net Asset
Value, End
of Period | Total
Return(2) | Operating
Expenses | Net
Investment
Income
(Loss) | Portfolio
Turnover
Rate | Net
Assets,
End of
Period
(in thousands) |
Investor Class | | | | | | | | | | | | |
2017 | $17.39 | 0.26 | 2.10 | 2.36 | (0.28) | (0.16) | (0.44) | $19.31 | 13.78% | 0.91% | 1.44% | 112% |
| $814,569 |
|
2016 | $17.91 | 0.25 | 0.26 | 0.51 | (0.26) | (0.77) | (1.03) | $17.39 | 3.14% | 0.90% | 1.44% | 104% |
| $754,957 |
|
2015 | $19.38 | 0.26 | (0.08) | 0.18 | (0.28) | (1.37) | (1.65) | $17.91 | 0.98% | 0.90% | 1.43% | 94% |
| $789,209 |
|
2014 | $19.19 | 0.25 | 1.66 | 1.91 | (0.28) | (1.44) | (1.72) | $19.38 | 10.76% | 0.90% | 1.36% | 64% |
| $815,636 |
|
2013 | $17.41 | 0.30 | 2.25 | 2.55 | (0.31) | (0.46) | (0.77) | $19.19 | 15.21% | 0.90% | 1.64% | 81% |
| $721,523 |
|
I Class(3) | | | | | | | | | | | | |
2017 | $17.40 | 0.30 | 2.09 | 2.39 | (0.31) | (0.16) | (0.47) | $19.32 | 13.99% | 0.71% | 1.64% | 112% |
| $73,385 |
|
2016 | $17.92 | 0.28 | 0.27 | 0.55 | (0.30) | (0.77) | (1.07) | $17.40 | 3.35% | 0.70% | 1.64% | 104% |
| $58,915 |
|
2015 | $19.39 | 0.30 | (0.09) | 0.21 | (0.31) | (1.37) | (1.68) | $17.92 | 1.19% | 0.70% | 1.63% | 94% |
| $54,230 |
|
2014 | $19.20 | 0.29 | 1.65 | 1.94 | (0.31) | (1.44) | (1.75) | $19.39 | 10.98% | 0.70% | 1.56% | 64% |
| $49,009 |
|
2013 | $17.41 | 0.32 | 2.28 | 2.60 | (0.35) | (0.46) | (0.81) | $19.20 | 15.49% | 0.70% | 1.84% | 81% |
| $47,004 |
|
R5 Class | | | | | | | | | | | | |
2017(4) | $18.18 | 0.17 | 1.14 | 1.31 | (0.17) | — | (0.17) | $19.32 | 7.21% | 0.71%(5) | 1.66%(5) | 112%(6) |
| $5 |
|
|
| | | | |
Notes to Financial Highlights | | |
| |
(1) | Computed using average shares outstanding throughout the period. |
| |
(2) | Total returns are calculated based on the net asset value of the last business day. Total returns for periods less than one year are not annualized. |
| |
(3) | Prior to April 10, 2017, the I Class was referred to as the Institutional Class. |
| |
(4) | April 10, 2017 (commencement of sale) through October 31, 2017. |
| |
(6) | Portfolio turnover is calculated at the fund level. Percentage indicated was calculated for the year ended October 31, 2017. |
See Notes to Financial Statements.
|
|
Report of Independent Registered Public Accounting Firm |
To the Board of Directors and Shareholders of American Century Mutual Funds, Inc.:
We have audited the accompanying statement of assets and liabilities, including the schedule of investments, of Balanced Fund (the “Fund”), one of the funds constituting American Century Mutual Funds, Inc., as of October 31, 2017, and the related statement of operations for the year then ended, the statements of changes in net assets for each of the two years in the period then ended, and the financial highlights for each of the periods presented. These financial statements and financial highlights are the responsibility of the Fund’s management. Our responsibility is to express an opinion on these financial statements and financial highlights based on our audits.
We conducted our audits in accordance with the standards of the Public Company Accounting Oversight Board (United States). Those standards require that we plan and perform the audit to obtain reasonable assurance about whether the financial statements and financial highlights are free of material misstatement. The Fund is not required to have, nor were we engaged to perform, an audit of its internal control over financial reporting. Our audits included consideration of internal control over financial reporting as a basis for designing audit procedures that are appropriate in the circumstances, but not for the purpose of expressing an opinion on the effectiveness of the Fund’s internal control over financial reporting. Accordingly, we express no such opinion. An audit also includes examining, on a test basis, evidence supporting the amounts and disclosures in the financial statements, assessing the accounting principles used and significant estimates made by management, as well as evaluating the overall financial statement presentation. Our procedures included confirmation of securities owned as of October 31, 2017, by correspondence with the custodian and brokers; when replies were not received from brokers, we performed other auditing procedures. We believe that our audits provide a reasonable basis for our opinion.
In our opinion, the financial statements and financial highlights referred to above present fairly, in all material respects, the financial position of Balanced Fund of American Century Mutual Funds, Inc. as of October 31, 2017, the results of its operations for the year then ended, the changes in its net assets for each of the two years in the period then ended, and the financial highlights for each of the periods presented, in conformity with accounting principles generally accepted in the United States of America.
DELOITTE & TOUCHE LLP
Kansas City, Missouri
December 15, 2017
The Board of Directors
The individuals listed below serve as directors of the funds. Each director will continue to serve in this capacity until death, retirement, resignation or removal from office. The board has adopted a mandatory retirement age for directors who are not “interested persons,” as that term is defined in the Investment Company Act (independent directors). Independent directors shall retire by December 31 of the year in which they reach their 75th birthday.
Mr. Thomas is an “interested person” because he currently serves as President and Chief Executive Officer of American Century Companies, Inc. (ACC), the parent company of American Century Investment Management, Inc. (ACIM or the advisor). The other directors (more than three-fourths of the total number) are independent. They are not employees, directors or officers of, and have no financial interest in, ACC or any of its wholly owned, direct or indirect, subsidiaries, including ACIM, American Century Investment Services, Inc. (ACIS) and American Century Services, LLC (ACS), and they do not have any other affiliations, positions or relationships that would cause them to be considered “interested persons” under the Investment Company Act. The directors serve in this capacity for seven (in the case of Mr. Thomas, 15) registered investment companies in the American Century Investments family of funds.
The following table presents additional information about the directors. The mailing address for each director is 4500 Main Street, Kansas City, Missouri 64111.
|
| | | | | |
Name
(Year of Birth) | Position(s) Held with Funds | Length of Time Served | Principal Occupation(s) During Past 5 Years | Number of American Century Portfolios Overseen by Director | Other Directorships Held During Past 5 Years |
Independent Directors |
|
|
Thomas W. Bunn (1953) | Director | Since 2017 | Retired | 69 | SquareTwo Financial; Barings (formerly Babson Capital Funds Trust) (2013 to 2016) |
Barry Fink
(1955) | Director | Since 2012 (independent since 2016) | Retired; Executive Vice President, ACC (2007 to 2013); President, ACS (2007 to 2013); Chief Operating Officer, ACC (2007 to 2012) | 69 | None |
Andrea C. Hall
(1945) | Director | Since 1997 | Retired | 69 | None |
Jan M. Lewis
(1957) | Director | Since 2011 | Retired; President and Chief Executive Officer, Catholic Charities of Northeast Kansas (human services organization) (2006 to 2013) | 69 | None |
James A. Olson
(1942) | Director and Chairman of the Board | Since 2007 (Chairman since 2014) | Member, Plaza Belmont LLC (private equity fund manager) (1999 to present) | 69 | Saia, Inc. (2002 to 2012) and EPR Properties (2003 to 2013) |
|
| | | | | |
Name
(Year of Birth) | Position(s) Held with Funds | Length of Time Served | Principal Occupation(s) During Past 5 Years | Number of American Century Portfolios Overseen by Director | Other Directorships Held During Past 5 Years |
Independent Directors |
|
|
M. Jeannine Strandjord
(1945) | Director | Since 1994 | Retired | 69 | Euronet Worldwide Inc.; MGP Ingredients, Inc.; and DST Systems Inc. (1996 to 2012) |
John R. Whitten
(1946) | Director | Since 2008 | Retired | 69 | Rudolph Technologies, Inc. |
Stephen E. Yates
(1948) | Director | Since 2012 | Retired | 69 | None |
Interested Director |
|
|
Jonathan S. Thomas
(1963) | Director and President | Since 2007 | President and Chief Executive Officer, ACC (2007 to present). Also serves as Chief Executive Officer, ACS; Executive Vice President, ACIM; Director, ACC, ACIM and other ACC subsidiaries | 114 | BioMed Valley Discoveries, Inc. |
The Statement of Additional Information has additional information about the fund's directors and is available without charge, upon request, by calling 1-800-345-2021.
Officers
The following table presents certain information about the executive officers of the funds. Each officer serves as an officer for each of the 15 investment companies in the American Century family of funds, unless otherwise noted. No officer is compensated for his or her service as an officer of the funds. The listed officers are interested persons of the funds and are appointed or re-appointed on an annual basis. The mailing address for each officer listed below is 4500 Main Street, Kansas City, Missouri 64111.
|
| | |
Name
(Year of Birth) | Offices with the Funds | Principal Occupation(s) During the Past Five Years |
Jonathan S. Thomas
(1963) | Director and President since 2007 | President and Chief Executive Officer, ACC (2007 to present). Also serves as Chief Executive Officer, ACS; Executive Vice President, ACIM; Director, ACC, ACIM and other ACC subsidiaries |
Amy D. Shelton
(1964) | Chief Compliance Officer and Vice President since 2014 | Chief Compliance Officer, American Century funds, (2014 to present); Chief Compliance Officer, ACIM (2014 to present); Chief Compliance Officer, ACIS (2009 to present); Vice President, Client Interactions and Marketing, ACIS (2013 to 2014); Director, Client Interactions and Marketing, ACIS (2007 to 2013). Also serves as Vice President, ACIS |
Charles A. Etherington
(1957) | General Counsel since 2007 and Senior Vice President since 2006 | Attorney, ACC (1994 to present); Vice President, ACC (2005 to present); General Counsel, ACC (2007 to present). Also serves as General Counsel, ACIM, ACS, ACIS and other ACC subsidiaries; and Senior Vice President, ACIM and ACS |
C. Jean Wade
(1964) | Vice President,Treasurer and Chief Financial Officer since 2012 | Vice President, ACS (2000 to present) |
Robert J. Leach
(1966) | Vice President since 2006 and Assistant Treasurer since 2012 | Vice President, ACS (2000 to present) |
David H. Reinmiller
(1963) | Vice President since 2000 | Attorney, ACC (1994 to present); Associate General Counsel, ACC (2001 to present). Also serves as Vice President, ACIM and ACS |
Ward D. Stauffer
(1960) | Secretary since 2005 | Attorney, ACC (2003 to present) |
|
|
Approval of Management Agreement |
At a meeting held on June 29, 2017, the Fund’s Board of Directors (the "Board") unanimously approved the renewal of the management agreement pursuant to which American Century Investment Management, Inc. (the “Advisor”) acts as the investment advisor for the Fund. Under Section 15(c) of the Investment Company Act, contracts for investment advisory services are required to be reviewed, evaluated, and approved by a majority of a fund’s directors (the “Directors”), including a majority of the independent Directors, each year.
Prior to its consideration of the renewal of the management agreement, the Directors requested and reviewed extensive data and information compiled by the Advisor and certain independent providers of evaluation data concerning the Fund and the services provided to the Fund by the Advisor. This review was in addition to the oversight and evaluation undertaken by the Board and its committees on a continual basis and the information received was supplemental to the extensive information that the Board and its committees receive and consider throughout the year.
In connection with its consideration of the renewal of the management agreement, the Board’s review and evaluation of the services provided by the Advisor included, but was not limited to, the following:
| |
• | the nature, extent, and quality of investment management, shareholder services, and other services provided and to be provided to the Fund; |
| |
• | the wide range of other programs and services provided and to be provided to the Fund and its shareholders on a routine and non-routine basis; |
| |
• | the investment performance of the Fund, including data comparing the Fund's performance to appropriate benchmarks and/or a peer group of other mutual funds with similar investment objectives and strategies; |
| |
• | the cost of owning the Fund compared to the cost of owning similar funds; |
| |
• | the compliance policies, procedures, and regulatory experience of the Advisor and the Fund's service providers; |
| |
• | financial data showing the cost of services provided to the Fund, the profitability of the Fund to the Advisor, and the overall profitability of the Advisor; |
| |
• | strategic plans of the Advisor |
| |
• | possible economies of scale associated with the Advisor’s management of the Fund and other accounts under its management; |
| |
• | data comparing services provided and charges to the Advisor's other investment management clients; |
| |
• | acquired fund fees and expenses; |
| |
• | payments and practices by the Fund and the Advisor regarding financial intermediaries, the nature of services provided by intermediaries, and the terms of share classes utilized; and |
| |
• | any collateral benefits derived by the Advisor from the management of the Fund. |
The Directors held three in-person meetings and one telephonic meeting to review and discuss the information provided. The independent Directors also reviewed responses to supplemental information requests and held active discussions with the Advisor regarding the renewal of the management agreement. The independent Directors had the benefit of the advice of their independent counsel throughout the process.
Factors Considered
The Directors considered all of the information provided by the Advisor, the independent data providers, and independent counsel in connection with the approval. They determined that the
information was sufficient for them to evaluate the management agreement for the Fund. In connection with their review, the Directors did not identify any single factor as being all-important or controlling, and each Director may have attributed different levels of importance to different factors. In deciding to renew the management agreement, the Board based its decision on a number of factors, including without limitation the following:
Nature, Extent and Quality of Services - Generally. Under the management agreement, the Advisor is responsible for providing or arranging for all services necessary for the operation of the Fund. The Board noted that the Advisor provides or arranges at its own expense a wide variety of services including without limitation the following:
| |
• | portfolio research and security selection |
| |
• | daily valuation of the Fund’s portfolio |
| |
• | shareholder servicing and transfer agency, including shareholder confirmations, recordkeeping, and communications |
| |
• | legal services (except the independent Directors’ counsel) |
| |
• | regulatory and portfolio compliance |
| |
• | marketing and distribution (except amounts paid by the Fund under Rule 12b-1 plans) |
The Board noted that many of these services have expanded over time in terms of both quantity and complexity in response to shareholder demands, competition in the industry, changing distribution channels, and the changing regulatory environment. The Board noted specifically the resources the Advisor has committed during the year to compliance with the Department of Labor fiduciary rule and share class modernization.
Investment Management Services. The nature of the investment management services provided to the Fund is quite complex and allows Fund shareholders access to professional money management, instant diversification of their investments within an asset class, the opportunity to easily diversify among asset classes by investing in or exchanging among various American Century Investments funds, and liquidity. In evaluating investment performance, the Board expects the Advisor to manage the Fund in accordance with its investment objectives and approved strategies. Further, the Directors recognize that the Advisor has an obligation to monitor trading activities, and in particular to seek the best execution of fund trades, and to evaluate the use of and payment for research. In providing these services, the Advisor utilizes teams of investment professionals (portfolio managers, analysts, research assistants, and securities traders) who require extensive information technology, research, training, compliance, and other systems to conduct their business. The Board, directly and through its Fund Performance Review Committee, provides oversight of the investment performance process. It regularly reviews investment performance information for the Fund, together with comparative information for appropriate benchmarks and/or peer groups of similarly-managed funds, over different time horizons. The Directors also review detailed performance information provided by the Advisor during the management agreement renewal process. If performance concerns are identified, the Fund receives special reviews until performance improves, during which the Board receives a report from the Advisor regarding the reasons for such results (e.g., market conditions, security selection) and any efforts being undertaken to improve performance. The Fund’s performance was above its benchmark for the ten-year period and below its benchmark for the one-, three-, and five-year periods reviewed by the Board. The Board discussed the Fund's performance with the Advisor and was satisfied with the efforts being undertaken by the Advisor. The Board found the investment management services provided by the Advisor to the Fund to be satisfactory and consistent with the management agreement.
Shareholder and Other Services. Under the management agreement, the Advisor provides the Fund with a comprehensive package of transfer agency, shareholder, and other services. The Board, directly and through various committees of the Board, regularly reviews reports and evaluations of such services at its regular meetings. These reports include, but are not limited to, information regarding the operational efficiency and accuracy of the shareholder and transfer agency services provided, staffing levels, shareholder satisfaction (as measured by external as well as internal sources), technology support, new products and services offered to Fund shareholders, securities trading activities, portfolio valuation services, auditing services, and legal and operational compliance activities. Certain aspects of shareholder and transfer agency service level efficiency and the quality of securities trading activities are measured by independent third party providers and are presented in comparison to other fund groups not managed by the Advisor. The Board found the services provided by the Advisor to the Fund under the management agreement to be competitive and of high quality.
Costs of Services and Profitability. The Advisor provides detailed information concerning its cost of providing various services to the Fund, its profitability in managing the Fund (pre- and post-distribution), its overall profitability, and its financial condition. The Directors have reviewed with the Advisor the methodology used to prepare this financial information. This information is considered in evaluating the Advisor’s financial condition, its ability to continue to provide services under the management agreement, and the reasonableness of the current management fee. The Board concluded that the Advisor’s profits were reasonable in light of the services provided to the Fund.
Ethics. The Board generally considers the Advisor’s commitment to providing quality services to shareholders and to conducting its business ethically. They noted that the Advisor’s practices generally meet or exceed industry best practices.
Economies of Scale. The Board also reviewed information provided by the Advisor regarding the possible existence of economies of scale in connection with the management of the Fund. The Board concluded that economies of scale are difficult to measure and predict with precision, especially on a fund-by-fund basis. The Board concluded that the Advisor is appropriately sharing economies of scale through its competitive fee structure, offering competitive fees from fund inception, and through reinvestment in its business to provide shareholders additional content and services. The Board also noted that economies of scale are shared with the Fund and its shareholders through management fee breakpoints that serve to reduce the effective management fee as the assets of the Fund grow.
Comparison to Other Funds’ Fees. The management agreement provides that the Fund pays the Advisor a single, all-inclusive (or unified) management fee for providing all services necessary for the management and operation of the Fund, other than brokerage expenses, expenses attributable to short sales, taxes, interest, extraordinary expenses, and the fees and expenses of the Fund’s independent Directors (including their independent legal counsel) and expenses incurred in connection with the provision of shareholder services and distribution services under a plan adopted pursuant to Rule 12b-1 under the 1940 Act. Under the unified fee structure, the Advisor is responsible for providing all investment advisory, custody, audit, administrative, compliance, recordkeeping, marketing and shareholder services, or arranging and supervising third parties to provide such services. By contrast, most other funds are charged a variety of fees, including an investment advisory fee, a transfer agency fee, an administrative fee, distribution charges, and other expenses. Other than their investment advisory fees and any applicable Rule 12b-1 distribution fees, all other components of the total fees charged by these other funds may be increased without shareholder approval. The Board believes the unified fee structure is a benefit to Fund shareholders because it clearly discloses to shareholders the cost of owning Fund shares, and, since the unified fee cannot be increased without a vote of Fund shareholders, it shifts to the Advisor the risk of increased costs of operating the Fund and provides a direct incentive to minimize administrative inefficiencies. Part of the Board’s analysis of fee levels involves reviewing certain evaluative data compiled by an independent provider comparing the Fund’s unified fee to the total expense ratios of its peers. The unified fee charged to shareholders of the Fund was
below the median of the total expense ratios of the Fund’s peer expense universe and was within the range of its peer expense group. The Board concluded that the management fee paid by the Fund to the Advisor under the management agreement is reasonable in light of the services provided to the Fund.
Comparison to Fees and Services Provided to Other Clients of the Advisor. The Directors also requested and received information from the Advisor concerning the nature of the services, fees, costs, and profitability of its advisory services to advisory clients other than the Fund. They observed that these varying types of client accounts require different services and involve different regulatory and entrepreneurial risks than the management of the Fund. The Board analyzed this information and concluded that the fees charged and services provided to the Fund were reasonable by comparison.
Payments to Intermediaries. The Directors also requested and received a description of payments made to intermediaries by the Fund and the Advisor and services provided in response thereto. These payments include various payments made by the Fund or the Advisor to different types of intermediaries and recordkeepers for distribution and service activities provided for the Fund. The Board reviewed such information and received representations from the Advisor that all such payments by the Fund were made pursuant to the Fund's Rule 12b-1 Plan and that all such payments by the Advisor were made from the Advisor's resources and reasonable profits. The Board found the payments to be reasonable in scope and purpose.
Collateral or “Fall-Out” Benefits Derived by the Advisor. The Board considered the existence of collateral benefits the Advisor may receive as a result of its relationship with the Fund. They concluded that the Advisor’s primary business is managing mutual funds and it generally does not use fund or shareholder information to generate profits in other lines of business, and therefore does not derive any significant collateral benefits from them. The Board noted that additional assets from other clients may offer the Advisor some benefit from increased leverage with service providers and counterparties. Additionally, the Advisor receives proprietary research from broker-dealers that execute fund portfolio transactions, which the Board concluded is likely to benefit other clients of the Advisor, as well as Fund shareholders. The Board also determined that the Advisor is able to provide investment management services to certain clients other than the Fund, at least in part, due to its existing infrastructure built to serve the fund complex. The Board concluded that appropriate allocation methodologies had been employed to assign resources and the cost of those resources to these other clients and, where expressly provided, these other client assets may be included with the assets of the Fund to determine breakpoints in the management fee schedule.
Existing Relationship. The Board also considered whether there was any reason for not continuing the existing arrangement with the Advisor. In this regard, the Board was mindful of the potential disruptions of the Fund’s operations and various risks, uncertainties, and other effects that could occur as a result of a decision not to continue such relationship. In particular, the Board recognized that most shareholders have invested in the Fund on the strength of the Advisor’s industry standing and reputation and in the expectation that the Advisor will have a continuing role in providing advisory services to the Fund.
Conclusion of the Directors. As a result of this process, the Board, including all of the independent Directors, taking into account all of the factors discussed above and the information provided by the Advisor and others in connection with its review and throughout the year, determined that the management fee is fair and reasonable in light of the services provided and that the investment management agreement between the Fund and the Advisor should be renewed.
A special meeting of shareholders was held on October 18, 2017, to vote on the following proposal. The proposal received the required votes and was adopted. A summary of voting results is listed below.
To elect four directors to the Board of Directors of American Century Mutual Funds, Inc.:
|
| | | | | | | |
| Affirmative |
| Withhold |
Thomas W. Bunn | $ | 19,547,896,641 |
|
| $ | 402,531,816 |
|
Barry Fink | $ | 19,543,961,253 |
|
| $ | 406,467,204 |
|
Jan M. Lewis | $ | 19,556,221,886 |
|
| $ | 394,206,571 |
|
Stephen E. Yates | $ | 19,543,817,152 |
|
| $ | 406,611,305 |
|
The other directors whose term of office continued after the meeting include Jonathan S. Thomas, Andrea C. Hall, James A. Olson, M. Jeannine Strandjord, and John R. Whitten.
Retirement Account Information
As required by law, distributions you receive from certain retirement accounts are subject to federal income tax withholding, unless you elect not to have withholding apply*. Tax will be withheld on the total amount withdrawn even though you may be receiving amounts that are not subject to withholding, such as nondeductible contributions. In such case, excess amounts of withholding could occur. You may adjust your withholding election so that a greater or lesser amount will be withheld.
If you don’t want us to withhold on this amount, you must notify us to not withhold the federal income tax. You may notify us in writing or in certain situations by telephone or through other electronic means. For systematic withdrawals, your withholding election will remain in effect until revoked or changed by filing a new election. You have the right to revoke your election at any time and change your withholding percentage for future distributions.
Remember, even if you elect not to have income tax withheld, you are liable for paying income tax on the taxable portion of your withdrawal. If you elect not to have income tax withheld or you don’t have enough income tax withheld, you may be responsible for payment of estimated tax. You may incur penalties under the estimated tax rules if your withholding and estimated tax payments are not sufficient. You can reduce or defer the income tax on a distribution by directly or indirectly rolling such distribution over to another IRA or eligible plan. You should consult your tax advisor for additional information.
State tax will be withheld if, at the time of your distribution, your address is within one of the mandatory withholding states and you have federal income tax withheld (or as otherwise required by state law). State taxes will be withheld from your distribution in accordance with the respective state rules.
*Some 403(b), 457 and qualified retirement plan distributions may be subject to 20% mandatory withholding, as they are subject to special tax and withholding rules. Your plan administrator or plan sponsor is required to provide you with a special tax notice explaining those rules at the time you request a distribution. If applicable, federal and/or state taxes may be withheld from your distribution amount.
Proxy Voting Policies
A description of the policies that the fund's investment advisor uses in exercising the voting rights associated with the securities purchased and/or held by the fund is available without charge, upon request, by calling 1-800-345-2021. It is also available on the "About Us" page of American Century Investments’ website at americancentury.com and on the Securities and Exchange Commission’s website at sec.gov. Information regarding how the investment advisor voted proxies relating to portfolio securities during the most recent 12-month period ended June 30 is available on the "About Us" page at americancentury.com. It is also available at sec.gov.
Quarterly Portfolio Disclosure
The fund files its complete schedule of portfolio holdings with the Securities and Exchange Commission (SEC) for the first and third quarters of each fiscal year on Form N-Q. The fund’s Forms N-Q are available on the SEC’s website at sec.gov, and may be reviewed and copied at the SEC’s Public Reference Room in Washington, DC. Information on the operation of the Public Reference Room may be obtained by calling 1-800-SEC-0330. The fund also makes its complete schedule of portfolio holdings for the most recent quarter of its fiscal year available on its website at americancentury.com and, upon request, by calling 1-800-345-2021.
Other Tax Information
The following information is provided pursuant to provisions of the Internal Revenue Code.
The fund hereby designates up to the maximum amount allowable as qualified dividend income for the fiscal year ended October 31, 2017.
For corporate taxpayers, the fund hereby designates $10,021,309, or up to the maximum amount allowable, of ordinary income distributions paid during the fiscal year ended October 31, 2017 as qualified for the corporate dividends received deduction.
The fund hereby designates $7,627,767, or up to the maximum amount allowable, as long-term capital gain distributions (20% rate gain distributions) for the fiscal year ended October 31, 2017.
|
| | |
| |
| | |
Contact Us | americancentury.com | |
Automated Information Line | 1-800-345-8765 | |
Investor Services Representative | 1-800-345-2021 or 816-531-5575 | |
Investors Using Advisors | 1-800-378-9878 | |
Business, Not-For-Profit, Employer-Sponsored Retirement Plans | 1-800-345-3533 | |
Banks and Trust Companies, Broker-Dealers, Financial Professionals, Insurance Companies | 1-800-345-6488 | |
Telecommunications Relay Service for the Deaf | 711 | |
| | |
American Century Mutual Funds, Inc. | |
| | |
Investment Advisor: American Century Investment Management, Inc. Kansas City, Missouri | |
| | |
This report and the statements it contains are submitted for the general information of our shareholders. The report is not authorized for distribution to prospective investors unless preceded or accompanied by an effective prospectus. | |
| | |
©2017 American Century Proprietary Holdings, Inc. All rights reserved.
CL-ANN-90968 1712 | |
|
| |
| |
| Annual Report |
| |
| October 31, 2017 |
| |
| Capital Value Fund |
|
| |
President’s Letter | 2 |
Performance | 3 |
Portfolio Commentary | |
Fund Characteristics | |
Shareholder Fee Example | |
Schedule of Investments | |
Statement of Assets and Liabilities | |
Statement of Operations | |
Statement of Changes in Net Assets | |
Notes to Financial Statements | |
Financial Highlights | |
Report of Independent Registered Public Accounting Firm | |
Management | |
Approval of Management Agreement | |
Proxy Voting Results | |
Additional Information | |
Any opinions expressed in this report reflect those of the author as of the date of the report, and do not necessarily represent the opinions of American Century Investments® or any other person in the American Century Investments organization. Any such opinions are subject to change at any time based upon market or other conditions and American Century Investments disclaims any responsibility to update such opinions. These opinions may not be relied upon as investment advice and, because investment decisions made by American Century Investments funds are based on numerous factors, may not be relied upon as an indication of trading intent on behalf of any American Century Investments fund. Security examples are used for representational purposes only and are not intended as recommendations to purchase or sell securities. Performance information for comparative indices and securities is provided to American Century Investments by third party vendors. To the best of American Century Investments’ knowledge, such information is accurate at the time of printing.
Jonathan Thomas
Dear Investor:
Thank you for reviewing this annual report for the period ended October 31, 2017. Annual reports help convey important information about fund returns, including market factors that affected performance during the reporting period. For additional, updated investment and market insights, we encourage you to visit our website, americancentury.com.
‘Risk-On’ Sentiment Sparked Strong Gains Among Stocks
U.S. stocks delivered robust double-digit gains for the reporting period. The “risk-on” rally began early in the period, following Donald Trump’s election victory in November 2016. Investor expectations for President Trump’s administration to usher in pro-growth policies and reforms drove stock prices higher. In addition, healthy corporate earnings growth and improving gross domestic product (GDP) and other economic data provided additional support for stocks. Against this backdrop, the S&P 500 Index reached several milestone levels during the period and returned 23.63%. In terms of equity styles, riskier and economically sensitive stocks generally remained in favor. For example, small-cap stocks generally outperformed their mid- and large-cap peers, while growth stocks broadly outperformed their value counterparts across the capitalization spectrum. Real estate investment trusts (REITs) advanced, but global property stocks significantly underperformed the broader stock market as interest rates increased, most notably in the U.S., where the Federal Reserve (Fed) raised rates three times during the period.
As stocks soared in the post-election environment, global bonds sold off sharply. President Trump’s policy agenda fueled inflation fears that sent global bond yields sharply higher in late 2016. However, broad bond market performance generally recovered beginning in early 2017, advancing on subdued inflation and continued central bank accommodation to post modest gains for the entire reporting period. Investor preferences for risk also extended to the global fixed-income market, where high-yield corporate and emerging markets bonds were top performers.
As Congress considers tax cuts and other pro-growth reforms and the Fed and other central banks pursue policy normalization, investors likely will face new opportunities and challenges in the months ahead. We continue to believe in a disciplined, diversified, and risk-aware approach, using professionally managed portfolios in pursuit of investment goals. We appreciate your continued trust in us.
Sincerely,
Jonathan Thomas
President and Chief Executive Officer
American Century Investments
|
| | | | | |
Total Returns as of October 31, 2017 |
| | | Average Annual Returns | |
| Ticker Symbol | 1 year | 5 years | 10 years | Inception Date |
Investor Class | ACTIX | 17.24% | 12.34% | 5.01% | 3/31/99 |
Russell 1000 Value Index | — | 17.78% | 13.47% | 5.99% | — |
I Class | ACPIX | 17.55% | 12.58% | 5.23% | 3/1/02 |
A Class | ACCVX | | | | 5/14/03 |
No sales charge | | 16.99% | 12.10% | 4.76% | |
With sales charge | | 10.26% | 10.78% | 4.15% | |
Fund returns would have been lower if a portion of the fees had not been waived. Prior to March 1, 2010, the A Class was referred to as the Advisor Class and did not have a front-end sales charge. Performance prior to that date has been adjusted to reflect this charge. Prior to April 10, 2017, the I Class was referred to as the Institutional Class.
Sales charges include initial sales charges and contingent deferred sales charges (CDSCs), as applicable. A Class shares have a 5.75% maximum initial sales charge and may be subject to a maximum CDSC of 1.00%. The SEC requires that mutual funds provide performance information net of maximum sales charges in all cases where charges could be applied.
Data presented reflect past performance. Past performance is no guarantee of future results. Current performance may be higher or lower than the performance shown. Total returns for periods less than one year are not annualized. Investment return and principal value will fluctuate, and redemption value may be more or less than original cost. Data assumes reinvestment of dividends and capital gains, and none of the charts reflect the deduction of taxes that a shareholder would pay on fund distributions or the redemption of fund shares. To obtain performance data current to the most recent month end, please call 1-800-345-2021 or visit americancentury.com. For additional information about the fund, please consult the prospectus.
|
|
Growth of $10,000 Over 10 Years |
$10,000 investment made October 31, 2007 |
Performance for other share classes will vary due to differences in fee structure. |
|
| |
Value on October 31, 2017 |
| Investor Class — $16,312 |
|
| Russell 1000 Value Index — $17,893 |
|
Ending value of Investor Class would have been lower if a portion of the fees had not been waived.
|
| | |
Total Annual Fund Operating Expenses |
Investor Class | I Class | A Class |
1.10% | 0.90% | 1.35% |
The total annual fund operating expenses shown is as stated in the fund’s prospectus current as of the date of this report. The prospectus may vary from the expense ratio shown elsewhere in this report because it is based on a different time period, includes acquired fund fees and expenses, and, if applicable, does not include fee waivers or expense reimbursements.
Data presented reflect past performance. Past performance is no guarantee of future results. Current performance may be higher or lower than the performance shown. Total returns for periods less than one year are not annualized. Investment return and principal value will fluctuate, and redemption value may be more or less than original cost. Data assumes reinvestment of dividends and capital gains, and none of the charts reflect the deduction of taxes that a shareholder would pay on fund distributions or the redemption of fund shares. To obtain performance data current to the most recent month end, please call 1-800-345-2021 or visit americancentury.com. For additional information about the fund, please consult the prospectus.
Portfolio Managers: Brendan Healy and Brian Woglom
Performance Summary
Capital Value advanced 17.24%* for the 12 months ended October 31, 2017. The fund’s benchmark, the Russell 1000 Value Index, advanced 17.78% for the same time period. The fund’s return reflects operating expenses, while the index’s return does not.
The portfolio’s overweight and security selection in the energy sector were key drivers behind the portfolio’s underperformance. Individual positions in consumer discretionary, health care, and industrials sectors also detracted from relative returns. Conversely, holdings in the information technology and financials sectors contributed positively to performance.
Energy Detracted From Returns
During the first half of 2017, oil and gas prices weakened as investors became concerned that both markets would switch back to an oversupplied state in 2018. Additionally, a much higher-than-expected rig count increase in the U.S. led to concerns over service cost inflation. These factors pressured the stocks of many energy companies. Against this backdrop, the portfolio’s overweight to the energy sector detracted from performance. Although oil prices recovered to some degree during the third quarter of 2017, Schlumberger, Occidental Petroleum, and Noble Energy were among the top individual detractors from relative performance over the trailing 12-month period.
Holdings in the Consumer Discretionary, Health Care, and Industrials Sectors Weighed on Performance
A competitive environment, which intensified following Amazon’s announcement that it would purchase Whole Foods Market, presented challenges to many consumer discretionary stocks. Advance Auto Parts was pressured from investor sentiment that Amazon would enter additional industries previously thought to be safe from Amazon’s influence. The stock was also negatively affected by weak quarterly earnings announcements and lowered fiscal year 2017 guidance. Mattel was another key detractor in the sector. The toy company missed its second-quarter earnings estimates due to margin pressure from excess inventory. Furthermore, Toys”R”Us, one of Mattel’s largest customers, filed for bankruptcy, creating uncertainty leading up to the holiday season.
In the health care sector, several of the portfolio’s holdings in the pharmaceuticals industry negatively impacted performance. One of the top individual detractors was Teva Pharmaceutical Industries. The stock declined for several reasons, including generic drug pricing pressures and concerns regarding the company’s debt levels emanating from Teva’s 2016 purchase of Allergan’s generics business. Worries about a competitor’s potential approval of a version of Copaxone, Teva’s biggest specialty drug, also pressured the stock. Furthermore, a couple of members of Teva’s senior management team left the company. Given these headwinds, we reduced our position in Teva throughout the first half of 2017 and eventually eliminated the stock from the portfolio in August.
*All fund returns referenced in this commentary are for Investor Class shares. Fund returns would have been lower if a portion of the fees had not been waived. Performance for other share classes will vary due to differences in fee structure; when Investor Class performance exceeds that of the fund's benchmark, other share classes may not. See page 3 for returns for all share classes.
The industrials sector was another area of weakness. Johnson Controls International, a building products company, announced quarterly results that reflected a material shortfall in free cash flow relative to expectations. The company also lowered its full-year earnings guidance. In addition, given its low tax rate, Johnson Controls will not benefit from potential tax reform as compared to other industrials, and this weighed on the stock.
Consumer Staples Stock Was a Top Detractor
CVS Health, a retail pharmacy and health care company, was one of the portfolio’s largest detractors from performance. Toward the beginning of the reporting period, the stock declined after the company provided much lighter-than-expected 2016 fiscal year guidance as a result of two lost contracts. Concerns over drug pricing and the possible slowdown in the rate of drug price inflation for branded and generic drugs also pushed the stock price of CVS Health down. Later in the reporting period, concerns of competition from Amazon caused the stock to underperform.
Information Technology and Financials Holdings Buoyed Returns
Stock selection in the information technology sector was strong, particularly in the semiconductors and semiconductor equipment industry. Applied Materials rose significantly as the company benefited from strong orders, record backlog, and market share gains. The company also announced that it expects continued growth in revenues and earnings over the next few years due to strong demand. In the software industry, Oracle’s stock rose due to solid cloud revenue growth and cloud gross margins. Additionally, Oracle announced a sizable dividend increase.
In the financials sector, our capital markets and bank holdings were meaningful contributors to performance. Many of our holdings in these industries, including Ameriprise Financial, benefited from higher interest rates and higher equity markets. Several of our bank holdings, including PNC Financial Services Group, rose following the election due to the potential for lower corporate tax rates, optimism for economic growth and better credit, and the potential for an easing regulatory burden.
Outlook
We continue to be bottom-up investment managers, evaluating each company individually and
building our portfolio one stock at a time. We use our fundamental analysis, risk/reward framework, and proprietary valuation model to invest primarily in the stocks of large companies that we believe to be undervalued.
As of October 31, 2017, the portfolio’s largest sector overweights are in energy and health care. In energy, we believe we hold well-managed, higher-quality companies with strong balance sheets and attractive valuations. In the health care sector, notable industry overweights are in the pharmaceuticals and health care equipment and supplies industries, where we have identified higher-quality companies with strong fundamentals and compelling risk/reward profiles. Conversely, our largest sector underweights are in real estate and utilities, as our valuation work continues to show that many stocks in those sectors are overvalued.
|
| |
OCTOBER 31, 2017 | |
Top Ten Holdings | % of net assets |
JPMorgan Chase & Co. | 3.2% |
Wells Fargo & Co. | 3.1% |
Chevron Corp. | 3.0% |
Johnson & Johnson | 2.9% |
Pfizer, Inc. | 2.9% |
Oracle Corp. (New York) | 2.7% |
TOTAL SA | 2.6% |
Bank of America Corp. | 2.5% |
Schlumberger Ltd. | 2.3% |
Cisco Systems, Inc. | 2.1% |
| |
Top Five Industries | % of net assets |
Banks | 15.4% |
Oil, Gas and Consumable Fuels | 13.9% |
Pharmaceuticals | 8.9% |
Insurance | 5.2% |
Health Care Equipment and Supplies | 4.8% |
| |
Types of Investments in Portfolio | % of net assets |
Domestic Common Stocks | 93.2% |
Foreign Common Stocks* | 5.7% |
Total Common Stocks | 98.9% |
Temporary Cash Investments | 1.0% |
Other Assets and Liabilities | 0.1% |
*Includes depositary shares, dual listed securities and foreign ordinary shares.
Fund shareholders may incur two types of costs: (1) transaction costs, including sales charges (loads) on purchase payments and redemption/exchange fees; and (2) ongoing costs, including management fees; distribution and service (12b-1) fees; and other fund expenses. This example is intended to help you understand your ongoing costs (in dollars) of investing in your fund and to compare these costs with the ongoing cost of investing in other mutual funds.
The example is based on an investment of $1,000 made at the beginning of the period and held for the entire period from May 1, 2017 to October 31, 2017.
Actual Expenses
The table provides information about actual account values and actual expenses for each class. You may use the information, together with the amount you invested, to estimate the expenses that you paid over the period. First, identify the share class you own. Then simply divide your account value by $1,000 (for example, an $8,600 account value divided by $1,000 = 8.6), then multiply the result by the number under the heading “Expenses Paid During Period” to estimate the expenses you paid on your account during this period.
If you hold Investor Class shares of any American Century Investments fund, or I Class shares of the American Century Diversified Bond Fund, in an American Century Investments account (i.e., not a financial intermediary or retirement plan account), American Century Investments may charge you a $12.50 semiannual account maintenance fee if the value of those shares is less than $10,000. We will redeem shares automatically in one of your accounts to pay the $12.50 fee. In determining your total eligible investment amount, we will include your investments in all personal accounts (including American Century Investments Brokerage accounts) registered under your Social Security number. Personal accounts include individual accounts, joint accounts, UGMA/UTMA accounts, personal trusts, Coverdell Education Savings Accounts and IRAs (including traditional, Roth, Rollover, SEP-, SARSEP- and SIMPLE-IRAs), and certain other retirement accounts. If you have only business, business retirement, employer-sponsored or American Century Investments Brokerage accounts, you are currently not subject to this fee. If you are subject to the Account Maintenance Fee, your account value could be reduced by the fee amount.
Hypothetical Example for Comparison Purposes
The table also provides information about hypothetical account values and hypothetical expenses based on the actual expense ratio of each class of your fund and an assumed rate of return of 5% per year before expenses, which is not the actual return of a fund’s share class. The hypothetical account values and expenses may not be used to estimate the actual ending account balance or expenses you paid for the period. You may use this information to compare the ongoing costs of investing in your fund and other funds. To do so, compare this 5% hypothetical example with the 5% hypothetical examples that appear in the shareholder reports of the other funds.
Please note that the expenses shown in the table are meant to highlight your ongoing costs only and do not reflect any transactional costs, such as sales charges (loads) or redemption/exchange fees. Therefore, the table is useful in comparing ongoing costs only, and will not help you determine the relative total costs of owning different funds. In addition, if these transactional costs were included, your costs would have been higher.
|
| | | | |
| Beginning
Account Value
5/1/17 | Ending
Account Value
10/31/17 | Expenses Paid
During Period(1)
5/1/17 - 10/31/17 | Annualized
Expense Ratio(1) |
Actual | | | | |
Investor Class | $1,000 | $1,041.00 | $5.20 | 1.01% |
I Class | $1,000 | $1,041.90 | $4.17 | 0.81% |
A Class | $1,000 | $1,040.00 | $6.48 | 1.26% |
Hypothetical | | | | |
Investor Class | $1,000 | $1,020.11 | $5.14 | 1.01% |
I Class | $1,000 | $1,021.12 | $4.13 | 0.81% |
A Class | $1,000 | $1,018.85 | $6.41 | 1.26% |
| |
(1) | Expenses are equal to the class's annualized expense ratio listed in the table above, multiplied by the average account value over the period, multiplied by 184, the number of days in the most recent fiscal half-year, divided by 365, to reflect the one-half year period. Annualized expense ratio reflects actual expenses, including any applicable fee waivers or expense reimbursements and excluding any acquired fund fees and expenses. |
OCTOBER 31, 2017
|
| | | | | |
| Shares | Value |
COMMON STOCKS — 98.9% | | |
Aerospace and Defense — 2.3% | | |
Textron, Inc. | 15,700 |
| $ | 828,018 |
|
United Technologies Corp. | 22,350 |
| 2,676,636 |
|
| | 3,504,654 |
|
Auto Components — 1.0% | | |
BorgWarner, Inc. | 9,850 |
| 519,292 |
|
Delphi Automotive plc | 9,890 |
| 982,868 |
|
| | 1,502,160 |
|
Automobiles — 0.6% | | |
Ford Motor Co. | 68,690 |
| 842,826 |
|
Banks — 15.4% | | |
Bank of America Corp. | 140,210 |
| 3,840,352 |
|
BB&T Corp. | 26,010 |
| 1,280,732 |
|
Citigroup, Inc. | 39,900 |
| 2,932,650 |
|
JPMorgan Chase & Co. | 49,070 |
| 4,936,933 |
|
KeyCorp | 34,480 |
| 629,260 |
|
PNC Financial Services Group, Inc. (The) | 15,910 |
| 2,176,329 |
|
U.S. Bancorp | 52,980 |
| 2,881,052 |
|
Wells Fargo & Co. | 85,160 |
| 4,780,883 |
|
| | 23,458,191 |
|
Beverages — 0.7% | | |
PepsiCo, Inc. | 9,120 |
| 1,005,298 |
|
Biotechnology — 1.1% | | |
Amgen, Inc. | 7,890 |
| 1,382,486 |
|
Celgene Corp.(1) | 2,370 |
| 239,299 |
|
| | 1,621,785 |
|
Building Products — 1.6% | | |
Johnson Controls International plc | 57,872 |
| 2,395,322 |
|
Capital Markets — 4.7% | | |
Ameriprise Financial, Inc. | 5,420 |
| 848,447 |
|
BlackRock, Inc. | 3,250 |
| 1,530,198 |
|
Goldman Sachs Group, Inc. (The) | 3,790 |
| 918,999 |
|
Invesco Ltd. | 24,580 |
| 879,718 |
|
Morgan Stanley | 21,520 |
| 1,076,000 |
|
State Street Corp. | 20,430 |
| 1,879,560 |
|
| | 7,132,922 |
|
Chemicals — 1.6% | | |
DowDuPont, Inc. | 27,210 |
| 1,967,555 |
|
LyondellBasell Industries NV, Class A | 3,960 |
| 409,979 |
|
| | 2,377,534 |
|
Communications Equipment — 2.1% | | |
Cisco Systems, Inc. | 95,780 |
| 3,270,887 |
|
Containers and Packaging — 0.6% | | |
WestRock Co. | 15,450 |
| 947,549 |
|
Diversified Financial Services — 0.6% | | |
Berkshire Hathaway, Inc., Class B(1) | 4,970 |
| 929,092 |
|
|
| | | | | |
| Shares | Value |
Diversified Telecommunication Services — 2.1% | | |
AT&T, Inc. | 70,990 |
| $ | 2,388,813 |
|
Verizon Communications, Inc. | 17,970 |
| 860,224 |
|
| | 3,249,037 |
|
Electric Utilities — 3.4% | | |
Edison International | 18,190 |
| 1,454,290 |
|
Eversource Energy | 18,450 |
| 1,155,708 |
|
PG&E Corp. | 19,740 |
| 1,140,380 |
|
Xcel Energy, Inc. | 29,130 |
| 1,442,518 |
|
| | 5,192,896 |
|
Electrical Equipment — 0.9% | | |
Eaton Corp. plc | 16,300 |
| 1,304,326 |
|
Energy Equipment and Services — 2.9% | | |
Baker Hughes a GE Co. | 27,880 |
| 876,268 |
|
Schlumberger Ltd. | 54,530 |
| 3,489,920 |
|
| | 4,366,188 |
|
Equity Real Estate Investment Trusts (REITs) — 0.3% | | |
Brixmor Property Group, Inc. | 26,580 |
| 464,353 |
|
Food and Staples Retailing — 3.3% | | |
CVS Health Corp. | 40,470 |
| 2,773,409 |
|
Wal-Mart Stores, Inc. | 26,380 |
| 2,303,238 |
|
| | 5,076,647 |
|
Food Products — 1.9% | | |
General Mills, Inc. | 10,800 |
| 560,736 |
|
Kellogg Co. | 14,040 |
| 877,921 |
|
Mondelez International, Inc., Class A | 35,310 |
| 1,462,893 |
|
| | 2,901,550 |
|
Health Care Equipment and Supplies — 4.8% | | |
Abbott Laboratories | 42,220 |
| 2,289,590 |
|
Medtronic plc | 37,500 |
| 3,019,500 |
|
Zimmer Biomet Holdings, Inc. | 16,130 |
| 1,961,731 |
|
| | 7,270,821 |
|
Health Care Providers and Services — 2.9% | | |
Aetna, Inc. | 4,170 |
| 709,025 |
|
Anthem, Inc. | 4,520 |
| 945,629 |
|
Cardinal Health, Inc. | 16,640 |
| 1,030,016 |
|
HCA Healthcare, Inc.(1) | 13,310 |
| 1,006,902 |
|
McKesson Corp. | 4,990 |
| 688,021 |
|
| | 4,379,593 |
|
Household Products — 1.5% | | |
Procter & Gamble Co. (The) | 27,280 |
| 2,355,355 |
|
Industrial Conglomerates — 1.7% | | |
General Electric Co. | 129,350 |
| 2,607,696 |
|
Insurance — 5.2% | | |
Allstate Corp. (The) | 8,460 |
| 794,056 |
|
American International Group, Inc. | 22,190 |
| 1,433,696 |
|
Chubb Ltd. | 19,710 |
| 2,972,662 |
|
MetLife, Inc. | 24,820 |
| 1,329,855 |
|
Principal Financial Group, Inc. | 5,640 |
| 371,394 |
|
Prudential Financial, Inc. | 9,020 |
| 996,349 |
|
| | 7,898,012 |
|
|
| | | | | |
| Shares | Value |
Leisure Products — 0.3% | | |
Mattel, Inc. | 34,290 |
| $ | 484,175 |
|
Machinery — 1.1% | | |
Ingersoll-Rand plc | 9,950 |
| 881,570 |
|
Stanley Black & Decker, Inc. | 5,290 |
| 854,600 |
|
| | 1,736,170 |
|
Media — 1.0% | | |
Time Warner, Inc. | 15,780 |
| 1,551,016 |
|
Multiline Retail — 0.4% | | |
Target Corp. | 11,130 |
| 657,115 |
|
Oil, Gas and Consumable Fuels — 13.9% | | |
Anadarko Petroleum Corp. | 31,140 |
| 1,537,382 |
|
Chevron Corp. | 39,740 |
| 4,605,468 |
|
ConocoPhillips | 46,440 |
| 2,375,406 |
|
Exxon Mobil Corp. | 21,660 |
| 1,805,361 |
|
Imperial Oil Ltd. | 48,310 |
| 1,566,396 |
|
Noble Energy, Inc. | 43,030 |
| 1,199,246 |
|
Occidental Petroleum Corp. | 40,120 |
| 2,590,548 |
|
Royal Dutch Shell plc, Class B ADR | 22,000 |
| 1,437,920 |
|
TOTAL SA | 72,328 |
| 4,033,107 |
|
| | 21,150,834 |
|
Pharmaceuticals — 8.9% | | |
Allergan plc | 7,050 |
| 1,249,471 |
|
Johnson & Johnson | 31,900 |
| 4,447,179 |
|
Merck & Co., Inc. | 44,560 |
| 2,454,810 |
|
Pfizer, Inc. | 126,160 |
| 4,423,170 |
|
Roche Holding AG | 4,600 |
| 1,062,798 |
|
| | 13,637,428 |
|
Road and Rail — 0.4% | | |
Union Pacific Corp. | 5,260 |
| 609,055 |
|
Semiconductors and Semiconductor Equipment — 3.3% | | |
Applied Materials, Inc. | 29,950 |
| 1,690,078 |
|
Intel Corp. | 39,220 |
| 1,784,118 |
|
Microchip Technology, Inc. | 3,280 |
| 310,944 |
|
NXP Semiconductors NV(1) | 4,530 |
| 530,237 |
|
QUALCOMM, Inc. | 13,320 |
| 679,453 |
|
| | 4,994,830 |
|
Software — 2.8% | | |
Electronic Arts, Inc.(1) | 1,860 |
| 222,456 |
|
Oracle Corp. (New York) | 79,790 |
| 4,061,311 |
|
| | 4,283,767 |
|
Specialty Retail — 1.5% | | |
Advance Auto Parts, Inc. | 12,340 |
| 1,008,672 |
|
L Brands, Inc. | 18,760 |
| 807,430 |
|
Lowe's Cos., Inc. | 5,300 |
| 423,735 |
|
| | 2,239,837 |
|
Technology Hardware, Storage and Peripherals — 0.5% | | |
Apple, Inc. | 4,630 |
| 782,655 |
|
Textiles, Apparel and Luxury Goods — 0.3% | | |
Ralph Lauren Corp. | 4,870 |
| 435,524 |
|
|
| | | | | |
| Shares | Value |
Tobacco — 1.3% | | |
Altria Group, Inc. | 8,600 |
| $ | 552,292 |
|
Philip Morris International, Inc. | 14,370 |
| 1,503,677 |
|
| | 2,055,969 |
|
TOTAL COMMON STOCKS
(Cost $104,948,457) | | 150,673,069 |
|
TEMPORARY CASH INVESTMENTS — 1.0% | | |
Repurchase Agreement, BMO Capital Markets Corp., (collateralized by various U.S. Treasury obligations, 0.375% - 1.375%, 1/15/27 - 2/15/45, valued at $871,313), in a joint trading account at 0.88%, dated 10/31/17, due 11/1/17 (Delivery value $852,292) | | 852,271 |
|
Repurchase Agreement, Fixed Income Clearing Corp., (collateralized by various U.S. Treasury obligations, 2.50%, 5/15/46, valued at $726,029), at 0.34%, dated 10/31/17, due 11/1/17 (Delivery value $710,007) | | 710,000 |
|
State Street Institutional U.S. Government Money Market Fund, Premier Class | 1,311 |
| 1,311 |
|
TOTAL TEMPORARY CASH INVESTMENTS
(Cost $1,563,582) | | 1,563,582 |
|
TOTAL INVESTMENT SECURITIES — 99.9%
(Cost $106,512,039) | | 152,236,651 |
|
OTHER ASSETS AND LIABILITIES — 0.1% | | 147,167 |
|
TOTAL NET ASSETS — 100.0% | | $ | 152,383,818 |
|
|
| | | | | | | | | | |
FORWARD FOREIGN CURRENCY EXCHANGE CONTRACTS | | |
Currency Purchased | Currency Sold | Counterparty | Settlement Date | Unrealized Appreciation
(Depreciation) |
USD | 57,517 |
| CAD | 73,818 |
| Morgan Stanley | 12/29/17 | $ | 264 |
|
USD | 1,222,000 |
| CAD | 1,511,137 |
| Morgan Stanley | 12/29/17 | 49,954 |
|
CHF | 34,224 |
| USD | 34,940 |
| Credit Suisse AG | 12/29/17 | (496 | ) |
CHF | 35,696 |
| USD | 35,957 |
| Credit Suisse AG | 12/29/17 | (32 | ) |
USD | 24,051 |
| CHF | 23,440 |
| Credit Suisse AG | 12/29/17 | 460 |
|
USD | 920,230 |
| CHF | 888,832 |
| Credit Suisse AG | 12/29/17 | 25,693 |
|
USD | 82,187 |
| EUR | 70,656 |
| UBS AG | 12/29/17 | (394 | ) |
USD | 80,818 |
| EUR | 69,146 |
| UBS AG | 12/29/17 | 3 |
|
USD | 3,110,486 |
| EUR | 2,624,285 |
| UBS AG | 12/29/17 | 43,300 |
|
USD | 39,542 |
| GBP | 29,788 |
| Morgan Stanley | 12/29/17 | (93 | ) |
USD | 28,064 |
| GBP | 21,078 |
| Morgan Stanley | 12/29/17 | 18 |
|
USD | 1,081,031 |
| GBP | 800,343 |
| Morgan Stanley | 12/29/17 | 16,099 |
|
| | | | | | $ | 134,776 |
|
|
| | |
NOTES TO SCHEDULE OF INVESTMENTS |
ADR | - | American Depositary Receipt |
CAD | - | Canadian Dollar |
CHF | - | Swiss Franc |
EUR | - | Euro |
GBP | - | British Pound |
USD | - | United States Dollar |
See Notes to Financial Statements.
|
|
Statement of Assets and Liabilities |
|
| | | |
OCTOBER 31, 2017 | |
Assets | |
Investment securities, at value (cost of $106,512,039) | $ | 152,236,651 |
|
Receivable for capital shares sold | 4,371 |
|
Unrealized appreciation on forward foreign currency exchange contracts | 135,791 |
|
Dividends and interest receivable | 149,392 |
|
| 152,526,205 |
|
| |
Liabilities | |
Payable for capital shares redeemed | 8,384 |
|
Unrealized depreciation on forward foreign currency exchange contracts | 1,015 |
|
Accrued management fees | 130,427 |
|
Distribution and service fees payable | 784 |
|
Accrued other expenses | 1,777 |
|
| 142,387 |
|
| |
Net Assets | $ | 152,383,818 |
|
| |
Net Assets Consist of: | |
Capital (par value and paid-in surplus) | $ | 92,140,176 |
|
Undistributed net investment income | 1,647,041 |
|
Undistributed net realized gain | 12,737,213 |
|
Net unrealized appreciation | 45,859,388 |
|
| $ | 152,383,818 |
|
|
| | | | | | |
| Net Assets | Shares Outstanding | Net Asset Value Per Share |
Investor Class, $0.01 Par Value |
| $145,582,934 |
| 15,480,955 |
| $9.40 |
I Class, $0.01 Par Value |
| $3,115,799 |
| 330,131 |
| $9.44 |
A Class, $0.01 Par Value |
| $3,685,085 |
| 393,450 |
| $9.37* |
*Maximum offering price $9.94 (net asset value divided by 0.9425).
See Notes to Financial Statements.
|
| | | |
YEAR ENDED OCTOBER 31, 2017 | |
Investment Income (Loss) | |
Income: | |
Dividends (net of foreign taxes withheld of $35,315) | $ | 4,240,068 |
|
Interest | 6,999 |
|
| 4,247,067 |
|
| |
Expenses: | |
Management fees | 1,678,618 |
|
Distribution and service fees — A Class | 10,337 |
|
Directors' fees and expenses | 4,694 |
|
Other expenses | 4,991 |
|
| 1,698,640 |
|
Fees waived(1) | (153,014 | ) |
| 1,545,626 |
|
| |
Net investment income (loss) | 2,701,441 |
|
| |
Realized and Unrealized Gain (Loss) | |
Net realized gain (loss) on: | |
Investment transactions | 14,587,760 |
|
Forward foreign currency exchange contract transactions | (243,303 | ) |
Foreign currency translation transactions | 432 |
|
| 14,344,889 |
|
| |
Change in net unrealized appreciation (depreciation) on: | |
Investments | 6,697,360 |
|
Forward foreign currency exchange contracts | 9,931 |
|
Translation of assets and liabilities in foreign currencies | 178 |
|
| 6,707,469 |
|
| |
Net realized and unrealized gain (loss) | 21,052,358 |
|
| |
Net Increase (Decrease) in Net Assets Resulting from Operations | $ | 23,753,799 |
|
| |
(1) | Amount consists of $146,614, $2,265 and $4,135 for the Investor Class, I Class and A Class, respectively. |
See Notes to Financial Statements.
|
|
Statement of Changes in Net Assets |
|
| | | | | | |
YEARS ENDED OCTOBER 31, 2017 AND OCTOBER 31, 2016 |
Increase (Decrease) in Net Assets | October 31, 2017 | October 31, 2016 |
Operations | | |
Net investment income (loss) | $ | 2,701,441 |
| $ | 2,424,105 |
|
Net realized gain (loss) | 14,344,889 |
| 10,704,341 |
|
Change in net unrealized appreciation (depreciation) | 6,707,469 |
| (7,223,914 | ) |
Net increase (decrease) in net assets resulting from operations | 23,753,799 |
| 5,904,532 |
|
| | |
Distributions to Shareholders | | |
From net investment income: | | |
Investor Class | (2,191,476 | ) | (2,244,362 | ) |
I Class | (35,875 | ) | (48,846 | ) |
A Class | (59,449 | ) | (60,089 | ) |
From net realized gains: | | |
Investor Class | (9,545,165 | ) | (8,499,296 | ) |
I Class | (137,766 | ) | (164,845 | ) |
A Class | (311,203 | ) | (268,334 | ) |
Decrease in net assets from distributions | (12,280,934 | ) | (11,285,772 | ) |
| | |
Capital Share Transactions | | |
Net increase (decrease) in net assets from capital share transactions (Note 5) | 943,959 |
| (5,924,588 | ) |
| | |
Net increase (decrease) in net assets | 12,416,824 |
| (11,305,828 | ) |
| | |
Net Assets | | |
Beginning of period | 139,966,994 |
| 151,272,822 |
|
End of period | $ | 152,383,818 |
| $ | 139,966,994 |
|
| | |
Undistributed net investment income | $ | 1,647,041 |
| $ | 1,680,415 |
|
See Notes to Financial Statements.
|
|
Notes to Financial Statements |
OCTOBER 31, 2017
1. Organization
American Century Mutual Funds, Inc. (the corporation) is registered under the Investment Company Act of 1940, as amended (the 1940 Act), as an open-end management investment company and is organized as a Maryland corporation. Capital Value Fund (the fund) is one fund in a series issued by the corporation. The fund’s investment objective is to seek long-term capital growth.
The fund offers the Investor Class, I Class (formerly Institutional Class) and A Class. The A Class may incur an initial sales charge and may be subject to a contingent deferred sales charge.
2. Significant Accounting Policies
The following is a summary of significant accounting policies consistently followed by the fund in preparation of its financial statements. The fund is an investment company and follows accounting and reporting guidance in accordance with accounting principles generally accepted in the United States of America. This may require management to make certain estimates and assumptions at the date of the financial statements. Actual results could differ from these estimates. Management evaluated the impact of events or transactions occurring through the date the financial statements were issued that would merit recognition or disclosure.
Investment Valuations — The fund determines the fair value of its investments and computes its net asset value per share at the close of regular trading (usually 4 p.m. Eastern time) on the New York Stock Exchange (NYSE) on each day the NYSE is open. The Board of Directors has adopted valuation policies and procedures to guide the investment advisor in the fund’s investment valuation process and to provide methodologies for the oversight of the fund’s pricing function.
Equity securities that are listed or traded on a domestic securities exchange are valued at the last reported sales price or at the official closing price as provided by the exchange. Equity securities traded on foreign securities exchanges are generally valued at the closing price of such securities on the exchange where primarily traded or at the close of the NYSE, if that is earlier. If no last sales price is reported, or if local convention or regulation so provides, the mean of the latest bid and asked prices may be used. Securities traded over-the-counter are valued at the mean of the latest bid and asked prices, the last sales price, or the official closing price. Equity securities initially expressed in local currencies are translated into U.S. dollars at the mean of the appropriate currency exchange rate at the close of the NYSE as provided by an independent pricing service.
Open-end management investment companies are valued at the reported net asset value per share. Repurchase agreements are valued at cost, which approximates fair value. Forward foreign currency exchange contracts are valued at the mean of the appropriate forward exchange rate at the close of the NYSE as provided by an independent pricing service.
If the fund determines that the market price for an investment is not readily available or the valuation methods mentioned above do not reflect an investment’s fair value, such investment is valued as determined in good faith by the Board of Directors or its delegate, in accordance with policies and procedures adopted by the Board of Directors. In its determination of fair value, the fund may review several factors including, but not limited to, market information regarding the specific investment or comparable investments and correlation with other investment types, futures indices or general market indicators. Circumstances that may cause the fund to use these procedures to value an investment include, but are not limited to: an investment has been declared in default or is distressed; trading in a security has been suspended during the trading day or a security is not actively trading on its principal exchange; prices received from a regular pricing source are deemed unreliable; or there is a foreign market holiday and no trading occurred.
The fund monitors for significant events occurring after the close of an investment’s primary exchange but before the fund’s net asset value per share is determined. Significant events may include, but are not limited to: corporate announcements and transactions; governmental action and political unrest that could impact a specific investment or an investment sector; or armed conflicts, natural disasters and similar events that could affect investments in a specific country or region. The fund also monitors for significant fluctuations between domestic and foreign markets, as evidenced by the U.S. market or such other indicators that the Board of
Directors, or its delegate, deems appropriate. If significant fluctuations in foreign markets are identified, the fund may apply a model-derived factor to the closing price of equity securities traded on foreign securities exchanges. The factor is based on observable market data as provided by an independent pricing service.
Security Transactions — Security transactions are accounted for as of the trade date. Net realized gains and losses are determined on the identified cost basis, which is also used for federal income tax purposes.
Investment Income — Dividend income less foreign taxes withheld, if any, is recorded as of the ex-dividend date. Distributions received on securities that represent a return of capital or long-term capital gain are recorded as a reduction of cost of investments and/or as a realized gain. The fund may estimate the components of distributions received that may be considered nontaxable distributions or long-term capital gain distributions for income tax purposes. Interest income is recorded on the accrual basis and includes accretion of discounts and amortization of premiums.
Foreign Currency Translations — All assets and liabilities initially expressed in foreign currencies are translated into U.S. dollars at prevailing exchange rates at period end. The fund may enter into spot foreign currency exchange contracts to facilitate transactions denominated in a foreign currency. Purchases and sales of investment securities, dividend and interest income, spot foreign currency exchange contracts, and expenses are translated at the rates of exchange prevailing on the respective dates of such transactions. Net realized and unrealized foreign currency exchange gains or losses related to investment securities are a component of net realized gain (loss) on investment transactions and change in net unrealized appreciation (depreciation) on investments, respectively.
Repurchase Agreements — The fund may enter into repurchase agreements with institutions that American Century Investment Management, Inc. (ACIM) (the investment advisor) has determined are creditworthy pursuant to criteria adopted by the Board of Directors. The fund requires that the collateral, represented by securities, received in a repurchase transaction be transferred to the custodian in a manner sufficient to enable the fund to obtain those securities in the event of a default under the repurchase agreement. ACIM monitors, on a daily basis, the securities transferred to ensure the value, including accrued interest, of the securities under each repurchase agreement is equal to or greater than amounts owed to the fund under each repurchase agreement.
Joint Trading Account — Pursuant to an Exemptive Order issued by the Securities and Exchange Commission, the fund, along with certain other funds in the American Century Investments family of funds, may transfer uninvested cash balances into a joint trading account. These balances are invested in one or more repurchase agreements that are collateralized by U.S. Treasury or Agency obligations.
Income Tax Status — It is the fund’s policy to distribute substantially all net investment income and net realized gains to shareholders and to otherwise qualify as a regulated investment company under provisions of the Internal Revenue Code. Accordingly, no provision has been made for income taxes. The fund files U.S. federal, state, local and non-U.S. tax returns as applicable. The fund's tax returns are subject to examination by the relevant taxing authority until expiration of the applicable statute of limitations, which is generally three years from the date of filing but can be longer in certain jurisdictions. At this time, management believes there are no uncertain tax positions which, based on their technical merit, would not be sustained upon examination and for which it is reasonably possible that the total amounts of unrecognized tax benefits will significantly change in the next twelve months.
Multiple Class — All shares of the fund represent an equal pro rata interest in the net assets of the class to which such shares belong, and have identical voting, dividend, liquidation and other rights and the same terms and conditions, except for class specific expenses and exclusive rights to vote on matters affecting only individual classes. Income, non-class specific expenses, and realized and unrealized capital gains and losses of the fund are allocated to each class of shares based on their relative net assets.
Distributions to Shareholders — Distributions from net investment income and net realized gains, if any, are generally declared and paid annually. The fund may elect to treat a portion of its payment to a redeeming shareholder, which represents the pro rata share of undistributed net investment income and net realized gains, as a distribution for federal income tax purposes (tax equalization).
Indemnifications — Under the corporation’s organizational documents, its officers and directors are indemnified against certain liabilities arising out of the performance of their duties to the fund. In addition, in the normal course of business, the fund enters into contracts that provide general indemnifications. The maximum exposure under these arrangements is unknown as this would involve future claims that may be made against a fund. The risk of material loss from such claims is considered by management to be remote.
3. Fees and Transactions with Related Parties
Certain officers and directors of the corporation are also officers and/or directors of American Century Companies, Inc. (ACC). The corporation’s investment advisor, ACIM, the corporation's distributor, American Century Investment Services, Inc. (ACIS), and the corporation’s transfer agent, American Century Services, LLC, are wholly owned, directly or indirectly, by ACC.
Management Fees — The corporation has entered into a management agreement with ACIM, under which ACIM provides the fund with investment advisory and management services in exchange for a single, unified management fee (the fee) per class. The agreement provides that all expenses of managing and operating the fund, except distribution and service fees, brokerage expenses, taxes, interest, fees and expenses of the independent directors (including legal counsel fees), and extraordinary expenses, will be paid by ACIM. The fee is computed and accrued daily based on each class's daily net assets and paid monthly in arrears. The difference in the fee among the classes is a result of their separate arrangements for non-Rule 12b-1 shareholder services. It is not the result of any difference in advisory or custodial fees or other expenses related to the management of the fund’s assets, which do not vary by class. The rate of the fee is determined by applying a fee rate calculation formula. This formula takes into account the fund’s assets as well as certain assets, if any, of other clients of the investment advisor outside the American Century Investments family of funds (such as subadvised funds and separate accounts) that use very similar investment teams and strategies (strategy assets). During the period ended October 31, 2017, the investment advisor agreed to waive 0.10% of the fund's management fee. The investment advisor expects this waiver to continue until July 31, 2018 and cannot terminate it prior to such date without the approval of the Board of Directors.
The management fee schedule range and the effective annual management fee before and after waiver for each class for the period ended October 31, 2017 are as follows:
|
| | | |
| | Effective Annual Management Fee |
| Management Fee Schedule Range | Before Waiver | After Waiver |
Investor Class | 0.900% to 1.100% | 1.10% | 1.00% |
I Class | 0.700% to 0.900% | 0.90% | 0.80% |
A Class | 0.900% to 1.100% | 1.10% | 1.00% |
Distribution and Service Fees — The Board of Directors has adopted a Master Distribution and Individual Shareholder Services Plan (the plan) for the A Class, pursuant to Rule 12b-1 of the 1940 Act. The plan provides that the A Class will pay ACIS an annual distribution and service fee of 0.25%. The fees are computed and accrued daily based on the A Class’s daily net assets and paid monthly in arrears. The fees are used to pay financial intermediaries for distribution and individual shareholder services. Fees incurred under the plan during the period ended October 31, 2017 are detailed in the Statement of Operations.
Directors' Fees and Expenses — The Board of Directors is responsible for overseeing the investment advisor’s management and operations of the fund. The directors receive detailed information about the fund and its investment advisor regularly throughout the year, and meet at least quarterly with management of the investment advisor to review reports about fund operations. The fund’s officers do not receive compensation from the fund.
Interfund Transactions — The fund may enter into security transactions with other American Century Investments funds and other client accounts of the investment advisor, in accordance with the 1940 Act rules and procedures adopted by the Board of Directors. The rules and procedures require, among other things, that these transactions be effected at the independent current market price of the security. During the period, the interfund purchases and sales were $733,889 and $462,013, respectively. The effect of interfund transactions on the Statement of Operations was $74,473 in net realized gain (loss) on investment transactions.
4. Investment Transactions
Purchases and sales of investment securities, excluding short-term investments, for the period ended October 31, 2017 were $38,999,974 and $48,161,940, respectively.
5. Capital Share Transactions
Transactions in shares of the fund were as follows:
|
| | | | | | | | | | |
| Year ended October 31, 2017 | Year ended
October 31, 2016 |
| Shares | Amount | Shares | Amount |
Investor Class/Shares Authorized | 180,000,000 |
| | 200,000,000 |
| |
Sold | 1,153,110 |
| $ | 10,522,431 |
| 624,518 |
| $ | 5,261,374 |
|
Issued in reinvestment of distributions | 1,257,615 |
| 11,104,738 |
| 1,245,917 |
| 10,191,589 |
|
Redeemed | (2,277,001 | ) | (20,744,578 | ) | (2,406,725 | ) | (20,339,514 | ) |
| 133,724 |
| 882,591 |
| (536,290 | ) | (4,886,551 | ) |
I Class/Shares Authorized | 20,000,000 |
| | 15,000,000 |
| |
Sold | 151,082 |
| 1,380,796 |
| 12,428 |
| 104,453 |
|
Issued in reinvestment of distributions | 12,824 |
| 113,359 |
| 18,746 |
| 153,720 |
|
Redeemed | (53,781 | ) | (491,331 | ) | (149,579 | ) | (1,260,000 | ) |
| 110,125 |
| 1,002,824 |
| (118,405 | ) | (1,001,827 | ) |
A Class/Shares Authorized | 40,000,000 |
| | 40,000,000 |
| |
Sold | 156,156 |
| 1,420,499 |
| 132,211 |
| 1,112,660 |
|
Issued in reinvestment of distributions | 41,700 |
| 367,377 |
| 39,753 |
| 324,780 |
|
Redeemed | (301,198 | ) | (2,729,332 | ) | (175,034 | ) | (1,473,650 | ) |
| (103,342 | ) | (941,456 | ) | (3,070 | ) | (36,210 | ) |
Net increase (decrease) | 140,507 |
| $ | 943,959 |
| (657,765 | ) | $ | (5,924,588 | ) |
6. Fair Value Measurements
The fund’s investments valuation process is based on several considerations and may use multiple inputs to determine the fair value of the investments held by the fund. In conformity with accounting principles generally accepted in the United States of America, the inputs used to determine a valuation are classified into three broad levels.
• Level 1 valuation inputs consist of unadjusted quoted prices in an active market for identical investments.
• Level 2 valuation inputs consist of direct or indirect observable market data (including quoted prices for
comparable investments, evaluations of subsequent market events, interest rates, prepayment speeds,
credit risk, etc.). These inputs also consist of quoted prices for identical investments initially expressed in
local currencies that are adjusted through translation into U.S. dollars.
• Level 3 valuation inputs consist of unobservable data (including a fund’s own assumptions).
The level classification is based on the lowest level input that is significant to the fair valuation measurement. The valuation inputs are not necessarily an indication of the risks associated with investing in these securities or other financial instruments. There were no significant transfers between levels during the period.
The following is a summary of the level classifications as of period end. The Schedule of Investments provides additional information on the fund’s portfolio holdings. |
| | | | | | | | |
| Level 1 | Level 2 | Level 3 |
Assets | | | |
Investment Securities | | | |
Common Stocks | $ | 144,010,768 |
| $ | 6,662,301 |
| — |
|
Temporary Cash Investments | 1,311 |
| 1,562,271 |
| — |
|
| $ | 144,012,079 |
| $ | 8,224,572 |
| — |
|
Other Financial Instruments | | | |
Forward Foreign Currency Exchange Contracts | — |
| $ | 135,791 |
| — |
|
| | | |
Liabilities | | | |
Other Financial Instruments | | | |
Forward Foreign Currency Exchange Contracts | — |
| $ | 1,015 |
| — |
|
7. Derivative Instruments
Foreign Currency Risk — The fund is subject to foreign currency exchange rate risk in the normal course of pursuing its investment objectives. The value of foreign investments held by a fund may be significantly affected by changes in foreign currency exchange rates. The dollar value of a foreign security generally decreases when the value of the dollar rises against the foreign currency in which the security is denominated and tends to increase when the value of the dollar declines against such foreign currency. A fund may enter into forward foreign currency exchange contracts to reduce a fund's exposure to foreign currency exchange rate fluctuations. The net U.S. dollar value of foreign currency underlying all contractual commitments held by a fund and the resulting unrealized appreciation or depreciation are determined daily. Realized gain or loss is recorded upon the termination of the contract. Net realized and unrealized gains or losses occurring during the holding period of forward foreign currency exchange contracts are a component of net realized gain (loss) on forward foreign currency exchange contract transactions and change in net unrealized appreciation (depreciation) on forward foreign currency exchange contracts, respectively. A fund bears the risk of an unfavorable change in the foreign currency exchange rate underlying the forward contract. Additionally, losses, up to the fair value, may arise if the counterparties do not perform under the contract terms. The fund's average U.S. dollar exposure to foreign currency risk derivative instruments held during the period was $6,332,254.
The value of foreign currency risk derivative instruments as of October 31, 2017, is disclosed on the Statement of Assets and Liabilities as an asset of $135,791 in unrealized appreciation on forward foreign currency exchange contracts and a liability of $1,015 in unrealized depreciation on forward foreign currency exchange contracts. For the year ended October 31, 2017, the effect of foreign currency risk derivative instruments on the Statement of Operations was $(243,303) in net realized gain (loss) on forward foreign currency exchange contract transactions and $9,931 in change in net unrealized appreciation (depreciation) on forward foreign currency exchange contracts.
8. Risk Factors
There are certain risks involved in investing in foreign securities. These risks include those resulting from future adverse political, social and economic developments, fluctuations in currency exchange rates, the possible imposition of exchange controls, and other foreign laws or restrictions.
9. Federal Tax Information
The tax character of distributions paid during the years ended October 31, 2017 and October 31, 2016 were as follows:
|
| | | | | | |
| 2017 | 2016 |
Distributions Paid From | | |
Ordinary income | $ | 2,286,800 |
| $ | 2,353,297 |
|
Long-term capital gains | $ | 9,994,134 |
| $ | 8,932,475 |
|
The book-basis character of distributions made during the year from net investment income or net realized gains may differ from their ultimate characterization for federal income tax purposes. These differences reflect the differing character of certain income items and net realized gains and losses for financial statement and tax purposes, and may result in reclassification among certain capital accounts on the financial statements.
As of period end, the federal tax cost of investments and the components of distributable earnings on a tax-basis were as follows:
|
| | | |
Federal tax cost of investments | $ | 107,180,980 |
|
Gross tax appreciation of investments | $ | 48,988,092 |
|
Gross tax depreciation of investments | (3,932,421 | ) |
Net tax appreciation (depreciation) of investments | $ | 45,055,671 |
|
Undistributed ordinary income | $ | 1,781,817 |
|
Accumulated long-term gains | $ | 13,406,154 |
|
The difference between book-basis and tax-basis unrealized appreciation (depreciation) is attributable primarily to the tax deferral of losses on wash sales.
|
| | | | | | | | | | | | | | | | | |
For a Share Outstanding Throughout the Years Ended October 31 (except as noted) | | |
Per-Share Data | | | | | Ratios and Supplemental Data |
| | Income From Investment Operations: | Distributions From: | | | Ratio to Average Net Assets of: | | |
| Net Asset
Value,
Beginning
of Period | Net
Investment
Income
(Loss)(1) | Net
Realized
and
Unrealized
Gain (Loss) | Total From
Investment
Operations | Net
Investment
Income | Net
Realized
Gains | Total
Distributions | Net Asset
Value,
End
of Period | Total
Return(2) | Operating
Expenses | Operating
Expenses
(before
expense
waiver) | Net
Investment
Income
(Loss) | Net
Investment
Income
(Loss)
(before
expense
waiver) | Portfolio
Turnover
Rate | Net
Assets,
End of
Period (in thousands) |
Investor Class | | | | | | | | | | | | | | |
2017 | $8.71 | 0.16 | 1.29 | 1.45 | (0.14) | (0.62) | (0.76) | $9.40 | 17.24% | 1.01% | 1.11% | 1.76% | 1.66% | 26% |
| $145,583 |
|
2016 | $9.05 | 0.14 | 0.21 | 0.35 | (0.14) | (0.55) | (0.69) | $8.71 | 4.36% | 1.00% | 1.10% | 1.72% | 1.62% | 45% |
| $133,732 |
|
2015 | $9.71 | 0.12 | (0.08) | 0.04 | (0.13) | (0.57) | (0.70) | $9.05 | 0.61% | 1.00% | 1.10% | 1.28% | 1.18% | 31% |
| $143,698 |
|
2014 | $8.51 | 0.12 | 1.20 | 1.32 | (0.12) | — | (0.12) | $9.71 | 15.68% | 1.00% | 1.10% | 1.32% | 1.22% | 31% |
| $151,715 |
|
2013 | $6.89 | 0.13 | 1.61 | 1.74 | (0.12) | — | (0.12) | $8.51 | 25.67% | 1.00% | 1.10% | 1.66% | 1.56% | 26% |
| $138,884 |
|
I Class(3) | | | | | | | | | | | | | | |
2017 | $8.74 | 0.18 | 1.30 | 1.48 | (0.16) | (0.62) | (0.78) | $9.44 | 17.55% | 0.81% | 0.91% | 1.96% | 1.86% | 26% |
| $3,116 |
|
2016 | $9.08 | 0.16 | 0.21 | 0.37 | (0.16) | (0.55) | (0.71) | $8.74 | 4.67% | 0.80% | 0.90% | 1.92% | 1.82% | 45% |
| $1,924 |
|
2015 | $9.74 | 0.14 | (0.08) | 0.06 | (0.15) | (0.57) | (0.72) | $9.08 | 0.72% | 0.80% | 0.90% | 1.48% | 1.38% | 31% |
| $3,071 |
|
2014 | $8.54 | 0.14 | 1.20 | 1.34 | (0.14) | — | (0.14) | $9.74 | 15.86% | 0.80% | 0.90% | 1.52% | 1.42% | 31% |
| $3,019 |
|
2013 | $6.90 | 0.15 | 1.62 | 1.77 | (0.13) | — | (0.13) | $8.54 | 26.00% | 0.80% | 0.90% | 1.86% | 1.76% | 26% |
| $3,289 |
|
|
| | | | | | | | | | | | | | | | | |
For a Share Outstanding Throughout the Years Ended October 31 (except as noted) | | |
Per-Share Data | | | | | Ratios and Supplemental Data |
| | Income From Investment Operations: | Distributions From: | | | Ratio to Average Net Assets of: | | |
| Net Asset
Value,
Beginning
of Period | Net
Investment
Income
(Loss)(1) | Net
Realized
and
Unrealized
Gain (Loss) | Total From
Investment
Operations | Net
Investment
Income | Net
Realized
Gains | Total
Distributions | Net Asset
Value,
End
of Period | Total
Return(2) | Operating
Expenses | Operating
Expenses
(before
expense
waiver) | Net
Investment
Income
(Loss) | Net
Investment
Income
(Loss)
(before
expense
waiver) | Portfolio
Turnover
Rate | Net
Assets,
End of
Period (in thousands) |
A Class | | | | | | | | | | | | | | |
2017 | $8.68 | 0.13 | 1.30 | 1.43 | (0.12) | (0.62) | (0.74) | $9.37 | 16.99% | 1.26% | 1.36% | 1.51% | 1.41% | 26% |
| $3,685 |
|
2016 | $9.01 | 0.12 | 0.22 | 0.34 | (0.12) | (0.55) | (0.67) | $8.68 | 4.21% | 1.25% | 1.35% | 1.47% | 1.37% | 45% |
| $4,312 |
|
2015 | $9.67 | 0.09 | (0.07) | 0.02 | (0.11) | (0.57) | (0.68) | $9.01 | 0.34% | 1.25% | 1.35% | 1.03% | 0.93% | 31% |
| $4,504 |
|
2014 | $8.48 | 0.10 | 1.19 | 1.29 | (0.10) | — | (0.10) | $9.67 | 15.32% | 1.25% | 1.35% | 1.07% | 0.97% | 31% |
| $4,107 |
|
2013 | $6.87 | 0.11 | 1.62 | 1.73 | (0.12) | — | (0.12) | $8.48 | 25.51% | 1.25% | 1.35% | 1.41% | 1.31% | 26% |
| $3,155 |
|
|
|
Notes to Financial Highlights |
| |
(1) | Computed using average shares outstanding throughout the period. |
| |
(2) | Total returns are calculated based on the net asset value of the last business day and do not reflect applicable sales charges, if any. Total returns for periods less than one year are not annualized. |
| |
(3) | Prior to April 10, 2017, the I Class was referred to as the Institutional Class. |
See Notes to Financial Statements.
|
|
Report of Independent Registered Public Accounting Firm |
To the Board of Directors and Shareholders of American Century Mutual Funds, Inc.:
We have audited the accompanying statement of assets and liabilities, including the schedule of investments, of Capital Value Fund (the “Fund”), one of the funds constituting American Century Mutual Funds, Inc., as of October 31, 2017, and the related statement of operations for the year then ended, the statements of changes in net assets for each of the two years in the period then ended, and the financial highlights for each of the five years in the period then ended. These financial statements and financial highlights are the responsibility of the Fund’s management. Our responsibility is to express an opinion on these financial statements and financial highlights based on our audits.
We conducted our audits in accordance with the standards of the Public Company Accounting Oversight Board (United States). Those standards require that we plan and perform the audit to obtain reasonable assurance about whether the financial statements and financial highlights are free of material misstatement. The Fund is not required to have, nor were we engaged to perform, an audit of its internal control over financial reporting. Our audits included consideration of internal control over financial reporting as a basis for designing audit procedures that are appropriate in the circumstances, but not for the purpose of expressing an opinion on the effectiveness of the Fund’s internal control over financial reporting. Accordingly, we express no such opinion. An audit also includes examining, on a test basis, evidence supporting the amounts and disclosures in the financial statements, assessing the accounting principles used and significant estimates made by management, as well as evaluating the overall financial statement presentation. Our procedures included confirmation of securities owned as of October 31, 2017, by correspondence with the custodian and brokers. We believe that our audits provide a reasonable basis for our opinion.
In our opinion, the financial statements and financial highlights referred to above present fairly, in all material respects, the financial position of Capital Value Fund of American Century Mutual Funds, Inc. as of October 31, 2017, the results of its operations for the year then ended, the changes in its net assets for each of the two years in the period then ended, and the financial highlights for each of the five years in the period then ended, in conformity with accounting principles generally accepted in the United States of America.
DELOITTE & TOUCHE LLP
Kansas City, Missouri
December 15, 2017
The Board of Directors
The individuals listed below serve as directors of the funds. Each director will continue to serve in this capacity until death, retirement, resignation or removal from office. The board has adopted a mandatory retirement age for directors who are not “interested persons,” as that term is defined in the Investment Company Act (independent directors). Independent directors shall retire by December 31 of the year in which they reach their 75th birthday.
Mr. Thomas is an “interested person” because he currently serves as President and Chief Executive Officer of American Century Companies, Inc. (ACC), the parent company of American Century Investment Management, Inc. (ACIM or the advisor). The other directors (more than three-fourths of the total number) are independent. They are not employees, directors or officers of, and have no financial interest in, ACC or any of its wholly owned, direct or indirect, subsidiaries, including ACIM, American Century Investment Services, Inc. (ACIS) and American Century Services, LLC (ACS), and they do not have any other affiliations, positions or relationships that would cause them to be considered “interested persons” under the Investment Company Act. The directors serve in this capacity for seven (in the case of Mr. Thomas, 15) registered investment companies in the American Century Investments family of funds.
The following table presents additional information about the directors. The mailing address for each director is 4500 Main Street, Kansas City, Missouri 64111.
|
| | | | | |
Name
(Year of Birth) | Position(s) Held with Funds | Length of Time Served | Principal Occupation(s) During Past 5 Years | Number of American Century Portfolios Overseen by Director | Other Directorships Held During Past 5 Years |
Independent Directors |
|
|
Thomas W. Bunn (1953) | Director | Since 2017 | Retired | 69 | SquareTwo Financial; Barings (formerly Babson Capital Funds Trust) (2013 to 2016) |
Barry Fink
(1955) | Director | Since 2012 (independent since 2016) | Retired; Executive Vice President, ACC (2007 to 2013); President, ACS (2007 to 2013); Chief Operating Officer, ACC (2007 to 2012) | 69 | None |
Andrea C. Hall
(1945) | Director | Since 1997 | Retired | 69 | None |
Jan M. Lewis
(1957) | Director | Since 2011 | Retired; President and Chief Executive Officer, Catholic Charities of Northeast Kansas (human services organization) (2006 to 2013) | 69 | None |
James A. Olson
(1942) | Director and Chairman of the Board | Since 2007 (Chairman since 2014) | Member, Plaza Belmont LLC (private equity fund manager) (1999 to present) | 69 | Saia, Inc. (2002 to 2012) and EPR Properties (2003 to 2013) |
|
| | | | | |
Name
(Year of Birth) | Position(s) Held with Funds | Length of Time Served | Principal Occupation(s) During Past 5 Years | Number of American Century Portfolios Overseen by Director | Other Directorships Held During Past 5 Years |
Independent Directors |
|
|
M. Jeannine Strandjord
(1945) | Director | Since 1994 | Retired | 69 | Euronet Worldwide Inc.; MGP Ingredients, Inc.; and DST Systems Inc. (1996 to 2012) |
John R. Whitten
(1946) | Director | Since 2008 | Retired | 69 | Rudolph Technologies, Inc. |
Stephen E. Yates
(1948) | Director | Since 2012 | Retired | 69 | None |
Interested Director |
|
|
Jonathan S. Thomas
(1963) | Director and President | Since 2007 | President and Chief Executive Officer, ACC (2007 to present). Also serves as Chief Executive Officer, ACS; Executive Vice President, ACIM; Director, ACC, ACIM and other ACC subsidiaries | 114 | BioMed Valley Discoveries, Inc. |
The Statement of Additional Information has additional information about the fund's directors and is available without charge, upon request, by calling 1-800-345-2021.
Officers
The following table presents certain information about the executive officers of the funds. Each officer serves as an officer for each of the 15 investment companies in the American Century family of funds, unless otherwise noted. No officer is compensated for his or her service as an officer of the funds. The listed officers are interested persons of the funds and are appointed or re-appointed on an annual basis. The mailing address for each officer listed below is 4500 Main Street, Kansas City, Missouri 64111.
|
| | |
Name
(Year of Birth) | Offices with the Funds | Principal Occupation(s) During the Past Five Years |
Jonathan S. Thomas
(1963) | Director and President since 2007 | President and Chief Executive Officer, ACC (2007 to present). Also serves as Chief Executive Officer, ACS; Executive Vice President, ACIM; Director, ACC, ACIM and other ACC subsidiaries |
Amy D. Shelton
(1964) | Chief Compliance Officer and Vice President since 2014 | Chief Compliance Officer, American Century funds, (2014 to present); Chief Compliance Officer, ACIM (2014 to present); Chief Compliance Officer, ACIS (2009 to present); Vice President, Client Interactions and Marketing, ACIS (2013 to 2014); Director, Client Interactions and Marketing, ACIS (2007 to 2013). Also serves as Vice President, ACIS |
Charles A. Etherington
(1957) | General Counsel since 2007 and Senior Vice President since 2006 | Attorney, ACC (1994 to present); Vice President, ACC (2005 to present); General Counsel, ACC (2007 to present). Also serves as General Counsel, ACIM, ACS, ACIS and other ACC subsidiaries; and Senior Vice President, ACIM and ACS |
C. Jean Wade
(1964) | Vice President,Treasurer and Chief Financial Officer since 2012 | Vice President, ACS (2000 to present) |
Robert J. Leach
(1966) | Vice President since 2006 and Assistant Treasurer since 2012 | Vice President, ACS (2000 to present) |
David H. Reinmiller
(1963) | Vice President since 2000 | Attorney, ACC (1994 to present); Associate General Counsel, ACC (2001 to present). Also serves as Vice President, ACIM and ACS |
Ward D. Stauffer
(1960) | Secretary since 2005 | Attorney, ACC (2003 to present) |
|
|
Approval of Management Agreement |
At a meeting held on June 29, 2017, the Fund’s Board of Directors (the "Board") unanimously approved the renewal of the management agreement pursuant to which American Century Investment Management, Inc. (the “Advisor”) acts as the investment advisor for the Fund. Under Section 15(c) of the Investment Company Act, contracts for investment advisory services are required to be reviewed, evaluated, and approved by a majority of a fund’s directors (the “Directors”), including a majority of the independent Directors, each year.
Prior to its consideration of the renewal of the management agreement, the Directors requested and reviewed extensive data and information compiled by the Advisor and certain independent providers of evaluation data concerning the Fund and the services provided to the Fund by the Advisor. This review was in addition to the oversight and evaluation undertaken by the Board and its committees on a continual basis and the information received was supplemental to the extensive information that the Board and its committees receive and consider throughout the year.
In connection with its consideration of the renewal of the management agreement, the Board’s review and evaluation of the services provided by the Advisor included, but was not limited to, the following:
| |
• | the nature, extent, and quality of investment management, shareholder services, and other services provided and to be provided to the Fund; |
| |
• | the wide range of other programs and services provided and to be provided to the Fund and its shareholders on a routine and non-routine basis; |
| |
• | the investment performance of the Fund, including data comparing the Fund's performance to appropriate benchmarks and/or a peer group of other mutual funds with similar investment objectives and strategies; |
| |
• | the cost of owning the Fund compared to the cost of owning similar funds; |
| |
• | the compliance policies, procedures, and regulatory experience of the Advisor and the Fund's service providers; |
| |
• | financial data showing the cost of services provided to the Fund, the profitability of the Fund to the Advisor, and the overall profitability of the Advisor; |
| |
• | strategic plans of the Advisor |
| |
• | possible economies of scale associated with the Advisor’s management of the Fund and other accounts under its management; |
| |
• | data comparing services provided and charges to the Advisor's other investment management clients; |
| |
• | acquired fund fees and expenses; |
| |
• | payments and practices by the Fund and the Advisor regarding financial intermediaries, the nature of services provided by intermediaries, and the terms of share classes utilized; and |
| |
• | any collateral benefits derived by the Advisor from the management of the Fund. |
The Directors held three in-person meetings and one telephonic meeting to review and discuss the information provided. The independent Directors also reviewed responses to supplemental information requests and held active discussions with the Advisor regarding the renewal of the management agreement. The independent Directors had the benefit of the advice of their independent counsel throughout the process.
Factors Considered
The Directors considered all of the information provided by the Advisor, the independent data providers, and independent counsel in connection with the approval. They determined that the
information was sufficient for them to evaluate the management agreement for the Fund. In connection with their review, the Directors did not identify any single factor as being all-important or controlling, and each Director may have attributed different levels of importance to different factors. In deciding to renew the management agreement, the Board based its decision on a number of factors, including without limitation the following:
Nature, Extent and Quality of Services - Generally. Under the management agreement, the Advisor is responsible for providing or arranging for all services necessary for the operation of the Fund. The Board noted that the Advisor provides or arranges at its own expense a wide variety of services including without limitation the following:
| |
• | portfolio research and security selection |
| |
• | daily valuation of the Fund’s portfolio |
| |
• | shareholder servicing and transfer agency, including shareholder confirmations, recordkeeping, and communications |
| |
• | legal services (except the independent Directors’ counsel) |
| |
• | regulatory and portfolio compliance |
| |
• | marketing and distribution (except amounts paid by the Fund under Rule 12b-1 plans) |
The Board noted that many of these services have expanded over time in terms of both quantity and complexity in response to shareholder demands, competition in the industry, changing distribution channels, and the changing regulatory environment. The Board noted specifically the resources the Advisor has committed during the year to compliance with the Department of Labor fiduciary rule and share class modernization.
Investment Management Services. The nature of the investment management services provided to the Fund is quite complex and allows Fund shareholders access to professional money management, instant diversification of their investments within an asset class, the opportunity to easily diversify among asset classes by investing in or exchanging among various American Century Investments funds, and liquidity. In evaluating investment performance, the Board expects the Advisor to manage the Fund in accordance with its investment objectives and approved strategies. Further, the Directors recognize that the Advisor has an obligation to monitor trading activities, and in particular to seek the best execution of fund trades, and to evaluate the use of and payment for research. In providing these services, the Advisor utilizes teams of investment professionals (portfolio managers, analysts, research assistants, and securities traders) who require extensive information technology, research, training, compliance, and other systems to conduct their business. The Board, directly and through its Fund Performance Review Committee, provides oversight of the investment performance process. It regularly reviews investment performance information for the Fund, together with comparative information for appropriate benchmarks and/or peer groups of similarly-managed funds, over different time horizons. The Directors also review detailed performance information provided by the Advisor during the management agreement renewal process. If performance concerns are identified, the Fund receives special reviews until performance improves, during which the Board receives a report from the Advisor regarding the reasons for such results (e.g., market conditions, security selection) and any efforts being undertaken to improve performance. The Fund’s performance was above its benchmark for the three-, five-, and ten-year periods and below its benchmark for the one-year period reviewed by the Board. The Board discussed the Fund's performance with the Advisor and was satisfied with the efforts being undertaken by the Advisor. The Board found the investment management services provided by the Advisor to the Fund to be satisfactory and consistent with the management agreement.
Shareholder and Other Services. Under the management agreement, the Advisor provides the Fund with a comprehensive package of transfer agency, shareholder, and other services. The Board, directly and through various committees of the Board, regularly reviews reports and evaluations of such services at its regular meetings. These reports include, but are not limited to, information regarding the operational efficiency and accuracy of the shareholder and transfer agency services provided, staffing levels, shareholder satisfaction (as measured by external as well as internal sources), technology support, new products and services offered to Fund shareholders, securities trading activities, portfolio valuation services, auditing services, and legal and operational compliance activities. Certain aspects of shareholder and transfer agency service level efficiency and the quality of securities trading activities are measured by independent third party providers and are presented in comparison to other fund groups not managed by the Advisor. The Board found the services provided by the Advisor to the Fund under the management agreement to be competitive and of high quality.
Costs of Services and Profitability. The Advisor provides detailed information concerning its cost of providing various services to the Fund, its profitability in managing the Fund (pre- and post-distribution), its overall profitability, and its financial condition. The Directors have reviewed with the Advisor the methodology used to prepare this financial information. This information is considered in evaluating the Advisor’s financial condition, its ability to continue to provide services under the management agreement, and the reasonableness of the current management fee. The Board concluded that the Advisor’s profits were reasonable in light of the services provided to the Fund.
Ethics. The Board generally considers the Advisor’s commitment to providing quality services to shareholders and to conducting its business ethically. They noted that the Advisor’s practices generally meet or exceed industry best practices.
Economies of Scale. The Board also reviewed information provided by the Advisor regarding the possible existence of economies of scale in connection with the management of the Fund. The Board concluded that economies of scale are difficult to measure and predict with precision, especially on a fund-by-fund basis. The Board concluded that the Advisor is appropriately sharing economies of scale through its competitive fee structure, offering competitive fees from fund inception, and through reinvestment in its business to provide shareholders additional content and services. The Board also noted that economies of scale are shared with the Fund and its shareholders through management fee breakpoints that serve to reduce the effective management fee as the assets of the Fund grow.
Comparison to Other Funds’ Fees. The management agreement provides that the Fund pays the Advisor a single, all-inclusive (or unified) management fee for providing all services necessary for the management and operation of the Fund, other than brokerage expenses, expenses attributable to short sales, taxes, interest, extraordinary expenses, and the fees and expenses of the Fund’s independent Directors (including their independent legal counsel) and expenses incurred in connection with the provision of shareholder services and distribution services under a plan adopted pursuant to Rule 12b-1 under the 1940 Act. Under the unified fee structure, the Advisor is responsible for providing all investment advisory, custody, audit, administrative, compliance, recordkeeping, marketing and shareholder services, or arranging and supervising third parties to provide such services. By contrast, most other funds are charged a variety of fees, including an investment advisory fee, a transfer agency fee, an administrative fee, distribution charges, and other expenses. Other than their investment advisory fees and any applicable Rule 12b-1 distribution fees, all other components of the total fees charged by these other funds may be increased without shareholder approval. The Board believes the unified fee structure is a benefit to Fund shareholders because it clearly discloses to shareholders the cost of owning Fund shares, and, since the unified fee cannot be increased without a vote of Fund shareholders, it shifts to the Advisor the risk of increased costs of operating the Fund and provides a direct incentive to minimize administrative inefficiencies. Part of the Board’s analysis of fee levels involves reviewing certain evaluative data compiled by an independent provider comparing the Fund’s unified fee to the total expense ratios of its peers. The unified fee charged to shareholders of the Fund was
above the median of the total expense ratios of the Fund’s peer expense universe and was within the range of its peer expense group. The Board discussed with the Advisor the factors that impacted the level of the fee in relation to its peers and accepted the Advisor's explanation of such factors. The Board and the Advisor agreed to a temporary reduction of the Fund's annual unified management fee of 0.10% (e.g., the Investor Class unified fee will be reduced from 1.10% to 1.00%) for at least one year, beginning August 1, 2017. The Board concluded that the management fee paid by the Fund to the Advisor under the management agreement is reasonable in light of the services provided to the Fund.
Comparison to Fees and Services Provided to Other Clients of the Advisor. The Directors also requested and received information from the Advisor concerning the nature of the services, fees, costs, and profitability of its advisory services to advisory clients other than the Fund. They observed that these varying types of client accounts require different services and involve different regulatory and entrepreneurial risks than the management of the Fund. The Board analyzed this information and concluded that the fees charged and services provided to the Fund were reasonable by comparison.
Payments to Intermediaries. The Directors also requested and received a description of payments made to intermediaries by the Fund and the Advisor and services provided in response thereto. These payments include various payments made by the Fund or the Advisor to different types of intermediaries and recordkeepers for distribution and service activities provided for the Fund. The Board reviewed such information and received representations from the Advisor that all such payments by the Fund were made pursuant to the Fund's Rule 12b-1 Plan and that all such payments by the Advisor were made from the Advisor's resources and reasonable profits. The Board found the payments to be reasonable in scope and purpose.
Collateral or “Fall-Out” Benefits Derived by the Advisor. The Board considered the existence of collateral benefits the Advisor may receive as a result of its relationship with the Fund. They concluded that the Advisor’s primary business is managing mutual funds and it generally does not use fund or shareholder information to generate profits in other lines of business, and therefore does not derive any significant collateral benefits from them. The Board noted that additional assets from other clients may offer the Advisor some benefit from increased leverage with service providers and counterparties. Additionally, the Advisor receives proprietary research from broker-dealers that execute fund portfolio transactions, which the Board concluded is likely to benefit other clients of the Advisor, as well as Fund shareholders. The Board also determined that the Advisor is able to provide investment management services to certain clients other than the Fund, at least in part, due to its existing infrastructure built to serve the fund complex. The Board concluded that appropriate allocation methodologies had been employed to assign resources and the cost of those resources to these other clients and, where expressly provided, these other client assets may be included with the assets of the Fund to determine breakpoints in the management fee schedule.
Existing Relationship. The Board also considered whether there was any reason for not continuing the existing arrangement with the Advisor. In this regard, the Board was mindful of the potential disruptions of the Fund’s operations and various risks, uncertainties, and other effects that could occur as a result of a decision not to continue such relationship. In particular, the Board recognized that most shareholders have invested in the Fund on the strength of the Advisor’s industry standing and reputation and in the expectation that the Advisor will have a continuing role in providing advisory services to the Fund.
Conclusion of the Directors. As a result of this process, the Board, including all of the independent Directors, taking into account all of the factors discussed above and the information provided by the Advisor and others in connection with its review and throughout the year, determined that the management fee is fair and reasonable in light of the services provided and that the investment management agreement between the Fund and the Advisor should be renewed.
A special meeting of shareholders was held on October 18, 2017, to vote on the following proposal. The proposal received the required votes and was adopted. A summary of voting results is listed below.
To elect four directors to the Board of Directors of American Century Mutual Funds, Inc.:
|
| | | | | | | |
| Affirmative |
| Withhold |
Thomas W. Bunn | $ | 19,547,896,641 |
|
| $ | 402,531,816 |
|
Barry Fink | $ | 19,543,961,253 |
|
| $ | 406,467,204 |
|
Jan M. Lewis | $ | 19,556,221,886 |
|
| $ | 394,206,571 |
|
Stephen E. Yates | $ | 19,543,817,152 |
|
| $ | 406,611,305 |
|
The other directors whose term of office continued after the meeting include Jonathan S. Thomas, Andrea C. Hall, James A. Olson, M. Jeannine Strandjord, and John R. Whitten.
Retirement Account Information
As required by law, distributions you receive from certain retirement accounts are subject to federal income tax withholding, unless you elect not to have withholding apply*. Tax will be withheld on the total amount withdrawn even though you may be receiving amounts that are not subject to withholding, such as nondeductible contributions. In such case, excess amounts of withholding could occur. You may adjust your withholding election so that a greater or lesser amount will be withheld.
If you don’t want us to withhold on this amount, you must notify us to not withhold the federal income tax. You may notify us in writing or in certain situations by telephone or through other electronic means. For systematic withdrawals, your withholding election will remain in effect until revoked or changed by filing a new election. You have the right to revoke your election at any time and change your withholding percentage for future distributions.
Remember, even if you elect not to have income tax withheld, you are liable for paying income tax on the taxable portion of your withdrawal. If you elect not to have income tax withheld or you don’t have enough income tax withheld, you may be responsible for payment of estimated tax. You may incur penalties under the estimated tax rules if your withholding and estimated tax payments are not sufficient. You can reduce or defer the income tax on a distribution by directly or indirectly rolling such distribution over to another IRA or eligible plan. You should consult your tax advisor for additional information.
State tax will be withheld if, at the time of your distribution, your address is within one of the mandatory withholding states and you have federal income tax withheld (or as otherwise required by state law). State taxes will be withheld from your distribution in accordance with the respective state rules.
*Some 403(b), 457 and qualified retirement plan distributions may be subject to 20% mandatory withholding, as they are subject to special tax and withholding rules. Your plan administrator or plan sponsor is required to provide you with a special tax notice explaining those rules at the time you request a distribution. If applicable, federal and/or state taxes may be withheld from your distribution amount.
Proxy Voting Policies
A description of the policies that the fund's investment advisor uses in exercising the voting rights associated with the securities purchased and/or held by the fund is available without charge, upon request, by calling 1-800-345-2021. It is also available on the "About Us" page of American Century Investments’ website at americancentury.com and on the Securities and Exchange Commission’s website at sec.gov. Information regarding how the investment advisor voted proxies relating to portfolio securities during the most recent 12-month period ended June 30 is available on the "About Us" page at americancentury.com. It is also available at sec.gov.
Quarterly Portfolio Disclosure
The fund files its complete schedule of portfolio holdings with the Securities and Exchange Commission (SEC) for the first and third quarters of each fiscal year on Form N-Q. The fund’s Forms N-Q are available on the SEC’s website at sec.gov, and may be reviewed and copied at the SEC’s Public Reference Room in Washington, DC. Information on the operation of the Public Reference Room may be obtained by calling 1-800-SEC-0330. The fund also makes its complete schedule of portfolio holdings for the most recent quarter of its fiscal year available on its website at americancentury.com and, upon request, by calling 1-800-345-2021.
Other Tax Information
The following information is provided pursuant to provisions of the Internal Revenue Code.
The fund hereby designates up to the maximum amount allowable as qualified dividend income for the fiscal year ended October 31, 2017.
For corporate taxpayers, the fund hereby designates $2,286,800, or up to the maximum amount allowable, of ordinary income distributions paid during the fiscal year ended October 31, 2017 as qualified for the corporate dividends received deduction.
The fund hereby designates $10,978,475, or up to the maximum amount allowable, as long-term capital gain distributions (20% rate gain distributions) for the fiscal year ended October 31, 2017.
The fund utilized earnings and profits of $1,150,526 distributed to shareholders on redemption of shares as part of the dividends paid deduction (tax equalization).
|
| | |
| |
| | |
Contact Us | americancentury.com | |
Automated Information Line | 1-800-345-8765 | |
Investor Services Representative | 1-800-345-2021 or 816-531-5575 | |
Investors Using Advisors | 1-800-378-9878 | |
Business, Not-For-Profit, Employer-Sponsored Retirement Plans | 1-800-345-3533 | |
Banks and Trust Companies, Broker-Dealers, Financial Professionals, Insurance Companies | 1-800-345-6488 | |
Telecommunications Relay Service for the Deaf | 711 | |
| | |
American Century Mutual Funds, Inc. | |
| | |
Investment Advisor: American Century Investment Management, Inc. Kansas City, Missouri | |
| | |
This report and the statements it contains are submitted for the general information of our shareholders. The report is not authorized for distribution to prospective investors unless preceded or accompanied by an effective prospectus. | |
| | |
©2017 American Century Proprietary Holdings, Inc. All rights reserved.
CL-ANN-90972 1712 | |
|
| |
| |
| Annual Report |
| |
| October 31, 2017 |
| |
| Growth Fund |
|
| | |
President’s Letter | 2 |
|
Performance | 3 |
|
Portfolio Commentary | |
|
Fund Characteristics | |
|
Shareholder Fee Example | |
|
Schedule of Investments | |
|
Statement of Assets and Liabilities | |
|
Statement of Operations | |
|
Statement of Changes in Net Assets | |
|
Notes to Financial Statements | |
|
Financial Highlights | |
|
Report of Independent Registered Public Accounting Firm | |
|
Management | |
|
Approval of Management Agreement | |
|
Proxy Voting Results | |
|
Additional Information | |
|
Any opinions expressed in this report reflect those of the author as of the date of the report, and do not necessarily represent the opinions of American Century Investments® or any other person in the American Century Investments organization. Any such opinions are subject to change at any time based upon market or other conditions and American Century Investments disclaims any responsibility to update such opinions. These opinions may not be relied upon as investment advice and, because investment decisions made by American Century Investments funds are based on numerous factors, may not be relied upon as an indication of trading intent on behalf of any American Century Investments fund. Security examples are used for representational purposes only and are not intended as recommendations to purchase or sell securities. Performance information for comparative indices and securities is provided to American Century Investments by third party vendors. To the best of American Century Investments’ knowledge, such information is accurate at the time of printing.
Jonathan Thomas
Dear Investor:
Thank you for reviewing this annual report for the period ended October 31, 2017. Annual reports help convey important information about fund returns, including market factors that affected performance during the reporting period. For additional, updated investment and market insights, we encourage you to visit our website, americancentury.com.
‘Risk-On’ Sentiment Sparked Strong Gains Among Stocks
U.S. stocks delivered robust double-digit gains for the reporting period. The “risk-on” rally began early in the period, following Donald Trump’s election victory in November 2016. Investor expectations for President Trump’s administration to usher in pro-growth policies and reforms drove stock prices higher. In addition, healthy corporate earnings growth and improving gross domestic product (GDP) and other economic data provided additional support for stocks. Against this backdrop, the S&P 500 Index reached several milestone levels during the period and returned 23.63%. In terms of equity styles, riskier and economically sensitive stocks generally remained in favor. For example, small-cap stocks generally outperformed their mid- and large-cap peers, while growth stocks broadly outperformed their value counterparts across the capitalization spectrum. Real estate investment trusts (REITs) advanced, but global property stocks significantly underperformed the broader stock market as interest rates increased, most notably in the U.S., where the Federal Reserve (Fed) raised rates three times during the period.
As stocks soared in the post-election environment, global bonds sold off sharply. President Trump’s policy agenda fueled inflation fears that sent global bond yields sharply higher in late 2016. However, broad bond market performance generally recovered beginning in early 2017, advancing on subdued inflation and continued central bank accommodation to post modest gains for the entire reporting period. Investor preferences for risk also extended to the global fixed-income market, where high-yield corporate and emerging markets bonds were top performers.
As Congress considers tax cuts and other pro-growth reforms and the Fed and other central banks pursue policy normalization, investors likely will face new opportunities and challenges in the months ahead. We continue to believe in a disciplined, diversified, and risk-aware approach, using professionally managed portfolios in pursuit of investment goals. We appreciate your continued trust in us.
Sincerely,
Jonathan Thomas
President and Chief Executive Officer
American Century Investments
|
| | | | | | |
Total Returns as of October 31, 2017 |
| | | Average Annual Returns | |
| Ticker Symbol | 1 year | 5 years | 10 years | Since Inception | Inception Date |
Investor Class | TWCGX | 28.26% | 14.92% | 8.06% | — | 6/30/71 |
Russell 1000 Growth Index | — | 29.71% | 16.82% | 9.12% | — | — |
I Class | TWGIX | 28.48% | 15.15% | 8.27% | — | 6/16/97 |
Y Class | AGYWX | — | — | — | 14.90% | 4/10/17 |
A Class | TCRAX | | | | | 6/4/97 |
No sales charge | | 27.95% | 14.64% | 7.79% | — | |
With sales charge | | 20.60% | 13.29% | 7.15% | — | |
C Class | TWRCX | 26.99% | 13.78% | — | 12.18% | 3/1/10 |
R Class | AGWRX | 27.62% | 14.35% | 7.52% | — | 8/29/03 |
R5 Class | AGWUX | — | — | — | 14.80% | 4/10/17 |
R6 Class | AGRDX | 28.71% | — | — | 13.86% | 7/26/13 |
Average annual returns since inception are presented when ten years of performance history is not available. Although the fund’s actual inception date was October 31, 1958, the Investor Class inception date corresponds with the investment advisor’s implementation of its current investment philosophy and practices. Prior to March 1, 2010, the A Class was referred to as the Advisor Class and did not have a front-end sales charge. Performance prior to that date has been adjusted to reflect this charge. Prior to April 10, 2017, the I Class was referred to as the Institutional Class.
Sales charges include initial sales charges and contingent deferred sales charges (CDSCs), as applicable. A Class shares have a 5.75% maximum initial sales charge and may be subject to a maximum CDSC of 1.00%. C Class shares redeemed within 12 months of purchase are subject to a maximum CDSC of 1.00%. The SEC requires that mutual funds provide performance information net of maximum sales charges in all cases where charges could be applied.
Data presented reflect past performance. Past performance is no guarantee of future results. Current performance may be higher or lower than the performance shown. Total returns for periods less than one year are not annualized. Investment return and principal value will fluctuate, and redemption value may be more or less than original cost. Data assumes reinvestment of dividends and capital gains, and none of the charts reflect the deduction of taxes that a shareholder would pay on fund distributions or the redemption of fund shares. To obtain performance data current to the most recent month end, please call 1-800-345-2021 or visit americancentury.com. For additional information about the fund, please consult the prospectus.
|
|
Growth of $10,000 Over 10 Years |
$10,000 investment made October 31, 2007 |
Performance for other share classes will vary due to differences in fee structure. |
|
| |
Value on October 31, 2017 |
| Investor Class — $21,716 |
|
| Russell 1000 Growth Index — $23,964 |
|
|
| | | | | | | |
Total Annual Fund Operating Expenses |
Investor Class | I Class | Y Class | A Class | C Class | R Class | R5 Class | R6 Class |
0.98% | 0.78% | 0.63% | 1.23% | 1.98% | 1.48% | 0.78% | 0.63% |
The total annual fund operating expenses shown is as stated in the fund’s prospectus current as of the date of this report. The prospectus may vary from the expense ratio shown elsewhere in this report because it is based on a different time period, includes acquired fund fees and expenses, and, if applicable, does not include fee waivers or expense reimbursements.
Data presented reflect past performance. Past performance is no guarantee of future results. Current performance may be higher or lower than the performance shown. Total returns for periods less than one year are not annualized. Investment return and principal value will fluctuate, and redemption value may be more or less than original cost. Data assumes reinvestment of dividends and capital gains, and none of the charts reflect the deduction of taxes that a shareholder would pay on fund distributions or the redemption of fund shares. To obtain performance data current to the most recent month end, please call 1-800-345-2021 or visit americancentury.com. For additional information about the fund, please consult the prospectus.
Portfolio Managers: Gregory Woodhams and Justin Brown
Performance Summary
Growth returned 28.26%* for the 12 months ended October 31, 2017, lagging the 29.71% return of the portfolio’s benchmark, the Russell 1000 Growth Index.
U.S. stock indices posted positive returns during the reporting period. Growth stocks outperformed value stocks by a wide margin across the capitalization spectrum. Within the Russell 1000 Growth Index, all sectors but energy posted strong gains. The small utilities segment—a sector that rarely has companies with the growth characteristics we seek—reported the top total return, but index gains were largely driven by the strong performance of information technology stocks.
Stock selection in the consumer discretionary sector was a significant source of underperformance relative to the benchmark. Stock choices among health care and financials stocks were also modest detractors. Stock selection and an overweight in the information technology sector benefited relative performance. Stock choices among industrials and real estate stocks were positive as well.
Consumer Discretionary Stocks Led Detractors
Brick-and-mortar retailers struggled during much of 2017 for a variety of reasons, including delayed tax refunds, weather, and competitive pressures from online retailer Amazon (a fund holding). Aftermarket car parts dealer O’Reilly Automotive reported sales that missed expectations and warned of weak consumer demand that drove the stock significantly lower. Investors also appeared to be fearful of increased competition from Amazon in a space that previously seemed relatively immune from online threats. We sold our O'Reilly holding. Off-price retailer TJX underperformed after reporting results that were in line with expectations but below historical growth levels. Chipotle Mexican Grill fell sharply in July on concerns about renewed food-safety issues after a Virginia store was closed because customers became ill.
In health care, not owning benchmark component AbbVie detracted as the stock price soared following the pharmaceutical company’s favorable settlement in its lawsuit against Amgen (a fund holding), which now must pay royalties to AbbVie on sales of its anti-inflammatory drug Amgevita, a biosimilar of AbbVie’s Humira.
Elsewhere, not owning benchmark component NVIDIA hindered results. The visual computing chip company’s gaming and data center businesses have continued to perform well, with the data center segment accelerating. Underweighting Apple also detracted. The company reported good results, and investors appeared to look ahead favorably to the release of the latest iPhone.
Information Technology Holdings Aided Performance
Top contributors in the information technology sector included Activision Blizzard. The video game developer reported results that were much better than expected, driven by higher margins and strong results from its recently acquired King Digital business (the mobile video game company that created Candy Crush). Exposure to semiconductor capital equipment manufacturer ASML Holding aided performance. The Netherlands-based company reported better-than-expected
*All fund returns referenced in this commentary are for Investor Class shares. Performance for other share classes will vary due to differences in fee structure; when Investor Class performance exceeds that of the fund’s benchmark, other share classes may not. See page 3 for returns for all share classes.
results and guidance with strong bookings for its new product, which allows companies to further
shrink the size and increase the complexity of semiconductor chips. Semiconductor company Applied Materials continued to gain market share and reported record revenues and earnings per share for its fiscal third quarter. The company also announced that it expects continued growth in revenues and earnings over the next few years due to strong demand.
Other major contributors included Intuitive Surgical. The medical device company benefited from Food and Drug Administration clearance for its new da Vinci X robotic platform, which offers several technologies at a lower price than its previous platform. Veterinary hospital operator VCA rose sharply on the announcement that it would be acquired by privately owned Mars. As a result, the stock was eliminated from the portfolio.
Outlook
We believe stock selection—rather than sector allocation or market timing via the use of cash—is the most efficient means of generating superior risk-adjusted returns. As a result of this approach, the portfolio’s sector and industry selection, as well as capitalization-range allocations, are primarily due to identifying what we believe to be superior individual securities.
The portfolio remains overweight the information technology sector as we continue to find strong growth opportunities. Our bottom-up fundamental analysis indicates rising capital spending by semiconductor companies. Internet names continued to generate high growth, and data security is another growth segment.
We have been underweight materials for some time as the sector shows an absence of secular growth. Our underweight in the consumer discretionary sector derives from concerns about secular changes in retail and media.
|
| |
OCTOBER 31, 2017 | |
Top Ten Holdings | % of net assets |
Alphabet, Inc., Class A | 7.7% |
Facebook, Inc., Class A | 5.5% |
Amazon.com, Inc. | 5.5% |
Apple, Inc. | 4.0% |
Visa, Inc., Class A | 2.8% |
Boeing Co. (The) | 2.3% |
PepsiCo, Inc. | 2.1% |
Palo Alto Networks, Inc. | 2.1% |
Applied Materials, Inc. | 2.0% |
PayPal Holdings, Inc. | 1.8% |
| |
Top Five Industries | % of net assets |
Internet Software and Services | 14.0% |
Software | 7.9% |
IT Services | 7.3% |
Internet and Direct Marketing Retail | 6.6% |
Semiconductors and Semiconductor Equipment | 5.8% |
| |
Types of Investments in Portfolio | % of net assets |
Common Stocks | 99.8% |
Temporary Cash Investments | 0.2% |
Other Assets and Liabilities | —* |
*Category is less than 0.05% of total net assets.
Fund shareholders may incur two types of costs: (1) transaction costs, including sales charges (loads) on purchase payments and redemption/exchange fees; and (2) ongoing costs, including management fees; distribution and service (12b-1) fees; and other fund expenses. This example is intended to help you understand your ongoing costs (in dollars) of investing in your fund and to compare these costs with the ongoing cost of investing in other mutual funds.
The example is based on an investment of $1,000 made at the beginning of the period and held for the entire period from May 1, 2017 to October 31, 2017.
Actual Expenses
The table provides information about actual account values and actual expenses for each class. You may use the information, together with the amount you invested, to estimate the expenses that you paid over the period. First, identify the share class you own. Then simply divide your account value by $1,000 (for example, an $8,600 account value divided by $1,000 = 8.6), then multiply the result by the number under the heading “Expenses Paid During Period” to estimate the expenses you paid on your account during this period.
If you hold Investor Class shares of any American Century Investments fund, or I Class shares of the American Century Diversified Bond Fund, in an American Century Investments account (i.e., not a financial intermediary or retirement plan account), American Century Investments may charge you a $12.50 semiannual account maintenance fee if the value of those shares is less than $10,000. We will redeem shares automatically in one of your accounts to pay the $12.50 fee. In determining your total eligible investment amount, we will include your investments in all personal accounts (including American Century Investments Brokerage accounts) registered under your Social Security number. Personal accounts include individual accounts, joint accounts, UGMA/UTMA accounts, personal trusts, Coverdell Education Savings Accounts and IRAs (including traditional, Roth, Rollover, SEP-, SARSEP- and SIMPLE-IRAs), and certain other retirement accounts. If you have only business, business retirement, employer-sponsored or American Century Investments Brokerage accounts, you are currently not subject to this fee. If you are subject to the Account Maintenance Fee, your account value could be reduced by the fee amount.
Hypothetical Example for Comparison Purposes
The table also provides information about hypothetical account values and hypothetical expenses based on the actual expense ratio of each class of your fund and an assumed rate of return of 5% per year before expenses, which is not the actual return of a fund’s share class. The hypothetical account values and expenses may not be used to estimate the actual ending account balance or expenses you paid for the period. You may use this information to compare the ongoing costs of investing in your fund and other funds. To do so, compare this 5% hypothetical example with the 5% hypothetical examples that appear in the shareholder reports of the other funds.
Please note that the expenses shown in the table are meant to highlight your ongoing costs only and do not reflect any transactional costs, such as sales charges (loads) or redemption/exchange fees. Therefore, the table is useful in comparing ongoing costs only, and will not help you determine the relative total costs of owning different funds. In addition, if these transactional costs were included, your costs would have been higher.
|
| | | | |
| Beginning
Account Value
5/1/17 | Ending
Account Value
10/31/17 | Expenses Paid
During Period(1)
5/1/17 - 10/31/17 | Annualized
Expense Ratio(1) |
Actual | | | | |
Investor Class | $1,000 | $1,116.00 | $5.23 | 0.98% |
I Class | $1,000 | $1,117.00 | $4.16 | 0.78% |
Y Class | $1,000 | $1,118.00 | $3.36 | 0.63% |
A Class | $1,000 | $1,114.60 | $6.56 | 1.23% |
C Class | $1,000 | $1,110.10 | $10.53 | 1.98% |
R Class | $1,000 | $1,113.00 | $7.88 | 1.48% |
R5 Class | $1,000 | $1,116.90 | $4.16 | 0.78% |
R6 Class | $1,000 | $1,117.60 | $3.36 | 0.63% |
Hypothetical | | | | |
Investor Class | $1,000 | $1,020.27 | $4.99 | 0.98% |
I Class | $1,000 | $1,021.27 | $3.97 | 0.78% |
Y Class | $1,000 | $1,022.03 | $3.21 | 0.63% |
A Class | $1,000 | $1,019.01 | $6.26 | 1.23% |
C Class | $1,000 | $1,015.22 | $10.06 | 1.98% |
R Class | $1,000 | $1,017.75 | $7.53 | 1.48% |
R5 Class | $1,000 | $1,021.27 | $3.97 | 0.78% |
R6 Class | $1,000 | $1,022.03 | $3.21 | 0.63% |
| |
(1) | Expenses are equal to the class's annualized expense ratio listed in the table above, multiplied by the average account value over the period, multiplied by 184, the number of days in the most recent fiscal half-year, divided by 365, to reflect the one-half year period. Annualized expense ratio reflects actual expenses, including any applicable fee waivers or expense reimbursements and excluding any acquired fund fees and expenses. |
OCTOBER 31, 2017
|
| | | | | |
| Shares | Value |
COMMON STOCKS — 99.8% | | |
Aerospace and Defense — 3.3% | | |
Boeing Co. (The) | 737,086 |
| $ | 190,153,446 |
|
Lockheed Martin Corp. | 261,376 |
| 80,545,628 |
|
| | 270,699,074 |
|
Air Freight and Logistics — 1.1% | | |
XPO Logistics, Inc.(1) | 1,293,819 |
| 89,726,348 |
|
Airlines — 1.4% | | |
Delta Air Lines, Inc. | 2,311,897 |
| 115,664,207 |
|
Banks — 0.6% | | |
Bank of America Corp. | 1,896,512 |
| 51,945,464 |
|
Beverages — 2.1% | | |
PepsiCo, Inc. | 1,587,465 |
| 174,986,267 |
|
Biotechnology — 3.9% | | |
Amgen, Inc. | 533,148 |
| 93,418,193 |
|
Biogen, Inc.(1) | 379,297 |
| 118,211,703 |
|
Gilead Sciences, Inc. | 754,026 |
| 56,521,789 |
|
Incyte Corp.(1) | 195,998 |
| 22,196,774 |
|
Regeneron Pharmaceuticals, Inc.(1) | 73,612 |
| 29,637,663 |
|
| | 319,986,122 |
|
Capital Markets — 2.0% | | |
Charles Schwab Corp. (The) | 2,016,529 |
| 90,421,160 |
|
S&P Global, Inc. | 441,433 |
| 69,071,022 |
|
| | 159,492,182 |
|
Chemicals — 0.6% | | |
LyondellBasell Industries NV, Class A | 463,511 |
| 47,987,294 |
|
Communications Equipment — 2.1% | | |
Palo Alto Networks, Inc.(1) | 1,172,664 |
| 172,616,141 |
|
Consumer Finance — 1.0% | | |
American Express Co. | 843,698 |
| 80,590,033 |
|
Electronic Equipment, Instruments and Components — 0.7% | | |
CDW Corp. | 846,048 |
| 59,223,360 |
|
Energy Equipment and Services — 0.4% | | |
Halliburton Co. | 815,504 |
| 34,854,641 |
|
Equity Real Estate Investment Trusts (REITs) — 3.1% | | |
Equity Residential | 1,820,734 |
| 122,462,569 |
|
SBA Communications Corp.(1) | 846,623 |
| 133,072,203 |
|
| | 255,534,772 |
|
Food and Staples Retailing — 1.6% | | |
Wal-Mart Stores, Inc. | 1,494,246 |
| 130,462,618 |
|
Food Products — 0.8% | | |
Hormel Foods Corp. | 2,207,913 |
| 68,798,569 |
|
|
| | | | | |
| Shares | Value |
Health Care Equipment and Supplies — 4.7% | | |
ABIOMED, Inc.(1) | 173,118 |
| $ | 33,397,925 |
|
Boston Scientific Corp.(1) | 1,656,719 |
| 46,620,073 |
|
Edwards Lifesciences Corp.(1) | 1,115,435 |
| 114,030,920 |
|
Hologic, Inc.(1) | 274,438 |
| 10,387,478 |
|
IDEXX Laboratories, Inc.(1) | 242,822 |
| 40,349,732 |
|
Intuitive Surgical, Inc.(1) | 296,021 |
| 111,114,442 |
|
Penumbra, Inc.(1) | 241,285 |
| 24,261,207 |
|
| | 380,161,777 |
|
Health Care Providers and Services — 1.4% | | |
Quest Diagnostics, Inc. | 391,701 |
| 36,733,720 |
|
WellCare Health Plans, Inc.(1) | 403,848 |
| 79,856,903 |
|
| | 116,590,623 |
|
Health Care Technology — 0.6% | | |
Cerner Corp.(1) | 767,071 |
| 51,792,634 |
|
Hotels, Restaurants and Leisure — 3.8% | | |
Chipotle Mexican Grill, Inc.(1) | 216,494 |
| 58,864,718 |
|
Darden Restaurants, Inc. | 947,663 |
| 77,964,235 |
|
Las Vegas Sands Corp. | 1,050,632 |
| 66,589,056 |
|
Royal Caribbean Cruises Ltd. | 844,423 |
| 104,514,235 |
|
| | 307,932,244 |
|
Household Products — 1.3% | | |
Church & Dwight Co., Inc. | 1,425,851 |
| 64,405,689 |
|
Procter & Gamble Co. (The) | 476,105 |
| 41,106,906 |
|
| | 105,512,595 |
|
Industrial Conglomerates — 1.3% | | |
3M Co. | 476,342 |
| 109,649,165 |
|
Internet and Direct Marketing Retail — 6.6% | | |
Amazon.com, Inc.(1) | 406,590 |
| 449,395,795 |
|
Expedia, Inc. | 730,391 |
| 91,050,542 |
|
| | 540,446,337 |
|
Internet Software and Services — 14.0% | | |
Alphabet, Inc., Class A(1) | 608,973 |
| 629,093,468 |
|
Facebook, Inc., Class A(1) | 2,517,327 |
| 453,269,900 |
|
LogMeIn, Inc. | 267,792 |
| 32,416,221 |
|
VeriSign, Inc.(1) | 286,356 |
| 30,788,997 |
|
| | 1,145,568,586 |
|
IT Services — 7.3% | | |
DXC Technology Co. | 967,404 |
| 88,536,814 |
|
Fiserv, Inc.(1) | 650,317 |
| 84,170,529 |
|
Global Payments, Inc. | 482,732 |
| 50,179,992 |
|
PayPal Holdings, Inc.(1) | 2,047,302 |
| 148,552,233 |
|
Visa, Inc., Class A | 2,053,536 |
| 225,847,889 |
|
| | 597,287,457 |
|
Life Sciences Tools and Services — 1.5% | | |
Agilent Technologies, Inc. | 1,055,947 |
| 71,836,074 |
|
Illumina, Inc.(1) | 90,945 |
| 18,661,005 |
|
|
| | | | | |
| Shares | Value |
Waters Corp.(1) | 159,208 |
| $ | 31,212,728 |
|
| | 121,709,807 |
|
Machinery — 3.3% | | |
Caterpillar, Inc. | 549,243 |
| 74,587,200 |
|
Cummins, Inc. | 483,831 |
| 85,580,027 |
|
Parker-Hannifin Corp. | 308,308 |
| 56,300,124 |
|
WABCO Holdings, Inc.(1) | 343,255 |
| 50,654,140 |
|
| | 267,121,491 |
|
Media — 1.8% | | |
Comcast Corp., Class A | 1,975,188 |
| 71,166,024 |
|
DISH Network Corp., Class A(1) | 364,578 |
| 17,696,616 |
|
Liberty Media Corp-Liberty Formula One, Class C(1) | 629,512 |
| 24,009,588 |
|
Sirius XM Holdings, Inc. | 6,389,971 |
| 34,761,442 |
|
| | 147,633,670 |
|
Multiline Retail — 3.0% | | |
Dollar Tree, Inc.(1) | 1,126,250 |
| 102,770,313 |
|
Target Corp. | 2,335,860 |
| 137,909,174 |
|
| | 240,679,487 |
|
Oil, Gas and Consumable Fuels — 0.4% | | |
Concho Resources, Inc.(1) | 226,326 |
| 30,375,212 |
|
Personal Products — 1.0% | | |
Estee Lauder Cos., Inc. (The), Class A | 694,172 |
| 77,615,371 |
|
Pharmaceuticals — 0.8% | | |
Bristol-Myers Squibb Co. | 333,627 |
| 20,571,441 |
|
Johnson & Johnson | 318,672 |
| 44,426,063 |
|
| | 64,997,504 |
|
Road and Rail — 1.5% | | |
Union Pacific Corp. | 1,018,310 |
| 117,910,115 |
|
Semiconductors and Semiconductor Equipment — 5.8% | | |
Applied Materials, Inc. | 2,919,807 |
| 164,764,709 |
|
ASML Holding NV | 774,964 |
| 139,740,503 |
|
Broadcom Ltd. | 368,466 |
| 97,241,862 |
|
Maxim Integrated Products, Inc. | 1,296,690 |
| 68,128,093 |
|
| | 469,875,167 |
|
Software — 7.9% | | |
Activision Blizzard, Inc. | 1,279,899 |
| 83,820,586 |
|
Electronic Arts, Inc.(1) | 621,079 |
| 74,281,048 |
|
Microsoft Corp. | 1,784,592 |
| 148,442,363 |
|
Oracle Corp. (New York) | 1,240,089 |
| 63,120,530 |
|
salesforce.com, Inc.(1) | 1,092,304 |
| 111,786,391 |
|
Splunk, Inc.(1) | 941,966 |
| 63,394,312 |
|
Symantec Corp. | 1,160,356 |
| 37,711,570 |
|
VMware, Inc., Class A(1) | 517,861 |
| 61,982,783 |
|
| | 644,539,583 |
|
Specialty Retail — 0.7% | | |
TJX Cos., Inc. (The) | 824,042 |
| 57,518,132 |
|
|
| | | | | |
| Shares | Value |
Technology Hardware, Storage and Peripherals — 4.0% | | |
Apple, Inc. | 1,945,695 |
| $ | 328,900,283 |
|
Textiles, Apparel and Luxury Goods — 0.5% | | |
Tapestry, Inc. | 909,383 |
| 37,239,234 |
|
Tobacco — 1.9% | | |
Altria Group, Inc. | 1,546,633 |
| 99,324,771 |
|
Philip Morris International, Inc. | 511,745 |
| 53,548,997 |
|
| | 152,873,768 |
|
TOTAL COMMON STOCKS
(Cost $5,610,868,959) | | 8,146,497,334 |
|
TEMPORARY CASH INVESTMENTS — 0.2% | | |
Repurchase Agreement, BMO Capital Markets Corp., (collateralized by various U.S. Treasury obligations, 0.375% - 1.375%, 1/15/27 - 2/15/45, valued at $10,684,073), in a joint trading account at 0.88%, dated 10/31/17, due 11/1/17 (Delivery value $10,450,844) | | 10,450,589 |
|
Repurchase Agreement, Fixed Income Clearing Corp., (collateralized by various U.S. Treasury obligations, 2.50%, 5/15/46, valued at $8,890,346), at 0.34%, dated 10/31/17, due 11/1/17 (Delivery value $8,712,082) | | 8,712,000 |
|
State Street Institutional U.S. Government Money Market Fund, Premier Class | 26,613 |
| 26,613 |
|
TOTAL TEMPORARY CASH INVESTMENTS
(Cost $19,189,202) | | 19,189,202 |
|
TOTAL INVESTMENT SECURITIES — 100.0%
(Cost $5,630,058,161) | | 8,165,686,536 |
|
OTHER ASSETS AND LIABILITIES† | | 2,039,179 |
|
TOTAL NET ASSETS — 100.0% | | $ | 8,167,725,715 |
|
|
| | | | | | | | | | |
FORWARD FOREIGN CURRENCY EXCHANGE CONTRACTS |
Currency Purchased | Currency Sold | Counterparty | Settlement Date | Unrealized Appreciation
(Depreciation) |
USD | 4,016,909 |
| EUR | 3,387,053 |
| UBS AG | 12/29/17 | $ | 58,222 |
|
USD | 4,699,589 |
| EUR | 3,982,392 |
| UBS AG | 12/29/17 | 45,087 |
|
USD | 109,784,638 |
| EUR | 92,624,160 |
| UBS AG | 12/29/17 | 1,528,268 |
|
| | | | | | $ | 1,631,577 |
|
|
| | |
NOTES TO SCHEDULE OF INVESTMENTS |
EUR | - | Euro |
USD | - | United States Dollar |
| |
† | Category is less than 0.05% of total net assets. |
See Notes to Financial Statements.
|
|
Statement of Assets and Liabilities |
|
| | | |
OCTOBER 31, 2017 | |
Assets | |
Investment securities, at value (cost of $5,630,058,161) | $ | 8,165,686,536 |
|
Receivable for investments sold | 17,043,274 |
|
Receivable for capital shares sold | 1,081,178 |
|
Unrealized appreciation on forward foreign currency exchange contracts | 1,631,577 |
|
Dividends and interest receivable | 2,156,125 |
|
| 8,187,598,690 |
|
| |
Liabilities | |
Payable for investments purchased | 487,268 |
|
Payable for capital shares redeemed | 13,011,550 |
|
Accrued management fees | 6,205,264 |
|
Distribution and service fees payable | 77,435 |
|
Accrued other expenses | 91,458 |
|
| 19,872,975 |
|
| |
Net Assets | $ | 8,167,725,715 |
|
| |
Net Assets Consist of: | |
Capital (par value and paid-in surplus) | $ | 4,860,772,492 |
|
Undistributed net investment income | 16,983,890 |
|
Undistributed net realized gain | 752,709,505 |
|
Net unrealized appreciation | 2,537,259,828 |
|
| $ | 8,167,725,715 |
|
|
| | | | | | |
| Net Assets | Shares Outstanding | Net Asset Value Per Share |
Investor Class, $0.01 Par Value |
| $5,648,964,598 |
| 161,723,554 |
| $34.93 |
I Class, $0.01 Par Value |
| $1,271,820,987 |
| 35,801,618 |
| $35.52 |
Y Class, $0.01 Par Value |
| $56,217,712 |
| 1,581,914 |
| $35.54 |
A Class, $0.01 Par Value |
| $113,348,002 |
| 3,340,039 |
| $33.94* |
C Class, $0.01 Par Value |
| $9,962,066 |
| 304,903 |
| $32.67 |
R Class, $0.01 Par Value |
| $104,367,835 |
| 3,135,391 |
| $33.29 |
R5 Class, $0.01 Par Value |
| $5,756 |
| 162 |
| $35.53 |
R6 Class, $0.01 Par Value |
| $963,038,759 |
| 27,104,598 |
| $35.53 |
*Maximum offering price $36.01 (net asset value divided by 0.9425).
See Notes to Financial Statements.
|
| | | |
YEAR ENDED OCTOBER 31, 2017 | |
Investment Income (Loss) | |
Income: | |
Dividends (net of foreign taxes withheld of $63,821) | $ | 94,278,828 |
|
Interest | 474,298 |
|
| 94,753,126 |
|
| |
Expenses: | |
Management fees | 69,251,286 |
|
Distribution and service fees: | |
A Class | 333,537 |
|
C Class | 98,724 |
|
R Class | 490,381 |
|
Directors' fees and expenses | 235,435 |
|
Other expenses | 238,741 |
|
| 70,648,104 |
|
| |
Net investment income (loss) | 24,105,022 |
|
| |
Realized and Unrealized Gain (Loss) | |
Net realized gain (loss) on: | |
Investment transactions | 809,409,062 |
|
Forward foreign currency exchange contract transactions | (2,339,995 | ) |
Futures contract transactions | 9,620,611 |
|
Foreign currency translation transactions | 37,984 |
|
| 816,727,662 |
|
| |
Change in net unrealized appreciation (depreciation) on: | |
Investments | 1,060,019,842 |
|
Forward foreign currency exchange contracts | 565,180 |
|
Futures contracts | 579,013 |
|
Translation of assets and liabilities in foreign currencies | 71 |
|
| 1,061,164,106 |
|
| |
Net realized and unrealized gain (loss) | 1,877,891,768 |
|
| |
Net Increase (Decrease) in Net Assets Resulting from Operations | $ | 1,901,996,790 |
|
See Notes to Financial Statements.
|
|
Statement of Changes in Net Assets |
|
| | | | | | |
YEARS ENDED OCTOBER 31, 2017 AND OCTOBER 31, 2016 |
Increase (Decrease) in Net Assets | October 31, 2017 | October 31, 2016 |
Operations | | |
Net investment income (loss) | $ | 24,105,022 |
| $ | 46,001,282 |
|
Net realized gain (loss) | 816,727,662 |
| 333,902,023 |
|
Change in net unrealized appreciation (depreciation) | 1,061,164,106 |
| (373,298,587 | ) |
Net increase (decrease) in net assets resulting from operations | 1,901,996,790 |
| 6,604,718 |
|
| | |
Distributions to Shareholders | | |
From net investment income: | | |
Investor Class | (30,098,944 | ) | (19,299,202 | ) |
I Class | (10,110,336 | ) | (8,735,464 | ) |
A Class | (493,592 | ) | (213,438 | ) |
R Class | (77,006 | ) | — |
|
R6 Class | (3,809,345 | ) | (2,228,096 | ) |
From net realized gains: | | |
Investor Class | (227,335,406 | ) | (362,748,942 | ) |
I Class | (56,667,053 | ) | (103,384,171 | ) |
A Class | (6,581,911 | ) | (15,137,419 | ) |
C Class | (441,655 | ) | (763,235 | ) |
R Class | (4,398,218 | ) | (7,186,670 | ) |
R6 Class | (17,899,899 | ) | (20,634,765 | ) |
Decrease in net assets from distributions | (357,913,365 | ) | (540,331,402 | ) |
| | |
Capital Share Transactions | | |
Net increase (decrease) in net assets from capital share transactions (Note 5) | (439,720,200 | ) | (828,721,980 | ) |
| | |
Net increase (decrease) in net assets | 1,104,363,225 |
| (1,362,448,664 | ) |
| | |
Net Assets | | |
Beginning of period | 7,063,362,490 |
| 8,425,811,154 |
|
End of period | $ | 8,167,725,715 |
| $ | 7,063,362,490 |
|
| | |
Undistributed net investment income | $ | 16,983,890 |
| $ | 43,514,609 |
|
See Notes to Financial Statements.
|
|
Notes to Financial Statements |
OCTOBER 31, 2017
1. Organization
American Century Mutual Funds, Inc. (the corporation) is registered under the Investment Company Act of 1940, as amended (the 1940 Act), as an open-end management investment company and is organized as a Maryland corporation. Growth Fund (the fund) is one fund in a series issued by the corporation. The fund's investment objective is to seek long-term capital growth.
The fund offers the Investor Class, I Class (formerly Institutional Class), Y Class, A Class, C Class, R Class, R5 Class and R6 Class. The A Class may incur an initial sales charge. The A Class and C Class may be subject to a contingent deferred sales charge. Sale of the Y Class and R5 Class commenced on April 10, 2017.
2. Significant Accounting Policies
The following is a summary of significant accounting policies consistently followed by the fund in preparation of its financial statements. The fund is an investment company and follows accounting and reporting guidance in accordance with accounting principles generally accepted in the United States of America. This may require management to make certain estimates and assumptions at the date of the financial statements. Actual results could differ from these estimates. Management evaluated the impact of events or transactions occurring through the date the financial statements were issued that would merit recognition or disclosure.
Investment Valuations — The fund determines the fair value of its investments and computes its net asset value per share at the close of regular trading (usually 4 p.m. Eastern time) on the New York Stock Exchange (NYSE) on each day the NYSE is open. The Board of Directors has adopted valuation policies and procedures to guide the investment advisor in the fund’s investment valuation process and to provide methodologies for the oversight of the fund’s pricing function.
Equity securities that are listed or traded on a domestic securities exchange are valued at the last reported sales price or at the official closing price as provided by the exchange. Equity securities traded on foreign securities exchanges are generally valued at the closing price of such securities on the exchange where primarily traded or at the close of the NYSE, if that is earlier. If no last sales price is reported, or if local convention or regulation so provides, the mean of the latest bid and asked prices may be used. Securities traded over-the-counter are valued at the mean of the latest bid and asked prices, the last sales price, or the official closing price. Equity securities initially expressed in local currencies are translated into U.S. dollars at the mean of the appropriate currency exchange rate at the close of the NYSE as provided by an independent pricing service.
Fixed income securities are valued at the evaluated mean as provided by independent pricing services or at the mean of the most recent bid and asked prices as provided by investment dealers. U.S. Treasury and Government Agency securities are valued using market models that consider trade data, quotations from dealers and active market makers, relevant yield curve and spread data, creditworthiness, trade data or market information on comparable securities, and other relevant security specific information.
Open-end management investment companies are valued at the reported net asset value per share. Repurchase agreements are valued at cost, which approximates fair value. Exchange-traded futures contracts are valued at the settlement price as provided by the appropriate clearing corporation. Forward foreign currency exchange contracts are valued at the mean of the appropriate forward exchange rate at the close of the NYSE as provided by an independent pricing service.
If the fund determines that the market price for an investment is not readily available or the valuation methods mentioned above do not reflect an investment’s fair value, such investment is valued as determined in good faith by the Board of Directors or its delegate, in accordance with policies and procedures adopted by the Board of Directors. In its determination of fair value, the fund may review several factors including, but not limited to, market information regarding the specific investment or comparable investments and correlation with other investment types, futures indices or general market indicators. Circumstances that may cause the fund to use these procedures to value an investment include, but are not limited to: an investment has been declared in default or is distressed; trading in a security has been suspended during the trading day or a
security is not actively trading on its principal exchange; prices received from a regular pricing source are deemed unreliable; or there is a foreign market holiday and no trading occurred.
The fund monitors for significant events occurring after the close of an investment’s primary exchange but before the fund’s net asset value per share is determined. Significant events may include, but are not limited to: corporate announcements and transactions; governmental action and political unrest that could impact a specific investment or an investment sector; or armed conflicts, natural disasters and similar events that could affect investments in a specific country or region. The fund also monitors for significant fluctuations between domestic and foreign markets, as evidenced by the U.S. market or such other indicators that the Board of Directors, or its delegate, deems appropriate. If significant fluctuations in foreign markets are identified, the fund may apply a model-derived factor to the closing price of equity securities traded on foreign securities exchanges. The factor is based on observable market data as provided by an independent pricing service.
Security Transactions — Security transactions are accounted for as of the trade date. Net realized gains and losses are determined on the identified cost basis, which is also used for federal income tax purposes.
Investment Income — Dividend income less foreign taxes withheld, if any, is recorded as of the ex-dividend date. Distributions received on securities that represent a return of capital or long-term capital gain are recorded as a reduction of cost of investments and/or as a realized gain. The fund may estimate the components of distributions received that may be considered nontaxable distributions or long-term capital gain distributions for income tax purposes. Interest income is recorded on the accrual basis and includes accretion of discounts and amortization of premiums.
Foreign Currency Translations — All assets and liabilities initially expressed in foreign currencies are translated into U.S. dollars at prevailing exchange rates at period end. The fund may enter into spot foreign currency exchange contracts to facilitate transactions denominated in a foreign currency. Purchases and sales of investment securities, dividend and interest income, spot foreign currency exchange contracts, and expenses are translated at the rates of exchange prevailing on the respective dates of such transactions. Net realized and unrealized foreign currency exchange gains or losses related to investment securities are a component of net realized gain (loss) on investment transactions and change in net unrealized appreciation (depreciation) on investments, respectively.
Repurchase Agreements — The fund may enter into repurchase agreements with institutions that American Century Investment Management, Inc. (ACIM) (the investment advisor) has determined are creditworthy pursuant to criteria adopted by the Board of Directors. The fund requires that the collateral, represented by securities, received in a repurchase transaction be transferred to the custodian in a manner sufficient to enable the fund to obtain those securities in the event of a default under the repurchase agreement. ACIM monitors, on a daily basis, the securities transferred to ensure the value, including accrued interest, of the securities under each repurchase agreement is equal to or greater than amounts owed to the fund under each repurchase agreement.
Joint Trading Account — Pursuant to an Exemptive Order issued by the Securities and Exchange Commission, the fund, along with certain other funds in the American Century Investments family of funds, may transfer uninvested cash balances into a joint trading account. These balances are invested in one or more repurchase agreements that are collateralized by U.S. Treasury or Agency obligations.
Segregated Assets — In accordance with the 1940 Act, the fund segregates assets on its books and records to cover futures contracts. ACIM monitors, on a daily basis, the securities segregated to ensure the fund designates a sufficient amount of liquid assets, marked-to-market daily. The fund may also receive assets or be required to pledge assets at the custodian bank or with a broker for margin requirements on futures contracts.
Income Tax Status — It is the fund’s policy to distribute substantially all net investment income and net realized gains to shareholders and to otherwise qualify as a regulated investment company under provisions of the Internal Revenue Code. Accordingly, no provision has been made for income taxes. The fund files U.S. federal, state, local and non-U.S. tax returns as applicable. The fund's tax returns are subject to examination by the relevant taxing authority until expiration of the applicable statute of limitations, which is generally three years from the date of filing but can be longer in certain jurisdictions. At this time, management believes there are no uncertain tax positions which, based on their technical merit, would not be sustained upon examination and for which it is reasonably possible that the total amounts of unrecognized tax benefits will significantly change in the next twelve months.
Multiple Class — All shares of the fund represent an equal pro rata interest in the net assets of the class to which such shares belong, and have identical voting, dividend, liquidation and other rights and the same terms and conditions, except for class specific expenses and exclusive rights to vote on matters affecting only individual classes. Income, non-class specific expenses, and realized and unrealized capital gains and losses of the fund are allocated to each class of shares based on their relative net assets.
Distributions to Shareholders — Distributions from net investment income and net realized gains, if any, are generally declared and paid annually. The fund may elect to treat a portion of its payment to a redeeming shareholder, which represents the pro rata share of undistributed net investment income and net realized gains, as a distribution for federal income tax purposes (tax equalization).
Indemnifications — Under the corporation’s organizational documents, its officers and directors are indemnified against certain liabilities arising out of the performance of their duties to the fund. In addition, in the normal course of business, the fund enters into contracts that provide general indemnifications. The maximum exposure under these arrangements is unknown as this would involve future claims that may be made against a fund. The risk of material loss from such claims is considered by management to be remote.
3. Fees and Transactions with Related Parties
Certain officers and directors of the corporation are also officers and/or directors of American Century Companies, Inc. (ACC). The corporation’s investment advisor, ACIM, the corporation's distributor, American Century Investment Services, Inc. (ACIS), and the corporation’s transfer agent, American Century Services, LLC, are wholly owned, directly or indirectly, by ACC. Various funds issued by American Century Asset Allocation Portfolios, Inc. own, in aggregate, 5% of the shares of the fund.
Management Fees — The corporation has entered into a management agreement with ACIM, under which ACIM provides the fund with investment advisory and management services in exchange for a single, unified management fee (the fee) per class. The agreement provides that all expenses of managing and operating the fund, except distribution and service fees, brokerage expenses, taxes, interest, fees and expenses of the independent directors (including legal counsel fees), and extraordinary expenses, will be paid by ACIM. The fee is computed and accrued daily based on each class's daily net assets and paid monthly in arrears. The difference in the fee among the classes is a result of their separate arrangements for non-Rule 12b-1 shareholder services. It is not the result of any difference in advisory or custodial fees or other expenses related to the management of the fund’s assets, which do not vary by class. The rate of the fee is determined by applying a fee rate calculation formula. This formula takes into account the fund’s assets as well as certain assets, if any, of other clients of the investment advisor outside the American Century Investments family of funds (such as subadvised funds and separate accounts) that use very similar investment teams and strategies (strategy assets). The strategy assets of the fund also include the assets of NT Growth Fund, one fund in a series issued by the corporation.
The management fee schedule range and the effective annual management fee for each class for the period ended October 31, 2017 are as follows:
|
| | |
| Management Fee Schedule Range | Effective Annual Management Fee |
Investor Class | 0.800% to 0.990% | 0.97% |
I Class | 0.600% to 0.790% | 0.77% |
Y Class | 0.450% to 0.640% | 0.62% |
A Class | 0.800% to 0.990% | 0.97% |
C Class | 0.800% to 0.990% | 0.97% |
R Class | 0.800% to 0.990% | 0.97% |
R5 Class | 0.600% to 0.790% | 0.77% |
R6 Class | 0.450% to 0.640% | 0.62% |
Distribution and Service Fees — The Board of Directors has adopted a separate Master Distribution and Individual Shareholder Services Plan for each of the A Class, C Class and R Class (collectively the plans), pursuant to Rule 12b-1 of the 1940 Act. The plans provide that the A Class will pay ACIS an annual distribution and service fee of 0.25%. The plans provide that the C Class will pay ACIS an annual distribution and service fee of 1.00%, of which 0.25% is paid for individual shareholder services and 0.75% is paid for distribution services. The plans provide that the R Class will pay ACIS an annual distribution and service fee of 0.50%. The fees are computed and accrued daily based on each class’s daily net assets and paid monthly in arrears. The fees are used to pay financial intermediaries for distribution and individual shareholder services. Fees incurred under the plans during the period ended October 31, 2017 are detailed in the Statement of Operations.
Directors' Fees and Expenses — The Board of Directors is responsible for overseeing the investment advisor’s management and operations of the fund. The directors receive detailed information about the fund and its investment advisor regularly throughout the year, and meet at least quarterly with management of the investment advisor to review reports about fund operations. The fund’s officers do not receive compensation from the fund.
Interfund Transactions — The fund may enter into security transactions with other American Century Investments funds and other client accounts of the investment advisor, in accordance with the 1940 Act rules and procedures adopted by the Board of Directors. The rules and procedures require, among other things, that these transactions be effected at the independent current market price of the security. During the period, the interfund purchases and sales were $35,555,089 and $23,686,632, respectively. The effect of interfund transactions on the Statement of Operations was $5,232,849 in net realized gain (loss) on investment transactions.
4. Investment Transactions
Purchases and sales of investment securities, excluding short-term investments, for the period ended October 31, 2017 were $3,604,852,234 and $4,316,630,150, respectively.
5. Capital Share Transactions
Transactions in shares of the fund were as follows:
|
| | | | | | | | | | |
| Year ended October 31, 2017(1) | Year ended
October 31, 2016 |
| Shares | Amount | Shares | Amount |
Investor Class/Shares Authorized | 1,500,000,000 |
| | 1,330,000,000 |
| |
Sold | 11,403,461 |
| $ | 358,006,508 |
| 8,647,841 |
| $ | 243,040,048 |
|
Issued in reinvestment of distributions | 8,815,428 |
| 249,564,765 |
| 13,248,696 |
| 371,360,933 |
|
Redeemed | (37,349,836 | ) | (1,171,385,793 | ) | (37,793,076 | ) | (1,060,416,668 | ) |
| (17,130,947 | ) | (563,814,520 | ) | (15,896,539 | ) | (446,015,687 | ) |
I Class/Shares Authorized | 400,000,000 |
| | 420,000,000 |
| |
Sold | 8,934,676 |
| 287,954,459 |
| 6,303,266 |
| 179,701,920 |
|
Issued in reinvestment of distributions | 2,309,948 |
| 66,411,012 |
| 3,922,377 |
| 111,552,414 |
|
Redeemed | (20,028,587 | ) | (613,188,444 | ) | (21,172,647 | ) | (608,989,395 | ) |
| (8,783,963 | ) | (258,822,973 | ) | (10,947,004 | ) | (317,735,061 | ) |
Y Class/Shares Authorized | 50,000,000 |
| | N/A | |
Sold | 1,689,777 |
| 56,076,451 |
| | |
Redeemed | (107,863 | ) | (3,653,822 | ) | | |
| 1,581,914 |
| 52,422,629 |
| | |
A Class/Shares Authorized | 120,000,000 |
| | 200,000,000 |
| |
Sold | 708,516 |
| 21,112,032 |
| 933,876 |
| 25,777,376 |
|
Issued in reinvestment of distributions | 225,286 |
| 6,211,139 |
| 514,611 |
| 14,064,308 |
|
Redeemed | (2,874,696 | ) | (87,213,286 | ) | (5,907,288 | ) | (167,530,067 | ) |
| (1,940,894 | ) | (59,890,115 | ) | (4,458,801 | ) | (127,688,383 | ) |
C Class/Shares Authorized | 20,000,000 |
| | 15,000,000 |
| |
Sold | 56,427 |
| 1,636,645 |
| 51,407 |
| 1,381,134 |
|
Issued in reinvestment of distributions | 12,938 |
| 345,575 |
| 21,933 |
| 584,089 |
|
Redeemed | (112,183 | ) | (3,314,908 | ) | (128,450 | ) | (3,356,084 | ) |
| (42,818 | ) | (1,332,688 | ) | (55,110 | ) | (1,390,861 | ) |
R Class/Shares Authorized | 30,000,000 |
| | 30,000,000 |
| |
Sold | 359,182 |
| 10,783,702 |
| 483,186 |
| 12,840,380 |
|
Issued in reinvestment of distributions | 162,884 |
| 4,414,145 |
| 262,174 |
| 7,047,238 |
|
Redeemed | (912,178 | ) | (26,648,938 | ) | (1,131,715 | ) | (30,786,463 | ) |
| (390,112 | ) | (11,451,091 | ) | (386,355 | ) | (10,898,845 | ) |
R5 Class/Shares Authorized | 50,000,000 |
| | N/A | |
Sold | 162 |
| 5,000 |
| | |
R6 Class/Shares Authorized | 300,000,000 |
| | 95,000,000 |
| |
Sold | 17,057,639 |
| 512,455,239 |
| 4,427,156 |
| 126,197,799 |
|
Issued in reinvestment of distributions | 756,156 |
| 21,709,244 |
| 804,747 |
| 22,862,861 |
|
Redeemed | (4,113,055 | ) | (131,000,925 | ) | (2,567,545 | ) | (74,053,803 | ) |
| 13,700,740 |
| 403,163,558 |
| 2,664,358 |
| 75,006,857 |
|
Net increase (decrease) | (13,005,918 | ) | $ | (439,720,200 | ) | (29,079,451 | ) | $ | (828,721,980 | ) |
| |
(1) | April 10, 2017 (commencement of sale) through October 31, 2017 for the Y Class and R5 Class. |
6. Fair Value Measurements
The fund’s investments valuation process is based on several considerations and may use multiple inputs to determine the fair value of the investments held by the fund. In conformity with accounting principles generally accepted in the United States of America, the inputs used to determine a valuation are classified into three broad levels.
| |
• | Level 1 valuation inputs consist of unadjusted quoted prices in an active market for identical investments. |
| |
• | Level 2 valuation inputs consist of direct or indirect observable market data (including quoted prices for comparable investments, evaluations of subsequent market events, interest rates, prepayment speeds, credit risk, etc.). These inputs also consist of quoted prices for identical investments initially expressed in local currencies that are adjusted through translation into U.S. dollars. |
| |
• | Level 3 valuation inputs consist of unobservable data (including a fund’s own assumptions). |
The level classification is based on the lowest level input that is significant to the fair valuation measurement. The valuation inputs are not necessarily an indication of the risks associated with investing in these securities or other financial instruments. There were no significant transfers between levels during the period.
The following is a summary of the level classifications as of period end. The Schedule of Investments provides additional information on the fund’s portfolio holdings.
|
| | | | | | | | |
| Level 1 | Level 2 | Level 3 |
Assets | | | |
Investment Securities | | | |
Common Stocks | $ | 8,006,756,831 |
| $ | 139,740,503 |
| — |
|
Temporary Cash Investments | 26,613 |
| 19,162,589 |
| — |
|
| $ | 8,006,783,444 |
| $ | 158,903,092 |
| — |
|
Other Financial Instruments | | | |
Forward Foreign Currency Exchange Contracts | — |
| $ | 1,631,577 |
| — |
|
7. Derivative Instruments
Equity Price Risk — The fund is subject to equity price risk in the normal course of pursuing its investment objectives. A fund may enter into futures contracts based on an equity index in order to manage its exposure to changes in market conditions. A fund may purchase futures contracts to gain exposure to increases in market value or sell futures contracts to protect against a decline in market value. Upon entering into a futures contract, a fund is required to deposit either cash or securities in an amount equal to a certain percentage of the contract value (initial margin). Subsequent payments (variation margin) are made or received daily, in cash, by a fund. The variation margin is equal to the daily change in the contract value and is recorded as unrealized gains and losses. A fund recognizes a realized gain or loss when the contract is closed or expires. Net realized and unrealized gains or losses occurring during the holding period of futures contracts are a component of net realized gain (loss) on futures contract transactions and change in net unrealized appreciation (depreciation) on futures contracts, respectively. One of the risks of entering into futures contracts is the possibility that the change in value of the contract may not correlate with the changes in value of the underlying securities. The fund's average notional exposure to these equity price risk derivative instruments held during the period was $33,341 futures contracts purchased.
Foreign Currency Risk — The fund is subject to foreign currency exchange rate risk in the normal course of pursuing its investment objectives. The value of foreign investments held by a fund may be significantly affected by changes in foreign currency exchange rates. The dollar value of a foreign security generally decreases when the value of the dollar rises against the foreign currency in which the security is denominated and tends to increase when the value of the dollar declines against such foreign currency. A fund may enter into forward foreign currency exchange contracts to reduce a fund's exposure to foreign currency exchange rate fluctuations. The net U.S. dollar value of foreign currency underlying all contractual commitments held by a fund and the resulting unrealized appreciation or depreciation are determined daily. Realized gain or loss is recorded upon the termination of the contract. Net realized and unrealized gains or losses occurring during the holding period of forward foreign currency exchange contracts are a component of net realized gain (loss) on forward foreign currency exchange contract transactions and change in net unrealized appreciation (depreciation) on forward foreign currency exchange contracts, respectively. A fund bears the risk of an
unfavorable change in the foreign currency exchange rate underlying the forward contract. Additionally, losses, up to the fair value, may arise if the counterparties do not perform under the contract terms. The fund's average U.S. dollar exposure to foreign currency risk derivative instruments held during the period was $73,498,377.
Value of Derivative Instruments as of October 31, 2017
|
| | | | | | | |
| Asset Derivatives | Liability Derivatives |
Type of Risk Exposure | Location on Statement of Assets and Liabilities | Value | Location on Statement of Assets and Liabilities | Value |
Foreign Currency Risk | Unrealized appreciation on forward foreign currency exchange contracts | $ | 1,631,577 |
| Unrealized depreciation on forward foreign currency exchange contracts | — |
|
Effect of Derivative Instruments on the Statement of Operations for the Year Ended October 31, 2017
|
| | | | | | | | |
| Net Realized Gain (Loss) | Change in Net Unrealized Appreciation (Depreciation) |
Type of Risk Exposure | Location on Statement of Operations | Value | Location on Statement of Operations | Value |
Equity Price Risk | Net realized gain (loss) on futures contract transactions | $ | 9,620,611 |
| Change in net unrealized appreciation (depreciation) on futures contracts | $ | 579,013 |
|
Foreign Currency Risk | Net realized gain (loss) on forward foreign currency exchange contract transactions | (2,339,995 | ) | Change in net unrealized appreciation (depreciation) on forward foreign currency exchange contracts | 565,180 |
|
| | $ | 7,280,616 |
| | $ | 1,144,193 |
|
8. Federal Tax Information
The tax character of distributions paid during the years ended October 31, 2017 and October 31, 2016 were as follows:
|
| | | | | | |
| 2017 | 2016 |
Distributions Paid From | | |
Ordinary income | $ | 44,589,223 |
| $ | 172,892,491 |
|
Long-term capital gains | $ | 313,324,142 |
| $ | 367,438,911 |
|
The book-basis character of distributions made during the year from net investment income or net realized gains may differ from their ultimate characterization for federal income tax purposes. These differences reflect the differing character of certain income items and net realized gains and losses for financial statement and tax purposes, and may result in reclassification among certain capital accounts on the financial statements.
As of period end, the federal tax cost of investments and the components of distributable earnings on a tax-basis were as follows:
|
| | | |
Federal tax cost of investments | $ | 5,632,696,992 |
|
Gross tax appreciation of investments | $ | 2,573,813,624 |
|
Gross tax depreciation of investments | (40,824,080 | ) |
Net tax appreciation (depreciation) of investments | 2,532,989,544 |
|
Net tax appreciation (depreciation) on derivatives and translation of assets and liabilities in foreign currencies | (124 | ) |
Net tax appreciation (depreciation) | $ | 2,532,989,420 |
|
Undistributed ordinary income | $ | 166,767,847 |
|
Accumulated long-term gains | $ | 607,195,956 |
|
The difference between book-basis and tax-basis unrealized appreciation (depreciation) is attributable primarily to the tax deferral of losses on wash sales.
|
| | | | | | | | | | | | | | | |
For a Share Outstanding Throughout the Years Ended October 31 (except as noted) | |
Per-Share Data | | | | | | | | | Ratios and Supplemental Data |
| | Income From Investment Operations: | Distributions From: | | | Ratio to Average Net Assets of: | |
| Net Asset
Value,
Beginning
of Period | Net
Investment
Income
(Loss)(1) | Net
Realized
and
Unrealized
Gain (Loss) | Total From
Investment
Operations | Net
Investment
Income | Net
Realized
Gains | Total
Distributions | Net Asset
Value,
End
of Period | Total
Return(2) | Operating
Expenses | Net
Investment
Income
(Loss) | Portfolio
Turnover
Rate | Net
Assets,
End of
Period
(in thousands) |
Investor Class | | | | | | | | | | | | |
2017 | $28.64 | 0.08 | 7.67 | 7.75 | (0.17) | (1.29) | (1.46) | $34.93 | 28.26% | 0.98% | 0.26% | 48% |
| $5,648,965 |
|
2016 | $30.57 | 0.16 | (0.08) | 0.08 | (0.10) | (1.91) | (2.01) | $28.64 | 0.40% | 0.98% | 0.57% | 36% |
| $5,122,550 |
|
2015 | $35.39 | 0.10 | 2.34 | 2.44 | (0.10) | (7.16) | (7.26) | $30.57 | 9.07% | 0.97% | 0.35% | 49% |
| $5,952,798 |
|
2014 | $33.10 | 0.11 | 4.22 | 4.33 | (0.12) | (1.92) | (2.04) | $35.39 | 13.84% | 0.97% | 0.32% | 103% |
| $6,021,115 |
|
2013 | $27.48 | 0.21 | 6.53 | 6.74 | (0.25) | (0.87) | (1.12) | $33.10 | 25.42% | 0.97% | 0.71% | 67% |
| $6,327,674 |
|
I Class(3) | | | | | | | | | | | | |
2017 | $29.11 | 0.15 | 7.78 | 7.93 | (0.23) | (1.29) | (1.52) | $35.52 | 28.48% | 0.78% | 0.46% | 48% |
| $1,271,821 |
|
2016 | $31.03 | 0.23 | (0.08) | 0.15 | (0.16) | (1.91) | (2.07) | $29.11 | 0.64% | 0.78% | 0.77% | 36% |
| $1,297,685 |
|
2015 | $35.83 | 0.17 | 2.36 | 2.53 | (0.17) | (7.16) | (7.33) | $31.03 | 9.30% | 0.77% | 0.55% | 49% |
| $1,723,219 |
|
2014 | $33.49 | 0.18 | 4.27 | 4.45 | (0.19) | (1.92) | (2.11) | $35.83 | 14.03% | 0.77% | 0.52% | 103% |
| $2,482,606 |
|
2013 | $27.75 | 0.27 | 6.60 | 6.87 | (0.26) | (0.87) | (1.13) | $33.49 | 25.68% | 0.77% | 0.91% | 67% |
| $2,842,185 |
|
Y Class | | | | | | | | | | | | |
2017(4) | $30.93 | 0.08 | 4.53 | 4.61 | — | — | — | $35.54 | 14.90% | 0.63%(5) | 0.43%(5) | 48%(6) |
| $56,218 |
|
|
| | | | | | | | | | | | | | | |
For a Share Outstanding Throughout the Years Ended October 31 (except as noted) | |
Per-Share Data | | | | | | | | | Ratios and Supplemental Data |
| | Income From Investment Operations: | Distributions From: | | | Ratio to Average Net Assets of: | |
| Net Asset
Value,
Beginning
of Period | Net
Investment
Income
(Loss)(1) | Net
Realized
and
Unrealized
Gain (Loss) | Total From
Investment
Operations | Net
Investment
Income | Net
Realized
Gains | Total
Distributions | Net Asset
Value,
End
of Period | Total
Return(2) | Operating
Expenses | Net
Investment
Income
(Loss) | Portfolio
Turnover
Rate | Net
Assets,
End of
Period
(in thousands) |
A Class | | | | | | | | | | | | | |
2017 | $27.86 | 0.01 | 7.46 | 7.47 | (0.10) | (1.29) | (1.39) | $33.94 | 27.95% | 1.23% | 0.01% | 48% |
| $113,348 |
|
2016 | $29.78 | 0.10 | (0.08) | 0.02 | (0.03) | (1.91) | (1.94) | $27.86 | 0.18% | 1.23% | 0.32% | 36% |
| $147,133 |
|
2015 | $34.65 | 0.04 | 2.26 | 2.30 | (0.01) | (7.16) | (7.17) | $29.78 | 8.78% | 1.22% | 0.10% | 49% |
| $290,077 |
|
2014 | $32.45 | 0.03 | 4.13 | 4.16 | (0.04) | (1.92) | (1.96) | $34.65 | 13.53% | 1.22% | 0.07% | 103% |
| $718,640 |
|
2013 | $27.00 | 0.13 | 6.42 | 6.55 | (0.23) | (0.87) | (1.10) | $32.45 | 25.14% | 1.22% | 0.46% | 67% |
| $817,166 |
|
C Class | | | | | | | | | | | | | |
2017 | $26.97 | (0.21) | 7.20 | 6.99 | — | (1.29) | (1.29) | $32.67 | 26.99% | 1.98% | (0.74)% | 48% |
| $9,962 |
|
2016 | $29.08 | (0.11) | (0.09) | (0.20) | — | (1.91) | (1.91) | $26.97 | (0.58)% | 1.98% | (0.43)% | 36% |
| $9,379 |
|
2015 | $34.20 | (0.19) | 2.23 | 2.04 | — | (7.16) | (7.16) | $29.08 | 7.95% | 1.97% | (0.65)% | 49% |
| $11,713 |
|
2014 | $32.24 | (0.22) | 4.10 | 3.88 | — | (1.92) | (1.92) | $34.20 | 12.71% | 1.97% | (0.68)% | 103% |
| $13,413 |
|
2013 | $26.98 | (0.08) | 6.38 | 6.30 | (0.17) | (0.87) | (1.04) | $32.24 | 24.16% | 1.97% | (0.29)% | 67% |
| $14,489 |
|
R Class | | | | | | | | | | | | | |
2017 | $27.35 | (0.07) | 7.32 | 7.25 | (0.02) | (1.29) | (1.31) | $33.29 | 27.62% | 1.48% | (0.24)% | 48% |
| $104,368 |
|
2016 | $29.31 | 0.02 | (0.07) | (0.05) | — | (1.91) | (1.91) | $27.35 | (0.06)% | 1.48% | 0.07% | 36% |
| $96,415 |
|
2015 | $34.28 | (0.04) | 2.23 | 2.19 | — | (7.16) | (7.16) | $29.31 | 8.50% | 1.47% | (0.15)% | 49% |
| $114,672 |
|
2014 | $32.16 | (0.06) | 4.10 | 4.04 | — | (1.92) | (1.92) | $34.28 | 13.26% | 1.47% | (0.18)% | 103% |
| $142,845 |
|
2013 | $26.82 | 0.06 | 6.36 | 6.42 | (0.21) | (0.87) | (1.08) | $32.16 | 24.80% | 1.47% | 0.21% | 67% |
| $145,337 |
|
|
| | | | | | | | | | | | | | | |
For a Share Outstanding Throughout the Years Ended October 31 (except as noted) | |
Per-Share Data | | | | | | | | | Ratios and Supplemental Data |
| | Income From Investment Operations: | Distributions From: | | | Ratio to Average Net Assets of: | |
| Net Asset
Value,
Beginning
of Period | Net
Investment
Income
(Loss)(1) | Net
Realized
and
Unrealized
Gain (Loss) | Total From
Investment
Operations | Net
Investment
Income | Net
Realized
Gains | Total
Distributions | Net Asset
Value,
End
of Period | Total
Return(2) | Operating
Expenses | Net
Investment
Income
(Loss) | Portfolio
Turnover
Rate | Net
Assets,
End of
Period
(in thousands) |
R5 Class | | | | | | | | | | | | | |
2017(4) | $30.95 | 0.05 | 4.53 | 4.58 | — | — | — | $35.53 | 14.80% | 0.78%(5) | 0.27%(5) | 48%(6) |
| $6 |
|
R6 Class | | | | | | | | | | | | | |
2017 | $29.11 | 0.18 | 7.80 | 7.98 | (0.27) | (1.29) | (1.56) | $35.53 | 28.71% | 0.63% | 0.61% | 48% |
| $963,039 |
|
2016 | $31.04 | 0.26 | (0.07) | 0.19 | (0.21) | (1.91) | (2.12) | $29.11 | 0.76% | 0.63% | 0.92% | 36% |
| $390,201 |
|
2015 | $35.84 | 0.23 | 2.35 | 2.58 | (0.22) | (7.16) | (7.38) | $31.04 | 9.46% | 0.62% | 0.70% | 49% |
| $333,333 |
|
2014 | $33.51 | 0.18 | 4.31 | 4.49 | (0.24) | (1.92) | (2.16) | $35.84 | 14.20% | 0.62% | 0.67% | 103% |
| $566,919 |
|
2013(7) | $31.22 | 0.05 | 2.24 | 2.29 | — | — | — | $33.51 | 7.34% | 0.62%(5) | 0.64%(5) | 67%(8) |
| $15,219 |
|
|
| | | | |
Notes to Financial Highlights | | |
| |
(1) | Computed using average shares outstanding throughout the period. |
| |
(2) | Total returns are calculated based on the net asset value of the last business day and do not reflect applicable sales charges, if any. Total returns for periods less than one year are not annualized. |
| |
(3) | Prior to April 10, 2017, the I Class was referred to as the Institutional Class. |
| |
(4) | April 10, 2017 (commencement of sale) through October 31, 2017. |
| |
(6) | Portfolio turnover is calculated at the fund level. Percentage indicated was calculated for the year ended October 31, 2017. |
| |
(7) | July 26, 2013 (commencement of sale) through October 31, 2013. |
| |
(8) | Portfolio turnover is calculated at the fund level. Percentage indicated was calculated for the year ended October 31, 2013. |
See Notes to Financial Statements.
|
|
Report of Independent Registered Public Accounting Firm |
To the Board of Directors and Shareholders of American Century Mutual Funds, Inc.:
We have audited the accompanying statement of assets and liabilities, including the schedule of investments, of Growth Fund (the “Fund”), one of the funds constituting American Century Mutual Funds, Inc., as of October 31, 2017, and the related statement of operations for the year then ended, the statements of changes in net assets for each of the two years in the period then ended, and the financial highlights for each of the periods presented. These financial statements and financial highlights are the responsibility of the Fund’s management. Our responsibility is to express an opinion on these financial statements and financial highlights based on our audits.
We conducted our audits in accordance with the standards of the Public Company Accounting Oversight Board (United States). Those standards require that we plan and perform the audit to obtain reasonable assurance about whether the financial statements and financial highlights are free of material misstatement. The Fund is not required to have, nor were we engaged to perform, an audit of its internal control over financial reporting. Our audits included consideration of internal control over financial reporting as a basis for designing audit procedures that are appropriate in the circumstances, but not for the purpose of expressing an opinion on the effectiveness of the Fund’s internal control over financial reporting. Accordingly, we express no such opinion. An audit also includes examining, on a test basis, evidence supporting the amounts and disclosures in the financial statements, assessing the accounting principles used and significant estimates made by management, as well as evaluating the overall financial statement presentation. Our procedures included confirmation of securities owned as of October 31, 2017, by correspondence with the custodian and brokers; when replies were not received from brokers, we performed other auditing procedures. We believe that our audits provide a reasonable basis for our opinion.
In our opinion, the financial statements and financial highlights referred to above present fairly, in all material respects, the financial position of Growth Fund of American Century Mutual Funds, Inc. as of October 31, 2017, the results of its operations for the year then ended, the changes in its net assets for each of the two years in the period then ended, and the financial highlights for each of the periods presented, in conformity with accounting principles generally accepted in the United States of America.
DELOITTE & TOUCHE LLP
Kansas City, Missouri
December 15, 2017
The Board of Directors
The individuals listed below serve as directors of the funds. Each director will continue to serve in this capacity until death, retirement, resignation or removal from office. The board has adopted a mandatory retirement age for directors who are not “interested persons,” as that term is defined in the Investment Company Act (independent directors). Independent directors shall retire by December 31 of the year in which they reach their 75th birthday.
Mr. Thomas is an “interested person” because he currently serves as President and Chief Executive Officer of American Century Companies, Inc. (ACC), the parent company of American Century Investment Management, Inc. (ACIM or the advisor). The other directors (more than three-fourths of the total number) are independent. They are not employees, directors or officers of, and have no financial interest in, ACC or any of its wholly owned, direct or indirect, subsidiaries, including ACIM, American Century Investment Services, Inc. (ACIS) and American Century Services, LLC (ACS), and they do not have any other affiliations, positions or relationships that would cause them to be considered “interested persons” under the Investment Company Act. The directors serve in this capacity for seven (in the case of Mr. Thomas, 15) registered investment companies in the American Century Investments family of funds.
The following table presents additional information about the directors. The mailing address for each director is 4500 Main Street, Kansas City, Missouri 64111.
|
| | | | | |
Name
(Year of Birth) | Position(s) Held with Funds | Length of Time Served | Principal Occupation(s) During Past 5 Years | Number of American Century Portfolios Overseen by Director | Other Directorships Held During Past 5 Years |
Independent Directors |
|
|
Thomas W. Bunn (1953) | Director | Since 2017 | Retired | 69 | SquareTwo Financial; Barings (formerly Babson Capital Funds Trust) (2013 to 2016) |
Barry Fink
(1955) | Director | Since 2012 (independent since 2016) | Retired; Executive Vice President, ACC (2007 to 2013); President, ACS (2007 to 2013); Chief Operating Officer, ACC (2007 to 2012) | 69 | None |
Andrea C. Hall
(1945) | Director | Since 1997 | Retired | 69 | None |
Jan M. Lewis
(1957) | Director | Since 2011 | Retired; President and Chief Executive Officer, Catholic Charities of Northeast Kansas (human services organization) (2006 to 2013) | 69 | None |
James A. Olson
(1942) | Director and Chairman of the Board | Since 2007 (Chairman since 2014) | Member, Plaza Belmont LLC (private equity fund manager) (1999 to present) | 69 | Saia, Inc. (2002 to 2012) and EPR Properties (2003 to 2013) |
|
| | | | | |
Name
(Year of Birth) | Position(s) Held with Funds | Length of Time Served | Principal Occupation(s) During Past 5 Years | Number of American Century Portfolios Overseen by Director | Other Directorships Held During Past 5 Years |
Independent Directors |
|
|
M. Jeannine Strandjord
(1945) | Director | Since 1994 | Retired | 69 | Euronet Worldwide Inc.; MGP Ingredients, Inc.; and DST Systems Inc. (1996 to 2012) |
John R. Whitten
(1946) | Director | Since 2008 | Retired | 69 | Rudolph Technologies, Inc. |
Stephen E. Yates
(1948) | Director | Since 2012 | Retired | 69 | None |
Interested Director |
|
|
Jonathan S. Thomas
(1963) | Director and President | Since 2007 | President and Chief Executive Officer, ACC (2007 to present). Also serves as Chief Executive Officer, ACS; Executive Vice President, ACIM; Director, ACC, ACIM and other ACC subsidiaries | 114 | BioMed Valley Discoveries, Inc. |
The Statement of Additional Information has additional information about the fund's directors and is available without charge, upon request, by calling 1-800-345-2021.
Officers
The following table presents certain information about the executive officers of the funds. Each officer serves as an officer for each of the 15 investment companies in the American Century family of funds, unless otherwise noted. No officer is compensated for his or her service as an officer of the funds. The listed officers are interested persons of the funds and are appointed or re-appointed on an annual basis. The mailing address for each officer listed below is 4500 Main Street, Kansas City, Missouri 64111.
|
| | |
Name
(Year of Birth) | Offices with the Funds | Principal Occupation(s) During the Past Five Years |
Jonathan S. Thomas
(1963) | Director and President since 2007 | President and Chief Executive Officer, ACC (2007 to present). Also serves as Chief Executive Officer, ACS; Executive Vice President, ACIM; Director, ACC, ACIM and other ACC subsidiaries |
Amy D. Shelton
(1964) | Chief Compliance Officer and Vice President since 2014 | Chief Compliance Officer, American Century funds, (2014 to present); Chief Compliance Officer, ACIM (2014 to present); Chief Compliance Officer, ACIS (2009 to present); Vice President, Client Interactions and Marketing, ACIS (2013 to 2014); Director, Client Interactions and Marketing, ACIS (2007 to 2013). Also serves as Vice President, ACIS |
Charles A. Etherington
(1957) | General Counsel since 2007 and Senior Vice President since 2006 | Attorney, ACC (1994 to present); Vice President, ACC (2005 to present); General Counsel, ACC (2007 to present). Also serves as General Counsel, ACIM, ACS, ACIS and other ACC subsidiaries; and Senior Vice President, ACIM and ACS |
C. Jean Wade
(1964) | Vice President,Treasurer and Chief Financial Officer since 2012 | Vice President, ACS (2000 to present) |
Robert J. Leach
(1966) | Vice President since 2006 and Assistant Treasurer since 2012 | Vice President, ACS (2000 to present) |
David H. Reinmiller
(1963) | Vice President since 2000 | Attorney, ACC (1994 to present); Associate General Counsel, ACC (2001 to present). Also serves as Vice President, ACIM and ACS |
Ward D. Stauffer
(1960) | Secretary since 2005 | Attorney, ACC (2003 to present) |
|
|
Approval of Management Agreement |
At a meeting held on June 29, 2017, the Fund’s Board of Directors (the "Board") unanimously approved the renewal of the management agreement pursuant to which American Century Investment Management, Inc. (the “Advisor”) acts as the investment advisor for the Fund. Under Section 15(c) of the Investment Company Act, contracts for investment advisory services are required to be reviewed, evaluated, and approved by a majority of a fund’s directors (the “Directors”), including a majority of the independent Directors, each year.
Prior to its consideration of the renewal of the management agreement, the Directors requested and reviewed extensive data and information compiled by the Advisor and certain independent providers of evaluation data concerning the Fund and the services provided to the Fund by the Advisor. This review was in addition to the oversight and evaluation undertaken by the Board and its committees on a continual basis and the information received was supplemental to the extensive information that the Board and its committees receive and consider throughout the year.
In connection with its consideration of the renewal of the management agreement, the Board’s review and evaluation of the services provided by the Advisor included, but was not limited to, the following:
| |
• | the nature, extent, and quality of investment management, shareholder services, and other services provided and to be provided to the Fund; |
| |
• | the wide range of other programs and services provided and to be provided to the Fund and its shareholders on a routine and non-routine basis; |
| |
• | the investment performance of the Fund, including data comparing the Fund's performance to appropriate benchmarks and/or a peer group of other mutual funds with similar investment objectives and strategies; |
| |
• | the cost of owning the Fund compared to the cost of owning similar funds; |
| |
• | the compliance policies, procedures, and regulatory experience of the Advisor and the Fund's service providers; |
| |
• | financial data showing the cost of services provided to the Fund, the profitability of the Fund to the Advisor, and the overall profitability of the Advisor; |
| |
• | strategic plans of the Advisor |
| |
• | possible economies of scale associated with the Advisor’s management of the Fund and other accounts under its management; |
| |
• | data comparing services provided and charges to the Advisor's other investment management clients; |
| |
• | acquired fund fees and expenses; |
| |
• | payments and practices by the Fund and the Advisor regarding financial intermediaries, the nature of services provided by intermediaries, and the terms of share classes utilized; and |
| |
• | any collateral benefits derived by the Advisor from the management of the Fund. |
The Directors held three in-person meetings and one telephonic meeting to review and discuss the information provided. The independent Directors also reviewed responses to supplemental information requests and held active discussions with the Advisor regarding the renewal of the management agreement. The independent Directors had the benefit of the advice of their independent counsel throughout the process.
Factors Considered
The Directors considered all of the information provided by the Advisor, the independent data providers, and independent counsel in connection with the approval. They determined that the
information was sufficient for them to evaluate the management agreement for the Fund. In connection with their review, the Directors did not identify any single factor as being all-important or controlling, and each Director may have attributed different levels of importance to different factors. In deciding to renew the management agreement, the Board based its decision on a number of factors, including without limitation the following:
Nature, Extent and Quality of Services - Generally. Under the management agreement, the Advisor is responsible for providing or arranging for all services necessary for the operation of the Fund. The Board noted that the Advisor provides or arranges at its own expense a wide variety of services including without limitation the following:
| |
• | portfolio research and security selection |
| |
• | daily valuation of the Fund’s portfolio |
| |
• | shareholder servicing and transfer agency, including shareholder confirmations, recordkeeping, and communications |
| |
• | legal services (except the independent Directors’ counsel) |
| |
• | regulatory and portfolio compliance |
| |
• | marketing and distribution (except amounts paid by the Fund under Rule 12b-1 plans) |
The Board noted that many of these services have expanded over time in terms of both quantity and complexity in response to shareholder demands, competition in the industry, changing distribution channels, and the changing regulatory environment. The Board noted specifically the resources the Advisor has committed during the year to compliance with the Department of Labor fiduciary rule and share class modernization.
Investment Management Services. The nature of the investment management services provided to the Fund is quite complex and allows Fund shareholders access to professional money management, instant diversification of their investments within an asset class, the opportunity to easily diversify among asset classes by investing in or exchanging among various American Century Investments funds, and liquidity. In evaluating investment performance, the Board expects the Advisor to manage the Fund in accordance with its investment objectives and approved strategies. Further, the Directors recognize that the Advisor has an obligation to monitor trading activities, and in particular to seek the best execution of fund trades, and to evaluate the use of and payment for research. In providing these services, the Advisor utilizes teams of investment professionals (portfolio managers, analysts, research assistants, and securities traders) who require extensive information technology, research, training, compliance, and other systems to conduct their business. The Board, directly and through its Fund Performance Review Committee, provides oversight of the investment performance process. It regularly reviews investment performance information for the Fund, together with comparative information for appropriate benchmarks and/or peer groups of similarly-managed funds, over different time horizons. The Directors also review detailed performance information provided by the Advisor during the management agreement renewal process. If performance concerns are identified, the Fund receives special reviews until performance improves, during which the Board receives a report from the Advisor regarding the reasons for such results (e.g., market conditions, security selection) and any efforts being undertaken to improve performance. The Fund’s performance was above its benchmark for the ten-year period and below its benchmark for the one-, three-, and five-year periods reviewed by the Board. The Board discussed the Fund's performance with the Advisor and was satisfied with the efforts being undertaken by the Advisor. The Board found the investment management services provided by the Advisor to the Fund to be satisfactory and consistent with the management agreement.
Shareholder and Other Services. Under the management agreement, the Advisor provides the Fund with a comprehensive package of transfer agency, shareholder, and other services. The Board, directly and through various committees of the Board, regularly reviews reports and evaluations of such services at its regular meetings. These reports include, but are not limited to, information regarding the operational efficiency and accuracy of the shareholder and transfer agency services provided, staffing levels, shareholder satisfaction (as measured by external as well as internal sources), technology support, new products and services offered to Fund shareholders, securities trading activities, portfolio valuation services, auditing services, and legal and operational compliance activities. Certain aspects of shareholder and transfer agency service level efficiency and the quality of securities trading activities are measured by independent third party providers and are presented in comparison to other fund groups not managed by the Advisor. The Board found the services provided by the Advisor to the Fund under the management agreement to be competitive and of high quality.
Costs of Services and Profitability. The Advisor provides detailed information concerning its cost of providing various services to the Fund, its profitability in managing the Fund (pre- and post-distribution), its overall profitability, and its financial condition. The Directors have reviewed with the Advisor the methodology used to prepare this financial information. This information is considered in evaluating the Advisor’s financial condition, its ability to continue to provide services under the management agreement, and the reasonableness of the current management fee. The Board concluded that the Advisor’s profits were reasonable in light of the services provided to the Fund.
Ethics. The Board generally considers the Advisor’s commitment to providing quality services to shareholders and to conducting its business ethically. They noted that the Advisor’s practices generally meet or exceed industry best practices.
Economies of Scale. The Board also reviewed information provided by the Advisor regarding the possible existence of economies of scale in connection with the management of the Fund. The Board concluded that economies of scale are difficult to measure and predict with precision, especially on a fund-by-fund basis. The Board concluded that the Advisor is appropriately sharing economies of scale through its competitive fee structure, offering competitive fees from fund inception, and through reinvestment in its business to provide shareholders additional content and services. The Board also noted that economies of scale are shared with the Fund and its shareholders through management fee breakpoints that serve to reduce the effective management fee as the assets of the Fund grow.
Comparison to Other Funds’ Fees. The management agreement provides that the Fund pays the Advisor a single, all-inclusive (or unified) management fee for providing all services necessary for the management and operation of the Fund, other than brokerage expenses, expenses attributable to short sales, taxes, interest, extraordinary expenses, and the fees and expenses of the Fund’s independent Directors (including their independent legal counsel) and expenses incurred in connection with the provision of shareholder services and distribution services under a plan adopted pursuant to Rule 12b-1 under the 1940 Act. Under the unified fee structure, the Advisor is responsible for providing all investment advisory, custody, audit, administrative, compliance, recordkeeping, marketing and shareholder services, or arranging and supervising third parties to provide such services. By contrast, most other funds are charged a variety of fees, including an investment advisory fee, a transfer agency fee, an administrative fee, distribution charges, and other expenses. Other than their investment advisory fees and any applicable Rule 12b-1 distribution fees, all other components of the total fees charged by these other funds may be increased without shareholder approval. The Board believes the unified fee structure is a benefit to Fund shareholders because it clearly discloses to shareholders the cost of owning Fund shares, and, since the unified fee cannot be increased without a vote of Fund shareholders, it shifts to the Advisor the risk of increased costs of operating the Fund and provides a direct incentive to minimize administrative inefficiencies. Part of the Board’s analysis of fee levels involves reviewing certain evaluative data compiled by an independent provider comparing the Fund’s unified fee to the total expense ratios of its peers. The unified fee charged to shareholders of the Fund was
below the median of the total expense ratios of the Fund’s peer expense universe and was within the range of its peer expense group. The Board discussed with the Advisor the factors that impacted the level of the fee in relation to its peers. The Board concluded that the management fee paid by the Fund to the Advisor under the management agreement is reasonable in light of the services provided to the Fund.
Comparison to Fees and Services Provided to Other Clients of the Advisor. The Directors also requested and received information from the Advisor concerning the nature of the services, fees, costs, and profitability of its advisory services to advisory clients other than the Fund. They observed that these varying types of client accounts require different services and involve different regulatory and entrepreneurial risks than the management of the Fund. The Board analyzed this information and concluded that the fees charged and services provided to the Fund were reasonable by comparison.
Payments to Intermediaries. The Directors also requested and received a description of payments made to intermediaries by the Fund and the Advisor and services provided in response thereto. These payments include various payments made by the Fund or the Advisor to different types of intermediaries and recordkeepers for distribution and service activities provided for the Fund. The Board reviewed such information and received representations from the Advisor that all such payments by the Fund were made pursuant to the Fund's Rule 12b-1 Plan and that all such payments by the Advisor were made from the Advisor's resources and reasonable profits. The Board found the payments to be reasonable in scope and purpose.
Collateral or “Fall-Out” Benefits Derived by the Advisor. The Board considered the existence of collateral benefits the Advisor may receive as a result of its relationship with the Fund. They concluded that the Advisor’s primary business is managing mutual funds and it generally does not use fund or shareholder information to generate profits in other lines of business, and therefore does not derive any significant collateral benefits from them. The Board noted that additional assets from other clients may offer the Advisor some benefit from increased leverage with service providers and counterparties. Additionally, the Advisor receives proprietary research from broker-dealers that execute fund portfolio transactions, which the Board concluded is likely to benefit other clients of the Advisor, as well as Fund shareholders. The Board also determined that the Advisor is able to provide investment management services to certain clients other than the Fund, at least in part, due to its existing infrastructure built to serve the fund complex. The Board concluded that appropriate allocation methodologies had been employed to assign resources and the cost of those resources to these other clients and, where expressly provided, these other client assets may be included with the assets of the Fund to determine breakpoints in the management fee schedule.
Existing Relationship. The Board also considered whether there was any reason for not continuing the existing arrangement with the Advisor. In this regard, the Board was mindful of the potential disruptions of the Fund’s operations and various risks, uncertainties, and other effects that could occur as a result of a decision not to continue such relationship. In particular, the Board recognized that most shareholders have invested in the Fund on the strength of the Advisor’s industry standing and reputation and in the expectation that the Advisor will have a continuing role in providing advisory services to the Fund.
Conclusion of the Directors. As a result of this process, the Board, including all of the independent Directors, taking into account all of the factors discussed above and the information provided by the Advisor and others in connection with its review and throughout the year, determined that the management fee is fair and reasonable in light of the services provided and that the investment management agreement between the Fund and the Advisor should be renewed.
A special meeting of shareholders was held on October 18, 2017, to vote on the following proposal. The proposal received the required votes and was adopted. A summary of voting results is listed below.
To elect four directors to the Board of Directors of American Century Mutual Funds, Inc.:
|
| | | | | | | |
| Affirmative |
| Withhold |
Thomas W. Bunn | $ | 19,547,896,641 |
|
| $ | 402,531,816 |
|
Barry Fink | $ | 19,543,961,253 |
|
| $ | 406,467,204 |
|
Jan M. Lewis | $ | 19,556,221,886 |
|
| $ | 394,206,571 |
|
Stephen E. Yates | $ | 19,543,817,152 |
|
| $ | 406,611,305 |
|
The other directors whose term of office continued after the meeting include Jonathan S. Thomas, Andrea C. Hall, James A. Olson, M. Jeannine Strandjord, and John R. Whitten.
Retirement Account Information
As required by law, distributions you receive from certain retirement accounts are subject to federal income tax withholding, unless you elect not to have withholding apply*. Tax will be withheld on the total amount withdrawn even though you may be receiving amounts that are not subject to withholding, such as nondeductible contributions. In such case, excess amounts of withholding could occur. You may adjust your withholding election so that a greater or lesser amount will be withheld.
If you don’t want us to withhold on this amount, you must notify us to not withhold the federal income tax. You may notify us in writing or in certain situations by telephone or through other electronic means. For systematic withdrawals, your withholding election will remain in effect until revoked or changed by filing a new election. You have the right to revoke your election at any time and change your withholding percentage for future distributions.
Remember, even if you elect not to have income tax withheld, you are liable for paying income tax on the taxable portion of your withdrawal. If you elect not to have income tax withheld or you don’t have enough income tax withheld, you may be responsible for payment of estimated tax. You may incur penalties under the estimated tax rules if your withholding and estimated tax payments are not sufficient. You can reduce or defer the income tax on a distribution by directly or indirectly rolling such distribution over to another IRA or eligible plan. You should consult your tax advisor for additional information.
State tax will be withheld if, at the time of your distribution, your address is within one of the mandatory withholding states and you have federal income tax withheld (or as otherwise required by state law). State taxes will be withheld from your distribution in accordance with the respective state rules.
*Some 403(b), 457 and qualified retirement plan distributions may be subject to 20% mandatory withholding, as they are subject to special tax and withholding rules. Your plan administrator or plan sponsor is required to provide you with a special tax notice explaining those rules at the time you request a distribution. If applicable, federal and/or state taxes may be withheld from your distribution amount.
Proxy Voting Policies
A description of the policies that the fund's investment advisor uses in exercising the voting rights associated with the securities purchased and/or held by the fund is available without charge, upon request, by calling 1-800-345-2021. It is also available on the "About Us" page of American Century Investments’ website at americancentury.com and on the Securities and Exchange Commission’s website at sec.gov. Information regarding how the investment advisor voted proxies relating to portfolio securities during the most recent 12-month period ended June 30 is available on the "About Us" page at americancentury.com. It is also available at sec.gov.
Quarterly Portfolio Disclosure
The fund files its complete schedule of portfolio holdings with the Securities and Exchange Commission (SEC) for the first and third quarters of each fiscal year on Form N-Q. The fund’s Forms N-Q are available on the SEC’s website at sec.gov, and may be reviewed and copied at the SEC’s Public Reference Room in Washington, DC. Information on the operation of the Public Reference Room may be obtained by calling 1-800-SEC-0330. The fund also makes its complete schedule of portfolio holdings for the most recent quarter of its fiscal year available on its website at americancentury.com and, upon request, by calling 1-800-345-2021.
Other Tax Information
The following information is provided pursuant to provisions of the Internal Revenue Code.
The fund hereby designates up to the maximum amount allowable as qualified dividend income for the fiscal year ended October 31, 2017.
For corporate taxpayers, the fund hereby designates $44,589,223, or up to the maximum amount allowable, of ordinary income distributions paid during the fiscal year ended October 31, 2017 as qualified for the corporate dividends received deduction.
The fund hereby designates $12,733,001 as qualified short-term capital gain distributions for purposes of Internal Revenue Code Section 871 for the fiscal year ended October 31, 2017.
The fund hereby designates $365,510,871, or up to the maximum amount allowable, as long-term capital gain distributions (20% rate gain distributions) for the fiscal year ended October 31, 2017.
The fund utilized earnings and profits of $66,520,348 distributed to shareholders on redemption of shares as part of the dividends paid deduction (tax equalization).
|
| | |
| |
| | |
Contact Us | americancentury.com | |
Automated Information Line | 1-800-345-8765 | |
Investor Services Representative | 1-800-345-2021 or 816-531-5575 | |
Investors Using Advisors | 1-800-378-9878 | |
Business, Not-For-Profit, Employer-Sponsored Retirement Plans | 1-800-345-3533 | |
Banks and Trust Companies, Broker-Dealers, Financial Professionals, Insurance Companies | 1-800-345-6488 | |
Telecommunications Relay Service for the Deaf | 711 | |
| | |
American Century Mutual Funds, Inc. | |
| | |
Investment Advisor: American Century Investment Management, Inc. Kansas City, Missouri | |
| | |
This report and the statements it contains are submitted for the general information of our shareholders. The report is not authorized for distribution to prospective investors unless preceded or accompanied by an effective prospectus. | |
| | |
©2017 American Century Proprietary Holdings, Inc. All rights reserved.
CL-ANN-90970 1712 | |
|
| |
| |
| Annual Report |
| |
| October 31, 2017 |
| |
| Heritage Fund |
|
| | |
President’s Letter | 2 |
|
Performance | 3 |
|
Portfolio Commentary | |
|
Fund Characteristics | |
|
Shareholder Fee Example | |
|
Schedule of Investments | |
|
Statement of Assets and Liabilities | |
|
Statement of Operations | |
|
Statement of Changes in Net Assets | |
|
Notes to Financial Statements | |
|
Financial Highlights | |
|
Report of Independent Registered Public Accounting Firm | |
|
Management | |
|
Approval of Management Agreement | |
|
Proxy Voting Results | |
|
Additional Information | |
|
Any opinions expressed in this report reflect those of the author as of the date of the report, and do not necessarily represent the opinions of American Century Investments® or any other person in the American Century Investments organization. Any such opinions are subject to change at any time based upon market or other conditions and American Century Investments disclaims any responsibility to update such opinions. These opinions may not be relied upon as investment advice and, because investment decisions made by American Century Investments funds are based on numerous factors, may not be relied upon as an indication of trading intent on behalf of any American Century Investments fund. Security examples are used for representational purposes only and are not intended as recommendations to purchase or sell securities. Performance information for comparative indices and securities is provided to American Century Investments by third party vendors. To the best of American Century Investments’ knowledge, such information is accurate at the time of printing.
Jonathan Thomas
Dear Investor:
Thank you for reviewing this annual report for the period ended October 31, 2017. Annual reports help convey important information about fund returns, including market factors that affected performance during the reporting period. For additional, updated investment and market insights, we encourage you to visit our website, americancentury.com.
‘Risk-On’ Sentiment Sparked Strong Gains Among Stocks
U.S. stocks delivered robust double-digit gains for the reporting period. The “risk-on” rally began early in the period, following Donald Trump’s election victory in November 2016. Investor expectations for President Trump’s administration to usher in pro-growth policies and reforms drove stock prices higher. In addition, healthy corporate earnings growth and improving gross domestic product (GDP) and other economic data provided additional support for stocks. Against this backdrop, the S&P 500 Index reached several milestone levels during the period and returned 23.63%. In terms of equity styles, riskier and economically sensitive stocks generally remained in favor. For example, small-cap stocks generally outperformed their mid- and large-cap peers, while growth stocks broadly outperformed their value counterparts across the capitalization spectrum. Real estate investment trusts (REITs) advanced, but global property stocks significantly underperformed the broader stock market as interest rates increased, most notably in the U.S., where the Federal Reserve (Fed) raised rates three times during the period.
As stocks soared in the post-election environment, global bonds sold off sharply. President Trump’s policy agenda fueled inflation fears that sent global bond yields sharply higher in late 2016. However, broad bond market performance generally recovered beginning in early 2017, advancing on subdued inflation and continued central bank accommodation to post modest gains for the entire reporting period. Investor preferences for risk also extended to the global fixed-income market, where high-yield corporate and emerging markets bonds were top performers.
As Congress considers tax cuts and other pro-growth reforms and the Fed and other central banks pursue policy normalization, investors likely will face new opportunities and challenges in the months ahead. We continue to believe in a disciplined, diversified, and risk-aware approach, using professionally managed portfolios in pursuit of investment goals. We appreciate your continued trust in us.
Sincerely,
Jonathan Thomas
President and Chief Executive Officer
American Century Investments
|
| | | | | | |
Total Returns as of October 31, 2017 |
| | | Average Annual Returns | |
| Ticker Symbol | 1 year | 5 years | 10 years | Since Inception | Inception Date |
Investor Class | TWHIX | 20.77% | 12.12% | 6.34% | — | 11/10/87 |
Russell Midcap Growth Index | — | 26.25% | 15.33% | 8.22% | — | — |
I Class | ATHIX | 21.01% | 12.35% | 6.55% | — | 6/16/97 |
Y Class | ATHYX | — | — | — | 10.29% | 4/10/17 |
A Class | ATHAX | | | | | 7/11/97 |
No sales charge | | 20.48% | 11.85% | 6.08% | — | |
With sales charge | | 13.56% | 10.53% | 5.45% | — | |
C Class | AHGCX | 19.58% | 11.00% | 5.28% | — | 6/26/01 |
R Class | ATHWX | 20.16% | 11.56% | 5.81% | — | 9/28/07 |
R5 Class | ATHGX | — | — | — | 10.18% | 4/10/17 |
R6 Class | ATHDX | 21.22% | — | — | 9.84% | 7/26/13 |
Average annual returns since inception are presented when ten years of performance history is not available.
Prior to April 10, 2017, the I Class was referred to as the Institutional Class.
Sales charges include initial sales charges and contingent deferred sales charges (CDSCs), as applicable. A Class shares have a 5.75% maximum initial sales charge and may be subject to a maximum CDSC of 1.00%. C Class shares redeemed within 12 months of purchase are subject to a maximum CDSC of 1.00%. The SEC requires that mutual funds provide performance information net of maximum sales charges in all cases where charges could be applied.
Data presented reflect past performance. Past performance is no guarantee of future results. Current performance may be higher or lower than the performance shown. Total returns for periods less than one year are not annualized. Investment return and principal value will fluctuate, and redemption value may be more or less than original cost. Data assumes reinvestment of dividends and capital gains, and none of the charts reflect the deduction of taxes that a shareholder would pay on fund distributions or the redemption of fund shares. To obtain performance data current to the most recent month end, please call 1-800-345-2021 or visit americancentury.com. For additional information about the fund, please consult the prospectus.
|
|
Growth of $10,000 Over 10 Years |
$10,000 investment made October 31, 2007 |
Performance for other share classes will vary due to differences in fee structure. |
|
| |
Value on October 31, 2017 |
| Investor Class — $18,501 |
|
| Russell Midcap Growth Index — $22,046 |
|
|
| | | | | | | |
Total Annual Fund Operating Expenses |
Investor Class | I Class | Y Class | A Class | C Class | R Class | R5 Class | R6 Class |
1.00% | 0.80% | 0.65% | 1.25% | 2.00% | 1.50% | 0.80% | 0.65% |
The total annual fund operating expenses shown is as stated in the fund’s prospectus current as of the date of this report. The prospectus may vary from the expense ratio shown elsewhere in this report because it is based on a different time period, includes acquired fund fees and expenses, and, if applicable, does not include fee waivers or expense reimbursements.
Data presented reflect past performance. Past performance is no guarantee of future results. Current performance may be higher or lower than the performance shown. Total returns for periods less than one year are not annualized. Investment return and principal value will fluctuate, and redemption value may be more or less than original cost. Data assumes reinvestment of dividends and capital gains, and none of the charts reflect the deduction of taxes that a shareholder would pay on fund distributions or the redemption of fund shares. To obtain performance data current to the most recent month end, please call 1-800-345-2021 or visit americancentury.com. For additional information about the fund, please consult the prospectus.
Portfolio Managers: Greg Walsh and Nalin Yogasundram
Portfolio manager David Hollond retired from American Century in April 2017.
Performance Summary
Heritage returned 20.77%* for the 12 months ended October 31, 2017, lagging the 26.25% return of the portfolio’s benchmark, the Russell Midcap Growth Index.
U.S. stock indices delivered strong returns during the reporting period. Growth stocks outperformed value stocks by a wide margin across the capitalization spectrum. Within the Russell Midcap Growth Index, the utilities sector—which represents a very small segment of the benchmark—had the best performance on a total-return basis. Index returns were largely driven by strong performance of information technology, health care, and industrials stocks. Consumer staples was the only sector that posted a negative return.
The fund’s underperformance relative to the benchmark was primarily due to stock selection in the information technology sector. Stock choices in health care and industrials also detracted. Stock selection in the real estate sector aided relative performance.
Information Technology Stocks Led Detractors
In the information technology sector, stock decisions among semiconductors and semiconductor equipment companies weighed on performance versus the benchmark. Visual computing chip company NVIDIA hindered results due to an underweight position. The holding was eliminated during the period. The company’s gaming and data center businesses have continued to perform well, with the data center segment accelerating.
Among other significant detractors, Newell Brands, which owns several solid consumer brands such as Rubbermaid, detracted. Although Newell has done well, its end markets have decelerated. The company revised its profit forecast down due to Hurricane Harvey, which hurt its resin suppliers in Texas and Louisiana. Resin is a key component of many Newell products. Molson Coors Brewing was a key detractor. The company reported tepid revenue and slow margin improvements and offered weak earnings guidance. Private-label food processor TreeHouse Foods detracted. A poor end-market environment for its supermarket customers created a challenging environment for pricing and profitability. In addition, a recent acquisition is having operational issues, leading us to reduce our growth outlook. We sold the holding. O’Reilly Automotive reported sales that missed expectations and warned of weak consumer demand, driving the stock significantly lower. Investors also appeared fearful of increased competition from Amazon in a space that previously seemed relatively immune from online threats.
Real Estate Benefited Performance
Stock selection within the real estate sector was a significant contributor to relative performance. Although none of our positions were top-10 contributors for the year, we benefited from not owning several poor performers as expectations for rising interest rates weighed on the sector.
Major contributors included Teleflex. The medical device maker outperformed on solid quarterly earnings results and a positive outlook that topped expectations. Teleflex also announced the
*All fund returns referenced in this commentary are for Investor Class shares. Performance for other share classes will vary due to differences in fee structure; when Investor Class performance exceeds that of the fund's benchmark, other share classes may not. See page 3 for returns for all share classes.
acquisition of a large urology treatment provider, which we think will augment growth and profitability. We took advantage of the favorable valuation opportunity to build the portfolio’s position when the stock sold off in the fourth quarter of 2016 amid concerns about the impact of the elections on health care stocks. Owning semiconductor manufacturer Broadcom aided results. The company reported good earnings. It is shifting from relying on mergers and acquisitions to generating free cash flow, which is bringing in a new investor base.
Panera Bread was a significant contributor and was eliminated from the portfolio following the announcement that it would be acquired by JAB Holding. Electronic Arts, a maker of video games, was a top contributor to performance, as the company had favorable quarterly results. The company issued conservative guidance for the upcoming fiscal year, and it expects some gains as games are updated and as it emphasizes esports, a strong trend for the industry.
The financials sector performed well following the 2016 elections on anticipated stronger economic growth, higher interest rates, and deregulation. SVB Financial is expected to benefit from a decreased regulatory burden and was a significant contributor.
Outlook
Heritage continues to invest in companies where we believe fundamentals are strong and improving but share price performance does not fully reflect these factors. Our process is based on individual security selection, but broad themes have emerged.
The portfolio’s largest overweight relative to the benchmark is in information technology, largely due to individual stocks meeting our criteria. We have found improving growth profiles coming out of recent earnings reports. Within the sector, a tailwind is forming from enterprises wanting to “modernize” their on-premise infrastructure in preparation for deeper cloud penetration. We are also overweight health care, where there is now greater clarity about possible changes to the Affordable Care Act and greater regulation of prescription drug pricing. Also, mergers and acquisitions are increasing. Large biotechnology and pharmaceuticals companies are experiencing decelerating growth and weaker pipelines and as a result are looking for growth by purchasing smaller companies.
We have been underweight materials for some time as the sector shows an absence of secular growth. The underweight is led by the chemicals industry, where margin trends are poor. The portfolio has no positions in telecommunication services or utilities. These smaller benchmark components do not typically provide the kind of growth opportunities we look for. Additionally, wireless carriers are under competitive pressure to offer discount pricing on their plans.
|
| |
OCTOBER 31, 2017 | |
Top Ten Holdings | % of net assets |
Zoetis, Inc. | 2.1% |
DXC Technology Co. | 2.0% |
Red Hat, Inc. | 1.9% |
Ball Corp. | 1.8% |
Teleflex, Inc. | 1.8% |
iShares Russell Mid-Cap Growth ETF | 1.7% |
O'Reilly Automotive, Inc. | 1.5% |
Illumina, Inc. | 1.5% |
Fidelity National Information Services, Inc. | 1.5% |
SEI Investments Co. | 1.5% |
| |
Top Five Industries | % of net assets |
Software | 9.9% |
IT Services | 7.0% |
Semiconductors and Semiconductor Equipment | 6.5% |
Machinery | 6.1% |
Health Care Equipment and Supplies | 5.7% |
| |
Types of Investments in Portfolio | % of net assets |
Common Stocks | 97.8% |
Exchange-Traded Funds | 1.7% |
Total Equity Exposure | 99.5% |
Temporary Cash Investments | 0.7% |
Other Assets and Liabilities | (0.2)% |
Fund shareholders may incur two types of costs: (1) transaction costs, including sales charges (loads) on purchase payments and redemption/exchange fees; and (2) ongoing costs, including management fees; distribution and service (12b-1) fees; and other fund expenses. This example is intended to help you understand your ongoing costs (in dollars) of investing in your fund and to compare these costs with the ongoing cost of investing in other mutual funds.
The example is based on an investment of $1,000 made at the beginning of the period and held for the entire period from May 1, 2017 to October 31, 2017.
Actual Expenses
The table provides information about actual account values and actual expenses for each class. You may use the information, together with the amount you invested, to estimate the expenses that you paid over the period. First, identify the share class you own. Then simply divide your account value by $1,000 (for example, an $8,600 account value divided by $1,000 = 8.6), then multiply the result by the number under the heading “Expenses Paid During Period” to estimate the expenses you paid on your account during this period.
If you hold Investor Class shares of any American Century Investments fund, or I Class shares of the American Century Diversified Bond Fund, in an American Century Investments account (i.e., not a financial intermediary or retirement plan account), American Century Investments may charge you a $12.50 semiannual account maintenance fee if the value of those shares is less than $10,000. We will redeem shares automatically in one of your accounts to pay the $12.50 fee. In determining your total eligible investment amount, we will include your investments in all personal accounts (including American Century Investments Brokerage accounts) registered under your Social Security number. Personal accounts include individual accounts, joint accounts, UGMA/UTMA accounts, personal trusts, Coverdell Education Savings Accounts and IRAs (including traditional, Roth, Rollover, SEP-, SARSEP- and SIMPLE-IRAs), and certain other retirement accounts. If you have only business, business retirement, employer-sponsored or American Century Investments Brokerage accounts, you are currently not subject to this fee. If you are subject to the Account Maintenance Fee, your account value could be reduced by the fee amount.
Hypothetical Example for Comparison Purposes
The table also provides information about hypothetical account values and hypothetical expenses based on the actual expense ratio of each class of your fund and an assumed rate of return of 5% per year before expenses, which is not the actual return of a fund’s share class. The hypothetical account values and expenses may not be used to estimate the actual ending account balance or expenses you paid for the period. You may use this information to compare the ongoing costs of investing in your fund and other funds. To do so, compare this 5% hypothetical example with the 5% hypothetical examples that appear in the shareholder reports of the other funds.
Please note that the expenses shown in the table are meant to highlight your ongoing costs only and do not reflect any transactional costs, such as sales charges (loads) or redemption/exchange fees. Therefore, the table is useful in comparing ongoing costs only, and will not help you determine the relative total costs of owning different funds. In addition, if these transactional costs were included, your costs would have been higher.
|
| | | | |
| Beginning
Account Value
5/1/17 | Ending
Account Value
10/31/17 | Expenses Paid
During Period(1)
5/1/17 - 10/31/17 |
Annualized
Expense Ratio(1) |
Actual | | | | |
Investor Class | $1,000 | $1,070.60 | $5.27 | 1.01% |
I Class | $1,000 | $1,072.00 | $4.23 | 0.81% |
Y Class | $1,000 | $1,072.80 | $3.45 | 0.66% |
A Class | $1,000 | $1,069.80 | $6.57 | 1.26% |
C Class | $1,000 | $1,065.50 | $10.46 | 2.01% |
R Class | $1,000 | $1,068.10 | $7.87 | 1.51% |
R5 Class | $1,000 | $1,072.00 | $4.23 | 0.81% |
R6 Class | $1,000 | $1,072.80 | $3.45 | 0.66% |
Hypothetical | | | | |
Investor Class | $1,000 | $1,020.11 | $5.14 | 1.01% |
I Class | $1,000 | $1,021.12 | $4.13 | 0.81% |
Y Class | $1,000 | $1,021.88 | $3.36 | 0.66% |
A Class | $1,000 | $1,018.85 | $6.41 | 1.26% |
C Class | $1,000 | $1,015.07 | $10.21 | 2.01% |
R Class | $1,000 | $1,017.59 | $7.68 | 1.51% |
R5 Class | $1,000 | $1,021.12 | $4.13 | 0.81% |
R6 Class | $1,000 | $1,021.88 | $3.36 | 0.66% |
| |
(1) | Expenses are equal to the class's annualized expense ratio listed in the table above, multiplied by the average account value over the period, multiplied by 184, the number of days in the most recent fiscal half-year, divided by 365, to reflect the one-half year period. Annualized expense ratio reflects actual expenses, including any applicable fee waivers or expense reimbursements and excluding any acquired fund fees and expenses. |
OCTOBER 31, 2017
|
| | | | | |
| Shares | Value |
COMMON STOCKS — 97.8% | | |
Aerospace and Defense — 1.2% | | |
L3 Technologies, Inc. | 319,528 |
| $ | 59,809,251 |
|
Air Freight and Logistics — 0.9% | | |
XPO Logistics, Inc.(1) | 645,615 |
| 44,773,400 |
|
Airlines — 0.6% | | |
American Airlines Group, Inc. | 610,323 |
| 28,575,323 |
|
Auto Components — 0.7% | | |
Delphi Automotive plc | 371,595 |
| 36,929,111 |
|
Banks — 2.1% | | |
BankUnited, Inc. | 72,348 |
| 2,521,328 |
|
SVB Financial Group(1) | 209,934 |
| 46,034,327 |
|
Zions Bancorporation | 1,206,626 |
| 56,059,844 |
|
| | 104,615,499 |
|
Beverages — 3.6% | | |
Brown-Forman Corp., Class B | 724,582 |
| 41,315,666 |
|
Constellation Brands, Inc., Class A | 246,267 |
| 53,954,637 |
|
Molson Coors Brewing Co., Class B | 395,225 |
| 31,961,846 |
|
Monster Beverage Corp.(1) | 913,897 |
| 52,942,053 |
|
| | 180,174,202 |
|
Biotechnology — 3.7% | | |
Alexion Pharmaceuticals, Inc.(1) | 352,388 |
| 42,166,748 |
|
BioMarin Pharmaceutical, Inc.(1) | 518,295 |
| 42,546,837 |
|
Bioverativ, Inc.(1) | 620,832 |
| 35,077,008 |
|
Exelixis, Inc.(1) | 473,389 |
| 11,735,313 |
|
Incyte Corp.(1) | 373,957 |
| 42,350,630 |
|
Neurocrine Biosciences, Inc.(1) | 185,759 |
| 11,537,492 |
|
| | 185,414,028 |
|
Building Products — 1.7% | | |
Fortune Brands Home & Security, Inc. | 731,228 |
| 48,304,922 |
|
Lennox International, Inc. | 193,772 |
| 37,035,642 |
|
| | 85,340,564 |
|
Capital Markets — 4.4% | | |
Affiliated Managers Group, Inc. | 209,370 |
| 39,047,505 |
|
Cboe Global Markets, Inc. | 480,502 |
| 54,325,556 |
|
S&P Global, Inc. | 350,959 |
| 54,914,555 |
|
SEI Investments Co. | 1,148,946 |
| 74,118,506 |
|
| | 222,406,122 |
|
Chemicals — 0.6% | | |
Scotts Miracle-Gro Co. (The) | 297,092 |
| 29,596,305 |
|
Commercial Services and Supplies — 0.9% | | |
Brink's Co. (The) | 576,501 |
| 43,871,726 |
|
Communications Equipment — 1.5% | | |
Palo Alto Networks, Inc.(1) | 502,875 |
| 74,023,200 |
|
Construction and Engineering — 0.5% | | |
Jacobs Engineering Group, Inc. | 428,714 |
| 24,955,442 |
|
|
| | | | | |
| Shares | Value |
Construction Materials — 1.0% | | |
Vulcan Materials Co. | 411,308 |
| $ | 50,076,749 |
|
Containers and Packaging — 3.0% | | |
Ball Corp. | 2,159,284 |
| 92,698,062 |
|
Packaging Corp. of America | 504,328 |
| 58,638,217 |
|
| | 151,336,279 |
|
Distributors — 0.9% | | |
LKQ Corp.(1) | 1,234,162 |
| 46,515,566 |
|
Electrical Equipment — 0.7% | | |
AMETEK, Inc. | 534,043 |
| 36,042,562 |
|
Electronic Equipment, Instruments and Components — 4.1% | | |
Dolby Laboratories, Inc., Class A | 953,528 |
| 55,247,412 |
|
Flextronics International Ltd.(1) | 2,854,250 |
| 50,805,650 |
|
National Instruments Corp. | 1,283,442 |
| 57,754,890 |
|
Trimble, Inc.(1) | 1,055,267 |
| 43,139,315 |
|
| | 206,947,267 |
|
Equity Real Estate Investment Trusts (REITs) — 2.9% | | |
Crown Castle International Corp. | 460,776 |
| 49,339,894 |
|
Equinix, Inc. | 81,029 |
| 37,556,942 |
|
SBA Communications Corp.(1) | 364,506 |
| 57,293,053 |
|
| | 144,189,889 |
|
Food and Staples Retailing — 0.5% | | |
Costco Wholesale Corp. | 153,137 |
| 24,667,308 |
|
Health Care Equipment and Supplies — 5.7% | | |
Align Technology, Inc.(1) | 261,593 |
| 62,515,495 |
|
Baxter International, Inc. | 992,891 |
| 64,011,683 |
|
Hill-Rom Holdings, Inc. | 317,588 |
| 25,632,527 |
|
Teleflex, Inc. | 375,918 |
| 89,085,048 |
|
West Pharmaceutical Services, Inc. | 442,472 |
| 44,866,661 |
|
| | 286,111,414 |
|
Health Care Providers and Services — 1.8% | | |
Amedisys, Inc.(1) | 870,321 |
| 41,871,143 |
|
Humana, Inc. | 189,976 |
| 48,510,372 |
|
| | 90,381,515 |
|
Hotels, Restaurants and Leisure — 3.9% | | |
Domino's Pizza, Inc. | 70,836 |
| 12,962,988 |
|
Hilton Worldwide Holdings, Inc. | 453,477 |
| 32,777,318 |
|
Las Vegas Sands Corp. | 606,334 |
| 38,429,449 |
|
MGM Resorts International | 1,402,157 |
| 43,957,622 |
|
Papa John's International, Inc. | 357,004 |
| 24,294,122 |
|
Vail Resorts, Inc. | 192,023 |
| 43,977,107 |
|
| | 196,398,606 |
|
Household Durables — 2.1% | | |
Mohawk Industries, Inc.(1) | 199,790 |
| 52,297,030 |
|
Newell Brands, Inc. | 1,286,257 |
| 52,453,561 |
|
| | 104,750,591 |
|
Internet and Direct Marketing Retail — 1.6% | | |
Expedia, Inc. | 459,262 |
| 57,251,601 |
|
Wayfair, Inc., Class A(1) | 334,003 |
| 23,346,809 |
|
| | 80,598,410 |
|
|
| | | | | |
| Shares | Value |
Internet Software and Services — 1.8% | | |
eBay, Inc.(1) | 709,756 |
| $ | 26,715,216 |
|
LogMeIn, Inc. | 534,057 |
| 64,647,600 |
|
| | 91,362,816 |
|
IT Services — 7.0% | | |
Booz Allen Hamilton Holding Corp. | 1,562,131 |
| 59,032,930 |
|
DXC Technology Co. | 1,069,575 |
| 97,887,504 |
|
Fidelity National Information Services, Inc. | 801,208 |
| 74,320,054 |
|
First Data Corp., Class A(1) | 2,675,576 |
| 47,652,009 |
|
Vantiv, Inc., Class A(1) | 1,016,445 |
| 71,151,150 |
|
| | 350,043,647 |
|
Life Sciences Tools and Services — 2.2% | | |
Bio-Techne Corp. | 264,745 |
| 34,686,890 |
|
Illumina, Inc.(1) | 364,220 |
| 74,734,302 |
|
| | 109,421,192 |
|
Machinery — 6.1% | | |
Ingersoll-Rand plc | 420,103 |
| 37,221,126 |
|
John Bean Technologies Corp. | 380,605 |
| 40,686,674 |
|
Kennametal, Inc. | 1,021,118 |
| 44,571,801 |
|
Middleby Corp. (The)(1) | 533,616 |
| 61,846,094 |
|
Parker-Hannifin Corp. | 359,591 |
| 65,664,913 |
|
Snap-on, Inc. | 177,128 |
| 27,947,256 |
|
WABCO Holdings, Inc.(1) | 198,344 |
| 29,269,624 |
|
| | 307,207,488 |
|
Multiline Retail — 1.8% | | |
Dollar General Corp. | 463,050 |
| 37,432,962 |
|
Dollar Tree, Inc.(1) | 576,237 |
| 52,581,626 |
|
| | 90,014,588 |
|
Oil, Gas and Consumable Fuels — 1.2% | | |
Concho Resources, Inc.(1) | 450,833 |
| 60,506,297 |
|
Pharmaceuticals — 2.8% | | |
Jazz Pharmaceuticals plc(1) | 251,872 |
| 35,647,444 |
|
Zoetis, Inc. | 1,616,356 |
| 103,155,840 |
|
| | 138,803,284 |
|
Professional Services — 2.2% | | |
IHS Markit Ltd.(1) | 894,404 |
| 38,110,555 |
|
Verisk Analytics, Inc., Class A(1) | 846,865 |
| 72,025,868 |
|
| | 110,136,423 |
|
Road and Rail — 1.1% | | |
Canadian Pacific Railway Ltd. | 151,252 |
| 26,233,147 |
|
Norfolk Southern Corp. | 201,063 |
| 26,423,699 |
|
| | 52,656,846 |
|
Semiconductors and Semiconductor Equipment — 6.5% | | |
Advanced Micro Devices, Inc.(1) | 3,083,575 |
| 33,873,071 |
|
Analog Devices, Inc. | 512,005 |
| 46,746,056 |
|
Broadcom Ltd. | 215,260 |
| 56,809,267 |
|
KLA-Tencor Corp. | 612,921 |
| 66,740,968 |
|
Lam Research Corp. | 165,777 |
| 34,576,109 |
|
Maxim Integrated Products, Inc. | 528,959 |
| 27,791,506 |
|
Xilinx, Inc. | 779,746 |
| 57,459,483 |
|
| | 323,996,460 |
|
|
| | | | | |
| Shares | Value |
Software — 9.9% | | |
Autodesk, Inc.(1) | 502,103 |
| $ | 62,742,791 |
|
Electronic Arts, Inc.(1) | 551,764 |
| 65,990,975 |
|
Guidewire Software, Inc.(1) | 707,096 |
| 56,553,538 |
|
Red Hat, Inc.(1) | 801,387 |
| 96,831,591 |
|
ServiceNow, Inc.(1) | 495,894 |
| 62,666,125 |
|
Splunk, Inc.(1) | 635,560 |
| 42,773,188 |
|
Tyler Technologies, Inc.(1) | 401,208 |
| 71,130,166 |
|
Zynga, Inc., Class A(1) | 9,831,077 |
| 38,341,200 |
|
| | 497,029,574 |
|
Specialty Retail — 3.2% | | |
Burlington Stores, Inc.(1) | 490,307 |
| 46,034,924 |
|
O'Reilly Automotive, Inc.(1) | 358,445 |
| 75,613,973 |
|
Ross Stores, Inc. | 622,827 |
| 39,543,286 |
|
| | 161,192,183 |
|
Textiles, Apparel and Luxury Goods — 0.5% | | |
Columbia Sportswear Co. | 391,433 |
| 24,417,590 |
|
Trading Companies and Distributors — 0.9% | | |
United Rentals, Inc.(1) | 314,252 |
| 44,460,373 |
|
TOTAL COMMON STOCKS
(Cost $3,741,868,338) | | 4,899,749,090 |
|
EXCHANGE-TRADED FUNDS — 1.7% | | |
iShares Russell Mid-Cap Growth ETF
(Cost $86,942,761) | 749,351 |
| 87,216,963 |
|
TEMPORARY CASH INVESTMENTS — 0.7% | | |
Repurchase Agreement, BMO Capital Markets Corp., (collateralized by various U.S. Treasury obligations, 0.375% - 1.375%, 1/15/27 - 2/15/45, valued at $19,821,017), in a joint trading account at 0.88%, dated 10/31/17, due 11/1/17 (Delivery value $19,388,333) | | 19,387,859 |
|
Repurchase Agreement, Fixed Income Clearing Corp., (collateralized by various U.S. Treasury obligations, 2.50%, 5/15/46, valued at $16,487,891), at 0.34%, dated 10/31/17, due 11/1/17 (Delivery value $16,163,153) | | 16,163,000 |
|
State Street Institutional U.S. Government Money Market Fund, Premier Class | 39,623 |
| 39,623 |
|
TOTAL TEMPORARY CASH INVESTMENTS
(Cost $35,590,482) | | 35,590,482 |
|
TOTAL INVESTMENT SECURITIES — 100.2%
(Cost $3,864,401,581) | | 5,022,556,535 |
|
OTHER ASSETS AND LIABILITIES — (0.2)% | | (9,637,200 | ) |
TOTAL NET ASSETS — 100.0% | | $ | 5,012,919,335 |
|
|
| | | | | | | | | | |
FORWARD FOREIGN CURRENCY EXCHANGE CONTRACTS | | |
Currency Purchased | Currency Sold | Counterparty | Settlement Date | Unrealized Appreciation
(Depreciation) |
USD | 22,852,216 |
| CAD | 28,259,279 |
| Morgan Stanley | 12/29/17 | $ | 934,181 |
|
USD | 1,432,959 |
| CAD | 1,786,592 |
| Morgan Stanley | 12/29/17 | 47,269 |
|
| | | | | | $ | 981,450 |
|
|
| | |
NOTES TO SCHEDULE OF INVESTMENTS |
CAD | - | Canadian Dollar |
USD | - | United States Dollar |
See Notes to Financial Statements.
|
|
Statement of Assets and Liabilities |
|
| | | |
OCTOBER 31, 2017 | |
Assets | |
Investment securities, at value (cost of $3,864,401,581) | $ | 5,022,556,535 |
|
Receivable for investments sold | 45,225,232 |
|
Receivable for capital shares sold | 6,933,222 |
|
Unrealized appreciation on forward foreign currency exchange contracts | 981,450 |
|
Dividends and interest receivable | 338,397 |
|
| 5,076,034,836 |
|
| |
Liabilities | |
Payable for investments purchased | 47,036,834 |
|
Payable for capital shares redeemed | 11,688,072 |
|
Accrued management fees | 4,165,301 |
|
Distribution and service fees payable | 168,019 |
|
Accrued other expenses | 57,275 |
|
| 63,115,501 |
|
| |
Net Assets | $ | 5,012,919,335 |
|
| |
Net Assets Consist of: | |
Capital (par value and paid-in surplus) | $ | 3,425,603,028 |
|
Accumulated net investment loss | (8,537,323 | ) |
Undistributed net realized gain | 436,691,441 |
|
Net unrealized appreciation | 1,159,162,189 |
|
| $ | 5,012,919,335 |
|
|
| | | | | | |
| Net Assets | Shares Outstanding | Net Asset Value Per Share |
Investor Class, $0.01 Par Value |
| $4,083,668,877 |
| 172,521,768 |
| $23.67 |
I Class, $0.01 Par Value |
| $262,094,863 |
| 10,484,306 |
| $25.00 |
Y Class, $0.01 Par Value |
| $5,516 |
| 219 |
| $25.19 |
A Class, $0.01 Par Value |
| $353,039,217 |
| 15,998,029 |
| $22.07* |
C Class, $0.01 Par Value |
| $88,628,765 |
| 4,863,311 |
| $18.22 |
R Class, $0.01 Par Value |
| $39,032,835 |
| 1,763,718 |
| $22.13 |
R5 Class, $0.01 Par Value |
| $113,989 |
| 4,560 |
| $25.00 |
R6 Class, $0.01 Par Value |
| $186,335,273 |
| 7,397,864 |
| $25.19 |
*Maximum offering price $23.42 (net asset value divided by 0.9425).
See Notes to Financial Statements.
|
| | | |
YEAR ENDED OCTOBER 31, 2017 | |
Investment Income (Loss) | |
Income: | |
Dividends (net of foreign taxes withheld of $54,501) | $ | 42,112,289 |
|
Interest | 218,690 |
|
| 42,330,979 |
|
| |
Expenses: | |
Management fees | 48,419,791 |
|
Distribution and service fees: | |
A Class | 1,152,800 |
|
C Class | 958,725 |
|
R Class | 205,597 |
|
Directors' fees and expenses | 152,377 |
|
Other expenses | 155,478 |
|
| 51,044,768 |
|
| |
Net investment income (loss) | (8,713,789 | ) |
| |
Realized and Unrealized Gain (Loss) | |
Net realized gain (loss) on: | |
Investment transactions | 488,997,451 |
|
Forward foreign currency exchange contract transactions | (1,673,544 | ) |
Foreign currency translation transactions | (131 | ) |
| 487,323,776 |
|
| |
Change in net unrealized appreciation (depreciation) on: | |
Investments | 449,510,338 |
|
Forward foreign currency exchange contracts | 214,490 |
|
Translation of assets and liabilities in foreign currencies | 2,043 |
|
| 449,726,871 |
|
| |
Net realized and unrealized gain (loss) | 937,050,647 |
|
| |
Net Increase (Decrease) in Net Assets Resulting from Operations | $ | 928,336,858 |
|
See Notes to Financial Statements.
|
|
Statement of Changes in Net Assets |
|
| | | | | | |
YEARS ENDED OCTOBER 31, 2017 AND OCTOBER 31, 2016 |
Increase (Decrease) in Net Assets | October 31, 2017 | October 31, 2016 |
Operations | | |
Net investment income (loss) | $ | (8,713,789 | ) | $ | (13,564,912 | ) |
Net realized gain (loss) | 487,323,776 |
| 392,559,276 |
|
Change in net unrealized appreciation (depreciation) | 449,726,871 |
| (511,638,261 | ) |
Net increase (decrease) in net assets resulting from operations | 928,336,858 |
| (132,643,897 | ) |
| | |
Distributions to Shareholders | | |
From net realized gains: | | |
Investor Class | (309,914,664 | ) | (476,523,199 | ) |
I Class | (11,179,521 | ) | (18,120,987 | ) |
A Class | (47,529,397 | ) | (91,679,856 | ) |
C Class | (10,202,472 | ) | (17,882,234 | ) |
R Class | (3,730,908 | ) | (6,346,684 | ) |
R6 Class | (9,792,656 | ) | (10,943,140 | ) |
Decrease in net assets from distributions | (392,349,618 | ) | (621,496,100 | ) |
| | |
Capital Share Transactions | | |
Net increase (decrease) in net assets from capital share transactions (Note 5) | (343,021,445 | ) | (28,900,566 | ) |
| | |
Net increase (decrease) in net assets | 192,965,795 |
| (783,040,563 | ) |
| | |
Net Assets | | |
Beginning of period | 4,819,953,540 |
| 5,602,994,103 |
|
End of period | $ | 5,012,919,335 |
| $ | 4,819,953,540 |
|
| | |
Accumulated net investment loss | $ | (8,537,323 | ) | $ | (13,600,943 | ) |
See Notes to Financial Statements.
|
|
Notes to Financial Statements |
OCTOBER 31, 2017
1. Organization
American Century Mutual Funds, Inc. (the corporation) is registered under the Investment Company Act of 1940, as amended (the 1940 Act), as an open-end management investment company and is organized as a Maryland corporation. Heritage Fund (the fund) is one fund in a series issued by the corporation. The fund's investment objective is to seek long-term capital growth.
The fund offers the Investor Class, I Class (formerly Institutional Class), Y Class, A Class, C Class, R Class, R5 Class and R6 Class. The A Class may incur an initial sales charge. The A Class and C Class may be subject to a contingent deferred sales charge. Sale of the Y Class and R5 Class commenced on April 10, 2017.
2. Significant Accounting Policies
The following is a summary of significant accounting policies consistently followed by the fund in preparation of its financial statements. The fund is an investment company and follows accounting and reporting guidance in accordance with accounting principles generally accepted in the United States of America. This may require management to make certain estimates and assumptions at the date of the financial statements. Actual results could differ from these estimates. Management evaluated the impact of events or transactions occurring through the date the financial statements were issued that would merit recognition or disclosure.
Investment Valuations — The fund determines the fair value of its investments and computes its net asset value per share at the close of regular trading (usually 4 p.m. Eastern time) on the New York Stock Exchange (NYSE) on each day the NYSE is open. The Board of Directors has adopted valuation policies and procedures to guide the investment advisor in the fund’s investment valuation process and to provide methodologies for the oversight of the fund’s pricing function.
Equity securities that are listed or traded on a domestic securities exchange are valued at the last reported sales price or at the official closing price as provided by the exchange. Equity securities traded on foreign securities exchanges are generally valued at the closing price of such securities on the exchange where primarily traded or at the close of the NYSE, if that is earlier. If no last sales price is reported, or if local convention or regulation so provides, the mean of the latest bid and asked prices may be used. Securities traded over-the-counter are valued at the mean of the latest bid and asked prices, the last sales price, or the official closing price. Equity securities initially expressed in local currencies are translated into U.S. dollars at the mean of the appropriate currency exchange rate at the close of the NYSE as provided by an independent pricing service.
Fixed income securities are valued at the evaluated mean as provided by independent pricing services or at the mean of the most recent bid and asked prices as provided by investment dealers. U.S. Treasury and Government Agency securities are valued using market models that consider trade data, quotations from dealers and active market makers, relevant yield curve and spread data, creditworthiness, trade data or market information on comparable securities, and other relevant security specific information.
Open-end management investment companies are valued at the reported net asset value per share. Repurchase agreements are valued at cost, which approximates fair value. Forward foreign currency exchange contracts are valued at the mean of the appropriate forward exchange rate at the close of the NYSE as provided by an independent pricing service.
If the fund determines that the market price for an investment is not readily available or the valuation methods mentioned above do not reflect an investment’s fair value, such investment is valued as determined in good faith by the Board of Directors or its delegate, in accordance with policies and procedures adopted by the Board of Directors. In its determination of fair value, the fund may review several factors including, but not limited to, market information regarding the specific investment or comparable investments and correlation with other investment types, futures indices or general market indicators. Circumstances that may cause the fund to use these procedures to value an investment include, but are not limited to: an investment has been declared in default or is distressed; trading in a security has been suspended during the trading day or a
security is not actively trading on its principal exchange; prices received from a regular pricing source are deemed unreliable; or there is a foreign market holiday and no trading occurred.
The fund monitors for significant events occurring after the close of an investment’s primary exchange but before the fund’s net asset value per share is determined. Significant events may include, but are not limited to: corporate announcements and transactions; governmental action and political unrest that could impact a specific investment or an investment sector; or armed conflicts, natural disasters and similar events that could affect investments in a specific country or region. The fund also monitors for significant fluctuations between domestic and foreign markets, as evidenced by the U.S. market or such other indicators that the Board of Directors, or its delegate, deems appropriate. If significant fluctuations in foreign markets are identified, the fund may apply a model-derived factor to the closing price of equity securities traded on foreign securities exchanges. The factor is based on observable market data as provided by an independent pricing service.
Security Transactions — Security transactions are accounted for as of the trade date. Net realized gains and losses are determined on the identified cost basis, which is also used for federal income tax purposes.
Investment Income — Dividend income less foreign taxes withheld, if any, is recorded as of the ex-dividend date. Distributions received on securities that represent a return of capital or long-term capital gain are recorded as a reduction of cost of investments and/or as a realized gain. The fund may estimate the components of distributions received that may be considered nontaxable distributions or long-term capital gain distributions for income tax purposes. Interest income is recorded on the accrual basis and includes accretion of discounts and amortization of premiums.
Foreign Currency Translations — All assets and liabilities initially expressed in foreign currencies are translated into U.S. dollars at prevailing exchange rates at period end. The fund may enter into spot foreign currency exchange contracts to facilitate transactions denominated in a foreign currency. Purchases and sales of investment securities, dividend and interest income, spot foreign currency exchange contracts, and expenses are translated at the rates of exchange prevailing on the respective dates of such transactions. Net realized and unrealized foreign currency exchange gains or losses related to investment securities are a component of net realized gain (loss) on investment transactions and change in net unrealized appreciation (depreciation) on investments, respectively.
Repurchase Agreements — The fund may enter into repurchase agreements with institutions that American Century Investment Management, Inc. (ACIM) (the investment advisor) has determined are creditworthy pursuant to criteria adopted by the Board of Directors. The fund requires that the collateral, represented by securities, received in a repurchase transaction be transferred to the custodian in a manner sufficient to enable the fund to obtain those securities in the event of a default under the repurchase agreement. ACIM monitors, on a daily basis, the securities transferred to ensure the value, including accrued interest, of the securities under each repurchase agreement is equal to or greater than amounts owed to the fund under each repurchase agreement.
Joint Trading Account — Pursuant to an Exemptive Order issued by the Securities and Exchange Commission, the fund, along with certain other funds in the American Century Investments family of funds, may transfer uninvested cash balances into a joint trading account. These balances are invested in one or more repurchase agreements that are collateralized by U.S. Treasury or Agency obligations.
Income Tax Status — It is the fund’s policy to distribute substantially all net investment income and net realized gains to shareholders and to otherwise qualify as a regulated investment company under provisions of the Internal Revenue Code. Accordingly, no provision has been made for income taxes. The fund files U.S. federal, state, local and non-U.S. tax returns as applicable. The fund's tax returns are subject to examination by the relevant taxing authority until expiration of the applicable statute of limitations, which is generally three years from the date of filing but can be longer in certain jurisdictions. At this time, management believes there are no uncertain tax positions which, based on their technical merit, would not be sustained upon examination and for which it is reasonably possible that the total amounts of unrecognized tax benefits will significantly change in the next twelve months.
Multiple Class — All shares of the fund represent an equal pro rata interest in the net assets of the class to which such shares belong, and have identical voting, dividend, liquidation and other rights and the same terms and conditions, except for class specific expenses and exclusive rights to vote on matters affecting only individual classes. Income, non-class specific expenses, and realized and unrealized capital gains and losses of the fund are allocated to each class of shares based on their relative net assets.
Distributions to Shareholders — Distributions from net investment income and net realized gains, if any, are generally declared and paid annually. The fund may elect to treat a portion of its payment to a redeeming shareholder, which represents the pro rata share of undistributed net investment income and net realized gains, as a distribution for federal income tax purposes (tax equalization).
Indemnifications — Under the corporation’s organizational documents, its officers and directors are indemnified against certain liabilities arising out of the performance of their duties to the fund. In addition, in the normal course of business, the fund enters into contracts that provide general indemnifications. The maximum exposure under these arrangements is unknown as this would involve future claims that may be made against a fund. The risk of material loss from such claims is considered by management to be remote.
3. Fees and Transactions with Related Parties
Certain officers and directors of the corporation are also officers and/or directors of American Century Companies, Inc. (ACC). The corporation’s investment advisor, ACIM, the corporation's distributor, American Century Investment Services, Inc. (ACIS), and the corporation’s transfer agent, American Century Services, LLC, are wholly owned, directly or indirectly, by ACC. Various funds issued by American Century Asset Allocation Portfolios, Inc. own, in aggregate, 5% of the shares of the fund.
Management Fees — The corporation has entered into a management agreement with ACIM, under which ACIM provides the fund with investment advisory and management services in exchange for a single, unified management fee (the fee) per class. The agreement provides that all expenses of managing and operating the fund, except distribution and service fees, brokerage expenses, taxes, interest, fees and expenses of the independent directors (including legal counsel fees), and extraordinary expenses, will be paid by ACIM. The fee is computed and accrued daily based on each class's daily net assets and paid monthly in arrears. The difference in the fee among the classes is a result of their separate arrangements for non-Rule 12b-1 shareholder services. It is not the result of any difference in advisory or custodial fees or other expenses related to the management of the fund’s assets, which do not vary by class.
The annual management fee for each class is as follows:
|
| | | | | | | |
Investor Class | I Class | Y Class | A Class | C Class | R Class | R5 Class | R6 Class |
1.000% | 0.800% | 0.650% | 1.000% | 1.000% | 1.000% | 0.800% | 0.650% |
Distribution and Service Fees — The Board of Directors has adopted a separate Master Distribution and Individual Shareholder Services Plan for each of the A Class, C Class and R Class (collectively the plans), pursuant to Rule 12b-1 of the 1940 Act. The plans provide that the A Class will pay ACIS an annual distribution and service fee of 0.25%. The plans provide that the C Class will pay ACIS an annual distribution and service fee of 1.00%, of which 0.25% is paid for individual shareholder services and 0.75% is paid for distribution services. The plans provide that the R Class will pay ACIS an annual distribution and service fee of 0.50%. The fees are computed and accrued daily based on each class’s daily net assets and paid monthly in arrears. The fees are used to pay financial intermediaries for distribution and individual shareholder services. Fees incurred under the plans during the period ended October 31, 2017 are detailed in the Statement of Operations.
Directors' Fees and Expenses — The Board of Directors is responsible for overseeing the investment advisor’s management and operations of the fund. The directors receive detailed information about the fund and its investment advisor regularly throughout the year, and meet at least quarterly with management of the investment advisor to review reports about fund operations. The fund’s officers do not receive compensation from the fund.
Interfund Transactions — The fund may enter into security transactions with other American Century Investments funds and other client accounts of the investment advisor, in accordance with the 1940 Act rules and procedures adopted by the Board of Directors. The rules and procedures require, among other things, that these transactions be effected at the independent current market price of the security. During the period, the interfund purchases and sales were $11,497,940 and $41,974,578, respectively. The effect of interfund transactions on the Statement of Operations was $8,655,249 in net realized gain (loss) on investment transactions.
4. Investment Transactions
Purchases and sales of investment securities, excluding short-term investments, for the period ended October 31, 2017 were $2,740,414,985 and $3,463,746,101, respectively.
5. Capital Share Transactions
Transactions in shares of the fund were as follows:
|
| | | | | | | | | | |
| Year ended October 31, 2017(1) | Year ended
October 31, 2016 |
| Shares | Amount | Shares | Amount |
Investor Class/Shares Authorized | 1,500,000,000 |
| | 1,270,000,000 |
| |
Sold | 17,887,611 |
| $ | 393,494,050 |
| 12,665,346 |
| $ | 267,899,742 |
|
Issued in reinvestment of distributions | 14,633,383 |
| 299,984,349 |
| 21,839,340 |
| 461,902,032 |
|
Redeemed | (39,665,791 | ) | (874,177,394 | ) | (31,751,604 | ) | (680,380,619 | ) |
| (7,144,797 | ) | (180,698,995 | ) | 2,753,082 |
| 49,421,155 |
|
I Class/Shares Authorized | 130,000,000 |
| | 120,000,000 |
| |
Sold | 6,982,989 |
| 166,592,943 |
| 1,961,747 |
| 44,663,069 |
|
Issued in reinvestment of distributions | 505,042 |
| 10,913,955 |
| 791,046 |
| 17,529,582 |
|
Redeemed | (3,973,484 | ) | (92,038,952 | ) | (2,170,480 | ) | (48,819,503 | ) |
| 3,514,547 |
| 85,467,946 |
| 582,313 |
| 13,373,148 |
|
Y Class/Shares Authorized | 50,000,000 |
| | N/A |
| |
Sold | 219 |
| 5,000 |
| | |
A Class/Shares Authorized | 340,000,000 |
| | 450,000,000 |
| |
Sold | 2,742,715 |
| 55,641,787 |
| 4,766,511 |
| 97,356,035 |
|
Issued in reinvestment of distributions | 2,399,006 |
| 45,940,961 |
| 4,477,628 |
| 89,194,354 |
|
Redeemed | (17,660,672 | ) | (362,961,627 | ) | (14,972,490 | ) | (301,149,639 | ) |
| (12,518,951 | ) | (261,378,879 | ) | (5,728,351 | ) | (114,599,250 | ) |
C Class/Shares Authorized | 80,000,000 |
| | 80,000,000 |
| |
Sold | 413,354 |
| 6,982,452 |
| 707,195 |
| 12,265,998 |
|
Issued in reinvestment of distributions | 582,590 |
| 9,274,836 |
| 944,287 |
| 16,015,100 |
|
Redeemed | (2,236,275 | ) | (38,049,760 | ) | (2,151,091 | ) | (36,799,144 | ) |
| (1,240,331 | ) | (21,792,472 | ) | (499,609 | ) | (8,518,046 | ) |
R Class/Shares Authorized | 40,000,000 |
| | 40,000,000 |
| |
Sold | 366,643 |
| 7,525,722 |
| 605,044 |
| 12,283,208 |
|
Issued in reinvestment of distributions | 191,545 |
| 3,687,238 |
| 315,250 |
| 6,323,925 |
|
Redeemed | (977,608 | ) | (19,952,451 | ) | (1,025,372 | ) | (20,375,900 | ) |
| (419,420 | ) | (8,739,491 | ) | (105,078 | ) | (1,768,767 | ) |
R5 Class/Shares Authorized | 50,000,000 |
| | N/A |
| |
Sold | 4,654 |
| 111,637 |
| | |
Redeemed | (94 | ) | (2,241 | ) | | |
| 4,560 |
| 109,396 |
| | |
R6 Class/Shares Authorized | 60,000,000 |
| | 60,000,000 |
| |
Sold | 3,999,527 |
| 94,253,347 |
| 2,752,948 |
| 61,715,522 |
|
Issued in reinvestment of distributions | 450,237 |
| 9,792,656 |
| 491,826 |
| 10,943,140 |
|
Redeemed | (2,558,341 | ) | (60,039,953 | ) | (1,744,390 | ) | (39,467,468 | ) |
| 1,891,423 |
| 44,006,050 |
| 1,500,384 |
| 33,191,194 |
|
Net increase (decrease) | (15,912,750 | ) | $ | (343,021,445 | ) | (1,497,259 | ) | $ | (28,900,566 | ) |
| |
(1) | April 10, 2017 (commencement of sale) through October 31, 2017 for the Y Class and R5 Class. |
6. Fair Value Measurements
The fund’s investments valuation process is based on several considerations and may use multiple inputs to determine the fair value of the investments held by the fund. In conformity with accounting principles generally accepted in the United States of America, the inputs used to determine a valuation are classified into three broad levels.
| |
• | Level 1 valuation inputs consist of unadjusted quoted prices in an active market for identical investments. |
| |
• | Level 2 valuation inputs consist of direct or indirect observable market data (including quoted prices for comparable investments, evaluations of subsequent market events, interest rates, prepayment speeds, credit risk, etc.). These inputs also consist of quoted prices for identical investments initially expressed in local currencies that are adjusted through translation into U.S. dollars. |
| |
• | Level 3 valuation inputs consist of unobservable data (including a fund’s own assumptions). |
The level classification is based on the lowest level input that is significant to the fair valuation measurement. The valuation inputs are not necessarily an indication of the risks associated with investing in these securities or other financial instruments. There were no significant transfers between levels during the period.
The following is a summary of the level classifications as of period end. The Schedule of Investments provides additional information on the fund’s portfolio holdings.
|
| | | | | | | | |
| Level 1 | Level 2 | Level 3 |
Assets | | | |
Investment Securities | | | |
Common Stocks | $ | 4,899,749,090 |
| — |
| — |
|
Exchange-Traded Funds | 87,216,963 |
| — |
| — |
|
Temporary Cash Investments | 39,623 |
| $ | 35,550,859 |
| — |
|
| $ | 4,987,005,676 |
| $ | 35,550,859 |
| — |
|
Other Financial Instruments | | | |
Forward Foreign Currency Exchange Contracts | — |
| $ | 981,450 |
| — |
|
7. Derivative Instruments
Foreign Currency Risk — The fund is subject to foreign currency exchange rate risk in the normal course of pursuing its investment objectives. The value of foreign investments held by a fund may be significantly affected by changes in foreign currency exchange rates. The dollar value of a foreign security generally decreases when the value of the dollar rises against the foreign currency in which the security is denominated and tends to increase when the value of the dollar declines against such foreign currency. A fund may enter into forward foreign currency exchange contracts to reduce a fund's exposure to foreign currency exchange rate fluctuations. The net U.S. dollar value of foreign currency underlying all contractual commitments held by a fund and the resulting unrealized appreciation or depreciation are determined daily. Realized gain or loss is recorded upon the termination of the contract. Net realized and unrealized gains or losses occurring during the holding period of forward foreign currency exchange contracts are a component of net realized gain (loss) on forward foreign currency exchange contract transactions and change in net unrealized appreciation (depreciation) on forward foreign currency exchange contracts, respectively. A fund bears the risk of an unfavorable change in the foreign currency exchange rate underlying the forward contract. Additionally, losses, up to the fair value, may arise if the counterparties do not perform under the contract terms. The fund's average U.S. dollar exposure to foreign currency risk derivative instruments held during the period was $39,577,930.
The value of foreign currency risk derivative instruments as of October 31, 2017, is disclosed on the Statement of Assets and Liabilities as an asset of $981,450 in unrealized appreciation on forward foreign currency exchange contracts. For the year ended October 31, 2017, the effect of foreign currency risk derivative instruments on the Statement of Operations was $(1,673,544) in net realized gain (loss) on forward foreign currency exchange contract transactions and $214,490 in change in net unrealized appreciation (depreciation) on forward foreign currency exchange contracts.
8. Risk Factors
The fund invests in common stocks of small companies. Because of this, the fund may be subject to greater risk and market fluctuations than a fund investing in larger, more established companies.
9. Federal Tax Information
The tax character of distributions paid during the years ended October 31, 2017 and October 31, 2016 were as follows:
|
| | | | | | |
| 2017 | 2016 |
Distributions Paid From | | |
Ordinary income | — |
| — |
|
Long-term capital gains | $ | 392,349,618 |
| $ | 621,496,100 |
|
The book-basis character of distributions made during the year from net investment income or net realized gains may differ from their ultimate characterization for federal income tax purposes. These differences reflect the differing character of certain income items and net realized gains and losses for financial statement and tax purposes, and may result in reclassification among certain capital accounts on the financial statements.
As of period end, the federal tax cost of investments and the components of distributable earnings on a tax-basis were as follows:
|
| | | |
Federal tax cost of investments | $ | 3,868,428,891 |
|
Gross tax appreciation of investments | $ | 1,198,150,575 |
|
Gross tax depreciation of investments | (44,022,931 | ) |
Net tax appreciation (depreciation) of investments | 1,154,127,644 |
|
Net tax appreciation (depreciation) on derivatives and translation of assets and liabilities in foreign currencies | 25,785 |
|
Net tax appreciation (depreciation) | $ | 1,154,153,429 |
|
Undistributed ordinary income | — |
|
Accumulated long-term gains | $ | 440,718,751 |
|
Late-year ordinary loss deferral | $ | (7,555,873 | ) |
The difference between book-basis and tax-basis unrealized appreciation (depreciation) is attributable primarily to the tax deferral of losses on wash sales.
Loss deferrals represent certain qualified losses that the fund has elected to treat as having been incurred in the following fiscal year for federal income tax purposes.
|
| | | | | | | | | | | | | |
For a Share Outstanding Throughout the Years Ended October 31 (except as noted) | | | | | |
Per-Share Data | | | | | | Ratios and Supplemental Data | | |
| | Income From Investment Operations: | | | | Ratio to Average Net Assets of: | | |
| Net Asset
Value,
Beginning
of Period | Net
Investment
Income
(Loss)(1) | Net
Realized
and
Unrealized
Gain (Loss) | Total From
Investment
Operations | Distributions From Net
Realized
Gains | Net Asset
Value,
End
of Period | Total
Return(2) | Operating
Expenses | Net
Investment
Income
(Loss) | Portfolio
Turnover
Rate | Net
Assets,
End of
Period
(in thousands) |
Investor Class | | | | | | | | | | |
2017 | $21.28 | (0.03) | 4.18 | 4.15 | (1.76) | $23.67 | 20.77% | 1.01% | (0.15)% | 56% |
| $4,083,669 |
|
2016 | $24.59 | (0.05) | (0.53) | (0.58) | (2.73) | $21.28 | (2.26)% | 1.00% | (0.21)% | 62% |
| $3,823,112 |
|
2015 | $26.89 | (0.11) | 1.66 | 1.55 | (3.85) | $24.59 | 7.11% | 1.00% | (0.42)% | 62% |
| $4,349,601 |
|
2014 | $28.45 | (0.14) | 2.18 | 2.04 | (3.60) | $26.89 | 8.33% | 1.00% | (0.55)% | 73% |
| $4,449,377 |
|
2013 | $22.44 | (0.07) | 6.55 | 6.48 | (0.47) | $28.45 | 29.43% | 1.00% | (0.29)% | 70% |
| $3,016,930 |
|
I Class(3) | | | | | | | | | | |
2017 | $22.34 | —(4) | 4.42 | 4.42 | (1.76) | $25.00 | 21.01% | 0.81% | 0.05% | 56% |
| $262,095 |
|
2016 | $25.62 | —(4) | (0.55) | (0.55) | (2.73) | $22.34 | (2.07)% | 0.80% | (0.01)% | 62% |
| $155,695 |
|
2015 | $27.81 | (0.06) | 1.72 | 1.66 | (3.85) | $25.62 | 7.33% | 0.80% | (0.22)% | 62% |
| $163,670 |
|
2014 | $29.25 | (0.09) | 2.25 | 2.16 | (3.60) | $27.81 | 8.53% | 0.80% | (0.35)% | 73% |
| $198,895 |
|
2013 | $23.01 | (0.02) | 6.73 | 6.71 | (0.47) | $29.25 | 29.70% | 0.80% | (0.09)% | 70% |
| $243,548 |
|
Y Class | | | | | | | | | | |
2017(5) | $22.84 | 0.02 | 2.33 | 2.35 | — | $25.19 | 10.29% | 0.66%(6) | 0.12%(6) | 56%(7) |
| $6 |
|
|
| | | | | | | | | | | | | |
For a Share Outstanding Throughout the Years Ended October 31 (except as noted) | | | | | |
Per-Share Data | | | | | | Ratios and Supplemental Data | | |
| | Income From Investment Operations: | | | | Ratio to Average Net Assets of: | | |
| Net Asset
Value,
Beginning
of Period | Net
Investment
Income
(Loss)(1) | Net
Realized
and
Unrealized
Gain (Loss) | Total From
Investment
Operations | Distributions From Net
Realized
Gains | Net Asset
Value,
End
of Period | Total
Return(2) | Operating
Expenses | Net
Investment
Income
(Loss) | Portfolio
Turnover
Rate | Net
Assets,
End of
Period
(in thousands) |
A Class | | | | | | | | | | |
2017 | $20.00 | (0.08) | 3.91 | 3.83 | (1.76) | $22.07 | 20.48% | 1.26% | (0.40)% | 56% |
| $353,039 |
|
2016 | $23.33 | (0.09) | (0.51) | (0.60) | (2.73) | $20.00 | (2.53)% | 1.25% | (0.46)% | 62% |
| $570,298 |
|
2015 | $25.78 | (0.16) | 1.56 | 1.40 | (3.85) | $23.33 | 6.88% | 1.25% | (0.67)% | 62% |
| $798,879 |
|
2014 | $27.48 | (0.20) | 2.10 | 1.90 | (3.60) | $25.78 | 8.04% | 1.25% | (0.80)% | 73% |
| $869,381 |
|
2013 | $21.74 | (0.13) | 6.34 | 6.21 | (0.47) | $27.48 | 29.13% | 1.25% | (0.54)% | 70% |
| $1,092,574 |
|
C Class | | | | | | | | | | |
2017 | $16.92 | (0.19) | 3.25 | 3.06 | (1.76) | $18.22 | 19.58% | 2.01% | (1.15)% | 56% |
| $88,629 |
|
2016 | $20.31 | (0.21) | (0.45) | (0.66) | (2.73) | $16.92 | (3.29)% | 2.00% | (1.21)% | 62% |
| $103,292 |
|
2015 | $23.10 | (0.30) | 1.36 | 1.06 | (3.85) | $20.31 | 6.09% | 2.00% | (1.42)% | 62% |
| $134,096 |
|
2014 | $25.16 | (0.35) | 1.89 | 1.54 | (3.60) | $23.10 | 7.25% | 2.00% | (1.55)% | 73% |
| $128,522 |
|
2013 | $20.09 | (0.28) | 5.82 | 5.54 | (0.47) | $25.16 | 28.10% | 2.00% | (1.29)% | 70% |
| $139,064 |
|
R Class | | | | | | | | | | |
2017 | $20.10 | (0.13) | 3.92 | 3.79 | (1.76) | $22.13 | 20.16% | 1.51% | (0.65)% | 56% |
| $39,033 |
|
2016 | $23.48 | (0.15) | (0.50) | (0.65) | (2.73) | $20.10 | (2.75)% | 1.50% | (0.71)% | 62% |
| $43,875 |
|
2015 | $25.97 | (0.22) | 1.58 | 1.36 | (3.85) | $23.48 | 6.60% | 1.50% | (0.92)% | 62% |
| $53,731 |
|
2014 | $27.72 | (0.27) | 2.12 | 1.85 | (3.60) | $25.97 | 7.80% | 1.50% | (1.05)% | 73% |
| $58,426 |
|
2013 | $21.99 | (0.20) | 6.40 | 6.20 | (0.47) | $27.72 | 28.74% | 1.50% | (0.79)% | 70% |
| $54,129 |
|
R5 Class | | | | | | | | | | |
2017(5) | $22.69 | —(4) | 2.31 | 2.31 | — | $25.00 | 10.18% | 0.81%(6) | (0.03)%(6) | 56%(7) |
| $114 |
|
|
| | | | | | | | | | | | | |
For a Share Outstanding Throughout the Years Ended October 31 (except as noted) | | | | | |
Per-Share Data | | | | | | Ratios and Supplemental Data | | |
| | Income From Investment Operations: | | | | Ratio to Average Net Assets of: | | |
| Net Asset
Value,
Beginning
of Period | Net
Investment
Income
(Loss)(1) | Net
Realized
and
Unrealized
Gain (Loss) | Total From
Investment
Operations | Distributions From Net
Realized
Gains | Net Asset
Value,
End
of Period | Total
Return(2) | Operating
Expenses | Net
Investment
Income
(Loss) | Portfolio
Turnover
Rate | Net
Assets,
End of
Period
(in thousands) |
R6 Class | | | | | | | | | | |
2017 | $22.46 | 0.04 | 4.45 | 4.49 | (1.76) | $25.19 | 21.22% | 0.66% | 0.20% | 56% |
| $186,335 |
|
2016 | $25.72 | 0.03 | (0.56) | (0.53) | (2.73) | $22.46 | (1.93)% | 0.65% | 0.14% | 62% |
| $123,681 |
|
2015 | $27.86 | (0.02) | 1.73 | 1.71 | (3.85) | $25.72 | 7.48% | 0.65% | (0.07)% | 62% |
| $103,017 |
|
2014 | $29.25 | (0.07) | 2.28 | 2.21 | (3.60) | $27.86 | 8.72% | 0.65% | (0.20)% | 73% |
| $56,442 |
|
2013(8) | $27.22 | —(4) | 2.03 | 2.03 | — | $29.25 | 7.46% | 0.65%(6) | (0.07)%(6) | 70%(9) |
| $74 |
|
|
| | | | |
Notes to Financial Highlights | | |
| |
(1) | Computed using average shares outstanding throughout the period. |
| |
(2) | Total returns are calculated based on the net asset value of the last business day and do not reflect applicable sales charges, if any. Total returns for periods less than one year are not annualized. |
| |
(3) | Prior to April 10, 2017, the I Class was referred to as the Institutional Class. |
| |
(4) | Per-share amount was less than $0.005. |
| |
(5) | April 10, 2017 (commencement of sale) through October 31, 2017. |
| |
(7) | Portfolio turnover is calculated at the fund level. Percentage indicated was calculated for the year ended October 31, 2017. |
| |
(8) | July 26, 2013 (commencement of sale) through October 31, 2013. |
| |
(9) | Portfolio turnover is calculated at the fund level. Percentage indicated was calculated for the year ended October 31, 2013. |
See Notes to Financial Statements.
|
|
Report of Independent Registered Public Accounting Firm |
To the Board of Directors and Shareholders of American Century Mutual Funds, Inc.:
We have audited the accompanying statement of assets and liabilities, including the schedule of investments, of Heritage Fund (the “Fund”), one of the funds constituting American Century Mutual Funds, Inc., as of October 31, 2017, and the related statement of operations for the year then ended, the statements of changes in net assets for each of the two years in the period then ended, and the financial highlights for each of the periods presented. These financial statements and financial highlights are the responsibility of the Fund’s management. Our responsibility is to express an opinion on these financial statements and financial highlights based on our audits.
We conducted our audits in accordance with the standards of the Public Company Accounting Oversight Board (United States). Those standards require that we plan and perform the audit to obtain reasonable assurance about whether the financial statements and financial highlights are free of material misstatement. The Fund is not required to have, nor were we engaged to perform, an audit of its internal control over financial reporting. Our audits included consideration of internal control over financial reporting as a basis for designing audit procedures that are appropriate in the circumstances, but not for the purpose of expressing an opinion on the effectiveness of the Fund’s internal control over financial reporting. Accordingly, we express no such opinion. An audit also includes examining, on a test basis, evidence supporting the amounts and disclosures in the financial statements, assessing the accounting principles used and significant estimates made by management, as well as evaluating the overall financial statement presentation. Our procedures included confirmation of securities owned as of October 31, 2017, by correspondence with the custodian and brokers; when replies were not received from brokers, we performed other auditing procedures. We believe that our audits provide a reasonable basis for our opinion.
In our opinion, the financial statements and financial highlights referred to above present fairly, in all material respects, the financial position of Heritage Fund of American Century Mutual Funds, Inc. as of October 31, 2017, the results of its operations for the year then ended, the changes in its net assets for each of the two years in the period then ended, and the financial highlights for each of the periods presented, in conformity with accounting principles generally accepted in the United States of America.
DELOITTE & TOUCHE LLP
Kansas City, Missouri
December 15, 2017
The Board of Directors
The individuals listed below serve as directors of the funds. Each director will continue to serve in this capacity until death, retirement, resignation or removal from office. The board has adopted a mandatory retirement age for directors who are not “interested persons,” as that term is defined in the Investment Company Act (independent directors). Independent directors shall retire by December 31 of the year in which they reach their 75th birthday.
Mr. Thomas is an “interested person” because he currently serves as President and Chief Executive Officer of American Century Companies, Inc. (ACC), the parent company of American Century Investment Management, Inc. (ACIM or the advisor). The other directors (more than three-fourths of the total number) are independent. They are not employees, directors or officers of, and have no financial interest in, ACC or any of its wholly owned, direct or indirect, subsidiaries, including ACIM, American Century Investment Services, Inc. (ACIS) and American Century Services, LLC (ACS), and they do not have any other affiliations, positions or relationships that would cause them to be considered “interested persons” under the Investment Company Act. The directors serve in this capacity for seven (in the case of Mr. Thomas, 15) registered investment companies in the American Century Investments family of funds.
The following table presents additional information about the directors. The mailing address for each director is 4500 Main Street, Kansas City, Missouri 64111.
|
| | | | | |
Name
(Year of Birth) | Position(s) Held with Funds | Length of Time Served | Principal Occupation(s) During Past 5 Years | Number of American Century Portfolios Overseen by Director | Other Directorships Held During Past 5 Years |
Independent Directors |
|
|
Thomas W. Bunn (1953) | Director | Since 2017 | Retired | 69 | SquareTwo Financial; Barings (formerly Babson Capital Funds Trust) (2013 to 2016) |
Barry Fink
(1955) | Director | Since 2012 (independent since 2016) | Retired; Executive Vice President, ACC (2007 to 2013); President, ACS (2007 to 2013); Chief Operating Officer, ACC (2007 to 2012) | 69 | None |
Andrea C. Hall
(1945) | Director | Since 1997 | Retired | 69 | None |
Jan M. Lewis
(1957) | Director | Since 2011 | Retired; President and Chief Executive Officer, Catholic Charities of Northeast Kansas (human services organization) (2006 to 2013) | 69 | None |
James A. Olson
(1942) | Director and Chairman of the Board | Since 2007 (Chairman since 2014) | Member, Plaza Belmont LLC (private equity fund manager) (1999 to present) | 69 | Saia, Inc. (2002 to 2012) and EPR Properties (2003 to 2013) |
|
| | | | | |
Name
(Year of Birth) | Position(s) Held with Funds | Length of Time Served | Principal Occupation(s) During Past 5 Years | Number of American Century Portfolios Overseen by Director | Other Directorships Held During Past 5 Years |
Independent Directors |
|
|
M. Jeannine Strandjord
(1945) | Director | Since 1994 | Retired | 69 | Euronet Worldwide Inc.; MGP Ingredients, Inc.; and DST Systems Inc. (1996 to 2012) |
John R. Whitten
(1946) | Director | Since 2008 | Retired | 69 | Rudolph Technologies, Inc. |
Stephen E. Yates
(1948) | Director | Since 2012 | Retired | 69 | None |
Interested Director |
|
|
Jonathan S. Thomas
(1963) | Director and President | Since 2007 | President and Chief Executive Officer, ACC (2007 to present). Also serves as Chief Executive Officer, ACS; Executive Vice President, ACIM; Director, ACC, ACIM and other ACC subsidiaries | 114 | BioMed Valley Discoveries, Inc. |
The Statement of Additional Information has additional information about the fund's directors and is available without charge, upon request, by calling 1-800-345-2021.
Officers
The following table presents certain information about the executive officers of the funds. Each officer serves as an officer for each of the 15 investment companies in the American Century family of funds, unless otherwise noted. No officer is compensated for his or her service as an officer of the funds. The listed officers are interested persons of the funds and are appointed or re-appointed on an annual basis. The mailing address for each officer listed below is 4500 Main Street, Kansas City, Missouri 64111.
|
| | |
Name
(Year of Birth) | Offices with the Funds | Principal Occupation(s) During the Past Five Years |
Jonathan S. Thomas
(1963) | Director and President since 2007 | President and Chief Executive Officer, ACC (2007 to present). Also serves as Chief Executive Officer, ACS; Executive Vice President, ACIM; Director, ACC, ACIM and other ACC subsidiaries |
Amy D. Shelton
(1964) | Chief Compliance Officer and Vice President since 2014 | Chief Compliance Officer, American Century funds, (2014 to present); Chief Compliance Officer, ACIM (2014 to present); Chief Compliance Officer, ACIS (2009 to present); Vice President, Client Interactions and Marketing, ACIS (2013 to 2014); Director, Client Interactions and Marketing, ACIS (2007 to 2013). Also serves as Vice President, ACIS |
Charles A. Etherington
(1957) | General Counsel since 2007 and Senior Vice President since 2006 | Attorney, ACC (1994 to present); Vice President, ACC (2005 to present); General Counsel, ACC (2007 to present). Also serves as General Counsel, ACIM, ACS, ACIS and other ACC subsidiaries; and Senior Vice President, ACIM and ACS |
C. Jean Wade
(1964) | Vice President,Treasurer and Chief Financial Officer since 2012 | Vice President, ACS (2000 to present) |
Robert J. Leach
(1966) | Vice President since 2006 and Assistant Treasurer since 2012 | Vice President, ACS (2000 to present) |
David H. Reinmiller
(1963) | Vice President since 2000 | Attorney, ACC (1994 to present); Associate General Counsel, ACC (2001 to present). Also serves as Vice President, ACIM and ACS |
Ward D. Stauffer
(1960) | Secretary since 2005 | Attorney, ACC (2003 to present) |
|
|
Approval of Management Agreement |
At a meeting held on June 29, 2017, the Fund’s Board of Directors (the "Board") unanimously approved the renewal of the management agreement pursuant to which American Century Investment Management, Inc. (the “Advisor”) acts as the investment advisor for the Fund. Under Section 15(c) of the Investment Company Act, contracts for investment advisory services are required to be reviewed, evaluated, and approved by a majority of a fund’s directors (the “Directors”), including a majority of the independent Directors, each year.
Prior to its consideration of the renewal of the management agreement, the Directors requested and reviewed extensive data and information compiled by the Advisor and certain independent providers of evaluation data concerning the Fund and the services provided to the Fund by the Advisor. This review was in addition to the oversight and evaluation undertaken by the Board and its committees on a continual basis and the information received was supplemental to the extensive information that the Board and its committees receive and consider throughout the year.
In connection with its consideration of the renewal of the management agreement, the Board’s review and evaluation of the services provided by the Advisor included, but was not limited to, the following:
| |
• | the nature, extent, and quality of investment management, shareholder services, and other services provided and to be provided to the Fund; |
| |
• | the wide range of other programs and services provided and to be provided to the Fund and its shareholders on a routine and non-routine basis; |
| |
• | the investment performance of the Fund, including data comparing the Fund's performance to appropriate benchmarks and/or a peer group of other mutual funds with similar investment objectives and strategies; |
| |
• | the cost of owning the Fund compared to the cost of owning similar funds; |
| |
• | the compliance policies, procedures, and regulatory experience of the Advisor and the Fund's service providers; |
| |
• | financial data showing the cost of services provided to the Fund, the profitability of the Fund to the Advisor, and the overall profitability of the Advisor; |
| |
• | strategic plans of the Advisor |
| |
• | possible economies of scale associated with the Advisor’s management of the Fund and other accounts under its management; |
| |
• | data comparing services provided and charges to the Advisor's other investment management clients; |
| |
• | acquired fund fees and expenses; |
| |
• | payments and practices by the Fund and the Advisor regarding financial intermediaries, the nature of services provided by intermediaries, and the terms of share classes utilized; and |
| |
• | any collateral benefits derived by the Advisor from the management of the Fund. |
The Directors held three in-person meetings and one telephonic meeting to review and discuss the information provided. The independent Directors also reviewed responses to supplemental information requests and held active discussions with the Advisor regarding the renewal of the management agreement. The independent Directors had the benefit of the advice of their independent counsel throughout the process.
Factors Considered
The Directors considered all of the information provided by the Advisor, the independent data providers, and independent counsel in connection with the approval. They determined that the
information was sufficient for them to evaluate the management agreement for the Fund. In connection with their review, the Directors did not identify any single factor as being all-important or controlling, and each Director may have attributed different levels of importance to different factors. In deciding to renew the management agreement, the Board based its decision on a number of factors, including without limitation the following:
Nature, Extent and Quality of Services - Generally. Under the management agreement, the Advisor is responsible for providing or arranging for all services necessary for the operation of the Fund. The Board noted that the Advisor provides or arranges at its own expense a wide variety of services including without limitation the following:
| |
• | portfolio research and security selection |
| |
• | daily valuation of the Fund’s portfolio |
| |
• | shareholder servicing and transfer agency, including shareholder confirmations, recordkeeping, and communications |
| |
• | legal services (except the independent Directors’ counsel) |
| |
• | regulatory and portfolio compliance |
| |
• | marketing and distribution (except amounts paid by the Fund under Rule 12b-1 plans) |
The Board noted that many of these services have expanded over time in terms of both quantity and complexity in response to shareholder demands, competition in the industry, changing distribution channels, and the changing regulatory environment. The Board noted specifically the resources the Advisor has committed during the year to compliance with the Department of Labor fiduciary rule and share class modernization.
Investment Management Services. The nature of the investment management services provided to the Fund is quite complex and allows Fund shareholders access to professional money management, instant diversification of their investments within an asset class, the opportunity to easily diversify among asset classes by investing in or exchanging among various American Century Investments funds, and liquidity. In evaluating investment performance, the Board expects the Advisor to manage the Fund in accordance with its investment objectives and approved strategies. Further, the Directors recognize that the Advisor has an obligation to monitor trading activities, and in particular to seek the best execution of fund trades, and to evaluate the use of and payment for research. In providing these services, the Advisor utilizes teams of investment professionals (portfolio managers, analysts, research assistants, and securities traders) who require extensive information technology, research, training, compliance, and other systems to conduct their business. The Board, directly and through its Fund Performance Review Committee, provides oversight of the investment performance process. It regularly reviews investment performance information for the Fund, together with comparative information for appropriate benchmarks and/or peer groups of similarly-managed funds, over different time horizons. The Directors also review detailed performance information provided by the Advisor during the management agreement renewal process. If performance concerns are identified, the Fund receives special reviews until performance improves, during which the Board receives a report from the Advisor regarding the reasons for such results (e.g., market conditions, security selection) and any efforts being undertaken to improve performance. The Fund’s performance was above its benchmark for the ten-year period and below its benchmark for the one-, three-, and five-year periods reviewed by the Board. The Board discussed the Fund's performance with the Advisor and was satisfied with the efforts being undertaken by the Advisor. The Board found the investment management services provided by the Advisor to the Fund to be satisfactory and consistent with the management agreement.
Shareholder and Other Services. Under the management agreement, the Advisor provides the Fund with a comprehensive package of transfer agency, shareholder, and other services. The Board, directly and through various committees of the Board, regularly reviews reports and evaluations of such services at its regular meetings. These reports include, but are not limited to, information regarding the operational efficiency and accuracy of the shareholder and transfer agency services provided, staffing levels, shareholder satisfaction (as measured by external as well as internal sources), technology support, new products and services offered to Fund shareholders, securities trading activities, portfolio valuation services, auditing services, and legal and operational compliance activities. Certain aspects of shareholder and transfer agency service level efficiency and the quality of securities trading activities are measured by independent third party providers and are presented in comparison to other fund groups not managed by the Advisor. The Board found the services provided by the Advisor to the Fund under the management agreement to be competitive and of high quality.
Costs of Services and Profitability. The Advisor provides detailed information concerning its cost of providing various services to the Fund, its profitability in managing the Fund (pre- and post-distribution), its overall profitability, and its financial condition. The Directors have reviewed with the Advisor the methodology used to prepare this financial information. This information is considered in evaluating the Advisor’s financial condition, its ability to continue to provide services under the management agreement, and the reasonableness of the current management fee. The Board concluded that the Advisor’s profits were reasonable in light of the services provided to the Fund.
Ethics. The Board generally considers the Advisor’s commitment to providing quality services to shareholders and to conducting its business ethically. They noted that the Advisor’s practices generally meet or exceed industry best practices.
Economies of Scale. The Board also reviewed information provided by the Advisor regarding the possible existence of economies of scale in connection with the management of the Fund. The Board concluded that economies of scale are difficult to measure and predict with precision, especially on a fund-by-fund basis. The Board concluded that the Advisor is appropriately sharing economies of scale through its competitive fee structure, offering competitive fees from fund inception, and through reinvestment in its business to provide shareholders additional content and services.
Comparison to Other Funds’ Fees. The management agreement provides that the Fund pays the Advisor a single, all-inclusive (or unified) management fee for providing all services necessary for the management and operation of the Fund, other than brokerage expenses, expenses attributable to short sales, taxes, interest, extraordinary expenses, and the fees and expenses of the Fund’s independent Directors (including their independent legal counsel) and expenses incurred in connection with the provision of shareholder services and distribution services under a plan adopted pursuant to Rule 12b-1 under the 1940 Act. Under the unified fee structure, the Advisor is responsible for providing all investment advisory, custody, audit, administrative, compliance, recordkeeping, marketing and shareholder services, or arranging and supervising third parties to provide such services. By contrast, most other funds are charged a variety of fees, including an investment advisory fee, a transfer agency fee, an administrative fee, distribution charges, and other expenses. Other than their investment advisory fees and any applicable Rule 12b-1 distribution fees, all other components of the total fees charged by these other funds may be increased without shareholder approval. The Board believes the unified fee structure is a benefit to Fund shareholders because it clearly discloses to shareholders the cost of owning Fund shares, and, since the unified fee cannot be increased without a vote of Fund shareholders, it shifts to the Advisor the risk of increased costs of operating the Fund and provides a direct incentive to minimize administrative inefficiencies. Part of the Board’s analysis of fee levels involves reviewing certain evaluative data compiled by an independent provider comparing the Fund’s unified fee to the total expense ratios of its peers. The unified fee charged to shareholders of the Fund was below the median of the total expense ratios of the Fund’s peer expense universe and was within the range of its peer expense group. The Board concluded that the management fee paid by the
Fund to the Advisor under the management agreement is reasonable in light of the services provided to the Fund.
Comparison to Fees and Services Provided to Other Clients of the Advisor. The Directors also requested and received information from the Advisor concerning the nature of the services, fees, costs, and profitability of its advisory services to advisory clients other than the Fund. They observed that these varying types of client accounts require different services and involve different regulatory and entrepreneurial risks than the management of the Fund. The Board analyzed this information and concluded that the fees charged and services provided to the Fund were reasonable by comparison.
Payments to Intermediaries. The Directors also requested and received a description of payments made to intermediaries by the Fund and the Advisor and services provided in response thereto. These payments include various payments made by the Fund or the Advisor to different types of intermediaries and recordkeepers for distribution and service activities provided for the Fund. The Board reviewed such information and received representations from the Advisor that all such payments by the Fund were made pursuant to the Fund's Rule 12b-1 Plan and that all such payments by the Advisor were made from the Advisor's resources and reasonable profits. The Board found the payments to be reasonable in scope and purpose.
Collateral or “Fall-Out” Benefits Derived by the Advisor. The Board considered the existence of collateral benefits the Advisor may receive as a result of its relationship with the Fund. They concluded that the Advisor’s primary business is managing mutual funds and it generally does not use fund or shareholder information to generate profits in other lines of business, and therefore does not derive any significant collateral benefits from them. The Board noted that additional assets from other clients may offer the Advisor some benefit from increased leverage with service providers and counterparties. Additionally, the Advisor receives proprietary research from broker-dealers that execute fund portfolio transactions, which the Board concluded is likely to benefit other clients of the Advisor, as well as Fund shareholders. The Board also determined that the Advisor is able to provide investment management services to certain clients other than the Fund, at least in part, due to its existing infrastructure built to serve the fund complex. The Board concluded that appropriate allocation methodologies had been employed to assign resources and the cost of those resources to these other clients and, where expressly provided, these other client assets may be included with the assets of the Fund to determine breakpoints in the management fee schedule.
Existing Relationship. The Board also considered whether there was any reason for not continuing the existing arrangement with the Advisor. In this regard, the Board was mindful of the potential disruptions of the Fund’s operations and various risks, uncertainties, and other effects that could occur as a result of a decision not to continue such relationship. In particular, the Board recognized that most shareholders have invested in the Fund on the strength of the Advisor’s industry standing and reputation and in the expectation that the Advisor will have a continuing role in providing advisory services to the Fund.
Conclusion of the Directors. As a result of this process, the Board, including all of the independent Directors, taking into account all of the factors discussed above and the information provided by the Advisor and others in connection with its review and throughout the year, determined that the management fee is fair and reasonable in light of the services provided and that the investment management agreement between the Fund and the Advisor should be renewed.
A special meeting of shareholders was held on October 18, 2017, to vote on the following proposal. The proposal received the required votes and was adopted. A summary of voting results is listed below.
To elect four directors to the Board of Directors of American Century Mutual Funds, Inc.:
|
| | | | | | | |
| Affirmative |
| Withhold |
Thomas W. Bunn | $ | 19,547,896,641 |
|
| $ | 402,531,816 |
|
Barry Fink | $ | 19,543,961,253 |
|
| $ | 406,467,204 |
|
Jan M. Lewis | $ | 19,556,221,886 |
|
| $ | 394,206,571 |
|
Stephen E. Yates | $ | 19,543,817,152 |
|
| $ | 406,611,305 |
|
The other directors whose term of office continued after the meeting include Jonathan S. Thomas, Andrea C. Hall, James A. Olson, M. Jeannine Strandjord, and John R. Whitten.
Retirement Account Information
As required by law, distributions you receive from certain retirement accounts are subject to federal income tax withholding, unless you elect not to have withholding apply*. Tax will be withheld on the total amount withdrawn even though you may be receiving amounts that are not subject to withholding, such as nondeductible contributions. In such case, excess amounts of withholding could occur. You may adjust your withholding election so that a greater or lesser amount will be withheld.
If you don’t want us to withhold on this amount, you must notify us to not withhold the federal income tax. You may notify us in writing or in certain situations by telephone or through other electronic means. For systematic withdrawals, your withholding election will remain in effect until revoked or changed by filing a new election. You have the right to revoke your election at any time and change your withholding percentage for future distributions.
Remember, even if you elect not to have income tax withheld, you are liable for paying income tax on the taxable portion of your withdrawal. If you elect not to have income tax withheld or you don’t have enough income tax withheld, you may be responsible for payment of estimated tax. You may incur penalties under the estimated tax rules if your withholding and estimated tax payments are not sufficient. You can reduce or defer the income tax on a distribution by directly or indirectly rolling such distribution over to another IRA or eligible plan. You should consult your tax advisor for additional information.
State tax will be withheld if, at the time of your distribution, your address is within one of the mandatory withholding states and you have federal income tax withheld (or as otherwise required by state law). State taxes will be withheld from your distribution in accordance with the respective state rules.
*Some 403(b), 457 and qualified retirement plan distributions may be subject to 20% mandatory withholding, as they are subject to special tax and withholding rules. Your plan administrator or plan sponsor is required to provide you with a special tax notice explaining those rules at the time you request a distribution. If applicable, federal and/or state taxes may be withheld from your distribution amount.
Proxy Voting Policies
A description of the policies that the fund's investment advisor uses in exercising the voting rights associated with the securities purchased and/or held by the fund is available without charge, upon request, by calling 1-800-345-2021. It is also available on the "About Us" page of American Century Investments’ website at americancentury.com and on the Securities and Exchange Commission’s website at sec.gov. Information regarding how the investment advisor voted proxies relating to portfolio securities during the most recent 12-month period ended June 30 is available on the "About Us" page at americancentury.com. It is also available at sec.gov.
Quarterly Portfolio Disclosure
The fund files its complete schedule of portfolio holdings with the Securities and Exchange Commission (SEC) for the first and third quarters of each fiscal year on Form N-Q. The fund’s Forms N-Q are available on the SEC’s website at sec.gov, and may be reviewed and copied at the SEC’s Public Reference Room in Washington, DC. Information on the operation of the Public Reference Room may be obtained by calling 1-800-SEC-0330. The fund also makes its complete schedule of portfolio holdings for the most recent quarter of its fiscal year available on its website at americancentury.com and, upon request, by calling 1-800-345-2021.
Other Tax Information
The following information is provided pursuant to provisions of the Internal Revenue Code.
The fund hereby designates $425,248,517, or up to the maximum amount allowable, as long-term capital gain distributions (20% rate gain distributions) for the fiscal year ended October 31, 2017.
The fund utilized earnings and profits of $32,898,899 distributed to shareholders on redemption of shares as part of the dividends paid deduction (tax equalization).
|
| | |
| |
| | |
Contact Us | americancentury.com | |
Automated Information Line | 1-800-345-8765 | |
Investor Services Representative | 1-800-345-2021 or 816-531-5575 | |
Investors Using Advisors | 1-800-378-9878 | |
Business, Not-For-Profit, Employer-Sponsored Retirement Plans | 1-800-345-3533 | |
Banks and Trust Companies, Broker-Dealers, Financial Professionals, Insurance Companies | 1-800-345-6488 | |
Telecommunications Relay Service for the Deaf | 711 | |
| | |
American Century Mutual Funds, Inc. | |
| | |
Investment Advisor: American Century Investment Management, Inc. Kansas City, Missouri | |
| | |
This report and the statements it contains are submitted for the general information of our shareholders. The report is not authorized for distribution to prospective investors unless preceded or accompanied by an effective prospectus. | |
| | |
©2017 American Century Proprietary Holdings, Inc. All rights reserved.
CL-ANN-90977 1712 | |
|
| |
| |
| Annual Report |
| |
| October 31, 2017 |
| |
| NT Growth Fund |
|
| | |
Performance | 2 |
|
Portfolio Commentary | |
|
Fund Characteristics | |
|
Shareholder Fee Example | |
|
Schedule of Investments | |
|
Statement of Assets and Liabilities | |
|
Statement of Operations | |
|
Statement of Changes in Net Assets | |
|
Notes to Financial Statements | |
|
Financial Highlights | |
|
Report of Independent Registered Public Accounting Firm | |
|
Management | |
|
Approval of Management Agreement | |
|
Proxy Voting Results | |
|
Additional Information | |
|
Any opinions expressed in this report reflect those of the author as of the date of the report, and do not necessarily represent the opinions of American Century Investments® or any other person in the American Century Investments organization. Any such opinions are subject to change at any time based upon market or other conditions and American Century Investments disclaims any responsibility to update such opinions. These opinions may not be relied upon as investment advice and, because investment decisions made by American Century Investments funds are based on numerous factors, may not be relied upon as an indication of trading intent on behalf of any American Century Investments fund. Security examples are used for representational purposes only and are not intended as recommendations to purchase or sell securities. Performance information for comparative indices and securities is provided to American Century Investments by third party vendors. To the best of American Century Investments’ knowledge, such information is accurate at the time of printing.
|
| | | | | |
Total Returns as of October 31, 2017 | |
| | | Average Annual Returns | |
| Ticker Symbol | 1 year | 5 years | 10 years | Inception Date |
G Class | ACLTX | 28.64% | 15.17% | 8.28% | 5/12/06 |
Russell 1000 Growth Index | — | 29.71% | 16.82% | 9.12% | — |
Fund returns would have been lower if a portion of the fees had not been waived. Prior to July 31, 2017, the
G Class was referred to as the Institutional Class.
|
|
Growth of $10,000 Over 10 Years |
$10,000 investment made October 31, 2007 |
|
| |
Value on October 31, 2017 |
| G Class — $22,177 |
|
| Russell 1000 Growth Index — $23,964 |
|
Ending value of G Class would have been lower if a portion of the fees had not been waived.
|
| |
Total Annual Fund Operating Expenses |
G Class | 0.63% |
The total annual fund operating expenses shown is as stated in the fund’s prospectus current as of the date of this report. The prospectus may vary from the expense ratio shown elsewhere in this report because it is based on a different time period, includes acquired fund fees and expenses, and, if applicable, does not include fee waivers or expense reimbursements.
Data presented reflect past performance. Past performance is no guarantee of future results. Current performance may be higher or lower than the performance shown. Total returns for periods less than one year are not annualized. Investment return and principal value will fluctuate, and redemption value may be more or less than original cost. Data assumes reinvestment of dividends and capital gains, and none of the charts reflect the deduction of taxes that a shareholder would pay on fund distributions or the redemption of fund shares. To obtain performance data current to the most recent month end, please call 1-800-345-2021 or visit americancentury.com. For additional information about the fund, please consult the prospectus.
Portfolio Managers: Gregory Woodhams and Justin Brown
Performance Summary
NT Growth returned 28.64%* for the 12 months ended October 31, 2017, lagging the 29.71% return of the portfolio’s benchmark, the Russell 1000 Growth Index.
U.S. stock indices posted positive returns during the reporting period. Growth stocks outperformed value stocks by a wide margin across the capitalization spectrum. Within the Russell 1000 Growth Index, all sectors but energy posted strong gains. The small utilities segment—a sector that rarely has companies with the growth characteristics we seek—reported the top total return, but index gains were largely driven by the strong performance of information technology stocks.
Stock selection in the consumer discretionary sector was a significant source of underperformance relative to the benchmark. Stock choices among health care and financials stocks were also modest detractors. Stock selection and an overweight in the information technology sector benefited relative performance. Stock choices among industrials and real estate stocks were positive as well.
Consumer Discretionary Stocks Led Detractors
Brick-and-mortar retailers struggled during much of 2017 for a variety of reasons, including delayed tax refunds, weather, and competitive pressures from online retailer Amazon (a fund holding). Aftermarket car parts dealer O’Reilly Automotive reported sales that missed expectations and warned of weak consumer demand that drove the stock significantly lower. Investors also appeared to be fearful of increased competition from Amazon in a space that previously seemed relatively immune from online threats. We sold our O'Reilly holding. Off-price retailer TJX underperformed after reporting results that were in line with expectations but below historical growth levels.
Chipotle Mexican Grill fell sharply in July on concerns about renewed food-safety issues after a Virginia store was closed because customers became ill.
In health care, not owning benchmark component AbbVie detracted as the stock price soared following the pharmaceutical company’s favorable settlement in its lawsuit against Amgen (a fund holding), which now must pay royalties to AbbVie on sales of its anti-inflammatory drug Amgevita, a biosimilar of AbbVie’s Humira.
Elsewhere, not owning benchmark holding NVIDIA hindered results. The visual computing chip company’s gaming and data center businesses have continued to perform well, with the data center segment accelerating. Underweighting Apple also detracted. The company reported good results, and investors appeared to look ahead favorably to the release of the latest iPhone.
Information Technology Holdings Aided Performance
Top contributors in the information technology sector included Activision Blizzard. The video game developer reported results that were much better than expected, driven by higher margins and strong results from its recently acquired King Digital business (the mobile video game company that created Candy Crush). Exposure to semiconductor capital equipment manufacturer ASML Holding aided performance. The Netherlands-based company reported better-than-expected results and guidance with strong bookings for its new product, which allows companies to further
* Fund returns would have been lower if a portion of the fees had not been waived.
shrink the size and increase the complexity of semiconductor chips. Semiconductor company Applied Materials continued to gain market share and reported record revenues and earnings per share for its fiscal third quarter. The company also announced that it expects continued growth in revenues and earnings over the next few years due to strong demand.
Other major contributors included Intuitive Surgical. The medical device company benefited from Food and Drug Administration clearance for its new da Vinci X robotic platform, which offers several technologies at a lower price than its previous platform. Veterinary hospital operator VCA rose sharply on the announcement that it would be acquired by privately owned Mars. As a result, the stock was eliminated from the portfolio.
Not owning tobacco stocks aided results. Tobacco stocks declined as the Food and Drug Administration began to pursue possible regulations that would lower nicotine in cigarettes to nonaddictive levels.
Outlook
We believe stock selection—rather than sector allocation or market timing via the use of cash—is the most efficient means of generating superior risk-adjusted returns. As a result of this approach, the portfolio’s sector and industry selection, as well as capitalization-range allocations, are primarily due to identifying what we believe to be superior individual securities.
The portfolio remains overweight the information technology sector as we continue to find strong growth opportunities. Our bottom-up fundamental analysis indicates rising capital spending by semiconductor companies. Internet names continued to generate high growth, and data security is another growth segment.
We have been underweight materials for some time as the sector shows an absence of secular growth. Our underweight in the consumer discretionary sector derives from concerns about secular changes in retail and media.
|
| |
OCTOBER 31, 2017 | |
Top Ten Holdings | % of net assets |
Alphabet, Inc., Class A | 7.8% |
Facebook, Inc., Class A | 5.6% |
Amazon.com, Inc. | 5.5% |
Apple, Inc. | 4.1% |
PepsiCo, Inc. | 4.0% |
Visa, Inc., Class A | 2.8% |
Boeing Co. (The) | 2.3% |
Palo Alto Networks, Inc. | 2.1% |
Applied Materials, Inc. | 2.0% |
PayPal Holdings, Inc. | 1.8% |
| |
Top Five Industries | % of net assets |
Internet Software and Services | 14.1% |
Software | 7.9% |
IT Services | 7.3% |
Internet and Direct Marketing Retail | 6.7% |
Semiconductors and Semiconductor Equipment | 5.8% |
| |
Types of Investments in Portfolio | % of net assets |
Common Stocks | 100.1% |
Exchange-Traded Funds | 0.3% |
Total Equity Exposure | 100.4% |
Temporary Cash Investments | 0.1% |
Other Assets and Liabilities | (0.5)% |
Fund shareholders may incur two types of costs: (1) transaction costs, including sales charges (loads) on purchase payments and redemption/exchange fees; and (2) ongoing costs, including management fees; distribution and service (12b-1) fees; and other fund expenses. This example is intended to help you understand your ongoing costs (in dollars) of investing in your fund and to compare these costs with the ongoing cost of investing in other mutual funds.
The example is based on an investment of $1,000 made at the beginning of the period and held for the entire period from May 1, 2017 to October 31, 2017.
Actual Expenses
The table provides information about actual account values and actual expenses for each class. You may use the information, together with the amount you invested, to estimate the expenses that you paid over the period. First, identify the share class you own. Then simply divide your account value by $1,000 (for example, an $8,600 account value divided by $1,000 = 8.6), then multiply the result by the number under the heading “Expenses Paid During Period” to estimate the expenses you paid on your account during this period.
Hypothetical Example for Comparison Purposes
The table also provides information about hypothetical account values and hypothetical expenses based on the actual expense ratio of each class of your fund and an assumed rate of return of 5% per year before expenses, which is not the actual return of a fund’s share class. The hypothetical account values and expenses may not be used to estimate the actual ending account balance or expenses you paid for the period. You may use this information to compare the ongoing costs of investing in your fund and other funds. To do so, compare this 5% hypothetical example with the 5% hypothetical examples that appear in the shareholder reports of the other funds.
Please note that the expenses shown in the table are meant to highlight your ongoing costs only and do not reflect any transactional costs, such as sales charges (loads) or redemption/exchange fees. Therefore, the table is useful in comparing ongoing costs only, and will not help you determine the relative total costs of owning different funds. In addition, if these transactional costs were included, your costs would have been higher.
|
| | | | |
| Beginning
Account Value
5/1/17 | Ending
Account Value
10/31/17 | Expenses Paid
During Period(1)
5/1/17 - 10/31/17 |
Annualized
Expense Ratio(1) |
Actual | | | | |
G Class | $1,000 | $1,120.00 | $1.98 | 0.37% |
Hypothetical | | | | |
G Class | $1,000 | $1,023.34 | $1.89 | 0.37% |
| |
(1) | Expenses are equal to the class's annualized expense ratio listed in the table above, multiplied by the average account value over the period, multiplied by 184, the number of days in the most recent fiscal half-year, divided by 365, to reflect the one-half year period. Annualized expense ratio reflects actual expenses, including any applicable fee waivers or expense reimbursements and excluding any acquired fund fees and expenses. |
OCTOBER 31, 2017
|
| | | | | |
| Shares | Value |
COMMON STOCKS — 100.1% | | |
Aerospace and Defense — 3.3% | | |
Boeing Co. (The) | 123,978 |
| $ | 31,983,844 |
|
Lockheed Martin Corp. | 43,498 |
| 13,404,344 |
|
| | 45,388,188 |
|
Air Freight and Logistics — 1.1% | | |
XPO Logistics, Inc.(1) | 215,768 |
| 14,963,511 |
|
Airlines — 1.4% | | |
Delta Air Lines, Inc. | 387,804 |
| 19,401,834 |
|
Banks — 0.6% | | |
Bank of America Corp. | 315,300 |
| 8,636,067 |
|
Beverages — 4.0% | | |
PepsiCo, Inc. | 501,115 |
| 55,237,906 |
|
Biotechnology — 3.9% | | |
Amgen, Inc. | 89,309 |
| 15,648,723 |
|
Biogen, Inc.(1) | 64,128 |
| 19,986,133 |
|
Gilead Sciences, Inc. | 127,423 |
| 9,551,628 |
|
Incyte Corp.(1) | 32,613 |
| 3,693,422 |
|
Regeneron Pharmaceuticals, Inc.(1) | 12,441 |
| 5,008,995 |
|
| | 53,888,901 |
|
Capital Markets — 1.9% | | |
Charles Schwab Corp. (The) | 335,535 |
| 15,045,389 |
|
S&P Global, Inc. | 73,303 |
| 11,469,721 |
|
| | 26,515,110 |
|
Chemicals — 0.6% | | |
LyondellBasell Industries NV, Class A | 78,010 |
| 8,076,375 |
|
Communications Equipment — 2.1% | | |
Palo Alto Networks, Inc.(1) | 197,149 |
| 29,020,333 |
|
Consumer Finance — 1.0% | | |
American Express Co. | 142,579 |
| 13,619,146 |
|
Electronic Equipment, Instruments and Components — 0.7% | | |
CDW Corp. | 141,052 |
| 9,873,640 |
|
Energy Equipment and Services — 0.4% | | |
Halliburton Co. | 135,076 |
| 5,773,148 |
|
Equity Real Estate Investment Trusts (REITs) — 3.2% | | |
Equity Residential | 307,830 |
| 20,704,646 |
|
SBA Communications Corp.(1) | 142,098 |
| 22,334,963 |
|
| | 43,039,609 |
|
Food and Staples Retailing — 1.6% | | |
Wal-Mart Stores, Inc. | 250,827 |
| 21,899,705 |
|
Food Products — 0.8% | | |
Hormel Foods Corp. | 365,004 |
| 11,373,525 |
|
|
| | | | | |
| Shares | Value |
Health Care Equipment and Supplies — 4.7% | | |
ABIOMED, Inc.(1) | 29,256 |
| $ | 5,644,067 |
|
Boston Scientific Corp.(1) | 276,522 |
| 7,781,329 |
|
Edwards Lifesciences Corp.(1) | 187,060 |
| 19,123,144 |
|
Hologic, Inc.(1) | 46,160 |
| 1,747,156 |
|
IDEXX Laboratories, Inc.(1) | 40,686 |
| 6,760,793 |
|
Intuitive Surgical, Inc.(1) | 49,639 |
| 18,632,495 |
|
Penumbra, Inc.(1) | 39,513 |
| 3,973,032 |
|
| | 63,662,016 |
|
Health Care Providers and Services — 1.4% | | |
Quest Diagnostics, Inc. | 64,725 |
| 6,069,910 |
|
WellCare Health Plans, Inc.(1) | 67,474 |
| 13,342,309 |
|
| | 19,412,219 |
|
Health Care Technology — 0.6% | | |
Cerner Corp.(1) | 128,405 |
| 8,669,906 |
|
Hotels, Restaurants and Leisure — 3.8% | | |
Chipotle Mexican Grill, Inc.(1) | 35,974 |
| 9,781,331 |
|
Darden Restaurants, Inc. | 160,148 |
| 13,175,376 |
|
Las Vegas Sands Corp. | 174,141 |
| 11,037,056 |
|
Royal Caribbean Cruises Ltd. | 140,581 |
| 17,399,710 |
|
| | 51,393,473 |
|
Household Products — 1.3% | | |
Church & Dwight Co., Inc. | 236,431 |
| 10,679,588 |
|
Procter & Gamble Co. (The) | 78,957 |
| 6,817,148 |
|
| | 17,496,736 |
|
Industrial Conglomerates — 1.3% | | |
3M Co. | 79,847 |
| 18,379,981 |
|
Internet and Direct Marketing Retail — 6.7% | | |
Amazon.com, Inc.(1) | 68,392 |
| 75,592,310 |
|
Expedia, Inc. | 123,377 |
| 15,380,177 |
|
| | 90,972,487 |
|
Internet Software and Services — 14.1% | | |
Alphabet, Inc., Class A(1) | 102,435 |
| 105,819,452 |
|
Facebook, Inc., Class A(1) | 423,437 |
| 76,244,066 |
|
LogMeIn, Inc. | 45,254 |
| 5,477,997 |
|
VeriSign, Inc.(1) | 47,647 |
| 5,123,006 |
|
| | 192,664,521 |
|
IT Services — 7.3% | | |
DXC Technology Co. | 161,978 |
| 14,824,227 |
|
Fiserv, Inc.(1) | 108,208 |
| 14,005,361 |
|
Global Payments, Inc. | 80,323 |
| 8,349,576 |
|
PayPal Holdings, Inc.(1) | 343,894 |
| 24,952,949 |
|
Visa, Inc., Class A | 345,632 |
| 38,012,607 |
|
| | 100,144,720 |
|
Life Sciences Tools and Services — 1.5% | | |
Agilent Technologies, Inc. | 177,565 |
| 12,079,747 |
|
Illumina, Inc.(1) | 15,118 |
| 3,102,062 |
|
|
| | | | | |
| Shares | Value |
Waters Corp.(1) | 26,335 |
| $ | 5,162,977 |
|
| | 20,344,786 |
|
Machinery — 3.3% | | |
Caterpillar, Inc. | 90,869 |
| 12,340,010 |
|
Cummins, Inc. | 80,783 |
| 14,288,897 |
|
Parker-Hannifin Corp. | 51,308 |
| 9,369,354 |
|
WABCO Holdings, Inc.(1) | 57,118 |
| 8,428,903 |
|
| | 44,427,164 |
|
Media — 1.8% | | |
Comcast Corp., Class A | 332,428 |
| 11,977,381 |
|
DISH Network Corp., Class A(1) | 59,900 |
| 2,907,546 |
|
Liberty Media Corp-Liberty Formula One, Class C(1) | 104,745 |
| 3,994,974 |
|
Sirius XM Holdings, Inc. | 1,078,495 |
| 5,867,013 |
|
| | 24,746,914 |
|
Multiline Retail — 3.0% | | |
Dollar Tree, Inc.(1) | 188,742 |
| 17,222,707 |
|
Target Corp. | 392,266 |
| 23,159,385 |
|
| | 40,382,092 |
|
Oil, Gas and Consumable Fuels — 0.4% | | |
Concho Resources, Inc.(1) | 37,576 |
| 5,043,075 |
|
Personal Products — 1.0% | | |
Estee Lauder Cos., Inc. (The), Class A | 119,134 |
| 13,320,373 |
|
Pharmaceuticals — 0.8% | | |
Bristol-Myers Squibb Co. | 56,177 |
| 3,463,874 |
|
Johnson & Johnson | 52,733 |
| 7,351,507 |
|
| | 10,815,381 |
|
Road and Rail — 1.5% | | |
Union Pacific Corp. | 170,839 |
| 19,781,448 |
|
Semiconductors and Semiconductor Equipment — 5.8% | | |
Applied Materials, Inc. | 490,759 |
| 27,693,530 |
|
ASML Holding NV | 130,132 |
| 23,465,234 |
|
Broadcom Ltd. | 61,310 |
| 16,180,322 |
|
Maxim Integrated Products, Inc. | 214,216 |
| 11,254,909 |
|
| | 78,593,995 |
|
Software — 7.9% | | |
Activision Blizzard, Inc. | 212,965 |
| 13,947,078 |
|
Electronic Arts, Inc.(1) | 103,449 |
| 12,372,501 |
|
Microsoft Corp. | 299,811 |
| 24,938,279 |
|
Oracle Corp. (New York) | 205,089 |
| 10,439,030 |
|
salesforce.com, Inc.(1) | 182,104 |
| 18,636,523 |
|
Splunk, Inc.(1) | 157,424 |
| 10,594,635 |
|
Symantec Corp. | 192,156 |
| 6,245,070 |
|
VMware, Inc., Class A(1) | 86,168 |
| 10,313,448 |
|
| | 107,486,564 |
|
Specialty Retail — 0.7% | | |
TJX Cos., Inc. (The) | 137,849 |
| 9,621,860 |
|
|
| | | | | |
| Shares | Value |
Technology Hardware, Storage and Peripherals — 4.1% | | |
Apple, Inc. | 327,017 |
| $ | 55,278,954 |
|
Textiles, Apparel and Luxury Goods — 0.5% | | |
Tapestry, Inc. | 150,298 |
| 6,154,703 |
|
TOTAL COMMON STOCKS
(Cost $941,618,995) | | 1,365,500,366 |
|
EXCHANGE-TRADED FUNDS — 0.3% | | |
iShares Russell 1000 Growth ETF
(Cost $4,339,889) | 33,784 |
| 4,390,569 |
|
TEMPORARY CASH INVESTMENTS — 0.1% | | |
Repurchase Agreement, BMO Capital Markets Corp., (collateralized by various U.S. Treasury obligations, 0.375% - 1.375%, 1/15/27 - 2/15/45, valued at $897,895), in a joint trading account at 0.88%, dated 10/31/17, due 11/1/17 (Delivery value $878,294) | | 878,273 |
|
Repurchase Agreement, Fixed Income Clearing Corp., (collateralized by various U.S. Treasury obligations, 2.50%, 5/15/46, valued at $749,450), at 0.34%, dated 10/31/17, due 11/1/17 (Delivery value $732,007) | | 732,000 |
|
State Street Institutional U.S. Government Money Market Fund, Premier Class | 255,792 |
| 255,792 |
|
TOTAL TEMPORARY CASH INVESTMENTS
(Cost $1,866,065) | | 1,866,065 |
|
TOTAL INVESTMENT SECURITIES — 100.5%
(Cost $947,824,949) | | 1,371,757,000 |
|
OTHER ASSETS AND LIABILITIES — (0.5)% | | (7,016,372 | ) |
TOTAL NET ASSETS — 100.0% | | $ | 1,364,740,628 |
|
|
| | | | | | | | | | |
FORWARD FOREIGN CURRENCY EXCHANGE CONTRACTS | | |
Currency Purchased | Currency Sold | Counterparty | Settlement Date | Unrealized Appreciation
(Depreciation) |
USD | 18,481,721 |
| EUR | 15,592,836 |
| UBS AG | 12/29/17 | $ | 257,277 |
|
USD | 676,228 |
| EUR | 570,194 |
| UBS AG | 12/29/17 | 9,801 |
|
USD | 543,643 |
| EUR | 460,678 |
| UBS AG | 12/29/17 | 5,216 |
|
USD | 506,345 |
| EUR | 433,997 |
| UBS AG | 12/29/17 | (899 | ) |
| | | | | | $ | 271,395 |
|
|
| | |
NOTES TO SCHEDULE OF INVESTMENTS |
EUR | - | Euro |
USD | - | United States Dollar |
See Notes to Financial Statements.
|
|
Statement of Assets and Liabilities |
|
| | | |
OCTOBER 31, 2017 | |
Assets | |
Investment securities, at value (cost of $947,824,949) | $ | 1,371,757,000 |
|
Receivable for investments sold | 11,186,638 |
|
Receivable for variation margin on futures contracts | 17,525 |
|
Unrealized appreciation on forward foreign currency exchange contracts | 272,294 |
|
Dividends and interest receivable | 358,590 |
|
| 1,383,592,047 |
|
| |
Liabilities | |
Disbursements in excess of demand deposit cash | 2,795 |
|
Payable for investments purchased | 646,885 |
|
Payable for capital shares redeemed | 18,185,306 |
|
Unrealized depreciation on forward foreign currency exchange contracts | 899 |
|
Accrued other expenses | 15,534 |
|
| 18,851,419 |
|
| |
Net Assets | $ | 1,364,740,628 |
|
| |
G Class Capital Shares, $0.01 Par Value | |
Shares authorized | 660,000,000 |
|
Shares outstanding | 74,250,702 |
|
| |
Net Asset Value Per Share | $ | 18.38 |
|
| |
Net Assets Consist of: | |
Capital (par value and paid-in surplus) | $ | 822,674,181 |
|
Undistributed net investment income | 5,473,332 |
|
Undistributed net realized gain | 112,389,615 |
|
Net unrealized appreciation | 424,203,500 |
|
| $ | 1,364,740,628 |
|
See Notes to Financial Statements.
|
| | | |
YEAR ENDED OCTOBER 31, 2017 |
Investment Income (Loss) |
Income: | |
Dividends (net of foreign taxes withheld of $10,931) | $ | 16,118,428 |
|
Interest | 34,235 |
|
| 16,152,663 |
|
| |
Expenses: | |
Management fees | 9,477,753 |
|
Directors' fees and expenses | 40,518 |
|
Other expenses | 47,647 |
|
| 9,565,918 |
|
Fees waived - G Class | (2,145,687 | ) |
| 7,420,231 |
|
| |
Net investment income (loss) | 8,732,432 |
|
| |
Realized and Unrealized Gain (Loss) | |
Net realized gain (loss) on: | |
Investment transactions | 119,095,025 |
|
Forward foreign currency exchange contract transactions | (406,843 | ) |
Futures contract transactions | (704,709 | ) |
Foreign currency translation transactions | 6,210 |
|
| 117,989,683 |
|
| |
Change in net unrealized appreciation (depreciation) on: | |
Investments | 204,271,801 |
|
Forward foreign currency exchange contracts | 89,403 |
|
Translation of assets and liabilities in foreign currencies | 53 |
|
| 204,361,257 |
|
| |
Net realized and unrealized gain (loss) | 322,350,940 |
|
| |
Net Increase (Decrease) in Net Assets Resulting from Operations | $ | 331,083,372 |
|
See Notes to Financial Statements.
|
|
Statement of Changes in Net Assets |
|
| | | | | | |
YEARS ENDED OCTOBER 31, 2017 AND OCTOBER 31, 2016 |
Increase (Decrease) in Net Assets | October 31, 2017 | October 31, 2016 |
Operations | | |
Net investment income (loss) | $ | 8,732,432 |
| $ | 8,665,449 |
|
Net realized gain (loss) | 117,989,683 |
| 17,371,506 |
|
Change in net unrealized appreciation (depreciation) | 204,361,257 |
| (11,186,280 | ) |
Net increase (decrease) in net assets resulting from operations | 331,083,372 |
| 14,850,675 |
|
| | |
Distributions to Shareholders | | |
From net investment income: | | |
G Class | (8,520,575 | ) | (4,751,626 | ) |
R6 Class | (1,102,965 | ) | (402,024 | ) |
From net realized gains: | | |
G Class | (17,018,924 | ) | (61,284,133 | ) |
R6 Class | (1,839,876 | ) | (3,940,677 | ) |
Decrease in net assets from distributions | (28,482,340 | ) | (70,378,460 | ) |
| | |
Capital Share Transactions | | |
Net increase (decrease) in net assets from capital share transactions (Note 5) | (149,696,725 | ) | 158,651,324 |
|
| | |
Net increase (decrease) in net assets | 152,904,307 |
| 103,123,539 |
|
| | |
Net Assets | | |
Beginning of period | 1,211,836,321 |
| 1,108,712,782 |
|
End of period | $ | 1,364,740,628 |
| $ | 1,211,836,321 |
|
| | |
Undistributed net investment income | $ | 5,473,332 |
| $ | 7,131,452 |
|
See Notes to Financial Statements.
|
|
Notes to Financial Statements |
OCTOBER 31, 2017
1. Organization
American Century Mutual Funds, Inc. (the corporation) is registered under the Investment Company Act of 1940, as amended (the 1940 Act), as an open-end management investment company and is organized as a Maryland corporation. NT Growth Fund (the fund) is one fund in a series issued by the corporation. The fund's investment objective is to seek long-term capital growth. The fund is not permitted to invest in securities issued by companies assigned the Global Industry Classification Standard or the Bloomberg Industry Classification Standard for the tobacco industry. The fund offers the G Class (formerly Institutional Class). On July 31, 2017, all outstanding R6 Class shares were converted to G Class shares and the fund discontinued offering the R6 Class.
2. Significant Accounting Policies
The following is a summary of significant accounting policies consistently followed by the fund in preparation of its financial statements. The fund is an investment company and follows accounting and reporting guidance in accordance with accounting principles generally accepted in the United States of America. This may require management to make certain estimates and assumptions at the date of the financial statements. Actual results could differ from these estimates. Management evaluated the impact of events or transactions occurring through the date the financial statements were issued that would merit recognition or disclosure.
Investment Valuations — The fund determines the fair value of its investments and computes its net asset value per share at the close of regular trading (usually 4 p.m. Eastern time) on the New York Stock Exchange (NYSE) on each day the NYSE is open. The Board of Directors has adopted valuation policies and procedures to guide the investment advisor in the fund’s investment valuation process and to provide methodologies for the oversight of the fund’s pricing function.
Equity securities that are listed or traded on a domestic securities exchange are valued at the last reported sales price or at the official closing price as provided by the exchange. Equity securities traded on foreign securities exchanges are generally valued at the closing price of such securities on the exchange where primarily traded or at the close of the NYSE, if that is earlier. If no last sales price is reported, or if local convention or regulation so provides, the mean of the latest bid and asked prices may be used. Securities traded over-the-counter are valued at the mean of the latest bid and asked prices, the last sales price, or the official closing price. Equity securities initially expressed in local currencies are translated into U.S. dollars at the mean of the appropriate currency exchange rate at the close of the NYSE as provided by an independent pricing service.
Open-end management investment companies are valued at the reported net asset value per share. Repurchase agreements are valued at cost, which approximates fair value. Exchange-traded futures contracts are valued at the settlement price as provided by the appropriate clearing corporation. Forward foreign currency exchange contracts are valued at the mean of the appropriate forward exchange rate at the close of the NYSE as provided by an independent pricing service.
If the fund determines that the market price for an investment is not readily available or the valuation methods mentioned above do not reflect an investment’s fair value, such investment is valued as determined in good faith by the Board of Directors or its delegate, in accordance with policies and procedures adopted by the Board of Directors. In its determination of fair value, the fund may review several factors including, but not limited to, market information regarding the specific investment or comparable investments and correlation with other investment types, futures indices or general market indicators. Circumstances that may cause the fund to use these procedures to value an investment include, but are not limited to: an investment has been declared in default or is distressed; trading in a security has been suspended during the trading day or a security is not actively trading on its principal exchange; prices received from a regular pricing source are deemed unreliable; or there is a foreign market holiday and no trading occurred.
The fund monitors for significant events occurring after the close of an investment’s primary exchange but before the fund’s net asset value per share is determined. Significant events may include, but are not limited to: corporate announcements and transactions; governmental action and political unrest that could impact a specific investment or an investment sector; or armed conflicts, natural disasters and similar events that could
affect investments in a specific country or region. The fund also monitors for significant fluctuations between domestic and foreign markets, as evidenced by the U.S. market or such other indicators that the Board of Directors, or its delegate, deems appropriate. If significant fluctuations in foreign markets are identified, the fund may apply a model-derived factor to the closing price of equity securities traded on foreign securities exchanges. The factor is based on observable market data as provided by an independent pricing service.
Security Transactions — Security transactions are accounted for as of the trade date. Net realized gains and losses are determined on the identified cost basis, which is also used for federal income tax purposes.
Investment Income — Dividend income less foreign taxes withheld, if any, is recorded as of the ex-dividend date. Distributions received on securities that represent a return of capital or long-term capital gain are recorded as a reduction of cost of investments and/or as a realized gain. The fund may estimate the components of distributions received that may be considered nontaxable distributions or long-term capital gain distributions for income tax purposes. Interest income is recorded on the accrual basis and includes accretion of discounts and amortization of premiums.
Foreign Currency Translations — All assets and liabilities initially expressed in foreign currencies are translated into U.S. dollars at prevailing exchange rates at period end. The fund may enter into spot foreign currency exchange contracts to facilitate transactions denominated in a foreign currency. Purchases and sales of investment securities, dividend and interest income, spot foreign currency exchange contracts, and expenses are translated at the rates of exchange prevailing on the respective dates of such transactions. Net realized and unrealized foreign currency exchange gains or losses related to investment securities are a component of net realized gain (loss) on investment transactions and change in net unrealized appreciation (depreciation) on investments, respectively.
Repurchase Agreements — The fund may enter into repurchase agreements with institutions that American Century Investment Management, Inc. (ACIM) (the investment advisor) has determined are creditworthy pursuant to criteria adopted by the Board of Directors. The fund requires that the collateral, represented by securities, received in a repurchase transaction be transferred to the custodian in a manner sufficient to enable the fund to obtain those securities in the event of a default under the repurchase agreement. ACIM monitors, on a daily basis, the securities transferred to ensure the value, including accrued interest, of the securities under each repurchase agreement is equal to or greater than amounts owed to the fund under each repurchase agreement.
Joint Trading Account — Pursuant to an Exemptive Order issued by the Securities and Exchange Commission, the fund, along with certain other funds in the American Century Investments family of funds, may transfer uninvested cash balances into a joint trading account. These balances are invested in one or more repurchase agreements that are collateralized by U.S. Treasury or Agency obligations.
Segregated Assets — In accordance with the 1940 Act, the fund segregates assets on its books and records to cover futures contracts. ACIM monitors, on a daily basis, the securities segregated to ensure the fund designates a sufficient amount of liquid assets, marked-to-market daily. The fund may also receive assets or be required to pledge assets at the custodian bank or with a broker for margin requirements on futures contracts.
Income Tax Status — It is the fund’s policy to distribute substantially all net investment income and net realized gains to shareholders and to otherwise qualify as a regulated investment company under provisions of the Internal Revenue Code. Accordingly, no provision has been made for income taxes. The fund files U.S. federal, state, local and non-U.S. tax returns as applicable. The fund's tax returns are subject to examination by the relevant taxing authority until expiration of the applicable statute of limitations, which is generally three years from the date of filing but can be longer in certain jurisdictions. At this time, management believes there are no uncertain tax positions which, based on their technical merit, would not be sustained upon examination and for which it is reasonably possible that the total amounts of unrecognized tax benefits will significantly change in the next twelve months.
Multiple Class — All shares of the fund represent an equal pro rata interest in the net assets of the class to which such shares belong, and have identical voting, dividend, liquidation and other rights and the same terms and conditions, except for class specific expenses and exclusive rights to vote on matters affecting only individual classes. Income, non-class specific expenses, and realized and unrealized capital gains and losses of the fund are allocated to each class of shares based on their relative net assets.
Distributions to Shareholders — Distributions from net investment income and net realized gains, if any, are generally declared and paid annually.
Indemnifications — Under the corporation’s organizational documents, its officers and directors are indemnified against certain liabilities arising out of the performance of their duties to the fund. In addition, in the normal course of business, the fund enters into contracts that provide general indemnifications. The maximum exposure under these arrangements is unknown as this would involve future claims that may be made against a fund. The risk of material loss from such claims is considered by management to be remote.
3. Fees and Transactions with Related Parties
Certain officers and directors of the corporation are also officers and/or directors of American Century Companies, Inc. (ACC). The corporation’s investment advisor, ACIM, the corporation's distributor, American Century Investment Services, Inc., and the corporation’s transfer agent, American Century Services, LLC, are wholly owned, directly or indirectly, by ACC. Various funds issued by American Century Asset Allocation Portfolios, Inc. own, in aggregate, 100% of the shares of the fund. Related parties do not invest in the fund for the purpose of exercising management or control.
Management Fees — The corporation has entered into a management agreement with ACIM, under which ACIM provides the fund with investment advisory and management services in exchange for a single, unified management fee (the fee) per class. The agreement provides that all expenses of managing and operating the fund, except distribution and service fees, brokerage expenses, taxes, interest, fees and expenses of the independent directors (including legal counsel fees), and extraordinary expenses, will be paid by ACIM. The fee is computed and accrued daily based on each class's daily net assets and paid monthly in arrears. The rate of the fee is determined by applying a fee rate calculation formula. This formula takes into account the fund’s assets as well as certain assets, if any, of other clients of the investment advisor outside the American Century Investments family of funds (such as subadvised funds and separate accounts) that use very similar investment teams and strategies (strategy assets). The strategy assets of the fund also include the assets of Growth Fund, one fund in a series issued by the corporation. The management fee schedule ranges from 0.450% to 0.640% for the G Class. Prior to July 31, 2017, the management fee schedule ranged from 0.600% to 0.790% for the G Class and 0.450% to 0.640% for the R6 Class. Effective July 31, 2017, the investment advisor agreed to waive the G Class’s management fee in its entirety. The investment advisor expects this waiver to remain in effect permanently and cannot terminate it without the approval of the Board of Directors. The effective annual management fee for the period ended October 31, 2017 was 0.73% before waiver and 0.55% after waiver for the G Class.
Directors' Fees and Expenses — The Board of Directors is responsible for overseeing the investment advisor’s management and operations of the fund. The directors receive detailed information about the fund and its investment advisor regularly throughout the year, and meet at least quarterly with management of the investment advisor to review reports about fund operations. The fund’s officers do not receive compensation from the fund.
Interfund Transactions — The fund may enter into security transactions with other American Century Investments funds and other client accounts of the investment advisor, in accordance with the 1940 Act rules and procedures adopted by the Board of Directors. The rules and procedures require, among other things, that these transactions be effected at the independent current market price of the security. During the period, the interfund purchases and sales were $8,184,939 and $9,521,931, respectively. The effect of interfund transactions on the Statement of Operations was $1,249,594 in net realized gain (loss) on investment transactions.
4. Investment Transactions
Purchases and sales of investment securities, excluding short-term investments, for the period ended October 31, 2017 were $832,595,269 and $994,290,004, respectively.
5. Capital Share Transactions
Transactions in shares of the fund were as follows:
|
| | | | | | | | | | |
| Year ended October 31, 2017 | Year ended
October 31, 2016 |
| Shares | Amount | Shares | Amount |
G Class/Shares Authorized | 660,000,000 |
| | 475,000,000 |
| |
Sold | 13,727,570 |
| $ | 228,420,327 |
| 11,629,984 |
| $ | 160,606,033 |
|
Issued in reinvestment of distributions | 1,719,832 |
| 25,539,499 |
| 4,617,885 |
| 66,035,759 |
|
Redeemed | (16,787,555 | ) | (274,474,628 | ) | (8,178,147 | ) | (120,163,445 | ) |
| (1,340,153 | ) | (20,514,802 | ) | 8,069,722 |
| 106,478,347 |
|
R6 Class/Shares Authorized | N/A |
| | 55,000,000 |
| |
Sold | 2,372,292 |
| 36,926,033 |
| 3,717,992 |
| 53,645,133 |
|
Issued in reinvestment of distributions | 198,438 |
| 2,942,841 |
| 304,111 |
| 4,342,701 |
|
Redeemed | (9,893,780 | ) | (169,050,797 | ) | (401,556 | ) | (5,814,857 | ) |
| (7,323,050 | ) | (129,181,923 | ) | 3,620,547 |
| 52,172,977 |
|
Net increase (decrease) | (8,663,203 | ) | $ | (149,696,725 | ) | 11,690,269 |
| $ | 158,651,324 |
|
6. Fair Value Measurements
The fund’s investments valuation process is based on several considerations and may use multiple inputs to determine the fair value of the investments held by the fund. In conformity with accounting principles generally accepted in the United States of America, the inputs used to determine a valuation are classified into three broad levels.
| |
• | Level 1 valuation inputs consist of unadjusted quoted prices in an active market for identical investments. |
| |
• | Level 2 valuation inputs consist of direct or indirect observable market data (including quoted prices for comparable investments, evaluations of subsequent market events, interest rates, prepayment speeds, credit risk, etc.). These inputs also consist of quoted prices for identical investments initially expressed in local currencies that are adjusted through translation into U.S. dollars. |
| |
• | Level 3 valuation inputs consist of unobservable data (including a fund’s own assumptions). |
The level classification is based on the lowest level input that is significant to the fair valuation measurement. The valuation inputs are not necessarily an indication of the risks associated with investing in these securities or other financial instruments. There were no significant transfers between levels during the period.
The following is a summary of the level classifications as of period end. The Schedule of Investments provides additional information on the fund’s portfolio holdings.
|
| | | | | | | | |
| Level 1 | Level 2 | Level 3 |
Assets | | | |
Investment Securities | | | |
Common Stocks | $ | 1,342,035,132 |
| $ | 23,465,234 |
| — |
|
Exchange-Traded Funds | 4,390,569 |
| — |
| — |
|
Temporary Cash Investments | 255,792 |
| 1,610,273 |
| — |
|
| $ | 1,346,681,493 |
| $ | 25,075,507 |
| — |
|
Other Financial Instruments | | | |
Forward Foreign Currency Exchange Contracts | — |
| $ | 272,294 |
| — |
|
| | | |
Liabilities | | | |
Other Financial Instruments | | | |
Forward Foreign Currency Exchange Contracts | — |
| $ | 899 |
| — |
|
7. Derivative Instruments
Equity Price Risk — The fund is subject to equity price risk in the normal course of pursuing its investment objectives. A fund may enter into futures contracts based on an equity index in order to manage its exposure to changes in market conditions. A fund may purchase futures contracts to gain exposure to increases in market value or sell futures contracts to protect against a decline in market value. Upon entering into a futures contract, a fund is required to deposit either cash or securities in an amount equal to a certain percentage of the contract value (initial margin). Subsequent payments (variation margin) are made or received daily, in cash, by a fund. The variation margin is equal to the daily change in the contract value and is recorded as unrealized gains and losses. A fund recognizes a realized gain or loss when the contract is closed or expires. Net realized and unrealized gains or losses occurring during the holding period of futures contracts are a component of net realized gain (loss) on futures contract transactions and change in net unrealized appreciation (depreciation) on futures contracts, respectively. One of the risks of entering into futures contracts is the possibility that the change in value of the contract may not correlate with the changes in value of the underlying securities. During the period, the fund participated in equity price risk derivative instruments for temporary investment purposes.
Foreign Currency Risk — The fund is subject to foreign currency exchange rate risk in the normal course of pursuing its investment objectives. The value of foreign investments held by a fund may be significantly affected by changes in foreign currency exchange rates. The dollar value of a foreign security generally decreases when the value of the dollar rises against the foreign currency in which the security is denominated and tends to increase when the value of the dollar declines against such foreign currency. A fund may enter into forward foreign currency exchange contracts to reduce a fund's exposure to foreign currency exchange rate fluctuations. The net U.S. dollar value of foreign currency underlying all contractual commitments held by a fund and the resulting unrealized appreciation or depreciation are determined daily. Realized gain or loss is recorded upon the termination of the contract. Net realized and unrealized gains or losses occurring during the holding period of forward foreign currency exchange contracts are a component of net realized gain (loss) on forward foreign currency exchange contract transactions and change in net unrealized appreciation (depreciation) on forward foreign currency exchange contracts, respectively. A fund bears the risk of an unfavorable change in the foreign currency exchange rate underlying the forward contract. Additionally, losses, up to the fair value, may arise if the counterparties do not perform under the contract terms. The fund's average U.S. dollar exposure to foreign currency risk derivative instruments held during the period was $12,438,470.
Value of Derivative Instruments as of October 31, 2017
|
| | | | | | | | |
| Asset Derivatives | Liability Derivatives |
Type of Risk Exposure | Location on Statement of Assets and Liabilities | Value | Location on Statement of Assets and Liabilities | Value |
Equity Price Risk | Receivable for variation margin on futures contracts* | $ | 17,525 |
| Payable for variation margin on futures contracts* | — |
|
Foreign Currency Risk | Unrealized appreciation on forward foreign currency exchange contracts | 272,294 |
| Unrealized depreciation on forward foreign currency exchange contracts | $ | 899 |
|
| | $ | 289,819 |
| | $ | 899 |
|
*Included in the unrealized appreciation (depreciation) on futures contracts as reported in the Schedule of Investments.
Effect of Derivative Instruments on the Statement of Operations for the Year Ended October 31, 2017
|
| | | | | | | | |
| Net Realized Gain (Loss) | Change in Net Unrealized Appreciation (Depreciation) |
Type of Risk Exposure | Location on Statement of Operations | Value | Location on Statement of Operations | Value |
Equity Price Risk | Net realized gain (loss) on futures contract transactions | $ | (704,709 | ) | Change in net unrealized appreciation (depreciation) on futures contracts | — |
|
Foreign Currency Risk | Net realized gain (loss) on forward foreign currency exchange contract transactions | (406,843 | ) | Change in net unrealized appreciation (depreciation) on forward foreign currency exchange contracts | $ | 89,403 |
|
| | $ | (1,111,552 | ) | | $ | 89,403 |
|
8. Federal Tax Information
The tax character of distributions paid during the years ended October 31, 2017 and October 31, 2016 were as follows:
|
| | | | | | |
| 2017 | 2016 |
Distributions Paid From | | |
Ordinary income | $ | 9,623,540 |
| $ | 30,362,423 |
|
Long-term capital gains | $ | 18,858,800 |
| $ | 40,016,037 |
|
The book-basis character of distributions made during the year from net investment income or net realized gains may differ from their ultimate characterization for federal income tax purposes. These differences reflect the differing character of certain income items and net realized gains and losses for financial statement and tax purposes, and may result in reclassification among certain capital accounts on the financial statements.
As of period end, the federal tax cost of investments and the components of distributable earnings on a tax-basis were as follows:
|
| | | |
Federal tax cost of investments | $ | 952,949,699 |
|
Gross tax appreciation of investments | $ | 425,324,281 |
|
Gross tax depreciation of investments | (6,516,980 | ) |
Net tax appreciation (depreciation) of investments | 418,807,301 |
|
Net tax appreciation (depreciation) on derivatives and translation of assets and liabilities in foreign currencies | 54 |
|
Net tax appreciation (depreciation) | $ | 418,807,355 |
|
Undistributed ordinary income | $ | 34,746,734 |
|
Accumulated long-term gains | $ | 88,512,358 |
|
The difference between book-basis and tax-basis unrealized appreciation (depreciation) is attributable primarily to the tax deferral of losses on wash sales.
|
| | | | | | | | | | | | | | | |
For a Share Outstanding Throughout the Years Ended October 31 (except as noted) | |
Per-Share Data | | | | | | | | | Ratios and Supplemental Data |
| | Income From Investment Operations: | Distributions From: | | | Ratio to Average Net Assets of: | |
| Net Asset Value, Beginning of Period | Net Investment Income (Loss)(1) | Net Realized and Unrealized Gain (Loss) | Total From Investment Operations | Net Investment Income | Net Realized Gains | Total Distributions | Net Asset Value, End of Period | Total Return(2) | Operating Expenses | Net Investment Income (Loss) | Portfolio Turnover Rate | Net Assets, End of Period (in thousands) |
G Class(3) | | | | | | | | | | | | |
2017 | $14.62 | 0.11 | 4.00 | 4.11 | (0.12) | (0.23) | (0.35) | $18.38 | 28.64% | 0.56%(4) | 0.67%(4) | 64% |
| $1,364,741 |
|
2016 | $15.57 | 0.11 | (0.06) | 0.05 | (0.07) | (0.93) | (1.00) | $14.62 | 0.49% | 0.78% | 0.74% | 60% |
| $1,104,817 |
|
2015 | $16.82 | 0.08 | 1.17 | 1.25 | (0.08) | (2.42) | (2.50) | $15.57 | 8.97% | 0.77% | 0.52% | 82% |
| $1,051,077 |
|
2014 | $15.42 | 0.08 | 2.02 | 2.10 | (0.09) | (0.61) | (0.70) | $16.82 | 14.17% | 0.77% | 0.50% | 119% |
| $1,234,784 |
|
2013 | $12.72 | 0.12 | 3.08 | 3.20 | (0.10) | (0.40) | (0.50) | $15.42 | 26.05% | 0.77% | 0.85% | 77% |
| $995,575 |
|
|
|
Notes to Financial Highlights |
| |
(1) | Computed using average shares outstanding throughout the period. |
| |
(2) | Total returns are calculated based on the net asset value of the last business day. Total returns for periods less than one year are not annualized. |
| |
(3) | Prior to July 31, 2017, the G Class was referred to as the Institutional Class. |
| |
(4) | The ratio of operating expenses to average net assets before expense waiver and the ratio of net investment income (loss) to average net assets before expense waiver was 0.74% and 0.49%, respectively. |
See Notes to Financial Statements.
|
|
Report of Independent Registered Public Accounting Firm |
To the Board of Directors and Shareholders of American Century Mutual Funds, Inc.:
We have audited the accompanying statement of assets and liabilities, including the schedule of investments, of NT Growth Fund (the “Fund”), one of the funds constituting American Century Mutual Funds, Inc., as of October 31, 2017, and the related statement of operations for the year then ended, the statements of changes in net assets for each of the two years in the period then ended, and the financial highlights for each of the five years in the period then ended. These financial statements and financial highlights are the responsibility of the Fund’s management. Our responsibility is to express an opinion on these financial statements and financial highlights based on our audits.
We conducted our audits in accordance with the standards of the Public Company Accounting Oversight Board (United States). Those standards require that we plan and perform the audit to obtain reasonable assurance about whether the financial statements and financial highlights are free of material misstatement. The Fund is not required to have, nor were we engaged to perform, an audit of its internal control over financial reporting. Our audits included consideration of internal control over financial reporting as a basis for designing audit procedures that are appropriate in the circumstances, but not for the purpose of expressing an opinion on the effectiveness of the Fund’s internal control over financial reporting. Accordingly, we express no such opinion. An audit also includes examining, on a test basis, evidence supporting the amounts and disclosures in the financial statements, assessing the accounting principles used and significant estimates made by management, as well as evaluating the overall financial statement presentation. Our procedures included confirmation of securities owned as of October 31, 2017, by correspondence with the custodian and brokers; when replies were not received from brokers, we performed other auditing procedures. We believe that our audits provide a reasonable basis for our opinion.
In our opinion, the financial statements and financial highlights referred to above present fairly, in all material respects, the financial position of NT Growth Fund of American Century Mutual Funds, Inc. as of October 31, 2017, the results of its operations for the year then ended, the changes in its net assets for each of the two years in the period then ended, and the financial highlights for each of the five years in the period then ended, in conformity with accounting principles generally accepted in the United States of America.
DELOITTE & TOUCHE LLP
Kansas City, Missouri
December 15, 2017
The Board of Directors
The individuals listed below serve as directors of the funds. Each director will continue to serve in this capacity until death, retirement, resignation or removal from office. The board has adopted a mandatory retirement age for directors who are not “interested persons,” as that term is defined in the Investment Company Act (independent directors). Independent directors shall retire by December 31 of the year in which they reach their 75th birthday.
Mr. Thomas is an “interested person” because he currently serves as President and Chief Executive Officer of American Century Companies, Inc. (ACC), the parent company of American Century Investment Management, Inc. (ACIM or the advisor). The other directors (more than three-fourths of the total number) are independent. They are not employees, directors or officers of, and have no financial interest in, ACC or any of its wholly owned, direct or indirect, subsidiaries, including ACIM, American Century Investment Services, Inc. (ACIS) and American Century Services, LLC (ACS), and they do not have any other affiliations, positions or relationships that would cause them to be considered “interested persons” under the Investment Company Act. The directors serve in this capacity for seven (in the case of Mr. Thomas, 15) registered investment companies in the American Century Investments family of funds.
The following table presents additional information about the directors. The mailing address for each director is 4500 Main Street, Kansas City, Missouri 64111.
|
| | | | | |
Name
(Year of Birth) | Position(s) Held with Funds | Length of Time Served | Principal Occupation(s) During Past 5 Years | Number of American Century Portfolios Overseen by Director | Other Directorships Held During Past 5 Years |
Independent Directors |
|
|
Thomas W. Bunn (1953) | Director | Since 2017 | Retired | 69 | SquareTwo Financial; Barings (formerly Babson Capital Funds Trust) (2013 to 2016) |
Barry Fink
(1955) | Director | Since 2012 (independent since 2016) | Retired; Executive Vice President, ACC (2007 to 2013); President, ACS (2007 to 2013); Chief Operating Officer, ACC (2007 to 2012) | 69 | None |
Andrea C. Hall
(1945) | Director | Since 1997 | Retired | 69 | None |
Jan M. Lewis
(1957) | Director | Since 2011 | Retired; President and Chief Executive Officer, Catholic Charities of Northeast Kansas (human services organization) (2006 to 2013) | 69 | None |
James A. Olson
(1942) | Director and Chairman of the Board | Since 2007 (Chairman since 2014) | Member, Plaza Belmont LLC (private equity fund manager) (1999 to present) | 69 | Saia, Inc. (2002 to 2012) and EPR Properties (2003 to 2013) |
|
| | | | | |
Name
(Year of Birth) | Position(s) Held with Funds | Length of Time Served | Principal Occupation(s) During Past 5 Years | Number of American Century Portfolios Overseen by Director | Other Directorships Held During Past 5 Years |
Independent Directors |
|
|
M. Jeannine Strandjord
(1945) | Director | Since 1994 | Retired | 69 | Euronet Worldwide Inc.; MGP Ingredients, Inc.; and DST Systems Inc. (1996 to 2012) |
John R. Whitten
(1946) | Director | Since 2008 | Retired | 69 | Rudolph Technologies, Inc. |
Stephen E. Yates
(1948) | Director | Since 2012 | Retired | 69 | None |
Interested Director |
|
|
Jonathan S. Thomas
(1963) | Director and President | Since 2007 | President and Chief Executive Officer, ACC (2007 to present). Also serves as Chief Executive Officer, ACS; Executive Vice President, ACIM; Director, ACC, ACIM and other ACC subsidiaries | 114 | BioMed Valley Discoveries, Inc. |
The Statement of Additional Information has additional information about the fund's directors and is available without charge, upon request, by calling 1-800-345-2021.
Officers
The following table presents certain information about the executive officers of the funds. Each officer serves as an officer for each of the 15 investment companies in the American Century family of funds, unless otherwise noted. No officer is compensated for his or her service as an officer of the funds. The listed officers are interested persons of the funds and are appointed or re-appointed on an annual basis. The mailing address for each officer listed below is 4500 Main Street, Kansas City, Missouri 64111.
|
| | |
Name
(Year of Birth) | Offices with the Funds | Principal Occupation(s) During the Past Five Years |
Jonathan S. Thomas
(1963) | Director and President since 2007 | President and Chief Executive Officer, ACC (2007 to present). Also serves as Chief Executive Officer, ACS; Executive Vice President, ACIM; Director, ACC, ACIM and other ACC subsidiaries |
Amy D. Shelton
(1964) | Chief Compliance Officer and Vice President since 2014 | Chief Compliance Officer, American Century funds, (2014 to present); Chief Compliance Officer, ACIM (2014 to present); Chief Compliance Officer, ACIS (2009 to present); Vice President, Client Interactions and Marketing, ACIS (2013 to 2014); Director, Client Interactions and Marketing, ACIS (2007 to 2013). Also serves as Vice President, ACIS |
Charles A. Etherington
(1957) | General Counsel since 2007 and Senior Vice President since 2006 | Attorney, ACC (1994 to present); Vice President, ACC (2005 to present); General Counsel, ACC (2007 to present). Also serves as General Counsel, ACIM, ACS, ACIS and other ACC subsidiaries; and Senior Vice President, ACIM and ACS |
C. Jean Wade
(1964) | Vice President,Treasurer and Chief Financial Officer since 2012 | Vice President, ACS (2000 to present) |
Robert J. Leach
(1966) | Vice President since 2006 and Assistant Treasurer since 2012 | Vice President, ACS (2000 to present) |
David H. Reinmiller
(1963) | Vice President since 2000 | Attorney, ACC (1994 to present); Associate General Counsel, ACC (2001 to present). Also serves as Vice President, ACIM and ACS |
Ward D. Stauffer
(1960) | Secretary since 2005 | Attorney, ACC (2003 to present) |
|
|
Approval of Management Agreement |
At a meeting held on June 29, 2017, the Fund’s Board of Directors (the "Board") unanimously approved the renewal of the management agreement pursuant to which American Century Investment Management, Inc. (the “Advisor”) acts as the investment advisor for the Fund. Under Section 15(c) of the Investment Company Act, contracts for investment advisory services are required to be reviewed, evaluated, and approved by a majority of a fund’s directors (the “Directors”), including a majority of the independent Directors, each year.
Prior to its consideration of the renewal of the management agreement, the Directors requested and reviewed extensive data and information compiled by the Advisor and certain independent providers of evaluation data concerning the Fund and the services provided to the Fund by the Advisor. This review was in addition to the oversight and evaluation undertaken by the Board and its committees on a continual basis and the information received was supplemental to the extensive information that the Board and its committees receive and consider throughout the year.
In connection with its consideration of the renewal of the management agreement, the Board’s review and evaluation of the services provided by the Advisor included, but was not limited to, the following:
| |
• | the nature, extent, and quality of investment management, shareholder services, and other services provided and to be provided to the Fund; |
| |
• | the wide range of other programs and services provided and to be provided to the Fund and its shareholders on a routine and non-routine basis; |
| |
• | the investment performance of the Fund, including data comparing the Fund's performance to appropriate benchmarks and/or a peer group of other mutual funds with similar investment objectives and strategies; |
| |
• | the cost of owning the Fund compared to the cost of owning similar funds; |
| |
• | the compliance policies, procedures, and regulatory experience of the Advisor and the Fund's service providers; |
| |
• | financial data showing the cost of services provided to the Fund, the profitability of the Fund to the Advisor, and the overall profitability of the Advisor; |
| |
• | strategic plans of the Advisor |
| |
• | possible economies of scale associated with the Advisor’s management of the Fund and other accounts under its management; |
| |
• | data comparing services provided and charges to the Advisor's other investment management clients; |
| |
• | acquired fund fees and expenses; |
| |
• | payments and practices by the Fund and the Advisor regarding financial intermediaries, the nature of services provided by intermediaries, and the terms of share classes utilized; and |
| |
• | any collateral benefits derived by the Advisor from the management of the Fund. |
The Directors held three in-person meetings and one telephonic meeting to review and discuss the information provided. The independent Directors also reviewed responses to supplemental information requests and held active discussions with the Advisor regarding the renewal of the management agreement. The independent Directors had the benefit of the advice of their independent counsel throughout the process.
Factors Considered
The Directors considered all of the information provided by the Advisor, the independent data providers, and independent counsel in connection with the approval. They determined that the
information was sufficient for them to evaluate the management agreement for the Fund. In connection with their review, the Directors did not identify any single factor as being all-important or controlling, and each Director may have attributed different levels of importance to different factors. In deciding to renew the management agreement, the Board based its decision on a number of factors, including without limitation the following:
Nature, Extent and Quality of Services - Generally. Under the management agreement, the Advisor is responsible for providing or arranging for all services necessary for the operation of the Fund. The Board noted that the Advisor provides or arranges at its own expense a wide variety of services including without limitation the following:
| |
• | portfolio research and security selection |
| |
• | daily valuation of the Fund’s portfolio |
| |
• | shareholder servicing and transfer agency, including shareholder confirmations, recordkeeping, and communications |
| |
• | legal services (except the independent Directors’ counsel) |
| |
• | regulatory and portfolio compliance |
| |
• | marketing and distribution (except amounts paid by the Fund under Rule 12b-1 plans) |
The Board noted that many of these services have expanded over time in terms of both quantity and complexity in response to shareholder demands, competition in the industry, changing distribution channels, and the changing regulatory environment. The Board noted specifically the resources the Advisor has committed during the year to compliance with the Department of Labor fiduciary rule and share class modernization.
Investment Management Services. The nature of the investment management services provided to the Fund is quite complex and allows Fund shareholders access to professional money management, instant diversification of their investments within an asset class, the opportunity to easily diversify among asset classes by investing in or exchanging among various American Century Investments funds, and liquidity. In evaluating investment performance, the Board expects the Advisor to manage the Fund in accordance with its investment objectives and approved strategies. Further, the Directors recognize that the Advisor has an obligation to monitor trading activities, and in particular to seek the best execution of fund trades, and to evaluate the use of and payment for research. In providing these services, the Advisor utilizes teams of investment professionals (portfolio managers, analysts, research assistants, and securities traders) who require extensive information technology, research, training, compliance, and other systems to conduct their business. The Board, directly and through its Fund Performance Review Committee, provides oversight of the investment performance process. It regularly reviews investment performance information for the Fund, together with comparative information for appropriate benchmarks and/or peer groups of similarly-managed funds, over different time horizons. The Directors also review detailed performance information provided by the Advisor during the management agreement renewal process. If performance concerns are identified, the Fund receives special reviews until performance improves, during which the Board receives a report from the Advisor regarding the reasons for such results (e.g., market conditions, security selection) and any efforts being undertaken to improve performance. The Fund’s performance was above its benchmark for the ten-year period and below its benchmark for the one-, three-, and five-year periods reviewed by the Board. The Board discussed the Fund's performance with the Advisor and was satisfied with the efforts being undertaken by the Advisor. The Board found the investment management services provided by the Advisor to the Fund to be satisfactory and consistent with the management agreement.
Shareholder and Other Services. Under the management agreement, the Advisor provides the Fund with a comprehensive package of transfer agency, shareholder, and other services. The Board, directly and through various committees of the Board, regularly reviews reports and evaluations of such services at its regular meetings. These reports include, but are not limited to, information regarding the operational efficiency and accuracy of the shareholder and transfer agency services provided, staffing levels, shareholder satisfaction (as measured by external as well as internal sources), technology support, new products and services offered to Fund shareholders, securities trading activities, portfolio valuation services, auditing services, and legal and operational compliance activities. Certain aspects of shareholder and transfer agency service level efficiency and the quality of securities trading activities are measured by independent third party providers and are presented in comparison to other fund groups not managed by the Advisor. The Board found the services provided by the Advisor to the Fund under the management agreement to be competitive and of high quality.
Costs of Services and Profitability. The Advisor provides detailed information concerning its cost of providing various services to the Fund, its profitability in managing the Fund (pre- and post-distribution), its overall profitability, and its financial condition. The Directors have reviewed with the Advisor the methodology used to prepare this financial information. This information is considered in evaluating the Advisor’s financial condition, its ability to continue to provide services under the management agreement, and the reasonableness of the current management fee. The Board concluded that the Advisor’s profits were reasonable in light of the services provided to the Fund.
Ethics. The Board generally considers the Advisor’s commitment to providing quality services to shareholders and to conducting its business ethically. They noted that the Advisor’s practices generally meet or exceed industry best practices.
Economies of Scale. The Board also reviewed information provided by the Advisor regarding the possible existence of economies of scale in connection with the management of the Fund. The Board concluded that economies of scale are difficult to measure and predict with precision, especially on a fund-by-fund basis. The Board concluded that the Advisor is appropriately sharing economies of scale through its competitive fee structure, offering competitive fees from fund inception, and through reinvestment in its business to provide shareholders additional content and services. The Board also noted that economies of scale are shared with the Fund and its shareholders through management fee breakpoints that serve to reduce the effective management fee as the assets of the Fund grow.
Comparison to Other Funds’ Fees. The management agreement provides that the Fund pays the Advisor a single, all-inclusive (or unified) management fee for providing all services necessary for the management and operation of the Fund, other than brokerage expenses, expenses attributable to short sales, taxes, interest, extraordinary expenses, and the fees and expenses of the Fund’s independent Directors (including their independent legal counsel) and expenses incurred in connection with the provision of shareholder services and distribution services under a plan adopted pursuant to Rule 12b-1 under the 1940 Act. Under the unified fee structure, the Advisor is responsible for providing all investment advisory, custody, audit, administrative, compliance, recordkeeping, marketing and shareholder services, or arranging and supervising third parties to provide such services. By contrast, most other funds are charged a variety of fees, including an investment advisory fee, a transfer agency fee, an administrative fee, distribution charges, and other expenses. Other than their investment advisory fees and any applicable Rule 12b-1 distribution fees, all other components of the total fees charged by these other funds may be increased without shareholder approval. The Board believes the unified fee structure is a benefit to Fund shareholders because it clearly discloses to shareholders the cost of owning Fund shares, and, since the unified fee cannot be increased without a vote of Fund shareholders, it shifts to the Advisor the risk of increased costs of operating the Fund and provides a direct incentive to minimize administrative inefficiencies. Part of the Board’s analysis of fee levels involves reviewing certain evaluative data compiled by an independent provider comparing the Fund’s unified fee to the total expense ratios of its peers. The unified fee charged to shareholders of the Fund was
below the median of the total expense ratios of the Fund’s peer expense universe and was within the range of its peer expense group. The Board discussed with the Advisor the factors that impacted the level of the fee in relation to its peers. The Board concluded that the management fee paid by the Fund to the Advisor under the management agreement is reasonable in light of the services provided to the Fund.
Comparison to Fees and Services Provided to Other Clients of the Advisor. The Directors also requested and received information from the Advisor concerning the nature of the services, fees, costs, and profitability of its advisory services to advisory clients other than the Fund. They observed that these varying types of client accounts require different services and involve different regulatory and entrepreneurial risks than the management of the Fund. The Board analyzed this information and concluded that the fees charged and services provided to the Fund were reasonable by comparison.
Payments to Intermediaries. The Directors also requested and received a description of payments made to intermediaries by the Fund and the Advisor and services provided in response thereto. These payments include various payments made by the Fund or the Advisor to different types of intermediaries and recordkeepers for distribution and service activities provided for the Fund. The Board reviewed such information and received representations from the Advisor that all such payments by the Fund were made pursuant to the Fund's Rule 12b-1 Plan and that all such payments by the Advisor were made from the Advisor's resources and reasonable profits. The Board found the payments to be reasonable in scope and purpose.
Collateral or “Fall-Out” Benefits Derived by the Advisor. The Board considered the existence of collateral benefits the Advisor may receive as a result of its relationship with the Fund. They concluded that the Advisor’s primary business is managing mutual funds and it generally does not use fund or shareholder information to generate profits in other lines of business, and therefore does not derive any significant collateral benefits from them. The Board noted that additional assets from other clients may offer the Advisor some benefit from increased leverage with service providers and counterparties. Additionally, the Advisor receives proprietary research from broker-dealers that execute fund portfolio transactions, which the Board concluded is likely to benefit other clients of the Advisor, as well as Fund shareholders. The Board also determined that the Advisor is able to provide investment management services to certain clients other than the Fund, at least in part, due to its existing infrastructure built to serve the fund complex. The Board concluded that appropriate allocation methodologies had been employed to assign resources and the cost of those resources to these other clients and, where expressly provided, these other client assets may be included with the assets of the Fund to determine breakpoints in the management fee schedule.
Existing Relationship. The Board also considered whether there was any reason for not continuing the existing arrangement with the Advisor. In this regard, the Board was mindful of the potential disruptions of the Fund’s operations and various risks, uncertainties, and other effects that could occur as a result of a decision not to continue such relationship. In particular, the Board recognized that most shareholders have invested in the Fund on the strength of the Advisor’s industry standing and reputation and in the expectation that the Advisor will have a continuing role in providing advisory services to the Fund.
Conclusion of the Directors. As a result of this process, the Board, including all of the independent Directors, taking into account all of the factors discussed above and the information provided by the Advisor and others in connection with its review and throughout the year, determined that the management fee is fair and reasonable in light of the services provided and that the investment management agreement between the Fund and the Advisor should be renewed.
A special meeting of shareholders was held on October 18, 2017, to vote on the following proposal. The proposal received the required votes and was adopted. A summary of voting results is listed below.
To elect four directors to the Board of Directors of American Century Mutual Funds, Inc.:
|
| | | | | | | |
| Affirmative |
| Withhold |
Thomas W. Bunn | $ | 19,547,896,641 |
|
| $ | 402,531,816 |
|
Barry Fink | $ | 19,543,961,253 |
|
| $ | 406,467,204 |
|
Jan M. Lewis | $ | 19,556,221,886 |
|
| $ | 394,206,571 |
|
Stephen E. Yates | $ | 19,543,817,152 |
|
| $ | 406,611,305 |
|
The other directors whose term of office continued after the meeting include Jonathan S. Thomas, Andrea C. Hall, James A. Olson, M. Jeannine Strandjord, and John R. Whitten.
Retirement Account Information
As required by law, distributions you receive from certain retirement accounts are subject to federal income tax withholding, unless you elect not to have withholding apply*. Tax will be withheld on the total amount withdrawn even though you may be receiving amounts that are not subject to withholding, such as nondeductible contributions. In such case, excess amounts of withholding could occur. You may adjust your withholding election so that a greater or lesser amount will be withheld.
If you don’t want us to withhold on this amount, you must notify us to not withhold the federal income tax. You may notify us in writing or in certain situations by telephone or through other electronic means. For systematic withdrawals, your withholding election will remain in effect until revoked or changed by filing a new election. You have the right to revoke your election at any time and change your withholding percentage for future distributions.
Remember, even if you elect not to have income tax withheld, you are liable for paying income tax on the taxable portion of your withdrawal. If you elect not to have income tax withheld or you don’t have enough income tax withheld, you may be responsible for payment of estimated tax. You may incur penalties under the estimated tax rules if your withholding and estimated tax payments are not sufficient. You can reduce or defer the income tax on a distribution by directly or indirectly rolling such distribution over to another IRA or eligible plan. You should consult your tax advisor for additional information.
State tax will be withheld if, at the time of your distribution, your address is within one of the mandatory withholding states and you have federal income tax withheld (or as otherwise required by state law). State taxes will be withheld from your distribution in accordance with the respective state rules.
*Some 403(b), 457 and qualified retirement plan distributions may be subject to 20% mandatory withholding, as they are subject to special tax and withholding rules. Your plan administrator or plan sponsor is required to provide you with a special tax notice explaining those rules at the time you request a distribution. If applicable, federal and/or state taxes may be withheld from your distribution amount.
Proxy Voting Policies
A description of the policies that the fund's investment advisor uses in exercising the voting rights associated with the securities purchased and/or held by the fund is available without charge, upon request, by calling 1-800-345-2021. It is also available on the "About Us" page of American Century Investments’ website at americancentury.com and on the Securities and Exchange Commission’s website at sec.gov. Information regarding how the investment advisor voted proxies relating to portfolio securities during the most recent 12-month period ended June 30 is available on the "About Us" page at americancentury.com. It is also available at sec.gov.
Quarterly Portfolio Disclosure
The fund files its complete schedule of portfolio holdings with the Securities and Exchange Commission (SEC) for the first and third quarters of each fiscal year on Form N-Q. The fund’s Forms N-Q are available on the SEC’s website at sec.gov, and may be reviewed and copied at the SEC’s Public Reference Room in Washington, DC. Information on the operation of the Public Reference Room may be obtained by calling 1-800-SEC-0330. The fund also makes its complete schedule of portfolio holdings for the most recent quarter of its fiscal year available on its website at americancentury.com and, upon request, by calling 1-800-345-2021.
Other Tax Information
The following information is provided pursuant to provisions of the Internal Revenue Code.
The fund hereby designates up to the maximum amount allowable as qualified dividend income for the fiscal year ended October 31, 2017.
For corporate taxpayers, the fund hereby designates $9,623,540, or up to the maximum amount allowable, of ordinary income distributions paid during the fiscal year ended October 31, 2017 as qualified for the corporate dividends received deduction.
The fund hereby designates $18,858,800, or up to the maximum amount allowable, as long-term capital gain distributions (20% rate gain distributions) for the fiscal year ended October 31, 2017.
|
| | |
| |
| | |
Contact Us | americancentury.com | |
Automated Information Line | 1-800-345-8765 | |
Investor Services Representative | 1-800-345-2021 or 816-531-5575 | |
Investors Using Advisors | 1-800-378-9878 | |
Business, Not-For-Profit, Employer-Sponsored Retirement Plans | 1-800-345-3533 | |
Banks and Trust Companies, Broker-Dealers, Financial Professionals, Insurance Companies | 1-800-345-6488 | |
Telecommunications Relay Service for the Deaf | 711 | |
| | |
American Century Mutual Funds, Inc. | |
| | |
Investment Advisor: American Century Investment Management, Inc. Kansas City, Missouri | |
| | |
This report and the statements it contains are submitted for the general information of our shareholders. The report is not authorized for distribution to prospective investors unless preceded or accompanied by an effective prospectus. | |
| | |
©2017 American Century Proprietary Holdings, Inc. All rights reserved.
CL-ANN-90986 1712 | |
|
| |
| |
| Annual Report |
| |
| October 31, 2017 |
| |
| NT Heritage Fund |
|
| | |
Performance | 2 |
|
Portfolio Commentary | |
|
Fund Characteristics | |
|
Shareholder Fee Example | |
|
Schedule of Investments | |
|
Statement of Assets and Liabilities | |
|
Statement of Operations | |
|
Statement of Changes in Net Assets | |
|
Notes to Financial Statements | |
|
Financial Highlights | |
|
Report of Independent Registered Public Accounting Firm | |
|
Management | |
|
Approval of Management Agreement | |
|
Proxy Voting Results | |
|
Additional Information | |
|
Any opinions expressed in this report reflect those of the author as of the date of the report, and do not necessarily represent the opinions of American Century Investments® or any other person in the American Century Investments organization. Any such opinions are subject to change at any time based upon market or other conditions and American Century Investments disclaims any responsibility to update such opinions. These opinions may not be relied upon as investment advice and, because investment decisions made by American Century Investments funds are based on numerous factors, may not be relied upon as an indication of trading intent on behalf of any American Century Investments fund. Security examples are used for representational purposes only and are not intended as recommendations to purchase or sell securities. Performance information for comparative indices and securities is provided to American Century Investments by third party vendors. To the best of American Century Investments’ knowledge, such information is accurate at the time of printing.
|
| | | | | |
Total Returns as of October 31, 2017 |
| | | Average Annual Returns | |
| Ticker Symbol | 1 year | 5 years | 10 years | Inception Date |
G Class | ACLWX | 21.29% | 12.50% | 3.80% | 5/12/06 |
Russell Midcap Growth Index | — | 26.25% | 15.33% | 8.22% | — |
Fund returns would have been lower if a portion of the fees had not been waived. Prior to July 31, 2017, the G Class was referred to as the Institutional Class.
|
|
Growth of $10,000 Over 10 Years |
$10,000 investment made October 31, 2007 |
|
| |
Value on October 31, 2017 |
| G Class — $14,530 |
|
| Russell Midcap Growth Index — $22,046 |
|
Ending value of G Class would have been lower if a portion of the fees had not been waived.
|
| |
Total Annual Fund Operating Expenses |
G Class | 0.65% |
The total annual fund operating expenses shown is as stated in the fund’s prospectus current as of the date of this report. The prospectus may vary from the expense ratio shown elsewhere in this report because it is based on a different time period, includes acquired fund fees and expenses, and, if applicable, does not include fee waivers or expense reimbursements.
Data presented reflect past performance. Past performance is no guarantee of future results. Current performance may be higher or lower than the performance shown. Total returns for periods less than one year are not annualized. Investment return and principal value will fluctuate, and redemption value may be more or less than original cost. Data assumes reinvestment of dividends and capital gains, and none of the charts reflect the deduction of taxes that a shareholder would pay on fund distributions or the redemption of fund shares. To obtain performance data current to the most recent month end, please call 1-800-345-2021 or visit americancentury.com. For additional information about the fund, please consult the prospectus.
Portfolio Managers: Greg Walsh and Nalin Yogasundram
Portfolio manager David Hollond retired from American Century in April 2017.
Performance Summary
NT Heritage returned 21.29%* for the 12 months ended October 31, 2017, lagging the 26.25% return of the portfolio’s benchmark, the Russell Midcap Growth Index.
U.S. stock indices delivered strong returns during the reporting period. Growth stocks outperformed value stocks by a wide margin across the capitalization spectrum. Within the Russell Midcap Growth Index, the utilities sector—which represents a very small segment of the benchmark—had the best performance on a total-return basis. Index returns were largely driven by strong performance of information technology, health care, and industrials stocks. Consumer staples was the only sector that posted a negative return.
The fund’s underperformance relative to the benchmark was primarily due to stock selection in the information technology sector. Stock choices in health care and industrials also detracted. Stock selection in the real estate sector aided relative performance.
Information Technology Stocks Led Detractors
In the information technology sector, stock decisions among semiconductors and semiconductor equipment companies weighed on performance versus the benchmark. Visual computing chip company NVIDIA hindered results due to an underweight position. The holding was eliminated during the reporting period. The company’s gaming and data center businesses have continued to perform well, with the data center segment accelerating.
Among other significant detractors, Newell Brands, which owns several solid consumer brands such as Rubbermaid, detracted. Although Newell has done well, its end markets have decelerated. The company revised its profit forecast down due to Hurricane Harvey, which hurt its resin suppliers in Texas and Louisiana. Resin is a key component of many Newell products. Molson Coors Brewing was a key detractor. The company reported tepid revenue and slow margin improvements and offered weak earnings guidance. Private-label food processor TreeHouse Foods detracted. A poor end-market environment for its supermarket customers created a challenging environment for pricing and profitability. In addition, a recent acquisition is having operational issues, leading us to reduce our growth outlook. We sold the holding. O’Reilly Automotive reported sales that missed expectations and warned of weak consumer demand, driving the stock significantly lower. Investors also appeared fearful of increased competition from Amazon in a space that previously seemed relatively immune from online threats.
Real Estate Benefited Performance
Stock selection within the real estate sector was a significant contributor to relative performance. Although none of our positions were top-10 contributors for the year, we benefited from not owning several poor performers as expectations for rising interest rates weighed on the sector.
Major contributors included Teleflex. The medical device maker outperformed on solid quarterly earnings results and a positive outlook that topped expectations. Teleflex also announced the acquisition of a large urology treatment provider, which we think will augment growth and
*Fund returns would have been lower if a portion of the fees had not been waived.
profitability. We took advantage of the favorable valuation opportunity to build the portfolio’s position when the stock sold off in the fourth quarter of 2016 amid concerns about the impact of the elections on health care stocks. Owning semiconductor manufacturer Broadcom aided results. The company reported good earnings. It is shifting from relying on mergers and acquisitions to generating free cash flow, which is bringing in a new investor base.
Panera Bread was a significant contributor and was eliminated from the portfolio following the announcement that it would be acquired by JAB Holding. Electronic Arts, a maker of video games, was a top contributor to performance, as the company had favorable quarterly results. The company issued conservative guidance for the upcoming fiscal year, and it expects some gains as games are updated and as it emphasizes esports, a strong trend for the industry.
The financials sector performed well following the 2016 elections on anticipated stronger economic growth, higher interest rates, and deregulation. SVB Financial is expected to benefit from a decreased regulatory burden and was a significant contributor.
Outlook
NT Heritage continues to invest in companies where we believe fundamentals are strong and improving but share price performance does not fully reflect these factors. Our process is based on individual security selection, but broad themes have emerged.
The portfolio’s largest overweight relative to the benchmark is in information technology, largely due to individual stocks meeting our criteria. We have found improving growth profiles coming out of recent earnings reports. Within the sector, a tailwind is forming from enterprises wanting to “modernize” their on-premise infrastructure in preparation for deeper cloud penetration. We are also overweight health care, where there is now greater clarity about possible changes to the Affordable Care Act and greater regulation of prescription drug pricing. Also, mergers and acquisitions are increasing. Large biotechnology and pharmaceuticals companies are experiencing decelerating growth and weaker pipelines and as a result are looking for growth by purchasing smaller companies.
We have been underweight materials for some time as the sector shows an absence of secular growth. The underweight is led by the chemicals industry, where margin trends are poor. The portfolio has no positions in telecommunication services or utilities. These smaller benchmark components do not typically provide the kind of growth opportunities we look for. Additionally, wireless carriers are under competitive pressure to offer discount pricing on their plans.
|
| |
OCTOBER 31, 2017 | |
Top Ten Holdings | % of net assets |
Zoetis, Inc. | 2.0% |
DXC Technology Co. | 1.9% |
Red Hat, Inc. | 1.9% |
Ball Corp. | 1.8% |
Teleflex, Inc. | 1.8% |
iShares Russell Mid-Cap Growth ETF | 1.8% |
O'Reilly Automotive, Inc. | 1.5% |
Palo Alto Networks, Inc. | 1.5% |
Illumina, Inc. | 1.5% |
Fidelity National Information Services, Inc. | 1.5% |
| |
Top Five Industries | % of net assets |
Software | 9.9% |
IT Services | 6.9% |
Semiconductors and Semiconductor Equipment | 6.4% |
Machinery | 6.2% |
Health Care Equipment and Supplies | 5.7% |
| |
Types of Investments in Portfolio | % of net assets |
Common Stocks | 97.5% |
Exchange-Traded Funds | 1.8% |
Total Equity Exposure | 99.3% |
Temporary Cash Investments | 1.0% |
Other Assets and Liabilities | (0.3)% |
Fund shareholders may incur two types of costs: (1) transaction costs, including sales charges (loads) on purchase payments and redemption/exchange fees; and (2) ongoing costs, including management fees; distribution and service (12b-1) fees; and other fund expenses. This example is intended to help you understand your ongoing costs (in dollars) of investing in your fund and to compare these costs with the ongoing cost of investing in other mutual funds.
The example is based on an investment of $1,000 made at the beginning of the period and held for the entire period from May 1, 2017 to October 31, 2017.
Actual Expenses
The table provides information about actual account values and actual expenses for each class. You may use the information, together with the amount you invested, to estimate the expenses that you paid over the period. First, identify the share class you own. Then simply divide your account value by $1,000 (for example, an $8,600 account value divided by $1,000 = 8.6), then multiply the result by the number under the heading “Expenses Paid During Period” to estimate the expenses you paid on your account during this period.
Hypothetical Example for Comparison Purposes
The table also provides information about hypothetical account values and hypothetical expenses based on the actual expense ratio of each class of your fund and an assumed rate of return of 5% per year before expenses, which is not the actual return of a fund’s share class. The hypothetical account values and expenses may not be used to estimate the actual ending account balance or expenses you paid for the period. You may use this information to compare the ongoing costs of investing in your fund and other funds. To do so, compare this 5% hypothetical example with the 5% hypothetical examples that appear in the shareholder reports of the other funds.
Please note that the expenses shown in the table are meant to highlight your ongoing costs only and do not reflect any transactional costs, such as sales charges (loads) or redemption/exchange fees. Therefore, the table is useful in comparing ongoing costs only, and will not help you determine the relative total costs of owning different funds. In addition, if these transactional costs were included, your costs would have been higher.
|
| | | | |
| Beginning
Account Value
5/1/17 | Ending
Account Value
10/31/17 | Expenses Paid
During Period(1)
5/1/17 - 10/31/17 |
Annualized
Expense Ratio(1) |
Actual | | | | |
G Class | $1,000 | $1,074.50 | $1.99 | 0.38% |
Hypothetical | | | | |
G Class | $1,000 | $1,023.29 | $1.94 | 0.38% |
| |
(1) | Expenses are equal to the class's annualized expense ratio listed in the table above, multiplied by the average account value over the period, multiplied by 184, the number of days in the most recent fiscal half-year, divided by 365, to reflect the one-half year period. Annualized expense ratio reflects actual expenses, including any applicable fee waivers or expense reimbursements and excluding any acquired fund fees and expenses. |
OCTOBER 31, 2017
|
| | | | | |
| Shares | Value |
COMMON STOCKS — 97.5% | | |
Aerospace and Defense — 1.2% | | |
L3 Technologies, Inc. | 52,745 |
| $ | 9,872,809 |
|
Air Freight and Logistics — 0.9% | | |
XPO Logistics, Inc.(1) | 107,118 |
| 7,428,633 |
|
Airlines — 0.6% | | |
American Airlines Group, Inc. | 101,183 |
| 4,737,388 |
|
Auto Components — 0.7% | | |
Delphi Automotive plc | 59,717 |
| 5,934,675 |
|
Banks — 2.1% | | |
BankUnited, Inc. | 11,894 |
| 414,506 |
|
SVB Financial Group(1) | 34,853 |
| 7,642,566 |
|
Zions Bancorporation | 198,687 |
| 9,230,998 |
|
| | 17,288,070 |
|
Beverages — 3.6% | | |
Brown-Forman Corp., Class B | 119,122 |
| 6,792,336 |
|
Constellation Brands, Inc., Class A | 40,454 |
| 8,863,067 |
|
Molson Coors Brewing Co., Class B | 64,903 |
| 5,248,706 |
|
Monster Beverage Corp.(1) | 149,935 |
| 8,685,735 |
|
| | 29,589,844 |
|
Biotechnology — 3.7% | | |
Alexion Pharmaceuticals, Inc.(1) | 57,572 |
| 6,889,066 |
|
BioMarin Pharmaceutical, Inc.(1) | 85,209 |
| 6,994,807 |
|
Bioverativ, Inc.(1) | 102,791 |
| 5,807,691 |
|
Exelixis, Inc.(1) | 77,762 |
| 1,927,720 |
|
Incyte Corp.(1) | 61,480 |
| 6,962,610 |
|
Neurocrine Biosciences, Inc.(1) | 30,539 |
| 1,896,777 |
|
| | 30,478,671 |
|
Building Products — 1.7% | | |
Fortune Brands Home & Security, Inc. | 117,521 |
| 7,763,437 |
|
Lennox International, Inc. | 31,526 |
| 6,025,565 |
|
| | 13,789,002 |
|
Capital Markets — 4.4% | | |
Affiliated Managers Group, Inc. | 34,237 |
| 6,385,200 |
|
Cboe Global Markets, Inc. | 77,337 |
| 8,743,721 |
|
S&P Global, Inc. | 57,659 |
| 9,021,904 |
|
SEI Investments Co. | 185,856 |
| 11,989,571 |
|
| | 36,140,396 |
|
Chemicals — 0.6% | | |
Scotts Miracle-Gro Co. (The), Class A | 47,467 |
| 4,728,663 |
|
Commercial Services and Supplies — 0.9% | | |
Brink's Co. (The) | 96,056 |
| 7,309,862 |
|
Communications Equipment — 1.5% | | |
Palo Alto Networks, Inc.(1) | 82,982 |
| 12,214,950 |
|
Construction and Engineering — 0.5% | | |
Jacobs Engineering Group, Inc. | 71,037 |
| 4,135,064 |
|
|
| | | | | |
| Shares | Value |
Construction Materials — 1.0% | | |
Vulcan Materials Co. | 67,507 |
| $ | 8,218,977 |
|
Containers and Packaging — 3.0% | | |
Ball Corp. | 352,566 |
| 15,135,658 |
|
Packaging Corp. of America | 81,774 |
| 9,507,863 |
|
| | 24,643,521 |
|
Distributors — 0.9% | | |
LKQ Corp.(1) | 198,376 |
| 7,476,791 |
|
Electrical Equipment — 0.7% | | |
AMETEK, Inc. | 88,490 |
| 5,972,190 |
|
Electronic Equipment, Instruments and Components — 4.1% | | |
Dolby Laboratories, Inc., Class A | 157,085 |
| 9,101,505 |
|
Flextronics International Ltd.(1) | 468,272 |
| 8,335,241 |
|
National Instruments Corp. | 210,204 |
| 9,459,180 |
|
Trimble, Inc.(1) | 174,185 |
| 7,120,683 |
|
| | 34,016,609 |
|
Equity Real Estate Investment Trusts (REITs) — 2.9% | | |
Crown Castle International Corp. | 76,391 |
| 8,179,948 |
|
Equinix, Inc. | 13,245 |
| 6,139,058 |
|
SBA Communications Corp.(1) | 58,885 |
| 9,255,544 |
|
| | 23,574,550 |
|
Food and Staples Retailing — 0.5% | | |
Costco Wholesale Corp. | 25,265 |
| 4,069,686 |
|
Health Care Equipment and Supplies — 5.7% | | |
Align Technology, Inc.(1) | 41,924 |
| 10,018,997 |
|
Baxter International, Inc. | 160,697 |
| 10,360,136 |
|
Hill-Rom Holdings, Inc. | 52,387 |
| 4,228,155 |
|
Teleflex, Inc. | 62,322 |
| 14,769,067 |
|
West Pharmaceutical Services, Inc. | 72,744 |
| 7,376,242 |
|
| | 46,752,597 |
|
Health Care Providers and Services — 1.8% | | |
Amedisys, Inc.(1) | 143,592 |
| 6,908,211 |
|
Humana, Inc. | 31,262 |
| 7,982,752 |
|
| | 14,890,963 |
|
Hotels, Restaurants and Leisure — 3.9% | | |
Domino's Pizza, Inc. | 11,646 |
| 2,131,218 |
|
Hilton Worldwide Holdings, Inc. | 72,826 |
| 5,263,863 |
|
Las Vegas Sands Corp. | 97,887 |
| 6,204,078 |
|
MGM Resorts International | 230,134 |
| 7,214,701 |
|
Papa John's International, Inc. | 58,378 |
| 3,972,623 |
|
Vail Resorts, Inc. | 30,531 |
| 6,992,210 |
|
| | 31,778,693 |
|
Household Durables — 2.1% | | |
Mohawk Industries, Inc.(1) | 32,722 |
| 8,565,311 |
|
Newell Brands, Inc. | 211,288 |
| 8,616,324 |
|
| | 17,181,635 |
|
Internet and Direct Marketing Retail — 1.6% | | |
Expedia, Inc. | 75,099 |
| 9,361,842 |
|
Wayfair, Inc., Class A(1) | 54,797 |
| 3,830,310 |
|
| | 13,192,152 |
|
|
| | | | | |
| Shares | Value |
Internet Software and Services — 1.8% | | |
eBay, Inc.(1) | 113,458 |
| $ | 4,270,559 |
|
LogMeIn, Inc. | 88,078 |
| 10,661,842 |
|
| | 14,932,401 |
|
IT Services — 6.9% | | |
Booz Allen Hamilton Holding Corp. | 252,082 |
| 9,526,179 |
|
DXC Technology Co. | 173,753 |
| 15,901,875 |
|
Fidelity National Information Services, Inc. | 129,907 |
| 12,050,173 |
|
First Data Corp., Class A(1) | 439,872 |
| 7,834,120 |
|
Vantiv, Inc., Class A(1) | 166,475 |
| 11,653,250 |
|
| | 56,965,597 |
|
Life Sciences Tools and Services — 2.2% | | |
Bio-Techne Corp. | 43,292 |
| 5,672,118 |
|
Illumina, Inc.(1) | 59,152 |
| 12,137,399 |
|
| | 17,809,517 |
|
Machinery — 6.2% | | |
Ingersoll-Rand plc | 67,169 |
| 5,951,174 |
|
John Bean Technologies Corp. | 62,189 |
| 6,648,004 |
|
Kennametal, Inc. | 172,748 |
| 7,540,450 |
|
Middleby Corp. (The)(1) | 89,188 |
| 10,336,889 |
|
Parker-Hannifin Corp. | 59,269 |
| 10,823,112 |
|
Snap-on, Inc. | 30,561 |
| 4,821,915 |
|
WABCO Holdings, Inc.(1) | 31,877 |
| 4,704,089 |
|
| | 50,825,633 |
|
Multiline Retail — 1.8% | | |
Dollar General Corp. | 75,795 |
| 6,127,268 |
|
Dollar Tree, Inc.(1) | 95,068 |
| 8,674,955 |
|
| | 14,802,223 |
|
Oil, Gas and Consumable Fuels — 1.2% | | |
Concho Resources, Inc.(1) | 73,485 |
| 9,862,422 |
|
Pharmaceuticals — 2.7% | | |
Jazz Pharmaceuticals plc(1) | 41,374 |
| 5,855,662 |
|
Zoetis, Inc. | 262,888 |
| 16,777,512 |
|
| | 22,633,174 |
|
Professional Services — 2.2% | | |
IHS Markit Ltd.(1) | 147,590 |
| 6,288,810 |
|
Verisk Analytics, Inc., Class A(1) | 137,217 |
| 11,670,306 |
|
| | 17,959,116 |
|
Road and Rail — 1.0% | | |
Canadian Pacific Railway Ltd. | 25,151 |
| 4,362,190 |
|
Norfolk Southern Corp. | 32,208 |
| 4,232,775 |
|
| | 8,594,965 |
|
Semiconductors and Semiconductor Equipment — 6.4% | | |
Advanced Micro Devices, Inc.(1) | 504,240 |
| 5,539,076 |
|
Analog Devices, Inc. | 84,000 |
| 7,669,200 |
|
Broadcom Ltd. | 34,783 |
| 9,179,582 |
|
KLA-Tencor Corp. | 101,241 |
| 11,024,132 |
|
Lam Research Corp. | 26,623 |
| 5,552,759 |
|
Maxim Integrated Products, Inc. | 87,179 |
| 4,580,385 |
|
Xilinx, Inc. | 128,513 |
| 9,470,123 |
|
| | 53,015,257 |
|
|
| | | | | |
| Shares | Value |
Software — 9.9% | | |
Autodesk, Inc.(1) | 83,051 |
| $ | 10,378,053 |
|
Electronic Arts, Inc.(1) | 90,678 |
| 10,845,089 |
|
Guidewire Software, Inc.(1) | 115,523 |
| 9,239,530 |
|
Red Hat, Inc.(1) | 131,477 |
| 15,886,366 |
|
ServiceNow, Inc.(1) | 81,830 |
| 10,340,857 |
|
Splunk, Inc.(1) | 105,094 |
| 7,072,826 |
|
Tyler Technologies, Inc.(1) | 65,960 |
| 11,694,048 |
|
Zynga, Inc., Class A(1) | 1,610,150 |
| 6,279,585 |
|
| | 81,736,354 |
|
Specialty Retail — 3.2% | | |
Burlington Stores, Inc.(1) | 80,256 |
| 7,535,236 |
|
O'Reilly Automotive, Inc.(1) | 59,095 |
| 12,466,090 |
|
Ross Stores, Inc. | 102,682 |
| 6,519,280 |
|
| | 26,520,606 |
|
Textiles, Apparel and Luxury Goods — 0.5% | | |
Columbia Sportswear Co. | 64,634 |
| 4,031,869 |
|
Trading Companies and Distributors — 0.9% | | |
United Rentals, Inc.(1) | 52,065 |
| 7,366,156 |
|
TOTAL COMMON STOCKS
(Cost $621,318,100) | | 802,471,681 |
|
EXCHANGE-TRADED FUNDS — 1.8% | | |
iShares Russell Mid-Cap Growth ETF
(Cost $14,293,830) | 123,196 |
| 14,338,782 |
|
TEMPORARY CASH INVESTMENTS — 1.0% | | |
Repurchase Agreement, BMO Capital Markets Corp., (collateralized by various U.S. Treasury obligations, 0.375% - 1.375%, 1/15/27 - 2/15/45, valued at $4,681,933), in a joint trading account at 0.88%, dated 10/31/17, due 11/1/17 (Delivery value $4,579,728) | | 4,579,616 |
|
Repurchase Agreement, Fixed Income Clearing Corp., (collateralized by various U.S. Treasury obligations, 2.50%, 5/15/46, valued at $3,897,138), at 0.34%, dated 10/31/17, due 11/1/17 (Delivery value $3,817,036) | | 3,817,000 |
|
State Street Institutional U.S. Government Money Market Fund, Premier Class | 5,093 |
| 5,093 |
|
TOTAL TEMPORARY CASH INVESTMENTS
(Cost $8,401,709) | | 8,401,709 |
|
TOTAL INVESTMENT SECURITIES — 100.3%
(Cost $644,013,639) | | 825,212,172 |
|
OTHER ASSETS AND LIABILITIES — (0.3)% | | (2,301,880 | ) |
TOTAL NET ASSETS — 100.0% | | $ | 822,910,292 |
|
|
| | | | | | | | | | |
FORWARD FOREIGN CURRENCY EXCHANGE CONTRACTS | | |
Currency Purchased | Currency Sold | Counterparty | Settlement Date | Unrealized Appreciation
(Depreciation) |
USD | 3,799,990 |
| CAD | 4,699,106 |
| Morgan Stanley | 12/29/17 | $ | 155,341 |
|
USD | 238,280 |
| CAD | 297,084 |
| Morgan Stanley | 12/29/17 | 7,860 |
|
| | | | | | $ | 163,201 |
|
|
| | |
NOTES TO SCHEDULE OF INVESTMENTS |
CAD | - | Canadian Dollar |
USD | - | United States Dollar |
See Notes to Financial Statements.
|
|
Statement of Assets and Liabilities |
|
| | | |
OCTOBER 31, 2017 | |
Assets | |
Investment securities, at value (cost of $644,013,639) | $ | 825,212,172 |
|
Receivable for investments sold | 7,257,696 |
|
Unrealized appreciation on forward foreign currency exchange contracts | 163,201 |
|
Dividends and interest receivable | 21,453 |
|
| 832,654,522 |
|
| |
Liabilities | |
Payable for investments purchased | 7,732,470 |
|
Payable for capital shares redeemed | 2,002,534 |
|
Accrued other expenses | 9,226 |
|
| 9,744,230 |
|
| |
Net Assets | $ | 822,910,292 |
|
| |
G Class Capital Shares, $0.01 Par Value | |
Shares authorized | 500,000,000 |
|
Shares outstanding | 57,087,323 |
|
| |
Net Asset Value Per Share | $ | 14.41 |
|
| |
Net Assets Consist of: | |
Capital (par value and paid-in surplus) | $ | 590,867,356 |
|
Undistributed net investment income | 1,452,312 |
|
Undistributed net realized gain | 49,228,890 |
|
Net unrealized appreciation | 181,361,734 |
|
| $ | 822,910,292 |
|
See Notes to Financial Statements.
|
| | | |
YEAR ENDED OCTOBER 31, 2017 |
Investment Income (Loss) |
Income: | |
Dividends (net of foreign taxes withheld of $8,699) | $ | 6,623,898 |
|
Interest | 40,436 |
|
| 6,664,334 |
|
| |
Expenses: | |
Management fees | 5,850,287 |
|
Directors' fees and expenses | 24,147 |
|
Other expenses | 24,369 |
|
| 5,898,803 |
|
Fees waived - G Class | (1,345,683 | ) |
| 4,553,120 |
|
| |
Net investment income (loss) | 2,111,214 |
|
| |
Realized and Unrealized Gain (Loss) | |
Net realized gain (loss) on: | |
Investment transactions | 57,468,873 |
|
Forward foreign currency exchange contract transactions | (262,447 | ) |
Futures contract transactions | (464,764 | ) |
Foreign currency translation transactions | 598 |
|
| 56,742,260 |
|
| |
Change in net unrealized appreciation (depreciation) on: | |
Investments | 91,038,081 |
|
Forward foreign currency exchange contracts | 52,668 |
|
| 91,090,749 |
|
| |
Net realized and unrealized gain (loss) | 147,833,009 |
|
| |
Net Increase (Decrease) in Net Assets Resulting from Operations | $ | 149,944,223 |
|
See Notes to Financial Statements.
|
|
Statement of Changes in Net Assets |
|
| | | | | | |
YEARS ENDED OCTOBER 31, 2017 AND OCTOBER 31, 2016 |
Increase (Decrease) in Net Assets | October 31, 2017 | October 31, 2016 |
Operations | | |
Net investment income (loss) | $ | 2,111,214 |
| $ | (70,959 | ) |
Net realized gain (loss) | 56,742,260 |
| 20,897,994 |
|
Change in net unrealized appreciation (depreciation) | 91,090,749 |
| (26,687,178 | ) |
Net increase (decrease) in net assets resulting from operations | 149,944,223 |
| (5,860,143 | ) |
| | |
Distributions to Shareholders | | |
From net realized gains: | | |
G Class | (22,613,046 | ) | (47,436,142 | ) |
R6 Class | (2,450,807 | ) | (3,027,088 | ) |
Decrease in net assets from distributions | (25,063,853 | ) | (50,463,230 | ) |
| | |
Capital Share Transactions | | |
Net increase (decrease) in net assets from capital share transactions (Note 5) | (15,408,566 | ) | 126,330,213 |
|
| | |
Net increase (decrease) in net assets | 109,471,804 |
| 70,006,840 |
|
| | |
Net Assets | | |
Beginning of period | 713,438,488 |
| 643,431,648 |
|
End of period | $ | 822,910,292 |
| $ | 713,438,488 |
|
| | |
Undistributed (accumulated) net investment income (loss) | $ | 1,452,312 |
| $ | (396,446 | ) |
See Notes to Financial Statements.
|
|
Notes to Financial Statements |
OCTOBER 31, 2017
1. Organization
American Century Mutual Funds, Inc. (the corporation) is registered under the Investment Company Act of 1940, as amended (the 1940 Act), as an open-end management investment company and is organized as a Maryland corporation. NT Heritage Fund (the fund) is one fund in a series issued by the corporation. The fund's investment objective is to seek long-term capital growth. The fund is not permitted to invest in securities issued by companies assigned the Global Industry Classification Standard or the Bloomberg Industry Classification Standard for the tobacco industry. The fund offers the G Class (formerly Institutional Class). On July 31, 2017, all outstanding R6 Class shares were converted to G Class shares and the fund discontinued offering the R6 Class.
2. Significant Accounting Policies
The following is a summary of significant accounting policies consistently followed by the fund in preparation of its financial statements. The fund is an investment company and follows accounting and reporting guidance in accordance with accounting principles generally accepted in the United States of America. This may require management to make certain estimates and assumptions at the date of the financial statements. Actual results could differ from these estimates. Management evaluated the impact of events or transactions occurring through the date the financial statements were issued that would merit recognition or disclosure.
Investment Valuations — The fund determines the fair value of its investments and computes its net asset value per share at the close of regular trading (usually 4 p.m. Eastern time) on the New York Stock Exchange (NYSE) on each day the NYSE is open. The Board of Directors has adopted valuation policies and procedures to guide the investment advisor in the fund’s investment valuation process and to provide methodologies for the oversight of the fund’s pricing function.
Equity securities that are listed or traded on a domestic securities exchange are valued at the last reported sales price or at the official closing price as provided by the exchange. Equity securities traded on foreign securities exchanges are generally valued at the closing price of such securities on the exchange where primarily traded or at the close of the NYSE, if that is earlier. If no last sales price is reported, or if local convention or regulation so provides, the mean of the latest bid and asked prices may be used. Securities traded over-the-counter are valued at the mean of the latest bid and asked prices, the last sales price, or the official closing price. Equity securities initially expressed in local currencies are translated into U.S. dollars at the mean of the appropriate currency exchange rate at the close of the NYSE as provided by an independent pricing service.
Open-end management investment companies are valued at the reported net asset value per share. Repurchase agreements are valued at cost, which approximates fair value. Exchange-traded futures contracts are valued at the settlement price as provided by the appropriate clearing corporation. Forward foreign currency exchange contracts are valued at the mean of the appropriate forward exchange rate at the close of the NYSE as provided by an independent pricing service.
If the fund determines that the market price for an investment is not readily available or the valuation methods mentioned above do not reflect an investment’s fair value, such investment is valued as determined in good faith by the Board of Directors or its delegate, in accordance with policies and procedures adopted by the Board of Directors. In its determination of fair value, the fund may review several factors including, but not limited to, market information regarding the specific investment or comparable investments and correlation with other investment types, futures indices or general market indicators. Circumstances that may cause the fund to use these procedures to value an investment include, but are not limited to: an investment has been declared in default or is distressed; trading in a security has been suspended during the trading day or a security is not actively trading on its principal exchange; prices received from a regular pricing source are deemed unreliable; or there is a foreign market holiday and no trading occurred.
The fund monitors for significant events occurring after the close of an investment’s primary exchange but before the fund’s net asset value per share is determined. Significant events may include, but are not limited to: corporate announcements and transactions; governmental action and political unrest that could impact a specific investment or an investment sector; or armed conflicts, natural disasters and similar events that could
affect investments in a specific country or region. The fund also monitors for significant fluctuations between domestic and foreign markets, as evidenced by the U.S. market or such other indicators that the Board of Directors, or its delegate, deems appropriate. If significant fluctuations in foreign markets are identified, the fund may apply a model-derived factor to the closing price of equity securities traded on foreign securities exchanges. The factor is based on observable market data as provided by an independent pricing service.
Security Transactions — Security transactions are accounted for as of the trade date. Net realized gains and losses are determined on the identified cost basis, which is also used for federal income tax purposes.
Investment Income — Dividend income less foreign taxes withheld, if any, is recorded as of the ex-dividend date. Distributions received on securities that represent a return of capital or long-term capital gain are recorded as a reduction of cost of investments and/or as a realized gain. The fund may estimate the components of distributions received that may be considered nontaxable distributions or long-term capital gain distributions for income tax purposes. Interest income is recorded on the accrual basis and includes accretion of discounts and amortization of premiums.
Foreign Currency Translations — All assets and liabilities initially expressed in foreign currencies are translated into U.S. dollars at prevailing exchange rates at period end. The fund may enter into spot foreign currency exchange contracts to facilitate transactions denominated in a foreign currency. Purchases and sales of investment securities, dividend and interest income, spot foreign currency exchange contracts, and expenses are translated at the rates of exchange prevailing on the respective dates of such transactions. Net realized and unrealized foreign currency exchange gains or losses related to investment securities are a component of net realized gain (loss) on investment transactions and change in net unrealized appreciation (depreciation) on investments, respectively.
Repurchase Agreements — The fund may enter into repurchase agreements with institutions that American Century Investment Management, Inc. (ACIM) (the investment advisor) has determined are creditworthy pursuant to criteria adopted by the Board of Directors. The fund requires that the collateral, represented by securities, received in a repurchase transaction be transferred to the custodian in a manner sufficient to enable the fund to obtain those securities in the event of a default under the repurchase agreement. ACIM monitors, on a daily basis, the securities transferred to ensure the value, including accrued interest, of the securities under each repurchase agreement is equal to or greater than amounts owed to the fund under each repurchase agreement.
Joint Trading Account — Pursuant to an Exemptive Order issued by the Securities and Exchange Commission, the fund, along with certain other funds in the American Century Investments family of funds, may transfer uninvested cash balances into a joint trading account. These balances are invested in one or more repurchase agreements that are collateralized by U.S. Treasury or Agency obligations.
Segregated Assets — In accordance with the 1940 Act, the fund segregates assets on its books and records to cover futures contracts. ACIM monitors, on a daily basis, the securities segregated to ensure the fund designates a sufficient amount of liquid assets, marked-to-market daily. The fund may also receive assets or be required to pledge assets at the custodian bank or with a broker for margin requirements on futures contracts.
Income Tax Status — It is the fund’s policy to distribute substantially all net investment income and net realized gains to shareholders and to otherwise qualify as a regulated investment company under provisions of the Internal Revenue Code. Accordingly, no provision has been made for income taxes. The fund files U.S. federal, state, local and non-U.S. tax returns as applicable. The fund's tax returns are subject to examination by the relevant taxing authority until expiration of the applicable statute of limitations, which is generally three years from the date of filing but can be longer in certain jurisdictions. At this time, management believes there are no uncertain tax positions which, based on their technical merit, would not be sustained upon examination and for which it is reasonably possible that the total amounts of unrecognized tax benefits will significantly change in the next twelve months.
Multiple Class — All shares of the fund represent an equal pro rata interest in the net assets of the class to which such shares belong, and have identical voting, dividend, liquidation and other rights and the same terms and conditions, except for class specific expenses and exclusive rights to vote on matters affecting only individual classes. Income, non-class specific expenses, and realized and unrealized capital gains and losses of the fund are allocated to each class of shares based on their relative net assets.
Distributions to Shareholders — Distributions from net investment income and net realized gains, if any, are generally declared and paid annually. The fund may elect to treat a portion of its payment to a redeeming shareholder, which represents the pro rata share of undistributed net investment income and net realized gains, as a distribution for federal income tax purposes (tax equalization).
Indemnifications — Under the corporation’s organizational documents, its officers and directors are indemnified against certain liabilities arising out of the performance of their duties to the fund. In addition, in the normal course of business, the fund enters into contracts that provide general indemnifications. The maximum exposure under these arrangements is unknown as this would involve future claims that may be made against a fund. The risk of material loss from such claims is considered by management to be remote.
3. Fees and Transactions with Related Parties
Certain officers and directors of the corporation are also officers and/or directors of American Century Companies, Inc. (ACC). The corporation’s investment advisor, ACIM, the corporation's distributor, American Century Investment Services, Inc., and the corporation’s transfer agent, American Century Services, LLC, are wholly owned, directly or indirectly, by ACC. Various funds issued by American Century Asset Allocation Portfolios, Inc. own, in aggregate, 100% of the shares of the fund. Related parties do not invest in the fund for the purpose of exercising management or control.
Management Fees —The corporation has entered into a management agreement with ACIM, under which ACIM provides the fund with investment advisory and management services in exchange for a single, unified management fee (the fee) per class. The agreement provides that all expenses of managing and operating the fund, except distribution and service fees, brokerage expenses, taxes, interest, fees and expenses of the independent directors (including legal counsel fees), and extraordinary expenses, will be paid by ACIM. The fee is computed and accrued daily based on each class's daily net assets and paid monthly in arrears. The annual management fee is 0.650% for the G Class. Prior to July 31, 2017, the annual management fee was 0.800% for the G Class and 0.650% for the R6 Class. Effective July 31, 2017, the investment advisor agreed to waive the G Class’s management fee in its entirety. The investment advisor expects this waiver to remain in effect permanently and cannot terminate it without the approval of the Board of Directors. The effective annual management fee for the period ended October 31, 2017 was 0.75% before waiver and 0.57% after waiver for the G Class.
Directors' Fees and Expenses — The Board of Directors is responsible for overseeing the investment advisor’s management and operations of the fund. The directors receive detailed information about the fund and its investment advisor regularly throughout the year, and meet at least quarterly with management of the investment advisor to review reports about fund operations. The fund’s officers do not receive compensation from the fund.
Interfund Transactions — The fund may enter into security transactions with other American Century Investments funds and other client accounts of the investment advisor, in accordance with the 1940 Act rules and procedures adopted by the Board of Directors. The rules and procedures require, among other things, that these transactions be effected at the independent current market price of the security. During the period, the interfund purchases and sales were $3,020,341 and $7,561,965, respectively. The effect of interfund transactions on the Statement of Operations was $893,719 in net realized gain (loss) on investment transactions.
4. Investment Transactions
Purchases and sales of investment securities, excluding short-term investments, for the period ended October 31, 2017 were $517,986,247 and $553,566,301, respectively.
5. Capital Share Transactions
Transactions in shares of the fund were as follows:
|
| | | | | | | | | | |
| Year ended
October 31, 2017 | Year ended
October 31, 2016 |
| Shares | Amount | Shares | Amount |
G Class/Shares Authorized | 500,000,000 |
| | 335,000,000 |
| |
Sold | 10,789,180 |
| $ | 145,023,909 |
| 9,790,354 |
| $ | 114,337,876 |
|
Issued in reinvestment of distributions | 1,817,769 |
| 22,613,046 |
| 3,888,208 |
| 47,436,142 |
|
Redeemed | (8,335,745 | ) | (110,364,109 | ) | (5,527,519 | ) | (68,697,827 | ) |
| 4,271,204 |
| 57,272,846 |
| 8,151,043 |
| 93,076,191 |
|
R6 Class/Shares Authorized | N/A |
| | 50,000,000 |
| |
Sold | 1,796,142 |
| 23,492,081 |
| 2,710,867 |
| 33,673,026 |
|
Issued in reinvestment of distributions | 195,908 |
| 2,450,807 |
| 247,109 |
| 3,027,088 |
|
Redeemed | (7,123,592 | ) | (98,624,300 | ) | (278,019 | ) | (3,446,092 | ) |
| (5,131,542 | ) | (72,681,412 | ) | 2,679,957 |
| 33,254,022 |
|
Net increase (decrease) | (860,338 | ) | $ | (15,408,566 | ) | 10,831,000 |
| $ | 126,330,213 |
|
6. Fair Value Measurements
The fund’s investments valuation process is based on several considerations and may use multiple inputs to determine the fair value of the investments held by the fund. In conformity with accounting principles generally accepted in the United States of America, the inputs used to determine a valuation are classified into three broad levels.
| |
• | Level 1 valuation inputs consist of unadjusted quoted prices in an active market for identical investments. |
| |
• | Level 2 valuation inputs consist of direct or indirect observable market data (including quoted prices for comparable investments, evaluations of subsequent market events, interest rates, prepayment speeds, credit risk, etc.). These inputs also consist of quoted prices for identical investments initially expressed in local currencies that are adjusted through translation into U.S. dollars. |
| |
• | Level 3 valuation inputs consist of unobservable data (including a fund’s own assumptions). |
The level classification is based on the lowest level input that is significant to the fair valuation measurement. The valuation inputs are not necessarily an indication of the risks associated with investing in these securities or other financial instruments. There were no significant transfers between levels during the period.
The following is a summary of the level classifications as of period end. The Schedule of Investments provides additional information on the fund’s portfolio holdings.
|
| | | | | | | | |
| Level 1 | Level 2 | Level 3 |
Assets | | | |
Investment Securities | | | |
Common Stocks | $ | 802,471,681 |
| — |
| — |
|
Exchange-Traded Funds | 14,338,782 |
| — |
| — |
|
Temporary Cash Investments | 5,093 |
| $ | 8,396,616 |
| — |
|
| $ | 816,815,556 |
| $ | 8,396,616 |
| — |
|
Other Financial Instruments | | | |
Forward Foreign Currency Exchange Contracts | — |
| $ | 163,201 |
| — |
|
7. Derivative Instruments
Foreign Currency Risk — The fund is subject to foreign currency exchange rate risk in the normal course of pursuing its investment objectives. The value of foreign investments held by a fund may be significantly affected by changes in foreign currency exchange rates. The dollar value of a foreign security generally decreases when the value of the dollar rises against the foreign currency in which the security is denominated and tends to increase when the value of the dollar declines against such foreign currency. A fund may enter into forward foreign currency exchange contracts to reduce a fund's exposure to foreign currency exchange rate fluctuations. The net U.S. dollar value of foreign currency underlying all contractual commitments held by a fund and the resulting unrealized appreciation or depreciation are determined daily. Realized gain or loss is recorded upon the termination of the contract. Net realized and unrealized gains or losses occurring during the holding period of forward foreign currency exchange contracts are a component of net realized gain (loss) on forward foreign currency exchange contract transactions and change in net unrealized appreciation (depreciation) on forward foreign currency exchange contracts, respectively. A fund bears the risk of an unfavorable change in the foreign currency exchange rate underlying the forward contract. Additionally, losses, up to the fair value, may arise if the counterparties do not perform under the contract terms. The fund's average U.S. dollar exposure to foreign currency risk derivative instruments held during the period was $6,444,838.
Equity Price Risk — The fund is subject to equity price risk in the normal course of pursuing its investment objectives. A fund may enter into futures contracts based on an equity index in order to manage its exposure to changes in market conditions. A fund may purchase futures contracts to gain exposure to increases in market value or sell futures contracts to protect against a decline in market value. Upon entering into a futures contract, a fund is required to deposit either cash or securities in an amount equal to a certain percentage of the contract value (initial margin). Subsequent payments (variation margin) are made or received daily, in cash, by a fund. The variation margin is equal to the daily change in the contract value and is recorded as unrealized gains and losses. A fund recognizes a realized gain or loss when the contract is closed or expires. Net realized and unrealized gains or losses occurring during the holding period of futures contracts are a component of net realized gain (loss) on futures contract transactions and change in net unrealized appreciation (depreciation) on futures contracts, respectively. One of the risks of entering into futures contracts is the possibility that the change in value of the contract may not correlate with the changes in value of the underlying securities. During the period, the fund participated in equity price risk derivative instruments for temporary investment purposes.
Value of Derivative Instruments as of October 31, 2017
|
| | | | | | | |
| Asset Derivatives | Liability Derivatives |
Type of Risk Exposure | Location on Statement of Assets and Liabilities | Value | Location on Statement of Assets and Liabilities | Value |
Foreign Currency Risk | Unrealized appreciation on forward foreign currency exchange contracts | $ | 163,201 |
| Unrealized depreciation on forward foreign currency exchange contracts | — |
|
Effect of Derivative Instruments on the Statement of Operations for the Year Ended October 31, 2017
|
| | | | | | | | |
| Net Realized Gain (Loss) | Change in Net Unrealized Appreciation (Depreciation) |
Type of Risk Exposure | Location on Statement of Operations | Value | Location on Statement of Operations | Value |
Equity Price Risk | Net realized gain (loss) on futures contract transactions | $ | (464,764 | ) | Change in net unrealized appreciation (depreciation) on futures contracts | — |
|
Foreign Currency Risk | Net realized gain (loss) on forward foreign currency exchange contract transactions | (262,447 | ) | Change in net unrealized appreciation (depreciation) on forward foreign currency exchange contracts | $ | 52,668 |
|
| | $ | (727,211 | ) | | $ | 52,668 |
|
8. Risk Factors
The fund invests in common stocks of small companies. Because of this, the fund may be subject to greater risk and market fluctuations than a fund investing in larger, more established companies.
9. Federal Tax Information
The tax character of distributions paid during the years ended October 31, 2017 and October 31, 2016 were as follows:
|
| | | | | | |
| 2017 | 2016 |
Distributions Paid From | | |
Ordinary income | — |
| — |
|
Long-term capital gains | $ | 25,063,853 |
| $ | 50,463,230 |
|
The book-basis character of distributions made during the year from net investment income or net realized gains may differ from their ultimate characterization for federal income tax purposes. These differences reflect the differing character of certain income items and net realized gains and losses for financial statement and tax purposes, and may result in reclassification among certain capital accounts on the financial statements.
As of period end, the federal tax cost of investments and the components of distributable earnings on a tax-basis were as follows:
|
| | | |
Federal tax cost of investments | $ | 647,684,407 |
|
Gross tax appreciation of investments | $ | 184,469,216 |
|
Gross tax depreciation of investments | (6,941,451 | ) |
Net tax appreciation (depreciation) of investments | $ | 177,527,765 |
|
Undistributed ordinary income | $ | 3,083,930 |
|
Accumulated long-term gains | $ | 51,431,241 |
|
The difference between book-basis and tax-basis unrealized appreciation (depreciation) is attributable primarily to the tax deferral of losses on wash sales.
|
| | | | | | | | | | | | | | | |
For a Share Outstanding Throughout the Years Ended October 31 (except as noted) | | | | | | |
Per-Share Data | | | | | | | | | Ratios and Supplemental Data | |
| | Income From Investment Operations: | Distributions From: | | | Ratio to Average Net Assets of: | | |
| Net Asset
Value,
Beginning
of Period | Net
Investment
Income
(Loss)(1) | Net
Realized
and
Unrealized
Gain (Loss) | Total From
Investment
Operations | Net
Investment
Income | Net
Realized
Gains | Total
Distributions | Net Asset
Value,
End
of Period | Total
Return(2) | Operating
Expenses | Net
Investment
Income
(Loss) | Portfolio
Turnover
Rate | Net
Assets,
End of
Period
(in thousands) |
G Class(3) | | | | | | | | | | | | |
2017 | $12.31 | 0.04 | 2.50 | 2.54 | — | (0.44) | (0.44) | $14.41 | 21.29% | 0.58%(4) | 0.27%(4) | 67% |
| $822,910 |
|
2016 | $13.65 | —(5) | (0.28) | (0.28) | — | (1.06) | (1.06) | $12.31 | (2.01)% | 0.80% | (0.02)% | 73% |
| $649,951 |
|
2015 | $13.37 | (0.03) | 0.93 | 0.90 | — | (0.62) | (0.62) | $13.65 | 7.20% | 0.80% | (0.22)% | 83% |
| $609,841 |
|
2014 | $13.81 | (0.04) | 1.08 | 1.04 | — | (1.48) | (1.48) | $13.37 | 8.53% | 0.80% | (0.31)% | 76% |
| $572,085 |
|
2013 | $10.61 | (0.01) | 3.23 | 3.22 | (0.02) | — | (0.02) | $13.81 | 30.38% | 0.80% | (0.10)% | 113% |
| $459,877 |
|
|
|
Notes to Financial Highlights |
| |
(1) | Computed using average shares outstanding throughout the period. |
| |
(2) | Total returns are calculated based on the net asset value of the last business day. Total returns for periods less than one year are not annualized. |
| |
(3) | Prior to July 31, 2017, the G Class was referred to as the Institutional Class. |
| |
(4) | The ratio of operating expenses to average net assets before expense waiver and the ratio of net investment income (loss) to average net assets before expense waiver was 0.76% and 0.09%, respectively. |
| |
(5) | Per-share amount was less than $0.005. |
See Notes to Financial Statements.
|
|
Report of Independent Registered Public Accounting Firm |
To the Board of Directors and Shareholders of American Century Mutual Funds, Inc.:
We have audited the accompanying statement of assets and liabilities, including the schedule of investments, of NT Heritage Fund (the “Fund”), one of the funds constituting American Century Mutual Funds, Inc., as of October 31, 2017, and the related statement of operations for the year then ended, the statements of changes in net assets for each of the two years in the period then ended, and the financial highlights for each of the five years in the period then ended. These financial statements and financial highlights are the responsibility of the Fund’s management. Our responsibility is to express an opinion on these financial statements and financial highlights based on our audits.
We conducted our audits in accordance with the standards of the Public Company Accounting Oversight Board (United States). Those standards require that we plan and perform the audit to obtain reasonable assurance about whether the financial statements and financial highlights are free of material misstatement. The Fund is not required to have, nor were we engaged to perform, an audit of its internal control over financial reporting. Our audits included consideration of internal control over financial reporting as a basis for designing audit procedures that are appropriate in the circumstances, but not for the purpose of expressing an opinion on the effectiveness of the Fund’s internal control over financial reporting. Accordingly, we express no such opinion. An audit also includes examining, on a test basis, evidence supporting the amounts and disclosures in the financial statements, assessing the accounting principles used and significant estimates made by management, as well as evaluating the overall financial statement presentation. Our procedures included confirmation of securities owned as of October 31, 2017, by correspondence with the custodian and brokers; when replies were not received from brokers, we performed other auditing procedures. We believe that our audits provide a reasonable basis for our opinion.
In our opinion, the financial statements and financial highlights referred to above present fairly, in all material respects, the financial position of NT Heritage Fund of American Century Mutual Funds, Inc. as of October 31, 2017, the results of its operations for the year then ended, the changes in its net assets for each of the two years in the period then ended, and the financial highlights for each of the five years in the period then ended, in conformity with accounting principles generally accepted in the United States of America.
DELOITTE & TOUCHE LLP
Kansas City, Missouri
December 15, 2017
The Board of Directors
The individuals listed below serve as directors of the funds. Each director will continue to serve in this capacity until death, retirement, resignation or removal from office. The board has adopted a mandatory retirement age for directors who are not “interested persons,” as that term is defined in the Investment Company Act (independent directors). Independent directors shall retire by December 31 of the year in which they reach their 75th birthday.
Mr. Thomas is an “interested person” because he currently serves as President and Chief Executive Officer of American Century Companies, Inc. (ACC), the parent company of American Century Investment Management, Inc. (ACIM or the advisor). The other directors (more than three-fourths of the total number) are independent. They are not employees, directors or officers of, and have no financial interest in, ACC or any of its wholly owned, direct or indirect, subsidiaries, including ACIM, American Century Investment Services, Inc. (ACIS) and American Century Services, LLC (ACS), and they do not have any other affiliations, positions or relationships that would cause them to be considered “interested persons” under the Investment Company Act. The directors serve in this capacity for seven (in the case of Mr. Thomas, 15) registered investment companies in the American Century Investments family of funds.
The following table presents additional information about the directors. The mailing address for each director is 4500 Main Street, Kansas City, Missouri 64111.
|
| | | | | |
Name
(Year of Birth) | Position(s) Held with Funds | Length of Time Served | Principal Occupation(s) During Past 5 Years | Number of American Century Portfolios Overseen by Director | Other Directorships Held During Past 5 Years |
Independent Directors |
|
|
Thomas W. Bunn (1953) | Director | Since 2017 | Retired | 69 | SquareTwo Financial; Barings (formerly Babson Capital Funds Trust) (2013 to 2016) |
Barry Fink
(1955) | Director | Since 2012 (independent since 2016) | Retired; Executive Vice President, ACC (2007 to 2013); President, ACS (2007 to 2013); Chief Operating Officer, ACC (2007 to 2012) | 69 | None |
Andrea C. Hall
(1945) | Director | Since 1997 | Retired | 69 | None |
Jan M. Lewis
(1957) | Director | Since 2011 | Retired; President and Chief Executive Officer, Catholic Charities of Northeast Kansas (human services organization) (2006 to 2013) | 69 | None |
James A. Olson
(1942) | Director and Chairman of the Board | Since 2007 (Chairman since 2014) | Member, Plaza Belmont LLC (private equity fund manager) (1999 to present) | 69 | Saia, Inc. (2002 to 2012) and EPR Properties (2003 to 2013) |
|
| | | | | |
Name
(Year of Birth) | Position(s) Held with Funds | Length of Time Served | Principal Occupation(s) During Past 5 Years | Number of American Century Portfolios Overseen by Director | Other Directorships Held During Past 5 Years |
Independent Directors |
|
|
M. Jeannine Strandjord
(1945) | Director | Since 1994 | Retired | 69 | Euronet Worldwide Inc.; MGP Ingredients, Inc.; and DST Systems Inc. (1996 to 2012) |
John R. Whitten
(1946) | Director | Since 2008 | Retired | 69 | Rudolph Technologies, Inc. |
Stephen E. Yates
(1948) | Director | Since 2012 | Retired | 69 | None |
Interested Director |
|
|
Jonathan S. Thomas
(1963) | Director and President | Since 2007 | President and Chief Executive Officer, ACC (2007 to present). Also serves as Chief Executive Officer, ACS; Executive Vice President, ACIM; Director, ACC, ACIM and other ACC subsidiaries | 114 | BioMed Valley Discoveries, Inc. |
The Statement of Additional Information has additional information about the fund's directors and is available without charge, upon request, by calling 1-800-345-2021.
Officers
The following table presents certain information about the executive officers of the funds. Each officer serves as an officer for each of the 15 investment companies in the American Century family of funds, unless otherwise noted. No officer is compensated for his or her service as an officer of the funds. The listed officers are interested persons of the funds and are appointed or re-appointed on an annual basis. The mailing address for each officer listed below is 4500 Main Street, Kansas City, Missouri 64111.
|
| | |
Name
(Year of Birth) | Offices with the Funds | Principal Occupation(s) During the Past Five Years |
Jonathan S. Thomas
(1963) | Director and President since 2007 | President and Chief Executive Officer, ACC (2007 to present). Also serves as Chief Executive Officer, ACS; Executive Vice President, ACIM; Director, ACC, ACIM and other ACC subsidiaries |
Amy D. Shelton
(1964) | Chief Compliance Officer and Vice President since 2014 | Chief Compliance Officer, American Century funds, (2014 to present); Chief Compliance Officer, ACIM (2014 to present); Chief Compliance Officer, ACIS (2009 to present); Vice President, Client Interactions and Marketing, ACIS (2013 to 2014); Director, Client Interactions and Marketing, ACIS (2007 to 2013). Also serves as Vice President, ACIS |
Charles A. Etherington
(1957) | General Counsel since 2007 and Senior Vice President since 2006 | Attorney, ACC (1994 to present); Vice President, ACC (2005 to present); General Counsel, ACC (2007 to present). Also serves as General Counsel, ACIM, ACS, ACIS and other ACC subsidiaries; and Senior Vice President, ACIM and ACS |
C. Jean Wade
(1964) | Vice President,Treasurer and Chief Financial Officer since 2012 | Vice President, ACS (2000 to present) |
Robert J. Leach
(1966) | Vice President since 2006 and Assistant Treasurer since 2012 | Vice President, ACS (2000 to present) |
David H. Reinmiller
(1963) | Vice President since 2000 | Attorney, ACC (1994 to present); Associate General Counsel, ACC (2001 to present). Also serves as Vice President, ACIM and ACS |
Ward D. Stauffer
(1960) | Secretary since 2005 | Attorney, ACC (2003 to present) |
|
|
Approval of Management Agreement |
At a meeting held on June 29, 2017, the Fund’s Board of Directors (the "Board") unanimously approved the renewal of the management agreement pursuant to which American Century Investment Management, Inc. (the “Advisor”) acts as the investment advisor for the Fund. Under Section 15(c) of the Investment Company Act, contracts for investment advisory services are required to be reviewed, evaluated, and approved by a majority of a fund’s directors (the “Directors”), including a majority of the independent Directors, each year.
Prior to its consideration of the renewal of the management agreement, the Directors requested and reviewed extensive data and information compiled by the Advisor and certain independent providers of evaluation data concerning the Fund and the services provided to the Fund by the Advisor. This review was in addition to the oversight and evaluation undertaken by the Board and its committees on a continual basis and the information received was supplemental to the extensive information that the Board and its committees receive and consider throughout the year.
In connection with its consideration of the renewal of the management agreement, the Board’s review and evaluation of the services provided by the Advisor included, but was not limited to, the following:
| |
• | the nature, extent, and quality of investment management, shareholder services, and other services provided and to be provided to the Fund; |
| |
• | the wide range of other programs and services provided and to be provided to the Fund and its shareholders on a routine and non-routine basis; |
| |
• | the investment performance of the Fund, including data comparing the Fund's performance to appropriate benchmarks and/or a peer group of other mutual funds with similar investment objectives and strategies; |
| |
• | the cost of owning the Fund compared to the cost of owning similar funds; |
| |
• | the compliance policies, procedures, and regulatory experience of the Advisor and the Fund's service providers; |
| |
• | financial data showing the cost of services provided to the Fund, the profitability of the Fund to the Advisor, and the overall profitability of the Advisor; |
| |
• | strategic plans of the Advisor |
| |
• | possible economies of scale associated with the Advisor’s management of the Fund and other accounts under its management; |
| |
• | data comparing services provided and charges to the Advisor's other investment management clients; |
| |
• | acquired fund fees and expenses; |
| |
• | payments and practices by the Fund and the Advisor regarding financial intermediaries, the nature of services provided by intermediaries, and the terms of share classes utilized; and |
| |
• | any collateral benefits derived by the Advisor from the management of the Fund. |
The Directors held three in-person meetings and one telephonic meeting to review and discuss the information provided. The independent Directors also reviewed responses to supplemental information requests and held active discussions with the Advisor regarding the renewal of the management agreement. The independent Directors had the benefit of the advice of their independent counsel throughout the process.
Factors Considered
The Directors considered all of the information provided by the Advisor, the independent data providers, and independent counsel in connection with the approval. They determined that the
information was sufficient for them to evaluate the management agreement for the Fund. In connection with their review, the Directors did not identify any single factor as being all-important or controlling, and each Director may have attributed different levels of importance to different factors. In deciding to renew the management agreement, the Board based its decision on a number of factors, including without limitation the following:
Nature, Extent and Quality of Services - Generally. Under the management agreement, the Advisor is responsible for providing or arranging for all services necessary for the operation of the Fund. The Board noted that the Advisor provides or arranges at its own expense a wide variety of services including without limitation the following:
| |
• | portfolio research and security selection |
| |
• | daily valuation of the Fund’s portfolio |
| |
• | shareholder servicing and transfer agency, including shareholder confirmations, recordkeeping, and communications |
| |
• | legal services (except the independent Directors’ counsel) |
| |
• | regulatory and portfolio compliance |
| |
• | marketing and distribution (except amounts paid by the Fund under Rule 12b-1 plans) |
The Board noted that many of these services have expanded over time in terms of both quantity and complexity in response to shareholder demands, competition in the industry, changing distribution channels, and the changing regulatory environment. The Board noted specifically the resources the Advisor has committed during the year to compliance with the Department of Labor fiduciary rule and share class modernization.
Investment Management Services. The nature of the investment management services provided to the Fund is quite complex and allows Fund shareholders access to professional money management, instant diversification of their investments within an asset class, the opportunity to easily diversify among asset classes by investing in or exchanging among various American Century Investments funds, and liquidity. In evaluating investment performance, the Board expects the Advisor to manage the Fund in accordance with its investment objectives and approved strategies. Further, the Directors recognize that the Advisor has an obligation to monitor trading activities, and in particular to seek the best execution of fund trades, and to evaluate the use of and payment for research. In providing these services, the Advisor utilizes teams of investment professionals (portfolio managers, analysts, research assistants, and securities traders) who require extensive information technology, research, training, compliance, and other systems to conduct their business. The Board, directly and through its Fund Performance Review Committee, provides oversight of the investment performance process. It regularly reviews investment performance information for the Fund, together with comparative information for appropriate benchmarks and/or peer groups of similarly-managed funds, over different time horizons. The Directors also review detailed performance information provided by the Advisor during the management agreement renewal process. If performance concerns are identified, the Fund receives special reviews until performance improves, during which the Board receives a report from the Advisor regarding the reasons for such results (e.g., market conditions, security selection) and any efforts being undertaken to improve performance. The Fund’s performance was below its benchmark for the one-, three-, five-, and ten-year periods reviewed by the Board. The Board discussed the Fund's performance with the Advisor and was satisfied with the efforts being undertaken by the Advisor. The Board found the investment management services provided by the Advisor to the Fund to be satisfactory and consistent with the management agreement.
Shareholder and Other Services. Under the management agreement, the Advisor provides the Fund with a comprehensive package of transfer agency, shareholder, and other services. The Board, directly and through various committees of the Board, regularly reviews reports and evaluations of such services at its regular meetings. These reports include, but are not limited to, information regarding the operational efficiency and accuracy of the shareholder and transfer agency services provided, staffing levels, shareholder satisfaction (as measured by external as well as internal sources), technology support, new products and services offered to Fund shareholders, securities trading activities, portfolio valuation services, auditing services, and legal and operational compliance activities. Certain aspects of shareholder and transfer agency service level efficiency and the quality of securities trading activities are measured by independent third party providers and are presented in comparison to other fund groups not managed by the Advisor. The Board found the services provided by the Advisor to the Fund under the management agreement to be competitive and of high quality.
Costs of Services and Profitability. The Advisor provides detailed information concerning its cost of providing various services to the Fund, its profitability in managing the Fund (pre- and post-distribution), its overall profitability, and its financial condition. The Directors have reviewed with the Advisor the methodology used to prepare this financial information. This information is considered in evaluating the Advisor’s financial condition, its ability to continue to provide services under the management agreement, and the reasonableness of the current management fee. The Board concluded that the Advisor’s profits were reasonable in light of the services provided to the Fund.
Ethics. The Board generally considers the Advisor’s commitment to providing quality services to shareholders and to conducting its business ethically. They noted that the Advisor’s practices generally meet or exceed industry best practices.
Economies of Scale. The Board also reviewed information provided by the Advisor regarding the possible existence of economies of scale in connection with the management of the Fund. The Board concluded that economies of scale are difficult to measure and predict with precision, especially on a fund-by-fund basis. The Board concluded that the Advisor is appropriately sharing economies of scale through its competitive fee structure, offering competitive fees from fund inception, and through reinvestment in its business to provide shareholders additional content and services.
Comparison to Other Funds’ Fees. The management agreement provides that the Fund pays the Advisor a single, all-inclusive (or unified) management fee for providing all services necessary for the management and operation of the Fund, other than brokerage expenses, expenses attributable to short sales, taxes, interest, extraordinary expenses, and the fees and expenses of the Fund’s independent Directors (including their independent legal counsel) and expenses incurred in connection with the provision of shareholder services and distribution services under a plan adopted pursuant to Rule 12b-1 under the 1940 Act. Under the unified fee structure, the Advisor is responsible for providing all investment advisory, custody, audit, administrative, compliance, recordkeeping, marketing and shareholder services, or arranging and supervising third parties to provide such services. By contrast, most other funds are charged a variety of fees, including an investment advisory fee, a transfer agency fee, an administrative fee, distribution charges, and other expenses. Other than their investment advisory fees and any applicable Rule 12b-1 distribution fees, all other components of the total fees charged by these other funds may be increased without shareholder approval. The Board believes the unified fee structure is a benefit to Fund shareholders because it clearly discloses to shareholders the cost of owning Fund shares, and, since the unified fee cannot be increased without a vote of Fund shareholders, it shifts to the Advisor the risk of increased costs of operating the Fund and provides a direct incentive to minimize administrative inefficiencies. Part of the Board’s analysis of fee levels involves reviewing certain evaluative data compiled by an independent provider comparing the Fund’s unified fee to the total expense ratios of its peers. The unified fee charged to shareholders of the Fund was below the median of the total expense ratios of the Fund’s peer expense universe and was within the range of its peer expense group. The Board concluded that the management fee paid by the
Fund to the Advisor under the management agreement is reasonable in light of the services provided to the Fund.
Comparison to Fees and Services Provided to Other Clients of the Advisor. The Directors also requested and received information from the Advisor concerning the nature of the services, fees, costs, and profitability of its advisory services to advisory clients other than the Fund. They observed that these varying types of client accounts require different services and involve different regulatory and entrepreneurial risks than the management of the Fund. The Board analyzed this information and concluded that the fees charged and services provided to the Fund were reasonable by comparison.
Payments to Intermediaries. The Directors also requested and received a description of payments made to intermediaries by the Fund and the Advisor and services provided in response thereto. These payments include various payments made by the Fund or the Advisor to different types of intermediaries and recordkeepers for distribution and service activities provided for the Fund. The Board reviewed such information and received representations from the Advisor that all such payments by the Fund were made pursuant to the Fund's Rule 12b-1 Plan and that all such payments by the Advisor were made from the Advisor's resources and reasonable profits. The Board found the payments to be reasonable in scope and purpose.
Collateral or “Fall-Out” Benefits Derived by the Advisor. The Board considered the existence of collateral benefits the Advisor may receive as a result of its relationship with the Fund. They concluded that the Advisor’s primary business is managing mutual funds and it generally does not use fund or shareholder information to generate profits in other lines of business, and therefore does not derive any significant collateral benefits from them. The Board noted that additional assets from other clients may offer the Advisor some benefit from increased leverage with service providers and counterparties. Additionally, the Advisor receives proprietary research from broker-dealers that execute fund portfolio transactions, which the Board concluded is likely to benefit other clients of the Advisor, as well as Fund shareholders. The Board also determined that the Advisor is able to provide investment management services to certain clients other than the Fund, at least in part, due to its existing infrastructure built to serve the fund complex. The Board concluded that appropriate allocation methodologies had been employed to assign resources and the cost of those resources to these other clients and, where expressly provided, these other client assets may be included with the assets of the Fund to determine breakpoints in the management fee schedule.
Existing Relationship. The Board also considered whether there was any reason for not continuing the existing arrangement with the Advisor. In this regard, the Board was mindful of the potential disruptions of the Fund’s operations and various risks, uncertainties, and other effects that could occur as a result of a decision not to continue such relationship. In particular, the Board recognized that most shareholders have invested in the Fund on the strength of the Advisor’s industry standing and reputation and in the expectation that the Advisor will have a continuing role in providing advisory services to the Fund.
Conclusion of the Directors. As a result of this process, the Board, including all of the independent Directors, taking into account all of the factors discussed above and the information provided by the Advisor and others in connection with its review and throughout the year, determined that the management fee is fair and reasonable in light of the services provided and that the investment management agreement between the Fund and the Advisor should be renewed.
A special meeting of shareholders was held on October 18, 2017, to vote on the following proposal. The proposal received the required votes and was adopted. A summary of voting results is listed below.
To elect four directors to the Board of Directors of American Century Mutual Funds, Inc.:
|
| | | | | | | |
| Affirmative |
| Withhold |
Thomas W. Bunn | $ | 19,547,896,641 |
|
| $ | 402,531,816 |
|
Barry Fink | $ | 19,543,961,253 |
|
| $ | 406,467,204 |
|
Jan M. Lewis | $ | 19,556,221,886 |
|
| $ | 394,206,571 |
|
Stephen E. Yates | $ | 19,543,817,152 |
|
| $ | 406,611,305 |
|
The other directors whose term of office continued after the meeting include Jonathan S. Thomas, Andrea C. Hall, James A. Olson, M. Jeannine Strandjord, and John R. Whitten.
Retirement Account Information
As required by law, distributions you receive from certain retirement accounts are subject to federal income tax withholding, unless you elect not to have withholding apply*. Tax will be withheld on the total amount withdrawn even though you may be receiving amounts that are not subject to withholding, such as nondeductible contributions. In such case, excess amounts of withholding could occur. You may adjust your withholding election so that a greater or lesser amount will be withheld.
If you don’t want us to withhold on this amount, you must notify us to not withhold the federal income tax. You may notify us in writing or in certain situations by telephone or through other electronic means. For systematic withdrawals, your withholding election will remain in effect until revoked or changed by filing a new election. You have the right to revoke your election at any time and change your withholding percentage for future distributions.
Remember, even if you elect not to have income tax withheld, you are liable for paying income tax on the taxable portion of your withdrawal. If you elect not to have income tax withheld or you don’t have enough income tax withheld, you may be responsible for payment of estimated tax. You may incur penalties under the estimated tax rules if your withholding and estimated tax payments are not sufficient. You can reduce or defer the income tax on a distribution by directly or indirectly rolling such distribution over to another IRA or eligible plan. You should consult your tax advisor for additional information.
State tax will be withheld if, at the time of your distribution, your address is within one of the mandatory withholding states and you have federal income tax withheld (or as otherwise required by state law). State taxes will be withheld from your distribution in accordance with the respective state rules.
*Some 403(b), 457 and qualified retirement plan distributions may be subject to 20% mandatory withholding, as they are subject to special tax and withholding rules. Your plan administrator or plan sponsor is required to provide you with a special tax notice explaining those rules at the time you request a distribution. If applicable, federal and/or state taxes may be withheld from your distribution amount.
Proxy Voting Policies
A description of the policies that the fund's investment advisor uses in exercising the voting rights associated with the securities purchased and/or held by the fund is available without charge, upon request, by calling 1-800-345-2021. It is also available on the "About Us" page of American Century Investments’ website at americancentury.com and on the Securities and Exchange Commission’s website at sec.gov. Information regarding how the investment advisor voted proxies relating to portfolio securities during the most recent 12-month period ended June 30 is available on the "About Us" page at americancentury.com. It is also available at sec.gov.
Quarterly Portfolio Disclosure
The fund files its complete schedule of portfolio holdings with the Securities and Exchange Commission (SEC) for the first and third quarters of each fiscal year on Form N-Q. The fund’s Forms N-Q are available on the SEC’s website at sec.gov, and may be reviewed and copied at the SEC’s Public Reference Room in Washington, DC. Information on the operation of the Public Reference Room may be obtained by calling 1-800-SEC-0330. The fund also makes its complete schedule of portfolio holdings for the most recent quarter of its fiscal year available on its website at americancentury.com and, upon request, by calling 1-800-345-2021.
Other Tax Information
The following information is provided pursuant to provisions of the Internal Revenue Code.
The fund hereby designates $50,403 as qualified short-term capital gain distributions for purposes of Internal Revenue Code Section 871 for the fiscal year ended October 31, 2017.
The fund hereby designates $26,829,241, or up to the maximum amount allowable, as long-term capital gain distributions (20% rate gain distributions) for the fiscal year ended October 31, 2017.
The fund utilized earnings and profits of $1,871,244 distributed to shareholders on redemption of shares as part of the dividends paid deduction (tax equalization).
|
| | |
| |
| | |
Contact Us | americancentury.com | |
Automated Information Line | 1-800-345-8765 | |
Investor Services Representative | 1-800-345-2021 or 816-531-5575 | |
Investors Using Advisors | 1-800-378-9878 | |
Business, Not-For-Profit, Employer-Sponsored Retirement Plans | 1-800-345-3533 | |
Banks and Trust Companies, Broker-Dealers, Financial Professionals, Insurance Companies | 1-800-345-6488 | |
Telecommunications Relay Service for the Deaf | 711 | |
| | |
American Century Mutual Funds, Inc. | |
| | |
Investment Advisor: American Century Investment Management, Inc. Kansas City, Missouri | |
| | |
This report and the statements it contains are submitted for the general information of our shareholders. The report is not authorized for distribution to prospective investors unless preceded or accompanied by an effective prospectus. | |
| | |
©2017 American Century Proprietary Holdings, Inc. All rights reserved.
CL-ANN-90987 1712 | |
|
| |
| |
| Annual Report |
| |
| October 31, 2017 |
| |
| Select Fund |
|
| | |
President’s Letter | 2 |
|
Performance | 3 |
|
Portfolio Commentary | |
|
Fund Characteristics | |
|
Shareholder Fee Example | |
|
Schedule of Investments | |
|
Statement of Assets and Liabilities | |
|
Statement of Operations | |
|
Statement of Changes in Net Assets | |
|
Notes to Financial Statements | |
|
Financial Highlights | |
|
Report of Independent Registered Public Accounting Firm | |
|
Management | |
|
Approval of Management Agreement | |
|
Proxy Voting Results | |
|
Additional Information | |
|
Any opinions expressed in this report reflect those of the author as of the date of the report, and do not necessarily represent the opinions of American Century Investments® or any other person in the American Century Investments organization. Any such opinions are subject to change at any time based upon market or other conditions and American Century Investments disclaims any responsibility to update such opinions. These opinions may not be relied upon as investment advice and, because investment decisions made by American Century Investments funds are based on numerous factors, may not be relied upon as an indication of trading intent on behalf of any American Century Investments fund. Security examples are used for representational purposes only and are not intended as recommendations to purchase or sell securities. Performance information for comparative indices and securities is provided to American Century Investments by third party vendors. To the best of American Century Investments’ knowledge, such information is accurate at the time of printing.
Jonathan Thomas
Dear Investor:
Thank you for reviewing this annual report for the period ended October 31, 2017. Annual reports help convey important information about fund returns, including market factors that affected performance during the reporting period. For additional, updated investment and market insights, we encourage you to visit our website, americancentury.com.
‘Risk-On’ Sentiment Sparked Strong Gains Among Stocks
U.S. stocks delivered robust double-digit gains for the reporting period. The “risk-on” rally began early in the period, following Donald Trump’s election victory in November 2016. Investor expectations for President Trump’s administration to usher in pro-growth policies and reforms drove stock prices higher. In addition, healthy corporate earnings growth and improving gross domestic product (GDP) and other economic data provided additional support for stocks. Against this backdrop, the S&P 500 Index reached several milestone levels during the period and returned 23.63%. In terms of equity styles, riskier and economically sensitive stocks generally remained in favor. For example, small-cap stocks generally outperformed their mid- and large-cap peers, while growth stocks broadly outperformed their value counterparts across the capitalization spectrum. Real estate investment trusts (REITs) advanced, but global property stocks significantly underperformed the broader stock market as interest rates increased, most notably in the U.S., where the Federal Reserve (Fed) raised rates three times during the period.
As stocks soared in the post-election environment, global bonds sold off sharply. President Trump’s policy agenda fueled inflation fears that sent global bond yields sharply higher in late 2016. However, broad bond market performance generally recovered beginning in early 2017, advancing on subdued inflation and continued central bank accommodation to post modest gains for the entire reporting period. Investor preferences for risk also extended to the global fixed-income market, where high-yield corporate and emerging markets bonds were top performers.
As Congress considers tax cuts and other pro-growth reforms and the Fed and other central banks pursue policy normalization, investors likely will face new opportunities and challenges in the months ahead. We continue to believe in a disciplined, diversified, and risk-aware approach, using professionally managed portfolios in pursuit of investment goals. We appreciate your continued trust in us.
Sincerely,
Jonathan Thomas
President and Chief Executive Officer
American Century Investments
|
| | | | | | |
Total Returns as of October 31, 2017 |
| | | Average Annual Returns | |
| Ticker Symbol | 1 year | 5 years | 10 years | Since Inception | Inception Date |
Investor Class | TWCIX | 27.93% | 15.43% | 8.02% | — | 6/30/71 |
Russell 1000 Growth Index | — | 29.71% | 16.82% | 9.12% | — | — |
I Class | TWSIX | 28.20% | 15.67% | 8.24% | — | 3/13/97 |
Y Class | ASLWX | — | — | — | 14.62% | 4/10/17 |
A Class | TWCAX | | | | | 8/8/97 |
No sales charge | | 27.63% | 15.15% | 7.75% | — | |
With sales charge | | 20.28% | 13.79% | 7.11% | — | |
C Class | ACSLX | 26.66% | 14.28% | 6.94% | — | 1/31/03 |
R Class | ASERX | 27.30% | 14.86% | 7.48% | — | 7/29/05 |
R5 Class | ASLGX | — | — | — | 14.52% | 4/10/17 |
R6 Class | ASDEX | 28.38% | — | — | 15.13% | 7/26/13 |
Average annual returns since inception are presented when ten years of performance history is not available.
Although the fund’s actual inception date was October 31, 1958, the Investor Class inception date corresponds with the investment advisor’s implementation of its current investment philosophy and practices.
Fund returns would have been lower if a portion of the fees had not been waived. Prior to April 10, 2017, the
I Class was referred to as the Institutional Class.
Sales charges include initial sales charges and contingent deferred sales charges (CDSCs), as applicable. A Class shares have a 5.75% maximum initial sales charge and may be subject to a maximum CDSC of 1.00%. C Class shares redeemed within 12 months of purchase are subject to a maximum CDSC of 1.00%. The SEC requires that mutual funds provide performance information net of maximum sales charges in all cases where charges could be applied.
Data presented reflect past performance. Past performance is no guarantee of future results. Current performance may be higher or lower than the performance shown. Total returns for periods less than one year are not annualized. Investment return and principal value will fluctuate, and redemption value may be more or less than original cost. Data assumes reinvestment of dividends and capital gains, and none of the charts reflect the deduction of taxes that a shareholder would pay on fund distributions or the redemption of fund shares. To obtain performance data current to the most recent month end, please call 1-800-345-2021 or visit americancentury.com. For additional information about the fund, please consult the prospectus.
|
|
Growth of $10,000 Over 10 Years |
$10,000 investment made October 31, 2007 |
Performance for other share classes will vary due to differences in fee structure. |
|
| |
Value on October 31, 2017 |
| Investor Class — $21,638 |
|
| Russell 1000 Growth Index — $23,964 |
|
Ending value of Investor Class would have been lower if a portion of the fees had not been waived.
|
| | | | | | | |
Total Annual Fund Operating Expenses |
Investor Class | I Class | Y Class | A Class | C Class | R Class | R5 Class | R6 Class |
0.99% | 0.79% | 0.64% | 1.24% | 1.99% | 1.49% | 0.79% | 0.64% |
The total annual fund operating expenses shown is as stated in the fund’s prospectus current as of the date of this report. The prospectus may vary from the expense ratio shown elsewhere in this report because it is based on a different time period, includes acquired fund fees and expenses, and, if applicable, does not include fee waivers or expense reimbursements.
Data presented reflect past performance. Past performance is no guarantee of future results. Current performance may be higher or lower than the performance shown. Total returns for periods less than one year are not annualized. Investment return and principal value will fluctuate, and redemption value may be more or less than original cost. Data assumes reinvestment of dividends and capital gains, and none of the charts reflect the deduction of taxes that a shareholder would pay on fund distributions or the redemption of fund shares. To obtain performance data current to the most recent month end, please call 1-800-345-2021 or visit americancentury.com. For additional information about the fund, please consult the prospectus.
Portfolio Managers: Keith Lee, Michael Li, and Chris Krantz
Performance Summary
Select returned 27.93%* for the 12 months ended October 31, 2017, lagging the 29.71% return of the portfolio’s benchmark, the Russell 1000 Growth Index.
U.S. stock indices posted strong returns during the reporting period. Growth stocks outperformed value stocks by a wide margin across the capitalization spectrum. Within the Russell 1000 Growth Index, all sectors but energy posted strong gains. The small utilities segment—a sector that rarely offers the kind of growth characteristics we seek—reported the top total return, but index gains were largely driven by the strong performance of information technology stocks.
Stock selection in the consumer discretionary sector detracted from performance relative to the Russell 1000 Growth Index. Overweight positioning among specialty retailers also hampered performance. Stock choices in information technology and health care were also negative. Stock selection in the consumer staples sector was beneficial, as it was in financials and real estate.
Consumer Discretionary Stocks Led Detractors
Aftermarket parts retailer AutoZone was a significant detractor in the consumer discretionary sector. The company reported a series of quarterly sales and earnings growth misses. The automotive segment is facing increased competition from Amazon in a space that previously seemed relatively immune from online threats. We sold the holding. Off-price retailer TJX underperformed after reporting results that were in line with expectations but below historical growth levels.
In information technology, QUALCOMM was a significant detractor. It is facing a lawsuit by Apple—a large customer—concerning royalties, creating uncertainty among investors. We reduced our holding in the semiconductor and telecommunications equipment company. Not owning benchmark holding NVIDIA hindered results. The visual computing chip company’s gaming and data center businesses have continued to perform well, with the data center segment accelerating.
Elsewhere, biotechnology firm Celgene fell sharply late in the period after announcing that it was discontinuing late-stage clinical trials of its drug to treat Crohn’s disease, putting pressure on its product pipeline. Gilead Sciences detracted following guidance that was well below expectations due to the weak forecast for its hepatitis C drug.
Consumer Staples Aided Performance
In the consumer staples sector, avoiding a number of underperforming beverage and tobacco companies was helpful. In particular, not owning tobacco company Altria benefited performance. The stock lagged on concerns that the Food and Drug Administration would impose nicotine restrictions on cigarettes that would make them nonaddictive. We don’t own the stock because it has been losing share to competing firms.
*All fund returns referenced in this commentary are for Investor Class shares. Fund returns would have been lower if a portion of the fees had not been waived. Performance for other share classes will vary due to differences in fee structure; when Investor Class performance exceeds that of the fund’s benchmark, other share classes may not. See page 3 for returns for all share classes.
In the information technology sector, Apple outperformed as the company reported results ahead of expectations. Investors also appeared excited about the new iPhone that was introduced in
September 2017. In addition, Warren Buffett took a large stake in the company, which we believe reflects the quality of the business and the brand, and the sustainable nature of the business. Electronic Arts, a maker of video games, was a top contributor, as the company had favorable quarterly results. The company issued conservative guidance for the upcoming fiscal year, and it expects some gains as games are updated and as it emphasizes esports, a strong trend for the industry.
Among other top contributors, options exchange Cboe Global Markets reported strong quarterly results for revenue and earnings. The company said that it was pleased with its integration of Bats Global Markets, which was completed in February. Airplane manufacturer Boeing reported strong earnings, cash flow, and forward guidance for profitability of the company’s 787 airliner. Investors increasingly appear to believe in the stock more as a secular than a cyclical growth story and have become more comfortable with the business for the long term. Managed health care firm UnitedHealth Group rose on investor optimism that President Trump’s administration would bring less regulation and higher growth to the economy, which should help some health care companies. Additionally, UnitedHealth raised earnings guidance above analyst expectations.
Outlook
We remain confident in our belief that high-quality companies with a capability for sustained long-term growth will outperform in the long term. Our portfolio positioning reflects where we are seeing opportunities as a result of the application of that philosophy and process.
As of October 31, 2017, this process pointed the portfolio toward overweight positions relative to the Russell 1000 Growth Index in the financials, health care, and consumer staples sectors. The materials and information technology sectors represented the largest underweights.
The health care overweight reflects our view that drug pipelines are robust, with ample clinical trial readouts. There is now greater clarity about possible changes to the Affordable Care Act and increased regulation of prescription drug pricing, easing investor concerns. Commodity price deflation is a common theme among materials companies. Valuations are in line with historic levels, and we believe margins are at or above normal levels; however, a lack of clarity on the outlook for prices makes us reluctant to overweight the sector.
|
| |
OCTOBER 31, 2017 | |
Top Ten Holdings | % of net assets |
Apple, Inc. | 9.5% |
Alphabet, Inc.* | 8.4% |
MasterCard, Inc., Class A | 4.8% |
Facebook, Inc., Class A | 4.3% |
UnitedHealth Group, Inc. | 4.2% |
Amazon.com, Inc. | 4.1% |
Microsoft Corp. | 3.1% |
Home Depot, Inc. (The) | 2.5% |
Electronic Arts, Inc. | 2.5% |
Biogen, Inc. | 2.3% |
*Includes all classes of the issuer held by the fund. | |
| |
Top Five Industries | % of net assets |
Internet Software and Services | 13.7% |
Technology Hardware, Storage and Peripherals | 9.5% |
Biotechnology | 7.8% |
IT Services | 6.4% |
Software | 5.6% |
| |
Types of Investments in Portfolio | % of net assets |
Domestic Common Stocks | 94.6% |
Foreign Common Stocks* | 5.1% |
Total Common Stocks | 99.7% |
Temporary Cash Investments | 0.3% |
Other Assets and Liabilities | —** |
*Includes depositary shares, dual listed securities and foreign ordinary shares.
**Category is less than 0.05% of total net assets.
Fund shareholders may incur two types of costs: (1) transaction costs, including sales charges (loads) on purchase payments and redemption/exchange fees; and (2) ongoing costs, including management fees; distribution and service (12b-1) fees; and other fund expenses. This example is intended to help you understand your ongoing costs (in dollars) of investing in your fund and to compare these costs with the ongoing cost of investing in other mutual funds.
The example is based on an investment of $1,000 made at the beginning of the period and held for the entire period from May 1, 2017 to October 31, 2017.
Actual Expenses
The table provides information about actual account values and actual expenses for each class. You may use the information, together with the amount you invested, to estimate the expenses that you paid over the period. First, identify the share class you own. Then simply divide your account value by $1,000 (for example, an $8,600 account value divided by $1,000 = 8.6), then multiply the result by the number under the heading “Expenses Paid During Period” to estimate the expenses you paid on your account during this period.
If you hold Investor Class shares of any American Century Investments fund, or I Class shares of the American Century Diversified Bond Fund, in an American Century Investments account (i.e., not a financial intermediary or retirement plan account), American Century Investments may charge you a $12.50 semiannual account maintenance fee if the value of those shares is less than $10,000. We will redeem shares automatically in one of your accounts to pay the $12.50 fee. In determining your total eligible investment amount, we will include your investments in all personal accounts (including American Century Investments Brokerage accounts) registered under your Social Security number. Personal accounts include individual accounts, joint accounts, UGMA/UTMA accounts, personal trusts, Coverdell Education Savings Accounts and IRAs (including traditional, Roth, Rollover, SEP-, SARSEP- and SIMPLE-IRAs), and certain other retirement accounts. If you have only business, business retirement, employer-sponsored or American Century Investments Brokerage accounts, you are currently not subject to this fee. If you are subject to the Account Maintenance Fee, your account value could be reduced by the fee amount.
Hypothetical Example for Comparison Purposes
The table also provides information about hypothetical account values and hypothetical expenses based on the actual expense ratio of each class of your fund and an assumed rate of return of 5% per year before expenses, which is not the actual return of a fund’s share class. The hypothetical account values and expenses may not be used to estimate the actual ending account balance or expenses you paid for the period. You may use this information to compare the ongoing costs of investing in your fund and other funds. To do so, compare this 5% hypothetical example with the 5% hypothetical examples that appear in the shareholder reports of the other funds.
Please note that the expenses shown in the table are meant to highlight your ongoing costs only and do not reflect any transactional costs, such as sales charges (loads) or redemption/exchange fees. Therefore, the table is useful in comparing ongoing costs only, and will not help you determine the relative total costs of owning different funds. In addition, if these transactional costs were included, your costs would have been higher.
|
| | | | |
| Beginning
Account Value
5/1/17 | Ending
Account Value
10/31/17 | Expenses Paid
During Period(1)
5/1/17 - 10/31/17 | Annualized
Expense Ratio(1) |
Actual | | | | |
Investor Class | $1,000 | $1,112.30 | $5.27 | 0.99% |
I Class | $1,000 | $1,113.50 | $4.21 | 0.79% |
Y Class | $1,000 | $1,114.30 | $3.41 | 0.64% |
A Class | $1,000 | $1,110.80 | $6.60 | 1.24% |
C Class | $1,000 | $1,106.70 | $10.57 | 1.99% |
R Class | $1,000 | $1,109.40 | $7.92 | 1.49% |
R5 Class | $1,000 | $1,113.30 | $4.21 | 0.79% |
R6 Class | $1,000 | $1,114.30 | $3.41 | 0.64% |
Hypothetical | | | | |
Investor Class | $1,000 | $1,020.22 | $5.04 | 0.99% |
I Class | $1,000 | $1,021.22 | $4.02 | 0.79% |
Y Class | $1,000 | $1,021.98 | $3.26 | 0.64% |
A Class | $1,000 | $1,018.96 | $6.31 | 1.24% |
C Class | $1,000 | $1,015.17 | $10.11 | 1.99% |
R Class | $1,000 | $1,017.69 | $7.58 | 1.49% |
R5 Class | $1,000 | $1,021.22 | $4.02 | 0.79% |
R6 Class | $1,000 | $1,021.98 | $3.26 | 0.64% |
| |
(1) | Expenses are equal to the class's annualized expense ratio listed in the table above, multiplied by the average account value over the period, multiplied by 184, the number of days in the most recent fiscal half-year, divided by 365, to reflect the one-half year period. Annualized expense ratio reflects actual expenses, including any applicable fee waivers or expense reimbursements and excluding any acquired fund fees and expenses. |
OCTOBER 31, 2017
|
| | | | | |
| Shares | Value |
COMMON STOCKS — 99.7% | | |
Aerospace and Defense — 2.9% | | |
Boeing Co. (The) | 198,400 |
| $ | 51,183,232 |
|
United Technologies Corp. | 276,000 |
| 33,053,760 |
|
| | 84,236,992 |
|
Auto Components — 2.0% | | |
Delphi Automotive plc | 379,300 |
| 37,694,834 |
|
Gentex Corp. | 1,018,500 |
| 19,769,085 |
|
| | 57,463,919 |
|
Banks — 1.9% | | |
JPMorgan Chase & Co. | 534,400 |
| 53,765,984 |
|
Beverages — 3.2% | | |
Constellation Brands, Inc., Class A | 290,200 |
| 63,579,918 |
|
Diageo plc | 832,000 |
| 28,421,135 |
|
| | 92,001,053 |
|
Biotechnology — 7.8% | | |
Biogen, Inc.(1) | 214,500 |
| 66,851,070 |
|
Celgene Corp.(1) | 549,000 |
| 55,432,530 |
|
Gilead Sciences, Inc. | 350,900 |
| 26,303,464 |
|
Regeneron Pharmaceuticals, Inc.(1) | 127,500 |
| 51,334,050 |
|
Vertex Pharmaceuticals, Inc.(1) | 158,000 |
| 23,104,340 |
|
| | 223,025,454 |
|
Capital Markets — 1.8% | | |
Cboe Global Markets, Inc. | 467,000 |
| 52,799,020 |
|
Chemicals — 2.1% | | |
Monsanto Co. | 289,500 |
| 35,058,450 |
|
Valvoline, Inc. | 1,019,200 |
| 24,481,184 |
|
| | 59,539,634 |
|
Electronic Equipment, Instruments and Components — 0.4% | | |
Keyence Corp. | 20,700 |
| 11,438,204 |
|
Equity Real Estate Investment Trusts (REITs) — 3.0% | | |
American Tower Corp. | 388,400 |
| 55,801,428 |
|
Equinix, Inc. | 67,700 |
| 31,378,950 |
|
| | 87,180,378 |
|
Food and Staples Retailing — 1.8% | | |
Costco Wholesale Corp. | 320,500 |
| 51,626,140 |
|
Health Care Providers and Services — 5.2% | | |
Cigna Corp. | 145,400 |
| 28,675,788 |
|
UnitedHealth Group, Inc. | 570,700 |
| 119,972,554 |
|
| | 148,648,342 |
|
Hotels, Restaurants and Leisure — 3.5% | | |
Papa John's International, Inc. | 349,800 |
| 23,803,890 |
|
Starbucks Corp. | 830,200 |
| 45,528,168 |
|
Wynn Resorts Ltd. | 204,800 |
| 30,205,952 |
|
| | 99,538,010 |
|
Industrial Conglomerates — 1.2% | | |
Roper Technologies, Inc. | 134,600 |
| 34,749,682 |
|
|
| | | | | |
| Shares | Value |
Insurance — 1.3% | | |
MetLife, Inc. | 689,700 |
| $ | 36,954,126 |
|
Internet and Direct Marketing Retail — 4.1% | | |
Amazon.com, Inc.(1) | 106,300 |
| 117,491,264 |
|
Internet Software and Services — 13.7% | | |
Alphabet, Inc., Class A(1) | 97,300 |
| 100,514,792 |
|
Alphabet, Inc., Class C(1) | 138,600 |
| 140,906,304 |
|
Baidu, Inc. ADR(1) | 106,000 |
| 25,857,640 |
|
Facebook, Inc., Class A(1) | 692,000 |
| 124,601,520 |
|
| | 391,880,256 |
|
IT Services — 6.4% | | |
MasterCard, Inc., Class A | 915,000 |
| 136,124,550 |
|
PayPal Holdings, Inc.(1) | 661,400 |
| 47,991,184 |
|
| | 184,115,734 |
|
Machinery — 4.2% | | |
FANUC Corp. | 204,600 |
| 47,449,998 |
|
Graco, Inc. | 225,900 |
| 29,771,361 |
|
Middleby Corp. (The)(1) | 375,000 |
| 43,462,500 |
|
| | 120,683,859 |
|
Media — 2.5% | | |
Time Warner, Inc. | 218,200 |
| 21,446,878 |
|
Walt Disney Co. (The) | 525,700 |
| 51,418,717 |
|
| | 72,865,595 |
|
Oil, Gas and Consumable Fuels — 1.1% | | |
EOG Resources, Inc. | 329,300 |
| 32,887,191 |
|
Personal Products — 1.5% | | |
Estee Lauder Cos., Inc. (The), Class A | 373,100 |
| 41,716,311 |
|
Pharmaceuticals — 1.4% | | |
Bristol-Myers Squibb Co. | 638,100 |
| 39,345,246 |
|
Professional Services — 2.0% | | |
IHS Markit Ltd.(1) | 410,900 |
| 17,508,449 |
|
Verisk Analytics, Inc.(1) | 451,300 |
| 38,383,065 |
|
| | 55,891,514 |
|
Road and Rail — 1.1% | | |
Canadian Pacific Railway Ltd. | 182,600 |
| 31,659,537 |
|
Semiconductors and Semiconductor Equipment — 2.3% | | |
Analog Devices, Inc. | 270,400 |
| 24,687,520 |
|
Maxim Integrated Products, Inc. | 536,100 |
| 28,166,694 |
|
QUALCOMM, Inc. | 271,600 |
| 13,854,316 |
|
| | 66,708,530 |
|
Software — 5.6% | | |
Electronic Arts, Inc.(1) | 597,900 |
| 71,508,840 |
|
Microsoft Corp. | 1,080,400 |
| 89,867,672 |
|
| | 161,376,512 |
|
Specialty Retail — 5.1% | | |
Home Depot, Inc. (The) | 435,400 |
| 72,180,612 |
|
L Brands, Inc. | 432,600 |
| 18,619,104 |
|
TJX Cos., Inc. (The) | 789,400 |
| 55,100,120 |
|
| | 145,899,836 |
|
Technology Hardware, Storage and Peripherals — 9.5% | | |
Apple, Inc. | 1,613,900 |
| 272,813,656 |
|
|
| | | | | |
| Shares | Value |
Tobacco — 1.1% | | |
Philip Morris International, Inc. | 291,500 |
| $ | 30,502,560 |
|
TOTAL COMMON STOCKS
(Cost $1,315,954,030) | | 2,858,804,539 |
|
TEMPORARY CASH INVESTMENTS — 0.3% | | |
Repurchase Agreement, BMO Capital Markets Corp., (collateralized by various U.S. Treasury obligations, 0.375% - 1.375%, 1/15/27 - 2/15/45, valued at $4,155,936), in a joint trading account at 0.88%, dated 10/31/17, due 11/1/17 (Delivery value $4,065,213) | | 4,065,114 |
|
Repurchase Agreement, Fixed Income Clearing Corp., (collateralized by various U.S. Treasury obligations, 2.50%, 5/15/46, valued at $3,456,836), at 0.34%, dated 10/31/17, due 11/1/17 (Delivery value $3,389,032) | | 3,389,000 |
|
State Street Institutional U.S. Government Money Market Fund, Premier Class | 3,896 |
| 3,896 |
|
TOTAL TEMPORARY CASH INVESTMENTS
(Cost $7,458,010) | | 7,458,010 |
|
TOTAL INVESTMENT SECURITIES — 100.0%
(Cost $1,323,412,040) | | 2,866,262,549 |
|
OTHER ASSETS AND LIABILITIES† | | (576,535 | ) |
TOTAL NET ASSETS — 100.0% | | $ | 2,865,686,014 |
|
|
| | | | | | | | | | |
FORWARD FOREIGN CURRENCY EXCHANGE CONTRACTS |
Currency Purchased | Currency Sold | Counterparty | Settlement Date | Unrealized Appreciation
(Depreciation) |
USD | 21,304,195 |
| CAD | 26,344,980 |
| Morgan Stanley | 12/29/17 | $ | 870,899 |
|
USD | 1,460,905 |
| CAD | 1,821,435 |
| Morgan Stanley | 12/29/17 | 48,191 |
|
USD | 4,284,297 |
| JPY | 477,397,500 |
| Credit Suisse AG | 12/29/17 | 73,573 |
|
USD | 748,926 |
| JPY | 84,694,500 |
| Credit Suisse AG | 12/29/17 | 1,906 |
|
USD | 752,595 |
| JPY | 85,197,000 |
| Credit Suisse AG | 12/29/17 | 1,144 |
|
| | | | | | $ | 995,713 |
|
|
| | |
NOTES TO SCHEDULE OF INVESTMENTS |
ADR | - | American Depositary Receipt |
CAD | - | Canadian Dollar |
JPY | - | Japanese Yen |
USD | - | United States Dollar |
| |
† | Category is less than 0.05% of total net assets. |
See Notes to Financial Statements.
|
|
Statement of Assets and Liabilities |
|
| | | |
OCTOBER 31, 2017 | |
Assets | |
Investment securities, at value (cost of $1,323,412,040) | $ | 2,866,262,549 |
|
Foreign currency holdings, at value (cost of $68,064) | 67,674 |
|
Receivable for investments sold | 2,569,794 |
|
Receivable for capital shares sold | 292,469 |
|
Unrealized appreciation on forward foreign currency exchange contracts | 995,713 |
|
Dividends and interest receivable | 1,168,846 |
|
| 2,871,357,045 |
|
| |
Liabilities | |
Payable for investments purchased | 2,605,292 |
|
Payable for capital shares redeemed | 702,970 |
|
Accrued management fees | 2,316,786 |
|
Distribution and service fees payable | 14,702 |
|
Accrued other expenses | 31,281 |
|
| 5,671,031 |
|
| |
Net Assets | $ | 2,865,686,014 |
|
| |
Net Assets Consist of: | |
Capital (par value and paid-in surplus) | $ | 1,148,274,022 |
|
Undistributed net investment income | 7,122,238 |
|
Undistributed net realized gain | 166,443,658 |
|
Net unrealized appreciation | 1,543,846,096 |
|
| $ | 2,865,686,014 |
|
|
| | | | | | |
| Net Assets | Shares Outstanding | Net Asset Value Per Share |
Investor Class, $0.01 Par Value |
| $2,753,729,459 |
| 38,286,183 |
| $71.92 |
I Class, $0.01 Par Value |
| $60,894,561 |
| 832,964 |
| $73.11 |
Y Class, $0.01 Par Value |
| $5,704 |
| 78 |
| $73.13 |
A Class, $0.01 Par Value |
| $40,345,200 |
| 572,693 |
| $70.45* |
C Class, $0.01 Par Value |
| $5,668,265 |
| 88,408 |
| $64.11 |
R Class, $0.01 Par Value |
| $3,518,044 |
| 50,222 |
| $70.05 |
R5 Class, $0.01 Par Value |
| $5,702 |
| 78 |
| $73.10 |
R6 Class, $0.01 Par Value |
| $1,519,079 |
| 20,772 |
| $73.13 |
*Maximum offering price $74.75 (net asset value divided by 0.9425).
See Notes to Financial Statements.
|
| | | |
YEAR ENDED OCTOBER 31, 2017 | |
Investment Income (Loss) | |
Income: | |
Dividends (net of foreign taxes withheld of $147,827) | $ | 34,340,201 |
|
Interest | 56,816 |
|
| 34,397,017 |
|
| |
Expenses: | |
Management fees | 25,625,529 |
|
Distribution and service fees: | |
A Class | 95,990 |
|
C Class | 49,373 |
|
R Class | 15,466 |
|
Directors' fees and expenses | 80,058 |
|
Other expenses | 84,019 |
|
| 25,950,435 |
|
Fees waived(1) | (139,827 | ) |
| 25,810,608 |
|
| |
Net investment income (loss) | 8,586,409 |
|
| |
Realized and Unrealized Gain (Loss) | |
Net realized gain (loss) on: | |
Investment transactions | 169,145,968 |
|
Forward foreign currency exchange contract transactions | (1,306,355 | ) |
Foreign currency translation transactions | (111,668 | ) |
| 167,727,945 |
|
| |
Change in net unrealized appreciation (depreciation) on: | |
Investments | 461,628,811 |
|
Forward foreign currency exchange contracts | 769,217 |
|
Translation of assets and liabilities in foreign currencies | 69,449 |
|
| 462,467,477 |
|
| |
Net realized and unrealized gain (loss) | 630,195,422 |
|
| |
Net Increase (Decrease) in Net Assets Resulting from Operations | $ | 638,781,831 |
|
| |
(1) | Amount consists of $134,641, $2,710, $1,970, $282, $168 and $56 for the Investor Class, I Class, A Class, C Class, R Class and R6 Class, respectively. The waiver amounts for the Y Class and R5 Class were less than $0.50. |
See Notes to Financial Statements.
|
|
Statement of Changes in Net Assets |
|
| | | | | | |
YEARS ENDED OCTOBER 31, 2017 AND OCTOBER 31, 2016 |
Increase (Decrease) in Net Assets | October 31, 2017 | October 31, 2016 |
Operations | | |
Net investment income (loss) | $ | 8,586,409 |
| $ | 8,536,611 |
|
Net realized gain (loss) | 167,727,945 |
| 79,512,477 |
|
Change in net unrealized appreciation (depreciation) | 462,467,477 |
| (69,641,770 | ) |
Net increase (decrease) in net assets resulting from operations | 638,781,831 |
| 18,407,318 |
|
| | |
Distributions to Shareholders | | |
From net investment income: | | |
Investor Class | (8,554,850 | ) | (9,847,674 | ) |
I Class | (156,843 | ) | (192,491 | ) |
A Class | (43,226 | ) | (67,613 | ) |
R6 Class | (57,884 | ) | (75,146 | ) |
From net realized gains: | | |
Investor Class | (76,803,447 | ) | (138,659,649 | ) |
I Class | (907,444 | ) | (1,826,497 | ) |
A Class | (1,250,457 | ) | (2,410,121 | ) |
C Class | (169,263 | ) | (359,667 | ) |
R Class | (97,514 | ) | (189,769 | ) |
R6 Class | (264,392 | ) | (572,948 | ) |
Decrease in net assets from distributions | (88,305,320 | ) | (154,201,575 | ) |
| | |
Capital Share Transactions | | |
Net increase (decrease) in net assets from capital share transactions (Note 5) | (52,715,513 | ) | (30,480,042 | ) |
| | |
Net increase (decrease) in net assets | 497,760,998 |
| (166,274,299 | ) |
| | |
Net Assets | | |
Beginning of period | 2,367,925,016 |
| 2,534,199,315 |
|
End of period | $ | 2,865,686,014 |
| $ | 2,367,925,016 |
|
| | |
Undistributed net investment income | $ | 7,122,238 |
| $ | 8,583,758 |
|
See Notes to Financial Statements.
|
|
Notes to Financial Statements |
OCTOBER 31, 2017
1. Organization
American Century Mutual Funds, Inc. (the corporation) is registered under the Investment Company Act of 1940, as amended (the 1940 Act), as an open-end management investment company and is organized as a Maryland corporation. Select Fund (the fund) is one fund in a series issued by the corporation. The fund’s investment objective is to seek long-term capital growth.
The fund offers the Investor Class, I Class (formerly Institutional Class), Y Class, A Class, C Class, R Class, R5 Class and R6 Class. The A Class may incur an initial sales charge. The A Class and C Class may be subject to a contingent deferred sales charge. Sale of the Y Class and R5 Class commenced on April 10, 2017.
2. Significant Accounting Policies
The following is a summary of significant accounting policies consistently followed by the fund in preparation of its financial statements. The fund is an investment company and follows accounting and reporting guidance in accordance with accounting principles generally accepted in the United States of America. This may require management to make certain estimates and assumptions at the date of the financial statements. Actual results could differ from these estimates. Management evaluated the impact of events or transactions occurring through the date the financial statements were issued that would merit recognition or disclosure.
Investment Valuations — The fund determines the fair value of its investments and computes its net asset value per share at the close of regular trading (usually 4 p.m. Eastern time) on the New York Stock Exchange (NYSE) on each day the NYSE is open. The Board of Directors has adopted valuation policies and procedures to guide the investment advisor in the fund’s investment valuation process and to provide methodologies for the oversight of the fund’s pricing function.
Equity securities that are listed or traded on a domestic securities exchange are valued at the last reported sales price or at the official closing price as provided by the exchange. Equity securities traded on foreign securities exchanges are generally valued at the closing price of such securities on the exchange where primarily traded or at the close of the NYSE, if that is earlier. If no last sales price is reported, or if local convention or regulation so provides, the mean of the latest bid and asked prices may be used. Securities traded over-the-counter are valued at the mean of the latest bid and asked prices, the last sales price, or the official closing price. Equity securities initially expressed in local currencies are translated into U.S. dollars at the mean of the appropriate currency exchange rate at the close of the NYSE as provided by an independent pricing service.
Open-end management investment companies are valued at the reported net asset value per share. Repurchase agreements are valued at cost, which approximates fair value. Forward foreign currency exchange contracts are valued at the mean of the appropriate forward exchange rate at the close of the NYSE as provided by an independent pricing service.
If the fund determines that the market price for an investment is not readily available or the valuation methods mentioned above do not reflect an investment’s fair value, such investment is valued as determined in good faith by the Board of Directors or its delegate, in accordance with policies and procedures adopted by the Board of Directors. In its determination of fair value, the fund may review several factors including, but not limited to, market information regarding the specific investment or comparable investments and correlation with other investment types, futures indices or general market indicators. Circumstances that may cause the fund to use these procedures to value an investment include, but are not limited to: an investment has been declared in default or is distressed; trading in a security has been suspended during the trading day or a security is not actively trading on its principal exchange; prices received from a regular pricing source are deemed unreliable; or there is a foreign market holiday and no trading occurred.
The fund monitors for significant events occurring after the close of an investment’s primary exchange but before the fund’s net asset value per share is determined. Significant events may include, but are not limited to: corporate announcements and transactions; governmental action and political unrest that could impact a specific investment or an investment sector; or armed conflicts, natural disasters and similar events that could
affect investments in a specific country or region. The fund also monitors for significant fluctuations between domestic and foreign markets, as evidenced by the U.S. market or such other indicators that the Board of Directors, or its delegate, deems appropriate. If significant fluctuations in foreign markets are identified, the fund may apply a model-derived factor to the closing price of equity securities traded on foreign securities exchanges. The factor is based on observable market data as provided by an independent pricing service.
Security Transactions — Security transactions are accounted for as of the trade date. Net realized gains and losses are determined on the identified cost basis, which is also used for federal income tax purposes.
Investment Income — Dividend income less foreign taxes withheld, if any, is recorded as of the ex-dividend date. Distributions received on securities that represent a return of capital or long-term capital gain are recorded as a reduction of cost of investments and/or as a realized gain. The fund may estimate the components of distributions received that may be considered nontaxable distributions or long-term capital gain distributions for income tax purposes. Interest income is recorded on the accrual basis and includes accretion of discounts and amortization of premiums.
Foreign Currency Translations — All assets and liabilities initially expressed in foreign currencies are translated into U.S. dollars at prevailing exchange rates at period end. The fund may enter into spot foreign currency exchange contracts to facilitate transactions denominated in a foreign currency. Purchases and sales of investment securities, dividend and interest income, spot foreign currency exchange contracts, and expenses are translated at the rates of exchange prevailing on the respective dates of such transactions. Net realized and unrealized foreign currency exchange gains or losses related to investment securities are a component of net realized gain (loss) on investment transactions and change in net unrealized appreciation (depreciation) on investments, respectively.
Repurchase Agreements — The fund may enter into repurchase agreements with institutions that American Century Investment Management, Inc. (ACIM) (the investment advisor) has determined are creditworthy pursuant to criteria adopted by the Board of Directors. The fund requires that the collateral, represented by securities, received in a repurchase transaction be transferred to the custodian in a manner sufficient to enable the fund to obtain those securities in the event of a default under the repurchase agreement. ACIM monitors, on a daily basis, the securities transferred to ensure the value, including accrued interest, of the securities under each repurchase agreement is equal to or greater than amounts owed to the fund under each repurchase agreement.
Joint Trading Account — Pursuant to an Exemptive Order issued by the Securities and Exchange Commission, the fund, along with certain other funds in the American Century Investments family of funds, may transfer uninvested cash balances into a joint trading account. These balances are invested in one or more repurchase agreements that are collateralized by U.S. Treasury or Agency obligations.
Income Tax Status — It is the fund’s policy to distribute substantially all net investment income and net realized gains to shareholders and to otherwise qualify as a regulated investment company under provisions of the Internal Revenue Code. Accordingly, no provision has been made for income taxes. The fund files U.S. federal, state, local and non-U.S. tax returns as applicable. The fund's tax returns are subject to examination by the relevant taxing authority until expiration of the applicable statute of limitations, which is generally three years from the date of filing but can be longer in certain jurisdictions. At this time, management believes there are no uncertain tax positions which, based on their technical merit, would not be sustained upon examination and for which it is reasonably possible that the total amounts of unrecognized tax benefits will significantly change in the next twelve months.
Multiple Class — All shares of the fund represent an equal pro rata interest in the net assets of the class to which such shares belong, and have identical voting, dividend, liquidation and other rights and the same terms and conditions, except for class specific expenses and exclusive rights to vote on matters affecting only individual classes. Income, non-class specific expenses, and realized and unrealized capital gains and losses of the fund are allocated to each class of shares based on their relative net assets.
Distributions to Shareholders — Distributions from net investment income and net realized gains, if any, are generally declared and paid annually.
Indemnifications — Under the corporation’s organizational documents, its officers and directors are indemnified against certain liabilities arising out of the performance of their duties to the fund. In addition, in the normal course of business, the fund enters into contracts that provide general indemnifications. The maximum exposure under these arrangements is unknown as this would involve future claims that may be made against a fund. The risk of material loss from such claims is considered by management to be remote.
3. Fees and Transactions with Related Parties
Certain officers and directors of the corporation are also officers and/or directors of American Century Companies, Inc. (ACC). The corporation’s investment advisor, ACIM, the corporation's distributor, American Century Investment Services, Inc. (ACIS), and the corporation’s transfer agent, American Century Services, LLC, are wholly owned, directly or indirectly, by ACC.
Management Fees — The corporation has entered into a management agreement with ACIM, under which ACIM provides the fund with investment advisory and management services in exchange for a single, unified management fee (the fee) per class. The agreement provides that all expenses of managing and operating the fund, except distribution and service fees, brokerage expenses, taxes, interest, fees and expenses of the independent directors (including legal counsel fees), and extraordinary expenses, will be paid by ACIM. The fee is computed and accrued daily based on each class's daily net assets and paid monthly in arrears. The difference in the fee among the classes is a result of their separate arrangements for non-Rule 12b-1 shareholder services. It is not the result of any difference in advisory or custodial fees or other expenses related to the management of the fund’s assets, which do not vary by class. The rate of the fee is determined by applying a fee rate calculation formula. This formula takes into account the fund’s assets as well as certain assets, if any, of other clients of the investment advisor outside the American Century Investments family of funds (such as subadvised funds and separate accounts) that use very similar investment teams and strategies (strategy assets). Effective August 1, 2017, the investment advisor agreed to waive 0.02% of the fund's management fee. The investment advisor expects this waiver to continue until July 31, 2018 and cannot terminate it prior to such date without the approval of the Board of Directors.
The management fee schedule range and the effective annual management fee before and after waiver for each class for the period ended October 31, 2017 are as follows:
|
| | | |
| Management Fee | Effective Annual Management Fee |
| Schedule Range | Before Waiver | After Waiver |
Investor Class | 0.800% to 0.990% | 0.99% | 0.98% |
I Class | 0.600% to 0.790% | 0.79% | 0.78% |
Y Class | 0.450% to 0.640% | 0.64% | 0.63% |
A Class | 0.800% to 0.990% | 0.99% | 0.98% |
C Class | 0.800% to 0.990% | 0.99% | 0.98% |
R Class | 0.800% to 0.990% | 0.99% | 0.98% |
R5 Class | 0.600% to 0.790% | 0.79% | 0.78% |
R6 Class | 0.450% to 0.640% | 0.64% | 0.63% |
Distribution and Service Fees — The Board of Directors has adopted a separate Master Distribution and Individual Shareholder Services Plan for each of the A Class, C Class and R Class (collectively the plans), pursuant to Rule 12b-1 of the 1940 Act. The plans provide that the A Class will pay ACIS an annual distribution and service fee of 0.25%. The plans provide that the C Class will pay ACIS an annual distribution and service fee of 1.00%, of which 0.25% is paid for individual shareholder services and 0.75% is paid for distribution services. The plans provide that the R Class will pay ACIS an annual distribution and service fee of 0.50%. The fees are computed and accrued daily based on each class’s daily net assets and paid monthly in arrears. The fees are used to pay financial intermediaries for distribution and individual shareholder services. Fees incurred under the plans during the period ended October 31, 2017 are detailed in the Statement of Operations.
Directors' Fees and Expenses — The Board of Directors is responsible for overseeing the investment advisor’s management and operations of the fund. The directors receive detailed information about the fund and its investment advisor regularly throughout the year, and meet at least quarterly with management of the investment advisor to review reports about fund operations. The fund’s officers do not receive compensation from the fund.
Interfund Transactions — The fund may enter into security transactions with other American Century Investments funds and other client accounts of the investment advisor, in accordance with the 1940 Act rules and procedures adopted by the Board of Directors. The rules and procedures require, among other things, that these transactions be effected at the independent current market price of the security. During the period,
the interfund purchases and sales were $25,879,131 and $10,120,807, respectively. The effect of interfund transactions on the Statement of Operations was $905,109 in net realized gain (loss) on investment transactions.
4. Investment Transactions
Purchases and sales of investment securities, excluding short-term investments, for the period ended October 31, 2017 were $492,775,792 and $558,866,380, respectively.
5. Capital Share Transactions
Transactions in shares of the fund were as follows:
|
| | | | | | | | | | |
| Year ended October 31, 2017(1) | Year ended
October 31, 2016 |
| Shares | Amount | Shares | Amount |
Investor Class/Shares Authorized | 350,000,000 |
| | 310,000,000 |
| |
Sold | 1,407,426 |
| $ | 90,665,297 |
| 1,385,269 |
| $ | 79,339,972 |
|
Issued in reinvestment of distributions | 1,386,370 |
| 81,463,131 |
| 2,504,165 |
| 142,011,190 |
|
Redeemed | (3,734,837 | ) | (237,384,030 | ) | (4,298,761 | ) | (243,954,392 | ) |
| (941,041 | ) | (65,255,602 | ) | (409,327 | ) | (22,603,230 | ) |
I Class/Shares Authorized | 35,000,000 |
| | 35,000,000 |
| |
Sold | 436,454 |
| 29,772,009 |
| 157,917 |
| 9,320,449 |
|
Issued in reinvestment of distributions | 17,851 |
| 1,064,278 |
| 35,107 |
| 2,018,979 |
|
Redeemed | (94,975 | ) | (6,205,828 | ) | (248,703 | ) | (14,144,529 | ) |
| 359,330 |
| 24,630,459 |
| (55,679 | ) | (2,805,101 | ) |
Y Class/Shares Authorized | 50,000,000 |
| | N/A |
| |
Sold | 78 |
| 5,000 |
| | |
A Class/Shares Authorized | 50,000,000 |
| | 60,000,000 |
| |
Sold | 173,237 |
| 10,898,266 |
| 105,157 |
| 5,844,418 |
|
Issued in reinvestment of distributions | 21,975 |
| 1,267,277 |
| 43,484 |
| 2,422,041 |
|
Redeemed | (264,980 | ) | (16,695,198 | ) | (197,111 | ) | (10,823,964 | ) |
| (69,768 | ) | (4,529,655 | ) | (48,470 | ) | (2,557,505 | ) |
C Class/Shares Authorized | 20,000,000 |
| | 20,000,000 |
| |
Sold | 26,075 |
| 1,515,135 |
| 8,090 |
| 415,641 |
|
Issued in reinvestment of distributions | 2,670 |
| 141,044 |
| 5,496 |
| 283,057 |
|
Redeemed | (27,362 | ) | (1,544,561 | ) | (32,315 | ) | (1,657,750 | ) |
| 1,383 |
| 111,618 |
| (18,729 | ) | (959,052 | ) |
R Class/Shares Authorized | 30,000,000 |
| | 30,000,000 |
| |
Sold | 8,559 |
| 540,751 |
| 8,446 |
| 481,416 |
|
Issued in reinvestment of distributions | 1,697 |
| 97,514 |
| 3,414 |
| 189,769 |
|
Redeemed | (9,476 | ) | (583,108 | ) | (17,144 | ) | (961,949 | ) |
| 780 |
| 55,157 |
| (5,284 | ) | (290,764 | ) |
R5 Class/Shares Authorized | 50,000,000 |
| | N/A |
| |
Sold | 78 |
| 5,000 |
| | |
R6 Class/Shares Authorized | 50,000,000 |
| | 45,000,000 |
| |
Sold | 24,008 |
| 1,582,119 |
| 34,678 |
| 2,085,331 |
|
Issued in reinvestment of distributions | 5,411 |
| 322,276 |
| 11,279 |
| 648,094 |
|
Redeemed | (142,938 | ) | (9,641,885 | ) | (69,099 | ) | (3,997,815 | ) |
| (113,519 | ) | (7,737,490 | ) | (23,142 | ) | (1,264,390 | ) |
Net increase (decrease) | (762,679 | ) | $ | (52,715,513 | ) | (560,631 | ) | $ | (30,480,042 | ) |
| |
(1) | April 10, 2017 (commencement of sale) through October 31, 2017 for the Y Class and R5 Class. |
6. Fair Value Measurements
The fund’s investments valuation process is based on several considerations and may use multiple inputs to determine the fair value of the investments held by the fund. In conformity with accounting principles generally accepted in the United States of America, the inputs used to determine a valuation are classified into three broad levels.
| |
• | Level 1 valuation inputs consist of unadjusted quoted prices in an active market for identical investments. |
| |
• | Level 2 valuation inputs consist of direct or indirect observable market data (including quoted prices for comparable investments, evaluations of subsequent market events, interest rates, prepayment speeds, credit risk, etc.). These inputs also consist of quoted prices for identical investments initially expressed in local currencies that are adjusted through translation into U.S. dollars. |
| |
• | Level 3 valuation inputs consist of unobservable data (including a fund’s own assumptions). |
The level classification is based on the lowest level input that is significant to the fair valuation measurement. The valuation inputs are not necessarily an indication of the risks associated with investing in these securities or other financial instruments. There were no significant transfers between levels during the period.
The following is a summary of the level classifications as of period end. The Schedule of Investments provides additional information on the fund’s portfolio holdings.
|
| | | | | | | | |
| Level 1 | Level 2 | Level 3 |
Assets | | | |
Investment Securities | | | |
Common Stocks | $ | 2,739,835,665 |
| $ | 118,968,874 |
| — |
|
Temporary Cash Investments | 3,896 |
| 7,454,114 |
| — |
|
| $ | 2,739,839,561 |
| $ | 126,422,988 |
| — |
|
Other Financial Instruments | | | |
Forward Foreign Currency Exchange Contracts | — |
| $ | 995,713 |
| — |
|
7. Derivative Instruments
Foreign Currency Risk — The fund is subject to foreign currency exchange rate risk in the normal course of pursuing its investment objectives. The value of foreign investments held by a fund may be significantly affected by changes in foreign currency exchange rates. The dollar value of a foreign security generally decreases when the value of the dollar rises against the foreign currency in which the security is denominated and tends to increase when the value of the dollar declines against such foreign currency. A fund may enter into forward foreign currency exchange contracts to reduce a fund's exposure to foreign currency exchange rate fluctuations. The net U.S. dollar value of foreign currency underlying all contractual commitments held by a fund and the resulting unrealized appreciation or depreciation are determined daily. Realized gain or loss is recorded upon the termination of the contract. Net realized and unrealized gains or losses occurring during the holding period of forward foreign currency exchange contracts are a component of net realized gain (loss) on forward foreign currency exchange contract transactions and change in net unrealized appreciation (depreciation) on forward foreign currency exchange contracts, respectively. A fund bears the risk of an unfavorable change in the foreign currency exchange rate underlying the forward contract. Additionally, losses, up to the fair value, may arise if the counterparties do not perform under the contract terms. The fund's average U.S. dollar exposure to foreign currency risk derivative instruments held during the period was $20,607,066.
The value of foreign currency risk derivative instruments as of October 31, 2017, is disclosed on the Statement of Assets and Liabilities as an asset of $995,713 in unrealized appreciation on forward foreign currency exchange contracts. For the year ended October 31, 2017, the effect of foreign currency risk derivative instruments on the Statement of Operations was $(1,306,355) in net realized gain (loss) on forward foreign currency exchange contract transactions and $769,217 in change in net unrealized appreciation (depreciation) on forward foreign currency exchange contracts.
8. Risk Factors
There are certain risks involved in investing in foreign securities. These risks include those resulting from future adverse political, social and economic developments, fluctuations in currency exchange rates, the possible imposition of exchange controls, and other foreign laws or restrictions.
9. Federal Tax Information
The tax character of distributions paid during the years ended October 31, 2017 and October 31, 2016 were as follows:
|
| | | | | | |
| 2017 | 2016 |
Distributions Paid From | | |
Ordinary income | $ | 8,812,803 |
| $ | 10,053,612 |
|
Long-term capital gains | $ | 79,492,517 |
| $ | 144,147,963 |
|
The book-basis character of distributions made during the year from net investment income or net realized gains may differ from their ultimate characterization for federal income tax purposes. These differences reflect the differing character of certain income items and net realized gains and losses for financial statement and tax purposes, and may result in reclassification among certain capital accounts on the financial statements.
As of period end, the federal tax cost of investments and the components of distributable earnings on a tax-basis were as follows:
|
| | | |
Federal tax cost of investments | $ | 1,323,721,938 |
|
Gross tax appreciation of investments | $ | 1,547,613,310 |
|
Gross tax depreciation of investments | (5,072,699 | ) |
Net tax appreciation (depreciation) of investments | 1,542,540,611 |
|
Net tax appreciation (depreciation) on derivatives and translation of assets and liabilities in foreign currencies | 2,105 |
|
Net tax appreciation (depreciation) | $ | 1,542,542,716 |
|
Undistributed ordinary income | $ | 8,115,720 |
|
Accumulated long-term gains | $ | 166,753,556 |
|
The difference between book-basis and tax-basis unrealized appreciation (depreciation) is attributable primarily to the realization for tax purposes of unrealized gains (losses) on certain foreign currency exchange contracts.
|
| | | | | | | | | | | | | | | | | |
For a Share Outstanding Throughout the Years Ended October 31 (except as noted) | | | | |
Per-Share Data | | | | | | | | | Ratios and Supplemental Data |
| | Income From Investment Operations: | Distributions From: | | | Ratio to Average Net Assets of: | | |
| Net Asset
Value,
Beginning
of Period | Net
Investment
Income
(Loss)(1) | Net
Realized
and
Unrealized
Gain (Loss) | Total From
Investment
Operations | Net
Investment
Income | Net
Realized
Gains | Total
Distributions | Net Asset
Value,
End
of Period | Total
Return(2) | Operating
Expenses | Operating
Expenses
(before
expense
waiver) | Net
Investment
Income
(Loss) | Net
Investment
Income
(Loss)
(before
expense
waiver) | Portfolio
Turnover
Rate | Net
Assets,
End of
Period
(in thousands) |
Investor Class | | | | | | | | | | | | | | |
2017 | $58.32 | 0.21 | 15.59 | 15.80 | (0.22) | (1.98) | (2.20) | $71.92 | 27.93% | 0.99% | 1.00% | 0.33% | 0.32% | 19% |
| $2,753,729 |
|
2016 | $61.57 | 0.20 | 0.30 | 0.50 | (0.25) | (3.50) | (3.75) | $58.32 | 0.98% | 0.99% | 0.99% | 0.36% | 0.36% | 16% |
| $2,287,797 |
|
2015 | $61.31 | 0.21 | 5.71 | 5.92 | (0.24) | (5.42) | (5.66) | $61.57 | 10.93% | 0.99% | 0.99% | 0.35% | 0.35% | 24% |
| $2,440,319 |
|
2014 | $53.07 | 0.19 | 8.51 | 8.70 | (0.24) | (0.22) | (0.46) | $61.31 | 16.50% | 1.00% | 1.00% | 0.34% | 0.34% | 25% |
| $2,293,893 |
|
2013 | $43.52 | 0.35 | 9.51 | 9.86 | (0.31) | — | (0.31) | $53.07 | 22.80% | 1.00% | 1.00% | 0.74% | 0.74% | 31% |
| $2,119,523 |
|
I Class(3) | | | | | | | | | | | | | |
2017 | $59.25 | 0.31 | 15.87 | 16.18 | (0.34) | (1.98) | (2.32) | $73.11 | 28.20% | 0.79% | 0.80% | 0.53% | 0.52% | 19% |
| $60,895 |
|
2016 | $62.49 | 0.32 | 0.31 | 0.63 | (0.37) | (3.50) | (3.87) | $59.25 | 1.19% | 0.79% | 0.79% | 0.56% | 0.56% | 16% |
| $28,061 |
|
2015 | $62.15 | 0.34 | 5.78 | 6.12 | (0.36) | (5.42) | (5.78) | $62.49 | 11.16% | 0.79% | 0.79% | 0.55% | 0.55% | 24% |
| $33,075 |
|
2014 | $53.79 | 0.32 | 8.61 | 8.93 | (0.35) | (0.22) | (0.57) | $62.15 | 16.74% | 0.80% | 0.80% | 0.54% | 0.54% | 25% |
| $29,130 |
|
2013 | $44.04 | 0.36 | 9.72 | 10.08 | (0.33) | — | (0.33) | $53.79 | 23.05% | 0.80% | 0.80% | 0.94% | 0.94% | 31% |
| $39,263 |
|
Y Class | | | | | | | | | | | | | |
2017(4) | $63.80 | 0.22 | 9.11 | 9.33 | — | — | — | $73.13 | 14.62% | 0.64%(5) | 0.65%(5) | 0.59%(5) | 0.58%(5) | 19%(6) |
| $6 |
|
|
| | | | | | | | | | | | | | | | | |
For a Share Outstanding Throughout the Years Ended October 31 (except as noted) | | | | |
Per-Share Data | | | | | | | | | Ratios and Supplemental Data |
| | Income From Investment Operations: | Distributions From: | | | Ratio to Average Net Assets of: | | |
| Net Asset
Value,
Beginning
of Period | Net
Investment
Income
(Loss)(1) | Net
Realized
and
Unrealized
Gain (Loss) | Total From
Investment
Operations | Net
Investment
Income | Net
Realized
Gains | Total
Distributions | Net Asset
Value,
End
of Period | Total
Return(2) | Operating
Expenses | Operating
Expenses
(before
expense
waiver) | Net
Investment
Income
(Loss) | Net
Investment
Income
(Loss)
(before
expense
waiver) | Portfolio
Turnover
Rate | Net
Assets,
End of
Period
(in thousands) |
A Class | | | | | | | | | | | | | | |
2017 | $57.16 | 0.05 | 15.29 | 15.34 | (0.07) | (1.98) | (2.05) | $70.45 | 27.63% | 1.24% | 1.25% | 0.08% | 0.07% | 19% |
| $40,345 |
|
2016 | $60.41 | 0.06 | 0.29 | 0.35 | (0.10) | (3.50) | (3.60) | $57.16 | 0.73% | 1.24% | 1.24% | 0.11% | 0.11% | 16% |
| $36,723 |
|
2015 | $60.25 | 0.06 | 5.61 | 5.67 | (0.09) | (5.42) | (5.51) | $60.41 | 10.67% | 1.24% | 1.24% | 0.10% | 0.10% | 24% |
| $41,737 |
|
2014 | $52.15 | 0.06 | 8.36 | 8.42 | (0.10) | (0.22) | (0.32) | $60.25 | 16.21% | 1.25% | 1.25% | 0.09% | 0.09% | 25% |
| $39,786 |
|
2013 | $42.85 | 0.25 | 9.33 | 9.58 | (0.28) | — | (0.28) | $52.15 | 22.48% | 1.25% | 1.25% | 0.49% | 0.49% | 31% |
| $43,318 |
|
C Class | | | | | | | | |
2017 | $52.51 | (0.39) | 13.97 | 13.58 | — | (1.98) | (1.98) | $64.11 | 26.66% | 1.99% | 2.00% | (0.67)% | (0.68)% | 19% |
| $5,668 |
|
2016 | $56.09 | (0.33) | 0.25 | (0.08) | — | (3.50) | (3.50) | $52.51 | (0.02)% | 1.99% | 1.99% | (0.64)% | (0.64)% | 16% |
| $4,570 |
|
2015 | $56.64 | (0.36) | 5.23 | 4.87 | — | (5.42) | (5.42) | $56.09 | 9.83% | 1.99% | 1.99% | (0.65)% | (0.65)% | 24% |
| $5,932 |
|
2014 | $49.32 | (0.34) | 7.88 | 7.54 | — | (0.22) | (0.22) | $56.64 | 15.34% | 2.00% | 2.00% | (0.66)% | (0.66)% | 25% |
| $5,929 |
|
2013 | $40.75 | (0.14) | 8.90 | 8.76 | (0.19) | — | (0.19) | $49.32 | 21.57% | 2.00% | 2.00% | (0.26)% | (0.26)% | 31% |
| $8,054 |
|
R Class | | | | | | | | |
2017 | $56.92 | (0.11) | 15.22 | 15.11 | — | (1.98) | (1.98) | $70.05 | 27.30% | 1.49% | 1.50% | (0.17)% | (0.18)% | 19% |
| $3,518 |
|
2016 | $60.21 | (0.08) | 0.29 | 0.21 | — | (3.50) | (3.50) | $56.92 | 0.49% | 1.49% | 1.49% | (0.14)% | (0.14)% | 16% |
| $2,814 |
|
2015 | $60.12 | (0.09) | 5.60 | 5.51 | — | (5.42) | (5.42) | $60.21 | 10.38% | 1.49% | 1.49% | (0.15)% | (0.15)% | 24% |
| $3,295 |
|
2014 | $52.07 | (0.08) | 8.35 | 8.27 | — | (0.22) | (0.22) | $60.12 | 15.92% | 1.50% | 1.50% | (0.16)% | (0.16)% | 25% |
| $3,050 |
|
2013 | $42.86 | 0.03 | 9.43 | 9.46 | (0.25) | — | (0.25) | $52.07 | 22.18% | 1.50% | 1.50% | 0.24% | 0.24% | 31% |
| $3,275 |
|
R5 Class | | | | | | | | |
2017(4) | $63.83 | 0.17 | 9.10 | 9.27 | — | — | — | $73.10 | 14.52% | 0.79%(5) | 0.80%(5) | 0.44%(5) | 0.43%(5) | 19%(6) |
| $6 |
|
|
| | | | | | | | | | | | | | | | | |
For a Share Outstanding Throughout the Years Ended October 31 (except as noted) | | | | |
Per-Share Data | | | | | | | | | Ratios and Supplemental Data |
| | Income From Investment Operations: | Distributions From: | | | Ratio to Average Net Assets of: | | |
| Net Asset
Value,
Beginning
of Period | Net
Investment
Income
(Loss)(1) | Net
Realized
and
Unrealized
Gain (Loss) | Total From
Investment
Operations | Net
Investment
Income | Net
Realized
Gains | Total
Distributions | Net Asset
Value,
End
of Period | Total
Return(2) | Operating
Expenses | Operating
Expenses
(before
expense
waiver) | Net
Investment
Income
(Loss) | Net
Investment
Income
(Loss)
(before
expense
waiver) | Portfolio
Turnover
Rate | Net
Assets,
End of
Period
(in thousands) |
R6 Class | | | | | | | | |
2017 | $59.27 | 0.51 | 15.76 | 16.27 | (0.43) | (1.98) | (2.41) | $73.13 | 28.38% | 0.64% | 0.65% | 0.68% | 0.67% | 19% |
| $1,519 |
|
2016 | $62.51 | 0.41 | 0.31 | 0.72 | (0.46) | (3.50) | (3.96) | $59.27 | 1.35% | 0.64% | 0.64% | 0.71% | 0.71% | 16% |
| $7,959 |
|
2015 | $62.18 | 0.41 | 5.79 | 6.20 | (0.45) | (5.42) | (5.87) | $62.51 | 11.31% | 0.64% | 0.64% | 0.70% | 0.70% | 24% |
| $9,841 |
|
2014 | $53.81 | 0.18 | 8.84 | 9.02 | (0.43) | (0.22) | (0.65) | $62.18 | 16.92% | 0.65% | 0.65% | 0.69% | 0.69% | 25% |
| $7,672 |
|
2013(7) | $49.95 | 0.10 | 3.76 | 3.86 | — | — | — | $53.81 | 7.73% | 0.65%(5) | 0.65%(5) | 0.72%(5) | 0.72%(5) | 31%(8) |
| $27 |
|
|
| | | | |
Notes to Financial Highlights | | |
| |
(1) | Computed using average shares outstanding throughout the period. |
| |
(2) | Total returns are calculated based on the net asset value of the last business day and do not reflect applicable sales charges, if any. Total returns for periods less than one year are not annualized. |
| |
(3) | Prior to April 10, 2017, the I Class was referred to as the Institutional Class. |
| |
(4) | April 10, 2017 (commencement of sale) through October 31, 2017. |
| |
(6) | Portfolio turnover is calculated at the fund level. Percentage indicated was calculated for the year ended October 31, 2017. |
| |
(7) | July 26, 2013 (commencement of sale) through October 31, 2013. |
| |
(8) | Portfolio turnover is calculated at the fund level. Percentage indicated was calculated for the year ended October 31, 2013. |
See Notes to Financial Statements.
|
|
Report of Independent Registered Public Accounting Firm |
To the Board of Directors and Shareholders of American Century Mutual Funds, Inc.:
We have audited the accompanying statement of assets and liabilities, including the schedule of investments, of Select Fund (the “Fund”), one of the funds constituting American Century Mutual Funds, Inc., as of October 31, 2017, and the related statement of operations for the year then ended, the statements of changes in net assets for each of the two years in the period then ended, and the financial highlights for each of the periods presented. These financial statements and financial highlights are the responsibility of the Fund’s management. Our responsibility is to express an opinion on these financial statements and financial highlights based on our audits.
We conducted our audits in accordance with the standards of the Public Company Accounting Oversight Board (United States). Those standards require that we plan and perform the audit to obtain reasonable assurance about whether the financial statements and financial highlights are free of material misstatement. The Fund is not required to have, nor were we engaged to perform, an audit of its internal control over financial reporting. Our audits included consideration of internal control over financial reporting as a basis for designing audit procedures that are appropriate in the circumstances, but not for the purpose of expressing an opinion on the effectiveness of the Fund’s internal control over financial reporting. Accordingly, we express no such opinion. An audit also includes examining, on a test basis, evidence supporting the amounts and disclosures in the financial statements, assessing the accounting principles used and significant estimates made by management, as well as evaluating the overall financial statement presentation. Our procedures included confirmation of securities owned as of October 31, 2017, by correspondence with the custodian and brokers; when replies were not received from brokers, we performed other auditing procedures. We believe that our audits provide a reasonable basis for our opinion.
In our opinion, the financial statements and financial highlights referred to above present fairly, in all material respects, the financial position of Select Fund of American Century Mutual Funds, Inc. as of October 31, 2017, the results of its operations for the year then ended, the changes in its net assets for each of the two years in the period then ended, and the financial highlights for each of the periods presented, in conformity with accounting principles generally accepted in the United States of America.
DELOITTE & TOUCHE LLP
Kansas City, Missouri
December 15, 2017
The Board of Directors
The individuals listed below serve as directors of the funds. Each director will continue to serve in this capacity until death, retirement, resignation or removal from office. The board has adopted a mandatory retirement age for directors who are not “interested persons,” as that term is defined in the Investment Company Act (independent directors). Independent directors shall retire by December 31 of the year in which they reach their 75th birthday.
Mr. Thomas is an “interested person” because he currently serves as President and Chief Executive Officer of American Century Companies, Inc. (ACC), the parent company of American Century Investment Management, Inc. (ACIM or the advisor). The other directors (more than three-fourths of the total number) are independent. They are not employees, directors or officers of, and have no financial interest in, ACC or any of its wholly owned, direct or indirect, subsidiaries, including ACIM, American Century Investment Services, Inc. (ACIS) and American Century Services, LLC (ACS), and they do not have any other affiliations, positions or relationships that would cause them to be considered “interested persons” under the Investment Company Act. The directors serve in this capacity for seven (in the case of Mr. Thomas, 15) registered investment companies in the American Century Investments family of funds.
The following table presents additional information about the directors. The mailing address for each director is 4500 Main Street, Kansas City, Missouri 64111.
|
| | | | | |
Name
(Year of Birth) | Position(s) Held with Funds | Length of Time Served | Principal Occupation(s) During Past 5 Years | Number of American Century Portfolios Overseen by Director | Other Directorships Held During Past 5 Years |
Independent Directors |
|
|
Thomas W. Bunn (1953) | Director | Since 2017 | Retired | 69 | SquareTwo Financial; Barings (formerly Babson Capital Funds Trust) (2013 to 2016) |
Barry Fink
(1955) | Director | Since 2012 (independent since 2016) | Retired; Executive Vice President, ACC (2007 to 2013); President, ACS (2007 to 2013); Chief Operating Officer, ACC (2007 to 2012) | 69 | None |
Andrea C. Hall
(1945) | Director | Since 1997 | Retired | 69 | None |
Jan M. Lewis
(1957) | Director | Since 2011 | Retired; President and Chief Executive Officer, Catholic Charities of Northeast Kansas (human services organization) (2006 to 2013) | 69 | None |
James A. Olson
(1942) | Director and Chairman of the Board | Since 2007 (Chairman since 2014) | Member, Plaza Belmont LLC (private equity fund manager) (1999 to present) | 69 | Saia, Inc. (2002 to 2012) and EPR Properties (2003 to 2013) |
|
| | | | | |
Name
(Year of Birth) | Position(s) Held with Funds | Length of Time Served | Principal Occupation(s) During Past 5 Years | Number of American Century Portfolios Overseen by Director | Other Directorships Held During Past 5 Years |
Independent Directors |
|
|
M. Jeannine Strandjord
(1945) | Director | Since 1994 | Retired | 69 | Euronet Worldwide Inc.; MGP Ingredients, Inc.; and DST Systems Inc. (1996 to 2012) |
John R. Whitten
(1946) | Director | Since 2008 | Retired | 69 | Rudolph Technologies, Inc. |
Stephen E. Yates
(1948) | Director | Since 2012 | Retired | 69 | None |
Interested Director |
|
|
Jonathan S. Thomas
(1963) | Director and President | Since 2007 | President and Chief Executive Officer, ACC (2007 to present). Also serves as Chief Executive Officer, ACS; Executive Vice President, ACIM; Director, ACC, ACIM and other ACC subsidiaries | 114 | BioMed Valley Discoveries, Inc. |
The Statement of Additional Information has additional information about the fund's directors and is available without charge, upon request, by calling 1-800-345-2021.
Officers
The following table presents certain information about the executive officers of the funds. Each officer serves as an officer for each of the 15 investment companies in the American Century family of funds, unless otherwise noted. No officer is compensated for his or her service as an officer of the funds. The listed officers are interested persons of the funds and are appointed or re-appointed on an annual basis. The mailing address for each officer listed below is 4500 Main Street, Kansas City, Missouri 64111.
|
| | |
Name
(Year of Birth) | Offices with the Funds | Principal Occupation(s) During the Past Five Years |
Jonathan S. Thomas
(1963) | Director and President since 2007 | President and Chief Executive Officer, ACC (2007 to present). Also serves as Chief Executive Officer, ACS; Executive Vice President, ACIM; Director, ACC, ACIM and other ACC subsidiaries |
Amy D. Shelton
(1964) | Chief Compliance Officer and Vice President since 2014 | Chief Compliance Officer, American Century funds, (2014 to present); Chief Compliance Officer, ACIM (2014 to present); Chief Compliance Officer, ACIS (2009 to present); Vice President, Client Interactions and Marketing, ACIS (2013 to 2014); Director, Client Interactions and Marketing, ACIS (2007 to 2013). Also serves as Vice President, ACIS |
Charles A. Etherington
(1957) | General Counsel since 2007 and Senior Vice President since 2006 | Attorney, ACC (1994 to present); Vice President, ACC (2005 to present); General Counsel, ACC (2007 to present). Also serves as General Counsel, ACIM, ACS, ACIS and other ACC subsidiaries; and Senior Vice President, ACIM and ACS |
C. Jean Wade
(1964) | Vice President,Treasurer and Chief Financial Officer since 2012 | Vice President, ACS (2000 to present) |
Robert J. Leach
(1966) | Vice President since 2006 and Assistant Treasurer since 2012 | Vice President, ACS (2000 to present) |
David H. Reinmiller
(1963) | Vice President since 2000 | Attorney, ACC (1994 to present); Associate General Counsel, ACC (2001 to present). Also serves as Vice President, ACIM and ACS |
Ward D. Stauffer
(1960) | Secretary since 2005 | Attorney, ACC (2003 to present) |
|
|
Approval of Management Agreement |
At a meeting held on June 29, 2017, the Fund’s Board of Directors (the "Board") unanimously approved the renewal of the management agreement pursuant to which American Century Investment Management, Inc. (the “Advisor”) acts as the investment advisor for the Fund. Under Section 15(c) of the Investment Company Act, contracts for investment advisory services are required to be reviewed, evaluated, and approved by a majority of a fund’s directors (the “Directors”), including a majority of the independent Directors, each year.
Prior to its consideration of the renewal of the management agreement, the Directors requested and reviewed extensive data and information compiled by the Advisor and certain independent providers of evaluation data concerning the Fund and the services provided to the Fund by the Advisor. This review was in addition to the oversight and evaluation undertaken by the Board and its committees on a continual basis and the information received was supplemental to the extensive information that the Board and its committees receive and consider throughout the year.
In connection with its consideration of the renewal of the management agreement, the Board’s review and evaluation of the services provided by the Advisor included, but was not limited to, the following:
| |
• | the nature, extent, and quality of investment management, shareholder services, and other services provided and to be provided to the Fund; |
| |
• | the wide range of other programs and services provided and to be provided to the Fund and its shareholders on a routine and non-routine basis; |
| |
• | the investment performance of the Fund, including data comparing the Fund's performance to appropriate benchmarks and/or a peer group of other mutual funds with similar investment objectives and strategies; |
| |
• | the cost of owning the Fund compared to the cost of owning similar funds; |
| |
• | the compliance policies, procedures, and regulatory experience of the Advisor and the Fund's service providers; |
| |
• | financial data showing the cost of services provided to the Fund, the profitability of the Fund to the Advisor, and the overall profitability of the Advisor; |
| |
• | strategic plans of the Advisor |
| |
• | possible economies of scale associated with the Advisor’s management of the Fund and other accounts under its management; |
| |
• | data comparing services provided and charges to the Advisor's other investment management clients; |
| |
• | acquired fund fees and expenses; |
| |
• | payments and practices by the Fund and the Advisor regarding financial intermediaries, the nature of services provided by intermediaries, and the terms of share classes utilized; and |
| |
• | any collateral benefits derived by the Advisor from the management of the Fund. |
The Directors held three in-person meetings and one telephonic meeting to review and discuss the information provided. The independent Directors also reviewed responses to supplemental information requests and held active discussions with the Advisor regarding the renewal of the management agreement. The independent Directors had the benefit of the advice of their independent counsel throughout the process.
Factors Considered
The Directors considered all of the information provided by the Advisor, the independent data providers, and independent counsel in connection with the approval. They determined that the
information was sufficient for them to evaluate the management agreement for the Fund. In connection with their review, the Directors did not identify any single factor as being all-important or controlling, and each Director may have attributed different levels of importance to different factors. In deciding to renew the management agreement, the Board based its decision on a number of factors, including without limitation the following:
Nature, Extent and Quality of Services - Generally. Under the management agreement, the Advisor is responsible for providing or arranging for all services necessary for the operation of the Fund. The Board noted that the Advisor provides or arranges at its own expense a wide variety of services including without limitation the following:
| |
• | portfolio research and security selection |
| |
• | daily valuation of the Fund’s portfolio |
| |
• | shareholder servicing and transfer agency, including shareholder confirmations, recordkeeping, and communications |
| |
• | legal services (except the independent Directors’ counsel) |
| |
• | regulatory and portfolio compliance |
| |
• | marketing and distribution (except amounts paid by the Fund under Rule 12b-1 plans) |
The Board noted that many of these services have expanded over time in terms of both quantity and complexity in response to shareholder demands, competition in the industry, changing distribution channels, and the changing regulatory environment. The Board noted specifically the resources the Advisor has committed during the year to compliance with the Department of Labor fiduciary rule and share class modernization.
Investment Management Services. The nature of the investment management services provided to the Fund is quite complex and allows Fund shareholders access to professional money management, instant diversification of their investments within an asset class, the opportunity to easily diversify among asset classes by investing in or exchanging among various American Century Investments funds, and liquidity. In evaluating investment performance, the Board expects the Advisor to manage the Fund in accordance with its investment objectives and approved strategies. Further, the Directors recognize that the Advisor has an obligation to monitor trading activities, and in particular to seek the best execution of fund trades, and to evaluate the use of and payment for research. In providing these services, the Advisor utilizes teams of investment professionals (portfolio managers, analysts, research assistants, and securities traders) who require extensive information technology, research, training, compliance, and other systems to conduct their business. The Board, directly and through its Fund Performance Review Committee, provides oversight of the investment performance process. It regularly reviews investment performance information for the Fund, together with comparative information for appropriate benchmarks and/or peer groups of similarly-managed funds, over different time horizons. The Directors also review detailed performance information provided by the Advisor during the management agreement renewal process. If performance concerns are identified, the Fund receives special reviews until performance improves, during which the Board receives a report from the Advisor regarding the reasons for such results (e.g., market conditions, security selection) and any efforts being undertaken to improve performance. The Fund’s performance was above its benchmark for the three-, five-, and ten-year periods and below its benchmark for the one-year period reviewed by the Board. The Board discussed the Fund's performance with the Advisor and was satisfied with the efforts being undertaken by the Advisor. The Board found the investment management services provided by the Advisor to the Fund to be satisfactory and consistent with the management agreement.
Shareholder and Other Services. Under the management agreement, the Advisor provides the Fund with a comprehensive package of transfer agency, shareholder, and other services. The Board, directly and through various committees of the Board, regularly reviews reports and evaluations of such services at its regular meetings. These reports include, but are not limited to, information regarding the operational efficiency and accuracy of the shareholder and transfer agency services provided, staffing levels, shareholder satisfaction (as measured by external as well as internal sources), technology support, new products and services offered to Fund shareholders, securities trading activities, portfolio valuation services, auditing services, and legal and operational compliance activities. Certain aspects of shareholder and transfer agency service level efficiency and the quality of securities trading activities are measured by independent third party providers and are presented in comparison to other fund groups not managed by the Advisor. The Board found the services provided by the Advisor to the Fund under the management agreement to be competitive and of high quality.
Costs of Services and Profitability. The Advisor provides detailed information concerning its cost of providing various services to the Fund, its profitability in managing the Fund (pre- and post-distribution), its overall profitability, and its financial condition. The Directors have reviewed with the Advisor the methodology used to prepare this financial information. This information is considered in evaluating the Advisor’s financial condition, its ability to continue to provide services under the management agreement, and the reasonableness of the current management fee. The Board concluded that the Advisor’s profits were reasonable in light of the services provided to the Fund.
Ethics. The Board generally considers the Advisor’s commitment to providing quality services to shareholders and to conducting its business ethically. They noted that the Advisor’s practices generally meet or exceed industry best practices.
Economies of Scale. The Board also reviewed information provided by the Advisor regarding the possible existence of economies of scale in connection with the management of the Fund. The Board concluded that economies of scale are difficult to measure and predict with precision, especially on a fund-by-fund basis. The Board concluded that the Advisor is appropriately sharing economies of scale through its competitive fee structure, offering competitive fees from fund inception, and through reinvestment in its business to provide shareholders additional content and services. The Board also noted that economies of scale are shared with the Fund and its shareholders through management fee breakpoints that serve to reduce the effective management fee as the assets of the Fund grow.
Comparison to Other Funds’ Fees. The management agreement provides that the Fund pays the Advisor a single, all-inclusive (or unified) management fee for providing all services necessary for the management and operation of the Fund, other than brokerage expenses, expenses attributable to short sales, taxes, interest, extraordinary expenses, and the fees and expenses of the Fund’s independent Directors (including their independent legal counsel) and expenses incurred in connection with the provision of shareholder services and distribution services under a plan adopted pursuant to Rule 12b-1 under the 1940 Act. Under the unified fee structure, the Advisor is responsible for providing all investment advisory, custody, audit, administrative, compliance, recordkeeping, marketing and shareholder services, or arranging and supervising third parties to provide such services. By contrast, most other funds are charged a variety of fees, including an investment advisory fee, a transfer agency fee, an administrative fee, distribution charges, and other expenses. Other than their investment advisory fees and any applicable Rule 12b-1 distribution fees, all other components of the total fees charged by these other funds may be increased without shareholder approval. The Board believes the unified fee structure is a benefit to Fund shareholders because it clearly discloses to shareholders the cost of owning Fund shares, and, since the unified fee cannot be increased without a vote of Fund shareholders, it shifts to the Advisor the risk of increased costs of operating the Fund and provides a direct incentive to minimize administrative inefficiencies. Part of the Board’s analysis of fee levels involves reviewing certain evaluative data compiled by an independent provider comparing the Fund’s unified fee to the total expense ratios of its peers. The unified fee charged to shareholders of the Fund was
below the median of the total expense ratios of the Fund’s peer expense universe and was within the range of its peer expense group. The Board discussed with the Advisor the factors that impacted the level of the fee in relation to its peers. The Board and the Advisor agreed to a temporary reduction of the Fund's annual unified management fee of 0.02% (e.g., the Investor Class unified fee will be reduced from 0.99% to 0.97%) for at least one year, beginning August 1, 2017. The Board concluded that the management fee paid by the Fund to the Advisor under the management agreement is reasonable in light of the services provided to the Fund.
Comparison to Fees and Services Provided to Other Clients of the Advisor. The Directors also requested and received information from the Advisor concerning the nature of the services, fees, costs, and profitability of its advisory services to advisory clients other than the Fund. They observed that these varying types of client accounts require different services and involve different regulatory and entrepreneurial risks than the management of the Fund. The Board analyzed this information and concluded that the fees charged and services provided to the Fund were reasonable by comparison.
Payments to Intermediaries. The Directors also requested and received a description of payments made to intermediaries by the Fund and the Advisor and services provided in response thereto. These payments include various payments made by the Fund or the Advisor to different types of intermediaries and recordkeepers for distribution and service activities provided for the Fund. The Board reviewed such information and received representations from the Advisor that all such payments by the Fund were made pursuant to the Fund's Rule 12b-1 Plan and that all such payments by the Advisor were made from the Advisor's resources and reasonable profits. The Board found the payments to be reasonable in scope and purpose.
Collateral or “Fall-Out” Benefits Derived by the Advisor. The Board considered the existence of collateral benefits the Advisor may receive as a result of its relationship with the Fund. They concluded that the Advisor’s primary business is managing mutual funds and it generally does not use fund or shareholder information to generate profits in other lines of business, and therefore does not derive any significant collateral benefits from them. The Board noted that additional assets from other clients may offer the Advisor some benefit from increased leverage with service providers and counterparties. Additionally, the Advisor receives proprietary research from broker-dealers that execute fund portfolio transactions, which the Board concluded is likely to benefit other clients of the Advisor, as well as Fund shareholders. The Board also determined that the Advisor is able to provide investment management services to certain clients other than the Fund, at least in part, due to its existing infrastructure built to serve the fund complex. The Board concluded that appropriate allocation methodologies had been employed to assign resources and the cost of those resources to these other clients and, where expressly provided, these other client assets may be included with the assets of the Fund to determine breakpoints in the management fee schedule.
Existing Relationship. The Board also considered whether there was any reason for not continuing the existing arrangement with the Advisor. In this regard, the Board was mindful of the potential disruptions of the Fund’s operations and various risks, uncertainties, and other effects that could occur as a result of a decision not to continue such relationship. In particular, the Board recognized that most shareholders have invested in the Fund on the strength of the Advisor’s industry standing and reputation and in the expectation that the Advisor will have a continuing role in providing advisory services to the Fund.
Conclusion of the Directors. As a result of this process, the Board, including all of the independent Directors, taking into account all of the factors discussed above and the information provided by the Advisor and others in connection with its review and throughout the year, determined that the management fee is fair and reasonable in light of the services provided and that the investment management agreement between the Fund and the Advisor should be renewed.
A special meeting of shareholders was held on October 18, 2017, to vote on the following proposal. The proposal received the required votes and was adopted. A summary of voting results is listed below.
To elect four directors to the Board of Directors of American Century Mutual Funds, Inc.:
|
| | | | | | | |
| Affirmative |
| Withhold |
Thomas W. Bunn | $ | 19,547,896,641 |
|
| $ | 402,531,816 |
|
Barry Fink | $ | 19,543,961,253 |
|
| $ | 406,467,204 |
|
Jan M. Lewis | $ | 19,556,221,886 |
|
| $ | 394,206,571 |
|
Stephen E. Yates | $ | 19,543,817,152 |
|
| $ | 406,611,305 |
|
The other directors whose term of office continued after the meeting include Jonathan S. Thomas, Andrea C. Hall, James A. Olson, M. Jeannine Strandjord, and John R. Whitten.
Retirement Account Information
As required by law, distributions you receive from certain retirement accounts are subject to federal income tax withholding, unless you elect not to have withholding apply*. Tax will be withheld on the total amount withdrawn even though you may be receiving amounts that are not subject to withholding, such as nondeductible contributions. In such case, excess amounts of withholding could occur. You may adjust your withholding election so that a greater or lesser amount will be withheld.
If you don’t want us to withhold on this amount, you must notify us to not withhold the federal income tax. You may notify us in writing or in certain situations by telephone or through other electronic means. For systematic withdrawals, your withholding election will remain in effect until revoked or changed by filing a new election. You have the right to revoke your election at any time and change your withholding percentage for future distributions.
Remember, even if you elect not to have income tax withheld, you are liable for paying income tax on the taxable portion of your withdrawal. If you elect not to have income tax withheld or you don’t have enough income tax withheld, you may be responsible for payment of estimated tax. You may incur penalties under the estimated tax rules if your withholding and estimated tax payments are not sufficient. You can reduce or defer the income tax on a distribution by directly or indirectly rolling such distribution over to another IRA or eligible plan. You should consult your tax advisor for additional information.
State tax will be withheld if, at the time of your distribution, your address is within one of the mandatory withholding states and you have federal income tax withheld (or as otherwise required by state law). State taxes will be withheld from your distribution in accordance with the respective state rules.
*Some 403(b), 457 and qualified retirement plan distributions may be subject to 20% mandatory withholding, as they are subject to special tax and withholding rules. Your plan administrator or plan sponsor is required to provide you with a special tax notice explaining those rules at the time you request a distribution. If applicable, federal and/or state taxes may be withheld from your distribution amount.
Proxy Voting Policies
A description of the policies that the fund's investment advisor uses in exercising the voting rights associated with the securities purchased and/or held by the fund is available without charge, upon request, by calling 1-800-345-2021. It is also available on the "About Us" page of American Century Investments’ website at americancentury.com and on the Securities and Exchange Commission’s website at sec.gov. Information regarding how the investment advisor voted proxies relating to portfolio securities during the most recent 12-month period ended June 30 is available on the "About Us" page at americancentury.com. It is also available at sec.gov.
Quarterly Portfolio Disclosure
The fund files its complete schedule of portfolio holdings with the Securities and Exchange Commission (SEC) for the first and third quarters of each fiscal year on Form N-Q. The fund’s Forms N-Q are available on the SEC’s website at sec.gov, and may be reviewed and copied at the SEC’s Public Reference Room in Washington, DC. Information on the operation of the Public Reference Room may be obtained by calling 1-800-SEC-0330. The fund also makes its complete schedule of portfolio holdings for the most recent quarter of its fiscal year available on its website at americancentury.com and, upon request, by calling 1-800-345-2021.
Other Tax Information
The following information is provided pursuant to provisions of the Internal Revenue Code.
The fund hereby designates up to the maximum amount allowable as qualified dividend income for the fiscal year ended October 31, 2017.
For corporate taxpayers, the fund hereby designates $8,812,803, or up to the maximum amount allowable, of ordinary income distributions paid during the fiscal year ended October 31, 2017 as qualified for the corporate dividends received deduction.
The fund hereby designates $79,492,517, or up to the maximum amount allowable, as long-term capital gain distributions (20% rate gain distributions) for the fiscal year ended October 31, 2017.
|
| | |
| |
| | |
Contact Us | americancentury.com | |
Automated Information Line | 1-800-345-8765 | |
Investor Services Representative | 1-800-345-2021 or 816-531-5575 | |
Investors Using Advisors | 1-800-378-9878 | |
Business, Not-For-Profit, Employer-Sponsored Retirement Plans | 1-800-345-3533 | |
Banks and Trust Companies, Broker-Dealers, Financial Professionals, Insurance Companies | 1-800-345-6488 | |
Telecommunications Relay Service for the Deaf | 711 | |
| | |
American Century Mutual Funds, Inc. | |
| | |
Investment Advisor: American Century Investment Management, Inc. Kansas City, Missouri | |
| | |
This report and the statements it contains are submitted for the general information of our shareholders. The report is not authorized for distribution to prospective investors unless preceded or accompanied by an effective prospectus. | |
| | |
©2017 American Century Proprietary Holdings, Inc. All rights reserved.
CL-ANN-90969 1712 | |
|
| |
| |
| Annual Report |
| |
| October 31, 2017 |
| |
| Small Cap Growth Fund |
|
| | |
President’s Letter | 2 |
|
Performance | 3 |
|
Portfolio Commentary | |
|
Fund Characteristics | |
|
Shareholder Fee Example | |
|
Schedule of Investments | |
|
Statement of Assets and Liabilities | |
|
Statement of Operations | |
|
Statement of Changes in Net Assets | |
|
Notes to Financial Statements | |
|
Financial Highlights | |
|
Report of Independent Registered Public Accounting Firm | |
|
Management | |
|
Approval of Management Agreement | |
|
Proxy Voting Results | |
|
Additional Information | |
|
Any opinions expressed in this report reflect those of the author as of the date of the report, and do not necessarily represent the opinions of American Century Investments® or any other person in the American Century Investments organization. Any such opinions are subject to change at any time based upon market or other conditions and American Century Investments disclaims any responsibility to update such opinions. These opinions may not be relied upon as investment advice and, because investment decisions made by American Century Investments funds are based on numerous factors, may not be relied upon as an indication of trading intent on behalf of any American Century Investments fund. Security examples are used for representational purposes only and are not intended as recommendations to purchase or sell securities. Performance information for comparative indices and securities is provided to American Century Investments by third party vendors. To the best of American Century Investments’ knowledge, such information is accurate at the time of printing.
Jonathan Thomas
Dear Investor:
Thank you for reviewing this annual report for the period ended October 31, 2017. Annual reports help convey important information about fund returns, including market factors that affected performance during the reporting period. For additional, updated investment and market insights, we encourage you to visit our website, americancentury.com.
‘Risk-On’ Sentiment Sparked Strong Gains Among Stocks
U.S. stocks delivered robust double-digit gains for the reporting period. The “risk-on” rally began early in the period, following Donald Trump’s election victory in November 2016. Investor expectations for President Trump’s administration to usher in pro-growth policies and reforms drove stock prices higher. In addition, healthy corporate earnings growth and improving gross domestic product (GDP) and other economic data provided additional support for stocks. Against this backdrop, the S&P 500 Index reached several milestone levels during the period and returned 23.63%. In terms of equity styles, riskier and economically sensitive stocks generally remained in favor. For example, small-cap stocks generally outperformed their mid- and large-cap peers, while growth stocks broadly outperformed their value counterparts across the capitalization spectrum. Real estate investment trusts (REITs) advanced, but global property stocks significantly underperformed the broader stock market as interest rates increased, most notably in the U.S., where the Federal Reserve (Fed) raised rates three times during the period.
As stocks soared in the post-election environment, global bonds sold off sharply. President Trump’s policy agenda fueled inflation fears that sent global bond yields sharply higher in late 2016. However, broad bond market performance generally recovered beginning in early 2017, advancing on subdued inflation and continued central bank accommodation to post modest gains for the entire reporting period. Investor preferences for risk also extended to the global fixed-income market, where high-yield corporate and emerging markets bonds were top performers.
As Congress considers tax cuts and other pro-growth reforms and the Fed and other central banks pursue policy normalization, investors likely will face new opportunities and challenges in the months ahead. We continue to believe in a disciplined, diversified, and risk-aware approach, using professionally managed portfolios in pursuit of investment goals. We appreciate your continued trust in us.
Sincerely,
Jonathan Thomas
President and Chief Executive Officer
American Century Investments
|
| | | | | | |
Total Returns as of October 31, 2017 |
| | | Average Annual Returns | |
| Ticker Symbol | 1 year | 5 years | 10 years | Since Inception | Inception Date |
Investor Class | ANOIX | 33.36% | 14.52% | 6.37% | — | 6/1/01 |
Russell 2000 Growth Index | — | 31.00% | 15.35% | 8.15% | — | — |
I Class | ANONX | 33.51% | 14.74% | 6.57% | — | 5/18/07 |
Y Class | ANOYX | — | — | — | 15.67% | 4/10/17 |
A Class | ANOAX | | | | | 1/31/03 |
No sales charge | | 33.02% | 14.24% | 6.10% | — | |
With sales charge | | 25.36% | 12.89% | 5.48% | — | |
C Class | ANOCX | 31.99% | 13.38% | 5.31% | — | 1/31/03 |
R Class | ANORX | 32.61% | 13.96% | 5.83% | — | 9/28/07 |
R5 Class | ANOGX | — | — | — | 15.56% | 4/10/17 |
R6 Class | ANODX | 33.74% | — | — | 11.07% | 7/26/13 |
Average annual returns since inception are presented when ten years of performance history is not available.
Prior to April 10, 2017, the I Class was referred to as the Institutional Class. Extraordinary performance is attributable in part to unusually favorable market conditions and may not be repeated or consistently achieved in the future.
Sales charges include initial sales charges and contingent deferred sales charges (CDSCs), as applicable. A Class shares have a 5.75% maximum initial sales charge and may be subject to a maximum CDSC of 1.00%. C Class shares redeemed within 12 months of purchase are subject to a maximum CDSC of 1.00%. The SEC requires that mutual funds provide performance information net of maximum sales charges in all cases where charges could be applied.
Data presented reflect past performance. Past performance is no guarantee of future results. Current performance may be higher or lower than the performance shown. Total returns for periods less than one year are not annualized. Investment return and principal value will fluctuate, and redemption value may be more or less than original cost. Data assumes reinvestment of dividends and capital gains, and none of the charts reflect the deduction of taxes that a shareholder would pay on fund distributions or the redemption of fund shares. To obtain performance data current to the most recent month end, please call 1-800-345-2021 or visit americancentury.com. For additional information about the fund, please consult the prospectus.
|
|
Growth of $10,000 Over 10 Years |
$10,000 investment made October 31, 2007 |
Performance for other share classes will vary due to differences in fee structure. |
|
| |
Value on October 31, 2017 |
| Investor Class — $18,552 |
|
| Russell 2000 Growth Index — $21,912 |
|
|
| | | | | | | |
Total Annual Fund Operating Expenses |
Investor Class | I Class | Y Class | A Class | C Class | R Class | R5 Class | R6 Class |
1.36% | 1.16% | 1.01% | 1.61% | 2.36% | 1.86% | 1.16% | 1.01% |
The total annual fund operating expenses shown is as stated in the fund’s prospectus current as of the date of this report. The prospectus may vary from the expense ratio shown elsewhere in this report because it is based on a different time period, includes acquired fund fees and expenses, and, if applicable, does not include fee waivers or expense reimbursements.
Data presented reflect past performance. Past performance is no guarantee of future results. Current performance may be higher or lower than the performance shown. Total returns for periods less than one year are not annualized. Investment return and principal value will fluctuate, and redemption value may be more or less than original cost. Data assumes reinvestment of dividends and capital gains, and none of the charts reflect the deduction of taxes that a shareholder would pay on fund distributions or the redemption of fund shares. To obtain performance data current to the most recent month end, please call 1-800-345-2021 or visit americancentury.com. For additional information about the fund, please consult the prospectus.
Portfolio Managers: Jackie Wagner and Jeff Hoernemann
Portfolio manager Matthew Ferretti retired from American Century in May 2017. Senior investment analyst Jeff Hoernemann was promoted to portfolio manager in April 2017.
On October 20, 2017, the New Opportunities Fund combined into the Small Cap Growth Fund.
Performance Summary
Small Cap Growth returned 33.36%* for the 12 months ended October 31, 2017, outpacing the 31.00% return of the portfolio’s benchmark, the Russell 2000 Growth Index.
U.S. stock indices registered strong gains during the reporting period, and growth stocks outpaced value stocks by a wide margin across all capitalization ranges, providing a tailwind for the fund. Within the Russell 2000 Growth Index, every sector except energy reported strong total returns, led by telecommunication services, which represents a small slice of the benchmark. Financials, materials, and health care also posted solid results.
Stock choices within the information technology sector helped drive the fund’s outperformance relative to the benchmark. Stock selection in the consumer discretionary, industrials, and consumer staples sectors was also strongly positive. An overweight allocation to the energy sector, an underweight allocation to the telecommunication services sector, and certain stock choices in the materials sector detracted from performance relative to the benchmark.
Information Technology Stocks Benefited Performance
Within the information technology sector, stock choices among internet software and services companies led relative outperformance. In the software industry, RingCentral was a significant contributor. The provider of cloud-based software that enables unified business communications benefited from larger deal activity and growth in the enterprise-level customer base as these customers adopt on-demand solutions, replacing legacy on-premise solutions. Stock selection in the consumer discretionary sector also added value. Chegg, an online provider of textbooks, study guides, tutors, and test preparation, benefited from growth in its subscriber base and greater usage of its service offerings.
In health care, Tivity Health, which provides health fitness solutions and physical therapy, was a major contributor. The company experienced better-than-expected growth from strength in its popular SilverSneakers program, a free fitness benefit for seniors offered through Medicare Advantage and other health plans. Contract pharmaceutical maker Catalent benefited from solid growth in its biologics business.
Other top contributors included XPO Logistics, a provider of logistics services such as airfreight, ocean and ground forwarding, warehouse management, and order fulfillment. The company benefited from the secular growth in e-commerce, the cyclical upturn in freight volumes and rates, and the successful integration of opportunistic acquisitions.
*All fund returns referenced in this commentary are for Investor Class shares. Performance for other share classes will vary due to differences in fee structure; when Investor Class performance exceeds that of the fund’s benchmark, other share classes may not. See page 3 for returns for all share classes.
Energy Weighed on Results
An overweight position in the energy sector detracted from relative performance. Independent oil and gas company RSP Permian was a major detractor. Despite solid production and revenue results, the company’s shares fell along with oil prices.
Underweighting telecommunication services companies detracted. The strong-performing sector typically has few companies with the growth characteristics we look for.
Elsewhere, AMC Entertainment Holdings, the largest theater operator in the U.S., hindered results. Year-to-date box office results were weak and recent acquisition integrations caused some headwinds. The holding was eliminated. Evolent Health detracted. The technology company is focused on helping large provider groups manage population health and financial risk. Despite solid revenue growth, an equity raise and subsequent pivot to a higher-risk business model concerned investors. Adeptus Health also detracted. The operator of freestanding emergency rooms and clinics was unable to manage cash collections, which led to a severely dilutive emergency financing and eventual bankruptcy. The holding was eliminated.
Not owning benchmark component The Chemours Company was a significant detractor. The company, which was spun off from DuPont in 2015, makes materials used in coatings and refrigeration. The stock rose as the company benefited from a cyclical upswing in titanium oxide prices and settled personal-injury lawsuits related to a chemical contamination for less than investors had expected.
Outlook
Small Cap Growth’s investment process focuses on smaller companies with accelerating growth rates and share-price momentum. We believe that active investments in such companies will generate outperformance over time compared to the Russell 2000 Growth Index.
The portfolio positioning remains largely stock specific, with few thematic trends. As of October 31, 2017, financials, materials, and energy were the largest overweight sectors. Information technology, telecommunication services, and utilities were the largest underweights.
|
| |
OCTOBER 31, 2017 | |
Top Ten Holdings | % of net assets |
Tivity Health, Inc. | 1.6% |
Monolithic Power Systems, Inc. | 1.6% |
XPO Logistics, Inc. | 1.6% |
LogMeIn, Inc. | 1.6% |
2U, Inc. | 1.5% |
Cotiviti Holdings, Inc. | 1.5% |
RingCentral, Inc., Class A | 1.5% |
Paycom Software, Inc. | 1.4% |
Catalent, Inc. | 1.3% |
SiteOne Landscape Supply, Inc. | 1.3% |
| |
Top Five Industries | % of net assets |
Internet Software and Services | 8.0% |
Biotechnology | 7.8% |
Software | 5.9% |
Semiconductors and Semiconductor Equipment | 5.6% |
Machinery | 5.3% |
| |
Types of Investments in Portfolio | % of net assets |
Common Stocks | 98.4% |
Temporary Cash Investments | 1.5% |
Other Assets and Liabilities | 0.1% |
Fund shareholders may incur two types of costs: (1) transaction costs, including sales charges (loads) on purchase payments and redemption/exchange fees; and (2) ongoing costs, including management fees; distribution and service (12b-1) fees; and other fund expenses. This example is intended to help you understand your ongoing costs (in dollars) of investing in your fund and to compare these costs with the ongoing cost of investing in other mutual funds.
The example is based on an investment of $1,000 made at the beginning of the period and held for the entire period from May 1, 2017 to October 31, 2017.
Actual Expenses
The table provides information about actual account values and actual expenses for each class. You may use the information, together with the amount you invested, to estimate the expenses that you paid over the period. First, identify the share class you own. Then simply divide your account value by $1,000 (for example, an $8,600 account value divided by $1,000 = 8.6), then multiply the result by the number under the heading “Expenses Paid During Period” to estimate the expenses you paid on your account during this period.
If you hold Investor Class shares of any American Century Investments fund, or I Class shares of the American Century Diversified Bond Fund, in an American Century Investments account (i.e., not a financial intermediary or retirement plan account), American Century Investments may charge you a $12.50 semiannual account maintenance fee if the value of those shares is less than $10,000. We will redeem shares automatically in one of your accounts to pay the $12.50 fee. In determining your total eligible investment amount, we will include your investments in all personal accounts (including American Century Investments Brokerage accounts) registered under your Social Security number. Personal accounts include individual accounts, joint accounts, UGMA/UTMA accounts, personal trusts, Coverdell Education Savings Accounts and IRAs (including traditional, Roth, Rollover, SEP-, SARSEP- and SIMPLE-IRAs), and certain other retirement accounts. If you have only business, business retirement, employer-sponsored or American Century Investments Brokerage accounts, you are currently not subject to this fee. If you are subject to the Account Maintenance Fee, your account value could be reduced by the fee amount.
Hypothetical Example for Comparison Purposes
The table also provides information about hypothetical account values and hypothetical expenses based on the actual expense ratio of each class of your fund and an assumed rate of return of 5% per year before expenses, which is not the actual return of a fund’s share class. The hypothetical account values and expenses may not be used to estimate the actual ending account balance or expenses you paid for the period. You may use this information to compare the ongoing costs of investing in your fund and other funds. To do so, compare this 5% hypothetical example with the 5% hypothetical examples that appear in the shareholder reports of the other funds.
Please note that the expenses shown in the table are meant to highlight your ongoing costs only and do not reflect any transactional costs, such as sales charges (loads) or redemption/exchange fees. Therefore, the table is useful in comparing ongoing costs only, and will not help you determine the relative total costs of owning different funds. In addition, if these transactional costs were included, your costs would have been higher.
|
| | | | |
| Beginning
Account Value
5/1/17 | Ending
Account Value
10/31/17 | Expenses Paid
During Period(1)
5/1/17 - 10/31/17 |
Annualized
Expense Ratio(1) |
Actual | | | | |
Investor Class | $1,000 | $1,115.10 | $7.30 | 1.37% |
I Class | $1,000 | $1,115.40 | $6.24 | 1.17% |
Y Class | $1,000 | $1,117.40 | $5.44 | 1.02% |
A Class | $1,000 | $1,113.80 | $8.63 | 1.62% |
C Class | $1,000 | $1,109.40 | $12.60 | 2.37% |
R Class | $1,000 | $1,111.80 | $9.95 | 1.87% |
R5 Class | $1,000 | $1,116.10 | $6.24 | 1.17% |
R6 Class | $1,000 | $1,116.70 | $5.44 | 1.02% |
Hypothetical | | | | |
Investor Class | $1,000 | $1,018.30 | $6.97 | 1.37% |
I Class | $1,000 | $1,019.31 | $5.96 | 1.17% |
Y Class | $1,000 | $1,020.06 | $5.19 | 1.02% |
A Class | $1,000 | $1,017.04 | $8.24 | 1.62% |
C Class | $1,000 | $1,013.26 | $12.03 | 2.37% |
R Class | $1,000 | $1,015.78 | $9.50 | 1.87% |
R5 Class | $1,000 | $1,019.31 | $5.96 | 1.17% |
R6 Class | $1,000 | $1,020.06 | $5.19 | 1.02% |
| |
(1) | Expenses are equal to the class's annualized expense ratio listed in the table above, multiplied by the average account value over the period, multiplied by 184, the number of days in the most recent fiscal half-year, divided by 365, to reflect the one-half year period. Annualized expense ratio reflects actual expenses, including any applicable fee waivers or expense reimbursements and excluding any acquired fund fees and expenses. |
OCTOBER 31, 2017
|
| | | | | |
| Shares | Value |
COMMON STOCKS — 98.4% | | |
Aerospace and Defense — 3.2% | | |
AAR Corp. | 194,392 |
| $ | 7,559,905 |
|
KLX, Inc.(1) | 135,265 |
| 7,420,638 |
|
Mercury Systems, Inc.(1) | 146,514 |
| 7,394,561 |
|
| | 22,375,104 |
|
Air Freight and Logistics — 1.6% | | |
XPO Logistics, Inc.(1) | 164,311 |
| 11,394,968 |
|
Auto Components — 1.4% | | |
LCI Industries | 35,217 |
| 4,359,865 |
|
Tenneco, Inc. | 97,731 |
| 5,679,148 |
|
| | 10,039,013 |
|
Banks — 2.6% | | |
Ameris Bancorp | 115,466 |
| 5,530,821 |
|
Cathay General Bancorp | 195,837 |
| 8,185,987 |
|
Heritage Financial Corp. | 153,702 |
| 4,687,911 |
|
| | 18,404,719 |
|
Beverages — 0.8% | | |
MGP Ingredients, Inc. | 80,213 |
| 5,451,275 |
|
Biotechnology — 7.8% | | |
ACADIA Pharmaceuticals, Inc.(1) | 17,950 |
| 625,199 |
|
Aimmune Therapeutics, Inc.(1) | 84,207 |
| 2,447,898 |
|
Alder Biopharmaceuticals, Inc.(1) | 98,381 |
| 1,106,786 |
|
Amicus Therapeutics, Inc.(1) | 96,475 |
| 1,373,804 |
|
Arena Pharmaceuticals, Inc.(1) | 86,669 |
| 2,429,332 |
|
Avexis, Inc.(1) | 17,132 |
| 1,790,465 |
|
Biohaven Pharmaceutical Holding Co. Ltd.(1) | 55,039 |
| 1,654,472 |
|
Clovis Oncology, Inc.(1) | 50,158 |
| 3,780,408 |
|
Exact Sciences Corp.(1) | 79,915 |
| 4,394,526 |
|
FibroGen, Inc.(1) | 80,440 |
| 4,492,574 |
|
Flexion Therapeutics, Inc.(1) | 107,959 |
| 2,376,178 |
|
Halozyme Therapeutics, Inc.(1) | 164,546 |
| 2,917,401 |
|
Ligand Pharmaceuticals, Inc.(1) | 19,372 |
| 2,815,720 |
|
Neurocrine Biosciences, Inc.(1) | 20,993 |
| 1,303,875 |
|
Portola Pharmaceuticals, Inc.(1) | 58,311 |
| 2,881,147 |
|
Prothena Corp. plc(1) | 32,115 |
| 1,864,276 |
|
Puma Biotechnology, Inc.(1) | 36,397 |
| 4,633,338 |
|
Radius Health, Inc.(1) | 71,234 |
| 2,287,324 |
|
Sage Therapeutics, Inc.(1) | 33,687 |
| 2,131,713 |
|
Sarepta Therapeutics, Inc.(1) | 54,894 |
| 2,706,823 |
|
Spark Therapeutics, Inc.(1) | 36,766 |
| 2,974,369 |
|
Ultragenyx Pharmaceutical, Inc.(1) | 34,341 |
| 1,582,777 |
|
| | 54,570,405 |
|
|
| | | | | |
| Shares | Value |
Building Products — 1.1% | | |
Masonite International Corp.(1) | 46,741 |
| $ | 3,136,321 |
|
PGT Innovations, Inc.(1) | 326,668 |
| 4,606,019 |
|
| | 7,742,340 |
|
Capital Markets — 0.3% | | |
Hamilton Lane, Inc., Class A | 73,695 |
| 2,025,876 |
|
Chemicals — 3.1% | | |
Ingevity Corp.(1) | 127,770 |
| 9,101,057 |
|
Scotts Miracle-Gro Co. (The) | 15,478 |
| 1,541,918 |
|
Sensient Technologies Corp. | 104,350 |
| 7,935,818 |
|
Valvoline, Inc. | 123,088 |
| 2,956,574 |
|
| | 21,535,367 |
|
Commercial Services and Supplies — 2.2% | | |
Advanced Disposal Services, Inc.(1) | 269,052 |
| 6,704,776 |
|
Brink's Co. (The) | 105,811 |
| 8,052,217 |
|
Copart, Inc.(1) | 20,914 |
| 758,969 |
|
| | 15,515,962 |
|
Communications Equipment — 0.4% | | |
Lumentum Holdings, Inc.(1) | 44,194 |
| 2,790,851 |
|
Construction and Engineering — 1.3% | | |
Granite Construction, Inc. | 145,570 |
| 9,271,353 |
|
Construction Materials — 1.3% | | |
Summit Materials, Inc., Class A(1) | 291,533 |
| 9,154,136 |
|
Consumer Finance — 0.7% | | |
Green Dot Corp., Class A(1) | 87,036 |
| 4,927,978 |
|
Distributors — 0.3% | | |
Pool Corp. | 18,587 |
| 2,244,938 |
|
Diversified Consumer Services — 2.1% | | |
Bright Horizons Family Solutions, Inc.(1) | 100,229 |
| 8,649,763 |
|
Chegg, Inc.(1) | 386,994 |
| 6,002,277 |
|
| | 14,652,040 |
|
Electronic Equipment, Instruments and Components — 2.2% | | |
Coherent, Inc.(1) | 12,583 |
| 3,305,680 |
|
Dolby Laboratories, Inc., Class A | 133,350 |
| 7,726,299 |
|
TTM Technologies, Inc.(1) | 270,547 |
| 4,269,232 |
|
| | 15,301,211 |
|
Equity Real Estate Investment Trusts (REITs) — 2.5% | | |
CyrusOne, Inc. | 39,336 |
| 2,414,837 |
|
National Health Investors, Inc. | 49,278 |
| 3,754,491 |
|
PS Business Parks, Inc. | 31,441 |
| 4,160,588 |
|
QTS Realty Trust, Inc., Class A | 122,170 |
| 7,067,534 |
|
| | 17,397,450 |
|
Health Care Equipment and Supplies — 3.3% | | |
Masimo Corp.(1) | 70,582 |
| 6,194,276 |
|
Merit Medical Systems, Inc.(1) | 82,290 |
| 3,131,135 |
|
Nevro Corp.(1) | 59,306 |
| 5,194,019 |
|
NuVasive, Inc.(1) | 52,038 |
| 2,952,116 |
|
|
| | | | | |
| Shares | Value |
Varex Imaging Corp.(1) | 177,308 |
| $ | 6,094,076 |
|
| | 23,565,622 |
|
Health Care Providers and Services — 4.0% | | |
Acadia Healthcare Co., Inc.(1) | 110,561 |
| 3,467,193 |
|
Amedisys, Inc.(1) | 81,448 |
| 3,918,463 |
|
HealthEquity, Inc.(1) | 105,688 |
| 5,307,651 |
|
Teladoc, Inc.(1) | 121,979 |
| 4,031,406 |
|
Tivity Health, Inc.(1) | 249,667 |
| 11,547,099 |
|
| | 28,271,812 |
|
Health Care Technology — 2.1% | | |
Cotiviti Holdings, Inc.(1) | 304,138 |
| 10,693,492 |
|
Evolent Health, Inc., Class A(1) | 259,208 |
| 4,212,130 |
|
| | 14,905,622 |
|
Hotels, Restaurants and Leisure — 4.4% | | |
Cedar Fair LP | 86,958 |
| 5,443,571 |
|
Churchill Downs, Inc. | 27,421 |
| 5,718,650 |
|
Hilton Grand Vacations, Inc.(1) | 140,889 |
| 5,770,813 |
|
Planet Fitness, Inc., Class A | 303,129 |
| 8,075,357 |
|
Texas Roadhouse, Inc. | 116,827 |
| 5,842,518 |
|
| | 30,850,909 |
|
Household Durables — 1.0% | | |
Installed Building Products, Inc.(1) | 101,440 |
| 7,070,368 |
|
Household Products — 0.6% | | |
Central Garden & Pet Co., Class A(1) | 115,461 |
| 4,261,665 |
|
Insurance — 1.5% | | |
James River Group Holdings Ltd. | 38,630 |
| 1,634,822 |
|
Kinsale Capital Group, Inc. | 100,826 |
| 4,373,832 |
|
Trupanion, Inc.(1) | 167,609 |
| 4,719,869 |
|
| | 10,728,523 |
|
Internet Software and Services — 8.0% | | |
2U, Inc.(1) | 169,925 |
| 10,812,328 |
|
Alarm.com Holdings, Inc.(1) | 111,057 |
| 5,184,141 |
|
Five9, Inc.(1) | 261,202 |
| 6,590,126 |
|
j2 Global, Inc. | 42,256 |
| 3,132,860 |
|
LogMeIn, Inc. | 91,173 |
| 11,036,492 |
|
Mimecast Ltd.(1) | 245,535 |
| 7,805,558 |
|
MongoDB, Inc.(1) | 13,034 |
| 397,276 |
|
Q2 Holdings, Inc.(1) | 127,942 |
| 5,443,932 |
|
Quotient Technology, Inc.(1) | 195,684 |
| 3,062,454 |
|
Shopify, Inc., Class A(1) | 27,339 |
| 2,719,957 |
|
| | 56,185,124 |
|
IT Services — 1.4% | | |
Euronet Worldwide, Inc.(1) | 54,957 |
| 5,311,045 |
|
Science Applications International Corp. | 62,160 |
| 4,558,814 |
|
| | 9,869,859 |
|
Leisure Products — 0.6% | | |
Malibu Boats, Inc., Class A(1) | 131,425 |
| 4,100,460 |
|
|
| | | | | |
| Shares | Value |
Life Sciences Tools and Services — 1.6% | | |
Bio-Techne Corp. | 35,246 |
| $ | 4,617,931 |
|
PRA Health Sciences, Inc.(1) | 82,949 |
| 6,754,537 |
|
| | 11,372,468 |
|
Machinery — 5.3% | | |
ITT, Inc. | 154,546 |
| 7,208,025 |
|
John Bean Technologies Corp. | 61,373 |
| 6,560,774 |
|
Kadant, Inc. | 51,529 |
| 5,853,694 |
|
Kennametal, Inc. | 183,696 |
| 8,018,330 |
|
Terex Corp. | 97,186 |
| 4,578,433 |
|
Woodward, Inc. | 61,344 |
| 4,743,732 |
|
| | 36,962,988 |
|
Media — 0.3% | | |
Emerald Expositions Events, Inc. | 80,110 |
| 1,865,762 |
|
Multiline Retail — 0.4% | | |
Ollie's Bargain Outlet Holdings, Inc.(1) | 65,197 |
| 2,911,046 |
|
Oil, Gas and Consumable Fuels — 1.8% | | |
Callon Petroleum Co.(1) | 570,951 |
| 6,331,847 |
|
RSP Permian, Inc.(1) | 191,893 |
| 6,603,038 |
|
| | 12,934,885 |
|
Paper and Forest Products — 1.0% | | |
KapStone Paper and Packaging Corp. | 317,573 |
| 7,132,690 |
|
Personal Products — 1.0% | | |
Inter Parfums, Inc. | 66,586 |
| 3,082,932 |
|
Medifast, Inc. | 65,563 |
| 4,091,131 |
|
| | 7,174,063 |
|
Pharmaceuticals — 3.5% | | |
Aerie Pharmaceuticals, Inc.(1) | 32,312 |
| 1,995,266 |
|
Catalent, Inc.(1) | 221,756 |
| 9,444,588 |
|
Dermira, Inc.(1) | 57,925 |
| 1,550,652 |
|
Horizon Pharma plc(1) | 106,969 |
| 1,450,500 |
|
Medicines Co. (The)(1) | 70,388 |
| 2,022,951 |
|
Optinose, Inc.(1) | 192,420 |
| 3,879,187 |
|
Pacira Pharmaceuticals, Inc.(1) | 55,141 |
| 1,767,269 |
|
Supernus Pharmaceuticals, Inc.(1) | 66,443 |
| 2,764,029 |
|
| | 24,874,442 |
|
Real Estate Management and Development — 1.3% | | |
FirstService Corp. | 68,469 |
| 4,766,453 |
|
RE/MAX Holdings, Inc., Class A | 63,754 |
| 4,239,641 |
|
| | 9,006,094 |
|
Road and Rail — 0.9% | | |
Saia, Inc.(1) | 98,873 |
| 6,406,970 |
|
Semiconductors and Semiconductor Equipment — 5.6% | | |
Cavium, Inc.(1) | 73,028 |
| 5,038,202 |
|
Formfactor, Inc.(1) | 265,321 |
| 4,828,842 |
|
Inphi Corp.(1) | 90,110 |
| 3,692,708 |
|
Microsemi Corp.(1) | 95,386 |
| 5,090,751 |
|
|
| | | | | |
| Shares | Value |
MKS Instruments, Inc. | 40,795 |
| $ | 4,432,377 |
|
Monolithic Power Systems, Inc. | 93,959 |
| 11,431,991 |
|
Power Integrations, Inc. | 62,035 |
| 4,984,512 |
|
| | 39,499,383 |
|
Software — 5.9% | | |
Callidus Software, Inc.(1) | 331,642 |
| 8,407,125 |
|
Guidewire Software, Inc.(1) | 13,854 |
| 1,108,043 |
|
Paycom Software, Inc.(1) | 121,979 |
| 10,026,674 |
|
RealPage, Inc.(1) | 194,680 |
| 8,429,644 |
|
RingCentral, Inc., Class A(1) | 242,568 |
| 10,224,241 |
|
Tyler Technologies, Inc.(1) | 19,826 |
| 3,514,951 |
|
| | 41,710,678 |
|
Specialty Retail — 2.6% | | |
American Eagle Outfitters, Inc. | 206,475 |
| 2,688,305 |
|
At Home Group, Inc.(1) | 202,675 |
| 4,154,837 |
|
Burlington Stores, Inc.(1) | 62,881 |
| 5,903,897 |
|
DSW, Inc., Class A | 106,512 |
| 2,039,705 |
|
National Vision Holdings, Inc.(1) | 133,616 |
| 3,848,141 |
|
| | 18,634,885 |
|
Textiles, Apparel and Luxury Goods — 0.5% | | |
Steven Madden Ltd.(1) | 82,206 |
| 3,206,034 |
|
Thrifts and Mortgage Finance — 1.7% | | |
Essent Group Ltd.(1) | 171,077 |
| 7,291,302 |
|
LendingTree, Inc.(1) | 17,949 |
| 4,811,229 |
|
| | 12,102,531 |
|
Trading Companies and Distributors — 2.8% | | |
BMC Stock Holdings, Inc.(1) | 195,321 |
| 4,189,635 |
|
MRC Global, Inc.(1) | 340,718 |
| 5,843,314 |
|
SiteOne Landscape Supply, Inc.(1) | 148,020 |
| 9,400,750 |
|
| | 19,433,699 |
|
Wireless Telecommunication Services — 0.4% | | |
Boingo Wireless, Inc.(1) | 111,655 |
| 2,610,494 |
|
TOTAL COMMON STOCKS
(Cost $559,693,853) | | 692,444,062 |
|
TEMPORARY CASH INVESTMENTS — 1.5% | | |
Repurchase Agreement, BMO Capital Markets Corp., (collateralized by various U.S. Treasury obligations, 0.375% - 1.375%, 1/15/27 - 2/15/45, valued at $5,692,393), in a joint trading account at 0.88%, dated 10/31/17, due 11/1/17 (Delivery value $5,568,130) | | 5,567,994 |
|
Repurchase Agreement, Fixed Income Clearing Corp., (collateralized by various U.S. Treasury obligations, 2.50%, 5/15/46, valued at $4,735,585), at 0.34%, dated 10/31/17, due 11/1/17 (Delivery value $4,641,044) | | 4,641,000 |
|
State Street Institutional U.S. Government Money Market Fund, Premier Class | 5,955 |
| 5,955 |
|
TOTAL TEMPORARY CASH INVESTMENTS
(Cost $10,214,949) | | 10,214,949 |
|
TOTAL INVESTMENT SECURITIES — 99.9%
(Cost $569,908,802) | | 702,659,011 |
|
OTHER ASSETS AND LIABILITIES — 0.1% | | 713,000 |
|
TOTAL NET ASSETS — 100.0% | | $ | 703,372,011 |
|
|
| | | | | | | | | | |
FORWARD FOREIGN CURRENCY EXCHANGE CONTRACTS | | |
Currency Purchased | Currency Sold | Counterparty | Settlement Date | Unrealized Appreciation
(Depreciation) |
CAD | 244,962 |
| USD | 193,641 |
| Morgan Stanley | 12/29/17 | $ | (3,647 | ) |
CAD | 130,639 |
| USD | 101,240 |
| Morgan Stanley | 12/29/17 | 84 |
|
USD | 3,279,826 |
| CAD | 4,055,865 |
| Morgan Stanley | 12/29/17 | 134,077 |
|
USD | 119,614 |
| CAD | 149,999 |
| Morgan Stanley | 12/29/17 | 3,273 |
|
USD | 115,516 |
| CAD | 144,117 |
| Morgan Stanley | 12/29/17 | 3,738 |
|
USD | 1,143,159 |
| CAD | 1,444,667 |
| Morgan Stanley | 12/29/17 | 22,668 |
|
| | | | | | $ | 160,193 |
|
|
| | |
NOTES TO SCHEDULE OF INVESTMENTS |
CAD | - | Canadian Dollar |
USD | - | United States Dollar |
See Notes to Financial Statements.
|
|
Statement of Assets and Liabilities |
|
| | | |
OCTOBER 31, 2017 | |
Assets | |
Investment securities, at value (cost of $569,908,802) | $ | 702,659,011 |
|
Receivable for investments sold | 4,235,114 |
|
Receivable for capital shares sold | 310,708 |
|
Unrealized appreciation on forward foreign currency exchange contracts | 163,840 |
|
Dividends and interest receivable | 92,837 |
|
| 707,461,510 |
|
| |
Liabilities | |
Payable for investments purchased | 2,872,687 |
|
Payable for capital shares redeemed | 585,531 |
|
Unrealized depreciation on forward foreign currency exchange contracts | 3,647 |
|
Accrued management fees | 597,161 |
|
Distribution and service fees payable | 24,628 |
|
Accrued other expenses | 5,845 |
|
| 4,089,499 |
|
| |
Net Assets | $ | 703,372,011 |
|
| |
Net Assets Consist of: | |
Capital (par value and paid-in surplus) | $ | 571,575,013 |
|
Accumulated net investment loss | (3,919,079 | ) |
Undistributed net realized gain | 2,805,675 |
|
Net unrealized appreciation | 132,910,402 |
|
| $ | 703,372,011 |
|
|
| | | | |
| Net Assets | Shares Outstanding | Net Asset Value Per Share |
Investor Class, $0.01 Par Value | $361,029,413 | 21,624,068 |
| $16.70 |
I Class, $0.01 Par Value | $219,880,785 | 12,900,444 |
| $17.04 |
Y Class, $0.01 Par Value | $5,782 | 337 |
| $17.16 |
A Class, $0.01 Par Value | $80,654,378 | 4,982,328 |
| $16.19* |
C Class, $0.01 Par Value | $9,957,558 | 670,108 |
| $14.86 |
R Class, $0.01 Par Value | $3,760,937 | 237,087 |
| $15.86 |
R5 Class, $0.01 Par Value | $5,779 | 339 |
| $17.05 |
R6 Class, $0.01 Par Value | $28,077,379 | 1,636,856 |
| $17.15 |
*Maximum offering price $17.18 (net asset value divided by 0.9425).
See Notes to Financial Statements.
|
| | | |
YEAR ENDED OCTOBER 31, 2017 | |
Investment Income (Loss) | |
Income: | |
Dividends (net of foreign taxes withheld of $4,827) | $ | 2,889,075 |
|
Interest | 37,630 |
|
| 2,926,705 |
|
| |
Expenses: | |
Management fees | 6,799,101 |
|
Distribution and service fees: | |
A Class | 197,554 |
|
C Class | 94,984 |
|
R Class | 15,255 |
|
Directors' fees and expenses | 17,665 |
|
Other expenses | 15,481 |
|
| 7,140,040 |
|
| |
Net investment income (loss) | (4,213,335 | ) |
| |
Realized and Unrealized Gain (Loss) | |
Net realized gain (loss) on: | |
Investment transactions | 74,075,270 |
|
Forward foreign currency exchange contract transactions | (191,308 | ) |
Futures contract transactions | 474,122 |
|
Foreign currency translation transactions | (3,035 | ) |
| 74,355,049 |
|
| |
Change in net unrealized appreciation (depreciation) on: | |
Investments | 85,547,785 |
|
Forward foreign currency exchange contracts | 117,378 |
|
| 85,665,163 |
|
| |
Net realized and unrealized gain (loss) | 160,020,212 |
|
| |
Net Increase (Decrease) in Net Assets Resulting from Operations | $ | 155,806,877 |
|
See Notes to Financial Statements.
|
|
Statement of Changes in Net Assets |
|
| | | | | | |
YEARS ENDED OCTOBER 31, 2017 AND OCTOBER 31, 2016 |
Increase (Decrease) in Net Assets | October 31, 2017 | October 31, 2016 |
Operations | | |
Net investment income (loss) | $ | (4,213,335 | ) | $ | (4,169,510 | ) |
Net realized gain (loss) | 74,355,049 |
| 24,815,641 |
|
Change in net unrealized appreciation (depreciation) | 85,665,163 |
| (31,010,506 | ) |
Net increase (decrease) in net assets resulting from operations | 155,806,877 |
| (10,364,375 | ) |
| | |
Distributions to Shareholders | | |
From net realized gains: | | |
Investor Class | (5,748,134 | ) | — |
|
I Class | (7,465,031 | ) | — |
|
Y Class | (188 | ) | — |
|
A Class | (2,378,830 | ) | — |
|
C Class | (341,222 | ) | — |
|
R Class | (116,383 | ) | — |
|
R5 Class | (189 | ) | — |
|
R6 Class | (910,051 | ) | — |
|
Decrease in net assets from distributions | (16,960,028 | ) | — |
|
| | |
Capital Share Transactions | | |
Net increase (decrease) in net assets from capital share transactions (Note 5) | 37,784,767 |
| (30,017,121 | ) |
| | |
Redemption Fees | | |
Increase in net assets from redemption fees | 46,152 |
| 44,134 |
|
| | |
Net increase (decrease) in net assets | 176,677,768 |
| (40,337,362 | ) |
| | |
Net Assets | | |
Beginning of period | 526,694,243 |
| 567,031,605 |
|
End of period | $ | 703,372,011 |
| $ | 526,694,243 |
|
| | |
Accumulated net investment loss | $ | (3,919,079 | ) | $ | (3,590,012 | ) |
See Notes to Financial Statements.
|
|
Notes to Financial Statements |
OCTOBER 31, 2017
1. Organization
American Century Mutual Funds, Inc. (the corporation) is registered under the Investment Company Act of 1940, as amended (the 1940 Act), as an open-end management investment company and is organized as a Maryland corporation. Small Cap Growth Fund (the fund) is one fund in a series issued by the corporation. The fund’s investment objective is to seek long-term capital growth.
The fund offers the Investor Class, I Class (formerly Institutional Class), Y Class, A Class, C Class, R Class, R5 Class and R6 Class. The A Class may incur an initial sales charge. The A Class and C Class may be subject to a contingent deferred sales charge. Sale of the Y Class and R5 Class commenced on April 10, 2017.
2. Significant Accounting Policies
The following is a summary of significant accounting policies consistently followed by the fund in preparation of its financial statements. The fund is an investment company and follows accounting and reporting guidance in accordance with accounting principles generally accepted in the United States of America. This may require management to make certain estimates and assumptions at the date of the financial statements. Actual results could differ from these estimates. Management evaluated the impact of events or transactions occurring through the date the financial statements were issued that would merit recognition or disclosure.
Investment Valuations — The fund determines the fair value of its investments and computes its net asset value per share at the close of regular trading (usually 4 p.m. Eastern time) on the New York Stock Exchange (NYSE) on each day the NYSE is open. The Board of Directors has adopted valuation policies and procedures to guide the investment advisor in the fund’s investment valuation process and to provide methodologies for the oversight of the fund’s pricing function.
Equity securities that are listed or traded on a domestic securities exchange are valued at the last reported sales price or at the official closing price as provided by the exchange. Equity securities traded on foreign securities exchanges are generally valued at the closing price of such securities on the exchange where primarily traded or at the close of the NYSE, if that is earlier. If no last sales price is reported, or if local convention or regulation so provides, the mean of the latest bid and asked prices may be used. Securities traded over-the-counter are valued at the mean of the latest bid and asked prices, the last sales price, or the official closing price. Equity securities initially expressed in local currencies are translated into U.S. dollars at the mean of the appropriate currency exchange rate at the close of the NYSE as provided by an independent pricing service.
Open-end management investment companies are valued at the reported net asset value per share. Repurchase agreements are valued at cost, which approximates fair value. Exchange-traded futures contracts are valued at the settlement price as provided by the appropriate clearing corporation. Forward foreign currency exchange contracts are valued at the mean of the appropriate forward exchange rate at the close of the NYSE as provided by an independent pricing service.
If the fund determines that the market price for an investment is not readily available or the valuation methods mentioned above do not reflect an investment’s fair value, such investment is valued as determined in good faith by the Board of Directors or its delegate, in accordance with policies and procedures adopted by the Board of Directors. In its determination of fair value, the fund may review several factors including, but not limited to, market information regarding the specific investment or comparable investments and correlation with other investment types, futures indices or general market indicators. Circumstances that may cause the fund to use these procedures to value an investment include, but are not limited to: an investment has been declared in default or is distressed; trading in a security has been suspended during the trading day or a security is not actively trading on its principal exchange; prices received from a regular pricing source are deemed unreliable; or there is a foreign market holiday and no trading occurred.
The fund monitors for significant events occurring after the close of an investment’s primary exchange but before the fund’s net asset value per share is determined. Significant events may include, but are not limited to: corporate announcements and transactions; governmental action and political unrest that could impact a
specific investment or an investment sector; or armed conflicts, natural disasters and similar events that could affect investments in a specific country or region. The fund also monitors for significant fluctuations between domestic and foreign markets, as evidenced by the U.S. market or such other indicators that the Board of Directors, or its delegate, deems appropriate. If significant fluctuations in foreign markets are identified, the fund may apply a model-derived factor to the closing price of equity securities traded on foreign securities exchanges. The factor is based on observable market data as provided by an independent pricing service.
Security Transactions — Security transactions are accounted for as of the trade date. Net realized gains and losses are determined on the identified cost basis, which is also used for federal income tax purposes.
Investment Income — Dividend income less foreign taxes withheld, if any, is recorded as of the ex-dividend date. Distributions received on securities that represent a return of capital or long-term capital gain are recorded as a reduction of cost of investments and/or as a realized gain. The fund may estimate the components of distributions received that may be considered nontaxable distributions or long-term capital gain distributions for income tax purposes. Interest income is recorded on the accrual basis and includes accretion of discounts and amortization of premiums.
Foreign Currency Translations — All assets and liabilities initially expressed in foreign currencies are translated into U.S. dollars at prevailing exchange rates at period end. The fund may enter into spot foreign currency exchange contracts to facilitate transactions denominated in a foreign currency. Purchases and sales of investment securities, dividend and interest income, spot foreign currency exchange contracts, and expenses are translated at the rates of exchange prevailing on the respective dates of such transactions. Net realized and unrealized foreign currency exchange gains or losses related to investment securities are a component of net realized gain (loss) on investment transactions and change in net unrealized appreciation (depreciation) on investments, respectively.
Repurchase Agreements — The fund may enter into repurchase agreements with institutions that American Century Investment Management, Inc. (ACIM) (the investment advisor) has determined are creditworthy pursuant to criteria adopted by the Board of Directors. The fund requires that the collateral, represented by securities, received in a repurchase transaction be transferred to the custodian in a manner sufficient to enable the fund to obtain those securities in the event of a default under the repurchase agreement. ACIM monitors, on a daily basis, the securities transferred to ensure the value, including accrued interest, of the securities under each repurchase agreement is equal to or greater than amounts owed to the fund under each repurchase agreement.
Joint Trading Account — Pursuant to an Exemptive Order issued by the Securities and Exchange Commission, the fund, along with certain other funds in the American Century Investments family of funds, may transfer uninvested cash balances into a joint trading account. These balances are invested in one or more repurchase agreements that are collateralized by U.S. Treasury or Agency obligations.
Income Tax Status — It is the fund’s policy to distribute substantially all net investment income and net realized gains to shareholders and to otherwise qualify as a regulated investment company under provisions of the Internal Revenue Code. Accordingly, no provision has been made for income taxes. The fund files U.S. federal, state, local and non-U.S. tax returns as applicable. The fund's tax returns are subject to examination by the relevant taxing authority until expiration of the applicable statute of limitations, which is generally three years from the date of filing but can be longer in certain jurisdictions. At this time, management believes there are no uncertain tax positions which, based on their technical merit, would not be sustained upon examination and for which it is reasonably possible that the total amounts of unrecognized tax benefits will significantly change in the next twelve months.
Multiple Class — All shares of the fund represent an equal pro rata interest in the net assets of the class to which such shares belong, and have identical voting, dividend, liquidation and other rights and the same terms and conditions, except for class specific expenses and exclusive rights to vote on matters affecting only individual classes. Income, non-class specific expenses, and realized and unrealized capital gains and losses of the fund are allocated to each class of shares based on their relative net assets.
Distributions to Shareholders — Distributions from net investment income and net realized gains, if any, are generally declared and paid annually.
Redemption Fees — Prior to October 9, 2017, the fund may have imposed a 2.00% redemption fee on shares held less than 60 days. The fee was not applicable to all classes. The redemption fee was retained by the fund to help cover transaction costs that long-term investors may bear when the fund sells securities to meet investor redemptions.
Indemnifications — Under the corporation’s organizational documents, its officers and directors are indemnified against certain liabilities arising out of the performance of their duties to the fund. In addition, in the normal course of business, the fund enters into contracts that provide general indemnifications. The maximum exposure under these arrangements is unknown as this would involve future claims that may be made against a fund. The risk of material loss from such claims is considered by management to be remote.
3. Fees and Transactions with Related Parties
Certain officers and directors of the corporation are also officers and/or directors of American Century Companies, Inc. (ACC). The corporation’s investment advisor, ACIM, the corporation's distributor, American Century Investment Services, Inc. (ACIS), and the corporation’s transfer agent, American Century Services, LLC, are wholly owned, directly or indirectly, by ACC.
Management Fees — The corporation has entered into a management agreement with ACIM, under which ACIM provides the fund with investment advisory and management services in exchange for a single, unified management fee (the fee) per class. The agreement provides that all expenses of managing and operating the fund, except distribution and service fees, brokerage expenses, taxes, interest, fees and expenses of the independent directors (including legal counsel fees), and extraordinary expenses, will be paid by ACIM. The fee is computed and accrued daily based on each class's daily net assets and paid monthly in arrears. The difference in the fee among the classes is a result of their separate arrangements for non-Rule 12b-1 shareholder services. It is not the result of any difference in advisory or custodial fees or other expenses related to the management of the fund’s assets, which do not vary by class. The rate of the fee is determined by applying a fee rate calculation formula. This formula takes into account the fund’s assets as well as certain assets, if any, of other clients of the investment advisor outside the American Century Investments family of funds (such as subadvised funds and separate accounts) that use very similar investment teams and strategies (strategy assets).
The management fee schedule range and the effective annual management fee for each class for the period ended October 31, 2017 are as follows:
|
| | |
| Management Fee Schedule Range | Effective Annual Management Fee |
Investor Class | 1.100% to 1.500% | 1.35% |
I Class | 0.900% to 1.300% | 1.15% |
Y Class | 0.750% to 1.150%
| 1.00% |
A Class | 1.100% to 1.500% | 1.35% |
C Class | 1.100% to 1.500% | 1.35% |
R Class | 1.100% to 1.500% | 1.35% |
R5 Class | 0.900% to 1.300% | 1.15% |
R6 Class | 0.750% to 1.150% | 1.00% |
Distribution and Service Fees — The Board of Directors has adopted a separate Master Distribution and Individual Shareholder Services Plan for each of the A Class, C Class and R Class (collectively the plans), pursuant to Rule 12b-1 of the 1940 Act. The plans provide that the A Class will pay ACIS an annual distribution and service fee of 0.25%. The plans provide that the C Class will pay ACIS an annual distribution and service fee of 1.00%, of which 0.25% is paid for individual shareholder services and 0.75% is paid for distribution services. The plans provide that the R Class will pay ACIS an annual distribution and service fee of 0.50%. The fees are computed and accrued daily based on each class’s daily net assets and paid monthly in arrears. The fees are used to pay financial intermediaries for distribution and individual shareholder services. Fees incurred under the plans during the period ended October 31, 2017 are detailed in the Statement of Operations.
Directors' Fees and Expenses — The Board of Directors is responsible for overseeing the investment advisor’s management and operations of the fund. The directors receive detailed information about the fund and its investment advisor regularly throughout the year, and meet at least quarterly with management of the investment advisor to review reports about fund operations. The fund’s officers do not receive compensation from the fund.
Interfund Transactions — The fund may enter into security transactions with other American Century Investments funds and other client accounts of the investment advisor, in accordance with the 1940 Act rules and procedures adopted by the Board of Directors. The rules and procedures require, among other things,
that these transactions be effected at the independent current market price of the security. During the period, the interfund purchases and sales were $1,194,827 and $9,112,155, respectively. The effect of interfund transactions on the Statement of Operations was $2,357,436 in net realized gain (loss) on investment transactions.
4. Investment Transactions
Purchases and sales of investment securities, excluding short-term investments, for the period ended October 31, 2017 were $381,618,303 and $556,542,192, respectively.
5. Capital Share Transactions
Transactions in shares of the fund were as follows:
|
| | | | | | | | | | |
| Year ended October 31, 2017(1) | Year ended
October 31, 2016 |
| Shares | Amount | Shares | Amount |
Investor Class/Shares Authorized | 140,000,000 |
| | 160,000,000 |
| |
Sold | 3,941,253 |
| $ | 60,605,078 |
| 1,389,385 |
| $ | 17,147,388 |
|
Issued in connection with reorganization (Note 10) | 11,477,646 |
| 191,178,610 |
| — |
| — |
|
Issued in reinvestment of distributions | 330,936 |
| 5,457,134 |
| — |
| — |
|
Redeemed | (4,397,306 | ) | (68,805,286 | ) | (4,251,053 | ) | (52,453,638 | ) |
| 11,352,529 |
| 188,435,536 |
| (2,861,668 | ) | (35,306,250 | ) |
I Class/Shares Authorized | 200,000,000 |
| | 160,000,000 |
| |
Sold | 2,219,923 |
| 34,034,994 |
| 11,003,624 |
| 141,487,812 |
|
Issued in connection with reorganization (Note 10) | 17,006 |
| 289,155 |
| — |
| — |
|
Issued in reinvestment of distributions | 65,809 |
| 1,107,559 |
| — |
| — |
|
Redeemed | (9,790,924 | ) | (152,975,647 | ) | (9,909,515 | ) | (122,997,407 | ) |
| (7,488,186 | ) | (117,543,939 | ) | 1,094,109 |
| 18,490,405 |
|
Y Class/Shares Authorized | 50,000,000 |
| | N/A |
| |
Sold | 326 |
| 5,000 |
| | |
Issued in reinvestment of distributions | 11 |
| 188 |
| | |
| 337 |
| 5,188 |
| | |
A Class/Shares Authorized | 130,000,000 |
| | 110,000,000 |
| |
Sold | 443,075 |
| 6,494,852 |
| 758,373 |
| 9,466,335 |
|
Issued in connection with reorganization (Note 10) | 733,376 |
| 11,849,698 |
| — |
| — |
|
Issued in reinvestment of distributions | 141,539 |
| 2,263,214 |
| — |
| — |
|
Redeemed | (3,205,533 | ) | (47,623,536 | ) | (2,030,654 | ) | (24,473,819 | ) |
| (1,887,543 | ) | (27,015,772 | ) | (1,272,281 | ) | (15,007,484 | ) |
C Class/Shares Authorized | 20,000,000 |
| | 20,000,000 |
| |
Sold | 53,630 |
| 727,224 |
| 89,433 |
| 1,005,649 |
|
Issued in connection with reorganization (Note 10) | 60,216 |
| 893,045 |
| — |
| — |
|
Issued in reinvestment of distributions | 19,042 |
| 279,538 |
| — |
| — |
|
Redeemed | (244,413 | ) | (3,361,284 | ) | (270,189 | ) | (3,060,448 | ) |
| (111,525 | ) | (1,461,477 | ) | (180,756 | ) | (2,054,799 | ) |
| | | | |
|
| | | | | | | | | | |
| Year ended October 31, 2017(1) | Year ended
October 31, 2016 |
| Shares | Amount | Shares | Amount |
R Class/Shares Authorized | 20,000,000 |
| | 20,000,000 |
| |
Sold | 79,409 |
| $ | 1,160,623 |
| 129,087 |
| $ | 1,551,834 |
|
Issued in connection with reorganization (Note 10) | 23,868 |
| 377,916 |
| — |
| — |
|
Issued in reinvestment of distributions | 7,118 |
| 111,533 |
| — |
| — |
|
Redeemed | (88,784 | ) | (1,291,440 | ) | (83,700 | ) | (1,004,939 | ) |
| 21,611 |
| 358,632 |
| 45,387 |
| 546,895 |
|
R5 Class/Shares Authorized | 50,000,000 |
| | N/A |
| |
Sold | 328 |
| 5,000 |
| | |
Issued in reinvestment of distributions | 11 |
| 189 |
| | |
| 339 |
| 5,189 |
| | |
R6 Class/Shares Authorized | 50,000,000 |
| | 45,000,000 |
| |
Sold | 666,466 |
| 10,392,722 |
| 1,096,234 |
| 14,013,731 |
|
Issued in reinvestment of distributions | 53,722 |
| 910,051 |
| — |
| — |
|
Redeemed | (1,043,703 | ) | (16,301,363 | ) | (806,343 | ) | (10,699,619 | ) |
| (323,515 | ) | (4,998,590 | ) | 289,891 |
| 3,314,112 |
|
Net increase (decrease) | 1,564,047 |
| $ | 37,784,767 |
| (2,885,318 | ) | $ | (30,017,121 | ) |
| |
(1) | April 10, 2017 (commencement of sale) through October 31, 2017 for the Y Class and R5 Class. |
6. Fair Value Measurements
The fund’s investments valuation process is based on several considerations and may use multiple inputs to determine the fair value of the investments held by the fund. In conformity with accounting principles generally accepted in the United States of America, the inputs used to determine a valuation are classified into three broad levels.
• Level 1 valuation inputs consist of unadjusted quoted prices in an active market for identical investments.
• Level 2 valuation inputs consist of direct or indirect observable market data (including quoted prices for
comparable investments, evaluations of subsequent market events, interest rates, prepayment speeds,
credit risk, etc.). These inputs also consist of quoted prices for identical investments initially expressed in
local currencies that are adjusted through translation into U.S. dollars.
• Level 3 valuation inputs consist of unobservable data (including a fund’s own assumptions).
The level classification is based on the lowest level input that is significant to the fair valuation measurement. The valuation inputs are not necessarily an indication of the risks associated with investing in these securities or other financial instruments. There were no significant transfers between levels during the period.
The following is a summary of the level classifications as of period end. The Schedule of Investments provides additional information on the fund’s portfolio holdings.
|
| | | | | | | | |
| Level 1 | Level 2 | Level 3 |
Assets | | | |
Investment Securities | | | |
Common Stocks | $ | 687,677,609 |
| $ | 4,766,453 |
| — |
|
Temporary Cash Investments | 5,955 |
| 10,208,994 |
| — |
|
| $ | 687,683,564 |
| $ | 14,975,447 |
| — |
|
Other Financial Instruments | | | |
Forward Foreign Currency Exchange Contracts | — |
| $ | 163,840 |
| — |
|
| | | |
Liabilities | | | |
Other Financial Instruments | | | |
Forward Foreign Currency Exchange Contracts | — |
| $ | 3,647 |
| — |
|
7. Derivative Instruments
Foreign Currency Risk — The fund is subject to foreign currency exchange rate risk in the normal course of pursuing its investment objectives. The value of foreign investments held by a fund may be significantly affected by changes in foreign currency exchange rates. The dollar value of a foreign security generally decreases when the value of the dollar rises against the foreign currency in which the security is denominated and tends to increase when the value of the dollar declines against such foreign currency. A fund may enter into forward foreign currency exchange contracts to reduce a fund's exposure to foreign currency exchange rate fluctuations. The net U.S. dollar value of foreign currency underlying all contractual commitments held by a fund and the resulting unrealized appreciation or depreciation are determined daily. Realized gain or loss is recorded upon the termination of the contract. Net realized and unrealized gains or losses occurring during the holding period of forward foreign currency exchange contracts are a component of net realized gain (loss) on forward foreign currency exchange contract transactions and change in net unrealized appreciation (depreciation) on forward foreign currency exchange contracts, respectively. A fund bears the risk of an unfavorable change in the foreign currency exchange rate underlying the forward contract. Additionally, losses, up to the fair value, may arise if the counterparties do not perform under the contract terms. The fund's average U.S. dollar exposure to foreign currency risk derivative instruments held during the period was $4,142,908.
Equity Price Risk — The fund is subject to equity price risk in the normal course of pursuing its investment
objectives. A fund may enter into futures contracts based on an equity index in order to manage its exposure
to changes in market conditions. A fund may purchase futures contracts to gain exposure to increases in
market value or sell futures contracts to protect against a decline in market value. Upon entering into a futures
contract, a fund is required to deposit either cash or securities in an amount equal to a certain percentage of
the contract value (initial margin). Subsequent payments (variation margin) are made or received daily, in
cash, by a fund. The variation margin is equal to the daily change in the contract value and is recorded as
unrealized gains and losses. A fund recognizes a realized gain or loss when the contract is closed or expires.
Net realized and unrealized gains or losses occurring during the holding period of futures contracts are a
component of net realized gain (loss) on futures contract transactions and change in net unrealized
appreciation (depreciation) on futures contracts, respectively. One of the risks of entering into futures
contracts is the possibility that the change in value of the contract may not correlate with the changes in value
of the underlying securities. During the period, the fund participated in equity price risk derivative instruments
for temporary investment purposes.
Value of Derivative Instruments as of October 31, 2017
|
| | | | | | | | |
| Asset Derivatives | Liability Derivatives |
Type of Risk Exposure | Location on Statement of Assets and Liabilities | Value | Location on Statement of Assets and Liabilities | Value |
Foreign Currency Risk | Unrealized appreciation on forward foreign currency exchange contracts | $ | 163,840 |
| Unrealized depreciation on forward foreign currency exchange contracts | $ | 3,647 |
|
Effect of Derivative Instruments on the Statement of Operations for the Year Ended October 31, 2017
|
| | | | | | | | |
| Net Realized Gain (Loss) | Change in Net Unrealized Appreciation (Depreciation) |
Type of Risk Exposure | Location on Statement of Operations | Value | Location on Statement of Operations | Value |
Foreign Currency Risk | Net realized gain (loss) on forward foreign currency exchange contract transactions | $ | (191,308 | ) | Change in net unrealized appreciation (depreciation) on forward foreign currency exchange contracts | $ | 117,378 |
|
Equity Price Risk | Net realized gain (loss) on futures contract transactions | 474,122 |
| Change in net unrealized appreciation (depreciation) on futures contracts | — |
|
| | $ | 282,814 |
| | $ | 117,378 |
|
8. Risk Factors
The fund invests in common stocks of small companies. Because of this, the fund may be subject to greater risk and market fluctuations than a fund investing in larger, more established companies.
9. Federal Tax Information
The tax character of distributions paid during the years ended October 31, 2017 and October 31, 2016 were as follows:
|
| | | | | |
| 2017 | 2016 |
Distributions Paid From | |
Ordinary income | — |
| — |
|
Long-term capital gains | $ | 16,960,028 |
| — |
|
The book-basis character of distributions made during the year from net investment income or net realized gains may differ from their ultimate characterization for federal income tax purposes. These differences reflect the differing character of certain income items and net realized gains and losses for financial statement and tax purposes, and may result in reclassification among certain capital accounts on the financial statements.
As of period end, the federal tax cost of investments and the components of distributable earnings on a tax-basis were as follows:
|
| | | |
Federal tax cost of investments | $ | 571,191,287 |
|
Gross tax appreciation of investments | $ | 144,844,001 |
|
Gross tax depreciation of investments | (13,376,277 | ) |
Net tax appreciation (depreciation) | $ | 131,467,724 |
|
Undistributed ordinary income | — |
|
Accumulated long-term gains | $ | 4,087,805 |
|
Late-year ordinary loss deferral | $ | (3,758,531 | ) |
The difference between book-basis and tax-basis unrealized appreciation (depreciation) is attributable primarily to the tax deferral of losses on wash sales.
Loss deferrals represent certain qualified losses that the fund has elected to treat as having been incurred in the following fiscal year for federal income tax purposes.
10. Reorganization
On June 29, 2017, the Board of Directors approved an agreement and plan of reorganization (the reorganization), whereby the net assets of New Opportunities Fund, one fund in a series issued by the corporation, were transferred to Small Cap Growth Fund in exchange for shares of Small Cap Growth Fund. The purpose of the transaction was to combine two funds with substantially similar investment objectives and strategies. The financial statements and performance history of Small Cap Growth Fund survived after the reorganization. The reorganization was effective at the close of the NYSE on October 20, 2017.
The reorganization was accomplished by a tax-free exchange of shares. On October 20, 2017, New Opportunities Fund exchanged its shares for shares of Small Cap Growth Fund as follows:
|
| | | | | | |
Original Fund/Class | Shares Exchanged | | New Fund/Class | Shares Received |
New Opportunities Fund – Investor Class | 18,280,839 |
| | Small Cap Growth Fund – Investor Class | 11,477,646 |
|
New Opportunities Fund – I Class | 27,060 |
| | Small Cap Growth Fund – I Class | 17,006 |
|
New Opportunities Fund – A Class | 1,165,326 |
| | Small Cap Growth Fund – A Class | 733,376 |
|
New Opportunities Fund – C Class | 95,508 |
| | Small Cap Growth Fund – C Class | 60,216 |
|
New Opportunities Fund – R Class | 38,203 |
| | Small Cap Growth Fund – R Class | 23,868 |
|
The net assets of New Opportunities Fund and Small Cap Growth Fund immediately before the reorganization were $204,588,424 and $501,100,744, respectively. New Opportunities Fund's unrealized appreciation of $33,960,092 was combined with that of Small Cap Growth Fund. Immediately after the reorganization, the combined net assets were $705,689,168.
Assuming the reorganization had been completed on November 1, 2016, the beginning of the annual reporting period, the pro forma results of operations for the year ended October 31, 2017 are as follows:
|
| | | |
Net investment income (loss) | $ | (5,585,482 | ) |
Net realized and unrealized gain (loss) | 212,553,163 |
|
Net increase (decrease) in net assets resulting from operations | $ | 206,967,681 |
|
Because the combined investment portfolios have been managed as a single integrated portfolio since the reorganization was completed, it is not practicable to separate the amounts of revenue and earnings of New Opportunities Fund that have been included in the fund’s Statement of Operations since October 20, 2017.
|
| | | | | | | | | | | | | | | |
For a Share Outstanding Throughout the Years Ended October 31 (except as noted) | | | |
Per-Share Data | | | | | | | | | Ratios and Supplemental Data |
| | Income From Investment Operations: | Distributions From: | | | Ratio to Average Net Assets of: | | |
| Net Asset
Value,
Beginning
of Period | Net
Investment
Income
(Loss)(1) | Net
Realized
and
Unrealized
Gain (Loss) | Total From
Investment
Operations | Net Investment Income | Net Realized Gains | Total Distributions | Net Asset
Value,
End
of Period | Total
Return(2) | Operating
Expenses | Net
Investment
Income
(Loss) | Portfolio
Turnover
Rate | Net
Assets,
End of
Period
(in thousands) |
Investor Class | | | | | | | | | | | | |
2017 | $12.96 | (0.13) | 4.45 | 4.32 | — | (0.58) | (0.58) | $16.70 | 33.36% | 1.36% | (0.83)% | 70% |
| $361,029 |
|
2016 | $13.06 | (0.10) | —(3) | (0.10) | — | — | — | $12.96 | (0.77)% | 1.36% | (0.83)% | 130% |
| $133,140 |
|
2015 | $12.82 | (0.13) | 0.37 | 0.24 | — | — | — | $13.06 | 1.87% | 1.39% | (0.92)% | 100% |
| $171,490 |
|
2014 | $11.95 | (0.11) | 0.98 | 0.87 | — | — | — | $12.82 | 7.28% | 1.40% | (0.93)% | 75% |
| $170,316 |
|
2013 | $8.79 | (0.05) | 3.23 | 3.18 | (0.02) | — | (0.02) | $11.95 | 36.23% | 1.42% | (0.47)% | 80% |
| $199,294 |
|
I Class(4) | | | | | | | | | | | | |
2017 | $13.20 | (0.09) | 4.51 | 4.42 | — | (0.58) | (0.58) | $17.04 | 33.51% | 1.16% | (0.63)% | 70% |
| $219,881 |
|
2016 | $13.27 | (0.08) | 0.01 | (0.07) | — | — | — | $13.20 | (0.53)% | 1.16% | (0.63)% | 130% |
| $269,094 |
|
2015 | $13.01 | (0.10) | 0.36 | 0.26 | — | — | — | $13.27 | 2.00% | 1.17% | (0.70)% | 100% |
| $256,001 |
|
2014 | $12.10 | (0.09) | 1.00 | 0.91 | — | — | — | $13.01 | 7.52% | 1.20% | (0.73)% | 75% |
| $72,542 |
|
2013 | $8.88 | (0.02) | 3.26 | 3.24 | (0.02) | — | (0.02) | $12.10 | 36.61% | 1.22% | (0.27)% | 80% |
| $103,520 |
|
Y Class | | | | | | | | | | | | |
2017(5) | $15.34 | (0.06) | 2.46 | 2.40 | — | (0.58) | (0.58) | $17.16 | 15.67% | 1.01%(6) | (0.61)%(6) | 70%(7) |
| $6 |
|
|
| | | | | | | | | | | | | | | |
For a Share Outstanding Throughout the Years Ended October 31 (except as noted) | | | |
Per-Share Data | | | | | | | | | Ratios and Supplemental Data |
| | Income From Investment Operations: | Distributions From: | | | Ratio to Average Net Assets of: | | |
| Net Asset
Value,
Beginning
of Period | Net
Investment
Income
(Loss)(1) | Net
Realized
and
Unrealized
Gain (Loss) | Total From
Investment
Operations | Net Investment Income | Net Realized Gains | Total Distributions | Net Asset
Value,
End
of Period | Total
Return(2) | Operating
Expenses | Net
Investment
Income
(Loss) | Portfolio
Turnover
Rate | Net
Assets,
End of
Period
(in thousands) |
A Class | | | | | | | | | | | | |
2017 | $12.61 | (0.16) | 4.32 | 4.16 | — | (0.58) | (0.58) | $16.19 | 33.02% | 1.61% | (1.08)% | 70% |
| $80,654 |
|
2016 | $12.74 | (0.13) | —(3) | (0.13) | — | — | — | $12.61 | (1.02)% | 1.61% | (1.08)% | 130% |
| $86,651 |
|
2015 | $12.54 | (0.16) | 0.36 | 0.20 | — | — | — | $12.74 | 1.59% | 1.64% | (1.17)% | 100% |
| $103,713 |
|
2014 | $11.72 | (0.14) | 0.96 | 0.82 | — | — | — | $12.54 | 7.00% | 1.65% | (1.18)% | 75% |
| $100,051 |
|
2013 | $8.63 | (0.07) | 3.17 | 3.10 | (0.01) | — | (0.01) | $11.72 | 36.00% | 1.67% | (0.72)% | 80% |
| $114,080 |
|
C Class | | | | | | | | | | | | |
2017 | $11.70 | (0.25) | 3.99 | 3.74 | — | (0.58) | (0.58) | $14.86 | 31.99% | 2.36% | (1.83)% | 70% |
| $9,958 |
|
2016 | $11.91 | (0.21) | —(3) | (0.21) | — | — | — | $11.70 | (1.68)% | 2.36% | (1.83)% | 130% |
| $9,146 |
|
2015 | $11.81 | (0.24) | 0.34 | 0.10 | — | — | — | $11.91 | 0.76% | 2.39% | (1.92)% | 100% |
| $11,458 |
|
2014 | $11.12 | (0.22) | 0.91 | 0.69 | — | — | — | $11.81 | 6.21% | 2.40% | (1.93)% | 75% |
| $11,727 |
|
2013 | $8.24 | (0.14) | 3.02 | 2.88 | — | — | — | $11.12 | 34.95% | 2.42% | (1.47)% | 80% |
| $13,171 |
|
R Class | | | | | | | | | | | | |
2017 | $12.40 | (0.19) | 4.23 | 4.04 | — | (0.58) | (0.58) | $15.86 | 32.61% | 1.86% | (1.33)% | 70% |
| $3,761 |
|
2016 | $12.55 | (0.16) | 0.01 | (0.15) | — | — | — | $12.40 | (1.20)% | 1.86% | (1.33)% | 130% |
| $2,672 |
|
2015 | $12.39 | (0.19) | 0.35 | 0.16 | — | — | — | $12.55 | 1.29% | 1.89% | (1.42)% | 100% |
| $2,135 |
|
2014 | $11.61 | (0.17) | 0.95 | 0.78 | — | — | — | $12.39 | 6.72% | 1.90% | (1.43)% | 75% |
| $1,373 |
|
2013 | $8.56 | (0.10) | 3.16 | 3.06 | (0.01) | — | (0.01) | $11.61 | 35.73% | 1.92% | (0.97)% | 80% |
| $2,022 |
|
|
| | | | | | | | | | | | | | | |
For a Share Outstanding Throughout the Years Ended October 31 (except as noted) | | | |
Per-Share Data | | | | | | | | | Ratios and Supplemental Data |
| | Income From Investment Operations: | Distributions From: | | | Ratio to Average Net Assets of: | | |
| Net Asset
Value,
Beginning
of Period | Net
Investment
Income
(Loss)(1) | Net
Realized
and
Unrealized
Gain (Loss) | Total From
Investment
Operations | Net Investment Income | Net Realized Gains | Total Distributions | Net Asset
Value,
End
of Period | Total
Return(2) | Operating
Expenses | Net
Investment
Income
(Loss) | Portfolio
Turnover
Rate | Net
Assets,
End of
Period
(in thousands) |
R5 Class | | | | | | | | | | | | |
2017(5) | $15.26 | (0.07) | 2.44 | 2.37 | — | (0.58) | (0.58) | $17.05 | 15.56% | 1.16%(6) | (0.76)%(6) | 70%(7) |
| $6 |
|
R6 Class | | | | | | | | | | | | |
2017 | $13.26 | (0.08) | 4.55 | 4.47 | — | (0.58) | (0.58) | $17.15 | 33.74% | 1.01% | (0.48)% | 70% |
| $28,077 |
|
2016 | $13.31 | (0.06) | 0.01 | (0.05) | — | — | — | $13.26 | (0.38)% | 1.01% | (0.48)% | 130% |
| $25,992 |
|
2015 | $13.03 | (0.08) | 0.36 | 0.28 | — | — | — | $13.31 | 2.15% | 1.04% | (0.57)% | 100% |
| $22,235 |
|
2014 | $12.10 | (0.08) | 1.01 | 0.93 | — | — | — | $13.03 | 7.69% | 1.07% | (0.60)% | 75% |
| $18,447 |
|
2013(8) | $11.33 | (0.02) | 0.79 | 0.77 | — | — | — | $12.10 | 6.80% | 1.05%(6) | (0.55)%(6) | 80%(9) |
| $27 |
|
|
| | | | |
Notes to Financial Highlights | | |
| |
(1) | Computed using average shares outstanding throughout the period. |
| |
(2) | Total returns are calculated based on the net asset value of the last business day and do not reflect applicable sales charges, if any. Total returns for periods less than one year are not annualized. |
| |
(3) | Amount is less than $0.005. |
| |
(4) | Prior to April 10, 2017, the I Class was referred to as the Institutional Class. |
| |
(5) | April 10, 2017 (commencement of sale) through October 31, 2017. |
| |
(7) | Portfolio turnover is calculated at the fund level. Percentage indicated was calculated for the year ended October 31, 2017. |
| |
(8) | July 26, 2013 (commencement of sale) through October 31, 2013. |
| |
(9) | Portfolio turnover is calculated at the fund level. Percentage indicated was calculated for the year ended October 31, 2013. |
See Notes to Financial Statements.
|
|
Report of Independent Registered Public Accounting Firm |
To the Board of Directors and Shareholders of American Century Mutual Funds, Inc.:
We have audited the accompanying statement of assets and liabilities, including the schedule of investments, of Small Cap Growth Fund (the “Fund”), one of the funds constituting American Century Mutual Funds, Inc., as of October 31, 2017, and the related statement of operations for the year then ended, the statements of changes in net assets for each of the two years in the period then ended, and the financial highlights for each of the periods presented. These financial statements and financial highlights are the responsibility of the Fund’s management. Our responsibility is to express an opinion on these financial statements and financial highlights based on our audits.
We conducted our audits in accordance with the standards of the Public Company Accounting Oversight Board (United States). Those standards require that we plan and perform the audit to obtain reasonable assurance about whether the financial statements and financial highlights are free of material misstatement. The Fund is not required to have, nor were we engaged to perform, an audit of its internal control over financial reporting. Our audits included consideration of internal control over financial reporting as a basis for designing audit procedures that are appropriate in the circumstances, but not for the purpose of expressing an opinion on the effectiveness of the Fund’s internal control over financial reporting. Accordingly, we express no such opinion. An audit also includes examining, on a test basis, evidence supporting the amounts and disclosures in the financial statements, assessing the accounting principles used and significant estimates made by management, as well as evaluating the overall financial statement presentation. Our procedures included confirmation of securities owned as of October 31, 2017, by correspondence with the custodian and brokers; when replies were not received from brokers, we performed other auditing procedures. We believe that our audits provide a reasonable basis for our opinion.
In our opinion, the financial statements and financial highlights referred to above present fairly, in all material respects, the financial position of Small Cap Growth Fund of American Century Mutual Funds, Inc. as of October 31, 2017, the results of its operations for the year then ended, the changes in its net assets for each of the two years in the period then ended, and the financial highlights for each of the periods presented, in conformity with accounting principles generally accepted in the United States of America.
DELOITTE & TOUCHE LLP
Kansas City, Missouri
December 15, 2017
The Board of Directors
The individuals listed below serve as directors of the funds. Each director will continue to serve in this capacity until death, retirement, resignation or removal from office. The board has adopted a mandatory retirement age for directors who are not “interested persons,” as that term is defined in the Investment Company Act (independent directors). Independent directors shall retire by December 31 of the year in which they reach their 75th birthday.
Mr. Thomas is an “interested person” because he currently serves as President and Chief Executive Officer of American Century Companies, Inc. (ACC), the parent company of American Century Investment Management, Inc. (ACIM or the advisor). The other directors (more than three-fourths of the total number) are independent. They are not employees, directors or officers of, and have no financial interest in, ACC or any of its wholly owned, direct or indirect, subsidiaries, including ACIM, American Century Investment Services, Inc. (ACIS) and American Century Services, LLC (ACS), and they do not have any other affiliations, positions or relationships that would cause them to be considered “interested persons” under the Investment Company Act. The directors serve in this capacity for seven (in the case of Mr. Thomas, 15) registered investment companies in the American Century Investments family of funds.
The following table presents additional information about the directors. The mailing address for each director is 4500 Main Street, Kansas City, Missouri 64111.
|
| | | | | |
Name
(Year of Birth) | Position(s) Held with Funds | Length of Time Served | Principal Occupation(s) During Past 5 Years | Number of American Century Portfolios Overseen by Director | Other Directorships Held During Past 5 Years |
Independent Directors |
|
|
Thomas W. Bunn (1953) | Director | Since 2017 | Retired | 69 | SquareTwo Financial; Barings (formerly Babson Capital Funds Trust) (2013 to 2016) |
Barry Fink
(1955) | Director | Since 2012 (independent since 2016) | Retired; Executive Vice President, ACC (2007 to 2013); President, ACS (2007 to 2013); Chief Operating Officer, ACC (2007 to 2012) | 69 | None |
Andrea C. Hall
(1945) | Director | Since 1997 | Retired | 69 | None |
Jan M. Lewis
(1957) | Director | Since 2011 | Retired; President and Chief Executive Officer, Catholic Charities of Northeast Kansas (human services organization) (2006 to 2013) | 69 | None |
James A. Olson
(1942) | Director and Chairman of the Board | Since 2007 (Chairman since 2014) | Member, Plaza Belmont LLC (private equity fund manager) (1999 to present) | 69 | Saia, Inc. (2002 to 2012) and EPR Properties (2003 to 2013) |
|
| | | | | |
Name
(Year of Birth) | Position(s) Held with Funds | Length of Time Served | Principal Occupation(s) During Past 5 Years | Number of American Century Portfolios Overseen by Director | Other Directorships Held During Past 5 Years |
Independent Directors |
|
|
M. Jeannine Strandjord
(1945) | Director | Since 1994 | Retired | 69 | Euronet Worldwide Inc.; MGP Ingredients, Inc.; and DST Systems Inc. (1996 to 2012) |
John R. Whitten
(1946) | Director | Since 2008 | Retired | 69 | Rudolph Technologies, Inc. |
Stephen E. Yates
(1948) | Director | Since 2012 | Retired | 69 | None |
Interested Director |
|
|
Jonathan S. Thomas
(1963) | Director and President | Since 2007 | President and Chief Executive Officer, ACC (2007 to present). Also serves as Chief Executive Officer, ACS; Executive Vice President, ACIM; Director, ACC, ACIM and other ACC subsidiaries | 114 | BioMed Valley Discoveries, Inc. |
The Statement of Additional Information has additional information about the fund's directors and is available without charge, upon request, by calling 1-800-345-2021.
Officers
The following table presents certain information about the executive officers of the funds. Each officer serves as an officer for each of the 15 investment companies in the American Century family of funds, unless otherwise noted. No officer is compensated for his or her service as an officer of the funds. The listed officers are interested persons of the funds and are appointed or re-appointed on an annual basis. The mailing address for each officer listed below is 4500 Main Street, Kansas City, Missouri 64111.
|
| | |
Name
(Year of Birth) | Offices with the Funds | Principal Occupation(s) During the Past Five Years |
Jonathan S. Thomas
(1963) | Director and President since 2007 | President and Chief Executive Officer, ACC (2007 to present). Also serves as Chief Executive Officer, ACS; Executive Vice President, ACIM; Director, ACC, ACIM and other ACC subsidiaries |
Amy D. Shelton
(1964) | Chief Compliance Officer and Vice President since 2014 | Chief Compliance Officer, American Century funds, (2014 to present); Chief Compliance Officer, ACIM (2014 to present); Chief Compliance Officer, ACIS (2009 to present); Vice President, Client Interactions and Marketing, ACIS (2013 to 2014); Director, Client Interactions and Marketing, ACIS (2007 to 2013). Also serves as Vice President, ACIS |
Charles A. Etherington
(1957) | General Counsel since 2007 and Senior Vice President since 2006 | Attorney, ACC (1994 to present); Vice President, ACC (2005 to present); General Counsel, ACC (2007 to present). Also serves as General Counsel, ACIM, ACS, ACIS and other ACC subsidiaries; and Senior Vice President, ACIM and ACS |
C. Jean Wade
(1964) | Vice President,Treasurer and Chief Financial Officer since 2012 | Vice President, ACS (2000 to present) |
Robert J. Leach
(1966) | Vice President since 2006 and Assistant Treasurer since 2012 | Vice President, ACS (2000 to present) |
David H. Reinmiller
(1963) | Vice President since 2000 | Attorney, ACC (1994 to present); Associate General Counsel, ACC (2001 to present). Also serves as Vice President, ACIM and ACS |
Ward D. Stauffer
(1960) | Secretary since 2005 | Attorney, ACC (2003 to present) |
|
|
Approval of Management Agreement |
At a meeting held on June 29, 2017, the Fund’s Board of Directors (the "Board") unanimously approved the renewal of the management agreement pursuant to which American Century Investment Management, Inc. (the “Advisor”) acts as the investment advisor for the Fund. Under Section 15(c) of the Investment Company Act, contracts for investment advisory services are required to be reviewed, evaluated, and approved by a majority of a fund’s directors (the “Directors”), including a majority of the independent Directors, each year.
Prior to its consideration of the renewal of the management agreement, the Directors requested and reviewed extensive data and information compiled by the Advisor and certain independent providers of evaluation data concerning the Fund and the services provided to the Fund by the Advisor. This review was in addition to the oversight and evaluation undertaken by the Board and its committees on a continual basis and the information received was supplemental to the extensive information that the Board and its committees receive and consider throughout the year.
In connection with its consideration of the renewal of the management agreement, the Board’s review and evaluation of the services provided by the Advisor included, but was not limited to, the following:
| |
• | the nature, extent, and quality of investment management, shareholder services, and other services provided and to be provided to the Fund; |
| |
• | the wide range of other programs and services provided and to be provided to the Fund and its shareholders on a routine and non-routine basis; |
| |
• | the investment performance of the Fund, including data comparing the Fund's performance to appropriate benchmarks and/or a peer group of other mutual funds with similar investment objectives and strategies; |
| |
• | the cost of owning the Fund compared to the cost of owning similar funds; |
| |
• | the compliance policies, procedures, and regulatory experience of the Advisor and the Fund's service providers; |
| |
• | financial data showing the cost of services provided to the Fund, the profitability of the Fund to the Advisor, and the overall profitability of the Advisor; |
| |
• | strategic plans of the Advisor |
| |
• | possible economies of scale associated with the Advisor’s management of the Fund and other accounts under its management; |
| |
• | data comparing services provided and charges to the Advisor's other investment management clients; |
| |
• | acquired fund fees and expenses; |
| |
• | payments and practices by the Fund and the Advisor regarding financial intermediaries, the nature of services provided by intermediaries, and the terms of share classes utilized; and |
| |
• | any collateral benefits derived by the Advisor from the management of the Fund. |
The Directors held three in-person meetings and one telephonic meeting to review and discuss the information provided. The independent Directors also reviewed responses to supplemental information requests and held active discussions with the Advisor regarding the renewal of the management agreement. The independent Directors had the benefit of the advice of their independent counsel throughout the process.
Factors Considered
The Directors considered all of the information provided by the Advisor, the independent data providers, and independent counsel in connection with the approval. They determined that the
information was sufficient for them to evaluate the management agreement for the Fund. In connection with their review, the Directors did not identify any single factor as being all-important or controlling, and each Director may have attributed different levels of importance to different factors. In deciding to renew the management agreement, the Board based its decision on a number of factors, including without limitation the following:
Nature, Extent and Quality of Services - Generally. Under the management agreement, the Advisor is responsible for providing or arranging for all services necessary for the operation of the Fund. The Board noted that the Advisor provides or arranges at its own expense a wide variety of services including without limitation the following:
| |
• | portfolio research and security selection |
| |
• | daily valuation of the Fund’s portfolio |
| |
• | shareholder servicing and transfer agency, including shareholder confirmations, recordkeeping, and communications |
| |
• | legal services (except the independent Directors’ counsel) |
| |
• | regulatory and portfolio compliance |
| |
• | marketing and distribution (except amounts paid by the Fund under Rule 12b-1 plans) |
The Board noted that many of these services have expanded over time in terms of both quantity and complexity in response to shareholder demands, competition in the industry, changing distribution channels, and the changing regulatory environment. The Board noted specifically the resources the Advisor has committed during the year to compliance with the Department of Labor fiduciary rule and share class modernization.
Investment Management Services. The nature of the investment management services provided to the Fund is quite complex and allows Fund shareholders access to professional money management, instant diversification of their investments within an asset class, the opportunity to easily diversify among asset classes by investing in or exchanging among various American Century Investments funds, and liquidity. In evaluating investment performance, the Board expects the Advisor to manage the Fund in accordance with its investment objectives and approved strategies. Further, the Directors recognize that the Advisor has an obligation to monitor trading activities, and in particular to seek the best execution of fund trades, and to evaluate the use of and payment for research. In providing these services, the Advisor utilizes teams of investment professionals (portfolio managers, analysts, research assistants, and securities traders) who require extensive information technology, research, training, compliance, and other systems to conduct their business. The Board, directly and through its Fund Performance Review Committee, provides oversight of the investment performance process. It regularly reviews investment performance information for the Fund, together with comparative information for appropriate benchmarks and/or peer groups of similarly-managed funds, over different time horizons. The Directors also review detailed performance information provided by the Advisor during the management agreement renewal process. If performance concerns are identified, the Fund receives special reviews until performance improves, during which the Board receives a report from the Advisor regarding the reasons for such results (e.g., market conditions, security selection) and any efforts being undertaken to improve performance. The Fund’s performance was above its benchmark for the one-, three-, five-, and ten-year periods reviewed by the Board. The Board found the investment management services provided by the Advisor to the Fund to be satisfactory and consistent with the management agreement.
Shareholder and Other Services. Under the management agreement, the Advisor provides the Fund with a comprehensive package of transfer agency, shareholder, and other services. The Board, directly and through various committees of the Board, regularly reviews reports and
evaluations of such services at its regular meetings. These reports include, but are not limited to, information regarding the operational efficiency and accuracy of the shareholder and transfer agency services provided, staffing levels, shareholder satisfaction (as measured by external as well as internal sources), technology support, new products and services offered to Fund shareholders, securities trading activities, portfolio valuation services, auditing services, and legal and operational compliance activities. Certain aspects of shareholder and transfer agency service level efficiency and the quality of securities trading activities are measured by independent third party providers and are presented in comparison to other fund groups not managed by the Advisor. The Board found the services provided by the Advisor to the Fund under the management agreement to be competitive and of high quality.
Costs of Services and Profitability. The Advisor provides detailed information concerning its cost of providing various services to the Fund, its profitability in managing the Fund (pre- and post-distribution), its overall profitability, and its financial condition. The Directors have reviewed with the Advisor the methodology used to prepare this financial information. This information is considered in evaluating the Advisor’s financial condition, its ability to continue to provide services under the management agreement, and the reasonableness of the current management fee. The Board concluded that the Advisor’s profits were reasonable in light of the services provided to the Fund.
Ethics. The Board generally considers the Advisor’s commitment to providing quality services to shareholders and to conducting its business ethically. They noted that the Advisor’s practices generally meet or exceed industry best practices.
Economies of Scale. The Board also reviewed information provided by the Advisor regarding the possible existence of economies of scale in connection with the management of the Fund. The Board concluded that economies of scale are difficult to measure and predict with precision, especially on a fund-by-fund basis. The Board concluded that the Advisor is appropriately sharing economies of scale through its competitive fee structure, offering competitive fees from fund inception, and through reinvestment in its business to provide shareholders additional content and services. The Board also noted that economies of scale are shared with the Fund and its shareholders through management fee breakpoints that serve to reduce the effective management fee as the assets of the Fund grow.
Comparison to Other Funds’ Fees. The management agreement provides that the Fund pays the Advisor a single, all-inclusive (or unified) management fee for providing all services necessary for the management and operation of the Fund, other than brokerage expenses, expenses attributable to short sales, taxes, interest, extraordinary expenses, and the fees and expenses of the Fund’s independent Directors (including their independent legal counsel) and expenses incurred in connection with the provision of shareholder services and distribution services under a plan adopted pursuant to Rule 12b-1 under the 1940 Act. Under the unified fee structure, the Advisor is responsible for providing all investment advisory, custody, audit, administrative, compliance, recordkeeping, marketing and shareholder services, or arranging and supervising third parties to provide such services. By contrast, most other funds are charged a variety of fees, including an investment advisory fee, a transfer agency fee, an administrative fee, distribution charges, and other expenses. Other than their investment advisory fees and any applicable Rule 12b-1 distribution fees, all other components of the total fees charged by these other funds may be increased without shareholder approval. The Board believes the unified fee structure is a benefit to Fund shareholders because it clearly discloses to shareholders the cost of owning Fund shares, and, since the unified fee cannot be increased without a vote of Fund shareholders, it shifts to the Advisor the risk of increased costs of operating the Fund and provides a direct incentive to minimize administrative inefficiencies. Part of the Board’s analysis of fee levels involves reviewing certain evaluative data compiled by an independent provider comparing the Fund’s unified fee to the total expense ratios of its peers. The unified fee charged to shareholders of the Fund was above the median of the total expense ratios of the Fund’s peer expense universe and was within the range of its peer expense group. The Board discussed with the Advisor the factors that impacted the level of the fee in relation to its peers and accepted the Advisor's explanation of such
factors. The Board concluded that the management fee paid by the Fund to the Advisor under the management agreement is reasonable in light of the services provided to the Fund.
Comparison to Fees and Services Provided to Other Clients of the Advisor. The Directors also requested and received information from the Advisor concerning the nature of the services, fees, costs, and profitability of its advisory services to advisory clients other than the Fund. They observed that these varying types of client accounts require different services and involve different regulatory and entrepreneurial risks than the management of the Fund. The Board analyzed this information and concluded that the fees charged and services provided to the Fund were reasonable by comparison.
Payments to Intermediaries. The Directors also requested and received a description of payments made to intermediaries by the Fund and the Advisor and services provided in response thereto. These payments include various payments made by the Fund or the Advisor to different types of intermediaries and recordkeepers for distribution and service activities provided for the Fund. The Board reviewed such information and received representations from the Advisor that all such payments by the Fund were made pursuant to the Fund's Rule 12b-1 Plan and that all such payments by the Advisor were made from the Advisor's resources and reasonable profits. The Board found the payments to be reasonable in scope and purpose.
Collateral or “Fall-Out” Benefits Derived by the Advisor. The Board considered the existence of collateral benefits the Advisor may receive as a result of its relationship with the Fund. They concluded that the Advisor’s primary business is managing mutual funds and it generally does not use fund or shareholder information to generate profits in other lines of business, and therefore does not derive any significant collateral benefits from them. The Board noted that additional assets from other clients may offer the Advisor some benefit from increased leverage with service providers and counterparties. Additionally, the Advisor receives proprietary research from broker-dealers that execute fund portfolio transactions, which the Board concluded is likely to benefit other clients of the Advisor, as well as Fund shareholders. The Board also determined that the Advisor is able to provide investment management services to certain clients other than the Fund, at least in part, due to its existing infrastructure built to serve the fund complex. The Board concluded that appropriate allocation methodologies had been employed to assign resources and the cost of those resources to these other clients and, where expressly provided, these other client assets may be included with the assets of the Fund to determine breakpoints in the management fee schedule.
Existing Relationship. The Board also considered whether there was any reason for not continuing the existing arrangement with the Advisor. In this regard, the Board was mindful of the potential disruptions of the Fund’s operations and various risks, uncertainties, and other effects that could occur as a result of a decision not to continue such relationship. In particular, the Board recognized that most shareholders have invested in the Fund on the strength of the Advisor’s industry standing and reputation and in the expectation that the Advisor will have a continuing role in providing advisory services to the Fund.
Conclusion of the Directors. As a result of this process, the Board, including all of the independent Directors, taking into account all of the factors discussed above and the information provided by the Advisor and others in connection with its review and throughout the year, determined that the management fee is fair and reasonable in light of the services provided and that the investment management agreement between the Fund and the Advisor should be renewed.
A special meeting of shareholders was held on October 18, 2017, to vote on the following proposal. The proposal received the required votes and was adopted. A summary of voting results is listed below.
To elect four directors to the Board of Directors of American Century Mutual Funds, Inc.:
|
| | | | | | | |
| Affirmative |
| Withhold |
Thomas W. Bunn | $ | 19,547,896,641 |
|
| $ | 402,531,816 |
|
Barry Fink | $ | 19,543,961,253 |
|
| $ | 406,467,204 |
|
Jan M. Lewis | $ | 19,556,221,886 |
|
| $ | 394,206,571 |
|
Stephen E. Yates | $ | 19,543,817,152 |
|
| $ | 406,611,305 |
|
The other directors whose term of office continued after the meeting include Jonathan S. Thomas, Andrea C. Hall, James A. Olson, M. Jeannine Strandjord, and John R. Whitten.
Retirement Account Information
As required by law, distributions you receive from certain retirement accounts are subject to federal income tax withholding, unless you elect not to have withholding apply*. Tax will be withheld on the total amount withdrawn even though you may be receiving amounts that are not subject to withholding, such as nondeductible contributions. In such case, excess amounts of withholding could occur. You may adjust your withholding election so that a greater or lesser amount will be withheld.
If you don’t want us to withhold on this amount, you must notify us to not withhold the federal income tax. You may notify us in writing or in certain situations by telephone or through other electronic means. For systematic withdrawals, your withholding election will remain in effect until revoked or changed by filing a new election. You have the right to revoke your election at any time and change your withholding percentage for future distributions.
Remember, even if you elect not to have income tax withheld, you are liable for paying income tax on the taxable portion of your withdrawal. If you elect not to have income tax withheld or you don’t have enough income tax withheld, you may be responsible for payment of estimated tax. You may incur penalties under the estimated tax rules if your withholding and estimated tax payments are not sufficient. You can reduce or defer the income tax on a distribution by directly or indirectly rolling such distribution over to another IRA or eligible plan. You should consult your tax advisor for additional information.
State tax will be withheld if, at the time of your distribution, your address is within one of the mandatory withholding states and you have federal income tax withheld (or as otherwise required by state law). State taxes will be withheld from your distribution in accordance with the respective state rules.
*Some 403(b), 457 and qualified retirement plan distributions may be subject to 20% mandatory withholding, as they are subject to special tax and withholding rules. Your plan administrator or plan sponsor is required to provide you with a special tax notice explaining those rules at the time you request a distribution. If applicable, federal and/or state taxes may be withheld from your distribution amount.
Proxy Voting Policies
A description of the policies that the fund's investment advisor uses in exercising the voting rights associated with the securities purchased and/or held by the fund is available without charge, upon request, by calling 1-800-345-2021. It is also available on the "About Us" page of American Century Investments’ website at americancentury.com and on the Securities and Exchange Commission’s website at sec.gov. Information regarding how the investment advisor voted proxies relating to portfolio securities during the most recent 12-month period ended June 30 is available on the "About Us" page at americancentury.com. It is also available at sec.gov.
Quarterly Portfolio Disclosure
The fund files its complete schedule of portfolio holdings with the Securities and Exchange Commission (SEC) for the first and third quarters of each fiscal year on Form N-Q. The fund’s Forms N-Q are available on the SEC’s website at sec.gov, and may be reviewed and copied at the SEC’s Public Reference Room in Washington, DC. Information on the operation of the Public Reference Room may be obtained by calling 1-800-SEC-0330. The fund also makes its complete schedule of portfolio holdings for the most recent quarter of its fiscal year available on its website at americancentury.com and, upon request, by calling 1-800-345-2021.
Other Tax Information
The following information is provided pursuant to provisions of the Internal Revenue Code.
The fund hereby designates $16,960,028, or up to the maximum amount allowable, as long-term capital gain distributions (20% rate gain distributions) for the fiscal year ended October 31, 2017.
|
| | |
| |
| | |
Contact Us | americancentury.com | |
Automated Information Line | 1-800-345-8765 | |
Investor Services Representative | 1-800-345-2021 or 816-531-5575 | |
Investors Using Advisors | 1-800-378-9878 | |
Business, Not-For-Profit, Employer-Sponsored Retirement Plans | 1-800-345-3533 | |
Banks and Trust Companies, Broker-Dealers, Financial Professionals, Insurance Companies | 1-800-345-6488 | |
Telecommunications Relay Service for the Deaf | 711 | |
| | |
American Century Mutual Funds, Inc. | |
| | |
Investment Advisor: American Century Investment Management, Inc. Kansas City, Missouri | |
| | |
This report and the statements it contains are submitted for the general information of our shareholders. The report is not authorized for distribution to prospective investors unless preceded or accompanied by an effective prospectus. | |
| | |
©2017 American Century Proprietary Holdings, Inc. All rights reserved.
CL-ANN-90978 1712 | |
|
| |
| |
| Annual Report |
| |
| October 31, 2017 |
| |
| Sustainable Equity Fund |
|
| |
President's Letter | 2 |
Performance | 3 |
Portfolio Commentary | |
Fund Characteristics | |
Shareholder Fee Example | |
Schedule of Investments | |
Statement of Assets and Liabilities | |
Statement of Operations | |
Statement of Changes in Net Assets | |
Notes to Financial Statements | |
Financial Highlights | |
Report of Independent Registered Public Accounting Firm | |
Management | |
Approval of Management Agreement | |
Proxy Voting Results | |
Additional Information | |
Any opinions expressed in this report reflect those of the author as of the date of the report, and do not necessarily represent the opinions of American Century Investments® or any other person in the American Century Investments organization. Any such opinions are subject to change at any time based upon market or other conditions and American Century Investments disclaims any responsibility to update such opinions. These opinions may not be relied upon as investment advice and, because investment decisions made by American Century Investments funds are based on numerous factors, may not be relied upon as an indication of trading intent on behalf of any American Century Investments fund. Security examples are used for representational purposes only and are not intended as recommendations to purchase or sell securities. Performance information for comparative indices and securities is provided to American Century Investments by third party vendors. To the best of American Century Investments’ knowledge, such information is accurate at the time of printing.
Jonathan Thomas
Dear Investor:
Thank you for reviewing this annual report for the period ended October 31, 2017. Annual reports help convey important information about fund returns, including market factors that affected performance during the reporting period. For additional, updated investment and market insights, we encourage you to visit our website, americancentury.com.
‘Risk-On’ Sentiment Sparked Strong Gains Among Stocks
U.S. stocks delivered robust double-digit gains for the reporting period. The “risk-on” rally began early in the period, following Donald Trump’s election victory in November 2016. Investor expectations for President Trump’s administration to usher in pro-growth policies and reforms drove stock prices higher. In addition, healthy corporate earnings growth and improving gross domestic product (GDP) and other economic data provided additional support for stocks. Against this backdrop, the S&P 500 Index reached several milestone levels during the period and returned 23.63%. In terms of equity styles, riskier and economically sensitive stocks generally remained in favor. For example, small-cap stocks generally outperformed their mid- and large-cap peers, while growth stocks broadly outperformed their value counterparts across the capitalization spectrum. Real estate investment trusts (REITs) advanced, but global property stocks significantly underperformed the broader stock market as interest rates increased, most notably in the U.S., where the Federal Reserve (Fed) raised rates three times during the period.
As stocks soared in the post-election environment, global bonds sold off sharply. President Trump’s policy agenda fueled inflation fears that sent global bond yields sharply higher in late 2016. However, broad bond market performance generally recovered beginning in early 2017, advancing on subdued inflation and continued central bank accommodation to post modest gains for the entire reporting period. Investor preferences for risk also extended to the global fixed-income market, where high-yield corporate and emerging markets bonds were top performers.
As Congress considers tax cuts and other pro-growth reforms and the Fed and other central banks pursue policy normalization, investors likely will face new opportunities and challenges in the months ahead. We continue to believe in a disciplined, diversified, and risk-aware approach, using professionally managed portfolios in pursuit of investment goals. We appreciate your continued trust in us.
Sincerely,
Jonathan Thomas
President and Chief Executive Officer
American Century Investments
|
| | | | | | |
Total Returns as of October 31, 2017 |
| | | Average Annual Returns | |
| Ticker Symbol | 1 year | 5 years | 10 years | Since Inception | Inception Date |
A Class | AFDAX | | | | | 11/30/04 |
No sales charge | | 26.34% | 13.99% | 6.93% | — | |
With sales charge | | 19.09% | 12.65% | 6.30% | — | |
S&P 500 Index | — | 23.63% | 15.17% | 7.51% | — | — |
Investor Class | AFDIX | 26.61% | 14.27% | 7.19% | — | 7/29/05 |
I Class | AFEIX | 26.88% | 14.49% | 7.41% | — | 7/29/05 |
Y Class | AFYDX | — | — | — | 14.40% | 4/10/17 |
C Class | AFDCX | 25.40% | 13.13% | 6.13% | — | 11/30/04 |
R Class | AFDRX | 26.03% | 13.71% | 6.65% | — | 7/29/05 |
R5 Class | AFDGX | — | — | — | 14.27% | 4/10/17 |
Average annual returns since inception are presented when ten years of performance history is not available.
Prior to April 10, 2017, the I Class was referred to as the Institutional Class.
Sales charges include initial sales charges and contingent deferred sales charges (CDSCs), as applicable. A Class shares have a 5.75% maximum initial sales charge and may be subject to a maximum CDSC of 1.00%. C Class shares redeemed within 12 months of purchase are subject to a maximum CDSC of 1.00%. The SEC requires that mutual funds provide performance information net of maximum sales charges in all cases where charges could be applied.
Data presented reflect past performance. Past performance is no guarantee of future results. Current performance may be higher or lower than the performance shown. Total returns for periods less than one year are not annualized. Investment return and principal value will fluctuate, and redemption value may be more or less than original cost. Data assumes reinvestment of dividends and capital gains, and none of the charts reflect the deduction of taxes that a shareholder would pay on fund distributions or the redemption of fund shares. To obtain performance data current to the most recent month end, please call 1-800-345-2021 or visit americancentury.com. For additional information about the fund, please consult the prospectus.
|
|
Growth of $10,000 Over 10 Years |
$10,000 investment made October 31, 2007 |
Performance for other share classes will vary due to differences in fee structure. |
|
| |
Value on October 31, 2017 |
| A Class — $19,558 |
|
| S&P 500 Index — $20,638 |
|
The A Class’s initial investment is $9,425 to reflect the maximum 5.75% initial sales charge.
|
| | | | | | |
Total Annual Fund Operating Expenses | |
Investor Class | I Class | Y Class | A Class | C Class | R Class | R5 Class |
1.00% | 0.80% | 0.65% | 1.25% | 2.00% | 1.50% | 0.80% |
The total annual fund operating expenses shown is as stated in the fund’s prospectus current as of the date of this report. The prospectus may vary from the expense ratio shown elsewhere in this report because it is based on a different time period, includes acquired fund fees and expenses, and, if applicable, does not include fee waivers or expense reimbursements.
Data presented reflect past performance. Past performance is no guarantee of future results. Current performance may be higher or lower than the performance shown. Total returns for periods less than one year are not annualized. Investment return and principal value will fluctuate, and redemption value may be more or less than original cost. Data assumes reinvestment of dividends and capital gains, and none of the charts reflect the deduction of taxes that a shareholder would pay on fund distributions or the redemption of fund shares. To obtain performance data current to the most recent month end, please call 1-800-345-2021 or visit americancentury.com. For additional information about the fund, please consult the prospectus.
Portfolio Managers: Greg Woodhams, Justin Brown, Joe Reiland, and Rob Bove
Performance Summary
Sustainable Equity returned 26.61%* for the 12 months ended October 31, 2017, compared with the 23.63% return of the portfolio’s benchmark, the S&P 500 Index.
U.S. stock indices delivered positive returns during the reporting period with growth stocks outperforming value stocks across the capitalization spectrum. Within the S&P 500 Index, every sector except telecommunication services posted gains. Information technology and financials were especially strong sectors, but materials, industrials, and health care also rose more than 20%.
Stock selection among industrials stocks was a significant contributor to fund performance relative to the S&P 500 Index. An underweight allocation to energy and stock decisions in that sector also benefited performance. Stock choices among information technology and consumer discretionary companies detracted, although an overweight in the information technology sector mitigated some of the weakness.
Industrials Led Contributors
Within the industrials sector, positioning among industrial conglomerates aided performance, especially as we avoided owning several underperforming stocks such as General Electric that are components of the benchmark. Our holding in Boeing was a top contributor. The airplane manufacturer reported strong earnings, cash flow, and forward guidance for profitability of the company’s 787 airliner. Investors increasingly appear to believe in the stock more as a secular than a cyclical growth story and have become more comfortable with the business for the long term.
Other significant contributors included Applied Materials. The semiconductor equipment provider offered strong long-term guidance as the semiconductor industry is experiencing rapid growth due to increased demand for chips used in artificial intelligence and big data applications. Temporary employment agency ManpowerGroup benefited results as the company outperformed due to improving economic growth. JPMorgan Chase and Citigroup were significant contributors as interest rate-sensitive stocks outperformed on higher rates and potentially less regulation under President Trump.
Information Technology and Consumer Discretionary Detracted
In information technology, underweighting Apple detracted. The company reported good results, and investors appeared to look ahead favorably to the release of the new 10th anniversary iPhone. Not owning benchmark holding NVIDIA hindered results. The visual computing chip company’s gaming and data center businesses have continued to perform well.
Multiline retailer Target was a major detractor during a difficult period for stocks of retailers amid worries about intensifying competition from Amazon. In addition, the stock continues to suffer from investor disappointment in business results and progress on the company’s turnaround plan. O’Reilly Automotive hindered results. The automotive parts retailer reported sales that missed
*All fund returns referenced in this commentary are for Investor Class shares. Performance for other share classes will vary due to differences in fee structure; when Investor Class performance exceeds that of the fund’s benchmark, other share classes may not. See page 3 for returns for all share classes.
expectations and warned of weak consumer demand that drove the stock significantly lower. Investors are also fearful of increased competition from Amazon in a segment that had seemed relatively immune from online threats. We eliminated the holding.
Elsewhere, CVS Health, a retail pharmacy and health care company, declined after the company provided much lighter-than-expected fiscal year guidance as a result of two lost contracts, which were expected to have a larger impact on margins and earnings than the consensus was anticipating. Investors also appeared to worry about possible competition from Amazon.
Outlook
The portfolio invests in a blend of large value and large growth stocks, while seeking to outperform the S&P 500 Index with a comparable dividend yield without taking on significant additional risk. We believe that companies exhibiting both improving business fundamentals and sustainable corporate behaviors will outperform over time. We use a quantitative model that combines fundamental measures of a stock's value and growth potential. We then integrate our view of the company’s financial improvement with multiple sources of environmental, social, and governance (ESG) data.
As of October 31, 2017, the portfolio’s largest overweight positions relative to the benchmark were in the industrials and information technology sectors. Positioning in the industrials sector is a product of notable overweight positions in the machinery, professional services, and industrial conglomerate industries, among others. The portfolio remained overweight the information technology sector as we continued to find strong growth opportunities. Our fundamental analysis indicates rising capital spending by semiconductor companies.
The largest underweight positions relative to the index were in the utilities, consumer discretionary, and energy sectors. We look to invest at the intersection of growing, reasonably priced companies with attractive ESG characteristics. Utilities tend to score poorly on those broad metrics, and consequently we hold very few utilities stocks. In addition, we see a sustained demand/supply imbalance in energy, resulting from the shale oil and gas revolution in the U.S.
|
| |
OCTOBER 31, 2017 | |
Top Ten Holdings | % of net assets |
JPMorgan Chase & Co. | 4.0% |
Alphabet, Inc.* | 3.7% |
Boeing Co. (The) | 3.0% |
Microsoft Corp. | 2.8% |
Prologis, Inc. | 2.7% |
Facebook, Inc., Class A | 2.6% |
3M Co. | 2.5% |
Citigroup, Inc. | 2.3% |
Home Depot, Inc. (The) | 2.3% |
Cisco Systems, Inc. | 2.2% |
*Includes all classes of the issuer held by the fund. | |
| |
Top Five Industries | % of net assets |
Banks | 8.4% |
Internet Software and Services | 6.3% |
Software | 6.2% |
Semiconductors and Semiconductor Equipment | 4.5% |
Equity Real Estate Investment Trusts (REITs) | 4.5% |
| |
Types of Investments in Portfolio | % of net assets |
Common Stocks | 98.9% |
Temporary Cash Investments | 1.1% |
Other Assets and Liabilities | —** |
**Category is less than 0.05% of total net assets.
Fund shareholders may incur two types of costs: (1) transaction costs, including sales charges (loads) on purchase payments and redemption/exchange fees; and (2) ongoing costs, including management fees; distribution and service (12b-1) fees; and other fund expenses. This example is intended to help you understand your ongoing costs (in dollars) of investing in your fund and to compare these costs with the ongoing cost of investing in other mutual funds.
The example is based on an investment of $1,000 made at the beginning of the period and held for the entire period from May 1, 2017 to October 31, 2017.
Actual Expenses
The table provides information about actual account values and actual expenses for each class. You may use the information, together with the amount you invested, to estimate the expenses that you paid over the period. First, identify the share class you own. Then simply divide your account value by $1,000 (for example, an $8,600 account value divided by $1,000 = 8.6), then multiply the result by the number under the heading “Expenses Paid During Period” to estimate the expenses you paid on your account during this period.
If you hold Investor Class shares of any American Century Investments fund, or I Class shares of the American Century Diversified Bond Fund, in an American Century Investments account (i.e., not a financial intermediary or retirement plan account), American Century Investments may charge you a $12.50 semiannual account maintenance fee if the value of those shares is less than $10,000. We will redeem shares automatically in one of your accounts to pay the $12.50 fee. In determining your total eligible investment amount, we will include your investments in all personal accounts (including American Century Investments Brokerage accounts) registered under your Social Security number. Personal accounts include individual accounts, joint accounts, UGMA/UTMA accounts, personal trusts, Coverdell Education Savings Accounts and IRAs (including traditional, Roth, Rollover, SEP-, SARSEP- and SIMPLE-IRAs), and certain other retirement accounts. If you have only business, business retirement, employer-sponsored or American Century Investments Brokerage accounts, you are currently not subject to this fee. If you are subject to the Account Maintenance Fee, your account value could be reduced by the fee amount.
Hypothetical Example for Comparison Purposes
The table also provides information about hypothetical account values and hypothetical expenses based on the actual expense ratio of each class of your fund and an assumed rate of return of 5% per year before expenses, which is not the actual return of a fund’s share class. The hypothetical account values and expenses may not be used to estimate the actual ending account balance or expenses you paid for the period. You may use this information to compare the ongoing costs of investing in your fund and other funds. To do so, compare this 5% hypothetical example with the 5% hypothetical examples that appear in the shareholder reports of the other funds.
Please note that the expenses shown in the table are meant to highlight your ongoing costs only and do not reflect any transactional costs, such as sales charges (loads) or redemption/exchange fees. Therefore, the table is useful in comparing ongoing costs only, and will not help you determine the relative total costs of owning different funds. In addition, if these transactional costs were included, your costs would have been higher.
|
| | | | |
| Beginning
Account Value
5/1/17 | Ending
Account Value
10/31/17 | Expenses Paid
During Period(1)
5/1/17 - 10/31/17 |
Annualized
Expense Ratio(1) |
Actual | | | | |
Investor Class | $1,000 | $1,117.40 | $5.34 | 1.00% |
I Class | $1,000 | $1,118.40 | $4.27 | 0.80% |
Y Class | $1,000 | $1,119.60 | $3.47 | 0.65% |
A Class | $1,000 | $1,116.50 | $6.67 | 1.25% |
C Class | $1,000 | $1,111.90 | $10.65 | 2.00% |
R Class | $1,000 | $1,114.90 | $8.00 | 1.50% |
R5 Class | $1,000 | $1,118.40 | $4.27 | 0.80% |
Hypothetical | | | | |
Investor Class | $1,000 | $1,020.16 | $5.09 | 1.00% |
I Class | $1,000 | $1,021.17 | $4.08 | 0.80% |
Y Class | $1,000 | $1,021.93 | $3.31 | 0.65% |
A Class | $1,000 | $1,018.90 | $6.36 | 1.25% |
C Class | $1,000 | $1,015.12 | $10.16 | 2.00% |
R Class | $1,000 | $1,017.64 | $7.63 | 1.50% |
R5 Class | $1,000 | $1,021.17 | $4.08 | 0.80% |
| |
(1) | Expenses are equal to the class's annualized expense ratio listed in the table above, multiplied by the average account value over the period, multiplied by 184, the number of days in the most recent fiscal half-year, divided by 365, to reflect the one-half year period. Annualized expense ratio reflects actual expenses, including any applicable fee waivers or expense reimbursements and excluding any acquired fund fees and expenses. |
OCTOBER 31, 2017
|
| | | | | |
| Shares | Value |
COMMON STOCKS — 98.9% | | |
Aerospace and Defense — 3.9% | | |
Boeing Co. (The) | 26,651 |
| $ | 6,875,425 |
|
Northrop Grumman Corp. | 6,663 |
| 1,969,116 |
|
| | 8,844,541 |
|
Airlines — 1.2% | | |
Delta Air Lines, Inc. | 55,554 |
| 2,779,367 |
|
Automobiles — 0.5% | | |
Ford Motor Co. | 85,970 |
| 1,054,852 |
|
Banks — 8.4% | | |
Bank of America Corp. | 179,429 |
| 4,914,560 |
|
Citigroup, Inc. | 71,008 |
| 5,219,088 |
|
JPMorgan Chase & Co. | 90,368 |
| 9,091,925 |
|
| | 19,225,573 |
|
Beverages — 2.2% | | |
PepsiCo, Inc. | 45,032 |
| 4,963,877 |
|
Biotechnology — 3.1% | | |
AbbVie, Inc. | 16,773 |
| 1,513,763 |
|
Amgen, Inc. | 9,734 |
| 1,705,592 |
|
Biogen, Inc.(1) | 10,682 |
| 3,329,152 |
|
Bioverativ, Inc.(1) | 3,514 |
| 198,541 |
|
Incyte Corp.(1) | 3,184 |
| 360,588 |
|
| | 7,107,636 |
|
Capital Markets — 1.4% | | |
Ameriprise Financial, Inc. | 11,046 |
| 1,729,141 |
|
S&P Global, Inc. | 9,680 |
| 1,514,629 |
|
| | 3,243,770 |
|
Chemicals — 1.7% | | |
DowDuPont, Inc. | 5,715 |
| 413,252 |
|
LyondellBasell Industries NV, Class A | 13,884 |
| 1,437,410 |
|
Sherwin-Williams Co. (The) | 5,341 |
| 2,110,496 |
|
| | 3,961,158 |
|
Communications Equipment — 3.2% | | |
Cisco Systems, Inc. | 146,442 |
| 5,000,994 |
|
Motorola Solutions, Inc. | 17,671 |
| 1,599,933 |
|
Palo Alto Networks, Inc.(1) | 5,371 |
| 790,611 |
|
| | 7,391,538 |
|
Containers and Packaging — 0.6% | | |
International Paper Co. | 22,103 |
| 1,265,839 |
|
Diversified Telecommunication Services — 1.6% | | |
AT&T, Inc. | 80,388 |
| 2,705,056 |
|
Verizon Communications, Inc. | 21,321 |
| 1,020,636 |
|
| | 3,725,692 |
|
Electric Utilities — 0.1% | | |
Exelon Corp. | 7,134 |
| 286,858 |
|
Electrical Equipment — 0.9% | | |
Eaton Corp. plc | 26,360 |
| 2,109,327 |
|
|
| | | | | |
| Shares | Value |
Energy Equipment and Services — 0.9% | | |
Schlumberger Ltd. | 32,987 |
| $ | 2,111,168 |
|
Equity Real Estate Investment Trusts (REITs) — 4.5% | | |
Host Hotels & Resorts, Inc. | 114,222 |
| 2,234,182 |
|
Prologis, Inc. | 97,361 |
| 6,287,574 |
|
SBA Communications Corp.(1) | 11,766 |
| 1,849,380 |
|
| | 10,371,136 |
|
Food and Staples Retailing — 2.7% | | |
CVS Health Corp. | 41,368 |
| 2,834,949 |
|
Kroger Co. (The) | 5,672 |
| 117,411 |
|
Wal-Mart Stores, Inc. | 36,614 |
| 3,196,768 |
|
| | 6,149,128 |
|
Food Products — 1.1% | | |
Archer-Daniels-Midland Co. | 14,333 |
| 585,790 |
|
Campbell Soup Co. | 7,842 |
| 371,476 |
|
Pinnacle Foods, Inc. | 27,177 |
| 1,478,972 |
|
| | 2,436,238 |
|
Health Care Equipment and Supplies — 2.8% | | |
Abbott Laboratories | 13,795 |
| 748,103 |
|
Edwards Lifesciences Corp.(1) | 26,890 |
| 2,748,964 |
|
Hologic, Inc.(1) | 74,188 |
| 2,808,016 |
|
| | 6,305,083 |
|
Health Care Providers and Services — 4.2% | | |
Aetna, Inc. | 25,666 |
| 4,363,990 |
|
Centene Corp.(1) | 2,144 |
| 200,829 |
|
Express Scripts Holding Co.(1) | 28,345 |
| 1,737,265 |
|
Humana, Inc. | 3,778 |
| 964,712 |
|
UnitedHealth Group, Inc. | 10,969 |
| 2,305,903 |
|
| | 9,572,699 |
|
Hotels, Restaurants and Leisure — 0.6% | | |
Royal Caribbean Cruises Ltd. | 5,870 |
| 726,530 |
|
Starbucks Corp. | 12,723 |
| 697,729 |
|
| | 1,424,259 |
|
Household Products — 1.0% | | |
Procter & Gamble Co. (The) | 26,436 |
| 2,282,484 |
|
Industrial Conglomerates — 2.5% | | |
3M Co. | 24,696 |
| 5,684,772 |
|
Insurance — 3.4% | | |
Aflac, Inc. | 14,696 |
| 1,232,848 |
|
Prudential Financial, Inc. | 17,135 |
| 1,892,732 |
|
Travelers Cos., Inc. (The) | 35,691 |
| 4,727,273 |
|
| | 7,852,853 |
|
Internet and Direct Marketing Retail — 2.4% | | |
Amazon.com, Inc.(1) | 4,188 |
| 4,628,912 |
|
Expedia, Inc. | 7,180 |
| 895,059 |
|
| | 5,523,971 |
|
Internet Software and Services — 6.3% | | |
Alphabet, Inc., Class A(1) | 5,847 |
| 6,040,185 |
|
Alphabet, Inc., Class C(1) | 2,343 |
| 2,381,987 |
|
Facebook, Inc., Class A(1) | 32,826 |
| 5,910,650 |
|
| | 14,332,822 |
|
|
| | | | | |
| Shares | Value |
IT Services — 3.7% | | |
Accenture plc, Class A | 29,676 |
| $ | 4,224,676 |
|
Alliance Data Systems Corp. | 1,908 |
| 426,877 |
|
Visa, Inc., Class A | 34,136 |
| 3,754,277 |
|
| | 8,405,830 |
|
Life Sciences Tools and Services — 0.9% | | |
Agilent Technologies, Inc. | 30,221 |
| 2,055,935 |
|
Machinery — 3.3% | | |
Caterpillar, Inc. | 28,207 |
| 3,830,511 |
|
Cummins, Inc. | 10,851 |
| 1,919,325 |
|
Parker-Hannifin Corp. | 9,207 |
| 1,681,290 |
|
| | 7,431,126 |
|
Media — 2.5% | | |
Comcast Corp., Class A | 125,507 |
| 4,522,017 |
|
Time Warner, Inc. | 12,207 |
| 1,199,826 |
|
| | 5,721,843 |
|
Multi-Utilities — 0.7% | | |
DTE Energy Co. | 13,439 |
| 1,484,472 |
|
Multiline Retail — 1.4% | | |
Target Corp. | 53,656 |
| 3,167,850 |
|
Oil, Gas and Consumable Fuels — 3.0% | | |
ConocoPhillips | 47,322 |
| 2,420,521 |
|
Devon Energy Corp. | 17,788 |
| 656,377 |
|
EOG Resources, Inc. | 12,641 |
| 1,262,457 |
|
Marathon Petroleum Corp. | 22,307 |
| 1,332,620 |
|
Valero Energy Corp. | 16,270 |
| 1,283,540 |
|
| | 6,955,515 |
|
Pharmaceuticals — 3.0% | | |
Bristol-Myers Squibb Co. | 43,836 |
| 2,702,928 |
|
Johnson & Johnson | 27,714 |
| 3,863,608 |
|
Merck & Co., Inc. | 6,898 |
| 380,011 |
|
| | 6,946,547 |
|
Professional Services — 1.8% | | |
ManpowerGroup, Inc. | 33,367 |
| 4,113,484 |
|
Road and Rail — 0.3% | | |
Ryder System, Inc. | 8,625 |
| 699,315 |
|
Semiconductors and Semiconductor Equipment — 4.5% | | |
Applied Materials, Inc. | 79,903 |
| 4,508,926 |
|
Intel Corp. | 107,427 |
| 4,886,854 |
|
Texas Instruments, Inc. | 10,279 |
| 993,877 |
|
| | 10,389,657 |
|
Software — 6.2% | | |
Adobe Systems, Inc.(1) | 14,052 |
| 2,461,348 |
|
Electronic Arts, Inc.(1) | 7,564 |
| 904,655 |
|
Microsoft Corp. | 76,228 |
| 6,340,645 |
|
Oracle Corp. (New York) | 53,988 |
| 2,747,989 |
|
Red Hat, Inc.(1) | 13,310 |
| 1,608,247 |
|
| | 14,062,884 |
|
Specialty Retail — 2.4% | | |
Home Depot, Inc. (The) | 31,464 |
| 5,216,102 |
|
Lowe's Cos., Inc. | 1,076 |
| 86,026 |
|
|
| | | | | |
| Shares | Value |
Ross Stores, Inc. | 4,536 |
| $ | 287,991 |
|
| | 5,590,119 |
|
Technology Hardware, Storage and Peripherals — 2.9% | | |
Apple, Inc. | 27,597 |
| 4,664,997 |
|
HP, Inc. | 95,662 |
| 2,061,516 |
|
| | 6,726,513 |
|
Tobacco — 1.1% | | |
Philip Morris International, Inc. | 24,242 |
| 2,536,683 |
|
TOTAL COMMON STOCKS
(Cost $158,072,773) | | 226,294,414 |
|
TEMPORARY CASH INVESTMENTS — 1.1% | | |
Repurchase Agreement, BMO Capital Markets Corp., (collateralized by various U.S. Treasury obligations, 0.375% - 1.375%, 1/15/27 - 2/15/45, valued at $1,364,845), in a joint trading account at 0.88%, dated 10/31/17, due 11/1/17 (Delivery value $1,335,052) | | 1,335,018 |
|
Repurchase Agreement, Fixed Income Clearing Corp., (collateralized by various U.S. Treasury obligations, 2.50%, 5/15/46, valued at $1,138,227), at 0.34%, dated 10/31/17, due 11/1/17 (Delivery value $1,112,011) | | 1,112,000 |
|
State Street Institutional U.S. Government Money Market Fund, Premier Class | 2,157 |
| 2,157 |
|
TOTAL TEMPORARY CASH INVESTMENTS
(Cost $2,449,175) | | 2,449,175 |
|
TOTAL INVESTMENT SECURITIES — 100.0%
(Cost $160,521,948) | | 228,743,589 |
|
OTHER ASSETS AND LIABILITIES† | | (53,014 | ) |
TOTAL NET ASSETS — 100.0% | | $ | 228,690,575 |
|
|
| | |
NOTES TO SCHEDULE OF INVESTMENTS |
| |
† | Category is less than 0.05% of total net assets. |
See Notes to Financial Statements.
|
|
Statement of Assets and Liabilities |
|
| | | |
OCTOBER 31, 2017 | |
Assets | |
Investment securities, at value (cost of $160,521,948) | $ | 228,743,589 |
|
Receivable for capital shares sold | 35,686 |
|
Dividends and interest receivable | 223,316 |
|
| 229,002,591 |
|
| |
Liabilities | |
Payable for capital shares redeemed | 94,388 |
|
Accrued management fees | 187,379 |
|
Distribution and service fees payable | 27,703 |
|
Accrued other expenses | 2,546 |
|
| 312,016 |
|
| |
Net Assets | $ | 228,690,575 |
|
| |
Net Assets Consist of: | |
Capital (par value and paid-in surplus) | $ | 155,159,533 |
|
Undistributed net investment income | 1,129,902 |
|
Undistributed net realized gain | 4,179,499 |
|
Net unrealized appreciation | 68,221,641 |
|
| $ | 228,690,575 |
|
|
| | | | |
| Net Assets | Shares Outstanding | Net Asset Value Per Share |
Investor Class, $0.01 Par Value | $135,314,540 | 4,970,500 |
| $27.22 |
I Class, $0.01 Par Value | $19,776,327 | 724,320 |
| $27.30 |
Y Class, $0.01 Par Value | $383,333 | 14,028 |
| $27.33 |
A Class, $0.01 Par Value | $51,396,282 | 1,894,697 |
| $27.13* |
C Class, $0.01 Par Value | $17,904,066 | 672,402 |
| $26.63 |
R Class, $0.01 Par Value | $3,910,321 | 144,951 |
| $26.98 |
R5 Class, $0.01 Par Value | $5,706 | 209 |
| $27.30 |
*Maximum offering price $28.79 (net asset value divided by 0.9425).
See Notes to Financial Statements.
|
| | | |
YEAR ENDED OCTOBER 31, 2017 |
Investment Income (Loss) | |
Income: | |
Dividends | $ | 4,263,598 |
|
Interest | 6,881 |
|
| 4,270,479 |
|
| |
Expenses: | |
Management fees | 2,152,986 |
|
Distribution and service fees: | |
A Class | 186,659 |
|
C Class | 184,969 |
|
R Class | 19,028 |
|
Directors' fees and expenses | 6,752 |
|
Other expenses | 7,587 |
|
| 2,557,981 |
|
| |
Net investment income (loss) | 1,712,498 |
|
| |
Realized and Unrealized Gain (Loss) | |
Net realized gain (loss) on investment transactions | 7,836,118 |
|
Change in net unrealized appreciation (depreciation) on investments | 41,922,276 |
|
| |
Net realized and unrealized gain (loss) | 49,758,394 |
|
| |
Net Increase (Decrease) in Net Assets Resulting from Operations | $ | 51,470,892 |
|
See Notes to Financial Statements.
|
|
Statement of Changes in Net Assets |
|
| | | | | | |
YEARS ENDED OCTOBER 31, 2017 AND OCTOBER 31, 2016 |
Increase (Decrease) in Net Assets | October 31, 2017 | October 31, 2016 |
Operations | | |
Net investment income (loss) | $ | 1,712,498 |
| $ | 2,215,677 |
|
Net realized gain (loss) | 7,836,118 |
| 36,997,341 |
|
Change in net unrealized appreciation (depreciation) | 41,922,276 |
| (38,849,766 | ) |
Net increase (decrease) in net assets resulting from operations | 51,470,892 |
| 363,252 |
|
| | |
Distributions to Shareholders | | |
From net investment income: | | |
Investor Class | (1,035,050 | ) | (1,002,434 | ) |
I Class | (86,690 | ) | (177,843 | ) |
A Class | (912,362 | ) | (975,431 | ) |
C Class | (30,542 | ) | (16,625 | ) |
R Class | (25,123 | ) | (31,720 | ) |
Decrease in net assets from distributions | (2,089,767 | ) | (2,204,053 | ) |
| | |
Capital Share Transactions | | |
Net increase (decrease) in net assets from capital share transactions (Note 5) | (33,935,108 | ) | (43,272,294 | ) |
| | |
Net increase (decrease) in net assets | 15,446,017 |
| (45,113,095 | ) |
| | |
Net Assets | | |
Beginning of period | 213,244,558 |
| 258,357,653 |
|
End of period | $ | 228,690,575 |
| $ | 213,244,558 |
|
| | |
Undistributed net investment income | $ | 1,129,902 |
| $ | 1,670,698 |
|
See Notes to Financial Statements.
|
|
Notes to Financial Statements |
OCTOBER 31, 2017
1. Organization
American Century Mutual Funds, Inc. (the corporation) is registered under the Investment Company Act of 1940, as amended (the 1940 Act), as an open-end management investment company and is organized as a Maryland corporation. Sustainable Equity Fund (the fund) is one fund in a series issued by the corporation. The fund’s investment objective is to seek long-term capital growth. Income is a secondary objective.
The fund offers the Investor Class, I Class (formerly Institutional Class), Y Class, A Class, C Class, R Class and R5 Class. The A Class may incur an initial sales charge. The A Class and C Class may be subject to a contingent deferred sales charge. Sale of the Y Class and R5 Class commenced on April 10, 2017.
2. Significant Accounting Policies
The following is a summary of significant accounting policies consistently followed by the fund in preparation of its financial statements. The fund is an investment company and follows accounting and reporting guidance in accordance with accounting principles generally accepted in the United States of America. This may require management to make certain estimates and assumptions at the date of the financial statements. Actual results could differ from these estimates. Management evaluated the impact of events or transactions occurring through the date the financial statements were issued that would merit recognition or disclosure.
Investment Valuations — The fund determines the fair value of its investments and computes its net asset value per share at the close of regular trading (usually 4 p.m. Eastern time) on the New York Stock Exchange (NYSE) on each day the NYSE is open. The Board of Directors has adopted valuation policies and procedures to guide the investment advisor in the fund’s investment valuation process and to provide methodologies for the oversight of the fund’s pricing function.
Equity securities that are listed or traded on a domestic securities exchange are valued at the last reported sales price or at the official closing price as provided by the exchange. Equity securities traded on foreign securities exchanges are generally valued at the closing price of such securities on the exchange where primarily traded or at the close of the NYSE, if that is earlier. If no last sales price is reported, or if local convention or regulation so provides, the mean of the latest bid and asked prices may be used. Securities traded over-the-counter are valued at the mean of the latest bid and asked prices, the last sales price, or the official closing price.
Open-end management investment companies are valued at the reported net asset value per share. Repurchase agreements are valued at cost, which approximates fair value.
If the fund determines that the market price for an investment is not readily available or the valuation methods mentioned above do not reflect an investment’s fair value, such investment is valued as determined in good faith by the Board of Directors or its delegate, in accordance with policies and procedures adopted by the Board of Directors. In its determination of fair value, the fund may review several factors including, but not limited to, market information regarding the specific investment or comparable investments and correlation with other investment types, futures indices or general market indicators. Circumstances that may cause the fund to use these procedures to value an investment include, but are not limited to: an investment has been declared in default or is distressed; trading in a security has been suspended during the trading day or a security is not actively trading on its principal exchange; prices received from a regular pricing source are deemed unreliable; or there is a foreign market holiday and no trading occurred.
The fund monitors for significant events occurring after the close of an investment’s primary exchange but before the fund’s net asset value per share is determined. Significant events may include, but are not limited to: corporate announcements and transactions; governmental action and political unrest that could impact a specific investment or an investment sector; or armed conflicts, natural disasters and similar events that could affect investments in a specific country or region. The fund also monitors for significant fluctuations between domestic and foreign markets, as evidenced by the U.S. market or such other indicators that the Board of Directors, or its delegate, deems appropriate. If significant fluctuations in foreign markets are identified, the fund may apply a model-derived factor to the closing price of equity securities traded on foreign securities exchanges. The factor is based on observable market data as provided by an independent pricing service.
Security Transactions — Security transactions are accounted for as of the trade date. Net realized gains and losses are determined on the identified cost basis, which is also used for federal income tax purposes.
Investment Income — Dividend income less foreign taxes withheld, if any, is recorded as of the ex-dividend date. Distributions received on securities that represent a return of capital or long-term capital gain are recorded as a reduction of cost of investments and/or as a realized gain. The fund may estimate the components of distributions received that may be considered nontaxable distributions or long-term capital gain distributions for income tax purposes. Interest income is recorded on the accrual basis and includes accretion of discounts and amortization of premiums.
Repurchase Agreements — The fund may enter into repurchase agreements with institutions that American Century Investment Management, Inc. (ACIM) (the investment advisor) has determined are creditworthy pursuant to criteria adopted by the Board of Directors. The fund requires that the collateral, represented by securities, received in a repurchase transaction be transferred to the custodian in a manner sufficient to enable the fund to obtain those securities in the event of a default under the repurchase agreement. ACIM monitors, on a daily basis, the securities transferred to ensure the value, including accrued interest, of the securities under each repurchase agreement is equal to or greater than amounts owed to the fund under each repurchase agreement.
Joint Trading Account — Pursuant to an Exemptive Order issued by the Securities and Exchange Commission, the fund, along with certain other funds in the American Century Investments family of funds, may transfer uninvested cash balances into a joint trading account. These balances are invested in one or more repurchase agreements that are collateralized by U.S. Treasury or Agency obligations.
Income Tax Status — It is the fund’s policy to distribute substantially all net investment income and net realized gains to shareholders and to otherwise qualify as a regulated investment company under provisions of the Internal Revenue Code. Accordingly, no provision has been made for income taxes. The fund files U.S. federal, state, local and non-U.S. tax returns as applicable. The fund's tax returns are subject to examination by the relevant taxing authority until expiration of the applicable statute of limitations, which is generally three years from the date of filing but can be longer in certain jurisdictions. At this time, management believes there are no uncertain tax positions which, based on their technical merit, would not be sustained upon examination and for which it is reasonably possible that the total amounts of unrecognized tax benefits will significantly change in the next twelve months.
Multiple Class — All shares of the fund represent an equal pro rata interest in the net assets of the class to which such shares belong, and have identical voting, dividend, liquidation and other rights and the same terms and conditions, except for class specific expenses and exclusive rights to vote on matters affecting only individual classes. Income, non-class specific expenses, and realized and unrealized capital gains and losses of the fund are allocated to each class of shares based on their relative net assets.
Distributions to Shareholders — Distributions from net investment income and net realized gains, if any, are generally declared and paid annually. The fund may elect to treat a portion of its payment to a redeeming shareholder, which represents the pro rata share of undistributed net investment income and net realized gains, as a distribution for federal income tax purposes (tax equalization).
Indemnifications — Under the corporation’s organizational documents, its officers and directors are indemnified against certain liabilities arising out of the performance of their duties to the fund. In addition, in the normal course of business, the fund enters into contracts that provide general indemnifications. The maximum exposure under these arrangements is unknown as this would involve future claims that may be made against a fund. The risk of material loss from such claims is considered by management to be remote.
3. Fees and Transactions with Related Parties
Certain officers and directors of the corporation are also officers and/or directors of American Century Companies, Inc. (ACC). The corporation’s investment advisor, ACIM, the corporation's distributor, American Century Investment Services, Inc. (ACIS), and the corporation’s transfer agent, American Century Services, LLC, are wholly owned, directly or indirectly, by ACC.
Management Fees — The corporation has entered into a management agreement with ACIM, under which ACIM provides the fund with investment advisory and management services in exchange for a single, unified management fee (the fee) per class. The agreement provides that all expenses of managing and operating the fund, except distribution and service fees, brokerage expenses, taxes, interest, fees and expenses of the
independent directors (including legal counsel fees), and extraordinary expenses, will be paid by ACIM. The fee is computed and accrued daily based on each class's daily net assets and paid monthly in arrears. The difference in the fee among the classes is a result of their separate arrangements for non-Rule 12b-1 shareholder services. It is not the result of any difference in advisory or custodial fees or other expenses related to the management of the fund’s assets, which do not vary by class. The rate of the fee is determined by applying a fee rate calculation formula. This formula takes into account the fund’s assets as well as certain assets, if any, of other clients of the investment advisor outside the American Century Investments family of funds (such as subadvised funds and separate accounts) that use very similar investment teams and strategies (strategy assets).
The management fee schedule range and the effective annual management fee for each class for the period ended October 31, 2017 are as follows:
|
| | |
| Management Fee Schedule Range | Effective Annual Management Fee |
Investor Class | 0.800% to 0.990% | 0.99% |
I Class | 0.600% to 0.790% | 0.79% |
Y Class | 0.450% to 0.640% | 0.64% |
A Class | 0.800% to 0.990% | 0.99% |
C Class | 0.800% to 0.990% | 0.99% |
R Class | 0.800% to 0.990% | 0.99% |
R5 Class | 0.600% to 0.790% | 0.79% |
Distribution and Service Fees — The Board of Directors has adopted a separate Master Distribution and Individual Shareholder Services Plan for each of the A Class, C Class and R Class (collectively the plans), pursuant to Rule 12b-1 of the 1940 Act. The plans provide that the A Class will pay ACIS an annual distribution and service fee of 0.25%. The plans provide that the C Class will pay ACIS an annual distribution and service fee of 1.00%, of which 0.25% is paid for individual shareholder services and 0.75% is paid for distribution services. The plans provide that the R Class will pay ACIS an annual distribution and service fee of 0.50%. The fees are computed and accrued daily based on each class’s daily net assets and paid monthly in arrears. The fees are used to pay financial intermediaries for distribution and individual shareholder services. Fees incurred under the plans during the period ended October 31, 2017 are detailed in the Statement of Operations.
Directors' Fees and Expenses — The Board of Directors is responsible for overseeing the investment advisor’s management and operations of the fund. The directors receive detailed information about the fund and its investment advisor regularly throughout the year, and meet at least quarterly with management of the investment advisor to review reports about fund operations. The fund’s officers do not receive compensation from the fund.
Interfund Transactions — The fund may enter into security transactions with other American Century Investments funds and other client accounts of the investment advisor, in accordance with the 1940 Act rules and procedures adopted by the Board of Directors. The rules and procedures require, among other things, that these transactions be effected at the independent current market price of the security. During the period, the interfund purchases and sales were $1,092,731 and $276,324, respectively. The effect of interfund transactions on the Statement of Operations was $27,821 in net realized gain (loss) on investment transactions.
4. Investment Transactions
Purchases and sales of investment securities, excluding short-term investments, for the period ended October 31, 2017 were $39,567,583 and $74,405,119, respectively.
5. Capital Share Transactions
Transactions in shares of the fund were as follows:
|
| | | | | | | | | | |
| Year ended
October 31, 2017(1) | Year ended
October 31, 2016 |
| Shares | Amount | Shares | Amount |
Investor Class/Shares Authorized | 120,000,000 |
| | 140,000,000 |
| |
Sold | 2,921,568 |
| $ | 71,286,795 |
| 1,315,790 |
| $ | 27,773,723 |
|
Issued in reinvestment of distributions | 40,885 |
| 941,572 |
| 44,610 |
| 939,045 |
|
Redeemed | (2,031,710 | ) | (49,907,476 | ) | (1,687,573 | ) | (35,290,320 | ) |
| 930,743 |
| 22,320,891 |
| (327,173 | ) | (6,577,552 | ) |
I Class/Shares Authorized | 20,000,000 |
| | 20,000,000 |
| |
Sold | 601,139 |
| 15,331,397 |
| 177,059 |
| 3,608,045 |
|
Issued in reinvestment of distributions | 3,759 |
| 86,690 |
| 8,437 |
| 177,843 |
|
Redeemed | (139,002 | ) | (3,439,848 | ) | (571,756 | ) | (12,085,552 | ) |
| 465,896 |
| 11,978,239 |
| (386,260 | ) | (8,299,664 | ) |
Y Class/Shares Authorized | 50,000,000 |
| | N/A |
| |
Sold | 14,067 |
| 369,745 |
| | |
Redeemed | (39 | ) | (1,033 | ) | | |
| 14,028 |
| 368,712 |
| | |
A Class/Shares Authorized | 120,000,000 |
| | 140,000,000 |
| |
Sold | 204,275 |
| 4,893,975 |
| 316,665 |
| 6,681,629 |
|
Issued in reinvestment of distributions | 37,477 |
| 861,602 |
| 43,720 |
| 918,990 |
|
Redeemed | (2,823,750 | ) | (68,426,795 | ) | (1,530,482 | ) | (32,046,890 | ) |
| (2,581,998 | ) | (62,671,218 | ) | (1,170,097 | ) | (24,446,271 | ) |
C Class/Shares Authorized | 40,000,000 |
| | 40,000,000 |
| |
Sold | 43,933 |
| 1,031,559 |
| 140,148 |
| 2,911,206 |
|
Issued in reinvestment of distributions | 1,095 |
| 24,880 |
| 636 |
| 13,209 |
|
Redeemed | (248,865 | ) | (5,945,415 | ) | (252,386 | ) | (5,252,976 | ) |
| (203,837 | ) | (4,888,976 | ) | (111,602 | ) | (2,328,561 | ) |
R Class/Shares Authorized | 20,000,000 |
| | 20,000,000 |
| |
Sold | 28,422 |
| 684,583 |
| 62,022 |
| 1,307,560 |
|
Issued in reinvestment of distributions | 1,096 |
| 25,123 |
| 1,514 |
| 31,720 |
|
Redeemed | (74,353 | ) | (1,757,462 | ) | (137,016 | ) | (2,959,526 | ) |
| (44,835 | ) | (1,047,756 | ) | (73,480 | ) | (1,620,246 | ) |
R5 Class/Shares Authorized | 50,000,000 |
| | N/A |
| |
Sold | 209 |
| 5,000 |
| | |
Net increase (decrease) | (1,419,794 | ) | $ | (33,935,108 | ) | (2,068,612 | ) | $ | (43,272,294 | ) |
| |
(1) | April 10, 2017 (commencement of sale) through October 31, 2017 for the Y Class and R5 Class. |
6. Fair Value Measurements
The fund’s investments valuation process is based on several considerations and may use multiple inputs to determine the fair value of the investments held by the fund. In conformity with accounting principles generally accepted in the United States of America, the inputs used to determine a valuation are classified into three broad levels.
| |
• | Level 1 valuation inputs consist of unadjusted quoted prices in an active market for identical investments. |
| |
• | Level 2 valuation inputs consist of direct or indirect observable market data (including quoted prices for comparable investments, evaluations of subsequent market events, interest rates, prepayment speeds, credit risk, etc.). These inputs also consist of quoted prices for identical investments initially expressed in local currencies that are adjusted through translation into U.S. dollars. |
| |
• | Level 3 valuation inputs consist of unobservable data (including a fund’s own assumptions). |
The level classification is based on the lowest level input that is significant to the fair valuation measurement. The valuation inputs are not necessarily an indication of the risks associated with investing in these securities or other financial instruments. There were no significant transfers between levels during the period.
The following is a summary of the level classifications as of period end. The Schedule of Investments provides additional information on the fund’s portfolio holdings.
|
| | | | | | | | |
| Level 1 | Level 2 | Level 3 |
Assets | | | |
Investment Securities | | | |
Common Stocks | $ | 226,294,414 |
| — |
| — |
|
Temporary Cash Investments | 2,157 |
| $ | 2,447,018 |
| — |
|
| $ | 226,296,571 |
| $ | 2,447,018 |
| — |
|
7. Federal Tax Information
The tax character of distributions paid during the years ended October 31, 2017 and October 31, 2016 were as follows:
|
| | | | | | |
| 2017 | 2016 |
Distributions Paid From | | |
Ordinary income | $ | 2,089,767 |
| $ | 2,204,053 |
|
Long-term capital gains | — |
| — |
|
The book-basis character of distributions made during the year from net investment income or net realized gains may differ from their ultimate characterization for federal income tax purposes. These differences reflect the differing character of certain income items and net realized gains and losses for financial statement and tax purposes, and may result in reclassification among certain capital accounts on the financial statements.
As of period end, the federal tax cost of investments and the components of distributable earnings on a tax-basis were as follows:
|
| | | |
Federal tax cost of investments | $ | 161,520,692 |
|
Gross tax appreciation of investments | $ | 70,067,073 |
|
Gross tax depreciation of investments | (2,844,176 | ) |
Net tax appreciation (depreciation) of investments | $ | 67,222,897 |
|
Undistributed ordinary income | $ | 1,129,902 |
|
Accumulated long-term gains | $ | 5,178,243 |
|
The difference between book-basis and tax-basis unrealized appreciation (depreciation) is attributable primarily to the tax deferral of losses on wash sales.
|
| | | | | | | | | | | | | |
For a Share Outstanding Throughout the Years Ended October 31 (except as noted) | | | | | |
Per-Share Data | | | | | | Ratios and Supplemental Data | | |
| | Income From Investment Operations: | | | | Ratio to Average Net Assets of: | | |
| Net Asset
Value,
Beginning
of Period | Net
Investment
Income
(Loss)(1) | Net
Realized
and
Unrealized
Gain (Loss) | Total From
Investment
Operations | Distributions From Net
Investment Income | Net Asset
Value,
End
of Period | Total
Return(2) | Operating
Expenses | Net
Investment
Income
(Loss) | Portfolio
Turnover
Rate | Net
Assets,
End of
Period
(in thousands) |
Investor Class | | | | | | | | | | |
2017 | $21.75 | 0.23 | 5.51 | 5.74 | (0.27) | $27.22 | 26.61% | 1.00% | 0.95% | 18% |
| $135,315 |
|
2016 | $21.77 | 0.25 | (0.04) | 0.21 | (0.23) | $21.75 | 0.99% | 0.99% | 1.18% | 71% |
| $87,865 |
|
2015 | $21.31 | 0.26 | 0.46 | 0.72 | (0.26) | $21.77 | 3.51% | 0.99% | 1.23% | 33% |
| $95,072 |
|
2014 | $18.41 | 0.24 | 2.88 | 3.12 | (0.22) | $21.31 | 17.06% | 1.00% | 1.19% | 41% |
| $77,015 |
|
2013 | $14.82 | 0.23 | 3.55 | 3.78 | (0.19) | $18.41 | 25.83% | 1.01% | 1.44% | 36% |
| $68,416 |
|
I Class(3) | | | | | | | | | | |
2017 | $21.81 | 0.27 | 5.53 | 5.80 | (0.31) | $27.30 | 26.88% | 0.80% | 1.15% | 18% |
| $19,776 |
|
2016 | $21.84 | 0.29 | (0.05) | 0.24 | (0.27) | $21.81 | 1.19% | 0.79% | 1.38% | 71% |
| $5,637 |
|
2015 | $21.37 | 0.31 | 0.47 | 0.78 | (0.31) | $21.84 | 3.66% | 0.79% | 1.43% | 33% |
| $14,077 |
|
2014 | $18.47 | 0.28 | 2.88 | 3.16 | (0.26) | $21.37 | 17.29% | 0.80% | 1.39% | 41% |
| $10,731 |
|
2013 | $14.85 | 0.27 | 3.55 | 3.82 | (0.20) | $18.47 | 26.06% | 0.81% | 1.64% | 36% |
| $10,451 |
|
Y Class | | | | | | | | | | |
2017(4) | $23.89 | 0.16 | 3.28 | 3.44 | — | $27.33 | 14.40% | 0.65%(5) | 1.10%(5) | 18%(6) |
| $383 |
|
|
| | | | | | | | | | | | | |
For a Share Outstanding Throughout the Years Ended October 31 (except as noted) | | | | | |
Per-Share Data | | | | | | Ratios and Supplemental Data | | |
| | Income From Investment Operations: | | | | Ratio to Average Net Assets of: | | |
| Net Asset
Value,
Beginning
of Period | Net
Investment
Income
(Loss)(1) | Net
Realized
and
Unrealized
Gain (Loss) | Total From
Investment
Operations | Distributions From Net
Investment Income | Net Asset
Value,
End
of Period | Total
Return(2) | Operating
Expenses | Net
Investment
Income
(Loss) | Portfolio
Turnover
Rate | Net
Assets,
End of
Period
(in thousands) |
A Class | | | | | | | | | | |
2017 | $21.67 | 0.17 | 5.50 | 5.67 | (0.21) | $27.13 | 26.34% | 1.25% | 0.70% | 18% |
| $51,396 |
|
2016 | $21.69 | 0.20 | (0.05) | 0.15 | (0.17) | $21.67 | 0.74% | 1.24% | 0.93% | 71% |
| $97,012 |
|
2015 | $21.23 | 0.21 | 0.46 | 0.67 | (0.21) | $21.69 | 3.21% | 1.24% | 0.98% | 33% |
| $122,492 |
|
2014 | $18.35 | 0.19 | 2.86 | 3.05 | (0.17) | $21.23 | 16.76% | 1.25% | 0.94% | 41% |
| $116,462 |
|
2013 | $14.80 | 0.20 | 3.53 | 3.73 | (0.18) | $18.35 | 25.51% | 1.26% | 1.19% | 36% |
| $119,358 |
|
C Class | | | | | | | | | | |
2017 | $21.27 | (0.01) | 5.41 | 5.40 | (0.04) | $26.63 | 25.40% | 2.00% | (0.05)% | 18% |
| $17,904 |
|
2016 | $21.29 | 0.04 | (0.04) | —(7) | (0.02) | $21.27 | (0.02)% | 1.99% | 0.18% | 71% |
| $18,640 |
|
2015 | $20.84 | 0.05 | 0.45 | 0.50 | (0.05) | $21.29 | 2.42% | 1.99% | 0.23% | 33% |
| $21,036 |
|
2014 | $18.01 | 0.04 | 2.82 | 2.86 | (0.03) | $20.84 | 15.90% | 2.00% | 0.19% | 41% |
| $16,777 |
|
2013 | $14.61 | 0.07 | 3.48 | 3.55 | (0.15) | $18.01 | 24.54% | 2.01% | 0.44% | 36% |
| $16,679 |
|
R Class | | | | | | | | | | |
2017 | $21.55 | 0.11 | 5.47 | 5.58 | (0.15) | $26.98 | 26.03% | 1.50% | 0.45% | 18% |
| $3,910 |
|
2016 | $21.58 | 0.14 | (0.05) | 0.09 | (0.12) | $21.55 | 0.44% | 1.49% | 0.68% | 71% |
| $4,090 |
|
2015 | $21.11 | 0.16 | 0.47 | 0.63 | (0.16) | $21.58 | 3.01% | 1.49% | 0.73% | 33% |
| $5,680 |
|
2014 | $18.25 | 0.14 | 2.84 | 2.98 | (0.12) | $21.11 | 16.45% | 1.50% | 0.69% | 41% |
| $5,294 |
|
2013 | $14.74 | 0.15 | 3.53 | 3.68 | (0.17) | $18.25 | 25.25% | 1.51% | 0.94% | 36% |
| $5,000 |
|
R5 Class | | | | | | | | | | |
2017(4) | $23.89 | 0.15 | 3.26 | 3.41 | — | $27.30 | 14.27% | 0.80%(5) | 1.07%(5) | 18%(6) |
| $6 |
|
|
|
Notes to Financial Highlights |
| |
(1) | Computed using average shares outstanding throughout the period. |
| |
(2) | Total returns are calculated based on the net asset value of the last business day and do not reflect applicable sales charges, if any. Total returns for periods less than one year are not annualized. |
| |
(3) | Prior to April 10, 2017, the I Class was referred to as the Institutional Class. |
| |
(4) | April 10, 2017 (commencement of sale) through October 31, 2017. |
| |
(6) | Portfolio turnover is calculated at the fund level. Percentage indicated was calculated for the year ended October 31, 2017. |
| |
(7) | Per-share amount was less than $0.005. |
See Notes to Financial Statements.
|
|
Report of Independent Registered Public Accounting Firm |
To the Board of Directors and Shareholders of American Century Mutual Funds, Inc.:
We have audited the accompanying statement of assets and liabilities, including the schedule of investments, of Sustainable Equity Fund (the “Fund”), one of the funds constituting American Century Mutual Funds, Inc., as of October 31, 2017, and the related statement of operations for the year then ended, the statements of changes in net assets for each of the two years in the period then ended, and the financial highlights for each of the periods presented. These financial statements and financial highlights are the responsibility of the Fund’s management. Our responsibility is to express an opinion on these financial statements and financial highlights based on our audits.
We conducted our audits in accordance with the standards of the Public Company Accounting Oversight Board (United States). Those standards require that we plan and perform the audit to obtain reasonable assurance about whether the financial statements and financial highlights are free of material misstatement. The Fund is not required to have, nor were we engaged to perform, an audit of its internal control over financial reporting. Our audits included consideration of internal control over financial reporting as a basis for designing audit procedures that are appropriate in the circumstances, but not for the purpose of expressing an opinion on the effectiveness of the Fund’s internal control over financial reporting. Accordingly, we express no such opinion. An audit also includes examining, on a test basis, evidence supporting the amounts and disclosures in the financial statements, assessing the accounting principles used and significant estimates made by management, as well as evaluating the overall financial statement presentation. Our procedures included confirmation of securities owned as of October 31, 2017, by correspondence with the custodian and brokers; when replies were not received from brokers, we performed other auditing procedures. We believe that our audits provide a reasonable basis for our opinion.
In our opinion, the financial statements and financial highlights referred to above present fairly, in all material respects, the financial position of Sustainable Equity Fund of American Century Mutual Funds, Inc. as of October 31, 2017, the results of its operations for the year then ended, the changes in its net assets for each of the two years in the period then ended, and the financial highlights for each of the periods presented, in conformity with accounting principles generally accepted in the United States of America.
DELOITTE & TOUCHE LLP
Kansas City, Missouri
December 15, 2017
The Board of Directors
The individuals listed below serve as directors of the funds. Each director will continue to serve in this capacity until death, retirement, resignation or removal from office. The board has adopted a mandatory retirement age for directors who are not “interested persons,” as that term is defined in the Investment Company Act (independent directors). Independent directors shall retire by December 31 of the year in which they reach their 75th birthday.
Mr. Thomas is an “interested person” because he currently serves as President and Chief Executive Officer of American Century Companies, Inc. (ACC), the parent company of American Century Investment Management, Inc. (ACIM or the advisor). The other directors (more than three-fourths of the total number) are independent. They are not employees, directors or officers of, and have no financial interest in, ACC or any of its wholly owned, direct or indirect, subsidiaries, including ACIM, American Century Investment Services, Inc. (ACIS) and American Century Services, LLC (ACS), and they do not have any other affiliations, positions or relationships that would cause them to be considered “interested persons” under the Investment Company Act. The directors serve in this capacity for seven (in the case of Mr. Thomas, 15) registered investment companies in the American Century Investments family of funds.
The following table presents additional information about the directors. The mailing address for each director is 4500 Main Street, Kansas City, Missouri 64111.
|
| | | | | |
Name
(Year of Birth) | Position(s) Held with Funds | Length of Time Served | Principal Occupation(s) During Past 5 Years | Number of American Century Portfolios Overseen by Director | Other Directorships Held During Past 5 Years |
Independent Directors |
|
|
Thomas W. Bunn (1953) | Director | Since 2017 | Retired | 69 | SquareTwo Financial; Barings (formerly Babson Capital Funds Trust) (2013 to 2016) |
Barry Fink
(1955) | Director | Since 2012 (independent since 2016) | Retired; Executive Vice President, ACC (2007 to 2013); President, ACS (2007 to 2013); Chief Operating Officer, ACC (2007 to 2012) | 69 | None |
Andrea C. Hall
(1945) | Director | Since 1997 | Retired | 69 | None |
Jan M. Lewis
(1957) | Director | Since 2011 | Retired; President and Chief Executive Officer, Catholic Charities of Northeast Kansas (human services organization) (2006 to 2013) | 69 | None |
James A. Olson
(1942) | Director and Chairman of the Board | Since 2007 (Chairman since 2014) | Member, Plaza Belmont LLC (private equity fund manager) (1999 to present) | 69 | Saia, Inc. (2002 to 2012) and EPR Properties (2003 to 2013) |
|
| | | | | |
Name
(Year of Birth) | Position(s) Held with Funds | Length of Time Served | Principal Occupation(s) During Past 5 Years | Number of American Century Portfolios Overseen by Director | Other Directorships Held During Past 5 Years |
Independent Directors |
|
|
M. Jeannine Strandjord
(1945) | Director | Since 1994 | Retired | 69 | Euronet Worldwide Inc.; MGP Ingredients, Inc.; and DST Systems Inc. (1996 to 2012) |
John R. Whitten
(1946) | Director | Since 2008 | Retired | 69 | Rudolph Technologies, Inc. |
Stephen E. Yates
(1948) | Director | Since 2012 | Retired | 69 | None |
Interested Director |
|
|
Jonathan S. Thomas
(1963) | Director and President | Since 2007 | President and Chief Executive Officer, ACC (2007 to present). Also serves as Chief Executive Officer, ACS; Executive Vice President, ACIM; Director, ACC, ACIM and other ACC subsidiaries | 114 | BioMed Valley Discoveries, Inc. |
The Statement of Additional Information has additional information about the fund's directors and is available without charge, upon request, by calling 1-800-345-2021.
Officers
The following table presents certain information about the executive officers of the funds. Each officer serves as an officer for each of the 15 investment companies in the American Century family of funds, unless otherwise noted. No officer is compensated for his or her service as an officer of the funds. The listed officers are interested persons of the funds and are appointed or re-appointed on an annual basis. The mailing address for each officer listed below is 4500 Main Street, Kansas City, Missouri 64111.
|
| | |
Name
(Year of Birth) | Offices with the Funds | Principal Occupation(s) During the Past Five Years |
Jonathan S. Thomas
(1963) | Director and President since 2007 | President and Chief Executive Officer, ACC (2007 to present). Also serves as Chief Executive Officer, ACS; Executive Vice President, ACIM; Director, ACC, ACIM and other ACC subsidiaries |
Amy D. Shelton
(1964) | Chief Compliance Officer and Vice President since 2014 | Chief Compliance Officer, American Century funds, (2014 to present); Chief Compliance Officer, ACIM (2014 to present); Chief Compliance Officer, ACIS (2009 to present); Vice President, Client Interactions and Marketing, ACIS (2013 to 2014); Director, Client Interactions and Marketing, ACIS (2007 to 2013). Also serves as Vice President, ACIS |
Charles A. Etherington
(1957) | General Counsel since 2007 and Senior Vice President since 2006 | Attorney, ACC (1994 to present); Vice President, ACC (2005 to present); General Counsel, ACC (2007 to present). Also serves as General Counsel, ACIM, ACS, ACIS and other ACC subsidiaries; and Senior Vice President, ACIM and ACS |
C. Jean Wade
(1964) | Vice President,Treasurer and Chief Financial Officer since 2012 | Vice President, ACS (2000 to present) |
Robert J. Leach
(1966) | Vice President since 2006 and Assistant Treasurer since 2012 | Vice President, ACS (2000 to present) |
David H. Reinmiller
(1963) | Vice President since 2000 | Attorney, ACC (1994 to present); Associate General Counsel, ACC (2001 to present). Also serves as Vice President, ACIM and ACS |
Ward D. Stauffer
(1960) | Secretary since 2005 | Attorney, ACC (2003 to present) |
|
|
Approval of Management Agreement |
At a meeting held on June 29, 2017, the Fund’s Board of Directors (the "Board") unanimously approved the renewal of the management agreement pursuant to which American Century Investment Management, Inc. (the “Advisor”) acts as the investment advisor for the Fund. Under Section 15(c) of the Investment Company Act, contracts for investment advisory services are required to be reviewed, evaluated, and approved by a majority of a fund’s directors (the “Directors”), including a majority of the independent Directors, each year.
Prior to its consideration of the renewal of the management agreement, the Directors requested and reviewed extensive data and information compiled by the Advisor and certain independent providers of evaluation data concerning the Fund and the services provided to the Fund by the Advisor. This review was in addition to the oversight and evaluation undertaken by the Board and its committees on a continual basis and the information received was supplemental to the extensive information that the Board and its committees receive and consider throughout the year.
In connection with its consideration of the renewal of the management agreement, the Board’s review and evaluation of the services provided by the Advisor included, but was not limited to, the following:
| |
• | the nature, extent, and quality of investment management, shareholder services, and other services provided and to be provided to the Fund; |
| |
• | the wide range of other programs and services provided and to be provided to the Fund and its shareholders on a routine and non-routine basis; |
| |
• | the investment performance of the Fund, including data comparing the Fund's performance to appropriate benchmarks and/or a peer group of other mutual funds with similar investment objectives and strategies; |
| |
• | the cost of owning the Fund compared to the cost of owning similar funds; |
| |
• | the compliance policies, procedures, and regulatory experience of the Advisor and the Fund's service providers; |
| |
• | financial data showing the cost of services provided to the Fund, the profitability of the Fund to the Advisor, and the overall profitability of the Advisor; |
| |
• | strategic plans of the Advisor |
| |
• | possible economies of scale associated with the Advisor’s management of the Fund and other accounts under its management; |
| |
• | data comparing services provided and charges to the Advisor's other investment management clients; |
| |
• | acquired fund fees and expenses; |
| |
• | payments and practices by the Fund and the Advisor regarding financial intermediaries, the nature of services provided by intermediaries, and the terms of share classes utilized; and |
| |
• | any collateral benefits derived by the Advisor from the management of the Fund. |
The Directors held three in-person meetings and one telephonic meeting to review and discuss the information provided. The independent Directors also reviewed responses to supplemental information requests and held active discussions with the Advisor regarding the renewal of the management agreement. The independent Directors had the benefit of the advice of their independent counsel throughout the process.
Factors Considered
The Directors considered all of the information provided by the Advisor, the independent data providers, and independent counsel in connection with the approval. They determined that the
information was sufficient for them to evaluate the management agreement for the Fund. In connection with their review, the Directors did not identify any single factor as being all-important or controlling, and each Director may have attributed different levels of importance to different factors. In deciding to renew the management agreement, the Board based its decision on a number of factors, including without limitation the following:
Nature, Extent and Quality of Services - Generally. Under the management agreement, the Advisor is responsible for providing or arranging for all services necessary for the operation of the Fund. The Board noted that the Advisor provides or arranges at its own expense a wide variety of services including without limitation the following:
| |
• | portfolio research and security selection |
| |
• | daily valuation of the Fund’s portfolio |
| |
• | shareholder servicing and transfer agency, including shareholder confirmations, recordkeeping, and communications |
| |
• | legal services (except the independent Directors’ counsel) |
| |
• | regulatory and portfolio compliance |
| |
• | marketing and distribution (except amounts paid by the Fund under Rule 12b-1 plans) |
The Board noted that many of these services have expanded over time in terms of both quantity and complexity in response to shareholder demands, competition in the industry, changing distribution channels, and the changing regulatory environment. The Board noted specifically the resources the Advisor has committed during the year to compliance with the Department of Labor fiduciary rule and share class modernization.
Investment Management Services. The nature of the investment management services provided to the Fund is quite complex and allows Fund shareholders access to professional money management, instant diversification of their investments within an asset class, the opportunity to easily diversify among asset classes by investing in or exchanging among various American Century Investments funds, and liquidity. In evaluating investment performance, the Board expects the Advisor to manage the Fund in accordance with its investment objectives and approved strategies. Further, the Directors recognize that the Advisor has an obligation to monitor trading activities, and in particular to seek the best execution of fund trades, and to evaluate the use of and payment for research. In providing these services, the Advisor utilizes teams of investment professionals (portfolio managers, analysts, research assistants, and securities traders) who require extensive information technology, research, training, compliance, and other systems to conduct their business. The Board, directly and through its Fund Performance Review Committee, provides oversight of the investment performance process. It regularly reviews investment performance information for the Fund, together with comparative information for appropriate benchmarks and/or peer groups of similarly-managed funds, over different time horizons. The Directors also review detailed performance information provided by the Advisor during the management agreement renewal process. If performance concerns are identified, the Fund receives special reviews until performance improves, during which the Board receives a report from the Advisor regarding the reasons for such results (e.g., market conditions, security selection) and any efforts being undertaken to improve performance. The Fund’s performance was above its benchmark for the ten-year period and below its benchmark for the one-, three-, and five-year periods reviewed by the Board. The Board discussed the Fund's performance with the Advisor and was satisfied with the efforts being undertaken by the Advisor. The Board found the investment management services provided by the Advisor to the Fund to be satisfactory and consistent with the management agreement.
Shareholder and Other Services. Under the management agreement, the Advisor provides the Fund with a comprehensive package of transfer agency, shareholder, and other services. The Board, directly and through various committees of the Board, regularly reviews reports and evaluations of such services at its regular meetings. These reports include, but are not limited to, information regarding the operational efficiency and accuracy of the shareholder and transfer agency services provided, staffing levels, shareholder satisfaction (as measured by external as well as internal sources), technology support, new products and services offered to Fund shareholders, securities trading activities, portfolio valuation services, auditing services, and legal and operational compliance activities. Certain aspects of shareholder and transfer agency service level efficiency and the quality of securities trading activities are measured by independent third party providers and are presented in comparison to other fund groups not managed by the Advisor. The Board found the services provided by the Advisor to the Fund under the management agreement to be competitive and of high quality.
Costs of Services and Profitability. The Advisor provides detailed information concerning its cost of providing various services to the Fund, its profitability in managing the Fund (pre- and post-distribution), its overall profitability, and its financial condition. The Directors have reviewed with the Advisor the methodology used to prepare this financial information. This information is considered in evaluating the Advisor’s financial condition, its ability to continue to provide services under the management agreement, and the reasonableness of the current management fee. The Board concluded that the Advisor’s profits were reasonable in light of the services provided to the Fund.
Ethics. The Board generally considers the Advisor’s commitment to providing quality services to shareholders and to conducting its business ethically. They noted that the Advisor’s practices generally meet or exceed industry best practices.
Economies of Scale. The Board also reviewed information provided by the Advisor regarding the possible existence of economies of scale in connection with the management of the Fund. The Board concluded that economies of scale are difficult to measure and predict with precision, especially on a fund-by-fund basis. The Board concluded that the Advisor is appropriately sharing economies of scale through its competitive fee structure, offering competitive fees from fund inception, and through reinvestment in its business to provide shareholders additional content and services. The Board also noted that economies of scale are shared with the Fund and its shareholders through management fee breakpoints that serve to reduce the effective management fee as the assets of the Fund grow.
Comparison to Other Funds’ Fees. The management agreement provides that the Fund pays the Advisor a single, all-inclusive (or unified) management fee for providing all services necessary for the management and operation of the Fund, other than brokerage expenses, expenses attributable to short sales, taxes, interest, extraordinary expenses, and the fees and expenses of the Fund’s independent Directors (including their independent legal counsel) and expenses incurred in connection with the provision of shareholder services and distribution services under a plan adopted pursuant to Rule 12b-1 under the 1940 Act. Under the unified fee structure, the Advisor is responsible for providing all investment advisory, custody, audit, administrative, compliance, recordkeeping, marketing and shareholder services, or arranging and supervising third parties to provide such services. By contrast, most other funds are charged a variety of fees, including an investment advisory fee, a transfer agency fee, an administrative fee, distribution charges, and other expenses. Other than their investment advisory fees and any applicable Rule 12b-1 distribution fees, all other components of the total fees charged by these other funds may be increased without shareholder approval. The Board believes the unified fee structure is a benefit to Fund shareholders because it clearly discloses to shareholders the cost of owning Fund shares, and, since the unified fee cannot be increased without a vote of Fund shareholders, it shifts to the Advisor the risk of increased costs of operating the Fund and provides a direct incentive to minimize administrative inefficiencies. Part of the Board’s analysis of fee levels involves reviewing certain evaluative data compiled by an independent provider comparing the Fund’s unified fee to the total expense ratios of its peers. The unified fee charged to shareholders of the Fund was
above the median of the total expense ratios of the Fund’s peer expense universe and was within the range of its peer expense group. The Board concluded that the management fee paid by the Fund to the Advisor under the management agreement is reasonable in light of the services provided to the Fund.
Comparison to Fees and Services Provided to Other Clients of the Advisor. The Directors also requested and received information from the Advisor concerning the nature of the services, fees, costs, and profitability of its advisory services to advisory clients other than the Fund. They observed that these varying types of client accounts require different services and involve different regulatory and entrepreneurial risks than the management of the Fund. The Board analyzed this information and concluded that the fees charged and services provided to the Fund were reasonable by comparison.
Payments to Intermediaries. The Directors also requested and received a description of payments made to intermediaries by the Fund and the Advisor and services provided in response thereto. These payments include various payments made by the Fund or the Advisor to different types of intermediaries and recordkeepers for distribution and service activities provided for the Fund. The Board reviewed such information and received representations from the Advisor that all such payments by the Fund were made pursuant to the Fund's Rule 12b-1 Plan and that all such payments by the Advisor were made from the Advisor's resources and reasonable profits. The Board found the payments to be reasonable in scope and purpose.
Collateral or “Fall-Out” Benefits Derived by the Advisor. The Board considered the existence of collateral benefits the Advisor may receive as a result of its relationship with the Fund. They concluded that the Advisor’s primary business is managing mutual funds and it generally does not use fund or shareholder information to generate profits in other lines of business, and therefore does not derive any significant collateral benefits from them. The Board noted that additional assets from other clients may offer the Advisor some benefit from increased leverage with service providers and counterparties. Additionally, the Advisor receives proprietary research from broker-dealers that execute fund portfolio transactions, which the Board concluded is likely to benefit other clients of the Advisor, as well as Fund shareholders. The Board also determined that the Advisor is able to provide investment management services to certain clients other than the Fund, at least in part, due to its existing infrastructure built to serve the fund complex. The Board concluded that appropriate allocation methodologies had been employed to assign resources and the cost of those resources to these other clients and, where expressly provided, these other client assets may be included with the assets of the Fund to determine breakpoints in the management fee schedule.
Existing Relationship. The Board also considered whether there was any reason for not continuing the existing arrangement with the Advisor. In this regard, the Board was mindful of the potential disruptions of the Fund’s operations and various risks, uncertainties, and other effects that could occur as a result of a decision not to continue such relationship. In particular, the Board recognized that most shareholders have invested in the Fund on the strength of the Advisor’s industry standing and reputation and in the expectation that the Advisor will have a continuing role in providing advisory services to the Fund.
Conclusion of the Directors. As a result of this process, the Board, including all of the independent Directors, taking into account all of the factors discussed above and the information provided by the Advisor and others in connection with its review and throughout the year, determined that the management fee is fair and reasonable in light of the services provided and that the investment management agreement between the Fund and the Advisor should be renewed.
A special meeting of shareholders was held on October 18, 2017, to vote on the following proposal. The proposal received the required votes and was adopted. A summary of voting results is listed below.
To elect four directors to the Board of Directors of American Century Mutual Funds, Inc.:
|
| | | | | | | |
| Affirmative |
| Withhold |
Thomas W. Bunn | $ | 19,547,896,641 |
|
| $ | 402,531,816 |
|
Barry Fink | $ | 19,543,961,253 |
|
| $ | 406,467,204 |
|
Jan M. Lewis | $ | 19,556,221,886 |
|
| $ | 394,206,571 |
|
Stephen E. Yates | $ | 19,543,817,152 |
|
| $ | 406,611,305 |
|
The other directors whose term of office continued after the meeting include Jonathan S. Thomas, Andrea C. Hall, James A. Olson, M. Jeannine Strandjord, and John R. Whitten.
Retirement Account Information
As required by law, distributions you receive from certain retirement accounts are subject to federal income tax withholding, unless you elect not to have withholding apply*. Tax will be withheld on the total amount withdrawn even though you may be receiving amounts that are not subject to withholding, such as nondeductible contributions. In such case, excess amounts of withholding could occur. You may adjust your withholding election so that a greater or lesser amount will be withheld.
If you don’t want us to withhold on this amount, you must notify us to not withhold the federal income tax. You may notify us in writing or in certain situations by telephone or through other electronic means. For systematic withdrawals, your withholding election will remain in effect until revoked or changed by filing a new election. You have the right to revoke your election at any time and change your withholding percentage for future distributions.
Remember, even if you elect not to have income tax withheld, you are liable for paying income tax on the taxable portion of your withdrawal. If you elect not to have income tax withheld or you don’t have enough income tax withheld, you may be responsible for payment of estimated tax. You may incur penalties under the estimated tax rules if your withholding and estimated tax payments are not sufficient. You can reduce or defer the income tax on a distribution by directly or indirectly rolling such distribution over to another IRA or eligible plan. You should consult your tax advisor for additional information.
State tax will be withheld if, at the time of your distribution, your address is within one of the mandatory withholding states and you have federal income tax withheld (or as otherwise required by state law). State taxes will be withheld from your distribution in accordance with the respective state rules.
*Some 403(b), 457 and qualified retirement plan distributions may be subject to 20% mandatory withholding, as they are subject to special tax and withholding rules. Your plan administrator or plan sponsor is required to provide you with a special tax notice explaining those rules at the time you request a distribution. If applicable, federal and/or state taxes may be withheld from your distribution amount.
Proxy Voting Policies
A description of the policies that the fund's investment advisor uses in exercising the voting rights associated with the securities purchased and/or held by the fund is available without charge, upon request, by calling 1-800-345-2021. It is also available on the "About Us" page of American Century Investments’ website at americancentury.com and on the Securities and Exchange Commission’s website at sec.gov. Information regarding how the investment advisor voted proxies relating to portfolio securities during the most recent 12-month period ended June 30 is available on the "About Us" page at americancentury.com. It is also available at sec.gov.
Quarterly Portfolio Disclosure
The fund files its complete schedule of portfolio holdings with the Securities and Exchange Commission (SEC) for the first and third quarters of each fiscal year on Form N-Q. The fund’s Forms N-Q are available on the SEC’s website at sec.gov, and may be reviewed and copied at the SEC’s Public Reference Room in Washington, DC. Information on the operation of the Public Reference Room may be obtained by calling 1-800-SEC-0330. The fund also makes its complete schedule of portfolio holdings for the most recent quarter of its fiscal year available on its website at americancentury.com and, upon request, by calling 1-800-345-2021.
Other Tax Information
The following information is provided pursuant to provisions of the Internal Revenue Code.
The fund hereby designates up to the maximum amount allowable as qualified dividend income for the fiscal year ended October 31, 2017.
For corporate taxpayers, the fund hereby designates $2,089,767, or up to the maximum amount allowable, of ordinary income distributions paid during the fiscal year ended October 31, 2017, as qualified for the corporate dividends received deduction.
The fund hereby designates $1,118,984, or up to the maximum amount allowable, as long-term capital gain distributions (20% rate gain distributions) for the fiscal year ended October 31, 2017.
The fund utilized earnings and profits of $1,291,092 distributed to shareholders on redemption of shares as part of the dividends paid deduction (tax equalization).
|
| | |
| |
| | |
Contact Us | americancentury.com | |
Automated Information Line | 1-800-345-8765 | |
Investor Services Representative | 1-800-345-2021 or 816-531-5575 | |
Investors Using Advisors | 1-800-378-9878 | |
Business, Not-For-Profit, Employer-Sponsored Retirement Plans | 1-800-345-3533 | |
Banks and Trust Companies, Broker-Dealers, Financial Professionals, Insurance Companies | 1-800-345-6488 | |
Telecommunications Relay Service for the Deaf | 711 | |
| | |
American Century Mutual Funds, Inc. | |
| | |
Investment Advisor: American Century Investment Management, Inc. Kansas City, Missouri | |
| | |
This report and the statements it contains are submitted for the general information of our shareholders. The report is not authorized for distribution to prospective investors unless preceded or accompanied by an effective prospectus. | |
| | |
©2017 American Century Proprietary Holdings, Inc. All rights reserved.
CL-ANN-90971 1712 | |
|
| |
| |
| Annual Report |
| |
| October 31, 2017 |
| |
| Ultra® Fund |
|
| | |
President’s Letter | 2 |
|
Performance | 3 |
|
Portfolio Commentary | |
|
Fund Characteristics | |
|
Shareholder Fee Example | |
|
Schedule of Investments | |
|
Statement of Assets and Liabilities | |
|
Statement of Operations | |
|
Statement of Changes in Net Assets | |
|
Notes to Financial Statements | |
|
Financial Highlights | |
|
Report of Independent Registered Public Accounting Firm | |
|
Management | |
|
Approval of Management Agreement | |
|
Proxy Voting Results | |
|
Additional Information | |
|
Any opinions expressed in this report reflect those of the author as of the date of the report, and do not necessarily represent the opinions of American Century Investments® or any other person in the American Century Investments organization. Any such opinions are subject to change at any time based upon market or other conditions and American Century Investments disclaims any responsibility to update such opinions. These opinions may not be relied upon as investment advice and, because investment decisions made by American Century Investments funds are based on numerous factors, may not be relied upon as an indication of trading intent on behalf of any American Century Investments fund. Security examples are used for representational purposes only and are not intended as recommendations to purchase or sell securities. Performance information for comparative indices and securities is provided to American Century Investments by third party vendors. To the best of American Century Investments’ knowledge, such information is accurate at the time of printing.
Jonathan Thomas
Dear Investor:
Thank you for reviewing this annual report for the period ended October 31, 2017. Annual reports help convey important information about fund returns, including market factors that affected performance during the reporting period. For additional, updated investment and market insights, we encourage you to visit our website, americancentury.com.
‘Risk-On’ Sentiment Sparked Strong Gains Among Stocks
U.S. stocks delivered robust double-digit gains for the reporting period. The “risk-on” rally began early in the period, following Donald Trump’s election victory in November 2016. Investor expectations for President Trump’s administration to usher in pro-growth policies and reforms drove stock prices higher. In addition, healthy corporate earnings growth and improving gross domestic product (GDP) and other economic data provided additional support for stocks. Against this backdrop, the S&P 500 Index reached several milestone levels during the period and returned 23.63%. In terms of equity styles, riskier and economically sensitive stocks generally remained in favor. For example, small-cap stocks generally outperformed their mid- and large-cap peers, while growth stocks broadly outperformed their value counterparts across the capitalization spectrum. Real estate investment trusts (REITs) advanced, but global property stocks significantly underperformed the broader stock market as interest rates increased, most notably in the U.S., where the Federal Reserve (Fed) raised rates three times during the period.
As stocks soared in the post-election environment, global bonds sold off sharply. President Trump’s policy agenda fueled inflation fears that sent global bond yields sharply higher in late 2016. However, broad bond market performance generally recovered beginning in early 2017, advancing on subdued inflation and continued central bank accommodation to post modest gains for the entire reporting period. Investor preferences for risk also extended to the global fixed-income market, where high-yield corporate and emerging markets bonds were top performers.
As Congress considers tax cuts and other pro-growth reforms and the Fed and other central banks pursue policy normalization, investors likely will face new opportunities and challenges in the months ahead. We continue to believe in a disciplined, diversified, and risk-aware approach, using professionally managed portfolios in pursuit of investment goals. We appreciate your continued trust in us.
Sincerely,
Jonathan Thomas
President and Chief Executive Officer
American Century Investments
|
| | | | | | | | | |
Total Returns as of October 31, 2017 |
| | | Average Annual Returns | |
| Ticker Symbol | 1 year | 5 years | 10 years | Since Inception | Inception Date |
Investor Class | TWCUX | 30.42% | 16.78% | 8.36% | — | 11/2/81 |
Russell 1000 Growth Index | — | 29.71% | 16.82% | 9.12% | — | — |
S&P 500 Index | — | 23.63% | 15.17% | 7.51% | — | — |
I Class | TWUIX | 30.66% | 17.00% | 8.58% | — | 11/14/96 |
Y Class | AULYX | — |
| — |
| — |
| 16.93% | 4/10/17 |
A Class | TWUAX | | | | | 10/2/96 |
No sales charge | | 30.10% | 16.48% | 8.09% | — | |
With sales charge | | 22.63% | 15.11% | 7.45% | — | |
C Class | TWCCX | 29.12% | 15.61% | 7.28% | — | 10/29/01 |
R Class | AULRX | 29.75% | 16.19% | 7.82% | — | 8/29/03 |
R5 Class | AULGX | — | — | — | 16.82% | 4/10/17 |
R6 Class | AULDX | 30.86% | — | — | 15.23% | 7/26/13 |
Average annual returns since inception are presented when ten years of performance history is not available.
Prior to April 10, 2017, the I Class was referred to as the Institutional Class. Fund returns would have been lower if a portion of the fees had not been waived. Extraordinary performance is attributable in part to unusually favorable market conditions and may not be repeated or consistently achieved in the future.
Sales charges include initial sales charges and contingent deferred sales charges (CDSCs), as applicable. A Class shares have a 5.75% maximum initial sales charge and may be subject to a maximum CDSC of 1.00%. C Class shares redeemed within 12 months of purchase are subject to a maximum CDSC of 1.00%. The SEC requires that mutual funds provide performance information net of maximum sales charges in all cases where charges could be applied.
Data presented reflect past performance. Past performance is no guarantee of future results. Current performance may be higher or lower than the performance shown. Total returns for periods less than one year are not annualized. Investment return and principal value will fluctuate, and redemption value may be more or less than original cost. Data assumes reinvestment of dividends and capital gains, and none of the charts reflect the deduction of taxes that a shareholder would pay on fund distributions or the redemption of fund shares. To obtain performance data current to the most recent month end, please call 1-800-345-2021 or visit americancentury.com. For additional information about the fund, please consult the prospectus.
|
|
Growth of $10,000 Over 10 Years |
$10,000 investment made October 31, 2007 |
Performance for other share classes will vary due to differences in fee structure. |
|
| |
Value on October 31, 2017 |
| Investor Class — $22,335 |
|
| Russell 1000 Growth Index — $23,964 |
|
| S&P 500 Index — $20,638 |
|
Ending value of Investor Class would have been lower if a portion of the fees had not been waived.
|
| | | | | | | |
Total Annual Fund Operating Expenses |
Investor Class | I Class | Y Class | A Class | C Class | R Class | R5 Class | R6 Class |
0.98% | 0.78% | 0.63% | 1.23% | 1.98% | 1.48% | 0.78% | 0.63% |
The total annual fund operating expenses shown is as stated in the fund’s prospectus current as of the date of this report. The prospectus may vary from the expense ratio shown elsewhere in this report because it is based on a different time period, includes acquired fund fees and expenses, and, if applicable, does not include fee waivers or expense reimbursements.
Data presented reflect past performance. Past performance is no guarantee of future results. Current performance may be higher or lower than the performance shown. Total returns for periods less than one year are not annualized. Investment return and principal value will fluctuate, and redemption value may be more or less than original cost. Data assumes reinvestment of dividends and capital gains, and none of the charts reflect the deduction of taxes that a shareholder would pay on fund distributions or the redemption of fund shares. To obtain performance data current to the most recent month end, please call 1-800-345-2021 or visit americancentury.com. For additional information about the fund, please consult the prospectus.
Portfolio Managers: Keith Lee, Michael Li, and Jeff Bourke
Performance Summary
Ultra returned 30.42%* for the 12 months ended October 31, 2017, outpacing the 29.71% return of the portfolio’s benchmark, the Russell 1000 Growth Index.
U.S. stock indices posted strong returns during the reporting period. Growth stocks outperformed value stocks by a wide margin across the capitalization spectrum, providing a tailwind for the fund. Within the Russell 1000 Growth Index, all sectors but energy posted strong gains. The small utilities segment—a sector that rarely offers the kind of growth characteristics we seek—reported the top total return, but index gains were largely driven by the strong performance of information technology stocks.
Stock selection in the consumer staples sector led the fund’s outperformance relative to the benchmark. An underweight allocation was helpful as well, especially among food products and beverages companies. Stock decisions in health care and information technology were also beneficial. Stock choices in the consumer discretionary and industrials sectors hampered performance, as did an overweight allocation to energy stocks.
Consumer Staples Led Contributors
Within the consumer staples sector, not owning benchmark holding Altria benefited performance. The tobacco company lagged on concerns that the Food and Drug Administration would impose nicotine restrictions on cigarettes that would make them nonaddictive.
Health care equipment and supplies companies were among the fund’s top contributors. Medical device company Intuitive Surgical benefited from Food and Drug Administration clearance for its new da Vinci X robotic platform, which offers several technologies at a lower price than its previous platform. Elsewhere in the health care sector, biotechnology company Kite Pharma, a leader in immunotherapy drugs, soared on news that it would be acquired by Gilead Sciences. The holding was eliminated as a result.
Among other significant contributors, Yaskawa Electric, a leading robotics manufacturer, reported quarterly results that exceeded expectations. The company’s order book accelerated, and revenue is growing faster than expected. The company raised full-year guidance for revenue and profit. Airplane manufacturer Boeing reported strong earnings, cash flow, and forward guidance for profitability of the company’s 787 airliner. Investors increasingly appear to believe in the stock more as a secular than a cyclical growth story and have become more comfortable with the business for the long term. Apple outperformed as the company reported results ahead of expectations due to iPhone and services. Investors appeared excited about the new iPhone that was introduced in September 2017. In addition, Warren Buffett took a large stake in the company, which we believe reflects the quality of the business and the brand and the sustainable nature of the business.
Consumer Discretionary Stocks Detracted
Retailers struggled during the year, hampering some holdings in the consumer discretionary sector. Aftermarket parts retailer O’Reilly Automotive reported sales that missed expectations and warned of weak consumer demand that drove the stock significantly lower. Investors are also fearful of
*All fund returns referenced in this commentary are for Investor Class shares. Performance for other share classes will vary due to differences in fee structure; when Investor Class performance exceeds that of the fund’s benchmark, other share classes may not. See page 3 for returns for all share classes.
increased competition from Amazon in a space that previously seemed relatively immune from online threats. Off-price retailer TJX underperformed after reporting results that were in line with expectations but below historical growth levels. Athletic apparel firm Under Armour reported strong sales but overall results were below expectations. The company is being impacted by increased competition and consolidation among sporting goods retailers that carry its products.
In the industrials sector, lighting manufacturer Acuity Brands continued to struggle with weaker-than-expected demand in its North American market. The company appears to be stabilizing after a strong period, but investors were hoping for greater sustainability in its growth. Wabtec, a maker of technology products and services for the railroad industry, reported disappointing results as an expected cyclical recovery in rail continued to be delayed. Capital spending trends have not rebounded because railroad companies did a better job of maintaining their rolling stock going into the downturn.
In information technology, not owning benchmark stock NVIDIA hampered performance. Although the graphics-chips manufacturer performed well, we believe the company’s fundamentals don’t support the high expectations for the company.
Outlook
We remain confident in our belief that high-quality companies with a capability for sustained long-term growth will outperform in the long term. Our portfolio positioning reflects where we are seeing opportunities as a result of the application of that philosophy and process.
As of October 31, 2017, this process pointed the portfolio toward overweight positions relative to the Russell 1000 Growth Index in the information technology, health care, and consumer discretionary sectors. The industrials and real estate sectors represented the largest underweights.
In the information technology sector, we continue to find strong growth opportunities through bottom-up fundamental analysis. In health care, valuations of drug and medical supplies companies have corrected, and we see opportunity where earnings growth is driven by innovation. Despite potential measures to control drug pricing, drug pipelines are robust, with ample clinical trial readouts.
The portfolio’s industrials sector weighting reflects generally modest fundamentals combined with valuations that are not compelling. The portfolio has no holdings in the real estate sector. The sector has benefited from a long period of falling and low interest rates but appears likely to struggle as rates rise.
|
| |
OCTOBER 31, 2017 | |
Top Ten Holdings | % of net assets |
Apple, Inc. | 9.3% |
Alphabet, Inc.* | 6.4% |
Amazon.com, Inc. | 4.9% |
Facebook, Inc., Class A | 4.5% |
Visa, Inc., Class A | 3.9% |
UnitedHealth Group, Inc. | 3.6% |
MasterCard, Inc., Class A | 3.2% |
Intuitive Surgical, Inc. | 3.0% |
Boeing Co. (The) | 2.3% |
Microsoft Corp. | 2.3% |
*Includes all classes of the issuer held by the fund. | |
| |
Top Five Industries | % of net assets |
Internet Software and Services | 12.8% |
Technology Hardware, Storage and Peripherals | 9.3% |
IT Services | 8.5% |
Internet and Direct Marketing Retail | 6.1% |
Biotechnology | 5.8% |
| |
Types of Investments in Portfolio | % of net assets |
Common Stocks | 98.8% |
Temporary Cash Investments | 1.3% |
Other Assets and Liabilities | (0.1)% |
Fund shareholders may incur two types of costs: (1) transaction costs, including sales charges (loads) on purchase payments and redemption/exchange fees; and (2) ongoing costs, including management fees; distribution and service (12b-1) fees; and other fund expenses. This example is intended to help you understand your ongoing costs (in dollars) of investing in your fund and to compare these costs with the ongoing cost of investing in other mutual funds.
The example is based on an investment of $1,000 made at the beginning of the period and held for the entire period from May 1, 2017 to October 31, 2017.
Actual Expenses
The table provides information about actual account values and actual expenses for each class. You may use the information, together with the amount you invested, to estimate the expenses that you paid over the period. First, identify the share class you own. Then simply divide your account value by $1,000 (for example, an $8,600 account value divided by $1,000 = 8.6), then multiply the result by the number under the heading “Expenses Paid During Period” to estimate the expenses you paid on your account during this period.
If you hold Investor Class shares of any American Century Investments fund, or I Class shares of the American Century Diversified Bond Fund, in an American Century Investments account (i.e., not a financial intermediary or retirement plan account), American Century Investments may charge you a $12.50 semiannual account maintenance fee if the value of those shares is less than $10,000. We will redeem shares automatically in one of your accounts to pay the $12.50 fee. In determining your total eligible investment amount, we will include your investments in all personal accounts (including American Century Investments Brokerage accounts) registered under your Social Security number. Personal accounts include individual accounts, joint accounts, UGMA/UTMA accounts, personal trusts, Coverdell Education Savings Accounts and IRAs (including traditional, Roth, Rollover, SEP-, SARSEP- and SIMPLE-IRAs), and certain other retirement accounts. If you have only business, business retirement, employer-sponsored or American Century Investments Brokerage accounts, you are currently not subject to this fee. If you are subject to the Account Maintenance Fee, your account value could be reduced by the fee amount.
Hypothetical Example for Comparison Purposes
The table also provides information about hypothetical account values and hypothetical expenses based on the actual expense ratio of each class of your fund and an assumed rate of return of 5% per year before expenses, which is not the actual return of a fund’s share class. The hypothetical account values and expenses may not be used to estimate the actual ending account balance or expenses you paid for the period. You may use this information to compare the ongoing costs of investing in your fund and other funds. To do so, compare this 5% hypothetical example with the 5% hypothetical examples that appear in the shareholder reports of the other funds.
Please note that the expenses shown in the table are meant to highlight your ongoing costs only and do not reflect any transactional costs, such as sales charges (loads) or redemption/exchange fees. Therefore, the table is useful in comparing ongoing costs only, and will not help you determine the relative total costs of owning different funds. In addition, if these transactional costs were included, your costs would have been higher.
|
| | | | |
| Beginning
Account Value
5/1/17 | Ending
Account Value
10/31/17 | Expenses Paid
During Period(1)
5/1/17 - 10/31/17 | Annualized
Expense Ratio(1) |
Actual | | | | |
Investor Class | $1,000 | $1,133.50 | $5.27 | 0.98% |
I Class | $1,000 | $1,134.50 | $4.20 | 0.78% |
Y Class | $1,000 | $1,135.30 | $3.39 | 0.63% |
A Class | $1,000 | $1,132.30 | $6.61 | 1.23% |
C Class | $1,000 | $1,127.90 | $10.62 | 1.98% |
R Class | $1,000 | $1,130.80 | $7.95 | 1.48% |
R5 Class | $1,000 | $1,134.50 | $4.20 | 0.78% |
R6 Class | $1,000 | $1,135.60 | $3.39 | 0.63% |
Hypothetical | | | | |
Investor Class | $1,000 | $1,020.27 | $4.99 | 0.98% |
I Class | $1,000 | $1,021.27 | $3.97 | 0.78% |
Y Class | $1,000 | $1,022.03 | $3.21 | 0.63% |
A Class | $1,000 | $1,019.01 | $6.26 | 1.23% |
C Class | $1,000 | $1,015.22 | $10.06 | 1.98% |
R Class | $1,000 | $1,017.75 | $7.53 | 1.48% |
R5 Class | $1,000 | $1,021.27 | $3.97 | 0.78% |
R6 Class | $1,000 | $1,022.03 | $3.21 | 0.63% |
| |
(1) | Expenses are equal to the class's annualized expense ratio listed in the table above, multiplied by the average account value over the period, multiplied by 184, the number of days in the most recent fiscal half-year, divided by 365, to reflect the one-half year period. Annualized expense ratio reflects actual expenses, including any applicable fee waivers or expense reimbursements and excluding any acquired fund fees and expenses. |
OCTOBER 31, 2017
|
| | | | | |
| Shares | Value |
COMMON STOCKS — 98.8% | | |
Aerospace and Defense — 3.5% | | |
Boeing Co. (The) | 927,000 |
| $ | 239,147,460 |
|
United Technologies Corp. | 1,006,000 |
| 120,478,560 |
|
| | 359,626,020 |
|
Automobiles — 1.5% | | |
Tesla, Inc.(1) | 473,000 |
| 156,813,690 |
|
Banks — 2.6% | | |
JPMorgan Chase & Co. | 1,635,000 |
| 164,497,350 |
|
U.S. Bancorp | 1,760,000 |
| 95,708,800 |
|
| | 260,206,150 |
|
Beverages — 1.6% | | |
Constellation Brands, Inc., Class A | 753,000 |
| 164,974,770 |
|
Biotechnology — 5.8% | | |
Bluebird Bio, Inc.(1) | 208,000 |
| 28,932,800 |
|
Celgene Corp.(1) | 2,065,289 |
| 208,532,231 |
|
Gilead Sciences, Inc. | 1,256,000 |
| 94,149,760 |
|
Ionis Pharmaceuticals, Inc.(1) | 1,039,000 |
| 59,337,290 |
|
Regeneron Pharmaceuticals, Inc.(1) | 507,000 |
| 204,128,340 |
|
| | 595,080,421 |
|
Chemicals — 3.1% | | |
Ecolab, Inc. | 945,000 |
| 123,473,700 |
|
Monsanto Co. | 862,000 |
| 104,388,200 |
|
PPG Industries, Inc. | 798,000 |
| 92,759,520 |
|
| | 320,621,420 |
|
Electrical Equipment — 1.2% | | |
Acuity Brands, Inc. | 717,000 |
| 119,882,400 |
|
Electronic Equipment, Instruments and Components — 2.2% | | |
Cognex Corp. | 445,000 |
| 54,801,750 |
|
Keyence Corp. | 72,000 |
| 39,785,058 |
|
Yaskawa Electric Corp. | 3,775,000 |
| 134,127,787 |
|
| | 228,714,595 |
|
Food and Staples Retailing — 1.5% | | |
Costco Wholesale Corp. | 953,000 |
| 153,509,240 |
|
Health Care Equipment and Supplies — 4.4% | | |
ABIOMED, Inc.(1) | 232,000 |
| 44,757,440 |
|
Edwards Lifesciences Corp.(1) | 499,000 |
| 51,012,770 |
|
IDEXX Laboratories, Inc.(1) | 314,000 |
| 52,177,380 |
|
Intuitive Surgical, Inc.(1) | 805,592 |
| 302,387,013 |
|
| | 450,334,603 |
|
Health Care Providers and Services — 4.1% | | |
Cigna Corp. | 276,000 |
| 54,432,720 |
|
UnitedHealth Group, Inc. | 1,732,000 |
| 364,101,040 |
|
| | 418,533,760 |
|
Hotels, Restaurants and Leisure — 2.7% | | |
Chipotle Mexican Grill, Inc.(1) | 95,000 |
| 25,830,500 |
|
Starbucks Corp. | 3,013,000 |
| 165,232,920 |
|
|
| | | | | |
| Shares | Value |
Wynn Resorts Ltd. | 574,000 |
| $ | 84,659,260 |
|
| | 275,722,680 |
|
Insurance — 1.2% | | |
MetLife, Inc. | 2,318,000 |
| 124,198,440 |
|
Internet and Direct Marketing Retail — 6.1% | | |
Amazon.com, Inc.(1) | 454,000 |
| 501,797,120 |
|
Netflix, Inc.(1) | 639,000 |
| 125,518,770 |
|
| | 627,315,890 |
|
Internet Software and Services — 12.8% | | |
Alphabet, Inc., Class A(1) | 294,058 |
| 303,773,676 |
|
Alphabet, Inc., Class C(1) | 350,000 |
| 355,824,000 |
|
Baidu, Inc. ADR(1) | 308,000 |
| 75,133,520 |
|
Facebook, Inc., Class A(1) | 2,579,000 |
| 464,374,740 |
|
Tencent Holdings Ltd. | 2,546,000 |
| 114,157,818 |
|
| | 1,313,263,754 |
|
IT Services — 8.5% | | |
MasterCard, Inc., Class A | 2,237,123 |
| 332,816,789 |
|
PayPal Holdings, Inc.(1) | 1,879,000 |
| 136,340,240 |
|
Visa, Inc., Class A | 3,606,000 |
| 396,587,880 |
|
| | 865,744,909 |
|
Machinery — 3.8% | | |
Cummins, Inc. | 617,000 |
| 109,134,960 |
|
Donaldson Co., Inc. | 717,000 |
| 33,849,570 |
|
WABCO Holdings, Inc.(1) | 841,000 |
| 124,106,370 |
|
Wabtec Corp. | 1,618,000 |
| 123,777,000 |
|
| | 390,867,900 |
|
Media — 3.4% | | |
Scripps Networks Interactive, Inc., Class A | 408,000 |
| 33,978,240 |
|
Time Warner, Inc. | 1,507,000 |
| 148,123,030 |
|
Walt Disney Co. (The) | 1,651,000 |
| 161,484,310 |
|
| | 343,585,580 |
|
Oil, Gas and Consumable Fuels — 1.4% | | |
Concho Resources, Inc.(1) | 411,000 |
| 55,160,310 |
|
EOG Resources, Inc. | 908,000 |
| 90,681,960 |
|
| | 145,842,270 |
|
Personal Products — 2.0% | | |
Estee Lauder Cos., Inc. (The), Class A | 1,792,000 |
| 200,363,520 |
|
Pharmaceuticals — 0.6% | | |
Pfizer, Inc. | 1,772,000 |
| 62,126,320 |
|
Road and Rail — 1.0% | | |
J.B. Hunt Transport Services, Inc. | 957,000 |
| 101,815,230 |
|
Semiconductors and Semiconductor Equipment — 3.1% | | |
ams AG | 795,000 |
| 72,475,567 |
|
Analog Devices, Inc. | 640,000 |
| 58,432,000 |
|
Maxim Integrated Products, Inc. | 1,655,000 |
| 86,953,700 |
|
Xilinx, Inc. | 1,320,617 |
| 97,316,267 |
|
| | 315,177,534 |
|
Software — 5.4% | | |
Adobe Systems, Inc.(1) | 197,000 |
| 34,506,520 |
|
Microsoft Corp. | 2,802,000 |
| 233,070,360 |
|
salesforce.com, Inc.(1) | 1,733,000 |
| 177,355,220 |
|
|
| | | | | | |
| Shares/Principal Amount | Value |
Splunk, Inc.(1) | 534,000 |
| $ | 35,938,200 |
|
Tableau Software, Inc., Class A(1) | 939,000 |
| 76,143,510 |
|
| | 557,013,810 |
|
Specialty Retail — 3.3% | | |
O'Reilly Automotive, Inc.(1) | 310,000 |
| 65,394,500 |
|
Ross Stores, Inc. | 1,285,000 |
| 81,584,650 |
|
TJX Cos., Inc. (The) | 2,707,000 |
| 188,948,600 |
|
| | 335,927,750 |
|
Technology Hardware, Storage and Peripherals — 9.3% | | |
Apple, Inc. | 5,654,953 |
| 955,913,255 |
|
Textiles, Apparel and Luxury Goods — 1.4% | | |
NIKE, Inc., Class B | 2,300,000 |
| 126,477,000 |
|
Under Armour, Inc., Class C(1) | 1,293,000 |
| 14,908,290 |
|
| | 141,385,290 |
|
Tobacco — 1.3% | | |
Philip Morris International, Inc. | 1,311,000 |
| 137,183,040 |
|
TOTAL COMMON STOCKS
(Cost $4,075,567,099) | | 10,121,744,241 |
|
TEMPORARY CASH INVESTMENTS — 1.3% | | |
Federal Home Loan Bank Discount Notes, 0.86%, 11/1/17(2) | $ | 50,000,000 |
| 50,000,000 |
|
Repurchase Agreement, BMO Capital Markets Corp., (collateralized by various U.S. Treasury obligations, 0.375% - 1.375%, 1/15/27 - 2/15/45, valued at $46,484,736), in a joint trading account at 0.88%, dated 10/31/17, due 11/1/17 (Delivery value $45,469,992) | | 45,468,881 |
|
Repurchase Agreement, Fixed Income Clearing Corp., (collateralized by various U.S. Treasury obligations, 2.50%, 5/15/46, valued at $38,666,915), at 0.34%, dated 10/31/17, due 11/1/17 (Delivery value $37,906,358) | | 37,906,000 |
|
State Street Institutional U.S. Government Money Market Fund, Premier Class | 40,478 |
| 40,478 |
|
TOTAL TEMPORARY CASH INVESTMENTS
(Cost $133,415,359) | | 133,415,359 |
|
TOTAL INVESTMENT SECURITIES — 100.1%
(Cost $4,208,982,458) | | 10,255,159,600 |
|
OTHER ASSETS AND LIABILITIES — (0.1)% | | (6,843,885 | ) |
TOTAL NET ASSETS — 100.0% | | $ | 10,248,315,715 |
|
|
| | | | | | | | | | |
FORWARD FOREIGN CURRENCY EXCHANGE CONTRACTS | | |
Currency Purchased | Currency Sold | Counterparty | Settlement Date | Unrealized Appreciation
(Depreciation) |
CHF | 1,383,300 |
| USD | 1,416,938 |
| Credit Suisse AG | 12/29/17 | $ | (24,758 | ) |
USD | 16,531,634 |
| CHF | 15,967,575 |
| Credit Suisse AG | 12/29/17 | 461,559 |
|
USD | 1,243,256 |
| CHF | 1,204,425 |
| Credit Suisse AG | 12/29/17 | 31,099 |
|
USD | 3,318,906 |
| CHF | 3,267,450 |
| Credit Suisse AG | 12/29/17 | 30,482 |
|
USD | 2,255,460 |
| CHF | 2,241,900 |
| Credit Suisse AG | 12/29/17 | (832 | ) |
JPY | 412,324,500 |
| USD | 3,626,265 |
| Credit Suisse AG | 12/29/17 | 10,504 |
|
USD | 41,840,966 |
| JPY | 4,664,012,500 |
| Credit Suisse AG | 12/29/17 | 703,613 |
|
USD | 9,193,599 |
| JPY | 1,029,815,500 |
| Credit Suisse AG | 12/29/17 | 110,458 |
|
USD | 7,416,191 |
| JPY | 826,383,250 |
| Credit Suisse AG | 12/29/17 | 127,356 |
|
USD | 4,385,887 |
| JPY | 498,412,250 |
| Credit Suisse AG | 12/29/17 | (10,190 | ) |
| | | | | | $ | 1,439,291 |
|
|
| | |
NOTES TO SCHEDULE OF INVESTMENTS |
ADR | - | American Depositary Receipt |
CHF | - | Swiss Franc |
JPY | - | Japanese Yen |
USD | - | United States Dollar |
| |
(2) | The rate indicated is the yield to maturity at purchase. |
See Notes to Financial Statements.
|
|
Statement of Assets and Liabilities |
|
| | | |
OCTOBER 31, 2017 | |
Assets | |
Investment securities, at value (cost of $4,208,982,458) | $ | 10,255,159,600 |
|
Receivable for capital shares sold | 1,715,807 |
|
Unrealized appreciation on forward foreign currency exchange contracts | 1,475,071 |
|
Dividends and interest receivable | 2,045,502 |
|
| 10,260,395,980 |
|
| |
Liabilities | |
Payable for investments purchased | 1,624,562 |
|
Payable for capital shares redeemed | 2,084,744 |
|
Unrealized depreciation on forward foreign currency exchange contracts | 35,780 |
|
Accrued management fees | 8,198,591 |
|
Distribution and service fees payable | 26,175 |
|
Accrued other expenses | 110,413 |
|
| 12,080,265 |
|
| |
Net Assets | $ | 10,248,315,715 |
|
| |
Net Assets Consist of: | |
Capital (par value and paid-in surplus) | $ | 3,620,512,957 |
|
Undistributed net investment income | 16,272,626 |
|
Undistributed net realized gain | 563,929,174 |
|
Net unrealized appreciation | 6,047,600,958 |
|
| $ | 10,248,315,715 |
|
|
| | | | |
| Net Assets | Shares Outstanding | Net Asset Value Per Share |
Investor Class, $0.01 Par Value | $9,593,102,078 | 215,155,710 |
| $44.59 |
I Class, $0.01 Par Value | $322,059,277 | 6,995,420 |
| $46.04 |
Y Class, $0.01 Par Value | $5,851 | 127 |
| $46.07 |
A Class, $0.01 Par Value | $83,130,062 | 1,942,465 |
| $42.80* |
C Class, $0.01 Par Value | $5,358,788 | 145,006 |
| $36.96 |
R Class, $0.01 Par Value | $11,345,269 | 271,186 |
| $41.84 |
R5 Class, $0.01 Par Value | $5,847 | 127 |
| $46.04 |
R6 Class, $0.01 Par Value | $233,308,543 | 5,064,516 |
| $46.07 |
*Maximum offering price $45.41 (net asset value divided by 0.9425).
See Notes to Financial Statements.
|
| | | |
YEAR ENDED OCTOBER 31, 2017 | |
Investment Income (Loss) | |
Income: | |
Dividends (net of foreign taxes withheld of $189,559) | $ | 103,484,476 |
|
Interest | 402,430 |
|
| 103,886,906 |
|
| |
Expenses: | |
Management fees | 87,250,585 |
|
Distribution and service fees: | |
A Class | 166,721 |
|
C Class | 38,805 |
|
R Class | 51,808 |
|
Directors' fees and expenses | 278,744 |
|
Other expenses | 291,265 |
|
| 88,077,928 |
|
| |
Net investment income (loss) | 15,808,978 |
|
| |
Realized and Unrealized Gain (Loss) | |
Net realized gain (loss) on: | |
Investment transactions | 581,378,315 |
|
Forward foreign currency exchange contract transactions | 670,104 |
|
Foreign currency translation transactions | 48,107 |
|
| 582,096,526 |
|
| |
Change in net unrealized appreciation (depreciation) on: | |
Investments | 1,806,739,228 |
|
Forward foreign currency exchange contracts | 1,439,291 |
|
Translation of assets and liabilities in foreign currencies | 60,270 |
|
| 1,808,238,789 |
|
| |
Net realized and unrealized gain (loss) | 2,390,335,315 |
|
| |
Net Increase (Decrease) in Net Assets Resulting from Operations | $ | 2,406,144,293 |
|
See Notes to Financial Statements.
|
|
Statement of Changes in Net Assets |
|
| | | | | | |
YEARS ENDED OCTOBER 31, 2017 AND OCTOBER 31, 2016 |
Increase (Decrease) in Net Assets | October 31, 2017 | October 31, 2016 |
Operations | | |
Net investment income (loss) | $ | 15,808,978 |
| $ | 15,142,479 |
|
Net realized gain (loss) | 582,096,526 |
| 366,260,214 |
|
Change in net unrealized appreciation (depreciation) | 1,808,238,789 |
| (397,815,232 | ) |
Net increase (decrease) in net assets resulting from operations | 2,406,144,293 |
| (16,412,539 | ) |
| | |
Distributions to Shareholders | | |
From net investment income: | | |
Investor Class | (22,033,975 | ) | (17,978,057 | ) |
I Class | (936,176 | ) | (931,198 | ) |
A Class | (16,542 | ) | — |
|
R6 Class | (510,662 | ) | (211,120 | ) |
From net realized gains: | | |
Investor Class | (343,677,139 | ) | (396,365,081 | ) |
I Class | (8,476,528 | ) | (10,890,656 | ) |
A Class | (2,668,802 | ) | (3,822,340 | ) |
C Class | (170,965 | ) | (191,807 | ) |
R Class | (428,166 | ) | (482,530 | ) |
R6 Class | (3,517,159 | ) | (1,825,199 | ) |
Decrease in net assets from distributions | (382,436,114 | ) | (432,697,988 | ) |
| | |
Capital Share Transactions | | |
Net increase (decrease) in net assets from capital share transactions (Note 5) | 81,023,969 |
| (8,028,452 | ) |
| | |
Net increase (decrease) in net assets | 2,104,732,148 |
| (457,138,979 | ) |
| | |
Net Assets | | |
Beginning of period | 8,143,583,567 |
| 8,600,722,546 |
|
End of period | $ | 10,248,315,715 |
| $ | 8,143,583,567 |
|
| | |
Undistributed net investment income | $ | 16,272,626 |
| $ | 23,484,472 |
|
See Notes to Financial Statements.
|
|
Notes to Financial Statements |
OCTOBER 31, 2017
1. Organization
American Century Mutual Funds, Inc. (the corporation) is registered under the Investment Company Act of 1940, as amended (the 1940 Act), as an open-end management investment company and is organized as a Maryland corporation. Ultra Fund (the fund) is one fund in a series issued by the corporation. The fund's investment objective is to seek long-term capital growth.
The fund offers the Investor Class, I Class (formerly Institutional Class), Y Class, A Class, C Class, R Class, R5 Class and R6 Class. The A Class may incur an initial sales charge. The A Class and C Class may be subject to a contingent deferred sales charge. Sale of the Y Class and R5 Class commenced on April 10, 2017.
2. Significant Accounting Policies
The following is a summary of significant accounting policies consistently followed by the fund in preparation of its financial statements. The fund is an investment company and follows accounting and reporting guidance in accordance with accounting principles generally accepted in the United States of America. This may require management to make certain estimates and assumptions at the date of the financial statements. Actual results could differ from these estimates. Management evaluated the impact of events or transactions occurring through the date the financial statements were issued that would merit recognition or disclosure.
Investment Valuations — The fund determines the fair value of its investments and computes its net asset value per share at the close of regular trading (usually 4 p.m. Eastern time) on the New York Stock Exchange (NYSE) on each day the NYSE is open. The Board of Directors has adopted valuation policies and procedures to guide the investment advisor in the fund’s investment valuation process and to provide methodologies for the oversight of the fund’s pricing function.
Equity securities that are listed or traded on a domestic securities exchange are valued at the last reported sales price or at the official closing price as provided by the exchange. Equity securities traded on foreign securities exchanges are generally valued at the closing price of such securities on the exchange where primarily traded or at the close of the NYSE, if that is earlier. If no last sales price is reported, or if local convention or regulation so provides, the mean of the latest bid and asked prices may be used. Securities traded over-the-counter are valued at the mean of the latest bid and asked prices, the last sales price, or the official closing price. Equity securities initially expressed in local currencies are translated into U.S. dollars at the mean of the appropriate currency exchange rate at the close of the NYSE as provided by an independent pricing service.
Fixed income securities are valued at the evaluated mean as provided by independent pricing services or at the mean of the most recent bid and asked prices as provided by investment dealers. U.S. Treasury and Government Agency securities are valued using market models that consider trade data, quotations from dealers and active market makers, relevant yield curve and spread data, creditworthiness, trade data or market information on comparable securities, and other relevant security specific information.
Open-end management investment companies are valued at the reported net asset value per share. Repurchase agreements are valued at cost, which approximates fair value. Forward foreign currency exchange contracts are valued at the mean of the appropriate forward exchange rate at the close of the NYSE as provided by an independent pricing service.
If the fund determines that the market price for an investment is not readily available or the valuation methods mentioned above do not reflect an investment’s fair value, such investment is valued as determined in good faith by the Board of Directors or its delegate, in accordance with policies and procedures adopted by the Board of Directors. In its determination of fair value, the fund may review several factors including, but not limited to, market information regarding the specific investment or comparable investments and correlation with other investment types, futures indices or general market indicators. Circumstances that may cause the fund to use these procedures to value an investment include, but are not limited to: an investment has been declared in default or is distressed; trading in a security has been suspended during the trading day or a
security is not actively trading on its principal exchange; prices received from a regular pricing source are deemed unreliable; or there is a foreign market holiday and no trading occurred.
The fund monitors for significant events occurring after the close of an investment’s primary exchange but before the fund’s net asset value per share is determined. Significant events may include, but are not limited to: corporate announcements and transactions; governmental action and political unrest that could impact a specific investment or an investment sector; or armed conflicts, natural disasters and similar events that could affect investments in a specific country or region. The fund also monitors for significant fluctuations between domestic and foreign markets, as evidenced by the U.S. market or such other indicators that the Board of Directors, or its delegate, deems appropriate. If significant fluctuations in foreign markets are identified, the fund may apply a model-derived factor to the closing price of equity securities traded on foreign securities exchanges. The factor is based on observable market data as provided by an independent pricing service.
Security Transactions — Security transactions are accounted for as of the trade date. Net realized gains and losses are determined on the identified cost basis, which is also used for federal income tax purposes.
Investment Income — Dividend income less foreign taxes withheld, if any, is recorded as of the ex-dividend date. Distributions received on securities that represent a return of capital or long-term capital gain are recorded as a reduction of cost of investments and/or as a realized gain. The fund may estimate the components of distributions received that may be considered nontaxable distributions or long-term capital gain distributions for income tax purposes. Interest income is recorded on the accrual basis and includes accretion of discounts and amortization of premiums.
Foreign Currency Translations — All assets and liabilities initially expressed in foreign currencies are translated into U.S. dollars at prevailing exchange rates at period end. The fund may enter into spot foreign currency exchange contracts to facilitate transactions denominated in a foreign currency. Purchases and sales of investment securities, dividend and interest income, spot foreign currency exchange contracts, and expenses are translated at the rates of exchange prevailing on the respective dates of such transactions. Net realized and unrealized foreign currency exchange gains or losses related to investment securities are a component of net realized gain (loss) on investment transactions and change in net unrealized appreciation (depreciation) on investments, respectively.
Repurchase Agreements — The fund may enter into repurchase agreements with institutions that American Century Investment Management, Inc. (ACIM) (the investment advisor) has determined are creditworthy pursuant to criteria adopted by the Board of Directors. The fund requires that the collateral, represented by securities, received in a repurchase transaction be transferred to the custodian in a manner sufficient to enable the fund to obtain those securities in the event of a default under the repurchase agreement. ACIM monitors, on a daily basis, the securities transferred to ensure the value, including accrued interest, of the securities under each repurchase agreement is equal to or greater than amounts owed to the fund under each repurchase agreement.
Joint Trading Account — Pursuant to an Exemptive Order issued by the Securities and Exchange Commission, the fund, along with certain other funds in the American Century Investments family of funds, may transfer uninvested cash balances into a joint trading account. These balances are invested in one or more repurchase agreements that are collateralized by U.S. Treasury or Agency obligations.
Income Tax Status — It is the fund’s policy to distribute substantially all net investment income and net realized gains to shareholders and to otherwise qualify as a regulated investment company under provisions of the Internal Revenue Code. Accordingly, no provision has been made for income taxes. The fund files U.S. federal, state, local and non-U.S. tax returns as applicable. The fund's tax returns are subject to examination by the relevant taxing authority until expiration of the applicable statute of limitations, which is generally three years from the date of filing but can be longer in certain jurisdictions. At this time, management believes there are no uncertain tax positions which, based on their technical merit, would not be sustained upon examination and for which it is reasonably possible that the total amounts of unrecognized tax benefits will significantly change in the next twelve months.
Multiple Class — All shares of the fund represent an equal pro rata interest in the net assets of the class to which such shares belong, and have identical voting, dividend, liquidation and other rights and the same terms and conditions, except for class specific expenses and exclusive rights to vote on matters affecting only individual classes. Income, non-class specific expenses, and realized and unrealized capital gains and losses of the fund are allocated to each class of shares based on their relative net assets.
Distributions to Shareholders — Distributions from net investment income and net realized gains, if any, are generally declared and paid annually.
Indemnifications — Under the corporation’s organizational documents, its officers and directors are indemnified against certain liabilities arising out of the performance of their duties to the fund. In addition, in the normal course of business, the fund enters into contracts that provide general indemnifications. The maximum exposure under these arrangements is unknown as this would involve future claims that may be made against a fund. The risk of material loss from such claims is considered by management to be remote.
3. Fees and Transactions with Related Parties
Certain officers and directors of the corporation are also officers and/or directors of American Century Companies, Inc. (ACC). The corporation’s investment advisor, ACIM, the corporation's distributor, American Century Investment Services, Inc. (ACIS), and the corporation’s transfer agent, American Century Services, LLC, are wholly owned, directly or indirectly, by ACC.
Management Fees — The corporation has entered into a management agreement with ACIM, under which ACIM provides the fund with investment advisory and management services in exchange for a single, unified management fee (the fee) per class. The agreement provides that all expenses of managing and operating the fund, except distribution and service fees, brokerage expenses, taxes, interest, fees and expenses of the independent directors (including legal counsel fees), and extraordinary expenses, will be paid by ACIM. The fee is computed and accrued daily based on each class's daily net assets and paid monthly in arrears. The difference in the fee among the classes is a result of their separate arrangements for non-Rule 12b-1 shareholder services. It is not the result of any difference in advisory or custodial fees or other expenses related to the management of the fund’s assets, which do not vary by class. The rate of the fee is determined by applying a fee rate calculation formula. This formula takes into account the fund’s assets as well as certain assets, if any, of other clients of the investment advisor outside the American Century Investments family of funds (such as subadvised funds and separate accounts) that use very similar investment teams and strategies (strategy assets).
The management fee schedule range and the effective annual management fee for each class for the period ended October 31, 2017 are as follows:
|
| | |
| Management Fee Schedule Range | Effective Annual Management Fee |
Investor Class | 0.800% to 0.990% | 0.97% |
I Class | 0.600% to 0.790% | 0.77% |
Y Class | 0.450% to 0.640% | 0.62% |
A Class | 0.800% to 0.990% | 0.97% |
C Class | 0.800% to 0.990% | 0.97% |
R Class | 0.800% to 0.990% | 0.97% |
R5 Class | 0.600% to 0.790% | 0.77% |
R6 Class | 0.450% to 0.640% | 0.62% |
Distribution and Service Fees — The Board of Directors has adopted a separate Master Distribution and Individual Shareholder Services Plan for each of the A Class, C Class and R Class (collectively the plans), pursuant to Rule 12b-1 of the 1940 Act. The plans provide that the A Class will pay ACIS an annual distribution and service fee of 0.25%. The plans provide that the C Class will pay ACIS an annual distribution and service fee of 1.00%, of which 0.25% is paid for individual shareholder services and 0.75% is paid for distribution services. The plans provide that the R Class will pay ACIS an annual distribution and service fee of 0.50%. The fees are computed and accrued daily based on each class’s daily net assets and paid monthly in arrears. The fees are used to pay financial intermediaries for distribution and individual shareholder services. Fees incurred under the plans during the period ended October 31, 2017 are detailed in the Statement of Operations.
Directors' Fees and Expenses — The Board of Directors is responsible for overseeing the investment advisor’s management and operations of the fund. The directors receive detailed information about the fund and its investment advisor regularly throughout the year, and meet at least quarterly with management of the investment advisor to review reports about fund operations. The fund’s officers do not receive compensation from the fund.
Interfund Transactions — The fund may enter into security transactions with other American Century Investments funds and other client accounts of the investment advisor, in accordance with the 1940 Act rules and procedures adopted by the Board of Directors. The rules and procedures require, among other things, that these transactions be effected at the independent current market price of the security. During the period, the interfund purchases and sales were $25,380,078 and $5,750,170, respectively. The effect of interfund transactions on the Statement of Operations was $(548,412) in net realized gain (loss) on investment transactions.
4. Investment Transactions
Purchases and sales of investment securities, excluding short-term investments, for the period ended October 31, 2017 were $1,423,468,977 and $1,632,660,362, respectively.
5. Capital Share Transactions
Transactions in shares of the fund were as follows:
|
| | | | | | | | | | |
| Year ended October 31, 2017(1) | Year ended
October 31, 2016 |
| Shares | Amount | Shares | Amount |
Investor Class/Shares Authorized | 3,350,000,000 |
| | 3,400,000,000 |
| |
Sold | 6,991,026 |
| $ | 277,438,803 |
| 6,003,589 |
| $ | 209,184,788 |
|
Issued in reinvestment of distributions | 9,969,734 |
| 353,028,282 |
| 11,470,135 |
| 400,537,097 |
|
Redeemed | (19,202,525 | ) | (747,743,609 | ) | (18,890,025 | ) | (662,960,210 | ) |
| (2,241,765 | ) | (117,276,524 | ) | (1,416,301 | ) | (53,238,325 | ) |
I Class/Shares Authorized | 130,000,000 |
| | 200,000,000 |
| |
Sold | 2,936,370 |
| 126,336,971 |
| 1,213,416 |
| 45,659,701 |
|
Issued in reinvestment of distributions | 252,374 |
| 9,211,667 |
| 322,809 |
| 11,601,769 |
|
Redeemed | (1,577,420 | ) | (64,714,752 | ) | (1,433,066 | ) | (52,604,666 | ) |
| 1,611,324 |
| 70,833,886 |
| 103,159 |
| 4,656,804 |
|
Y Class/Shares Authorized | 50,000,000 |
| | N/A |
| |
Sold | 127 |
| 5,000 |
| | |
A Class/Shares Authorized | 70,000,000 |
| | 80,000,000 |
| |
Sold | 874,768 |
| 33,597,337 |
| 728,373 |
| 24,333,624 |
|
Issued in reinvestment of distributions | 73,609 |
| 2,507,131 |
| 108,105 |
| 3,636,643 |
|
Redeemed | (713,427 | ) | (26,741,197 | ) | (1,105,320 | ) | (36,645,386 | ) |
| 234,950 |
| 9,363,271 |
| (268,842 | ) | (8,675,119 | ) |
C Class/Shares Authorized | 20,000,000 |
| | 20,000,000 |
| |
Sold | 66,568 |
| 2,234,855 |
| 49,793 |
| 1,497,508 |
|
Issued in reinvestment of distributions | 5,087 |
| 150,568 |
| 5,377 |
| 159,439 |
|
Redeemed | (36,228 | ) | (1,157,734 | ) | (37,296 | ) | (1,089,188 | ) |
| 35,427 |
| 1,227,689 |
| 17,874 |
| 567,759 |
|
R Class/Shares Authorized | 40,000,000 |
| | 40,000,000 |
| |
Sold | 95,802 |
| 3,601,379 |
| 86,852 |
| 2,851,097 |
|
Issued in reinvestment of distributions | 11,791 |
| 393,362 |
| 13,601 |
| 449,650 |
|
Redeemed | (104,730 | ) | (3,972,590 | ) | (100,941 | ) | (3,320,102 | ) |
| 2,863 |
| 22,151 |
| (488 | ) | (19,355 | ) |
R5 Class/Shares Authorized | 50,000,000 |
| | N/A |
| |
Sold | 127 |
| 5,000 |
| | |
R6 Class/Shares Authorized | 50,000,000 |
| | 50,000,000 |
| |
Sold | 3,210,642 |
| 133,551,173 |
| 1,491,438 |
| 55,368,124 |
|
Issued in reinvestment of distributions | 110,442 |
| 4,027,821 |
| 56,706 |
| 2,036,319 |
|
Redeemed | (511,606 | ) | (20,735,498 | ) | (241,819 | ) | (8,724,659 | ) |
| 2,809,478 |
| 116,843,496 |
| 1,306,325 |
| 48,679,784 |
|
Net increase (decrease) | 2,452,531 |
| $ | 81,023,969 |
| (258,273 | ) | $ | (8,028,452 | ) |
| |
(1) | April 10, 2017 (commencement of sale) through October 31, 2017 for the Y Class and R5 Class. |
6. Fair Value Measurements
The fund’s investments valuation process is based on several considerations and may use multiple inputs to determine the fair value of the investments held by the fund. In conformity with accounting principles generally accepted in the United States of America, the inputs used to determine a valuation are classified into three broad levels.
| |
• | Level 1 valuation inputs consist of unadjusted quoted prices in an active market for identical investments. |
| |
• | Level 2 valuation inputs consist of direct or indirect observable market data (including quoted prices for comparable investments, evaluations of subsequent market events, interest rates, prepayment speeds, credit risk, etc.). These inputs also consist of quoted prices for identical investments initially expressed in local currencies that are adjusted through translation into U.S. dollars. |
| |
• | Level 3 valuation inputs consist of unobservable data (including a fund’s own assumptions). |
The level classification is based on the lowest level input that is significant to the fair valuation measurement. The valuation inputs are not necessarily an indication of the risks associated with investing in these securities or other financial instruments. There were no significant transfers between levels during the period.
The following is a summary of the level classifications as of period end. The Schedule of Investments provides additional information on the fund’s portfolio holdings.
|
| | | | | | | | |
| Level 1 | Level 2 | Level 3 |
Assets | | | |
Investment Securities | | | |
Common Stocks | $ | 9,761,198,011 |
| $ | 360,546,230 |
| — |
|
Temporary Cash Investments | 40,478 |
| 133,374,881 |
| — |
|
| $ | 9,761,238,489 |
| $ | 493,921,111 |
| — |
|
Other Financial Instruments | | | |
Forward Foreign Currency Exchange Contracts | — |
| $ | 1,475,071 |
| — |
|
| | | |
Liabilities | | | |
Other Financial Instruments | | | |
Forward Foreign Currency Exchange Contracts | — |
| $ | 35,780 |
| — |
|
7. Derivative Instruments
Foreign Currency Risk — The fund is subject to foreign currency exchange rate risk in the normal course of pursuing its investment objectives. The value of foreign investments held by a fund may be significantly affected by changes in foreign currency exchange rates. The dollar value of a foreign security generally decreases when the value of the dollar rises against the foreign currency in which the security is denominated and tends to increase when the value of the dollar declines against such foreign currency. A fund may enter into forward foreign currency exchange contracts to reduce a fund's exposure to foreign currency exchange rate fluctuations. The net U.S. dollar value of foreign currency underlying all contractual commitments held by a fund and the resulting unrealized appreciation or depreciation are determined daily. Realized gain or loss is recorded upon the termination of the contract. Net realized and unrealized gains or losses occurring during the holding period of forward foreign currency exchange contracts are a component of net realized gain (loss) on forward foreign currency exchange contract transactions and change in net unrealized appreciation (depreciation) on forward foreign currency exchange contracts, respectively. A fund bears the risk of an unfavorable change in the foreign currency exchange rate underlying the forward contract. Additionally, losses, up to the fair value, may arise if the counterparties do not perform under the contract terms. The fund's average U.S. dollar exposure to foreign currency risk derivative instruments held during the period was $45,304,824.
The value of foreign currency risk derivative instruments as of October 31, 2017, is disclosed on the Statement of Assets and Liabilities as an asset of $1,475,071 in unrealized appreciation on forward foreign currency exchange contracts and a liability of $35,780 in unrealized depreciation on forward foreign currency exchange contracts. For the year ended October 31, 2017, the effect of foreign currency risk derivative instruments on the Statement of Operations was $670,104 in net realized gain (loss) on forward foreign
currency exchange contract transactions and $1,439,291 in change in net unrealized appreciation (depreciation) on forward foreign currency exchange contracts.
8. Federal Tax Information
The tax character of distributions paid during the years ended October 31, 2017 and October 31, 2016 were as follows:
|
| | | | | | |
| 2017 | 2016 |
Distributions Paid From | | |
Ordinary income | $ | 23,497,355 |
| $ | 18,985,228 |
|
Long-term capital gains | $ | 358,938,759 |
| $ | 413,712,760 |
|
The book-basis character of distributions made during the year from net investment income or net realized gains may differ from their ultimate characterization for federal income tax purposes. These differences reflect the differing character of certain income items and net realized gains and losses for financial statement and tax purposes, and may result in reclassification among certain capital accounts on the financial statements.
As of period end, the federal tax cost of investments and the components of distributable earnings on a tax-basis were as follows:
|
| | | |
Federal tax cost of investments | $ | 4,226,319,039 |
|
Gross tax appreciation of investments | $ | 6,051,071,543 |
|
Gross tax depreciation of investments | (22,230,982 | ) |
Net tax appreciation (depreciation) of investments | 6,028,840,561 |
|
Net tax appreciation (depreciation) on derivatives and translation of assets and liabilities in foreign currencies | (15,475 | ) |
Net tax appreciation (depreciation) | $ | 6,028,825,086 |
|
Undistributed ordinary income | $ | 17,711,917 |
|
Accumulated long-term gains | $ | 581,265,755 |
|
The difference between book-basis and tax-basis unrealized appreciation (depreciation) is attributable primarily to the tax deferral of losses on wash sales.
|
| | | | | | | | | | | | | | | | | |
For a Share Outstanding Throughout the Years Ended October 31 (except as noted) | | | | |
Per-Share Data | | | | | | | | | Ratios and Supplemental Data |
| | Income From Investment Operations: | Distributions From: | | | Ratio to Average Net Assets of: | | |
| Net Asset
Value,
Beginning
of Period | Net
Investment
Income
(Loss)(1) | Net
Realized
and
Unrealized
Gain (Loss) | Total From
Investment
Operations | Net
Investment
Income | Net
Realized
Gains | Total
Distributions | Net Asset
Value,
End
of Period | Total
Return(2) | Operating
Expenses | Operating
Expenses
(before
expense
waiver) | Net
Investment
Income
(Loss) | Net
Investment
Income
(Loss)
(before
expense
waiver) | Portfolio
Turnover
Rate | Net
Assets,
End of
Period
(in thousands) |
Investor Class | | | | | | | | | | | | | | |
2017 | $35.83 | 0.07 | 10.39 | 10.46 | (0.10) | (1.60) | (1.70) | $44.59 | 30.42% | 0.98% | 0.98% | 0.17% | 0.17% | 16% |
| $9,593,102 |
|
2016 | $37.81 | 0.06 | (0.14) | (0.08) | (0.08) | (1.82) | (1.90) | $35.83 | (0.06)% | 0.98% | 0.98% | 0.19% | 0.19% | 18% |
| $7,790,085 |
|
2015 | $37.20 | 0.08 | 3.18 | 3.26 | (0.12) | (2.53) | (2.65) | $37.81 | 9.72% | 0.98% | 0.98% | 0.22% | 0.22% | 16% |
| $8,273,589 |
|
2014 | $33.56 | 0.10 | 4.96 | 5.06 | (0.10) | (1.32) | (1.42) | $37.20 | 15.66% | 1.00% | 1.01% | 0.29% | 0.28% | 16% |
| $7,981,781 |
|
2013 | $25.68 | 0.15 | 7.86 | 8.01 | (0.13) | — | (0.13) | $33.56 | 31.34% | 0.99% | 0.99% | 0.52% | 0.52% | 26% |
| $7,338,222 |
|
I Class(3) | | | | | | | | | | | | | |
2017 | $36.95 | 0.14 | 10.73 | 10.87 | (0.18) | (1.60) | (1.78) | $46.04 | 30.66% | 0.78% | 0.78% | 0.37% | 0.37% | 16% |
| $322,059 |
|
2016 | $38.93 | 0.14 | (0.14) | — | (0.16) | (1.82) | (1.98) | $36.95 | 0.14% | 0.78% | 0.78% | 0.39% | 0.39% | 18% |
| $198,930 |
|
2015 | $38.22 | 0.16 | 3.27 | 3.43 | (0.19) | (2.53) | (2.72) | $38.93 | 9.96% | 0.78% | 0.78% | 0.42% | 0.42% | 16% |
| $205,574 |
|
2014 | $34.44 | 0.17 | 5.10 | 5.27 | (0.17) | (1.32) | (1.49) | $38.22 | 15.90% | 0.80% | 0.81% | 0.49% | 0.48% | 16% |
| $214,464 |
|
2013 | $26.32 | 0.17 | 8.10 | 8.27 | (0.15) | — | (0.15) | $34.44 | 31.56% | 0.79% | 0.79% | 0.72% | 0.72% | 26% |
| $202,118 |
|
Y Class | | | | | | | | | | | | | |
2017(4) | $39.40 | 0.10 | 6.57 | 6.67 | — | — | — | $46.07 | 16.93% | 0.63%(5) | 0.63%(5) | 0.43%(5) | 0.43%(5) | 16%(6) |
| $6 |
|
|
| | | | | | | | | | | | | | | | | |
For a Share Outstanding Throughout the Years Ended October 31 (except as noted) | | | | |
Per-Share Data | | | | | | | | | Ratios and Supplemental Data |
| | Income From Investment Operations: | Distributions From: | | | Ratio to Average Net Assets of: | | |
| Net Asset
Value,
Beginning
of Period | Net
Investment
Income
(Loss)(1) | Net
Realized
and
Unrealized
Gain (Loss) | Total From
Investment
Operations | Net
Investment
Income | Net
Realized
Gains | Total
Distributions | Net Asset
Value,
End
of Period | Total
Return(2) | Operating
Expenses | Operating
Expenses
(before
expense
waiver) | Net
Investment
Income
(Loss) | Net
Investment
Income
(Loss)
(before
expense
waiver) | Portfolio
Turnover
Rate | Net
Assets,
End of
Period
(in thousands) |
A Class | | | | | | | | | | | | | | |
2017 | $34.45 | (0.04) | 10.00 | 9.96 | (0.01) | (1.60) | (1.61) | $42.80 | 30.10% | 1.23% | 1.23% | (0.08)% | (0.08)% | 16% |
| $83,130 |
|
2016 | $36.43 | (0.02) | (0.14) | (0.16) | — | (1.82) | (1.82) | $34.45 | (0.31)% | 1.23% | 1.23% | (0.06)% | (0.06)% | 18% |
| $58,829 |
|
2015 | $35.94 | (0.01) | 3.06 | 3.05 | (0.03) | (2.53) | (2.56) | $36.43 | 9.46% | 1.23% | 1.23% | (0.03)% | (0.03)% | 16% |
| $72,004 |
|
2014 | $32.46 | 0.01 | 4.81 | 4.82 | (0.02) | (1.32) | (1.34) | $35.94 | 15.35% | 1.25% | 1.26% | 0.04% | 0.03% | 16% |
| $71,650 |
|
2013 | $24.89 | 0.08 | 7.60 | 7.68 | (0.11) | — | (0.11) | $32.46 | 30.99% | 1.24% | 1.24% | 0.27% | 0.27% | 26% |
| $71,063 |
|
C Class | | | | | | | | |
2017 | $30.17 | (0.28) | 8.67 | 8.39 | — | (1.60) | (1.60) | $36.96 | 29.12% | 1.98% | 1.98% | (0.83)% | (0.83)% | 16% |
| $5,359 |
|
2016 | $32.36 | (0.25) | (0.12) | (0.37) | — | (1.82) | (1.82) | $30.17 | (1.03)% | 1.98% | 1.98% | (0.81)% | (0.81)% | 18% |
| $3,306 |
|
2015 | $32.41 | (0.25) | 2.73 | 2.48 | — | (2.53) | (2.53) | $32.36 | 8.63% | 1.98% | 1.98% | (0.78)% | (0.78)% | 16% |
| $2,968 |
|
2014 | $29.60 | (0.22) | 4.35 | 4.13 | — | (1.32) | (1.32) | $32.41 | 14.51% | 2.00% | 2.01% | (0.71)% | (0.72)% | 16% |
| $2,482 |
|
2013 | $22.83 | (0.13) | 6.96 | 6.83 | (0.06) | — | (0.06) | $29.60 | 29.98% | 1.99% | 1.99% | (0.48)% | (0.48)% | 26% |
| $2,077 |
|
R Class | | | | | | | | |
2017 | $33.79 | (0.12) | 9.77 | 9.65 | — | (1.60) | (1.60) | $41.84 | 29.75% | 1.48% | 1.48% | (0.33)% | (0.33)% | 16% |
| $11,345 |
|
2016 | $35.85 | (0.10) | (0.14) | (0.24) | — | (1.82) | (1.82) | $33.79 | (0.55)% | 1.48% | 1.48% | (0.31)% | (0.31)% | 18% |
| $9,066 |
|
2015 | $35.46 | (0.10) | 3.02 | 2.92 | — | (2.53) | (2.53) | $35.85 | 9.19% | 1.48% | 1.48% | (0.28)% | (0.28)% | 16% |
| $9,637 |
|
2014 | $32.10 | (0.08) | 4.76 | 4.68 | — | (1.32) | (1.32) | $35.46 | 15.08% | 1.50% | 1.51% | (0.21)% | (0.22)% | 16% |
| $7,983 |
|
2013 | $24.66 | 0.01 | 7.53 | 7.54 | (0.10) | — | (0.10) | $32.10 | 30.66% | 1.49% | 1.49% | 0.02% | 0.02% | 26% |
| $6,556 |
|
R5 Class | | | | | | | | |
2017(4) | $39.41 | 0.07 | 6.56 | 6.63 | — | — | — | $46.04 | 16.82% | 0.78%(5) | 0.78%(5) | 0.28%(5) | 0.28%(5) | 16%(6) |
| $6 |
|
|
| | | | | | | | | | | | | | | | | |
For a Share Outstanding Throughout the Years Ended October 31 (except as noted) | | | | |
Per-Share Data | | | | | | | | | Ratios and Supplemental Data |
| | Income From Investment Operations: | Distributions From: | | | Ratio to Average Net Assets of: | | |
| Net Asset
Value,
Beginning
of Period | Net
Investment
Income
(Loss)(1) | Net
Realized
and
Unrealized
Gain (Loss) | Total From
Investment
Operations | Net
Investment
Income | Net
Realized
Gains | Total
Distributions | Net Asset
Value,
End
of Period | Total
Return(2) | Operating
Expenses | Operating
Expenses
(before
expense
waiver) | Net
Investment
Income
(Loss) | Net
Investment
Income
(Loss)
(before
expense
waiver) | Portfolio
Turnover
Rate | Net
Assets,
End of
Period
(in thousands) |
R6 Class | | | | | | | | |
2017 | $36.97 | 0.18 | 10.75 | 10.93 | (0.23) | (1.60) | (1.83) | $46.07 | 30.86% | 0.63% | 0.63% | 0.52% | 0.52% | 16% |
| $233,309 |
|
2016 | $38.95 | 0.17 | (0.12) | 0.05 | (0.21) | (1.82) | (2.03) | $36.97 | 0.29% | 0.63% | 0.63% | 0.54% | 0.54% | 18% |
| $83,367 |
|
2015 | $38.25 | 0.20 | 3.28 | 3.48 | (0.25) | (2.53) | (2.78) | $38.95 | 10.12% | 0.63% | 0.63% | 0.57% | 0.57% | 16% |
| $36,951 |
|
2014 | $34.46 | 0.05 | 5.28 | 5.33 | (0.22) | (1.32) | (1.54) | $38.25 | 16.06% | 0.65% | 0.66% | 0.64% | 0.63% | 16% |
| $23,684 |
|
2013(7) | $31.57 | 0.05 | 2.84 | 2.89 | — | — | — | $34.46 | 9.15% | 0.63%(5) | 0.64%(5) | 0.61%(5) | 0.60%(5) | 26%(8) |
| $27 |
|
|
| | | | |
Notes to Financial Highlights | | |
| |
(1) | Computed using average shares outstanding throughout the period. |
| |
(2) | Total returns are calculated based on the net asset value of the last business day and do not reflect applicable sales charges, if any. Total returns for periods less than one year are not annualized. |
| |
(3) | Prior to April 10, 2017, the I Class was referred to as the Institutional Class. |
| |
(4) | April 10, 2017 (commencement of sale) through October 31, 2017. |
| |
(6) | Portfolio turnover is calculated at the fund level. Percentage indicated was calculated for the year ended October 31, 2017. |
| |
(7) | July 26, 2013 (commencement of sale) through October 31, 2013. |
| |
(8) | Portfolio turnover is calculated at the fund level. Percentage indicated was calculated for the year ended October 31, 2013. |
See Notes to Financial Statements.
|
|
Report of Independent Registered Public Accounting Firm |
To the Board of Directors and Shareholders of American Century Mutual Funds, Inc.:
We have audited the accompanying statement of assets and liabilities, including the schedule of investments, of Ultra Fund (the “Fund”), one of the funds constituting American Century Mutual Funds, Inc., as of October 31, 2017, and the related statement of operations for the year then ended, the statements of changes in net assets for each of the two years in the period then ended, and the financial highlights for each of the periods presented. These financial statements and financial highlights are the responsibility of the Fund’s management. Our responsibility is to express an opinion on these financial statements and financial highlights based on our audits.
We conducted our audits in accordance with the standards of the Public Company Accounting Oversight Board (United States). Those standards require that we plan and perform the audit to obtain reasonable assurance about whether the financial statements and financial highlights are free of material misstatement. The Fund is not required to have, nor were we engaged to perform, an audit of its internal control over financial reporting. Our audits included consideration of internal control over financial reporting as a basis for designing audit procedures that are appropriate in the circumstances, but not for the purpose of expressing an opinion on the effectiveness of the Fund’s internal control over financial reporting. Accordingly, we express no such opinion. An audit also includes examining, on a test basis, evidence supporting the amounts and disclosures in the financial statements, assessing the accounting principles used and significant estimates made by management, as well as evaluating the overall financial statement presentation. Our procedures included confirmation of securities owned as of October 31, 2017, by correspondence with the custodian and brokers; when replies were not received from brokers, we performed other auditing procedures. We believe that our audits provide a reasonable basis for our opinion.
In our opinion, the financial statements and financial highlights referred to above present fairly, in all material respects, the financial position of Ultra Fund of American Century Mutual Funds, Inc. as of October 31, 2017, the results of its operations for the year then ended, the changes in its net assets for each of the two years in the period then ended, and the financial highlights for each of the periods presented, in conformity with accounting principles generally accepted in the United States of America.
DELOITTE & TOUCHE LLP
Kansas City, Missouri
December 15, 2017
The Board of Directors
The individuals listed below serve as directors of the funds. Each director will continue to serve in this capacity until death, retirement, resignation or removal from office. The board has adopted a mandatory retirement age for directors who are not “interested persons,” as that term is defined in the Investment Company Act (independent directors). Independent directors shall retire by December 31 of the year in which they reach their 75th birthday.
Mr. Thomas is an “interested person” because he currently serves as President and Chief Executive Officer of American Century Companies, Inc. (ACC), the parent company of American Century Investment Management, Inc. (ACIM or the advisor). The other directors (more than three-fourths of the total number) are independent. They are not employees, directors or officers of, and have no financial interest in, ACC or any of its wholly owned, direct or indirect, subsidiaries, including ACIM, American Century Investment Services, Inc. (ACIS) and American Century Services, LLC (ACS), and they do not have any other affiliations, positions or relationships that would cause them to be considered “interested persons” under the Investment Company Act. The directors serve in this capacity for seven (in the case of Mr. Thomas, 15) registered investment companies in the American Century Investments family of funds.
The following table presents additional information about the directors. The mailing address for each director is 4500 Main Street, Kansas City, Missouri 64111.
|
| | | | | |
Name
(Year of Birth) | Position(s) Held with Funds | Length of Time Served | Principal Occupation(s) During Past 5 Years | Number of American Century Portfolios Overseen by Director | Other Directorships Held During Past 5 Years |
Independent Directors |
|
|
Thomas W. Bunn (1953) | Director | Since 2017 | Retired | 69 | SquareTwo Financial; Barings (formerly Babson Capital Funds Trust) (2013 to 2016) |
Barry Fink
(1955) | Director | Since 2012 (independent since 2016) | Retired; Executive Vice President, ACC (2007 to 2013); President, ACS (2007 to 2013); Chief Operating Officer, ACC (2007 to 2012) | 69 | None |
Andrea C. Hall
(1945) | Director | Since 1997 | Retired | 69 | None |
Jan M. Lewis
(1957) | Director | Since 2011 | Retired; President and Chief Executive Officer, Catholic Charities of Northeast Kansas (human services organization) (2006 to 2013) | 69 | None |
James A. Olson
(1942) | Director and Chairman of the Board | Since 2007 (Chairman since 2014) | Member, Plaza Belmont LLC (private equity fund manager) (1999 to present) | 69 | Saia, Inc. (2002 to 2012) and EPR Properties (2003 to 2013) |
|
| | | | | |
Name
(Year of Birth) | Position(s) Held with Funds | Length of Time Served | Principal Occupation(s) During Past 5 Years | Number of American Century Portfolios Overseen by Director | Other Directorships Held During Past 5 Years |
Independent Directors |
|
|
M. Jeannine Strandjord
(1945) | Director | Since 1994 | Retired | 69 | Euronet Worldwide Inc.; MGP Ingredients, Inc.; and DST Systems Inc. (1996 to 2012) |
John R. Whitten
(1946) | Director | Since 2008 | Retired | 69 | Rudolph Technologies, Inc. |
Stephen E. Yates
(1948) | Director | Since 2012 | Retired | 69 | None |
Interested Director |
|
|
Jonathan S. Thomas
(1963) | Director and President | Since 2007 | President and Chief Executive Officer, ACC (2007 to present). Also serves as Chief Executive Officer, ACS; Executive Vice President, ACIM; Director, ACC, ACIM and other ACC subsidiaries | 114 | BioMed Valley Discoveries, Inc. |
The Statement of Additional Information has additional information about the fund's directors and is available without charge, upon request, by calling 1-800-345-2021.
Officers
The following table presents certain information about the executive officers of the funds. Each officer serves as an officer for each of the 15 investment companies in the American Century family of funds, unless otherwise noted. No officer is compensated for his or her service as an officer of the funds. The listed officers are interested persons of the funds and are appointed or re-appointed on an annual basis. The mailing address for each officer listed below is 4500 Main Street, Kansas City, Missouri 64111.
|
| | |
Name
(Year of Birth) | Offices with the Funds | Principal Occupation(s) During the Past Five Years |
Jonathan S. Thomas
(1963) | Director and President since 2007 | President and Chief Executive Officer, ACC (2007 to present). Also serves as Chief Executive Officer, ACS; Executive Vice President, ACIM; Director, ACC, ACIM and other ACC subsidiaries |
Amy D. Shelton
(1964) | Chief Compliance Officer and Vice President since 2014 | Chief Compliance Officer, American Century funds, (2014 to present); Chief Compliance Officer, ACIM (2014 to present); Chief Compliance Officer, ACIS (2009 to present); Vice President, Client Interactions and Marketing, ACIS (2013 to 2014); Director, Client Interactions and Marketing, ACIS (2007 to 2013). Also serves as Vice President, ACIS |
Charles A. Etherington
(1957) | General Counsel since 2007 and Senior Vice President since 2006 | Attorney, ACC (1994 to present); Vice President, ACC (2005 to present); General Counsel, ACC (2007 to present). Also serves as General Counsel, ACIM, ACS, ACIS and other ACC subsidiaries; and Senior Vice President, ACIM and ACS |
C. Jean Wade
(1964) | Vice President,Treasurer and Chief Financial Officer since 2012 | Vice President, ACS (2000 to present) |
Robert J. Leach
(1966) | Vice President since 2006 and Assistant Treasurer since 2012 | Vice President, ACS (2000 to present) |
David H. Reinmiller
(1963) | Vice President since 2000 | Attorney, ACC (1994 to present); Associate General Counsel, ACC (2001 to present). Also serves as Vice President, ACIM and ACS |
Ward D. Stauffer
(1960) | Secretary since 2005 | Attorney, ACC (2003 to present) |
|
|
Approval of Management Agreement |
At a meeting held on June 29, 2017, the Fund’s Board of Directors (the "Board") unanimously approved the renewal of the management agreement pursuant to which American Century Investment Management, Inc. (the “Advisor”) acts as the investment advisor for the Fund. Under Section 15(c) of the Investment Company Act, contracts for investment advisory services are required to be reviewed, evaluated, and approved by a majority of a fund’s directors (the “Directors”), including a majority of the independent Directors, each year.
Prior to its consideration of the renewal of the management agreement, the Directors requested and reviewed extensive data and information compiled by the Advisor and certain independent providers of evaluation data concerning the Fund and the services provided to the Fund by the Advisor. This review was in addition to the oversight and evaluation undertaken by the Board and its committees on a continual basis and the information received was supplemental to the extensive information that the Board and its committees receive and consider throughout the year.
In connection with its consideration of the renewal of the management agreement, the Board’s review and evaluation of the services provided by the Advisor included, but was not limited to, the following:
| |
• | the nature, extent, and quality of investment management, shareholder services, and other services provided and to be provided to the Fund; |
| |
• | the wide range of other programs and services provided and to be provided to the Fund and its shareholders on a routine and non-routine basis; |
| |
• | the investment performance of the Fund, including data comparing the Fund's performance to appropriate benchmarks and/or a peer group of other mutual funds with similar investment objectives and strategies; |
| |
• | the cost of owning the Fund compared to the cost of owning similar funds; |
| |
• | the compliance policies, procedures, and regulatory experience of the Advisor and the Fund's service providers; |
| |
• | financial data showing the cost of services provided to the Fund, the profitability of the Fund to the Advisor, and the overall profitability of the Advisor; |
| |
• | strategic plans of the Advisor |
| |
• | possible economies of scale associated with the Advisor’s management of the Fund and other accounts under its management; |
| |
• | data comparing services provided and charges to the Advisor's other investment management clients; |
| |
• | acquired fund fees and expenses; |
| |
• | payments and practices by the Fund and the Advisor regarding financial intermediaries, the nature of services provided by intermediaries, and the terms of share classes utilized; and |
| |
• | any collateral benefits derived by the Advisor from the management of the Fund. |
The Directors held three in-person meetings and one telephonic meeting to review and discuss the information provided. The independent Directors also reviewed responses to supplemental information requests and held active discussions with the Advisor regarding the renewal of the management agreement. The independent Directors had the benefit of the advice of their independent counsel throughout the process.
Factors Considered
The Directors considered all of the information provided by the Advisor, the independent data providers, and independent counsel in connection with the approval. They determined that the
information was sufficient for them to evaluate the management agreement for the Fund. In connection with their review, the Directors did not identify any single factor as being all-important or controlling, and each Director may have attributed different levels of importance to different factors. In deciding to renew the management agreement, the Board based its decision on a number of factors, including without limitation the following:
Nature, Extent and Quality of Services - Generally. Under the management agreement, the Advisor is responsible for providing or arranging for all services necessary for the operation of the Fund. The Board noted that the Advisor provides or arranges at its own expense a wide variety of services including without limitation the following:
| |
• | portfolio research and security selection |
| |
• | daily valuation of the Fund’s portfolio |
| |
• | shareholder servicing and transfer agency, including shareholder confirmations, recordkeeping, and communications |
| |
• | legal services (except the independent Directors’ counsel) |
| |
• | regulatory and portfolio compliance |
| |
• | marketing and distribution (except amounts paid by the Fund under Rule 12b-1 plans) |
The Board noted that many of these services have expanded over time in terms of both quantity and complexity in response to shareholder demands, competition in the industry, changing distribution channels, and the changing regulatory environment. The Board noted specifically the resources the Advisor has committed during the year to compliance with the Department of Labor fiduciary rule and share class modernization.
Investment Management Services. The nature of the investment management services provided to the Fund is quite complex and allows Fund shareholders access to professional money management, instant diversification of their investments within an asset class, the opportunity to easily diversify among asset classes by investing in or exchanging among various American Century Investments funds, and liquidity. In evaluating investment performance, the Board expects the Advisor to manage the Fund in accordance with its investment objectives and approved strategies. Further, the Directors recognize that the Advisor has an obligation to monitor trading activities, and in particular to seek the best execution of fund trades, and to evaluate the use of and payment for research. In providing these services, the Advisor utilizes teams of investment professionals (portfolio managers, analysts, research assistants, and securities traders) who require extensive information technology, research, training, compliance, and other systems to conduct their business. The Board, directly and through its Fund Performance Review Committee, provides oversight of the investment performance process. It regularly reviews investment performance information for the Fund, together with comparative information for appropriate benchmarks and/or peer groups of similarly-managed funds, over different time horizons. The Directors also review detailed performance information provided by the Advisor during the management agreement renewal process. If performance concerns are identified, the Fund receives special reviews until performance improves, during which the Board receives a report from the Advisor regarding the reasons for such results (e.g., market conditions, security selection) and any efforts being undertaken to improve performance. The Fund’s performance was above its benchmark for the five- and ten-year periods and below its benchmark for the one- and three-year periods reviewed by the Board. The Board discussed the Fund's performance with the Advisor and was satisfied with the efforts being undertaken by the Advisor. The Board found the investment management services provided by the Advisor to the Fund to be satisfactory and consistent with the management agreement.
Shareholder and Other Services. Under the management agreement, the Advisor provides the Fund with a comprehensive package of transfer agency, shareholder, and other services. The Board, directly and through various committees of the Board, regularly reviews reports and evaluations of such services at its regular meetings. These reports include, but are not limited to, information regarding the operational efficiency and accuracy of the shareholder and transfer agency services provided, staffing levels, shareholder satisfaction (as measured by external as well as internal sources), technology support, new products and services offered to Fund shareholders, securities trading activities, portfolio valuation services, auditing services, and legal and operational compliance activities. Certain aspects of shareholder and transfer agency service level efficiency and the quality of securities trading activities are measured by independent third party providers and are presented in comparison to other fund groups not managed by the Advisor. The Board found the services provided by the Advisor to the Fund under the management agreement to be competitive and of high quality.
Costs of Services and Profitability. The Advisor provides detailed information concerning its cost of providing various services to the Fund, its profitability in managing the Fund (pre- and post-distribution), its overall profitability, and its financial condition. The Directors have reviewed with the Advisor the methodology used to prepare this financial information. This information is considered in evaluating the Advisor’s financial condition, its ability to continue to provide services under the management agreement, and the reasonableness of the current management fee. The Board concluded that the Advisor’s profits were reasonable in light of the services provided to the Fund.
Ethics. The Board generally considers the Advisor’s commitment to providing quality services to shareholders and to conducting its business ethically. They noted that the Advisor’s practices generally meet or exceed industry best practices.
Economies of Scale. The Board also reviewed information provided by the Advisor regarding the possible existence of economies of scale in connection with the management of the Fund. The Board concluded that economies of scale are difficult to measure and predict with precision, especially on a fund-by-fund basis. The Board concluded that the Advisor is appropriately sharing economies of scale through its competitive fee structure, offering competitive fees from fund inception, and through reinvestment in its business to provide shareholders additional content and services. The Board also noted that economies of scale are shared with the Fund and its shareholders through management fee breakpoints that serve to reduce the effective management fee as the assets of the Fund grow.
Comparison to Other Funds’ Fees. The management agreement provides that the Fund pays the Advisor a single, all-inclusive (or unified) management fee for providing all services necessary for the management and operation of the Fund, other than brokerage expenses, expenses attributable to short sales, taxes, interest, extraordinary expenses, and the fees and expenses of the Fund’s independent Directors (including their independent legal counsel) and expenses incurred in connection with the provision of shareholder services and distribution services under a plan adopted pursuant to Rule 12b-1 under the 1940 Act. Under the unified fee structure, the Advisor is responsible for providing all investment advisory, custody, audit, administrative, compliance, recordkeeping, marketing and shareholder services, or arranging and supervising third parties to provide such services. By contrast, most other funds are charged a variety of fees, including an investment advisory fee, a transfer agency fee, an administrative fee, distribution charges, and other expenses. Other than their investment advisory fees and any applicable Rule 12b-1 distribution fees, all other components of the total fees charged by these other funds may be increased without shareholder approval. The Board believes the unified fee structure is a benefit to Fund shareholders because it clearly discloses to shareholders the cost of owning Fund shares, and, since the unified fee cannot be increased without a vote of Fund shareholders, it shifts to the Advisor the risk of increased costs of operating the Fund and provides a direct incentive to minimize administrative inefficiencies. Part of the Board’s analysis of fee levels involves reviewing certain evaluative data compiled by an independent provider comparing the Fund’s unified fee to the total expense ratios of its peers. The unified fee charged to shareholders of the Fund was
below the median of the total expense ratios of the Fund’s peer expense universe and was within the range of its peer expense group. The Board discussed with the Advisor the factors that impacted the level of the fee in relation to its peers. The Board concluded that the management fee paid by the Fund to the Advisor under the management agreement is reasonable in light of the services provided to the Fund.
Comparison to Fees and Services Provided to Other Clients of the Advisor. The Directors also requested and received information from the Advisor concerning the nature of the services, fees, costs, and profitability of its advisory services to advisory clients other than the Fund. They observed that these varying types of client accounts require different services and involve different regulatory and entrepreneurial risks than the management of the Fund. The Board analyzed this information and concluded that the fees charged and services provided to the Fund were reasonable by comparison.
Payments to Intermediaries. The Directors also requested and received a description of payments made to intermediaries by the Fund and the Advisor and services provided in response thereto. These payments include various payments made by the Fund or the Advisor to different types of intermediaries and recordkeepers for distribution and service activities provided for the Fund. The Board reviewed such information and received representations from the Advisor that all such payments by the Fund were made pursuant to the Fund's Rule 12b-1 Plan and that all such payments by the Advisor were made from the Advisor's resources and reasonable profits. The Board found the payments to be reasonable in scope and purpose.
Collateral or “Fall-Out” Benefits Derived by the Advisor. The Board considered the existence of collateral benefits the Advisor may receive as a result of its relationship with the Fund. They concluded that the Advisor’s primary business is managing mutual funds and it generally does not use fund or shareholder information to generate profits in other lines of business, and therefore does not derive any significant collateral benefits from them. The Board noted that additional assets from other clients may offer the Advisor some benefit from increased leverage with service providers and counterparties. Additionally, the Advisor receives proprietary research from broker-dealers that execute fund portfolio transactions, which the Board concluded is likely to benefit other clients of the Advisor, as well as Fund shareholders. The Board also determined that the Advisor is able to provide investment management services to certain clients other than the Fund, at least in part, due to its existing infrastructure built to serve the fund complex. The Board concluded that appropriate allocation methodologies had been employed to assign resources and the cost of those resources to these other clients and, where expressly provided, these other client assets may be included with the assets of the Fund to determine breakpoints in the management fee schedule.
Existing Relationship. The Board also considered whether there was any reason for not continuing the existing arrangement with the Advisor. In this regard, the Board was mindful of the potential disruptions of the Fund’s operations and various risks, uncertainties, and other effects that could occur as a result of a decision not to continue such relationship. In particular, the Board recognized that most shareholders have invested in the Fund on the strength of the Advisor’s industry standing and reputation and in the expectation that the Advisor will have a continuing role in providing advisory services to the Fund.
Conclusion of the Directors. As a result of this process, the Board, including all of the independent Directors, taking into account all of the factors discussed above and the information provided by the Advisor and others in connection with its review and throughout the year, determined that the management fee is fair and reasonable in light of the services provided and that the investment management agreement between the Fund and the Advisor should be renewed.
A special meeting of shareholders was held on October 18, 2017, to vote on the following proposal. The proposal received the required votes and was adopted. A summary of voting results is listed below.
To elect four directors to the Board of Directors of American Century Mutual Funds, Inc.:
|
| | | | | | | |
| Affirmative |
| Withhold |
Thomas W. Bunn | $ | 19,547,896,641 |
|
| $ | 402,531,816 |
|
Barry Fink | $ | 19,543,961,253 |
|
| $ | 406,467,204 |
|
Jan M. Lewis | $ | 19,556,221,886 |
|
| $ | 394,206,571 |
|
Stephen E. Yates | $ | 19,543,817,152 |
|
| $ | 406,611,305 |
|
The other directors whose term of office continued after the meeting include Jonathan S. Thomas, Andrea C. Hall, James A. Olson, M. Jeannine Strandjord, and John R. Whitten.
Retirement Account Information
As required by law, distributions you receive from certain retirement accounts are subject to federal income tax withholding, unless you elect not to have withholding apply*. Tax will be withheld on the total amount withdrawn even though you may be receiving amounts that are not subject to withholding, such as nondeductible contributions. In such case, excess amounts of withholding could occur. You may adjust your withholding election so that a greater or lesser amount will be withheld.
If you don’t want us to withhold on this amount, you must notify us to not withhold the federal income tax. You may notify us in writing or in certain situations by telephone or through other electronic means. For systematic withdrawals, your withholding election will remain in effect until revoked or changed by filing a new election. You have the right to revoke your election at any time and change your withholding percentage for future distributions.
Remember, even if you elect not to have income tax withheld, you are liable for paying income tax on the taxable portion of your withdrawal. If you elect not to have income tax withheld or you don’t have enough income tax withheld, you may be responsible for payment of estimated tax. You may incur penalties under the estimated tax rules if your withholding and estimated tax payments are not sufficient. You can reduce or defer the income tax on a distribution by directly or indirectly rolling such distribution over to another IRA or eligible plan. You should consult your tax advisor for additional information.
State tax will be withheld if, at the time of your distribution, your address is within one of the mandatory withholding states and you have federal income tax withheld (or as otherwise required by state law). State taxes will be withheld from your distribution in accordance with the respective state rules.
*Some 403(b), 457 and qualified retirement plan distributions may be subject to 20% mandatory withholding, as they are subject to special tax and withholding rules. Your plan administrator or plan sponsor is required to provide you with a special tax notice explaining those rules at the time you request a distribution. If applicable, federal and/or state taxes may be withheld from your distribution amount.
Proxy Voting Policies
A description of the policies that the fund's investment advisor uses in exercising the voting rights associated with the securities purchased and/or held by the fund is available without charge, upon request, by calling 1-800-345-2021. It is also available on the "About Us" page of American Century Investments’ website at americancentury.com and on the Securities and Exchange Commission’s website at sec.gov. Information regarding how the investment advisor voted proxies relating to portfolio securities during the most recent 12-month period ended June 30 is available on the "About Us" page at americancentury.com. It is also available at sec.gov.
Quarterly Portfolio Disclosure
The fund files its complete schedule of portfolio holdings with the Securities and Exchange Commission (SEC) for the first and third quarters of each fiscal year on Form N-Q. The fund’s Forms N-Q are available on the SEC’s website at sec.gov, and may be reviewed and copied at the SEC’s Public Reference Room in Washington, DC. Information on the operation of the Public Reference Room may be obtained by calling 1-800-SEC-0330. The fund also makes its complete schedule of portfolio holdings for the most recent quarter of its fiscal year available on its website at americancentury.com and, upon request, by calling 1-800-345-2021.
Other Tax Information
The following information is provided pursuant to provisions of the Internal Revenue Code.
The fund hereby designates up to the maximum amount allowable as qualified dividend income for the fiscal year ended October 31, 2017.
For corporate taxpayers, the fund hereby designates $23,497,355, or up to the maximum amount allowable, of ordinary income distributions paid during the fiscal year ended October 31, 2017 as qualified for the corporate dividends received deduction.
The fund hereby designates $358,938,759, or up to the maximum amount allowable, as long-term capital gain distributions (20% rate gain distributions) for the fiscal year ended October 31, 2017.
|
| | |
| |
| | |
Contact Us | americancentury.com | |
Automated Information Line | 1-800-345-8765 | |
Investor Services Representative | 1-800-345-2021 or 816-531-5575 | |
Investors Using Advisors | 1-800-378-9878 | |
Business, Not-For-Profit, Employer-Sponsored Retirement Plans | 1-800-345-3533 | |
Banks and Trust Companies, Broker-Dealers, Financial Professionals, Insurance Companies | 1-800-345-6488 | |
Telecommunications Relay Service for the Deaf | 711 | |
| | |
American Century Mutual Funds, Inc. | |
| | |
Investment Advisor: American Century Investment Management, Inc. Kansas City, Missouri | |
| | |
This report and the statements it contains are submitted for the general information of our shareholders. The report is not authorized for distribution to prospective investors unless preceded or accompanied by an effective prospectus. | |
| | |
©2017 American Century Proprietary Holdings, Inc. All rights reserved.
CL-ANN-90975 1712 | |
ITEM 2. CODE OF ETHICS.
| |
(a) | The registrant has adopted a Code of Ethics for Senior Financial Officers that applies to the registrant’s principal executive officer, principal financial officer, principal accounting officer, and persons performing similar functions. |
| |
(f) | The registrant’s Code of Ethics for Senior Financial Officers was filed as Exhibit 12 (a)(1) to American Century Asset Allocation Portfolios, Inc.’s Annual Certified Shareholder Report on Form N-CSR, File No. 811-21591, on September 29, 2005, and is incorporated herein by reference. |
ITEM 3. AUDIT COMMITTEE FINANCIAL EXPERT.
| |
(a)(1) | The registrant’s board has determined that the registrant has at least one audit committee financial expert serving on its audit committee. |
| |
(a)(2) | John R. Whitten, Andrea C. Hall, Jan M. Lewis and James A. Olson are the registrant’s designated audit committee financial experts. They are “independent” as defined in Item 3 of Form N-CSR. |
ITEM 4. PRINCIPAL ACCOUNTANT FEES AND SERVICES.
The aggregate fees billed for each of the last two fiscal years for professional services rendered by the principal accountant for the audit of the registrant’s annual financial statements or services that are normally provided by the accountant in connection with statutory and regulatory filings or engagements for those fiscal years were as follows:
FY 2016: $307,195
FY 2017: $254,800
The aggregate fees billed in each of the last two fiscal years for assurance and related services by the principal accountant that are reasonably related to the performance of the audit of the registrant’s financial statements and are not reported under paragraph (a) of this Item were as follows:
For services rendered to the registrant:
Fees required to be approved pursuant to paragraph (c)(7)(ii) of Rule 2-01 of Regulation S-X (relating to certain engagements for non-audit services with the registrant’s investment adviser and its affiliates):
The aggregate fees billed in each of the last two fiscal years for professional services rendered by the principal accountant for tax compliance, tax advice, and tax planning were as follows:
For services rendered to the registrant:
FY 2016: $0
FY 2017: $0
Fees required to be approved pursuant to paragraph (c)(7)(ii) of Rule 2-01 of Regulation S-X (relating to certain engagements for non-audit services with the registrant’s investment adviser and its affiliates):
FY 2016: $0
FY 2017: $0
The aggregate fees billed in each of the last two fiscal years for products and services provided by the principal accountant, other than the services reported in paragraphs (a) through (c) of this Item were as follows:
For services rendered to the registrant:
Fees required to be approved pursuant to paragraph (c)(7)(ii) of Rule 2-01 of Regulation S-X (relating to certain engagements for non-audit services with the registrant’s investment adviser and its affiliates):
| |
(e)(1) | In accordance with paragraph (c)(7)(i)(A) of Rule 2-01 of Regulation S-X, before the accountant is engaged by the registrant to render audit or non-audit services, the engagement is approved by the registrant’s audit committee. Pursuant to paragraph (c)(7)(ii) of Rule 2-01 of Regulation S-X, the registrant’s audit committee also pre-approves its accountant’s engagements for non-audit services with the registrant’s investment adviser, its parent company, and any entity controlled by, or under common control with the investment adviser that provides ongoing services to the registrant, if the engagement relates directly to the operations and financial reporting of the registrant. |
| |
(e)(2) | All services described in each of paragraphs (b) through (d) of this Item were pre-approved before the engagement by the registrant’s audit committee pursuant to paragraph (c)(7)(i)(A) of Rule 2-01 of Regulation S-X. Consequently, none of such services were required to be approved by the audit committee pursuant to paragraph (c)(7)(i)(C). |
| |
(f) | The percentage of hours expended on the principal accountant’s engagement to audit the registrant’s financial statements for the most recent fiscal year that were attributed to work performed by persons other than the principal accountant’s full-time, permanent employees was less than 50%. |
| |
(g) | The aggregate non-audit fees billed by the registrant’s accountant for services rendered to the registrant, and rendered to the registrant’s investment adviser (not including any sub-adviser whose role is primarily portfolio management and is subcontracted with or overseen by another investment adviser), and any entity controlling, controlled by, or under common control with the adviser that provides ongoing services to the registrant for each of the last two fiscal years of the registrant were as follows: |
FY 2016: $829,350
FY 2017: $104,750
| |
(h) | The registrant’s investment adviser and accountant have notified the registrant’s audit committee of all non-audit services that were rendered by the registrant’s accountant to the registrant’s investment adviser, its parent company, and any entity controlled by, or under common control with the investment adviser that provides services to the registrant, which services were not required to be pre-approved pursuant to paragraph (c)(7)(ii) of Rule 2-01 of Regulation S-X. The notification provided to the registrant’s audit committee included sufficient details regarding such services to allow the registrant’s audit committee to consider the continuing independence of its principal accountant. |
ITEM 5. AUDIT COMMITTEE OF LISTED REGISTRANTS.
Not applicable.
ITEM 6. INVESTMENTS.
| |
(a) | The schedule of investments is included as part of the report to stockholders filed under Item 1 of this Form. |
ITEM 7. DISCLOSURE OF PROXY VOTING POLICIES AND PROCEDURES FOR CLOSED-END MANAGEMENT INVESTMENT COMPANIES.
Not applicable.
ITEM 8. PORTFOLIO MANAGERS OF CLOSED-END MANAGEMENT INVESTMENT COMPANIES.
Not applicable.
ITEM 9. PURCHASES OF EQUITY SECURITIES BY CLOSED-END MANAGEMENT INVESTMENT COMPANY AND AFFILIATED PURCHASERS.
Not applicable.
ITEM 10. SUBMISSION OF MATTERS TO A VOTE OF SECURITY HOLDERS.
During the reporting period, there were no material changes to the procedures by which shareholders may recommend nominees to the registrant’s board.
ITEM 11. CONTROLS AND PROCEDURES.
| |
(a) | The registrant's principal executive officer and principal financial officer have concluded that the registrant's disclosure controls and procedures (as defined in Rule 30a-3(c) under the Investment Company Act of 1940) are effective based on their evaluation of these controls and procedures as of a date within 90 days of the filing date of this report. |
| |
(b) | There were no changes in the registrant's internal control over financial reporting (as defined in Rule 30a-3(d) under the Investment Company Act of 1940) that occurred during the registrant's second fiscal quarter of the period covered by this report that have materially affected, or are reasonably likely to materially affect, the registrant's internal control over financial reporting. |
ITEM 12. EXHIBITS.
| |
(a)(1) | Registrant’s Code of Ethics for Senior Financial Officers, which is the subject of the disclosure required by Item 2 of Form N-CSR, was filed as Exhibit 12(a)(1) to American Century Asset Allocation Portfolios, Inc.’s Certified Shareholder Report on Form N-CSR, File No. 811-21591, on September 29, 2005. |
| |
(a)(2) | Separate certifications by the registrant’s principal executive officer and principal financial officer, pursuant to Section 302 of the Sarbanes-Oxley Act of 2002 and Rule 30a-2(a) under the Investment Company Act of 1940, are filed and attached hereto as EX-99.CERT. |
| |
(b) | A certification by the registrant’s chief executive officer and chief financial officer, pursuant to Section 906 of the Sarbanes-Oxley Act of 2002, is furnished and attached hereto as EX-99.906CERT. |
SIGNATURES
Pursuant to the requirements of the Securities Exchange Act of 1934 and the Investment Company Act of 1940, the registrant has duly caused this report to be signed on its behalf by the undersigned, thereunto duly authorized.
|
| | | |
Registrant: | American Century Mutual Funds, Inc. |
| | |
By: | /s/ Jonathan S. Thomas |
| Name: | Jonathan S. Thomas |
| Title: | President |
| | |
Date: | December 28, 2017 |
Pursuant to the requirements of the Securities Exchange Act of 1934 and the Investment Company Act of 1940, this report has been signed below by the following persons on behalf of the registrant and in the capacities and on the dates indicated.
|
| | |
By: | /s/ Jonathan S. Thomas |
| Name: | Jonathan S. Thomas |
| Title: | President |
| | (principal executive officer) |
| | |
Date: | December 28, 2017 |
|
| | |
By: | /s/ C. Jean Wade |
| Name: | C. Jean Wade |
| Title: | Vice President, Treasurer, and |
| | Chief Financial Officer |
| | (principal financial officer) |
| | |
Date: | December 28, 2017 |