UNITED STATES
SECURITIES AND EXCHANGE COMMISSION
Washington, D.C. 20549
FORM N-CSR
CERTIFIED SHAREHOLDER REPORT OF REGISTERED MANAGEMENT
INVESTMENT COMPANIES
Investment Company Act file number: 811-07589
THE HARTFORD MUTUAL FUNDS, INC.
(Exact name of registrant as specified in charter)
P. O. Box 2999, Hartford, Connecticut 06104-2999
(Address of Principal Executive Offices)
Edward P. Macdonald, Esquire
Life Law Unit
The Hartford Financial Services Group, Inc.
200 Hopmeadow Street
Simsbury, Connecticut 06089
(Name and Address of Agent for Service)
Registrant’s telephone number, including area code: (860) 843-9934
Date of fiscal year end: October 31st
Date of reporting period: November 1, 2007 – April 30, 2008
Form N-CSR is to be used by management investment companies to file reports with the Commission not later than 10 days after the transmission to stockholders of any report that is required to be transmitted to stockholders under Rule 30e-1 under the Investment Company Act of 1940 (17 CFR 270.30e-1). The Commission may use the information provided on Form N-CSR in its regulatory, disclosure review, inspection, and policymaking roles.
A registrant is required to disclose the information specified by Form N-CSR, and the Commission will make this information public. A registrant is not required to respond to the collection of information contained in Form N-CSR unless the Form displays a currently valid Office of Management and Budget (“OMB”) control number. Please direct comments concerning the accuracy of the information collection burden estimate and any suggestions for reducing the burden to Secretary, Securities and Exchange Commission, 450 Fifth Street, NW, Washington, DC 20549-0609. The OMB has reviewed this collection of information under the clearance requirements of 44 U.S.C. § 3507.
TABLE OF CONTENTS
Item 1. Reports to Stockholders.
| | | |
Semi-Annual Report
April 30, 2008 | |  |
| | | |
• Manager Discussions
• Financials
Please note that the responses to the questions: How did the Fund perform? and Why did the Fund perform this way?, represent the views of the portfolio manager(s) of the applicable fund.
The Hartford Advisers Fund
(subadvised by Wellington Management Company, LLP)
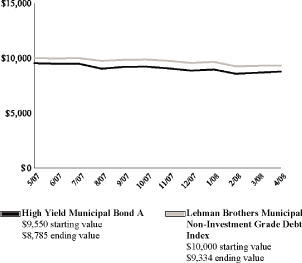
Performance Overview(1) 4/30/98 — 4/30/08
Growth of a $10,000 investment in class A which includes, Sales Charge
Lehman Brothers Government/Credit Bond Index is a broad based unmanaged, market value-weighted index of all debt obligations of the U.S. Treasury and U.S. Government agencies (excluding mortgage-backed securities) and of all publicly issued fixed-rate, nonconvertible, investment grade domestic corporate debt.
S&P 500 Index is a market capitalization weighted price index composed of 500 widely held common stocks.
You cannot invest directly in an index.
The value of shares will fluctuate so that, when redeemed, shares may be worth more or less than their original cost. The chart and table do not reflect the deduction of taxes that a shareholder would pay on fund distributions or the redemption of fund shares.
Investment objective — Seeks maximum long-term total return.
Average Annual Total Returns(2,3) (as of 4/30/08)
| | | | | | | | | | | | | | | | | | | | | |
| | | Inception | | 1 | | 5 | | 10 | | Since |
| | | Date | | Year | | Year | | Year | | Inception |
| |
| Advisers A# | | | 7/22/96 | | | | -1.95 | % | | | 7.36 | % | | | 4.07 | % | | | 7.20 | % |
| Advisers A## | | | 7/22/96 | | | | -7.34 | % | | | 6.15 | % | | | 3.49 | % | | | 6.69 | % |
| Advisers B# | | | 7/22/96 | | | | -2.78 | % | | | 6.54 | % | | | NA | * | | | NA | * |
| Advisers B## | | | 7/22/96 | | | | -7.06 | % | | | 6.23 | % | | | NA | * | | | NA | * |
| Advisers C# | | | 7/22/96 | | | | -2.64 | % | | | 6.65 | % | | | 3.37 | % | | | 6.48 | % |
| Advisers C## | | | 7/22/96 | | | | -3.50 | % | | | 6.65 | % | | | 3.37 | % | | | 6.48 | % |
| Advisers R3# | | | 7/22/96 | | | | -2.30 | % | | | 7.60 | % | | | 4.46 | % | | | 7.61 | % |
| Advisers R3## | | | 7/22/96 | | | | -2.30 | % | | | 7.60 | % | | | 4.46 | % | | | 7.61 | % |
| Advisers R4# | | | 7/22/96 | | | | -1.91 | % | | | 7.70 | % | | | 4.51 | % | | | 7.65 | % |
| Advisers R4## | | | 7/22/96 | | | | -1.91 | % | | | 7.70 | % | | | 4.51 | % | | | 7.65 | % |
| Advisers R5# | | | 7/22/96 | | | | -1.67 | % | | | 7.78 | % | | | 4.55 | % | | | 7.69 | % |
| Advisers R5## | | | 7/22/96 | | | | -1.67 | % | | | 7.78 | % | | | 4.55 | % | | | 7.69 | % |
| Advisers Y# | | | 7/22/96 | | | | -1.54 | % | | | 7.82 | % | | | 4.56 | % | | | 7.70 | % |
| | |
| # | | Without sales charge |
| |
| ## | | With sales charge |
| |
| NA | | Not Applicable |
| |
| * | | 10 year and inception returns are not applicable for Class B because after 8 years Class B converts to Class A. |
PAST PERFORMANCE IS NOT INDICATIVE OF FUTURE RESULTS.
| (1) | | Growth of a $10,000 investment in Classes B, C, R3, R4, R5 and Y shares will vary from results seen above due to differences in the expenses charged to these share classes. |
| |
| (2) | | Class C shares commenced operations on 7/31/98. Performance prior to 7/31/98 reflects Class B performance less Class C sales charges where applicable. Class R3, R4 and R5 shares commenced operations on 12/22/06. Performance prior to 12/22/06 reflects Class Y performance. |
| |
| (3) | | The initial investment in Class A shares reflects the maximum sales charge and Classes B and C reflect CDSC. |
Performance information may reflect historical or current expense waivers/reimbursements from the investment adviser, without which performance would have been lower. For information on current expense waivers/reimbursements, please see the prospectus.
| | | | | | | |
| Portfolio Managers | | | | | | |
| Steven T. Irons, CFA | | John C. Keogh | | Peter I. Higgins, CFA | | Christopher L. Goodkind, CFA |
| Senior Vice President, Partner | | Senior Vice President, Partner | | Vice President, Partner | | Vice President |
How did the Fund perform?
The Class A shares of The Hartford Advisers Fund returned -7.11%, before sales charge, for the six-month period ended April 30, 2008, versus the returns of - -9.63% for the S&P 500 Index, 4.14% for the Lehman Brothers Government/Credit Bond Index and -6.85% for the average fund in the Lipper Mixed-Asset Target Allocation Growth Funds peer group, a group of funds that hold between 60%-80% in equity securities, with the remainder invested in bonds, cash, and cash equivalents.
Why did the Fund perform this way?
U.S. equity markets fell during the period amid ongoing turmoil in the credit markets, a lowering of corporate earnings estimates, and continued home price declines. Equity markets as measured by the S&P 500 Index were down -9.6%. Risk aversion dominated fixed income markets for the period. Investor anxiety over mortgage-related writedowns, weak earnings from companies in the Financial sector, and the persistence of negative ratings actions resulted in a flight to Treasuries. The credit crunch intensified as lending standards tightened and broad-based delevering occurred which led to the underperformance of all Non-Treasury (i.e. “spread”) sectors. The U.S. Federal Reserve (the “Fed”) cut the federal funds rate by 250 bps during the period and introduced a number of liquidity programs in an effort to alleviate pressures in the credit market and renew investor confidence. In this environment fixed income markets generated positive returns as a flight to quality brought down U.S. Treasury rates, more than offsetting widening spreads (i.e. short and long term interest rates moving farther apart) in non-government sectors. The bond market as measured by the Lehman Brothers Government/Credit Bond Index generated returns of 4.1% during the period.
1
The Fund has three primary levers to generate investment performance: equity investments, fixed income investments, and asset allocation among stocks, bonds, and cash. During the period, the equity portion and the fixed income portion of the Fund both underperformed their respective benchmarks. Asset allocation detracted from the Fund’s performance as the Fund’s overweight (i.e. the Fund’s sector position was greater than the benchmark position) to lagging equities and underweight (i.e. the Fund’s sector position was less than the benchmark position) to fixed income hurt relative (i.e. performance of the Fund as measured against the benchmark) returns during the period.
The equity portion of the Fund underperformed due to a combination of security selection and allocation among sectors. Strong stock selection in Consumer Discretionary and Energy was offset by weaker stock selection in Industrials and Telecommunication Services. Sector allocation, which is a result of bottom-up (i.e. stock by stock fundamental research) security selection, was a detractor during the period due primarily to the Fund’s slight underweight to the strongly performing Energy sector and overweight to lagging Information Technology.
Stocks that detracted the most from relative returns included Schering-Plough (Health Care), UBS (Financials) and Suntech Power (Industrials). Shares of Schering-Plough fell on concerns about the effectiveness of its flagship cholesterol drug Vytorin. UBS experienced losses relating to subprime mortgages, as well as losses in their investment banking division. This forced the company to raise additional dilutive equity capital to help absorb write downs, pushing the stock price lower. China-based solar energy products and services company Suntech Power, a new purchase during the period, posted lower-than expected earnings results due to rising polysilicon costs. Significant detractors from absolute (i.e. total return) returns included General Electric (Industrials), AIG (Financials) and Sprint Nextel (Telecommunication Services).
Stocks that contributed most to performance during the period included Washington Mutual (Financials), Elan (Health Care) and Gazprom (Energy). Shares of consumer and small business banking company Washington Mutual rose after merger speculation and an improving interest-rate environment buoyed the shares. The Fund’s holdings in Elan moved higher after the company reported positive results from its multiple sclerosis drug Tysabri. Vertically integrated Russian gas producer Gazprom is benefiting from rising energy prices and demand growth in primary Russian markets, as well as in exports to Europe. Energy companies Schlumberger, Chesapeake Energy and Hess also contributed to the Fund’s returns on an absolute basis. We continued to hold all six of these stocks at the end of the period.
The fixed income portion of the Fund underperformed its benchmark due to overweight allocations to spread sectors. The Fund’s allocations to mortgage-backed securities (MBS), in particular non-agency MBS, commercial mortgage-backed securities (CMBS) and asset-backed securities (ABS) all detracted from relative results. Continued declines in the residential real estate market, a lack of market liquidity, and further liquidations by levered investors led to mass selling of non-agency mortgages and the underperformance of these holdings. Concerns over the implications of a recession for commercial real estate put downward pressure on all CMBS valuations. In addition, the Fund’s overweight to the credit sector and security selection within this sector also hurt relative performance. In particular the Fund’s exposure to debt issued by financial corporations detracted from performance as financial institutions announced greater-than-expected structured product and subprime mortgage-related writedowns and disappointing earnings.
What is the outlook?
Based on bottom-up stock decisions, at the end of the period, the equity portion of the Fund held overweight positions in Information Technology, Health Care and Financials and underweight positions in Consumer Staples, Utilities, and Energy relative to the S&P 500 Index.
We believe that the economic deceleration in the U.S. is ongoing and that the probability of a recession has increased with tighter credit conditions. The Fed’s actions have been substantial and market sentiment is improving; however the potential for negative economic news to surprise markets remains. We believe that spread sectors will benefit as the Fed and other policy actions return stability to the financial markets. The fixed income portion of the Fund is positioned with overweight allocations to the credit, MBS, CMBS, and ABS sectors, an underweight to Treasuries, and a modestly short duration posture. Within the credit sector, we believe corporate spreads represent value relative to default expectations. In the MBS sector, mortgage spreads continue to be attractive despite recent tightening, as we anticipate that future policy actions will favor the residential mortgage sector. In the CMBS market, securities are priced for high levels of losses, which we believe are too severe. Lastly, within the ABS sector, auto and credit card deals are also attractive.
The equity and fixed income managers will continue to work collaboratively to make decisions regarding portfolio weights in stocks, bonds, and cash. As of April 30, 2008, the Fund’s equity exposure was at 69% compared to 60% in its benchmark and at the upper end of the 50-70% range, as we expect equities to outperform bonds and cash.
Diversification by Industry
as of April 30, 2008
| | | | | |
| | | Percentage of |
| Industry | | Net Assets |
| |
| Basic Materials | | | 3.8 | % |
| Capital Goods | | | 0.2 | |
| Consumer Cyclical | | | 5.7 | |
| Consumer Staples | | | 3.4 | |
| Energy | | | 6.8 | |
| Finance | | | 26.9 | |
| General Obligations | | | 0.3 | |
| Health Care | | | 10.2 | |
| Prerefunded | | | 0.3 | |
| Services | | | 9.1 | |
| Short-Term Investments | | | 0.7 | |
| Technology | | | 18.7 | |
| Transportation | | | 0.6 | |
| U.S. Government Agencies | | | 1.9 | |
| U.S. Government Securities | | | 7.1 | |
| Utilities | | | 1.7 | |
| Short-Term Investments | | | 11.1 | |
| Other Assets and Liabilities | | | (8.5 | ) |
| | | | | |
Total | | | 100.0 | % |
| | | | | |
Distribution by Category
as of April 30, 2008
| | | | | |
| | | Percentage of |
| Category | | Net Assets |
| |
| Asset & Commercial Mortgage Backed Securities | | | 3.8 | % |
| Common Stocks | | | 68.5 | |
| Corporate Bonds: Investment Grades | | | 14.1 | |
| Municipal Bonds | | | 0.6 | |
| Preferred Stocks | | | 0.7 | |
| Short-Term Investments | | | 0.7 | |
| U.S. Government Agencies | | | 1.9 | |
| U.S. Government Securities | | | 7.1 | |
| Short-Term Investments | | | 11.1 | |
| Other Assets and Liabilities | | | (8.5 | ) |
| | | | | |
Total | | | 100.0 | % |
| | | | | |
2
The Hartford Balanced Allocation Fund
(subadvised by Hartford Investment Management Company)
Performance Overview(1) 5/28/04 — 4/30/08
Growth of a $10,000 investment in class A which includes, Sales Charge
Lehman Brothers U.S. Aggregate Bond Index is an unmanaged index and is composed of securities from the Lehman Brothers Government/Credit Bond Index, Mortgage-Backed Securities Index, Asset-Backed Index and Commercial Mortgage-Backed Securities Index.
S&P 500 Index is a market capitalization weighted price index composed of 500 widely held common stocks.
You cannot invest directly in an index.
Investment objective — Seeks long-term capital appreciation and income.
Average Annual Total Returns(2,3) (as of 4/30/08)
| | | | | | | | | | | | | |
| | | Inception | | 1 | | Since |
| | | Date | | Year | | Inception |
| |
| Balanced Allocation A# | | | 5/28/04 | | | | 1.39 | % | | | 7.99 | % |
| Balanced Allocation A## | | | 5/28/04 | | | | -4.19 | % | | | 6.45 | % |
| Balanced Allocation B# | | | 5/28/04 | | | | 0.67 | % | | | 7.19 | % |
| Balanced Allocation B## | | | 5/28/04 | | | | -3.98 | % | | | 6.57 | % |
| Balanced Allocation C# | | | 5/28/04 | | | | 0.63 | % | | | 7.19 | % |
| Balanced Allocation C## | | | 5/28/04 | | | | -0.30 | % | | | 7.19 | % |
| Balanced Allocation I# | | | 5/28/04 | | | | 1.79 | % | | | 8.14 | % |
| Balanced Allocation I## | | | 5/28/04 | | | | 1.79 | % | | | 8.14 | % |
| Balanced Allocation R3# | | | 5/28/04 | | | | 1.12 | % | | | 7.86 | % |
| Balanced Allocation R3## | | | 5/28/04 | | | | 1.12 | % | | | 7.86 | % |
| Balanced Allocation R4# | | | 5/28/04 | | | | 1.44 | % | | | 7.99 | % |
| Balanced Allocation R4## | | | 5/28/04 | | | | 1.44 | % | | | 7.99 | % |
| Balanced Allocation R5# | | | 5/28/04 | | | | 1.74 | % | | | 8.09 | % |
| Balanced Allocation R5## | | | 5/28/04 | | | | 1.74 | % | | | 8.09 | % |
| | |
| # | | Without sales charge |
| |
| ## | | With sales charge |
PAST PERFORMANCE IS NOT INDICATIVE OF FUTURE RESULTS.
| (1) | | Growth of a $10,000 investment in Classes B, C, I, R3, R4 and R5 shares will vary from results seen above due to differences in the expenses charged to these classes. |
| |
| (2) | | Class I shares commenced operations on 8/31/06. Performance prior to 8/31/06 reflects Class A performance. Class R3, R4 and R5 shares commenced operations on 12/22/06. Performance prior to 12/22/06 reflects Class A performance. |
| |
| (3) | | The initial investment in Class A shares reflects the maximum sales charge and Classes B and C reflect CDSC. |
The value of shares will fluctuate so that, when redeemed, shares may be worth more or less than their original cost. The chart and table do not reflect the deduction of taxes that a shareholder would pay on fund distributions or the redemption of fund shares.
Performance information may reflect historical or current expense waivers/reimbursements from the investment adviser, without which performance would have been lower. For information on current expense waivers/reimbursements, please see the prospectus.
| | | |
| Portfolio Managers | | |
| Hugh Whelan | | Edward C. Caputo |
| Managing Director | | Assistant Vice President |
How did the Fund perform?
The Class A shares of The Hartford Balanced Allocation Fund returned -5.23%, before sales charge, for the six-month period ended April 30, 2008, versus -5.35% for the Lipper Mixed-Asset Target Allocation Moderate Funds average, 4.08% for the Lehman Brothers U.S. Aggregate Bond Index, and -9.63% for the S&P 500 Index.
Why did the Fund perform this way?
The six-month period under review was challenging for both stocks and bonds, as credit and liquidity remained constrained, volatility was high, and concerns about a potential recession emerged. Although the Federal Reserve (the “Fed”) took considerable steps to help bolster the markets, including reducing the target federal funds rate on several occasions, establishing lending facilities that provided a back stop to both banks and brokers, and facilitating JPMorgan Chase’s rescue acquisition of Bear Stearns, investor confidence continued to erode. As a result, investors fled to the relative safety of Treasury securities, fueling their outperformance of all other sectors of the market for the overall period.
Within the fixed income market, the asset-backed securities segment was the worst performing sector and overall, high-yield asset classes such as U.S. high yield bonds, floating-rate notes, and emerging market bonds underperformed higher quality securities. Within domestic equities, mid-cap stocks outperformed large-cap and small-cap stocks. With regard to style, growth beat value within large-cap and mid-cap stocks but underperformed within small-cap stocks. Overall, international stocks slightly outperformed domestic stocks.
Over the course of the period, asset allocation decisions within equities detracted from the Fund’s performance. Specifically, allocations to small-cap growth, large-cap value, and international small-cap stocks held back returns. However, the negative impact was partially offset by
3
the favorable performance of allocations to mid-cap and large-cap growth and international large-cap stocks. Asset allocation within the fixed income portion of the Fund also detracted from performance. Although allocations to Treasury Inflation Protected Securities (TIPS) and short-term bonds were additive to performance, they did not offset the unfavorable performance of allocations to floating-rate notes, high yield bonds, and emerging market debt. Additionally, the duration of the Fund’s fixed income segment (a measure of interest-rate sensitivity) was targeted to be less than that of the broad fixed income market, as measured by the Lehman Brothers U.S. Aggregate Bond Index. This shorter duration also hindered performance as interest rates declined during the period.
During the reporting period, the Fund began utilizing exchange-traded funds (ETFs) to obtain asset class exposures unavailable through The Hartford fund family. Doing so enables the Fund to capture additional opportunities while also enhancing its diversification. In addition, the Fund continues to target an overweight (i.e. the Fund’s sector position was greater than the benchmark position) to international stocks over domestic stocks, growth stocks over value stocks, and large-cap stocks over small-cap stocks.
The Fund’s performance is influenced not just by our asset allocation decisions, but also by the performance of the underlying funds in which it invests. For the overall period, the Fund benefited from Fund selection decisions in both fixed income and equities. In keeping with the Fund’s long-term approach, we use cash flows to reallocate among the underlying funds whenever possible. No hard rebalance (i.e. a fund rebalancing to move the underlying fund investments to their target allocation percentages) was executed during the period.
What is the outlook?
The economy continues to face strong headwinds. Growth is likely to be weak until home prices stabilize and credit providers return to the business of lending rather than writing down assets. Despite the Fed’s sharp reductions in short-term interest rates, risk premiums (i.e. difference between the risk associated with buying or holding a Treasury and holding a high yield bond) remain high, which has kept borrowing costs high. However, there are encouraging signs. Lenders are moving to aggressively write down bad loans and the Fed has clearly signaled it stands ready to support the capital markets. Given that Fed policy actions have historically taken a few quarters to affect growth, the rate reductions of last year should begin to be felt in the near future, helping to restore order to the financial markets and setting the stage for recovery.
Composition by Underlying Fund
as of April 30, 2008
| | | | | |
| | | Percentage of |
| Fund Name | | Net Assets |
| |
| DJ Wilshire REIT ETF | | | 0.1 | % |
| The Hartford Capital Appreciation Fund, Class Y | | | 17.0 | |
| The Hartford Capital Appreciation II Fund, Class Y | | | 0.9 | |
| The Hartford Disciplined Equity Fund, Class Y | | | 4.0 | |
| The Hartford Equity Income Fund, Class Y | | | 5.6 | |
| The Hartford Floating Rate Fund, Class Y | | | 5.4 | |
| The Hartford Global Growth Fund, Class Y | | | 4.1 | |
| The Hartford Growth Fund, Class Y | | | 0.4 | |
| The Hartford Income Fund, Class Y | | | 12.9 | |
| The Hartford Inflation Plus Fund, Class Y | | | 7.1 | |
| The Hartford International Opportunities Fund, Class Y | | | 4.1 | |
| The Hartford International Small Company Fund, Class Y | | | 4.0 | |
| The Hartford Select MidCap Value Fund, Class Y | | | 1.5 | |
| The Hartford Select SmallCap Value Fund, Class Y | | | 2.4 | |
| The Hartford Short Duration Fund, Class Y | | | 5.1 | |
| The Hartford Small Company Fund, Class Y | | | 3.7 | |
| The Hartford Strategic Income Fund, Class Y | | | 1.7 | |
| The Hartford Total Return Bond Fund, Class Y | | | 7.4 | |
| The Hartford Value Fund, Class Y | | | 11.9 | |
| SPDR DJ Wilshire International Real Estate ETF | | | 0.5 | |
| Other Assets and Liabilities | | | 0.2 | |
| | | | | |
Total | | | 100.0 | % |
| | | | | |
4
The Hartford Balanced Income Fund
(subadvised by Wellington Management Company, LLP)
Performance Overview (1) 7/31/06 — 4/30/08
Growth of a $10,000 investment in class A which includes, Sales Charge
Lehman Brothers Corporate Index is an unmanaged index and is the Corporate component of the U.S. Credit Index within the Lehman Brothers U.S. Aggregate Bond Index.
Russell 1000 Value Index measures the performance of those Russell 1000 Index companies with lower price-to-book ratios and lower forecasted growth values.
You cannot invest directly in an index.
Investment objective — Seeks to provide current income with growth of capital as a secondary objective.
Average Annual Total Returns(2) (as of 4/30/08)
| | | | | | | | | | | | | |
| | | Inception | | 1 | | Since |
| | | Date | | Year | | Inception |
| |
| Balanced Income A# | | | 7/31/06 | | | | -0.82 | % | | | 5.93 | % |
| Balanced Income A## | | | 7/31/06 | | | | -6.27 | % | | | 2.56 | % |
| Balanced Income B# | | | 7/31/06 | | | | -1.63 | % | | | 5.11 | % |
| Balanced Income B## | | | 7/31/06 | | | | -6.40 | % | | | 2.89 | % |
| Balanced Income C# | | | 7/31/06 | | | | -1.59 | % | | | 5.11 | % |
| Balanced Income C## | | | 7/31/06 | | | | -2.54 | % | | | 5.11 | % |
| Balanced Income Y# | | | 7/31/06 | | | | -0.46 | % | | | 6.28 | % |
| | |
| # | | Without sales charge |
| |
| ## | | With sales charge |
PAST PERFORMANCE IS NOT INDICATIVE OF FUTURE RESULTS.
| (1) | | Growth of a $10,000 investment in Classes B, C and Y shares will vary from results seen above due to differences in the expenses charged to these share classes. |
| |
| (2) | | The initial investment in Class A shares reflects the maximum sales charge and Classes B and C reflect CDSC. |
The value of shares will fluctuate so that, when redeemed, shares may be worth more or less than their original cost. The chart and table do not reflect the deduction of taxes that a shareholder would pay on fund distributions or the redemption of fund shares.
Performance information may reflect historical or current expense waivers/reimbursements from the investment adviser, without which performance would have been lower. For information on current expense waivers/reimbursements, please see the prospectus.
| | | | | |
Portfolio Managers | | | | |
Lucius T. Hill, III | | Scott I. St. John, CFA | | John R. Ryan, CFA* |
| Senior Vice President | | Vice President | | Senior Vice President, Partner |
W. Michael Reckmeyer, III, CFA | | Karen H. Grimes, CFA | | Ian R. Link, CFA |
| Vice President | | Vice President | | Vice President |
How did the Fund perform?
The Class A shares of The Hartford Balanced Income Fund returned -3.22%, before sales charge, for the six-month period ended April 30, 2008, versus the returns of -9.83% for the Russell 1000 Value Index, 1.52% for the Lehman Brothers Corporate Index and -5.35% for the average fund in the Lipper Mixed-Asset Target Allocation Moderate Funds peer group, a group of funds that hold between 40-60% in equity securities and the remainder in bonds, cash and cash equivalents.
Why did the Fund perform this way?
U.S. equity markets were weak during the period due to continued disruptions in the credit markets. As the U.S. economy continued to slide into recession, investors abruptly lost their appetite for risk and companies with balance sheet leverage or uncertain financing needs saw significant erosion in their equity market value. The worries climaxed in March with the near collapse of a major investment bank and several bond insurers. However, equity markets experienced a sharp rebound in April as the Federal Reserve (the “Fed”) acted aggressively to soften the economic slowdown and increase liquidity in financial markets. The Russell 1000 Value Index fell -9.83% for the six months ended April 30, 2008. Risk aversion also dominated fixed income markets for the period. Investor anxiety over mortgage-related writedowns, weak earnings from companies in the Financials sector, and the persistence of negative ratings actions resulted in a flight to the relative safety of Treasuries. The credit crunch intensified as lending standards tightened and broad-based reductions in debt occurred, which led to the underperformance of all riskier sectors. The Fed cut the federal funds rate by 250 bps during the period and introduced a number of liquidity programs in an effort to alleviate pressures in the credit market and renew investor confidence. In this environment of declining Treasury rates, fixed income markets posted positive absolute (i.e. total return) returns with the Lehman Aggregate Bond Index gaining 4.08% for the period.
The equity portion of the Fund outperformed its benchmark due to both sector allocation and stock selection. The Fund benefited from underweight (i.e. the Fund’s sector position was less than the benchmark position) positions in the lagging Financials and Information Technology sectors and overweight (i.e. the Fund’s sector position was greater than the benchmark position) positions in Utilities and
5
Consumer Staples. Additionally, strong stock selection in Financials and Telecommunication Services contributed positively to relative (i.e. performance of the Fund as measured against the benchmark) returns. Stock selection was weaker in the Energy, Materials, and Industrials sectors, detracting from relative returns.
Top relative contributors to the equity portion of the Fund included Citigroup (Financials), BP (Energy), and U.S. Bancorp (Financials). Citigroup’s stock continued to decline in the wake of the subprime crisis and related credit market disruptions that began in August 2007. We did not own the stock for much of the period, which helped our relative performance. Shares of BP continue to benefit from higher crude oil prices. BP’s new management team is focused on improving execution and operational efficiencies in oil production. U.S. Bancorp’s shares outperformed as the bank has relatively lower credit risk than some other banking institutions. Top contributors to absolute results also included JPMorgan Chase (Financials) and Chevron (Energy). We continued to hold positions in all of these stocks at the end of the period.
The largest detractors from benchmark-relative returns in the equity portion of the Fund were UBS (Financials), ExxonMobil (Energy), and Bristol-Myers Squibb (Health Care). UBS’s shares declined due to general concerns about liquidity and the company’s exposure to sub-prime. Shares of ExxonMobil rose slightly during the period, but we were underweight the stock, hurting relative results. Bristol-Meyers Squibb was negatively impacted by concerns about the company’s new drug development pipeline and upcoming generic competition. Among the largest detractors on an absolute basis were General Electric (Industrials), Bank of America (Financials), and Verizon Communications (Telecommunications Services). We eliminated our positions in UBS and ExxonMobil during the period but continued to hold the other stocks as of period-end.
The Fund’s fixed income allocation outperformed its benchmark primarily due to the Fund’s underweight to investment grade credit and non-dollar positions. A decline in risk appetite, ratings downgrades, and a lack of market liquidity all pressured spreads wider relative to Treasuries for corporate bonds during the period, and the Fund’s underweight to this sector was additive. Also contributing positively to performance was the Fund’s positioning for interest rates to rise in Canada and Australia versus U.S. rates based on expectations of elevated relative growth and inflation in these countries. During the period, U.S. rates declined by more than rates in Canada and Australia, boosting the Fund’s performance. Security selection within the Fund’s high yield allocation was also modestly additive. Detracting from these results were the Fund’s allocation to commercial mortgage-backed securities (CMBS) and security selection within the investment grade credit sector. In particular the Fund’s overweight exposure to debt issued by financial corporations, specifically brokers and real estate investment trusts (“REITS”), detracted from performance.
Asset allocation was slightly negative during the period due to the Fund’s slight overweight to equities and modest underweight to fixed income.
What is the outlook?
Our equity outlook is based on the view that the U.S. economy has dimmed considerably. There has been downside movement to our “mild ramp-down” case as falling home prices, rising food and energy costs, and declining consumer confidence have led to a pull back in stock prices, particularly for companies involved with selling to consumers. We believe that a mild recession is in market prices now, but the risks of deeper recession have risen.
We believe the outcome in the U.S. is somewhat binary - either a deep recession is in the cards, or all the central bank actions work to avoid the meltdown and a boom is re-ignited on a global basis. In the U.S., Fed action has been impressive. The U.K. and European economies are decelerating, and many countries have a number of financial issues to digest. Japan is sluggish, while Asia and the emerging markets remain strong. In the equity portfolio, we are maintaining our defensive positioning and keeping flexibility in the Fund to move in either direction. Our equity exposure favors the Utilities and Consumer Staples sectors; we are most underweight Consumer Discretionary and Industrials.
Our fixed income positioning is based on the expectation that we are likely to see evidence of a mild recession in the U.S. and a slowing of global economies — a view that is already largely priced into the market. Ultimately we believe that the economy will recover; however the full impact of reduced rates will not be evident for some time. The Fed has taken significant actions to increase liquidity in financial markets and we believe that these actions will be successful in alleviating the credit crunch. As a result, we are maintaining a neutral duration posture. Within the credit sector, corporate valuations are attractive and balance sheets remain healthy. Current spread levels relative to Treasuries reflect valuations consistent with past recessions and we see the best value in BBB-rated bonds and new issues. CMBS are priced for severe loss levels which we believe are unrealistic. We find valuations for high-quality CMBS to be attractive and will maintain the Fund’s allocation. Emerging Market bonds continue to benefit from solid macroeconomic fundamentals. We expect to see falling bond yields and currency appreciation in select emerging market countries. In contrast, high yield valuations are less attractive relative to investment grade opportunities. We hold a neutral allocation to the high yield sector consisting of a diversified basket of select issuers.
The equity and fixed income managers continue to work collaboratively to make decisions regarding portfolio weights in equities and fixed income. At the end of the period, the Fund was neutrally positioned in both equities and fixed income relative to its benchmark.
| | |
| * | | It is anticipated that after June 30, 2008, John R. Ryan will no longer manage assets for the Fund. |
Diversification by Industry
as of April 30, 2008
| | | | | |
| | | Percentage of |
| Industry | | Net Assets |
| |
| Basic Materials | | | 5.9 | % |
| Capital Goods | | | 0.7 | |
| Consumer Cyclical | | | 4.7 | |
| Consumer Staples | | | 4.3 | |
| Energy | | | 9.6 | |
| Finance | | | 34.3 | |
| Foreign Governments | | | 5.2 | |
| Health Care | | | 5.5 | |
| Services | | | 4.5 | |
| Technology | | | 10.9 | |
| Transportation | | | 0.4 | |
| U.S. Government Securities | | | 0.3 | |
| Utilities | | | 10.2 | |
| Short-Term Investments | | | 2.8 | |
| Other Assets and Liabilities | | | 0.7 | |
| | | | | |
Total | | | 100.0 | % |
| | | | | |
Distribution by Category
as of April 30, 2008
| | | | | |
| | | Percentage of |
| Category | | Net Assets |
| |
| Asset & Commercial Mortgage Backed Securities | | | 2.5 | % |
| Common Stocks | | | 44.8 | |
| Corporate Bonds: Investment Grades | | | 40.3 | |
| Corporate Bonds: Non-Investment Grades | | | 8.6 | |
| U.S. Government Securities | | | 0.3 | |
| Short-Term Investments | | | 2.8 | |
| Other Assets and Liabilities | | | 0.7 | |
| | | | | |
Total | | | 100.0 | % |
| | | | | |
6
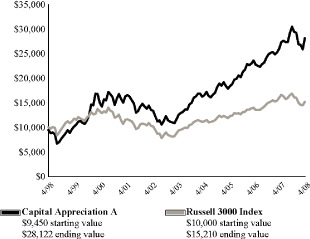
The Hartford Capital Appreciation Fund
(subadvised by Wellington Management Company, LLP)
Performance Overview(1) 4/30/98 — 4/30/08
Growth of a $10,000 investment in Class A which includes Sales Charge
Russell 3000 Index is an unmanaged index that measures the performance of the 3,000 largest U.S. companies based on total capitalization.
You cannot invest directly in an index.
The value of shares will fluctuate so that, when redeemed, shares may be worth more or less than their original cost. The chart and table do not reflect the deduction of taxes that a shareholder would pay on fund distributions or the redemption of fund shares.
Performance information may reflect historical or current expense waivers/reimbursements from the investment adviser, without which performance would have been lower. For information on current expense waivers/reimbursements, please see the prospectus.
Investment objective — Seeks growth of capital.
Average Annual Total Returns(2,3) (as of 4/30/08)
| | | | | | | | | | | | | | | | | | | | | |
| | | Inception | | 1 | | 5 | | 10 | | Since |
| | | Date | | Year | | Year | | Year | | Inception |
| |
| Capital Appreciation A# | | | 7/22/96 | | | | 8.07 | % | | | 19.14 | % | | | 11.51 | % | | | 18.05 | % |
| Capital Appreciation A## | | | 7/22/96 | | | | 2.12 | % | | | 17.80 | % | | | 10.88 | % | | | 17.49 | % |
| Capital Appreciation B# | | | 7/22/96 | | | | 7.21 | % | | | 18.22 | % | | | NA | * | | | NA | * |
| Capital Appreciation B## | | | 7/22/96 | | | | 2.35 | % | | | 18.01 | % | | | NA | * | | | NA | * |
| Capital Appreciation C# | | | 7/22/96 | | | | 7.29 | % | | | 18.33 | % | | | 10.75 | % | | | 17.26 | % |
| Capital Appreciation C## | | | 7/22/96 | | | | 6.31 | % | | | 18.33 | % | | | 10.75 | % | | | 17.26 | % |
| Capital Appreciation I# | | | 7/22/96 | | | | 8.40 | % | | | 19.26 | % | | | 11.57 | % | | | 18.10 | % |
| Capital Appreciation I## | | | 7/22/96 | | | | 8.40 | % | | | 19.26 | % | | | 11.57 | % | | | 18.10 | % |
| Capital Appreciation R3# | | | 7/22/96 | | | | 7.66 | % | | | 19.45 | % | | | 11.93 | % | | | 18.52 | % |
| Capital Appreciation R3## | | | 7/22/96 | | | | 7.66 | % | | | 19.45 | % | | | 11.93 | % | | | 18.52 | % |
| Capital Appreciation R4# | | | 7/22/96 | | | | 8.11 | % | | | 19.57 | % | | | 11.99 | % | | | 18.57 | % |
| Capital Appreciation R4## | | | 7/22/96 | | | | 8.11 | % | | | 19.57 | % | | | 11.99 | % | | | 18.57 | % |
| Capital Appreciation R5# | | | 7/22/96 | | | | 8.35 | % | | | 19.65 | % | | | 12.03 | % | | | 18.60 | % |
| Capital Appreciation R5## | | | 7/22/96 | | | | 8.35 | % | | | 19.65 | % | | | 12.03 | % | | | 18.60 | % |
| Capital Appreciation Y# | | | 7/22/96 | | | | 8.51 | % | | | 19.70 | % | | | 12.05 | % | | | 18.62 | % |
| | |
| # | | Without sales charge |
| |
| ## | | With sales charge |
| |
| NA | | Not Applicable |
| |
| * | | 10 year and inception returns are not applicable for Class B because after 8 years Class B converts to Class A. |
PAST PERFORMANCE IS NOT INDICATIVE OF FUTURE RESULTS.
| (1) | | Growth of a $10,000 investment in Classes B, C, I, R3, R4, R5 and Y shares will vary from results seen above due to differences in the expenses charged to these share classes. |
| |
| (2) | | Class C shares commenced operations on 7/31/98. Performance prior to 7/31/98 reflects Class B performance less Class C sales charges where applicable. Class I shares commenced operations on 8/31/06. Performance prior to 8/31/06 reflects Class A performance. Class R3, R4 and R5 shares commenced operations on 12/22/06. Performance prior to 12/22/06 reflects Class Y performance. |
| |
| (3) | | The initial investment in Class A shares reflects the maximum sales charge and Classes B and C reflect CDSC. |
| | | |
Portfolio Managers | | |
Saul J. Pannell, CFA | | Frank D. Catrickes, CFA, CMT |
| Senior Vice President, Partner | | Senior Vice President, Partner |
How did the Fund perform?
The Class A shares of The Hartford Capital Appreciation Fund returned -7.76%, before sales charge, for the six-month period ended April 30, 2008, versus its benchmark, the Russell 3000 Index, which returned -9.82%, and the -10.20% return of the average fund in the Lipper Multi-Cap Core Funds peer group, a group of funds with investment strategies similar to those of the Fund.
Why did the Fund perform this way?
After rising for five consecutive fiscal years, equity markets, as measured by the Russell 3000 Index, fell during the last six months of the period as equity investors sought to shed risk in response to increasing concerns about the financial system and a potential U.S. recession. The extended credit crunch contributed to the near collapse of the large investment bank Bear Stearns. The U.S. Federal Reserve intervened to sponsor an acquisition of Bear Stearns, lowered the federal funds rate, and introduced multiple programs aimed at improving liquidity. Weakness was broad-based as every sector but one in the Russell 3000 Index declined. Financials (-18%), Information Technology (-16%), and Consumer Discretionary (-14%) posted the largest losses. Energy was the only sector to advance, gaining 6% during the period as oil prices continued to push higher on rising demand from emerging economies and concerns about declining supplies. Materials (-1%) and Consumer Staples (-1%) also performed relatively well during the period.
Relative (i.e. performance of the Fund as measured against the benchmark) performance was driven primarily by positive stock selection in seven of ten sectors. Allocation was also a modest positive as the Fund benefited from its overweight (i.e. the Fund’s sector position was greater than the benchmark position) in Materials stocks and its underweight (i.e. the Fund’s sector position was less than the benchmark position) in Financials stocks. Selection was strongest in the Information Technology and Materials sectors. Top Information Technology picks included credit card processors Visa and MasterCard, which benefited from high transaction volumes, and consumer electronics company Apple, shares of which were bought on weakness during the period and subsequently rose. Strong relative performance in
7
the Materials sector was due in part to positions in steelmaker U.S. Steel and mining companies Vale and Rio Tinto, which continue to benefit from rising global commodity prices. Other top relative and absolute (i.e. total return) contributors included oilfield services company Halliburton, Brazilian integrated oil firm Petrol Brasileiros, and a recently established position in retail bank and mortgage company Washington Mutual.
The Fund lagged the benchmark in the Health Care, Financials, and Utilities sectors. In Health Care, our positions in drug maker Schering-Plough and HMO UnitedHealth Group detracted from results. Shares of Schering-Plough fell on concerns about the effectiveness of its flagship cholesterol drug Vytorin. We continue to hold Schering-Plough based on the belief that the Vytorin concerns are overblown, the company maintains a robust drug pipeline, and expected synergies from its acquisition of Organon Biosciences should be accretive (i.e. additive to earnings per share). UnitedHealth Group was impacted by sector-wide concerns of increasing medical claims rates and physician cost estimates. In spite of the market’s concerns regarding the sector, we believe somewhat higher cost trends and slowing enrollment growth are more than discounted in the stock price. Financials results were hurt by a position in Turkish bank Akbank and by an overweight exposure to Citigroup. Relative results also suffered as the Fund did not hold a position in rising ExxonMobil shares.
What is the outlook?
We continue to focus our efforts on picking stocks one-at-a-time based on detailed fundamental research. We see attractive investment opportunities in the Materials sector, which represented our largest exposure relative to the benchmark at period-end. Top holdings include steel company U.S. Steel and mining companies Vale and Vedanta Resources. Information Technology was the largest absolute weight in the Fund at the end of the period, with top positions in IBM and Google. The Fund has nearly no exposure to the Utilities sector, and retains lower-than-benchmark weightings in Consumer Staples, Health Care, and Financials.
Diversification by Industry
as of April 30, 2008
| | | | | |
| | | Percentage of |
| Industry | | Net Assets |
| |
| Basic Materials | | | 16.7 | % |
| Capital Goods | | | 6.1 | |
| Consumer Cyclical | | | 7.6 | |
| Consumer Staples | | | 2.3 | |
| Energy | | | 10.7 | |
| Finance | | | 16.6 | |
| Health Care | | | 5.5 | |
| Services | | | 3.2 | |
| Technology | | | 21.8 | |
| Transportation | | | 0.6 | |
| Utilities | | | 1.7 | |
| Short-Term Investments | | | 12.6 | |
| Other Assets and Liabilities | | | (5.4 | ) |
| | | | | |
Total | | | 100.0 | % |
| | | | | |
Diversification by Country
as of April 30, 2008
| | | | | |
| | | Percentage of |
| Country | | Net Assets |
| |
| Australia | | | 0.4 | % |
| Austria | | | 0.9 | |
| Belgium | | | 0.2 | |
| Brazil | | | 4.8 | |
| Canada | | | 3.2 | |
| China | | | 2.8 | |
| Egypt | | | 0.6 | |
| France | | | 1.0 | |
| Germany | | | 0.7 | |
| Hong Kong | | | 0.5 | |
| India | | | 0.7 | |
| Israel | | | 0.9 | |
| Japan | | | 0.8 | |
| Luxembourg | | | 1.6 | |
| Norway | | | 0.9 | |
| South Africa | | | 0.8 | |
| Switzerland | | | 3.6 | |
| Taiwan | | | 1.5 | |
| United Kingdom | | | 4.1 | |
| United States | | | 62.8 | |
| Short-Term Investments | | | 12.6 | |
| Other Assets and Liabilities | | | (5.4 | ) |
| | | | | |
Total | | | 100.0 | % |
| | | | | |
8
The Hartford Capital Appreciation II Fund
(subadvised by Wellington Management Company, LLP)
Performance Overview(1) 4/29/05 — 4/30/08
Growth of a $10,000 investment in Class A which includes Sales Charge
Russell 3000 Index is an unmanaged index that measures the performance of the 3,000 largest U.S. companies based on total capitalization.
You cannot invest directly in an index.
The value of shares will fluctuate so that, when redeemed, shares may be worth more or less than their original cost. The chart and table do not reflect the deduction of taxes that a shareholder would pay on fund distributions or the redemption of fund shares.
Performance information may reflect historical or current expense waivers/reimbursements from the investment adviser, without which performance would have been lower. For information on current expense waivers/reimbursements, please see the prospectus.
Investment objective — Seeks growth of capital.
Average Annual Total Returns(2,3) (as of 4/30/08)
| | | | | | | | | | | | | |
| | | Inception | | 1 | | Since |
| | | Date | | Year | | Inception |
| |
| Capital Appreciation II A# | | | 4/29/05 | | | | 1.14 | % | | | 15.04 | % |
| Capital Appreciation II A## | | | 4/29/05 | | | | -4.43 | % | | | 12.89 | % |
| Capital Appreciation II B# | | | 4/29/05 | | | | 0.28 | % | | | 14.12 | % |
| Capital Appreciation II B## | | | 4/29/05 | | | | -4.36 | % | | | 13.35 | % |
| Capital Appreciation II C# | | | 4/29/05 | | | | 0.36 | % | | | 14.23 | % |
| Capital Appreciation II C## | | | 4/29/05 | | | | -0.57 | % | | | 14.23 | % |
| Capital Appreciation II I# | | | 4/29/05 | | | | 1.49 | % | | | 15.25 | % |
| Capital Appreciation II I## | | | 4/29/05 | | | | 1.49 | % | | | 15.25 | % |
| Capital Appreciation II R3# | | | 4/29/05 | | | | 0.70 | % | | | 15.05 | % |
| Capital Appreciation II R3## | | | 4/29/05 | | | | 0.70 | % | | | 15.05 | % |
| Capital Appreciation II R4# | | | 4/29/05 | | | | 1.20 | % | | | 15.27 | % |
| Capital Appreciation II R4## | | | 4/29/05 | | | | 1.20 | % | | | 15.27 | % |
| Capital Appreciation II R5# | | | 4/29/05 | | | | 1.41 | % | | | 15.40 | % |
| Capital Appreciation II R5## | | | 4/29/05 | | | | 1.41 | % | | | 15.40 | % |
| Capital Appreciation II Y# | | | 4/29/05 | | | | 1.55 | % | | | 15.48 | % |
| | |
| # | | Without sales charge |
| |
| ## | | With sales charge |
PAST PERFORMANCE IS NOT INDICATIVE OF FUTURE RESULTS.
| (1) | | Growth of a $10,000 investment in Classes B, C, I, R3, R4, R5 and Y shares will vary from results seen above due to differences in the expenses charged to these share classes. |
| |
| (2) | | Class I shares commenced operations on 8/31/06. Performance prior to 8/31/06 reflects Class A performance. Class R3, R4 and R5 shares commenced operations on 12/22/06. Performance prior to 12/22/06 reflects Class Y performance. |
| |
| (3) | | The initial investment in Class A shares reflects the maximum sales charge and Classes B and C reflect CDSC. |
| | | | | |
Portfolio Managers
Michael T. Carmen, CFA, CPA | | David W. Palmer, CFA | | Frank D. Catrickes, CFA, CMT |
| Senior Vice President, Partner | | Vice President | | Senior Vice President, Partner |
Nicolas M. Choumenkovitch | | Saul J. Pannell, CFA | | |
| Senior Vice President, Partner | | Senior Vice President, Partner | | |
How did the Fund perform?
The Class A shares of The Hartford Capital Appreciation II Fund returned -13.36%, before sales charge, for the six-month period ended April 30, 2008, versus its benchmark, the Russell 3000 Index, which returned - -9.82%, and the -11.51% return of the average fund in the Lipper Multi-Cap Growth Funds peer group, a group of funds with investment strategies similar to those of the Fund.
Why did the Fund perform this way?
After rising for five consecutive fiscal years, equity markets, as measured by the Russell 3000 Index, fell during the last six months of the period as equity investors sought to shed risk in response to increasing concerns about credit markets and a potential U.S. recession. The extended credit crunch contributed to the near collapse of the large investment bank Bear Stearns. The U.S. Federal Reserve intervened to sponsor an acquisition of Bear Stearns, lowered the federal funds rate, and introduced multiple programs aimed at improving liquidity. Weakness was broad-based as every sector but one in the Russell 3000
Index declined. Financials (-18%), Information Technology (-16%), and Consumer Discretionary (-14%) posted the largest losses. Energy was the only sector to advance, gaining 6% during the period as oil prices continued to push higher on rising demand from emerging economies and concerns about declining supplies. Materials (-1%) and Consumer Staples (-1%) also performed relatively well during the period.
The Fund’s underperformance reflected weak stock selection across seven of ten economic sectors, particularly in Health Care, Industrials, and Financials. This was partially offset by stronger stock selection in the Materials and Information Technology sectors. Allocation among sectors, a result of bottom-up (i.e. stock by stock fundamental research) stock selection, was modestly positive as the Fund benefited from an overweight (i.e. the Fund’s sector position was greater than the benchmark position) in rising Materials stocks and an underweight (i.e. the Fund’s sector position was less than the benchmark position) in lagging Financials stocks. The largest detractors during the period on a relative (i.e. performance of the Fund as measured against the benchmark) and absolute (i.e. total return) basis were Schering-Plough,
9
Focus Media, and Google. Shares of pharmaceutical company Schering-Plough fell on concerns about the effectiveness of its flagship cholesterol drug Vytorin. We continue to hold the stock based on the belief that the Vytorin concerns are overblown, the company maintains a robust drug pipeline, and expected synergies from its acquisition of Organon Biosciences should be accretive (i.e. additive to earnings per share). Shares of China-based digital advertising company Focus Media trended lower due to concerns about management changes, accounting issues, and mobile spamming. We believe the risk/reward potential for the stock remains attractive given the firm’s strong market position in the rapidly expanding Chinese media and advertising markets. Internet search firm Google saw its shares fall on fears that advertising revenues will decelerate as a result of more modest cost-per-click increases and slowing consumer demand. We reduced the position based on the belief that growth will slow more than expected in 2008 and rising expenses could weigh on earnings.
The Fund’s top contributors on a relative and absolute basis were all in the Energy and Materials sectors. Coal producer Arch Coal saw material price increases due to extremely tight global coal markets brought on by strong developing world demand and supply disruptions in China and Australia. Steel maker U.S. Steel, with operations in the U.S., Canada, and Central Europe, is benefiting from rising global demand, pushing prices and margins higher. U.S. Steel’s vertical integration should allow continued leverage to these positive trends. Independent natural gas company Chesapeake Energy raised its production forecasts for 2008 and 2009, citing higher recovery expectations and increased drilling activity levels. The company’s strong asset base and low-cost structure should leave it well-positioned for continued high energy prices. Uralkali, a Russian producer of potash, saw its shares gain on higher fertilizer price expectations. We remain positive on the stock due to a supportive pricing environment, global secular demand growth, and limited expected capacity additions in the potash market.
What is the outlook?
The Hartford Capital Appreciation II Fund is a multi-managed Fund with an opportunistic investment approach. The Fund’s managers pursue diverse and complementary investment strategies, with fundamental, bottom-up research as the foundation for portfolio construction. As a result of this bottom-up stock selection, the Fund ended the period with greater-than-benchmark weights in Materials, Industrials, and Health Care stocks and less-than-benchmark weights in Consumer Staples, Financials, and Utilities. Our largest absolute sector weights at period-end were in the Information Technology, Industrials, and Health Care sectors.
Diversification by Industry
as of April 30, 2008
| | | | | |
| | | Percentage of |
| Industry | | Net Assets |
| |
| Basic Materials | | | 14.8 | % |
| Capital Goods | | | 6.9 | |
| Consumer Cyclical | | | 5.5 | |
| Consumer Staples | | | 4.2 | |
| Energy | | | 8.8 | |
| Finance | | | 16.0 | |
| Health Care | | | 13.2 | |
| Services | | | 6.5 | |
| Technology | | | 17.5 | |
| Transportation | | | 1.9 | |
| Utilities | | | 0.7 | |
| Short-Term Investments | | | 10.5 | |
| Other Assets and Liabilities | | | (6.5 | ) |
| | | | | |
Total | | | 100.0 | % |
| | | | | |
Diversification by Country
as of April 30, 2008
| | | | | |
| | | Percentage of |
| Country | | Net Assets |
| |
| Australia | | | 0.2 | % |
| Brazil | | | 3.0 | |
| Canada | | | 4.0 | |
| China | | | 1.6 | |
| Egypt | | | 0.7 | |
| Finland | | | 0.8 | |
| France | | | 2.4 | |
| Germany | | | 0.5 | |
| Hong Kong | | | 0.5 | |
| Indonesia | | | 0.4 | |
| Ireland | | | 0.6 | |
| Israel | | | 0.5 | |
| Japan | | | 2.3 | |
| Luxembourg | | | 0.7 | |
| Mexico | | | 0.1 | |
| Netherlands | | | 1.0 | |
| Norway | | | 0.9 | |
| Russia | | | 0.8 | |
| South Africa | | | 0.6 | |
| Sweden | | | 0.7 | |
| Switzerland | | | 2.1 | |
| United Kingdom | | | 3.7 | |
| United States | | | 67.9 | |
| Short-Term Investments | | | 10.5 | |
| Other Assets and Liabilities | | | (6.5 | ) |
| | | | | |
Total | | | 100.0 | % |
| | | | | |
10
The Hartford Checks and Balances Fund
(advised by Hartford Investment Financial Services, LLC)
Performance Overview(1) 5/31/07 — 4/30/08
Growth of a $10,000 investment in Class A which includes Sales Charge
Lehman Brothers U.S. Aggregate Bond Index is an unmanaged index and is composed of securities from the Lehman Brothers Government/Credit Bond Index, Mortgage-Backed Securities Index, Asset-Backed Index and Commercial Mortgage-Backed Securities Index.
Russell 3000 Index is an unmanaged index that measures the performance of the 3,000 largest U.S. companies based on total capitalization.
S&P 500 Index is a market capitalization weighted price index composed of 500 widely held common stocks.
You cannot invest directly in an index.
Investment objective — Seeks long-term capital appreciation and income.
Average Annual Total Returns(2) (as of 4/30/08)
| | | | | | | |
| | | Inception | | Since |
| | | Date | | Inception |
| |
| Checks and Balances A# | | 5/31/07 | | | 1.50 | % |
| Checks and Balances A## | | 5/31/07 | | -4.08% |
| Checks and Balances B# | | 5/31/07 | | | 0.87 | % |
| Checks and Balances B## | | 5/31/07 | | -4.10% |
| Checks and Balances C# | | 5/31/07 | | | 0.88 | % |
| Checks and Balances C## | | 5/31/07 | | -0.11% |
| Checks and Balances I# | | 2/29/08 | | | 1.57 | % |
| Checks and Balances I## | | 2/29/08 | | �� | 1.57 | % |
| | |
| # | | Without sales charge |
| |
| ## | | With sales charge |
PAST PERFORMANCE IS NOT INDICATIVE OF FUTURE RESULTS.
| (1) | | Growth of a $10,000 investment in Classes B and C shares will vary from results seen above due to differences in the expenses charged to these share classes. |
| |
| (2) | | The initial investment in Class A shares reflects the maximum sales charge and Classes B and C reflect CDSC. |
The value of shares will fluctuate so that, when redeemed, shares may be worth more or less than their original cost. The chart and table do not reflect the deduction of taxes that a shareholder would pay on fund distributions or the redemption of fund shares.
Performance information may reflect historical or current expense waivers/reimbursements from the investment adviser, without which performance would have been lower. For information on current expense waivers/reimbursements, please see the prospectus.
Portfolio Manager
Vernon J. Meyer, CFA
Senior Vice President
How did the Fund perform?
The Class A shares of The Hartford Checks and Balances Fund returned -3.85%, before sales charge, for the six-month period ended April 30, 2008, versus -6.85% for the Lipper Mixed-Asset Target Allocation Growth Funds average, 4.08% for the Lehman Brothers U.S. Aggregate Bond Index, -9.63% for the S&P 500 Index, and -9.82% for the Russell 3000 Index.
Why did the Fund perform this way?
The Fund makes equal allocations of its assets to a combination of Hartford Mutual Funds (“Underlying Funds”): The Hartford Capital Appreciation Fund, The Hartford Dividend and Growth Fund and The Hartford Total Return Bond Fund. The Underlying Funds may invest in a wide variety of instruments which primarily include U.S. and foreign equity securities, fixed income and money market securities. The Fund is not actively managed, and the Fund’s assets will be rebalanced back to one-third each as soon as reasonably practicable whenever the Fund’s investment in any single Underlying Fund deviates from the target allocation by more than 5%.
The Fund’s relative performance benefited most from the performance of The Hartford Total Return Bond Fund. The Hartford Capital Appreciation Fund’s performance detracted most from relative performance.
11
What is your outlook?
The Fund will continue to make equal allocations of its assets to the three Underlying Funds. Please refer to the individual pages of each Underlying Fund for additional information.
Composition by Underlying Fund
as of April 30, 2008
| | | | | |
| | | Percentage of |
| Fund Name | | Net Assets |
| |
| The Hartford Capital Appreciation Fund, Class Y | | | 32.8 | % |
| The Hartford Dividend and Growth Fund, Class Y | | | 32.8 | |
| The Hartford Total Return Bond Fund, Class Y | | | 32.6 | |
| Other Assets and Liabilities | | | 1.8 | |
| | | | | |
Total | | | 100.0 | % |
| | | | | |
12
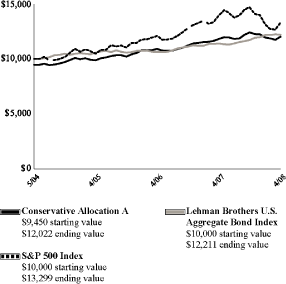
The Hartford Conservative Allocation Fund
(subadvised by Hartford Investment Management Company)
Performance Overview(1) 5/28/04 — 4/30/08
Growth of a $10,000 investment in Class A which includes Sales Charge
Lehman Brothers U.S. Aggregate Bond Index is an unmanaged index and is composed of securities from the Lehman Brothers Government/Credit Bond Index, Mortgage-Backed Securities Index, Asset-Backed Index and Commercial Mortgage-Backed Securities Index.
S&P 500 Index is a market capitalization weighted price index composed of 500 widely held common stocks.
You cannot invest directly in an index.
The value of shares will fluctuate so that, when redeemed, shares may be worth more or less than their original cost. The chart and table do not reflect the deduction of taxes that a shareholder would pay on fund distributions or the redemption of fund shares.
Investment objective — Seeks current income and long-term capital appreciation.
Average Annual Total Returns(2,3) (as of 4/30/08)
| | | | | | | | | | | | | |
| | | Inception | | 1 | | Since |
| | | Date | | Year | | Inception |
| |
| Conservative Allocation A# | | | 5/28/04 | | | | 1.59 | % | | | 6.32 | % |
| Conservative Allocation A## | | | 5/28/04 | | | | -4.00 | % | | | 4.80 | % |
| Conservative Allocation B# | | | 5/28/04 | | | | 0.79 | % | | | 5.61 | % |
| Conservative Allocation B## | | | 5/28/04 | | | | -3.91 | % | | | 4.96 | % |
| Conservative Allocation C# | | | 5/28/04 | | | | 0.81 | % | | | 5.60 | % |
| Conservative Allocation C## | | | 5/28/04 | | | | -0.13 | % | | | 5.60 | % |
| Conservative Allocation I# | | | 5/28/04 | | | | 1.82 | % | | | 6.44 | % |
| Conservative Allocation I## | | | 5/28/04 | | | | 1.82 | % | | | 6.44 | % |
| Conservative Allocation R3# | | | 5/28/04 | | | | 1.11 | % | | | 6.14 | % |
| Conservative Allocation R3## | | | 5/28/04 | | | | 1.11 | % | | | 6.14 | % |
| Conservative Allocation R4# | | | 5/28/04 | | | | 1.56 | % | | | 6.30 | % |
| Conservative Allocation R4## | | | 5/28/04 | | | | 1.56 | % | | | 6.30 | % |
| Conservative Allocation R5# | | | 5/28/04 | | | | 1.82 | % | | | 6.39 | % |
| Conservative Allocation R5## | | | 5/28/04 | | | | 1.82 | % | | | 6.39 | % |
| | |
| # | | Without sales charge |
| |
| ## | | With sales charge |
PAST PERFORMANCE IS NOT INDICATIVE OF FUTURE RESULTS.
| (1) | | Growth of a $10,000 investment in Classes B, C, I, R3, R4 and R5 shares will vary from results seen above due to differences in the expenses charged to these classes. |
| |
| (2) | | Class I shares commenced operations on 8/31/06. Performance prior to 8/31/06 reflects Class A performance. Class R3, R4 and R5 shares commenced operations on 12/22/06. Performance prior to 12/22/06 reflects Class A performance. |
| |
| (3) | | The initial investment in Class A shares reflects the maximum sales charge and Classes B and C reflect CDSC. |
Performance information may reflect historical or current expense waivers/reimbursements from the investment adviser, without which performance would have been lower. For information on current expense waivers/reimbursements, please see the prospectus.
| | | |
Portfolio Managers | | |
Hugh Whelan | | Edward C. Caputo |
| Managing Director | | Assistant Vice President |
How did the Fund perform?
The Class A shares of The Hartford Conservative Allocation Fund returned -3.13%, before sales charge, for the six-month period ended April 30, 2008, versus - -2.29% for the Lipper Mixed-Asset Target Allocation Conservative Funds category, 4.08% for the Lehman Brothers U.S. Aggregate Bond Index, and -9.63% for the S&P 500 Index.
Why did the Fund perform this way?
The six-month period under review was challenging for both stocks and bonds, as credit and liquidity remained constrained, volatility was high, and concerns about a potential recession emerged. Although the Federal Reserve (the “Fed”) took considerable steps to help bolster the markets, including reducing the target federal funds rate on several occasions, establishing lending facilities that provided a back stop to
both banks and brokers, and facilitating JPMorgan Chase’s rescue acquisition of Bear Stearns, investor confidence continued to erode. As a result, investors fled to the relative safety of Treasury securities, fueling their outperformance of all other sectors of the market for the overall period.
Within the fixed income market, the asset-backed securities segment was the worst performing sector and overall, high-yield asset classes such as U.S. high yield bonds, floating-rate notes, and emerging market bonds underperformed higher quality securities. Within domestic equities, mid-cap stocks outperformed large-cap and small-cap stocks. With regard to style, growth beat value within large-cap and mid-cap stocks but underperformed within small-cap stocks. Overall, international stocks slightly outperformed domestic stocks.
Over the course of the period, asset allocation decisions within equities detracted from the Fund’s performance. Specifically, allocations to
13
small-cap growth, large-cap value, and international small-cap stocks held back returns. However, the negative impact was partially offset by the favorable performance of allocations to mid-cap and large-cap growth and international large-cap stocks. Asset allocation within the fixed income portion of the Fund also detracted from performance. Although allocations to Treasury Inflation Protected Securities (TIPS) and short-term bonds were additive to performance, they did not offset the unfavorable performance of allocations to floating-rate notes and intermediate-maturity bonds. Additionally, the duration of the Fund’s fixed income segment (a measure of interest-rate sensitivity) was targeted to be less than that of the broad fixed income market, as measured by the Lehman Brothers U.S. Aggregate Bond Index. This shorter duration also hindered performance as interest rates declined during the period.
During the reporting period, the Fund began utilizing exchange-traded funds (ETFs) to obtain asset class exposures unavailable through The Hartford fund family. Doing so enables the Fund to capture additional opportunities while also enhancing its diversification. In addition, the Fund continues to target an overweight (i.e. the Fund’s sector position was greater than the benchmark position) to international stocks over domestic stocks, growth stocks over value stocks, and large-cap stocks over small-cap stocks.
The Fund’s performance is influenced not just by our asset allocation decisions, but also by the performance of the underlying funds in which it invests. For the overall period, the Fund benefited from Fund selection decisions in both fixed income and equities. In keeping with the Fund’s long-term approach, we use cash flows to reallocate among the underlying funds whenever possible. No hard rebalance (i.e. a fund rebalancing to move the underlying fund investments to their target allocation percentages) was executed during the period.
What is the outlook?
The economy continues to face strong headwinds. Growth is likely to be weak until home prices stabilize and credit providers return to the business of lending rather than writing down assets. Despite the Fed’s sharp reductions in short-term interest rates, risk premiums (i.e. difference between the risk associated with buying or holding a Treasury and holding a high yield bond) remain high, which has kept borrowing costs high. However, there are encouraging signs. Lenders are moving to aggressively write down bad loans and the Fed has clearly signaled it stands ready to support the capital markets. Given that Fed policy actions have historically taken a few quarters to affect growth, the rate reductions of last year should begin to be felt in the near future, helping to restore order to the financial markets and setting the stage for recovery.
Composition by Underlying Fund
as of April 30, 2008
| | | | | |
| | | Percentage of |
| Fund Name | | Net Assets |
| |
| DJ Wilshire REIT ETF | | | 0.2 | % |
| The Hartford Capital Appreciation Fund, Class Y | | | 12.6 | |
| The Hartford Capital Appreciation II Fund, Class Y | | | 1.6 | |
| The Hartford Disciplined Equity Fund, Class Y | | | 4.9 | |
| The Hartford Equity Income Fund, Class Y | | | 7.8 | |
| The Hartford Floating Rate Fund, Class Y | | | 6.0 | |
| The Hartford Global Growth Fund, Class Y | | | 3.2 | |
| The Hartford Growth Fund, Class Y | | | 1.1 | |
| The Hartford High Yield Fund, Class Y | | | 1.0 | |
| The Hartford Income Fund, Class Y | | | 11.7 | |
| The Hartford Inflation Plus Fund, Class Y | | | 11.8 | |
| The Hartford International Opportunities Fund, Class Y | | | 2.1 | |
| The Hartford International Small Company Fund, Class Y | | | 2.4 | |
| The Hartford Money Market Fund, Class Y | | | 1.1 | |
| The Hartford Select MidCap Value Fund, Class Y | | | 1.0 | |
| The Hartford Select SmallCap Value Fund, Class Y | | | 2.0 | |
| The Hartford Short Duration Fund, Class Y | | | 13.9 | |
| The Hartford Strategic Income Fund, Class Y | | | 3.6 | |
| The Hartford Total Return Bond Fund, Class Y | | | 10.5 | |
| The Hartford Value Opportunities Fund, Class Y | | | 1.0 | |
| SPDR DJ Wilshire International Real Estate ETF | | | 0.2 | |
| Other Assets and Liabilities | | | 0.3 | |
| | | | | |
Total | | | 100.0 | % |
| | | | | |
14
The Hartford Disciplined Equity Fund
(subadvised by Wellington Management Company, LLP)
Performance Overview(1) 4/30/98 — 4/30/08
Growth of a $10,000 investment in Class A which includes Sales Charge
S&P 500 Index is a market capitalization weighted price index composed of 500 widely held common stocks.
You cannot invest directly in an index.
The value of shares will fluctuate so that, when redeemed, shares may be worth more or less than their original cost. The chart and table do not reflect the deduction of taxes that a shareholder would pay on fund distributions or the redemption of fund shares.
Performance information may reflect historical or current expense waivers/reimbursements from the investment adviser, without which performance would have been lower. For information on current expense waivers/reimbursements, please see the prospectus.
Investment objective — Seeks growth of capital.
Average Annual Total Returns(2,3) (as of 4/30/08)
| | | | | | | | | | | | | | | | | | | | | |
| | | Inception | | 1 | | 5 | | 10 | | Since |
| | | Date | | Year | | Year | | Year | | Inception |
| |
| Disciplined Equity A# | | | 4/30/98 | | | | -7.04 | % | | | 9.41 | % | | | 3.69 | % | | | 3.69 | % |
| Disciplined Equity A## | | | 4/30/98 | | | | -12.15 | % | | | 8.18 | % | | | 3.10 | % | | | 3.10 | % |
| Disciplined Equity B# | | | 4/30/98 | | | | -7.61 | % | | | 8.66 | % | | | NA | * | | | NA | * |
| Disciplined Equity B## | | | 4/30/98 | | | | -12.23 | % | | | 8.37 | % | | | NA | * | | | NA | * |
| Disciplined Equity C# | | | 4/30/98 | | | | -7.68 | % | | | 8.65 | % | | | 2.98 | % | | | 2.98 | % |
| Disciplined Equity C## | | | 4/30/98 | | | | -8.60 | % | | | 8.65 | % | | | 2.98 | % | | | 2.98 | % |
| Disciplined Equity R3# | | | 4/30/98 | | | | -7.25 | % | | | 9.74 | % | | | 4.11 | % | | | 4.11 | % |
| Disciplined Equity R3## | | | 4/30/98 | | | | -7.25 | % | | | 9.74 | % | | | 4.11 | % | | | 4.11 | % |
| Disciplined Equity R4# | | | 4/30/98 | | | | -6.92 | % | | | 9.85 | % | | | 4.16 | % | | | 4.16 | % |
| Disciplined Equity R4## | | | 4/30/98 | | | | -6.92 | % | | | 9.85 | % | | | 4.16 | % | | | 4.16 | % |
| Disciplined Equity R5# | | | 4/30/98 | | | | -6.72 | % | | | 9.93 | % | | | 4.19 | % | | | 4.19 | % |
| Disciplined Equity R5## | | | 4/30/98 | | | | -6.72 | % | | | 9.93 | % | | | 4.19 | % | | | 4.19 | % |
| Disciplined Equity Y# | | | 4/30/98 | | | | -6.58 | % | | | 9.97 | % | | | 4.22 | % | | | 4.22 | % |
| | |
| # | | Without sales charge |
| |
| ## | | With sales charge |
| |
| NA | | Not Applicable |
| |
| * | | 10 year and inception returns are not applicable for Class B because after 8 years Class B converts to Class A. |
PAST PERFORMANCE IS NOT INDICATIVE OF FUTURE RESULTS.
| (1) | | Growth of a $10,000 investment in Classes B, C, R3, R4, R5 and Y shares will vary from results seen above due to differences in the expenses charged to these share classes. |
| |
| (2) | | Class C shares commenced operations on 7/31/98. Performance prior to 7/31/98 reflects Class B performance less Class C sales charges where applicable. Class R3, R4 and R5 shares commenced operations on 12/22/06. Performance prior to 12/22/06 reflects Class Y performance. |
| |
| (3) | | The initial investment in Class A shares reflects the maximum sales charge and Classes B and C reflect CDSC. |
| | | |
Portfolio Managers | | |
James A. Rullo, CFA | | Mammem Chally, CFA |
| Senior Vice President, Partner | | Vice President |
How did the Fund perform?
The Class A shares of The Hartford Disciplined Equity Fund returned -10.59%, before sales charge, for the six-month period ended April 30, 2008, versus its benchmark, the S&P 500 Index, which returned -9.63%, and the -10.59% return of the average fund in the Lipper Large-Cap Core Funds peer group, a group of funds with investment strategies similar to those of the Fund.
Why did the Fund perform this way?
U.S. equity markets fell during the period amid ongoing turmoil in the credit markets, a lowering of corporate earnings estimates, and continued home-price declines. The U.S. Federal Reserve (the “Fed”) acted aggressively to soften an economic slowdown by lowering the federal funds rate and introducing multiple programs aimed at improving liquidity within the U.S. financial systems. Amid the concern, however, investors found some cause for optimism based on the assertiveness of the Fed, which proved willing to intervene to ensure the orderly functioning of U.S. financial markets. Weakness was widespread during the period as every sector but one in the S&P 500 Index fell during the period. Financials (-20%), Information Technology (-15%), and Telecommunication Services (-13%) posted the largest losses. Energy was the only sector to advance, gaining 6% during the period as oil prices continued to push higher on rising demand from emerging economies and concerns about declining supplies. Consumer Staples (-0.5%) and Materials (-2%) also performed relatively well during the period.
The Fund’s relative (i.e. performance of the Fund as measured against the benchmark) underperformance was due largely to allocation among sectors, which is a result of the bottom-up (i.e. stock by stock fundamental research) stock selection process. Our below-benchmark allocations to Energy, Consumer Staples, and Industrials all had a negative impact on relative results. Stock selection was strong in the Financials, Materials, and Information Technology sectors but was offset by weaker results in Health Care, Consumer Discretionary, and Consumer Staples.
The largest detractors on a relative basis were Schering-Plough (Health Care), WellPoint (Health Care), and Marathon Oil (Energy). Shares of pharmaceutical company Schering-Plough declined on concerns about the effectiveness of Vytorin, a cholesterol drug that was developed in
15
partnership with Merck. Managed healthcare insurance provider WellPoint cut 2008 guidance citing an underestimation of medical cost trends, pushing its shares lower. We reduced our position. Shares of integrated oil company Marathon Oil declined as the company indicated higher than expected spending to develop new energy sources and reduced guidance for the year. We continued to hold all three stocks at the end of the period. Other top detractors from relative and absolute (i.e. total return) returns included UnitedHealth Group (Health Care) and Goldman Sachs (Financials).
Top relative contributors to performance during the period were Occidental Petroleum (Energy), Mosaic (Materials), and Assurant (Financials). Oil and gas company Occidental Petroleum reported better-than-expected quarterly earnings driven by strong crude oil prices, sending its shares higher. Mosaic, one of the world’s largest makers of phosphates for fertilizer, saw it’s shares rise during the period as consensus estimates increased due to strong demand for grains and oilseeds. Shares of Assurant, which provides specialized insurance products in the U.S. and internationally, rose after the company reported better than expected earnings, mostly driven by growth in its Special Property segment. Other top relative and absolute contributors included U.S. Steel (Materials) and Visa (Information Technology). We continued to own all five stocks at the end of the period.
What is the outlook?
The Fund focuses on stock selection as the key driver of returns and uses proprietary fundamental and quantitative research in a disciplined framework to build a portfolio of the most attractive stocks. Sector exposures are residuals from this bottom-up stock selection process and are not explicit management decisions. Based on individual stock decisions, the Fund ended the period most overweight (i.e. the Fund’s sector position was greater than the benchmark position) the Health Care, Information Technology, and Utilities sectors and most underweight (i.e. the Fund’s sector position was less than the benchmark position) the Industrials, Energy, and Materials sectors.
Diversification by Industry
as of April 30, 2008
| | | | | |
| | | Percentage of |
| Industry | | Net Assets |
| |
| Basic Materials | | | 2.8 | % |
| Capital Goods | | | 4.4 | |
| Consumer Cyclical | | | 10.8 | |
| Consumer Staples | | | 4.8 | |
| Energy | | | 11.9 | |
| Finance | | | 21.8 | |
| Health Care | | | 12.1 | |
| Services | | | 7.1 | |
| Technology | | | 18.8 | |
| Utilities | | | 4.7 | |
| Short-Term Investments | | | 4.0 | |
| Other Assets and Liabilities | | | (3.2 | ) |
| | | | | |
Total | | | 100.0 | % |
| | | | | |
16
The Hartford Dividend and Growth Fund
(subadvised by Wellington Management Company, LLP)
Performance Overview(1) 4/30/98 — 4/30/08
Growth of a $10,000 investment in Class A which includes Sales Charge
Russell 1000 Value Index measures the performance of those Russell 1000 Index companies with lower price-to-book ratios and lower forecasted growth values.
S&P 500 Index is a market capitalization weighted price index composed of 500 widely held common stocks.
You cannot invest directly in an index.
The value of shares will fluctuate so that, when redeemed, shares may be worth more or less than their original cost. The chart and table do not reflect the deduction of taxes that a shareholder would pay on fund distributions or the redemption of fund shares.
Performance information may reflect historical or current expense waivers/reimbursements from the investment adviser, without which performance would have been lower. For information on current expense waivers/reimbursements, please see the prospectus.
Investment objective — Seeks a high level of current income consistent with growth of capital.
Average Annual Total Returns(2,3) (as of 4/30/08)
| | | | | | | | | | | | | | | | | | | | | |
| | | Inception | | 1 | | 5 | | 10 | | Since |
| | | Date | | Year | | Year | | Year | | Inception |
| |
| Dividend & Growth A# | | | 7/22/96 | | | | -1.40 | % | | | 12.77 | % | | | 6.07 | % | | | 9.81 | % |
| Dividend & Growth A## | | | 7/22/96 | | | | -6.82 | % | | | 11.51 | % | | | 5.47 | % | | | 9.28 | % |
| Dividend & Growth B# | | | 7/22/96 | | | | -2.29 | % | | | 11.81 | % | | | NA | * | | | NA | * |
| Dividend & Growth B## | | | 7/22/96 | | | | -6.87 | % | | | 11.55 | % | | | NA | * | | | NA | * |
| Dividend & Growth C# | | | 7/22/96 | | | | -2.11 | % | | | 11.97 | % | | | 5.34 | % | | | 9.05 | % |
| Dividend & Growth C## | | | 7/22/96 | | | | -3.03 | % | | | 11.97 | % | | | 5.34 | % | | | 9.05 | % |
| Dividend & Growth I# | | | 7/22/96 | | | | -1.04 | % | | | 12.89 | % | | | 6.13 | % | | | 9.86 | % |
| Dividend & Growth I## | | | 7/22/96 | | | | -1.04 | % | | | 12.89 | % | | | 6.13 | % | | | 9.86 | % |
| Dividend & Growth R3# | | | 7/22/96 | | | | -1.80 | % | | | 13.02 | % | | | 6.47 | % | | | 10.23 | % |
| Dividend & Growth R3## | | | 7/22/96 | | | | -1.80 | % | | | 13.02 | % | | | 6.47 | % | | | 10.23 | % |
| Dividend & Growth R4# | | | 7/22/96 | | | | -1.39 | % | | | 13.14 | % | | | 6.53 | % | | | 10.28 | % |
| Dividend & Growth R4## | | | 7/22/96 | | | | -1.39 | % | | | 13.14 | % | | | 6.53 | % | | | 10.28 | % |
| Dividend & Growth R5# | | | 7/22/96 | | | | -1.09 | % | | | 13.23 | % | | | 6.57 | % | | | 10.32 | % |
| Dividend & Growth R5## | | | 7/22/96 | | | | -1.09 | % | | | 13.23 | % | | | 6.57 | % | | | 10.32 | % |
| Dividend & Growth Y# | | | 7/22/96 | | | | -1.00 | % | | | 13.27 | % | | | 6.59 | % | | | 10.33 | % |
| | |
| # | | Without sales charge |
| |
| ## | | With sales charge |
| |
| NA | | Not Applicable |
| |
| * | | 10 year and inception returns are not applicable for Class B because after 8 years Class B converts to Class A. |
PAST PERFORMANCE IS NOT INDICATIVE OF FUTURE RESULTS.
| (1) | | Growth of a $10,000 investment in Classes B, C, I, R3, R4, R5 and Y shares will vary from results seen above due to differences in the expenses charged to these share classes. |
| |
| (2) | | Class C shares commenced operations on 7/31/98. Performance prior to 7/31/98 reflects Class B performance less Class C sales charges where applicable. Class I shares commenced operations on 8/31/06. Performance prior to 8/31/06 reflects Class A performance. Class R3, R4 and R5 shares commenced operations on 12/22/06. Performance prior to 12/22/06 reflects Class Y performance. |
| |
| (3) | | The initial investment in Class A shares reflects the maximum sales charge and Classes B and C reflect CDSC. |
Portfolio Manager
Edward P. Bousa, CFA
Senior Vice President, Partner
How did the Fund perform?
The Class A shares of The Hartford Dividend and Growth Fund returned -6.46%, before sales charge, for the six-month period ended April 30, 2008, versus its benchmark, the S&P 500 Index, which returned -9.63%, and the -9.01% return of the average fund in the Lipper Equity Income Funds peer group, a group of funds with investment strategies similar to those of the Fund.
Why did the Fund perform this way?
Overall equity market performance was weak for the period amid continued turmoil in the U.S. bond and housing markets. Large cap equities (-9.6%) outpaced small cap stocks (-12.9%) but underperformed mid caps (-7.0%) as represented by the S&P 500 Index, Russell 2000 Index and S&P MidCap 400 Index, respectively. During the six-month period, Financials (-20.1%) and Information Technology (-15.3%) were the weakest sectors within the broad market, as represented by the S&P 500 Index, while Energy (+5.7%) and Consumer Staples (-0.5%) were stronger in comparison. The Fund’s outperformance relative (i.e. performance of the Fund as measured against the benchmark) to the S&P 500 Index was due to both favorable sector allocation and positive stock selection. Our overweight (i.e. the Fund’s sector position was greater than the benchmark position) allocation to Energy and underweight (i.e. the Fund’s sector position was less than the benchmark position) allocation to Information Technology contributed positively to benchmark relative performance. Strong stock selection in the Information Technology, Telecommunications Services, Consumer Staples, and Consumer Discretionary sectors drove relative outperformance but was modestly offset by weaker security selection in the Materials and Financials sectors.
17
During the period, the Fund’s top three contributors to relative performance were Total (Energy), EnCana (Energy), and Agrium (Materials). Shares in Total, the large French integrated oil company, rose due to strong oil prices, which boosted revenue. Agrium, the largest agricultural retailer in the U.S. and a major producer of nitrogen, phosphate, and potash fertilizers, benefited from the strong run up in fertilizer prices. EnCana, a Canadian gas producer, benefited from better-than-expected earnings on output and price increases. Other contributors to relative and absolute (i.e. total return) performance included Wal-Mart Stores (Consumer Staples) and Chevron (Energy). We held all positions at the end of the period.
The top relative detractors from performance during the period included Schering-Plough (Health Care), UBS (Financials), and MBIA (Financials). Schering-Plough’s shares declined on concerns about the effectiveness of its flagship cholesterol drug Vytorin. We believe the Vytorin concerns are overblown and continue to hold the position. UBS experienced losses relating to subprime mortgages, as well as losses in their investment banking division. This forced the company to raise additional dilutive equity capital to help absorb write downs, pushing the stock price lower. Shares of the MBIA fell with the declining market value of its insured credit derivatives portfolio, raising concerns about the stability of U.S. financial markets, and disclosure of its full exposure to mortgage related securities. In addition, Citigroup (Financials) was among the top detractors from absolute performance. The company suffered from write-downs on subprime mortgages and bonds, which led to two straight quarters of losses that weighed heavily on the stock. At the end of the period we continued to hold UBS, MBIA, and Citigroup.
What is the outlook?
Our discipline is focused on identifying industries where supply/demand characteristics remain favorable. We remain overweight Energy, as global demand remains strong and supply is constrained. Also, we continue to see favorable supply/demand characteristics in the agriculture markets as food inflation continues to rise.
Based on these views and our bottom-up (i.e. stock by stock fundamental research) stock selection, at the end of the period, relative to the S&P 500 Index, the Fund was overweight Energy, Materials, Utilities, and Telecommunication Services and underweight Information Technology, Financials, Consumer Discretionary, and Health Care.
Diversification by Industry
as of April 30, 2008
| | | | | |
| | | Percentage of |
| Industry | | Net Assets |
| |
| Basic Materials | | | 7.3 | % |
| Capital Goods | | | 3.7 | |
| Consumer Cyclical | | | 7.2 | |
| Consumer Staples | | | 4.8 | |
| Energy | | | 18.0 | |
| Finance | | | 13.4 | |
| Health Care | | | 10.6 | |
| Services | | | 8.1 | |
| Technology | | | 15.6 | |
| Transportation | | | 1.2 | |
| Utilities | | | 5.6 | |
| Short-Term Investments | | | 12.1 | |
| Other Assets and Liabilities | | | (7.6 | ) |
| | | | | |
Total | | | 100.0 | % |
| | | | | |
18
The Hartford Equity Growth Allocation Fund
(subadvised by Hartford Investment Management Company)
Performance Overview(1) 5/28/04 — 4/30/08
Growth of a $10,000 investment in Class A which includes Sales Charge
S&P 500 Index is a market capitalization weighted price index composed of 500 widely held common stocks.
You cannot invest directly in an index.
The value of shares will fluctuate so that, when redeemed, shares may be worth more or less than their original cost. The chart and table do not reflect the deduction of taxes that a shareholder would pay on fund distributions or the redemption of fund shares.
Performance information may reflect historical or current expense waivers/reimbursements from the investment adviser, without which performance would have been lower. For information on current expense waivers/reimbursements, please see the prospectus.
Investment objective — Seeks long-term capital appreciation.
Average Annual Total Returns(2,3) (as of 4/30/08)
| | | | | | | | | | | | | |
| | | Inception | | 1 | | Since |
| | | Date | | Year | | Inception |
| |
| Equity Growth Allocation A# | | | 5/28/04 | | | | -0.54 | % | | | 10.27 | % |
| Equity Growth Allocation A## | | | 5/28/04 | | | | -6.01 | % | | | 8.70 | % |
| Equity Growth Allocation B# | | | 5/28/04 | | | | -1.25 | % | | | 9.53 | % |
| Equity Growth Allocation B## | | | 5/28/04 | | | | -5.73 | % | | | 8.94 | % |
| Equity Growth Allocation C# | | | 5/28/04 | | | | -1.16 | % | | | 9.54 | % |
| Equity Growth Allocation C## | | | 5/28/04 | | | | -2.06 | % | | | 9.54 | % |
| Equity Growth Allocation I# | | | 5/28/04 | | | | -0.11 | % | | | 10.45 | % |
| Equity Growth Allocation I## | | | 5/28/04 | | | | -0.11 | % | | | 10.45 | % |
| Equity Growth Allocation R3# | | | 5/28/04 | | | | -0.72 | % | | | 10.18 | % |
| Equity Growth Allocation R3## | | | 5/28/04 | | | | -0.72 | % | | | 10.18 | % |
| Equity Growth Allocation R4# | | | 5/28/04 | | | | -0.47 | % | | | 10.29 | % |
| Equity Growth Allocation R4## | | | 5/28/04 | | | | -0.47 | % | | | 10.29 | % |
| Equity Growth Allocation R5# | | | 5/28/04 | | | | -0.20 | % | | | 10.41 | % |
| Equity Growth Allocation R5## | | | 5/28/04 | | | | -0.20 | % | | | 10.41 | % |
| | |
| # | | Without sales charge |
| |
| ## | | With sales charge |
PAST PERFORMANCE IS NOT INDICATIVE OF FUTURE RESULTS.
| (1) | | Growth of a $10,000 investment in Classes B, C, I, R3, R4 and R5 shares will vary from results seen above due to differences in the expenses charged to these classes. |
| |
| (2) | | Class I shares commenced operations on 8/31/06. Performance prior to 8/31/06 reflects Class A performance. Class R3, R4 and R5 shares commenced operations on 12/22/06. Performance prior to 12/22/06 reflects Class A performance. |
| |
| (3) | | The initial investment in Class A shares reflects the maximum sales charge and Classes B and C reflect CDSC. |
| | | |
Portfolio Managers | | |
Hugh Whelan | | Edward C. Caputo |
| Managing Director | | Assistant Vice President |
How did the Fund perform?
The Class A shares of The Hartford Equity Growth Allocation Fund returned -10.07%, before sales charge, for the six-month period ended April 30, 2008, versus - -9.63% for the S&P 500 Index, and -10.20% for the Lipper Multi-Cap Core Funds category, a group of funds with investment strategies similar to those of the Fund.
Why did the Fund perform this way?
The six-month period under review was challenging for both stocks and bonds, as credit and liquidity remained constrained, volatility was high, and concerns about a potential recession emerged. Although the Federal Reserve (the “Fed”) took considerable steps to help bolster the markets, including reducing the target federal funds rate on several occasions, establishing lending facilities that provided a back stop to both banks and brokers, and facilitating JPMorgan Chase’s rescue acquisition of Bear Stearns, investor confidence continued to erode. As a result, investors fled to the relative safety of Treasury securities, fueling their outperformance of all other sectors of the market for the overall period.
Within domestic equities, mid-cap stocks outperformed large-cap and small-cap stocks. With regard to style, growth beat value within large-cap and mid-cap stocks but underperformed within small-cap stocks. Overall, international stocks slightly outperformed domestic stocks.
Over the course of the period, asset allocation decisions within equities detracted from the Fund’s performance. Specifically, allocations to small-cap growth, large-cap value, and international small-cap stocks held back returns. However, the negative impact was partially offset by the favorable performance of allocations to mid-cap and large-cap growth and international large-cap stocks.
During the reporting period, the Fund began utilizing exchange-traded funds (ETFs) to obtain asset class exposures unavailable through The Hartford fund family. Doing so enables the Fund to capture additional opportunities while also enhancing its diversification. In addition, the Fund continues to target an overweight (i.e. the Fund’s sector position was greater than the benchmark position) to international stocks over domestic stocks, growth stocks over value stocks, and large-cap stocks over small-cap stocks.
19
The Fund’s performance is influenced not just by our asset allocation decisions, but also by the performance of the underlying funds in which it invests. For the overall period, the Fund benefited from our fund selection decisions. In keeping with the Fund’s long-term approach, we use cash flows to reallocate among the underlying funds whenever possible. No hard rebalance (i.e. a fund rebalancing to move the underlying fund investments to their target allocation percentages) was executed during the period.
What is the outlook?
The economy continues to face strong headwinds. Growth is likely to be weak until home prices stabilize and credit providers return to the business of lending rather than writing down assets. Despite the Fed’s sharp reductions in short-term interest rates, risk premiums (i.e. difference between the risk associated with buying or holding a Treasury and holding a high yield bond) remain high, which has kept borrowing costs high. However, there are encouraging signs. Lenders are moving to aggressively write down bad loans and the Fed has clearly signaled it stands ready to support the capital markets. Given that Fed policy actions have historically taken a few quarters to affect growth, the rate reductions of last year should begin to be felt in the near future, helping to restore order to the financial markets and setting the stage for recovery.
Composition by Underlying Fund
as of April 30, 2008
| | | | | |
| | | Percentage of |
| Fund Name | | Net Assets |
| |
| The Hartford Capital Appreciation Fund, Class Y | | | 23.0 | % |
| The Hartford Capital Appreciation II Fund, Class Y | | | 0.5 | |
| The Hartford Disciplined Equity Fund, Class Y | | | 7.3 | |
| The Hartford Dividend and Growth Fund, Class Y | | | 0.7 | |
| The Hartford Equity Income Fund, Class Y | | | 4.2 | |
| The Hartford Global Growth Fund, Class Y | | | 6.9 | |
| The Hartford Growth Fund, Class Y | | | 1.2 | |
| The Hartford Growth Opportunities Fund, Class Y | | | 6.1 | |
| The Hartford International Opportunities Fund, Class Y | | | 6.2 | |
| The Hartford International Small Company Fund, Class Y | | | 6.5 | |
| The Hartford Select MidCap Value Fund, Class Y | | | 4.4 | |
| The Hartford Select SmallCap Value Fund, Class Y | | | 7.4 | |
| The Hartford Small Company Fund, Class Y | | | 5.4 | |
| The Hartford Stock Fund, Class Y | | | 1.4 | |
| The Hartford Value Fund, Class Y | | | 17.9 | |
| SPDR DJ Wilshire International Real Estate ETF | | | 0.8 | |
| Other Assets and Liabilities | | | 0.1 | |
| | | | | |
Total | | | 100.0 | % |
| | | | | |
20
The Hartford Equity Income Fund
(subadvised by Wellington Management Company, LLP)
Performance Overview(1) 8/28/03 — 4/30/08
Growth of a $10,000 investment in Class A which includes Sales Charge
Russell 1000 Value Index measures the performance of those Russell 1000 Index companies with lower price-to-book ratios and lower forecasted growth values.
You cannot invest directly in an index.
The value of shares will fluctuate so that, when redeemed, shares may be worth more or less than their original cost. The chart and table do not reflect the deduction of taxes that a shareholder would pay on fund distributions or the redemption of fund shares.
Performance information may reflect historical or current expense waivers/reimbursements from the investment adviser, without which performance would have been lower. For information on current expense waivers/reimbursements, please see the prospectus.
Investment objective — Seeks a high level of current income consistent with growth of capital.
Average Annual Total Returns(2,3) (as of 4/30/08)
| | | | | | | | | | | | | |
| | | Inception | | 1 | | Since |
| | | Date | | Year | | Inception |
| |
| Equity Income A# | | | 8/28/03 | | | | -3.47 | % | | | 10.47 | % |
| Equity Income A## | | | 8/28/03 | | | | -8.78 | % | | | 9.14 | % |
| Equity Income B# | | | 8/28/03 | | | | -4.32 | % | | | 9.55 | % |
| Equity Income B## | | | 8/28/03 | | | | -8.92 | % | | | 9.24 | % |
| Equity Income C# | | | 8/28/03 | | | | -4.14 | % | | | 9.70 | % |
| Equity Income C## | | | 8/28/03 | | | | -5.06 | % | | | 9.70 | % |
| Equity Income I# | | | 8/28/03 | | | | -3.12 | % | | | 10.58 | % |
| Equity Income I## | | | 8/28/03 | | | | -3.12 | % | | | 10.58 | % |
| Equity Income R3# | | | 8/28/03 | | | | -3.79 | % | | | 10.76 | % |
| Equity Income R3## | | | 8/28/03 | | | | -3.79 | % | | | 10.76 | % |
| Equity Income R4# | | | 8/28/03 | | | | -3.45 | % | | | 10.86 | % |
| Equity Income R4## | | | 8/28/03 | | | | -3.45 | % | | | 10.86 | % |
| Equity Income R5# | | | 8/28/03 | | | | -3.18 | % | | | 10.96 | % |
| Equity Income R5## | | | 8/28/03 | | | | -3.18 | % | | | 10.96 | % |
| Equity Income Y# | | | 8/28/03 | | | | -3.09 | % | | | 11.00 | % |
| | |
| # | | Without sales charge |
| |
| ## | | With sales charge |
PAST PERFORMANCE IS NOT INDICATIVE OF FUTURE RESULTS.
| (1) | | Growth of a $10,000 investment in Classes B, C, I, R3, R4, R5 and Y shares will vary from results seen above due to differences in the expenses charged to these share classes. |
| |
| (2) | | Class I shares commenced operations on 8/31/06. Performance prior to 8/31/06 reflects Class A performance. Class R3, R4 and R5 shares commenced operations on 12/22/06. Performance prior to 12/22/06 reflects Class Y performance. |
| |
| (3) | | The initial investment in Class A shares reflects the maximum sales charge and Classes B and C reflect CDSC. |
| | | | | | | |
Portfolio Managers | | | | | | |
W. Michael Reckmeyer, III, CFA | | Karen H. Grimes, CFA | | Ian R. Link, CFA | | John R. Ryan, CFA* |
| Vice President | | Vice President | | Vice President | | Senior Vice President, Partner |
How did the Fund perform?
The Class A shares of The Hartford Equity Income Fund returned -7.19%, before sales charge, for the six-month period ended April 30, 2008, versus its benchmark, the Russell 1000 Value Index, which returned -9.83%, and the -9.01% return of the average fund in the Lipper Equity Income Funds peer group, a group of funds with investment strategies similar to those of the Fund.
Why did the Fund perform this way?
The U.S. equity markets were weak during the period due to continued disruptions in the credit markets. Investors abruptly lost their appetite for risk, and companies with balance sheet leverage or uncertain financing needs saw significant erosion in their equity market value. The worries climaxed in March with the near collapse of a major investment bank and several bond insurers. However, the equity markets experienced a sharp rebound in April when the Federal Reserve (the “Fed”) acted aggressively to soften the economic slowdown and increase liquidity in the financial markets.
Within the Fund’s Russell 1000 Value Index benchmark, Energy was the only sector that posted positive returns. Information Technology, Financials and Consumer Discretionary were significant laggards. Mid cap stocks outperformed small cap and large cap stocks as measured by the S&P MidCap 400 Index (-7.0%), Russell 2000 Index (-12.9%) and S&P 500 Index (-9.6%), respectively. Value stocks slightly underperformed growth stocks, as measured by the Russell 1000 Value Index (-9.8%) and Russell 1000 Growth Index (-9.3%).
While the Fund’s investment strategy is based on bottom-up (i.e. stock by stock fundamental research) fundamental research on each company, the primary driver of the Fund’s outperformance relative (i.e. performance of the Fund as measured against the benchmark) to the benchmark was the Fund’s underweight (i.e. the Fund’s sector position was less than the benchmark position) positions in Financials and Consumer Discretionary and overweight (i.e. the Fund’s sector position was greater than the benchmark position) positions in Utilities and Consumer Staples. In addition, stock selection also contributed significantly to the Fund’s relative performance. Stock selection was
21
strongest within Financials and Telecommunications Services and weakest within Energy, Consumer Staples and Materials. Among the top contributors to absolute (i.e. total return) and relative performance were Energy stocks Chevron and BP, Financials stock Citigroup and Industrials stock Trane. Both Chevron and BP’s shares continue to benefit from higher crude oil prices. BP’s new management team is focused on improving execution and operational efficiencies for oil production. Citigroup’s stock continued to decline in the wake of the credit crunch that began in August 2007. We did not own the stock for much of the period which helped our relative performance. Trane, a global manufacturer of commercial and residential heating, ventilation and air conditioning (HVAC) agreed to be acquired by Ingersoll-Rand. We eliminated Trane and held on to the other three stocks at the end of the period.
Among the top detractors from absolute and relative performance were Financials stocks UBS and Bank of America and Health Care stock Bristol-Myers Squibb. In addition, not owning Occidental Petroleum (Energy) detracted from performance as the company’s shares benefited from increasing crude oil prices. UBS and Bank of America’s shares declined due to general concerns about liquidity and the companies’ exposure to sub-prime. Bristol-Myers Squibb’s shares increased due to investor speculation that the company would be acquired. The acquisition did not occur; however, the company sold its Medical Imaging business which reduced earnings causing a reversal of the stock price. General Electric (Industrials) was the largest detractor on an absolute basis. The company’s shares declined as management announced the company would miss its earnings estimates for the first quarter. We eliminated our position in UBS during the period and held on to our positions in the other stocks.
What is the outlook?
Our outlook for the U.S. economy has dimmed considerably, and there has been downside movement to our “mild ramp-down” case. Falling home prices, rising food and energy costs, and declining consumer confidence have led to a pull back in stock prices, particularly for companies involved with selling to consumers. We believe that a mild recession is in market prices now, but the risks of deeper recession have risen.
We believe the outcome in the U.S. is somewhat binary - either a deep recession is in the cards, or all the central bank actions work to avoid the meltdown and a boom is re-ignited on a global basis. In the U.S., Fed action has been impressive. The U.K. and European economies are decelerating, and many countries have a number of financial issues to digest. Japan is sluggish, while Asia and the emerging markets remain strong. We are maintaining our defensive positioning and keeping flexibility in the Fund to move in either direction.
At the end of the period, the Fund remained most overweight Utilities and Consumer Staples and most underweight Consumer Discretionary and Financials, relative to the Russell 1000 Value Index.
* It is anticipated that after June 30, 2008, John R. Ryan will no longer manage assets for the Fund.
Diversification by Industry
as of April 30, 2008
| | | | | |
| | | Percentage of |
| Industry | | Net Assets |
| |
| Basic Materials | | | 7.5 | % |
| Capital Goods | | | 0.9 | |
| Consumer Cyclical | | | 5.8 | |
| Consumer Staples | | | 7.4 | |
| Energy | | | 18.4 | |
| Finance | | | 23.6 | |
| Health Care | | | 8.3 | |
| Services | | | 0.9 | |
| Technology | | | 12.2 | |
| Utilities | | | 11.5 | |
| Short-Term Investments | | | 4.6 | |
| Other Assets and Liabilities | | | (1.1 | ) |
| | | | | |
Total | | | 100.0 | % |
| | | | | |
22
The Hartford Floating Rate Fund
(subadvised by Hartford Investment Management Company)
Performance Overview(1) 4/29/05 — 4/30/08
Growth of a $10,000 investment in Class A which includes Sales Charge
Credit Suisse Leveraged Loan Index is designed to mirror the investable universe of the U.S. dollar-denominated leveraged loan market.
You cannot invest directly in an index.
The value of shares will fluctuate so that, when redeemed, shares may be worth more or less than their original cost. The chart and table do not reflect the deduction of taxes that a shareholder would pay on fund distributions or the redemption of fund shares.
Performance information may reflect historical or current expense waivers/reimbursements from the investment adviser, without which performance would have been lower. For information on current expense waivers/reimbursements, please see the prospectus.
Investment objective – Seeks a high level of current income.
Average Annual Total Returns(2,3) (as of 4/30/08)
| | | | | | | | | |
| | | Inception | | 1 | | Since |
| | | Date | | Year | | Inception |
| |
| Floating Rate A# | | 4/29/05 | | -4.20% | | | 2.97 | % |
| Floating Rate A## | | 4/29/05 | | -7.07% | | | 1.93 | % |
| Floating Rate B# | | 4/29/05 | | -4.84% | | | 2.20 | % |
| Floating Rate B## | | 4/29/05 | | -9.33% | | | 1.32 | % |
| Floating Rate C# | | 4/29/05 | | -4.83% | | | 2.23 | % |
| Floating Rate C## | | 4/29/05 | | -5.73% | | | 2.23 | % |
| Floating Rate I# | | 4/29/05 | | -3.84% | | | 3.19 | % |
| Floating Rate I## | | 4/29/05 | | -3.84% | | | 3.19 | % |
| Floating Rate R3# | | 4/29/05 | | -4.26% | | | 3.04 | % |
| Floating Rate R3## | | 4/29/05 | | -4.26% | | | 3.04 | % |
| Floating Rate R4# | | 4/29/05 | | -4.12% | | | 3.12 | % |
| Floating Rate R4## | | 4/29/05 | | -4.12% | | | 3.12 | % |
| Floating Rate R5# | | 4/29/05 | | -3.75% | | | 3.31 | % |
| Floating Rate R5## | | 4/29/05 | | -3.75% | | | 3.31 | % |
| Floating Rate Y# | | 4/29/05 | | -3.81% | | | 3.27 | % |
| | |
| # | | Without sales charge |
| |
| ## | | With sales charge |
PAST PERFORMANCE IS NOT INDICATIVE OF FUTURE RESULTS.
| (1) | | Growth of a $10,000 investment in Classes B, C, I, R3, R4, R5 and Y shares will vary from results seen above due to differences in the expenses charged to these share classes. |
| |
| (2) | | Class I shares commenced operations on 8/31/06. Performance prior to 8/31/06 reflects Class A performance. Class R3, R4 and R5 shares commenced operations on 12/22/06. Performance prior to 12/22/06 reflects Class Y performance. |
| |
| (3) | | The initial investment in Class A shares reflects the maximum sales charge and Classes B and C reflect CDSC. |
| | | |
Portfolio Managers | | |
Michael Bacevich | | Frank Ossino |
| Managing Director | | Vice President |
How did the Fund perform?
The Class A shares of The Hartford Floating Rate Fund returned -3.97%, before sales charge, for the six-month period ended April 30, 2008, versus its benchmark, the Credit Suisse Leveraged Loan Index, which returned -3.51%, and the -3.22% average return of the Lipper Loan Participation Funds category, a group of funds with investment strategies similar to those of the Fund.
Why did the Fund perform this way?
The reporting period included three of the worst months on record for the high-yield loan market: November, 2007, and January and February, 2008. This was spurned by a continuation of the subprime crisis and credit crunch that unfolded in the summer of last year. The supply of bank loans remained elevated during the period, London Inter-Bank Offered Rate (“LIBOR”) rates declined (which negatively impacted the current yield of floating rate-products), defaults rose, and fears grew that some large investors would be forced into liquidation, further depressing prices.
Although the environment during the reporting period was challenging, various factors contributed positively to the Fund’s performance including the selective sale of riskier credits from the portfolio, multiple loan repayments at par, and no defaults. Additionally, in the latter part of the period, we began adding risk back into the portfolio, which enhanced performance as shortly thereafter, riskier assets began to outperform higher-quality assets.
The primary detractors from relative (i.e. performance of the Fund as measured against the benchmark) performance were holdings in housing and advertising-related businesses (newspapers and yellow pages). While we are comfortable with our housing credits at this time, we are re-evaluating our media/telecom holdings in order to capitalize on better opportunities either within the sector or in other sectors.
We generated liquidity to meet redemptions through broad-based selling, though Fund inflows did begin to pick up in April. Sales were a mix of higher-quality credits with better liquidity, reductions in larger
23
positions in order to “right size” them for a smaller portfolio, and lower-quality credits including airline, auto, and real estate credits. For example, we completely exited Residential Capital and homebuilder Standard Pacific, and executed two portfolio sales totaling $157 million at better-than-expected prices. In addition, several of the portfolio’s loans were repaid by the issuers at par, which also helped to generate cash. We remain comfortable with our liquidity position at this time, as well as liquidity in the high-yield loan and bond markets in general.
We were very selective regarding asset purchases throughout the period. We participated in a few new deals, including Boise Paper, NewPage, Mylan Labs, and in the latter part of the period, began adding risk to the portfolio through selective purchases of high-yield bonds. In our view, the Federal Reserve’s (the “Fed’s”) significant efforts to bolster the markets, the recent stabilization of LIBOR rates, a more than 50% reduction in the loan supply pipeline, and acceptable first quarter corporate earnings all appear to suggest that the worst may be over.
As of the end of the period, approximately 4% of Fund holdings were in high-yield bonds, 8% were in cash and commercial paper, and exposure to commercial mortgage-backed securities (CMBS), Small Business Administration (SBA) loans, and asset-backed securities (ABS) totaled less than 1% of holdings.
What is your outlook?
The economy continues to face strong headwinds. Growth is likely to be weak until home prices stabilize and credit providers return to the business of lending rather than writing down assets. Despite the Fed’s sharp reductions in short-term interest rates, risk premiums (i.e. difference between the risk associated with buying or holding a Treasury and holding a high yield bond) remain high, which has kept borrowing costs high. However, there are encouraging signs. Lenders are moving to aggressively write down bad loans and the Fed has clearly signaled it stands ready to support the capital markets. Given that Fed policy actions have historically taken a few quarters to affect growth, the rate reductions of last year should begin to be felt in the near future, helping to restore order to the financial markets and setting the stage for recovery.
Although the loan market posted improved performance in the latter part of the period, we still view loans as fundamentally cheap, with the supply/demand imbalance and macro trends weighing on the market. As a result we will continue to selectively add risk to the portfolio in the near term.
Diversification by Industry
as of April 30, 2008
| | | | | |
| | | Percentage of | |
| Industry | | Net Assets | |
| |
| Basic Materials | | | 12.0 | % |
| Capital Goods | | | 2.5 | |
| Consumer Cyclical | | | 10.3 | |
| Consumer Staples | | | 2.6 | |
| Energy | | | 1.4 | |
| Finance | | | 8.5 | |
| Health Care | | | 9.8 | |
| Services | | | 25.3 | |
| Technology | | | 12.9 | |
| Transportation | | | 3.0 | |
| Utilities | | | 4.4 | |
| Short-Term Investments | | | 7.1 | |
| Other Assets and Liabilities | | | 0.2 | |
| | | | |
Total | | | 100.0 | % |
| | | | |
Distribution by Credit Quality
as of April 30, 2008
| | | | | |
| | | Percentage of | |
| | | Long-Term | |
| Rating | | Holdings | |
| |
| A | | | 0.0 | |
| BBB | | | 1.7 | |
| BB | | | 50.2 | |
| B | | | 40.3 | |
| CCC | | | 1.8 | |
| NR | | | 6.0 | |
| | | | |
Total | | | 100.0 | % |
| | | | |
24
The Hartford Fundamental Growth Fund
(subadvised by Wellington Management Company, LLP)
Performance Overview(1) 5/24/01 — 4/30/08
Growth of a $10,000 investment in Class A which includes Sales Charge
Russell 1000 Growth Index is an unmanaged index that measures the performance of those Russell 1000 Index companies with higher price-to-book ratios and higher forecasted growth values.
S&P 500 Index is a market capitalization weighted price index composed of 500 widely held common stocks.
You cannot invest directly in an index.
Investment objective — Seeks long-term capital appreciation.
Average Annual Total Returns(2) (as of 4/30/08)
| | | | | | | | | | | | | | | | | |
| | | Inception | | 1 | | 5 | | Since |
| | | Date | | Year | | Year | | Inception |
| |
| Fundamental Growth A# | | | 5/24/01 | | | | 8.91 | % | | | 11.53 | % | | | 4.09 | % |
| Fundamental Growth A## | | | 5/24/01 | | | | 2.92 | % | | | 10.28 | % | | | 3.25 | % |
| Fundamental Growth B# | | | 5/24/01 | | | | 8.07 | % | | | 10.70 | % | | | 3.34 | % |
| Fundamental Growth B## | | | 5/24/01 | | | | 3.31 | % | | | 10.43 | % | | | 3.34 | % |
| Fundamental Growth C# | | | 5/24/01 | | | | 8.16 | % | | | 10.75 | % | | | 3.35 | % |
| Fundamental Growth C## | | | 5/24/01 | | | | 7.20 | % | | | 10.75 | % | | | 3.35 | % |
| Fundamental Growth Y# | | | 5/24/01 | | | | 9.49 | % | | | 12.04 | % | | | 4.57 | % |
| | |
| # | | Without sales charge |
| |
| ## | | With sales charge |
PAST PERFORMANCE IS NOT INDICATIVE OF FUTURE RESULTS.
| (1) | | Growth of a $10,000 investment in Classes B, C and Y shares will vary from results seen above due to differences in the expenses charged to these share classes. |
| |
| (2) | | The initial investment in Class A shares reflects the maximum sales charge and Classes B and C reflect CDSC. |
The value of shares will fluctuate so that, when redeemed, shares may be worth more or less than their original cost. The chart and table do not reflect the deduction of taxes that a shareholder would pay on fund distributions or the redemption of fund shares.
Performance information may reflect historical or current expense waivers/reimbursements from the investment adviser, without which performance would have been lower. For information on current expense waivers/reimbursements, please see the prospectus.
Portfolio Manager
Francis J. Boggan, CFA
Senior Vice President, Partner
How did the Fund perform?
The Class A shares of The Hartford Fundamental Growth Fund returned -5.92%, before sales charge, for the six-month period ended April 30, 2008, versus its benchmark, the Russell 1000 Growth Index, which returned -9.28%, and the -10.01% return of the average fund in the Lipper Large-Cap Growth Funds peer group, a group of funds with investment strategies similar to those of the Fund.
Why did the Fund perform this way?
Overall equity market performance was weak for the period amid continued turmoil in the U.S. credit and housing markets. Within the Russell 1000 Growth Index, losses during the period were broad-based with only two of the ten sectors posting positive results. Energy, Materials, and Consumer Staples performed best, while Financials, Information Technology, and Consumer Discretionary each posted double-digit negative returns.
The Fund outperformed during the period due to strong stock selection across several sectors. Stock selection was particularly strong in Consumer Discretionary, Energy, and Information Technology, which more than offset weaker selection in Financials, Consumer Staples, and Telecommunication Services. Sector positioning, a result of bottom-up (i.e. stock by stock fundamental research) stock selection, detracted modestly from benchmark relative (i.e. performance of the Fund as measured against the benchmark) returns as our underweight (i.e. the Fund’s sector position was less than the benchmark position) allocations to Consumer Staples and Health Care hurt returns and more than offset positive contributions from overweight (i.e. the Fund’s sector position was greater than the benchmark position) allocations to Energy and Materials.
The three largest contributors to relative and absolute (i.e. total return) performance were Apache Corporation (Energy), Priceline.com (Consumer Discretionary), and The Gymboree Corporation (Consumer Discretionary). Shares of independent energy exploration and production company Apache rose during the period after the company reported better than expected fourth quarter results and announced several major development projects for 2008. Online travel company Priceline.com’s stock price benefited from strong results in its international unit Bookings.com and from domestic product lines. Specialty children’s retailer Gymboree reported a strong holiday season in which the company met aggressive sales goals resulting in increased same-store sales growth for the fourth quarter. We maintained a position in all three securities as of the end of the period.
Top detractors from relative performance included MBIA (Financials), WellPoint (Health Care), and NII Holdings (Telecommunication
25
Services). Shares of financial guarantee insurance company MBIA fell with the declining market value of its insured credit derivatives portfolio and rising concerns about the stability of U.S. financial markets. We continued to hold a position in the security as of the end of the period. Managed healthcare insurance provider WellPoint’s stock price fell after management reduced 2008 guidance citing an underestimation of medical cost trends. We continue to hold the security as we believe cost trends will be lower than investors currently forecast and that underwriting standards should improve as the year progresses. NII Holdings, a wireless communications company with operations in Latin America (formerly Nextel International), reported disappointing net subscriber additions hurt by stiff competition in Mexico. Its share price fell, and we eliminated the holding. Microsoft Corporation was another stock that detracted from performance on an absolute basis. The company’s stock price fell more than 20% after they announced their intention to purchase Yahoo. We continued to hold a position at the end of the period.
What is the outlook?
The Fund seeks to add value through bottom-up security selection in a diversified portfolio of high-quality growth companies with attractive valuations. Investment decisions are based primarily on independent, bottom-up, fundamental research. As of the end of the period, the Fund was most overweight Information Technology, Financials, and Health Care and most underweight Consumer Staples, Industrials, and Consumer Discretionary sectors relative to the Russell 1000 Growth Index.
Diversification by Industry
as of April 30, 2008
| | | | | |
| | | Percentage of | |
| Industry | | Net Assets | |
| |
| Basic Materials | | | 4.8 | % |
| Capital Goods | | | 6.7 | |
| Consumer Cyclical | | | 9.0 | |
| Consumer Staples | | | 2.9 | |
| Energy | | | 9.7 | |
| Finance | | | 10.5 | |
| Health Care | | | 15.4 | |
| Services | | | 5.8 | |
| Technology | | | 28.2 | |
| Transportation | | | 0.5 | |
| Utilities | | | 1.5 | |
| Short-Term Investments | | | 32.4 | |
| Other Assets and Liabilities | | | (27.4 | ) |
| | | | |
Total | | | 100.0 | % |
| | | | |
26
The Hartford Global Communications Fund
(subadvised by Wellington Management Company, LLP)
Performance Overview(1) 10/31/00 — 4/30/08
Growth of a $10,000 investment in Class A which includes Sales Charge
MSCI All Country World Telecommunication Services Index is a free float-adjusted market capitalization index which measures the performance of companies within the telecommunications sector across both developed and emerging market countries. The index is calculated to exclude companies and share classes which cannot be freely purchased by foreigners.
S&P 500 Index is a market capitalization weighted price index composed of 500 widely held common stocks.
You cannot invest directly in an index.
Investment objective — Seeks long-term capital appreciation.
Average Annual Total Returns(2) (as of 4/30/08)
| | | | | | | | | | | | | | | | | |
| | | Inception | | 1 | | 5 | | Since |
| | | Date | | Year | | Year | | Inception |
| |
| Global Communications A# | | | 10/31/00 | | | | 9.63 | % | | | 23.71 | % | | | 0.50 | % |
| Global Communications A## | | | 10/31/00 | | | | 3.60 | % | | | 22.32 | % | | | -0.25 | % |
| Global Communications B# | | | 10/31/00 | | | | 8.79 | % | | | 22.86 | % | | | -0.18 | % |
| Global Communications B## | | | 10/31/00 | | | | 3.79 | % | | | 22.69 | % | | | -0.18 | % |
| Global Communications C# | | | 10/31/00 | | | | 8.80 | % | | | 22.80 | % | | | -0.22 | % |
| Global Communications C## | | | 10/31/00 | | | | 7.80 | % | | | 22.80 | % | | | -0.22 | % |
| Global Communications Y# | | | 10/31/00 | | | | 10.19 | % | | | 24.32 | % | | | 0.99 | % |
| | |
| # | | Without sales charge |
| |
| ## | | With sales charge |
PAST PERFORMANCE IS NOT INDICATIVE OF FUTURE RESULTS.
| (1) | | Growth of a $10,000 investment in Classes B, C and Y shares will vary from results seen above due to differences in the expenses charged to these share classes. |
| |
| (2) | | The initial investment in Class A shares reflects the maximum sales charge and Classes B and C reflect CDSC. |
The value of shares will fluctuate so that, when redeemed, shares may be worth more or less than their original cost. The chart and table do not reflect the deduction of taxes that a shareholder would pay on fund distributions or the redemption of fund shares.
Performance information may reflect historical or current expense waivers/reimbursements from the investment adviser, without which performance would have been lower. For information on current expense waivers/reimbursements, please see the prospectus.
Portfolio Manager
Archana Basi, CFA
Senior Vice President, Global Industry Analyst and Partner
How did the Fund perform?
The Class A shares of The Hartford Global Communications Fund returned -9.22%, before sales charge, for the six-month period ended April 30, 2008, versus its benchmark, the MSCI All Country World Telecommunication Services Index, which returned -12.37% for the same period, and the - -18.50% return of the average fund in the Lipper Telecommunications Funds peer group, a group of funds with investment strategies similar to those of the Fund.
Why did the Fund perform this way?
Global equities fell during the period amid continued turmoil in the U.S. credit and housing markets and concerns regarding global economic growth. Telecommunication Services stocks trailed the broader market, falling -12.37% versus a -9.24% decline in the MSCI All Country World Index. This follows two consecutive calendar years of Telecommunications outperformance. Diversified telecommunications companies fell less than their wireless peers, while communications equipment stocks performed relatively well. On a regional basis Telecommunications companies in emerging markets have, in general, benefited from positive macro environments and relatively strong stock price performance, while returns in developed markets have been more challenging.
The Fund benefited from a number of holdings in emerging markets countries, where demand for telecommunication services continues to grow. Top contributors to relative (i.e. performance of the Fund as measured against the benchmark) and absolute (i.e. total return) performance during the period included Brazilian stocks Telemar Norte Leste and Brasil Telecom and Israeli wireless service provider Partner Communications. Shares of Brazilian fixed line operator Telemar Norte Leste rose in anticipation of a possible corporate restructuring and acquisition of Brasil Telecom. Brasil Telecom, in turn, saw share price gains primarily in expectation of the buyout by Telemar Norte Leste. The market was also pleased by the company’s solid financial results for the fourth quarter of 2007, particularly in its mobile division. Partner Communications reported strong fourth quarter results, which was driven by higher minutes and data usage, pushing its shares higher. We continued to own positions in all three companies at the end of the period.
27
The largest detractors from relative performance included Alaska-based integrated communications company General Communications, Latin American wireless provider NII Holdings, and Japanese mobile operator Okinawa Cellular. Shares of General Communications fell when the company reported earnings below analyst expectations. We eliminated our position in the company. NII Holdings reported strong fourth quarter results and provided upbeat 2008 guidance, but the stock declined sharply due to investors’ growing concerns about Mexican growth. We retained our position as we believe investor concerns are overblown. Okinawa Cellular, the only regionally-based wireless operator in Okinawa, was impacted by concerns over corporate governance and an emerging competitive threat from SoftBank. We eliminated our position during the period. The Fund’s relative performance was also hurt by not owning a position in AT&T, a large position in the benchmark that outperformed on a relative basis. Significant detractors from absolute returns included integrated phone operators France Telecom and Telefonica.
What is the outlook?
The Fund’s stock selection focuses on companies with solid business fundamentals but which consensus opinion has misperceived as being at a competitive disadvantage. Because of the uncertainty and volatility surrounding the telecom sector, we believe that many such investing opportunities exist.
Using the approach described above, the Fund allocates its assets to selected areas or industries. Once these allocations are made, we envision low stock turnover as we monitor how well the industries perform. The key positions that the Fund is now taking include: wireless stocks will outperform wireline stocks and Emerging Market telecom stocks will outperform developed market telecom stocks.
Diversification by Industry
as of April 30, 2008
| | | | | |
| | | Percentage of | |
| Industry | | Net Assets | |
| |
| Electrical Equipment Manufacturing — Component Other | | 1.4 | % |
| Internet Providers & Web Search Portal | | | 4.0 | |
| Other Telecommunications | | | 32.9 | |
| Telecommunication Resellers | | | 8.7 | |
| Wired Telecommunications Carriers | | | 9.1 | |
| Wireless Communications Services | | | 8.8 | |
| Wireless Telecommunications Carriers | | | 32.0 | |
| Short-Term Investments | | | 10.6 | |
| Other Assets and Liabilities | | | (7.5 | ) |
| | | | |
Total | | | 100.0 | % |
| | | | |
Diversification by Country
as of April 30, 2008
| | | | | |
| | | Percentage of | |
| Country | | Net Assets | |
| |
| Argentina | | | 0.9 | % |
| Brazil | | | 12.1 | |
| Canada | | | 0.9 | |
| Egypt | | | 4.6 | |
| France | | | 4.7 | |
| Germany | | | 3.1 | |
| India | | | 3.0 | |
| Indonesia | | | 2.5 | |
| Israel | | | 4.1 | |
| Italy | | | 3.1 | |
| Luxembourg | | | 6.4 | |
| Norway | | | 8.0 | |
| Russia | | | 11.3 | |
| South Africa | | | 4.9 | |
| Spain | | | 8.7 | |
| Turkey | | | 4.0 | |
| United Kingdom | | | 1.1 | |
| United States | | | 13.5 | |
| Short-Term Investments | | | 10.6 | |
| Other Assets and Liabilities | | | (7.5 | ) |
| | | | |
Total | | | 100.0 | % |
| | | | |
28
The Hartford Global Equity Fund
(subadvised by Wellington Management Company, LLP)
Performance Overview 2/29/08 — 4/30/08
Growth of a $10,000 investment in Class A which includes Sales Charge
MSCI All Country World Index is a free float-adjusted market capitalization weighted index that is designed to measure the equity market performance of odeveloped and emerging markets.
You cannot invest directly in an index.
Investment objective — Seeks long-term capital appreciation.
Average Annual Total Returns (as of 4/30/08)
| | | | | | | |
| | | Inception | | Since |
| | | Date | | Inception |
| |
| Global Equity A# | | 2/29/08 | | | 3.20 | % |
| Global Equity A## | | 2/29/08 | | | -2.48 | % |
| Global Equity B# | | 2/29/08 | | | 3.10 | % |
| Global Equity B## | | 2/29/08 | | | -1.90 | % |
| Global Equity C# | | 2/29/08 | | | 3.10 | % |
| Global Equity C## | | 2/29/08 | | | 2.10 | % |
| Global Equity I# | | 2/29/08 | | | 3.30 | % |
| Global Equity I## | | 2/29/08 | | | 3.30 | % |
| Global Equity R3# | | 2/29/08 | | | 3.30 | % |
| Global Equity R3## | | 2/29/08 | | | 3.20 | % |
| Global Equity R4# | | 2/29/08 | | | 3.20 | % |
| Global Equity R4## | | 2/29/08 | | | 3.20 | % |
| Global Equity R5# | | 2/29/08 | | | 3.20 | % |
| Global Equity R5## | | 2/29/08 | | | 3.20 | % |
| Global Equity Y# | | 2/29/08 | | | 3.30 | % |
| | |
| # | | Without sales charge |
| |
| ## | | With sales charge |
PAST PERFORMANCE IS NOT INDICATIVE OF FUTURE RESULTS.
The value of shares will fluctuate so that, when redeemed, shares may be worth more or less than their original cost. The chart and table do not reflect the deduction of taxes that a shareholder would pay on fund distributions or the redemption of fund shares.
Performance information may reflect historical or current expense waivers/reimbursements from the investment adviser, without which performance would have been lower. For information on current expense waivers/reimbursements, please see the prospectus.
| | | |
Portfolio Managers | | |
Mark D. Mandel, CFA | | Cheryl M. Duckworth, CFA |
| Senior Vice President, Partner | | Senior Vice President, Partner |
How did the Fund perform?
The Class A shares of The Hartford Global Equity Fund returned 3.2%, before sales charge, since its inception on February 29, 2008, versus its benchmark, the MSCI All Country World Index, which returned 4.15%, and the 3.76% return of the average fund in the Lipper Global Multi-Cap Core Funds peer group, a group of funds with investment strategies similar to those of the Fund.
Why did the Fund perform this way?
Global equity markets rebounded in April as market sentiment improved on solid earnings news, particularly outside the Financials sector, and as investors began to look past the turmoil in the U.S. mortgage and credit markets. During the period, the Fund benefited from strong security selection in the Materials, Information Technology, and Utilities sectors. However, this was more than offset by unfavorable stock selection in the Financials, Consumer Staples, and Telecommunication Services sectors. An overweight to the Health Care sector also detracted from benchmark relative performance.
Vale (Materials), Millennium Pharmaceuticals (Health Care), and Visa (Information Technology) were among the top contributors to relative (i.e. performance of the Fund as measured against the benchmark) and absolute (i.e. total return) performance during the period. Shares of diversified Brazilian metals and mining company Vale rose on higher- than-expected iron ore settlement prices. In an environment of rising costs, the firm benefited from its size and low costs. Millennium Pharmaceuticals saw its shares rise after Takeda Pharmaceutical Company announced its acquisition of the drug company. Shares of credit and debit card processor Visa rose sharply on investor enthusiasm following the recent initial public offering of the stock. We continued to hold all three of these stocks at the end of the period.
Schering-Plough (Health Care), Japan Tobacco (Consumer Staples) and McKesson (Health Care) were among top detractors from relative performance. Shares of U.S. pharmaceutical company Schering-Plough, which has a profitable partnership selling cholesterol drugs with Merck, declined on concerns about the effectiveness of its flagship cholesterol drug Vytorin. Shares of cigarette manufacturing company Japan Tobacco declined in the first quarter on concerns of slowing sales in Japan and a weaker currency. Shares of pharmaceutical distribution and health care information technology company McKesson fell as investors were concerned about a pending class action lawsuit against the company. Also detracting from absolute performance were UnitedHealth Group, a U.S. health care provider, and Nokia, a provider of mobile phones, broadband, IP network infrastructure and related services. We continued to hold all of these stocks at the end of the period, with the exception of Nokia.
29
What is the outlook?
The Fund’s diversified portfolio is constructed by allocating the Fund’s assets across a variety of industries and then selecting companies in each industry that are deemed attractive by a team of global industry analysts. Our holdings are geographically diverse. As a result of bottom-up (i.e. stock by stock fundamental research) stock selection, at the end of the period we were overweight (i.e. the Fund’s sector position was greater than the benchmark position) to North America, and underweight (i.e. the Fund’s sector position was less than the benchmark position) in developed Europe and Japan relative to the MSCI All Country World Index.
Diversification by Industry
as of April 30, 2008
| | | | | |
| | Percentage of | |
| Industry | | Net Assets | |
| |
| Basic Materials | | | 9.6 | % |
| Capital Goods | | | 1.9 | |
| Consumer Cyclical | | | 7.9 | |
| Consumer Staples | | | 7.0 | |
| Energy | | | 10.3 | |
| Finance | | | 21.7 | |
| Health Care | | | 12.4 | |
| Services | | | 4.8 | |
| Technology | | | 15.1 | |
| Transportation | | | 1.3 | |
| Utilities | | | 4.8 | |
| Short-Term Investments | | | 2.0 | |
| Other Assets and Liabilities | | | 1.2 | |
| | | | |
Total | | | 100.0 | % |
| | | | |
Diversification by Country
as of April 30, 2008
| | | | | |
| | | Percentage of | |
| Country | | Net Assets | |
| Australia | | | 1.3 | |
| Austria | | | 0.6 | |
| Belgium | | | 0.7 | |
| Brazil | | | 4.4 | |
| Canada | | | 6.5 | |
| China | | | 1.2 | |
| Denmark | | | 0.1 | |
| Egypt | | | 0.5 | |
| France | | | 4.9 | |
| Germany | | | 3.8 | |
| Greece | | | 0.3 | |
| Hong Kong | | | 0.8 | |
| India | | | 0.2 | |
| Indonesia | | | 0.2 | |
| Ireland | | | 0.3 | |
| Israel | | | 0.3 | |
| Italy | | | 0.9 | |
| Japan | | | 6.0 | |
| Luxembourg | | | 0.2 | |
| Malaysia | | | 0.5 | |
| Mexico | | | 0.1 | |
| Netherlands | | | 2.5 | |
| Norway | | | 1.0 | |
| Russia | | | 2.5 | |
| Singapore | | | 0.7 | |
| South Africa | | | 0.6 | |
| Spain | | | 1.0 | |
| Sweden | | | 1.1 | |
| Switzerland | | | 3.4 | |
| Taiwan | | | 0.5 | |
| Turkey | | | 0.4 | |
| United Kingdom | | | 5.0 | |
| United States | | | 44.3 | |
| Short-Term Investments | | | 2.0 | |
| Other Assets and Liabilities | | | 1.2 | |
| | | | |
Total | | | 100.0 | % |
| | | | |
30
The Hartford Global Financial Services Fund
(subadvised by Wellington Management Company, LLP)
Performance Overview(1) 10/31/00 — 4/30/08
Growth of a $10,000 investment in Class A which includes Sales Charge
MSCI Finance ex Real Estate Index is a cap-weighted index that measures the performance of financial stocks from around the world. This index excludes real estate.
S&P 500 Index is a market capitalization weighted price index composed of 500 widely held common stocks.
You cannot invest directly in an index.
Investment objective — Seeks long-term capital appreciation.
Average Annual Total Returns(2) (as of 4/30/08)
| | | | | | | | | | | | | | | | | |
| | | Inception | | | 1 | | | 5 | | | Since |
| | | Date | | Year | | | Year | | | Inception |
| |
| Global Financial Services A# | | | 10/31/00 | | | | -16.36 | % | | | 10.05 | % | | | 3.76 | % |
| Global Financial Services A## | | | 10/31/00 | | | | -20.96 | % | | | 8.81 | % | | | 2.98 | % |
| Global Financial Services B# | | | 10/31/00 | | | | -16.73 | % | | | 9.37 | % | | | 3.08 | % |
| Global Financial Services B## | | | 10/31/00 | | | | -20.36 | % | | | 9.09 | % | | | 3.08 | % |
| Global Financial Services C# | | | 10/31/00 | | | | -16.87 | % | | | 9.25 | % | | | 3.02 | % |
| Global Financial Services C## | | | 10/31/00 | | | | -17.60 | % | | | 9.25 | % | | | 3.02 | % |
| Global Financial Services Y# | | | 10/31/00 | | | | -15.93 | % | | | 10.56 | % | | | 4.23 | % |
| | |
| # | | Without sales charge |
| |
| ## | | With sales charge |
PAST PERFORMANCE IS NOT INDICATIVE OF FUTURE RESULTS.
| (1) | | Growth of a $10,000 investment in Classes B, C and Y shares will vary from results seen above due to differences in the expenses charged to these share classes. |
| |
| (2) | | The initial investment in Class A shares reflects the maximum sales charge and Classes B and C reflect CDSC. |
The value of shares will fluctuate so that, when redeemed, shares may be worth more or less than their original cost. The chart and table do not reflect the deduction of taxes that a shareholder would pay on fund distributions or the redemption of fund shares.
Performance information may reflect historical or current expense waivers/reimbursements from the investment adviser, without which performance would have been lower. For information on current expense waivers/reimbursements, please see the prospectus.
Portfolio Manager
Mark T. Lynch, CFA
Senior Vice President, Partner,
Global Industry Analyst
How did the Fund perform?
The Class A shares of The Hartford Global Financial Services Fund returned -16.01%, before sales charge, for the six-month period ended April 30, 2008, versus its benchmark, the MSCI Finance ex-Real Estate Index, which returned -15.67% for the same period, and the - -16.35% return of the average fund in the Lipper Financial Services Funds peer group, a group of funds with investment strategies similar to those of the Fund.
Why did the Fund perform this way?
The six-month period ending April 30, 2008 was one of the most volatile in recent history for the financial sector. Financial stocks were at the epicenter of market turmoil as volatility stemmed from events in the subprime mortgage market, which led to tightening credit availability and deterioration in the U.S. housing market. The extended credit crunch contributed to the near collapse of large investment bank Bear Stearns. In response to increasing concerns of an uncertain financial system and a potential recession in the U.S., equity investors sought to shed risk. In this environment, all of the industries in the MSCI Finance ex-Real Estate Index had negative returns during the period, with eleven of the sixteen groups posting double-digit declines. Thrifts & Mortgage Finance (-43%), Specialized Finance (-27%), Diversified Capital Markets (-23%) and Consumer Finance (-22%) were hit the hardest.
Thrifts & Mortgage Finance holdings contributed most to the Fund’s relative (i.e. performance of the Fund as measured against the benchmark) performance due to strong security selection. Stock selection was also strong in the Regional Banks and Diversified Banks industries; however, these gains were more than offset by weaker selection within the Asset Management & Custody, Diversified Capital Markets, and Life & Health Insurance industries.
Top contributors to relative and absolute (i.e. total return) performance included Washington Mutual, Popular Inc. and Discover Financial. During the period we established a position in consumer and small business banking company Washington Mutual through their private placement, which has generated significant positive returns. Shares of Popular have risen as it has become the number one bank in Puerto Rico, following a tumultuous period that weakened several competitors. Management is also rationalizing their troublesome U.S. business.
31
Shares of credit card issuer and electronic services company Discover Financial were oversold towards the end of last year as investors worried about credit quality. However, shares rose as its asset quality trends and earnings potential have held up better than expected. Discover also has a key strategic asset beyond its credit card portfolio in its network. Through third parties, Discover is leveraging the network to show better growth and earnings trends.
E*Trade Financial, Advanta Corp. and African Bank Investments Ltd. were among the top detractors to relative performance during the period. Shares of E*Trade, the retail brokerage and banking firm, were hurt as unexpected subprime and mortgage issues relating to the company began to surface. Additionally, expectations that it would benefit from consolidation in the online brokerage sector deflated when the company had to increase provisions for bad debts in its loan and securities book. Shares of small-business credit card issuer Advanta fell due to concerns about higher-than-expected delinquencies. We eliminated our position. Shares of South African-based bank-controlling company African Bank Investments declined on general South African credit quality concerns, while persistent inflation has led to rate increases and higher debt burdens for consumers at a time when credit has grown rapidly in the system. We continued to hold the stock at the end of the period. Other top detractors from absolute performance included UBS AG, Citigroup, and Old Mutual.
What is the outlook?
The past year has been extremely volatile and complex for the Financial sector. However, the disorder and turmoil caused by the subprime mortgage market and other structured vehicles has generated opportunities. We continue to focus on stocks with low P/Es (i.e. Price/Earnings ratio), opportunistically look for special situations, and avoid companies that are lacking strong customer franchises. Our holdings are geographically diverse. At the end of the period, we remained overweight (i.e. the Fund’s sector position was greater than the benchmark position) to North America and Emerging Markets, and underweight (i.e. the Fund’s sector position was less than the benchmark position) in Asia and the United Kingdom. At the end of the period, we were overweight the Asset Management & Custody Banks, Consumer Finance, and Thrifts & Mortgage Finance industries and most underweight Diversified Banks and Multi-line Insurance.
Diversification by Industry
as of April 30, 2008
| | | | | |
| | | Percentage of | |
| Industry | | Net Assets | |
| |
| Commercial Banking | | | 11.5 | % |
| Consumer Lending | | | 2.7 | |
| Depository Credit Banking | | | 24.6 | |
| Insurance Carriers | | | 19.4 | |
| International Trade Financing (Foreign Banks) | | 9.8 | |
| Monetary Authorities — Central Bank | | | 2.6 | |
| Nondepository Credit Banking | | | 9.1 | |
| Other Financial Investment Activities | | | 6.0 | |
| Real Estate Credit (Mortgage Banking) | | | 4.6 | |
| Securities, Commodities and Brokerage | | | 4.5 | |
| Short-Term Investments | | | 12.8 | |
| Other Assets and Liabilities | | | (7.6 | ) |
| | | | |
Total | | | 100.0 | % |
| | | | |
Diversification by Country
as of April 30, 2008
| | | | | |
| | | Percentage of | |
| Country | | Net Assets | |
| |
| Brazil | | | 2.1 | % |
| Canada | | | 16.5 | |
| China | | | 1.7 | |
| France | | | 7.6 | |
| Germany | | | 2.9 | |
| Italy | | | 4.1 | |
| Netherlands | | | 6.8 | |
| Norway | | | 4.0 | |
| Singapore | | | 2.6 | |
| South Africa | | | 2.7 | |
| Switzerland | | | 5.9 | |
| United Kingdom | | | 6.6 | |
| United States | | | 31.3 | |
| Short-Term Investments | | | 12.8 | |
| Other Assets and Liabilities | | (7.6 | ) |
| | | | |
Total | | | 100.0 | % |
| | | | |
32
The Hartford Global Growth Fund
(subadvised by Wellington Management Company, LLP)
Performance Overview(1) 9/30/98 — 4/30/08
Growth of a $10,000 investment in Class A which includes Sales Charge
MSCI World Growth Index is a broad-based unmanaged market capitalization-weighted total return index which measures the performance of growth securities in 23 developed-country global equity markets including the U.S., Canada, Europe, Australia, New Zealand and the Far East.
You cannot invest directly in an index.
The value of shares will fluctuate so that, when redeemed, shares may be worth more or less than their original cost. The chart and table do not reflect the deduction of taxes that a shareholder would pay on fund distributions or the redemption of fund shares.
Performance information may reflect historical or current expense waivers/reimbursements from the investment adviser, without which performance would have been lower. For information on current expense waivers/reimbursements, please see the prospectus.
Investment objective — Seeks growth of capital.
Average Annual Total Returns(2,3) (as of 4/30/08)
| | | | | | | | | | | | | | | | | |
| | | Inception | | 1 | | | 5 | | | Since |
| | | Date | | Year | | | Year | | | Inception |
| |
| Global Growth A# | | | 9/30/98 | | | | 8.13 | % | | | 14.73 | % | | | 9.76 | % |
| Global Growth A## | | | 9/30/98 | | | | 2.19 | % | | | 13.44 | % | | | 9.11 | % |
| Global Growth B# | | | 9/30/98 | | | | 7.38 | % | | | 13.88 | % | | NA* |
| Global Growth B## | | | 9/30/98 | | | | 2.66 | % | | | 13.65 | % | | NA* |
| Global Growth C# | | | 9/30/98 | | | | 7.39 | % | | | 13.95 | % | | | 9.01 | % |
| Global Growth C## | | | 9/30/98 | | | | 6.45 | % | | | 13.95 | % | | | 9.01 | % |
| Global Growth R3# | | | 9/30/98 | | | | 7.87 | % | | | 15.13 | % | | | 10.24 | % |
| Global Growth R3## | | | 9/30/98 | | | | 7.87 | % | | | 15.13 | % | | | 10.24 | % |
| Global Growth R4# | | | 9/30/98 | | | | 8.06 | % | | | 15.19 | % | | | 10.27 | % |
| Global Growth R4## | | | 9/30/98 | | | | 8.06 | % | | | 15.19 | % | | | 10.27 | % |
| Global Growth R5# | | | 9/30/98 | | | | 8.61 | % | | | 15.34 | % | | | 10.34 | % |
| Global Growth R5## | | | 9/30/98 | | | | 8.61 | % | | | 15.34 | % | | | 10.34 | % |
| Global Growth Y# | | | 9/30/98 | | | | 8.70 | % | | | 15.38 | % | | | 10.36 | % |
| | |
| # | | Without sales charge |
| |
| ## | | With sales charge |
| |
| NA | | Not Applicable |
| |
| * | | Inception returns are not applicable for Class B because after 8 years Class B converts to Class A. |
PAST PERFORMANCE IS NOT INDICATIVE OF FUTURE RESULTS.
| (1) | | Growth of a $10,000 investment in Classes B, C, R3, R4, R5 and Y shares will vary from results seen above due to differences in the expenses charged to these share classes. |
| |
| (2) | | Class R3, R4 and R5 shares commenced operations on 12/22/06. Performance prior to 12/22/06 reflects Class Y performance. |
| |
| (3) | | The initial investment in Class A shares reflects the maximum sales charge and Classes B and C reflect CDSC. |
| | | | | |
Portfolio Managers | | | | |
Matthew D. Hudson, CFA | | Jean-Marc Berteaux | | Andrew S. Offit, CPA |
| Vice President | | Senior Vice President, Partner | | Senior Vice President, Partner |
How did the Fund perform?
The Class A shares of The Hartford Global Growth Fund returned -12.96%, before sales charge, for the six-month period ended April 30, 2008, underperforming its benchmark, the MSCI World Growth Index, which returned -7.34% for the same period. The Fund also underperformed the -10.01% return of the average fund in the Lipper Global Large-Cap Growth Funds peer group, a group of funds with investment strategies similar to those of the Fund.
Why did the Fund perform this way?
Global equity markets fell during the period as investors shed risk amid turmoil in the bond and housing markets. Markets were volatile as investors remained concerned about higher energy and agricultural commodity prices and the potential impact of a U.S.-led economic recession on global economic growth. The MSCI World Growth Index (-7.34%) outperformed the MSCI World Value Index (-10.98%). Within the MSCI World Growth Index, sector returns were negative for all but Energy and Materials. Consumer Discretionary, Financials, and Information Technology fell the most during the period.
The Fund’s underperformance relative (i.e. performance of the Fund as measured against the benchmark) to the MSCI World Growth Index during the period was a primarily a result of security selection. Positive stock selection in Materials and Telecommunication Services was more than offset by weaker stock selection in the Consumer Discretionary, Information Technology, and Industrials sectors. Sector allocation, which is a result of bottom-up (i.e. stock by stock fundamental research) security selection, also detracted from relative performance. The Fund’s overweight (i.e. the Fund’s sector position was greater than the benchmark position) to lagging Information Technology and Financials and underweight (i.e. the Fund’s sector position was less than the benchmark position) in Materials hurt benchmark relative returns.
Las Vegas Sands (Consumer Discretionary), Schering-Plough (Health Care), and MF Global (Financials) were the leading relative detractors owned by the Fund. Shares of Las Vegas Sands, a developer and
33
operator of hotel, gaming, and resort businesses, fell due to disappointing earnings as gamblers at its properties had better-than-expected success. Shares of Schering-Plough fell on concerns about the effectiveness of its flagship cholesterol drug Vytorin. Shares of MF Global fell sharply after a rogue trader within the Bermuda-based independent derivatives brokerage firm caused significant losses by trading unauthorized wheat futures contracts. Internet search and advertising firm Google also detracted from absolute (i.e. total return) performance results. The company experienced a decline in its stock price after reporting weaker-than-expected earnings and slowing growth in paid ad clicks. We owned Las Vegas Sands, MF Global, and Google at the end of the period.
Top contributors to the Fund’s relative and absolute performance were LG Electronics (Consumer Discretionary), Seadrill (Energy), and Monsanto (Materials). Shares of LG Electronics, a Korean-based electronics and telecommunication products company, rose on reports suggesting a strong outlook for the company’s handset business and continued strong demand for LCD displays. Shares of Norwegian deepwater drilling company Seadrill moved higher after the company posted better-than-expected operating profits and stated that day-rates for rigs were expected to continue to move higher due to strong demand. Leading agricultural products company Monsanto continued to benefit from strong demand for its seed and crop protection products due to greater global grain consumption and bio-fuel demand. Potash, a Canadian-based fertilizer and feed products company, also contributed to absolute returns. Its shares moved higher after the company reported better-than-expected quarterly earnings and issued optimistic earnings guidance for 2008. Both Monsanto and Potash are benefiting from the global boom in agricultural products.
What is the outlook?
We believe the U.S. slowdown will be a drag on global activity in 2008. The impact of tighter credit conditions and slowing U.S. imports will be felt unevenly throughout the world, but the emerging economies will remain economic growth leaders. We expect that aggressive rate cuts by the Federal Reserve and a weaker U.S. dollar will stimulate monetary policies abroad and should set the stage for improving global growth in 2009. At the end of the period, our stock-by-stock investment process resulted in greater-than-benchmark weights in Telecommunication Services, Information Technology, and Energy stocks. The Fund held less-than-benchmark weights in Consumer Staples, Consumer Discretionary, and Materials names.
Diversification by Industry
as of April 30, 2008
| | | | | |
| | | Percentage of | |
| Industry | | Net Assets | |
| |
| Basic Materials | | | 9.4 | % |
| Capital Goods | | | 6.4 | |
| Consumer Cyclical | | | 7.6 | |
| Consumer Staples | | | 4.5 | |
| Energy | | | 8.8 | |
| Finance | | | 10.0 | |
| Health Care | | | 9.7 | |
| Services | | | 3.1 | |
| Technology | | | 32.6 | |
| Transportation | | | 2.8 | |
| Utilities | | | 3.8 | |
| Short-Term Investments | | | 13.0 | |
| Other Assets and Liabilities | | | (11.7 | ) |
| | | | |
Total | | | 100.0 | % |
| | | | |
Diversification by Country
as of April 30, 2008
| | | | | |
| | | Percentage of | |
| Country | | Net Assets | |
| |
| Australia | | | 1.2 | % |
| Brazil | | | 1.9 | |
| Canada | | | 5.6 | |
| China | | | 2.6 | |
| Denmark | | | 1.5 | |
| Finland | | | 1.5 | |
| France | | | 2.6 | |
| Germany | | | 4.0 | |
| Greece | | | 0.9 | |
| Hong Kong | | | 1.1 | |
| Ireland | | | 2.2 | |
| Israel | | | 1.2 | |
| Japan | | | 3.7 | |
| Luxembourg | | | 1.5 | |
| Mexico | | | 1.1 | |
| Netherlands | | | 2.6 | |
| Norway | | | 1.8 | |
| South Korea | | | 1.3 | |
| Spain | | | 4.1 | |
| Switzerland | | | 4.7 | |
| Taiwan | | | 1.2 | |
| United Kingdom | | | 7.1 | |
| United States | | | 43.3 | |
| Short-Term Investments | | | 13.0 | |
| Other Assets and Liabilities | | | (11.7 | ) |
| | | | |
Total | | | 100.0 | % |
| | | | |
34
The Hartford Global Health Fund
(subadvised by Wellington Management Company, LLP)
Performance Overview(1) 5/01/00 — 4/30/08
Growth of a $10,000 investment in Class A which includes Sales Charge
S&P 500 Index is a market capitalization weighted price index composed of 500 widely held common stocks.
S&P North American Health Care Sector Index is an unmanaged index designed to measure the performance of companies in the health care sector. Issues in the index include providers of health care related services including long-term care and hospitalization facilities, health care management organizations and continuing care services.
You cannot invest directly in an index.
The value of shares will fluctuate so that, when redeemed, shares may be worth more or less than their original cost. The chart and table do not reflect the deduction of taxes that a shareholder would pay on fund distributions or the redemption of fund shares.
Performance information may reflect historical or current expense waivers/reimbursements from the investment adviser, without which performance would have been lower. For information on current expense waivers/reimbursements, please see the prospectus.
Investment objective — Seeks long-term capital appreciation.
Average Annual Total Returns(2,3) (as of 4/30/08)
| | | | | | | | | | | | | | | | | |
| | | Inception | | 1 | | 5 | | Since |
| | | Date | | Year | | Year | | Inception |
| |
| Global Health A# | | | 5/01/00 | | | | -9.47 | % | | | 10.81 | % | | | 10.10 | % |
| Global Health A## | | | 5/01/00 | | | | -14.45 | % | | | 9.57 | % | | | 9.33 | % |
| Global Health B# | | | 5/01/00 | | | | -10.24 | % | | | 9.99 | % | | | 9.28 | % |
| Global Health B## | | | 5/01/00 | | | | -14.40 | % | | | 9.72 | % | | | 9.28 | % |
| Global Health C# | | | 5/01/00 | | | | -10.18 | % | | | 10.02 | % | | | 9.30 | % |
| Global Health C## | | | 5/01/00 | | | | -11.01 | % | | | 10.02 | % | | | 9.30 | % |
| Global Health I# | | | 5/01/00 | | | | -9.26 | % | | | 10.97 | % | | | 10.20 | % |
| Global Health I## | | | 5/01/00 | | | | -9.26 | % | | | 10.97 | % | | | 10.20 | % |
| Global Health R3# | | | 5/01/00 | | | | -9.82 | % | | | 11.11 | % | | | 10.53 | % |
| Global Health R3## | | | 5/01/00 | | | | -9.82 | % | | | 11.11 | % | | | 10.53 | % |
| Global Health R4# | | | 5/01/00 | | | | -9.39 | % | | | 11.24 | % | | | 10.61 | % |
| Global Health R4## | | | 5/01/00 | | | | -9.39 | % | | | 11.24 | % | | | 10.61 | % |
| Global Health R5# | | | 5/01/00 | | | | -9.05 | % | | | 11.35 | % | | | 10.68 | % |
| Global Health R5## | | | 5/01/00 | | | | -9.05 | % | | | 11.35 | % | | | 10.68 | % |
| Global Health Y# | | | 5/01/00 | | | | -9.05 | % | | | 11.37 | % | | | 10.69 | % |
| | |
| # | | Without sales charge |
| |
| ## | | With sales charge |
PAST PERFORMANCE IS NOT INDICATIVE OF FUTURE RESULTS.
| (1) | | Growth of a $10,000 investment in Classes B, C, I, R3, R4, R5 and Y shares will vary from results seen above due to differences in the expenses charged to these share classes. |
| |
| (2) | | Class I shares commenced operations on 8/31/06. Performance prior to 8/31/06 reflects Class A performance. Class R3, R4 and R5 shares commenced operations on 12/22/06. Performance prior to 12/22/06 reflects Class Y performance. |
| |
| (3) | | The initial investment in Class A shares reflects the maximum sales charge and Classes B and C reflect CDSC. |
| | | | | | | | | |
Portfolio Managers | | | | | | | | |
Joseph H. Schwartz, CFA* | | Jean M. Hynes, CFA | | Ann C. Gallo | | Kirk J. Mayer, CFA | | Robert L. Deresiewicz |
| Senior Vice President, Partner, | | Senior Vice President, Partner, | | Senior Vice President, Partner, | | Vice President, | | Vice President, |
| Global Industry Analyst | | Global Industry Analyst | | Global Industry Analyst | | Global Industry Analyst | | Global Industry Analyst |
How did the Fund perform?
The Class A shares of The Hartford Global Health Fund returned -10.24%, before sales charge, for the six-month period ended April 30, 2008, versus its benchmark, the S&P North American Health Care Sector Index (the index was formerly known as the S&P GSSI Health Care Index), which returned -12.06% for the same period, and the -11.00% return of the average fund in the Lipper Health and Biotechnology peer group, a group of funds with investment strategies similar to those of the Fund.
Why did the Fund perform this way?
It has been a tough environment for investors across the board over the last six months, and health care has certainly not been spared. Global equity markets fell during the period as investors shed risk in response to disruptions in the credit markets, rising agricultural and energy prices, and slower consumer spending. Health care volatility has increased over concerns about the potential implications of the U.S. elections. Health Care stocks, as measured by the S&P North American Health Care Sector Index, fell sharply during the period. Within the index, Health Care Equipment & Supplies and Life Sciences Tools & Services industries were the best performers, while Health Care
35
Providers & Services and Pharmaceuticals stocks lagged. Health Care stocks trailed the broader U.S. market, which returned -9.63%, as measured by the S&P 500 Index, and the world market return of - -9.12%, as measured by the MSCI World Index.
The Fund outperformed due to strong stock selection. Security selection was particularly strong in the Pharmaceuticals and Biotechnology stocks. Millennium Pharmaceutical, Merck, Shionogi and Elan were the top contributors to relative (i.e. performance of the Fund as measured against the benchmark) performance during the period. Shares of U.S.-based biotech company Millennium Pharmaceuticals rose on news of a proposed acquisition of the company by Japan’s biggest drugmaker Takeda Pharmaceutical. Not owning pharmaceutical firm Merck, whose shares fell significantly after bad news about its cholesterol drug Vytorin, helped relative performance. Shares of Japanese pharmaceutical firm Shionogi rose sharply after a study reported positive results from the drugmaker’s cholesterol pill Crestor. Shares of biotechnology company Elan rose after it reported better than expected revenues from sales of its multiple sclerosis drug Tysabri. Among other top contributors to performance was biopharmaceutical company Gilead Sciences. Its shares advanced after the company reported better than expected earnings estimates. We continued to hold Millenium, Shiongi, Elan and Gilead at the end of the period.
Schering-Plough and Progenics Pharmaceuticals were leading detractors from performance on a relative and absolute (i.e. total return) basis. Shares of U.S. pharmaceutical company Schering-Plough, which has a profitable partnership selling cholesterol drugs with New Jersey neighbor Merck, declined on concerns about the effectiveness of its flagship cholesterol drug Vytorin. We believe that the Vytorin concerns are overblown and added to our position. Shares of biopharmaceutical firm Progenics fell on news that methylnaltrexone, a treatment for postoperative gastrointestinal problems, failed a Phase 3 trial. We continue to hold the stock and remain optimistic about prospects for methylnaltrexone. The Fund was also hurt from not owning New Jersey based health products maker Johnson & Johnson. The company reported strong profits driven by dollar weakness driving up foreign revenues. U.S. health insurer UnitedHealth Group was among other detractors from performance during the period. Its shares fell as the company experienced slower than anticipated enrollment growth.
What is the outlook?
At the end of the period the Fund was most overweight (i.e. the Fund’s sector position was greater than the benchmark position) Biotechnology and Medical Technology and underweight (i.e. the Fund’s sector position was less than the benchmark position) Pharmaceuticals and Medical Products names. We remain overweight Biotechnology, and we believe that we may be entering a period where strong performance is not as concentrated on one or two areas but more broadly diverse. Within the Health Care Providers & Services sub-sector, stocks generally appear to be fairly valued and fundamentals are stable. Within the Health Care Equipment & Supplies sub-sector, most stocks appear fairly valued; however, we continue to look for companies with underappreciated franchises or promising research & development projects.
*Effective June 30, 2008, Joseph H. Schwartz will no longer be involved in portfolio management and securities analysis for the Fund.
Diversification by Country
as of April 30, 2008
| | | | | |
| | | Percentage of | |
| Country | | Net Assets | |
| |
| Belgium | | | 2.5 | % |
| Brazil | | | 0.4 | |
| China | | | 0.4 | |
| Denmark | | | 0.4 | |
| France | | | 3.5 | |
| Germany | | | 1.4 | |
| Ireland | | | 2.9 | |
| Israel | | | 1.6 | |
| Italy | | | 0.7 | |
| Japan | | | 11.2 | |
| Spain | | | 0.6 | |
| Switzerland | | | 0.9 | |
| United Kingdom | | | 2.2 | |
| United States | | | 70.5 | |
| Short-Term Investments | | | 10.2 | |
| Other Assets and Liabilities | | | (9.4 | ) |
| | | | |
Total | | | 100.0 | % |
| | | | |
Diversification by Industry
as of April 30, 2008
| | | | | |
| | | Percentage of | |
| Industry | | Net Assets | |
| |
| Drugs & Druggists Sundries Wholesalers | | | 4.5 | % |
| Electromedical Manufacturing | | | 7.5 | |
| General Medical and Surgical Hospitals | | | 2.1 | |
| Health and Personal Care Stores | | | 2.8 | |
| Individual and Family Services | | | 0.1 | |
| Insurance Carriers | | | 3.9 | |
| Medical and Diagnostic Laboratories | | | 0.7 | |
| Medical Equipment & Supplies Manufacturing | | | 8.7 | |
| Outpatient Care Centers | | | 2.2 | |
| Pharmaceutical & Medicine Manufacturing | | | 56.0 | |
| Professional Services — Computer System Design and Related | | | 0.6 | |
| Scientific Research & Development Services | | | 10.1 | |
| Short-Term Investments | | | 10.2 | |
| Other Assets and Liabilities | | | (9.4 | ) |
| | | | |
Total | | | 100.0 | % |
| | | | |
36
The Hartford Global Technology Fund
(subadvised by Wellington Management Company, LLP)
Performance Overview(1) 5/01/00 — 4/30/08
Growth of a $10,000 investment in Class A which includes Sales Charge
S&P 500 Index is a market capitalization weighted price index composed of 500 widely held common stocks.
S&P North American Technology Sector Index is an unmanaged index designed to measure performance of companies in the technology sector. Issues in the index include producers of sophisticated devices, services and software related to the fields of computers, electronics, networking and Internet services.
You cannot invest directly in an index.
Investment objective — Seeks long-term capital appreciation.
Average Annual Total Returns(2) (as of 4/30/08)
| | | | | | | | | | | | | | | | | |
| | | Inception | | 1 | | 5 | | Since |
| | | Date | | Year | | Year | | Inception |
| |
| Global Technology A# | | | 5/01/00 | | | | 0.65 | % | | | 12.77 | % | | | -5.98 | % |
| Global Technology A## | | | 5/01/00 | | | | -4.88 | % | | | 11.50 | % | | | -6.64 | % |
| Global Technology B# | | | 5/01/00 | | | | 0.17 | % | | | 12.03 | % | | | -6.64 | % |
| Global Technology B## | | | 5/01/00 | | | | -4.83 | % | | | 11.78 | % | | | -6.64 | % |
| Global Technology C# | | | 5/01/00 | | | | -0.17 | % | | | 11.88 | % | | | -6.72 | % |
| Global Technology C## | | | 5/01/00 | | | | -1.17 | % | | | 11.88 | % | | | -6.72 | % |
| Global Technology Y# | | | 5/01/00 | | | | 0.96 | % | | | 13.19 | % | | | -5.62 | % |
| | |
| # | | Without sales charge |
| |
| ## | | With sales charge |
PAST PERFORMANCE IS NOT INDICATIVE OF FUTURE RESULTS.
| (1) | | Growth of a $10,000 investment in Classes B, C and Y shares will vary from results seen above due to differences in the expenses charged to these share classes. |
| |
| (2) | | The initial investment in Class A shares reflects the maximum sales charge and Classes B and C reflect CDSC. |
The value of shares will fluctuate so that, when redeemed, shares may be worth more or less than their original cost. The chart and table do not reflect the deduction of taxes that a shareholder would pay on fund distributions or the redemption of fund shares.
Performance information may reflect historical or current expense waivers/reimbursements from the investment adviser, without which performance would have been lower. For information on current expense waivers/reimbursements, please see the prospectus.
| | | | | | | | | |
Portfolio Managers | | | | | | | | |
Scott E. Simpson | | John F. Averill, CFA | | Eric Stromquist | | Bruce L. Glazer | | Anita M. Killian, CFA |
| Senior Vice President, Partner, | | Senior Vice President, Partner, | | Senior Vice President, Partner, | | Senior Vice President, Partner, | | Senior Vice President, Partner, |
| Global Industry Analyst | | Global Industry Analyst | | Global Industry Analyst | | Global Industry Analyst | | Global Industry Analyst |
How did the Fund perform?
The Class A shares of The Hartford Global Technology Fund returned -14.94%, before sales charge, for the six-month period ended April 30, 2008, versus its benchmark, the S&P North American Technology Sector Index (the index was formerly known as the S&P GSTI Technology Index), which returned -14.80%, and the - -16.76% return of the average fund in the Lipper Science and Technology Funds peer group, a group of funds with investment strategies similar to those of the Fund.
Why did the Fund perform this way?
Global equity markets fell during the period amid ongoing turmoil in the credit markets, concerns about slowing economic growth and a weakening outlook for corporate earnings growth. Certain central banks acted aggressively to soften an economic slowdown, with the U.S. Federal Reserve lowering the federal funds rate and introducing multiple programs aimed at improving liquidity within financial markets. Technology stocks underperformed the broader U.S. market, which returned -9.6% during the period, as measured by the S&P 500 Index, and the world market return of -9.1%, as measured by the MSCI World Index.
During the period, the Fund benefited from security selection in the Communications Equipment industry. However, this was somewhat offset by weaker stock selection in the Computers & Peripherals, Internet Software & Services, Electronic Equipment & Instruments, and Software industries.
LG Electronics, Qualcomm Inc, and EMC Corporation were among the top contributors to relative (i.e. performance of the Fund as measured against the benchmark) and absolute (i.e. total return) performance during the period. Shares of Korean-based electronics and telecommunication products company LG Electronics moved higher on investor enthusiasm for the firm’s new handset line. Qualcomm, a leader in advanced wireless semiconductors, benefited from strong demand for 3G handsets and is gaining share in 3G chip market Code Division Multiple Access (CDMA) and Wideband Code Division Multiple Access (W-CDMA) wireless technologies. The Fund’s relative performance benefited from our underweight (i.e. the Fund’s sector position was less than the benchmark position) in EMC Corporation, a world leader in information infrastructure solutions. EMC’s stock fell in a challenging environment for enterprise Information Technology (“IT”) spending which limits the firm’s near-term earnings outlook. Research In Motion and Ciena Corporation were among other top
37
names contributing to absolute returns. Canadian-based wireless telecommunications manufacturer and service provider Research In Motion benefited from strong demand for Smartphones and solid sales of the company’s BlackBerry device. Shares of Ciena, a supplier of communications networking equipment, software and services, gained value after it announced strong quarterly results and an outlook that exceeded market expectations. LG Electronics, Qualcomm, Research In Motion, and Ciena were all held at the end of the period.
IBM, Apple and Google were among the top detractors from relative and absolute performance during the period. Performance was hurt by our underweight of technology company IBM, whose business spans computer hardware, software, semiconductors and IT services, in a time period when it outperformed the technology index. Shares of Apple fell after the company faced disappointing sales of the iPhone and the maturing iPod in North America and Europe. We sold the security. Google’s stock price declined due to concerns about the company’s future search advertising revenue. Microsoft and Cisco were among other top names that detracted from absolute returns during the period. Shares of software products and services company Microsoft fell after the company announced plans to acquire Yahoo. Shares of Cisco declined after the company’s recent earnings report showed results in line with expectations but cited weakness in the U.S. enterprise market. Google and Microsoft were held at the end of the period.
What is the outlook?
We believe that the U.S. may be heading towards a recession caused by the housing downturn, which has extended into 2008. The impact of tighter credit conditions and slowing U.S. imports will be felt throughout the world with economies in Europe and Japan also slowing down. However, we expect that most emerging markets will maintain economic growth and remain as trade leaders.
Historically, handset growth has not been affected by economic slowdowns. The handset market remains robust, with strong growth in emerging markets, where the mobile penetration is on a constant rise. Corporate IT and software spending in 2008 appears uncertain and we expect both to decelerate in North America as a result of businesses scaling back investment. However, emerging markets should remain strong growth drivers in this area. Storage, security, and maintenance spending should be more resilient in this environment.
We see a decline in semiconductor equipment spending in 2008, following low single-digit industry sales growth in 2007, as chipmakers digest excess capacity and delay new orders until end-market demand improves. However, we expect the weakness to be less severe than in prior downturns, given the increasing geographic and product diversification of semiconductor chips.
At the end of the period, the Fund was most overweight (i.e. the Fund’s sector position was greater than the benchmark position) the Semiconductors & Semiconductor Equipment industry and most underweight Computers & Peripherals names relative to the benchmark.
Diversification by Industry
as of April 30, 2008
| | | | | |
| | | Percentage of | |
| Industry | | Net Assets | |
| |
| Activities Related to Credit Banking | | | 4.5 | % |
| Business Support Services | | | 0.3 | |
| Communications Equipment Manufacturing | | | 9.1 | |
| Computer and Peripheral | | | 13.5 | |
| Electrical and Electronic Merchandise Wholesalers | | | 2.8 | |
| Electrical Equipment Manufacturing — Component Other | | | 2.8 | |
| Employment Services | | | 1.6 | |
| Industrial Machinery Manufacturing | | | 1.2 | |
| Industrial Machinery, Equipment Rental & Leasing | | | 3.1 | |
| Internet Providers & Web Search Portal | | | 5.7 | |
| Management, Scientific, Technical Consulting Service | | | 2.4 | |
| Other Telecommunications | | | 4.7 | |
| Professional & Commercial Equipment | | | 1.9 | |
| Professional Services — Computer System Design and Related | | | 3.7 | |
| Semiconductor, Electronic Component Manufacturing | | | 20.5 | |
| Software Publishers | | | 20.6 | |
| Short-Term Investments | | | 9.5 | |
| Other Assets and Liabilities | | | (7.9 | ) |
| | | | |
Total | | | 100.0 | % |
| | | | |
Diversification by Country
as of April 30, 2008
| | | | | |
| | | Percentage of | |
| Country | | Net Assets | |
| Canada | | | 3.6 | % |
| China | | | 0.8 | |
| Hong Kong | | | 0.8 | |
| Netherlands | | | 2.1 | |
| South Korea | | | 2.8 | |
| Switzerland | | | 0.8 | |
| Taiwan | | | 3.4 | |
| United States | | | 84.1 | |
| Short-Term Investments | | | 9.5 | |
| Other Assets and Liabilities | | | (7.9 | ) |
| | | | |
Total | | | 100.0 | % |
| | | | |
38
The Hartford Growth Allocation Fund
(subadvised Hartford Investment Management Company)
Performance Overview(1) 5/28/04 — 4/30/08
Growth of a $10,000 investment in Class A which includes Sales Charge
Lehman Brothers U.S. Aggregate Bond Index is an unmanaged index and is composed of securities from the Lehman Brothers Government/Credit Bond Index, Mortgage-Backed Securities Index, Asset-Backed Index and Commercial Mortgage-Backed Securities Index.
S&P 500 Index is a market capitalization weighted price index composed of 500 widely held common stocks.
You cannot invest directly in an index.
The value of shares will fluctuate so that, when redeemed, shares may be worth more or less than their original cost. The chart and table do not reflect the deduction of taxes that a shareholder would pay on fund distributions or the redemption of fund shares.
Investment objective — Seeks long-term capital appreciation
Average Annual Total Returns(2,3) (as of 4/30/08)
| | | | | | | | | | | | | |
| | | Inception | | 1 | | Since |
| | | Date | | Year | | Inception |
| |
| Growth Allocation A# | | | 5/28/04 | | | | 1.70 | % | | | 9.37 | % |
| Growth Allocation A## | | | 5/28/04 | | | | -3.90 | % | | | 7.81 | % |
| Growth Allocation B# | | | 5/28/04 | | | | 0.87 | % | | | 8.64 | % |
| Growth Allocation B## | | | 5/28/04 | | | | -3.74 | % | | | 8.03 | % |
| Growth Allocation C# | | | 5/28/04 | | | | 0.91 | % | | | 8.64 | % |
| Growth Allocation C## | | | 5/28/04 | | | | -0.02 | % | | | 8.64 | % |
| Growth Allocation I# | | | 5/28/04 | | | | 2.12 | % | | | 9.55 | % |
| Growth Allocation I## | | | 5/28/04 | | | | 2.12 | % | | | 9.55 | % |
| Growth Allocation R3# | | | 5/28/04 | | | | 1.25 | % | | | 9.21 | % |
| Growth Allocation R3## | | | 5/28/04 | | | | 1.25 | % | | | 9.21 | % |
| Growth Allocation R4# | | | 5/28/04 | | | | 1.68 | % | | | 9.37 | % |
| Growth Allocation R4## | | | 5/28/04 | | | | 1.68 | % | | | 9.37 | % |
| Growth Allocation R5# | | | 5/28/04 | | | | 2.02 | % | | | 9.48 | % |
| Growth Allocation R5## | | | 5/28/04 | | | | 2.02 | % | | | 9.48 | % |
| | |
| # | | Without sales charge |
| |
| ## | | With sales charge |
PAST PERFORMANCE IS NOT INDICATIVE OF FUTURE RESULTS.
| (1) | | Growth of a $10,000 investment in Classes B, C, I, R3, R4 and R5 shares will vary from results seen above due to differences in the expenses charged to these classes. |
| |
| (2) | | Class I shares commenced operations on 8/31/06. Performance prior to 8/31/06 reflects Class A performance. Class R3, R4 and R5 shares commenced operations on 12/22/06. Performance prior to 12/22/06 reflects Class A performance. |
| |
| (3) | | The initial investment in Class A shares reflects the maximum sales charge and Classes B and C reflect CDSC. |
Performance information may reflect historical or current expense waivers/reimbursements from the investment adviser, without which performance would have been lower. For information on current expense waivers/reimbursements, please see the prospectus.
| | | |
Portfolio Managers | | |
Hugh Whelan | | Edward C. Caputo |
| Managing Director | | Assistant Vice President |
How did the Fund perform?
The Class A shares of The Hartford Growth Allocation Fund returned -7.27%, before sales charge, for the six-month period ended April 30, 2008, versus the - -6.85.% return of the Lipper Mixed-Asset Target Allocation Growth Funds category, 4.08% for the Lehman Brothers U.S. Aggregate Bond Index, and -9.63% for the S&P 500 Index.
Why did the Fund perform this way?
The six-month period under review was challenging for both stocks and bonds, as credit and liquidity remained constrained, volatility was high, and concerns about a potential recession emerged. Although the Federal Reserve (the “Fed”) took considerable steps to help bolster the markets, including reducing the target federal funds rate on several occasions, establishing lending facilities that provided a back stop to both banks and brokers, and facilitating JPMorgan Chase’s rescue acquisition of Bear Stearns, investor confidence continued to erode. As a result, investors fled to the relative safety of Treasury securities, fueling their outperformance of all other sectors of the market for the overall period.
Within the fixed income market, the asset-backed securities segment was the worst performing sector and overall, high-yield asset classes such as U.S. high yield bonds, floating-rate notes, and emerging market bonds underperformed higher quality securities. Within domestic equities, mid-cap stocks outperformed large-cap and small-cap stocks. With regard to style, growth beat value within large-cap and mid-cap stocks but underperformed within small-cap stocks. Overall, international stocks slightly outperformed domestic stocks.
Over the course of the period, asse t allocation decision s within equities detracted from the Fund’s performance. Specifically, allocations to small-cap growth, large-cap value, and international small-cap stocks held back returns. However, the nega tive impact was partially offset by the favorable performance of allocations to mid-cap and large-cap
39
growth and international large-cap stocks. Asset allocation within the fixed income portion of the Fund also detracted from performance. Although allocations to Treasury Inflation Protected Securities (TIPS) and short-term bonds were additive to performance, they did not offset the unfavorable performance of allocations to floating-rate notes, high yield bonds, and emerging market debt. Additionally, the duration of the Fund’s fixed income segment (a measure of interest-rate sensitivity) was targeted to be less than that of the broad fixed income market, as measured by the Lehman Brothers U.S. Aggregate Bond Index. This shorter duration also hindered performance as interest rates declined during the period.
During the reporting period, the Fund began utilizing exchange-traded funds (ETFs) to obtain asset class exposures unavailable through The Hartford fund family. Doing so enables the Fund to capture additional opportunities while also enhancing its diversification. In addition, the Fund continues to target an overweight (i.e. the Fund’s sector position was greater than the benchmark position) to international stocks over domestic stocks, growth stocks over value stocks, and large-cap stocks over small-cap stocks.
The Fund’s performance is influenced not just by our asset allocation decisions, but also by the performance of the underlying funds in which it invests. For the overall period, the Fund benefited from fund selection decisions in both fixed income and equities. In keeping with the Fund’s long-term approach, we use cash flows to reallocate among the underlying funds whenever possible. No hard rebalance (i.e. a fund rebalancing to move the underlying fund investments to their target allocation percentages) was executed during the period.
What is the outlook?
The economy continues to face strong headwinds. Growth is likely to be weak until home prices stabilize and credit providers return to the business of lending rather than writing down assets. Despite the Fed’s sharp reductions in short-term interest rates, risk premiums (i.e. difference between the risk associated with buying or holding a Treasury and holding a high yield bond) remain high, which has kept borrowing costs high. However, there are encouraging signs. Lenders are moving to aggressively write down bad loans and the Fed has clearly signaled it stands ready to support the capital markets. Given that Fed policy actions have historically taken a few quarters to affect growth, the rate reductions of last year should begin to be felt in the near future, helping to restore order to the financial markets and setting the stage for recovery.
Composition by Underlying Fund
as of April 30, 2008
| | | | | |
| | | Percentage of |
| Fund Name | | Net Assets |
| |
| DJ Wilshire REIT ETF | | | 0.1 | % |
| The Hartford Capital Appreciation Fund, Class Y | | | 23.3 | |
| The Hartford Disciplined Equity Fund, Class Y | | | 3.3 | |
| The Hartford Equity Income Fund, Class Y | | | 4.6 | |
| The Hartford Global Growth Fund, Class Y | | | 6.3 | |
| The Hartford Growth Fund, Class Y | | | 0.7 | |
| The Hartford Growth Opportunities Fund, Class Y | | | 3.9 | |
| The Hartford Income Fund, Class Y | | | 0.8 | |
| The Hartford Inflation Plus Fund, Class Y | | | 4.2 | |
| The Hartford International Opportunities Fund, Class Y | | | 5.2 | |
| The Hartford International Small Company Fund, Class Y | | | 5.5 | |
| The Hartford Select MidCap Value Fund, Class Y | | | 2.1 | |
| The Hartford Select SmallCap Value Fund, Class Y | | | 4.4 | |
| The Hartford Short Duration Fund, Class Y | | | 4.9 | |
| The Hartford Small Company Fund, Class Y | | | 3.6 | |
| The Hartford Stock Fund, Class Y | | | 0.0 | |
| The Hartford Total Return Bond Fund, Class Y | | | 10.1 | |
| The Hartford Value Fund, Class Y | | | 16.2 | |
| SPDR DJ Wilshire International Real Estate ETF | | | 0.7 | |
| Other Assets and Liabilities | | | 0.1 | |
| | | | | |
Total | | | 100.0 | % |
| | | | | |
40
The Hartford Growth Fund
(subadvised by Wellington Management Company, LLP)
Performance Overview(1,2) 4/30/98 — 4/30/08
Growth of a $10,000 investment in Class A which includes Sales Charge
Russell 1000 Growth Index is an unmanaged index that measures the performance of those Russell 1000 Index companies with higher price-to-book ratios and higher forecasted growth values. You cannot invest directly in an index.
The value of shares will fluctuate so that, when redeemed, shares may be worth more or less than their original cost. The chart and table do not reflect the deduction of taxes that a shareholder would pay on fund distributions or the redemption of fund shares.
Performance information may reflect historical or current expense waivers/reimbursements from the investment adviser, without which performance would have been lower. For information on current expense waivers/reimbursements, please see the prospectus.
Investment objective – Seeks long-term capital appreciation
Average Annual Total Returns(1,3) (as of 4/30/08)
| | | | | | | | | | | | | | | | | | | | | |
| | | Inception | | 1 | | 5 | | 10 | | Since |
| | | Date | | Year | | Year | | Year | | Inception |
| |
| Growth A# | | | 6/08/49 | | | | 3.95 | % | | | 9.89 | % | | | 4.83 | % | | | 10.89 | % |
| Growth A## | | | 6/08/49 | | | | -1.76 | % | | | 8.65 | % | | | 4.24 | % | | | 10.78 | % |
| Growth B# | | | 11/14/94 | | | | 3.20 | % | | | 9.05 | % | | NA | * | | NA | * |
| Growth B## | | | 11/14/94 | | | | -1.49 | % | | | 8.77 | % | | NA | * | | NA | * |
| Growth C# | | | 11/14/94 | | | | 3.25 | % | | | 9.13 | % | | | 4.09 | % | | | 8.11 | % |
| Growth C## | | | 11/14/94 | | | | 2.31 | % | | | 9.13 | % | | | 4.09 | % | | | 8.11 | % |
| Growth I# | | | 2/19/02 | | | | 4.34 | % | | | 10.01 | % | | NA | | | 5.67 | % |
| Growth I## | | | 2/19/02 | | | | 4.34 | % | | | 10.01 | % | | NA | | | 5.67 | % |
| Growth L# | | | 6/08/49 | | | | 4.17 | % | | | 10.19 | % | | | 5.00 | % | | | 10.92 | % |
| Growth L## | | | 6/08/49 | | | | -0.78 | % | | | 9.13 | % | | | 4.49 | % | | | 10.82 | % |
| Growth R3# | | | 2/19/02 | | | | 3.63 | % | | | 10.21 | % | | NA | | | 5.51 | % |
| Growth R3## | | | 2/19/02 | | | | 3.63 | % | | | 10.21 | % | | NA | | | 5.51 | % |
| Growth R4# | | | 2/19/02 | | | | 4.02 | % | | | 10.31 | % | | NA | | | 5.59 | % |
| Growth R4## | | | 2/19/02 | | | | 4.02 | % | | | 10.31 | % | | NA | | | 5.59 | % |
| Growth R5# | | | 2/19/02 | | | | 4.29 | % | | | 10.39 | % | | NA | | | 5.65 | % |
| Growth R5## | | | 2/19/02 | | | | 4.29 | % | | | 10.39 | % | | NA | | | 5.65 | % |
| Growth Y# | | | 2/19/02 | | | | 4.45 | % | | | 10.44 | % | | NA | | | 5.69 | % |
| | |
| # | | Without sales charge |
| |
| ## | | With sales charge |
| |
| NA | | Not Applicable |
| |
| * | | 10 year and inception returns are not applicable for Class B because after 8 years Class B converts to Class A. |
PAST PERFORMANCE IS NOT INDICATIVE OF FUTURE RESULTS.
| (1) | | Classes A, B and C were offered beginning on 2/19/02. Performance prior to that date is that of the fund’s Classes L, M and N shares, respectively, which have lower operating expenses. Performance prior to 2/19/02 would have been lower if Classes A, B and C shares expenses were applied during that period. (Classes M and N are no longer offered.) Class I shares commenced operations on 8/31/06. Performance prior to 8/31/06 reflects Class A performance. Classes R3, R4 and R5 shares commenced operations on 12/22/06. Performance prior to 12/22/06 reflects Class A performance. |
| |
| (2) | | Growth of a $10,000 investment in Classes B, C, I, L, R3, R4, R5 and Y shares will vary from results seen above due to differences in the expenses charged to these share classes. |
| |
| (3) | | The initial investment in Classes A and L shares reflects the maximum sales charge and Classes B and C reflect CDSC. |
| | | |
Portfolio Managers | | |
Andrew J. Shilling, CFA | | John A. Boselli, CFA |
| Senior Vice President, Partner, and Global Industry Analyst | | Senior Vice President, Partner |
How did the Fund perform?
The Class A shares of The Hartford Growth Fund returned -10.82%, before sales charge, for the six-month period ended April 30, 2008, versus its benchmark, the Russell 1000 Growth Index, which returned -9.28% for the same period, and the - -10.01% return of the average fund in the Large-Cap Growth Funds peer group, a group of funds with investment strategies similar to those of the Fund.
Why did the Fund perform this way?
Equity markets suffered a broad decline over the past six months of the period as investors shed risk amid turmoil in the bond and housing markets and concerns over higher energy and agricultural commodity prices, rising inflation, and the potential impact of a U.S.-led economic recession on global economic growth. The market’s decline was broad-based, as both growth and value, and large- and small-cap stocks succumbed to the negative headwinds. The Russell 1000 Growth Index’s - -9.28% return was in line with the -9.83% return of the Russell 1000 Value Index. Large stocks, as measured by the Russell 1000 Index, faired better than smaller stocks, represented by the Russell 2000 Index, - -9.54% to -12.92%. Only two of the ten sectors in the Russell 1000 Growth Index had positive returns, as Materials (+3%) and Energy (+5%) rose. Financials (-19%), Information Technology (-14%), Consumer Discretionary (-14%), and Health Care (-12%) were the biggest laggards.
41
The Fund’s underperformance was driven primarily by sector allocation, which is a result of bottom-up (i.e. stock by stock fundamental research) stock selection. Our underweight (i.e. the Fund’s sector position was less than the benchmark position) to Consumer Staples and an overweight (i.e. the Fund’s sector position was greater than the benchmark position) to Information Technology were the main detractors. This was partially offset by our overweight to the Materials sector. Security selection had minimal impact on overall relative (i.e. performance of the Fund as measured against the benchmark) performance, as strong selection in Materials and Energy was offset by weak selection in Industrials, Health Care, and Financials. Top contributors to relative and absolute (i.e. total return) returns included EOG Resources (Energy), U.S. Steel (Materials), and Potash Corp. (Materials). Shares of oil and natural gas exploration company EOG Resources moved sharply higher after the company boosted its production growth forecasts and said it had found promising new sources of oil and natural gas. Steel maker U.S. Steel, with operations in the U.S., Canada, and Central Europe, is benefiting from rising global demand, pushing prices and margins higher. U.S. Steel’s vertical integration should allow continued leverage to these positive trends. Canadian agricultural products firm Potash saw its shares gain after reporting better-than-expected fourth quarter earnings and raising its guidance for the first quarter and all of 2008. We expect that earnings will continue to exceed expectations given our positive outlook on grain commodities and continued strong fertilizer price trends.
MF Global (Financials), Focus Media (Consumer Discretionary), and Google (Information Technology) were among the top detractors from relative and absolute performance during the period. Shares of Bermuda-based independent derivatives broker MF Global fell sharply after a rogue trader within the firm caused significant losses by trading unauthorized wheat futures contracts. Shares of China-based digital advertising and media company Focus Media trended lower due to concerns about management changes, accounting issues, and mobile spamming. Shares of internet search firm Google fell on disappointing earnings news, driven by higher operating expenses and concerns of slowing growth in ad sales. Top detractors from absolute returns also included software products and services company Microsoft and pharmaceutical companies Schering-Plough and Merck.
What is the outlook?
Our investment approach is very much a bottom-up process: we pick one stock at a time based upon the attractiveness of each company’s valuation and fundamentals. As a result of this bottom-up (i.e. stock by stock fundamental research) stock selection, we were most overweight Materials and Industrials at the end of the period. Significant Materials holdings included U.S. Steel, Agrium and Potash. Our largest Industrials positions were Fluor, Caterpillar, and Lockheed Martin. We remain underweight consumer stocks broadly as fundamentals are likely to be impacted by a slowing economy and reduced consumer spending. At the end of the period, we were most underweight the Consumer Staples, Health Care, and Consumer Discretionary sectors.
Diversification by Industry
as of April 30, 2008
| | | | | |
| | | Percentage of |
| Industry | | Net Assets |
| |
| Basic Materials | | | 14.6 | % |
| Capital Goods | | | 8.9 | |
| Consumer Cyclical | | | 8.6 | |
| Consumer Staples | | | 1.1 | |
| Energy | | | 8.5 | |
| Finance | | | 8.7 | |
| Health Care | | | 10.5 | |
| Services | | | 6.5 | |
| Technology | | | 30.6 | |
| Transportation | | | 0.8 | |
| Short-Term Investments | | | 3.7 | |
| Other Assets and Liabilities | | | (2.5 | ) |
| | | | | |
Total | | | 100.0 | % |
| | | | | |
42
The Hartford Growth Opportunities Fund
(subadvised by Wellington Management Company, LLP)
Performance Overview(1,2) 4/30/98 — 4/30/08
Growth of a $10,000 investment in Class A which includes Sales Charge
Russell 1000 Growth Index is an unmanaged index that measures the performance of those Russell 1000 Index companies with higher price-to-book ratios and higher forecasted growth values.
Russell 3000 Growth Index is an unmanaged index that measures the performance of those Russell 3000 Index companies with higher price-to-book ratios and higher forecasted growth values.
You cannot invest directly in an index.
The value of shares will fluctuate so that, when redeemed, shares may be worth more or less than their original cost. The chart and table do not reflect the deduction of taxes that a shareholder would pay on fund distributions or the redemption of fund shares.
Performance information may reflect historical or current expense waivers/reimbursements from the investment adviser, without which performance would have been lower. For information on current expense waivers/reimbursements, please see the prospectus.
Investment objective — Seeks capital appreciation
Average Annual Total Returns(1,3) (as of 04/30/08)
| | | | | | | | | | | | | | | | | | | | | |
| | | Inception | | 1 | | 5 | | 10 | | Since |
| | | Date | | Year | | Year | | Year | | Inception |
| |
| Growth Opp A# | | | 3/31/63 | | | | 6.24 | % | | | 17.73 | % | | | 8.38 | % | | | 12.93 | % |
| Growth Opp A## | | | 3/31/63 | | | | 0.40 | % | | | 16.41 | % | | | 7.77 | % | | | 12.79 | % |
| Growth Opp B# | | | 11/14/94 | | | | 5.38 | % | | | 16.84 | % | | NA | * | | NA | * |
| Growth Opp B## | | | 11/14/94 | | | | 0.87 | % | | | 16.63 | % | | NA | * | | NA | * |
| Growth Opp C# | | | 11/14/94 | | | | 5.62 | % | | | 16.90 | % | | | 7.61 | % | | | 10.52 | % |
| Growth Opp C## | | | 11/14/94 | | | | 4.72 | % | | | 16.90 | % | | | 7.61 | % | | | 10.52 | % |
| Growth Opp I# | | | 2/19/02 | | | | 6.79 | % | | | 17.90 | % | | NA | | | 11.35 | % |
| Growth Opp I## | | | 2/19/02 | | | | 6.79 | % | | | 17.90 | % | | NA | | | 11.35 | % |
| Growth Opp L# | | | 3/31/63 | | | | 6.54 | % | | | 18.04 | % | | | 8.56 | % | | | 12.97 | % |
| Growth Opp L## | | | 3/31/63 | | | | 1.48 | % | | | 16.90 | % | | | 8.03 | % | | | 12.85 | % |
| Growth Opp R3# | | | 2/19/02 | | | | 6.01 | % | | | 18.07 | % | | NA | | | 11.10 | % |
| Growth Opp R3## | | | 2/19/02 | | | | 6.01 | % | | | 18.07 | % | | NA | | | 11.10 | % |
| Growth Opp R4# | | | 2/19/02 | | | | 6.51 | % | | | 18.21 | % | | NA | | | 11.20 | % |
| Growth Opp R4## | | | 2/19/02 | | | | 6.51 | % | | | 18.21 | % | | NA | | | 11.20 | % |
| Growth Opp R5# | | | 2/19/02 | | | | 6.64 | % | | | 18.27 | % | | NA | | | 11.25 | % |
| Growth Opp R5## | | | 2/19/02 | | | | 6.64 | % | | | 18.27 | % | | NA | | | 11.25 | % |
| Growth Opp Y# | | | 2/19/02 | | | | 6.79 | % | | | 18.31 | % | | NA | | | 11.28 | % |
| | |
| # | | Without sales charge |
| |
| ## | | With sales charge |
| |
| NA | | Not Applicable |
| |
| * | | 10 year and inception returns are not applicable for Class B because after 8 years Class B converts to Class A. |
PAST PERFORMANCE IS NOT INDICATIVE OF FUTURE RESULTS.
| (1) | | Classes A, B and C were offered beginning on 2/19/02. Performance prior to that date is that of the fund’s Classes L, M and N shares, respectively, which have lower operating expenses. Performance prior to 2/19/02 would have been lower if Classes A, B and C shares expenses were applied during that period. (Classes M and N are no longer offered.) Class I shares commenced operations on 8/31/06. Performance prior to 8/31/06 reflects Class A performance. Classes R3, R4 and R5 shares commenced operations on 12/22/06. Performance prior to 12/22/06 reflects Class A performance. |
| |
| (2) | | Growth of a $10,000 investment in Classes B, C, I, L, R3, R4, R5 and Y shares will vary from results seen above due to differences in the expenses charged to these share classes. |
| |
| (3) | | The initial investment in Classes A and L shares reflects the maximum sales charge and Classes B and C reflect CDSC. |
| | | |
Portfolio Managers | | |
Michael T. Carmen, CFA, CPA | | Mario E. Abularach, CFA, CMT |
| Senior Vice President, Partner | | Vice President |
How did the Fund perform?
The Class A shares of The Hartford Growth Opportunities Fund returned -13.59%, before sales charge, for the six-month period ended April 30, 2008, versus its benchmarks, the Russell 3000 Growth Index, which returned -9.68% for the same period and the Russell 1000 Growth Index, which returned -9.28% for the same period. The average fund in the Lipper Multi-Cap Growth Funds peer group, a group of funds with investment strategies similar to those of the Fund, returned -11.51%.
Why did the Fund perform this way?
Overall equity market performance was weak for the period amid continued turmoil in the U.S. bond and housing markets. Within the Russell 3000 Growth Index, eight out of the ten sectors posted negative returns for the period led by Financial Services (-18%), Information Technology (-15%), and Consumer Discretionary (-14%). The leaders in this environment were Energy (+5%) and Materials (+1%).
The Fund underperformed due to weak security selection, particularly in Consumer Discretionary, Health Care, and Industrials. Sector weight positioning, the result of bottom-up (i.e. stock by stock fundamental research) stock selection decisions, had a small positive impact on performance because of overweight (i.e. the Fund’s sector position was
43
greater than the benchmark position) positions in Energy and Materials, which outperformed on a relative (i.e. performance of the Fund as measured against the benchmark) basis. Top relative detractors during the period included Focus Media (Consumer Discretionary), Aircastle (Industrials), and VeriFone (Information Technology). Shares of China-based digital advertising company Focus Media trended lower due to concerns about management changes, accounting practices, and mobile spamming. We continued to hold the stock at the end of the period. Aircastle, a global aircraft leasing company, saw its shares move lower with concerns about future growth as the firm faces rising costs of capital. Transactions automation systems provider VeriFone saw its shares decline after it announced that it would have to restate fiscal year 2007 results due to accounting errors, which had caused the company to overstate gross margins. We eliminated both Aircastle and VeriFone during the period. Google (Information Technology) was among the top absolute (i.e. total return) detractors during the period, as the Internet search firm saw its shares fall on fears that advertising revenues will decelerate as a result of more modest cost-per-click increases and slowing consumer demand. We eliminated the position.
Stock selection within the Energy and Materials sectors added to performance. On a relative basis EOG Resources (Energy), Flowserve (Industrials), and U.S. Steel (Materials) were top contributors. Shares in EOG Resources, an oil and natural gas exploration company, rose after management announced a large natural gas discovery in British Columbia, as well as raised production forecasts for existing fields in Texas and Colorado. The company also benefited from higher energy prices. Flowserve, an industrial fluid motion and control products company, saw its shares rise after earnings exceeded expectations due to strong demand from its customers in the global oil and gas end markets and management announced a dividend increase and share buyback initiative. Steel maker U.S. Steel is benefiting from rising global demand, pushing prices and margins higher. On an absolute basis, Arch Coal (Energy) was among the top contributors. This coal producer saw significant price increases due to extremely tight global coal markets brought on by strong developing world demand and supply shortages in China and Australia. At the end of the period, we held positions in all four stocks.
What is your outlook?
While the global economic outlook remains uncertain due to the possibility of a meaningful deceleration in the U.S., we see opportunities across multiple sectors. We continue to focus our research efforts on identifying stocks of companies whose future growth is underpriced. At the end of the period, our bottom-up decisions resulted in overweights in the Materials, Energy, and Industrials sectors and underweights (i.e. the Fund’s sector position was less than the benchmark position) in the Information Technology, Consumer Staples, and Financial sectors relative to the Russell 3000 Growth Index.
Diversification by Industry
as of April 30, 2008
| | | | | |
| | | Percentage of |
| Industry | | Net Assets |
| |
| Basic Materials | | | 18.0 | % |
| Capital Goods | | | 7.9 | |
| Consumer Cyclical | | | 10.8 | |
| Consumer Staples | | | 3.0 | |
| Energy | | | 9.7 | |
| Finance | | | 6.5 | |
| Health Care | | | 15.1 | |
| Services | | | 6.3 | |
| Technology | | | 19.0 | |
| Transportation | | | 0.8 | |
| Short-Term Investments | | | 15.8 | |
| Other Assets and Liabilities | | | (12.9 | ) |
| | | | | |
Total | | | 100.0 | % |
| | | | | |
44
The Hartford High Yield Fund
(subadvised by Hartford Investment Management Company)
Performance Overview(1) 9/30/98 — 4/30/08
Growth of a $10,000 investment in Class A which includes Sales Charge
Lehman Brothers High Yield Corporate Index is an unmanaged broad-based market value-weighted index that tracks the total return performance of non-investment grade, fixed-rate, publicly placed, dollar denominated and nonconvertible debt registered with the Securities and Exchange Commission.
You cannot invest directly in an index.
The value of shares will fluctuate so that, when redeemed, shares may be worth more or less than their original cost. The chart and table do not reflect the deduction of taxes that a shareholder would pay on fund distributions or the redemption of fund shares.
Performance information may reflect historical or current expense waivers/reimbursements from the investment adviser, without which performance would have been lower. For information on current expense waivers/reimbursements, please see the prospectus.
Investment objective — Seeks high current income. Growth of capital is a secondary objective.
Average Annual Total Returns(2,3) (as of 4/30/08)
| | | | | | | | | | | | | | | | | |
| | | Inception | | 1 | | 5 | | Since |
| | | Date | | Year | | Year | | Inception |
| |
| High Yield A# | | | 9/30/98 | | | | -2.32 | % | | | 6.36 | % | | | 4.73 | % |
| High Yield A## | | | 9/30/98 | | | | -6.71 | % | | | 5.39 | % | | | 4.23 | % |
| High Yield B# | | | 9/30/98 | | | | -3.06 | % | | | 5.55 | % | | NA | * |
| High Yield B## | | | 9/30/98 | | | | -7.59 | % | | | 5.24 | % | | NA | * |
| High Yield C# | | | 9/30/98 | | | | -3.02 | % | | | 5.65 | % | | | 4.02 | % |
| High Yield C## | | | 9/30/98 | | | | -3.93 | % | | | 5.65 | % | | | 4.02 | % |
| High Yield I# | | | 9/30/98 | | | | -2.03 | % | | | 6.43 | % | | | 4.76 | % |
| High Yield I## | | | 9/30/98 | | | | -2.03 | % | | | 6.43 | % | | | 4.76 | % |
| High Yield R3# | | | 9/30/98 | | | | -2.68 | % | | | 6.64 | % | | | 5.07 | % |
| High Yield R3## | | | 9/30/98 | | | | -2.68 | % | | | 6.64 | % | | | 5.07 | % |
| High Yield R4# | | | 9/30/98 | | | | -2.38 | % | | | 6.73 | % | | | 5.11 | % |
| High Yield R4## | | | 9/30/98 | | | | -2.38 | % | | | 6.73 | % | | | 5.11 | % |
| High Yield R5# | | | 9/30/98 | | | | -2.16 | % | | | 6.80 | % | | | 5.15 | % |
| High Yield R5## | | | 9/30/98 | | | | -2.16 | % | | | 6.80 | % | | | 5.15 | % |
| High Yield Y# | | | 9/30/98 | | | | -1.93 | % | | | 6.83 | % | | | 5.16 | % |
| | |
| # | | Without sales charge |
| |
| ## | | With sales charge |
| |
| NA | | Not Applicable |
| |
| * | | 10 year and inception returns are not applicable for Class B because after 8 years Class B converts to Class A. |
PAST PERFORMANCE IS NOT INDICATIVE OF FUTURE RESULTS.
| (1) | | Growth of a $10,000 investment in Classes B, C, I, R3, R4, R5 and Y shares will vary from results seen above due to differences in the expenses charged to these share classes. |
| |
| (2) | | The initial investment in Class A shares reflects the maximum sales charge and Classes B and C reflect CDSC. |
| |
| (3) | | Class I shares commenced operations on 5/31/07. Performance prior to 5/31/07 reflects Class A performance. Class R3, R4 and R5 shares commenced operations on 12/22/06. Performance prior to 12/22/06 reflects Class A performance. |
| | | | | |
Portfolio Managers | | | | |
Mark Niland, CFA | | James Serhant, CFA | | Nasri Toutoungi |
| Managing Director | | Senior Vice President, Senior Investment Analyst | | Managing Director |
How did the Fund perform?
The Class A shares of The Hartford High Yield Fund returned -2.10% for the six-month period ended April 30, 2008, versus its benchmark, the Lehman Brothers High Yield Corporate Index, which returned - -0.79%, and the -2.21% the average return of the Lipper High Current Yield Funds category, a group of funds with investment strategies similar to those of the Fund.
Why did the Fund perform this way?
Sector and security selection were the main drivers of the Fund’s performance relative to its benchmark during the six-month period. The Fund entered the period with an 11.5% allocation to bank loans as a defensive measure, given that these securities are typically less vulnerable to credit issues than high yield bonds since they are more senior in the capital structure, providing a relative safe haven in a period of rising defaults. However, the market pressures from a supply overhang and the unwinding of collateralized loan obligations (CLOs) introduced an unprecedented level of price volatility to this asset class. We were able to reduce the Fund’s exposure to the sector to less than 8% before this wave hit, but the remaining exposure was adversely affected by the 5% price decline that bank loans suffered during the period. Technology-related exposures also detracted from performance as Spansion and Freescale reported results and future guidance that fell short of our expectations.
The Fund’s defensive holdings in cash, which were in excess of 6%, proved to be one of the main positive contributors to performance in a declining market. Also benefiting performance were holdings in the media sector, as our Clear Channel bonds benefited from the announcement of a tender offer at a level above par. In addition, our holdings in XM Satellite Radio, which were purchased at a deep discount to par, increased in value as optimism rose around the prospect of the completion of their merger with Sirius Satellite Radio.
45
What is your outlook?
The economy continues to face strong headwinds. Growth is likely to be weak until home prices stabilize and credit providers return to the business of lending rather than writing down assets. Despite the Federal Reserve’s (the “Fed”) sharp reductions in short-term interest rates, risk premiums remain high, which has kept borrowing costs high. However, there are encouraging signs. Lenders are moving to aggressively write down bad loans and the Fed has clearly signaled it stands ready to support the capital markets. Given that Fed policy actions have historically taken a few quarters to affect growth, the rate reductions of last year should begin to be felt in the near future, helping to restore order to the financial markets and setting the stage for recovery.
With regard to the high yield market, the supply overhang of bank loans and high yield bonds underwritten in the first half of 2007 is beginning to diminish, easing the technical pressure the market was facing, and newly underwritten transactions have been successfully placed in recent weeks as structures and prices have dramatically improved. Although corporate earnings are likely to be pressured by the current economic slowdown and defaults are poised to rise further, the financial sector appears to be on the mend. As such, there is reason to believe that the worst of the turmoil in the broader capital markets is behind us and we can soon return to the basics of credit underwriting within our sector in a market where significant spread widening has both highlighted risk and created value.
Diversification by Industry
as of April 30, 2008
| | | | | |
| | | Percentage of |
| Industry | | Net Assets |
| |
| Basic Materials | | | 8.3 | % |
| Capital Goods | | | 1.6 | |
| Consumer Cyclical | | | 11.2 | |
| Consumer Staples | | | 1.1 | |
| Energy | | | 5.3 | |
| Finance | | | 12.3 | |
| Health Care | | | 6.4 | |
| Services | | | 16.0 | |
| Technology | | | 16.6 | |
| Transportation | | | 2.0 | |
| Utilities | | | 11.7 | |
| Short-Term Investments | | | 21.6 | |
| Other Assets and Liabilities | | | (14.1 | ) |
| | | | | |
Total | | | 100.0 | % |
| | | | | |
Distribution by Credit Quality
as of April 30, 2008
| | | | | |
| | | Percentage of |
| | | Long-Term |
| Rating | | Holdings |
| |
| AAA | | | 0.3 | |
| BBB | | | 0.4 | |
| BB | | | 21.8 | |
| B | | | 55.8 | |
| CCC | | | 19.1 | |
| CC | | | 0.2 | |
| C | | | 0.0 | |
| NR | | | 2.4 | |
| | | | | |
Total | | | 100.0 | % |
| | | | | |
46
The Hartford High Yield Municipal Bond Fund
(subadvised by Hartford Investment Management Company)
Performance Overview(1) 5/31/07 — 4/30/08
Growth of a $10,000 investment in Class A which includes Sales Charge
Lehman Brothers Municipal Non-Investment Grade Debt Index is an unmanaged index made up of bonds that are non-investment grade, unrated, or rated below Ba1 by Moody’s Investors Service with a remaining maturity of at least one year.
You cannot invest directly in an index.
The value of shares will fluctuate so that, when redeemed, shares may be worth more or less than their original cost. The chart and table do not reflect the deduction of taxes that a shareholder would pay on fund distributions or the redemption of fund shares.
Investment objective — Seeks to provide a high level of current income which is generally exempt from federal income taxes. Capital appreci ation is a seconda ry objective.
Average Annual Total Returns(2) (as of 4/30/08)
| | | | | | | | | |
| | | Inception | | Since |
| | | Date | | Inception |
| |
| High Yield Municipal Bond A# | | | 5/31/07 | | | | -8.01 | % |
| High Yield Municipal Bond A## | | | 5/31/07 | | | | -12.15 | % |
| High Yield Municipal Bond B# | | | 5/31/07 | | | | -8.65 | % |
| High Yield Municipal Bond B## | | | 5/31/07 | | | | -13.03 | % |
| High Yield Municipal Bond C# | | | 5/31/07 | | | | -8.55 | % |
| High Yield Municipal Bond C## | | | 5/31/07 | | | | -9.42 | % |
| High Yield Municipal Bond I# | | | 5/31/07 | | | | -7.70 | % |
| High Yield Municipal Bond I## | | | 5/31/07 | | | | -7.70 | % |
| | |
| # | | Without sales charge |
| |
| ## | | With sales charge |
PAST PERFORMANCE IS NOT INDICATIVE OF FUTURE RESULTS.
| (1) | | Growth of a $10,000 investment in Classes B, C and I shares will vary from results seen above due to differences in the expenses charged to these share classes. |
| |
| (2) | | The initial investment in Class A shares reflects the maximum sales charge and Classes B and C reflect CDSC. |
Performance information may reflect historical or current expense waivers/reimbursements from the investment adviser, without which performance would have been lower. For information on current expense waivers/reimbursements, please see the prospectus.
| | | |
Portfolio Managers | | |
Charles Grande | | Christopher Bade |
| Executive Vice President | | Vice President |
How did the Fund perform?
The Class A shares of The Hartford High Yield Municipal Bond Fund returned — 4.76%, before sales charge, for the six-month period ended April 30, 2008, versus its benchmark, the Lehman Brothers Municipal Non-Investment Grade Debt Index, which returned - -5.60%, and the -4.26% average return of the Lipper High Yield Municipal Funds category, a group of funds with investment strategies similar to those of the Fund.
Why did the Fund perform this way?
The Fund’s significant exposure to higher-yielding, lower-rated bonds (triple-B and below) was one of the primary detractors from performance for the period. The Fund currently holds 70% of its assets in lower rated bonds. The flight to quality that took place during the period, coupled with credit rating downgrades of various major monoline bond insurers, forced selling by hedge funds, and the deterioration of the variable rate and auction rate markets led to significant volatility and price declines in the market, particularly in the high-yield sector. As a result, high-yield municipal credit spreads widened (i.e. short and long term interest rates moving farther apart) by 113 basis points during the period while spreads in investment-grade municipals widened by 60 basis points.
The Fund’s longer duration (a measure of interest-rate sensitivity), which resulted from considerable exposure to the long end of the municipal yield curve, was also a major detractor from performance. During the period, the municipal curve steepened with the yield differential between two-year and 30-year maturities increasing by 119 basis points to 226 basis points. As a result, the long end of the curve underperformed both the intermediate and short segments of the curve.
Over the course of the period we did, however, reduce the Fund’s duration from 9.4 years to 7.0 years (versus 7.86 years for the benchmark) as well as its exposure to lower-rated securities (from 98% to 70%), which helped the Fund to outperform its benchmark. To reduce duration, we sold various long-maturity issues and purchased short-maturity floating-rate securities. These purchases included higher yielding, low-duration auction rate securities and variable rate demand notes. As such, these securities offer the Fund the opportunity to capture higher yields than those offered by the traditional long-term market
47
while also lowering the Fund’s duration. It should be noted that, while many auction rate securities have failed in recent months, we consider the auction rate securities we purchased as liquid because we limited our purchases to those issuers with high quality uderlying ratings and large cash balances that could be used to quickly refinance their outstanding auction rate debt. Furthermore, both the auction rate securities and the variable rate demand notes purchased are also in the higher-quality general obligation, utilities, and transportation sectors. As a result, these purchases coupled with the sale of lower-rated bonds from the portfolio also served to increase the Fund’s overall credit quality rating from ‘Ba1’ to ‘Baa2’ during the period.
Early this year, we reduced the Fund’s holdings in unsecured special facility airline bonds which was beneficial, as this was the worst performing sector for the six-month period. We expect to reenter this sector, but only on a secured basis, as pricing becomes more attractive. The Fund’s lack of leverage also benefited performance, as did its limited exposure to bond insurer credit downgrades. Conversely, holdings in special assessment bonds hindered returns as the sector continues to be negatively impacted by the national housing slowdown and increasing delinquencies and foreclosures.
What is your outlook?
The economy continues to face strong headwinds. Growth is likely to be weak until home prices stabilize and credit providers return to the business of lending rather than writing down assets. Despite the Federal Reserve’s (the “Fed”) sharp reductions in short-term interest rates, risk premiums (i.e. difference between the risk associated with buying or holding a Treasury and holding a high yield bond) remain high, which has kept borrowing costs high. However, there are encouraging signs. Lenders are moving to aggressively write down bad loans and the Fed has clearly signaled it stands ready to support the capital markets. Given that Fed policy actions have historically taken a few quarters to affect growth, the rate reductions of last year should begin to be felt in the near future, helping to restore order to the financial markets and setting the stage for recovery.
We believe the underlying credit fundamentals of the municipal market will to continue to weaken as long as the housing crisis, economic slowdown and bond insurer troubles continue to weigh on the market. With tax revenue growth slowing, we remain cautious and particularly selective with regard to high-yield bonds. Although demand from non-traditional buyers such as hedge funds remains spotty, demand from traditional buyers (insurance companies, individuals and mutual funds) has significantly improved in recent weeks, which has helped reduce the demand/supply imbalance that has negatively impacted market performance. However, we expect supply to remain relatively heavy throughout the remainder of this year. While municipal bond prices have risen recently, we believe they still offer tremendous value relative to taxable securities. In our view, this attractive pricing is unsustainable. Given this, as well as the extreme steepness of the municipal yield curve, we plan to slightly extend the Fund’s duration again while selectively adding to high-yield holdings.
Finally, the U.S. Supreme Court recently released its long-awaited decision in the Davis v. Kentucky Department of Revenue case, upholding the constitutionality of state laws that tax interest on out-of-state municipal bonds while exempting municipal bonds of in-state issuers. The decision preserves the status quo regarding state taxation of municipal bond interest and thus eliminates a potentially profound and largely uncertain impact on the municipal market going forward.
Diversification by Industry
as of April 30, 2008
| | | | | |
| | | Percentage of |
| Industry | | Net Assets |
| |
| Airport Revenues | | | 3.9 | % |
| General Obligations | | | 4.0 | |
| Health Care/Services | | | 15.4 | |
| Higher Education (Univ., Dorms, etc.) | | | 19.8 | |
| Housing (HFA’s, etc.) | | | 0.1 | |
| Industrial | | | 4.3 | |
| Miscellaneous | | | 13.7 | |
| Pollution Control | | | 8.2 | |
| Public Facilities | | | 2.5 | |
| Special Tax Assessment | | | 8.7 | |
| Tax Allocation | | | 2.3 | |
| Transportation | | | 2.4 | |
| Utilities — Electric | | | 1.0 | |
| Utilities — Gas | | | 7.1 | |
| Utilities — Water and Sewer | | | 3.1 | |
| Short-Term Investments | | | 6.8 | |
| Other Assets and Liabilities | | | (3.3 | ) |
| | | | | |
Total | | | 100.0 | % |
| | | | | |
Distribution by Credit Quality
as of April 30, 2008
| | | | | |
| | | Percentage of |
| | | Long-Term |
| Rating | | Holdings |
| |
| AAA | | | 11.0 | |
| AA | | | 2.0 | |
| A | | | 13.3 | |
| BBB | | | 29.8 | |
| BB | | | 11.8 | |
| B | | | 3.4 | |
| CCC | | | 1.4 | |
| NR | | | 27.3 | |
| | | | | |
Total | | | 100.0 | % |
| | | | | |
48
The Hartford Income Allocation Fund
(subadvised by Hartford Investment Management Company)
Performance Overview(1) 5/28/04 — 4/30/08
Growth of a $10,000 investment in Class A which includes Sales Charge
Lehman Brothers U.S. Aggregate Bond Index is an unmanaged index and is composed of securities from the Lehman Brothers Government/Credit Bond Index, Mortgage-Backed Securities Index, Asset-Backed Index and Commercial Mortgage-Backed Securities Index.
You cannot invest directly in an index.
The value of shares will fluctuate so that, when redeemed, shares may be worth more or less than their original cost. The chart and table do not reflect the deduction of taxes that a shareholder would pay on fund distributions or the redemption of fund shares.
Investment objective — Seeks current income and, as a secondary objective, capital preservation.
Average Annual Total Returns(2,3) (as of 4/30/08)
| | | | | | | | | | | | | |
| | | Inception | | 1 | | Since |
| | | Date | | Year | | Inception |
| |
| Income Allocation A# | | | 5/28/04 | | | | 2.91 | % | | | 3.51 | % |
| Income Allocation A## | | | 5/28/04 | | | | -1.72 | % | | | 2.30 | % |
| Income Allocation B# | | | 5/28/04 | | | | 2.18 | % | | | 2.80 | % |
| Income Allocation B## | | | 5/28/04 | | | | -2.72 | % | | | 2.10 | % |
| Income Allocation C# | | | 5/28/04 | | | | 2.29 | % | | | 2.80 | % |
| Income Allocation C## | | | 5/28/04 | | | | 1.30 | % | | | 2.80 | % |
| Income Allocation I# | | | 5/28/04 | | | | 3.27 | % | | | 3.64 | % |
| Income Allocation I## | | | 5/28/04 | | | | 3.27 | % | | | 3.64 | % |
| Income Allocation R3# | | | 5/28/04 | | | | 2.62 | % | | | 3.40 | % |
| Income Allocation R3## | | | 5/28/04 | | | | 2.62 | % | | | 3.40 | % |
| Income Allocation R4# | | | 5/28/04 | | | | 2.85 | % | | | 3.48 | % |
| Income Allocation R4## | | | 5/28/04 | | | | 2.85 | % | | | 3.48 | % |
| Income Allocation R5# | | | 5/28/04 | | | | 3.24 | % | | | 3.61 | % |
| Income Allocation R5## | | | 5/28/04 | | | | 3.24 | % | | | 3.61 | % |
| | |
| # | | Without sales charge |
| |
| ## | | With sales charge |
PAST PERFORMANCE IS NOT INDICATIVE OF FUTURE RESULTS.
| (1) | | Growth of a $10,000 investment in Classes B, C, I, R3, R4 and R5 shares will vary from results seen above due to differences in the expenses charged to these classes. |
| |
| (2) | | Class I shares commenced operations on 8/31/06. Performance prior to 8/31/06 reflects Class A performance. Class R3, R4 and R5 shares commenced operations on 12/22/06. Performance prior to 12/22/06 reflects Class A performance. |
| |
| (3) | | The initial investment in Class A shares reflects the maximum sales charge and Classes B and C reflect CDSC. |
Performance information may reflect historical or current expense waivers/reimbursements from the investment adviser, without which performance would have been lower. For information on current expense waivers/reimbursements, please see the prospectus.
| | | |
Portfolio Managers | | |
Hugh Whelan | | Edward C. Caputo |
| Managing Director | | Assistant Vice President |
How did the Fund perform?
The Class A shares of The Hartford Income Allocation Fund returned 1.34%, before sales charge, for the six-month period ended April 30, 2008, versus a 4.08% return for its benchmark, the Lehman Brothers U.S. Aggregate Bond Index, and 1.51% for the Lipper Intermediate Investment Grade Debt Funds category, a group of funds with investment strategies similar to those of the Fund.
Why did the Fund perform this way?
The six-month period under review was challenging for both stocks and bonds, as credit and liquidity remained constrained, volatility was high, and concerns about a potential recession emerged. Although the Federal Reserve (the “Fed”) took considerable steps to help bolster the markets, including reducing the target federal funds rate on several occasions, establishing lending facilities that provided a back stop to both banks and brokers, and facilitating JP Morgan Chase’s rescue acquisition of Bear Stearns, investor confidence continued to erode. As a result, investors fled to the relative safety of Treasury securities, fueling their outperformance of all other sectors of the market for the overall period.
Within the fixed income market, the asset-backed securities segment was the worst performing sector and overall, high-yield asset classes such as U.S. high yield bonds, floating-rate notes, and emerging market bonds underperformed higher quality securities.
Over the course of the period, the Fund’s duration (a measure of interest-rate sensitivity) was less than that of the broad fixed income market, as measured by the Lehman Brothers U.S. Aggregate Bond Index. This shorter relative duration detracted from performance as interest rates declined during the quarter. Asset allocation also hindered returns. Although allocations to Treasury Inflation Protected Securities (TIPS) and short-term bonds were additive to performance, they did not offset the unfavorable performance of allocations to floating rate notes, high yield bonds and emerging market debt. Recently, the Fund decreased its allocation to TIPS in favor of floating rate notes and intermediate maturity bonds.
During the period, the Fund began utilizing exchange-traded funds (ETFs) to obtain asset class exposures unavailable through The Hartford fund family. Doing so enables the Fund to capture additional opportunities while also enhancing its diversification. Specifically, the
49
Fund has set target allocations to an ETF that provides emerging market debt exposure.
The Fund’s performance is influenced not just by our asset allocation decisions, but also by the performance of the underlying funds in which it invests. For the overall period, the Fund benefited from our fund selection decisions. In keeping with the Fund’s long-term approach, we use cash flows to reallocate among the underlying funds whenever possible. No hard rebalance (i.e. a fund rebalancing to move the underlying fund investments to their target allocation percentages) was executed during the period.
What is the outlook?
The economy continues to face strong headwinds. Growth is likely to be weak until home prices stabilize and credit providers return to the business of lending rather than writing down assets. Despite the Fed’s sharp reductions in short-term interest rates, risk premiums (i.e. difference between the risk associated with buying or holding a Treasury and holding a high yield bond) remain high, which has kept borrowing costs high. However, there are encouraging signs. Lenders are moving to aggressively write down bad loans and the Fed has clearly signaled it stands ready to support the capital markets. Given that Fed policy actions have historically taken a few quarters to affect growth, the rate reductions of last year should begin to be felt in the near future, helping to restore order to the financial markets and setting the stage for recovery.
Composition by Underlying Fund
as of April 30, 2008
| | | | | |
| | | Percentage of |
| Fund Name | | Net Assets |
| |
| The Hartford Floating Rate Fund, Class Y | | | 5.6 | % |
| The Hartford High Yield Fund, Class Y | | | 10.2 | |
| The Hartford Income Fund, Class Y | | | 14.1 | |
| The Hartford Inflation Plus Fund, Class Y | | | 25.7 | |
| The Hartford Money Market Fund, Class Y | | | 2.0 | |
| The Hartford Short Duration Fund, Class Y | | | 21.7 | |
| The Hartford Strategic Income Fund, Class Y | | | 4.5 | |
| The Hartford Total Return Bond Fund, Class Y | | | 13.8 | |
| Powershares Emerging Markets Sovereign Debt Portfolio ETF | | | 1.8 | |
| Other Assets and Liabilities | | | 0.6 | |
| | | | | |
Total | | | 100.0 | |
| | | | | |
50
The Hartford Income Fund
(subadvised by Hartford Investment Management Company)
Performance Overview(1) 10/31/02 — 4/30/08
Growth of a $10,000 investment in Class A which includes Sales Charge
Lehman Brothers U.S. Aggregate Bond Index is an unmanaged index and is composed of securities from the Lehman Brothers Government/Credit Bond Index, Mortgage-Backed Securities Index, Asset-Backed Index and Commercial Mortgage-Backed Securities Index.
You cannot invest directly in an index.
Investment objective — Seeks to provide a high level of current income. Capital appreciatio n is a secondary objective.
Average Annual Total Returns(2) (as of 4/30/08)
| | | | | | | | | | | | | | | | | |
| | | Inception | | 1 | | 5 | | Since |
| | | Date | | Year | | Year | | Inception |
| |
| Income A# | | | 10/31/02 | | | | 0.34 | % | | | 3.99 | % | | | 5.09 | % |
| Income A## | | | 10/31/02 | | | | -4.18 | % | | | 3.04 | % | | | 4.21 | % |
| Income B# | | | 10/31/02 | | | | -0.42 | % | | | 3.23 | % | | | 4.32 | % |
| Income B## | | | 10/31/02 | | | | -5.16 | % | | | 2.90 | % | | | 4.17 | % |
| Income C# | | | 10/31/02 | | | | -0.42 | % | | | 3.27 | % | | | 4.36 | % |
| Income C## | | | 10/31/02 | | | | -1.36 | % | | | 3.27 | % | | | 4.36 | % |
| Income Y# | | | 11/28/03 | | | | 0.53 | % | | NA | | | 4.05 | % |
| | |
| # | | Without sales charge |
| |
| ## | | With sales charge |
| |
| NA | | Not Applicable |
PAST PERFORMANCE IS NOT INDICATIVE OF FUTURE RESULTS.
| (1) | | Growth of a $10,000 investment in Classes B, C and Y shares will vary from results seen above due to differences in the expenses charged to these share classes. |
| |
| (2) | | The initial investment in Class A shares reflects the maximum sales charge and Classes B and C reflect CDSC. |
The value of shares will fluctuate so that, when redeemed, shares may be worth more or less than their original cost. The chart and table do not reflect the deduction of taxes that a shareholder would pay on fund distributions or the redemption of fund shares.
Performance information may reflect historical or current expense waivers/reimbursements from the investment adviser, without which performance would have been lower. For information on current expense waivers/reimbursements, please see the prospectus.
| | | | | |
Portfolio Managers | | | | |
William H. Davison, Jr. | | Charles Moon | | Christopher J. Zeppiere (effective June 1, 2008) |
| Managing Director | | Managing Director | | Vice President |
How did the Fund perform?
The Class A shares of The Hartford Income Fund returned -0.04%, before sales charge, for the six-month period ended April 30, 2008, versus its benchmark, the Lehman Brothers U.S. Aggregate Bond Index, which returned 4.08%, and the 1.30% average return of the Lipper Corporate Debt A-Rated Funds category, a group of funds with investment strategies similar to those of the Fund.
Why did the Fund perform this way?
The market was extremely volatile throughout the six-month period under review and risk premiums (i.e. difference between the risk associated with buying or holding a Treasury and holding a high yield bond) across all asset classes rose significantly. The subprime mortgage crisis accelerated, culminating in the near collapse of Bear Stearns. As financial institutions wrote down impaired assets and realized enormous losses, investor confidence eroded. Markets began to seize as banks, brokers and other financial institutions became reluctant to transact with each other.
The Federal Reserve (the “Fed”) was quick to react to the crisis, adding liquidity to the market by reducing the target federal funds rate from 4.5% to 2.0% while also establishing lending facilities that provided a back stop to both banks and brokers. Moreover, the Fed facilitated JPMorgan Chase’s rescue acquisition of Bear Stearns, after which credit spreads in the market, which had dramatically widened, began to narrow again. As a result, in the last month of the period, the Lehman Brothers U.S. Aggregate Bond Index realized the best returns in excess of Treasuries in the history of the index.
The Fund held allocations to various higher-yielding spread sectors and, therefore, had exposure to the considerable spread widening (i.e. short and long term interest rates moving farther apart) that took place during much of the period. In particular, the Fund was overweighted (i.e. the Fund’s sector position was greater than the benchmark position) high-yield bonds and bank loans, which are not included in the benchmark, and commercial mortgage-backed securities (CMBS) and was underweighted (i.e. the Fund’s sector position was less than the benchmark position) in Treasury securities. This sector allocation was the primary detractor from the Fund’s relative (i.e. performance of the Fund as measured against the benchmark) performance as spread sectors underperformed Treasuries for the overall period. Security selection in investment-grade corporate debt and CMBS also hindered performance as a result of positions that were lower in the capital structure and more vulnerable to the illiquidity and systemic risk in the market.
The Fund’s duration (a measure of interest-rate sensitivity) and yield curve positioning, however, helped to mitigate some of this underperformance. We maintained a slightly longer duration for the Fund while positioning the Fund to benefit from a steepening of the yield curve (i.e. short and long term interest rates moving farther apart). This strategy proved beneficial as interest rates declined, particularly on
51
the short end of the curve, and the curve steepened with the yield differential between two-year and ten-year Treasury notes increasing from 52 basis points to 147 basis points.
What is the outlook?
The economy continues to face strong headwinds. Growth is likely to be weak until home prices stabilize and credit providers return to the business of lending rather than writing down assets. Despite the Fed’s sharp reductions in short-term interest rates, risk premiums remain high, which has kept borrowing costs high. However, there are encouraging signs. Lenders are moving to aggressively write down bad loans and the Fed has clearly signaled it stands ready to backstop the capital markets. Given that Fed policy actions have historically taken a few quarters to affect growth, the rate reductions of last year should begin to be felt in the near future, helping to restore order to the financial markets and setting the stage for recovery.
Although credit spreads have narrowed in recent weeks, they still remain at near record wide levels and appear to be pricing in very poor conditions. We believe that while the market is likely to remain volatile, market pricing will ultimately revert to historical means. Therefore, we will maintain our positions and opportunistically add modestly to spread risk.
Distribution by Credit Quality
as of April 30, 2008
| | | | | |
| | | Percentage of |
| | | Long-Term |
| Rating | | Holdings |
| |
| AAA | | | 52.3 | |
| AA | | | 6.1 | |
| A | | | 15.8 | |
| BBB | | | 7.3 | |
| BB | | | 9.9 | |
| B | | | 7.0 | |
| CCC | | | 0.8 | |
| NR | | | 0.8 | |
| | | | | |
Total | | | 100.0 | % |
| | | | | |
Diversification by Industry
as of April 30, 2008
| | | | | |
| | | Percentage of |
| Industry | | Net Assets |
| |
| Basic Materials | | | 2.3 | % |
| Capital Goods | | | 0.3 | |
| Consumer Cyclical | | | 2.1 | |
| Consumer Staples | | | 1.3 | |
| Energy | | | 1.6 | |
| Finance | | | 29.9 | |
| Foreign Governments | | | 3.0 | |
| Health Care | | | 1.5 | |
| Services | | | 4.7 | |
| Technology | | | 6.0 | |
| Transportation | | | 1.0 | |
| U.S. Government Agencies | | | 27.6 | |
| U.S. Government Securities | | | 11.0 | |
| Utilities | | | 2.5 | |
| Short-Term Investments | | | 20.4 | |
| Other Assets and Liabilities | | | (15.2 | ) |
| | | | | |
Total | | | 100.0 | % |
| | | | | |
52
The Hartford Inflation Plus Fund
(subadvised by Hartford Investment Management Company)
Performance Overview(1) 10/31/02 — 4/30/08
Growth of a $10,000 investment in Class A which includes Sales Charge
Lehman Brothers U.S. Treasury Inflation-Protected Securities (TIPS) Index represents securities that protect against adverse inflation and provide a minimum level of real return. To be included in this index, bonds must have cash flows linked to an inflation index, be sovereign issues denominated in U.S. currency, and have more than one year to maturity.
You cannot invest directly in an index.
The value of shares will fluctuate so that, when redeemed, shares may be worth more or less than their original cost. The chart and table do not reflect the deduction of taxes that a shareholder would pay on fund distributions or the redemption of fund shares.
Performance information may reflect historical or current expense waivers/reimbursements from the investment adviser, without which performance would have been lower. For information on current expense waivers/reimbursements, please see the prospectus.
Investment objective — Seeks a total return that exceeds the rate of inflation over an economic cycle.
Average Annual Total Returns(2,3) (as of 4/30/08)
| | | | | | | | | | | | | | | | | |
| | | Inception | | 1 | | 5 | | Since |
| | | Date | | Year | | Year | | Inception |
| |
| Inflation Plus A# | | | 10/31/02 | | | | 11.69 | % | | | 5.52 | % | | | 5.97 | % |
| Inflation Plus A## | | | 10/31/02 | | | | 6.66 | % | | | 4.56 | % | | | 5.08 | % |
| Inflation Plus B# | | | 10/31/02 | | | | 10.79 | % | | | 4.77 | % | | | 5.22 | % |
| Inflation Plus B## | | | 10/31/02 | | | | 5.79 | % | | | 4.43 | % | | | 5.07 | % |
| Inflation Plus C# | | | 10/31/02 | | | | 10.79 | % | | | 4.75 | % | | | 5.20 | % |
| Inflation Plus C## | | | 10/31/02 | | | | 9.79 | % | | | 4.75 | % | | | 5.20 | % |
| Inflation Plus I# | | | 10/31/02 | | | | 12.04 | % | | | 5.65 | % | | | 6.08 | % |
| Inflation Plus I## | | | 10/31/02 | | | | 12.04 | % | | | 5.65 | % | | | 6.08 | % |
| Inflation Plus R3# | | | 11/28/03 | | | | 11.25 | % | | NA | | | 5.50 | % |
| Inflation Plus R3## | | | 11/28/03 | | | | 11.25 | % | | NA | | | 5.50 | % |
| Inflation Plus R4# | | | 11/28/03 | | | | 11.41 | % | | NA | | | 5.57 | % |
| Inflation Plus R4## | | | 11/28/03 | | | | 11.41 | % | | NA | | | 5.57 | % |
| Inflation Plus R5# | | | 11/28/03 | | | | 11.79 | % | | NA | | | 5.66 | % |
| Inflation Plus R5## | | | 11/28/03 | | | | 11.79 | % | | NA | | | 5.66 | % |
| Inflation Plus Y# | | | 11/28/03 | | | | 11.96 | % | | NA | | | 5.73 | % |
| | |
| # | | Without sales charge |
| |
| ## | | With sales charge |
| |
| NA | | Not Applicable |
PAST PERFORMANCE IS NOT INDICATIVE OF FUTURE RESULTS.
| (1) | | Growth of a $10,000 investment in Classes B, C, I, R3, R4, R5 and Y shares will vary from results seen above due to differences in the expenses charged to these share classes. |
| |
| (2) | | Class I shares commenced operations on 8/31/06. performance prior to 8/31/06 reflects Class A performance. Class R3, R4 and R5 shares commenced operations on 12/22/06. Performance prior to 12/22/06 reflects Class Y performance. |
| |
| (3) | | The initial investment in Class A shares reflects the maximum sales charge and Classes B and C reflect CDSC. |
| | | |
Portfolio Managers | | |
John Hendricks | | Timothy Willhide |
| Senior Vice President | | Senior Vice President |
How did the Fund perform?
The Class A shares of The Hartford Inflation Plus Fund returned 7.26%, before sales charge, for the six-month period ended April 30, 2008, versus its benchmark, the Lehman Brothers U.S. Treasury Inflation Protected Securities (“TIPS”) Index, which returned 6.88%, and the 6.10% average return of the Lipper Treasury Inflation Protected Securities peer group, a group of funds with investment strategies similar to those of the Fund.
Why did the Fund perform this way?
The Fund’s performance was driven by positive contributions from duration (a measure of interest-rate sensitivity) and yield curve positioning, as well as sector allocation versus the benchmark index. With regard to duration and yield curve positioning, our strategy focused on positioning the Fund for lower interest rates and a steeper yield curve (i.e. short and long term interest rates moving farther apart), which proved additive to performance as interest rates generally declined, particularly on the short end of the yield curve. The Fund also benefited from successful tactical allocations between TIPS and nominal Treasuries of various maturities. Market conditions during the period afforded many opportunities for relative value trading between these two asset classes. When flight-to-quality concerns predominated, nominal Treasuries tended to outperform TIPS. When inflation worries escalated as food and energy prices climbed, investors favored TIPS. Security selection within TIPS, however, detracted from relative (i.e. performance of the Fund as measured against the benchmark) performance.
53
What is the outlook?
The economy continues to face strong headwinds. Growth is likely to be weak until home prices stabilize and credit providers return to the business of lending rather than writing down assets. Despite the Federal Reserve’s (the “Fed”) sharp reductions in short-term interest rates, risk premiums (i.e. difference between the risk associated with buying or holding a Treasury and holding a high yield bond) remain high, which has kept borrowing costs high. However, there are encouraging signs. Lenders are moving to aggressively write down bad loans and the Fed has clearly signaled it stands ready to support the capital markets. Given that Fed policy actions have historically taken a few quarters to affect growth, the rate reductions of last year should begin to be felt in the near future, helping to restore order to the financial markets and setting the stage for recovery.
The Fed’s current monetary policy of emphasizing growth and liquidity is likely to allow inflation pressures to continue to build, creating an environment which should benefit TIPS. As a result, we expect TIPS to continue to perform well on a relative basis. Additionally, spreads in the credit markets appear more attractive than they have for some time and we expect the Fund to add positions in high quality issuers in the coming months.
Distribution by Credit Quality
as of April 30, 2008
| | | | | |
| | | Percentage of |
| | | Long-Term |
| Rating | | Holdings |
| |
| AAA | | | 97.8 | |
| BB | | | 2.0 | |
Total | | | 100.0 | % |
Diversification by Industry
as of April 30, 2008
| | | | | |
| | | Percentage of |
| Industry | | Net Assets |
| |
| Basic Materials | | | 0.1 | % |
| Consumer Cyclical | | | 0.3 | |
| Finance | | | 0.2 | |
| Health Care | | | 0.2 | |
| Services | | | 1.0 | |
| Technology | | | 0.1 | |
| U.S. Government Securities | | | 102.4 | |
| Utilities | | | 0.2 | |
| Short-Term Investments | | | 0.7 | |
| Other Assets and Liabilities | | | (5.2 | ) |
| | | | | |
Total | | | 100.0 | % |
| | | | | |
54
The Hartford International Growth Fund
(subadvised by Wellington Management Company, LLP)
Performance Overview(1) 4/30/01 — 4/30/08
Growth of a $10,000 investment in Class A which includes Sales Charge
MSCI EAFE Growth Index is a free float-adjusted market capitalization index that is designed to measure developed market equity performance (excluding the U.S. and Canada) of the growth securities within the MSCI EAFE Index.
You cannot invest directly in an index.
The value of shares will fluctuate so that, when redeemed, shares may be worth more or less than their original cost. The chart and table do not reflect the deduction of taxes that a shareholder would pay on fund distributions or the redemption of fund shares.
Performance information may reflect historical or current expense waivers/reimbursements from the investment adviser, without which performance would have been lower. For information on current expense waivers/reimbursements, please see the prospectus.
Investment objective — Seeks capital appreciation.
Average Annual Total Returns(2,3) (as of 4/30/08)
| | | | | | | | | | | | | | | | | |
| | | Inception | | 1 | | 5 | | Since |
| | | Date | | Year | | Year | | Inception |
| |
| International Growth A# | | | 4/30/01 | | | | 2.09 | % | | | 18.93 | % | | | 8.42 | % |
| International Growth A## | | | 4/30/01 | | | | -3.52 | % | | | 17.59 | % | | | 7.55 | % |
| International Growth B# | | | 4/30/01 | | | | 1.17 | % | | | 18.01 | % | | | 7.62 | % |
| International Growth B## | | | 4/30/01 | | | | -3.19 | % | | | 17.80 | % | | | 7.62 | % |
| International Growth C# | | | 4/30/01 | | | | 1.32 | % | | | 18.04 | % | | | 7.64 | % |
| International Growth C## | | | 4/30/01 | | | | 0.44 | % | | | 18.04 | % | | | 7.64 | % |
| International Growth I# | | | 4/30/01 | | | | 2.40 | % | | | 19.06 | % | | | 8.50 | % |
| International Growth I## | | | 4/30/01 | | | | 2.40 | % | | | 19.06 | % | | | 8.50 | % |
| International Growth R3# | | | 4/30/01 | | | | 1.71 | % | | | 19.17 | % | | | 8.73 | % |
| International Growth R3## | | | 4/30/01 | | | | 1.71 | % | | | 19.17 | % | | | 8.73 | % |
| International Growth R4# | | | 4/30/01 | | | | 2.04 | % | | | 19.28 | % | | | 8.80 | % |
| International Growth R4## | | | 4/30/01 | | | | 2.04 | % | | | 19.28 | % | | | 8.80 | % |
| International Growth R5# | | | 4/30/01 | | | | 2.46 | % | | | 19.39 | % | | | 8.87 | % |
| International Growth R5## | | | 4/30/01 | | | | 2.46 | % | | | 19.39 | % | | | 8.87 | % |
| International Growth Y# | | | 4/30/01 | | | | 2.52 | % | | | 19.44 | % | | | 8.90 | % |
| | |
| # | | Without sales charge ## With sales charge |
PAST PERFORMANCE IS NOT INDICATIVE OF FUTURE RESULTS.
| (1) | | Growth of a $10,000 investment in Classes B, C, I, R3, R4, R5 and Y shares will vary from results seen above due to differences in the expenses charged to these share classes. |
| |
| (2) | | Class I shares commenced operations on 8/31/06. Performance prior to 8/31/06 reflects Class A performance. Class R3, R4 and R5 shares commenced operations on 12/22/06. Performance prior to 12/22/06 reflects Class A performance. |
| |
| (3) | | The initial investment in Class A shares reflects the maximum sales charge and Classes B and C reflect CDSC. |
| | | | | |
Portfolio Managers | | | | |
Andrew S. Offit, CPA | | Jean-Marc Berteaux | | Matthew D. Hudson, CFA |
| Senior Vice President, Partner | | Senior Vice President, Partner | | Vice President |
How did the Fund perform?
The Class A shares of The Hartford International Growth Fund returned -17.11%, before sales charge, for the six-month period ended April 30, 2008, versus its benchmark, the MSCI EAFE Growth Index, which returned - -7.41%, and the -10.77% return of the average fund in the Lipper International Multi-Cap Growth Funds peer group, a group of funds with investment strategies similar to those of the Fund.
Why did the Fund perform this way?
Global equity markets fell during the period as investors shed risk amid turmoil in the bond and housing markets. Markets were volatile as investors remained concerned about higher energy and agricultural commodity prices and the potential impact of a U.S.-led economic recession on global economic growth. The MSCI EAFE Growth Index (-7.41%) outperformed the MSCI EAFE Value Index (-10.62%). Within the MSCI EAFE Growth Index, sector returns were negative for all but Energy and Materials. Consumer Discretionary, Information Technology, and Telecommunication Services fell the most during the period.
The Fund’s underperformance relative (i.e. performance of the Fund as measured against the benchmark) to the MSCI EAFE Growth Index during the period was a primarily a result of security selection. Positive stock selection in Materials and Telecommunication Services was more than offset by weaker stock selection in the Consumer Discretionary, Information Technology, and Consumer Staples sectors.
Arcandor and Daimler AG (both Consumer Discretionary) and easyJet (Industrials) were the leading relative detractors owned by the Fund. Shares of Germany’s largest department store chain Arcandor moved lower amid poor domestic consumer sentiment, continued asset sales, and disappointing earnings. The slowdown in the U.S. markets hurt sales for Berlin-based automaker Daimler AG, which reported a decline in first-quarter profits. Discount airline easyJet experienced weak performance due to higher fuel costs. We held all three stocks at the end of the period. U.K. food retailer Tesco and mobile phone provider Nokia were among other names that hurt absolute (i.e. total return) performance during the period. We eliminated Tesco but maintained a position in Nokia at the end of the period.
55
Top contributors to the Fund’s relative and absolute performance were Potash and K&S AG (both Materials), and Vestas Wind Systems (Industrials). Shares of K&S, a Germany-based chemical company and the European leader in potash products, and Potash, a Canadian-based fertilizer and feed products company, moved higher after reporting better-than-expected quarterly earnings and issuing optimistic earnings guidance for 2008. Both are benefiting from the global boom in agricultural products. Shares of Vestas, a global leader in the wind power industry, rose after the company posted solid earnings as it benefited from higher oil prices and increased demand for renewable energy. Canadian-based consumer electronic device company Research In Motion was a top contributor on an absolute basis. The company’s shares rose after the company announced that its net subscriber additions should be substantially higher than previous forecasts. We continued to hold all four securities at the end of the period.
What is the outlook?
We believe the U.S. slowdown will be a drag on global activity in 2008. The impact of tighter credit conditions and slowing U.S. imports will be felt unevenly throughout the world, but the emerging economies will remain economic growth leaders. We expect that aggressive Federal Reserve cuts and a weaker U.S. dollar will stimulate monetary policies abroad and should set the stage for improving global growth in 2009. At the end of the period, our stock-by-stock investment process resulted in greater-than-benchmark weights in Information Technology, Financials, and Telecommunication Services stocks. The Fund held less-than-benchmark weights in Materials, Consumer Staples, and Utilities names.
Diversification by Industry
as of April 30, 2008
| | | | | |
| | | Percentage of |
| Industry | | Net Assets |
| |
| Basic Materials | | | 13.6 | % |
| Capital Goods | | | 7.7 | |
| Consumer Cyclical | | | 16.8 | |
| Consumer Staples | | | 6.6 | |
| Energy | | | 1.7 | |
| Finance | | | 16.8 | |
| Health Care | | | 7.6 | |
| Services | | | 1.2 | |
| Technology | | | 20.7 | |
| Transportation | | | 2.1 | |
| Utilities | | | 2.3 | |
| Short-Term Investments | | | 11.8 | |
| Other Assets and Liabilities | | | (8.9 | ) |
| | | | | |
Total | | | 100.0 | % |
| | | | | |
Diversification by Country
as of April 30, 2008
| | | | | |
| | | Percentage of |
| Country | | Net Assets |
| |
| Australia | | | 1.9 | % |
| Belgium | | | 1.0 | |
| Brazil | | | 1.8 | |
| Canada | | | 6.6 | |
| China | | | 2.3 | |
| Denmark | | | 3.3 | |
| Egypt | | | 2.2 | |
| Finland | | | 4.1 | |
| France | | | 8.8 | |
| Germany | | | 11.3 | |
| Hong Kong | | | 1.9 | |
| Ireland | | | 2.5 | |
| Israel | | | 2.0 | |
| Japan | | | 12.7 | |
| Luxembourg | | | 0.5 | |
| Netherlands | | | 5.2 | |
| Norway | | | 1.7 | |
| Russia | | | 0.7 | |
| South Africa | | | 1.1 | |
| South Korea | | | 2.2 | |
| Spain | | | 1.0 | |
| Sweden | | | 0.4 | |
| Switzerland | | | 4.3 | |
| United Kingdom | | | 17.6 | |
| Short-Term Investments | | | 11.8 | |
| Other Assets and Liabilities | | | (8.9 | ) |
| | | | | |
Total | | | 100.0 | % |
| | | | | |
56
The Hartford International Opportunities Fund
(subadvised by Wellington Management Company, LLP)
Performance Overview(1) 4/30/98 — 4/30/08
Growth of a $10,000 investment in Class A which includes Sales Charge
MSCI AC (All Country) World Free ex U.S. Index is a broad based, unmanaged, market capitalization weighted, total return index that measures the performance of both developed and emerging stock markets, excluding the U.S.
You cannot invest directly in an index.
The value of shares will fluctuate so that, when redeemed, shares may be worth more or less than their original cost. The chart and table do not reflect the deduction of taxes that a shareholder would pay on fund distributions or the redemption of fund shares.
Investment objective – Seeks long-term growth of capital.
Average Annual Total Returns(2,3) (as of 4/30/08)
| | | | | | | | | | | | | | | | | | | | | |
| | | Inception | | 1 | | 5 | | 10 | | Since |
| | | Date | | Year | | Year | | Year | | Inception |
| |
| International Opp A# | | | 7/22/96 | | | | 11.94 | % | | | 21.23 | % | | | 6.77 | % | | | 7.78 | % |
| International Opp A## | | | 7/22/96 | | | | 5.78 | % | | | 19.87 | % | | | 6.17 | % | | | 7.27 | % |
| International Opp B# | | | 7/22/96 | | | | 11.15 | % | | | 20.36 | % | | NA | * | | NA | * |
| International Opp B## | | | 7/22/96 | | | | 6.49 | % | | | 20.17 | % | | NA | * | | NA | * |
| International Opp C# | | | 7/22/96 | | | | 11.19 | % | | | 20.32 | % | | | 5.97 | % | | | 6.99 | % |
| International Opp C## | | | 7/22/96 | | | | 10.26 | % | | | 20.32 | % | | | 5.97 | % | | | 6.99 | % |
| International Opp R3# | | | 7/22/96 | | | | 11.67 | % | | | 21.60 | % | | | 7.16 | % | | | 8.19 | % |
| International Opp R3## | | | 7/22/96 | | | | 11.67 | % | | | 21.60 | % | | | 7.16 | % | | | 8.19 | % |
| International Opp R4# | | | 7/22/96 | | | | 12.24 | % | | | 21.75 | % | | | 7.23 | % | | | 8.25 | % |
| International Opp R4## | | | 7/22/96 | | | | 12.24 | % | | | 21.75 | % | | | 7.23 | % | | | 8.25 | % |
| International Opp R5# | | | 7/22/96 | | | | 12.43 | % | | | 21.82 | % | | | 7.26 | % | | | 8.27 | % |
| International Opp R5## | | | 7/22/96 | | | | 12.43 | % | | | 21.82 | % | | | 7.26 | % | | | 8.27 | % |
| International Opp Y# | | | 7/22/96 | | | | 12.51 | % | | | 21.86 | % | | | 7.28 | % | | | 8.29 | % |
| | |
| # | | Without sales charge |
| |
| ## | | With sales charge |
| |
| NA | | Not Applicable |
| |
| * | | 10 year and inception returns are not applicable for Class B because after 8 years Class B converts to Class A. |
PAST PERFORMANCE IS NOT INDICATIVE OF FUTURE RESULTS.
| (1) | | Growth of a $10,000 investment in Classes B, C, R3, R4, R5 and Y shares will vary from results seen above due to differences in the expenses charged to these share classes. |
| |
| (2) | | Class C shares commenced operations on 7/31/98. Performance prior to 7/31/98 reflects Class B performance less Class C sales charges where applicable. Class R3, R4 and R5 shares commenced operations on 12/22/06. Performance prior to 12/22/06 reflects Class Y performance. |
| |
| (3) | | The initial investment in Class A shares reflects the maximum sales charge and Classes B and C reflect CDSC. |
Performance information may reflect historical or current expense waivers/reimbursements from the investment adviser, without which performance would have been lower. For information on current expense waivers/reimbursements, please see the prospectus.
Portfolio Manager
Nicolas M. Choumenkovitch
Senior Vice President, Partner
How did the Fund perform?
The Class A shares of The Hartford International Opportunities Fund returned -7.94%, before sales charge, for the six-month period ended April 30, 2008, versus its benchmark, the MSCI All Country World ex U.S. Index, which returned -9.14% for the same period, and the -10.61% return of the average fund in the Lipper International LargeCap Core Funds peer group, a group of funds with investment strategies similar to those of the Fund.
Why did the Fund perform this way?
Non-U.S. equity markets fell during the period amid ongoing turmoil in global credit markets and a weakening outlook for corporate earnings growth. Within this environment, every sector in the MSCI All Country World Free ex U.S. Index fell, led by Consumer Discretionary (-16%), Industrials (-14%), and Financials (-14%). Energy (-1%), Materials (-1%), and Consumer Staples (-3%) fell the least. From a regional
perspective, Asian (-14%) and Emerging Markets (-14%) securities lagged the most, while Latin American (+3%) stocks performed better.
The Fund’s outperformance was primarily due to security selection. Sector allocation, a result of bottom-up (i.e. stock by stock fundamental research) stock selection, was also additive due to our underweight (i.e. the Fund’s sector position was less than the benchmark position) position to Financials and overweight (i.e. the Fund’s sector position was greater than the benchmark position) to Consumer Staples. Top contributors to relative (i.e. performance of the Fund as measured against the benchmark) and absolute (i.e. total return) performance were all in the Materials sector and included Uralkali, Rio Tinto, and MMX Mineracao. Uralkali, a Russian company developing the world’s second-largest deposit of potash, saw its shares rise as global food shortages put upward pressure on food prices. Rio Tinto is a diversified international mining company with significant iron ore exposure. The company’s shares benefited as investor concern ebbed over funding considerations for the company’s Alcan acquisition. The company also received a takeout offer from Australian mining company BHP Billiton,
57
which it declined. MMX Mineracao is a Brazilian mining company that benefited from robust iron-ore pricing and demand and investor enthusiasm for the company’s high growth profile. Strong sales volumes during the period helped the company’s share price rise.
Top detractors from relative performance included Ryanair (Industrials), Nokia (Information Technology), and AerCap (Industrials). Ryanair, a low cost European airline company, saw its shares decline due to worries about an EU deceleration leading to slower future growth. Nokia, the world’s largest mobile phone maker, had been a strong performer coming into 2008. However, the company’s most recent earnings release disappointed investors, leading to a downdraft in the stock price. AerCap is an aircraft leasing company that was hurt by liquidity concerns stemming from global credit market issues, as well as concerns about the slowing of the U.S. economy. We eliminated the position in AerCap, but continued to hold Ryanair and Nokia at the end of the period. Japan Tobacco (Consumer Staples) was also a top detractor from absolute performance during the period.
What is the outlook?
Despite strong action from the U.S. Federal Reserve during the period, we expect a continued slowdown in the growth rate of world economies. Problems within U.S. financial markets are likely to continue to spread throughout the economy and take their toll on U.S. demand. We put little faith in the decoupling thesis, thus believing that U.S. weakness will spread to most global economies.
Sector weights are a fall out of our bottom-up stock selection process and at the end of the period, Health Care, Consumer Staples, and Industrials were our largest overweights and Financials, Consumer Discretionary, and Utilities were are largest underweights relative to the benchmark. In terms of regional allocation, we ended the period overweight Europe and underweight Japan and Asia.
Diversification by Industry
as of April 30, 2008
| | | | | |
| | | Percentage of |
| Industry | | Net Assets |
| |
| Basic Materials | | | 13.2 | % |
| Capital Goods | | | 1.6 | |
| Consumer Cyclical | | | 8.5 | |
| Consumer Staples | | | 8.4 | |
| Energy | | | 8.1 | |
| Finance | | | 22.4 | |
| Health Care | | | 8.3 | |
| Services | | | 2.1 | |
| Technology | | | 17.8 | |
| Transportation | | | 3.1 | |
| Utilities | | | 3.0 | |
| Short-Term Investments | | | 23.8 | |
| Other Assets and Liabilities | | | (20.3 | ) |
| | | | | |
Total | | | 100.0 | % |
| | | | | |
Diversification by Country
as of April 30, 2008
| | | | | |
| | | Percentage of |
| Country | | Net Assets |
| |
| Austria | | | 1.3 | % |
| Belgium | | | 0.3 | |
| Brazil | | | 5.1 | |
| Canada | | | 2.1 | |
| China | | | 4.9 | |
| Denmark | | | 1.0 | |
| Egypt | | | 1.5 | |
| Finland | | | 1.9 | |
| France | | | 10.3 | |
| Germany | | | 8.3 | |
| Hong Kong | | | 1.3 | |
| India | | | 1.0 | |
| Ireland | | | 1.6 | |
| Israel | | | 1.7 | |
| Japan | | | 8.7 | |
| Luxembourg | | | 2.0 | |
| Mexico | | | 0.5 | |
| Netherlands | | | 5.8 | |
| Norway | | | 2.9 | |
| Russia | | | 3.2 | |
| South Africa | | | 2.2 | |
| South Korea | | | 1.0 | |
| Spain | | | 2.5 | |
| Sweden | | | 1.1 | |
| Switzerland | | | 7.1 | |
| United Kingdom | | | 14.1 | |
| United States | | | 3.1 | |
| Short-Term Investments | | | 23.8 | |
| Other Assets and Liabilities | | | (20.3 | ) |
| | | | | |
Total | | | 100.0 | % |
| | | | | |
58
The Hartford International Small Company Fund
(subadvised by Wellington Management Company, LLP)
Performance Overview(1) 4/30/01 — 4/30/08
Growth of a $10,000 investment in Class A which includes Sales Charge
S&P/Citigroup Extended Market Euro-Pacific Index is a global equity index comprised of the smallest 20% of each country’s market capitalization in the Broad Market Index. All developed countries are included except the U.S. and Canada.
You cannot invest directly in an index.
The value of shares will fluctuate so that, when redeemed, shares may be worth more or less than their original cost. The chart and table do not reflect the deduction of taxes that a shareholder would pay on fund distributions or the redemption of fund shares.
Investment objective – Seeks capital appreciation.
Average Annual Total Returns(2) (as of 4/30/08)
| | | | | | | | | | | | | | | | | |
| | | Inception | | 1 | | 5 | | Since |
| | | Date | | Year | | Year | | Inception |
| |
| International Small Co A# | | | 4/30/01 | | | | -4.38 | % | | | 21.03 | % | | | 13.99 | % |
| International Small Co A## | | | 4/30/01 | | | | -9.64 | % | | | 19.67 | % | | | 13.07 | % |
| International Small Co B# | | | 4/30/01 | | | | -5.15 | % | | | 20.17 | % | | | 13.30 | % |
| International Small Co B## | | | 4/30/01 | | | | -9.31 | % | | | 19.98 | % | | | 13.30 | % |
| International Small Co C# | | | 4/30/01 | | | | -5.10 | % | | | 20.11 | % | | | 13.16 | % |
| International Small Co C## | | | 4/30/01 | | | | -5.93 | % | | | 20.11 | % | | | 13.16 | % |
| International Small Co I# | | | 4/30/01 | | | | -4.06 | % | | | 21.11 | % | | | 14.05 | % |
| International Small Co I## | | | 4/30/01 | | | | -4.06 | % | | | 21.11 | % | | | 14.05 | % |
| International Small Co Y# | | | 4/30/01 | | | | -3.92 | % | | | 21.53 | % | | | 14.49 | % |
| | |
| # | | Without sales charge |
| |
| ## | | With sales charge |
PAST PERFORMANCE IS NOT INDICATIVE OF FUTURE RESULTS.
| (1) | | Growth of a $10,000 investment in Classes B, C, I and Y shares will vary from results seen above due to differences in the expenses charged to these share classes. |
| |
| (2) | | The initial investment in Class A shares reflects the maximum sales charge and Classes B and C reflect CDSC. |
Performance information may reflect historical or current expense waivers/reimbursements from the investment adviser, without which performance would have been lower. For information on current expense waivers/reimbursements, please see the prospectus.
| | | |
Portfolio Managers | | |
Simon H. Thomas | | Daniel Maguire, CFA |
| Vice President | | Vice President |
How did the Fund perform?
The Class A shares of The Hartford International Small Company Fund returned -11.83%, before sales charge, for the six-month period ended April 30, 2008, versus its benchmark, the S&P/Citigroup Extended Market Euro-Pacific Index, which returned -13.47% for the same period, and the -14.13% return of the average fund in the Lipper International Small/Mid-Cap Core peer group, a group of funds with investment strategies similar to those of the Fund.
Why did the Fund perform this way?
Non-U.S. equity markets fell during the period amid ongoing turmoil in the credit markets and a weakening outlook for corporate earnings growth. Certain central banks acted aggressively to soften an economic slowdown, with the U.S. Federal Reserve lowering the federal funds rate and introducing multiple programs aimed at improving liquidity within financial markets. In response to increasing concerns over a shaky financial system and a likely U.S. recession, equity investors globally sought to shed risk. All but one sector in the S&P/Citigroup Extended Market Euro-Pacific Index fell during the period, led lower by Consumer Discretionary (-22%), Information Technology (-17%), and Financials (-15%). The only sector to advance was Utilities (+3%).
The Fund outperformed its benchmark during the period due to both stock selection and allocation among sectors, which is largely a result of the bottom-up (i.e. stock by stock fundamental research) stock selection process. In particular, the Fund benefited from an overweight (i.e. the Fund’s sector position was greater than the benchmark position) position in relatively strong Energy stocks and an underweight (i.e. the Fund’s sector position was less than the benchmark position) among lagging Consumer Discretionary stocks.
Stock selection was positive in seven of ten sectors, with particular strength in Energy, Financials, and Consumer Discretionary. Results were weaker in Industrials, Utilities, and Materials. Among the top contributors to relative (i.e. performance of the Fund as measured against the benchmark) and absolute (i.e. total return) returns were Lupatech, Petrofac, and Lundin Petroleum. Lupatech, a leading equipment supplier to the oil and gas industry in Latin America, benefited from strong energy demand. We expect recent acquisitions and growth in international markets to create positive earnings momentum. Petrofac, a U.K. oil and gas services provider with projects in Tunisia, the North Sea and Kazakhstan, benefited from continued high demand from its large oil company clients as high oil prices spur greater exploration and production activity. We sold our position into strength. Investors rewarded Sweden-based oil and gas company
59
Lundin Petroleum for receiving a long-awaited drilling permit in Russia, commencement of drilling operations in Sudan, and further progress at its Alvheim offshore drilling operations. In addition to Lundin’s favorable production outlook and reserve growth, we expect further momentum and profitability to be derived from the North Sea oil field Alvheim, once this resource comes on stream. Other top contributors included Chilean fertilizer and chemicals company Sociedad Quimica y Minera, Hong Kong watchmaker Peace Mark, and Japanese baby and pet care company Unicharm.
The largest detractors on a relative and absolute basis during the period were concentrated in the Industrials sector. Fears of a slowing European economy and higher jet fuel prices hurt the shares of U.K. discount airline easyJet. We added to our position on weakness. Korean shipbuilding and construction concern Hanjin Heavy Industries saw its shares fall on concerns that existing contracts would be canceled. We continue to hold our position. Seek, the leading online employment site in Australia and New Zealand, was impacted by concerns of slowing job growth in Australia. We eliminated our position but would look to buy back on weakness as the fundamental business model remains attractive.
What is the outlook?
We select stocks in the Fund one at a time based on their individual merits. At the end of the period, we were most overweight Health Care and Energy stocks and most underweight Financials and Utilities. In Health Care we have a focus on the high margin and recurring revenue potential of equipment & service companies. We also hold positions in several leading drug development and niche medical equipment companies. Our Energy overweight is based on the belief that the sector is well positioned to outperform due to compelling supply and demand fundamentals. Our holdings include conventional oil and gas as well as alternative fuel sources companies. We also see a favorable environment for energy services companies, which should benefit as rising oil demand is likely to support further exploration and development in addition to increased focus on improving utilization of existing resources.
Our underweight in the Financials sector is the result of eliminating stocks with particular exposure to the ongoing credit crunch. We expect further weakness in the sector as companies, even if not involved in the wholesale funding segment of the market, disclose the extent of their exposure to troubled credit-related areas of the market.
On a regional basis, our greatest regional underweight position at the end of the period was in Europe, mostly due to less-than-benchmark exposures to Germany, France, and Spain, as valuations are no longer compelling relative to the risk/reward profile of many companies in these regions. This was offset by overweight positions in Japan and select emerging markets.
Diversification by Industry
as of April 30, 2008
| | | | | |
| | | Percentage of |
| Industry | | Net Assets |
| |
| Basic Materials | | | 16.5 | % |
| Capital Goods | | | 4.4 | |
| Consumer Cyclical | | | 12.2 | |
| Consumer Staples | | | 2.5 | |
| Energy | | | 7.5 | |
| Finance | | | 9.7 | |
| Health Care | | | 15.8 | |
| Services | | | 9.6 | |
| Technology | | | 8.7 | |
| Transportation | | | 6.3 | |
| Utilities | | | 3.0 | |
| Short-Term Investments | | | 21.5 | |
| Other Assets and Liabilities | | | (17.7 | ) |
| | | | | |
Total | | | 100.0 | % |
| | | | | |
Diversification by Country
as of April 30, 2008
| | | | | |
| | | Percentage of |
| Country | | Net Assets |
| |
| Australia | | | 5.7 | % |
| Belgium | | | 0.6 | |
| Brazil | | | 2.8 | |
| Canada | | | 1.3 | |
| China | | | 3.4 | |
| Denmark | | | 0.6 | |
| Finland | | | 2.3 | |
| France | | | 6.2 | |
| Germany | | | 5.0 | |
| Hong Kong | | | 5.9 | |
| India | | | 0.6 | |
| Israel | | | 0.8 | |
| Italy | | | 5.4 | |
| Japan | | | 23.6 | |
| Liechtenstein | | | 0.8 | |
| Malaysia | | | 0.5 | |
| Netherlands | | | 2.7 | |
| Norway | | | 2.5 | |
| Papua New Guinea | | | 0.5 | |
| Singapore | | | 0.7 | |
| South Korea | | | 3.0 | |
| Spain | | | 1.1 | |
| Sweden | | | 3.1 | |
| Switzerland | | | 4.0 | |
| United Kingdom | | | 13.1 | |
| Short-Term Investments | | | 21.5 | |
| Other Assets and Liabilities | | | (17.7 | ) |
| | | | | |
Total | | | 100.0 | % |
| | | | | |
60
The Hartford LargeCap Growth Fund
(subadvised by Hartford Investment Management Company)
Performance Overview(1) 11/30/06 — 4/30/08
Growth of a $10,000 investment in Class A which includes Sales Charge
Russell 1000 Growth Index is an unmanaged index that measures the performance of those Russell 1000 Index companies with higher price-to-book ratios and higher forecasted growth values.
You cannot invest directly in an index.
Investment objective – Seeks long-term growth of capital.
Average Annual Total Returns(2) (as of 4/30/08)
| | | | | | | | | | | | | |
| | | Inception | | 1 | | Since |
| | | Date | | Year | | Inception |
| |
| LargeCap Growth A# | | | 11/30/06 | | | | -8.52 | % | | | -2.65 | % |
| LargeCap Growth A## | | | 11/30/06 | | | | -13.55 | % | | | -6.46 | % |
| LargeCap Growth B# | | | 11/30/06 | | | | -9.40 | % | | | -3.49 | % |
| LargeCap Growth B## | | | 11/30/06 | | | | -13.85 | % | | | -6.18 | % |
| LargeCap Growth C# | | | 11/30/06 | | | | -9.31 | % | | | -3.42 | % |
| LargeCap Growth C## | | | 11/30/06 | | | | -10.20 | % | | | -3.42 | % |
| LargeCap Growth Y# | | | 11/30/06 | | | | -8.31 | % | | | -2.34 | % |
| | |
| # | | Without sales charge |
| |
| ## | | With sales charge |
PAST PERFORMANCE IS NOT INDICATIVE OF FUTURE RESULTS.
| (1) | | Growth of a $10,000 investment in Classes B, C and Y shares will vary from results seen above due to differences in the expenses charged to these share classes. |
| |
| (2) | | The initial investment in Class A shares reflects the maximum sales charge and Classes B and C reflect CDSC. |
The value of shares will fluctuate so that, when redeemed, shares may be worth more or less than their original cost. The chart and table do not reflect the deduction of taxes that a shareholder would pay on fund distributions or the redemption of fund shares.
Performance information may reflect historical or current expense waivers/reimbursements from the investment adviser, without which performance would have been lower. For information on current expense waivers/reimbursements, please see the prospectus.
Portfolio Manager
Hugh Whelan
Managing Director
How did the Fund perform?
The Class A shares of The Hartford LargeCap Growth Fund returned -13.15%, before sales charge, for the six-month period ended April 30, 2008, versus its benchmark, the Russell 1000 Growth Index, which returned -9.28%, and the -10.01% average return of the Lipper Large-Cap Growth Funds category, a group of funds with investment strategies similar to those of the Fund.
Why did the Fund perform this way?
During the period, the Fund’s underperformance relative (i.e. performance of the Fund as measured against the benchmark) to the benchmark was driven by both weak security selection and weak sector allocation. Favorable security selection in the Materials and Consumer Discretionary sectors could not offset unfavorable security selection in the Energy and Healthcare sectors. With regard to sector allocation, the Fund’s underweight (i.e. the Fund’s sector position was less than the benchmark position) to Energy and Materials and overweight (i.e. the Fund’s sector position was greater than the benchmark position) to Financials detracted from performance.
Among the largest individual contributors to returns relative to the benchmark were housing developer NVR and MasterCard, both of which were overweighted. NVR’s stock was up 29% during the period, while most of its peers had negative performance. Despite the poor housing market, the company remains profitable, incurring minimal writedowns because of its lack of exposure to the weak housing markets of Florida, Nevada, and California. Additionally, the company employs a strategy that places future land development risk in the hands of third parties. MasterCard was up 47% during the period. The company’s earnings more than doubled, driven by higher spending volume both in the U.S. and overseas, particularly in emerging markets.
Among the largest detractors from returns relative to the benchmark were overweights in Humana and Western Refining. Despite an impressive fourth-quarter profit that beat Wall Street expectations, Humana shares fell when the company significantly reduced its earnings outlook. Additionally, Humana’s industry (managed care) suffered over fears of increased costs for all companies. Western Refining fell 72% during the period, as the company’s refining margins deteriorated significantly because of the high price of oil.
As of the end of the period, the Fund’s top holdings included Apple and Microsoft. Apple is a top holding because of its favorable investor sentiment exhibited by recent stock volume support and greater consensus among analysts about the company’s favorable outlook, and strong management behavior as exhibited by its efficient use of invested capital. Similarly, Microsoft is a top holding primarily due to a combination of strong management behavior represented by favorable efficient use of invested capital and favorable investor sentiment exhibited by recent stock volume support.
Our team invests in companies that we believe have compelling stock characteristics versus the Russell 1000 Growth Index. The team’s systematic approach weighs more than 70 fundamental characteristics across four broad categories, including business behavior, management
61
behavior, valuation and investor behavior. This analysis is used to build a broadly diversified portfolio of companies, with sector weightings determined largely by the attractiveness of specific stocks within the Fund’s investment universe.
What is the outlook?
The economy continues to face strong headwinds. Growth is likely to be weak until home prices stabilize and credit providers return to the business of lending rather than writing down assets. Despite the Federal Reserve’s (the “Fed”) sharp reductions in short-term interest rates, risk premiums (i.e. difference between the risk associated with buying or holding a Treasury and holding a high yield bond) remain high, which has kept borrowing costs high. However, there are encouraging signs. Lenders are moving to aggressively write down bad loans and the Fed has clearly signaled it stands ready to support the capital markets. Given that Fed policy actions have historically taken a few quarters to affect growth, the rate reductions of last year should begin to be felt in the near future, helping to restore order to the financial markets and setting the stage for recovery.
On an absolute basis, the environment for stocks looks challenging. Both earnings growth and price/earnings multiples show little sign of improving in the near term. Another trend we see impacting performance is the outperformance of growth stocks versus value stocks over the last twelve months. To the extent that this trend continues, the Fund’s focus on large-cap growth stocks will be helpful. Finally, a weak business environment has increased demand for productivity enhancing technologies. So far this year, the Information Technology sector has outperformed all other sectors except the high flying Energy sector. Information technology stocks represent roughly twenty percent of the stated investment universe for the Fund. A continuation of this trend would help propel performance.
On a relative basis, we see three key themes that could significantly impact performance relative to the Fund’s benchmark: volatility, credit spreads, and valuations. Volatility increased dramatically during the last 12 months, and we expect it to remain relatively high through 2008. While periods of dramatically increasing volatility tend to be difficult for our strategy, periods of sustained high volatility tend to benefit the stocks with consistent earnings power that our strategy favors. Periods of widening credit spreads, as has been the case recently, also favor quality stocks. We expect this trend to continue because spreads have not yet reached peak levels seen in the past. With regard to valuations, relative differences in valuations across the Fund’s investment universe have been tight by historical standards. This has made it difficult to make meaningful distinctions between attractively priced stocks and expensive stocks. As a result, for the last 12 months our reliance on valuation has proven a disappointing tool for determining future relative performance. While there are some indications that the dispersion in valuations is beginning to return to normal levels, a continuation of this lack of differentiation could be a headwind for the Fund.
Diversification by Industry
as of April 30, 2008
| | | | | |
| | | Percentage of |
| Industry | | Net Assets |
| |
| Basic Materials | | | 2.7 | % |
| Capital Goods | | | 7.3 | |
| Consumer Cyclical | | | 10.0 | |
| Consumer Staples | | | 6.0 | |
| Energy | | | 9.5 | |
| Finance | | | 7.7 | |
| Health Care | | | 17.1 | |
| Other Investment Pools and Funds | | | 0.7 | |
| Services | | | 7.3 | |
| Technology | | | 28.5 | |
| Transportation | | | 2.3 | |
| Utilities | | | 0.3 | |
| Short-Term Investments | | | 0.2 | |
| Other Assets and Liabilities | | | 0.4 | |
| | | | | |
Total | | | 100.0 | % |
| | | | | |
62
The Hartford MidCap Fund**
(subadvised by Wellington Management Company, LLP)
Performance Overview(1) 4/30/98 — 4/30/08
Growth of a $10,000 investment in Class A which includes Sales Charge
S&P MidCap 400 Index is an unmanaged index measuring the performance of the mid-size company segment of the U.S. market.
You cannot invest directly in an index.
The value of shares will fluctuate so that, when redeemed, shares may be worth more or less than their original cost. The chart and table do not reflect the deduction of taxes that a shareholder would pay on fund distributions or the redemption of fund shares.
Performance information may reflect historical or current expense waivers/reimbursements from the investment adviser, without which performance would have been lower. For information on current expense waivers/reimbursements, please see the prospectus.
Investment objective – Seeks long-term growth of capital.
Average Annual Total Returns(2,3) (as of 4/30/08)
| | | | | | | | | | | | | | | | | | | | | |
| | | Inception | | 1 | | 5 | | 10 | | Since |
| | | Date | | Year | | Year | | Year | | Inception |
| |
| MidCap A# | | | 12/31/97 | | | | 1.94 | % | | | 16.47 | % | | | 14.21 | % | | | 15.09 | % |
| MidCap A## | | | 12/31/97 | | | | -3.67 | % | | | 15.16 | % | | | 13.57 | % | | | 14.46 | % |
| MidCap B# | | | 12/31/97 | | | | 1.13 | % | | | 15.59 | % | | NA | * | | NA | * |
| MidCap B## | | | 12/31/97 | | | | -3.05 | % | | | 15.37 | % | | NA | * | | NA | * |
| MidCap C# | | | 12/31/97 | | | | 1.21 | % | | | 15.69 | % | | | 13.44 | % | | | 14.32 | % |
| MidCap C## | | | 12/31/97 | | | | 0.38 | % | | | 15.69 | % | | | 13.44 | % | | | 14.32 | % |
| MidCap Y# | | | 12/31/97 | | | | 2.38 | % | | | 17.03 | % | | | 14.75 | % | | | 15.63 | % |
| | |
| # | | Without sales charge |
| |
| ## | | With sales charge |
| |
| NA | | Not Applicable |
| |
| * | | 10 year and inception returns are not applicable for Class B because after 8 years Class B converts to Class A. |
| |
| ** | | As of August 16, 2004, the Fund no longer offers class A, B and C shares except as follows: The Fund will continue to offer and sell shares to investors who participate in wrap-fee or similar programs in connection with certain investment platforms. Currently, the wrap-fee programs that qualify are those with Strategic Advisers, Inc. (that are cleared through National Financial Services), The Raymond James Freedom Wrap Account and The A.G. Edwards Professional Fund Advisor (PFA) Wrap Account. |
| |
| | | The Fund will continue to offer and sell shares: (1) through ACH and other similar systematic investment facilities to investors who established plans to invest through such facilities prior to August 16, 2004, (2) for reinvestment of capital gains distributions and income dividends, and (3) to certain qualified retirement plans that include (or offered) the Fund as an investment option prior to August 16, 2004. |
| |
| | | The Fund continues to pay 12b-1 fees. These fees are paid for ongoing shareholder services, to compensate brokers for past sales to reimburse the Fund’s distributor for commissions paid in connection with past sales. |
PAST PERFORMANCE IS NOT INDICATIVE OF FUTURE RESULTS.
| (1) | | Growth of a $10,000 investment in Classes B, C and Y shares will vary from results seen above due to differences in the expenses charged to these share classes. |
| |
| (2) | | Class C shares commenced operations on 7/31/98. Performance prior to 7/31/98 reflects Class B performance less Class C sales charges where applicable. |
| |
| (3) | | The initial investment in Class A shares reflects the maximum sales charge and Classes B and C reflect CDSC. |
Portfolio Manager
Phillip H. Perelmuter
Senior Vice President, Partner
How did the Fund perform?
The Class A shares of The Hartford MidCap Fund returned -6.86%, before sales charge, for the six-month period ended April 30, 2008, versus its benchmark, the S&P MidCap 400 Index, which returned -6.95%, and the -9.05 % return of the average fund in the Lipper Mid-Cap Core Funds peer group, a group of funds with investment strategies similar to those of the Fund.
Why did the Fund perform this way?
Global equity markets fell in the final months of 2007 and the first quarter of 2008 amidst continued turmoil in U.S. bond and housing markets and the extended credit crunch that contributed to the near collapse of large investment bank Bear Stearns. In response to increasing concerns of a shaky financial system and a potential recession in the U.S., equity investors sought to shed risk. Mid cap stocks (-7%) outperformed small (-13%) and large cap stocks (-10%) during the period, as measured by the S&P MidCap 400 Index, Russell 2000 Index and S&P 500 Index, respectively. Growth stocks (-8%) slightly out-paced their value counterparts stocks (-9%) during the period, as measured by the Russell MidCap Growth Index and Russell MidCap Value Index. Within the S&P MidCap 400 Index, nine out of ten sectors posted negative returns. Telecommunication Services (-40%), Information Technology (-17%), and Consumer Discretionary
63
(-12%) were the biggest laggards. Energy (+20%) was the only sector with positive returns.
Security selection in Materials, Health Care, Information Technology and Telecommunication Services contributed to positive relative (i.e. performance of the Fund as measured against the benchmark) performance for the Fund. This more than offset weaker selection in the Consumer Discretionary, Financials, Industrials and Energy sectors. Sector allocations, driven by security selection, detracted from relative returns during the period, primarily due to overweight (i.e. the Fund’s sector position was greater than the benchmark position) positions in Health Care and Information Technology and an underweight (i.e. the Fund’s sector position was less than the benchmark position) to the strong-performing Energy sector.
Top contributors to returns on a relative basis included Respironics (Health Care), U.S. Steel (Materials), and Cleveland-Cliffs (Materials). We sold our shares of medical device and equipment company Respironics after it was acquired by Royal Philips Electronics NV. Steel maker U.S. Steel, with operations in the U.S., Canada, and Central Europe, benefited from rising global demand, which pushed prices and margins higher. Shares of iron ore pellet producer Cleveland-Cliffs benefited from tight fundamentals in global iron ore markets due to strong worldwide demand for steel. Other top contributors to absolute (i.e. total return) performance were drug developer Millennium Pharmaceuticals (Health Care) and natural gas and exploration company Southwestern Energy (Energy). We continued to hold Cleveland-Cliffs, Millennium Pharmaceuticals, and Southwestern Energy at the end of the period.
Top detractors from absolute and relative performance included SanDisk (Information Technology), and Cadence Design Systems (Information Technology). We eliminated our position in flash data storage card products firm SanDisk after a disappointing lineup of new product introductions reduced our outlook for the firm. Shares of electronic design automation software and hardware company Cadence Design Systems fell as changes in the software license model announced in October caused uncertainty for investors. Active wear manufacturer Gildan Activewear (Consumer Discretionary) and bank holding company UCBH Holdings (Financials) were also among the top detractors from absolute and relative performance. We continued to hold Gildan Activewear and Cadence Design Systems at the end of the period.
What is the outlook?
Our efforts are focused on picking stocks based on a bottom-up (i.e. stock by stock fundamental research) review of their fundamentals. As a result of these individual stock decisions, we ended the period with our most significant overweight positions in the Health Care and Information Technology sectors. Within Information Technology, exposure favors Software & Services companies. At the end of the period, the Fund’s largest underweight remained Financials. The Fund also ended the period underweight the Utilities and Consumer Discretionary sectors.
Diversification by Industry
as of April 30, 2008
| | | | | |
| | | Percentage of |
| Industry | | Net Assets |
| |
| Basic Materials | | | 9.3 | % |
| Capital Goods | | | 2.8 | |
| Consumer Cyclical | | | 11.2 | |
| Consumer Staples | | | 1.9 | |
| Energy | | | 10.4 | |
| Finance | | | 10.7 | |
| Health Care | | | 16.1 | |
| Services | | | 13.3 | |
| Technology | | | 15.3 | |
| Transportation | | | 3.5 | |
| Utilities | | | 2.2 | |
| Short-Term Investments | | | 31.2 | |
| Other Assets and Liabilities | | | (27.9 | ) |
| | | | | |
Total | | | 100.0 | % |
| | | | | |
64
The Hartford MidCap Growth Fund
(formerly The Hartford Select MidCap Growth Fund)
(subadvised by Hartford Investment Management Company)
Performance Overview(1) 1/01/05 — 4/30/08
Growth of a $10,000 investment in Class A which includes Sales Charge
Russell MidCap Growth Index measures the performance of those Russell MidCap companies with higher price-to-book ratios and higher forecasted growth values. The stocks are members of the Russell 1000 Growth Index.
You cannot invest directly in an index.
Investment objective – Seeks long-term capital appreciation.
Average Annual Total Returns(2) (as of 4/30/08)
| | | | | | | | | | |
| | | Inception | | 1 | | Since |
| | | Date | | Year | | Inception |
| MidCap Growth A# | | 1/01/05 | | -7.97 | % | | | 4.88 | % |
| MidCap Growth A## | | 1/01/05 | | -13.03 | % | | | 3.11 | % |
| MidCap Growth B# | | 1/01/05 | | -8.45 | % | | | 4.24 | % |
| MidCap Growth B## | | 1/01/05 | | -12.42 | % | | | 3.46 | % |
| MidCap Growth C# | | 1/01/05 | | -8.66 | % | | | 4.09 | % |
| MidCap Growth C## | | 1/01/05 | | -9.45 | % | | | 4.09 | % |
| MidCap Growth Y# | | 1/01/05 | | -7.65 | % | | | 5.27 | % |
| | |
| # | | Without sales charge |
| |
| ## | | With sales charge |
PAST PERFORMANCE IS NOT INDICATIVE OF FUTURE RESULTS.
| (1) | | Growth of a $10,000 investment in Classes B, C and Y shares will vary from results seen above due to differences in the expenses charged to these share classes. |
| |
| (2) | | The initial investment in Class A shares reflects the maximum sales charge and Classes B and C reflect CDSC. |
The value of shares will fluctuate so that, when redeemed, shares may be worth more or less than their original cost. The chart and table do not reflect the deduction of taxes that a shareholder would pay on fund distributions or the redemption of fund shares.
Performance information may reflect historical or current expense waivers/reimbursements from the investment adviser, without which performance would have been lower. For information on current expense waivers/reimbursements, please see the prospectus.
Portfolio Manager
Hugh Whelan
Managing Director
How did the Fund perform?
The Class A shares of The Hartford MidCap Growth Fund returned -12.09%, before sales charge, for the six-month period ended April 30, 2008, versus -8.44% for its benchmark, the Russell MidCap Growth Index, and the -10.92% average return of the Lipper Mid-Cap Growth Funds category, a group of funds with investment strategies similar to those of the Fund.
Why did the Fund perform this way?
During the period, the Fund’s underperformance relative (i.e. performance of the Fund as measured against the benchmark) to the benchmark was primarily due to adverse security selection in the Energy, Financials, and Health Care sectors. However, this was partially offset by strong security selection in the Information Technology and Industrials sectors and an overweight (i.e. the Fund’s sector position was greater than the benchmark position) in the Materials and Energy sectors.
Among the largest individual contributors to relative returns were MasterCard, whose third-quarter profit topped analyst estimates, and W&T Offshore, an oil and gas producer whose fourth-quarter earnings also exceeded analyst expectations. The primary detractors from relative performance included a large overweight position in Tesoro, a petroleum refining company that posted an unexpectedly large quarterly loss, and Crocs, whose share price fell after the company warned of impending losses.
As of the end of the period, the Fund’s top holdings included overweight positions in Chemtura, a global chemical manufacturer, and Telephone & Data Systems, a diversified telecommunications company. Both Chemtura and Telephone & Data Systems are top holdings due to their attractive valuations.
Our team invests in companies that we believe have compelling stock characteristics relative to the Russell MidCap Growth Index. The team’s systematic approach weighs 30 fundamental characteristics across four broad categories, including business behavior, management behavior, valuation and investor behavior. This analysis is used to build a broadly diversified portfolio of companies, with sector weightings determined largely by the attractiveness of specific stocks within the Fund’s investment universe. Overall, the Fund tends to invest in financially efficient companies with attractive valuations and higher margins..
What is the outlook?
The economy continues to face strong headwinds. Growth is likely to be weak until home prices stabilize and credit providers return to the business of lending rather than writing down assets. Despite the Federal Reserve’s (the “Fed”) sharp reductions in short-term interest rates, risk premiums (i.e. difference between the risk associated with buying or holding a Treasury and holding a high yield bond) remain high, which has kept borrowing costs high. However, there are encouraging signs. Lenders are moving to aggressively write down bad loans and the Fed has clearly signaled it stands ready to support the capital markets. Given that Fed policy actions have historically taken a few quarters to affect growth, the rate reductions of last year should begin to be felt in the
65
near future, helping to restore order to the financial markets and setting the stage for recovery.
On an absolute basis, the environment for stocks looks challenging. Both earnings growth and price/earnings multiples show little sign of improving in the near term. Another trend we see impacting performance is the outperformance of growth stocks versus value stocks over the last twelve months. To the extent that this trend continues, the fund’s focus on mid-cap growth stocks will be helpful. Finally, consumer discretionary stocks represent roughly twenty percent of the stated investment universe for the fund. This sector has experienced severe underperformance recently because of the weakening economy and associated concerns that the consumer cannot keep spending. Any sort of “relief” rally in this sector would be an additional boost.
On a relative basis, we see three key themes that could significantly impact performance relative to the Fund’s benchmark: volatility, credit spreads, and valuations. Volatility increased dramatically during the last 12 months, and we expect it to remain relatively high through 2008. While periods of dramatically increasing volatility tend to be difficult for our strategy, periods of sustained high volatility tend to benefit the stocks with consistent earnings power that our strategy favors. Periods of widening credit spreads, as has been the case recently, also favor quality stocks. We expect this trend to continue because spreads have not yet reached peak levels seen in the past. With regard to valuations, relative differences in valuations across the Fund’s investment universe have been tight by historical standards. This has made it difficult to make meaningful distinctions between attractively priced stocks and expensive stocks. As a result, for the last 12 months our reliance on valuation has proven a disappointing tool for determining future relative performance. While there are some indications that the dispersion in valuations is beginning to return to normal levels, a continuation of this lack of differentiation could be a headwind for the Fund.
Diversification by Industry
as of April 30, 2008
| | | | | |
| | | Percentage of |
| Industry | | Net Assets |
| |
| Basic Materials | | | 9.3 | % |
| Capital Goods | | | 6.0 | |
| Consumer Cyclical | | | 12.7 | |
| Consumer Staples | | | 2.4 | |
| Energy | | | 9.6 | |
| Finance | | | 13.9 | |
| Health Care | | | 7.7 | |
| Other Investment Pools and Funds | | | 0.3 | |
| Services | | | 9.9 | |
| Technology | | | 23.5 | |
| Transportation | | | 1.6 | |
| Utilities | | | 2.6 | |
| Short-Term Investments | | | 28.4 | |
| Other Assets and Liabilities | | | (27.9 | ) |
| | | | | |
Total | | | 100.0 | % |
| | | | | |
66
The Hartford MidCap Value Fund*
(subadvised by Wellington Management Company, LLP)
Performance Overview(1) 4/30/01 — 4/30/08
Growth of a $10,000 investment in Class A which includes Sales Charge
Russell 2500 Value Index measures the performance of those Russell 2500 Index companies with lower price-to-book ratios and lower forecasted growth values. You cannot invest directly in an index.
The value of shares will fluctuate so that, when redeemed, shares may be worth more or less than their original cost. The chart and table do not reflect the deduction of taxes that a shareholder would pay on fund distributions or the redemption of fund shares.
Performance information may reflect historical or current expense waivers/reimbursements from the investment adviser, without which performance would have been lower. For information on current expense waivers/reimbursements, please see the prospectus.
Investment objective – Seeks long-term capital appreciation.
Average Annual Total Returns(2) (as of 4/30/08)
| | | | | | | | | | | | | | | | | |
| | | Inception | | 1 | | 5 | | Since |
| | | Date | | Year | | Year | | Inception |
| |
| MidCap Value A# | | | 4/30/01 | | | | -17.08 | % | | | 13.38 | % | | | 7.62 | % |
| MidCap Value A## | | | 4/30/01 | | | | -21.64 | % | | | 12.11 | % | | | 6.75 | % |
| MidCap Value B# | | | 4/30/01 | | | | -17.67 | % | | | 12.57 | % | | | 6.86 | % |
| MidCap Value B## | | | 4/30/01 | | | | -21.00 | % | | | 12.32 | % | | | 6.86 | % |
| MidCap Value C# | | | 4/30/01 | | | | -17.74 | % | | | 12.56 | % | | | 6.85 | % |
| MidCap Value C## | | | 4/30/01 | | | | -18.41 | % | | | 12.56 | % | | | 6.85 | % |
| MidCap Value Y# | | | 4/30/01 | | | | -16.77 | % | | | 13.92 | % | | | 8.12 | % |
| | |
| # | | Without sales charge |
| |
| ## | | With sales charge |
| |
| * | | As of August 16, 2004, the Fund no longer offers Class A, B and C shares except as follows: The Fund will continue to offer and sell shares: (1) through ACH and other similar systematic investors who established plans to invest through such facilities prior to August 16, 2004 and (2) for reinvestment of capital gains distributions and income dividends. |
| |
| | | The Fund continues to pay 12b-1 fees. These fees are paid for ongoing shareholder services, to compensate brokers for past sales to reimburse the Fund’s distributor for commissions paid in connection with past sales. |
PAST PERFORMANCE IS NOT INDICATIVE OF FUTURE RESULTS.
| (1) | | Growth of a $10,000 investment in Classes B, C and Y shares will vary from results seen above due to differences in the expenses charged to these share classes. |
| |
| (2) | | The initial investment in Class A shares reflects the maximum sales charge and Classes B and C reflect CDSC. |
Portfolio Manager
James N. Mordy
Senior Vice President, Partner
How did the Fund perform?
The Class A shares of The Hartford MidCap Value Fund returned -17.70%, before sales charge, for the six-month period ended April 30, 2008, versus its benchmark, the Russell 2500 Value Index, which returned -10.32% for the same period, and the -9.75% return of the average fund in the Lipper Mid-Cap Value Fund peer group, a group of funds with investment strategies similar to those of the Fund.
Why did the Fund perform this way?
For much of the period, the U.S. equity markets reacted negatively due to continued disruptions in the credit markets. As the U.S. economy continued to slide into recession, investors abruptly lost their appetite for risk and companies with balance sheet leverage or uncertain financing needs saw significant erosion in their equity market value. The worries climaxed in March with the near collapse of a major investment bank and several bond insurers. However, the equity markets experienced a sharp rebound in April as the Federal Reserve (the “Fed”) acted aggressively to soften the economic slowdown and increase liquidity in the financial markets.
During the period, mid cap stocks outperformed small cap and large cap stocks, as measured by the S&P MidCap 400 Index (-7.0%), Russell 2000 Index (-12.9%) and S&P 500 Index (-9.6%), respectively. Value stocks slightly underperformed growth stocks, as measured by the Russell 1000 Value Index (-9.8%) and Russell 1000 Growth Index (-9.3%). Within the benchmark, Energy was the only sector that posted positive returns while Telecommunication Services, Information Technology and Consumer Discretionary all lagged significantly.
The Fund’s underperformance was primarily driven by weak stock selection across seven of the ten broad economic sectors. Stock selection was weakest within Financials, Consumer Discretionary, Energy and Industrials. Overall sector allocation contributed positively to relative (i.e. performance of the Fund as measured against the benchmark) performance, particularly our overweight (i.e. the Fund’s sector position was greater than the benchmark position) positions in Energy and Materials.
The largest detractors from performance included R.H. Donnelley (Consumer Discretionary) and Financials stocks Ambac and Thornburg
67
Mortgage. U.S. yellow pages and online search company R.H. Donnelley’s shares lost over 80% of their value during the period, as investors worried about the negative impact of softer advertising sales during a recession on earnings and cash flow, given the company’s financial leverage. Shares of insurer Ambac fell due to concerns regarding losses from the company’s financial guarantee contracts as well as a dilutive stock offering in the fourth quarter. Thornburg Mortgage, a residential mortgage lender, got caught in a liquidity squeeze as credit markets seized up, forcing the sale of its high quality mortgage portfolio at deep losses and necessitating an extremely dilutive capital raise. We eliminated R.H. Donnelly and Ambac but held Thornburg at the end of the period.
Among the top contributors to performance were Materials stocks Cleveland-Cliffs and Owens-Illinois and Energy stock Arch Coal. Iron ore pellet producer Cleveland-Cliffs shares benefited from tight fundamentals in global iron ore markets due to strong worldwide demand for steel. Owens-Illinois, one of the world’s leading manufacturers of glass and plastic packaging containers saw its shares advance as the tightness in glass supply became more evident, particularly in Europe. U.S. coal producer Arch Coal’s shares benefited from a favorable pricing environment for coal. We held our positions in these stocks at the end of the period.
What is the outlook?
While official GDP statistics have yet to confirm the U.S. recession, we believe that is largely academic, as personal consumption and wage growth metrics have declined to levels consistent with previous economic contractions. Credit availability remains drastically curtailed, inflation and unemployment are rising, U.S. consumer confidence is badly shaken, U.S. housing prices have further to fall and the European economy appears poised for a slowdown. While continued growth in the emerging markets will cushion the blow, we do not envision a quick or vigorous recovery. The Fed has made it clear they will do whatever it takes to combat the credit crunch in the U.S., but the fact remains that it will take some time to work excessive leverage out of the system. The upcoming political election adds another layer of uncertainty in the U.S.
Investors seem eager to find a bottom in the equity markets and rotate to early cycle sectors like Financials and Consumer Discretionary. While we have found some value opportunities we like in these areas, we remain somewhat cautious as earnings expectations have generally not yet come down to realistic levels, and the optimism created by the Fed response could prove short-lived.
We are gradually increasing our Financials holdings, as we have uncovered some companies that are less dependent on the asset-backed credit markets or the economic cycle and therefore have more reliable earnings prospects. In the Consumer Discretionary sector, we have generally tried to upgrade the quality of our holdings and have cut loose a few losers. At the end of the period, we remained overweight in Health Care and Information Technology, where we think valuations have been excessively discounted.
Diversification by Industry
as of April 30, 2008
| | | | | |
| | | Percentage of |
| Industry | | Net Assets |
| |
| Basic Materials | | | 16.1 | % |
| Capital Goods | | | 8.1 | |
| Consumer Cyclical | | | 9.0 | |
| Consumer Staples | | | 6.6 | |
| Energy | | | 6.3 | |
| Finance | | | 17.4 | |
| Health Care | | | 8.8 | |
| Services | | | 4.5 | |
| Technology | | | 12.9 | |
| Transportation | | | 3.8 | |
| Utilities | | | 5.3 | |
| Short-Term Investments | | | 28.8 | |
| Other Assets and Liabilities | | | (27.6 | ) |
| | | | | |
Total | | | 100.0 | % |
| | | | | |
68
The Hartford Retirement Income Fund
(subadvised by Hartford Investment Management Company)
Performance Overview(1) 9/30/05 — 4/30/08
Growth of a $10,000 investment in Class A which includes Sales Charge
Lehman Brothers U.S. Aggregate Bond Index is an unmanaged index and is composed of securities from the Lehman Brothers Government/Credit Bond Index, Mortgage-Backed Securities Index, Asset-Backed Index and Commercial Mortgage-Backed Securities Index.
S&P 500 Index is a market capitalization weighted price index composed of 500 widely held common stocks.
You cannot invest directly in an index.
Investment objective – Seeks current income and secondarily, capital preservation.
Average Annual Total Returns(2,3) (as of 4/30/08)
| | | | | | | | | | | |
| | | Inception | | 1 | | Since |
| | | Date | | Year | | Inception |
| |
| Retirement Income A# | | 9/30/05 | | | 2.18 | % | | | 4.17 | % |
| Retirement Income A## | | 9/30/05 | | -3.44 | % | | | 1.91 | % |
| Retirement Income B# | | 9/30/05 | | | 1.42 | % | | | 3.41 | % |
| Retirement Income B## | | 9/30/05 | | -3.41 | % | | | 2.36 | % |
| Retirement Income C# | | 9/30/05 | | | 1.47 | % | | | 3.47 | % |
| Retirement Income C## | | 9/30/05 | | | 0.50 | % | | | 3.47 | % |
| Retirement Income R3# | | 9/30/05 | | | 1.70 | % | | | 4.10 | % |
| Retirement Income R3## | | 9/30/05 | | | 1.70 | % | | | 4.10 | % |
| Retirement Income R4# | | 9/30/05 | | | 2.11 | % | | | 4.29 | % |
| Retirement Income R4## | | 9/30/05 | | | 2.11 | % | | | 4.29 | % |
| Retirement Income R5# | | 9/30/05 | | | 2.50 | % | | | 4.49 | % |
| Retirement Income R5## | | 9/30/05 | | | 2.50 | % | | | 4.49 | % |
| Retirement Income Y# | | 9/30/05 | | | 2.50 | % | | | 4.51 | % |
| | |
| # | | Without sales charge |
| |
| ## | | With sales charge |
PAST PERFORMANCE IS NOT INDICATIVE OF FUTURE RESULTS.
| (1) | | Growth of a $10,000 investment in Classes B, C, R3, R4, R5 and Y shares will vary from results seen above due to differences in the expenses charged to these share classes. |
| |
| (2) | | Class R3, R4 and R5 shares commenced operations on 12/22/06. Performance prior to 12/22/06 reflects Class Y performance. |
| |
| (3) | | The initial investment in Class A shares reflects the maximum sales charge and Classes B and C reflect CDSC. |
The value of shares will fluctuate so that, when redeemed, shares may be worth more or less than their original cost. The chart and table do not reflect the deduction of taxes that a shareholder would pay on fund distributions or the redemption of fund shares.
Performance information may reflect historical or current expense waivers/reimbursements from the investment adviser, without which performance would have been lower. For information on current expense waivers/reimbursements, please see the prospectus.
| | | |
Portfolio Managers | | |
Hugh Whelan | | Edward C. Caputo |
| Managing Director | | Assistant Vice President |
How did the Fund perform?
The Class A shares of The Hartford Retirement Income Fund returned -1.66%, before sales charge, for the six-month period ended April 30, 2008, versus -2.29% for the Lipper Mixed-Asset Target Allocation Conservative Funds average, 4.08% for the Lehman Brothers U.S. Aggregate Bond Index, and -9.63% for the S&P 500 Index.
Why did the Fund perform this way?
The six-month period under review was challenging for both stocks and bonds, as credit and liquidity remained constrained, volatility was high, and concerns about a potential recession emerged. Although the Federal Reserve (the “Fed”) took considerable steps to help bolster the markets, including reducing the target federal funds rate on several occasions, establishing lending facilities that provided a back stop to both banks and brokers, and facilitating JPMorgan Chase’s rescue acquisition of Bear Stearns, investor confidence continued to erode. As a result, investors fled to the relative safety of Treasury securities, fueling their outperformance of all other sectors of the market for the overall period.
Within the fixed income market, the asset-backed securities segment was the worst performing sector and overall, high-yield asset classes such as U.S. high yield bonds, floating-rate notes, and emerging market bonds underperformed higher quality securities. Within domestic equities, mid-cap stocks outperformed large-cap and small-cap stocks. With regard to style, growth outperformed value within large-cap and mid-cap stocks but underperformed within small-cap stocks. Overall, international stocks slightly outperformed domestic stocks.
Over the course of the period, asset allocation decisions within equities detracted from the Fund’s performance. Specifically, allocations to small-cap growth, large-cap value, and international small-cap stocks held back returns. However, the negative impact was partially offset by the favorable performance of allocations to mid-cap and large-cap growth and international large-cap stocks. Asset allocation within the fixed income portion of the Fund also detracted from performance. Although allocations to Treasury Inflation Protected Securities (TIPS) and short-term bonds were additive to performance, they did not offset the unfavorable performance of allocations to floating-rate notes, high
69
yield bonds, and emerging market debt. Additionally, the duration of the Fund’s fixed income segment (a measure of interest-rate sensitivity) was targeted to be less than that of the broad fixed income market, as measured by the Lehman Brothers U.S. Aggregate Bond Index. This shorter duration also hindered performance as interest rates declined during the period.
The Fund’s performance is influenced not just by our asset allocation decisions, but also by the performance of the underlying funds in which it invests. For the overall period, the Fund benefited from fund selection decisions in both fixed income and equities. In keeping with the Fund’s long-term approach, we use cash flows to reallocate among the underlying funds whenever possible. No hard rebalance (i.e. a fund rebalancing to move the underlying fund investments to their target allocation percentages) was executed during the period.
What is the outlook?
The economy continues to face strong headwinds. Growth is likely to be weak until home prices stabilize and credit providers return to the business of lending rather than writing down assets. Despite the Fed’s sharp reductions in short-term interest rates, risk premiums (i.e. difference between the risk associated with buying or holding a Treasury and holding a high yield bond) remain high, which has kept borrowing costs high. However, there are encouraging signs. Lenders are moving to aggressively write down bad loans and the Fed has clearly signaled it stands ready to support the capital markets. Given that Fed policy actions have historically taken a few quarters to affect growth, the rate reductions of last year should begin to be felt in the near future, helping to restore order to the financial markets and setting the stage for recovery.
Composition by Underlying Fund
as of April 30, 2008
| | | | | |
| | | Percentage of |
| Fund Name | | Net Assets |
| |
| The Hartford Capital Appreciation Fund, Class Y | | | 6.8 | % |
| The Hartford Disciplined Equity Fund, Class Y | | | 3.3 | |
| The Hartford Equity Income Fund, Class Y | | | 2.2 | |
| The Hartford Floating Rate Fund, Class Y | | | 5.5 | |
| The Hartford Global Growth Fund, Class Y | | | 1.4 | |
| The Hartford Growth Fund, Class Y | | | 1.0 | |
| The Hartford High Yield Fund, Class Y | | | 3.5 | |
| The Hartford Income Fund, Class Y | | | 9.8 | |
| The Hartford Inflation Plus Fund, Class Y | | | 12.6 | |
| The Hartford International Opportunities Fund, Class Y | | | 3.3 | |
| The Hartford International Small Company Fund, Class Y | | | 2.4 | |
| The Hartford Money Market Fund, Class Y | | | 1.4 | |
| The Hartford Select MidCap Value Fund, Class Y | | | 0.6 | |
| The Hartford Select SmallCap Value Fund, Class Y | | | 0.5 | |
| The Hartford Short Duration Fund, Class Y | | | 18.9 | |
| The Hartford Stock Fund, Class Y | | | 0.6 | |
| The Hartford Strategic Income Fund, Class Y | | | 7.3 | |
| The Hartford Total Return Bond Fund, Class Y | | | 10.5 | |
| The Hartford Value Fund, Class Y | | | 6.9 | |
| The Hartford Value Opportunities Fund, Class Y | | | 0.5 | |
| Other Assets and Liabilities | | | 1.0 | |
| | | | | |
Total | | | 100.0 | % |
| | | | | |
70
The Hartford Select MidCap Value Fund
(subadvised by: Hartford Investment Management Company)
Performance Overview(1) 4/29/05 — 4/30/08
Growth of a $10,000 investment in Class A which includes Sales Charge
Russell MidCap Value Index measures the performance of those Russell Midcap companies with lower price-to-book ratios and lower forecasted growth rate. These stocks are also members of the Russell 1000 Value Index.
You cannot invest directly in an index.
Investment objective – Seeks long-term capital appreciation.
Average Annual Total Returns(2) (as of 4/30/08)
| | | | | | | | | |
| | | Inception | | 1 | | Since |
| | | Date | | Year | | Inception |
| |
| Select MidCap Value A# | | 4/29/05 | | -19.89% | | | 4.55 | % |
| Select MidCap Value A## | | 4/29/05 | | -24.30% | | | 2.60 | % |
| Select MidCap Value B# | | 4/29/05 | | -20.36% | | | 3.85 | % |
| Select MidCap Value B## | | 4/29/05 | | -23.91% | | | 2.97 | % |
| Select MidCap Value C# | | 4/29/05 | | -20.52% | | | 3.78 | % |
| Select MidCap Value C## | | 4/29/05 | | -21.23% | | | 3.78 | % |
| Select MidCap Value Y# | | 4/29/05 | | -19.57% | | | 4.88 | % |
| | |
| # | | Without sales charge |
| |
| ## | | With sales charge |
PAST PERFORMANCE IS NOT INDICATIVE OF FUTURE RESULTS.
| (1) | | Growth of a $10,000 investment in Classes B, C and Y shares will vary from results seen above due to differences in the expenses charged to these share classes. |
| |
| (2) | | The initial investment in Class A shares reflects the maximum sales charge and Classes B and C reflect CDSC. |
The value of shares will fluctuate so that, when redeemed, shares may be worth more or less than their original cost. The chart and table do not reflect the deduction of taxes that a shareholder would pay on fund distributions or the redemption of fund shares.
Performance information may reflect historical or current expense waivers/reimbursements from the investment adviser, without which performance would have been lower. For information on current expense waivers/reimbursements, please see the prospectus.
Portfolio Manager
Hugh Whelan
Managing Director
How did the Fund perform?
The Class A shares of The Hartford Select MidCap Value Fund returned -11.86%, before sales charge, for the six-month period ended April 30, 2008, versus -9.20% for its benchmark, the Russell MidCap Value Index, and the - -9.75% average return of the Lipper Mid-Cap Value Funds category, a group of funds with investment strategies similar to those of the Fund.
Why did the Fund perform this way?
The portfolio’s underperformance relative to the benchmark for the period was primarily due to poor security selection in the Financial sector. Sector allocation, however, marginally helped relative performance as a result of an overweight (i.e. the Fund’s sector position was greater than the benchmark position) to the Energy sector and an underweight (i.e. the Fund’s sector position was less than the benchmark position) to the Telecommunication Services sector.
Among the largest individual contributors to relative performance were Patterson-UTI Energy and Chesapeake Energy. Both stocks, which were overweighted in the portfolio, rose along with the Energy sector. Among the largest detractors from relative performance were MBIA and Ambac Financial Group, both of which were also overweighted and continue to struggle because of concerns about consumer housing credit.
As of the end of the period, the portfolio’s top holdings include Patterson-UTI Energy and Equity Residential, both of which are overweighted versus the benchmark. Patterson-UTI Energy is a top holding primarily because of its combination of attractive management and business behavior characteristics. Equity Residential is a top holding primarily because of its combination of attractive management and investor behavior characteristics.
Our team invests in companies that we believe have compelling stock characteristics versus the Russell MidCap Value Index. The team’s systematic approach weighs more than 80 fundamental characteristics across four broad categories, including business behavior, management behavior, valuation and investor behavior. This analysis is used to build a broadly diversified portfolio of companies, with sector weightings determined largely by the attractiveness of specific stocks within the Fund’s investment universe.
What is the outlook?
The economy continues to face strong headwinds. Growth is likely to be weak until home prices stabilize and credit providers return to the business of lending rather than writing down assets. Despite the Federal Reserve’s (the “Fed”) sharp reductions in short-term interest rates, risk premiums (i.e. difference between the risk associated with buying or holding a Treasury and holding a high yield bond) remain high, which has kept borrowing costs high. However, there are encouraging signs. Lenders are moving to aggressively write down bad loans and the Fed has clearly signaled it stands ready to support the capital markets. Given that Fed policy actions have historically taken a few quarters to affect growth, the rate reductions of last year should begin to be felt in the
71
near future, helping to restore order to the financial markets and setting the stage for recovery.
On an absolute basis, the environment for stocks looks challenging. Both earnings growth and price/earnings multiples show little sign of improving in the near term. Another trend we see impacting performance is the outperformance of growth stocks versus value stocks over the last twelve months. To the extent that this trend continues, the fund’s focus on mid-cap value stocks will be an additional hurdle. Finally, financial service stocks represent roughly thirty percent of the stated investment universe for the Fund. This sector has been crushed, primarily by the subprime crisis. Any sort of “relief” rally in this sector would be a boost.
On a relative basis, we see three key themes that could significantly impact performance relative to the Fund’s benchmark: volatility, credit spreads, and valuations. Volatility increased dramatically during the last 12 months, and we expect it to remain relatively high through 2008. While periods of dramatically increasing volatility tend to be difficult for our strategy, periods of sustained high volatility tend to benefit the stocks with consistent earnings power that our strategy favors. Periods of widening credit spreads, as has been the case recently, also favor quality stocks. We expect this trend to continue because spreads have not yet reached peak levels seen in the past. With regard to valuations, relative differences in valuations across the Fund’s investment universe have been tight by historical standards. This has made it difficult to make meaningful distinctions between attractively priced stocks and expensive stocks. As a result, for the last 12 months our reliance on valuation has proven a disappointing tool for determining future relative performance. While there are some indications that the dispersion in valuations is beginning to return to normal levels, a continuation of this lack of differentiation could be a headwind for the Fund.
We are committed to our belief that, for long-term success, the best approach is to remain fully invested and build the portfolio from the bottom up (i.e. stock by stock fundamental research) based on company-specific fundamentals.
Diversification by Industry
as of April 30, 2008
| | | | | |
| | | Percentage of |
| Industry | | Net Assets |
| |
| Basic Materials | | | 4.9 | % |
| Capital Goods | | | 5.1 | |
| Consumer Cyclical | | | 8.0 | |
| Consumer Staples | | | 3.0 | |
| Energy | | | 14.7 | |
| Finance | | | 33.2 | |
| Health Care | | | 4.8 | |
| Services | | | 4.7 | |
| Technology | | | 9.7 | |
| Transportation | | | 1.6 | |
| Utilities | | | 8.7 | |
| Short-Term Investments | | | 18.2 | |
| Other Assets and Liabilities | | | (16.6 | ) |
| | | | | |
Total | | | 100.0 | % |
| | | | | |
72
The Hartford Select SmallCap Value Fund
| | |
| (subadvised by: | | Kayne Anderson Rudnick Investment Management, LLC
Metropolitan West Capital Management, LLC
SSgA Funds Management, Inc.) |
Performance Overview(1) 7/31/06 — 4/30/08
Growth of a $10,000 investment in Class A which includes Sales Charge
Russell 2000 Value Index is a broad-based unmanaged index comprised of 2,000 of the smallest U.S. domiciled company common stocks (on the basis of capitalization) that are traded in the U.S. on the New York Stock Exchange, American Stock Exchange and Nasdaq.
You cannot invest directly in an index.
Investment objective – Seeks capital appreciation.
Average Annual Total Returns(2) (as of 4/30/08)
| | | | | | | | | | | | | |
| | | Inception | | 1 | | Since |
| | | Date | | Year | | Inception |
| |
| Select SmallCap Value A# | | | 7/31/06 | | | | -16.02 | % | | | -0.17 | % |
| Select SmallCap Value A## | | | 7/31/06 | | | | -20.64 | % | | | -3.34 | % |
| Select SmallCap Value B# | | | 7/31/06 | | | | -16.79 | % | | | -1.08 | % |
| Select SmallCap Value B## | | | 7/31/06 | | | | -20.67 | % | | | -3.20 | % |
| Select SmallCap Value C# | | | 7/31/06 | | | | -16.78 | % | | | -1.02 | % |
| Select SmallCap Value C## | | | 7/31/06 | | | | -17.56 | % | | | -1.02 | % |
| Select SmallCap Value Y# | | | 7/31/06 | | | | -15.72 | % | | | 0.16 | % |
| | |
| # | | Without sales charge |
| |
| ## | | With sales charge |
PAST PERFORMANCE IS NOT INDICATIVE OF FUTURE RESULTS.
| (1) | | Growth of a $10,000 investment in Classes B, C and Y shares will vary from results seen above due to differences in the expenses charged to these share classes. |
| |
| (2) | | The initial investment in Class A shares reflects the maximum sales charge and Classes B and C reflect CDSC. |
The value of shares will fluctuate so that, when redeemed, shares may be worth more or less than their original cost. The chart and table do not reflect the deduction of taxes that a shareholder would pay on fund distributions or the redemption of fund shares.
Performance information may reflect historical or current expense waivers/reimbursements from the investment adviser, without which performance would have been lower. For information on current expense waivers/reimbursements, please see the prospectus.
| | | | | |
Portfolio Managers | | | | |
Kayne Anderson Rudnick Investment Management, LLC | | Metropolitan West Capital Management, LLC | | SSgA Funds Management, Inc. |
Robert A. Schwarzkopf | | Gary W. Lisenbee | | Ric Thomas |
| Managing Director | | President | | Principal |
Sandi L. Gleason | | Samir Sikka | | Chuck Martin |
| | | Senior Vice President | | Principal |
How did the fund perform?
The Class A shares of The Hartford Select SmallCap Value Fund returned -15.60%, before sales charge, for the six-month period ended April 30, 2008, versus the -11.55% return of the Russell 2000 Value Index and -11.30% return of the average Fund in the Lipper Small-Cap Value peer group.
Why did the Fund perform this way?
Overall equity market performance was weak for the period amid continued turmoil in the U.S. bond and housing markets. Within the Russell 2000 Value Index, nine out of the ten sectors posted negative returns for the period led by Telecommunication Services (-25%), Information Technology (-20%), and Consumer Discretionary (-20%). The only positive performing sector for the period was Energy (+8%).
Stock selection was the primary driver of our performance during the year. Landstar Systems (Industrials), Navigant Consulting (Industrials) and Quicksilver Resources (Energy) were top relative (i.e. performance of the Fund as measured against the benchmark) performers. Shares of transportation company Landstar rose as a result of posting strong financial results. Landstar is likely to generate further earnings growth through continued new customer additions and an increase in non-truckload routes. Specialty legal consulting firm Navigant benefited as consulting firms are expected to see an increase in litigation and bankruptcy business due to the turmoil in the credit and housing markets. Shares of Quicksilver (an oil and gas company) rose from higher natural gas production and higher overall prices.
Detractors from performance included Tempur-Pedic International (Consumer Discretionary) and National Financial Partners (Financials). Tempur-Pedic, which was one of our top performers in 2007, fell hard on weak sales and increased competition. National Financial Partners, an independent distributor of financial service products, dropped during the period on sputtering sales and several analysts’ downgrades.
What is the outlook?
We remain hopeful regarding the long-term prospects for U.S. equity markets. Currently, the Fund’s overweight (i.e. the Fund’s sector position was greater than the benchmark position) positions relative to the benchmark were in Industrials, Health Care and Consumer Discretionary. Conversely, the Fund’s largest underweight (i.e. the Fund’s sector position was less than the benchmark position) position relative to the benchmark continues to be in Financials, which we consider unattractive given above-average historical valuations, rising credit costs, and continued slowdown in the housing market. We believe that the complementary style of the three sub-advisors provides the Fund with a well positioned portfolio in this environment to add value relative to the market and its peers.
73
Diversification by Industry
as of April 30, 2008
| | | | | |
| | | Percentage of |
| Industry | | Net Assets |
| |
| Basic Materials | | | 8.6 | % |
| Capital Goods | | | 6.0 | |
| Consumer Cyclical | | | 13.7 | |
| Consumer Staples | | | 2.5 | |
| Energy | | | 7.0 | |
| Finance | | | 24.2 | |
| Health Care | | | 4.5 | |
| Services | | | 13.3 | |
| Technology | | | 10.4 | |
| Transportation | | | 4.7 | |
| Utilities | | | 1.7 | |
| Short-Term Investments | | | 3.1 | |
| Other Assets and Liabilities | | | 0.3 | |
| | | | | |
Total | | | 100.0 | % |
| | | | | |
74
The Hartford Short Duration Fund
(subadvised by Hartford Investment Management Company)
Performance Overview(1) 10/31/02 — 4/30/08
Growth of a $10,000 investment in Class A which includes Sales Charge
Lehman Brothers 1-5 Year U.S. Government/Credit Index is an unmanaged index comprised of the U.S. Government/Credit component of the U.S. Aggregate Index. The 1-5 Year Government/Credit Index includes securities in the 1-5 year maturity range in the Government and Credit Index.
You cannot invest directly in an index.
Investment objective – Seeks to provide a high level of income.
Average Annual Total Returns(2) (as of 4/30/08)
| | | | | | | | | | | | | | | | | |
| | | Inception | | 1 | | 5 | | Since |
| | | Date | | Year | | Year | | Inception |
| |
| Short Duration A# | | | 10/31/02 | | | | 0.72 | % | | | 2.29 | % | | | 2.69 | % |
| Short Duration A## | | | 10/31/02 | | | | -2.30 | % | | | 1.67 | % | | | 2.12 | % |
| Short Duration B# | | | 10/31/02 | | | | -0.03 | % | | | 1.54 | % | | | 1.95 | % |
| Short Duration B## | | | 10/31/02 | | | | -4.85 | % | | | 1.18 | % | | | 1.79 | % |
| Short Duration C# | | | 10/31/02 | | | | 0.07 | % | | | 1.56 | % | | | 1.96 | % |
| Short Duration C## | | | 10/31/02 | | | | -0.89 | % | | | 1.56 | % | | | 1.96 | % |
| Short Duration Y# | | | 11/28/03 | | | | 1.01 | % | | NA | | | 2.61 | % |
| | |
| # | | Without sales charge |
| |
| ## | | With sales charge |
| |
| NA | | Not Applicable |
PAST PERFORMANCE IS NOT INDICATIVE OF FUTURE RESULTS.
| (1) | | Growth of a $10,000 investment in Classes B, C and Y shares will vary from results seen above due to differences in the expenses charged to these share classes. |
| |
| (2) | | The initial investment in Class A shares reflects the maximum sales charge and Classes B and C reflect CDSC. |
The value of shares will fluctuate so that, when redeemed, shares may be worth more or less than their original cost. The chart and table do not reflect the deduction of taxes that a shareholder would pay on fund distributions or the redemption of fund shares.
Performance information may reflect historical or current expense waivers/reimbursements from the investment adviser, without which performance would have been lower. For information on current expense waivers/reimbursements, please see the prospectus.
| | | |
Portfolio Managers
Robert Crusha
Vice President | |
Brian Dirgins
Vice President |
How did the Fund perform?
The Class A shares of The Hartford Short Duration Fund returned -0.71%, before sales charge, for the six-month period ended April 30, 2008, versus the 4.19% return of its benchmark, the Lehman Brothers 1-5 Year U.S. Government/Credit Index, and the -0.11% average return of the Lipper Short Investment Grade Debt Funds category, a group of funds with investment strategies similar to those of the Fund.
Why did the Fund perform this way?
The primary drivers of the Fund’s relative (i.e. performance of the Fund as measured against the benchmark) underperformance were holdings in asset-backed securities (ABS) and commercial mortgage-backed securities (CMBS), which are out-of-benchmark allocations. These sectors underperformed investment-grade corporate bonds for the overall reporting period.
The Fund’s duration (a measure of interest-rate sensitivity) and yield curve positioning also detracted from relative performance. The Fund had a comparatively shorter duration (1.3 years as of the end of the period) than that of the benchmark, though it was within the range of its peer group. This lower sensitivity to interest rate changes hindered relative returns as rates declined over the course of the period, particularly on the shorter end of the yield curve, where the yield on two-year Treasuries fell 169 basis points.
By contrast, the Fund’s allocation to investment-grade corporate bonds had a positive impact on relative returns for the period.
What is the outlook?
The economy continues to face strong headwinds. Growth is likely to be weak until home prices stabilize and credit providers return to the business of lending rather than writing down assets. Despite the Federal Reserve’s (the “Fed”) sharp reductions in short-term interest rates, risk premiums (i.e. difference between the risk associated with buying or holding a Treasury and holding a high yield bond) remain high, which has kept borrowing costs high. However, there are encouraging signs. Lenders are moving to aggressively write down bad loans and the Fed has clearly signaled it stands ready to support the capital markets. Given that Fed policy actions have historically taken a few quarters to affect growth, the rate reductions of last year should begin to be felt in the near future, helping to restore order to the financial markets and setting the stage for recovery.
Given the Fund’s positioning, the financial condition of the consumer will loom large in the ABS sector, while the overall condition of commercial real estate will impact the Fund’s investments in CMBS. The Fund’s investments are generally conservative, being high in the capital structure and having relatively short maturities. Although credit issues in the subprime mortgage-backed securities (MBS) market appear to be reflected in current market prices, credit valuations in the credit card and auto sub-sectors of ABS are less certain and will be
75
largely driven by the peak unemployment level reached during the economic downturn. As for commercial real estate, market valuations indicate investor anticipation of a modest deterioration in fundamentals, though at the moment those fundamentals remain strong.
Diversification by Industry
as of April 30, 2008
| | | | | |
| | | Percentage of |
| Industry | | Net Assets |
| |
| Basic Materials | | | 1.2 | % |
| Capital Goods | | | 1.3 | |
| Consumer Cyclical | | | 1.8 | |
| Consumer Staples | | | 1.7 | |
| Energy | | | 0.9 | |
| Finance | | | 54.3 | |
| Health Care | | | 2.2 | |
| Services | | | 3.4 | |
| Technology | | | 4.3 | |
| Transportation | | | 1.8 | |
| U.S. Government Agencies | | | 10.9 | |
| U.S. Government Securities | | | 6.8 | |
| Utilities | | | 0.7 | |
| Short-Term Investments | | | 10.0 | |
| Other Assets and Liabilities | | | (1.3 | ) |
| | | | | |
Total | | | 100.0 | % |
| | | | | |
Distribution by Credit Quality
as of April 30, 2008
| | | | | |
| | | Percentage of |
| | | Long-Term |
| Rating | | Holdings |
| |
| AAA | | | 39.2 | |
| AA | | | 11.8 | |
| A | | | 25.1 | |
| BBB | | | 23.8 | |
| CCC | | | 0.1 | |
| | | | | |
Total | | | 100.0 | % |
| | | | | |
76
The Hartford Small Company Fund
| | |
| (subadvised by: | | Wellington Management Company, LLP
Hartford Investment Management Company) |
Performance Overview(1) 4/30/98 — 4/30/08
Growth of a $10,000 investment in Class A which includes Sales Charge
Russell 2000 Growth Index is and unmanaged index of those Russell 2000 Index growth companies with higher price-to-book ratios and higher forecasted growth values.
You cannot invest directly in an index.
The value of shares will fluctuate so that, when redeemed, shares may be worth more or less than their original cost. The chart and table do not reflect the deduction of taxes that a shareholder would pay on fund distributions or the redemption of fund shares.
Performance information may reflect historical or current expense waivers/reimbursements from the investment adviser, without which performance would have been lower. For information on current expense waivers/reimbursements, please see the prospectus.
Investment objective – Seeks growth of capital.
Average Annual Total Returns(2,3) (as of 4/30/08)
| | | | | | | | | | | | | | | | | | | | | |
| | | Inception | | 1 | | 5 | | 10 | | Since |
| | | Date | | Year | | Year | | Year | | Inception |
| |
| Small Company A# | | | 7/22/96 | | | | -5.54 | % | | | 17.06 | % | | | 7.04 | % | | | 9.89 | % |
| Small Company A## | | | 7/22/96 | | | | -10.74 | % | | | 15.75 | % | | | 6.44 | % | | | 9.37 | % |
| Small Company B# | | | 7/22/96 | | | | -6.19 | % | | | 16.22 | % | | NA | * | | NA | * |
| Small Company B## | | | 7/22/96 | | | | -10.29 | % | | | 16.00 | % | | NA | * | | NA | * |
| Small Company C# | | | 7/22/96 | | | | -6.29 | % | | | 16.19 | % | | | 6.29 | % | | | 9.13 | % |
| Small Company C## | | | 7/22/96 | | | | -7.11 | % | | | 16.19 | % | | | 6.29 | % | | | 9.13 | % |
| Small Company I# | | | 7/22/96 | | | | -5.25 | % | | | 17.19 | % | | | 7.10 | % | | | 9.94 | % |
| Small Company I## | | | 7/22/96 | | | | -5.25 | % | | | 17.19 | % | | | 7.10 | % | | | 9.94 | % |
| Small Company R3# | | | 7/22/96 | | | | -5.81 | % | | | 17.37 | % | | | 7.44 | % | | | 10.31 | % |
| Small Company R3## | | | 7/22/96 | | | | -5.81 | % | | | 17.37 | % | | | 7.44 | % | | | 10.31 | % |
| Small Company R4# | | | 7/22/96 | | | | -5.44 | % | | | 17.48 | % | | | 7.49 | % | | | 10.36 | % |
| Small Company R4## | | | 7/22/96 | | | | -5.44 | % | | | 17.48 | % | | | 7.49 | % | | | 10.36 | % |
| Small Company R5# | | | 7/22/96 | | | | -5.21 | % | | | 17.57 | % | | | 7.53 | % | | | 10.39 | % |
| Small Company R5## | | | 7/22/96 | | | | -5.21 | % | | | 17.57 | % | | | 7.53 | % | | | 10.39 | % |
| Small Company Y# | | | 7/22/96 | | | | -5.08 | % | | | 17.61 | % | | | 7.54 | % | | | 10.41 | % |
| | |
| # | | Without sales charge |
| |
| ## | | With sales charge |
| |
| NA | | Not Applicable |
| |
| * | | 10 year and inception returns are not applicable for Class B because after 8 years Class B converts to Class A. |
PAST PERFORMANCE IS NOT INDICATIVE OF FUTURE RESULTS.
| (1) | | Growth of a $10,000 investment in Classes B, C, I, R3, R4, R5 and Y shares will vary from results seen above due to differences in the expenses charged to these share classes. |
| |
| (2) | | Class C shares commenced operations on 7/31/98. Performance prior to 7/31/98 reflects Class B performance less Class C sales charges where applicable. Class I shares commenced operations on 8/31/06. Performance prior to 8/31/06 reflects Class A performance. Class R3, R4 and R5 shares commenced operations on 12/22/06. Performance prior to 12/22/06 reflects Class Y performance. |
| |
| (3) | | The initial investment in Class A shares reflects the maximum sales charge and Classes B and C reflect CDSC. |
| | | | | | | |
| Portfolio Managers | | | | |
| Wellington Management Company, LLP | | | | Hartford Investment Management Company |
Steven C. Angeli, CFA | | Stephen C. Mortimer | | Mario E. Abularach, CFA, CMT | | Hugh Whelan |
| Senior Vice President, Partner | | Vice President | | Vice President | | Managing Director |
At April 30, 2008, 57% of the Fund’s assets were managed by Wellington Management Company and 43% of the assets were managed by Harford Investment Management Company.
How did the Fund perform?
The Class A shares of The Hartford Small Company Fund returned -13.58%, before sales charge, for the six-month period ended April 30, 2008, versus its benchmark, the Russell 2000 Growth Index, which returned -14.14% for the same period, and the -16.44% return of the average fund in the Lipper Small-Cap Growth Funds peer group, a group of funds with investment strategies similar to those of the Fund.
Why did the Fund perform this way?
Overall equity market performance was weak for the period amid continued turmoil in the U.S. bond and housing markets. Within the Russell 2000 Growth Index, nine out of the ten sectors posted negative returns for the period led by Information Technology (-23%), Telecommunication Services (-20%), and Consumer Discretionary (-18%). The leaders in this environment were Energy (+8%), Utilities (-6%), and Industrials (-7%).
The Fund’s outperformance was driven primarily by stock selection; relative sector exposure also had a slightly positive impact on benchmark-relative (i.e. performance of the Fund as measured against the benchmark) returns. Security selection was strongest in the Health Care, Materials, Telecommunications Services, and Energy sectors. Poor stock selection in Financials, Information Technology, and Consumer Discretionary detracted from performance.
Among the top relative and absolute (i.e. total return) contributors to performance during the period were Flowserve (Industrials), Cabot Oil & Gas (Energy), and Arch Coal (Energy). Flowserve is a leading manufacturer of flow control products, including pumps, valves, and pressure seals, with focus on the oil and gas industry. Shares rose after the company reported earnings that exceeded expectations with strong demand from its customers in global oil and gas end markets. Management also announced a dividend increase and share buyback
77
initiative. Cabot Oil & Gas is an independent exploration and production company with oil and gas properties in North America. The company’s share price rose during the period due to rising natural gas prices, impressive results in their East Texas acreage that helped boost reserves, and disciplined execution that restrained exploration and development costs. Coal producer Arch Coal’s shares benefited from extremely tight global coal markets, brought on by strong developing world demand. Arch held back from signing term contracts in 2007, when prices were weak, allowing for more volumes to be priced in today’s buoyant markets. The company also benefited from supply outages in major producing countries China and Australia, which caused coal pricing to move materially higher. Other top relative and absolute contributors during the period included Millennium Pharmaceuticals (Health Care), Cellcom Israel (Telecommunication Services), Big Lots (Consumer Discretionary) and Walter Industries (Industrials).
The three stocks that detracted the most from relative and absolute performance included Focus Media (Consumer Discretionary), MF Global (Financials), and VeriFone (Information Technology). Focus Media is China’s largest out-of-home advertising firm with over 90 percent market share in LCD display and poster frame networks. News that the company’s founder would relinquish his CEO role to the president caused a sharp pullback in the stock. In addition, China Mobile’s decision to shut down Focus’ SMS (instant messaging) access also dampened sentiment. We continue to hold the stock. MF Global is a leading broker of exchange traded futures and options. The company’s share price fell significantly amid a rogue trading incident as well as questions concerning the company’s repurchase book and counterparty credit risk triggered by JP Morgan Chase’s dramatic take-over of Bear Stearns. A modified agreement with former parent Man Group PLC should free up liquidity; meanwhile business metrics continue on track despite near term upheaval. We continue to hold the position. During the period, payment processor VeriFone announced that it would have to restate fiscal year 2007 results due to accounting errors. Data entry problems in the company’s cost of goods sold calculation led to an overstatement of gross margins, which was a key driver of the stock. We exited the stock in favor of other opportunities. Other detractors included Sotheby’s (Consumer Discretionary), which declined as investors anticipated that financial market troubles will reduce the budgets of art collectors.
What is the outlook?
The Fund focuses on stocks of companies we see as having unique business models or special market opportunities that should allow them to deliver superior growth. As such, changes in the overall positioning of the Fund are the result of bottom-up (i.e. stock by stock fundamental research) stock decisions as opposed to top-down macro themes. At the end of the period, the Fund’s largest overweight (i.e. the Fund’s sector position was greater than the benchmark position) allocations relative to the Russell 2000 Growth Index were to Materials, Consumer Staples and Health Care; while the largest underweight (i.e. the Fund’s sector position was less than the benchmark position) allocations were to Consumer Discretionary, Information Technology, and Financials.
Diversification by Industry
as of April 30, 2008
| | | | | |
| | | Percentage of |
| Industry | | Net Assets |
| |
| Basic Materials | | | 10.9 | % |
| Capital Goods | | | 4.8 | |
| Consumer Cyclical | | | 10.0 | |
| Consumer Staples | | | 0.9 | |
| Energy | | | 6.4 | |
| Finance | | | 10.0 | |
| Health Care | | | 15.6 | |
| Other Investment Pools and Funds | | | 1.6 | |
| Services | | | 9.3 | |
| Technology | | | 22.3 | |
| Transportation | | | 3.0 | |
| Utilities | | | 0.2 | |
| Short-Term Investments | | | 47.0 | |
| Other Assets and Liabilities | | | (42.0 | ) |
| | | | | |
Total | | | 100.0 | % |
| | | | | |
78
The Hartford SmallCap Growth Fund
| | |
| (subadvised by: | | Wellington Management Company, LLP
Hartford Investment Management Company) |
Performance Overview(1,2) 4/30/98 — 4/30/08
Growth of a $10,000 investment in Class A which includes Sales Charge
Russell 2000 Growth Index is and unmanaged index of those Russell 2000 Index growth companies with higher price-to-book ratios and higher forecasted growth values.
You cannot invest directly in an index.
The value of shares will fluctuate so that, when redeemed, shares may be worth more or less than their original cost. The chart and table do not reflect the deduction of taxes that a shareholder would pay on fund distributions or the redemption of fund shares.
Performance information may reflect historical or current expense waivers/reimbursements from the investment adviser, without which performance would have been lower. For information on current expense waivers/reimbursements, please see the prospectus.
Investment objective – Seeks long-term capital appreciation.
Average Annual Total Returns(1,3) (as of 4/30/08)
| | | | | | | | | | | | | | | | | | | | | |
| | | Inception | | 1 | | 5 | | 10 | | Since |
| | | Date | | Year | | Year | | Year | | Inception |
| |
| SmallCap Growth A# | | | 1/04/88 | | | | -14.36 | % | | | 12.05 | % | | | 6.51 | % | | | 11.04 | % |
| SmallCap Growth A## | | | 1/04/88 | | | | -19.07 | % | | | 10.79 | % | | | 5.91 | % | | | 10.73 | % |
| SmallCap Growth B# | | | 11/14/94 | | | | -14.84 | % | | | 11.32 | % | | NA | * | | NA | * |
| SmallCap Growth B## | | | 11/14/94 | | | | -18.59 | % | | | 11.06 | % | | NA | * | | NA | * |
| SmallCap Growth C# | | | 11/14/94 | | | | -15.03 | % | | | 11.23 | % | | | 5.80 | % | | | 8.46 | % |
| SmallCap Growth C## | | | 11/14/94 | | | | -15.78 | % | | | 11.23 | % | | | 5.80 | % | | | 8.46 | % |
| SmallCap Growth I# | | | 2/19/02 | | | | -14.22 | % | | | 12.12 | % | | NA | | | | 5.94 | % |
| SmallCap Growth I## | | | 2/19/02 | | | | -14.22 | % | | | 12.12 | % | | NA | | | | 5.94 | % |
| SmallCap Growth L# | | | 1/04/88 | | | | -14.17 | % | | | 12.24 | % | | | 6.58 | % | | | 11.08 | % |
| SmallCap Growth L## | | | 1/04/88 | | | | -18.24 | % | | | 11.15 | % | | | 6.06 | % | | | 10.82 | % |
| SmallCap Growth R3# | | | 2/19/02 | | | | -14.50 | % | | | 12.35 | % | | NA | | | | 5.75 | % |
| SmallCap Growth R3## | | | 2/19/02 | | | | -14.50 | % | | | 12.35 | % | | NA | | | | 5.75 | % |
| SmallCap Growth R4# | | | 2/19/02 | | | | -14.34 | % | | | 12.42 | % | | NA | | | | 5.81 | % |
| SmallCap Growth R4## | | | 2/19/02 | | | | -14.34 | % | | | 12.42 | % | | NA | | | | 5.81 | % |
| SmallCap Growth R5# | | | 2/19/02 | | | | -14.08 | % | | | 12.51 | % | | NA | | | | 5.87 | % |
| SmallCap Growth R5## | | | 2/19/02 | | | | -14.08 | % | | | 12.51 | % | | NA | | | | 5.87 | % |
| SmallCap Growth Y# | | | 2/19/02 | | | | -13.95 | % | | | 12.55 | % | | NA | | | | 5.90 | % |
| | |
| # | | Without sales charge |
| |
| ## | | With sales charge |
| |
| NA | | Not Applicable |
| |
| * | | 10 year and inception returns are not applicable for Class B because after 8 years Class B converts to Class A. |
PAST PERFORMANCE IS NOT INDICATIVE OF FUTURE RESULTS.
| (1) | | Classes A, B and C were offered beginning on 2/19/02. Performance prior to that date is that of the fund’s Classes L, M and N shares, respectively, which have lower operating expenses. Performance prior to 2/19/02 would have been lower if Classes A, B and C shares expenses were applied during that period. (Classes M and N are no longer offered.) Class I shares commenced operations on 8/31/06. Performance prior to 8/31/06 reflects Class A performance. Classes R3, R4 and R5 shares commenced operations on 12/22/06. Performance prior to 12/22/06 reflects Class A performance. |
| |
| (2) | | Growth of a $10,000 investment in Classes B, C, I, L, R3, R4, R5 and Y shares will vary from results seen above due to differences in the expenses charged to these share classes. |
| |
| (3) | | The initial investment in Classes A and L shares reflects the maximum sales charge and Classes B and C reflect CDSC. |
| | | | | |
| Portfolio Managers | | |
| Wellington Management Company, LLP | | Hartford Investment Management Company |
David J. Elliot, CFA | | Doris T. Dwyer | | Hugh Whelan |
| Vice President | | Vice President | | Managing Director |
At April 30, 2008, 81% of the Fund’s assets were managed by Wellington Management Company and 19% of the assets were managed by Hartford Investment Management Company.
How did the Fund perform?
The Class A shares of The Hartford SmallCap Growth Fund returned -14.18%, before sales charge, for the six-month period ended April 30, 2008, versus its benchmark, the Russell 2000 Growth Index, which returned -14.14%, and the -16.44% return of the average fund in the Lipper Small-Cap Growth Funds peer group, a group of funds with investment strategies similar to those of the Fund.
Why did the Fund perform this way?
Overall equity market performance was weak for the period amid continued turmoil in the U.S. bond and housing markets. Within the Russell 2000 Growth Index, nine out of the ten sectors posted negative returns for the period led by Information Technology (-23%), Telecommunication Services (-20%), and Consumer Discretionary (-18%). The leaders in this environment were Energy (+7%), Utilities (-6%), and Industrials (-7%).
Fund performance was driven by stock selection; sector allocation had very little impact on benchmark-relative (i.e. performance of the Fund as measured against the benchmark) returns. Strong stock selection in the Materials, Health Care, and Industrials sectors was offset by weaker
79
selection in Information Technology, Financials, Consumer Discretionary and Energy.
Among the top contributors to both relative and absolute (i.e. total return) performance were Perrigo (Health Care), Rigel Pharmaceutical (Health Care), and Cleveland-Cliffs (Materials). Perrigo is a generic drug and health care products company. Its stock rose upon news that the FDA approved the marketing and distribution of omeprazole, a generic version of heartburn drug Prilosec OTC. Rigel is a clinical-stage drug development company that researches and develops small molecule drugs for the treatment of inflammatory diseases, cancer, and viral diseases. Its drug R788 showed positive results in treating rheumatoid arthritis, a chronic inflammatory disease in the joints, causing the stock price to rise during the period. Cleveland-Cliffs, an iron ore pellet producer, benefited from tight fundamentals in global iron ore markets driven by strong worldwide demand for steel. Another contributor was Walters Industries (Industrials), which continued its upward trend after announcing earnings that beat expectations.
ITT Educational Services (Consumer Discretionary), Crocs (Consumer Discretionary), and Emulex (Information Technology) detracted the most from performance on a relative and absolute basis. ITT Educational Services is a private college system focused on technology-oriented programs of study. Exposure to private Sallie Mae loans put downward pressure on the stock’s price. We continue to hold the position based on strong management and ongoing recovery from uncertainties regarding student financing. Crocs is a designer, manufacturer, and distributor of footwear for men, women, and children. We eliminated our position due to degrading fundamentals, poor momentum and concerns regarding earnings quality. Shares of Emulex, a provider of storage networking infrastructure solutions, fell as the market worried about the impact of a weakening economy on technology expenditures. We continue to hold our position based on attractive valuation and improving competitive positioning of the company’s products. Other detractors included Sotheby’s (Consumer Discretionary), which declined as investors anticipated that financial market troubles will reduce the budgets of art collectors.
What is the outlook?
As the U.S. economy continues to grapple with falling home prices, rising food and energy costs, and declining consumer confidence we believe that a mild recession is in market prices now, but the risks of deeper recession have risen.
We will continue to employ a combination of fundamental and quantitative research rather than sector-level top-down views to identify the most attractive stocks, while maintaining appropriate risk controls relative to the benchmark. Relative sector overweights (i.e. the Fund’s sector position was greater than the benchmark position) and underweights (i.e. the Fund’s sector position was less than the benchmark position) versus the Russell 2000 Growth Index are small and incidental. As a result of the Fund’s investment approach, sector positioning at the end of the period resulted in the greatest exposure to the Information Technology, Health Care, Industrials, and Consumer Discretionary sectors.
Diversification by Industry
as of April 30, 2008
| | | | | |
| | | Percentage of |
| Industry | | Net Assets |
| |
| Basic Materials | | | 6.8 | % |
| Capital Goods | | | 6.3 | |
| Consumer Cyclical | | | 11.3 | |
| Consumer Staples | | | 0.8 | |
| Energy | | | 7.3 | |
| Finance | | | 8.0 | |
| Health Care | | | 17.9 | |
| Services | | | 13.1 | |
| Technology | | | 24.3 | |
| Transportation | | | 3.0 | |
| Utilities | | | 0.1 | |
| Short-Term Investments | | | 42.9 | |
| Other Assets and Liabilities | | | (41.8 | ) |
| | | | | |
Total | | | 100.0 | % |
| | | | | |
80
The Hartford Stock Fund
(subadvised by Wellington Management Company, LLP)
Performance Overview(1) 4/30/98 — 4/30/08
Growth of a $10,000 investment in Class A which includes Sales Charge
S&P 500 Index is a market capitalization weighted price index composed of 500 widely held common stocks.
You cannot invest directly in an index.
The value of shares will fluctuate so that, when redeemed, shares may be worth more or less than their original cost. The chart and table do not reflect the deduction of taxes that a shareholder would pay on fund distributions or the redemption of fund shares.
Performance information may reflect historical or current expense waivers/reimbursements from the investment adviser, without which performance would have been lower. For information on current expense waivers/reimbursements, please see the prospectus.
Investment objective – Seeks long-term growth of capital.
Average Annual Total Returns(2,3) (as of 4/30/08)
| | | | | | | | | | | | | | | | | | | | | |
| | | Inception | | 1 | | 5 | | 10 | | Since |
| | | Date | | Year | | Year | | Year | | Inception |
| |
| Stock A# | | | 7/22/96 | | | | -6.38 | % | | | 8.90 | % | | | 2.92 | % | | | 7.65 | % |
| Stock A## | | | 7/22/96 | | | | -11.53 | % | | | 7.68 | % | | | 2.34 | % | | | 7.13 | % |
| Stock B# | | | 7/22/96 | | | | -7.20 | % | | | 8.00 | % | | NA | * | | NA | * |
| Stock B## | | | 7/22/96 | | | | -11.84 | % | | | 7.70 | % | | NA | * | | NA | * |
| Stock C# | | | 7/22/96 | | | | -7.14 | % | | | 8.13 | % | | | 2.22 | % | | | 6.90 | % |
| Stock C## | | | 7/22/96 | | | | -8.07 | % | | | 8.13 | % | | | 2.22 | % | | | 6.90 | % |
| Stock R3# | | | 7/22/96 | | | | -6.65 | % | | | 9.26 | % | | | 3.35 | % | | | 8.10 | % |
| Stock R3## | | | 7/22/96 | | | | -6.65 | % | | | 9.26 | % | | | 3.35 | % | | | 8.10 | % |
| Stock R4# | | | 7/22/96 | | | | -6.37 | % | | | 9.36 | % | | | 3.39 | % | | | 8.13 | % |
| Stock R4## | | | 7/22/96 | | | | -6.37 | % | | | 9.36 | % | | | 3.39 | % | | | 8.13 | % |
| Stock R5# | | | 7/22/96 | | | | -6.08 | % | | | 9.44 | % | | | 3.43 | % | | | 8.17 | % |
| Stock R5## | | | 7/22/96 | | | | -6.08 | % | | | 9.44 | % | | | 3.43 | % | | | 8.17 | % |
| Stock Y# | | | 7/22/96 | | | | -5.95 | % | | | 9.48 | % | | | 3.45 | % | | | 8.19 | % |
| | |
| # | | Without sales charge |
| |
| ## | | With sales charge |
| |
| NA | | Not Applicable |
| |
| * | | 10 year and inception returns are not applicable for Class B because after 8 years Class B converts to Class A. |
PAST PERFORMANCE IS NOT INDICATIVE OF FUTURE RESULTS.
| | |
| (1) | | Growth of a $10,000 investment in Classes B, C, R3, R4, R5 and Y shares will vary from results seen above due to differences in the expenses charged to these share classes. |
| |
| (2) | | Class C shares commenced operations on 7/31/98. Performance prior to 7/31/98 reflects Class B performance less Class C sales charges where applicable. Class R3, R4 and R5 shares commenced operations on 12/22/06. Performance prior to 12/22/06 reflects Class Y performance. |
| |
| (3) | | The initial investment in Class A shares reflects the maximum sales charge and Classes B and C reflect CDSC. |
| | | |
Portfolio Managers | | |
Steven T. Irons, CFA | | Peter I. Higgins, CFA |
| Senior Vice President, Partner | | Senior Vice President, Partner |
How did the Fund perform?
The Class A shares of The Hartford Stock Fund returned -12.16%, before sales charge, for the six-month period ended April 30, 2008, versus its benchmark, the S&P 500 Index, which returned - -9.63%, and the -10.59% return of the average fund in the Lipper Large-Cap Core Funds peer group, a group of funds with investment strategies similar to those of the Fund.
Why did the Fund perform this way?
Equity markets fell during the last six months as equity investors sought to shed risk in response to increasing concerns about the financial system and a potential U.S. recession. The extended credit crunch contributed to the near collapse of the large investment bank Bear Stearns. The U.S. Federal Reserve intervened to sponsor an acquisition of Bear Stearns, lowered the federal funds rate, and introduced multiple programs aimed at improving liquidity. Against this backdrop, large cap equities (-9.6%) outpaced small cap stocks (-12.9%) but underperformed mid caps (-7.0%) as represented by the S&P 500 Index, Russell 2000 Index, and S&P MidCap 400 Index, respectively. Nine of the ten sectors in the S&P 500 Index posted negative returns during the period led by Financials (-20%), Information Technology (-15%) and Telecommunication Services (-13%). Energy was the only sector to post positive returns (+6%).
The Fund’s underperformance versus the benchmark was driven by both security selection and allocation among sectors. Strong stock selection in Consumer Discretionary and Energy was offset by weaker stock selection in Industrials and Telecommunication Services. Sector allocation, which is a result of bottom-up (i.e. stock by stock fundamental research) security selection, was a detractor during the period due primarily to the Fund’s slight underweight (i.e. the Fund’s sector position was less than the benchmark position) to the strongly performing Energy sector and overweight (i.e. the Fund’s sector position was greater than the benchmark position) to lagging Information Technology.
Stocks that detracted the most from relative (i.e. performance of the Fund as measured against the benchmark) returns included Schering-Plough (Health Care), UBS (Financials) and Suntech Power (Industrials). Shares of Schering-Plough fell on concerns about the effectiveness of its flagship cholesterol drug Vytorin. UBS experienced
81
losses relating to subprime mortgages, as well as losses in their investment banking division. This forced the company to raise additional dilutive equity capital to help absorb write downs pushing the stock price lower. China-based solar energy products and services company Suntech Power, a new purchase during the period, posted lower-than expected earnings results due to rising polysilicon costs. We maintained our position at period-end. Significant detractors from absolute (i.e. total return) returns included General Electric (Industrials), AIG (Financials) and Sprint Nextel (Telecommunication Services).
Top relative contributors during the period included Washington Mutual (Financials), Elan (Health Care) and Gazprom (Energy). Shares of consumer and small business banking company Washington Mutual rose after merger speculation and an improving interest-rate environment buoyed the shares. The Fund’s holdings in Elan moved higher after the company reported positive results from its multiple sclerosis drug Tysabri. Vertically integrated Russian gas producer Gazprom is benefiting from rising energy prices and demand growth in primary Russian markets, as well as in exports to Europe. Energy companies Schlumberger, Chesapeake Energy and Hess also contributed to the Fund’s returns on an absolute basis. We continued to hold all six of these stocks at the end of the period.
What is the outlook?
Our bottom-up investment approach resulted in overweight positions in Information Technology, Health Care, and Financials and underweights in Consumer Staples, Utilities, and Energy relative to the S&P 500 Index at the end of the period.
Diversification by Industry
as of April 30, 2008
| | | | | |
| | | Percentage of |
| Industry | | Net Assets |
| |
| Basic Materials | | | 5.3 | % |
| Consumer Cyclical | | | 7.3 | |
| Consumer Staples | | | 3.5 | |
| Energy | | | 9.7 | |
| Finance | | | 22.8 | |
| Health Care | | | 14.2 | |
| Services | | | 11.3 | |
| Technology | | | 24.2 | |
| Transportation | | | 0.6 | |
| Utilities | | | 1.0 | |
| Short-Term Investments | | | 6.9 | |
| Other Assets and Liabilities | | | (6.8 | ) |
| | | | | |
Total | | | 100.0 | % |
| | | | | |
82
The Hartford Strategic Income Fund
(subadvised by Hartford Investment Management Company)
Performance Overview(1) 5/31/07 — 4/30/08
Growth of a $10,000 investment in Class A which includes Sales Charge
Lehman Brothers U.S. Aggregate Bond Index is an unmanaged index and is composed of securities from the Lehman Brothers Government/Credit Bond Index, Mortgage-Backed Securities Index, Asset-Backed Index and Commercial Mortgage-Backed Securities Index.
You cannot invest directly in an index.
Investment objective – Seeks a high level of current income.
Capital appreciation is a secondary objective.
Average Annual Total Returns(2) (as of 4/30/08)
| | | | | | | | | |
| | | Inception | | Since |
| | | Date | | Inception |
| |
| Strategic Income A# | | | 5/31/07 | | | | 2.42 | % |
| Strategic Income A## | | | 5/31/07 | | | | -2.18 | % |
| Strategic Income B# | | | 5/31/07 | | | | 1.82 | % |
| Strategic Income B## | | | 5/31/07 | | | | -2.98 | % |
| Strategic Income C# | | | 5/31/07 | | | | 1.92 | % |
| Strategic Income C## | | | 5/31/07 | | | | 0.96 | % |
| Strategic Income I# | | | 5/31/07 | | | | 2.97 | % |
| Strategic Income I## | | | 5/31/07 | | | | 2.97 | % |
| Strategic Income Y# | | | 8/31/07 | | | | 4.34 | % |
| | |
| # | | Without sales charge |
| |
| ## | | With sales charge |
PAST PERFORMANCE IS NOT INDICATIVE OF FUTURE RESULTS.
| (1) | | Growth of a $10,000 investment in Classes B, C, I and Y shares will vary from results seen above due to differences in the expenses charged to these share classes. |
| |
| (2) | | The initial investment in Class A shares reflects the maximum sales charge and Classes B and C reflect CDSC. |
The value of shares will fluctuate so that, when redeemed, shares may be worth more or less than their original cost. The chart and table do not reflect the deduction of taxes that a shareholder would pay on fund distributions or the redemption of fund shares.
Performance information may reflect historical or current expense waivers/reimbursements from the investment adviser, without which performance would have been lower. For information on current expense waivers/reimbursements, please see the prospectus.
| | | | | |
Portfolio Managers | | | | |
Michael Bacevich | | Mark Niland, CFA | | Nasri Toutoungi |
| Managing Director | | Managing Director | | Managing Director |
Michael Gray, CFA | | Peter Perrotti, CFA | | Edward Vaimberg |
| Managing Director | | Executive Vice President | | Senior Vice President |
How did the Fund perform?
The Class A shares of The Hartford Strategic Income Fund returned 0.88%, before sales charge, for the six-month period ended April 30, 2008, versus the return of 4.08% for the Lehman Brothers U.S. Aggregate Bond Index, and the 0.21% return of the Lipper Multi-Sector Income Funds category, a group of funds with investment strategies similar to those of the Fund.
Why did the Fund perform this way?
The market was extremely volatile throughout the six-month period under review and risk premiums (i.e. difference between the risk associated with buying or holding a Treasury and holding a high yield bond) across all asset classes rose significantly. The subprime mortgage crisis accelerated, culminating in the near collapse of Bear Stearns. As financial institutions wrote down impaired assets and realized enormous losses, investor confidence eroded. Markets began to seize as banks, brokers and other financial institutions became reluctant to transact with each other.
The Federal Reserve (the “Fed”) was quick to react to the crisis, adding liquidity to the market by reducing the target federal funds rate from 4.5% to 2.0%, while also establishing lending facilities that provided a backstop to both banks and brokers. Moreover, the Fed facilitated JPMorgan Chase’s rescue acquisition of Bear Stearns, after which credit spreads in the market, which had dramatically widened, began to narrow again. As a result, in the last month of the period, the Lehman Brothers U.S. Aggregate Bond Index realized the best returns in excess of Treasuries in the history of the index.
Sector allocation was the largest contributor to the Fund’s underperformance relative (i.e. performance of the Fund as measured against the benchmark) to the benchmark. In particular, the Fund was overweighted (i.e. the Fund’s sector position was greater than the benchmark position) in the high yield bond and bank loan sectors, which are not represented in the benchmark, and underweighted (i.e. the Fund’s sector position was less than the benchmark position) in U.S. Treasury and agency securities. During the period, the credit and liquidity crisis pushed credit spreads significantly wider and prompted a flight to quality that led Treasury and agency securities to outperform all other sectors of the fixed income market.
Security selection in investment-grade corporate bonds also hindered relative performance. The majority of the Fund’s holdings here are concentrated in the financial sector, which suffered amid further mortgage-related writedowns during the period.
83
The Fund’s yield curve positioning, however, helped to mitigate some of this underperformance. We positioned the Fund to benefit from a steepening of the yield curve (i.e. short and long term interest rates moving farther apart), which proved beneficial as interest rates declined, particularly on the short end of the curve, and the curve steepened. By the end of the period, the yield differential between two-year and ten-year Treasury notes had increased from 52 basis points to 147 basis points. Additionally, the Fund’s holdings in non-dollar debt also contributed positively to performance as the U.S. dollar reached new lows versus many major currencies.
What is the outlook?
The economy continues to face strong headwinds. Growth is likely to be weak until home prices stabilize and credit providers return to the business of lending rather than writing down assets. Despite the Fed’s sharp reductions in short-term interest rates, risk premiums remain high, which has kept borrowing costs high. However, there are encouraging signs. Lenders are moving to aggressively write down bad loans and the Fed has clearly signaled it stands ready to support the capital markets. Given that Fed policy actions have historically taken a few quarters to affect growth, the rate reductions of last year should begin to be felt in the near future, helping to restore order to the financial markets and setting the stage for recovery.
Although credit spreads have narrowed in recent weeks, they still remain at near historic wide levels and appear to be pricing in very poor conditions. We believe that while the market is likely to remain volatile, market pricing will ultimately revert to historical means. Therefore, we will maintain our positions and opportunistically add modestly to spread risk.
Distribution by Credit Quality
as of April 30, 2008
| | | | | |
| | | Percentage of |
| | | Long-Term |
| Rating | | Holdings |
| |
| AAA | | | 35.0 | |
| AA | | | 4.1 | |
| A | | | 7.9 | |
| BBB | | | 9.7 | |
| BB | | | 17.6 | |
| B | | | 22.6 | |
| CCC | | | 1.4 | |
| CC | | | 0.1 | |
| NR | | | 1.6 | |
| | | | | |
Total | | | 100.0 | % |
| | | | | |
Diversification by Industry
as of April 30, 2008
| | | | | |
| | | Percentage of |
| Industry | | Net Assets |
| |
| Basic Materials | | | 3.7 | % |
| Capital Goods | | | 1.0 | |
| Consumer Cyclical | | | 5.4 | |
| Consumer Staples | | | 1.3 | |
| Energy | | | 3.5 | |
| Finance | | | 33.5 | |
| Foreign Governments | | | 3.8 | |
| Health Care | | | 4.0 | |
| Services | | | 7.4 | |
| Technology | | | 7.9 | |
| Transportation | | | 0.8 | |
| U.S. Government Agencies | | | 19.3 | |
| U.S. Government Securities | | | 0.3 | |
| Utilities | | | 5.5 | |
| Short-Term Investments | | | 3.4 | |
| Other Assets and Liabilities | | | (0.8 | ) |
| | | | | |
Total | | | 100.0 | % |
| | | | | |
84
The Hartford Target Retirement 2010 Fund
(subadvised by Hartford Investment Management Company)
Performance Overview(1) 9/30/05 — 4/30/08
Growth of a $10,000 investment in Class A which includes Sales Charge
Lehman Brothers U.S. Aggregate Bond Index is an unmanaged index and is composed of securities from the Lehman Brothers Government/Credit Bond Index, Mortgage-Backed Securities Index, Asset-Backed Index and Commercial Mortgage-Backed Securities Index.
S&P 500 Index is a market capitalization weighted price index composed of 500 widely held common stocks.
You cannot invest directly in an index.
Investment objective – seeks to maximize total return and secondarily, to seek capital preservation.
Average Annual Total Returns(2,3) (as of 4/30/08)
| | | | | | | | | | | | | |
| | | Inception | | 1 | | Since |
| | | Date | | Year | | Inception |
| |
| Target Retirement 2010 A# | | | 9/30/05 | | | | 3.70 | % | | | 6.08 | % |
| Target Retirement 2010 A## | | | 9/30/05 | | | | -2.00 | % | | | 3.78 | % |
| Target Retirement 2010 B# | | | 9/30/05 | | | | 2.95 | % | | | 5.30 | % |
| Target Retirement 2010 B## | | | 9/30/05 | | | | -1.92 | % | | | 4.24 | % |
| Target Retirement 2010 C# | | | 9/30/05 | | | | 2.95 | % | | | 5.26 | % |
| Target Retirement 2010 C## | | | 9/30/05 | | | | 1.97 | % | | | 5.26 | % |
| Target Retirement 2010 R3# | | | 9/30/05 | | | | 3.29 | % | | | 5.99 | % |
| Target Retirement 2010 R3## | | | 9/30/05 | | | | 3.29 | % | | | 5.99 | % |
| Target Retirement 2010 R4# | | | 9/30/05 | | | | 3.73 | % | | | 6.20 | % |
| Target Retirement 2010 R4## | | | 9/30/05 | | | | 3.73 | % | | | 6.20 | % |
| Target Retirement 2010 R5# | | | 9/30/05 | | | | 3.81 | % | | | 6.31 | % |
| Target Retirement 2010 R5## | | | 9/30/05 | | | | 3.81 | % | | | 6.31 | % |
| Target Retirement 2010 Y# | | | 9/30/05 | | | | 4.11 | % | | | 6.39 | % |
| | |
| # | | Without sales charge |
| |
| ## | | With sales charge |
PAST PERFORMANCE IS NOT INDICATIVE OF FUTURE RESULTS.
| (1) | | Growth of a $10,000 investment in Classes B, C, R3, R4, R5 and Y shares will vary from results seen above due to differences in the expenses charged to these share classes. |
| |
| (2) | | Class R3, R4 and R5 shares commenced operations on 12/22/06. |
| |
| | | Performance prior to 12/22/06 reflects Class Y performance. |
| |
| (3) | | The initial investment in Class A shares reflects the maximum sales charge and Classes B and C reflect CDSC. |
The value of shares will fluctuate so that, when redeemed, shares may be worth more or less than their original cost. The chart and table do not reflect the deduction of taxes that a shareholder would pay on fund distributions or the redemption of fund shares.
Performance information may reflect historical or current expense waivers/reimbursements from the investment adviser, without which performance would have been lower. For information on current expense waivers/reimbursements, please see the prospectus.
| | | |
Portfolio Managers | | |
Hugh Whelan | | Edward C. Caputo |
| Managing Director | | Assistant Vice President |
How did the Fund perform?
The Class A shares of The Hartford Target Retirement 2010 Fund returned -2.79%, before sales charge, for the six-month period ended April 30, 2008, versus -3.99% for the Lipper Mixed-Asset Target 2010 Funds average, 4.08% for the Lehman Brothers U.S. Aggregate Bond Index, and -9.63% for the S&P 500 Index.
Why did the Fund perform this way?
The six-month period under review was challenging for both stocks and bonds, as credit and liquidity remained constrained, volatility was high, and concerns about a potential recession emerged. Although the Federal Reserve (the “Fed”) took considerable steps to help bolster the markets, including reducing the target federal funds rate on several occasions, establishing lending facilities that provided a back stop to both banks and brokers, and facilitating JPMorgan Chase’s rescue acquisition of Bear Stearns, investor confidence continued to erode. As a result, investors fled to the relative safety of Treasury securities, fueling their outperformance of all other sectors of the market for the overall period.
Within the fixed income market, the asset-backed securities segment was the worst performing sector and overall, high-yield asset classes such as U.S. high yield bonds, floating-rate notes, and emerging market bonds underperformed higher quality securities. Within domestic equities, mid-cap stocks outperformed large-cap and small-cap stocks. With regard to style, growth beat value within large-cap and mid-cap stocks but underperformed within small-cap stocks. Overall, international stocks slightly outperformed domestic stocks.
Over the course of the period, asset allocation decisions within equities detracted from the Fund’s performance. Specifically, allocations to small-cap growth, large-cap value, and international small-cap stocks held back returns. However, the negative impact was partially offset by the favorable performance of allocations to mid-cap and large-cap growth and international large-cap stocks. Asset allocation within the fixed income portion of the Fund also detracted from performance. Although allocations to Treasury Inflation Protected Securities (TIPS) and short-term bonds were additive to performance, they did not offset the unfavorable performance of allocations to floating-rate notes, high
85
yield bonds, and emerging market debt. Additionally, the duration of the Fund’s fixed income segment (a measure of interest-rate sensitivity) was targeted to be less than that of the broad fixed income market, as measured by the Lehman Brothers U.S. Aggregate Bond Index. This shorter duration also hindered performance as interest rates declined during the period.
During the reporting period, the Fund began utilizing exchange-traded funds (ETFs) to obtain asset class exposures unavailable through The Hartford fund family. Doing so enables the Fund to capture additional opportunities while also enhancing its diversification. In addition, the Fund continues to target an overweight (i.e. the Fund’s sector position was greater than the benchmark position) to international stocks over domestic stocks, growth over value stocks, and large-cap over small-cap stocks.
The Fund’s performance is influenced not just by our asset allocation decisions, but also by the performance of the underlying funds in which it invests. For the overall period, the Fund benefited from fund selection decisions in both fixed income and equities. In keeping with the Fund’s long-term approach, we use cash flows to reallocate among the underlying funds whenever possible. However, a hard rebalance (i.e. a fund rebalancing to move the underlying fund investments to their target allocation percentages) was executed during the period in order to increase the Fund’s target allocation to stocks from 46.2% to 58% and decrease its target allocation to bonds from 53.8% to 42%.
What is the outlook?
The economy continues to face strong headwinds. Growth is likely to be weak until home prices stabilize and credit providers return to the business of lending rather than writing down assets. Despite the Fed’s sharp reductions in short-term interest rates, risk premiums (i.e. difference between the risk associated with buying or holding a Treasury and holding a high yield bond) remain high, which has kept borrowing costs high. However, there are encouraging signs. Lenders are moving to aggressively write down bad loans and the Fed has clearly signaled it stands ready to support the capital markets. Given that Fed policy actions have historically taken a few quarters to affect growth, the rate reductions of last year should begin to be felt in the near future, helping to restore order to the financial markets and setting the stage for recovery.
Composition by Underlying Fund
as of April 30, 2008
| | | | | |
| | | Percentage of |
| Fund Name | | Net Assets |
| |
| DJ Wilshire REIT ETF | | | 1.2 | % |
| The Hartford Capital Appreciation Fund, Class Y | | | 12.3 | |
| The Hartford Capital Appreciation II Fund, Class Y | | | 1.7 | |
| The Hartford Dividend and Growth Fund, Class Y | | | 3.4 | |
| The Hartford Equity Income Fund, Class Y | | | 3.2 | |
| The Hartford Floating Rate Fund, Class Y | | | 4.3 | |
| The Hartford Global Growth Fund, Class Y | | | 2.7 | |
| The Hartford Growth Fund, Class Y | | | 2.5 | |
| The Hartford Growth Opportunities Fund, Class Y | | | 2.1 | |
| The Hartford Income Fund, Class Y | | | 11.9 | |
| The Hartford Inflation Plus Fund, Class Y | | | 8.6 | |
| The Hartford International Opportunities Fund, Class Y | | | 6.7 | |
| The Hartford International Small Company Fund, Class Y | | | 5.0 | |
| The Hartford Select SmallCap Value Fund, Class Y | | | 2.5 | |
| The Hartford Short Duration Fund, Class Y | | | 4.5 | |
| The Hartford Small Company Fund, Class Y | | | 2.5 | |
| The Hartford Strategic Income Fund, Class Y | | | 4.3 | |
| The Hartford Total Return Bond Fund, Class Y | | | 8.4 | |
| The Hartford Value Fund, Class Y | | | 10.3 | |
| SPDR DJ Wilshire International Real Estate ETF | | | 1.4 | |
| Other Assets and Liabilities | | | 0.5 | |
| | | | | |
Total | | | 100.0 | % |
| | | | | |
86
The Hartford Target Retirement 2020 Fund
(subadvised by Hartford Investment Management Company)
Performance Overview(1) 9/30/05 — 4/30/08
Growth of a $10,000 investment in Class A which includes Sales Charge
Lehman Brothers U.S. Aggregate Bond Index is an unmanaged index and is composed of securities from the Lehman Brothers Government/Credit Bond Index, Mortgage-Backed Securities Index, Asset-Backed Index and Commercial Mortgage-Backed Securities Index.
S&P 500 Index is a market capitalization weighted price index composed of 500 widely held common stocks.
You cannot invest directly in an index.
Investment objective – seeks to maximize total return and secondarily, to seek capital preservation.
Average Annual Total Returns(2,3) (as of 4/30/08)
| | | | | | | | | | | | | |
| | | Inception | | 1 | | Since |
| | | Date | | Year | | Inception |
| |
| Target Retirement 2020 A# | | | 9/30/05 | | | | 1.20 | % | | | 6.57 | % |
| Target Retirement 2020 A## | | | 9/30/05 | | | | -4.37 | % | | | 4.26 | % |
| Target Retirement 2020 B# | | | 9/30/05 | | | | 0.43 | % | | | 5.77 | % |
| Target Retirement 2020 B## | | | 9/30/05 | | | | -4.39 | % | | | 4.70 | % |
| Target Retirement 2020 C# | | | 9/30/05 | | | | 0.47 | % | | | 5.78 | % |
| Target Retirement 2020 C## | | | 9/30/05 | | | | -0.49 | % | | | 5.78 | % |
| Target Retirement 2020 R3# | | | 9/30/05 | | | | 0.87 | % | | | 6.49 | % |
| Target Retirement 2020 R3## | | | 9/30/05 | | | | 0.87 | % | | | 6.49 | % |
| Target Retirement 2020 R4# | | | 9/30/05 | | | | 1.19 | % | | | 6.65 | % |
| Target Retirement 2020 R4## | | | 9/30/05 | | | | 1.19 | % | | | 6.65 | % |
| Target Retirement 2020 R5# | | | 9/30/05 | | | | 1.39 | % | | | 6.80 | % |
| Target Retirement 2020 R5## | | | 9/30/05 | | | | 1.39 | % | | | 6.80 | % |
| Target Retirement 2020 Y# | | | 9/30/05 | | | | 1.58 | % | | | 6.89 | % |
| | |
| # | | Without sales charge |
| |
| ## | | With sales charge |
PAST PERFORMANCE IS NOT INDICATIVE OF FUTURE RESULTS.
| (1) | | Growth of a $10,000 investment in Classes B, C, R3, R4, R5 and Y shares will vary from results seen above due to differences in the expenses charged to these share classes. |
| |
| (2) | | Class R3, R4 and R5 shares commenced operations on 12/22/06. Performance prior to 12/22/06 reflects Class Y performance. |
| |
| (3) | | The initial investment in Class A shares reflects the maximum sales charge and Classes B and C reflect CDSC. |
The value of shares will fluctuate so that, when redeemed, shares may be worth more or less than their original cost. The chart and table do not reflect the deduction of taxes that a shareholder would pay on fund distributions or the redemption of fund shares.
Performance information may reflect historical or current expense waivers/reimbursements from the investment adviser, without which performance would have been lower. For information on current expense waivers/reimbursements, please see the prospectus.
| | | |
Portfolio Managers | | |
Hugh Whelan | | Edward C. Caputo |
| Managing Director | | Assistant Vice President |
How did the Fund perform?
The Class A shares of The Hartford Target Retirement 2020 Fund returned -5.10%, before sales charge, for the six-month period ended April 30, 2008, versus -5.90% for Lipper Mixed-Asset Target 2020 Funds average, 4.08% for the Lehman Brothers U.S. Aggregate Bond Index, and -9.63% for the S&P 500 Index.
Why did the Fund perform this way?
The six-month period under review was challenging for both stocks and bonds, as credit and liquidity remained constrained, volatility was high, and concerns about a potential recession emerged. Although the Federal Reserve (the “Fed”) took considerable steps to help bolster the markets, including reducing the target federal funds rate on several occasions, establishing lending facilities that provided a back stop to both banks and brokers, and facilitating JPMorgan Chase’s rescue acquisition of Bear Stearns, investor confidence continued to erode. As a result, investors fled to the relative safety of Treasury securities, fueling their outperformance of all other sectors of the market for the overall period.
Within the fixed income market, the asset-backed securities segment was the worst performing sector and overall, high-yield asset classes such as U.S. high yield bonds, floating-rate notes, and emerging market bonds underperformed higher quality securities. Within domestic equities, mid-cap stocks outperformed large-cap and small-cap stocks. With regard to style, growth beat value within large-cap and mid-cap stocks but underperformed within small-cap stocks. Overall, international stocks slightly outperformed domestic stocks.
Over the course of the period, asset allocation decisions within equities detracted from the Fund’s performance. Specifically, allocations to small-cap growth, large-cap value, and international small-cap stocks held back returns. However, the negative impact was partially offset by the favorable performance of allocations to mid-cap and large-cap growth and international large-cap stocks. Asset allocation within the fixed income portion of the Fund also detracted from performance. Although allocations to Treasury Inflation Protected Securities (TIPS) and short-term bonds were additive to performance, they did not offset the unfavorable performance of allocations to floating-rate notes, high
87
yield bonds, and emerging market debt. Additionally, the duration of the Fund’s fixed income segment (a measure of interest-rate sensitivity) was targeted to be less than that of the broad fixed income market, as measured by the Lehman Brothers U.S. Aggregate Bond Index. This shorter duration also hindered performance as interest rates declined during the period.
During the reporting period, the Fund began utilizing exchange-traded funds (ETFs) to obtain asset class exposures unavailable through The Hartford fund family. Doing so enables the Fund to capture additional opportunities while also enhancing its diversification. In addition, the Fund continues to target an overweight (i.e. the Fund’s sector position was greater than the benchmark position) to international stocks over domestic stocks, growth over value stocks, and large-cap over small-cap stocks.
The Fund’s performance is influenced not just by our asset allocation decisions, but also by the performance of the underlying funds in which it invests. For the overall period, the Fund benefited from fund selection decisions in both fixed income and equities. In keeping with the Fund’s long-term approach, we use cash flows to reallocate among the underlying funds whenever possible. However, a hard rebalance (i.e. a fund rebalancing to move the underlying fund investments to their target allocation percentages) was executed during the period to increase the Fund’s allocation to stocks from 64.2% to 71% and decrease its allocation to bonds from 35.8% to 29%.
What is the outlook?
The economy continues to face strong headwinds. Growth is likely to be weak until home prices stabilize and credit providers return to the business of lending rather than writing down assets. Despite the Fed’s sharp reductions in short-term interest rates, risk premiums (i.e. difference between the risk associated with buying or holding a Treasury and holding a high yield bond) remain high, which has kept borrowing costs high. However, there are encouraging signs. Lenders are moving to aggressively write down bad loans and the Fed has clearly signaled it stands ready to support the capital markets. Given that Fed policy actions have historically taken a few quarters to affect growth, the rate reductions of last year should begin to be felt in the near future, helping to restore order to the financial markets and setting the stage for recovery.
Composition by Underlying Fund
as of April 30, 2008
| | | | | |
| | | Percentage of |
| Fund Name | | Net Assets |
| |
| The Hartford Capital Appreciation Fund, Class Y | | | 14.5 | % |
| The Hartford Capital Appreciation II Fund, Class Y | | | 2.9 | |
| The Hartford Dividend and Growth Fund, Class Y | | | 4.4 | |
| The Hartford Equity Income Fund, Class Y | | | 4.7 | |
| The Hartford Floating Rate Fund, Class Y | | | 3.0 | |
| The Hartford Global Growth Fund, Class Y | | | 2.6 | |
| The Hartford Growth Fund, Class Y | | | 2.8 | |
| The Hartford Growth Opportunities Fund, Class Y | | | 4.4 | |
| The Hartford Income Fund, Class Y | | | 5.1 | |
| The Hartford Inflation Plus Fund, Class Y | | | 6.2 | |
| The Hartford International Growth Fund, Class Y | | | 2.4 | |
| The Hartford International Opportunities Fund, Class Y | | | 5.4 | |
| The Hartford International Small Company Fund, Class Y | | | 6.8 | |
| The Hartford Select MidCap Value Fund, Class Y | | | 2.5 | |
| The Hartford Select SmallCap Value Fund, Class Y | | | 3.7 | |
| The Hartford Short Duration Fund, Class Y | | | 3.1 | |
| The Hartford Small Company Fund, Class Y | | | 2.6 | |
| The Hartford Strategic Income Fund, Class Y | | | 4.6 | |
| The Hartford Total Return Bond Fund, Class Y | | | 7.1 | |
| The Hartford Value Fund, Class Y | | | 10.5 | |
| SPDR DJ Wilshire International Real Estate ETF | | | 0.4 | |
| Other Assets and Liabilities | | | 0.3 | |
| | | | | |
Total | | | 100.0 | % |
| | | | | |
88
The Hartford Target Retirement 2030 Fund
(subadvised by Hartford Investment Management Company)
Performance Overview(1) 9/30/05 — 4/30/08
Growth of a $10,000 investment in Class A which includes Sales Charge
Lehman Brothers U.S. Aggregate Bond Index is an unmanaged index and is composed of securities from the Lehman Brothers Government/Credit Bond Index, Mortgage-Backed Securities Index, Asset-Backed Index and Commercial Mortgage-Backed Securities Index.
S&P 500 Index is a market capitalization weighted price index composed of 500 widely held common stocks.
You cannot invest directly in an index.
Investment objective – seeks to maximize total return and secondarily, to seek capital preservation.
Average Annual Total Returns(2,3) (as of 4/30/08)
| | | | | | | | | | | | | |
| | | Inception | | 1 | | Since |
| | | Date | | Year | | Inception |
| |
| Target Retirement 2030 A# | | | 9/30/05 | | | | 1.22 | % | | | 6.70 | % |
| Target Retirement 2030 A## | | | 9/30/05 | | | | -4.35 | % | | | 4.39 | % |
| Target Retirement 2030 B# | | | 9/30/05 | | | | 0.72 | % | | | 5.99 | % |
| Target Retirement 2030 B## | | | 9/30/05 | | | | -4.12 | % | | | 4.95 | % |
| Target Retirement 2030 C# | | | 9/30/05 | | | | 0.41 | % | | | 5.96 | % |
| Target Retirement 2030 C## | | | 9/30/05 | | | | -0.55 | % | | | 5.96 | % |
| Target Retirement 2030 R3# | | | 9/30/05 | | | | 0.85 | % | | | 6.59 | % |
| Target Retirement 2030 R3## | | | 9/30/05 | | | | 0.85 | % | | | 6.59 | % |
| Target Retirement 2030 R4# | | | 9/30/05 | | | | 1.15 | % | | | 6.76 | % |
| Target Retirement 2030 R4## | | | 9/30/05 | | | | 1.15 | % | | | 6.76 | % |
| Target Retirement 2030 R5# | | | 9/30/05 | | | | 1.23 | % | | | 6.83 | % |
| Target Retirement 2030 R5## | | | 9/30/05 | | | | 1.23 | % | | | 6.83 | % |
| Target Retirement 2030 Y# | | | 9/30/05 | | | | 1.63 | % | | | 7.03 | % |
| | |
| # | | Without sales charge |
| |
| ## | | With sales charge |
PAST PERFORMANCE IS NOT INDICATIVE OF FUTURE RESULTS.
| (1) | | Growth of a $10,000 investment in Classes B, C, R3, R4, R5 and Y shares will vary from results seen above due to differences in the expenses charged to these share classes. |
| |
| (2) | | Class R3, R4 and R5 shares commenced operations on 12/22/06. |
| |
| | | Performance prior to 12/22/06 reflects Class Y performance. |
| |
| (3) | | The initial investment in Class A shares reflects the maximum sales charge and Classes B and C reflect CDSC. |
The value of shares will fluctuate so that, when redeemed, shares may be worth more or less than their original cost. The chart and table do not reflect the deduction of taxes that a shareholder would pay on fund distributions or the redemption of fund shares.
Performance information may reflect historical or current expense waivers/reimbursements from the investment adviser, without which performance would have been lower. For information on current expense waivers/reimbursements, please see the prospectus.
| | | |
Portfolio Managers | | |
Hugh Whelan | | Edward C. Caputo |
| Managing Director | | Assistant Vice President |
How did the Fund perform?
The Class A shares of The Hartford Target Retirement 2030 Fund returned -6.85%, before sales charge, for the six-month period ended April 30, 2008, versus -8.71% for the Lipper Mixed-Asset Target 2030 Funds average, 4.08% for the Lehman Brothers U.S. Aggregate Bond Index, and -9.63% for the S&P 500 Index.
Why did the Fund perform this way?
The six-month period under review was challenging for both stocks and bonds, as credit and liquidity remained constrained, volatility was high, and concerns about a potential recession emerged. Although the Federal Reserve (the “Fed”) took considerable steps to help bolster the markets, including reducing the target federal funds rate on several occasions, establishing lending facilities that provided a back stop to both banks and brokers, and facilitating JPMorgan Chase’s rescue acquisition of Bear Stearns, investor confidence continued to erode. As a result, investors fled to the relative safety of Treasury securities, fueling their outperformance of all other sectors of the market for the overall period.
Within the fixed income market, the asset-backed securities segment was the worst performing sector and overall, high-yield asset classes such as U.S. high yield bonds, floating-rate notes, and emerging market bonds underperformed higher quality securities. Within domestic equities, mid-cap stocks outperformed large-cap and small-cap stocks. With regard to style, growth beat value within large-cap and mid-cap stocks but underperformed within small-cap stocks. Overall, international stocks slightly outperformed domestic stocks.
Over the course of the period, asset allocation decisions within equities detracted from the Fund’s performance. Specifically, allocations to small-cap growth, small-cap value, and international small-cap stocks held back returns. However, the negative impact was partially offset by the favorable performance of allocations to mid-cap and large-cap growth and international large-cap stocks. Asset allocation within the
89
fixed income portion of the Fund also detracted from performance. Although allocations to Treasury Inflation Protected Securities (TIPS) and short-term bonds were additive to performance, they did not offset the unfavorable performance of allocations to floating-rate notes, high yield bonds, and emerging market debt. Additionally, the duration of the Fund’s fixed income segment (a measure of interest-rate sensitivity) was targeted to be less than that of the broad fixed income market, as measured by the Lehman Brothers U.S. Aggregate Bond Index. This shorter duration also hindered performance as interest rates declined during the period.
During the reporting period, the Fund began utilizing exchange-traded funds (ETFs) to obtain asset class exposures unavailable through The Hartford fund family. Doing so enables the Fund to capture additional opportunities while also enhancing its diversification. In addition, the Fund continues to target an overweight (i.e. the Fund’s sector position was greater than the benchmark position) to international stocks over domestic stocks, growth over value stocks, and large-cap over small-cap stocks.
The Fund’s performance is influenced not just by our asset allocation decisions, but also by the performance of the underlying funds in which it invests. For the overall period, the Fund benefited from fund selection decisions in both fixed income and equities. In keeping with the Fund’s long-term approach, we use cash flows to reallocate among the underlying funds whenever possible. However, a hard rebalance (i.e. a fund rebalancing to move the underlying fund investments to their target allocation percentages) was executed during the period in order to increase the Fund’s allocation to stocks from 79.2% to 82% and decrease its allocation to bonds from 20.8% to 18%.
What is the outlook?
The economy continues to face strong headwinds. Growth is likely to be weak until home prices stabilize and credit providers return to the business of lending rather than writing down assets. Despite the Fed’s sharp reductions in short-term interest rates, risk premiums (i.e. difference between the risk associated with buying or holding a Treasury and holding a high yield bond) remain high, which has kept borrowing costs high. However, there are encouraging signs. Lenders are moving to aggressively write down bad loans and the Fed has clearly signaled it stands ready to support the capital markets. Given that Fed policy actions have historically taken a few quarters to affect growth, the rate reductions of last year should begin to be felt in the near future, helping to restore order to the financial markets and setting the stage for recovery.
Composition by Underlying Fund
as of April 30, 2008
| | | | | |
| | | Percentage of |
| Fund Name | | Net Assets |
| |
| DJ Wilshire REIT ETF | | | 0.2 | % |
| The Hartford Capital Appreciation Fund, Class Y | | | 18.5 | |
| The Hartford Capital Appreciation II Fund, Class Y | | | 2.6 | |
| The Hartford Dividend and Growth Fund, Class Y | | | 4.2 | |
| The Hartford Equity Income Fund, Class Y | | | 4.6 | |
| The Hartford Global Growth Fund, Class Y | | | 3.4 | |
| The Hartford Growth Fund, Class Y | | | 3.5 | |
| The Hartford Growth Opportunities Fund, Class Y | | | 4.1 | |
| The Hartford Inflation Plus Fund, Class Y | | | 5.4 | |
| The Hartford International Growth Fund, Class Y | | | 2.4 | |
| The Hartford International Opportunities Fund, Class Y | | | 5.3 | |
| The Hartford International Small Company Fund, Class Y | | | 7.3 | |
| The Hartford Select MidCap Value Fund, Class Y | | | 3.1 | |
| The Hartford Select SmallCap Value Fund, Class Y | | | 5.3 | |
| The Hartford Short Duration Fund, Class Y | | | 3.1 | |
| The Hartford Small Company Fund, Class Y | | | 3.1 | |
| The Hartford Total Return Bond Fund, Class Y | | | 10.1 | |
| The Hartford Value Fund, Class Y | | | 12.4 | |
| SPDR DJ Wilshire International Real Estate ETF | | | 1.1 | |
| Other Assets and Liabilities | | | 0.3 | |
| | | | | |
Total | | | 100.0 | % |
| | | | | |
90
The Hartford Tax-Free California Fund
(subadvised by Hartford Investment Management Company)
Performance Overview(1) 10/31/02 — 4/30/08
Growth of a $10,000 investment in Class A which includes Sales Charge
Lehman Brothers California Municipal Bond Index is an unmanaged index of municipal bonds issued by the State of California with maturities greater than two years.
You cannot invest directly in an index.
Investment objective – Seeks to provide current income exempt from both federal and California income tax.
Average Annual Total Returns(2) (as of 4/30/08)
| | | | | | | | | | | | | | | | | |
| | | Inception | | 1 | | 5 | | Since |
| | | Date | | Year | | Year | | Inception |
| |
| Tax-Free California A# | | | 10/31/02 | | | | -5.15 | % | | | 2.76 | % | | | 3.11 | % |
| Tax-Free California A## | | | 10/31/02 | | | | -9.42 | % | | | 1.82 | % | | | 2.25 | % |
| Tax-Free California B# | | | 10/31/02 | | | | -5.97 | % | | | 1.97 | % | | | 2.32 | % |
| Tax-Free California B## | | | 10/31/02 | | | | -10.50 | % | | | 1.62 | % | | | 2.17 | % |
| Tax-Free California C# | | | 10/31/02 | | | | -5.86 | % | | | 2.03 | % | | | 2.38 | % |
| Tax-Free California C## | �� | | 10/31/02 | | | | -6.77 | % | | | 2.03 | % | | | 2.38 | % |
| | |
| # | | Without sales charge |
| |
| ## | | With sales charge |
PAST PERFORMANCE IS NOT INDICATIVE OF FUTURE RESULTS.
| (1) | | Growth of a $10,000 investment in Classes B and C shares will vary from results seen above due to differences in the expenses charged to these share classes. |
| |
| (2) | | The initial investment in Class A shares reflects the maximum sales charge and Classes B and C reflect CDSC. |
The value of shares will fluctuate so that, when redeemed, shares may be worth more or less than their original cost. The chart and table do not reflect the deduction of taxes that a shareholder would pay on fund distributions or the redemption of fund shares.
Performance information may reflect historical or current expense waivers/reimbursements from the investment adviser, without which performance would have been lower. For information on current expense waivers/reimbursements, please see the prospectus.
| | | |
Portfolio Managers | | |
Charles Grande | | Christopher Bade |
| Executive Vice President | | Vice President |
How did the Fund perform?
The Class A shares of The Hartford Tax-Free California Fund returned -3.65%, before sales charge, for the six-month period ended April 30, 2008, versus its benchmark, the Lehman Brothers California Municipal Bond Index, which returned 1.08%, and the -0.71% average return of the Lipper California Municipal Debt Funds category, a group of funds with investment strategies similar to those of the Fund.
Why did the Fund perform this way?
The Fund’s exposure to higher-yielding, lower-rated bonds (triple-B and below) was one of the primary detractors from performance for the period. The Fund currently holds 55% of its assets in lower rated bonds, which generally results in greater exposure to credit risk than its benchmark. The flight to quality that took place during the period, coupled with credit rating downgrades of various major monoline bond insurers, forced selling by hedge funds, and the deterioration of the variable rate and auction rate markets led to significant volatility and price declines in the market, particularly in the high-yield sector. As a result, the high-yield municipal market (as measured by the Lehman Brothers High Yield Municipal Bond Index) returned -5.67% for the six-month period and high-yield credit spreads widened (i.e. short and long term interest rates moving farther apart) by 113 basis points. Spreads in investment-grade municipals widened by 60 basis points.
The Fund’s longer duration (a measure of interest-rate sensitivity), which resulted from its considerable exposure to the long end of the municipal yield curve, was also a major detractor from performance. The Fund’s duration is currently 8.2 years versus the benchmark of 7.2 years. During the period, the municipal curve steepened and the long end underperformed both the intermediate and short segments of the curve. As a result, the yield differential between two-year and 30-year maturities increased by 119 basis points to 226 basis points.
Over the course of the period we did, however, reduce the Fund’s duration (from 9.1 years to 8.2 years) through the sale of long-maturity issues and purchase of short-maturity issues while trimming exposure to lower-rated securities (from a high of 60% to 55%) in favor of higher-quality bonds. These strategies helped to decrease the Fund’s underperformance relative (i.e. performance of the Fund as measured against the benchmark) to its benchmark.
The Fund’s lack of leverage benefited performance, as did its limited exposure to bond insurer credit downgrades. Conversely, holdings in special assessment bonds hindered returns as this sector continues to be negatively impacted by the national housing slowdown and the boom/bust nature of the California housing market.
91
What is your outlook?
The economy continues to face strong headwinds. Growth is likely to be weak until home prices stabilize and credit providers return to the business of lending rather than writing down assets. Despite the Federal Reserve’s (the “Fed”) sharp reductions in short-term interest rates, risk premiums (i.e. difference between the risk associated with buying or holding a Treasury and holding a high yield bond) remain high, which has kept borrowing costs high. However, there are encouraging signs. Lenders are moving to aggressively write down bad loans and the Fed has clearly signaled it stands ready to support the capital markets. Given that Fed policy actions have historically taken a few quarters to affect growth, the rate reductions of last year should begin to be felt in the near future, helping to restore order to the financial markets and setting the stage for recovery.
We believe the underlying credit fundamentals of the municipal market will continue to weaken as long as the housing crisis, economic slowdown and bond insurer troubles continue to weigh on the market. This is especially true in the State of California (rated A1/A+) where the housing slowdown and its worsening economic climate have resulted in a larger than expected decline in tax revenue (personal income, sales and business taxes) leading to significant budgetary shortfalls and the issuance of $3.3 billion of deficit funding bonds in 2008. The governor’s proposed 2009 budget projected a combined cumulative fiscal years ending 2008 and 2009 budget gap of approximately $13 billion, or almost 14% of expenditures. The governor’s proposals to reduce the budget gap (including across-the-board cuts of 10% in 2009), if fully implemented, would leave a $2.8 billion general fund reserve at fiscal end 2009, or 2.8% of expenditures. However, the state legislative analyst projects revenues $1.5 billion worse at fiscal end 2009 than the governor’s budget. Nonetheless, the State’s financial operations will continue to remain volatile due to wide revenue swings related to its boom/bust economic cycles, persistent expenditure pressures arising from population growth, education spending policies and the politically charged state government that weakens its financial flexibility compared to other states.
With tax revenue growth slowing, we remain cautious and particularly selective with regard to high-yield bonds. Although demand from non-traditional buyers such as hedge funds remains spotty, demand from traditional buyers (insurance companies, individuals and mutual funds) has significantly improved in recent weeks, which has helped reduce the demand/supply imbalance that has negatively impacted market performance. However, we expect supply to remain relatively heavy throughout the remainder of this year. While municipal bond prices have risen recently, we believe they still offer tremendous value relative to taxable securities. In our view, this attractive pricing is unsustainable. We plan to continue to upgrade the credit quality of the Fund and further reduce its duration.
Finally, the U.S. Supreme Court recently released its long-awaited decision in the Davis v. Kentucky Department of Revenue case, upholding the constitutionality of state laws that tax interest on out-of-state municipal bonds while exempting municipal bonds of in-state issuers. The decision preserves the status quo regarding state taxation of municipal bond interest and thus eliminates a potentially profound and largely uncertain impact on the municipal market going forward. More importantly, the decision preserves the state tax preferences that induce state residents to favor their own state’s municipal bonds and that have promoted the growth of single-state municipal bond funds.
Diversification by Industry
as of April 30, 2008
| | | | | |
| | | Percentage of |
| Industry | | Net Assets |
| |
| Airport Revenues | | | 2.4 | % |
| General Obligations | | | 2.5 | |
| Health Care/Services | | | 8.9 | |
| Higher Education (Univ., Dorms, etc.) | | | 14.3 | |
| Housing (HFA’s, etc.) | | | 1.1 | |
| Industrial | | | 3.2 | |
| Miscellaneous | | | 3.9 | |
| Pollution Control | | | 1.8 | |
| Prerefunded | | | 6.5 | |
| Public Facilities | | | 1.3 | |
| Special Tax Assessment | | | 26.7 | |
| Tax Allocation | | | 8.7 | |
| Utilities — Electric | | | 5.1 | |
| Utilities — Gas | | | 4.9 | |
| Utilities — Water and Sewer | | | 2.9 | |
| Short-Term Investments | | | 5.6 | |
| Other Assets and Liabilities | | | 0.2 | |
| | | | | |
Total | | | 100.0 | % |
| | | | | |
Distribution by Credit Quality
as of April 30, 2008
| | | | | |
| | | Percentage of |
| | | Long-Term |
| Rating | | Holdings |
| |
| AAA | | | 16.9 | |
| AA | | | 5.5 | |
| A | | | 21.2 | |
| BBB | | | 19.8 | |
| NR | | | 36.6 | |
| | | | | |
Total | | | 100.0 | % |
| | | | | |
92
The Hartford Tax-Free Minnesota Fund
(subadvised by Hartford Investment Management Company)
Performance Overview(1,2) 4/30/98 — 4/30/08
Growth of a $10,000 investment in Class A which includes Sales Charge
Lehman Brothers Municipal Bond Index is an unmanaged index of municipal bonds with maturities greater than two years.
You cannot invest directly in an index.
The value of shares will fluctuate so that, when redeemed, shares may be worth more or less than their original cost. The chart and table do not reflect the deduction of taxes that a shareholder would pay on fund distributions or the redemption of fund shares.
Performance information may reflect historical or current expense waivers/reimbursements from the investment adviser, without which performance would have been lower. For information on current expense waivers/reimbursements, please see the prospectus.
Investment objective – Seeks to provide current income exempt from both federal income tax and Minnesota state personal income tax.
Average Annual Total Returns(1,3) (as of 4/30/08)
| | | | | | | | | | | | | | | | | | | | | |
| | | Inception | | 1 | | 5 | | 10 | | Since |
| | | Date | | Year | | Year | | Year | | Inception |
| |
| Tax-Free Minnesota A# | | | 6/02/86 | | | | -0.49 | % | | | 3.04 | % | | | 4.11 | % | | | 5.51 | % |
| Tax-Free Minnesota A## | | | 6/02/86 | | | | -4.96 | % | | | 2.10 | % | | | 3.63 | % | | | 5.29 | % |
| Tax-Free Minnesota B# | | | 11/14/94 | | | | -1.33 | % | | | 2.28 | % | | NA | * | | NA | * |
| Tax-Free Minnesota B## | | | 11/14/94 | | | | -6.10 | % | | | 1.94 | % | | NA | * | | NA | * |
| Tax-Free Minnesota C# | | | 11/14/94 | | | | -1.33 | % | | | 2.27 | % | | | 3.29 | % | | | 4.25 | % |
| Tax-Free Minnesota C## | | | 11/14/94 | | | | -2.28 | % | | | 2.27 | % | | | 3.29 | % | | | 4.25 | % |
| Tax-Free Minnesota L# | | | 11/14/94 | | | | -0.63 | % | | | 3.00 | % | | | 4.08 | % | | | 5.03 | % |
| Tax-Free Minnesota L## | | | 11/14/94 | | | | -5.11 | % | | | 2.06 | % | | | 3.60 | % | | | 4.67 | % |
| Tax-Free Minnesota Y# | | | 2/19/02 | | | | -0.34 | % | | | 3.13 | % | | NA | | | 3.85 | % |
| | |
| # | | Without sales charge |
| |
| ## | | With sales charge |
| |
| NA | | Not Applicable |
| |
| * | | 10 year and inception returns are not applicable for Class B because after 8 years Class B converts to Class A. |
PAST PERFORMANCE IS NOT INDICATIVE OF FUTURE RESULTS.
| (1) | | Classes A, B and C were offered beginning on 2/19/02. |
| |
| | | Performance prior to that date is that of the fund’s Classes E, M and N shares, respectively, which have lower operating expenses. Performance prior to 2/19/02 would have been lower if Classes A, B and C shares expenses were applied during that period. Classes E, M and N are no longer offered. |
| |
| (2) | | Growth of a $10,000 investment in Classes B, C, L and Y shares will vary from results seen above due to differences in the expenses charged to these share classes. |
| |
| (3) | | The initial investment in Classes A and L shares reflects the maximum sales charge and Classes B and C reflect CDSC. |
| | | |
Portfolio Managers | | |
Charles Grande | | Christopher Bade |
| Executive Vice President | | Vice President |
How did the Fund perform?
The Class A shares of The Hartford Tax-Free Minnesota Fund returned 0.00%, before sales charge, for the six-month period ended April 30, 2008, versus its benchmark, the Lehman Brothers Municipal Bond Index, which returned 1.47%, and the 0.64% average return of the Lipper Minnesota Municipal Debt Funds category, a group of funds with investment strategies similar to those of the Fund.
Why did the Fund perform this way?
The Fund’s exposure to higher-yielding, lower-rated bonds (triple-B and below) was the primary detractor from performance for the period. The Fund currently holds 46% of its assets in lower rated bonds, which generally results in greater exposure to credit risk than its benchmark. The flight to quality that took place during the period, coupled with credit rating downgrades of various major monoline bond insurers, forced selling by hedge funds, and the deterioration of the variable rate and auction rate markets led to significant volatility and price declines in the market, particularly in the high-yield sector. As a result, the high- yield municipal market (as measured by the Lehman Brothers High Yield Municipal Bond Index) returned -5.67% for the six-month period and high-yield credit spreads widened (i.e. short and long term interest rates moving farther apart) by 113 basis points. Spreads in investment-grade municipals widened by 60 basis points.
Positive contributors to performance included the Fund’s relatively low exposure to the long end of the municipal yield curve, resulting in a relatively moderate duration (a measure of interest-rate sensitivity) of 7.0 years. During the period, the municipal curve steepened and the long end underperformed both the intermediate and short segments of the curve. As a result, the yield differential between two-year and 30-year maturities increased by 119 basis points to 226 basis points. Holdings in higher-quality bonds, specifically general obligation, insured, and pre-refunded bonds (43% of Fund assets), were also additive to returns as these issues benefited from the flight to quality that occurred during the period. The Fund’s lack of leverage was also beneficial, as was its limited exposure to bond insurer credit downgrades.
93
What is your outlook?
The economy continues to face strong headwinds. Growth is likely to be weak until home prices stabilize and credit providers return to the business of lending rather than writing down assets. Despite the Federal Reserve’s (the “Fed”) sharp reductions in short-term interest rates, risk premiums (i.e. difference between the risk associated with buying or holding a Treasury and holding a high yield bond) remain high, which has kept borrowing costs high. However, there are encouraging signs. Lenders are moving to aggressively write down bad loans and the Fed has clearly signaled it stands ready to support the capital markets. Given that Fed policy actions have historically taken a few quarters to affect growth, the rate reductions of last year should begin to be felt in the near future, helping to restore order to the financial markets and setting the stage for recovery.
We believe the underlying credit fundamentals of the municipal market will continue to weaken as long as the housing crisis, economic slowdown and bond insurer troubles continue to weigh on the market. This is true in the State of Minnesota (rated Aa1/AAA) where the housing slowdown and its worsening economic climate has resulted in lower than projected tax revenue (personal income, sales and corporate income taxes) and a greater than anticipated budget gap of about $935 million over the biennium. The governor and legislature are expected to address this shortfall in the current legislative session, which does not include a tax increase. The governor has remained firm on not increasing taxes, and in the 2007 legislative session he vetoed bills that would have resulted in a tax increase. The final 2008-2009 biennial budget of $55 billion includes $34.5 billion in spending in the general fund, representing a 9.6% increase from the previous biennium. However, the State currently has significant built up reserves (over $3.0 billion currently) that give it the flexibility to respond to unanticipated fiscal challenges.
With tax revenue growth slowing, we remain cautious and particularly selective with regard to high-yield bonds. Although demand from non-traditional buyers such as hedge funds remains spotty, demand from traditional buyers (insurance companies, individuals and mutual funds) has significantly improved in recent weeks, which has helped reduce the demand/supply imbalance that has negatively impacted market performance. However, we expect supply to remain relatively heavy throughout the remainder of this year. While municipal bond prices have risen recently, we believe they still offer tremendous value relative to taxable securities. In our view, this attractive pricing is unsustainable. Given the extreme steepness of the municipal yield curve, we plan to slightly extend the Fund’s duration while maintaining its credit quality by balancing purchases of high-quality and high-yield securities.
Finally, the U.S. Supreme Court recently released its long-awaited decision in the Davis v. Kentucky Department of Revenue case, upholding the constitutionality of state laws that tax interest on out-of-state municipal bonds while exempting municipal bonds of in-state issuers. The decision preserves the status quo regarding state taxation of municipal bond interest and thus eliminates a potentially profound and largely uncertain impact on the municipal market going forward. More importantly, the decision preserves the state tax preferences that induce state residents to favor their own state’s municipal bonds and that have promoted the growth of single-state municipal bond funds.
Diversification by Industry
as of April 30, 2008
| | | | | |
| | | Percentage of |
| Industry | | Net Assets |
| |
| Airport Revenues | | | 2.9 | % |
| General Obligations | | | 14.0 | |
| Health Care/Services | | | 19.3 | |
| Higher Education (Univ., Dorms, etc.) | | | 15.9 | |
| Housing (HFA’s, etc.) | | | 7.3 | |
| Industrial | | | 2.1 | |
| Miscellaneous | | | 2.7 | |
| Pollution Control | | | 1.4 | |
| Prerefunded | | | 20.5 | |
| Public Facilities | | | 3.3 | |
| Tax Allocation | | | 3.3 | |
| Utilities — Electric | | | 2.3 | |
| Utilities — Water and Sewer | | | 3.3 | |
| Short-Term Investments | | | 2.5 | |
| Other Assets and Liabilities | | | (0.8 | ) |
| | | | | |
Total | | | 100.0 | % |
| | | | | |
Distribution by Credit Quality
as of April 30, 2008
| | | | | |
| | | Percentage of |
| | | Long-Term |
| Rating | | Holdings |
| |
| AAA | | | 20.4 | |
| AA | | | 16.7 | |
| A | | | 14.4 | |
| BBB | | | 28.7 | |
| NR | | | 19.8 | |
| | | | | |
Total | | | 100.0 | % |
| | | | | |
94
The Hartford Tax-Free National Fund
(subadvised by Hartford Investment Management Company)
Performance Overview(1,2) 4/30/98 — 4/30/08
Growth of a $10,000 investment in Class A which includes Sales Charge
Lehman Brothers Municipal Bond Index is an unmanaged index of municipal bonds with maturities greater than two years.
You cannot invest directly in an index.
The value of shares will fluctuate so that, when redeemed, shares may be worth more or less than their original cost. The chart and table do not reflect the deduction of taxes that a shareholder would pay on fund distributions or the redemption of fund shares.
Performance information may reflect historical or current expense waivers/reimbursements from the investment adviser, without which performance would have been lower. For information on current expense waivers/reimbursements, please see the prospectus.
Investment objective – Seeks to provide current income exempt from federal income tax.
Average Annual Total Returns(2,3) (as of 4/30/08)
| | | | | | | | | | | | | | | | | | | | | |
| | | Inception | | 1 | | 5 | | 10 | | Since |
| | | Date | | Year | | Year | | Year | | Inception |
| |
| Tax-Free National A# | | | 6/02/86 | | | | -4.25 | % | | | 2.90 | % | | | 4.22 | % | | | 5.86 | % |
| Tax-Free National A## | | | 6/02/86 | | | | -8.56 | % | | | 1.96 | % | | | 3.74 | % | | | 5.64 | % |
| Tax-Free National B# | | | 11/14/94 | | | | -4.91 | % | | | 2.16 | % | | NA | * | | NA | * |
| Tax-Free National B## | | | 11/14/94 | | | | -9.49 | % | | | 1.83 | % | | NA | * | | NA | * |
| Tax-Free National C# | | | 11/14/94 | | | | -4.90 | % | | | 2.18 | % | | | 3.37 | % | | | 4.52 | % |
| Tax-Free National C## | | | 11/14/94 | | | | -5.82 | % | | | 2.18 | % | | | 3.37 | % | | | 4.52 | % |
| Tax-Free National I# | | | 2/19/02 | | | | -3.85 | % | | | 2.99 | % | | NA | | | 3.83 | % |
| Tax-Free National I## | | | 2/19/02 | | | | -3.85 | % | | | 2.99 | % | | NA | | | 3.83 | % |
| Tax-Free National L# | | | 11/14/94 | | | | -4.23 | % | | | 2.90 | % | | | 4.11 | % | | | 5.29 | % |
| Tax-Free National L## | | | 11/14/94 | | | | -8.54 | % | | | 1.96 | % | | | 3.63 | % | | | 4.93 | % |
| Tax-Free National Y# | | | 2/19/02 | | | | -4.03 | % | | | 3.08 | % | | NA | | | 4.00 | % |
| | |
| # | | Without sales charge |
| |
| ## | | With sales charge |
| |
| NA | | Not Applicable |
| |
| * | | 10 year and inception returns are not applicable for Class B because after 8 years Class B converts to Class A. |
PAST PERFORMANCE IS NOT INDICATIVE OF FUTURE RESULTS.
| (1) | | Growth of a $10,000 investment in Classes B, C, L and Y shares will vary from results seen above due to differences in the expenses charged to these share classes. |
| |
| (2) | | Classes A, B and C were offered beginning on 2/19/02. Performance prior to that date is that of the fund’s Classes L, M and N shares, respectively, which have lower operating expenses. Performance prior to 2/19/02 would have been lower if Classes A, B and C shares expenses were applied during that period. (Classes M and N are no longer offered.) Class I shares commenced operations on 5/31/07. Performance prior to 5/31/07 reflects Class A performance. |
| |
| (3) | | The initial investment in Classes A and L shares reflects the maximum sales charge and Classes B and C reflect CDSC. |
| | | |
Portfolio Managers | | |
Charles Grande | | Christopher Bade |
| Executive Vice President | | Vice President |
How did the Fund perform?
The Class A shares of The Hartford Tax-Free National Fund returned -3.01%, before sales charge, for the six-month period ended April 30, 2008, versus its benchmark, the Lehman Brothers Municipal Bond Index, which returned 1.47%, and the 0.13% average return of the Lipper General Municipal Debt Funds category, a group of funds with investment strategies similar to those of the Fund.
Why did the Fund perform this way?
The Fund’s exposure to higher-yielding, lower-rated bonds (triple-B and below) was one of the primary detractors from performance for the period. The Fund currently holds 45% of its assets in lower rated bonds, which generally results in greater exposure to credit risk than its benchmark. The flight to quality that took place during the period, coupled with credit rating downgrades of various major monoline bond insurers, forced selling by hedge funds, and the deterioration of the variable rate and auction rate markets led to significant volatility and price declines in the market, particularly in the high-yield sector. As a result, the high-yield municipal market (as measured by the Lehman Brothers High Yield Municipal Bond Index) returned -5.67% for the six-month period and high-yield credit spreads widened (i.e. short and long term interest rates moving farther apart) by 113 basis points. Spreads in investment-grade municipals widened by 60 basis points.
The Fund’s longer duration (a measure of interest-rate sensitivity), which resulted from considerable exposure to the long end of the municipal yield curve, was also a major detractor from performance. The Fund’s duration is currently 7.3 years versus the benchmark of 6.83 years. During the period, the municipal curve steepened with the yield differential between two-year and 30-year maturities increasing by 119 basis points to 226 basis points. As a result, the long end of the curve underperformed both the intermediate and short segments of the curve.
Over the course of the period we did, however, reduce the Fund’s duration (from 8.3 years to 7.3 years) through the sale of long-maturity issues and purchase of short-maturity issues while trimming exposure to lower-rated securities (from over 50% to 45%) in favor of higher-quality bonds. These strategies helped to decrease the Fund’s
95
underperformance relative (i.e. performance of the Fund as measured against the benchmark) to its benchmark.
Early this year, we reduced the Fund’s holdings in unsecured special facility airline bonds, which was beneficial as this was the worst-performing sector for the six-month period. We expect to reenter this sector, but only on a secured basis, as pricing becomes more attractive. The Fund’s lack of leverage also benefited performance, as did its limited exposure to bond insurer credit downgrades and to zero-coupon bonds, which performed poorly during the period. Conversely, holdings in special assessment bonds hindered returns as the sector continues to be negatively impacted by the national housing slowdown and increasing delinquencies and foreclosures.
What is your outlook?
The economy continues to face strong headwinds. Growth is likely to be weak until home prices stabilize and credit providers return to the business of lending rather than writing down assets. Despite the Federal Reserve’s (the “Fed”) sharp reductions in short-term interest rates, risk premiums (i.e. difference between the risk associated with buying or holding a Treasury and holding a high yield bond) remain high, which has kept borrowing costs high. However, there are encouraging signs. Lenders are moving to aggressively write down bad loans and the Fed has clearly signaled it stands ready to support the capital markets. Given that Fed policy actions have historically taken a few quarters to affect growth, the rate reductions of last year should begin to be felt in the near future, helping to restore order to the financial markets and setting the stage for recovery.
We believe the underlying credit fundamentals of the municipal market will continue to weaken as long as the housing crisis, economic slowdown and bond insurer troubles continue to weigh on the market. With tax revenue growth slowing, we remain cautious and particularly selective with regard to high-yield bonds. Although demand from non-traditional buyers such as hedge funds remains spotty, demand from traditional buyers (insurance companies, individuals and mutual funds) has significantly improved in recent weeks, which has helped reduce the demand/supply imbalance that has negatively impacted market performance. However, we expect supply to remain relatively heavy throughout the remainder of this year. While municipal bond prices have risen recently, we believe they still offer tremendous value relative to taxable securities. In our view, this attractive pricing is unsustainable. Given the extreme steepness of the municipal yield curve, we plan to slightly extend the Fund’s duration while maintaining its credit quality by balancing purchases of high-quality and high-yield securities.
Finally, the U.S. Supreme Court recently released its long-awaited decision in the Davis v. Kentucky Department of Revenue case, upholding the constitutionality of state laws that tax interest on out-of-state municipal bonds while exempting municipal bonds of in-state issuers. The decision preserves the status quo regarding state taxation of municipal bond interest and thus eliminates a potentially profound and largely uncertain impact on the municipal market going forward.
Distribution by Credit Quality
as of April 30, 2008
| | | | | |
| | | Percentage of |
| | | Long-Term |
| Rating | | Holdings |
| |
| AAA | | | 20.0 | |
| AA | | | 13.4 | |
| A | | | 24.4 | |
| BBB | | | 12.4 | |
| BB | | | 4.7 | |
| B | | | 0.5 | |
| CCC | | | 0.4 | |
| NR | | | 24.2 | |
| | | | | |
Total | | | 100.0 | % |
| | | | | |
Diversification by Industry
as of April 30, 2008
| | | | | |
| | | Percentage of |
| Industry | | Net Assets |
| |
| Basic Materials | | | 14.6 | % |
| Capital Goods | | | 8.9 | |
| Consumer Cyclical | | | 8.6 | |
| Consumer Staples | | | 1.1 | |
| Energy | | | 8.5 | |
| Finance | | | 8.7 | |
| Health Care | | | 10.5 | |
| Services | | | 6.5 | |
| Technology | | | 30.6 | |
| Transportation | | | 0.8 | |
| Short-Term Investments | | | 3.7 | |
| Other Assets and Liabilities | | | (2.5 | ) |
| | | | | |
Total | | | 100.0 | % |
| | | | | |
Distribution by State
as of April 30, 2008
| | | | | |
| | | Percentage of |
| State | | Net Assets |
| |
| Alabama | | | 1.0 | % |
| Alaska | | | 0.5 | |
| Arizona | | | 2.5 | |
| California | | | 16.2 | |
| Colorado | | | 5.8 | |
| Florida | | | 10.9 | |
| Georgia | | | 7.0 | |
| Illinois | | | 7.1 | |
| Indiana | | | 0.3 | |
| Iowa | | | 0.4 | |
| Kansas | | | 0.8 | |
| Kentucky | | | 0.1 | |
| Louisiana | | | 1.7 | |
| Maryland | | | 1.3 | |
| Massachusetts | | | 0.5 | |
| Michigan | | | 2.3 | |
| Minnesota | | | 2.4 | |
| Mississippi | | | 0.1 | |
| Missouri | | | 1.4 | |
| Nevada | | | 1.2 | |
| New Hampshire | | | 0.4 | |
| New Jersey | | | 1.2 | |
| New Mexico | | | 2.2 | |
| New York | | | 6.2 | |
| North Carolina | | | 1.0 | |
| Ohio | | | 0.9 | |
| Oklahoma | | | 0.6 | |
| Other U.S. Territories | | | 0.4 | |
| Pennsylvania | | | 4.7 | |
| Rhode Island | | | 0.6 | |
| South Carolina | | | 4.6 | |
| Tennessee | | | 0.1 | |
| Texas | | | 5.7 | |
| Vermont | | | 1.2 | |
| Virginia | | | 3.0 | |
| Washington | | | 1.4 | |
| Wisconsin | | | 0.7 | |
| Short-Term Investments | | | 4.2 | |
| Other Assets and Liabilities | | | (2.6 | ) |
| | | | | |
Total | | | 100.0 | % |
| | | | | |
96
The Hartford Tax-Free New York Fund
(subadvised by Hartford Investment Management Company)
Performance Overview(1) 10/31/02 — 4/30/08
Growth of a $10,000 investment in Class A which includes Sales Charge
Lehman Brothers New York Municipal Bond Index is an unmanaged index of municipal bonds issued by the State of New York with maturities greater than two years.
You cannot invest directly in an index.
Investment objective – Seeks to provide current income exempt from federal, New York State and New York City income tax.
Average Annual Total Returns(2) (as of 4/30/08)
| | | | | | | | | | | | | | | | | |
| | | Inception | | 1 | | 5 | | Since |
| | | Date | | Year | | Year | | Inception |
| |
| Tax-Free New York A# | | | 10/31/02 | | | | -1.55 | % | | | 3.41 | % | | | 3.84 | % |
| Tax-Free New York A## | | | 10/31/02 | | | | -5.98 | % | | | 2.46 | % | | | 2.98 | % |
| Tax-Free New York B# | | | 10/31/02 | | | | -2.29 | % | | | 2.65 | % | | | 3.08 | % |
| Tax-Free New York B## | | | 10/31/02 | | | | -7.01 | % | | | 2.30 | % | | | 2.93 | % |
| Tax-Free New York C# | | | 10/31/02 | | | | -2.28 | % | | | 2.65 | % | | | 3.09 | % |
| Tax-Free New York C## | | | 10/31/02 | | | | -3.23 | % | | | 2.65 | % | | | 3.09 | % |
| | |
| # | | Without sales charge |
| |
| ## | | With sales charge |
PAST PERFORMANCE IS NOT INDICATIVE OF FUTURE RESULTS.
| (1) | | Growth of a $10,000 investment in Classes B and C shares will vary from results seen above due to differences in the expenses charged to these share classes. |
| |
| (2) | | The initial investment in Class A shares reflects the maximum sales charge and Classes B and C reflect CDSC. |
The value of shares will fluctuate so that, when redeemed, shares may be worth more or less than their original cost. The chart and table do not reflect the deduction of taxes that a shareholder would pay on fund distributions or the redemption of fund shares.
Performance information may reflect historical or current expense waivers/reimbursements from the investment adviser, without which performance would have been lower. For information on current expense waivers/reimbursements, please see the prospectus.
| | | |
Portfolio Managers | | |
Charles Grande | | Christopher Bade |
| Executive Vice President | | Vice President |
How did the Fund perform?
The Class A shares of The Hartford Tax-Free New York Fund returned -0.71%, before sales charge, for the six-month period ended April 30, 2008, versus its benchmark, the Lehman Brothers New York Municipal Bond Index, which returned 1.91%, and the 0.19% average return of the Lipper New York Municipal Debt Funds category, a group of funds with investment strategies similar to those of the Fund.
Why did the Fund perform this way?
The Fund’s exposure to higher-yielding, lower-rated bonds (triple-B and below) was one of the primary detractors from performance for the period. The Fund currently holds 44% of its assets in lower rated bonds, which generally results in greater exposure to credit risk than its benchmark. The flight to quality that took place during the period, coupled with credit rating downgrades of various major monoline bond insurers, forced selling by hedge funds, and the deterioration of the variable rate and auction rate markets led to significant volatility and price declines in the market, particularly in the high-yield sector. As a result, the high-yield municipal market (as measured by the Lehman Brothers High Yield Municipal Bond Index) returned -5.67% for the six-month period and high-yield credit spreads widened (i.e. short and long term interest rates moving farther apart) by 113 basis points. Spreads in investment-grade municipals widened by 60 basis points.
The Fund’s longer duration (a measure of interest-rate sensitivity), which resulted from its considerable exposure to the long end of the municipal yield curve, was also a major detractor from performance. The Fund’s duration is currently 8.16 years versus the benchmark of 6.58 years. During the period, the municipal curve steepened and the long end underperformed both the intermediate and short segments of the curve. As a result, the yield differential between two-year and 30-year maturities increased by 119 basis points to 226 basis points.
Over the course of the period we did, however, reduce the Fund’s duration (from 8.3 years to 8.16 years) through the sale of long-maturity issues and purchase of short-maturity issues while trimming exposure to lower-rated securities (from a high of 47% to 44%) in favor of higher-quality bonds. These strategies helped to decrease the Fund’s underperformance relative (i.e. performance of the Fund as measured against the benchmark) to its benchmark.
The Fund’s limited exposure to zero-coupon bonds was additive to performance as these securities performed poorly during the period. The Fund’s lack of leverage also benefited performance, as did its limited exposure to bond insurer credit downgrades.
What is your outlook?
The economy continues to face strong headwinds. Growth is likely to be weak until home prices stabilize and credit providers return to the business of lending rather than writing down assets. Despite the Federal Reserve’s (the “Fed”) sharp reductions in short-term interest rates, risk premiums (i.e. difference between the risk associated with buying or holding a Treasury and holding a high yield bond) remain high, which
97
has kept borrowing costs high. However, there are encouraging signs. Lenders are moving to aggressively write down bad loans and the Fed has clearly signaled it stands ready to support the capital markets. Given that Fed policy actions have historically taken a few quarters to affect growth, the rate reductions of last year should begin to be felt in the near future, helping to restore order to the financial markets and setting the stage for recovery.
We believe the underlying credit fundamentals of the municipal market will continue to weaken as long as the housing crisis, economic slowdown and bond insurer troubles continue to weigh on the market. This is true in New York State (rated Aa3/AA) where its worsening economic climate has resulted in total tax receipts (personal income, sales and business taxes) coming in less than expected. However, the State has effectively reduced expenditures to eliminate the projected deficit in fiscal 2009 and expects only modest increases in its outyear budget gaps. Furthermore, the State ended fiscal 2008 with only a small General Fund operating deficit and continues to maintain significant built up reserves ($2.8 billion currently) that gives the state the flexibility to respond to unanticipated fiscal challenges.
With tax revenue growth slowing, we remain cautious and particularly selective with regard to high-yield bonds. Although demand from non-traditional buyers such as hedge funds remains spotty, demand from traditional buyers (insurance companies, individuals and mutual funds) has significantly improved in recent weeks, which has helped reduce the demand/supply imbalance that has negatively impacted market performance. However, we expect supply to remain relatively heavy throughout the remainder of this year. While municipal bond prices have risen recently, we believe they still offer tremendous value relative to taxable securities. In our view, this attractive pricing is unsustainable. Given the extreme steepness of the municipal yield curve, we plan to slightly extend the Fund’s duration while maintaining its credit quality by balancing purchases of high-quality and high-yield securities.
Finally, the U.S. Supreme Court recently released its long-awaited decision in the Davis v. Kentucky Department of Revenue case, upholding the constitutionality of state laws that tax interest on out-of-state municipal bonds while exempting municipal bonds of in-state issuers. The decision preserves the status quo regarding state taxation of municipal bond interest and thus eliminates a potentially profound and largely uncertain impact on the municipal market going forward. More importantly, the decision preserves the state tax preferences that induce state residents to favor their own state’s municipal bonds and that have promoted the growth of single-state municipal bond funds.
Diversification by Industry
as of April 30, 2008
| | | | | |
| | | Percentage of |
| Industry | | Net Assets |
| |
| General Obligations | | | 4.2 | % |
| Health Care/Services | | | 19.3 | |
| Higher Education (Univ., Dorms, etc.) | | | 22.1 | |
| Industrial | | | 9.4 | |
| Miscellaneous | | | 13.3 | |
| Pollution Control | | | 0.9 | |
| Prerefunded | | | 6.4 | |
| Public Facilities | | | 6.9 | |
| Tax Allocation | | | 5.9 | |
| Transportation | | | 2.8 | |
| Utilities — Electric | | | 1.5 | |
| Utilities — Water and Sewer | | | 2.9 | |
| Short-Term Investments | | | 4.7 | |
| Other Assets and Liabilities | | | (0.3 | ) |
| | | | | |
Total | | | 100.0 | % |
| | | | | |
Distribution by Credit Quality
as of April 30, 2008
| | | | | |
| | | Percentage of |
| | | Long-Term |
| Rating | | Holdings |
| |
| AAA | | | 18.5 | |
| AA | | | 18.8 | |
| A | | | 19.6 | |
| BBB | | | 24.1 | |
| BB | | | 5.4 | |
| B | | | 1.9 | |
| NR | | | 11.7 | |
| | | | | |
Total | | | 100.0 | % |
| | | | | |
98
Hartford Total Return Bond Fund
(subadvised by Hartford Investment Management Company)
Performance Overview(1) 4/30/98 — 4/30/08
Growth of a $10,000 investment in Class A which includes Sales Charge
Lehman Brothers U.S. Aggregate Bond Index is an unmanaged index and is composed of securities from the Lehman Brothers Government/Credit Bond Index, Mortgage-Backed Securities Index, Asset-Backed Index and Commercial Mortgage-Backed Securities Index.
You cannot invest directly in an index.
The value of shares will fluctuate so that, when redeemed, shares may be worth more or less than their original cost. The chart and table do not reflect the deduction of taxes that a shareholder would pay on fund distributions or the redemption of fund shares.
Performance information may reflect historical or current expense waivers/reimbursements from the investment adviser, without which performance would have been lower. For information on current expense waivers/reimbursements, please see the prospectus.
Investment objective – Seeks a competitive total return, with income as a secondary objective.
Average Annual Total Returns(2,3) (as of 4/30/08)
| | | | | | | | | | | | | | | | | | | | | |
| | | Inception | | 1 | | 5 | | 10 | | Since |
| | | Date | | Year | | Year | | Year | | Inception |
| |
| Total Return Bond A# | | | 7/22/96 | | | | 3.02 | % | | | 3.58 | % | | | 5.20 | % | | | 6.00 | % |
| Total Return Bond A## | | | 7/22/96 | | | | -1.62 | % | | | 2.63 | % | | | 4.72 | % | | | 5.58 | % |
| Total Return Bond B# | | | 7/22/96 | | | | 2.29 | % | | | 2.81 | % | | NA | * | | NA | * |
| Total Return Bond B## | | | 7/22/96 | | | | -2.61 | % | | | 2.48 | % | | NA | * | | NA | * |
| Total Return Bond C# | | | 7/22/96 | | | | 2.34 | % | | | 2.93 | % | | | 4.49 | % | | | 5.27 | % |
| Total Return Bond C## | | | 7/22/96 | | | | 1.36 | % | | | 2.93 | % | | | 4.49 | % | | | 5.27 | % |
| Total Return Bond I# | | | 7/22/96 | | | | 3.32 | % | | | 3.70 | % | | | 5.26 | % | | | 6.05 | % |
| Total Return Bond I## | | | 7/22/96 | | | | 3.32 | % | | | 3.70 | % | | | 5.26 | % | | | 6.05 | % |
| Total Return Bond R3# | | | 7/22/96 | | | | 2.81 | % | | | 3.86 | % | | | 5.58 | % | | | 6.40 | % |
| Total Return Bond R3## | | | 7/22/96 | | | | 2.81 | % | | | 3.86 | % | | | 5.58 | % | | | 6.40 | % |
| Total Return Bond R4# | | | 7/22/96 | | | | 3.18 | % | | | 3.95 | % | | | 5.62 | % | | | 6.44 | % |
| Total Return Bond R4## | | | 7/22/96 | | | | 3.18 | % | | | 3.95 | % | | | 5.62 | % | | | 6.44 | % |
| Total Return Bond R5# | | | 7/22/96 | | | | 3.43 | % | | | 4.01 | % | | | 5.66 | % | | | 6.46 | % |
| Total Return Bond R5## | | | 7/22/96 | | | | 3.43 | % | | | 4.01 | % | | | 5.66 | % | | | 6.46 | % |
| Total Return Bond Y# | | | 7/22/96 | | | | 3.38 | % | | | 4.04 | % | | | 5.67 | % | | | 6.47 | % |
| | |
| # | | Without sales charge |
| |
| ## | | With sales charge |
| |
| NA | | Not Applicable |
| |
| * | | 10 year and inception returns are not applicable for Class B because after 8 years Class B converts to Class A. |
PAST PERFORMANCE IS NOT INDICATIVE OF FUTURE RESULTS.
| (1) | | Growth of a $10,000 investment in Classes B, C, I, R3, R4, R5 and Y shares will vary from results seen above due to differences in the expenses charged to these share classes. |
| |
| (2) | | Class C shares commenced operations on 7/31/98. Performance prior to 7/31/98 reflects Class B performance less Class C sales charges where applicable. Class I shares commenced operations on 8/31/06. Performance prior to 8/31/06 reflects Class A performance. Class R3, R4 and R5 shares commenced operations on 12/22/06. Performance prior to 12/22/06 reflects Class Y performance. |
| |
| (3) | | The initial investment in Class A shares reflects the maximum sales charge and Classes B and C reflect CDSC. |
Portfolio Manager
Nasri Toutoungi
Managing Director
How did the Fund perform?
The Class A shares of The Hartford Total Return Bond Fund returned 1.80%, before sales charge, for the six-month period ended April 30, 2008, versus its benchmark, the Lehman Brothers U.S. Aggregate Bond Index which returned 4.08%, and the 1.51% average return of the Lipper Intermediate Investment Grade Funds category, a group of funds with investment strategies similar to those of the Fund.
Why did the Fund perform this way?
The primary contributor to the Fund’s underperformance relative (i.e. performance of the Fund as measured against the benchmark) to the benchmark was security selection within investment-grade corporates. In particular, overweights (i.e. the Fund’s sector position was greater than the benchmark position) to banking and brokerage securities held back returns as the performance of these sectors suffered amid further mortgage-related writedowns during the period and the collapse of Bear Stearns, Wall Street’s fifth largest investment bank. Holdings in the high-yield bond and bank loan sectors, which are not represented in the benchmark, also hindered performance, as did an underweight (i.e. the Fund’s sector position was less than the benchmark position) to U.S. Treasury and agency securities. During the period, the credit and liquidity crisis pushed credit spreads significantly wider and prompted a flight to quality that led Treasury and agency securities to outperform all other sectors of the fixed income market. A small overweight to asset-backed securities (ABS) also detracted from relative performance as increased delinquencies and declines in home prices drove home equity spreads wider.
In the commercial mortgage-backed securities (CMBS) sector, a small overweight to double-A rated bonds held back returns, as did security selection in the residential mortgage-backed securities (MBS) sector due to an allocation to non-agency collateralized mortgage obligations (CMOs).
99
The Fund’s yield curve positioning, however, helped to mitigate some of this underperformance. We positioned the Fund to benefit from a steepening of the yield curve (i.e. short and long term interest rates moving farther apart), which proved beneficial as interest rates declined, particularly on the short end of the curve, and the curve steepened. By the end of the period, the yield differential between two-year and ten-year Treasury notes had widened by 96 basis points. The Fund’s exposure to the euro and the yen also contributed positively to performance as the U.S. dollar reached new lows versus these currencies.
What is the outlook?
The economy continues to face strong headwinds. Growth is likely to be weak until home prices stabilize and credit providers return to the business of lending rather than writing down assets. Despite the Federal Reserve’s (the “Fed”) sharp reductions in short-term interest rates, risk premiums (i.e. difference between the risk associated with buying or holding a Treasury and holding a high yield bond) remain high, which has kept borrowing costs high. However, there are encouraging signs. Lenders are moving to aggressively write down bad loans and the Fed has clearly signaled it stands ready to support the capital markets. Given that Fed policy actions have historically taken a few quarters to affect growth, the rate reductions of last year should begin to be felt in the near future, helping to restore order to the financial markets and setting the stage for recovery.
We believe that there was a dramatic turnaround in the market as a result of the Fed stepping in to rescue Bear Stearns, and it has been our belief since that event that the credit markets would subsequently recover. The pace of recovery however, is still in question. Given that we expect continued economic weakness and are anticipating a rising default environment, our positioning for price appreciation is being done selectively and gradually. In particular, we currently favor investment grade corporate bonds primarily in the financial sector. We also believe that CMBS will continue to offer value despite its recent strong performance. We are also cautious about aggressively increasing our high yield exposure in the face of rising defaults.
Diversification by Industry
as of April 30, 2008
| | | | | |
| | | Percentage of |
| Industry | | Net Assets |
| |
| Basic Materials | | | 1.8 | % |
| Capital Goods | | | 1.0 | |
| Consumer Cyclical | | | 2.0 | |
| Consumer Staples | | | 1.0 | |
| Energy | | | 1.5 | |
| Finance | | | 27.5 | |
| Foreign Governments | | | 4.4 | |
| General Obligations | | | 0.1 | |
| Health Care | | | 1.5 | |
| Services | | | 4.2 | |
| Technology | | | 5.9 | |
| Transportation | | | 0.7 | |
| U.S. Government Agencies | | | 34.8 | |
| U.S. Government Securities | | | 4.5 | |
| Utilities | | | 3.2 | |
| Short-Term Investments | | | 8.5 | |
| Other Assets and Liabilities | | | (2.6 | ) |
| | | | | |
Total | | | 100.0 | % |
| | | | | |
Distribution by Credit Quality
as of April 30, 2008
| | | | | |
| | | Percentage of |
| | | Long-Term |
| Rating | | Holdings |
| |
| AAA | | | 58.8 | |
| AA | | | 4.7 | |
| A | | | 14.1 | |
| BBB | | | 10.1 | |
| BB | | | 7.7 | |
| B | | | 3.4 | |
| CCC | | | 0.2 | |
| NR | | | 1.0 | |
| | | | | |
Total | | | 100.0 | % |
| | | | | |
100
The Hartford U.S. Government Securities Fund
(subadvised by Hartford Investment Management Company)
Performance Overview(1,2) 4/30/98 — 4/30/08
Growth of a $10,000 investment in Class A which includes Sales Charge
Lehman Brothers U.S. Government Index is an unmanaged index of government bonds with maturities of one year or more.
You cannot invest directly in an index.
The value of shares will fluctuate so that, when redeemed, shares may be worth more or less than their original cost. The chart and table do not reflect the deduction of taxes that a shareholder would pay on fund distributions or the redemption of fund shares.
Performance information may reflect historical or current expense waivers/reimbursements from the investment adviser, without which performance would have been lower. For information on current expense waivers/reimbursements, please see the prospectus.
Investment objective – Seeks to provide current income while maintaining preservation of capital consistent with prudent investment risk.
Average Annual Total Returns(1,3) (as of 4/30/08)
| | | | | | | | | | | | | | | | | | | | | |
| | | Inception | | 1 | | 5 | | 10 | | Since |
| | | Date | | Year | | Year | | Year | | Inception |
| |
| U.S. Govt Sec A# | | | 2/28/73 | | | | 2.96 | % | | | 2.49 | % | | | 4.74 | % | | | 7.28 | % |
| U.S. Govt Sec A## | | | 2/28/73 | | | | -1.68 | % | | | 1.55 | % | | | 4.26 | % | | | 7.14 | % |
| U.S. Govt Sec B# | | | 11/14/94 | | | | 2.17 | % | | | 1.75 | % | | NA | * | | NA | * |
| U.S. Govt Sec B## | | | 11/14/94 | | | | -2.73 | % | | | 1.41 | % | | NA | * | | NA | * |
| U.S. Govt Sec C# | | | 11/14/94 | | | | 2.09 | % | | | 1.73 | % | | | 3.87 | % | | | 4.84 | % |
| U.S. Govt Sec C## | | | 11/14/94 | | | | 1.11 | % | | | 1.73 | % | | | 3.87 | % | | | 4.84 | % |
| U.S. Govt Sec L# | | | 11/14/94 | | | | 3.07 | % | | | 2.58 | % | | | 4.70 | % | | | 5.66 | % |
| U.S. Govt Sec L## | | | 11/14/94 | | | | -1.57 | % | | | 1.64 | % | | | 4.22 | % | | | 5.30 | % |
| U.S. Govt Sec Y# | | | 2/19/02 | | | | 3.30 | % | | | 2.82 | % | | NA | | | 4.05 | % |
| | |
| # | | Without sales charge |
| |
| ## | | With sales charge |
| |
| NA | | Not Applicable |
| |
| * | | 10 year and inception returns are not applicable for Class B because after 8 years Class B converts to Class A. |
PAST PERFORMANCE IS NOT INDICATIVE OF FUTURE RESULTS.
| (1) | | Classes A, B and C were offered beginning on 2/19/02. |
| |
| | | Performance prior to that date is that of the fund’s Classes E, M and N shares, respectively, which have lower operating expenses. Performance prior to 2/19/02 would have been lower if Classes A, B and C shares expenses were applied during that period. Classes E, M and N are no longer offered. |
| |
| (2) | | Growth of a $10,000 investment in Classes B, C, L and Y shares will vary from results seen above due to differences in the expenses charged to these share classes. |
| |
| (3) | | The initial investment in Classes A and L shares reflects the maximum sales charge and Classes B and C reflect CDSC. |
| | | | | | | |
Portfolio Managers | | | | | | |
Christopher Hanlon* | | Russell M. Regenauer | | Timothy Wilhide* | | John Hendricks* |
| Senior Vice President | | Senior Vice President | | Senior Vice President | | Senior Vice President |
How did the Fund perform?
The Class A shares of The Hartford U.S. Government Securities Fund returned 2.21%, before sales charge, for the six-month period ended April 30, 2008, versus its benchmark, the Lehman Brothers U.S. Government Index, which returned 5.64%, and the 3.88% average return of the Lipper General U.S. Government Securities Funds category, a group of funds with investment strategies similar to those of the Fund.
Why did the Fund perform this way?
In addition to U.S. Government securities, the Fund has allocations to spread sectors such as residential and commercial mortgage-backed securities (“CMBS”), which are not represented in the benchmark Lehman Brothers U.S. Government Index. Over the course of the reporting period, these sectors were adversely affected by the ongoing contraction of credit in the economy and the resulting forced selling of securities by leveraged players no longer able to secure financing. As a result, the Fund’s holdings in the sectors were the primary contributors to its underperformance relative (i.e. performance of the Fund as measured against the benchmark) to the benchmark.
The Fund’s yield curve positioning, however, was additive to relative performance. We positioned the Fund to benefit from a steepening of the yield curve (i.e. short and long term interest rates moving farther apart), which did occur during the period as the Federal Reserve (the “Fed”) acted very aggressively to combat illiquidity and the slowing economy through a series of reductions in the target federal funds rate. These reductions caused yields to decline, particularly on the short end of the yield curve, and the curve to steepen.
What is the outlook?
The economy continues to face strong headwinds. Growth is likely to be weak until home prices stabilize and credit providers return to the business of lending rather than writing down assets. Despite the Fed’s sharp reductions in short-term interest rates, risk premiums (i.e. difference between the risk associated with buying or holding a Treasury and holding a high yield bond) remain high, which has kept borrowing costs high. However, there are encouraging signs. Lenders
101
are moving to aggressively write down bad loans and the Fed has clearly signaled it stands ready to support the capital markets. Given that Fed policy actions have historically taken a few quarters to affect growth, the rate reductions of last year should begin to be felt in the near future, helping to restore order to the financial markets and setting the stage for recovery.
We plan to maintain the Fund’s investments in the aforementioned spread sectors, as we believe the fundamental value of these securities is significantly higher than current market valuations. The majority of these holdings are guaranteed by the U.S. Government or its agencies. As of the end of the period, 97% of the Fund’s assets were in securities rated AAA and/or issued by the U.S. Government. While we do expect market volatility to continue, we believe spreads will begin to narrow. We will continue to closely monitor the market, seeking opportunities to benefit from changes in interest rates and the shape of the yield curve.
| | |
| * | | Effective June 1, 2008, Christopher Hanlon will no longer serve as a portfolio manager of the Fund. It is expected that Timothy Wilhide and John Hendricks will assume portfolio management responsibilities along with Russell M. Regenauer. |
Distribution by Category
as of April 30, 2008
| | | | | |
| | | Percentage of |
| Category | | Net Assets |
| |
| Asset & Commercial Mortgage Backed Securities | | | 7.9 | % |
| Corporate Bonds: Investment Grades | | | 0.2 | |
| U.S. Government Agencies | | | 77.8 | |
| U.S. Government Securities | | | 9.5 | |
| Short-Term Investments | | | 20.2 | |
| Other Assets and Liabilities | | | (15.6 | ) |
| | | | | |
Total | | | 100.0 | % |
| | | | | |
Distribution by Credit Quality
as of April 30, 2008
| | | | | |
| | | Percentage of |
| | | Long-Term |
| Rating | | Holdings |
| |
| AAA | | | 98.3 | |
| AA | | | 0.1 | |
| A | | | 0.7 | |
| BBB | | | 0.7 | |
| CCC | | | 0.2 | |
| | | | | |
Total | | | 100.0 | % |
| | | | | |
102
The Hartford Value Fund
(subadvised by Wellington Management Company, LLP)
Performance Overview(1) 4/30/01 — 4/30/08
Growth of a $10,000 investment in Class A which includes Sales Charge
Russell 1000 Value Index measures the performance of those Russell 1000 Index companies with lower price-to-book ratios and lower forecasted growth values.
You cannot invest directly in an index.
The value of shares will fluctuate so that, when redeemed, shares may be worth more or less than their original cost. The chart and table do not reflect the deduction of taxes that a shareholder would pay on fund distributions or the redemption of fund shares.
Performance information may reflect historical or current expense waivers/reimbursements from the investment adviser, without which performance would have been lower. For information on current expense waivers/reimbursements, please see the prospectus.
Investment objective – Seeks long-term total return.
Average Annual Total Returns(2,3) (as of 4/30/08)
| | | | | | | | | | | | | | | | | |
| | | Inception | | 1 | | 5 | | Since |
| | | Date | | Year | | Year | | Inception |
| |
| Value A# | | | 4/30/01 | | | | -1.34 | % | | | 13.02 | % | | | 5.44 | % |
| Value A## | | | 4/30/01 | | | | -6.77 | % | | | 11.75 | % | | | 4.59 | % |
| Value B# | | | 4/30/01 | | | | -2.16 | % | | | 12.19 | % | | | 4.65 | % |
| Value B## | | | 4/30/01 | | | | -6.81 | % | | | 11.93 | % | | | 4.65 | % |
| Value C# | | | 4/30/01 | | | | -2.06 | % | | | 12.18 | % | | | 4.66 | % |
| Value C## | | | 4/30/01 | | | | -3.00 | % | | | 12.18 | % | | | 4.66 | % |
| Value I# | | | 4/30/01 | | | | -0.94 | % | | | 13.11 | % | | | 5.50 | % |
| Value I## | | | 4/30/01 | | | | -0.94 | % | | | 13.11 | % | | | 5.50 | % |
| Value R3# | | | 4/30/01 | | | | -1.63 | % | | | 13.16 | % | | | 5.66 | % |
| Value R3## | | | 4/30/01 | | | | -1.63 | % | | | 13.16 | % | | | 5.66 | % |
| Value R4# | | | 4/30/01 | | | | -1.26 | % | | | 13.26 | % | | | 5.73 | % |
| Value R4## | | | 4/30/01 | | | | -1.26 | % | | | 13.26 | % | | | 5.73 | % |
| Value R5# | | | 4/30/01 | | | | -1.05 | % | | | 13.34 | % | | | 5.78 | % |
| Value R5## | | | 4/30/01 | | | | -1.05 | % | | | 13.34 | % | | | 5.78 | % |
| Value Y# | | | 4/30/01 | | | | -0.92 | % | | | 13.39 | % | | | 5.81 | % |
| | |
| # | | Without sales charge |
| |
| ## | | With sales charge |
PAST PERFORMANCE IS NOT INDICATIVE OF FUTURE RESULTS.
| (1) | | Growth of a $10,000 investment in Classes B, C, I, R3, R4, R5 and Y shares will vary from results seen above due to differences in the expenses charged to these share classes. |
| |
| (2) | | The initial investment in Class A shares reflects the maximum sales charge and Classes B and C reflect CDSC. |
| |
| (3) | | Class I shares commenced operations on 5/31/07. Performance prior to 5/31/07 reflects Class A performance. Class R3, R4 and R5 shares commenced operations on 12/22/06. Performance prior to 12/22/06 reflects Class A performance. |
| | | | | | | |
Portfolio Managers | | | | | | |
John R. Ryan, CFA* | | Karen H. Grimes, CFA | | W. Michael Reckmeyer, III, CFA | | Ian R. Link, CFA |
| Senior Vice President, Managing Partner | | Vice President | | Vice President | | Vice President |
How did the Fund perform?
The Class A shares of The Hartford Value Fund returned -6.72%, before sales charge, for the six-month period ended April 30, 2008, versus its benchmark, the Russell 1000 Value Index, which returned -9.83% for the same period, and the -10.24% return of the average fund in the Lipper Large-Cap Value Funds peer group, a group of funds with investment strategies similar to those of the Fund.
Why did the Fund perform this way?
The U.S. equity markets were weak during the period due to continued disruptions in the global credit markets. Investors became risk averse and companies with balance sheet leverage or uncertain financing needs saw significant erosion in their equity market value. The worries climaxed in March with the near collapse of a major investment bank and several bond insurers. However, the equity markets experienced a sharp rebound in April when the Federal Reserve (the “Fed”) acted aggressively to soften the economic slowdown and increase liquidity in the financial markets.
Within the Fund’s Russell 1000 Value Index benchmark, Energy was the only sector that posted positive returns. Information Technology, Financials and Consumer Discretionary were significant laggards. Mid cap stocks outperformed small cap and large cap stocks as measured by the S&P MidCap 400 Index (-7.0%), Russell 2000 Index (-12.9%) and S&P 500 Index (-9.6%), respectively. Value stocks slightly underperformed growth stocks, as measured by the Russell 1000 Value Index (-9.8%) and Russell 1000 Growth Index (-9.3%).
The primary driver of the Fund’s outperformance relative (i.e. performance of the Fund as measured against the benchmark) to the benchmark was strong stock selection, particularly within Financials, Information Technology, Utilities and Consumer Discretionary. In addition, while the Fund’s investment strategy is driven by bottom-up (i.e. stock by stock fundamental research) fundamental research, the Fund’s underweight (i.e. the Fund’s sector position was less than the benchmark position) position in Financials and overweight (i.e. the Fund’s sector position was greater than the benchmark position) position in Consumer Staples helped performance.
103
Among the top contributors to relative performance were Occidental Petroleum (Energy), Agrium (Materials) and Citigroup (Financials). Agrium, a fertilizer producer, benefited from the supply and demand imbalance associated with higher crop prices. Occidental Petroleum benefited from the rally in crude oil prices and a widening in U.S. refining margins. Citigroup’s shares struggled following the credit crunch that began in August 2007; however, we did not own Citigroup for the entire period which helped our benchmark-relative performance. JP Morgan Chase (Financials) was a top contributor on an absolute (i.e. total return) basis. The company’s shares were volatile during the period due to their exposure to sub prime securities; however, their shares rebounded following news that they would purchase Bear Stearns, a large owner of sub-prime mortgages. We continued to hold our positions in these stocks at the end of the period.
Among the top detractors from relative performance were Delta Air Lines (Industrials), UBS (Financials) and Smurfit Stone Container (Materials). Delta’s shares underperformed following a dramatic rise in jet fuel prices and a further weakening U.S. economy. Shares of UBS declined due to general concerns about liquidity and the company’s exposure to sub prime assets. Shares of Smurfit Stone fell due to rising costs of raw materials and management’s inability to increase linerboard pricing. General Electric was the largest absolute detractor from performance. The company’s shares declined as management announced the company would miss its earnings estimates for the first quarter due to softness in their real estate holdings. We owned these stocks at the end of the period.
What is the outlook?
Our outlook for the U.S. economy has dimmed considerably, and there has been downside movement to our “mild ramp-down” case. Falling home prices, rising food and energy costs, and declining consumer confidence have led to a pull back in stock prices, particularly for companies involved with selling to consumers. We believe that a mild recession is in market prices now, but the risks of deeper recession have risen.
We believe the outcome in the U.S. is somewhat binary — either a deep recession is in the cards, or all the central bank actions work to avoid the meltdown and a boom is re-ignited on a global basis. In the U.S., Fed action has been impressive. The U.K. and European economies are decelerating, and many countries have a number of financial issues to digest. Japan is sluggish, while Asia and the emerging markets remain strong. We are maintaining our defensive positioning and keeping flexibility in the Fund to move in either direction. At the end of the period, the Fund remained most overweight Consumer Staples and Information Technology and most underweight Financials and Consumer Discretionary, relative to the Russell 1000 Value Index.
| | |
| * | | It is anticipated that after June 30, 2008, John R. Ryan will no longer manage assets for the Fund. |
Diversification by Industry
as of April 30, 2008
| | | | | |
| | | Percentage of |
| Industry | | Net Assets |
| |
| Basic Materials | | | 5.1 | % |
| Capital Goods | | | 1.5 | |
| Consumer Cyclical | | | 7.0 | |
| Consumer Staples | | | 5.4 | |
| Energy | | | 17.3 | |
| Finance | | | 24.5 | |
| Health Care | | | 7.5 | |
| Services | | | 2.4 | |
| Technology | | | 14.5 | |
| Transportation | | | 3.0 | |
| Utilities | | | 9.5 | |
| Short-Term Investments | | | 2.8 | |
| Other Assets and Liabilities | | | (0.5 | ) |
| | | | | |
Total | | | 100.0 | % |
| | | | | |
104
The Hartford Value Opportunities Fund
(subadvised by Wellington Management Company, LLP)
Performance Overview(1,2) 4/30/98 — 4/30/08
Growth of a $10,000 investment in Class A which includes Sales Charge
Russell 1000 Value Index measures the performance of those Russell 1000 Index companies with lower price-to-book ratios and lower forecasted growth values.
Russell 3000 Value Index is an unmanaged index measuring the performance of those Russell 3000 Index companies with lower price-to-book ratios and lower forecasted growth values.
You cannot invest directly in an index.
The value of shares will fluctuate so that, when redeemed, shares may be worth more or less than their original cost. The chart and table do not reflect the deduction of taxes that a shareholder would pay on fund distributions or the redemption of fund shares.
Performance information may reflect historical or current expense waivers/reimbursements from the investment adviser, without which performance would have been lower. For information on current expense waivers/reimbursements, please see the prospectus.
Investment objective – Seeks capital appreciation.
Average Annual Total Returns(1,3) (as of 4/30/08)
| | | | | | | | | | | | | | | | | | | | | |
| | | Inception | | 1 | | 5 | | 10 | | Since |
| | | Date | | Year | | Year | | Year | | Inception |
| |
| Value Opportunities A# | | | 1/02/96 | | | | -20.27 | % | | | 11.12 | % | | | 4.90 | % | | | 8.32 | % |
| Value Opportunities A## | | | 1/02/96 | | | | -24.66 | % | | | 9.87 | % | | | 4.31 | % | | | 7.83 | % |
| Value Opportunities B# | | | 1/02/96 | | | | -20.77 | % | | | 10.35 | % | | NA | * | | NA | * |
| Value Opportunities B## | | | 1/02/96 | | | | -24.08 | % | | | 10.08 | % | | NA | * | | NA | * |
| Value Opportunities C# | | | 1/02/96 | | | | -20.82 | % | | | 10.31 | % | | | 4.13 | % | | | 7.53 | % |
| Value Opportunities C## | | | 1/02/96 | | | | -21.48 | % | | | 10.31 | % | | | 4.13 | % | | | 7.53 | % |
| Value Opportunities I# | | | 2/19/02 | | | | -20.01 | % | | | 11.23 | % | | NA | | | 6.07 | % |
| Value Opportunities I## | | | 2/19/02 | | | | -20.01 | % | | | 11.23 | % | | NA | | | 6.07 | % |
| Value Opportunities L# | | | 1/02/96 | | | | -20.13 | % | | | 11.23 | % | | | 4.95 | % | | | 8.37 | % |
| Value Opportunities L## | | | 1/02/96 | | | | -23.92 | % | | | 10.16 | % | | | 4.44 | % | | | 7.94 | % |
| Value Opportunities R3# | | | 2/19/02 | | | | -20.51 | % | | | 11.21 | % | | NA | | | 5.83 | % |
| Value Opportunities R3## | | | 2/19/02 | | | | -20.51 | % | | | 11.21 | % | | NA | | | 5.83 | % |
| Value Opportunities R4# | | | 2/19/02 | | | | -20.22 | % | | | 11.32 | % | | NA | | | 5.91 | % |
| Value Opportunities R4## | | | 2/19/02 | | | | -20.22 | % | | | 11.32 | % | | NA | | | 5.91 | % |
| Value Opportunities R5# | | | 2/19/02 | | | | -20.01 | % | | | 11.40 | % | | NA | | | 5.97 | % |
| Value Opportunities R5## | | | 2/19/02 | | | | -20.01 | % | | | 11.40 | % | | NA | | | 5.97 | % |
| Value Opportunities Y# | | | 2/19/02 | | | | -19.97 | % | | | 11.50 | % | | NA | | | 6.05 | % |
| | |
| # | | Without sales charge |
| |
| ## | | With sales charge |
| |
| NA | | Not Applicable |
| |
| * | | 10 year and inception returns are not applicable for Class B because after 8 years Class B converts to Class A. |
PAST PERFORMANCE IS NOT INDICATIVE OF FUTURE RESULTS.
| (1) | | Classes A, B and C were offered beginning on 2/19/02. |
| |
| | | Performance prior to that date is that of the fund’s Classes L, M and N shares, respectively, which have lower operating expenses. Performance prior to 2/19/02 would have been lower if Classes A, B and C shares expenses were applied during that period. (Classes M and N are no longer offered.) Class I shares commenced operations on 8/31/06. |
| |
| | | Performance prior to 8/31/06 reflects Class A performance. Classes R3, R4 and R5 shares commenced operations on 12/22/06. Performance prior to 12/22/06 reflects Class A performance. |
| |
| (2) | | Growth of a $10,000 investment in Classes B, C, I, L, R3, R4, R5 and Y shares will vary from results seen above due to differences in the expenses charged to these share classes. |
| |
| (3) | | The initial investment in Classes A and L shares reflects the maximum sales charge and Classes B and C reflect CDSC. |
| | | | | |
Portfolio Managers | | | | |
David R. Fassnacht, CFA | | James N. Mordy | | David W. Palmer, CFA |
| Senior Vice President, Partner | | Senior Vice President, Partner | | Vice President |
How did the Fund perform?
The Class A shares of The Hartford Value Opportunities Fund returned -18.70%, before sales charge, for the six-month period ended April 30, 2008, versus its benchmarks, the Russell 3000 Value Index, which returned -9.97% for the same period and the Russell 1000 Value Index, which returned -9.83% for the same period. The average fund in the Lipper Multi-Cap Value Fund peer group, a group of funds with investment strategies similar to those of the Fund, returned -11.26%.
Why did the Fund perform this way?
A tide of risk aversion has swept through the equity markets on the waves of worry about access to credit, home price depreciation and falling economic activity. The divergences in performance over the past three quarters among those stocks in the highest and those in the lowest quintiles of market cap, beta, momentum, price/book and leverage have been stark. These conditions have historically been very difficult times for our contrarian strategy, although they have also provided attractive entry points for future outperformance.
In this environment, the Russell 3000 Index returned -9.8% during the period, with value stocks, as measured by the Russell 3000 Value Index, slightly underperforming growth stocks, as measured by the Russell
105
3000 Growth Index, by a margin of 0.3%. Mid cap stocks outperformed large cap and small cap stocks, as indicated by the -7.0% return of the S&P MidCap 400 Index versus the -9.6% return of the S&P 500 Index and the -12.9% return of the Russell 2000 Index. Energy was the only broad sector within the Russell 3000 Value Index that posted a positive return.
Stock selection was the primary driver of the Fund’s relative (i.e. performance of the Fund as measured against the benchmark) underperformance, and was particularly weak in Financials, Industrials and Energy. Sector allocation overall also detracted from the Fund’s performance, in particular our underweight (i.e. the Fund’s sector position was less than the benchmark position) positions in Energy and Utilities and our overweight (i.e. the Fund’s sector position was greater than the benchmark position) position in Information Technology.
The largest detractors from both absolute (i.e. total return) and benchmark relative performance were Ambac Financial (Financials), R.H. Donnelley (Consumer Discretionary) and Northwest Airlines (Industrials). Widespread uncertainty regarding Ambac’s eventual losses from its financial guaranty contracts made this obscure municipal bond insurer a household name. The timing and execution of the company’s stock issuance was more dilutive than we expected. Yellow pages company R.H. Donnelley’s stock price fell as investors worried about the negative impact of softer advertising sales during a recession on earnings and cash flow, given the company’s financial leverage. A significant increase in fuel costs and fears of a decline in travel demand weighed on Northwest’s stock price. We retained our positions in these stocks at the end of the period.
Our largest contributors to relative performance included Arch Coal (Energy) and Financials stocks Fannie Mae and Citigroup. U.S. coal producer Arch’s shares benefited from production cuts in Australia and strong international demand, leading to a favorable pricing environment. The portfolio benefited from a timely purchase of government-sponsored mortgage company Fannie Mae, following a sharp decline in the shares. Our underweight position in Citigroup, a large position in the benchmark, was helpful to returns as the company’s stock fell due to concerns over write-downs of assets on its balance sheet. In addition, Hong Kong based Chaoda Modern Agriculture (Consumer Staples) which operates farmland in China was a significant contributor to absolute returns. We owned the four stocks at the end of the period.
What is the outlook?
The U.S. economy will likely be shown to have fallen into recession at some point in 2008, if it is not there already. We anticipate economic activity will remain soft for several quarters, although the monetary and fiscal policies necessary to free up the credit markets and lead the economy back to growth appear to be either in place or under discussion. The string of large capital calls in the banking sector to re-liquefy balance sheets has begun, and we expect there will be much further shareholder dilution before the financial sector regains comfort with both leverage levels and counterparty risk. Once the pieces are in place, we believe that U.S. economic growth will begin to look more appealing relative to Europe, Japan or developing economies by late 2008 or early 2009.
We did not make any major shifts to the Fund’s positioning during the period, with most of the variances in relative weighting coming from price performance. We retained our largest overweighting in Information Technology, concentrated in companies with strong product positions and, in many cases, net-cash balance sheets. At the end of the period, we remained underweight in sectors perceived as “safe” such as Consumer Staples, Energy, Utilities and Telecommunication Services.
Against the backdrop of great concern over consumer and real estate credit, we are looking for enticing opportunities to reduce our Financials sector underweight, with a preference for those companies who have already taken steps to fill in any capital holes created by poor lending or asset purchase decisions. We would also anticipate starting to invest more aggressively in Consumer Discretionary names as earnings expectations for the sector are reset lower.
Diversification by Industry
as of April 30, 2008
| | | | | |
| | | Percentage of |
| Industry | | Net Assets |
| |
| Basic Materials | | | 5.1 | % |
| Capital Goods | | | 5.5 | |
| Consumer Cyclical | | | 6.1 | |
| Consumer Staples | | | 7.4 | |
| Energy | | | 10.6 | |
| Finance | | | 26.5 | |
| Health Care | | | 11.2 | |
| Services | | | 8.8 | |
| Technology | | | 13.0 | |
| Transportation | | | 3.5 | |
| Utilities | | | 0.9 | |
| Short-Term Investments | | | 11.2 | |
| Other Assets and Liabilities | | | (9.8 | ) |
| | | | | |
Total | | | 100.0 | % |
| | | | | |
106
The Hartford Mutual Funds, Inc.
The Hartford Mutual Funds II, Inc.
Table of Contents
| | | |
| Manager Discussions (Unaudited) | | |
| The Hartford Mutual Funds, Inc. and The Hartford Mutual Funds II, Inc. Financial Statements | | |
| Schedule of Investments at April 30, 2008 (Unaudited) | | |
| The Hartford Advisers Fund | | 107 |
| The Hartford Balanced Allocation Fund | | 113 |
| The Hartford Balanced Income Fund | | 114 |
| The Hartford Capital Appreciation Fund | | 124 |
| The Hartford Capital Appreciation II Fund | | 127 |
| The Hartford Checks and Balances Fund | | 132 |
| The Hartford Conservative Allocation Fund | | 133 |
| The Hartford Disciplined Equity Fund | | 134 |
| The Hartford Dividend and Growth Fund | | 137 |
| The Hartford Equity Growth Allocation Fund | | 139 |
| The Hartford Equity Income Fund | | 140 |
| The Hartford Floating Rate Fund | | 142 |
| The Hartford Fundamental Growth Fund | | 152 |
| The Hartford Global Communications Fund | | 154 |
| The Hartford Global Equity Fund | | 156 |
| The Hartford Global Financial Services Fund | | 162 |
| The Hartford Global Growth Fund | | 164 |
| The Hartford Global Health Fund | | 167 |
| The Hartford Global Technology Fund | | 169 |
| The Hartford Growth Allocation Fund | | 171 |
| The Hartford Growth Fund | | 172 |
| The Hartford Growth Opportunities Fund | | 174 |
| The Hartford High Yield Fund | | 176 |
| The Hartford High Yield Municipal Bond Fund | | 182 |
| The Hartford Income Allocation Fund | | 186 |
| The Hartford Income Fund | | 187 |
| The Hartford Inflation Plus Fund | | 197 |
| The Hartford International Growth Fund | | 199 |
| The Hartford International Opportunities Fund | | 202 |
| The Hartford International Small Company Fund | | 205 |
| The Hartford LargeCap Growth Fund | | 208 |
| The Hartford MidCap Fund | | 210 |
| The Hartford MidCap Growth Fund (formerly The Hartford Select MidCap Growth Fund) | | 213 |
| The Hartford MidCap Value Fund | | 216 |
| The Hartford Money Market Fund | | 218 |
| The Hartford Retirement Income Fund | | 221 |
| The Hartford Select MidCap Value Fund | | 222 |
| The Hartford Select SmallCap Value Fund | | 225 |
| The Hartford Short Duration Fund | | 231 |
| The Hartford Small Company Fund | | 236 |
| The Hartford SmallCap Growth Fund | | 241 |
| The Hartford Stock Fund | | 246 |
| The Hartford Strategic Income Fund | | 248 |
| The Hartford Target Retirement 2010 Fund | | 256 |
| The Hartford Target Retirement 2020 Fund | | 257 |
| The Hartford Target Retirement 2030 Fund | | 258 |
| The Hartford Tax-Free California Fund | | 259 |
| The Hartford Tax-Free Minnesota Fund | | 262 |
| The Hartford Tax-Free National Fund | | 264 |
| The Hartford Tax-Free New York Fund | | 269 |
| The Hartford Total Return Bond Fund | | 271 |
| The Hartford U.S. Government Securities Fund | | 281 |
| The Hartford Value Fund | | 283 |
| The Hartford Value Opportunities Fund | | 285 |
| Statements of Assets and Liabilities at April 30, 2008 (Unaudited) | | 288 |
| Statements of Operations for the Six-Month Period Ended April 30, 2008 (Unaudited) | | 308 |
| Statements of Changes in Net Assets for the Six-Month Period Ended April 30, 2008 (Unaudited) and the Year Ended October 31, 2007 | | 318 |
| Notes to Financial Statements (Unaudited) | | 336 |
| Financial Highlights (Unaudited) | | 379 |
| Directors and Officers (Unaudited) | | 411 |
| How to Obtain a Copy of the Funds’ Proxy Voting Policies and Proxy Voting Records (Unaudited) | | 412 |
| Expense Example (Unaudited) | | 413 |
| Approval of Investment Management and Investment Sub-Advisory Agreements (Unaudited) | | 421 |
| Privacy Policy | | 423 |
The Hartford Advisers Fund
Schedule of Investments
April 30, 2008 (Unaudited)
(000’s Omitted)
| | | | | | | | | | | | | |
| | | | | | | | | Market
| |
| Shares | | | | | | | | Value (W) | |
| COMMON STOCK — 68.5% |
| | | | | Basic Materials — 3.8% |
| | 34 | | | Agrium, Inc. | | $ | 2,718 | |
| | 330 | | | Alcoa, Inc. | | | 11,460 | |
| | 92 | | | ArcelorMittal ADR | | | 8,232 | |
| | 210 | | | Cameco Corp. | | | 7,359 | |
| | 75 | | | Consol Energy, Inc. | | | 6,096 | |
| | 84 | | | Freeport-McMoRan Copper & Gold, Inc. | | | 9,532 | |
| | 26 | | | United States Steel Corp. | | | 4,064 | |
| | | | | | | | | |
| | | | | | | | | | | | 49,461 | |
| | | | | | | | | | | | | |
| | | | | Consumer Cyclical — 5.2% |
| | 2,225 | | | Buck Holdings L.P. (A)(D)(H) | | | 2,002 | |
| | 796 | | | Ford Motor Co. (D)(G) | | | 6,572 | |
| | 148 | | | Honda Motor Co., Ltd. | | | 4,721 | |
| | 369 | | | Kohl’s Corp. (D) | | | 18,026 | |
| | 502 | | | Lowe’s Co., Inc. | | | 12,635 | |
| | 242 | | | Safeway, Inc. | | | 7,660 | |
| | 199 | | | Supervalu, Inc. | | | 6,570 | |
| | 160 | | | Wal-Mart Stores, Inc. | | | 9,288 | |
| | | | | | | | | |
| | | | | | | | | | | | 67,474 | |
| | | | | | | | | | | | | |
| | | | | Consumer Staples — 2.4% |
| | 43 | | | Bunge Ltd. Finance Corp. | | | 4,951 | |
| | 1 | | | Japan Tobacco, Inc. | | | 5,636 | |
| | 141 | | | PepsiCo, Inc. | | | 9,656 | |
| | 159 | | | Procter & Gamble Co. | | | 10,654 | |
| | | | | | | | | |
| | | | | | | | | | | | 30,897 | |
| | | | | | | | | | | | | |
| | | | | Energy — 6.6% |
| | 195 | | | Chesapeake Energy Corp. | | | 10,082 | |
| | 104 | | | EnCana Corp. | | | 8,404 | |
| | 202 | | | Exxon Mobil Corp. | | | 18,809 | |
| | 235 | | | Halliburton Co. | | | 10,796 | |
| | 116 | | | Hess Corp. | | | 12,330 | |
| | 257 | | | OAO Gazprom Class S ADR | | | 13,696 | |
| | 124 | | | Schlumberger Ltd. | | | 12,438 | |
| | | | | | | | | |
| | | | | | | | | | | | 86,555 | |
| | | | | | | | | | | | | |
| | | | | Finance — 15.0% |
| | 190 | | | American International Group, Inc. | | | 8,772 | |
| | 592 | | | Bank of America Corp. | | | 22,219 | |
| | 317 | | | Capital One Financial Corp. | | | 16,806 | |
| | 405 | | | Citigroup, Inc. | | | 10,224 | |
| | 578 | | | Discover Financial Services, Inc. | | | 10,517 | |
| | 229 | | | Federal Home Loan Mortgage Corp. | | | 5,702 | |
| | 325 | | | Federal National Mortgage Association | | | 9,195 | |
| | 86 | | | Goldman Sachs Group, Inc. | | | 16,534 | |
| | 114 | | | ING Groep N.V. ADR | | | 4,320 | |
| | 605 | | | Invesco Ltd. | | | 15,517 | |
| | 67 | | | Julius Baer Holding Ltd. | | | 4,937 | |
| | 151 | | | Morgan Stanley | | | 7,329 | |
| | 172 | | | National City Corp. | | | 1,082 | |
| | 675 | | | Sovereign Bancorp, Inc. (G) | | | 5,043 | |
| | 98 | | | State Street Corp. | | | 7,048 | |
| | 282 | | | UBS AG Rights (D)(H) | | | 476 | |
| | 282 | | | UBS AG (D) | | | 9,474 | |
| | 433 | | | UnitedHealth Group, Inc. | | | 14,132 | |
| | 220 | | | Wachovia Corp. | | | 6,413 | |
| | 627 | | | Washington Mutual, Inc. | | | 7,707 | |
| | 79 | | | Wellpoint, Inc. (D) | | | 3,905 | |
| | 411 | | | Western Union Co. | | | 9,462 | |
| | | | | | | | | |
| | | | | | | | | | | | 196,814 | |
| | | | | | | | | | | | | |
| | | | | Health Care — 9.5% |
| | 92 | | | Astellas Pharma, Inc. | | | 3,767 | |
| | 112 | | | AstraZeneca plc | | | 4,715 | |
| | 133 | | | Daiichi Sankyo Co., Ltd. | | | 3,665 | |
| | 104 | | | Eisai Co., Ltd. (G) | | | 3,691 | |
| | 634 | | | Elan Corp. plc ADR (D) | | | 16,655 | |
| | 259 | | | Eli Lilly & Co. | | | 12,449 | |
| | 112 | | | Genentech, Inc. (D) | | | 7,638 | |
| | 240 | | | Medtronic, Inc. | | | 11,688 | |
| | 122 | | | Sanofi-Aventis S.A. ADR | | | 4,687 | |
| | 718 | | | Schering-Plough Corp. | | | 13,211 | |
| | 549 | | | Shionogi & Co., Ltd. | | | 10,603 | |
| | 96 | | | UCB S.A. (G) | | | 4,141 | |
| | 138 | | | Vertex Pharmaceuticals, Inc. (D) | | | 3,514 | |
| | 198 | | | Walgreen Co. | | | 6,907 | |
| | 377 | | | Wyeth | | | 16,756 | |
| | | | | | | | | |
| | | | | | | | | | | | 124,087 | |
| | | | | | | | | | | | | |
| | | | | Services — 8.1% |
| | 142 | | | Accenture Ltd. Class A | | | 5,313 | |
| | 67 | | | Autodesk, Inc. (D) | | | 2,538 | |
| | 1,121 | | | Comcast Corp. Class A | | | 23,030 | |
| | 122 | | | FedEx Corp. | | | 11,696 | |
| | 175 | | | Monster Worldwide, Inc. (D)(G) | | | 4,268 | |
| | 970 | | | Time Warner, Inc. | | | 14,411 | |
| | 258 | | | United Parcel Service, Inc. Class B | | | 18,660 | |
| | 197 | | | Viacom, Inc. Class B (D) | | | 7,575 | |
| | 305 | | | Waste Management, Inc. | | | 11,014 | |
| | 730 | | | XM Satellite Radio Holdings, Inc. Class A (D) | | | 8,144 | |
| | | | | | | | | |
| | | | | | | | | | | | 106,649 | |
| | | | | | | | | | | | | |
| | | | | Technology — 16.8% |
| | 735 | | | Applied Materials, Inc. | | | 13,710 | |
| | 106 | | | Canon, Inc. | | | 5,314 | |
| | 838 | | | Cisco Systems, Inc. (D) | | | 21,484 | |
| | 208 | | | Electronic Arts, Inc. (D) | | | 10,716 | |
| | 573 | | | Flextronics International Ltd. (D) | | | 5,948 | |
| | 1,247 | | | General Electric Co. | | | 40,780 | |
| | 20 | | | Google, Inc. (D) | | | 11,658 | |
| | 847 | | | Intel Corp. | | | 18,843 | |
| | 149 | | | Lam Research Corp. (D)(G) | | | 6,077 | |
| | 44 | | | Lockheed Martin Corp. | | | 4,613 | |
| | 675 | | | Maxim Integrated Products, Inc. | | | 14,187 | |
| | 263 | | | Metropcs Communications, Inc. (D)(G) | | | 5,163 | |
| | 901 | | | Microsoft Corp. | | | 25,697 | |
| | 569 | | | NetApp, Inc. (D) | | | 13,770 | |
| | 288 | | | Nokia Corp. | | | 8,654 | |
| | 304 | | | Qualcomm, Inc. | | | 13,147 | |
| | 3 | | | SanDisk Corp. (D) | | | 87 | |
| | | | | | | | | |
| | | | | | | | | | | | 219,848 | |
| | | | | | | | | | | | | |
| | | | | Transportation — 0.4% |
| | 650 | | | Delta Air Lines, Inc. (D)(G) | | | 5,530 | |
| | | | | | | | | |
| | | | | | | | | | | | | |
The accompanying notes are an integral part of these financial statements.
107
The Hartford Advisers Fund
Schedule of Investments — (continued)
April 30, 2008 (Unaudited)
(000’s Omitted)
| | | | | | | | | | | | | |
| | | | | | | | | Market
| |
| Shares | | | | | | | | Value (W) | |
| COMMON STOCK — (continued) |
| | | | | Utilities — 0.7% |
| | 195 | | | Suntech Power Holdings Co., Ltd. ADR (D) | | $ | 8,731 | |
| | | | | | | | | |
| | | | | Total common stock
(cost $936,984) | | $ | 896,046 | |
| | | | | | | | | | | | | |
| | | | | | | | | | | | | |
| PREFERRED STOCK — 0.7% |
| | | | | Finance — 0.7% |
| | — | | | Washington Mutual, Inc. with Warrants (D)(A)(H)(X) | | $ | 9,102 | |
| | | | | | | | | |
| | | | | Total preferred stock
(cost $7,200) | | $ | 9,102 | |
| | | | | | | | | | | | | |
| | | | | | | | | | | | | |
Principal
| | | | | | | | | |
| Amount | | | | | | | | | |
| |
| ASSET & COMMERCIAL MORTGAGE BACKED SECURITIES — 3.8% |
| | | | | Finance — 3.8% |
| | | | | Advanta Business Card Master Trust | | | | |
| $ | 5,000 | | | 5.30%, 05/21/2012 | | $ | 5,051 | |
| | | | | Banc of America Commercial Mortgage, Inc. | | | | |
| | 1,380 | | | 5.35%, 09/10/2047 (L) | | | 1,369 | |
| | | | | Bear Stearns Commercial Mortgage Securities, Inc. | | | | |
| | 1,755 | | | 5.30%, 10/12/2042 (L) | | | 1,739 | |
| | 1,300 | | | 5.54%, 10/12/2041 | | | 1,285 | |
| | 730 | | | 5.63%, 04/12/2038 (L) | | | 728 | |
| | | | | Citibank Credit Card Issuance Trust | | | | |
| | 2,985 | | | 5.65%, 09/20/2019 | | | 2,947 | |
| | | | | Countrywide Home Loans, Inc. | | | | |
| | 698 | | | 5.25%, 11/25/2035 (L) | | | 618 | |
| | | | | Credit Suisse Mortgage Capital Certificates | | | | |
| | 1,505 | | | 5.47%, 09/15/2039 | | | 1,478 | |
| | | | | Goldman Sachs Mortgage Securities Corp. II | | | | |
| | 3,000 | | | 4.75%, 07/10/2039 | | | 2,900 | |
| | | | | GSR Mortgage Loan Trust | | | | |
| | 1,365 | | | 5.79%, 05/25/2047 (L) | | | 1,284 | |
| | | | | Household Automotive Trust | | | | |
| | 1,622 | | | 5.28%, 09/17/2011 | | | 1,633 | |
| | | | | JP Morgan Chase Commercial Mortgage Security Corp. | | | | |
| | 1,895 | | | 5.34%, 12/15/2044 (L) | | | 1,883 | |
| | 3,050 | | | 5.48%, 12/12/2044 (L) | | | 3,016 | |
| | 1,300 | | | 6.07%, 04/15/2045 (L) | | | 1,318 | |
| | | | | Marriott Vacation Club Owner Trust | | | | |
| | 327 | | | 5.36%, 10/20/2028 (I) | | | 336 | |
| | | | | Morgan Stanley Capital I | | | | |
| | 2,875 | | | 5.23%, 09/15/2042 | | | 2,851 | |
| | 1,300 | | | 5.98%, 08/12/2041 (L) | | | 1,318 | |
| | | | | Nissan Automotive Lease Trust | | | | |
| | 5,000 | | | 5.10%, 07/16/2012 | | | 5,060 | |
| | | | | Peco Energy Transition Trust | | | | |
| | 3,129 | | | 6.13%, 03/01/2009 | | | 3,158 | |
| | | | | Residential Accredit Loans, Inc. | | | | |
| | 1,804 | | | 5.23%, 02/25/2035 (L) | | | 1,486 | |
| | | | | Sequoia Mortgage Trust | | | | |
| | 2,057 | | | 5.78%, 02/20/2047 (L) | | | 1,938 | |
| | | | | Susquehanna Automotive Lease Trust | | | | |
| | 1,859 | | | 5.21%, 03/16/2009 (I) | | | 1,863 | |
| | | | | Wells Fargo Mortgage Backed Securities Trust | | | | |
| | 1,669 | | | 4.54%, 03/25/2035 (L) | | | 1,603 | |
| | 2,250 | | | 5.54%, 04/25/2036 (L) | | | 2,165 | |
| | | | | Wells Fargo Mortgage Backed Securities Trust | | | | |
| | 1,085 | | | 6.02%, 09/25/2036 (L) | | | 1,050 | |
| | | | | | | | | |
| | | | | Total asset & commercial
mortgage backed securities
(cost $50,916) | | $ | 50,077 | |
| | | | | | | | | | | | | |
| | | | | | | | | | | | | |
| CORPORATE BONDS: INVESTMENT GRADE — 14.1% |
| | | | | Capital Goods — 0.2% |
| | | | | Pitney Bowes, Inc. | | | | |
| $ | 960 | | | 5.75%, 09/15/2017 | | $ | 968 | |
| | | | | Xerox Corp. | | | | |
| | 1,000 | | | 5.50%, 05/15/2012 | | | 1,001 | |
| | | | | | | | | |
| | | | | | | | | | | | 1,969 | |
| | | | | | | | | | | | | |
| | | | | Consumer Cyclical — 0.5% |
| | | | | DaimlerChrysler NA Holdings Corp. | | | | |
| | 1,000 | | | 5.88%, 03/15/2011 | | | 1,023 | |
| | 1,975 | | | 6.50%, 11/15/2013 | | | 2,063 | |
| | | | | Federated Retail Holdings, Inc. | | | | |
| | 714 | | | 5.90%, 12/01/2016 | | | 626 | |
| | | | | Lowe’s Co., Inc. | | | | |
| | 1,295 | | | 6.65%, 09/15/2037 | | | 1,297 | |
| | | | | Target Corp. | | | | |
| | 2,000 | | | 5.88%, 11/01/2008 | | | 2,022 | |
| | | | | | | | | |
| | | | | | | | | | | | 7,031 | |
| | | | | | | | | | | | | |
| | | | | Consumer Staples — 1.0% |
| | | | | Cargill, Inc. | | | | |
| | 1,215 | | | 5.60%, 09/15/2012 (I) | | | 1,225 | |
| | | | | Diageo Capital plc | | | | |
| | 2,025 | | | 4.38%, 05/03/2010 | | | 2,040 | |
| | | | | Kraft Foods, Inc. | | | | |
| | 2,325 | | | 6.25%, 06/01/2012 | | | 2,414 | |
| | | | | PepsiAmericas, Inc. | | | | |
| | 3,000 | | | 6.38%, 05/01/2009 | | | 3,093 | |
| | | | | Procter & Gamble Co. | | | | |
| | 2,988 | | | 9.36%, 01/01/2021 | | | 3,807 | |
| | | | | Weyerhaeuser Co. | | | | |
| | 800 | | | 7.38%, 03/15/2032 | | | 803 | |
| | | | | | | | | |
| | | | | | | | | | | | 13,382 | |
| | | | | | | | | | | | | |
| | | | | Energy — 0.2% |
| | | | | Atmos Energy Corp. | | | | |
| | 1,160 | | | 6.35%, 06/15/2017 | | | 1,159 | |
| | | | | Weatherford International Ltd. | | | | |
| | 2,000 | | | 5.95%, 06/15/2012 | | | 2,076 | |
| | | | | | | | | |
| | | | | | | | | | | | 3,235 | |
| | | | | | | | | | | | | |
| | | | | Finance — 7.4% |
| | | | | Ace INA Holdings, Inc. | | | | |
| | 1,925 | | | 5.88%, 06/15/2014 | | | 1,987 | |
| | | | | American Express Centurion Bank | | | | |
| | 2,400 | | | 6.00%, 09/13/2017 | | | 2,413 | |
| | | | | AXA Financial, Inc. | | | | |
| | 3,000 | | | 7.00%, 04/01/2028 | | | 2,793 | |
| | | | | Bank of America Corp. | | | | |
| | 3,000 | | | 5.42%, 03/15/2017 | | | 2,941 | |
The accompanying notes are an integral part of these financial statements.
108
| | | | | | | | | | | | | |
Principal
| | | | | | | | Market
| |
| Amount | | | | | | | | Value (W) | |
| |
| | | | | | | | | | | | | |
| CORPORATE BONDS: INVESTMENT GRADE — (continued) |
| | | | | | | | | | | | | |
| | | | | Finance — (continued) |
| | | | | Bank of New York Mellon Corp. | | | | |
| $ | 1,360 | | | 4.95%, 11/01/2012 | | $ | 1,380 | |
| | | | | BB&T Corp. | | | | |
| | 1,010 | | | 4.90%, 06/30/2017 | | | 917 | |
| | | | | Berkshire Hathaway Finance Corp. | | | | |
| | 2,350 | | | 4.85%, 01/15/2015 | | | 2,368 | |
| | | | | Brandywine Operating Partnership | | | | |
| | 750 | | | 5.70%, 05/01/2017 | | | 632 | |
| | 1,000 | | | 6.00%, 04/01/2016 | | | 881 | |
| | | | | Capital One Bank | | | | |
| | 750 | | | 6.50%, 06/13/2013 | | | 731 | |
| | | | | Capital One Capital IV | | | | |
| | 1,000 | | | 6.75%, 02/17/2037 | | | 808 | |
| | | | | Capital One Financial Corp. | | | | |
| | 870 | | | 5.70%, 09/15/2011 | | | 849 | |
| | | | | CIT Group, Inc. | | | | |
| | 1,150 | | | 7.63%, 11/30/2012 | | | 1,073 | |
| | | | | Citigroup, Inc. | | | | |
| | 750 | | | 3.63%, 02/09/2009 | | | 749 | |
| | 1,600 | | | 6.00%, 10/31/2033 | | | 1,448 | |
| | 500 | | | 6.50%, 01/18/2011 | | | 517 | |
| | | | | Credit Suisse First Boston USA, Inc. | | | | |
| | 1,980 | | | 4.88%, 01/15/2015 | | | 1,928 | |
| | | | | Developers Diversified Realty Corp. | | | | |
| | 1,500 | | | 5.38%, 10/15/2012 | | | 1,400 | |
| | | | | Discover Financial Services, Inc. | | | | |
| | 1,245 | | | 6.45%, 06/12/2017 | | | 1,050 | |
| | | | | Eaton Vance Corp. | | | | |
| | 530 | | | 6.50%, 10/02/2017 | | | 552 | |
| | | | | ERAC USA Finance Co. | | | | |
| | 2,725 | | | 7.35%, 06/15/2008 (I) | | | 2,736 | |
| | | | | Everest Reinsurance Holdings, Inc. | | | | |
| | 885 | | | 5.40%, 10/15/2014 | | | 859 | |
| | | | | General Electric Capital Corp. | | | | |
| | 1,500 | | | 6.75%, 03/15/2032 | | | 1,588 | |
| | | | | Genworth Financial, Inc. | | | | |
| | 1,500 | | | 6.15%, 11/15/2066 | | | 1,256 | |
| | | | | Goldman Sachs Group, Inc. | | | | |
| | 2,000 | | | 5.30%, 02/14/2012 | | | 2,021 | |
| | 1,200 | | | 5.63%, 01/15/2017 | | | 1,160 | |
| | 1,200 | | | 6.45%, 05/01/2036 | | | 1,139 | |
| | | | | Health Care Properties | | | | |
| | 2,035 | | | 6.00%, 01/30/2017 | | | 1,752 | |
| | | | | HSBC Bank USA | | | | |
| | 2,600 | | | 3.88%, 09/15/2009 | | | 2,589 | |
| | | | | HSBC Finance Corp. | | | | |
| | 2,000 | | | 5.50%, 01/19/2016 | | | 1,980 | |
| | | | | International Lease Finance Corp. | | | | |
| | 2,200 | | | 5.00%, 09/15/2012 | | | 2,113 | |
| | 1,200 | | | 5.63%, 09/15/2010 | | | 1,197 | |
| | | | | Jackson National Life Insurance Co. | | | | |
| | 2,000 | | | 8.15%, 03/15/2027 (I) | | | 2,209 | |
| | | | | John Deere Capital Corp. | | | | |
| | 1,655 | | | 4.88%, 10/15/2010 | | | 1,696 | |
| | | | | JP Morgan Chase & Co. | | | | |
| | 2,795 | | | 5.13%, 09/15/2014 | | | 2,759 | |
| | | | | KeyCorp Capital II | | | | |
| | 250 | | | 6.88%, 03/17/2029 | | | 204 | |
| | | | | Kimco Realty Corp. | | | | |
| | 1,550 | | | 5.78%, 03/15/2016 | | | 1,441 | |
| | | | | Lehman Brothers Holdings, Inc. | | | | |
| | 2,000 | | | 5.25%, 02/06/2012 | | | 1,950 | |
| | 1,000 | | | 6.50%, 07/19/2017 | | | 982 | |
| | | | | Liberty Mutual Group, Inc. | | | | |
| | 2,335 | | | 5.75%, 03/15/2014 (I) | | | 2,348 | |
| | | | | Liberty Property L.P. | | | | |
| | 260 | | | 6.63%, 10/01/2017 | | | 245 | |
| | | | | Merrill Lynch & Co., Inc. | | | | |
| | 2,000 | | | 5.00%, 02/03/2014 | | | 1,880 | |
| | | | | Metlife, Inc. | | | | |
| | 2,000 | | | 5.00%, 06/15/2015 | | | 1,984 | |
| | | | | Morgan Stanley | | | | |
| | 2,650 | | | 5.38%, 10/15/2015 | | | 2,549 | |
| | 1,200 | | | 5.45%, 01/09/2017 | | | 1,147 | |
| | | | | National City Corp. | | | | |
| | 125 | | | 6.88%, 05/15/2019 | | | 107 | |
| | | | | New England Mutual Life Insurance Co. | | | | |
| | 3,100 | | | 7.88%, 02/15/2024 (I) | | | 3,600 | |
| | | | | Prologis Trust | | | | |
| | 1,500 | | | 5.63%, 11/15/2016 | | | 1,396 | |
| | | | | Prudential Financial, Inc. | | | | |
| | 585 | | | 5.80%, 06/15/2012 | | | 603 | |
| | | | | Prudential Funding LLC | | | | |
| | 2,000 | | | 6.75%, 09/15/2023 (I) | | | 1,967 | |
| | | | | Realty Income Corp. | | | | |
| | 965 | | | 6.75%, 08/15/2019 | | | 903 | |
| | | | | Republic New York Capital I | | | | |
| | 250 | | | 7.75%, 11/15/2026 | | | 243 | |
| | | | | Santander Central Hispano Issuances Ltd. | | | | |
| | 500 | | | 7.63%, 11/03/2009 | | | 517 | |
| | | | | Simon Property Group L.P. | | | | |
| | 3,100 | | | 6.10%, 05/01/2016 | | | 3,108 | |
| | | | | Sovereign Capital Trust IV | | | | |
| | 1,500 | | | 7.91%, 06/13/2036 | | | 1,152 | |
| | | | | Torchmark Corp. | | | | |
| | 3,000 | | | 8.25%, 08/15/2009 | | | 3,164 | |
| | | | | UnitedHealth Group, Inc. | | | | |
| | 1,000 | | | 5.00%, 08/15/2014 | | | 953 | |
| | 500 | | | 5.50%, 11/15/2012 | | | 498 | |
| | | | | US Bank NA | | | | |
| | 3,100 | | | 4.95%, 10/30/2014 | | | 3,067 | |
| | | | | WEA Finance LLC | | | | |
| | 1,000 | | | 7.13%, 04/15/2018 (I) | | | 1,035 | |
| | | | | Wells Fargo Bank NA | | | | |
| | 4,000 | | | 6.45%, 02/01/2011 | | | 4,197 | |
| | | | | Willis North America, Inc. | | | | |
| | 580 | | | 5.63%, 07/15/2015 | | | 562 | |
| | 580 | | | 6.20%, 03/28/2017 | | | 566 | |
| | | | | | | | | |
| | | | | | | | | | | | 96,839 | |
| | | | | | | | | | | | | |
| | | | | Health Care — 0.7% |
| | | | | AstraZeneca plc | | | | |
| | 1,200 | | | 5.40%, 09/15/2012 | | | 1,243 | |
| | | | | Becton, Dickinson & Co. | | | | |
| | 1,250 | | | 6.70%, 08/01/2028 | | | 1,315 | |
| | | | | CVS Corp. | | | | |
| | 1,550 | | | 6.13%, 08/15/2016 | | | 1,602 | |
| | | | | Schering-Plough Corp. | | | | |
| | 2,000 | | | 5.55%, 12/01/2013 | | | 2,049 | |
The accompanying notes are an integral part of these financial statements.
109
The Hartford Advisers Fund
Schedule of Investments — (continued)
April 30, 2008 (Unaudited)
(000’s Omitted)
| | | | | | | | | | | | | |
Principal
| | | | | | | | Market
| |
| Amount | | | | | | | | Value (W) | |
| |
| | | | | | | | | | | | | |
| CORPORATE BONDS: INVESTMENT GRADE — (continued) |
| | | | | | | | | | | | | |
| | | | | Health Care — (continued) |
| | | | | Wyeth | | | | |
| $ | 2,500 | | | 6.95%, 03/15/2011 | | $ | 2,674 | |
| | | | | | | | | |
| | | | | | | | | | | | 8,883 | |
| | | | | | | | | | | | | |
| | | | | Services — 1.0% |
| | | | | COX Communications, Inc. | | | | |
| | 2,000 | | | 5.45%, 12/15/2014 | | | 1,990 | |
| | | | | FedEx Corp. | | | | |
| | 4,000 | | | 3.50%, 04/01/2009 | | | 3,989 | |
| | | | | Time Warner, Inc. | | | | |
| | 1,105 | | | 5.50%, 11/15/2011 | | | 1,095 | |
| | | | | United Parcel Service, Inc. | | | | |
| | 2,350 | | | 4.50%, 01/15/2013 | | | 2,393 | |
| | | | | Viacom, Inc. | | | | |
| | 3,040 | | | 6.88%, 04/30/2036 | | | 3,045 | |
| | | | | Wyndham Worldwide Corp. | | | | |
| | 615 | | | 6.00%, 12/01/2016 | | | 553 | |
| | | | | | | | | |
| | | | | | | | | | | | 13,065 | |
| | | | | | | | | | | | | |
| | | | | Technology — 1.9% |
| | | | | AT&T, Inc. | | | | |
| | 1,075 | | | 6.80%, 05/15/2036 | | | 1,131 | |
| | | | | BellSouth Telecommunications | | | | |
| | 250 | | | 7.00%, 12/01/2095 | | | 249 | |
| | | | | Comcast Cable Communications, Inc. | | | | |
| | 4,000 | | | 6.88%, 06/15/2009 | | | 4,104 | |
| | | | | Deutsche Telekom International Finance B.V. | | | | |
| | 1,800 | | | 8.25%, 06/15/2030 | | | 2,233 | |
| | | | | Fiserv, Inc. | | | | |
| | 1,250 | | | 6.13%, 11/20/2012 | | | 1,270 | |
| | | | | General Electric Co. | | | | |
| | 3,425 | | | 5.00%, 02/01/2013 | | | 3,494 | |
| | | | | Hewlett-Packard Co. | | | | |
| | 1,250 | | | 5.25%, 03/01/2012 | | | 1,296 | |
| | | | | Intuit, Inc. | | | | |
| | 1,500 | | | 5.40%, 03/15/2012 | | | 1,501 | |
| | | | | SBC Communications | | | | |
| | 1,830 | | | 6.45%, 06/15/2034 | | | 1,811 | |
| | | | | Siemens Finance | | | | |
| | 2,900 | | | 5.75%, 10/17/2016 (I) | | | 2,936 | |
| | | | | Time Warner Cable, Inc. | | | | |
| | 830 | | | 5.85%, 05/01/2017 | | | 824 | |
| | | | | Verizon Global Funding Corp. | | | | |
| | 250 | | | 7.25%, 12/01/2010 | | | 267 | |
| | 2,850 | | | 7.75%, 12/01/2030 | | | 3,239 | |
| | | | | | | | | |
| | | | | | | | | | | | 24,355 | |
| | | | | | | | | | | | | |
| | | | | Transportation — 0.2% |
| | | | | Continental Airlines, Inc. | | | | |
| | 755 | | | 5.98%, 04/19/2022 | | | 658 | |
| | | | | Southwest Airlines Co. | | | | |
| | 1,750 | | | 5.75%, 12/15/2016 | | | 1,636 | |
| | 688 | | | 6.15%, 08/01/2022 | | | 652 | |
| | | | | | | | | |
| | | | | | | | | | | | 2,946 | |
| | | | | | | | | | | | | |
| | | | | Utilities — 1.0% |
| | | | | Consolidated Edison Co. of NY | | | | |
| | 955 | | | 5.30%, 12/01/2016 | | | 944 | |
| | | | | Enel Finance International | | | | |
| | 805 | | | 6.80%, 09/15/2037 (I) | | | 833 | |
| | | | | Indianapolis Power and Light | | | | |
| | 1,500 | | | 6.60%, 06/01/2037 (I) | | | 1,447 | |
| | | | | Kinder Morgan Energy Partners L.P. | | | | |
| | 1,500 | | | 6.95%, 01/15/2038 | | | 1,521 | |
| | | | | MidAmerican Energy Co. | | | | |
| | 1,000 | | | 5.65%, 07/15/2012 | | | 1,040 | |
| | | | | MidAmerican Energy Holdings Co. | | | | |
| | 500 | | | 6.13%, 04/01/2036 | | | 500 | |
| | | | | Northern Border Pipeline Co. | | | | |
| | 1,150 | | | 7.75%, 09/01/2009 | | | 1,201 | |
| | | | | Northern States Power Co. | | | | |
| | 2,250 | | | 6.20%, 07/01/2037 | | | 2,317 | |
| | | | | Southern California Edison Co. | | | | |
| | 1,750 | | | 5.55%, 01/15/2037 | | | 1,670 | |
| | | | | Taqa Abu Dhabi National Energy Co. | | | | |
| | 550 | | | 5.62%, 10/25/2012 (I) | | | 558 | |
| | 695 | | | 5.88%, 10/27/2016 (I) | | | 705 | |
| | | | | TransCanada Pipelines Ltd. | | | | |
| | 250 | | | 6.49%, 01/21/2009 | | | 254 | |
| | | | | | | | | |
| | | | | | | | | | | | 12,990 | |
| | | | | | | | | | | | | |
| | | | | Total corporate bonds: investment grade
(cost $185,910) | | $ | 184,695 | |
| | | | | | | | | | | | | |
| | | | | | | | | | | | | |
| MUNICIPAL BONDS — 0.6% |
| | | | | General Obligations — 0.3% |
| | | | | Oregon School Boards Association, Taxable Pension | | | | |
| $ | 2,000 | | | 4.76%, 06/30/2028 | | $ | 1,823 | |
| | | | | State of Illinois, Taxable Pension | | | | |
| | 2,050 | | | 5.10%, 06/01/2033 | | | 1,972 | |
| | | | | | | | | |
| | | | | | | | | | | | 3,795 | |
| | | | | | | | | | | | | |
| | | | | Prerefunded — 0.3% |
| | | | | Arizona Tourism & Sports Authority | | | | |
| | 2,000 | | | 5.38%, 07/01/2021 | | | 2,220 | |
| | | | | Wisconsin State GO Unlimited | | | | |
| | 2,000 | | | 5.00%, 05/01/2017 | | | 2,179 | |
| | | | | | | | | |
| | | | | | | | | | | | 4,399 | |
| | | | | | | | | | | | | |
| | | | | Total municipal bonds
(cost $8,349) | | $ | 8,194 | |
| | | | | | | | | |
| U.S. GOVERNMENT AGENCIES — 1.9% |
| | | | | Federal Home Loan Mortgage Corporation — 0.8% |
| | | | | Mortgage Backed Securities: |
| $ | 9,280 | | | 6.50%, 2036 | | $ | 9,624 | |
| | | | | Remic — Pac’s: |
| | 795 | | | 2.50%, 2013 | | | 793 | |
| | | | | | | | | |
| | | | | | | | | | | | 10,417 | |
| | | | | | | | | | | | | |
| | | | | Federal National Mortgage Association — 0.3% |
| | | | | Mortgage Backed Securities: |
| | 118 | | | 5.00%, 2036 | | | 116 | |
| | 3,963 | | | 5.50%, 2036 — 2037 | | | 3,988 | |
| | 372 | | | 6.50%, 2036 | | | 386 | |
| | | | | | | | | |
| | | | | | | | | | | | 4,490 | |
| | | | | | | | | | | | | |
| | | | | | | | | | | | | |
The accompanying notes are an integral part of these financial statements.
110
| | | | | | | | | | | | | |
Principal
| | | | | | | | Market
| |
| Amount | | | | | | | | Value (W) | |
| |
| | | | | | | | | | | | | |
| U.S. GOVERNMENT AGENCIES — (continued) |
| | | | | Government National Mortgage Association — 0.8% |
| | | | | Mortgage Backed Securities: |
| $ | 2,545 | | | 5.50%, 2036 — 2037 | | $ | 2,582 | |
| | 2,792 | | | 6.00%, 2023 — 2034 | | | 2,876 | |
| | 1,960 | | | 6.50%, 2026 — 2035 | | | 2,050 | |
| | 2,032 | | | 7.00%, 2031 — 2033 | | | 2,172 | |
| | 408 | | | 8.00%, 2029 — 2031 | | | 446 | |
| | | | | | | | | |
| | | | | | | | | | | | 10,126 | |
| | | | | | | | | | | | | |
| | | | | Total U.S. government agencies
(cost $24,198) | | $ | 25,033 | |
| | | | | | | | | | | | | |
| | | | | | | | | | | | | |
| U.S. GOVERNMENT SECURITIES — 7.1% |
| | | | | Other Direct Federal Obligations — 1.9% |
| | | | | Federal Financing Corporation: |
| $ | 3,676 | | | 4.40%, 2013 (M) | | $ | 3,004 | |
| | 10,000 | | | 9.80%, 2018 | | | 14,364 | |
| | | | | | | | | |
| | | | | | | | | | | | 17,368 | |
| | | | | | | | | | | | | |
| | | | | Federal Home Loan Bank: |
| | 7,225 | | | 4.88%, 2011 (G) | | | 7,630 | |
| | | | | | | | | |
| | | | | | | | | | | | 24,998 | |
| | | | | | | | | | | | | |
| | | | | U.S. Treasury Securities — 5.2% |
| | | | | U.S. Treasury Bonds: |
| | 8,800 | | | 5.38%, 2031 (G) | | | 9,901 | |
| | 5,775 | | | 6.25%, 2023 (G) | | | 6,950 | |
| | | | | | | | | |
| | | | | | | | | | | | 16,851 | |
| | | | | | | | | | | | | |
| | | | | U.S. Treasury Notes: |
| | 9,300 | | | 2.63%, 2009 (G) | | | 9,365 | |
| | 21,725 | | | 3.50%, 2010 (G) | | | 22,214 | |
| | 6,335 | | | 4.13%, 2010 (G) | | | 6,595 | |
| | 10,200 | | | 4.50%, 2017 (G) | | | 10,809 | |
| | 1,277 | | | 4.75%, 2012 (G) | | | 1,368 | |
| | | | | | | | | |
| | | | | | | | | | | | 50,351 | |
| | | | | | | | | | | | | |
| | | | | | | | | | | | 67,202 | |
| | | | | | | | | | | | | |
| | | | | Total U.S. government securities
(cost $85,710) | | $ | 92,200 | |
| | | | | | | | | |
| | | | | Total long-term investments
(cost $1,299,267) | | $ | 1,265,347 | |
| | | | | | | | | | | | | |
| | | | | | | | | | | | | |
| SHORT-TERM INVESTMENTS — 11.8% |
| | | | | Federal National Mortgage Association — 0.7% |
| | | | | Federal National Mortgage Association | | | | |
| $ | 9,000 | | | 1.97%, 2008 (M) | | $ | 8,988 | |
| | | | | Other Direct Federal Obligations — 0.7% |
| | | | | Federal Home Loan Bank: |
| $ | 9,000 | | | 2.02%, 2008 | | $ | 8,990 | |
| | | | | | | | | | | | | |
| | | | | | | | | | | | | |
| | | | | Repurchase Agreements — 2.4% |
| | | | | Banc of America Securities TriParty Joint Repurchase Agreement (maturing on 05/01/2008 in the amount of $11,898, collateralized by FHLMC 5.00%, 2035, value of $12,135) | | | | |
| | 11,897 | | | 1.98% dated 04/30/2008 | | | 11,897 | |
| | | | | BNP Paribas Securities Corp. TriParty Joint Repurchase Agreement (maturing on 05/01/2008 in the amount of $5,835, collateralized by FNMA 5.50% — 6.50%, 2036 — 2038, value of $5,951) | | | | |
| | 5,834 | | | 2.00% dated 04/30/2008 | | | 5,834 | |
| | | | | Deutsche Bank Securities Joint Repurchase Agreement (maturing on 05/01/2008 in the amount of $12, collateralized by U. S. Treasury Note 3.63%, 2009, value of $12) | | | | |
| | 12 | | | 1.90% dated 04/30/2008 | | | 12 | |
| | | | | Deutsche Bank Securities TriParty Joint Repurchase Agreement (maturing on 05/01/2008 in the amount of $7,253, collateralized by FHLMC 4.50% — 7.00%, 2016 — 2038, value of $7,398) | | | | |
| | 7,253 | | | 2.00% dated 04/30/2008 | | | 7,253 | |
| | | | | JP Morgan Chase TriParty Joint Repurchase Agreement (maturing on 05/01/2008 in the amount of $6,990, collateralized by FNMA 4.50% — 7.00%, 2020 — 2038, value of $7,130) | | | | |
| | 6,990 | | | 1.96% dated 04/30/2008 | | | 6,990 | |
| | | | | | | | | |
| | | | | | | | | | | | 31,986 | |
| | | | | | | | | | | | | |
| | | | | | | | | | | | | |
| | | | | | | | | | | | | |
| Shares | | | | | | | | | |
| |
| | | | | Securities Purchased with Proceeds from Security Lending — 8.0% |
| | | | | Cash Collateral Reinvestment Fund: |
| | 104,889 | | | Navigator Prime Portfolio | | | 104,889 | |
| | | | | | | | | |
| | | | | Total short-term investments
(cost $154,852) | | $ | 154,853 | |
| | | | | | | | | |
| | | | | Total investments
(cost $1,454,119) (C) | | | 108.5 | % | | $ | 1,420,200 | |
| | | | | Other assets and liabilities | | | (8.5 | )% | | | (110,717 | ) |
| | | | | | | | | | | | | |
| | | | | Total net assets | | | 100.0 | % | | $ | 1,309,483 | |
| | | | | | | | | | | | | |
| |
| Note: | Percentage of investments as shown is the ratio of the total market value to total net assets. Market value of investments in foreign securities represents 11.87% of total net assets at April 30, 2008. |
| | |
| (C) | | At April 30, 2008, the cost of securities for federal income tax purposes was $1,458,418 and the aggregate gross unrealized appreciation and depreciation based on that cost were: |
| | | | | |
| Unrealized Appreciation | | $ | 59,640 | |
| Unrealized Depreciation | | | (97,858 | ) |
| | | | | |
| Net Unrealized Depreciation | | $ | (38,218 | ) |
| | | | | |
The accompanying notes are an integral part of these financial statements.
111
The Hartford Advisers Fund
Schedule of Investments — (continued)
April 30, 2008 (Unaudited)
(000’s Omitted)
| | |
| † | | The aggregate value of securities valued in good faith at fair value as determined under policies and procedures established by and under the supervision of the Funds’ Board of Directors at April 30, 2008, was $11,104, which represents 0.85% of total net assets. This calculation excludes securities that are principally traded on certain foreign markets and whose prices were adjusted solely pursuant to a third party pricing service methodology approved by the Board of Directors. |
| |
| (D) | | Currently non-income producing. |
| |
| (G) | | Security is partially on loan at April 30, 2008. |
| |
| (I) | | Securities issued within terms of a private placement memorandum, exempt from registration under Section 144A of the Securities Act of 1933, as amended, and may be sold only to qualified institutional buyers. Pursuant to guidelines adopted by the Board of Directors, these issues are determined to be liquid. The aggregate value of these securities at April 30, 2008 was $23,798, which represents 1.82% of total net assets. |
| |
| (L) | | Variable rate securities; the rate reported is the coupon rate in effect at April 30, 2008. |
| |
| (M) | | The interest rate disclosed for these securities represents the effective yield on the date of acquisition. |
| |
| (H) | | The following securities are considered illiquid. Illiquid securities are often purchased in private placement transactions, are not registered under the Securities Act of 1933 and may have contractual restrictions on resale. A security may also be considered illiquid if the security lacks a readily available market or if its valuation has not changed for a certain period of time. |
| | | | | | | | | | | |
Period
| | | | | | | | |
Acquired | | Shares/Par | | | Security | | Cost Basis | |
| 06/2007 | | | 2,225 | | | Buck Holdings L.P. | | $ | 2,227 | |
10/2006 –
03/2008 | | | 282 | | | UBS AG Rights | | | —
| |
| 04/2008 | | | — | | | Washington Mutual, Inc. with Warrants | | | 7,200 | |
| | |
| | The aggregate value of these securities at April 30, 2008 was $11,580, which represents 0.88% of total net assets. |
| |
| (X) | | Convertible security. |
| |
| | GO — General Obligations |
Forward Foreign Currency Contracts Outstanding at April 30, 2008
| | | | | | | | | | | | | | | | | |
| | | | | | | | | | | | Unrealized
| |
| | | Market
| | | Contract
| | | Delivery
| | | Appreciation/
| |
Description | | Value (W) | | | Amount | | | Date | | | (Depreciation) | |
| |
| Euro (Sell) | | $ | 51,758 | | | $ | 49,793 | | | | 06/03/08 | | | $ | (1,965 | ) |
| Japanese Yen (Sell) | | | 489 | | | | 487 | | | | 05/02/08 | | | | (2 | ) |
| | | | | | | | | | | | | | | | | |
| | | | | | | | | | | | | | | $ | (1,967 | ) |
| | | | | | | | | | | | | | | | | |
| | |
| (W) | | See Note 2b of accompanying Notes to Financial Statements regarding valuation of securities. |
The accompanying notes are an integral part of these financial statements.
112
The Hartford Balanced Allocation Fund
Schedule of Investments
April 30, 2008 (Unaudited)
(000’s Omitted)
| | | | | | | | | | | | | |
| | | | | | | | | Market
| |
| Shares | | | | | | | | Value (W) | |
| |
| AFFILIATED INVESTMENT COMPANIES — 99.2% |
| EQUITY FUNDS — 59.7% |
| | 3,974 | | | The Hartford Capital Appreciation Fund, Class Y | | $ | 166,498 | |
| | 615 | | | The Hartford Capital Appreciation II Fund, Class Y | | | 8,478 | |
| | 2,891 | | | The Hartford Disciplined Equity Fund, Class Y | | | 39,723 | |
| | 4,007 | | | The Hartford Equity Income Fund, Class Y | | | 54,455 | |
| | 1,967 | | | The Hartford Global Growth Fund, Class Y | | | 40,104 | |
| | 240 | | | The Hartford Growth Fund, Class Y | | | 4,338 | |
| | 2,315 | | | The Hartford International Opportunities Fund, Class Y | | | 40,682 | |
| | 2,786 | | | The Hartford International Small Company Fund, Class Y | | | 39,258 | |
| | 1,536 | | | The Hartford Select MidCap Value Fund, Class Y | | | 14,718 | |
| | 2,550 | | | The Hartford Select SmallCap Value Fund, Class Y | | | 23,540 | |
| | 1,788 | | | The Hartford Small Company Fund, Class Y | | | 35,937 | |
| | 9,373 | | | The Hartford Value Fund, Class Y | | | 116,221 | |
| | | | | | | | | |
| | | | | Total equity funds
(cost $574,208) | | $ | 583,952 | |
| | | | | | | | | | | | | |
| | | | | | | | | | | | | |
| FIXED INCOME FUNDS — 39.5% |
| | 5,794 | | | The Hartford Floating Rate Fund, Class Y | | $ | 52,784 | |
| | 12,781 | | | The Hartford Income Fund, Class Y | | | 125,889 | |
| | 6,174 | | | The Hartford Inflation Plus Fund, Class Y | | | 69,268 | |
| | 5,229 | | | The Hartford Short Duration Fund, Class Y | | | 49,887 | |
| | 1,793 | | | The Hartford Strategic Income Fund, Class Y | | | 17,035 | |
| | 6,844 | | | The Hartford Total Return Bond Fund, Class Y | | | 72,271 | |
| | | | | | | | | |
| | | | | Total fixed income funds
(cost $398,115) | | $ | 387,134 | |
| | | | | | | | | |
| | | | | Total investments in affiliated investment companies
(cost $972,323) | | $ | 971,086 | |
| | | | | | | | | | | | | |
| | | | | | | | | | | | | |
| EXCHANGE TRADED FUNDS — 0.6% |
| | 14 | | | DJ Wilshire REIT ETF | | $ | 1,069 | |
| | 77 | | | SPDR DJ Wilshire International Real Estate ETF | | | 4,274 | |
| | | | | | | | | |
| | | | | Total investments in exchange traded funds
(cost $5,223) | | $ | 5,343 | |
| | | | | | | | | |
| | | | | Total investments
(cost $977,546) (C) | | | 99.8 | % | | $ | 976,429 | |
| | | | | Other assets and liabilities | | | 0.2 | % | | | 2,163 | |
| | | | | | | | | | | | | |
| | | | | Total net assets | | | 100.0 | % | | $ | 978,592 | |
| | | | | | | | | | | | | |
| |
| Note: | Percentage of investments as shown is the ratio of the total market value to total net assets. |
| | |
| (C) | | At April 30, 2008, the cost of securities for federal income tax purposes was $977,903 and the aggregate gross unrealized appreciation and depreciation based on that cost were: |
| | | | | |
| Unrealized Appreciation | | $ | 25,018 | |
| Unrealized Depreciation | | | (26,492 | ) |
| | | | | |
| Net Unrealized Depreciation | | $ | (1,474 | ) |
| | | | | |
| | |
| (W) | | See Note 2b of accompanying Notes to Financial Statements regarding valuation of securities. |
The accompanying notes are an integral part of these financial statements.
113
The Hartford Balanced Income Fund
Schedule of Investments
April 30, 2008 (Unaudited)
(000’s Omitted)
| | | | | | | | | | | | | |
| | | | | | | | | Market
| |
| Shares | | | | | | | | Value (W) | |
| COMMON STOCK — 44.8% |
| | | | | Basic Materials — 4.3% |
| | 8 | | | Dow Chemical Co. | | $ | 329 | �� |
| | 10 | | | E.I. DuPont de Nemours & Co. | | | 470 | |
| | 9 | | | International Paper Co. | | | 235 | |
| | 12 | | | Kimberly-Clark Corp. | | | 749 | |
| | 9 | | | Packaging Corp. of America | | | 196 | |
| | 5 | | | PPG Industries, Inc. | | | 288 | |
| | 20 | | | Rexam plc | | | 181 | |
| | | | | | | | | |
| | | | | | | | | | | | 2,448 | |
| | | | | | | | | | | | | |
| | | | | Consumer Cyclical — 3.0% |
| | 17 | | | Altria Group, Inc. | | | 348 | |
| | 9 | | | Genuine Parts Co. | | | 370 | |
| | 5 | | | McDonald’s Corp. | | | 286 | |
| | 14 | | | Philip Morris International, Inc. (D) | | | 704 | |
| | | | | | | | | |
| | | | | | | | | | | | 1,708 | |
| | | | | | | | | | | | | |
| | | | | Consumer Staples — 2.9% |
| | 10 | | | ConAgra Foods, Inc. | | | 240 | |
| | 4 | | | Diageo plc ADR | | | 295 | |
| | 6 | | | General Mills, Inc. | | | 332 | |
| | 10 | | | Kellogg Co. | | | 522 | |
| | 8 | | | Unilever N.V. NY Shares ADR | | | 265 | |
| | | | | | | | | |
| | | | | | | | | | | | 1,654 | |
| | | | | | | | | | | | | |
| | | | | Energy — 7.1% |
| | 18 | | | BP plc ADR | | | 1,274 | |
| | 14 | | | Chevron Corp. | | | 1,317 | |
| | 4 | | | Royal Dutch Shell plc | | | 337 | |
| | 12 | | | Total S.A. ADR | | | 1,042 | |
| | | | | | | | | |
| | | | | | | | | | | | 3,970 | |
| | | | | | | | | | | | | |
| | | | | Finance — 11.7% |
| | 10 | | | Allstate Corp. | | | 514 | |
| | 25 | | | Bank of America Corp. | | | 954 | |
| | 6 | | | Bank of New York Mellon Corp. | | | 269 | |
| | 7 | | | Chubb Corp. | | | 344 | |
| | 16 | | | Citigroup, Inc. | | | 402 | |
| | 25 | | | Host Hotels & Resorts, Inc. | | | 430 | |
| | 18 | | | JP Morgan Chase & Co. | | | 862 | |
| | 18 | | | Lloyd’s TSB Group plc ADR | | | 613 | |
| | — | | | M&T Bank Corp. | | | 37 | |
| | 14 | | | PNC Financial Services Group, Inc. | | | 943 | |
| | 31 | | | US Bancorp | | | 1,064 | |
| | 6 | | | Wells Fargo & Co. | | | 170 | |
| | | | | | | | | |
| | | | | | | | | | | | 6,602 | |
| | | | | | | | | | | | | |
| | | | | Health Care — 3.6% |
| | 8 | | | Abbott Laboratories | | | 433 | |
| | 18 | | | Bristol-Myers Squibb Co. | | | 400 | |
| | 6 | | | Eli Lilly & Co. | | | 303 | |
| | 7 | | | GlaxoSmithKline plc ADR | | | 313 | |
| | 17 | | | Pfizer, Inc. | | | 334 | |
| | 6 | | | Wyeth | | | 262 | |
| | | | | | | | | |
| | | | | | | | | | | | 2,045 | |
| | | | | | | | | | | | | |
| | | | | Services — 0.5% |
| | 8 | | | Waste Management, Inc. | | | 296 | |
| | | | | Technology — 5.6% |
| | 27 | | | AT&T, Inc. | | | 1,055 | |
| | 35 | | | General Electric Co. | | | 1,151 | |
| | 3 | | | Schneider Electric S.A. | | | 414 | |
| | 13 | | | Verizon Communications, Inc. | | | 508 | |
| | | | | | | | | |
| | | | | | | | | | | | 3,128 | |
| | | | | | | | | | | | | |
| | | | | Utilities — 6.1% |
| | 8 | | | American Electric Power Co., Inc. | | | 357 | |
| | 11 | | | Consolidated Edison, Inc. | | | 449 | |
| | 13 | | | Dominion Resources, Inc. | | | 560 | |
| | 2 | | | Entergy Corp. | | | 241 | |
| | 3 | | | Exelon Corp. | | | 274 | |
| | 18 | | | FPL Group, Inc. | | | 1,206 | |
| | 6 | | | SCANA Corp. | | | 229 | |
| | 2 | | | Southern Co. | | | 89 | |
| | | | | | | | | |
| | | | | | | | | | | | 3,405 | |
| | | | | | | | | | | | | |
| | | | | Total common stock
(cost $25,403) | | $ | 25,256 | |
| | | | | | | | | | | | | |
| | | | | | | | | | | | | |
Principal
| | | | | | | | | |
| Amount | | | | | | | | | |
| |
| ASSET & COMMERCIAL MORTGAGE BACKED SECURITIES — 2.5% |
| | | | | Finance — 2.4% |
| | | | | Banc of America Commercial Mortgage, Inc. | | | | |
| $ | 85 | | | 5.45%, 01/15/2049 | | $ | 82 | |
| | | | | Bear Stearns Commercial Mortgage Securities, Inc. | | | | |
| | 100 | | | 4.68%, 08/13/2039 | | | 99 | |
| | 150 | | | 5.20%, 12/11/2038 | | | 145 | |
| | | | | Carmax Automotive Owner Trust | | | | |
| | 100 | | | 4.34%, 09/15/2010 | | | 100 | |
| | | | | Chase Commercial Mortgage Securities Corp. | | | | |
| | 83 | | | 6.39%, 11/18/2030 | | | 83 | |
| | | | | Commercial Mortgage Pass-Through Certificates | | | | |
| | 100 | | | 5.96%, 06/10/2046 (L) | | | 101 | |
| | | | | Honda Automotive Receivables Owner Trust | | | | |
| | 31 | | | 5.25%, 08/18/2009 | | | 31 | |
| | | | | LB-UBS Commercial Mortgage Trust | | | | |
| | 150 | | | 5.35%, 11/15/2038 | | | 146 | |
| | | | | Long Beach Automotive Receivables Trust | | | | |
| | 100 | | | 5.03%, 01/15/2014 | | | 97 | |
| | | | | Merrill Lynch Mortgage Trust | | | | |
| | 100 | | | 5.80%, 05/12/2039 (L) | | | 101 | |
| | | | | Morgan Stanley Capital I | | | | |
| | 100 | | | 5.23%, 09/15/2042 | | | 99 | |
| | | | | Nissan Automotive Lease Trust | | | | |
| | 100 | | | 5.10%, 07/16/2012 | | | 101 | |
| | | | | Peco Energy Transition Trust | | | | |
| | 75 | | | 6.52%, 12/31/2010 | | | 79 | |
| | | | | PSE&G Transition Funding LLC | | | | |
| | 100 | | | 6.45%, 03/15/2013 | | | 104 | |
| | | | | | | | | |
| | | | | | | | | | | | 1,368 | |
| | | | | | | | | | | | | |
| | | | | | | | | | | | | |
The accompanying notes are an integral part of these financial statements.
114
| | | | | | | | | | | | | |
Principal
| | | | | | | | Market
| |
| Amount | | | | | | | | Value (W) | |
| |
| | | | | | | | | | | | | |
| ASSET & COMMERCIAL MORTGAGE BACKED SECURITIES — (continued) |
| | | | | Health Care — 0.1% |
| | | | | CVS Lease Pass-Through Trust | | | | |
| $ | 19 | | | 6.04%, 12/10/2028 (I) | | $ | 18 | |
| | | | | | | | | |
| | | | | Total asset & commercial
mortgage backed securities
(cost $1,393) | | $ | 1,386 | |
| | | | | | | | | | | | | |
| | | | | | | | | | | | | |
| CORPORATE BONDS: INVESTMENT GRADE — 40.3% |
| | | | | Basic Materials — 1.1% |
| | | | | Alto Parana S.A. | | | | |
| $ | 15 | | | 6.38%, 06/09/2017 (I) | | $ | 15 | |
| | | | | Codelco, Inc. | | | | |
| | 100 | | | 4.75%, 10/15/2014 | | | 99 | |
| | | | | Commercial Metals Co. | | | | |
| | 70 | | | 6.50%, 07/15/2017 | | | 72 | |
| | | | | Cytec Industries, Inc. | | | | |
| | 50 | | | 6.00%, 10/01/2015 | | | 49 | |
| | | | | Freeport-McMoRan Copper & Gold, Inc. | | | | |
| | 55 | | | 8.38%, 04/01/2017 | | | 61 | |
| | | | | Inco Ltd. | | | | |
| | 30 | | | 7.20%, 09/15/2032 | | | 30 | |
| | 45 | | | 7.75%, 05/15/2012 | | | 48 | |
| | | | | Lubrizol Corp. | | | | |
| | 80 | | | 4.63%, 10/01/2009 | | | 80 | |
| | | | | Methanex Corp. | | | | |
| | 20 | | | 8.75%, 08/15/2012 | | | 21 | |
| | | | | Pactiv Corp. | | | | |
| | 20 | | | 5.88%, 07/15/2012 | | | 20 | |
| | | | | Temple-Inland, Inc. | | | | |
| | 40 | | | 6.63%, 01/15/2016 | | | 39 | |
| | | | | US Steel Corp. | | | | |
| | 30 | | | 7.00%, 02/01/2018 | | | 30 | |
| | | | | Yara International ASA | | | | |
| | 45 | | | 5.25%, 12/15/2014 (I) | | | 44 | |
| | | | | | | | | |
| | | | | | | | | | | | 608 | |
| | | | | | | | | | | | | |
| | | | | Capital Goods — 0.6% |
| | | | | Goodrich Corp. | | | | |
| | 35 | | | 6.29%, 07/01/2016 | | | 37 | |
| | | | | Hutchison Whampoa International Ltd. | | | | |
| | 100 | | | 5.45%, 11/24/2010 (I) | | | 102 | |
| | 15 | | | 6.50%, 02/13/2013 (K) | | | 16 | |
| | | | | Xerox Corp. | | | | |
| | 100 | | | 5.50%, 05/15/2012 | | | 100 | |
| | 60 | | | 6.40%, 03/15/2016 | | | 61 | |
| | | | | | | | | |
| | | | | | | | | | | | 316 | |
| | | | | | | | | | | | | |
| | | | | Consumer Cyclical — 1.0% |
| | | | | Avnet, Inc. | | | | |
| | 50 | | | 6.63%, 09/15/2016 | | | 50 | |
| | | | | DaimlerChrysler NA Holdings Corp. | | | | |
| | 30 | | | 5.75%, 05/18/2009 | | | 30 | |
| | 80 | | | 6.50%, 11/15/2013 | | | 84 | |
| | | | | Energy Transfer Partners | | | | |
| | 25 | | | 6.63%, 10/15/2036 | | | 24 | |
| | | | | Kroger Co. | | | | |
| | 35 | | | 6.40%, 08/15/2017 | | | 37 | |
| | | | | Macy’s Retail Holdings, Inc. | | | | |
| | 160 | | | 5.88%, 01/15/2013 | | | 151 | |
| | | | | SABMiller plc | | | | |
| | 80 | | | 6.20%, 07/01/2011 (I) | | | 83 | |
| | | | | Target Corp. | | | | |
| | 100 | | | 6.00%, 01/15/2018 | | | 104 | |
| | | | | | | | | |
| | | | | | | | | | | | 563 | |
| | | | | | | | | | | | | |
| | | | | Consumer Staples — 1.3% |
| | | | | Cargill, Inc. | | | | |
| | 50 | | | 3.63%, 03/04/2009 (I) | | | 50 | |
| | 95 | | | 5.60%, 09/15/2012 (I) | | | 96 | |
| | | | | Cia Brasileira de Bebidas | | | | |
| | 75 | | | 8.75%, 09/15/2013 | | | 87 | |
| | | | | Coca-Cola Enterprises, Inc. | | | | |
| | 45 | | | 6.70%, 10/15/2036 | | | 48 | |
| | | | | General Mills, Inc. | | | | |
| | 75 | | | 5.20%, 03/17/2015 | | | 75 | |
| | | | | Kellogg Co. | | | | |
| | 50 | | | 4.25%, 03/06/2013 | | | 49 | |
| | 15 | | | 5.13%, 12/03/2012 | | | 15 | |
| | | | | Kraft Foods, Inc. | | | | |
| | 75 | | | 4.13%, 11/12/2009 | | | 75 | |
| | 10 | | | 6.25%, 06/01/2012 | | | 10 | |
| | 100 | | | 6.50%, 08/11/2017 | | | 105 | |
| | | | | Miller Brewing Co. | | | | |
| | 20 | | | 4.25%, 08/15/2008 (I) | | | 20 | |
| | | | | PepsiAmericas, Inc. | | | | |
| | 35 | | | 4.88%, 01/15/2015 | | | 34 | |
| | | | | Tyson Foods, Inc. | | | | |
| | 90 | | | 6.85%, 04/01/2016 | | | 90 | |
| | | | | Weyerhaeuser Co. | | | | |
| | 10 | | | 7.38%, 03/15/2032 | | | 10 | |
| | | | | | | | | |
| | | | | | | | | | | | 764 | |
| | | | | | | | | | | | | |
| | | | | Energy — 2.0% |
| | | | | AGL Capital Corp. | | | | |
| | 35 | | | 6.38%, 07/15/2016 | | | 35 | |
| | | | | Amerada Hess Corp. | | | | |
| | 95 | | | 7.88%, 10/01/2029 | | | 113 | |
| | | | | Atmos Energy Corp. | | | | |
| | 40 | | | 6.35%, 06/15/2017 | | | 40 | |
| | | | | Canadian National Resources Ltd. | | | | |
| | 30 | | | 5.70%, 05/15/2017 | | | 30 | |
| | 100 | | | 6.25%, 03/15/2038 | | | 98 | |
| | | | | ConocoPhillips Holding Co. | | | | |
| | 50 | | | 6.95%, 04/15/2029 | | | 57 | |
| | | | | EnCana Corp. | | | | |
| | 50 | | | 5.90%, 12/01/2017 | | | 51 | |
| | | | | Enterprise Products Operating L.P. | | | | |
| | 90 | | | 5.65%, 04/01/2013 | | | 91 | |
| | | | | Panhandle Eastern Pipeline | | | | |
| | 75 | | | 6.20%, 11/01/2017 | | | 73 | |
| | | | | Pemex Project Funding Master Trust | | | | |
| | 15 | | | 5.75%, 03/01/2018 (I) | | | 15 | |
| | 10 | | | 6.63%, 06/15/2035 (I) | | | 10 | |
| | | | | Petrobras International Finance Co. | | | | |
| | 65 | | | 5.88%, 03/01/2018 | | | 65 | |
| | 20 | | | 8.38%, 12/10/2018 | | | 24 | |
| | | | | Transocean, Inc. | | | | |
| | 110 | | | 6.00%, 03/15/2018 | | | 114 | |
| | | | | Valero Energy Corp. | | | | |
| | 105 | | | 7.50%, 04/15/2032 | | | 109 | |
The accompanying notes are an integral part of these financial statements.
115
The Hartford Balanced Income Fund
Schedule of Investments — (continued)
April 30, 2008 (Unaudited)
(000’s Omitted)
| | | | | | | | | | | | | |
Principal
| | | | | | | | Market
| |
| Amount | | | | | | | | Value (W) | |
| |
| | | | | | | | | | | | | |
| CORPORATE BONDS: INVESTMENT GRADE — (continued) |
| | | | | | | | | | | | | |
| | | | | Energy — (continued) |
| | | | | Weatherford International Ltd. | | | | |
| $ | 100 | | | 6.00%, 03/15/2018 | | $ | 103 | |
| | 65 | | | 6.50%, 08/01/2036 | | | 64 | |
| | | | | XTO Energy, Inc. | | | | |
| | 45 | | | 7.50%, 04/15/2012 | | | 49 | |
| | | | | | | | | |
| | | | | | | | | | | | 1,141 | |
| | | | | | | | | | | | | |
| | | | | Finance — 19.5% |
| | | | | Ace Capital Trust II | | | | |
| | 90 | | | 9.70%, 04/01/2030 | | | 104 | |
| | | | | Ace INA Holdings, Inc. | | | | |
| | 20 | | | 6.70%, 05/15/2036 | | | 20 | |
| | | | | Allied World Assurance | | | | |
| | 50 | | | 7.50%, 08/01/2016 | | | 50 | |
| | | | | Allstate Finance Global Fund II | | | | |
| | 30 | | | 4.25%, 02/26/2010 | | | 30 | |
| | | | | AMB Property L.P. | | | | |
| | 100 | | | 5.45%, 12/01/2010 | | | 102 | |
| | | | | American General Finance Corp. | | | | |
| | 80 | | | 4.63%, 05/15/2009 | | | 80 | |
| | | | | Ameriprise Financial, Inc. | | | | |
| | 60 | | | 5.35%, 11/15/2010 | | | 61 | |
| | 20 | | | 5.65%, 11/15/2015 | | | 20 | |
| | | | | Avalonbay Communities, Inc. | | | | |
| | 25 | | | 7.50%, 08/01/2009 | | | 26 | |
| | | | | AXA S.A. | | | | |
| | 45 | | | 8.60%, 12/15/2030 | | | 50 | |
| | | | | BAC Capital Trust VI | | | | |
| | 20 | | | 5.63%, 03/08/2035 | | | 17 | |
| | | | | Banco Mercantile Del Norte S.A. | | | | |
| | 10 | | | 6.14%, 10/13/2016 (I) | | | 10 | |
| | | | | Bank of America Corp. | | | | |
| | 220 | | | 5.25%, 12/01/2015 | | | 219 | |
| | 200 | | | 5.42%, 03/15/2017 | | | 196 | |
| | 150 | | | 6.00%, 09/01/2017 | | | 156 | |
| | 50 | | | 7.25%, 10/15/2025 | | | 52 | |
| | | | | Bank of New York Mellon Corp. | | | | |
| | 105 | | | 4.50%, 04/01/2013 | | | 105 | |
| | | | | Bear Stearns & Co., Inc. | | | | |
| | 90 | | | 5.35%, 02/01/2012 | | | 90 | |
| | 75 | | | 6.95%, 08/10/2012 | | | 79 | |
| | 120 | | | 7.25%, 02/01/2018 | | | 131 | |
| | | | | Berkley (W.R.) Corp. | | | | |
| | 90 | | | 5.13%, 09/30/2010 | | | 90 | |
| | | | | Brandywine Operating Partnership | | | | |
| | 15 | | | 5.70%, 05/01/2017 | | | 13 | |
| | 50 | | | 5.75%, 04/01/2012 | | | 47 | |
| | | | | Camden Property Trust | | | | |
| | 85 | | | 4.38%, 01/15/2010 | | | 83 | |
| | | | | Capital One Financial Corp. | | | | |
| | 200 | | | 6.75%, 09/15/2017 | | | 199 | |
| | | | | Capmark Financial Group | | | | |
| | 40 | | | 5.88%, 05/10/2012 | | | 33 | |
| | 10 | | | 6.30%, 05/10/2017 | | | 7 | |
| | | | | CIT Group, Inc. | | | | |
| | 20 | | | 5.13%, 09/30/2014 | | | 16 | |
| | 75 | | | 5.65%, 02/13/2017 | | | 62 | |
| | 45 | | | 5.80%, 07/28/2011 | | | 38 | |
| | 100 | | | 5.85%, 09/15/2016 | | | 83 | |
| | | | | Citigroup, Inc. | | | | |
| | 105 | | | 5.00%, 09/15/2014 | | | 100 | |
| | 100 | | | 5.50%, 08/27/2012 | | | 100 | |
| | 140 | | | 5.63%, 08/27/2012 | | | 140 | |
| | 40 | | | 5.88%, 05/29/2037 | | | 36 | |
| | 85 | | | 6.00%, 10/31/2033 | | | 77 | |
| | 35 | | | 6.13%, 11/21/2017 | | | 35 | |
| | 200 | | | 6.88%, 03/05/2038 | | | 207 | |
| | 75 | | | 8.30%, 12/21/2057 (L) | | | 77 | |
| | | | | Colonial Realty L.P. | | | | |
| | 95 | | | 6.05%, 09/01/2016 | | | 83 | |
| | | | | Countrywide Financial Corp. | | | | |
| | 120 | | | 5.80%, 06/07/2012 | | | 114 | |
| | | | | Countrywide Home Loans, Inc. | | | | |
| | 15 | | | 4.00%, 03/22/2011 | | | 14 | |
| | | | | Credit Suisse First Boston USA, Inc. | | | | |
| | 20 | | | 4.88%, 08/15/2010 | | | 20 | |
| | | | | Credit Suisse New York | | | | |
| | 290 | | | 6.00%, 02/15/2018 | | | 294 | |
| | | | | Developers Diversified Realty Corp. | | | | |
| | 50 | | | 5.00%, 05/03/2010 | | | 49 | |
| | 50 | | | 5.38%, 10/15/2012 | | | 47 | |
| | | | | Discover Financial Services, Inc. | | | | |
| | 10 | | | 6.45%, 06/12/2017 | | | 8 | |
| | | | | Duke-Weeks Realty | | | | |
| | 50 | | | 7.75%, 11/15/2009 | | | 51 | |
| | | | | Eaton Vance Corp. | | | | |
| | 90 | | | 6.50%, 10/02/2017 | | | 94 | |
| | | | | Equity One, Inc. | | | | |
| | 65 | | | 6.00%, 09/15/2017 | | | 57 | |
| | | | | ERAC USA Finance Co. | | | | |
| | 125 | | | 7.00%, 10/15/2037 (I) | | | 104 | |
| | | | | ERP Operating L.P. | | | | |
| | 10 | | | 4.75%, 06/15/2009 | | | 10 | |
| | 40 | | | 6.95%, 03/02/2011 | | | 42 | |
| | | | | Everest Reinsurance Holdings, Inc. | | | | |
| | 70 | | | 5.40%, 10/15/2014 | | | 68 | |
| | 50 | | | 6.60%, 05/15/2037 (L) | | | 41 | |
| | 20 | | | 8.75%, 03/15/2010 | | | 22 | |
| | | | | Farmers Exchange Capital | | | | |
| | 100 | | | 7.05%, 07/15/2028 (I) | | | 92 | |
| | | | | General Electric Capital Corp. | | | | |
| | 300 | | | 6.00%, 06/15/2012 | | | 315 | |
| | 90 | | | 6.15%, 08/07/2037 | | | 89 | |
| | | | | Goldman Sachs Group, Inc. | | | | |
| | 115 | | | 5.45%, 11/01/2012 | | | 116 | |
| | 75 | | | 5.95%, 01/15/2027 | | | 68 | |
| | 180 | | | 6.25%, 09/01/2017 | | | 184 | |
| | 220 | | | 6.45%, 05/01/2036 | | | 209 | |
| | 50 | | | 6.60%, 01/15/2012 | | | 52 | |
| | 80 | | | 6.65%, 05/15/2009 | | | 82 | |
| | 85 | | | 6.75%, 10/01/2037 | | | 83 | |
| | | | | HBOS plc | | | | |
| | 50 | | | 6.00%, 11/01/2033 (I) | | | 42 | |
| | | | | Health Care Properties | | | | |
| | 20 | | | 5.65%, 12/15/2013 | | | 18 | |
| | 80 | | | 6.00%, 01/30/2017 | | | 69 | |
| | | | | Health Care Property Investors, Inc. | | | | |
| | 20 | | | 6.30%, 09/15/2016 | | | 18 | |
The accompanying notes are an integral part of these financial statements.
116
| | | | | | | | | | | | | |
Principal
| | | | | | | | Market
| |
| Amount | | | | | | | | Value (W) | |
| |
| | | | | | | | | | | | | |
| CORPORATE BONDS: INVESTMENT GRADE — (continued) |
| | | | | | | | | | | | | |
| | | | | Finance — (continued) |
| | | | | HSBC Finance Corp. | | | | |
| $ | 100 | | | 6.38%, 10/15/2011 | | $ | 104 | |
| | 145 | | | 6.75%, 05/15/2011 | | | 151 | |
| | | | | HSBC Holding plc | | | | |
| | 50 | | | 6.50%, 09/15/2037 | | | 49 | |
| | | | | International Lease Finance Corp. | | | | |
| | 120 | | | 5.63%, 09/15/2010 — 09/20/2013 | | | 119 | |
| | 80 | | | 6.38%, 03/15/2009 | | | 80 | |
| | | | | Janus Capital Group, Inc. | | | | |
| | 60 | | | 6.70%, 06/15/2017 | | | 57 | |
| | | | | JP Morgan Chase & Co. | | | | |
| | 215 | | | 5.13%, 09/15/2014 | | | 212 | |
| | 50 | | | 5.88%, 03/15/2035 | | | 43 | |
| | 50 | | | 6.00%, 01/15/2018 | | | 52 | |
| | 270 | | | 6.75%, 02/01/2011 | | | 282 | |
| | | | | Kimco Realty Corp. | | | | |
| | 30 | | | 5.78%, 03/15/2016 | | | 28 | |
| | | | | Lazard Group | | | | |
| | 80 | | | 6.85%, 06/15/2017 | | | 75 | |
| | | | | Lehman Brothers Holdings, Inc. | | | | |
| | 70 | | | 4.38%, 11/30/2010 | | | 67 | |
| | 30 | | | 5.63%, 01/24/2013 | | | 30 | |
| | 100 | | | 6.20%, 09/26/2014 | | | 101 | |
| | 100 | | | 6.50%, 07/19/2017 | | | 98 | |
| | 45 | | | 6.75%, 12/28/2017 | | | 45 | |
| | 165 | | | 7.00%, 09/27/2027 | | | 162 | |
| | | | | Liberty Mutual Group, Inc. | | | | |
| | 60 | | | 5.75%, 03/15/2014 (I) | | | 60 | |
| | 30 | | | 7.50%, 08/15/2036 (I) | | | 28 | |
| | | | | Liberty Property L.P. | | | | |
| | 10 | | | 5.50%, 12/15/2016 | | | 9 | |
| | 20 | | | 6.63%, 10/01/2017 | | | 19 | |
| | 25 | | | 7.75%, 04/15/2009 | | | 25 | |
| | 50 | | | 8.50%, 08/01/2010 | | | 53 | |
| | | | | Lincoln National Corp. | | | | |
| | 80 | | | 5.65%, 08/27/2012 | | | 80 | |
| | 35 | | | 6.15%, 04/07/2036 | | | 33 | |
| | | | | Merrill Lynch & Co., Inc. | | | | |
| | 50 | | | 5.45%, 02/05/2013 | | | 49 | |
| | 210 | | | 6.05%, 08/15/2012 — 05/16/2016 | | | 206 | |
| | 100 | | | 6.22%, 09/15/2026 | | | 89 | |
| | 60 | | | 6.40%, 08/28/2017 | | | 60 | |
| | 25 | | | 6.88%, 04/25/2018 | | | 25 | |
| | | | | Metlife, Inc. | | | | |
| | 25 | | | 6.13%, 12/01/2011 | | | 26 | |
| | | | | Ministry Finance Russia | | | | |
| | 40 | | | 3.00%, 05/14/2008 | | | 40 | |
| | | | | Mizuho Financial Group, Inc. | | | | |
| | 100 | | | 5.79%, 04/15/2014 (I) | | | 103 | |
| | | | | Morgan Stanley | | | | |
| | 445 | | | 4.75%, 04/01/2014 | | | 418 | |
| | 200 | | | 5.45%, 01/09/2017 | | | 191 | |
| | | | | PNC Funding Corp. | | | | |
| | 110 | | | 5.50%, 09/28/2012 | | | 109 | |
| | | | | Prudential Financial, Inc. | | | | |
| | 70 | | | 6.10%, 06/15/2017 | | | 71 | |
| | | | | Realty Income Corp. | | | | |
| | 85 | | | 6.75%, 08/15/2019 | | | 79 | |
| | | | | Regency Centers L.P. | | | | |
| | 30 | | | 5.25%, 08/01/2015 | | | 27 | |
| | 15 | | | 5.88%, 06/15/2017 | | | 13 | |
| | | | | Reinsurance Group of America, Inc. | | | | |
| | 60 | | | 5.63%, 03/15/2017 | | | 52 | |
| | | | | Schwab Capital Trust I | | | | |
| | 35 | | | 7.50%, 11/15/2037 (L) | | | 32 | |
| | | | | Simon Property Group L.P. | | | | |
| | 50 | | | 4.88%, 08/15/2010 | | | 49 | |
| | 45 | | | 5.38%, 06/01/2011 | | | 45 | |
| | 100 | | | 5.63%, 08/15/2014 | | | 99 | |
| | | | | Symetra Financial Corp. | | | | |
| | 10 | | | 6.13%, 04/01/2016 (I) | | | 9 | |
| | | | | Travelers Property Casualty Corp. | | | | |
| | 10 | | | 6.38%, 03/15/2033 | | | 10 | |
| | | | | Trustreet Properties, Inc. | | | | |
| | 80 | | | 7.50%, 04/01/2015 | | | 85 | |
| | | | | UBS AG Jersey Branch | | | | |
| | 30 | | | 0.00%, 02/05/2009 — 04/09/2009 (I)(M) | | | 30 | |
| | 20 | | | 0.00%, 03/06/2009 (M) | | | 20 | |
| | | | | UFJ Finance Aruba AEC | | | | |
| | 100 | | | 6.75%, 07/15/2013 | | | 103 | |
| | | | | United Dominion Realty Trust, Inc. | | | | |
| | 55 | | | 6.05%, 06/01/2013 | | | 54 | |
| | | | | UnitedHealth Group, Inc. | | | | |
| | 25 | | | 5.38%, 03/15/2016 | | | 24 | |
| | 100 | | | 5.50%, 11/15/2012 | | | 100 | |
| | 30 | | | 6.63%, 11/15/2037 | | | 28 | |
| | | | | Unitrin, Inc. | | | | |
| | 100 | | | 4.88%, 11/01/2010 | | | 95 | |
| | 40 | | | 6.00%, 05/15/2017 | | | 37 | |
| | | | | Ventas Realty L.P. | | | | |
| | 30 | | | 6.50%, 06/01/2016 | | | 29 | |
| | | | | Wachovia Corp. | | | | |
| | 55 | | | 4.88%, 02/15/2014 | | | 54 | |
| | 50 | | | 5.50%, 05/01/2013 | | | 50 | |
| | 70 | | | 5.63%, 10/15/2016 | | | 67 | |
| | 230 | | | 5.75%, 06/15/2017 — 02/01/2018 | | | 229 | |
| | | | | WEA Finance LLC | | | | |
| | 100 | | | 7.13%, 04/15/2018 (I) | | | 103 | |
| | | | | Wells Fargo Co. | | | | |
| | 260 | | | 4.38%, 01/31/2013 | | | 257 | |
| | | | | Westfield Group | | | | |
| | 60 | | | 5.40%, 10/01/2012 (I) | | | 59 | |
| | | | | Willis North America, Inc. | | | | |
| | 45 | | | 6.20%, 03/28/2017 | | | 44 | |
| | | | | WR Berkley Corp. | | | | |
| | 25 | | | 5.88%, 02/15/2013 | | | 25 | |
| | | | | XL Capital Europe plc | | | | |
| | 25 | | | 6.50%, 01/15/2012 | | | 24 | |
| | | | | | | | | |
| | | | | | | | | | | | 10,977 | |
| | | | | | | | | | | | | |
| | | | | | | | | | | | | |
| | | | | | | | | | | | | |
| | | | | Foreign Governments — 2.4% |
| | | | | Brazil (Republic of) | | | | |
| | 100 | | | 6.00%, 01/17/2017 | | | 105 | |
| | 45 | | | 7.88%, 03/07/2015 | | | 52 | |
| | 165 | | | 8.00%, 01/15/2018 | | | 188 | |
| | 25 | | | 8.25%, 01/20/2034 | | | 32 | |
| EUR | 20 | | | 8.50%, 09/24/2012 | | | 34 | |
| | 55 | | | 8.75%, 02/04/2025 | | | 70 | |
| | 50 | | | 8.88%, 10/14/2019 | | | 64 | |
The accompanying notes are an integral part of these financial statements.
117
The Hartford Balanced Income Fund
Schedule of Investments — (continued)
April 30, 2008 (Unaudited)
(000’s Omitted)
| | | | | | | | | | | | | |
Principal
| | | | | | | | Market
| |
| Amount (B) | | | | | | | | Value (W) | |
| |
| | | | | | | | | | | | | |
| CORPORATE BONDS: INVESTMENT GRADE — (continued) |
| | | | | | | | | | | | | |
| | | | | Foreign Governments — (continued) |
| | | | | Colombia (Republic of) | | | | |
| $ | 25 | | | 8.25%, 12/22/2014 | | $ | 29 | |
| | 20 | | | 10.00%, 01/23/2012 | | | 24 | |
| | 15 | | | 10.38%, 01/28/2033 | | | 22 | |
| | | | | Peru (Republic of) | | | | |
| PEN | 15 | | | 8.61%, 03/10/2010 | | | 6 | |
| | | | | Russian Federation Government | | | | |
| | 374 | | | 7.50%, 03/31/2030 (K) | | | 430 | |
| | 20 | | | 12.75%, 06/24/2028 (K) | | | 36 | |
| | | | | United Mexican States | | | | |
| | 62 | | | 6.05%, 01/11/2040 | | | 62 | |
| | 147 | | | 6.75%, 09/27/2034 | | | 163 | |
| MXP | 175 | | | 7.75%, 12/14/2017 | | | 16 | |
| MXP | 175 | | | 8.00%, 12/19/2013 | | | 17 | |
| | | | | | | | | |
| | | | | | | | | | | | 1,350 | |
| | | | | | | | | | | | | |
| | | | | Health Care — 1.3% |
| | | | | Amerisource Bergen Corp. | | | | |
| | 25 | | | 5.63%, 09/15/2012 | | | 25 | |
| | 101 | | | 5.88%, 09/15/2015 | | | 98 | |
| | | | | AstraZeneca plc | | | | |
| | 50 | | | 5.40%, 09/15/2012 | | | 52 | |
| | 120 | | | 6.45%, 09/15/2037 | | | 130 | |
| | | | | CVS Caremark Corp. | | | | |
| | 155 | | | 5.75%, 06/01/2017 | | | 157 | |
| | 40 | | | 6.94%, 01/10/2030 (I) | | | 39 | |
| | | | | Laboratory Corp. | | | | |
| | 20 | | | 5.63%, 12/15/2015 | | | 19 | |
| | | | | Medco Health Solutions | | | | |
| | 75 | | | 7.13%, 03/15/2018 | | | 79 | |
| | | | | Quest Diagnostics, Inc. | | | | |
| | 115 | | | 6.95%, 07/01/2037 | | | 117 | |
| | | | | | | | | |
| | | | | | | | | | | | 716 | |
| | | | | | | | | | | | | |
| | | | | Services — 2.8% |
| | | | | AT&T Broadband Corp. | | | | |
| | 145 | | | 8.38%, 03/15/2013 | | | 162 | |
| | | | | CBS Corp. | | | | |
| | 95 | | | 7.70%, 07/30/2010 | | | 100 | |
| | 35 | | | 7.88%, 07/30/2030 | | | 36 | |
| | | | | Clear Channel Communications, Inc. | | | | |
| | 105 | | | 7.65%, 09/15/2010 | | | 109 | |
| | | | | Comcast Corp. | | | | |
| | 5 | | | 5.50%, 03/15/2011 | | | 5 | |
| | 80 | | | 6.45%, 03/15/2037 | | | 80 | |
| | 20 | | | 6.50%, 01/15/2015 | | | 21 | |
| | 110 | | | 7.05%, 03/15/2033 | | | 115 | |
| | | | | COX Communications, Inc. | | | | |
| | 10 | | | 5.88%, 12/01/2016 (I) | | | 10 | |
| | 80 | | | 6.45%, 12/01/2036 (I) | | | 80 | |
| | 90 | | | 7.13%, 10/01/2012 | | | 96 | |
| | | | | Electronic Data Systems Corp. | | | | |
| | 40 | | | 7.45%, 10/15/2029 | | | 37 | |
| | | | | News America, Inc. | | | | |
| | 60 | | | 6.40%, 12/15/2035 | | | 60 | |
| | 25 | | | 7.28%, 06/30/2028 | | | 26 | |
| | | | | Time Warner Entertainment Co., L.P. | | | | |
| | 25 | | | 7.25%, 09/01/2008 | | | 25 | |
| | 30 | | | 8.38%, 03/15/2023 | | | 34 | |
| | | | | Time Warner, Inc. | | | | |
| | 160 | | | 6.75%, 04/15/2011 # | | | 164 | |
| | 105 | | | 7.63%, 04/15/2031 | | | 113 | |
| | | | | Viacom, Inc. | | | | |
| | 50 | | | 5.75%, 04/30/2011 | | | 51 | |
| | 40 | | | 6.13%, 10/05/2017 | | | 40 | |
| | 65 | | | 6.25%, 04/30/2016 | | | 66 | |
| | | | | Waste Management, Inc. | | | | |
| | 100 | | | 6.10%, 03/15/2018 | | | 100 | |
| | | | | Wyndham Worldwide Corp. | | | | |
| | 10 | | | 6.00%, 12/01/2016 | | | 9 | |
| | | | | Wynn Las Vegas LLC | | | | |
| | 25 | | | 6.63%, 12/01/2014 | | | 24 | |
| | | | | | | | | |
| | | | | | | | | | | | 1,563 | |
| | | | | | | | | | | | | |
| | | | | Technology — 4.6% |
| | | | | Alltel Corp. | | | | |
| | 60 | | | 6.75%, 04/01/2028 | | | 52 | |
| | | | | AT&T, Inc. | | | | |
| | 30 | | | 5.10%, 09/15/2014 | | | 30 | |
| | 85 | | | 5.30%, 11/15/2010 | | | 88 | |
| | 40 | | | 5.50%, 02/01/2018 | | | 40 | |
| | 140 | | | 6.15%, 09/15/2034 | | | 136 | |
| | 150 | | | 6.30%, 01/15/2038 | | | 150 | |
| | 110 | | | 6.50%, 09/01/2037 | | | 112 | |
| | | | | BellSouth Corp. | | | | |
| | 30 | | | 5.20%, 09/15/2014 | | | 30 | |
| | | | | British Telecommunications plc | | | | |
| | 35 | | �� | 8.62%, 12/15/2010 (L) | | | 38 | |
| | 90 | | | 9.12%, 12/15/2030 (L) | | | 115 | |
| | | | | Cingular Wireless Services, Inc. | | | | |
| | 120 | | | 8.75%, 03/01/2031 | | | 148 | |
| | | | | Comcast Cable Communications, Inc. | | | | |
| | 45 | | | 6.75%, 01/30/2011 | | | 47 | |
| | | | | Deutsche Telekom International Finance B.V. | | | | |
| | 55 | | | 8.00%, 06/15/2010 (L) | | | 59 | |
| | 100 | | | 8.25%, 06/15/2030 | | | 124 | |
| | | | | Embarq Corp. | | | | |
| | 40 | | | 7.08%, 06/01/2016 | | | 40 | |
| | | | | General Electric Co. | | | | |
| | 115 | | | 5.25%, 12/06/2017 | | | 114 | |
| | | | | Oracle Corp. | | | | |
| | 50 | | | 4.95%, 04/15/2013 | | | 51 | |
| | | | | Qwest Corp. | | | | |
| | 10 | | | 7.63%, 06/15/2015 | | | 10 | |
| | | | | Sprint Capital Corp. | | | | |
| | 70 | | | 6.13%, 11/15/2008 | | | 70 | |
| | 30 | | | 7.63%, 01/30/2011 | | | 28 | |
| | 100 | | | 8.38%, 03/15/2012 | | | 95 | |
| | | | | Sprint Nextel Corp. | | | | |
| | 100 | | | 6.00%, 12/01/2016 | | | 82 | |
| | | | | Telecom Italia Capital | | | | |
| | 10 | | | 5.25%, 10/01/2015 | | | 9 | |
| | 180 | | | 6.20%, 07/18/2011 | | | 181 | |
| | | | | Telefonica Europe B.V. | | | | |
| | 115 | | | 7.75%, 09/15/2010 | | | 123 | |
| | 90 | | | 8.25%, 09/15/2030 | | | 109 | |
| | | | | Time Warner Cable, Inc. | | | | |
| | 110 | | | 6.55%, 05/01/2037 | | | 109 | |
| | | | | Tyco International Group S.A. | | | | |
| | 25 | | | 6.75%, 02/15/2011 | | | 26 | |
The accompanying notes are an integral part of these financial statements.
118
| | | | | | | | | | | | | |
Principal
| | | | | | | | Market
| |
| Amount | | | | | | | | Value (W) | |
| |
| | | | | | | | | | | | | |
| CORPORATE BONDS: INVESTMENT GRADE — (continued) |
| | | | | | | | | | | | | |
| | | | | Technology — (continued) |
| | | | | Verizon Communications, Inc. | | | | |
| $ | 20 | | | 6.40%, 02/15/2038 | | $ | 20 | |
| | 30 | | | 6.90%, 04/15/2038 | | | 33 | |
| | | | | Verizon Global Funding Corp. | | | | |
| | 40 | | | 6.88%, 06/15/2012 | | | 43 | |
| | 115 | | | 7.25%, 12/01/2010 | | | 123 | |
| | 160 | | | 7.75%, 12/01/2030 | | | 182 | |
| | | | | | | | | |
| | | | | | | | | | | | 2,617 | |
| | | | | | | | | | | | | |
| | | | | Transportation — 0.3% |
| | | | | American Airlines, Inc. | | | | |
| | 31 | | | 3.86%, 07/09/2010 | | | 29 | |
| | | | | Continental Airlines, Inc. | | | | |
| | 20 | | | 5.98%, 04/19/2022 | | | 17 | |
| | 10 | | | 6.90%, 04/19/2022 | | | 8 | |
| | 45 | | | 9.80%, 04/01/2021 | | | 41 | |
| | | | | Southwest Airlines Co. | | | | |
| | 59 | | | 6.15%, 08/01/2022 | | | 56 | |
| | | | | | | | | |
| | | | | | | | | | | | 151 | |
| | | | | | | | | | | | | |
| | | | | Utilities — 3.4% |
| | | | | AES Panama S.A. | | | | |
| | 10 | | | 6.35%, 12/21/2016 (I) | | | 10 | |
| | | | | American Electric Power Co., Inc. | | | | |
| | 30 | | | 5.38%, 03/15/2010 | | | 31 | |
| | | | | Carolina Power & Light Co. | | | | |
| | 15 | | | 6.30%, 04/01/2038 | | | 16 | |
| | | | | CenterPoint Energy Resources Corp. | | | | |
| | 25 | | | 7.75%, 02/15/2011 | | | 27 | |
| | | | | Commonwealth Edison Co. | | | | |
| | 100 | | | 5.80%, 03/15/2018 | | | 100 | |
| | | | | DCP Midstream LLC | | | | |
| | 100 | | | 6.75%, 09/15/2037 (I) | | | 97 | |
| | | | | Dominion Resources, Inc. | | | | |
| | 181 | | | 6.25%, 06/30/2012 | | | 190 | |
| | | | | Duke Energy Corp. | | | | |
| | 25 | | | 5.25%, 01/15/2018 | | | 25 | |
| | | | | Duke Energy Field Services LLC | | | | |
| | 10 | | | 6.45%, 11/03/2036 (I) | | | 9 | |
| | | | | EDP Finance B.V. | | | | |
| | 100 | | | 6.00%, 02/02/2018 (I) | | | 102 | |
| | | | | El Paso Natural Gas Co. | | | | |
| | 70 | | | 5.95%, 04/15/2017 | | | 69 | |
| | | | | Enel Finance International | | | | |
| | 100 | | | 6.80%, 09/15/2037 (I) | | | 104 | |
| | | | | Exelon Generation Co. LLC | | | | |
| | 45 | | | 6.95%, 06/15/2011 | | | 47 | |
| | | | | ITC Midwest LLC | | | | |
| | 40 | | | 6.15%, 01/31/2038 (I) | | | 39 | |
| | | | | Kinder Morgan Energy Partners L.P. | | | | |
| | 40 | | | 6.75%, 03/15/2011 | | | 42 | |
| | 100 | | | 6.95%, 01/15/2038 | | | 101 | |
| | 50 | | | 7.30%, 08/15/2033 | | | 52 | |
| | | | | MidAmerican Energy Holdings Co. | | | | |
| | 85 | | | 5.00%, 02/15/2014 | | | 84 | |
| | 80 | | | 6.13%, 04/01/2036 | | | 80 | |
| | | | | NGPL Pipeco LLC | | | | |
| | 130 | | | 6.51%, 12/15/2012 (I) | | | 134 | |
| | | | | NiSource Finance Corp. | | | | |
| | 10 | | | 5.25%, 09/15/2017 | | | 9 | |
| | 140 | | | 6.40%, 03/15/2018 | | | 138 | |
| | 60 | | | 7.88%, 11/15/2010 | | | 63 | |
| | | | | Northern States Power Co. | | | | |
| | 85 | | | 5.25%, 03/01/2018 | | | 85 | |
| | | | | Ohio Power Co. | | | | |
| | 40 | | | 5.30%, 11/01/2010 | | | 41 | |
| | | | | Peco Energy Co. | | | | |
| | 20 | | | 5.70%, 03/15/2037 | | | 19 | |
| | | | | Progress Energy, Inc. | | | | |
| | 50 | | | 6.85%, 04/15/2012 | | | 53 | |
| | | | | PSEG Power LLC | | | | |
| | 10 | | | 8.63%, 04/15/2031 | | | 12 | |
| | | | | Taqa Abu Dhabi National | | | | |
| | 100 | | | 6.50%, 10/27/2036 (I) | | | 95 | |
| | | | | Union Electric Co. | | | | |
| | 45 | | | 6.40%, 06/15/2017 | | | 46 | |
| | | | | | | | | |
| | | | | | | | | | | | 1,920 | |
| | | | | | | | | | | | | |
| | | | | Total corporate bonds: investment grade
(cost $22,838) | | $ | 22,686 | |
| | | | | | | | | | | | | |
| | | | | | | | | | | | | |
| CORPORATE BONDS: NON-INVESTMENT GRADE — 8.6% |
| | | | | Basic Materials — 0.5% |
| | | | | Abitibi-Consolidated, Inc. | | | | |
| $ | 25 | | | 8.85%, 08/01/2030 | | $ | 10 | |
| | | | | Blount, Inc. | | | | |
| | 35 | | | 8.88%, 08/01/2012 | | | 35 | |
| | | | | Georgia-Pacific Corp. | | | | |
| | 25 | | | 7.13%, 01/15/2017 (I) | | | 25 | |
| | 10 | | | 8.13%, 05/15/2011 | | | 10 | |
| | | | | Hawk Corp. | | | | |
| | 15 | | | 8.75%, 11/01/2014 | | | 15 | |
| | | | | Koppers Holdings, Inc. | | | | |
| | 30 | | | 10.92%, 11/15/2014 (M) | | | 26 | |
| | | | | Metals USA, Inc. | | | | |
| | 15 | | | 11.13%, 12/01/2015 | | | 16 | |
| | | | | Novelis, Inc. | | | | |
| | 30 | | | 7.25%, 02/15/2015 | | | 27 | |
| | | | | Peabody Energy Corp. | | | | |
| | 10 | | | 6.88%, 03/15/2013 | | | 10 | |
| | | | | RathGibson, Inc. | | | | |
| | 10 | | | 11.25%, 02/15/2014 | | | 10 | |
| | | | | RBS Global & Rexnord Corp. | | | | |
| | 20 | | | 9.50%, 08/01/2014 | | | 20 | |
| | | | | Rock-Tenn Co. | | | | |
| | 25 | | | 9.25%, 03/15/2016 (I) | | | 26 | |
| | | | | Terra Capital, Inc. | | | | |
| | 15 | | | 7.00%, 02/01/2017 | | | 15 | |
| | | | | Texas Industries, Inc. | | | | |
| | 45 | | | 7.25%, 07/15/2013 | | | 45 | |
| | | | | Tube City Ims Corp. | | | | |
| | 15 | | | 9.75%, 02/01/2015 | | | 14 | |
| | | | | | | | | |
| | | | | | | | | | | | 304 | |
| | | | | | | | | | | | | |
| | | | | Capital Goods — 0.1% |
| | | | | Hawker Beechcraft Acquisition Co. | | | | |
| | 10 | | | 9.75%, 04/01/2017 | | | 10 | |
| | | | | L-3 Communications Corp. | | | | |
| | 15 | | | 5.88%, 01/15/2015 | | | 14 | |
The accompanying notes are an integral part of these financial statements.
119
The Hartford Balanced Income Fund
Schedule of Investments — (continued)
April 30, 2008 (Unaudited)
(000’s Omitted)
| | | | | | | | | | | | | |
Principal
| | | | | | | | Market
| |
| Amount | | | | | | | | Value (W) | |
| |
| | | | | | | | | | | | | |
| CORPORATE BONDS: NON-INVESTMENT GRADE — (continued) |
| | | | | | | | | | | | | |
| | | | | Capital Goods — (continued) |
| | | | | SPX Corp. | | | | |
| $ | 15 | | | 7.63%, 12/15/2014 (I) | | $ | 16 | |
| | | | | Transdigm, Inc. | | | | |
| | 25 | | | 7.75%, 07/15/2014 | | | 26 | |
| | | | | | | | | |
| | | | | | | | | | | | 66 | |
| | | | | | | | | | | | | |
| | | | | Consumer Cyclical — 0.7% |
| | | | | Alliance One International, Inc. | | | | |
| | 15 | | | 8.50%, 05/15/2012 | | | 14 | |
| | 15 | | | 11.00%, 05/15/2012 | | | 15 | |
| | | | | Aramark Corp. | | | | |
| | 20 | | | 8.50%, 02/01/2015 | | | 21 | |
| | | | | D.R. Horton, Inc. | | | | |
| | 20 | | | 6.88%, 05/01/2013 | | | 19 | |
| | 35 | | | 8.00%, 02/01/2009 | | | 35 | |
| | | | | Dollarama Group L.P. | | | | |
| | 20 | | | 8.88%, 08/15/2012 | | | 19 | |
| | | | | ESCO Corp. | | | | |
| | 30 | | | 8.63%, 12/15/2013 (I) | | | 30 | |
| | | | | Ford Motor Co. | | | | |
| | 25 | | | 7.45%, 07/16/2031 | | | 19 | |
| | | | | IKON Office Solutions, Inc. | | | | |
| | 30 | | | 7.70%, 01/01/2012 (I)(L) | | | 30 | |
| | 40 | | | 7.75%, 09/15/2015 | | | 40 | |
| | | | | Lazydays RV Center, Inc. | | | | |
| | 5 | | | 11.75%, 05/15/2012 | | | 4 | |
| | | | | Pulte Homes, Inc. | | | | |
| | 70 | | | 7.88%, 08/01/2011 | | | 68 | |
| | | | | Ryland Group, Inc. | | | | |
| | 15 | | | 6.88%, 06/15/2013 | | | 15 | |
| | | | | TRW Automotive, Inc. | | | | |
| | 20 | | | 7.00%, 03/15/2014 (I) | | | 20 | |
| | | | | United Components, Inc. | | | | |
| | 50 | | | 9.38%, 06/15/2013 | | | 49 | |
| | | | | | | | | |
| | | | | | | | | | | | 398 | |
| | | | | | | | | | | | | |
| | | | | Consumer Staples — 0.1% |
| | | | | Constellation Brands, Inc. | | | | |
| | 15 | | | 7.25%, 05/15/2017 | | | 15 | |
| | | | | Land O’Lakes Capital Trust | | | | |
| | 15 | | | 7.45%, 03/15/2028 (I) | | | 13 | |
| | | | | Smithfield Foods, Inc. | | | | |
| | 15 | | | 7.75%, 05/15/2013 | | | 15 | |
| | | | | | | | | |
| | | | | | | | | | | | 43 | |
| | | | | | | | | | | | | |
| | | | | Energy — 0.5% |
| | | | | Chesapeake Energy Corp. | | | | |
| | 40 | | | 6.50%, 08/15/2017 | | | 39 | |
| | | | | Delta Petroleum Corp. | | | | |
| | 20 | | | 7.00%, 04/01/2015 | | | 18 | |
| | | | | Encore Acquisition Co. | | | | |
| | 25 | | | 6.00%, 07/15/2015 | | | 23 | |
| | | | | Exco Resources, Inc. | | | | |
| | 15 | | | 7.25%, 01/15/2011 | | | 15 | |
| | | | | OPTI Canada, Inc. | | | | |
| | 25 | | | 7.88%, 12/15/2014 | | | 25 | |
| | | | | Petrohawk Energy Corp. | | | | |
| | 40 | | | 9.13%, 07/15/2013 | | | 42 | |
| | | | | Petroleos de Venezuela S.A. | | | | |
| | 30 | | | 5.25%, 04/12/2017 (K) | | | 20 | |
| | 40 | | | 5.38%, 04/12/2027 | | | 22 | |
| | | | | Pioneer Natural Resources Co. | | | | |
| | 25 | | | 5.88%, 07/15/2016 | | | 24 | |
| | | | | Range Resources Corp. | | | | |
| | 10 | | | 6.38%, 03/15/2015 | | | 10 | |
| | | | | Southwestern Energy Co. | | | | |
| | 10 | | | 7.50%, 02/01/2018 (I) | | | 11 | |
| | | | | Whiting Petroleum Corp. | | | | |
| | 10 | | | 7.25%, 05/01/2012 | | | 10 | |
| | | | | | | | | |
| | | | | | | | | | | | 259 | |
| | | | | | | | | | | | | |
| | | | | Finance — 0.7% |
| | | | | Bancolombia S.A. | | | | |
| | 25 | | | 6.88%, 05/25/2017 | | | 25 | |
| | | | | Ford Motor Credit Co. | | | | |
| | 30 | | | 7.00%, 10/01/2013 | | | 26 | |
| | 60 | | | 7.38%, 10/28/2009 | | | 58 | |
| | 20 | | | 8.63%, 11/01/2010 | | | 19 | |
| | | | | General Motors Acceptance Corp. | | | | |
| | 60 | | | 6.88%, 09/15/2011 — 08/28/2012 | | | 48 | |
| | 10 | | | 7.25%, 03/02/2011 | | | 8 | |
| | 10 | | | 8.00%, 11/01/2031 | | | 8 | |
| | | | | Hertz Corp. | | | | |
| | 20 | | | 8.88%, 01/01/2014 | | | 20 | |
| | | | | IOS Capital LLC | | | | |
| | 10 | | | 7.25%, 06/30/2008 | | | 10 | |
| | | | | Kar Holdings, Inc. | | | | |
| | 10 | | | 10.00%, 05/01/2015 | | | 9 | |
| | | | | Nexstar Financial Holdings LLC | | | | |
| | 3 | | | 11.38%, 04/01/2013 | | | 3 | |
| | | | | Nuveen Investments, Inc. | | | | |
| | 30 | | | 5.00%, 09/15/2010 | | | 26 | |
| | | | | Rainbow National Services LLC | | | | |
| | 25 | | | 8.75%, 09/01/2012 (I) | | | 26 | |
| | | | | Rental Service Corp. | | | | |
| | 20 | | | 9.50%, 12/01/2014 | | | 18 | |
| | | | | Rouse Co. | | | | |
| | 15 | | | 5.38%, 11/26/2013 | | | 13 | |
| | | | | Sunstate Equipment Co. | | | | |
| | 20 | | | 10.50%, 04/01/2013 (I) | | | 17 | |
| | | | | United Rentals North America, Inc. | | | | |
| | 20 | | | 6.50%, 02/15/2012 | | | 19 | |
| | | | | Universal Hospital Services | | | | |
| | 20 | | | 8.50%, 06/01/2015 | | | 20 | |
| | | | | | | | | |
| | | | | | | | | | | | 373 | |
| | | | | | | | | | | | | |
| | | | | Foreign Governments — 2.8% |
| | | | | Argentina (Republic of) | | | | |
| EUR | 10 | | | 1.20%, 12/31/2038 | | | 5 | |
| | 33 | | | 3.09%, 08/03/2012 (L) | | | 28 | |
| | 85 | | | 7.00%, 03/28/2011 — 04/17/2017 | | | 62 | |
| | 30 | | | 8.28%, 12/31/2033 | | | 24 | |
| | | | | Brazil (Republic of) | | | | |
| BRL | 565 | | | 6.00%, 11/15/2009 — 08/15/2010 | | | 328 | |
| BRL | 100 | | | 10.00%, 01/01/2017 | | | 49 | |
| | | | | Colombia (Republic of) | | | | |
| COP | 9,000 | | | 9.85%, 06/28/2027 | | | 5 | |
| COP | 27,000 | | | 12.00%, 10/22/2015 | | | 16 | |
The accompanying notes are an integral part of these financial statements.
120
| | | | | | | | | | | | | |
Principal
| | | | | | | | Market
| |
| Amount (B) | | | | | | | | Value (W) | |
| |
| | | | | | | | | | | | | |
| CORPORATE BONDS: NON-INVESTMENT GRADE — (continued) |
| | | | | | | | | | | | | |
| | | | | Foreign Governments — (continued) |
| | | | | Costa Rica (Republic of) | | | | |
| $ | 5 | | | 8.05%, 01/31/2013 (K) | | $ | 5 | |
| | 35 | | | 9.34%, 05/15/2009 | | | 37 | |
| | | | | Ecuador (Republic of) | | | | |
| | 95 | | | 10.00%, 08/15/2030 (K) | | | 96 | |
| | | | | Indonesia (Republic of) | | | | |
| IDR | 89,000 | | | 11.00%, 11/15/2020 | | | 8 | |
| | | | | Panama (Republic of) | | | | |
| | 5 | | | 6.70%, 01/26/2036 | | | 5 | |
| | 15 | | | 7.25%, 03/15/2015 | | | 17 | |
| | 20 | | | 9.38%, 07/23/2012 | | | 23 | |
| | | | | Peru (Republic of) | | | | |
| | 14 | | | 6.55%, 03/14/2037 | | | 15 | |
| EUR | 20 | | | 7.50%, 10/14/2014 | | | 34 | |
| | 10 | | | 8.38%, 05/03/2016 | | | 12 | |
| | 10 | | | 8.75%, 11/21/2033 | | | 13 | |
| | 60 | | | 9.13%, 02/21/2012 | | | 70 | |
| | 35 | | | 9.88%, 02/06/2015 | | | 45 | |
| | | | | Philippines (Republic of) | | | | |
| | 45 | | | 8.88%, 03/17/2015 | | | 53 | |
| | 55 | | | 9.00%, 02/15/2013 | | | 64 | |
| | 40 | | | 9.38%, 01/18/2017 | | | 50 | |
| | | | | Turkey (Republic of) | | | | |
| | 105 | | | 6.88%, 03/17/2036 | | | 97 | |
| | 90 | | | 7.25%, 03/15/2015 | | | 94 | |
| | 20 | | | 9.50%, 01/15/2014 | | | 23 | |
| | | | | Ukraine Government | | | | |
| | 100 | | | 6.39%, 06/26/2012 (K) | | | 101 | |
| | | | | Uruguay (Republic of) | | | | |
| UYU | 168 | | | 5.00%, 09/14/2018 | | | 9 | |
| | 50 | | | 7.63%, 03/21/2036 | | | 53 | |
| �� | 15 | | | 8.00%, 11/18/2022 | | | 17 | |
| | | | | Venezuela (Republic of) | | | | |
| | 5 | | | 3.91%, 04/20/2011 (K)(L) | | | 4 | |
| | 70 | | | 5.75%, 02/26/2016 | | | 55 | |
| | 45 | | | 7.65%, 04/21/2025 | | | 34 | |
| | 30 | | | 8.50%, 10/08/2014 | | | 28 | |
| | 15 | | | 9.25%, 09/15/2027 | | | 14 | |
| | | | | | | | | |
| | | | | | | | | | | | 1,593 | |
| | | | | | | | | | | | | |
| | | | | Health Care — 0.5% |
| | | | | Community Health Systems, Inc. | | | | |
| | 20 | | | 8.88%, 07/15/2015 | | | 21 | |
| | | | | CV Therapeutics | | | | |
| | 15 | | | 2.75%, 05/16/2012 (X) | | | 12 | |
| | | | | Elan Financial plc | | | | |
| | 20 | | | 7.07%, 11/15/2011 (L) | | | 19 | |
| | 70 | | | 7.75%, 11/15/2011 | | | 68 | |
| | | | | HCA, Inc. | | | | |
| | 80 | | | 9.63%, 11/15/2016 | | | 86 | |
| | | | | Omnicare, Inc. | | | | |
| | 20 | | | 6.88%, 12/15/2015 | | | 18 | |
| | | | | Rite Aid Corp. | | | | |
| | 20 | | | 7.50%, 01/15/2015 | | | 19 | |
| | | | | Tenet Healthcare Corp. | | | | |
| | 35 | | | 9.88%, 07/01/2014 | | | 36 | |
| | | | | | | | | |
| | | | | | | | | | | | 279 | |
| | | | | | | | | | | | | |
| | | | | Services — 1.2% |
| | | | | AMC Entertainment, Inc. | | | | |
| | 30 | | | 8.00%, 03/01/2014 | | | 27 | |
| | | | | Bonten Media Acquisition | | | | |
| | 15 | | | 9.00%, 06/01/2015 (I) | | | 12 | |
| | | | | Carriage Services, Inc. | | | | |
| | 25 | | | 7.88%, 01/15/2015 | | | 25 | |
| | | | | Casella Waste Systems, Inc. | | | | |
| | 40 | | | 9.75%, 02/01/2013 | | | 39 | |
| | | | | DirecTV Holdings LLC | | | | |
| | 10 | | | 6.38%, 06/15/2015 | | | 10 | |
| | | | | FireKeepers Development Authority | | | | |
| | 20 | | | 13.88%, 05/01/2015 (I)(Q) | | | 20 | |
| | | | | Harland Clarke Holdings | | | | |
| | 5 | | | 9.50%, 05/15/2015 | | | 4 | |
| | | | | Harrah’s Operating Co., Inc. | | | | |
| | 10 | | | 5.50%, 07/01/2010 | | | 9 | |
| | 25 | | | 5.63%, 06/01/2015 | | | 15 | |
| | 20 | | | 10.75%, 02/01/2016 (I) | | | 17 | |
| | | | | Idearc, Inc. | | | | |
| | 40 | | | 8.00%, 11/15/2016 | | | 26 | |
| | | | | Indianapolis Downs | | | | |
| | 15 | | | 11.00%, 11/01/2012 (I) | | | 14 | |
| | | | | Lamar Media Corp. | | | | |
| | 15 | | | 7.25%, 01/01/2013 | | | 15 | |
| | | | | Liberty Media Corp. | | | | |
| | 30 | | | 7.88%, 07/15/2009 | | | 30 | |
| | 10 | | | 8.50%, 07/15/2029 | | | 9 | |
| | | | | LIN Television Corp. | | | | |
| | 25 | | | 6.50%, 05/15/2013 | | | 24 | |
| | | | | Marquee Holdings, Inc. | | | | |
| | 30 | | | 12.00%, 08/15/2014 | | | 23 | |
| | | | | MGM Mirage, Inc. | | | | |
| | 15 | | | 8.50%, 09/15/2010 | | | 15 | |
| | | | | OED Corp./Diamond Jo LLC | | | | |
| | 20 | | | 8.75%, 04/15/2012 | | | 18 | |
| | | | | Open Solutions, Inc. | | | | |
| | 40 | | | 9.75%, 02/01/2015 (I) | | | 32 | |
| | | | | Park Place Entertainment Corp. | | | | |
| | 20 | | | 8.13%, 05/15/2011 | | | 17 | |
| | | | | Quebecor Media, Inc. | | | | |
| | 55 | | | 7.75%, 03/15/2016 | | | 53 | |
| | | | | R.H. Donnelley Corp. | | | | |
| | 30 | | | 6.88%, 01/15/2013 | | | 19 | |
| | 10 | | | 8.88%, 10/15/2017 (I) | | | 7 | |
| | | | | River Rock Entertainment | | | | |
| | 10 | | | 9.75%, 11/01/2011 | | | 10 | |
| | | | | Seneca Gaming Corp. | | | | |
| | 50 | | | 7.25%, 05/01/2012 | | | 48 | |
| | | | | Sensata Technologies | | | | |
| | 25 | | | 8.00%, 05/01/2014 | | | 23 | |
| | | | | Service Corp. International | | | | |
| | 25 | | | 7.00%, 06/15/2017 | | | 25 | |
| | | | | SunGard Data Systems, Inc. | | | | |
| | 20 | | | 9.13%, 08/15/2013 | | | 21 | |
| | 26 | | | 10.25%, 08/15/2015 | | | 28 | |
| | | | | Unisys Corp. | | | | |
| | 15 | | | 8.00%, 10/15/2012 | | | 14 | |
| | | | | Virgin River Casino Corp. | | | | |
| | 10 | | | 9.00%, 01/15/2012 | | | 7 | |
| | | | | | | | | |
| | | | | | | | | | | | 656 | |
| | | | | | | | | | | | | |
| | | | | | | | | | | | | |
The accompanying notes are an integral part of these financial statements.
121
The Hartford Balanced Income Fund
Schedule of Investments — (continued)
April 30, 2008 (Unaudited)
(000’s Omitted)
| | | | | | | | | | | | | |
Principal
| | | | | | | | Market
| |
| Amount | | | | | | | | Value (W) | |
| |
| | | | | | | | | | | | | |
| CORPORATE BONDS: NON-INVESTMENT GRADE — (continued) |
| | | | | Technology — 0.7% |
| | | | | Actuant Corp. | | | | |
| $ | 10 | | | 6.88%, 06/15/2017 (I) | | $ | 10 | |
| | | | | Bio-Rad Laboratories, Inc. | | | | |
| | 10 | | | 6.13%, 12/15/2014 | | | 9 | |
| | | | | Canwest MediaWorks L.P. | | | | |
| | 20 | | | 9.25%, 08/01/2015 (I) | | | 18 | |
| | | | | CCH II Holdings LLC/ CCH II Capital | | | | |
| | 15 | | | 10.25%, 10/01/2013 | | | 14 | |
| | | | | Celestica, Inc. | | | | |
| | 20 | | | 7.88%, 07/01/2011 | | | 20 | |
| | | | | Charter Communications Operating LLC | | | | |
| | 60 | | | 8.00%, 04/30/2012 (I) | | | 58 | |
| | 20 | | | 10.88%, 09/15/2014 (I) | | | 21 | |
| | | | | Coleman Cable, Inc. | | | | |
| | 15 | | | 9.88%, 10/01/2012 | | | 14 | |
| | | | | CSC Holdings, Inc. | | | | |
| | 30 | | | 7.63%, 07/15/2018 | | | 29 | |
| | | | | Deluxe Corp. | | | | |
| | 35 | | | 7.38%, 06/01/2015 | | | 32 | |
| | | | | GCI, Inc. | | | | |
| | 30 | | | 7.25%, 02/15/2014 | | | 25 | |
| | | | | Intelsat Intermediate | | | | |
| | 20 | | | 8.89%, 02/01/2015 (M) | | | 17 | |
| | | | | Mediacom Broadband LLC | | | | |
| | 40 | | | 8.50%, 10/15/2015 | | | 37 | |
| | | | | PanAmSat Corp. | | | | |
| | 20 | | | 9.00%, 08/15/2014 | | | 20 | |
| | | | | Sanmina-Sci Corp. | | | | |
| | 18 | | | 5.55%, 06/15/2010 (I)(L) | | | 18 | |
| | | | | Vangent, Inc. | | | | |
| | 15 | | | 9.63%, 02/15/2015 | | | 13 | |
| | | | | Windstream Corp. | | | | |
| | 30 | | | 8.13%, 08/01/2013 | | | 31 | |
| | | | | | | | | |
| | | | | | | | | | | | 386 | |
| | | | | | | | | | | | | |
| | | | | Transportation — 0.1% |
| | | | | American Rail Car Industries, Inc. | | | | |
| | 15 | | | 7.50%, 03/01/2014 | | | 13 | |
| | | | | Hornbeck Offshore Services, Inc. | | | | |
| | 15 | | | 6.13%, 12/01/2014 | | | 15 | |
| | | | | Navios Maritime Holdings | | | | |
| | 30 | | | 9.50%, 12/15/2014 | | | 31 | |
| | | | | Overseas Shipholding Group, Inc. | | | | |
| | 15 | | | 8.25%, 03/15/2013 | | | 16 | |
| | | | | Ultrapetrol Bahamas Ltd. | | | | |
| | 10 | | | 9.00%, 11/24/2014 (H) | | | 9 | |
| | | | | | | | | |
| | | | | | | | | | | | 84 | |
| | | | | | | | | | | | | |
| | | | | Utilities — 0.7% |
| | | | | AES Corp. | | | | |
| | 15 | | | 7.75%, 10/15/2015 | | | 16 | |
| | | | | Aquila, Inc. | | | | |
| | 45 | | | 14.88%, 07/01/2012 | | | 55 | |
| | | | | CIA Transporte Energia | | | | |
| | 5 | | | 8.88%, 12/15/2016 (I) | | | 4 | |
| | | | | Dynegy Holdings, Inc. | | | | |
| | 40 | | | 8.38%, 05/01/2016 | | | 42 | |
| | | | | Edison Mission Energy | | | | |
| | 15 | | | 7.20%, 05/15/2019 | | | 15 | |
| | 25 | | | 7.50%, 06/15/2013 | | | 26 | |
| | | | | Energy Future Holdings | | | | |
| | 50 | | | 10.88%, 11/01/2017 (I) | | | 53 | |
| | | | | Ipalco Enterprises, Inc. | | | | |
| | 10 | | | 7.25%, 04/01/2016 (I) | | | 10 | |
| | | | | Kinder Morgan Finance Co. | | | | |
| | 40 | | | 5.70%, 01/05/2016 | | | 38 | |
| | | | | National Power Corp. | | | | |
| | 35 | | | 7.34%, 08/23/2011 (L) | | | 37 | |
| | | | | National Power Corp. | | | | |
| | 35 | | | 9.88%, 03/16/2010 | | | 36 | |
| | | | | NRG Energy, Inc. | | | | |
| | 50 | | | 7.38%, 01/15/2017 | | | 52 | |
| | | | | TXU Corp. | | | | |
| | 20 | | | 5.55%, 11/15/2014 | | | 16 | |
| | 10 | | | 6.50%, 11/15/2024 | | | 8 | |
| | | | | | | | | |
| | | | | | | | | | | | 408 | |
| | | | | | | | | | | | | |
| | | | | Total corporate bonds: non-investment grade
(cost $4,958) | | $ | 4,849 | |
| | | | | | | | | | | | | |
| | | | | | | | | | | | | |
| U.S. GOVERNMENT SECURITIES — 0.3% |
| | | | | U.S. Treasury Securities — 0.3% |
| | | | | U.S. Treasury Bonds: |
| $ | 50 | | | 4.50%, 2036 | | $ | 50 | |
| | 80 | | | 6.00%, 2026 (S) | | | 95 | |
| | | | | | | | | |
| | | | | Total U.S. government securities
(cost $145) | | $ | 145 | |
| | | | | | | | | |
| | | | | Total long-term investments
(cost $54,737) | | $ | 54,322 | |
| | | | | | | | | | | | | |
| | | | | | | | | | | | | |
| SHORT-TERM INVESTMENTS — 2.8% |
| | | | | Foreign Governments — 0.7% |
| | | | | Bank Negara Monetary Note | | | | |
| MYR | 900 | | | 3.43%, 06/12/2008 (M) | | $ | 284 | |
| | | | | Egypt Treasury Bill | | | | |
| EGP | 150 | | | 7.40%, 10/07/2008 (M) | | | 27 | |
| EGP | 125 | | | 7.50%, 10/07/2008 — 10/21/2008 (M) | | | 22 | |
| EGP | 75 | | | 7.60%, 09/30/2008 (M) | | | 14 | |
| | | | | Peru Certif De Deposito | | | | |
| PEN | 100 | | | 5.75%, 07/03/2008 (M) | | | 35 | |
| | | | | | | | | |
| | | | | | | | | | | | 382 | |
| | | | | | | | | | | | | |
| | | | | Repurchase Agreements — 2.1% |
| | | | | Banc of America Securities TriParty Joint Repurchase Agreement (maturing on 05/01/2008 in the amount of $454, collateralized by FHLMC 5.00%, 2035, value of $463) | | | | |
| | 454 | | | 1.98% dated 04/30/2008 | | | 454 | |
| | | | | BNP Paribas Securities Corp. TriParty Joint Repurchase Agreement (maturing on 05/01/2008 in the amount of $223, collateralized by FNMA 5.50% — 6.50%, 2036 — 2038, value of $227) | | | | |
| | 222 | | | 2.00% dated 04/30/2008 | | | 222 | |
| | | | | Deutsche Bank Securities Joint Repurchase Agreement (maturing on 05/01/2008 in the amount of $—, collateralized by U. S. Treasury Note 3.63%, 2009, value of $—) | | | | |
| | — | | | 1.90% dated 04/30/2008 | | | — | |
The accompanying notes are an integral part of these financial statements.
122
| | | | | | | | | | | | | |
Principal
| | | | | | | | Market
| |
| Amount | | | | | | | | Value (W) | |
| |
| SHORT-TERM INVESTMENTS — (continued) |
| | | | | Repurchase Agreements — (continued) |
| | | | | Deutsche Bank Securities TriParty Joint Repurchase Agreement (maturing on 05/01/2008 in the amount of $277, collateralized by FHLMC 4.50% — 7.00%, 2016 — 2038, value of $282) | | | | |
| $ | 277 | | | 2.00% dated 04/30/2008 | | $ | 277 | |
| | | | | JP Morgan Chase TriParty Joint Repurchase Agreement (maturing on 05/01/2008 in the amount of $267, collateralized by FNMA 4.50% — 7.00%, 2020 — 2038, value of $272) | | | | |
| | 267 | | | 1.96% dated 04/30/2008 | | | 267 | |
| | | | | | | | | |
| | | | | | | | | | | | 1,220 | |
| | | | | | | | | | | | | |
| | | | | Total short-term investments
(cost $1,600) | | $ | 1,602 | |
| | | | | | | | | |
| | | | | Total investments
(cost $56,337) (C) | | | 99.3 | % | | $ | 55,924 | |
| | | | | Other assets and liabilities | | | 0.7 | % | | | 388 | |
| | | | | | | | | | | | | |
| | | | | Total net assets | | | 100.0 | % | | $ | 56,312 | |
| | | | | | | | | | | | | |
| |
| Note: | Percentage of investments as shown is the ratio of the total market value to total net assets. Market value of investments in foreign securities represents 19.80% of total net assets at April 30, 2008. |
| | |
| | Foreign securities that are principally traded on certain foreign markets are adjusted daily pursuant to a third party pricing service methodology approved by the Board of Directors in order to reflect an adjustment for factors occurring after the close of the foreign market but before the close of the New York Stock Exchange. |
| |
| (C) | | At April 30, 2008, the cost of securities for federal income tax purposes was $56,340 and the aggregate gross unrealized appreciation and depreciation based on that cost were: |
| | | | | |
| Unrealized Appreciation | | $ | 1,478 | |
| Unrealized Depreciation | | | (1,894 | ) |
| | | | | |
| Net Unrealized Depreciation | | $ | (416 | ) |
| | | | | |
| | |
| # | | This security, or a portion of this security, has been segregated to cover funding requirements on investment transactions settling in the future. |
| |
| (D) | | Currently non-income producing. |
| |
| (I) | | Securities issued within terms of a private placement memorandum, exempt from registration under Section 144A of the Securities Act of 1933, as amended, and may be sold only to qualified institutional buyers. Pursuant to guidelines adopted by the Board of Directors, these issues are determined to be liquid. The aggregate value of these securities at April 30, 2008, was $2,320, which represents 4.12% of total net assets. |
| |
| (K) | | Securities contain some restrictions as to public resale. These securities comply with Regulation S, rules governing offers and sales made outside the United States without registration under the Securities Act of 1933, and are determined to be liquid. At April 30, 2008, the market value of these securities amounted to $708 or 1.26% of net assets. |
| |
| (L) | | Variable rate securities; the rate reported is the coupon rate in effect at April 30, 2008. |
| |
| (M) | | The interest rate disclosed for these securities represents the effective yield on the date of acquisition. |
| |
| (Q) | | The cost of securities purchased on a when-issued or delayed delivery basis at April 30, 2008 was $19. |
| |
| (X) | | Convertible security. |
| |
| (B) | | All principal amounts are in U.S. dollars unless otherwise indicated. |
| | | |
| BRL | | — Brazilian Real |
| COP | | — Colombian Peso |
| EGP | | — Egyptian Pound |
| EUR | | — Euro |
| IDR | | — Indonesian Rupiah |
| MXP | | — Mexican Peso |
| MYR | | — Malaysian Ringgit |
| PEN | | — Peruvian New Sol |
| UYU | | — Uruguayan Peso |
| | |
| (H) | | The following securities are considered illiquid. Illiquid securities are often purchased in private placement transactions, are not registered under the Securities Act of 1933 and may have contractual restrictions on resale. A security may also be considered illiquid if the security lacks a readily available market or if its valuation has not changed for a certain period of time. |
| | | | | | | | | | | |
Period
| | | | | | | | |
Acquired | | Shares/Par | | | Security | | Cost Basis | |
| 05/2007 | | | 10 | | | Ultrapetrol Bahamas Ltd., 9.00%, 11/24/2014 | | $ | 10 | |
| | |
| | The aggregate value of these securities at April 30, 2008 was $9 which represents 0.02% of total net assets. |
| |
| (S) | | Security pledged as initial margin deposit for open futures contracts at April 30, 2008. |
Futures Contracts Outstanding at April 30, 2008
| | | | | | | | | | | | | | | | | |
| | | | | | | | | | | | Unrealized
| |
| | | Number of
| | | | | | Expiration
| | | Appreciation/
| |
Description | | Contracts* | | | Position | | | Month | | | (Depreciation) | |
| |
| 5 Year U.S. Treasury Note | | | 9 | | | | Long | | | | Jun 2008 | | | $ | (11 | ) |
| 10 Year U.S. Treasury Note | | | 10 | | | | Short | | | | Jun 2008 | | | | 14 | |
| U.S. Long Bond | | | 6 | | | | Long | | | | Jun 2008 | | | | 1 | |
| | | | | | | | | | | | | | | | | |
| | | | | | | | | | | | | | | $ | 4 | |
| | | | | | | | | | | | | | | | | |
| | |
| | * The number of contracts does not omit 000’s. |
Forward Foreign Currency Contracts Outstanding at April 30, 2008
| | | | | | | | | | | | | | | | | |
| | | | | | | | | | | | Unrealized
| |
| | | Market
| | | Contract
| | | Delivery
| | | Appreciation/
| |
Description | | Value (W) | | | Amount | | | Date | | | (Depreciation) | |
| |
| Brazilian Real (Buy) | | $ | 33 | | | $ | 33 | | | | 06/18/08 | | | $ | — | |
| Brazilian Real (Sell) | | | 95 | | | | 93 | | | | 06/18/08 | | | | (2 | ) |
| British Pound (Buy) | | | 56 | | | | 55 | | | | 05/02/08 | | | | 1 | |
| British Pound (Buy) | | | 124 | | | | 124 | | | | 05/06/08 | | | | — | |
| Colombian Peso (Sell) | | | 5 | | | | 5 | | | | 05/23/08 | | | | — | |
| Euro (Buy) | | | 23 | | | | 23 | | | | 06/18/08 | | | | — | |
| Euro (Sell) | | | 34 | | | | 34 | | | | 06/18/08 | | | | — | |
| Euro (Sell) | | | 64 | | | | 63 | | | | 06/18/08 | | | | (1 | ) |
| Indonesian Rupiah (Sell) | | | 10 | | | | 10 | | | | 05/23/08 | | | | — | |
| Israeli New Shekel (Buy) | | | 29 | | | | 29 | | | | 06/18/08 | | | | — | |
| Israeli New Shekel (Sell) | | | 29 | | | | 28 | | | | 06/18/08 | | | | (1 | ) |
| Malaysian Ringgit (Buy) | | | 66 | | | | 65 | | | | 06/18/08 | | | | 1 | |
| Peruvian New Sol (Buy) | | | 9 | | | | 9 | | | | 06/18/08 | | | | — | |
| Peruvian New Sol (Sell) | | | 9 | | | | 9 | | | | 06/18/08 | | | | — | |
| | | | | | | | | | | | | | | | | |
| | | | | | | | | | | | | | | $ | (2 | ) |
| | | | | | | | | | | | | | | | | |
| | |
| (W) | | See Note 2b of accompanying Notes to Financial Statements regarding valuation of securities. |
The accompanying notes are an integral part of these financial statements.
123
The Hartford Capital Appreciation Fund
Schedule of Investments
April 30, 2008 (Unaudited)
(000’s Omitted)
| | | | | | | | | | | | | |
| | | | | | | | | Market
| |
| Shares | | | | | | | | Value (W) | |
| COMMON STOCK — 90.7% |
| | | | | Basic Materials — 16.1% |
| | 2,023 | | | Aracruz Celulose S.A. ADR | | $ | 163,063 | |
| | 1,199 | | | BHP Billiton Ltd. ADR (G) | | | 96,740 | |
| | 4,887 | | | Cameco Corp. | | | 170,996 | |
| | 11,683 | | | Companhia Vale do Rio Doce ADR | | | 456,572 | |
| | 2,162 | | | Consol Energy, Inc. | | | 175,027 | |
| | 2,919 | | | Freeport-McMoRan Copper & Gold, Inc. (G) | | | 332,070 | |
| | 1,504 | | | Holcim Ltd. | | | 146,728 | |
| | 2,300 | | | Michelin (C.G.D.E.) Class B | | | 208,753 | |
| | 3,665 | | | Praxair, Inc. | | | 334,675 | |
| | 5,078 | | | Teck Cominco Ltd. Class B | | | 220,949 | |
| | 3,288 | | | United States Steel Corp. | | | 506,234 | |
| | 2,500 | | | Uranium One, Inc. (D) | | | 11,543 | |
| | 9,113 | | | Vedanta Resources plc | | | 401,789 | |
| | 3,457 | | | Xstrata plc | | | 269,157 | |
| | | | | | | | | |
| | | | | | | | | | | | 3,494,296 | |
| | | | | | | | | | | | | |
| | | | | Capital Goods — 6.1% |
| | 4,200 | | | ABB Ltd. ADR | | | 128,814 | |
| | 5,954 | | | Boeing Co. | | | 505,273 | |
| | 1,786 | | | Caterpillar, Inc. | | | 146,254 | |
| | 4,040 | | | Cummins, Inc. | | | 253,100 | |
| | 1,750 | | | Deere & Co. | | | 147,123 | |
| | 8,000 | | | Hansen Transmissions (D)(G) | | | 34,994 | |
| | 2,000 | | | Ingersoll-Rand Co. Class A (G) | | | 88,760 | |
| | 523 | | | Pall Corp. | | | 18,201 | |
| | | | | | | | | |
| | | | | | | | | | | | 1,322,519 | |
| | | | | | | | | | | | | |
| | | | | Consumer Cyclical — 7.6% |
| | 36,752 | | | Buck Holdings L.P. (A)(D)(H) | | | 33,077 | |
| | 60,854 | | | Ford Motor Co. (D)(G) | | | 502,655 | |
| | 1,600 | | | Foster Wheeler Ltd. (D) | | | 101,904 | |
| | 4,092 | | | Liz Claiborne, Inc. | | | 72,381 | |
| | 6,054 | | | Lowe’s Co., Inc. | | | 152,505 | |
| | 7,638 | | | Newell Rubbermaid, Inc. | | | 156,802 | |
| | 7,377 | | | Staples, Inc. | | | 160,070 | |
| | 6,791 | | | TJX Cos., Inc. (G) | | | 218,799 | |
| | 4,322 | | | Wal-Mart Stores, Inc. | | | 250,613 | |
| | | | | | | | | |
| | | | | | | | | | | | 1,648,806 | |
| | | | | | | | | | | | | |
| | | | | Consumer Staples — 2.3% |
| | 1,574 | | | Bunge Ltd. Finance Corp. (G) | | | 179,532 | |
| | 4,579 | | | Cosan Ltd. (D) | | | 60,716 | |
| | 3,826 | | | Cosan S.A. Industria E Comercio | | | 67,374 | |
| | 401 | | | Nestle S.A. (G) | | | 191,389 | |
| | | | | | | | | |
| | | | | | | | | | | | 499,011 | |
| | | | | | | | | | | | | |
| | | | | Energy — 10.7% |
| | 8,418 | | | Acergy S.A. | | | 206,540 | |
| | 3,171 | | | Chesapeake Energy Corp. | | | 163,956 | |
| | 1,661 | | | EnCana Corp. | | | 134,229 | |
| | 781 | | | EOG Resources, Inc. | | | 101,853 | |
| | 10,577 | | | Halliburton Co. | | | 485,572 | |
| | 988 | | | Hess Corp. | | | 104,936 | |
| | 2,625 | | | OMV AG | | | 197,185 | |
| | 2,520 | | | Petroleo Brasileiro S.A. ADR (G) | | | 306,021 | |
| | 6,169 | | | Seadrill Ltd. (G) | | | 185,809 | |
| | 3,000 | | | Weatherford International Ltd. (D) | | | 242,010 | |
| | 3,383 | | | XTO Energy, Inc. | | | 209,260 | |
| | | | | | | | | |
| | | | | | | | | | | | 2,337,371 | |
| | | | | | | | | | | | | |
| | | | | Finance — 15.8% |
| | 4,634 | | | ACE Ltd. | | $ | 279,408 | |
| | 7,615 | | | American International Group, Inc. (G) | | | 351,827 | |
| | 201 | | | Augsburg Re AG (A)(D)(H) | | | — | |
| | 132,340 | | | Bank of China Ltd. | | | 67,429 | |
| | 12,373 | | | Citigroup, Inc. | | | 312,653 | |
| | 874 | | | Deutsche Boerse AG | | | 127,172 | |
| | 2,923 | | | Eurocastle Investment Ltd. | | | 35,296 | |
| | 3,600 | | | European Capital Ltd. | | | 30,158 | |
| | 1,600 | | | Excel Medical Fund L.P. (A)(D)(H) | | | 1,440 | |
| | 2,287 | | | Federal National Mortgage Association (G) | | | 64,714 | |
| | 1,998 | | | Goldman Sachs Group, Inc. | | | 382,367 | |
| | 262,283 | | | Industrial and Commercial Bank of China | | | 207,101 | |
| | 4,256 | | | Julius Baer Holding Ltd. | | | 312,007 | |
| | 733 | | | Mastercard, Inc. (G) | | | 203,891 | |
| | 1,011 | | | ORIX Corp. | | | 182,929 | |
| | 35,722 | | | Shun Tak Holdings Ltd. | | | 47,662 | |
| | 4,786 | | | Standard Chartered plc | | | 169,112 | |
| | 10,862 | | | UnitedHealth Group, Inc. | | | 354,420 | |
| | 2,066 | | | Visa, Inc. (D) | | | 172,416 | |
| | 6,761 | | | Washington Mutual, Inc. PIPE (A)(H) | | | 74,786 | |
| | 1,000 | | | Wellpoint, Inc. (D) | | | 49,750 | |
| | | | | | | | | |
| | | | | | | | | | | | 3,426,538 | |
| | | | | | | | | | | | | |
| | | | | Health Care — 5.5% |
| | 4,378 | | | Amgen, Inc. (D) | | | 183,286 | |
| | 201 | | | AstraZeneca plc | | | 8,413 | |
| | 3,322 | | | Cardinal Health, Inc. | | | 172,977 | |
| | 6,634 | | | Medtronic, Inc. | | | 322,943 | |
| | 17,746 | | | Schering-Plough Corp. | | | 326,708 | |
| | 4,027 | | | Teva Pharmaceutical Industries Ltd. ADR | | | 188,378 | |
| | | | | | | | | |
| | | | | | | | | | | | 1,202,705 | |
| | | | | | | | | | | | | |
| | | | | Services — 3.2% |
| | 3,593 | | | Bare Escentuals, Inc. (D)(G) | | | 81,947 | |
| | 1,471 | | | Cadence Design Systems, Inc. (D) | | | 16,377 | |
| | 2,858 | | | Focus Media Holding Ltd. ADR (D) | | | 105,441 | |
| | 25 | | | Harvey Weinstein Master L.P. (A)(D)(H) | | | 16,348 | |
| | 2,803 | | | Monster Worldwide, Inc. (D)(G) | | | 68,207 | |
| | 16,774 | | | News Corp. Class A | | | 300,249 | |
| | 23,379 | | | Shangri-La Asia Ltd. | | | 64,857 | |
| | 1,400 | | | Walt Disney Co. (G) | | | 45,402 | |
| | | | | | | | | |
| | | | | | | | | | | | 698,828 | |
| | | | | | | | | | | | | |
| | | | | Technology — 21.8% |
| | 8,529 | | | Altera Corp. | | | 181,506 | |
| | 3,738 | | | Amdocs Ltd. (D) | | | 117,305 | |
| | 1,146 | | | Apple, Inc. (D) | | | 199,260 | |
| | 15,549 | | | Applied Materials, Inc. | | | 290,152 | |
| | 6,450 | | | AT&T, Inc. | | | 249,691 | |
| | 4,925 | | | Broadcom Corp. Class A (D) | | | 127,843 | |
| | 9,569 | | | Cisco Systems, Inc. (D) | | | 245,349 | |
| | 4,000 | | | EMC Corp. (D)(G) | | | 61,600 | |
| | 14,900 | | | General Electric Co. | | | 487,230 | |
| | 782 | | | Google, Inc. (D) | | | 448,922 | |
| | 1,800 | | | Hewlett-Packard Co. | | | 83,430 | |
| | 41,560 | | | Hon Hai Precision Industry Co., Ltd. | | | 240,181 | |
| | 4,325 | | | Intel Corp. | | | 96,272 | |
| | 4,083 | | | International Business Machines Corp. | | | 492,782 | |
The accompanying notes are an integral part of these financial statements.
124
| | | | | | | | | | | | | |
| | | | | | | | | Market
| |
| Shares | | | | | | | | Value (W) | |
| | | | | | | | | | | | | |
| COMMON STOCK — (continued) |
| | | | | | | | | | | | | |
| | | | | Technology — (continued) |
| | 3,511 | | | McAfee, Inc. (D) | | $ | 116,727 | |
| | 8,765 | | | MTN Group Ltd. | | | 166,561 | |
| | 7,804 | | | Oracle Corp. (D) | | | 162,707 | |
| | 1,860 | | | Orascom Telecom Holding SAE GDR (G) | | | 139,120 | |
| | 3,800 | | | Qualcomm, Inc. | | | 164,122 | |
| | 4,850 | | | Raytheon Co. | | | 310,256 | |
| | 1,303 | | | Research In Motion Ltd. (D) | | | 158,496 | |
| | 8,021 | | | Taiwan Semiconductor Manufacturing Co., Ltd. ADR | | | 90,156 | |
| | 5,080 | | | Time Warner Telecom, Inc. Class A (D) | | | 99,570 | |
| | | | | | | | | |
| | | | | | | | | | | | 4,729,238 | |
| | | | | | | | | | | | | |
| | | | | Transportation — 0.6% |
| | 1,265 | | | Burlington Northern Santa Fe Corp. | | | 129,756 | |
| | | | | Utilities — 1.0% |
| | 4,993 | | | Suntech Power Holdings Co., Ltd. ADR (D) | | | 223,320 | |
| | | | | | | | | |
| | | | | Total common stock
(cost $17,415,580) | | $ | 19,712,388 | |
| | | | | | | | | | | | | |
| | | | | | | | | | | | | |
| WARRANTS — 1.3% |
| | | | | Basic Materials — 0.6% |
| | 6,598 | | | TATA Steel Ltd. (H) | | $ | 133,250 | |
| | | | | Utilities — 0.7% |
| | 11,948 | | | Suzlon Energy Acc (H) | | | 151,972 | |
| | | | | | | | | |
| | | | | Total warrants
(cost $313,963) | | $ | 285,222 | |
| | | | | | | | | | | | | |
| | | | | | | | | | | | | |
| PREFERRED STOCK — 0.3% |
| | | | | Finance — 0.3% |
| | — | | | Washington Mutual, Inc. (A)(D)(H)(X) | | $ | 58,531 | |
| | | | | | | | | |
| | | | | Total preferred stock
(cost $46,300) | | $ | 58,531 | |
Principal
| | | | | | | | | |
| Amount (B) | | | | | | | | | |
| |
| CORPORATE BONDS: INVESTMENT GRADE — 0.5% |
| | | | | Finance — 0.5% |
| | | | | Augsburg Re AG | | | | |
| GBP | 397 | | | 0.00%, 12/31/2049 (A)(H)(X) | | $ | 130 | |
| | | | | MBIA Insurance Co. | | | | |
| | 95,840 | | | 14.00%, 01/15/2033 (I)(L) | | | 87,694 | |
| | | | | UBS Luxembourg S.A. | | | | |
| | 23,500 | | | 6.23%, 02/11/2015 | | | 23,596 | |
| | | | | | | | | |
| | | | | Total corporate bonds: investment grade
(cost $119,908) | | $ | 111,420 | |
| | | | | | | | | |
| | | | | Total long-term investments
(cost $17,895,751) | | $ | 20,167,561 | |
| SHORT-TERM INVESTMENTS — 12.6% |
| | | | | Repurchase Agreements — 6.6% |
| | | | | Banc of America Securities TriParty Joint Repurchase Agreement (maturing on 05/01/2008 in the amount of $528,512, collateralized by FHLMC 5.00%, 2035, value of $539,053) | | | | |
| $ | 528,483 | | | 1.98% dated 04/30/2008 | | $ | 528,483 | |
| | | | | BNP Paribas Securities Corp. TriParty Joint Repurchase Agreement (maturing on 05/01/2008 in the amount of $259,174, collateralized by FNMA 5.50% — 6.50%, 2036 — 2038, value of $264,343) | | | | |
| | 259,160 | | | 2.00% dated 04/30/2008 | | | 259,160 | |
| | | | | Deutsche Bank Securities Joint Repurchase Agreement (maturing on 05/01/2008 in the amount of $516, collateralized by U. S. Treasury Note 3.63%, 2009, value of $528) | | | | |
| | 516 | | | 1.90% dated 04/30/2008 | | | 516 | |
| | | | | Deutsche Bank Securities TriParty Joint Repurchase Agreement (maturing on 05/01/2008 in the amount of $322,189, collateralized by FHLMC 4.50% — 7.00%, 2016 — 2038, value of $328,615) | | | | |
| | 322,172 | | | 2.00% dated 04/30/2008 | | | 322,172 | |
| | | | | JP Morgan Chase TriParty Joint Repurchase Agreement (maturing on 05/01/2008 in the amount of $310,501, collateralized by FNMA
4.50% — 7.00%, 2020 — 2038, value of $316,695) | | | | |
| | 310,484 | | | 1.96% dated 04/30/2008 | | | 310,484 | |
| | | | | | | | | |
| | | | | | | | | | | | 1,420,815 | |
| | | | | | | | | | | | | |
| | | | | | | | | | | | | |
| | | | | | | | | | | | | |
| Shares | | | | | | | | | |
| |
| | | | | Securities Purchased with Proceeds from Security Lending — 6.0% |
| | | | | Cash Collateral Reinvestment Fund: |
| | 1,307,869 | | | Goldman Sachs FS Prime Obligation/Institutional Fund | | | 1,307,869 | |
| | | | | | | | | |
| | | | | Total short-term investments
(cost $2,728,684) | | $ | 2,728,684 | |
| | | | | | | | | |
| | | | | Total investments
(cost $20,624,435) (C) | | | 105.4 | % | | $ | 22,896,245 | |
| | | | | Other assets and liabilities | | | (5.4 | )% | | | (1,174,262 | ) |
| | | | | | | | | | | | | |
| | | | | Total net assets | | | 100.0 | % | | $ | 21,721,983 | |
| | | | | | | | | | | | | |
| |
| Note: | Percentage of investments as shown is the ratio of the total market value to total net assets. Market value of investments in foreign securities represents 30.07% of total net assets at April 30, 2008. |
The accompanying notes are an integral part of these financial statements.
125
The Hartford Capital Appreciation Fund
Schedule of Investments — (continued)
April 30, 2008 (Unaudited)
(000’s Omitted)
| | |
| (C) | | At April 30, 2008, the cost of securities for federal income tax purposes was $20,625,250 and the aggregate gross unrealized appreciation and depreciation based on that cost were: |
| | | | | |
| Unrealized Appreciation | | $ | 3,446,779 | |
| Unrealized Depreciation | | | (1,175,784 | ) |
| | | | | |
| Net Unrealized Appreciation | | $ | 2,270,995 | |
| | | | | |
| | |
| (A) | | The aggregate value of securities valued in good faith at fair value as determined under policies and procedures established by and under the supervision of the Funds’ Board of Directors at April 30, 2008, was $184,312, which represents 0.85% of total net assets. This calculation excludes securities that are principally traded on certain foreign markets and whose prices were adjusted solely pursuant to a third party pricing service methodology approved by the Board of Directors. |
| |
| (D) | | Currently non-income producing. |
| |
| (G) | | Security is partially on loan at April 30, 2008. |
| |
| (I) | | Securities issued within terms of a private placement memorandum, exempt from registration under Section 144A of the Securities Act of 1933, as amended, and may be sold only to qualified institutional buyers. Pursuant to guidelines adopted by the Board of Directors, these issues are determined to be liquid. The aggregate value of these securities at April 30, 2008, was $87,694, which represents 0.40% of total net assets. |
| |
| (L) | | Variable rate securities; the rate reported is the coupon rate in effect at April 30, 2008. |
| |
| (X) | | Convertible security. |
| |
| (B) | | All principal amounts are in U.S. dollars unless otherwise indicated. |
| | |
| (H) | | The following securities are considered illiquid. Illiquid securities are often purchased in private placement transactions, are not registered under the Securities Act of 1933 and may have contractual restrictions on resale. A security may also be considered illiquid if the security lacks a readily available market or if its valuation has not changed for a certain period of time. |
| | | | | | | | | | | |
Period
| | | | | | | | |
Acquired | | Shares/Par | | | Security | | Cost Basis | |
| 06/2006 | | | 397 | | | Augsburg Re AG, 0.00%, 12/31/2049 - 144A | | $ | 739 | |
| 06/2006 | | | 201 | | | Augsburg Re AG - 144A | | | 64 | |
| 06/2007 | | | 36,752 | | | Buck Holdings L.P. | | | 36,791 | |
| 03/2008 | | | 1,600 | | | Excel Medical Fund L.P. | | | 1,600 | |
| 10/2005 | | | 25 | | | Harvey Weinstein Master L.P. - Reg D | | | 23,636 | |
12/2007 –
01/2008 | | | 11,948 | | | Suzlon Energy Acc - 144A | | | 212,560 | |
07/2007 –
02/2008 | | | 6,598 | | | TATA Steel Ltd. - 144A | | | 101,402 | |
| 04/2008 | | | — | | | Washington Mutual, Inc. Preferred Stock | | | 46,300 | |
| 04/2008 | | | 6,761 | | | Washington Mutual, Inc. PIPE - Reg D | | | 59,161 | |
| | |
| | The aggregate value of these securities at April 30, 2008 was $469,534 which represents 2.16% of total net assets. |
| |
| | PIPE — Private Investment in Public Equity |
Forward Foreign Currency Contracts Outstanding at April 30, 2008
| | | | | | | | | | | | | | | | | |
| | | | | | | | | | | | Unrealized
| |
| | | Market
| | | Contract
| | | Delivery
| | | Appreciation/
| |
Description | | Value (W) | | | Amount | | | Date | | | (Depreciation) | |
| |
| British Pound (Buy) | | $ | 7,793 | | | $ | 7,778 | | | | 05/06/08 | | | $ | 15 | |
| Canadian Dollar (Sell) | | | 2,398 | | | | 2,384 | | | | 05/02/08 | | | | (14 | ) |
| Euro (Buy) | | | 13,293 | | | | 13,249 | | | | 05/05/08 | | | | 44 | |
| Euro (Sell) | | | 926,391 | | | | 862,341 | | | | 12/19/08 | | | | (64,050 | ) |
| Swiss Franc (Sell) | | | 3,053 | | | | 3,053 | | | | 05/02/08 | | | | — | |
| Swiss Franc (Sell) | | | 5,627 | | | | 5,618 | | | | 05/05/08 | | | | (9 | ) |
| | | | | | | | | | | | | | | | | |
| | | | | | | | | | | | | | | $ | (64,014 | ) |
| | | | | | | | | | | | | | | | | |
| | |
| (W) | | See Note 2b of accompanying Notes to Financial Statements regarding valuation of securities. |
Diversification by Country
as of April 30, 2008
| | | | | |
| | | Percentage of
|
Country | | Net Assets |
| |
| Australia | | | 0.4 | % |
| |
| |
| Austria | | | 0.9 | |
| |
| |
| Belgium | | | 0.2 | |
| |
| |
| Brazil | | | 4.8 | |
| |
| |
| Canada | | | 3.2 | |
| |
| |
| China | | | 2.8 | |
| |
| |
| Egypt | | | 0.6 | |
| |
| |
| France | | | 1.0 | |
| |
| |
| Germany | | | 0.7 | |
| |
| |
| Hong Kong | | | 0.5 | |
| |
| |
| India | | | 0.7 | |
| |
| |
| Israel | | | 0.9 | |
| |
| |
| Japan | | | 0.8 | |
| |
| |
| Luxembourg | | | 1.6 | |
| |
| |
| Norway | | | 0.9 | |
| |
| |
| South Africa | | | 0.8 | |
| |
| |
| Switzerland | | | 3.6 | |
| |
| |
| Taiwan | | | 1.5 | |
| |
| |
| United Kingdom | | | 4.1 | |
| |
| |
| United States | | | 62.8 | |
| |
| |
| Short-Term Investments | | | 12.6 | |
| |
| |
| Other Assets and Liabilities | | | (5.4 | ) |
| |
| |
Total | | | 100.0 | % |
| |
| |
The accompanying notes are an integral part of these financial statements.
126
The Hartford Capital Appreciation II Fund
Schedule of Investments
April 30, 2008 (Unaudited)
(000’s Omitted)
| | | | | | | | | | | | | |
| | | | | | | | | Market
| |
| Shares | | | | | | | | Value (W) | |
| COMMON STOCK — 95.2% |
| | | | | Basic Materials — 14.7% |
| | 14 | | | AK Steel Holding Corp. | | $ | 860 | |
| | 133 | | | Alcoa, Inc. # | | | 4,612 | |
| | 13 | | | Aracruz Celulose S.A. ADR | | | 1,077 | |
| | 68 | | | Arcelor | | | 5,976 | |
| | 2 | | | ArcelorMittal | | | 189 | |
| | 10 | | | ArcelorMittal ADR | | | 864 | |
| | 340 | | | Arch Coal, Inc. | | | 19,496 | |
| | 192 | | | Barrick Gold Corp. | | | 7,403 | |
| | 40 | | | BHP Billiton Ltd. ADR (G) | | | 3,226 | |
| | 7,462 | | | Bumi Resources TBK PT | | | 5,375 | |
| | 419 | | | Cameco Corp. | | | 14,669 | |
| | 46 | | | Celanese Corp. | | | 2,065 | |
| | 8 | | | Century Aluminum Co. (D) | | | 575 | |
| | 118 | | | Chemtura Corp. | | | 815 | |
| | 3 | | | Church & Dwight Co., Inc. | | | 158 | |
| | 8 | | | Cleveland-Cliffs, Inc. | | | 1,315 | |
| | 219 | | | Companhia Vale do Rio Doce ADR | | | 8,559 | |
| | 237 | | | Consol Energy, Inc. | | | 19,225 | |
| | 99 | | | Eurasian Natural Resources Corp. (D) | | | 2,361 | |
| | 19 | | | Evraz Group S.A. | | | 2,013 | |
| | 4 | | | FMC Corp. | | | 265 | |
| | 24 | | | Freeport-McMoRan Copper & Gold, Inc. | | | 2,692 | |
| | 8 | | | Holcim Ltd. | | | 785 | |
| | 131 | | | Impala Platinum Holdings Ltd. (Q) | | | 5,297 | |
| | 559 | | | Jarden Corp. (D) | | | 11,908 | |
| | 33 | | | Kinross Gold Corp. | | | 628 | |
| | 279 | | | Makhteshim-Agan Industries Ltd. | | | 2,561 | |
| | 4 | �� | | Massey Energy Co. | | | 190 | |
| | 424 | | | MMX Mineracao E Metalicos S.A. (D) | | | 14,244 | |
| | 274 | | | Norsk Hydro ASA | | | 4,027 | |
| | 20 | | | Outotec Oyj | | | 1,253 | |
| | 42 | | | Owens-Illinois, Inc. (D) | | | 2,333 | |
| | 9 | | | Potash Corp. of Saskatchewan, Inc. | | | 1,692 | |
| | 282 | | | Rexam plc | | | 2,500 | |
| | 7 | | | Rohm & Haas Co. | | | 362 | |
| | 248 | | | SABMiller plc | | | 5,728 | |
| | 6 | | | Sealed Air Corp. | | | 154 | |
| | 320 | | | Smurfit-Stone Container Corp. (D) | | | 1,740 | |
| | 53 | | | Teck Cominco Ltd. Class B | | | 2,293 | |
| | 6 | | | Terra Industries, Inc. (D) | | | 234 | |
| | 60 | | | Thompson Creek Metals Co., Inc (D) | | | 1,297 | |
| | 144 | | | United States Steel Corp. | | | 22,170 | |
| | 46 | | | Uralkali (D)(I) | | | 2,473 | |
| | 1,213 | | | Uranium One, Inc. (D) | | | 5,599 | |
| | 1,031 | | | USEC, Inc. (D)(G) | | | 4,782 | |
| | 25 | | | Usinas Siderurgicas De Minas Gerais S.A. | | | 1,211 | |
| | 1 | | | Valmont Industries, Inc. | | | 98 | |
| | 148 | | | Vedanta Resources plc | | | 6,541 | |
| | 167 | | | Xstrata plc | | | 13,004 | |
| | 45 | | | Yamana Gold, Inc. | | | 578 | |
| | | | | | | | | |
| | | | | | | | | | | | 219,472 | |
| | | | | | | | | | | | | |
| | | | | Capital Goods — 6.9% |
| | 6 | | | ABB Ltd. ADR | | | 185 | |
| | 37 | | | Alliant Techsystems, Inc. (D) | | | 4,091 | |
| | 67 | | | Baker Hughes, Inc. | | | 5,427 | |
| | 249 | | | Boeing Co. | | | 21,103 | |
| | 161 | | | Caterpillar, Inc. | | | 13,207 | |
| | 308 | | | Cummins, Inc. | | | 19,296 | |
| | 84 | | | Deere & Co. | | | 7,059 | |
| | 6 | | | Dril-Quip, Inc. (D) | | $ | 343 | |
| | 2 | | | Flowserve Corp. | | | 246 | |
| | 18 | | | FMC Technologies, Inc. (D) | | | 1,203 | |
| | 8 | | | Hexcel Corp. (D) | | | 177 | |
| | 94 | | | Honeywell International, Inc. | | | 5,561 | |
| | 8 | | | Joy Global, Inc. | | | 579 | |
| | 75 | | | Kennametal, Inc. | | | 2,618 | |
| | 365 | | | Pall Corp. | | | 12,701 | |
| | 222 | | | Sandvik Ab (G) | | | 3,379 | |
| | 143 | | | Varian Semiconductor Equipment Associates, Inc. (D) | | | 5,253 | |
| | | | | | | | | |
| | | | | | | | | | | | 102,428 | |
| | | | | | | | | | | | | |
| | | | | Consumer Cyclical — 5.5% |
| | 105 | | | Aker Kvaerner | | | 2,650 | |
| | 21 | | | Ariba, Inc. (D) | | | 244 | |
| | 8 | | | Big Lots, Inc. (D) | | | 211 | |
| | 1,405 | | | Buck Holdings L.P. (A)(D)(H) | | | 1,264 | |
| | 1,781 | | | China Communications Construction Co., Ltd. | | | 4,229 | |
| | 3 | | | Costco Wholesale Corp. | | | 205 | |
| | 12 | | | Dick’s Sporting Goods, Inc. (D) | | | 356 | |
| | 3,195 | | | Ford Motor Co. (D)(G) | | | 26,389 | |
| | 17 | | | Foster Wheeler Ltd. (D) | | | 1,089 | |
| | 245 | | | Home Depot, Inc. | | | 7,053 | |
| | 11 | | | Honda Motor Co., Ltd. ADR | | | 359 | |
| | 2 | | | Kohl’s Corp. (D) | | | 121 | |
| | 79 | | | Liz Claiborne, Inc. | | | 1,396 | |
| | 29 | | | Masco Corp. | | | 534 | |
| | 89 | | | MDC Holdings, Inc. | | | 3,892 | |
| | 275 | | | Mitsui & Co., Ltd. | | | 6,469 | |
| | 7 | | | NIKE, Inc. Class B | | | 446 | |
| | 1 | | | Nintendo Co., Ltd. | | | 337 | |
| | 5 | | | Philip Morris International, Inc. (D) | | | 260 | |
| | 37 | | | Staples, Inc. | | | 794 | |
| | 6 | | �� | Supervalu, Inc. | | | 185 | |
| | 307 | | | TRW Automotive Holdings Corp. (D) | | | 7,842 | |
| | 130 | | | UbiSoft Entertainment S.A. (D) | | | 12,984 | |
| | 7 | | | Under Armour, Inc. Class A (D)(G) | | | 221 | |
| | 13 | | | Wal-Mart Stores, Inc. | | | 767 | |
| | 22 | | | Walter Industries | | | 1,547 | |
| | 2 | | | Zumiez, Inc. (D)(G) | | | 47 | |
| | | | | | | | | |
| | | | | | | | | | | | 81,891 | |
| | | | | | | | | | | | | |
| | | | | Consumer Staples — 4.2% |
| | 126 | | | Avon Products, Inc. | | | 4,897 | |
| | 2,904 | | | Chaoda Modern Agriculture | | | 4,176 | |
| | 101 | | | Cosan Ltd. (D) | | | 1,337 | |
| | 237 | | | Dean Foods Co. (D) | | | 5,517 | |
| | 8 | | | Hansen National Corp. (D)(G) | | | 282 | |
| | 171 | | | Imperial Tobacco Group plc | | | 8,195 | |
| | 1 | | | Japan Tobacco, Inc. | | | 4,420 | |
| | 8,132 | | | Marine Harvest (D)(G) | | | 5,337 | |
| | 21 | | | Nestle S.A. | | | 10,008 | |
| | 4 | | | Nestle S.A. ADR | | | 458 | |
| | 155 | | | PepsiCo, Inc. | | | 10,651 | |
| | 205 | | | Unilever N.V. NY Shares ADR | | | 6,876 | |
| | | | | | | | | |
| | | | | | | | | | | | 62,154 | |
| | | | | | | | | | | | | |
| | | | | | | | | | | | | |
The accompanying notes are an integral part of these financial statements.
127
The Hartford Capital Appreciation II Fund
Schedule of Investments — (continued)
April 30, 2008 (Unaudited)
(000’s Omitted)
| | | | | | | | | | | | | |
| | | | | | | | | Market
| |
| Shares | | | | | | | | Value (W) | |
| | | | | | | | | | | | | |
| COMMON STOCK — (continued) |
| | | | | Energy — 8.8% |
| | 169 | | | Aegean Marine Petroleum Network (G) | | $ | 6,150 | |
| | 350 | | | Brasil EcoDiesel Industria (D) | | | 1,000 | |
| | 100 | | | Canadian Natural Resources Ltd. | | | 8,495 | |
| | 31 | | | Canadian Oil SandsTrust | | | 1,406 | |
| | 408 | | | Chesapeake Energy Corp. | | | 21,082 | |
| | 23 | | | EnCana Corp. | | | 1,880 | |
| | 39 | | | EOG Resources, Inc. | | | 5,152 | |
| | 98 | | | Exxon Mobil Corp. | | | 9,074 | |
| | 210 | | | Halliburton Co. | | | 9,628 | |
| | 17 | | | Hess Corp. | | | 1,841 | |
| | 1 | | | Lukoil ADR | | | 96 | |
| | 57 | | | Lundin Petroleum Ab (D) | | | 797 | |
| | 148 | | | Newfield Exploration Co. (D) | | | 9,011 | |
| | 88 | | | Noble Energy, Inc. | | | 7,613 | |
| | 107 | | | OAO Gazprom Class S ADR | | | 5,666 | |
| | 373 | | | OAO Rosneft Oil Co. (K) | | | 3,659 | |
| | 78 | | | Petro-Canada | | | 3,888 | |
| | 58 | | | Petrohawk Energy Corp. (D) | | | 1,369 | |
| | 64 | | | Petroleo Brasileiro S.A. ADR | | | 7,739 | |
| | 8 | | | Schlumberger Ltd. | | | 784 | |
| | 55 | | | Seadrill Ltd. | | | 1,651 | |
| | 385 | | | Talisman Energy, Inc. | | | 7,838 | |
| | 96 | | | Total S.A. ADR | | | 8,073 | |
| | 14 | | | Transocean, Inc. | | | 2,029 | |
| | 50 | | | UGI Corp. | | | 1,300 | |
| | 19 | | | Weatherford International Ltd. (D) | | | 1,516 | |
| | 52 | | | XTO Energy, Inc. | | | 3,206 | |
| | | | | | | | | |
| | | | | | | | | | | | 131,943 | |
| | | | | | | | | | | | | |
| | | | | Finance — 15.3% |
| | 394 | | | ACE Ltd. | | | 23,734 | |
| | 141 | | | Aetna, Inc. | | | 6,139 | |
| | 52 | | | Affiliated Managers Group, Inc. (D)(G) | | | 5,126 | |
| | 3 | | | Aflac, Inc. | | | 233 | |
| | 390 | | | AMBAC Financial Group, Inc. (G) | | | 1,805 | |
| | 127 | | | American International Group, Inc. | | | 5,876 | |
| | 2 | | | Assurant, Inc. | | | 126 | |
| | 66 | | | Babcock & Brown Air Ltd. (G) | | | 783 | |
| | 166 | | | Banco Bradesco S.A. (G) | | | 3,739 | |
| | 467 | | | Bank of America Corp. | | | 17,543 | |
| | 37 | | | BNP Paribas | | | 3,902 | |
| | 231 | | | Bolsa De Mercadorias e Futuros | | | 2,353 | |
| | 121 | | | Capital One Financial Corp. (G) | | | 6,433 | |
| | 1,126 | | | China Merchants Bank Co., Ltd. | | | 4,701 | |
| | 607 | | | CIT Group, Inc. (G) | | | 6,608 | |
| | 129 | | | Citigroup, Inc. | | | 3,252 | |
| | 53 | | | Deutsche Boerse AG | | | 7,754 | |
| | 6 | | | Discover Financial Services, Inc. | | | 102 | |
| | 9 | | | Eurocastle Investment Ltd. | | | 114 | |
| | 83 | | | Everest Re Group Ltd. | | | 7,468 | |
| | 12 | | | Federal Home Loan Mortgage Corp. | | | 307 | |
| | 239 | | | Federal National Mortgage Association | | | 6,769 | |
| | 27 | | | Franco-Nevada Corp. (D) | | | 473 | |
| | 216 | | | Genesis Lease Ltd. | | | 2,914 | |
| | 299 | | | GLG Partners, Inc. (G) | | | 2,464 | |
| | 44 | | | Goldman Sachs Group, Inc. | | | 8,377 | |
| | 374 | | | Huntington Bancshares, Inc. | | | 3,512 | |
| | 13 | | | ING Groep N.V. ADR | | | 500 | |
| | 4 | | | Invesco Ltd. | | | 113 | |
| | 104 | | | Julius Baer Holding Ltd. | | | 7,610 | |
| | 61 | | | Lehman Brothers Holdings, Inc. (G) | | $ | 2,708 | |
| | 5 | | | Liberty Acquisition Holdings Corp. (D) | | | 53 | |
| | 11 | | | Mastercard, Inc. (G) | | | 3,060 | |
| | 336 | | | MGIC Investment Corp. (G) | | | 4,381 | |
| | 63 | | | MSCI, Inc. (D) | | | 1,951 | |
| | 92 | | | National City Corp. (A)(H) | | | 519 | |
| | 167 | | | Oaktree Capital (D)(I) | | | 4,676 | |
| | 29 | | | ORIX Corp. | | | 5,167 | |
| | 128 | | | Outokumpu Oyj | | | 6,038 | |
| | 312 | | | PennantPark Investment Corp. | | | 2,314 | |
| | 124 | | | Platinum Underwriters Holdings Ltd. | | | 4,430 | |
| | 1,197 | | | Royal Bank of Scotland Group plc | | | 8,103 | |
| | 156 | | | Sovereign Bancorp, Inc. | | | 1,165 | |
| | 179 | | | TD Ameritrade Holding Corp. (D) | | | 3,234 | |
| | 184 | | | UBS AG Rights (D)(H) | | | 311 | |
| | 184 | | | UBS AG (D) | | | 6,192 | |
| | 44 | | | UnionBanCal Corp. | | | 2,326 | |
| | 98 | | | UnitedHealth Group, Inc. | | | 3,201 | |
| | 74 | | | Visa, Inc. (D) | | | 6,167 | |
| | 292 | | | Washington Mutual, Inc. PIPE (A)(H) | | | 3,231 | |
| | 60 | | | Washington Mutual, Inc. (G) | | | 739 | |
| | 2 | | | Wellpoint, Inc. (D) | | | 92 | |
| | 794 | | | Western Union Co. | | | 18,262 | |
| | | | | | | | | |
| | | | | | | | | | | | 229,150 | |
| | | | | | | | | | | | | |
| | | | | Health Care — 13.2% |
| | 15 | | | Abbott Laboratories | | | 817 | |
| | 314 | | | Alkermes, Inc. (D)(G) | | | 3,905 | |
| | 408 | | | Amgen, Inc. (D) | | | 17,096 | |
| | 92 | | | Amylin Pharmaceuticals, Inc. (D)(G) | | | 2,547 | |
| | 6 | | | Arena Pharmaceuticals, Inc. (D) | | | 36 | |
| | 51 | | | Astellas Pharma, Inc. | | | 2,083 | |
| | 69 | | | AstraZeneca plc | | | 2,906 | |
| | 3 | | | Auxilium Pharmaceuticals, Inc. (D) | | | 89 | |
| | 60 | | | Becton, Dickinson & Co. | | | 5,400 | |
| | 62 | | | Bristol-Myers Squibb Co. | | | 1,351 | |
| | 10 | | | Cardinal Health, Inc. | | | 535 | |
| | 177 | | | Cephalon, Inc. (D)(G) | | | 11,077 | |
| | 3 | | | Charles River Laboratories International, Inc. (D) | | | 191 | |
| | 84 | | | Cie Generale d’Optique Essilor International S.A. (D) | | | 5,186 | |
| | 213 | | | Cooper Co., Inc. | | | 7,438 | |
| | 56 | | | Covidien Ltd. | | | 2,605 | |
| | 4 | | | Eisai Co., Ltd. | | | 140 | |
| | 135 | | | Elan Corp. plc ADR (D) | | | 3,555 | |
| | 69 | | | Eli Lilly & Co. | | | 3,309 | |
| | 3 | | | Gilead Sciences, Inc. (D) | | | 159 | |
| | 210 | | | HealthSouth Corp. (D)(G) | | | 4,124 | |
| | 2 | | | ImClone Systems, Inc. (D) | | | 98 | |
| | 232 | | | Impax Laboratories, Inc. (D) | | | 2,145 | |
| | 1 | | | Intuitive Surgical, Inc. (D) | | | 260 | |
| | 384 | | | McKesson Corp. | | | 20,038 | |
| | 74 | | | Medtronic, Inc. | | | 3,591 | |
| | 12 | | | Mindray Medical International Ltd. | | | 400 | |
| | 2 | | | Monsanto Co. | | | 281 | |
| | 42 | | | Novavax, Inc. (D) | | | 100 | |
| | 353 | | | Pharmaceutical Product Development, Inc. | | | 14,601 | |
| | 4 | | | Psychiatric Solutions, Inc. (D) | | | 153 | |
| | 68 | | | Sanofi-Aventis S.A. | | | 5,216 | |
| | 891 | | | Schering-Plough Corp. | | | 16,408 | |
The accompanying notes are an integral part of these financial statements.
128
| | | | | | | | | | | | | |
| | | | | | | | | Market
| |
| Shares | | | | | | | | Value (W) | |
| | | | | | | | | | | | | |
| COMMON STOCK — (continued) |
| | | | | | | | | | | | | |
| | | | | Health Care — (continued) |
| | 594 | | | Shionogi & Co., Ltd. | | $ | 11,474 | |
| | 327 | | | St. Jude Medical, Inc. (D) | | | 14,338 | |
| | 99 | | | Teva Pharmaceutical Industries Ltd. ADR | | | 4,630 | |
| | 4 | | | UCB S.A. (G) | | | 182 | |
| | 22 | | | Walgreen Co. | | | 763 | |
| | 344 | | | Wyeth | | | 15,277 | |
| | 171 | | | Zimmer Holdings, Inc. (D) | | | 12,704 | |
| | | | | | | | | |
| | | | | | | | | | | | 197,208 | |
| | | | | | | | | | | | | |
| | | | | Services — 6.5% |
| | 18 | | | Accenture Ltd. Class A | | | 669 | |
| | 242 | | | Apollo Group, Inc. Class A (D) | | | 12,341 | |
| | 18 | | | Automatic Data Processing, Inc. | | | 817 | |
| | 169 | | | Bare Escentuals, Inc. (D)(G) | | | 3,848 | |
| | 404 | | | BearingPoint, Inc. (D) | | | 748 | |
| | 115 | | | CACI International, Inc. Class A (D) | | | 5,769 | |
| | 491 | | | Comcast Corp. Class A | | | 10,082 | |
| | 689 | | | Comcast Corp. Special Class A | | | 13,952 | |
| | 163 | | | Corrections Corp. of America (D) | | | 4,151 | |
| | 3 | | | DreamWorks Animation SKG, Inc. (D) | | | 84 | |
| | 116 | | | FedEx Corp. | | | 11,083 | |
| | 7 | | | Fluor Corp. | | | 1,124 | |
| | 363 | | | Focus Media Holding Ltd. ADR (D) | | | 13,407 | |
| | 2 | | | ITT Educational Services, Inc. (D) | | | 157 | |
| | 3 | | | Live Nation, Inc. (D) | | | 40 | |
| | 6 | | | Monster Worldwide, Inc. (D) | | | 156 | |
| | 187 | | | News Corp. Class A | | | 3,338 | |
| | 7 | | | Nice Systems Ltd. (D) | | | 228 | |
| | 144 | | | Orascom Hotels & Development (D) | | | 2,272 | |
| | 254 | | | R.H. Donnelley Corp. (D)(G) | | | 1,216 | |
| | 4 | | | Republic Services, Inc. | | | 132 | |
| | 1,329 | | | Shangri-La Asia Ltd. | | | 3,686 | |
| | 94 | | | United Parcel Service, Inc. Class B | | | 6,841 | |
| | 17 | | | Walt Disney Co. | | | 538 | |
| | 15 | | | Waste Management, Inc. | | | 541 | |
| | 17 | | | XM Satellite Radio Holdings, Inc. Class A (D) | | | 190 | |
| | | | | | | | | |
| | | | | | | | | | | | 97,410 | |
| | | | | | | | | | | | | |
| | | | | Technology — 17.5% |
| | 187 | | | ABB Ltd. | | | 5,692 | |
| | 7 | | | Altera Corp. | | | 155 | |
| | 11 | | | Apple, Inc. (D) | | | 1,910 | |
| | 26 | | | Applied Materials, Inc. | | | 479 | |
| | 140 | | | Arrow Electronics, Inc. (D) | | | 3,807 | |
| | 143 | | | ASML Holding N.V. | | | 4,062 | |
| | 3 | | | ASML Holding N.V. ADR | | | 89 | |
| | 19 | | | AT&T, Inc. | | | 725 | |
| | 343 | | | BMC Software, Inc. (D) | | | 11,930 | |
| | 80 | | | Canon, Inc. | | | 4,007 | |
| | 7 | | | Ciena Corp. (D) | | | 237 | |
| | 477 | | | Cisco Systems, Inc. (D) | | | 12,223 | |
| | 8 | | | CMGI, Inc. (D) | | | 110 | |
| | 5 | | | Concur Technologies, Inc. (D) | | | 164 | |
| | 279 | | | Corning, Inc. | | | 7,460 | |
| | 3 | | | Ctrip.Com International Ltd. | | | 188 | |
| | 59 | | | Danaher Corp. | | | 4,619 | |
| | 2 | | | Electronic Arts, Inc. (D) | | | 91 | |
| | 61 | | | Emerson Electric Co. | | | 3,177 | |
| | 6 | | | Equinix, Inc. (D) | | | 533 | |
| | 164 | | | Fairchild Semiconductor International, Inc. (D) | | | 2,141 | |
| | 524 | | | Flextronics International Ltd. (D) | | $ | 5,447 | |
| | 388 | | | FLIR Systems, Inc. (D) | | | 13,321 | |
| | 33 | | | Foxconn International Holdings Ltd. (D) | | | 51 | |
| | 180 | | | General Electric Co. | | | 5,902 | |
| | 6 | | | Google, Inc. (D) | | | 3,454 | |
| | 12 | | | Hologic, Inc. (D) | | | 346 | |
| | 50 | | | International Business Machines Corp. | | | 5,999 | |
| | 1 | | | Itron, Inc. (D) | | | 130 | |
| | 435 | | | JDS Uniphase Corp. (D)(G) | | | 6,225 | |
| | 102 | | | Koninklijke Philips Electronics N.V. | | | 3,836 | |
| | 207 | | | Lam Research Corp. (D) | | | 8,447 | |
| | 2 | | | Leap Wireless International, Inc. (D) | | | 91 | |
| | 135 | | | Lockheed Martin Corp. | | | 14,330 | |
| | 7 | | | Maxim Integrated Products, Inc. | | | 152 | |
| | 370 | | | McAfee, Inc. (D) | | | 12,305 | |
| | 2 | | | MEMC Electronic Materials, Inc. (D) | | | 96 | |
| | 19 | | | Metropcs Communications, Inc. (D) | | | 380 | |
| | 626 | | | Microsoft Corp. | | | 17,859 | |
| | 110 | | | Mine Safety Appliances Co. (G) | | | 4,101 | |
| | 177 | | | MTN Group Ltd. | | | 3,355 | |
| | 18 | | | NetApp, Inc. (D) | | | 436 | |
| | 5 | | | Nokia Corp. | | | 147 | |
| | 146 | | | Nokia Oyj | | | 4,387 | |
| | 7 | | | Nuance Communications, Inc. (D) | | | 144 | |
| | 106 | | | Orascom Telecom Holding SAE GDR | | | 7,921 | |
| | 679 | | | Qualcomm, Inc. | | | 29,339 | |
| | 291 | | | Raytheon Co. | | | 18,596 | |
| | 21 | | | Red Hat, Inc. (D) | | | 436 | |
| | 19 | | | Research In Motion Ltd. (D)(U) | | | 2,319 | |
| | 4 | | | Rockwell Collins, Inc. | | | 222 | |
| | 59 | | | Solar Cayman Ltd. (A)(D)(H) | | | 785 | |
| | 234 | | | Telefonaktiebolaget LM Ericsson ADR (G) | | | 5,895 | |
| | 6 | | | THQ, Inc. (D) | | | 117 | |
| | 370 | | | VeriSign, Inc. (D) | | | 13,322 | |
| | 310 | | | Virgin Media, Inc. (G) | | | 4,002 | |
| | 1,319 | | | Vodafone Group plc | | | 4,173 | |
| | | | | | | | | |
| | | | | | | | | | | | 261,867 | |
| | | | | | | | | | | | | |
| | | | | Transportation — 1.9% |
| | 218 | | | All America Latina Logistica S.A. | | | 2,846 | |
| | 340 | | | British Airways plc (D) | | | 1,517 | |
| | 13 | | | Burlington Northern Santa Fe Corp. | | | 1,313 | |
| | 26 | | | CSX Corp. | | | 1,637 | |
| | 529 | | | Delta Air Lines, Inc. (D)(G) | | | 4,505 | |
| | 91 | | | Grupo Aeroportuario Del ADR | | | 1,977 | |
| | 965 | | | Northwest Airlines Corp. (D) | | | 9,318 | |
| | 86 | | | Ryanair Holdings plc ADR (D) | | | 2,323 | |
| | 276 | | | US Airways Group, Inc. (D) | | | 2,370 | |
| | | | | | | | | |
| | | | | | | | | | | | 27,806 | |
| | | | | | | | | | | | | |
| | | | | Utilities — 0.7% |
| | 63 | | | Exelon Corp. | | | 5,385 | |
| | 104 | | | Progress Energy, Inc. | | | 4,375 | |
| | 6 | | | Sunpower Corp. (D)(G) | | | 481 | |
| | 12 | | | Suntech Power Holdings Co., Ltd. ADR (D) | | | 551 | |
| | | | | | | | | |
| | | | | | | | | | | | 10,792 | |
| | | | | | | | | | | | | |
| | | | | Total common stock
(cost $1,444,444) | | $ | 1,422,121 | |
| | | | | | | | | |
| | | | | | | | | | | | | |
| | | | | | | | | | | | | |
| | | | | | | | | | | | | |
The accompanying notes are an integral part of these financial statements.
129
The Hartford Capital Appreciation II Fund
Schedule of Investments — (continued)
April 30, 2008 (Unaudited)
(000’s Omitted)
| | | | | | | | | | | | | |
| | | | | | | | | Market
| |
| Shares | | | | | | | | Value (W) | |
| WARRANTS — 0.2% |
| | | | | Basic Materials — 0.1% |
| | 71 | | | TATA Steel Ltd. (H) | | $ | 1,443 | |
| | | | | Finance — 0.1% |
| | 479 | | | GLG Partners, Inc. | | | 1,078 | |
| | | | | | | | | |
| | | | | Total warrants
(cost $2,807) | | $ | 2,521 | |
| | | | | | | | | | | | | |
| | | | | | | | | | | | | |
| EXCHANGE TRADED FUNDS — 0.1% |
| | | | | Finance — 0.1% |
| | 12 | | | iShares Russell 3000 Index | | $ | 927 | |
| | | | | | | | | |
| | | | | Total exchange traded funds
(cost $928) | | $ | 927 | |
| | | | | | | | | | | | | |
| | | | | | | | | | | | | |
| PREFERRED STOCK — 0.5% |
| | | | | Finance — 0.5% |
| | — | | | National City Corp. (A)(D)(H)(X) | | $ | 4,423 | |
| | 124 | | | Thornburg Mortgage, Inc. (X) | | | 596 | |
| | — | | | Washington Mutual, Inc. (A)(D)(H)(X) | | | 2,528 | |
| | | | | | | | | |
| | | | | Total preferred stock
(cost $8,886) | | $ | 7,547 | |
| | | | | | | | | |
| | | | | Total long-term investments
(cost $1,457,065) | | $ | 1,433,116 | |
| | | | | | | | | | | | | |
| | | | | | | | | | | | | |
Principal
| | | | | | | | | |
| Amount | | | | | | | | | |
| |
| SHORT-TERM INVESTMENTS — 10.5% |
| | | | | Repurchase Agreements — 3.4% |
| | | | | Banc of America Securities TriParty Joint Repurchase Agreement (maturing on 05/01/2008 in the amount of $18,994, collateralized by FHLMC 5.00%, 2035, value of $19,372) | | | | |
| $ | 18,992 | | | 1.98% dated 04/30/2008 | | $ | 18,992 | |
| | | | | BNP Paribas Securities Corp. TriParty Joint Repurchase Agreement (maturing on 05/01/2008 in the amount of $9,314, collateralized by FNMA 5.50% — 6.50%, 2036 — 2038, value of $9,500) | | | | |
| | 9,314 | | | 2.00% dated 04/30/2008 | | | 9,314 | |
| | | | | Deutsche Bank Securities Joint Repurchase Agreement (maturing on 05/01/2008 in the amount of $19, collateralized by U.S. Treasury Note 3.63%, 2009, value of $19) | | | | |
| | 19 | | | 1.90% dated 04/30/2008 | | | 19 | |
| �� | | | | Deutsche Bank Securities TriParty Joint Repurchase Agreement (maturing on 05/01/2008 in the amount of $11,579, collateralized by FHLMC 4.50% — 7.00%, 2016 — 2038, value of $11,810) | | | | |
| | 11,578 | | | 2.00% dated 04/30/2008 | | | 11,578 | |
| | | | | JP Morgan Chase TriParty Joint Repurchase Agreement (maturing on 05/01/2008 in the amount of $11,159, collateralized by FNMA 4.50% — 7.00%, 2020 — 2038, value of $11,381) | | | | |
| | 11,158 | | | 1.96% dated 04/30/2008 | | | 11,158 | |
| | | | | | | | | |
| | | | | | | | | | | | 51,061 | |
| | | | | | | | | | | | | |
| | | | | | | | | | | | | |
| | | | | | | | | | | | | |
| | | | | | | | | Market
| |
| Shares | | | | | | | | Value (W) | |
| |
| | | | | Securities Purchased with Proceeds from Security Lending — 7.1% |
| | | | | Cash Collateral Reinvestment Fund: |
| | 106,539 | | | Goldman Sachs FS Prime Obligation/Institutional Fund | | $ | 106,539 | |
| | | | | | | | | |
| | | | | Total short-term investments
(cost $157,600) | | $ | 157,600 | |
| | | | | | | | | |
| | | | | Total investments
(cost $1,614,665) (C) | | | 106.5 | % | | $ | 1,590,716 | |
| | | | | Other assets and liabilities | | | (6.5 | )% | | | (96,431 | ) |
| | | | | | | | | | | | | |
| | | | | Total net assets | | | 100.0 | % | | $ | 1,494,285 | |
| | | | | | | | | | | | | |
| |
| Note: | Percentage of investments as shown is the ratio of the total market value to total net assets. Market value of investments in foreign securities represents 28.04% of total net assets at April 30, 2008. |
| | |
| (C) | | At April 30, 2008, the cost of securities for federal income tax purposes was $1,619,256 and the aggregate gross unrealized appreciation and depreciation based on that cost were: |
| | | | | |
| Unrealized Appreciation | | $ | 104,621 | |
| Unrealized Depreciation | | | (133,161 | ) |
| | | | | |
| Net Unrealized Depreciation | | $ | (28,540 | ) |
| | | | | |
| | |
| # | | This security, or a portion of this security, has been segregated to cover funding requirements on investment transactions settling in the future. |
| |
| (A) | | The aggregate value of securities valued in good faith at fair value as determined under policies and procedures established by and under the supervision of the Funds’ Board of Directors at April 30, 2008 was $12,750, which represents 0.85% of total net assets. This calculation excludes securities that are principally traded on certain foreign markets and whose prices were adjusted solely pursuant to a third party pricing service methodology approved by the Board of Directors. |
| |
| (D) | | Currently non-income producing. |
| |
| (G) | | Security is partially on loan at April 30, 2008. |
| |
| (I) | | Securities issued within terms of a private placement memorandum, exempt from registration under Section 144A of the Securities Act of 1933, as amended, and may be sold only to qualified institutional buyers. Pursuant to guidelines adopted by the Board of Directors, these issues are determined to be liquid. The aggregate value of these securities at April 30, 2008 was $7,149, which represents 0.48% of total net assets. |
| |
| (K) | | Securities contain some restrictions as to public resale. These securities comply with Regulation S, rules governing offers and sales made outside the United States without registration under the Securities Act of 1933, and are determined to be liquid. At April 30, 2008, the market value of these securities amounted to $3,659 or 0.24% of net assets. |
| |
| (Q) | | The cost of securities purchased on a when-issued or delayed delivery basis at April 30, 2008 was $273. |
| |
| (X) | | Convertible security. |
The accompanying notes are an integral part of these financial statements.
130
| | |
| (H) | | The following securities are considered illiquid. Illiquid securities are often purchased in private placement transactions, are not registered under the Securities Act of 1933 and may have contractual restrictions on resale. A security may also be considered illiquid if the security lacks a readily available market or if its valuation has not changed for a certain period of time. |
| | | | | | | | | | | |
Period
| | | | | | | | |
Acquired | | Shares/Par | | | Security | | Cost Basis | |
| 06/2007 | | | 1,405 | | | Buck Holdings L.P. | | $ | 1,406 | |
| 04/2008 | | | 92 | | | National City Corp. | | | 458 | |
| 04/2008 | | | — | | | National City Corp. Preferred Stock | | | 3,900 | |
| 03/2007 | | | 59 | | | Solar Cayman Ltd. | | | 878 | |
| 07/2007 – 12/2007 | | | 71 | | | TATA Steel Ltd. - 144A | | | 1,081 | |
| 12/2006 – 04/2008 | | | 184 | | | UBS AG Rights | | | — | |
| 04/2008 | | | — | | | Washington Mutual, Inc. Preferred Stock | | | 2,000 | |
| 04/2008 | | | 292 | | | Washington Mutual, Inc. PIPE - Reg D | | | 2,556 | |
| | |
| | The aggregate value of these securities at April 30, 2008 was $14,504, which represents 0.97% of total net assets. |
| |
| (U) | | At April 30, 2008, securities valued at $117 were designated to cover open call options written as follows (see Note 3h to accompanying Notes to Financial Statements): |
| | | | | | | | | | | | | | | | | | | | | | | | | |
| | | Number of
| | | Exercise
| | | Exercise
| | | Market
| | | Premiums
| | | | |
Issuer | | Contracts* | | | Price | | | Date | | | Value (W) | | | Received | | | | |
| |
| Research in Motion Ltd. | | | 9 | | | $ | 130.00 | | | | Jun, 2008 | | | $ | 5 | | | $ | 4 | | | | | |
| | | | | | | | | | | | | | | | | | | | | | | | | |
| | | | | | | | | | | | | | | $ | 5 | | | $ | 4 | | | | | |
| | | | | | | | | | | | | | | | | | | | | | | | | |
| | |
| | * The number of contracts does not omit 000’s. |
| |
| | PIPE — Private Investment in Public Equity |
Forward Foreign Currency Contracts Outstanding at April 30, 2008
| | | | | | | | | | | | | | | | | |
| | | | | | | | | | | | Unrealized
| |
| | | Market
| | | Contract
| | | Delivery
| | | Appreciation/
| |
Description | | Value (W) | | | Amount | | | Date | | | (Depreciation) | |
| |
| British Pound (Buy) | | $ | 448 | | | $ | 449 | | | | 05/01/08 | | | $ | (1 | ) |
| British Pound (Buy) | | | 200 | | | | 198 | | | | 05/02/08 | | | | 2 | |
| British Pound (Buy) | | | 625 | | | | 624 | | | | 05/06/08 | | | | 1 | |
| British Pound (Sell) | | | 8,292 | | | | 8,212 | | | | 07/31/08 | | | | (80 | ) |
| Canadian Dollar (Buy) | | | 6 | | | | 6 | | | | 05/05/08 | | | | — | |
| Euro (Buy) | | | 408 | | | | 407 | | | | 05/05/08 | | | | 1 | |
| Euro (Sell) | | | 17 | | | | 17 | | | | 05/05/08 | | | | — | |
| Japanese Yen (Sell) | | | 396 | | | | 395 | | | | 05/01/08 | | | | (1 | ) |
| Japanese Yen (Buy) | | | 67 | | | | 67 | | | | 05/02/08 | | | | — | |
| South African Rand (Buy) | | | 273 | | | | 268 | | | | 05/05/08 | | | | 5 | |
| Swiss Franc (Sell) | | | 233 | | | | 233 | | | | 05/02/08 | | | | — | |
| Swiss Franc (Sell) | | | 68 | | | | 68 | | | | 05/05/08 | | | | — | |
| | | | | | | | | | | | | | | | | |
| | | | | | | | | | | | | | | $ | (73 | ) |
| | | | | | | | | | | | | | | | | |
| | |
| (W) | | See Note 2b of accompanying Notes to Financial Statements regarding valuation of securities. |
Diversification by Country
as of April 30, 2008
| | | | | |
| | | Percentage of
|
Country | | Net Assets |
| Australia | | | 0.2 | % |
| |
| |
| Brazil | | | 3.0 | |
| |
| |
| Canada | | | 4.0 | |
| |
| |
| China | | | 1.6 | |
| |
| |
| Egypt | | | 0.7 | |
| |
| |
| Finland | | | 0.8 | |
| |
| |
| France | | | 2.4 | |
| |
| |
| Germany | | | 0.5 | |
| |
| |
| Hong Kong | | | 0.5 | |
| |
| |
| Indonesia | | | 0.4 | |
| |
| |
| Ireland | | | 0.6 | |
| |
| |
| Israel | | | 0.5 | |
| |
| |
| Japan | | | 2.3 | |
| |
| |
| Luxembourg | | | 0.7 | |
| |
| |
| Mexico | | | 0.1 | |
| |
| |
| Netherlands | | | 1.0 | |
| |
| |
| Norway | | | 0.9 | |
| |
| |
| Russia | | | 0.8 | |
| |
| |
| South Africa | | | 0.6 | |
| |
| |
| Sweden | | | 0.7 | |
| |
| |
| Switzerland | | | 2.1 | |
| |
| |
| United Kingdom | | | 3.7 | |
| |
| |
| United States | | | 67.9 | |
| |
| |
| Short-Term Investments | | | 10.5 | |
| |
| |
| Other Assets and Liabilities | | | (6.5 | ) |
| |
| |
Total | | | 100.0 | % |
| |
| |
The accompanying notes are an integral part of these financial statements.
131
The Hartford Checks and Balances Fund
Schedule of Investments
April 30, 2008 (Unaudited)
(000’s Omitted)
| | | | | | | | | | | | | |
| | | | | | | | | Market
| |
| Shares | | | | | | | | Value (W) | |
| AFFILIATED INVESTMENT COMPANIES — 98.2% |
| EQUITY FUNDS — 65.5% |
| | 5,745 | | | The Hartford Capital Appreciation Fund, Class Y | | $ | 240,711 | |
| | 11,719 | | | The Hartford Dividend and Growth Fund, Class Y | | | 240,711 | |
| | | | | | | | | |
| | | | | Total equity funds
(cost $492,646) | | $ | 481,422 | |
| | | | | | | | | | | | | |
| | | | | | | | | | | | | |
| FIXED INCOME FUNDS — 32.7% |
| | 22,722 | | | The Hartford Total Return Bond Fund, Class Y | | $ | 239,943 | |
| | | | | | | | | |
| | | | | Total fixed income funds
(cost $240,419) | | $ | 239,943 | |
| | | | | | | | | |
| | | | | Total investments in affiliated investment companies
(cost $733,065) | | $ | 721,365 | |
| | | | | | | | | |
| | | | | Total investments
(cost $733,065) (C) | | | 98.2 | % | | $ | 721,365 | |
| | | | | Other assets and liabilities | | | 1.8 | % | | | 13,174 | |
| | | | | | | | | | | | | |
| | | | | Total net assets | | | 100.0 | % | | $ | 734,539 | |
| | | | | | | | | | | | | |
| |
| Note: | Percentage of investments as shown is the ratio of the total market value to total net assets. |
| | |
| (C) | | At April 30, 2008, the cost of securities for federal income tax purposes was $733,065 and the aggregate gross unrealized appreciation and depreciation based on that cost were: |
| | | | | |
| Unrealized Appreciation | | $ | — | |
| Unrealized Depreciation | | | (11,700 | ) |
| | | | | |
| Net Unrealized Appreciation | | $ | (11,700 | ) |
| | | | | |
| | |
| (W) | | See Note 2b of accompanying Notes to Financial Statements regarding valuation of securities. |
The accompanying notes are an integral part of these financial statements.
132
The Hartford Conservative Allocation Fund
Schedule of Investments
April 30, 2008 (Unaudited)
(000’s Omitted)
| | | | | | | | | | | | | |
| | | | | | | | | Market
| |
| Shares | | | | | | | | Value (W) | |
| AFFILIATED INVESTMENT COMPANIES — 99.3% |
| EQUITY FUNDS — 39.8% |
| | 656 | | | The Hartford Capital Appreciation Fund, Class Y | | $ | 27,506 | |
| | 261 | | | The Hartford Capital Appreciation II Fund, Class Y | | | 3,592 | |
| | 772 | | | The Hartford Disciplined Equity Fund, Class Y | | | 10,610 | |
| | 1,247 | | | The Hartford Equity Income Fund, Class Y | | | 16,945 | |
| | 343 | | | The Hartford Global Growth Fund, Class Y | | | 6,984 | |
| | 133 | | | The Hartford Growth Fund, Class Y | | | 2,399 | |
| | 264 | | | The Hartford International Opportunities Fund, Class Y | | | 4,645 | |
| | 366 | | | The Hartford International Small Company Fund, Class Y | | | 5,164 | |
| | 237 | | | The Hartford Select MidCap Value Fund, Class Y | | | 2,275 | |
| | 478 | | | The Hartford Select SmallCap Value Fund, Class Y | | | 4,413 | |
| | 175 | | | The Hartford Value Opportunities Fund, Class Y | | | 2,261 | |
| | | | | | | | | |
| | | | | Total equity funds
(cost $87,150) | | $ | 86,794 | |
| | | | | | | | | | | | | |
| | | | | | | | | | | | | |
| FIXED INCOME FUNDS — 58.4% |
| | 1,424 | | | The Hartford Floating Rate Fund, Class Y | | $ | 12,973 | |
| | 286 | | | The Hartford High Yield Fund, Class Y | | | 2,132 | |
| | 2,596 | | | The Hartford Income Fund, Class Y | | | 25,575 | |
| | 2,288 | | | The Hartford Inflation Plus Fund, Class Y | | | 25,673 | |
| | 3,169 | | | The Hartford Short Duration Fund, Class Y | | | 30,234 | |
| | 823 | | | The Hartford Strategic Income Fund, Class Y | | | 7,816 | |
| | 2,170 | | | The Hartford Total Return Bond Fund, Class Y | | | 22,913 | |
| | | | | | | | | |
| | | | | Total fixed income funds
(cost $129,616) | | $ | 127,316 | |
| | | | | | | | | | | | | |
| | | | | | | | | | | | | |
| MONEY MARKET FUNDS — 1.1% |
| | 2,368 | | | The Hartford Money Market Fund, Class Y | | $ | 2,368 | |
| | | | | | | | | |
| | | | | Total money market funds
(cost $2,368) | | $ | 2,368 | |
| | | | | | | | | |
| | | | | Total investments in affiliated investment companies
(cost $219,134) | | $ | 216,478 | |
| | | | | | | | | | | | | |
| | | | | | | | | | | | | |
| EXCHANGE TRADED FUNDS — 0.4% |
| | 6 | | | DJ Wilshire REIT ETF | | $ | 445 | |
| | 9 | | | SPDR DJ Wilshire International Real Estate ETF | | | 484 | |
| | | | | | | | | |
| | | | | Total investments in exchange traded funds
(cost $897) | | $ | 929 | |
| | | | | | | | | |
| | | | | Total investments
(cost $220,031) (C) | | | 99.7 | % | | $ | 217,407 | |
| | | | | Other assets and liabilities | | | 0.3 | % | | | 626 | |
| | | | | | | | | | | | | |
| | | | | Total net assets | | | 100.0 | % | | $ | 218,033 | |
| | | | | | | | | | | | | |
| |
| Note: | Percentage of investments as shown is the ratio of the total market value to total net assets. |
| | |
| (C) | | At April 30, 2008, the cost of securities for federal income tax purposes was $220,461 and the aggregate gross unrealized appreciation and depreciation based on that cost were: |
| | | | | |
| Unrealized Appreciation | | $ | 3,234 | |
| Unrealized Depreciation | | | (6,288 | ) |
| | | | | |
| Net Unrealized Depreciation | | $ | (3,054 | ) |
| | | | | |
| | |
| (W) | | See Note 2b of accompanying Notes to Financial Statements regarding valuation of securities. |
The accompanying notes are an integral part of these financial statements.
133
The Hartford Disciplined Equity Fund
Schedule of Investments
April 30, 2008 (Unaudited)
(000’s Omitted)
| | | | | | | | | | | | | |
| | | | | | | | | Market
| |
| Shares | | | | | | | | Value (W) | |
| COMMON STOCK — 99.0% |
| | | | | Basic Materials — 2.8% |
| | 9 | | | Freeport-McMoRan Copper & Gold, Inc. (G) | | $ | 1,001 | |
| | 43 | | | Kimberly-Clark Corp. | | | 2,752 | |
| | 33 | | | Owens-Illinois, Inc. (D) | | | 1,820 | |
| | 16 | | | United States Steel Corp. (U) | | | 2,480 | |
| | | | | | | | | |
| | | | | | | | | | | | 8,053 | |
| | | | | | | | | | | | | |
| | | | | Capital Goods — 4.4% |
| | 17 | | | Deere & Co. | | | 1,387 | |
| | 42 | | | Northrop Grumman Corp. | | | 3,075 | |
| | 71 | | | Parker-Hannifin Corp. | | | 5,641 | |
| | 191 | | | Xerox Corp. | | | 2,666 | |
| | | | | | | | | |
| | | | | | | | | | | | 12,769 | |
| | | | | | | | | | | | | |
| | | | | Consumer Cyclical — 10.8% |
| | 19 | | | Abercrombie & Fitch Co. Class A | | | 1,448 | |
| | 76 | | | Altria Group, Inc. | | | 1,514 | |
| | 39 | | | BJ’s Wholesale Club, Inc. (D)(G) | | | 1,468 | |
| | 26 | | | Costco Wholesale Corp. | | | 1,852 | |
| | 215 | | | Gap, Inc. | | | 4,001 | |
| | 89 | | | Ingram Micro, Inc. (D) | | | 1,516 | |
| | 73 | | | Kroger Co. | | | 1,981 | |
| | 21 | | | Mosaic Co. (D) | | | 2,524 | |
| | 73 | | | Newell Rubbermaid, Inc. | | | 1,490 | |
| | 73 | | | NIKE, Inc. Class B | | | 4,843 | |
| | 76 | | | Philip Morris International, Inc. (D) | | | 3,863 | |
| | 46 | | | TJX Cos., Inc. | | | 1,495 | |
| | 54 | | | Wal-Mart Stores, Inc. | | | 3,137 | |
| | | | | | | | | |
| | | | | | | | | | | | 31,132 | |
| | | | | | | | | | | | | |
| | | | | Consumer Staples — 4.8% |
| | 38 | | | Bunge Ltd. Finance Corp. (U) | | | 4,335 | |
| | 37 | | | Hormel Foods Corp. | | | 1,454 | |
| | 47 | | | PepsiCo, Inc. | | | 3,187 | |
| | 90 | | | Reynolds American, Inc. | | | 4,863 | |
| | | | | | | | | |
| | | | | | | | | | | | 13,839 | |
| | | | | | | | | | | | | |
| | | | | Energy — 11.9% |
| | 34 | | | Chevron Corp. | | | 3,288 | |
| | 70 | | | ConocoPhillips Holding Co. | | | 6,056 | |
| | 47 | | | Exxon Mobil Corp. | | | 4,328 | |
| | 45 | | | Halliburton Co. | | | 2,062 | |
| | 46 | | | Hess Corp. (U) | | | 4,843 | |
| | 106 | | | Marathon Oil Corp. | | | 4,812 | |
| | 109 | | | Occidental Petroleum Corp. | | | 9,053 | |
| | | | | | | | | |
| | | | | | | | | | | | 34,442 | |
| | | | | | | | | | | | | |
| | | | | Finance — 21.6% |
| | 98 | | | ACE Ltd. | | | 5,920 | |
| | 90 | | | Aetna, Inc. | | | 3,928 | |
| | 77 | | | Allied World Assurance Holdings Ltd. | | | 3,191 | |
| | 101 | | | Assurant, Inc. | | | 6,565 | |
| | 100 | | | Axis Capital Holdings Ltd. | | | 3,388 | |
| | 157 | | | Bank of America Corp. | | | 5,875 | |
| | 16 | | | Blackrock, Inc. (G) | | | 3,128 | |
| | 16 | | | Capital One Financial Corp. | | | 832 | |
| | 66 | | | Everest Re Group Ltd. | | | 5,999 | |
| | 34 | | | Goldman Sachs Group, Inc. | | | 6,526 | |
| | 37 | | | Lehman Brothers Holdings, Inc. (G) | | | 1,646 | |
| | 58 | | | State Street Corp. | | | 4,170 | |
| | 113 | | | UnitedHealth Group, Inc. | | | 3,697 | |
| | 65 | | | Unum Group | | | 1,509 | |
| | 21 | | | Visa, Inc. (D) | | | 1,769 | |
| | 58 | | | Washington Mutual, Inc. PIPE (A)(H) | | | 646 | |
| | 27 | | | Wellpoint, Inc. (D) | | | 1,348 | |
| | 107 | | | Western Union Co. | | | 2,461 | |
| | | | | | | | | |
| | | | | | | | | | | | 62,598 | |
| | | | | | | | | | | | | |
| | | | | Health Care — 12.1% |
| | 27 | | | Abbott Laboratories | | | 1,408 | |
| | 33 | | | Amgen, Inc. (D) | | | 1,373 | |
| | 58 | | | Amylin Pharmaceuticals, Inc. (D)(G) | | | 1,611 | |
| | 181 | | | Bristol-Myers Squibb Co. | | | 3,979 | |
| | 31 | | | Cephalon, Inc. (D)(G) | | | 1,953 | |
| | 27 | | | Coventry Health Care, Inc. (D) | | | 1,194 | |
| | 111 | | | Eli Lilly & Co. | | | 5,334 | |
| | 129 | | | Forest Laboratories, Inc. (D) | | | 4,485 | |
| | 18 | | | Gilead Sciences, Inc. (D) | | | 906 | |
| | 101 | | | McKesson Corp. | | | 5,275 | |
| | 204 | | | Schering-Plough Corp. | | | 3,746 | |
| | 50 | | | Watson Pharmaceuticals, Inc. (D) | | | 1,536 | |
| | 18 | | | Wyeth | | | 783 | |
| | 18 | | | Zimmer Holdings, Inc. (D) | | | 1,365 | |
| | | | | | | | | |
| | | | | | | | | | | | 34,948 | |
| | | | | | | | | | | | | |
| �� | | | | Services — 7.1% |
| | 73 | | | Accenture Ltd. Class A | | | 2,737 | |
| | 23 | | | Apollo Group, Inc. Class A (D) | | | 1,145 | |
| | 84 | | | Autodesk, Inc. (D) | | | 3,177 | |
| | 117 | | | DirecTV Group, Inc. (D) | | | 2,873 | |
| | 59 | | | DISH Network Corp. (D) | | | 1,746 | |
| | 47 | | | Expedia, Inc. (D) | | | 1,180 | |
| | 38 | | | Manpower, Inc. | | | 2,538 | |
| | 46 | | | Viacom, Inc. Class B (D) | | | 1,768 | |
| | 104 | | | Walt Disney Co. | | | 3,363 | |
| | | | | | | | | |
| | | | | | | | | | | | 20,527 | |
| | | | | | | | | | | | | |
| | | | | Technology — 18.8% |
| | 167 | | | Applied Materials, Inc. | | | 3,122 | |
| | 184 | | | AT&T, Inc. | | | 7,116 | |
| | 83 | | | BMC Software, Inc. (D) | | | 2,878 | |
| | 53 | | | CenturyTel, Inc. | | | 1,713 | |
| | 36 | | | Danaher Corp. | | | 2,809 | |
| | 165 | | | Hewlett-Packard Co. | | | 7,638 | |
| | 45 | | | Intel Corp. | | | 1,006 | |
| | 12 | | | International Business Machines Corp. | | | 1,424 | |
| | 118 | | | Lam Research Corp. (D) | | | 4,803 | |
| | 63 | | | Lockheed Martin Corp. | | | 6,702 | |
| | 198 | | | Microsoft Corp. | | | 5,655 | |
| | 81 | | | NetApp, Inc. (D)(U) | | | 1,948 | |
| | 219 | | | Oracle Corp. (D) | | | 4,556 | |
| | 50 | | | Qualcomm, Inc. | | | 2,164 | |
| | 14 | | | Raytheon Co. | | | 864 | |
| | | | | | | | | |
| | | | | | | | | | | | 54,398 | |
| | | | | | | | | | | | | |
| | | | | Utilities — 4.7% |
| | 90 | | | Duke Energy Corp. | | | 1,644 | |
| | 22 | | | Entergy Corp. | | | 2,550 | |
| | 23 | | | Exelon Corp. | | | 1,966 | |
| | 30 | | | FirstEnergy Corp. | | | 2,254 | |
The accompanying notes are an integral part of these financial statements.
134
| | | | | | | | | | | | | |
| | | | | | | | | Market
| |
| Shares | | | | | | | | Value (W) | |
| COMMON STOCK — (continued) |
| | | | | Utilities — (continued) |
| | 53 | | | FPL Group, Inc. | | $ | 3,513 | |
| | 37 | | | Public Service Enterprise Group, Inc. | | | 1,625 | |
| | | | | | | | | |
| | | | | | | | | | | | 13,552 | |
| | | | | | | | | | | | | |
| | | | | Total common stock
(cost $275,298) | | $ | 286,258 | |
| | | | | | | | | | | | | |
| | | | | | | | | | | | | |
| PREFERRED STOCK — 0.2% |
| | | | | Finance — 0.2% |
| | — | | | Washington Mutual, Inc. (A)(D)(H)(X) | | $ | 505 | |
| | | | | | | | | |
| | | | | Total preferred stock
(cost $400) | | $ | 505 | |
| | | | | | | | | |
| | | | | Total long-term investments
(cost $275,698) | | $ | 286,763 | |
| | | | | | | | | | | | | |
| | | | | | | | | | | | | |
Principal
| | | | | | | | | |
| Amount | | | | | | | | | |
| |
| SHORT-TERM INVESTMENTS — 4.0% |
| | | | | Repurchase Agreements — 0.2% |
| | | | | Banc of America Securities TriParty Joint Repurchase Agreement (maturing on 05/01/2008 in the amount of $238, collateralized by FHLMC 5.00%, 2035, value of $242) | | | | |
| $ | 238 | | | 1.98% dated 04/30/2008 | | $ | 238 | |
| | | | | BNP Paribas Securities Corp. TriParty Joint Repurchase Agreement (maturing on 05/01/2008 in the amount of $117, collateralized by FNMA 5.50% — 6.50%, 2036 — 2038, value of $119) | | | | |
| | 116 | | | 2.00% dated 04/30/2008 | | | 116 | |
| | | | | Deutsche Bank Securities Joint Repurchase Agreement (maturing on 05/01/2008 in the amount of $—, collateralized by U. S. Treasury Note 3.63%, 2009, value of $—) | | | | |
| | — | | | 1.90% dated 04/30/2008 | | | — | |
| | | | | Deutsche Bank Securities TriParty Joint Repurchase Agreement (maturing on 05/01/2008 in the amount of $145, collateralized by FHLMC 4.50% — 7.00%, 2016 — 2038, value of $148) | | | | |
| | 145 | | | 2.00% dated 04/30/2008 | | | 145 | |
| | | | | JP Morgan Chase TriParty Joint Repurchase Agreement (maturing on 05/01/2008 in the amount of $140, collateralized by FNMA 4.50% — 7.00%, 2020 — 2038, value of $142) | | | | |
| | 140 | | | 1.96% dated 04/30/2008 | | | 140 | |
| | | | | | | | | |
| | | | | | | | | | | | 639 | |
| | | | | | | | | | | | | |
| | | | | | | | | | | | | |
| | | | | | | | | | | | | |
| | | | | | | | | Market
| |
| Shares | | | | | | | | Value (W) | |
| |
| | | | | Securities Purchased with Proceeds from Security Lending — 3.8% |
| | | | | Cash Collateral Reinvestment Fund: |
| | 11,118 | | | Goldman Sachs FS Prime Obligation/Institutional Fund | | $ | 11,118 | |
| | | | | | | | | |
| | | | | Total short-term investments
(cost $11,757) | | $ | 11,757 | |
| | | | | | | | | |
| | | | | Total investments
(cost $287,455) (C) | | | 103.2 | % | | $ | 298,520 | |
| | | | | Other assets and liabilities | | | (3.2 | )% | | | (9,289 | ) |
| | | | | | | | | | | | | |
| | | | | Total net assets | | | 100.0 | % | | $ | 289,231 | |
| | | | | | | | | | | | | |
| |
| Note: | Percentage of investments as shown is the ratio of the total market value to total net assets. |
| | |
| (C) | | At April 30, 2008, the cost of securities for federal income tax purposes was $287,654 and the aggregate gross unrealized appreciation and depreciation based on that cost were: |
| | | | | |
| Unrealized Appreciation | | $ | 32,197 | |
| Unrealized Depreciation | | | (21,331 | ) |
| | | | | |
| Net Unrealized Appreciation | | $ | 10,866 | |
| | | | | |
| | |
| (A) | | The aggregate value of securities valued in good faith at fair value as determined under policies and procedures established by and under the supervision of the Funds’ Board of Directors at April 30, 2008, was $1,151, which represents 0.40% of total net assets. This calculation excludes securities that are principally traded on certain foreign markets and whose prices were adjusted solely pursuant to a third party pricing service methodology approved by the Board of Directors. |
| |
| (D) | | Currently non-income producing. |
| |
| (G) | | Security is partially on loan at April 30, 2008. |
| |
| (X) | | Convertible security. |
| |
| (H) | | The following securities are considered illiquid. Illiquid securities are often purchased in private placement transactions, are not registered under the Securities Act of 1933 and may have contractual restrictions on resale. A security may also be considered illiquid if the security lacks a readily available market or if its valuation has not changed for a certain period of time. |
| | | | | | | | | | | |
Period
| | | | | | | | |
Acquired | | Shares/Par | | | Security | | Cost Basis | |
| 04/2008 | | | — | | | Washington Mutual, Inc. Preferred Stock | | $ | 400 | |
| 04/2008 | | | 58 | | | Washington Mutual, Inc. PIPE - Reg D | | | 511 | |
| | |
| | The aggregate value of these securities at April 30, 2008 was $1,151 which represents 0.40% of total net assets. |
| | |
| | PIPE — Private Investment in Public Equity |
The accompanying notes are an integral part of these financial statements.
135
The Hartford Disciplined Equity Fund
Schedule of Investments — (continued)
April 30, 2008 (Unaudited)
(000’s Omitted)
| | |
| (U) | | At April 30, 2008, securities valued at $2,349 were designated to cover open call options written as follows (see Note 3 to accompanying Notes to Financial Statements): |
| | | | | | | | | | | | | | | | | | | | | |
| | | Number of
| | | Exercise
| | | Exercise
| | | Market
| | | Premiums
| |
Issuer | | Contracts* | | | Price | | | Date | | | Value (W) | | | Received | |
| |
| Bunge Ltd. | | | 49 | | | $ | 135.00 | | | | May, 2008 | | | $ | 2 | | | $ | 11 | |
| Hess Corp. | | | 55 | | | | 115.00 | | | | May, 2008 | | | | 7 | | | | 12 | |
| NetApp, Inc. | | | 158 | | | | 25.00 | | | | May, 2008 | | | | 8 | | | | 6 | |
| United States Steel Corp. | | | 40 | | | | 165.00 | | | | May, 2008 | | | | 9 | | | | 14 | |
| | | | | | | | | | | | | | | | | | | | | |
| | | | | | | | | | | | | | | $ | 26 | | | $ | 43 | |
| | | | | | | | | | | | | | | | | | | | | |
| | |
| | * The number of contracts does not omit 000’s. |
| |
| | At April 30, 2008, cash at $874 was designated to cover open put options written as follows (see Note 3 to accompanying Notes to Financial Statements): |
| | | | | | | | | | | | | | | | | | | | | |
| | | Number of
| | | Exercise
| | | Exercise
| | | Market
| | | Premiums
| |
Issuer | | Contracts* | | | Price | | | Date | | | Value (W) | | | Received | |
| |
| Lehman Brothers Holdings | | | 36 | | | $ | 35.00 | | | | May, 2008 | | | $ | 1 | | | $ | 7 | |
| | | | | | | | | | | | | | | | | | | | | |
| | | | | | | | | | | | | | | $ | 1 | | | $ | 7 | |
| | | | | | | | | | | | | | | | | | | | | |
| | |
| | * The number of contracts does not omit 000’s. |
| |
| (W) | | See Note 2b of accompanying Notes to Financial Statements regarding valuation of securities. |
The accompanying notes are an integral part of these financial statements.
136
The Hartford Dividend and Growth Fund
Schedule of Investments
April 30, 2008 (Unaudited)
(000’s Omitted)
| | | | | | | | | | | | | |
| | | | | | | | | Market
| |
| Shares | | | | | | | | Value (W) | |
| COMMON STOCK — 95.3% |
| | | | | Basic Materials — 7.3% |
| | 110 | | | AbitibiBowater, Inc. (G) | | $ | 1,091 | |
| | 683 | | | Agrium, Inc. | | | 53,941 | |
| | 587 | | | Alcoa, Inc. | | | 20,409 | |
| | 536 | | | Barrick Gold Corp. | | | 20,700 | |
| | 463 | | | Dow Chemical Co. | | | 18,577 | |
| | 1,023 | | | E.I. DuPont de Nemours & Co. | | | 50,028 | |
| | 1,458 | | | International Paper Co. | | | 38,145 | |
| | 535 | | | Kimberly-Clark Corp. | | | 34,235 | |
| | 685 | | | Pentair, Inc. | | | 25,218 | |
| | 617 | | | Rhodia S.A. (D) | | | 12,847 | |
| | 613 | | | Rohm & Haas Co. (G) | | | 32,760 | |
| | | | | | | | | |
| | | | | | | | | | | | 307,951 | |
| | | | | | | | | | | | | |
| | | | | Capital Goods — 3.7% |
| | 870 | | | Deere & Co. | | | 73,174 | |
| | 394 | | | Illinois Tool Works, Inc. | | | 20,592 | |
| | 136 | | | Parker-Hannifin Corp. | | | 10,852 | |
| | 799 | | | Spirit Aerosystems Holdings, Inc. (D) | | | 23,310 | |
| | 2,093 | | | Xerox Corp. | | | 29,242 | |
| | | | | | | | | |
| | | | | | | | | | | | 157,170 | |
| | | | | | | | | | | | | |
| | | | | Consumer Cyclical — 7.2% |
| | 1,396 | | | Altria Group, Inc. | | | 27,924 | |
| | 447 | | | Avery Dennison Corp. (G) | | | 21,560 | |
| | 1,129 | | | Honda Motor Co., Ltd. ADR | | | 35,858 | |
| | 687 | | | Limited Brands, Inc. | | | 12,729 | |
| | 1,009 | | | Masco Corp. (G) | | | 18,366 | |
| | 146 | | | McDonald’s Corp. | | | 8,699 | |
| | 880 | | | SABMiller plc (G) | | | 20,345 | |
| | 1,562 | | | Staples, Inc. | | | 33,891 | |
| | 1,336 | | | Sysco Corp. (G) | | | 40,848 | |
| | 1,398 | | | Wal-Mart Stores, Inc. | | | 81,039 | |
| | | | | | | | | |
| | | | | | | | | | | | 301,259 | |
| | | | | | | | | | | | | |
| | | | | Consumer Staples — 4.8% |
| | 176 | | | Bunge Ltd. Finance Corp. (G) | | | 20,046 | |
| | 517 | | | Kraft Foods, Inc. | | | 16,343 | |
| | 461 | | | Nestle S.A. ADR | | | 55,018 | |
| | 671 | | | PepsiCo, Inc. | | | 45,984 | |
| | 742 | | | Procter & Gamble Co. | | | 49,759 | |
| | 396 | | | Unilever N.V. NY Shares ADR | | | 13,275 | |
| | | | | | | | | |
| | | | | | | | | | | | 200,425 | |
| | | | | | | | | | | | | |
| | | | | Energy — 18.0% |
| | 904 | | | Anadarko Petroleum Corp. | | | 60,190 | |
| | 211 | | | BP plc ADR | | | 15,322 | |
| | 1,729 | | | Chevron Corp. | | | 166,253 | |
| | 466 | | | ConocoPhillips Holding Co. | | | 40,137 | |
| | 860 | | | EnCana Corp. | | | 69,514 | |
| | 1,545 | | | Exxon Mobil Corp. | | | 143,795 | |
| | 927 | | | Marathon Oil Corp. | | | 42,248 | |
| | 476 | | | Schlumberger Ltd. | | | 47,882 | |
| | 1,291 | | | Total S.A. ADR (G) | | | 108,444 | |
| | 1,068 | | | XTO Energy, Inc. | | | 66,074 | |
| | | | | | | | | |
| | | | | | | | | | | | 759,859 | |
| | | | | | | | | | | | | |
| | | | | Finance — 13.2% |
| | 684 | | | ACE Ltd. | | | 41,214 | |
| | 946 | | | Allstate Corp. | | | 47,656 | |
| | 903 | | | American International Group, Inc. | | | 41,700 | |
| | 2,431 | | | Bank of America Corp. | | | 91,246 | |
| | 647 | | | Capital One Financial Corp. (G) | | | 34,270 | |
| | 1,868 | | | Citigroup, Inc. | | | 47,197 | |
| | 1,055 | | | Federal Home Loan Mortgage Corp. (G) | | | 26,287 | |
| | 711 | | | ING Groep N.V. ADR (G) | | | 27,007 | |
| | 502 | | | MBIA, Inc. | | | 5,223 | |
| | 397 | | | PNC Financial Services Group, Inc. | | | 27,525 | |
| | 408 | | | Prudential Financial, Inc. | | | 30,897 | |
| | 609 | | | State Street Corp. | | | 43,903 | |
| | 662 | | | Synovus Financial Corp. (G) | | | 7,836 | |
| | 1,040 | | | UBS AG Rights (D)(H) | | | 1,756 | |
| | 1,040 | | | UBS AG Rights (D)(G) | | | 34,924 | |
| | 701 | | | US Bancorp | | | 23,764 | |
| | 813 | | | Wachovia Corp. (G) | | | 23,690 | |
| | | | | | | | | |
| | | | | | | | | | | | 556,095 | |
| | | | | | | | | | | | | |
| | | | | Health Care — 10.6% |
| | 1,312 | | | Abbott Laboratories | | | 69,192 | |
| | 991 | | | AstraZeneca plc ADR (G) | | | 41,611 | |
| | 1,629 | | | Bristol-Myers Squibb Co. | | | 35,798 | |
| | 1,707 | | | Eli Lilly & Co. | | | 82,165 | |
| | 1,283 | | | Medtronic, Inc. | | | 62,442 | |
| | 744 | | | Sanofi-Aventis S.A. ADR | | | 28,692 | |
| | 2,629 | | | Schering-Plough Corp. | | | 48,407 | |
| | 404 | | | Teva Pharmaceutical Industries Ltd. ADR (G) | | | 18,899 | |
| | 528 | | | Walgreen Co. | | | 18,387 | |
| | 953 | | | Wyeth | | | 42,398 | |
| | | | | | | | | |
| | | | | | | | | | | | 447,991 | |
| | | | | | | | | | | | | |
| | | | | Services — 8.1% |
| | 1,010 | | | Accenture Ltd. Class A | | | 37,926 | |
| | 831 | | | Automatic Data Processing, Inc. | | | 36,730 | |
| | 1,731 | | | Comcast Corp. Class A | | | 35,575 | |
| | 756 | | | Comcast Corp. Special Class A | | | 15,301 | |
| | 602 | | | FedEx Corp. | | | 57,723 | |
| | 95 | | | McGraw-Hill Cos., Inc. | | | 3,901 | |
| | 820 | | | New York Times Co. Class A (G) | | | 15,986 | |
| | 1,407 | | | Time Warner, Inc. | | | 20,890 | |
| | 213 | | | United Parcel Service, Inc. Class B | | | 15,387 | |
| | 598 | | | Viacom, Inc. Class B (D) | | | 22,978 | |
| | 1,060 | | | Walt Disney Co. | | | 34,360 | |
| | 1,199 | | | Waste Management, Inc. | | | 43,273 | |
| | | | | | | | | |
| | | | | | | | | | | | 340,030 | |
| | | | | | | | | | | | | |
| | | | | Technology — 15.6% |
| | 1,573 | | | Applied Materials, Inc. | | | 29,354 | |
| | 1,145 | | | ASML Holding N.V. ADR (G) | | | 32,468 | |
| | 4,584 | | | AT&T, Inc. | | | 177,443 | |
| | 3,415 | | | General Electric Co. | | | 111,671 | |
| | 930 | | | Intel Corp. | | | 20,702 | |
| | 922 | | | International Business Machines Corp. | | | 111,237 | |
| | 469 | | | Lockheed Martin Corp. | | | 49,712 | |
| | 1,200 | | | Maxim Integrated Products, Inc. | | | 25,234 | |
| | 1,283 | | | Microsoft Corp. | | | 36,591 | |
| | 264 | | | Qualcomm, Inc. | | | 11,415 | |
| | 320 | | | Total System Services, Inc. (G) | | | 7,622 | |
| | 1,116 | | | Verizon Communications, Inc. | | | 42,941 | |
| | | | | | | | | |
| | | | | | | | | | | | 656,390 | |
| | | | | | | | | | | | | |
| | | | | | | | | | | | | |
The accompanying notes are an integral part of these financial statements.
137
The Hartford Dividend and Growth Fund
Schedule of Investments — (continued)
April 30, 2008 (Unaudited)
(000’s Omitted)
| | | | | | | | | | | | | |
| | | | | | | | | Market
| |
| Shares | | | | | | | | Value (W) | |
| | | | | | | | | | | | | |
| COMMON STOCK — (continued) |
| | | | | Transportation — 1.2% |
| | 718 | | | Royal Caribbean Cruises Ltd. (G) | | $ | 22,917 | |
| | 2,177 | | | Southwest Airlines Co. (G) | | | 28,826 | |
| | | | | | | | | |
| | | | | | | | | | | | 51,743 | |
| | | | | | | | | | | | | |
| | | | | Utilities — 5.6% |
| | 1,357 | | | Dominion Resources, Inc. | | | 58,893 | |
| | 937 | | | Exelon Corp. | | | 80,118 | |
| | 880 | | | FPL Group, Inc. | | | 58,342 | |
| | 522 | | | PG&E Corp. | | | 20,872 | |
| | 273 | | | Veolia Environment ADR | | | 19,779 | |
| | | | | | | | | |
| | | | | | | | | | | | 238,004 | |
| | | | | | | | | | | | | |
| | | | | Total common stock
(cost $3,519,738) | | $ | 4,016,917 | |
| PREFERRED STOCK — 0.2% |
| | | | | Finance — 0.2% |
| | — | | | Washington Mutual, Inc. with Warrants (D)(A)(H)(X) | | $ | 10,493 | |
| | | | | | | | | |
| | | | | Total preferred stock
(cost $8,300) | | $ | 10,493 | |
| | | | | | | | | |
| | | | | Total long-term investments
(cost $3,528,038) | | $ | 4,027,410 | |
| | | | | | | | | | | | | |
| | | | | | | | | | | | | |
Principal
| | | | | | | | | |
| Amount | | | | | | | | | |
| |
| SHORT-TERM INVESTMENTS — 12.1% |
| | | | | Repurchase Agreements — 4.0% |
| | | | | Banc of America Securities TriParty Joint Repurchase Agreement (maturing on 05/01/2008 in the amount of $62,313, collateralized by FHLMC 5.00%, 2035, value of $63,556) | | | | |
| $ | 62,310 | | | 1.98% dated 04/30/2008 | | $ | 62,310 | |
| | | | | BNP Paribas Securities Corp. TriParty Joint Repurchase Agreement (maturing on 05/01/2008 in the amount of $30,558, collateralized by FNMA 5.50% — 6.50%, 2036 — 2038, value of $31,167) | | | | |
| | 30,556 | | | 2.00% dated 04/30/2008 | | | 30,556 | |
| | | | | Deutsche Bank Securities Joint Repurchase Agreement (maturing on 05/01/2008 in the amount of $61, collateralized by U. S. Treasury Note 3.63%, 2009, value of $62) | | | | |
| | 61 | | | 1.90% dated 04/30/2008 | | | 61 | |
| | | | | Deutsche Bank Securities TriParty Joint Repurchase Agreement (maturing on 05/01/2008 in the amount of $37,987, collateralized by FHLMC 4.50% — 7.00%, 2016 — 2038, value of $38,745) | | | | |
| | 37,985 | | | 2.00% dated 04/30/2008 | | | 37,985 | |
| | | | | JP Morgan Chase TriParty Joint Repurchase Agreement (maturing on 05/01/2008 in the amount of $36,609, collateralized by FNMA 4.50% — 7.00%, 2020 — 2038, value of $37,339) | | | | |
| | 36,607 | | | 1.96% dated 04/30/2008 | | | 36,607 | |
| | | | | | | | | |
| | | | | | | | | | | | 167,519 | |
| | | | | | | | | | | | | |
| | | | | | | | | | | | | |
| | | | | | | | | | | | | |
| | | | | | | | | Market
| |
| Shares | | | | | | | | Value (W) | |
| |
| | | | | Securities Purchased with Proceeds from Security Lending — 8.1% |
| | | | | Cash Collateral Reinvestment Fund: |
| | 342,027 | | | Goldman Sachs FS Prime Obligation/Institutional Fund | | $ | 342,027 | |
| | | | | | | | | |
| | | | | Total short-term investments
(cost $509,546) | | $ | 509,546 | |
| | | | | | | | | |
| | | | | Total investments
(cost $4,037,584) (C) | | | 107.6 | % | | $ | 4,536,956 | |
| | | | | Other assets and liabilities | | | (7.6 | )% | | | (320,045 | ) |
| | | | | | | | | | | | | |
| | | | | Total net assets | | | 100.0 | % | | $ | 4,216,911 | |
| | | | | | | | | | | | | |
| |
| Note: | Percentage of investments as shown is the ratio of the total market value to total net assets. Market value of investments in foreign securities represents 14.50% of total net assets at April 30, 2008. |
| | |
| (C) | | At April 30, 2008, the cost of securities for federal income tax purposes was $4,040,244 and the aggregate gross unrealized appreciation and depreciation based on that cost were: |
| | | | | |
| Unrealized Appreciation | | $ | 730,046 | |
| Unrealized Depreciation | | | (233,334 | ) |
| | | | | |
| Net Unrealized Appreciation | | $ | 496,712 | |
| | | | | |
| | |
| (A) | | The aggregate value of securities valued in good faith at fair value as determined under policies and procedures established by and under the supervision of the Funds’ Board of Directors at April 30, 2008, was $10,493, which represents 0.25% of total net assets. This calculation excludes securities that are principally traded on certain foreign markets and whose prices were adjusted solely pursuant to a third party pricing service methodology approved by the Board of Directors. |
| |
| (D) | | Currently non-income producing. |
| |
| (X) | | Convertible security. |
| |
| (G) | | Security is partially on loan at April 30, 2008. |
| |
| (H) | | The following securities are considered illiquid. Illiquid securities are often purchased in private placement transactions, are not registered under the Securities Act of 1933 and may have contractual restrictions on resale. A security may also be considered illiquid if the security lacks a readily available market or if its valuation has not changed for a certain period of time. |
| | | | | | | | | | | |
Period
| | | | | | | | |
Acquired | | Shares/Par | | | Security | | Cost Basis | |
| 01/2004 – 01/2008 | | | 1,040 | | | UBS AG Rights | | $ | — | |
| 04/2008 | | | — | | | Washington Mutual, Inc. Preferred Stock | | | 8,300 | |
| | |
| | The aggregate value of these securities at April 30, 2008 was $12,249 which represents 0.29% of total net assets. |
| |
| (W) | | See Note 2b of accompanying Notes to Financial Statements regarding valuation of securities. |
The accompanying notes are an integral part of these financial statements.
138
The Hartford Equity Growth Allocation Fund
Schedule of Investments
April 30, 2008 (Unaudited)
(000’s Omitted)
| | | | | | | | | | | | | |
| | | | | | | | | Market
| |
| Shares | | | | | | | | Value (W) | |
| AFFILIATED INVESTMENT COMPANIES — 99.1% |
| EQUITY FUNDS — 99.1% |
| | 1,582 | | | The Hartford Capital Appreciation Fund, Class Y | | $ | 66,278 | |
| | 114 | | | The Hartford Capital Appreciation II Fund, Class Y | | | 1,570 | |
| | 1,523 | | | The Hartford Disciplined Equity Fund, Class Y | | | 20,921 | |
| | 96 | | | The Hartford Dividend and Growth Fund, Class Y | | | 1,963 | |
| | 883 | | | The Hartford Equity Income Fund, Class Y | | | 11,996 | |
| | 979 | | | The Hartford Global Growth Fund, Class Y | | | 19,955 | |
| | 189 | | | The Hartford Growth Fund, Class Y | | | 3,421 | |
| | 588 | | | The Hartford Growth Opportunities Fund, Class Y | | | 17,673 | |
| | 1,010 | | | The Hartford International Opportunities Fund, Class Y | | | 17,744 | |
| | 1,335 | | | The Hartford International Small Company Fund, Class Y | | | 18,806 | |
| | 1,318 | | | The Hartford Select MidCap Value Fund, Class Y | | | 12,622 | |
| | 2,319 | | | The Hartford Select SmallCap Value Fund, Class Y | | | 21,400 | |
| | 772 | | | The Hartford Small Company Fund, Class Y | | | 15,525 | |
| | 183 | | | The Hartford Stock Fund, Class Y | | | 4,085 | |
| | 4,156 | | | The Hartford Value Fund, Class Y | | | 51,534 | |
| | | | | | | | | |
| | | | | Total investments in affiliated investment companies
(cost $287,682) | | $ | 285,493 | |
| | | | | | | | | | | | | |
| | | | | | | | | | | | | |
| EXCHANGE TRADED FUNDS — 0.8% |
| | 43 | | | SPDR DJ Wilshire International Real Estate ETF | | $ | 2,398 | |
| | | | | | | | | |
| | | | | Total investments in exchange traded funds
(cost $2,330) | | $ | 2,398 | |
| | | | | | | | | |
| | | | | Total investments
(cost $290,012) (C) | | | 99.9 | % | | $ | 287,891 | |
| | | | | Other assets and liabilities | | | 0.1 | % | | | 197 | |
| | | | | | | | | | | | | |
| | | | | Total net assets | | | 100.0 | % | | $ | 288,088 | |
| | | | | | | | | | | | | |
| |
| Note: | Percentage of investments as shown is the ratio of the total market value to total net assets. |
| | |
| (C) | | At April 30, 2008, the cost of securities for federal income tax purposes was $290,012 and the aggregate gross unrealized appreciation and depreciation based on that cost were: |
| | | | | |
| Unrealized Appreciation | | $ | 8,075 | |
| Unrealized Depreciation | | | (10,196 | ) |
| | | | | |
| Net Unrealized Depreciation | | $ | (2,121 | ) |
| | | | | |
| | |
| (W) | | See Note 2b of accompanying Notes to Financial Statements regarding valuation of securities. |
The accompanying notes are an integral part of these financial statements.
139
The Hartford Equity Income Fund
Schedule of Investments
April 30, 2008 (Unaudited)
(000’s Omitted)
| | | | | | | | | | | | | |
| | | | | | | | | Market
| |
| Shares | | | | | | | | Value (W) | |
| COMMON STOCK — 96.5% |
| | | | | Basic Materials — 7.5% |
| | 150 | | | Air Products and Chemicals, Inc. | | $ | 14,715 | |
| | 333 | | | Dow Chemical Co. | | | 13,379 | |
| | 225 | | | E.I. DuPont de Nemours & Co. | | | 10,990 | |
| | 330 | | | International Paper Co. | | | 8,628 | |
| | 275 | | | Kimberly-Clark Corp. | | | 17,606 | |
| | 118 | | | PPG Industries, Inc. | | | 7,237 | |
| | | | | | | | | |
| | | | | | | | | | | | 72,555 | |
| | | | | | | | | | | | | |
| | | | | Capital Goods — 0.9% |
| | 110 | | | 3M Co. | | | 8,482 | |
| | | | | Consumer Cyclical — 5.8% |
| | 488 | | | Altria Group, Inc. | | | 9,762 | |
| | 267 | | | Genuine Parts Co. | | | 11,354 | |
| | 136 | | | McDonald’s Corp. | | | 8,115 | |
| | 356 | | | Philip Morris International, Inc. (D) | | | 18,146 | |
| | 241 | | | Supervalu, Inc. | | | 7,977 | |
| | | | | | | | | |
| | | | | | | | | | | | 55,354 | |
| | | | | | | | | | | | | |
| | | | | Consumer Staples — 7.4% |
| | 138 | | | Colgate-Palmolive Co. | | | 9,735 | |
| | 372 | | | ConAgra Foods, Inc. | | | 8,762 | |
| | 98 | | | Diageo plc ADR | | | 8,059 | |
| | 219 | | | General Mills, Inc. | | | 13,254 | |
| | 13 | | | Kellogg Co. | | | 678 | |
| | 76 | | | Nestle S.A. ADR | | | 9,078 | |
| | 179 | | | PepsiCo, Inc. | | | 12,253 | |
| | 292 | | | Unilever N.V. NY Shares ADR | | | 9,777 | |
| | | | | | | | | |
| | | | | | | | | | | | 71,596 | |
| | | �� | | | | | | | | | | |
| | | | | Energy — 18.4% |
| | 287 | | | BP plc ADR | | | 20,862 | |
| | 545 | | | Chevron Corp. | | | 52,411 | |
| | 293 | | | ConocoPhillips Holding Co. | | | 25,230 | |
| | 546 | | | Exxon Mobil Corp. | | | 50,809 | |
| | 95 | | | Royal Dutch Shell plc ADR | | | 7,605 | |
| | 239 | | | Total S.A. ADR (G) | | | 20,084 | |
| | | | | | | | | |
| | | | | | | | | | | | 177,001 | |
| | | | | | | | | | | | | |
| | | | | Finance — 23.6% |
| | 180 | | | ACE Ltd. | | | 10,853 | |
| | 389 | | | Allstate Corp. | | | 19,570 | |
| | 818 | | | Bank of America Corp. | | | 30,701 | |
| | 352 | | | Bank of New York Mellon Corp. | | | 15,329 | |
| | 306 | | | Chubb Corp. | | | 16,217 | |
| | 593 | | | Citigroup, Inc. | | | 14,988 | |
| | 785 | | | Host Hotels & Resorts, Inc. (G) | | | 13,497 | |
| | 569 | | | JP Morgan Chase & Co. | | | 27,132 | |
| | 443 | | | Lloyd’s TSB Group plc ADR (G) | | | 15,168 | |
| | 23 | | | M&T Bank Corp. (G) | | | 2,182 | |
| | 187 | | | Morgan Stanley | | | 9,078 | |
| | 266 | | | PNC Financial Services Group, Inc. | | | 18,470 | |
| | 814 | | | US Bancorp | | | 27,579 | |
| | 216 | | | Wells Fargo & Co. | | | 6,413 | |
| | | | | | | | | |
| | | | | | | | | | | | 227,177 | |
| | | | | | | | | | | | | |
| | | | | Health Care — 8.3% |
| | 248 | | | Abbott Laboratories | | | 13,103 | |
| | 223 | | | Baxter International, Inc. | | | 13,920 | |
| | 505 | | | Bristol-Myers Squibb Co. | | | 11,086 | |
| | 248 | | | Eli Lilly & Co. | | | 11,929 | |
| | 171 | | | GlaxoSmithKline plc ADR | | | 7,561 | |
| | 617 | | | Pfizer, Inc. | | | 12,412 | |
| | 233 | | | Wyeth | | | 10,342 | |
| | | | | | | | | |
| | | | | | | | | | | | 80,353 | |
| | | | | | | | | | | | | |
| | | | | Services — 0.9% |
| | 251 | | | Waste Management, Inc. | | | 9,065 | |
| | | | | Technology — 12.2% |
| | 859 | | | AT&T, Inc. | | | 33,235 | |
| | 1,242 | | | General Electric Co. | | | 40,617 | |
| | 729 | | | Intel Corp. | | | 16,219 | |
| | 113 | | | Schneider Electric S.A. | | | 13,703 | |
| | 370 | | | Verizon Communications, Inc. | | | 14,248 | |
| | | | | | | | | |
| | | | | | | | | | | | 118,022 | |
| | | | | | | | | | | | | |
| | | | | Utilities — 11.5% |
| | 270 | | | American Electric Power Co., Inc. | | | 12,068 | |
| | 408 | | | Consolidated Edison, Inc. (G) | | | 16,985 | |
| | 466 | | | Dominion Resources, Inc. | | | 20,215 | |
| | 105 | | | Entergy Corp. | | | 12,014 | |
| | 117 | | | Exelon Corp. | | | 9,976 | |
| | 444 | | | FPL Group, Inc. | | | 29,436 | |
| | 155 | | | SCANA Corp. | | | 6,120 | |
| | 103 | | | Southern Co. (G) | | | 3,816 | |
| | | | | | | | | |
| | | | | | | | | | | | 110,630 | |
| | | | | | | | | | | | | |
| | | | | Total common stock
(cost $857,492) | | $ | 930,235 | |
| | | | | | | | | | | | | |
| | | | | | | | | | | | | |
Principal
| | | | | | | | | |
| Amount | | | | | | | | | |
| |
| SHORT-TERM INVESTMENTS — 4.6% |
| | | | | Repurchase Agreements — 2.8% |
| | | | | Banc of America Securities TriParty Joint Repurchase Agreement (maturing on 05/01/2008 in the amount of $10,053, collateralized by FHLMC 5.00%, 2035, value of $10,253) | | | | |
| $ | 10,052 | | | 1.98% dated 04/30/2008 | | $ | 10,052 | |
| | | | | BNP Paribas Securities Corp. TriParty Joint Repurchase Agreement (maturing on 05/01/2008 in the amount of $4,930, collateralized by FNMA 5.50% — 6.50%, 2036 — 2038, value of $5,028) | | | | |
| | 4,929 | | | 2.00% dated 04/30/2008 | | | 4,929 | |
| | | | | Deutsche Bank Securities Joint Repurchase Agreement (maturing on 05/01/2008 in the amount of $10, collateralized by U. S. Treasury Note 3.63%, 2009, value of $10) | | | | |
| | 10 | | | 1.90% dated 04/30/2008 | | | 10 | |
| | | | | Deutsche Bank Securities TriParty Joint Repurchase Agreement (maturing on 05/01/2008 in the amount of $6,128, collateralized by FHLMC 4.50% — 7.00%, 2016 — 2038, value of $6,251) | | | | |
| | 6,128 | | | 2.00% dated 04/30/2008 | | | 6,128 | |
The accompanying notes are an integral part of these financial statements.
140
| | | | | | | | | | | | | |
Principal
| | | | | | | | Market
| |
| Amount | | | | | | | | Value (W) | |
| |
| | | | | | | | | | | | | |
| SHORT-TERM INVESTMENTS — (continued) |
| | | | | | | | | | | | | |
| | | | | Repurchase Agreements — (continued) |
| | | | | JP Morgan Chase TriParty Joint Repurchase Agreement (maturing on 05/01/2008 in the amount of $5,906, collateralized by FNMA 4.50% — 7.00%, 2020 — 2038, value of $6,024) | | | | |
| $ | 5,906 | | | 1.96% dated 04/30/2008 | | $ | 5,906 | |
| | | | | | | | | |
| | | | | | | | | | | | 27,025 | |
| | | | | | | | | | | | | |
| | | | | Securities Purchased with Proceeds from Security Lending — 1.8% |
| | | | | Cash Collateral Reinvestment Fund: |
| $ | 17,370 | | | Goldman Sachs FS Prime Obligation/Institutional Fund | | | 17,370 | |
| | | | | | | | | |
| | | | | Total short-term investments
(cost $44,395) | | $ | 44,395 | |
| | | | | | | | | |
| | | | | Total investments
(cost $901,887) (C) | | | 101.1 | % | | $ | 974,630 | |
| | | | | Other assets and liabilities | | | (1.1 | )% | | | (10,395 | ) |
| | | | | | | | | | | | | |
| | | | | Total net assets | | | 100.0 | % | | $ | 964,235 | |
| | | | | | | | | | | | | |
| |
| Note: | Percentage of investments as shown is the ratio of the total market value to total net assets. Market value of investments in foreign securities represents 11.60% of total net assets at April 30, 2008. |
| | |
| | Foreign securities that are principally traded on certain foreign markets are adjusted daily pursuant to a third party pricing service methodology approved by the Board of Directors in order to reflect an adjustment for factors occurring after the close of the foreign market but before the close of the New York Stock Exchange. |
| |
| (C) | | At April 30, 2008, the cost of securities for federal income tax purposes was $901,949 and the aggregate gross unrealized appreciation and depreciation based on that cost were: |
| | | | | |
| Unrealized Appreciation | | $ | 110,399 | |
| Unrealized Depreciation | | | (37,718 | ) |
| | | | | |
| Net Unrealized Appreciation | | $ | 72,681 | |
| | | | | |
| | |
| (D) | | Currently non-income producing. |
| |
| (G) | | Security is partially on loan at April 30, 2008. |
| |
| (W) | | See Note 2b of accompanying Notes to Financial Statements regarding valuation of securities. |
The accompanying notes are an integral part of these financial statements.
141
The Hartford Floating Rate Fund
Schedule of Investments
April 30, 2008 (Unaudited)
(000’s Omitted)
| | | | | | | | | | | | | |
Principal
| | | | | | | | Market
| |
| Amount | | | | | | | | Value (W) | |
| ASSET & COMMERCIAL MORTGAGE BACKED SECURITIES — 0.7% |
| | | | | Finance — 0.7% |
| | | | | Bayview Financial Acquisition Trust | | | | |
| $ | 2,600 | | | 5.04%, 05/28/2037 (H)(L) | | $ | 910 | |
| | | | | Goldman Sachs Mortgage Securities Corp. | | | | |
| | 17,001 | | | 4.24%, 02/01/2009 (H)(L) | | | 16,066 | |
| | | | | Helios Finance L.P. | | | | |
| | 5,000 | | | 4.89%, 10/20/2014 (H)(L) | | | 3,141 | |
| | | | | Structured Asset Securities Corp. | | | | |
| | 4,453 | | | 5.39%, 02/25/2037 (H)(L) | | | 487 | |
| | | | | Wells Fargo Home Equity Trust | | | | |
| | 4,363 | | | 5.15%, 03/25/2037 (H)(L) | | | 443 | |
| | | | | | | | | |
| | | | | Total asset & commercial mortgage backed securities (cost $33,150) | | $ | 21,047 | |
| | | | | | | | | | | | | |
| | | | | | | | | | | | | |
| CORPORATE BONDS: NON-INVESTMENT GRADE — 4.3% |
| | | | | Basic Materials — 0.9% |
| | | | | Berry Plastics Holding Co. | | | | |
| $ | 2,000 | | | 8.88%, 09/15/2014 # | | $ | 1,870 | |
| | | | | Bowater, Inc. | | | | |
| | 5,000 | | | 5.80%, 03/15/2010 (L)# | | | 3,375 | |
| | | | | Freeport-McMoRan Copper & Gold, Inc. | | | | |
| | 6,000 | | | 5.88%, 04/01/2015 (L) | | | 6,060 | |
| | | | | Georgia-Pacific Corp. | | | | |
| | 2,115 | | | 7.00%, 01/15/2015 (I) | | | 2,094 | |
| | | | | Graham Packaging Co., Inc. | | | | |
| | 2,000 | | | 8.50%, 10/15/2012 | | | 1,960 | |
| | | | | New Page Corp. | | | | |
| | 3,350 | | | 10.00%, 05/01/2012 (I) | | | 3,576 | |
| | | | | Norske Skog Canada Ltd. | | | | |
| | 7,750 | | | 8.63%, 06/15/2011 # | | | 6,646 | |
| | | | | | | | | |
| | | | | | | | | | | | 25,581 | |
| | | | | | | | | | | | | |
| | | | | Consumer Cyclical — 0.5% |
| | | | | Aramark Corp. | | | | |
| | 4,915 | | | 5.00%, 06/01/2012 # | | | 4,423 | |
| | | | | AutoNation, Inc. | | | | |
| | 1,490 | | | 4.71%, 04/15/2013 (L)# | | | 1,287 | |
| | | | | Dollarama Group L.P. | | | | |
| | 5,000 | | | 8.88%, 08/15/2012 | | | 4,700 | |
| | | | | Masonite International Corp. | | | | |
| | 4,000 | | | 11.00%, 04/06/2015 # | | | 2,700 | |
| | | | | | | | | |
| | | | | | | | | | | | 13,110 | |
| | | | | | | | | | | | | |
| | | | | Consumer Staples — 0.1% |
| | | | | Dole Food Co., Inc. | | | | |
| | 4,000 | | | 8.63%, 05/01/2009 | | | 3,870 | |
| | | | | Finance — 0.6% |
| | | | | Ford Motor Credit Co. | | | | |
| | 11,000 | | | 5.46%, 01/13/2012 (L) | | | 9,250 | |
| | | | | General Motors Acceptance Corp. | | | | |
| | 2,000 | | | 5.63%, 05/15/2009 | | | 1,880 | |
| | | | | LPL Holdings, Inc. | | | | |
| | 1,000 | | | 10.75%, 12/15/2015 (H) | | | 980 | |
| | | | | Rent-A-Center, Inc. | | | | |
| | 2,000 | | | 7.50%, 05/01/2010 | | | 1,960 | |
| | | | | United Rentals North America, Inc. | | | | |
| | 5,000 | | | 6.50%, 02/15/2012 | | | 4,688 | |
| | | | | | | | | |
| | | | | | | | | | | | 18,758 | |
| | | | | | | | | | | | | |
| | | | | Health Care — 0.5% |
| | | | | HCA, Inc. | | | | |
| | 7,000 | | | 6.30%, 10/01/2012 # | | | 6,562 | |
| | | | | Invacare Corp. | | | | |
| | 4,000 | | | 9.75%, 02/15/2015 | | | 4,010 | |
| | | | | Rite Aid Corp. | | | | |
| | 5,000 | | | 6.13%, 12/15/2008 (I) | | | 4,900 | |
| | | | | | | | | |
| | | | | | | | | | | | 15,472 | |
| | | | | | | | | | | | | |
| | | | | Services — 0.7% |
| | | | | Affinion Group, Inc. | | | | |
| | 1,305 | | | 11.50%, 10/15/2015 | | | 1,281 | |
| | | | | Echostar DBS Corp. | | | | |
| | 5,000 | | | 7.00%, 10/01/2013 | | | 4,987 | |
| | | | | FireKeepers Development Authority | | | | |
| | 800 | | | 13.88%, 05/01/2015 (I)(Q) | | | 812 | |
| | | | | Harrah’s Operating Co., Inc. | | | | |
| | 8,770 | | | 10.75%, 02/01/2016 — 02/01/2018 (I) | | | 7,474 | |
| | | | | SunGard Data Systems, Inc. | | | | |
| | 6,000 | | | 10.25%, 08/15/2015 | | | 6,375 | |
| | | | | | | | | |
| | | | | | | | | | | | 20,929 | |
| | | | | | | | | | | | | |
| | | | | Technology — 1.0% |
| | | | | Centennial Communications Corp. | | | | |
| | 3,865 | | | 8.45%, 01/01/2013 (L) | | | 3,681 | |
| | | | | CSC Holdings, Inc. | | | | |
| | 5,000 | | | 7.63%, 04/01/2011 # | | | 5,037 | |
| | | | | Level 3 Financing, Inc. | | | | |
| | 2,000 | | | 6.70%, 02/15/2015 (L) | | | 1,600 | |
| | | | | Mediacom LLC | | | | |
| | 1,845 | | | 7.88%, 02/15/2011 | | | 1,744 | |
| | | | | MetroPCS Wireless, Inc. | | | | |
| | 3,000 | | | 9.25%, 11/01/2014 | | | 2,948 | |
| | | | | NXP B.V./NXP Funding LLC | | | | |
| | 8,385 | | | 5.46%, 10/15/2013 (L) | | | 7,714 | |
| | | | | Windstream Corp. | | | | |
| | 5,000 | | | 8.63%, 08/01/2016 | | | 5,238 | |
| | | | | | | | | |
| | | | | | | | | | | | 27,962 | |
| | | | | | | | | | | | | |
| | | | | Total corporate bonds: non-investment grade
(cost $130,072) | | $ | 125,682 | |
| | | | | | | | | | | | | |
| | | | | | | | | | | | | |
| SENIOR FLOATING RATE INTERESTS: NON-INVESTMENT GRADE (V) — 87.7% |
| | | | | Basic Materials — 11.1% |
| | | | | Arizona Chemical Co. | | | | |
| $ | 6,555 | | | 5.28%, 02/27/2013 (N) | | $ | 5,113 | |
| | 8,250 | | | 8.59%, 02/27/2014 (N) | | | 4,950 | |
| | | | | Berry Plastics Holding Co. | | | | |
| | 18,995 | | | 5.10%, 04/03/2015 (N) | | | 17,305 | |
| | | | | Blount, Inc. | | | | |
| | 4,013 | | | 4.46%, 06/09/2010 (N) | | | 3,819 | |
| | | | | Boise Paper Holdings LLC | | | | |
| | 4,500 | | | 11.00%, 02/20/2015 (N) | | | 4,365 | |
| | | | | Brenntag Group | | | | |
| | 10,000 | | | 7.79%, 12/22/2012 (N) | | | 8,100 | |
| | | | | Brenntag Group, Acquisition Term | | | | |
| | 589 | | | 5.79%, 01/12/2014 (N) | | | 548 | |
| | | | | Brenntag Group, Term Loan B2 | | | | |
| | 2,411 | | | 5.79%, 01/12/2014 (N) | | | 2,258 | |
The accompanying notes are an integral part of these financial statements.
142
| | | | | | | | | | | | | |
Principal
| | | | | | | | Market
| |
| Amount (B) | | | | | | | | Value (W) | |
| |
| | | | | | | | | | | | | |
| SENIOR FLOATING RATE INTERESTS: NON-INVESTMENT GRADE (V) — (continued) |
| | | | | | | | | | | | | |
| | | | | Basic Materials — (continued) |
| | | | | Calumet Lubricants Co. L.P. | | | | |
| $ | 805 | | | 6.53%, 12/17/2014 (N) | | $ | 760 | |
| | 6,180 | | | 7.07%, 12/17/2014 (N) | | | 5,809 | |
| | | | | Celanese U.S. Holdings LLC, Letter of Credit | | | | |
| | 2,368 | | | 2.70%, 03/30/2014 (N) | | | 2,286 | |
| | | | | Celanese U.S. Holdings LLC, Term Loan B | | | | |
| | 9,481 | | | 4.19%, 03/30/2014 (N) | | | 9,175 | |
| | | | | Cenveo, Inc., Delayed Draw Term Loan | | | | |
| | 291 | | | 4.35%, 03/16/2014 (N) | | | 266 | |
| | | | | Cenveo, Inc., Term Loan C | | | | |
| | 13,543 | | | 4.35%, 06/21/2013 (N) | | | 12,578 | |
| | | | | Coffeyville Resources | | | | |
| | 8,683 | | | 5.45%, 12/21/2013 (N) | | | 8,176 | |
| | 2,676 | | | 5.95%, 12/21/2010 (AA) | | | 2,488 | |
| | | | | Cognis GMBH | | | | |
| | 11,000 | | | 4.80%, 05/04/2014 (N) | | | 9,845 | |
| EUR | 1,000 | | | 6.61%, 05/04/2014 (N) | | | 1,411 | |
| | | | | Columbian Chemicals Co. | | | | |
| | 10,120 | | | 5.20%, 03/15/2013 (N) | | | 9,108 | |
| | | | | Georgia-Pacific Corp. | | | | |
| | 5,092 | | | 4.68%, 02/14/2013 (N) | | | 4,886 | |
| | 14,994 | | | 4.73%, 02/14/2013 (N) | | | 14,372 | |
| | | | | Goodyear Engineered Products | | | | |
| | 1,122 | | | 5.37%, 07/31/2014 (N) | | | 926 | |
| | 7,836 | | | 5.40%, 07/31/2014 (N) | | | 6,464 | |
| | 4,000 | | | 5.75%, 07/31/2015 (N) | | | 2,320 | |
| | | | | Goodyear Tire & Rubber Co. | | | | |
| | 21,750 | | | 4.54%, 04/18/2014 (N) | | | 20,681 | |
| | | | | Graham Packaging Co., Inc. | | | | |
| | 14,452 | | | 5.04%, 04/03/2014 (N) | | | 13,784 | |
| | | | | Graphic Packaging Corp. | | | | |
| | 7,270 | | | 4.80%, 08/08/2010 (N) | | | 6,982 | |
| | | | | Hexion Specialty Chemicals | | | | |
| | 18,052 | | | 4.94%, 05/15/2013 (N) | | | 17,082 | |
| | 1,478 | | | 5.38%, 05/15/2013 (N) | | | 1,395 | |
| EUR | 1,870 | | | 6.98%, 05/05/2013 (N) | | | 2,722 | |
| | | | | Hexion Specialty Chemicals, Term Loan C2 | | | | |
| | 3,923 | | | 5.00%, 05/15/2013 (N) | | | 3,704 | |
| | | | | Hexion Specialty Chemicals, Term Loan C5 | | | | |
| | 993 | | | 5.00%, 05/05/2013 (N) | | | 937 | |
| | | | | Huntsman International LLC | | | | |
| | 23,960 | | | 4.64%, 04/23/2014 (N) | | | 23,186 | |
| | | | | Ineos Group | | | | |
| | 6,974 | | | 4.88%, 12/16/2014 (N) | | | 6,499 | |
| | 7,046 | | | 5.38%, 02/01/2013 (N) | | | 6,574 | |
| | | | | Ineos Group Holdings plc | | | | |
| EUR | 500 | | | 8.46%, 06/16/2015 (N) | | | 637 | |
| | | | | Intertape Polymer Group, Inc. | | | | |
| | 110 | | | 4.65%, 07/28/2011 (AA)# | | | 107 | |
| | | | | ISP Chemco LLC | | | | |
| | 17,434 | | | 4.69%, 05/31/2014 (N) | | | 16,388 | |
| | | | | Jarden Corp., Term Loan | | | | |
| | 4,356 | | | 4.45%, 01/24/2012 (N) | | | 4,148 | |
| | | | | Jarden Corp., Term Loan B2 | | | | |
| | 634 | | | 4.45%, 01/24/2012 (N) | | | 600 | |
| | | | | Jarden Corp., Term Loan B3 | | | | |
| | 3,942 | | | 4.45%, 01/24/2012 (N) | | | 3,752 | |
| | | | | John Maneely Co. | | | | |
| | 11,281 | | | 6.03%, 12/08/2013 (N) | | | 10,219 | |
| | | | | Kranson Industries | | | | |
| | 3,626 | | | 4.91%, 07/31/2013 (N) | | | 3,336 | |
| | | | | MacDermid, Inc. | | | | |
| | 11,409 | | | 4.70%, 04/11/2014 (N) | | | 10,268 | |
| | | | | Mega Bloks, Inc. | | | | |
| | 8,499 | | | 8.25%, 07/26/2012 (N)(Q) | | | 7,479 | |
| | | | | Newpage Corp. | | | | |
| | 3,990 | | | 6.31%, 12/21/2014 (N) | | | 3,960 | |
| | | | | Novelis, Inc., CA Term Loan | | | | |
| | 1,706 | | | 4.70%, 07/06/2014 (N) | | | 1,619 | |
| | | | | Novelis, Inc., US Term Loan | | | | |
| | 3,753 | | | 4.70%, 07/06/2014 (N) | | | 3,581 | |
| | | | | Smurfit-Stone Container Enterprises, Inc. | | | | |
| | 261 | | | 4.50%, 11/01/2010 (AA)(Q) | | | 252 | |
| | | | | Smurfit-Stone Container Enterprises, Inc., Term Loan B | | | | |
| | 100 | | | 4.85%, 11/01/2010 (AA)(Q) | | | 97 | |
| | | | | Smurfit-Stone Container Enterprises, Inc., Term Loan C | | | | |
| | 2,557 | | | 4.85%, 11/01/2011 (AA)(Q) | | | 2,474 | |
| | | | | Solo Cup Co. | | | | |
| | 6,693 | | | 6.30%, 02/27/2011 (N) | | | 6,522 | |
| | | | | Verso Paper Holdings LLC | | | | |
| | 6,576 | | | 4.45%, 07/28/2013 (N) | | | 6,110 | |
| | | | | | | | | |
| | | | | | | | | | | | 322,423 | |
| | | | | | | | | | | | | |
| | | | | Capital Goods — 2.5% |
| | | | | Ewards Ltd. | | | | |
| | 5,948 | | | 5.09%, 05/31/2014 (N) | | | 4,465 | |
| | | | | Hawker Beechcraft Acquisition Co., Letter of Credit | | | | |
| | 380 | | | 4.70%, 03/27/2014 (N) | | | 362 | |
| | | | | Hawker Beechcraft Acquisition Co., Term Loan | | | | |
| | 6,797 | | | 4.73%, 03/27/2014 (N) | | | 6,471 | |
| | | | | Lincoln Industries Corp. | | | | |
| | 948 | | | 5.40%, 07/11/2014 (N) | | | 872 | |
| | | | | Lincoln Industries Corp., Second Lien Term Loan | | | | |
| | 3,500 | | | 8.60%, 01/10/2015 (AA) | | | 3,150 | |
| | | | | Lincoln Industries Corp., Term Loan B | | | | |
| | 2,526 | | | 5.35%, 07/11/2014 (AA) | | | 2,324 | |
| | | | | Macandrews Amg Holdings LLC | | | | |
| | 10,710 | | | 8.65%, 04/17/2012 (N) | | | 8,996 | |
| | | | | Nacco Material Handling Group | | | | |
| | 8,790 | | | 5.64%, 03/22/2013 (N) | | | 7,735 | |
| | | | | Scitor Acquisition Corp. | | | | |
| | 4,478 | | | 7.12%, 09/26/2014 (H)(N) | | | 4,321 | |
| | | | | Targus Group International | | | | |
| | 10,416 | | | 7.62%, 11/22/2012 (N) | | | 8,437 | |
| | | | | Unifrax Corp. | | | | |
| | 4,236 | | | 5.13%, 05/02/2013 (N) | | | 3,918 | |
| | | | | Vought Aircraft Industries, Inc. | | | | |
| | 5,000 | | | 4.95%, 12/22/2010 (N) | | | 4,450 | |
| | 3,938 | | | 5.12%, 12/22/2011 (N) | | | 3,702 | |
| | | | | Yankee Candle Co. | | | | |
| | 15,759 | | | 4.61%, 02/06/2014 (N) | | | 14,174 | |
| | | | | | | | | |
| | | | | | | | | | | | 73,377 | |
| | | | | | | | | | | | | |
| | | | | | | | | | | | | |
The accompanying notes are an integral part of these financial statements.
143
The Hartford Floating Rate Fund
Schedule of Investments — (continued)
April 30, 2008 (Unaudited)
(000’s Omitted)
| | | | | | | | | | | | | |
Principal
| | | | | | | | Market
| |
| Amount | | | | | | | | Value (W) | |
| |
| | | | | | | | | | | | | |
| SENIOR FLOATING RATE INTERESTS: NON-INVESTMENT GRADE (V) — (continued) |
| | | | | Consumer Cyclical — 9.8% |
| | | | | Accuride Corp. | | | | |
| $ | 8,292 | | | 6.24%, 01/31/2012 (N)# | | $ | 8,126 | |
| | | | | AM General LLC | | | | |
| | 13,991 | | | 5.67%, 09/30/2013 (N) | | | 13,221 | |
| | | | | American Axle & Manufacturing Holdings, Inc. | | | | |
| | 15,333 | | | 5.17%, 06/14/2012 (N) | | | 13,762 | |
| | | | | American General Finance Corp. | | | | |
| | 528 | | | 5.73%, 09/01/2013 (N) | | | 497 | |
| | | | | Aramark Corp. | | | | |
| | 7,220 | | | 4.57%, 01/19/2014 (N) | | | 6,915 | |
| | 484 | | | 5.05%, 01/19/2014 (N) | | | 464 | |
| | | | | Axletech International | | | | |
| | 2,856 | | | 4.71%, 10/20/2012 (N) | | | 2,656 | |
| | 2,000 | | | 9.19%, 04/20/2013 (N) | | | 1,840 | |
| | | | | Brand Energy & Infrastructure Services | | | | |
| | 11,340 | | | 5.01%, 02/07/2014 (N) | | | 10,206 | |
| | 1,981 | | | 6.02%, 02/07/2014 (N) | | | 1,763 | |
| | | | | Building Materials Holdings Corp. | | | | |
| | 1,466 | | | 7.24%, 11/10/2013 (N) | | | 1,095 | |
| | | | | Contech Construction Products | | | | |
| | 4,878 | | | 4.79%, 01/31/2013 (N) | | | 4,207 | |
| | | | | Custom Building Products | | | | |
| | 5,043 | | | 5.06%, 10/20/2011 (N) | | | 4,337 | |
| | 2,000 | | | 9.72%, 04/20/2012 (N)# | | | 1,600 | |
| | | | | David’s Bridal, Inc. | | | | |
| | 6,435 | | | 4.70%, 01/25/2014 (N) | | | 5,534 | |
| | | | | Delphi Corp. | | | | |
| | 2,000 | | | 6.38%, 07/01/2008 (N) | | | 2,002 | |
| | 12,080 | | | 6.88%, 07/01/2008 (N) | | | 12,102 | |
| | | | | Dollarama Group L.P. | | | | |
| | 5,880 | | | 4.65%, 11/18/2011 (N) | | | 5,483 | |
| | | | | Easton-Bell Sports, Inc. | | | | |
| | 12,992 | | | 4.65%, 03/16/2012 (N) | | | 11,401 | |
| | | | | Ford Motor Co. | | | | |
| | 13,021 | | | 5.80%, 12/15/2013 (N)(Q) | | | 11,957 | |
| | | | | Foster Wheeler LLC | | | | |
| | 4,500 | | | 4.11%, 09/12/2011 (N) | | | 4,140 | |
| | | | | General Motors Corp. | | | | |
| | 13,279 | | | 5.06%, 11/27/2013 (N) | | | 12,466 | |
| | | | | Invista B.V., Term Loan A2 | | | | |
| | 10,779 | | | 4.20%, 04/30/2010 (N) | | | 10,240 | |
| | | | | Invista B.V., Tranche A Term Loan | | | | |
| | 3,129 | | | 4.20%, 04/30/2010 (N) | | | 2,972 | |
| | | | | KIK Custom Products, Inc. | | | | |
| | 3,500 | | | 7.92%, 11/23/2014 (N) | | | 1,190 | |
| | | | | Lear Corp. | | | | |
| | 13,886 | | | 5.34%, 04/25/2012 (N) | | | 13,429 | |
| | | | | Levi Strauss & Co. | | | | |
| | 24,316 | | | 4.99%, 03/09/2014 (N) | | | 20,729 | |
| | | | | Masonite International Corp., Canadian Term Loan | | | | |
| | 6,333 | | | 4.89%, 04/30/2010 (N) | | | 5,682 | |
| | | | | Masonite International Corp., US Term Loan | | | | |
| | 6,342 | | | 4.89%, 04/30/2010 (N) | | | 5,717 | |
| | | | | Michaels Stores, Inc. | | | | |
| | 13,351 | | | 5.20%, 11/11/2013 (N) | | | 11,783 | |
| | | | | Mother’s Work, Inc. | | | | |
| | 4,672 | | | 3.36%, 03/09/2013 (H)(N) | | | 3,411 | |
| | | | | Navistar International | | | | |
| | 12,467 | | | 6.23%, 01/17/2012 (N) | | | 11,687 | |
| | | | | Navistar International, Letter of Credit | | | | |
| | 4,533 | | | 6.04%, 01/17/2012 (N) | | | 4,246 | |
| | | | | Nortek, Inc. | | | | |
| | 5,816 | | | 5.30%, 08/27/2011 (N) | | | 5,200 | |
| | | | | Oshkosh Truck Corp. | | | | |
| | 1,750 | | | 4.51%, 12/06/2013 (N) | | | 1,643 | |
| | 3,300 | | | 4.76%, 11/30/2013 (N) | | | 3,157 | |
| | | | | The Pantry, Inc., Delayed Draw Term Loan | | | | |
| | 667 | | | 4.62%, 05/14/2014 (N)(Q) | | | 557 | |
| | | | | The Pantry, Inc., Term Loan B | | | | |
| | 2,316 | | | 4.62%, 05/14/2014 (N) | | | 1,934 | |
| | | | | Petco Animal Supplies, Inc. | | | | |
| | 3,930 | | | 5.03%, 10/25/2013 (N) | | | 3,589 | |
| | | | | Roundy’s Supermarkets, Inc. | | | | |
| | 11,347 | | | 5.47%, 11/03/2011 (N)(Q) | | | 10,660 | |
| | | | | Sports Authority, Inc. | | | | |
| | 7,336 | | | 4.95%, 04/25/2013 (H)(N) | | | 6,089 | |
| | | | | Standard Steel LLC | | | | |
| | 1,637 | | | 5.20%, 07/10/2012 (N) | | | 1,425 | |
| | 330 | | | 5.40%, 07/10/2012 (N) | | | 287 | |
| | | | | Tandus, Inc. | | | | |
| | 4,953 | | | 7.04%, 05/07/2014 (N) | | | 3,690 | |
| | | | | Tensar Corp. | | | | |
| | 3,308 | | | 6.40%, 10/28/2012 (N) | | | 3,192 | |
| | | | | Toys R Us, Inc. | | | | |
| | 17,500 | | | 5.71%, 11/30/2008 (N) | | | 16,537 | |
| | | | | United Subcontractors, Inc. | | | | |
| | 3,465 | | | 7.56%, 12/27/2012 (N) | | | 2,183 | |
| | | | | | | | | |
| | | | | | | | | | | | 287,003 | |
| | | | | | | | | | | | | |
| | | | | Consumer Staples — 2.5% |
| | | | | American Seafoods Group | | | | |
| | 1,317 | | | 4.60%, 09/30/2011 (AA) | | | 1,231 | |
| | 11,473 | | | 4.61%, 09/30/2012 (N) | | | 10,584 | |
| | | | | Bird’s Eye Foods, Inc. | | | | |
| | 4,408 | | | 4.45%, 03/21/2014 (N) | | | 4,187 | |
| | | | | Dean Foods Co. | | | | |
| | 7,823 | | | 4.45%, 03/29/2014 (N) | | | 7,447 | |
| | | | | Dole Food Co., Inc. | | | | |
| | 2,187 | | | 4.58%, 04/12/2013 (AA) | | | 2,027 | |
| | 14,693 | | | 4.83%, 04/12/2013 (N) | | | 13,620 | |
| | 4,409 | | | 5.01%, 04/12/2013 (N) | | | 4,089 | |
| | | | | Huish Detergents, Inc. | | | | |
| | 9,914 | | | 4.70%, 04/25/2014 (N) | | | 8,731 | |
| | | | | Michael Foods, Inc. | | | | |
| | 4,653 | | | 6.70%, 11/21/2010 (N) | | | 4,537 | |
| | | | | OSI Group, Inc., Dutch Term Loan | | | | |
| | 2,598 | | | 4.67%, 09/02/2011 (N) | | | 2,260 | |
| | | | | OSI Group, Inc., German Term Loan | | | | |
| | 2,078 | | | 4.67%, 09/02/2011 (N) | | | 1,808 | |
| | | | | OSI Group, Inc., US Term Loan B | | | | |
| | 4,676 | | | 4.67%, 09/02/2011 (N)# | | | 4,150 | |
| | | | | Piere Foods, Inc. | | | | |
| | 8,718 | | | 6.97%, 06/30/2010 (H)(N) | | | 5,719 | |
| | | | | Van Houtte, Inc., First Lien Term Loan | | | | |
| | 3,494 | | | 5.20%, 07/09/2014 (N) | | | 3,214 | |
| | | | | Van Houtte, Inc., Second Lien Term Loan | | | | |
| | 476 | | | 5.20%, 07/09/2014 (N) | | | 438 | |
| | | | | | | | | |
| | | | | | | | | | | | 74,042 | |
| | | | | | | | | | | | | |
| | | | | | | | | | | | | |
The accompanying notes are an integral part of these financial statements.
144
| | | | | | | | | | | | | |
Principal
| | | | | | | | Market
| |
| Amount | | | | | | | | Value (W) | |
| |
| | | | | | | | | | | | | |
| SENIOR FLOATING RATE INTERESTS: NON-INVESTMENT GRADE (V) — (continued) |
| | | | | Energy — 1.4% |
| | | | | Big West Oil LLC, Delayed Draw Term Loan | | | | |
| $ | 5,221 | | | 2.29%, 02/02/2015 (N)(Q) | | $ | 4,907 | |
| | | | | Big West Oil LLC, Term Loan | | | | |
| | 4,200 | | | 5.00%, 02/02/2015 (N) | | | 3,954 | |
| | | | | Firstlight Power Resources, Inc. | | | | |
| | 3,428 | | | 5.04%, 11/01/2013 (N) | | | 3,036 | |
| | 421 | | | 5.25%, 11/01/2013 (N) | | | 375 | |
| | | | | Petroleum Geo-Services | | | | |
| | 3,706 | | | 4.45%, 07/03/2015 (N) | | | 3,590 | |
| | | | | Targa Resources, Inc. | | | | |
| | 1,164 | | | 4.71%, 10/31/2012 (AA) | | | 1,133 | |
| | 2,062 | | | 6.83%, 10/31/2012 (N) | | | 2,010 | |
| | | | | Texas Petrochemicals L.P. | | | | |
| | 2,491 | | | 5.25%, 06/27/2013 (N) | | | 2,311 | |
| | 7,381 | | | 5.36%, 06/27/2013 (N) | | | 6,818 | |
| | | | | Western Refining, Inc. | | | | |
| | 14,535 | | | 4.65%, 03/06/2014 (N) | | | 12,936 | |
| | | | | | | | | |
| | | | | | | | | | | | 41,070 | |
| | | | | | | | | | | | | |
| | | | | Finance — 7.2% |
| | | | | Amerigroup Corp. | | | | |
| | 5,913 | | | 4.61%, 03/26/2012 (N) | | | 5,529 | |
| | | | | Ashtead Group plc | | | | |
| | 12,375 | | | 4.50%, 08/21/2011 (N) | | | 11,509 | |
| | | | | BNY Convergex Group LLC | | | | |
| | 3,074 | | | 1.50%, 09/30/2013 (N)(Q) | | | 2,882 | |
| | 2,192 | | | 5.70%, 09/30/2013 (N) | | | 2,055 | |
| | | | | BNY Convergex Group LLC & EZE Castle Software | | | | |
| | 6,214 | | | 5.70%, 08/30/2013 (N) | | | 5,826 | |
| | | | | Brickman Group Holdings, Inc. | | | | |
| | 6,942 | | | 4.69%, 01/24/2014 (N)(Q) | | | 6,456 | |
| | | | | Buckeye Check Cashing, Inc. | | | | |
| | 8,646 | | | 5.51%, 05/01/2012 (H)(N) | | | 5,620 | |
| | | | | Chrysler Financial Services NA | | | | |
| | 19,174 | | | 6.80%, 08/03/2012 (N) | | | 17,439 | |
| | | | | Community Health Systems, Inc., Delayed Draw Term Loan | | | | |
| | 777 | | | 1.00%, 07/02/2014 (N)(Q) | | | 743 | |
| | | | | Community Health Systems, Inc., Term Loan B | | | | |
| | 15,188 | | | 5.34%, 07/02/2014 (N) | | | 14,536 | |
| | | | | Conseco, Inc. | | | | |
| | 3,034 | | | 4.86%, 06/22/2010 (N) | | | 2,275 | |
| | | | | Covanta Holding Corp. | | | | |
| | 5,853 | | | 4.09%, 02/09/2014 (AA) | | | 5,611 | |
| | 11,920 | | | 5.08%, 02/09/2014 (N) | | | 11,428 | |
| | | | | Crescent Resources LLC | | | | |
| | 20,263 | | | 5.80%, 09/07/2012 (N) | | | 13,475 | |
| | | | | Dollar Financial Corp., Delayed Draw Term Loan | | | | |
| | 1,878 | | | 5.45%, 10/30/2012 (N) | | | 1,653 | |
| | | | | Dollar Financial Corp., Term Loan | | | | |
| | 2,554 | | | 5.45%, 10/30/2012 (N) | | | 2,222 | |
| | | | | FSB Holdings, Inc. | | | | |
| | 3,483 | | | 5.44%, 09/29/2013 (N) | | | 3,169 | |
| | 500 | | | 8.44%, 03/29/2014 (N) | | | 450 | |
| | | | | Golden Gate National | | | | |
| | 4,529 | | | 5.61%, 03/14/2011 (N) | | | 4,178 | |
| | | | | HMSC Corp. | | | | |
| | 3,960 | | | 4.97%, 10/03/2014 (H)(N) | | | 2,574 | |
| | | | | Hub International Holdings, Inc., Delayed Draw Term Loan | | | | |
| | 1,639 | | | 5.20%, 06/12/2014 (N)(Q) | | | 1,467 | |
| | | | | Hub International Holdings, Inc., Term Loan | | | | |
| | 7,298 | | | 5.20%, 06/14/2014 (N) | | | 6,495 | |
| | | | | Kar Holdings, Inc. | | | | |
| | 12,376 | | | 4.95%, 10/17/2013 (N) | | | 11,711 | |
| | | | | Landsource Holding Co. LLC | | | | |
| | 9,556 | | | 9.00%, 02/26/2013 (N) | | | 6,778 | |
| | | | | LNR Properties Corp., Term Loan A1 | | | | |
| | 6,160 | | | 6.36%, 06/29/2009 (N) | | | 5,221 | |
| | | | | LNR Properties Corp., Term Loan B | | | | |
| | 18,480 | | | 6.36%, 06/29/2011 (N) | | | 15,662 | |
| | | | | November Land Investors LLC | | | | |
| | 1,500 | | | 11.11%, 05/09/2012 (H)(N) | | | 375 | |
| | | | | Realogy Corp. | | | | |
| | 10,900 | | | 5.72%, 10/05/2014 (N) | | | 9,311 | |
| | | | | Realogy Corp., Letter of Credit | | | | |
| | 2,935 | | | 3.04%, 10/05/2013 (N) | | | 2,510 | |
| | | | | Rent-A-Center, Inc. | | | | |
| | 10,251 | | | 4.91%, 10/26/2012 (N) | | | 9,816 | |
| | | | | Sedgwick CMS Holdings, Inc. | | | | |
| | 7,590 | | | 4.95%, 01/31/2013 (N) | | | 6,841 | |
| | | | | TransFirst Holdings, Inc. | | | | |
| | 4,963 | | | 5.45%, 06/12/2014 (N) | | | 4,193 | |
| | 1,000 | | | 8.70%, 06/12/2015 (N) | | | 840 | |
| | | | | United Rentals, Inc. | | | | |
| | 2,425 | | | 4.55%, 02/14/2011 (AA) | | | 2,364 | |
| | 5,737 | | | 5.10%, 02/14/2011 (N) | | | 5,613 | |
| | | | | | | | | |
| | | | | | | | | | | | 208,827 | |
| | | | | | | | | | | | | |
| | | | | Health Care — 9.3% |
| | | | | Advanced Medical Optics, Inc. | | | | |
| | 7,920 | | | 5.44%, 04/02/2014 (N) | | | 7,336 | |
| | | | | AGA Medical Corp. | | | | |
| | 6,408 | | | 4.73%, 04/26/2013 (N) | | | 5,767 | |
| | | | | Carestream Health, Inc. | | | | |
| | 11,923 | | | 4.83%, 04/12/2013 (N) | | | 10,175 | |
| | 1,500 | | | 8.10%, 10/12/2013 (AA) | | | 975 | |
| | | | | Carl Zeiss | | | | |
| | 5,718 | | | 5.14%, 03/14/2014 (N) | | | 4,174 | |
| EUR | 2,500 | | | 6.85%, 03/14/2014 (AA) | | | 2,537 | |
| | | | | Center for Diagnostic Imaging | | | | |
| | 4,997 | | | 6.20%, 12/31/2010 (H)(N)(Q) | | | 4,697 | |
| | | | | DJO Finance LLC | | | | |
| | 6,983 | | | 5.70%, 04/07/2013 (N) | | | 6,747 | |
| | | | | General Nutrition Centers, Inc. | | | | |
| | 5,935 | | | 4.95%, 03/14/2014 (N) | | | 5,267 | |
| | | | | Generics International, Inc. | | | | |
| | 2,993 | | | 6.20%, 11/19/2014 (H)(N) | | | 2,828 | |
| | | | | HCA, Inc. | | | | |
| | 11,992 | | | 4.95%, 11/17/2013 (N)(Q) | | | 11,395 | |
| | | | | Health Management Associates, Inc. | | | | |
| | 11,528 | | | 4.45%, 02/12/2014 (N) | | | 10,631 | |
| | | | | Healthcare Partners LLC | | | | |
| | 11,447 | | | 4.65%, 10/20/2013 (N) | | | 10,960 | |
| | | | | HealthSouth Corp. | | | | |
| | 7,720 | | | 5.23%, 03/07/2013 (N) | | | 7,314 | |
The accompanying notes are an integral part of these financial statements.
145
The Hartford Floating Rate Fund
Schedule of Investments — (continued)
April 30, 2008 (Unaudited)
(000’s Omitted)
| | | | | | | | | | | | | |
Principal
| | | | | | | | Market
| |
| Amount | | | | | | | | Value (W) | |
| |
| | | | | | | | | | | | | |
| SENIOR FLOATING RATE INTERESTS: NON-INVESTMENT GRADE (V) — (continued) |
| | | | | | | | | | | | | |
| | | | | Health Care — (continued) |
| | | | | IASIS Healthcare Capital Corp. | | | | |
| $ | 1,145 | | | 4.78%, 03/15/2014 (AA) | | $ | 1,086 | |
| | 4,293 | | | 4.86%, 03/15/2014 (N) | | | 4,073 | |
| | 12,437 | | | 4.88%, 01/15/2014 (N) | | | 11,839 | |
| | 5,143 | | | 8.13%, 06/15/2014 (N)(Q) | | | 4,526 | |
| | | | | Invacare Corp. | | | | |
| | 2,000 | | | 5.15%, 02/07/2013 (AA)(Q) | | | 1,850 | |
| | | | | Inverness Medical Innovation, Inc. | | | | |
| | 5,955 | | | 4.67%, 06/27/2014 (N) | | | 5,523 | |
| | 1,000 | | | 6.92%, 06/26/2015 (N) | | | 900 | |
| | | | | LifePoint Hospitals, Inc. | | | | |
| | 15,726 | | | 4.71%, 04/15/2012 (N)# | | | 15,068 | |
| | | | | Multiplan Corp. | | | | |
| | 2,553 | | | 5.36%, 04/12/2013 (N) | | | 2,400 | |
| | 7,388 | | | 5.38%, 04/13/2013 (N) | | | 6,945 | |
| | | | | National Mentor | | | | |
| | 397 | | | 4.56%, 06/27/2013 (AA) | | | 349 | |
| | 6,492 | | | 4.70%, 06/27/2013 (N) | | | 5,713 | |
| | | | | National Renal Institutes, Inc. | | | | |
| | 13,220 | | | 5.00%, 03/31/2013 (N) | | | 11,898 | |
| | | | | Orthofix Holdings, Inc. | | | | |
| | 8,330 | | | 4.64%, 09/22/2013 (N) | | | 7,331 | |
| | | | | Pharmaceutical Product Development, Inc. | | | | |
| �� | 1,382 | | | 6.14%, 01/29/2012 (N) | | | 1,285 | |
| | | | | Psychiatric Solutions, Inc. | | | | |
| | 8,947 | | | 4.56%, 07/01/2012 (N) | | | 8,567 | |
| | | | | Quintiles Transnational Corp. | | | | |
| | 6,845 | | | 4.70%, 03/31/2013 (N) | | | 6,366 | |
| | | | | Renal Advantage, Inc. | | | | |
| | 3,698 | | | 5.26%, 10/05/2012 (N) | | | 3,430 | |
| | | | | Rite Aid Corp. | | | | |
| | 11,000 | | | 4.53%, 06/01/2014 (N) | | | 10,361 | |
| | | | | Select Medical Corp. | | | | |
| | 1,976 | | | 4.85%, 02/24/2012 (N) | | | 1,818 | |
| | 9,679 | | | 5.06%, 02/24/2012 (N) | | | 8,826 | |
| | | | | Skilled Healthcare Group, Inc. | | | | |
| | 4,914 | | | 4.89%, 06/15/2012 (N) | | | 4,398 | |
| | | | | Sun Healthcare Group, Inc. | | | | |
| | 3,865 | | | 4.49%, 04/12/2014 (N) | | | 3,566 | |
| | 873 | | | 4.60%, 04/19/2014 (AA) | | | 804 | |
| | 551 | | | 4.85%, 04/19/2014 (N) | | | 507 | |
| | | | | Surgical Care Affiliates LLC | | | | |
| | 5,955 | | | 4.95%, 12/29/2014 (N) | | | 5,121 | |
| | | | | United Surgical Partners International | | | | |
| | 1,532 | | | 4.75%, 04/19/2014 (N)(Q) | | | 1,394 | |
| | 7,888 | | | 5.49%, 04/19/2014 (N) | | | 7,178 | |
| | | | | Vanguard Health Holdings Co. II LLC | | | | |
| | 14,366 | | | 5.13%, 09/23/2011 (N)(Q) | | | 13,801 | |
| | | | | Varietal Distribution Merger Sub., Inc. | | | | |
| | 6,080 | | | 5.20%, 06/29/2014 (N) | | | 5,639 | |
| | | | | Viant Holdings, Inc. | | | | |
| | 13,399 | | | 4.95%, 06/25/2014 (AA) | | | 11,255 | |
| | | | | Warner Chilcott Corp. | | | | |
| | 825 | | | 4.73%, 01/18/2012 (N) | | | 778 | |
| | 3,959 | | | 4.84%, 01/18/2012 (N) | | | 3,820 | |
| | | | | Youth & Family Centered Services, Inc. | | | | |
| | 2,248 | | | 6.94%, 07/10/2013 (H)(N) | | | 2,046 | |
| | | | | | | | | |
| | | | | | | | | | | | 271,264 | |
| | | | | | | | | | | | | |
| | | | | Services — 24.6% |
| | | | | 24 Hour Fitness Worldwide, Inc. | | | | |
| | 5,885 | | | 5.93%, 06/08/2012 (N) | | | 5,238 | |
| | | | | Acosta, Inc. | | | | |
| | 6,391 | | | 5.12%, 12/06/2012 (N) | | | 6,016 | |
| | | | | Advanstar Holdings Corp. | | | | |
| | 12,903 | | | 4.92%, 06/01/2014 (N) | | | 9,741 | |
| | 2,000 | | | 7.61%, 12/01/2014 (H)(N) | | | 1,440 | |
| | | | | Advantage Sales & Marketing, Inc. | | | | |
| | 15,683 | | | 4.70%, 03/29/2013 (N) | | | 14,742 | |
| | | | | Affinion Group, Inc. | | | | |
| | 14,049 | | | 5.56%, 10/07/2012 (N) | | | 13,294 | |
| | | | | Allied Waste Industries, Inc. | | | | |
| | 9,674 | | | 4.35%, 01/15/2012 (AA) | | | 9,345 | |
| | 1,644 | | | 4.38%, 01/15/2012 (N) | | | 1,589 | |
| | | | | AMC Entertainment, Inc. | | | | |
| | 5,870 | | | 4.64%, 01/26/2013 (N) | | | 5,528 | |
| | | | | Bresnan Communications LLC | | | | |
| | 8,000 | | | 4.98%, 09/29/2013 (N) | | | 7,490 | |
| | | | | Brock Holdings III, Inc. | | | | |
| | 3,534 | | | 4.63%, 02/21/2014 (N) | | | 3,269 | |
| | | | | Cardinal Logistics Management | | | | |
| | 5,496 | | | 6.61%, 09/23/2013 (H)(N)(Q) | | | 4,782 | |
| | | | | Carmike Cinemas, Inc. | | | | |
| | 1,939 | | | 6.49%, 09/29/2011 (N) | | | 1,839 | |
| | 7,615 | | | 6.60%, 05/19/2012 (N) | | | 7,216 | |
| | | | | Casella Waste Systems, Inc. | | | | |
| | 4,477 | | | 4.75%, 04/28/2010 (N) | | | 4,309 | |
| | | | | CCO Holdings LLC | | | | |
| | 4,750 | | | 5.17%, 09/05/2014 (N) | | | 3,859 | |
| | | | | Cebridge Communications LLC | | | | |
| | 11,931 | | | 4.76%, 11/05/2013 (N) | | | 10,887 | |
| | 10,000 | | | 7.74%, 05/05/2014 (N) | | | 8,067 | |
| | | | | Cedar Fair L.P., Canadian Term Loan | | | | |
| | 6,882 | | | 4.86%, 07/21/2013 (N) | | | 6,544 | |
| | | | | Cedar Fair L.P., Term Loan B | | | | |
| | 5,716 | | | 4.86%, 07/21/2013 (N) | | | 5,434 | |
| | | | | Cengage | | | | |
| | 13,930 | | | 5.34%, 06/27/2014 (N) | | | 12,870 | |
| | | | | Centaur LLC | | | | |
| | 763 | | | 4.00%, 10/30/2012 (N)(Q) | | | 630 | |
| | 3,587 | | | 6.70%, 10/30/2012 (N) | | | 3,031 | |
| | 2,020 | | | 10.20%, 10/30/2013 (H)(N) | | | 1,616 | |
| | | | | Citadel Broadcasting Corp. | | | | |
| | 22,000 | | | 4.39%, 06/08/2014 (N) | | | 18,755 | |
| | | | | Clarke American Corp. | | | | |
| | 18,848 | | | 5.20%, 02/28/2014 (N) | | | 15,672 | |
| | | | | CMP Susquehanna Corp. | | | | |
| | 12,709 | | | 4.85%, 03/24/2013 (N) | | | 10,009 | |
| | | | | CSC Holdings, Inc. | | | | |
| | 12,901 | | | 4.48%, 03/24/2013 (N) | | | 12,412 | |
| | | | | Cumulus Media, Inc. | | | | |
| | 16,509 | | | 4.47%, 06/01/2014 (N) | | | 14,281 | |
| | | | | CW Media Holdings, Inc. | | | | |
| | 7,960 | | | 5.95%, 02/15/2015 (N) | | | 7,681 | |
| | | | | Emdeon Business Services LLC | | | | |
| | 7,162 | | | 4.70%, 11/16/2013 (N) | | | 6,741 | |
| | 4,000 | | | 7.70%, 05/16/2014 (N) | | | 3,700 | |
| | | | | Energy Solutions, LLC, Add-On Letter of Credit | | | | |
| | 1,514 | | | 5.05%, 06/07/2013 (N) | | | 1,442 | |
The accompanying notes are an integral part of these financial statements.
146
| | | | | | | | | | | | | |
Principal
| | | | | | | | Market
| |
| Amount | | | | | | | | Value (W) | |
| |
| | | | | | | | | | | | | |
| SENIOR FLOATING RATE INTERESTS: NON-INVESTMENT GRADE (V) — (continued) |
| | | | | | | | | | | | | |
| | | | | Services — (continued) |
| | | | | Energy Solutions, LLC, LC Facility | | | | |
| $ | 126 | | | 5.05%, 06/07/2013 (N) | | $ | 120 | |
| | | | | Energy Solutions, LLC, Term Loan B | | | | |
| | 1,970 | | | 7.10%, 06/07/2013 (N) | | | 1,886 | |
| | | | | Energy Solutions, LLC, Term Loan B2 | | | | |
| | 945 | | | 7.10%, 06/07/2013 (N) | | | 900 | |
| | | | | F & W Publications, Inc. | | | | |
| | 1,481 | | | 5.02%, 08/05/2012 (N) | | | 1,111 | |
| | 7,040 | | | 5.42%, 08/05/2012 (N) | | | 5,280 | |
| | 4,500 | | | 6.85%, 08/05/2012 (H)(N) | | | 2,475 | |
| | | | | Fender Musical Instruments Corp. | | | | |
| | 832 | | | 6.97%, 06/06/2014 (N) | | | 732 | |
| | 1,652 | | | 7.16%, 06/06/2014 (N) | | | 1,454 | |
| | | | | Golden Nugget, Inc. | | | | |
| | 1,455 | | | 1.75%, 06/22/2014 (N)(Q) | | | 1,280 | |
| | 2,545 | | | 4.84%, 06/22/2014 (N) | | | 2,265 | |
| | 3,750 | | | 6.05%, 12/31/2014 (N) | | | 2,625 | |
| | | | | Gray Television, Inc. | | | | |
| | 14,928 | | | 4.19%, 12/31/2014 (N) | | | 13,062 | |
| | | | | Greektown Holdings LLC | | | | |
| | 1,337 | | | 5.44%, 12/01/2012 (H)(N) | | | 1,157 | |
| | | | | Green Valley Ranch Gaming LLC | | | | |
| | 2,861 | | | 4.93%, 02/09/2014 (N) | | | 2,270 | |
| | 8,000 | | | 6.34%, 02/09/2014 (H)(N) | | | 4,960 | |
| | | | �� | Greenwood Racing, Inc. | | | | |
| | 6,407 | | | 5.12%, 11/14/2011 (H)(AA)(Q) | | | 5,799 | |
| | | | | Harrah’s Entertainment Inc. | | | | |
| | 2,000 | | | 5.92%, 01/28/2015 (N) | | | 1,878 | |
| | | | | Hit Entertainment, Inc. | | | | |
| | 1,475 | | | 5.07%, 08/26/2012 (N) | | | 1,328 | |
| | | | | Idearc, Inc. | | | | |
| | 17,673 | | | 4.71%, 11/17/2014 (N) | | | 14,536 | |
| | | | | inVentiv Health, Inc., Term Loan B | | | | |
| | 10,806 | | | 4.45%, 07/05/2014 (N) | | | 9,996 | |
| | | | | Lake At Las Vegas Joint Venture LLC, First Lien Term Loan | | | | |
| | 5,535 | | | 11.95%, 02/01/2010 (H)(AA) | | | 1,384 | |
| | | | | Lake At Las Vegas Joint Venture LLC, Revolver | | | | |
| | 735 | | | 12.95%, 02/01/2010 (H)(AA) | | | 184 | |
| | | | | Las Vegas Sands Corp., Delayed Draw Term Loan 1 | | | | |
| | 4,391 | | | 0.75%, 05/23/2014 (N)(Q) | | | 4,023 | |
| | | | | Las Vegas Sands Corp., Delayed Draw Term Loan 2 | | | | |
| | 2,000 | | | 0.75%, 05/23/2013 (N)(Q) | | | 1,834 | |
| | | | | Las Vegas Sands Corp., Term Loan B | | | | |
| | 17,913 | | | 4.45%, 05/23/2014 (N) | | | 16,449 | |
| | | | | LBI Media, Inc. | | | | |
| | 10,571 | | | 4.36%, 05/01/2012 (N) | | | 8,986 | |
| | | | | Local Insight | | | | |
| | 5,400 | | | 7.75%, 04/21/2013 (N) | | | 5,004 | |
| | | | | Medianews Groups, Inc. | | | | |
| | 3,930 | | | 5.13%, 08/02/2013 (N) | | | 2,898 | |
| | | | | MGM Holdings II, Inc. | | | | |
| | 3,581 | | | 5.95%, 04/08/2012 (N) | | | 2,858 | |
| | | | | MGM Mirage, Inc. | | | | |
| | 19,000 | | | 3.30%, 10/03/2011 (N) | | | 16,886 | |
| | | | | Nelson Education | | | | |
| | 5,970 | | | 5.20%, 07/05/2014 (H)(N) | | | 5,194 | |
| | | | | NEP Supershooters L.P. | | | | |
| | 7,920 | | | 4.95%, 02/13/2014 (N) | | | 7,078 | |
| | | | | New World Gaming Partners Ltd. | | | | |
| | 4,000 | | | 8.19%, 03/31/2015 (H)(N) | | | 2,800 | |
| | | | | New World Gaming Partners Ltd., Delayed Draw Term Loan | | | | |
| | 167 | | | 5.19%, 09/30/2014 (N) | | | 142 | |
| | | | | New World Gaming Partners Ltd., First Lien Term Loan | | | | |
| | 831 | | | 5.19%, 09/30/2014 (H)(N) | | | 707 | |
| | | | | Penton Media, Inc. | | | | |
| | 7,425 | | | 5.15%, 02/06/2013 (N) | | | 5,618 | |
| | 7,000 | | | 7.90%, 02/06/2014 (N) | | | 4,935 | |
| | | | | Philosophy, Inc. | | | | |
| | 6,521 | | | 4.89%, 03/15/2014 (N) | | | 5,260 | |
| | | | | Pinnacle Foods | | | | |
| | 24,311 | | | 5.44%, 03/30/2014 (N) | | | 22,549 | |
| | | | | PITG Gaming Investor Holdings LLC | | | | |
| | 6,600 | | | 9.80%, 05/26/2008 (N) | | | 6,417 | |
| | | | | R.H. Donnelley, Inc. | | | | |
| | 4,677 | | | 4.17%, 06/30/2011 (N) | | | 4,428 | |
| | 4,345 | | | 4.41%, 06/30/2011 (N) | | | 4,110 | |
| | | | | Raycom TV Broadcasting, Inc. | | | | |
| | 14,229 | | | 4.35%, 07/27/2013 (AA) | | | 13,090 | |
| | | | | Readers Digest Association, Inc. | | | | |
| | 5,000 | | | 4.09%, 03/02/2013 (N)(Q) | | | 4,150 | |
| | 18,270 | | | 4.94%, 03/02/2014 (N) | | | 15,347 | |
| | | | | Regal Cinemas, Inc. | | | | |
| | 17,976 | | | 4.20%, 10/27/2013 (N) | | | 17,077 | |
| | | | | Sabre, Inc. | | | | |
| | 16,380 | | | 4.88%, 09/30/2014 (N) | | | 13,857 | |
| | | | | Sensata Technologies | | | | |
| | 18,036 | | | 4.66%, 04/21/2013 (N) | | | 16,593 | |
| | | | | Sheridan Group, Inc. | | | | |
| | 10,913 | | | 5.21%, 06/15/2014 (N) | | | 9,412 | |
| | 4,000 | | | 8.46%, 06/15/2015 (H)(N) | | | 3,000 | |
| | | | | Sirius Satellite Radio, Inc. | | | | |
| | 10,452 | | | 5.13%, 09/01/2012 (N) | | | 9,616 | |
| | | | | Six Flags, Inc. | | | | |
| | 8,314 | | | 5.20%, 04/30/2015 (N) | | | 7,394 | |
| | | | | Southern Graphic Systems | | | | |
| | 992 | | | 5.25%, 12/30/2011 (H)(N) | | | 902 | |
| | 1,955 | | | 6.91%, 12/30/2011 (H)(N) | | | 1,779 | |
| | | | | Spanish Broadcasting System, Inc. | | | | |
| | 21,556 | | | 4.45%, 06/10/2012 (H)(N) | | | 17,999 | |
| | | | | SunGard Data Systems, Inc. | | | | |
| | 13,709 | | | 4.88%, 02/28/2014 (N) | | | 12,972 | |
| | | | | Synagro Technologies, Inc. | | | | |
| | 3,970 | | | 5.07%, 03/28/2014 (N) | | | 3,355 | |
| | 2,000 | | | 7.82%, 09/28/2014 (N) | | | 1,400 | |
| | | | | Telesat Canada | | | | |
| | 984 | | | 3.67%, 09/01/2014 (N)(Q) | | | 926 | |
| | 11,491 | | | 5.90%, 09/01/2014 (N)(Q) | | | 10,810 | |
| | | | | Town Sports International Holdings, Inc. | | | | |
| | 5,945 | | | 4.50%, 02/27/2014 (N) | | | 5,172 | |
| | | | | Transaction Network Services, Inc. | | | | |
| | 4,564 | | | 4.72%, 05/10/2013 (N) | | | 4,199 | |
The accompanying notes are an integral part of these financial statements.
147
The Hartford Floating Rate Fund
Schedule of Investments — (continued)
April 30, 2008 (Unaudited)
(000’s Omitted)
| | | | | | | | | | | | | |
Principal
| | | | | | | | Market
| |
| Amount | | | | | | | | Value (W) | |
| |
| | | | | | | | | | | | | |
| SENIOR FLOATING RATE INTERESTS: NON-INVESTMENT GRADE (V) — (continued) |
| | | | | | | | | | | | | |
| | | | | Services — (continued) |
| | | | | Tribune Co. | | | | |
| $ | 7,994 | | | 5.48%, 05/17/2009 (N) | | $ | 7,561 | |
| | 9,709 | | | 5.54%, 05/17/2014 (N) | | | 7,163 | |
| | | | | United Site Services, Inc. | | | | |
| | 1,800 | | | 6.95%, 06/29/2013 (N) | | | 1,440 | |
| | | | | Univision Communications | | | | |
| | 8,000 | | | 5.15%, 09/16/2014 (N) | | | 6,722 | |
| | 7,000 | | | 5.36%, 03/16/2009 (N) | | | 6,755 | |
| | | | | UPC Financing Partnership | | | | |
| | 15,500 | | | 4.46%, 12/31/2014 (N) | | | 14,493 | |
| | | | | Venetian Macau Ltd., Incremental Term Loan B | | | | |
| | 1,500 | | | 4.95%, 04/06/2012 (N) | | | 1,395 | |
| | | | | Venetian Macau Ltd., Term Loan | | | | |
| | 2,702 | | | 4.95%, 04/06/2013 (N) | | | 2,576 | |
| | | | | Vertafore, Inc. | | | | |
| | 3,465 | | | 5.59%, 01/31/2012 (N) | | | 3,153 | |
| | | | | West Corp. | | | | |
| | 22,249 | | | 5.28%, 10/23/2013 (N) | | | 20,378 | |
| | | | | WideOpenWest Finance LLC | | | | |
| | 16,000 | | | 4.15%, 07/01/2014 (H)(N) | | | 12,680 | |
| | 5,043 | | | 9.98%, 07/01/2015 (N)(Q) | | | 3,833 | |
| | | | | Wynn Resorts Ltd. | | | | |
| | 7,500 | | | 4.64%, 06/01/2014 (N) | | | 7,350 | |
| | | | | Yell Group plc | | | | |
| | 3,000 | | | 4.86%, 02/10/2013 (N) | | | 2,620 | |
| | | | | Yonkers Racing Corp. | | | | |
| | 4,729 | | | 8.94%, 08/12/2011 (H)(N) | | | 4,256 | |
| | | | | | | | | |
| | | | | | | | | | | | 715,752 | |
| | | | | | | | | | | | | |
| | | | | Technology — 11.9% |
| | | | | Acxiom Corp. | | | | |
| | 2,432 | | | 5.80%, 09/13/2012 (N) | | | 2,359 | |
| | | | | Alaska Communication Systems Holdings, Inc., Incremental Term Loan | | | | |
| | 2,190 | | | 4.45%, 02/01/2012 (N) | | | 2,054 | |
| | | | | Alaska Communication Systems Holdings, Inc., Term Loan | | | | |
| | 8,485 | | | 4.45%, 02/01/2012 (N) | | | 8,082 | |
| | | | | Aspect Software, Inc. | | | | |
| | 3,967 | | | 5.63%, 09/22/2012 (N) | | | 3,679 | |
| | | | | Canwest MediaWorks L.P. | | | | |
| | 4,953 | | | 5.09%, 07/10/2014 (N) | | | 4,730 | |
| | | | | Caribe Information Investment, Inc. | | | | |
| | 12,376 | | | 5.05%, 03/29/2013 (N) | | | 11,076 | |
| | | | | Cellnet Technology, Inc. | | | | |
| | 8,476 | | | 6.00%, 08/26/2011 (H)(N) | | | 7,502 | |
| | | | | Charter Communications Operating LLC | | | | |
| | 17,006 | | | 4.90%, 04/28/2013 (N) | | | 15,036 | |
| | | | | Cinram International | | | | |
| | 8,678 | | | 5.11%, 05/05/2010 (N) | | | 6,921 | |
| | | | | Crown Castle Operating Co. | | | | |
| | 6,403 | | | 2.33%, 03/06/2014 (N) | | | 6,043 | |
| | | | | DaVita, Inc. | | | | |
| | 2,015 | | | 4.21%, 10/05/2011 (N)# | | | 1,814 | |
| | 2,501 | | | 4.23%, 10/05/2012 (N) | | | 2,401 | |
| | | | | Dresser, Inc. | | | | |
| | 12,768 | | | 5.31%, 05/04/2014 (N) | | | 12,246 | |
| | | | | Fleetcor Technologies Operating Co. LLC, Delayed Draw Term Loan | | | | |
| | 1,336 | | | 4.98%, 04/30/2013 (N) | | | 1,236 | |
| | | | | Fleetcor Technologies Operating Co. LLC, Term Loan B | | | | |
| | 6,614 | | | 4.96%, 04/30/2013 (N)(Q) | | | 6,118 | |
| | | | | Freescale Semiconductor, Inc. | | | | |
| | 15,800 | | | 4.46%, 11/28/2013 (N) | | | 13,800 | |
| | | | | Gatehouse Media Operating, Inc. | | | | |
| | 6,250 | | | 4.75%, 08/05/2014 (N) | | | 4,250 | |
| | 19,750 | | | 5.09%, 08/05/2014 (N) | | | 13,430 | |
| | | | | Hawaiian Telecom Communications, Inc. | | | | |
| | 13,808 | | | 4.95%, 06/01/2014 (N) | | | 10,419 | |
| | | | | Infor Global Solutions | | | | |
| | 993 | | | 5.45%, 07/08/2012 (N) | | | 774 | |
| | 2,000 | | | 8.20%, 03/02/2014 (N) | | | 1,140 | |
| | 3,000 | | | 8.95%, 07/28/2014 (N) | | | 1,800 | |
| | | | | Infor Global Solutions, Delayed Draw Term Loan | | | | |
| | 1,290 | | | 6.45%, 07/28/2012 (N) | | | 1,058 | |
| | | | | Infor Global Solutions, U.S. Term Loan | | | | |
| | 2,473 | | | 6.45%, 07/28/2012 (N) | | | 2,025 | |
| | | | | Intelsat Bermuda Ltd. | | | | |
| | 8,500 | | | 5.20%, 01/11/2014 (N) | | | 8,468 | |
| | | | | Intelsat Bermuda Ltd., Term Loan B 2A | | | | |
| | 4,059 | | | 5.18%, 01/03/2014 (N) | | | 3,832 | |
| | | | | Intelsat Bermuda Ltd., Term Loan B 2B | | | | |
| | 4,058 | | | 5.18%, 01/03/2014 (N) | | | 3,831 | |
| | | | | Intelsat Bermuda Ltd., Term Loan B 2C | | | | |
| | 4,058 | | | 5.18%, 01/03/2014 (N) | | | 3,831 | |
| | | | | Intelsat Subsidiary Holding Co., Ltd. | | | | |
| | 3,448 | | | 5.18%, 07/03/2012 (N) | | | 3,292 | |
| | | | | IPC Systems, Inc. | | | | |
| | 17,860 | | | 4.95%, 05/31/2014 (N) | | | 13,514 | |
| | | | | Kronos, Inc. | | | | |
| | 6,878 | | | 4.95%, 06/12/2014 (N) | | | 6,156 | |
| | | | | Leap Wireless International, Inc. | | | | |
| | 7,865 | | | 4.70%, 06/15/2013 (N) | | | 7,730 | |
| | | | | Level 3 Communications Corp. | | | | |
| | 16,941 | | | 4.96%, 03/01/2014 (N) | | | 15,679 | |
| | | | | Marvell Technology Group Ltd. | | | | |
| | 10,828 | | | 5.20%, 11/09/2009 (N) | | | 10,395 | |
| | | | | Mediacom Broadband LLC, Term Loan D1 | | | | |
| | 13,484 | | | 4.52%, 01/31/2015 (N) | | | 12,226 | |
| | | | | Mediacom Broadband LLC, Term Loan D2 | | | | |
| | 7,361 | | | 4.52%, 01/31/2015��(N) | | | 6,773 | |
| | | | | Mediacom LLC | | | | |
| | 1,950 | | | 4.27%, 09/30/2012 (N)# | | | 1,804 | |
| | 6,870 | | | 4.52%, 01/31/2015 (N) | | | 6,286 | |
| | | | | MetroPCS Wireless, Inc. | | | | |
| | 14,192 | | | 5.32%, 11/02/2013 (N) | | | 13,358 | |
| | | | | National Cinemedia, Inc. | | | | |
| | 11,000 | | | 4.62%, 02/13/2015 (N) | | | 10,208 | |
| | | | | Ntelos, Inc. | | | | |
| | 15,363 | | | 5.27%, 08/24/2011 (N) | | | 14,998 | |
| | | | | One Communications Corp. | | | | |
| | 8,118 | | | 6.81%, 06/30/2012 (N) | | | 6,921 | |
| | | | | PAETEC Holding Corp. | | | | |
| | 3,142 | | | 5.35%, 02/09/2013 (N) | | | 3,032 | |
| | | | | RCN Corp. | | | | |
| | 14,872 | | | 5.00%, 04/19/2014 (N) | | | 12,803 | |
The accompanying notes are an integral part of these financial statements.
148
| | | | | | | | | | | | | |
Principal
| | | | | | | | Market
| |
| Amount | | | | | | | | Value (W) | |
| |
| | | | | | | | | | | | | |
| SENIOR FLOATING RATE INTERESTS: NON-INVESTMENT GRADE (V) — (continued) |
| | | | | | | | | | | | | |
| | | | | Technology — (continued) |
| | | | | Reynolds & Reynolds Co. | | | | |
| $ | 10,035 | | | 4.89%, 10/24/2012 (N) | | $ | 9,558 | |
| | | | | Time Warner Telecom Holdings, Inc. | | | | |
| | 10,369 | | | 4.87%, 07/01/2013 (N) | | | 9,760 | |
| | | | | Verint Systems, Inc. | | | | |
| | 13,262 | | | 6.24%, 05/23/2014 (N) | | | 11,670 | |
| | | | | Virgin Media Dover LLC | | | | |
| | 5,329 | | | 4.94%, 09/03/2012 (N) | | | 5,084 | |
| | | | | Wind Acquisitions Holdings Finance S.A. | | | | |
| | 5,857 | | | 9.98%, 12/12/2011 (N)(Q) | | | 5,579 | |
| | | | | | | | | |
| | | | | | | | | | | | 346,781 | |
| | | | | | | | | | | | | |
| | | | | Transportation — 3.0% |
| | | | | Delta Air Lines, Inc. | | | | |
| | 5,000 | | | 4.90%, 04/25/2012 (N) | | | 4,335 | |
| | 1,980 | | | 6.15%, 04/25/2014 (N) | | | 1,567 | |
| | | | | Greatwide Logistics Services, Inc. | | | | |
| | 6,419 | | | 6.20%, 01/22/2014 (N) | | | 4,926 | |
| | | | | Jacobson Cos. | | | | |
| | 3,970 | | | 5.35%, 06/19/2014 (H)(AA) | | | 3,017 | |
| | | | | Kenan Advantage Group | | | | |
| | 5,706 | | | 5.70%, 12/16/2011 (N) | | | 5,249 | |
| | | | | Louis US Holdco, Inc. | | | | |
| | 828 | | | 5.60%, 11/04/2013 (AA) | | | 754 | |
| | 2,508 | | | 5.86%, 11/04/2013 (N) | | | 2,282 | |
| | | | | MacQuarie Aircraft Leasing Finance S.A. | | | | |
| | 19,182 | | | 4.59%, 11/29/2013 (H)(N)(Q) | | | 18,031 | |
| | 4,984 | | | 7.09%, 11/29/2013 (H)(N) | | | 4,685 | |
| | | | | Northwest Airlines Corp. | | | | |
| | 12,315 | | | 4.72%, 08/21/2008 (N) | | | 10,714 | |
| | | | | Rail America, Inc. | | | | |
| | 17,000 | | | 5.10%, 10/04/2008 (AA) | | | 16,405 | |
| | | | | United Air Lines, Inc. | | | | |
| | 6,499 | | | 4.84%, 02/01/2014 (N) | | | 5,581 | |
| | | | | US Airways Group, Inc. | | | | |
| | 13,365 | | | 5.39%, 03/23/2014 (N) | | | 9,932 | |
| | | | | | | | | |
| | | | | | | | | | | | 87,478 | |
| | | | | | | | | | | | | |
| | | | | Utilities — 4.4% |
| | | | | Astoria Generating Co. Acquisitions LLC | | | | |
| | 9,500 | | | 6.35%, 08/23/2013 (N)(Q) | | | 8,906 | |
| | | | | Atlas Pipeline Partners L.P. | | | | |
| | 10,000 | | | 5.62%, 07/27/2014 (N) | | | 9,794 | |
| | | | | Calpine Corp. | | | | |
| | 11,665 | | | 5.58%, 03/29/2014 (N) | | | 10,971 | |
| | | | | Dynegy Holdings, Inc., Letter of Credit | | | | |
| | 15,896 | | | 4.36%, 03/30/2013 (N) | | | 15,022 | |
| | | | | Dynegy Holdings, Inc., Term Loan | | | | |
| | 1,096 | | | 4.36%, 03/30/2013 (N) | | | 1,031 | |
| | | | | Kgen LLC, Letter of Credit | | | | |
| | 2,625 | | | 4.60%, 02/01/2014 (AA) | | | 2,487 | |
| | | | | Kgen LLC, Term Loan B | | | | |
| | 4,320 | | | 4.60%, 02/01/2014 (N) | | | 4,093 | |
| | | | | Mirant North America LLC | | | | |
| | 7,832 | | | 4.61%, 01/03/2013 (N) | | | 7,617 | |
| | | | | NRG Energy, Inc. | | | | |
| | 8,387 | | | 2.60%, 02/01/2013 (N)(Q) | | | 8,006 | |
| | 11,087 | | | 4.20%, 06/08/2013 (N) | | | 10,637 | |
| | | | | Reliant Energy, Inc. | | | | |
| | 13,600 | | | 2.59%, 03/31/2014 (N) | | | 12,807 | |
| | | | | Texas Competitive Electric Holdings Co. LLC, Term Loan B2 | | | | |
| | 13,930 | | | 6.58%, 10/24/2014 (N) | | | 13,346 | |
| | | | | Texas Competitive Electric Holdings Co. LLC, Term Loan B3 | | | | |
| | 13,930 | | | 6.58%, 10/31/2014 (N) | | | 13,322 | |
| | | | | TPF Generation Holdings LLC | | | | |
| | 3,786 | | | 4.70%, 12/21/2013 (N) | | | 3,597 | |
| | 7,000 | | | 6.95%, 12/21/2014 (N) | | | 6,248 | |
| | | | | TPF Generation Holdings LLC, Letter of Credit | | | | |
| | 753 | | | 4.60%, 12/21/2013 (N) | | | 711 | |
| | | | | TPF Generation Holdings LLC, Revolver | | | | |
| | 236 | | | 4.60%, 12/21/2011 (N) | | | 223 | |
| | | | | | | | | |
| | | | | | | | | | | | 128,818 | |
| | | | | | | | | | | | | |
| | | | | Total senior floating rate interests: non-investment grade
(cost $2,856,706) | | $ | 2,556,835 | |
| | | | | | | | | | | | | |
| | | | | | | | | | | | | |
| Shares | | | | | | | | | |
| |
| COMMON STOCK — 0.0% |
| | | | | Utilities — 0.0% |
| | 4 | | | Calpine Corp. (D) | | $ | 75 | |
| | | | | | | | | |
| | | | | Total common stock
(cost $—) | | $ | 75 | |
| | | | | | | | | |
| | | | | Total long-term investments
(cost $3,019,928) | | $ | 2,703,639 | |
| | | | | | | | | | | | | |
| | | | | | | | | | | | | |
Principal
| | | | | | | | | |
| Amount | | | | | | | | | |
| |
| SHORT-TERM INVESTMENTS — 7.1% |
| | | | | Finance — 4.2% |
| | | | | BNP Paribas Finance | | | | |
| $ | 30,731 | | | 2.44%, 05/01/2008 | | $ | 30,729 | |
| | | | | Deutsche Bank | | | | |
| | 30,000 | | | 2.30%, 05/01/2008 | | | 29,998 | |
| | | | | Rabobank USA | | | | |
| | 31,100 | | | 2.31%, 05/01/2008 | | | 31,098 | |
| | | | | Societe Generale NA | | | | |
| | 29,915 | | | 2.45%, 05/01/2008 | | | 29,913 | |
| | | | | | | | | |
| | | | | | | | | | | | 121,738 | |
| | | | | | | | | | | | | |
| | | | | | | | | | | | | |
| | | | | | | | | | | | | |
| Shares | | | | | | | | | |
| |
| | | | | Investment Pools and Funds — 0.7% |
| | 19,669 | | | State Street Bank Money Market Fund | | | 19,669 | |
| | | | | | | | | | | | | |
| | | | | | | | | | | | | |
Principal
| | | | | | | | | |
| Amount | | | | | | | | | |
| |
| | | | | Repurchase Agreements — 2.2% |
| | | | | BNP Paribas Securities Corp. Repurchase Agreement (maturing on 05/01/2008 in the amount of $18,578, collateralized by U.S. Treasury Bond 5.50%, 2028, value of $19,162) | | | | |
| $ | 18,577 | | | 1.90% dated 04/30/2008 | | | 18,577 | |
The accompanying notes are an integral part of these financial statements.
149
The Hartford Floating Rate Fund
Schedule of Investments — (continued)
April 30, 2008 (Unaudited)
(000’s Omitted)
| | | | | | | | | | | | | |
Principal
| | | | | | | | Market
| |
| Amount | | | | | | | | Value (W) | |
| |
| | | | | Repurchase Agreements — (continued) |
| | | | | RBS Greenwich Capital Markets Repurchase Agreement (maturing on 05/01/2008 in the amount of $18,578, collateralized by U. S. Treasury Note 4.50%, 2011, value of $19,024) | | | | |
| $ | 18,577 | | | 1.90% dated 04/30/2008 | | $ | 18,577 | |
| | | | | UBS Securities, Inc. Repurchase Agreement (maturing on 05/01/2008 in the amount of $26,964, collateralized by U.S. Treasury Bond 6.00% — 8.75%, 2020 — 2026, U.S. Treasury Note 4.75% — 13.25%, 2008 — 2016, value of $27,618) | | | | |
| | 26,962 | | | 1.90% dated 04/30/2008 | | | 26,962 | |
| | | | | | | | | |
| | | | | | | | | | | | 64,116 | |
| | | | | | | | | | | | | |
| | | | | Total short-term investments
(cost $205,523) | | $ | 205,523 | |
| | | | | | | | | |
| | | | | Total investments
(cost $3,225,451) (C) | | | 99.8 | % | | $ | 2,909,162 | |
| | | | | Other assets and liabilities | | | 0.2 | % | | | 6,648 | |
| | | | | | | | | | | | | |
| | | | | Total net assets | | | 100.0 | % | | $ | 2,915,810 | |
| | | | | | | | | | | | | |
| |
| Note: | Percentage of investments as shown is the ratio of the total market value to total net assets. Market value of investments in foreign securities represents 2.09% of total net assets at April 30, 2008. |
| |
| | Foreign securities that are principally traded on certain foreign markets are adjusted daily pursuant to a third party pricing service methodology approved by the Board of Directors in order to reflect an adjustment for factors occurring after the close of the foreign market but before the close of the New York Stock Exchange. |
| | |
| (C) | | At April 30, 2008, the cost of securities for federal income tax purposes was $3,227,189 and the aggregate gross unrealized appreciation and depreciation based on that cost were: |
| | | | | |
| Unrealized Appreciation | | $ | 880 | |
| Unrealized Depreciation | | | (318,907 | ) |
| | | | | |
| Net Unrealized Depreciation | | $ | (318,027 | ) |
| | | | | |
| | |
| # | | This security, or a portion of this security, has been segregated to cover funding requirements on investment transactions settling in the future. |
| |
| (AA) | | The interest rate disclosed for these securities represents an estimated average coupon as of April 30, 2008. |
| |
| (D) | | Currently non-income producing. |
| |
| (I) | | Securities issued within terms of a private placement memorandum, exempt from registration under Section 144A of the Securities Act of 1933, as amended, and may be sold only to qualified institutional buyers. Pursuant to guidelines adopted by the Board of Directors, these issues are determined to be liquid. The aggregate value of these securities at April 30, 2008, was $18,856, which represents 0.65% of total net assets. |
| |
| (L) | | Variable rate securities; the rate reported is the coupon rate in effect at April 30, 2008. |
| |
| (N) | | The interest rate disclosed for these securities represents the average coupon as of April 30, 2008. |
| |
| (Q) | | The cost of securities purchased on a when-issued or delayed delivery basis at April 30, 2008 was $55,667. |
| |
| (V) | | Senior loans in which the Fund invests generally pay interest rates which are periodically adjusted by reference to a base short-term, floating lending rate plus a premium. These base lending rates are generally (i) the lending rate offered by one or more major European banks, such as the London Inter-Bank Offered Rate (LIBOR), (ii) the prime rate offered by one or more major United States Banks, or (iii) the bank’s certificate of deposit rate. Senior floating rate interests often require prepayments from excess cash flows or permit the borrower to repay at its election. The rate at which the borrower repays cannot be predicted with accuracy. As a result, the actual remaining maturity may be substantially less than the stated maturities shown. The interest rate indicated is the rate in effect at April 30, 2008. |
| |
| (B) | | All principal amounts are in U.S. dollars unless otherwise indicated. |
| | |
| (H) | | The following securities are considered illiquid. Illiquid securities are often purchased in private placement transactions, are not registered under the Securities Act of 1933 and may have contractual restrictions on resale. A security may also be considered illiquid if the security lacks a readily available market or if its valuation has not changed for a certain period of time. |
| | | | | | | | | | | |
Period
| | | | | | | | |
Acquired | | Shares/Par | | | Security | | Cost Basis | |
| 06/2007 | | | 2,000 | | | Advanstar Holdings Corp., 7.61%, 12/01/2014 | | $ | 2,000 | |
| 04/2007 | | | 2,600 | | | Bayview Financial Acquisition Trust, 5.04%, 05/28/2037 | | | 2,600 | |
04/2006 –
05/2007 | | | 8,646 | | | Buckeye Check Cashing, Inc., 5.51%, 05/01/2012 | | | 8,660 | |
03/2007 –
04/2008 | | | 5,496 | | | Cardinal Logistics Management, 6.61%, 09/23/2013 | | | 5,372 | |
02/2007 –
04/2007 | | | 8,476 | | | Cellnet Technology, Inc., 6.00%, 08/26/2011 | | | 8,501 | |
| 10/2007 | | | 2,020 | | | Centaur LLC, 10.20%, 10/30/2013 | | | 1,983 | |
09/2006 –
04/2008 | | | 4,997 | | | Center for Diagnostic Imaging, 6.20%, 12/31/2010 | | | 4,754 | |
03/2007 –
08/2007 | | | 4,500 | | | F & W Publications, Inc., 6.85%, 08/05/2012 | | | 4,489 | |
| 11/2007 | | | 2,993 | | | Generics International, Inc., 6.20%, 11/19/2014 | | | 2,963 | |
| 03/2007 | | | 17,001 | | | Goldman Sachs Mortgage Securities Corp., 4.24%, 02/01/2009 - Reg D | | | 17,001 | |
| 06/2006 | | | 1,337 | | | Greektown Holdings LLC, 5.44%, 12/01/2012 | | | 1,344 | |
| 02/2007 | | | 8,000 | | | Green Valley Ranch Gaming LLC, 6.34%, 02/09/2014 | | | 8,033 | |
11/2006 –
04/2008 | | | 6,407 | | | Greenwood Racing, Inc., 5.12%, 11/14/2011 | | | 6,214 | |
| 04/2007 | | | 5,000 | | | Helios Finance L.P., 4.89%, 10/20/2014 - 144A | | | 5,000 | |
The accompanying notes are an integral part of these financial statements.
150
| | | | | | | | | | | |
Period
| | | | | | | | |
Acquired | | Shares/Par | | | Security | | Cost Basis | |
| 04/2007 | | | 3,960 | | | HMSC Corp., 4.97%, 10/03/2014 | | $ | 3,964 | |
| 06/2007 | | | 3,970 | | | Jacobson Cos., 5.35%, 06/19/2014 | | | 3,970 | |
06/2007 –
12/2007 | | | 5,535 | | | Lake At Las Vegas Joint Venture LLC, First Lien Term Loan, 11.95%, 02/01/2010 | | | 5,501 | |
| 06/2007 | | | 735 | | | Lake At Las Vegas Joint Venture LLC, Revolver, 12.95%, 02/01/2010 | | | 730 | |
| 04/2008 | | | 1,000 | | | LPL Holdings, Inc., 10.75%, 12/15/2015 - 144A | | | 983 | |
03/2007 –
05/2007 | | | 19,182 | | | MacQuarie Aircraft Leasing Finance S.A., 4.59%, 11/29/2013 | | | 19,182 | |
| 03/2007 | | | 4,984 | | | MacQuarie Aircraft Leasing Finance S.A., 7.09%, 11/29/2013 | | | 4,984 | |
| 03/2007 | | | 4,672 | | | Mother’s Work, Inc., 3.36%, 03/09/2013 | | | 4,672 | |
| 07/2007 | | | 5,970 | | | Nelson Education, 5.20%, 07/05/2014 | | | 5,955 | |
| 07/2007 | | | 4,000 | | | New World Gaming Partners Ltd., 8.19%, 03/31/2015 | | | 4,000 | |
| 07/2007 | | | 831 | | | New World Gaming Partners Ltd., First Lien Term Loan, 5.19%, 09/30/2014 | | | 831 | |
| 05/2006 | | | 1,500 | | | November Land Investors LLC, 11.11%, 05/09/2012 | | | 1,512 | |
12/2006 –
06/2007 | | | 8,718 | | | Piere Foods, Inc., 6.97%, 06/30/2010 | | | 8,743 | |
| 09/2007 | | | 4,478 | | | Scitor Acquisition Corp., 7.12%, 09/26/2014 | | | 4,433 | |
| 06/2007 | | | 4,000 | | | Sheridan Group, Inc., 8.46%, 06/15/2015 | | | 4,000 | |
| 03/2007 | | | 992 | | | Southern Graphic Systems, 5.25%, 12/30/2011 | | | 992 | |
| 12/2005 | | | 1,955 | | | Southern Graphic Systems, 6.91%, 12/30/2011 | | | 1,955 | |
06/2006 –
04/2007 | | | 21,556 | | | Spanish Broadcasting System, Inc., 4.45%, 06/10/2012 | | | 21,569 | |
10/2006 –
05/2007 | | | 7,336 | | | Sports Authority, Inc., 4.95%, 04/25/2013 | | | 7,335 | |
| 03/2007 | | | 4,453 | | | Structured Asset Securities Corp., 5.39%, 02/25/2037 | | | 4,380 | |
| 03/2007 | | | 4,363 | | | Wells Fargo Home Equity Trust, 5.15%, 03/25/2037 | | | 4,169 | |
| 06/2007 | | | 16,000 | | | WideOpenWest Finance LLC, 4.15%, 07/01/2014 | | | 15,920 | |
01/2006 –
03/2007 | | | 4,729 | | | Yonkers Racing Corp., 8.94%, 08/12/2011 | | | 4,707 | |
| 07/2006 | | | 2,248 | | | Youth & Family Centered Services, Inc., 6.94%, 07/10/2013 | | | 2,248 | |
| | |
| | The aggregate value of these securities at April 30, 2008 was $166,056 which represents 5.70% of total net assets. |
| |
| (W) | | See Note 2b of accompanying Notes to Financial Statements regarding valuation of securities. |
The accompanying notes are an integral part of these financial statements.
151
The Hartford Fundamental Growth Fund
Schedule of Investments
April 30, 2008 (Unaudited)
(000’s Omitted)
| | | | | | | | | | | | | |
| | | | | | | | | Market
| |
| Shares | | | | | | | | Value (W) | |
| COMMON STOCK — 95.0% |
| | | | | Basic Materials — 4.8% |
| | 22 | | | Companhia Vale do Rio Doce ADR | | $ | 867 | |
| | 12 | | | Freeport-McMoRan Copper & Gold, Inc. (G) | | | 1,388 | |
| | 3 | | | Potash Corp. of Saskatchewan, Inc. | | | 607 | |
| | | | | | | | | |
| | | | | | | | | | | | 2,862 | |
| | | | | | | | | | | | | |
| | | | | Capital Goods — 6.7% |
| | 10 | | | ABB Ltd. ADR | | | 301 | |
| | 9 | | | Caterpillar, Inc. | | | 753 | |
| | 11 | | | Deere & Co. | | | 883 | |
| | 10 | | | Honeywell International, Inc. | | | 588 | |
| | 10 | | | Northrop Grumman Corp. | | | 699 | |
| | 12 | | | Terex Corp. (D)(G) | | | 843 | |
| | | | | | | | | |
| | | | | | | | | | | | 4,067 | |
| | | | | | | | | | | | | |
| | | | | Consumer Cyclical — 9.0% |
| | 23 | | | Coach, Inc. (D)(G) | | | 822 | |
| | 23 | | | Gymboree Corp. (D)(G) | | | 994 | |
| | 28 | | | Kohl’s Corp. (D)(G) | | | 1,363 | |
| | 17 | | | NIKE, Inc. Class B (G) | | | 1,155 | |
| | 8 | | | Philip Morris International, Inc. (D) | | | 413 | |
| | 32 | | | Staples, Inc. (G) | | | 701 | |
| | | | | | | | | |
| | | | | | | | | | | | 5,448 | |
| | | | | | | | | | | | | |
| | | | | Consumer Staples — 2.9% |
| | 13 | | | PepsiCo, Inc. | | | 898 | |
| | 12 | | | Procter & Gamble Co. | | | 824 | |
| | | | | | | | | |
| | | | | | | | | | | | 1,722 | |
| | | | | | | | | | | | | |
| | | | | Energy — 9.7% |
| | 9 | | | Apache Corp. | | | 1,199 | |
| | 6 | | | Devon Energy Corp. | | | 635 | |
| | 2 | | | EOG Resources, Inc. (G) | | | 300 | |
| | 16 | | | Halliburton Co. | | | 735 | |
| | 5 | | | Hess Corp. | | | 488 | |
| | 16 | | | Noble Corp. (G) | | | 900 | |
| | 7 | | | Schlumberger Ltd. | | | 654 | |
| | 6 | | | Transocean, Inc. (G) | | | 949 | |
| | | | | | | | | |
| | | | | | | | | | | | 5,860 | |
| | | | | | | | | | | | | |
| | | | | Finance — 10.5% |
| | 16 | | | Aflac, Inc. | | | 1,060 | |
| | 19 | | | American International Group, Inc. | | | 855 | |
| | 40 | | | Banco Itau Holding Financeira S.A. | | | 1,122 | |
| | 16 | | | Bank of America Corp. | | | 593 | |
| | 27 | | | Invesco Ltd. (G) | | | 695 | |
| | 19 | | | MBIA, Inc. | | | 196 | |
| | 18 | | | Wachovia Corp. (G) | | | 522 | |
| | 26 | | | Wellpoint, Inc. (D)(G) | | | 1,293 | |
| | | | | | | | | |
| | | | | | | | | | | | 6,336 | |
| | | | | | | | | | | | | |
| | | | | Health Care — 15.4% |
| | 14 | | | Abbott Laboratories | | | 712 | |
| | 18 | | | Amgen, Inc. (D) | | | 754 | |
| | 19 | | | AstraZeneca plc ADR (G) | | | 781 | |
| | 22 | | | Coventry Health Care, Inc. (D)(G) | | | 962 | |
| | 19 | | | Covidien Ltd. | | | 873 | |
| | 23 | | | CVS/Caremark Corp. | | | 916 | |
| | 10 | | | Genentech, Inc. (D) | | | 696 | |
| | 10 | | | Johnson & Johnson | | | 644 | |
| | 13 | | | Medtronic, Inc. (G) | | | 638 | |
| | 20 | | | St. Jude Medical, Inc. (D)(G) | | | 893 | |
| | 17 | | | Teva Pharmaceutical Industries Ltd. ADR | | | 795 | |
| | 9 | | | Zimmer Holdings, Inc. (D)(G) | | | 630 | |
| | | | | | | | | |
| | | | | | | | | | | | 9,294 | |
| | | | | | | | | | | | | |
| | | | | Services — 5.8% |
| | 20 | | | Accenture Ltd. Class A (G) | | | 740 | |
| | 16 | | | Autodesk, Inc. (D)(G) | | | 612 | |
| | 21 | | | Manpower, Inc. (G) | | | 1,416 | |
| | 6 | | | Priceline.com, Inc. (D)(G) | | | 753 | |
| | | | | | | | | |
| | | | | | | | | | | | 3,521 | |
| | | | | | | | | | | | | |
| | | | | Technology — 28.2% |
| | 6 | | | Apple, Inc. (D) | | | 1,026 | |
| | 39 | | | Applied Materials, Inc. (G) | | | 724 | |
| | 26 | | | AT&T, Inc. | | | 995 | |
| | 65 | | | Cisco Systems, Inc. (D) | | | 1,656 | |
| | 58 | | | Corning, Inc. | | | 1,557 | |
| | 16 | | | General Electric Co. | | | 507 | |
| | 2 | | | Google, Inc. (D) | | | 1,148 | |
| | 34 | | | Hewlett-Packard Co. | | | 1,576 | |
| | 29 | | | Infosys Technologies Ltd. ADR (G) | | | 1,263 | |
| | 27 | | | Intel Corp. | | | 590 | |
| | 9 | | | International Business Machines Corp. (G) | | | 1,135 | |
| | 54 | | | Microsoft Corp. | | | 1,529 | |
| | 17 | | | Nokia Corp. | | | 502 | |
| | 56 | | | Oracle Corp. (D) | | | 1,176 | |
| | 16 | | | Qualcomm, Inc. | | | 704 | |
| | 8 | | | Research In Motion Ltd. (D) | | | 912 | |
| | | | | | | | | |
| | | | | | | | | | | | 17,000 | |
| | | | | | | | | | | | | |
| | | | | Transportation — 0.5% |
| | 5 | | | Norfolk Southern Corp. (G) | | | 304 | |
| | | | | Utilities — 1.5% |
| | 11 | | | Exelon Corp. | | | 898 | |
| | | | | | | | | |
| | | | | Total common stock
(cost $53,066) | | $ | 57,312 | |
| | | | | | | | | | | | | |
| | | | | | | | | | | | | |
Principal
| | | | | | | | | |
| Amount | | | | | | | | | |
| |
| SHORT-TERM INVESTMENTS — 32.4% |
| | | | | Repurchase Agreements — 5.0% |
| | | | | Banc of America Securities TriParty Joint Repurchase Agreement (maturing on 05/01/2008 in the amount of $1,118, collateralized by FHLMC 5.00%, 2035, value of $1,140) | | | | |
| $ | 1,118 | | | 1.98% dated 04/30/2008 | | $ | 1,118 | |
| | | | | BNP Paribas Securities Corp. TriParty Joint Repurchase Agreement (maturing on 05/01/2008 in the amount of $548, collateralized by FNMA 5.50% — 6.50%, 2036 — 2038, value of $559) | | | | |
| | 548 | | | 2.00% dated 04/30/2008 | | | 548 | |
| | | | | Deutsche Bank Securities Joint Repurchase Agreement (maturing on 05/01/2008 in the amount of $1, collateralized by U. S. Treasury Note 3.63%, 2009, value of $1) | | | | |
| | 1 | | | 1.90% dated 04/30/2008 | | | 1 | |
The accompanying notes are an integral part of these financial statements.
152
| | | | | | | | | | | | | |
Principal
| | | | | | | | Market
| |
| Amount | | | | | | | | Value (W) | |
| |
| | | | | | | | | | | | | |
| SHORT-TERM INVESTMENTS — (continued) |
| | | | | | | | | | | | | |
| | | | | Repurchase Agreements — (continued) |
| | | | | Deutsche Bank Securities TriParty Joint Repurchase Agreement (maturing on 05/01/2008 in the amount of $681, collateralized by FHLMC 4.50% — 7.00%, 2016 — 2038, value of $695) | | | | |
| $ | 681 | | | 2.00% dated 04/30/2008 | | $ | 681 | |
| | | | | JP Morgan Chase TriParty Joint Repurchase Agreement (maturing on 05/01/2008 in the amount of $657, collateralized by FNMA 4.50% — 7.00%, 2020 — 2038, value of $670) | | | | |
| | 657 | | | 1.96% dated 04/30/2008 | | | 657 | |
| | | | | | | | | |
| | | | | | | | | | | | 3,005 | |
| | | | | | | | | | | | | |
| | | | | | | | | | | | | |
| | | | | | | | | | | | | |
| Shares | | | | | | | | | |
| |
| | | | | Securities Purchased with Proceeds from Security Lending — 27.4% |
| | | | | Cash Collateral Reinvestment Fund: |
| | 16,528 | | | Navigator Prime Portfolio | | | 16,528 | |
| | | | | | | | | |
| | | | | Total short-term investments
(cost $19,533) | | $ | 19,533 | |
| | | | | | | | | |
| | | | | Total investments
(cost $72,599) (C) | | | 127.4 | % | | $ | 76,845 | |
| | | | | Other assets and liabilities | | | (27.4 | )% | | | (16,531 | ) |
| | | | | | | | | | | | | |
| | | | | Total net assets | | | 100.0 | % | | $ | 60,314 | |
| | | | | | | | | | | | | |
| |
| Note: | Percentage of investments as shown is the ratio of the total market value to total net assets. Market value of investments in foreign securities represents 11.86% of total net assets at April 30, 2008. |
| |
| | Foreign securities that are principally traded on certain foreign markets are adjusted daily pursuant to a third party pricing service methodology approved by the Board of Directors in order to reflect an adjustment for factors occurring after the close of the foreign market but before the close of the New York Stock Exchange. |
| | |
| (C) | | At April 30, 2008, the cost of securities for federal income tax purposes was $72,673 and the aggregate gross unrealized appreciation and depreciation based on that cost were: |
| | | | | |
| Unrealized Appreciation | | $ | 6,479 | |
| Unrealized Depreciation | | | (2,307 | ) |
| | | | | |
| Net Unrealized Appreciation | | $ | 4,172 | |
| | | | | |
| | |
| (D) | | Currently non-income producing. |
| |
| (G) | | Security is partially on loan at April 30, 2008. |
| |
| (W) | | See Note 2b of accompanying Notes to Financial Statements regarding valuation of securities. |
The accompanying notes are an integral part of these financial statements.
153
The Hartford Global Communications Fund
Schedule of Investments
April 30, 2008 (Unaudited)
(000’s Omitted)
| | | | | | | | | | | | | |
| | | | | | | | | Market
| |
| Shares | | | | | | | | Value (W) | |
| COMMON STOCK — 88.6% |
| | | | | Argentina — 0.9% |
| | 23 | | | Telecom de Argentina ADR (D) | | $ | 397 | |
| | | | | Brazil — 6.8% |
| | 65 | | | Brasil Telecom S.A. ADR | | | 2,367 | |
| | 32 | | | Tele Norte Leste Participacoes S.A. ADR | | | 735 | |
| | | | | | | | | |
| | | | | | | | | | | | 3,102 | |
| | | | | | | | | | | | | |
| | | | | Canada — 0.9% |
| | 9 | | | Telus Corp. | | | 409 | |
| | | | | Egypt — 4.6% |
| | 13 | | | Mobinil-Egyptian Mobile Service | | | 494 | |
| | 22 | | | Orascom Telecom Holding SAE GDR | | | 1,631 | |
| | | | | | | | | |
| | | | | | | | | | | | 2,125 | |
| | | | | | | | | | | | | |
| | | | | France — 4.7% |
| | 49 | | | France Telecom S.A. | | | 1,523 | |
| | 12 | | | Neuf Cegtel (G) | | | 647 | |
| | | | | | | | | |
| | | | | | | | | | | | 2,170 | |
| | | | | | | | | | | | | |
| | | | | Germany — 3.1% |
| | 79 | | | Deutsche Telekom AG | | | 1,418 | |
| | | | | Indonesia — 2.5% |
| | 30 | | | P.T. Telekomunikasi Indonesia ADR (G) | | | 1,161 | |
| | | | | Israel — 4.1% |
| | 15 | | | Cellcom Israel Ltd. | | | 509 | |
| | 60 | | | Partner Communications Co., Ltd. ADR (G) | | | 1,389 | |
| | | | | | | | | |
| | | | | | | | | | | | 1,898 | |
| | | | | | | | | | | | | |
| | | | | Italy — 3.1% |
| | 865 | | | Telecom Italia S.p.A. | | | 1,408 | |
| | | | | Luxembourg — 6.4% |
| | 27 | | | Millicom International Cellular S.A. (D) | | | 2,927 | |
| | | | | Norway — 8.0% |
| | 183 | | | Telenor ASA | | | 3,672 | |
| | | | | Russia — 11.3% |
| | 44 | | | AFK Sistema GDR | | | 1,344 | |
| | 20 | | | Mobile Telesystems OJSC ADR | | | 1,544 | |
| | 76 | | | Vimpel-Communications ADR | | | 2,298 | |
| | | | | | | | | |
| | | | | | | | | | | | 5,186 | |
| | | | | | | | | | | | | |
| | | | | South Africa — 4.9% |
| | 117 | | | MTN Group Ltd. | | | 2,223 | |
| | | | | Spain — 8.7% |
| | 46 | | | Telefonica S.A. ADR | | | 3,964 | |
| | | | | Turkey — 4.0% |
| | 92 | | | Turkcell Iletisim Hizmetleri A.S. ADR (D) | | | 1,852 | |
| | | | | United Kingdom — 1.1% |
| | 197 | | | Thus Group plc (D) | | | 484 | |
| | | | | United States — 13.5% |
| | 13 | | | American Tower Corp. Class A (D) | | | 569 | |
| | 9 | | | Atlantic Tele-Network, Inc. | | | 274 | |
| | 15 | | | Equinix, Inc. (D)(G) | | | 1,329 | |
| | 62 | | | NII Holdings, Inc. Class B (D) | | | 2,854 | |
| | 59 | | | Time Warner Telecom, Inc. Class A (D) | | | 1,164 | |
| | | | | | | | | |
| | | | | | | | | | | | 6,190 | |
| | | | | | | | | | | | | |
| | | | | Total common stock
(cost $35,439) | | $ | 40,586 | |
| | | | | | | | | | | | | |
| | | | | | | | | | | | | |
| WARRANTS — 3.0% |
| | | | | India — 3.0% |
| | 62 | | | Citigroup Global Certificate — Bharti Televentures (H) | | $ | 1,369 | |
| | | | | | | | | |
| | | | | Total warrants
(cost $684) | | $ | 1,369 | |
| | | | | | | | | | | | | |
| | | | | | | | | | | | | |
| PREFERRED STOCK — 5.3% |
| | | | | Brazil — 5.3% |
| | 16 | | | Telecomunicacoes de Sao Paulo S.A. (G) | | $ | 416 | |
| | 35 | | | Telemar Norte Leste S.A. | | | 2,016 | |
| | | | | | | | | |
| | | | | Total preferred stock
(cost $1,318) | | $ | 2,432 | |
| | | | | | | | | |
| | | | | Total long-term investments
(cost $37,441) | | $ | 44,387 | |
| | | | | | | | | | | | | |
| | | | | | | | | | | | | |
Principal
| | | | | | | | | |
| Amount | | | | | | | | | |
| |
| SHORT-TERM INVESTMENTS — 10.6% |
| | | | | Repurchase Agreements — 2.3% |
| | | | | Banc of America Securities TriParty Joint Repurchase Agreement (maturing on 05/01/2008 in the amount of $389, collateralized by FHLMC 5.00%, 2035, value of $396) | | | | |
| $ | 389 | | | 1.98% dated 04/30/2008 | | $ | 389 | |
| | | | | BNP Paribas Securities Corp. TriParty Joint Repurchase Agreement (maturing on 05/01/2008 in the amount of $191, collateralized by FNMA 5.50% — 6.50%, 2036 — 2038, value of $194) | | | | |
| | 191 | | | 2.00% dated 04/30/2008 | | | 191 | |
| | | | | Deutsche Bank Securities Joint Repurchase Agreement (maturing on 05/01/2008 in the amount of $—, collateralized by U. S. Treasury Note 3.63%, 2009, value of $—) | | | | |
| | — | | | 1.90% dated 04/30/2008 | | | — | |
| | | | | Deutsche Bank Securities TriParty Joint Repurchase Agreement (maturing on 05/01/2008 in the amount of $237, collateralized by FHLMC 4.50% — 7.00%, 2016 — 2038, value of $242) | | | | |
| | 237 | | | 2.00% dated 04/30/2008 | | | 237 | |
| | | | | JP Morgan Chase TriParty Joint Repurchase Agreement (maturing on 05/01/2008 in the amount of $228, collateralized by FNMA 4.50% — 7.00%, 2020 — 2038, value of $233) | | | | |
| | 228 | | | 1.96% dated 04/30/2008 | | | 228 | |
| | | | | | | | | |
| | | | | | | | | | | | 1,045 | |
| | | | | | | | | | | | | |
| | | | | | | | | | | | | |
The accompanying notes are an integral part of these financial statements.
154
| | | | | | | | | | | | | |
Principal
| | | | | | | | Market
| |
| Amount | | | | | | | | Value (W) | |
| |
| | | | | | | | | | | | | |
| SHORT-TERM INVESTMENTS — (continued) |
| | | | | Securities Purchased with Proceeds from Security Lending — 8.3% |
| | | | | Cash Collateral Reinvestment Fund: |
| $ | 3,810 | | | Goldman Sachs FS Prime Obligation/Institutional Fund | | $ | 3,810 | |
| | | | | | | | | |
| | | | | Total short-term investments
(cost $4,855) | | $ | 4,855 | |
| | | | | | | | | |
| | | | | Total investments
(cost $42,296) (C) | | | 107.5 | % | | $ | 49,242 | |
| | | | | Other assets and liabilities | | | (7.5 | )% | | | (3,437 | ) |
| | | | | | | | | | | | | |
| | | | | Total net assets | | | 100.0 | % | | $ | 45,805 | |
| | | | | | | | | | | | | |
| |
| Note: | Percentage of investments as shown is the ratio of the total market value to total net assets. Market value of investments in foreign securities represents 83.39% of total net assets at April 30, 2008. |
| |
| | Foreign securities that are principally traded on certain foreign markets are adjusted daily pursuant to a third party pricing service methodology approved by the Board of Directors in order to reflect an adjustment for factors occurring after the close of the foreign market but before the close of the New York Stock Exchange. |
| | |
| (C) | | At April 30, 2008, the cost of securities for federal income tax purposes was $42,945 and the aggregate gross unrealized appreciation and depreciation based on that cost were: |
| | | | | |
| Unrealized Appreciation | | $ | 8,533 | |
| Unrealized Depreciation | | | (2,236 | ) |
| | | | | |
| Net Unrealized Appreciation | | $ | 6,297 | |
| | | | | |
| | |
| (D) | | Currently non-income producing. |
| |
| (G) | | Security is partially on loan at April 30, 2008. |
| |
| (H) | | The following securities are considered illiquid. Illiquid securities are often purchased in private placement transactions, are not registered under the Securities Act of 1933 and may have contractual restrictions on resale. A security may also be considered illiquid if the security lacks a readily available market or if its valuation has not changed for a certain period of time. |
| | | | | | | | | | | |
Period
| | | | | | | | |
Acquired | | Shares/Par | | | Security | | Cost Basis | |
08/2005 –
01/2008 | | | 62 | | | Citigroup Global Certificate - Bharti Televentures - 144A | | $ | 684 | |
| | |
| | The aggregate value of these securities at April 30, 2008 was $1,369 which represents 2.99% of total net assets. |
Forward Foreign Currency Contracts Outstanding at April 30, 2008
| | | | | | | | | | | | | | | | | |
| | | | | | | | | | | | Unrealized
| |
| | | Market
| | | Contract
| | | Delivery
| | | Appreciation/
| |
Description | | Value (W) | | | Amount | | | Date | | | (Depreciation) | |
| |
| South African Rand (Sell) | | $ | 91 | | | $ | 91 | | | | 05/09/08 | | | $ | — | |
| | | | | | | | | | | | | | | | | |
| | |
| (W) | | See Note 2b of accompanying Notes to Financial Statements regarding valuation of securities. |
Diversification by Industry
as of April 30, 2008
| | | | | |
| | | Percentage of
|
Industry | | Net Assets |
| Electrical Equipment Manufacturing — Component Other | | | 1.4 | % |
| |
| |
| Internet Providers & Web Search Portal | | | 4.0 | |
| |
| |
| Other Telecommunications | | | 32.9 | |
| |
| |
| Telecommunication Resellers | | | 8.7 | |
| |
| |
| Wired Telecommunications Carriers | | | 9.1 | |
| |
| |
| Wireless Communications Services | | | 8.8 | |
| |
| |
| Wireless Telecommunications Carriers | | | 32.0 | |
| |
| |
| Short-Term Investments | | | 10.6 | |
| |
| |
| Other Assets and Liabilities | | | (7.5 | ) |
| |
| |
Total | | | 100.0 | % |
| |
| |
The accompanying notes are an integral part of these financial statements.
155
The Hartford Global Equity Fund
Schedule of Investments
April 30, 2008 (Unaudited)
(000’s Omitted)
| | | | | | | | | | | | | |
| | | | | | | | | Market
| |
| Shares | | | | | | | | Value (W) | |
| COMMON STOCK — 94.6% |
| | | | | Argentina — 0.0% |
| | — | | | Telecom de Argentina ADR (D) | | $ | 5 | |
| | | | | Australia — 1.3% |
| | 1 | | | BHP Billiton Ltd. ADR | | | 48 | |
| | 5 | | | Cockatoo Ridge Wines | | | — | |
| | 1 | | | Rio Tinto Ltd. | | | 147 | |
| | — | | | Westfield Group | | | 5 | |
| | — | | | Woodside Petroleum Ltd. | | | 18 | |
| | 6 | | | Zinifex Ltd. | | | 59 | |
| | | | | | | | | |
| | | | | | | | | | | | 277 | |
| | | | | | | | | | | | | |
| | | | | Austria — 0.6% |
| | 2 | | | OMV AG | | | 132 | |
| | | | | Belgium — 0.7% |
| | — | | | Groupe Bruxelles Lambert S.A. | | | 18 | |
| | 2 | | | UCB S.A. | | | 75 | |
| | 1 | | | Umicore (D) | | | 42 | |
| | | | | | | | | |
| | | | | | | | | | | | 135 | |
| | | | | | | | | | | | | |
| | | | | Brazil — 3.5% |
| | — | | | Amil Participacoes S.A. | | | 2 | |
| | 2 | | | Banco Itau Holding Financeira S.A. | | | 59 | |
| | 3 | | | Bolsa De Mercadorias e Futuros | | | 25 | |
| | 2 | | | Bovespa Holding S.A. | | | 23 | |
| | — | | | Brasil Brokers Participacoes (D) | | | 49 | |
| | 1 | | | Brasil Telecom S.A. ADR | | | 32 | |
| | — | | | Companhai Braasileira de Distribuicao Grupo Pao de Acucar ADR | | | 18 | |
| | 1 | | | Companhia Energetica de Minas Gerais ADR | | | 12 | |
| | 11 | | | Companhia Vale do Rio Doce ADR | | | 416 | |
| | 1 | | | Dufry South America Ltd. (D) | | | 14 | |
| | 2 | | | Marisa S.A. | | | 5 | |
| | 1 | | | Petroleo Brasileiro S.A. ADR | | | 61 | |
| | — | | | Profarma Distribuidora | | | 4 | |
| | — | | | Tele Norte Leste Participacoes S.A. ADR | | | 9 | |
| | — | | | Trisul S.A. | | | 1 | |
| | | | | | | | | |
| | | | | | | | | | | | 730 | |
| | | | | | | | | | | | | |
| | | | | Canada — 6.5% |
| | 2 | | | Agrium, Inc. | | | 134 | |
| | 1 | | | Agrium, Inc. ADR | | | 104 | |
| | 3 | | | Bank of Montreal | | | 141 | |
| | 1 | | | Bank of Nova Scotia | | | 62 | |
| | — | | | Brookfield Asset Management, Inc. | | | 8 | |
| | 2 | | | Cameco Corp. | | | 57 | |
| | 1 | | | Canadian Imperial Bank of Commerce | | | 37 | |
| | 2 | | | Canadian Natural Resources Ltd. ADR | | | 170 | |
| | 1 | | | Canadian Oil SandsTrust | | | 27 | |
| | 1 | | | Canadian Western Bank | | | 32 | |
| | — | | | EnCana Corp. | | | 24 | |
| | 3 | | | First National Financial, Inc. | | | 35 | |
| | 2 | | | Husky Energy, Inc. | | | 99 | |
| | — | | | MDC Partners, Inc. (D) | | | 4 | |
| | — | | | Petro-Canada | | | 15 | |
| | — | | | Potash Corp. of Saskatchewan, Inc. | | | 74 | |
| | — | | | Potash Corp. of Saskatchewan, Inc. ADR | | | 69 | |
| | — | | | Research In Motion Ltd. (D) | | | 45 | |
| | — | | | Suncor Energy, Inc. | | | 34 | |
| | 1 | | | Talisman Energy, Inc. | | | 14 | |
| | 3 | | | Talisman Energy, Inc. ADR | | | 65 | |
| | — | | | Telus Corp. | | | 4 | |
| | 1 | | | The Toronto-Dominion Bank | | | 39 | |
| | 1 | | | The Toronto-Dominion Bank ADR | | | 57 | |
| | | | | | | | | |
| | | | | | | | | | | | 1,350 | |
| | | | | | | | | | | | | |
| | | | | China — 1.2% |
| | — | | | Airmedia Group, Inc. (D) | | | 6 | |
| | 155 | | | Bank of China Ltd. | | | 79 | |
| | 26 | | | China Dongxiang Group Co. (D) | | | 11 | |
| | 42 | | | Datang International Power | | | 29 | |
| | 2 | | | Focus Media Holding Ltd. ADR (D) | | | 60 | |
| | 6 | | | Foxconn International Holdings Ltd. (D) | | | 9 | |
| | 17 | | | Golden Eagle Retail Group Ltd. | | | 17 | |
| | 1 | | | Parkson Retail Group Ltd. | | | 13 | |
| | 17 | | | People’s Food Holdings | | | 14 | |
| | 1 | | | Sino-Ocean Land Holdings Ltd. (D) | | | 1 | |
| | 12 | | | Tingyi Holding Corp. | | | 16 | |
| | 30 | | | Yantai North Andre | | | 2 | |
| | | | | | | | | |
| | | | | | | | | | | | 257 | |
| | | | | | | | | | | | | |
| | | | | Denmark — 0.1% |
| | — | | | H. Lundbeck A/S | | | 10 | |
| | | | | Egypt — 0.5% |
| | — | | | Mobinil-Egyptian Mobile Service | | | 6 | |
| | 1 | | | Orascom Hotels & Development (D) | | | 24 | |
| | 1 | | | Orascom Telecom Holding SAE GDR | | | 75 | |
| | | | | | | | | |
| | | | | | | | | | | | 105 | |
| | | | | | | | | | | | | |
| | | | | France — 4.9% |
| | — | | | Accor S.A. | | | 3 | |
| | — | | | Alstom RGPT | | | 17 | |
| | 3 | | | Axa S.A. | | | 94 | |
| | — | | | BNP Paribas | | | 36 | |
| | 1 | | | Bouygues S.A. | | | 65 | |
| | 1 | | | Carrefour S.A. | | | 46 | |
| | — | | | Compagnie Generale de Geophysique-Veritas (D) | | | 25 | |
| | — | | | Electricite de France | | | 11 | |
| | 1 | | | France Telecom S.A. | | | 20 | |
| | — | | | Gaz de France | | | 12 | |
| | — | | | Ipsen | | | 21 | |
| | — | | | Neuf Cegtel | | | 8 | |
| | — | | | Pernod-Ricard | | | 24 | |
| | 1 | | | Peugeot S.A. | | | 86 | |
| | 4 | | | Rhodia S.A. (D) | | | 81 | |
| | 2 | | | Safran S.A. | | | 33 | |
| | 1 | | | Sanofi-Aventis S.A. | | | 50 | |
| | 2 | | | Sanofi-Aventis S.A. ADR | | | 70 | |
| | 1 | | | Societe Generale Class A | | | 117 | |
| | 1 | | | Suez S.A. | | | 44 | |
| | 1 | | | Total S.A. ADR | | | 59 | |
| | — | | | Unibail | | | 77 | |
| | — | | | Vivendi S.A. (D) | | | 10 | |
| | | | | | | | | |
| | | | | | | | | | | | 1,009 | |
| | | | | | | | | | | | | |
| | | | | Germany — 3.8% |
| | — | | | Adidas-Salomon AG | | | 16 | |
| | — | | | Beiersdorf AG (D) | | | 35 | |
| | 1 | | | Commerzbank AG | | | 50 | |
| | — | | | Deutsche Boerse AG | | | 52 | |
| | 1 | | | Deutsche Postbank AG | | | 61 | |
| | 1 | | | Deutsche Telekom AG | | | 13 | |
The accompanying notes are an integral part of these financial statements.
156
| | | | | | | | | | | | | |
| | | | | | | | | Market
| |
| Shares | | | | | | | | Value (W) | |
| | | | | | | | | | | | | |
| COMMON STOCK — (continued) |
| | | | | | | | | | | | | |
| | | | | Germany — (continued) |
| | 1 | | | E.On AG | | $ | 255 | |
| | 1 | | | Fresenius Medical Care AG ADR | | | 27 | |
| | 1 | | | Hochtief AG | | | 53 | |
| | — | | | Metro AG | | | 7 | |
| | — | | | Muenchener Rueckversicherungs-Gesellschaft AG | | | 53 | |
| | — | | | Patrizia Immobilien AG | | | 1 | |
| | 1 | | | Siemens AG | | | 170 | |
| | | | | | | | | |
| | | | | | | | | | | | 793 | |
| | | | | | | | | | | | | |
| | | | | Greece — 0.3% |
| | — | | | C Rokas S.A. (D) | | | 9 | |
| | 1 | | | Piraeus Bank S.A. | | | 43 | |
| | | | | | | | | |
| | | | | | | | | | | | 52 | |
| | | | | | | | | | | | | |
| | | | | Hong Kong — 0.8% |
| | 1 | | | ASM Pacific Technology | | | 10 | |
| | 60 | | | China Foods Ltd. | | | 35 | |
| | 1 | | | China Mobile Ltd. | | | 15 | |
| | 16 | | | China Overseas Land & Investment Ltd. | | | 34 | |
| | 1 | | | China Resources Land Ltd. | | | 2 | |
| | 2 | | | Hong Kong Exchanges & Clearing Ltd. | | | 39 | |
| | 1 | | | Hopson Development Holdings Ltd. | | | 2 | |
| | 1 | | | Kerry Properties Ltd. | | | 3 | |
| | 14 | | | Peace Mark Holdings Ltd. | | | 16 | |
| | 4 | | | Shangri-La Asia Ltd. | | | 11 | |
| | 8 | | | Shenzhen International Holdings | | | 1 | |
| | | | | | | | | |
| | | | | | | | | | | | 168 | |
| | | | | | | | | | | | | |
| | | | | India — 0.1% |
| | — | | | HDFC Bank Ltd. ADR | | | 23 | |
| | | | | Indonesia — 0.2% |
| | 1 | | | P.T. Telekomunikasi Indonesia ADR | | | 42 | |
| | | | | Ireland — 0.3% |
| | 2 | | | Elan Corp. plc ADR (D) | | | 64 | |
| | | | | Israel — 0.3% |
| | — | | | Cellcom Israel Ltd. | | | 7 | |
| | 1 | | | Partner Communications Co., Ltd. ADR | | | 18 | |
| | 1 | | | Teva Pharmaceutical Industries Ltd. ADR | | | 43 | |
| | | | | | | | | |
| | | | | | | | | | | | 68 | |
| | | | | | | | | | | | | |
| | | | | Italy — 0.9% |
| | 3 | | | Enel S.p.A. | | | 36 | |
| | — | | | Eni S.p.A. | | | 31 | |
| | 15 | | | Intesa Sanpaolo | | | 113 | |
| | 8 | | | Telecom Italia S.p.A. | | | 13 | |
| | | | | | | | | |
| | | | | | | | | | | | 193 | |
| | | | | | | | | | | | | |
| | | | | Japan — 6.0% |
| | — | | | Aoyama Trading Co., Ltd. | | | 8 | |
| | 2 | | | Astellas Pharma, Inc. | | | 91 | |
| | 1 | | | Canon, Inc. | | | 30 | |
| | 2 | | | Daiichi Sankyo Co., Ltd. | | | 66 | |
| | 4 | | | Eisai Co., Ltd. | | | 138 | |
| | — | | | Fast Retailing Co., Ltd. | | | 9 | |
| | 5 | | | Hino Motors Ltd. | | | 34 | |
| | 4 | | | Honda Motor Co., Ltd. | | | 135 | |
| | — | | | Iino Kaiun Kaisha Ltd. | | | 3 | |
| | — | | | Japan Airport Terminal | | | 1 | |
| | — | | | Japan Petroleum Exploration Co., Ltd. | | | 14 | |
| | — | | | Japan Tobacco, Inc. | | | 379 | |
| | 2 | | | Konica Minolta Holdings, Inc. | | | 23 | |
| | 4 | | | Mitsubishi Estate Co., Ltd. | | | 108 | |
| | 3 | | | Mitsui & Co., Ltd. | | | 70 | |
| | 1 | | | Mitsui Fudosan Co., Ltd. | | | 15 | |
| | — | | | NTT Urban Development Corp. | | | 2 | |
| | — | | | Ryohin Keikaku Co., Ltd. | | | 16 | |
| | 4 | | | Shionogi & Co., Ltd. | | | 68 | |
| | — | | | Sky Perfect Jsat | | | 5 | |
| | — | | | Sumitomo Realty & Development Co., Ltd. | | | 2 | |
| | — | | | Sumitomo Warehouse | | | 1 | |
| | 7 | | | Tokyo Gas Co., Ltd. | | | 27 | |
| | — | | | Tokyu Corp. | | | 1 | |
| | — | | | Yaskawa Electric Corp. | | | 3 | |
| | | | | | | | | |
| | | | | | | | | | | | 1,249 | |
| | | | | | | | | | | | | |
| | | | | Luxembourg — 0.2% |
| | — | | | Gagfah S.A. | | | 2 | |
| | — | | | Millicom International Cellular S.A. (D) | | | 42 | |
| | | | | | | | | |
| | | | | | | | | | | | 44 | |
| | | | | | | | | | | | | |
| | | | | Malaysia — 0.5% |
| | 50 | | | AMMB Holdings Berhad | | | 60 | |
| | 40 | | | YTL Power International Bhd | | | 32 | |
| | | | | | | | | |
| | | | | | | | | | | | 92 | |
| | | | | | | | | | | | | |
| | | | | Mexico — 0.1% |
| | — | | | America Movil S.A.B. de C.V. ADR | | | 4 | |
| | 3 | | | Wal-Mart de Mexico | | | 10 | |
| | | | | | | | | |
| | | | | | | | | | | | 14 | |
| | | | | | | | | | | | | |
| | | | | Netherlands — 2.5% |
| | 4 | | | Aegon N.V. | | | 66 | |
| | 2 | | | ASML Holding N.V. | | | 50 | |
| | 3 | | | ING Groep N.V. | | | 122 | |
| | — | | | Spazio Investment N.V. | | | 1 | |
| | 8 | | | Unilever N.V. CVA | | | 279 | |
| | | | | | | | | |
| | | | | | | | | | | | 518 | |
| | | | | | | | | | | | | |
| | | | | Norway — 1.0% |
| | 4 | | | DNB Nor ASA (D) | | | 57 | |
| | 1 | | | Seadrill Ltd. | | | 33 | |
| | 2 | | | Sparebanken Midt-Norge | | | 19 | |
| | 1 | | | StatoilHydro ASA ADR | | | 25 | |
| | 3 | | | Telenor ASA | | | 63 | |
| | | | | | | | | |
| | | | | | | | | | | | 197 | |
| | | | | | | | | | | | | |
| | | | | Philippines — 0.0% |
| | 4 | | | First Phil Holdings | | | 4 | |
| | 40 | | | PNOC Energy Development | | | 5 | |
| | | | | | | | | |
| | | | | | | | | | | | 9 | |
| | | | | | | | | | | | | |
| | | | | Russia — 2.5% |
| | 1 | | | AFK Sistema GDR | | | 18 | |
| | 1 | | | Lukoil ADR | | | 107 | |
| | 1 | | | Mobile Telesystems OJSC ADR | | | 109 | |
| | 3 | | | OAO Gazprom ADR | | | 170 | |
| | 1 | | | Severstal GDR (K) | | | 36 | |
The accompanying notes are an integral part of these financial statements.
157
The Hartford Global Equity Fund
Schedule of Investments — (continued)
April 30, 2008 (Unaudited)
(000’s Omitted)
| | | | | | | | | | | | | |
| | | | | | | | | Market
| |
| Shares | | | | | | | | Value (W) | |
| | | | | | | | | | | | | |
| COMMON STOCK — (continued) |
| | | | | | | | | | | | | |
| | | | | Russia — (continued) |
| | 1 | | | Uralkali (D)(K) | | $ | 43 | |
| | 1 | | | Vimpel-Communications ADR | | | 33 | |
| | | | | | | | | |
| | | | | | | | | | | | 516 | |
| | | | | | | | | | | | | |
| | | | | Singapore — 0.7% |
| | 22 | | | Banyan Tree Holdings Ltd. | | | 23 | |
| | 8 | | | DBS Group Holdings Ltd. | | | 117 | |
| | | | | | | | | |
| | | | | | | | | | | | 140 | |
| | | | | | | | | | | | | |
| | | | | South Africa — 0.6% |
| | 17 | | | African Bank Investments Ltd. | | | 60 | |
| | 4 | | | MTN Group Ltd. | | | 70 | |
| | | | | | | | | |
| | | | | | | | | | | | 130 | |
| | | | | | | | | | | | | |
| | | | | Spain — 1.0% |
| | 2 | | | Banco Bilbao Vizcaya Argentaria S.A. | | | 53 | |
| | 5 | | | Iberdrola Renovables (D) | | | 34 | |
| | 1 | | | Laboratorios Almiral S.A. (D) | | | 11 | |
| | 1 | | | Repsol-YPF S.A. ADR | | | 24 | |
| | 1 | | | Telefonica S.A. | | | 20 | |
| | 1 | | | Telefonica S.A. ADR | | | 58 | |
| | | | | | | | | |
| | | | | | | | | | | | 200 | |
| | | | | | | | | | | | | |
| | | | | Sweden — 1.1% |
| | 1 | | | Atlas Copco Ab | | | 10 | |
| | 1 | | | Hennes & Mauritz Ab | | | 32 | |
| | — | | | Modern Times Group | | | 5 | |
| | 7 | | | Swedish Match Ab | | | 153 | |
| | 1 | | | Volvo Ab | | | 20 | |
| | | | | | | | | |
| | | | | | | | | | | | 220 | |
| | | | | | | | | | | | | |
| | | | | Switzerland — 3.4% |
| | 1 | | | Credit Suisse Group | | | 65 | |
| | — | | | Dufry Group | | | 26 | |
| | 2 | | | Julius Baer Holding Ltd. | | | 155 | |
| | 1 | | | Nestle S.A. | | | 265 | |
| | 1 | | | Paris RE Holdings Ltd. (D) | | | 20 | |
| | — | | | Swiss Life Holding | | | 76 | |
| | — | | | Syngenta AG | | | 37 | |
| | — | | | Synthes, Inc. | | | 24 | |
| | — | | | Temenos Group AG (D) | | | 9 | |
| | 1 | | | UBS AG Rights (D) | | | 1 | |
| | 1 | | | UBS AG (D) | | | 30 | |
| | | | | | | | | |
| | | | | | | | | | | | 708 | |
| | | | | | | | | | | | | |
| | | | | Taiwan — 0.5% |
| | 9 | | | Hon Hai Precision Industry Co., Ltd. (K) | | | 99 | |
| | | | | Turkey — 0.4% |
| | 4 | | | Turkcell Iletisim Hizmetleri ADR (D) | | | 84 | |
| | | | | United Kingdom — 5.0% |
| | 12 | | | Aberdeen Asset Management plc | | | 33 | |
| | 1 | | | Admiral Group plc | | | 19 | |
| | 1 | | | AstraZeneca plc | | | 38 | |
| | 2 | | | AstraZeneca plc ADR | | | 95 | |
| | 2 | | | BG Group plc | | | 48 | |
| | 1 | | | BHP Billiton plc | | | 24 | |
| | 1 | | | BP plc ADR | | | 36 | |
| | 1 | | | British Land Co. plc | | | 10 | |
| | 1 | | | Burberry Group plc | | | 11 | |
| | 2 | | | Cadbury Schweppes plc | | | 26 | |
| | 1 | | | Dail Mail & General Trust Class A | | | 7 | |
| | 1 | | | Dawnay Day Sirius | | | 1 | |
| | 1 | | | Dawnay Day Treveria plc | | | 1 | |
| | 3 | | | Debenhams plc | | | 3 | |
| | — | | | Derwent London plc | | | 3 | |
| | 2 | | | easyJet plc (D) | | | 10 | |
| | 1 | | | Eurasian Natural Resources Corp. (D) | | | 32 | |
| | — | | | Eurocastle Investment Ltd. | | | 1 | |
| | — | | | Great Portland Est | | | 1 | |
| | — | | | Hammerson plc | | | 8 | |
| | 1 | | | Informa Group plc | | | 6 | |
| | 4 | | | Moneysupermarket.com | | | 9 | |
| | 2 | | | National Grid plc | | | 24 | |
| | 41 | | | Old Mutual plc | | | 105 | |
| | 1 | | | Reckitt Benckiser Group plc | | | 50 | |
| | 1 | | | Reed Elsevier plc | | | 8 | |
| | 7 | | | Rexam plc | | | 60 | |
| | 8 | | | Rolls-Royce Group plc | | | 67 | |
| | 602 | | | Rolls-Royce Group plc Class B (A)(D)(H) | | | 1 | |
| | 1 | | | Royal Dutch Shell plc | | | 56 | |
| | — | | | Songbird Estates plc | | | 1 | |
| | 3 | | | Standard Chartered plc | | | 121 | |
| | 3 | | | Thus Group plc (D) | | | 6 | |
| | 2 | | | Vedanta Resources plc | | | 79 | |
| | — | | | Xstrata plc | | | 27 | |
| | 1 | | | Yell Group plc | | | 2 | |
| | | | | | | | | |
| | | | | | | | | | | | 1,029 | |
| | | | | | | | | | | | | |
| | | | | United States — 43.1% |
| | 3 | | | Abbott Laboratories | | | 164 | |
| | 1 | | | Accenture Ltd. Class A | | | 54 | |
| | 2 | | | ACE Ltd. | | | 136 | |
| | — | | | Advance Automotive Parts, Inc. | | | 8 | |
| | 1 | | | Aetna, Inc. | | | 32 | |
| | — | | | Alleghany Corp. (D) | | | 35 | |
| | 1 | | | American Apparel, Inc. (D) | | | 6 | |
| | — | | | American Eagle Outfitters, Inc. | | | 8 | |
| | 1 | | | American Electric Power Co., Inc. | | | 31 | |
| | — | | | American Tower Corp. Class A (D) | | | 9 | |
| | — | | | AMETEK, Inc. | | | 11 | |
| | — | | | Amgen, Inc. (D) | | | 18 | |
| | 5 | | | AMR Corp. (D) | | | 48 | |
| | 1 | | | Amylin Pharmaceuticals, Inc. (D) | | | 31 | |
| | 1 | | | Applied Materials, Inc. | | | 22 | |
| | — | | | Arbitron, Inc. | | | 1 | |
| | — | | | Assurant, Inc. | | | 20 | |
| | — | | | Atlantic Tele-Network, Inc. | | | 4 | |
| | 2 | | | Automatic Data Processing, Inc. | | | 88 | |
| | 1 | | | Aventine Renewable Energy Holdings, Inc. (D) | | | 6 | |
| | — | | | Avon Products, Inc. | | | 18 | |
| | 1 | | | Baker Hughes, Inc. | | | 89 | |
| | 5 | | | Bank of America Corp. | | | 203 | |
| | 1 | | | Barr Pharmaceuticals, Inc. (D) | | | 69 | |
| | — | | | Beckman Coulter, Inc. | | | 33 | |
| | — | | | Becton, Dickinson & Co. | | | 29 | |
| | — | | | Best Buy Co., Inc. | | | 6 | |
| | — | | | BMC Software, Inc. (D) | | | 10 | |
| | — | | | Boeing Co. | | | 33 | |
| | — | | | Boston Properties, Inc. | | | 6 | |
| | 2 | | | Bristol-Myers Squibb Co. | | | 48 | |
The accompanying notes are an integral part of these financial statements.
158
| | | | | | | | | | | | | |
| | | | | | | | | Market
| |
| Shares | | | | | | | | Value (W) | |
| | | | | | | | | | | | | |
| COMMON STOCK — (continued) |
| | | | | | | | | | | | | |
| | | | | United States — (continued) |
| | 1 | | | Broadcom Corp. Class A (D) | | $ | 21 | |
| | 1 | | | Bunge Ltd. Finance Corp. | | | 78 | |
| | 2 | | | C.H. Robinson Worldwide, Inc. | | | 112 | |
| | — | | | Cabot Oil & Gas Corp. | | | 23 | |
| | 1 | | | Capital One Financial Corp. | | | 74 | |
| | — | | | Carlisle Cos., Inc. | | | 3 | |
| | — | | | CenterPoint Energy, Inc. | | | 5 | |
| | — | | | Central European Media Enterprises Ltd. (D) | | | 16 | |
| | 1 | | | Cephalon, Inc. (D) | | | 44 | |
| | 1 | | | Chevron Corp. | | | 58 | |
| | 1 | | | Church & Dwight Co., Inc. | | | 32 | |
| | 1 | | | Ciena Corp. (D) | | | 21 | |
| | — | | | Clear Channel Communications, Inc. | | | 7 | |
| | 1 | | | Coca-Cola Co. | | | 44 | |
| | — | | | Collective Brands, Inc. (D) | | | 4 | |
| | 1 | | | CommScope, Inc. (D) | | | 38 | |
| | — | | | comScore, Inc. (D) | | | 2 | |
| | 2 | | | Comverse Technology, Inc. (D) | | | 39 | |
| | 1 | | | ConocoPhillips Holding Co. | | | 60 | |
| | — | | | Consol Energy, Inc. | | | 32 | |
| | 5 | | | Corning, Inc. | | | 141 | |
| | 1 | | | Costco Wholesale Corp. | | | 36 | |
| | 5 | | | Covenant Transport (D) | | | 31 | |
| | 1 | | | Coventry Health Care, Inc. (D) | | | 43 | |
| | 1 | | | Covidien Ltd. | | | 29 | |
| | — | | | CTC Media, Inc. (D) | | | 8 | |
| | 2 | | | Danaher Corp. | | | 131 | |
| | — | | | Darden Restaurants, Inc. | | | 9 | |
| | — | | | Devon Energy Corp. | | | 23 | |
| | — | | | DirecTV Group, Inc. (D) | | | 8 | |
| | 5 | | | Discover Financial Services | | | 91 | |
| | — | | | DISH Network Corp. (D) | | | 2 | |
| | — | | | DPL, Inc. | | | 6 | |
| | — | | | DreamWorks Animation SKG, Inc. (D) | | | 10 | |
| | 1 | | | DST Systems, Inc. (D) | | | 44 | |
| | — | | | Duke Energy Corp. | | | 4 | |
| | — | | | Eclipsys Corp. (D) | | | 10 | |
| | 3 | | | Electronic Arts, Inc. (D) | | | 169 | |
| | 2 | | | Eli Lilly & Co. | | | 110 | |
| | — | | | Entergy Corp. | | | 11 | |
| | — | | | EOG Resources, Inc. | | | 52 | |
| | — | | | Equinix, Inc. (D) | | | 35 | |
| | 1 | | | Equitable Resources, Inc. | | | 35 | |
| | — | | | Equity Residential Properties Trust | | | 6 | |
| | — | | | Everest Re Group Ltd. | | | 18 | |
| | 2 | | | Exelon Corp. | | | 199 | |
| | 1 | | | Exxon Mobil Corp. | | | 84 | |
| | 1 | | | Fairchild Semiconductor International, Inc. (D) | | | 14 | |
| | 1 | | | FedEx Corp. | | | 97 | |
| | — | | | FirstEnergy Corp. | | | 14 | |
| | 1 | | | FMC Corp. | | | 51 | |
| | 11 | | | Ford Motor Co. (D) | | | 94 | |
| | — | | | Forest City Enterprises, Inc. Class A | | | 4 | |
| | 1 | | | Forest Laboratories, Inc. (D) | | | 49 | |
| | 1 | | | Forward Air Corp. | | | 44 | |
| | 1 | | | FPL Group, Inc. | | | 65 | |
| | — | | | Freeport-McMoRan Copper & Gold, Inc. | | | 34 | |
| | 5 | | | Gap, Inc. | | | 102 | |
| | 1 | | | Genentech, Inc. (D) | | | 34 | |
| | — | | | General Growth Properties, Inc. | | | 8 | |
| | 1 | | | Gilead Sciences, Inc. (D) | | | 52 | |
| | — | | | Goldman Sachs Group, Inc. | | | 57 | |
| | — | | | Google, Inc. (D) | | | 108 | |
| | 2 | | | Halliburton Co. | | | 73 | |
| | — | | | Hanesbrands, Inc. (D) | | | 9 | |
| | 3 | | | Health Management Associates, Inc. Class A (D) | | | 20 | |
| | — | | | Herbalife Ltd. | | | 3 | |
| | — | | | Hess Corp. | | | 21 | |
| | 3 | | | Hewlett-Packard Co. | | | 143 | |
| | 1 | | | Home Depot, Inc. | | | 35 | |
| | 1 | | | Honeywell International, Inc. | | | 46 | |
| | — | | | Hormel Foods Corp. | | | 5 | |
| | 1 | | | Hospira, Inc. (D) | | | 25 | |
| | 3 | | | Host Hotels & Resorts, Inc. | | | 48 | |
| | 2 | | | Hub Group, Inc. (D) | | | 64 | |
| | 2 | | | Huntington Bancshares, Inc. | | | 17 | |
| | — | | | Illinois Tool Works, Inc. | | | 15 | |
| | — | | | Ingersoll-Rand Co. Class A | | | 8 | |
| | 1 | | | Ingram Micro, Inc. (D) | | | 23 | |
| | 1 | | | Intel Corp. | | | 23 | |
| | 4 | | | Invesco Ltd. | | | 108 | |
| | 1 | | | J.B. Hunt Transport Services, Inc. | | | 20 | |
| | 1 | | | Kimberly-Clark Corp. | | | 52 | |
| | — | | | Kimco Realty Corp. | | | 7 | |
| | 1 | | | Kohl’s Corp. (D) | | | 31 | |
| | 1 | | | LAM Research Corp. (D) | | | 37 | |
| | — | | | Live Nation, Inc. (D) | | | 6 | |
| | 1 | | | Lockheed Martin Corp. | | | 101 | |
| | — | | | Longs Drug Stores Corp. | | | 18 | |
| | 1 | | | Macy’s, Inc. | | | 18 | |
| | — | | | Manpower, Inc. | | | 19 | |
| | 1 | | | Marathon Oil Corp. | | | 23 | |
| | — | | | Marriott International, Inc. Class A | | | 5 | |
| | 1 | | | Marvell Technology Group Ltd. (D) | | | 19 | |
| | 4 | | | Maxim Integrated Products, Inc. | | | 76 | |
| | 1 | | | MBIA, Inc. | | | 11 | |
| | — | | | McAfee, Inc. (D) | | | 14 | |
| | 4 | | | McKesson Corp. | | | 184 | |
| | 1 | | | Medicines Co. (D) | | | 20 | |
| | 3 | | | Medtronic, Inc. | | | 149 | |
| | 10 | | | Microsoft Corp. | | | 273 | |
| | 2 | | | Millennium Pharmaceuticals, Inc. (D) | | | 55 | |
| | — | | | Monster Worldwide, Inc. (D) | | | 9 | |
| | — | | | Moody’s Corp. | | | 6 | |
| | — | | | Nabors Industries Ltd. (D) | | | 8 | |
| | 4 | | | NetApp, Inc. (D) | | | 89 | |
| | 3 | | | Newell Rubbermaid, Inc. | | | 53 | |
| | — | | | Newfield Exploration Co. (D) | | | 12 | |
| | 1 | | | News Corp. Class A | | | 14 | |
| | 1 | | | NII Holdings, Inc. Class B (D) | | | 36 | |
| | — | | | Noble Energy, Inc. | | | 26 | |
| | 1 | | | Northeast Utilities | | | 16 | |
| | — | | | Northrop Grumman Corp. | | | 18 | |
| | 1 | | | Occidental Petroleum Corp. | | | 50 | |
| | 2 | | | Och-Ziff Capital Management Group | | | 43 | |
| | 1 | | | Omniture, Inc. (D) | | | 16 | |
| | 5 | | | ON Semiconductor Corp. (D) | | | 37 | |
| | — | | | Onyx Pharmaceuticals, Inc. (D) | | | 11 | |
| | — | | | OSI Pharmaceuticals, Inc. (D) | | | 16 | |
| | 1 | | | P. F. Chang’s China Bistro, Inc. (D) | | | 19 | |
| | — | | | Panera Bread Co. Class A (D) | | | 22 | |
The accompanying notes are an integral part of these financial statements.
159
The Hartford Global Equity Fund
Schedule of Investments — (continued)
April 30, 2008 (Unaudited)
(000’s Omitted)
| | | | | | | | | | | | | |
| | | | | | | | | Market
| |
| Shares | | | | | | | | Value (W) | |
| | | | | | | | | | | | | |
| COMMON STOCK — (continued) |
| | | | | | | | | | | | | |
| | | | | United States — (continued) |
| | 1 | | | PDL Biopharma, Inc. (D) | | $ | 10 | |
| | — | | | Peabody Energy Corp. | | | 18 | |
| | — | | | Pentair, Inc. | | | 17 | |
| | — | | | PepsiCo, Inc. | | | 21 | |
| | 2 | | | Phillip Morris International, Inc. (D) | | | 87 | |
| | 2 | | | Pier 1 Imports, Inc. (D) | | | 19 | |
| | 6 | | | Popular, Inc. | | | 80 | |
| | — | | | PPL Corp. | | | 11 | |
| | 1 | | | Praxair, Inc. | | | 108 | |
| | — | | | Precision Castparts Corp. | | | 11 | |
| | — | | | Progress Energy, Inc. | | | 4 | |
| | — | | | Public Service Enterprise Group, Inc. | | | 13 | |
| | 4 | | | Qualcomm, Inc. | | | 186 | |
| | — | | | Questar Corp. | | | 24 | |
| | — | | | R.H. Donnelley Corp. (D) | | | 1 | |
| | — | | | Raytheon Co. | | | 15 | |
| | 1 | | | Red Hat, Inc. (D) | | | 19 | |
| | 1 | | | Red Robin Gourmet Burgers, Inc. (D) | | | 23 | |
| | 1 | | | Regeneron Pharmaceuticals, Inc. (D) | | | 12 | |
| | — | | | Reynolds American, Inc. | | | 12 | |
| | — | | | Ross Stores, Inc. | | | 15 | |
| | 3 | | | Saia, Inc. (D) | | | 43 | |
| | 9 | | | Schering-Plough Corp. | | | 164 | |
| | 1 | | | Schlumberger Ltd. | | | 50 | |
| | 1 | | | Sealed Air Corp. | | | 28 | |
| | 1 | | | Shine Media Acquisition Corp. (D) | | | 6 | |
| | 1 | | | Sierra Pacific Resources | | | 16 | |
| | — | | | Simon Property Group, Inc. | | | 12 | |
| | 2 | | | Skyworks Solutions, Inc. (D) | | | 18 | |
| | 13 | | | Smurfit-Stone Container Corp. (D) | | | 69 | |
| | — | | | Southern Union Co. | | | 6 | |
| | — | | | SPX Corp. | | | 10 | |
| | 1 | | | St. Jude Medical, Inc. (D) | | | 36 | |
| | 3 | | | Staples, Inc. | | | 65 | |
| | 1 | | | State Street Corp. | | | 43 | |
| | — | | | Sunrise Senior Living, Inc. (D) | | | 2 | |
| | — | | | Teradata Corp. (D) | | | 3 | |
| | 1 | | | Tibco Software, Inc. (D) | | | 5 | |
| | 1 | | | Time Warner Telecom, Inc. Class A (D) | | | 16 | |
| | 1 | | | Time Warner, Inc. | | | 10 | |
| | — | | | TJX Cos., Inc. | | | 15 | |
| | — | | | Transocean, Inc. | | | 30 | |
| | 1 | | | Ulta Salon, Cosmetics & Fragrances, Inc. (D) | | | 16 | |
| | 3 | | | UnitedHealth Group, Inc. | | | 88 | |
| | — | | | Universal Health Services, Inc. Class B | | | 19 | |
| | 2 | | | Unum Group | | | 37 | |
| | 6 | | | US Airways Group, Inc. (D) | | | 48 | |
| | 1 | | | UTI Worldwide, Inc. | | | 21 | |
| | 1 | | | Valero Energy Corp. | | | 24 | |
| | — | | | Varian Semiconductor Equipment Associates, Inc. (D) | | | 15 | |
| | 1 | | | VeriSign, Inc. (D) | | | 21 | |
| | 1 | | | Vertex Pharmaceuticals, Inc. (D) | | | 15 | |
| | 4 | | | Viacom, Inc. Class B (D) | | | 140 | |
| | 1 | | | Visa, Inc. (D) | | | 75 | |
| | — | | | Vornado Realty Trust | | | 11 | |
| | 1 | | | Walgreen Co. | | | 29 | |
| | 3 | | | Wal-Mart Stores, Inc. | | | 169 | |
| | 1 | | | Walt Disney Co. | | | 22 | |
| | 3 | | | Washington Mutual, Inc. | | | 34 | |
| | — | | | Waste Management, Inc. | | | 1 | |
| | 1 | | | Weatherford International Ltd. (D) | | | 65 | |
| | 4 | | | Western Union Co. | | | 96 | |
| | — | | | Williams Cos., Inc. | | | 4 | |
| | — | | | Wisconsin Energy Corp. | | | 6 | |
| | 2 | | | Wyeth | | | 103 | |
| | — | | | XM Satellite Radio Holdings, Inc. Class A (D) | | | 4 | |
| | — | | | XTO Energy, Inc. | | | 12 | |
| | — | | | Zimmer Holdings, Inc. (D) | | | 17 | |
| | | | | | | | | |
| | | | | | | | | | | | 8,931 | |
| | | | | | | | | | | | | |
| | | | | Total common stock
(cost $18,973) | | $ | 19,593 | |
| | | | | | | | | | | | | |
| | | | | | | | | | | | | |
| WARRANTS — 0.1% |
| | | | | India — 0.1% |
| | 1 | | | Citigroup Global Certificate — Bharti Televentures (H) | | | 17 | |
| | | | | | | | | |
| | | | | Total warrants
(cost $16) | | $ | 17 | |
| | | | | | | | | | | | | |
| | | | | | | | | | | | | |
| EXCHANGE TRADED FUNDS — 1.2% |
| | | | | United States — 1.2% |
| | 1 | | | Industrial Select S&P Depository Receipt | | $ | 43 | |
| | — | | | Ishares Goldman Sachs Tech I Index Fund | | | 16 | |
| | 3 | | | Ishares MSCI EAFE Index Fund | | | 190 | |
| | | | | | | | | |
| | | | | Total exchange traded funds
(cost $238) | | $ | 249 | |
| | | | | | | | | | | | | |
| | | | | | | | | | | | | |
| PREFERRED STOCK — 0.9% |
| | | | | Brazil — 0.9% |
| | 1 | | | Banco Itau Holding | | $ | 41 | |
| | 1 | | | Petroleo Brasileiro S.A. ADR | | | 132 | |
| | — | | | Telecomunicacoes de Sao Paulo S.A. | | | 5 | |
| | — | | | Telemar Norte Leste S.A. | | | 17 | |
| | | | | | | | | |
| | | | | Total preferred stock
(cost $184) | | $ | 195 | |
| | | | | | | | | |
| | | | | Total long-term investments
(cost $19,411) | | $ | 20,054 | |
| | | | | | | | | | | | | |
| | | | | | | | | | | | | |
Principal
| | | | | | | | | |
| Amount | | | | | | | | | |
| |
| SHORT-TERM INVESTMENTS — 2.0% |
| | | | | Repurchase Agreements — 2.0% |
| | | | | Banc of America Securities TriParty Joint Repurchase Agreement (maturing on 05/01/2008 in the amount of $150, collateralized by FHLMC 5.00%, 2035, value of $153) | | | | |
| $ | 150 | | | 1.98% dated 05/01/2008 | | $ | 150 | |
| | | | | BNP Paribas Securities Corp. TriParty Joint Repurchase Agreement (maturing on 05/01/2008 in the amount of $74, collateralized by FNMA 5.50% — 6.50%, 2036 — 2038, value of $75) | | | | |
| | 74 | | | 2.00% dated 05/01/2008 | | | 74 | |
The accompanying notes are an integral part of these financial statements.
160
| | | | | | | | | | | | | |
Principal
| | | | | | | | Market
| |
| Amount | | | | | | | | Value (W) | |
| |
| | | | | | | | | | | | | |
| SHORT-TERM INVESTMENTS — (continued) |
| | | | | | | | | | | | | |
| | | | | Repurchase Agreements — (continued) |
| | | | | Deutsche Bank Securities Joint Repurchase Agreement (maturing on 05/01/2008 in the amount of $—, collateralized by U. S. Treasury Note 3.63%, 2009, value of $—) | | | | |
| $ | — | | | 1.90% dated 05/01/2008 | | $ | — | |
| | | | | Deutsche Bank Securities TriParty Joint Repurchase Agreement (maturing on 05/01/2008 in the amount of $92, collateralized by FHLMC 4.50% — 7.00%, 2016 — 2038, value of $93) | | | | |
| | 92 | | | 2.00% dated 05/01/2008 | | | 92 | |
| | | | | JP Morgan Chase TriParty Joint Repurchase Agreement (maturing on 05/01/2008 in the amount of $88, collateralized by FNMA 4.50% — 7.00%, 2020 — 2038, value of $90) | | | | |
| | 88 | | | 1.96% dated 05/01/2008 | | | 88 | |
| | | | | | | | | |
| | | | | Total short-term investments
(cost $404) | | $ | 404 | |
| | | | | | | | | |
| | | | | Total investments
(cost $19,815) (C) | | | 98.8 | % | | $ | 20,458 | |
| | | | | Other assets and liabilities | | | 1.2 | % | | | 246 | |
| | | | | | | | | | | | | |
| | | | | Total net assets | | | 100.0 | % | | $ | 20,704 | |
| | | | | | | | | | | | | |
| |
| Note: | Percentage of investments as shown is the ratio of the total market value to total net assets. Market value of investments in foreign securities represents 52.52% of total net assets at April 30, 2008. |
| | |
| (C) | | At April 30, 2008, the cost of securities for federal income tax purposes was $19,815 and the aggregate gross unrealized appreciation and depreciation based on that cost were: |
| | | | | |
| Unrealized Appreciation | | $ | 1,159 | |
| Unrealized Depreciation | | | (516 | ) |
| | | | | |
| Net Unrealized Appreciation | | $ | 643 | |
| | | | | |
| | |
| (A) | | The aggregate value of securities valued in good faith at fair value as determined under policies and procedures established by and under the supervision of the Funds’ Board of Directors at April 30, 2008, was $1, which represents 0.00% of total net assets. This calculation excludes securities that are principally traded on certain foreign markets and whose prices were adjusted solely pursuant to a third party pricing service methodology approved by the Board of Directors. |
| |
| (D) | | Currently non-income producing. |
| |
| (K) | | Securities contain some restrictions as to public resale. These securities comply with Regulation S, rules governing offers and sales made outside the United States without registration under the Securities Act of 1933, and are determined to be liquid. At April 30, 2008, the market value of these securities amounted to $178 or 0.86% of net assets. |
| |
| (H) | | The following securities are considered illiquid. Illiquid securities are often purchased in private placement transactions, are not registered under the Securities Act of 1933 and may have contractual restrictions on resale. A security may also be considered illiquid if the security lacks a readily available market or if its valuation has not changed for a certain period of time. |
| | | | | | | | | | | |
Period
| | | | | | | | |
Acquired | | Shares/Par | | | Security | | Cost Basis | |
| 02/2008 | | | 1 | | | Citigroup Global Certificate - Bharti Televentures - 144A | | $ | 16 | |
| 02/2008 | | | 602 | | | Rolls-Royce Group plc Class B | | | 1 | |
| | |
| | The aggregate value of these securities at April 30, 2008 was $18 which represents 0.09% of total net assets. |
| |
| | Futures Contracts Outstanding at April 30, 2008 |
| | | | | | | | | | | | | | | | | |
| | | | | | | | | | | | Unrealized
| |
| | | Number of
| | | | | | Expiration
| | | Appreciation/
| |
Description | | Contracts* | | | Position | | | Month | | | (Depreciation) | |
| |
| S&P 500 Mini Futures | | | 2 | | | | Long | | | | Jun 2008 | | | $ | 5 | |
| | | | | | | | | | | | | | | | | |
| | |
| | * The number of contracts does not omit 000’s. |
| |
| | Cash of $7 was pledged as initial margin deposit for open futures contracts at April 30, 2008. |
Forward Foreign Currency Contracts Outstanding at April 30, 2008
| | | | | | | | | | | | | | | | | |
| | | | | | | | | | | | Unrealized
| |
| | | Market
| | | Contract
| | | Delivery
| | | Appreciation/
| |
Description | | Value (W) | | | Amount | | | Date | | | (Depreciation) | |
| |
| Australian Dollar (Sell) | | $ | 67 | | | $ | 66 | | | | 05/02/08 | | | $ | (1 | ) |
| Euro (Sell) | | | 7 | | | | 7 | | | | 05/02/08 | | | | — | |
| Euro (Buy) | | | 33 | | | | 33 | | | | 05/05/08 | | | | — | |
| Euro (Sell) | | | 9 | | | | 9 | | | | 05/05/08 | | | | — | |
| Norwegian Krone (Buy) | | | 23 | | | | 23 | | | | 05/02/08 | | | | — | |
| | | | | | | | | | | | | | | | | |
| | | | | | | | | | | | | | | $ | (1 | ) |
| | | | | | | | | | | | | | | | | |
| | |
| (W) | | See Note 2b of accompanying Notes to Financial Statements regarding valuation of securities. |
Diversification by Industry
as of April 30, 2008
| | | | | |
| | | Percentage of
|
Industry | | Net Assets |
| Basic Materials | | | 9.6 | |
| |
| |
| Capital Goods | | | 1.9 | |
| |
| |
| Consumer Cyclical | | | 7.9 | |
| |
| |
| Consumer Staples | | | 7.0 | |
| |
| |
| Energy | | | 10.3 | |
| |
| |
| Finance | | | 21.7 | |
| |
| |
| Health Care | | | 12.4 | |
| |
| |
| Services | | | 4.8 | |
| |
| |
| Technology | | | 15.1 | |
| |
| |
| Transportation | | | 1.3 | |
| |
| |
| Utilities | | | 4.8 | |
| |
| |
| Short-Term Investments | | | 2.0 | |
| |
| |
| Other Assets and Liabilities | | | 1.2 | |
| |
| |
Total | | | 100.0 | % |
| |
| |
The accompanying notes are an integral part of these financial statements.
161
The Hartford Global Financial Services Fund
Schedule of Investments
April 30, 2008 (Unaudited)
(000’s Omitted)
| | | | | | | | | | | | | |
| | | | | | | | | Market
| |
| Shares | | | | | | | | Value (W) | |
| COMMON STOCK — 91.0% |
| | | | | Canada — 16.5% |
| | 27 | | | Bank of Montreal | | $ | 1,363 | |
| | 28 | | | Bank of Nova Scotia | | | 1,315 | |
| | 9 | | | Canadian Imperial Bank of Commerce | | | 670 | |
| | 2 | | | Canadian Imperial Bank of Commerce ADR | | | 118 | |
| | 28 | | | Canadian Western Bank | | | 690 | |
| | 55 | | | First National Financial, Inc. | | | 707 | |
| | 3 | | | Gluskin Sheff Associates, Inc. | | | 77 | |
| | 18 | | | Toronto-Dominion Bank | | | 1,182 | |
| | | | | | | | | |
| | | | | | | | | | | | 6,122 | |
| | | | | | | | | | | | | |
| | | | | China — 1.7% |
| | 1,273 | | | Bank of China Ltd. | | | 649 | |
| | | | | France — 7.6% |
| | 24 | | | AXA S.A. (G) | | | 889 | |
| | 7 | | | BNP Paribas | | | 749 | |
| | 10 | | | Societe Generale Class A | | | 1,206 | |
| | | | | | | | | |
| | | | | | | | | | | | 2,844 | |
| | | | | | | | | | | | | |
| | | | | Germany — 2.9% |
| | 6 | | | Muenchener Rueckversicherungs-Gesellschaft AG | | | 1,088 | |
| | | | | Italy — 4.1% |
| | 204 | | | Intesa Sanpaolo | | | 1,519 | |
| | | | | Netherlands — 6.8% |
| | 75 | | | Aegon N.V. | | | 1,202 | |
| | 35 | | | ING Groep N.V. | | | 1,338 | |
| | | | | | | | | |
| | | | | | | | | | | | 2,540 | |
| | | | | | | | | | | | | |
| | | | | Norway — 4.0% |
| | 74 | | | DNB Nor ASA (D) | | | 1,097 | |
| | 39 | | | Sparebanken Midt-Norge | | | 391 | |
| | | | | | | | | |
| | | | | | | | | | | | 1,488 | |
| | | | | | | | | | | | | |
| | | | | Singapore — 2.6% |
| | 66 | | | DBS Group Holdings Ltd. | | | 966 | |
| | | | | South Africa — 2.7% |
| | 286 | | | African Bank Investments Ltd. (Q) | | | 999 | |
| | | | | Switzerland — 5.9% |
| | 16 | | | Julius Baer Holding Ltd. | | | 1,148 | |
| | 16 | | | Paris RE Holdings Ltd. (D) | | | 359 | |
| | 2 | | | Swiss Life Holding | | | 678 | |
| | | | | | | | | |
| | | | | | | | | | | | 2,185 | |
| | | | | | | | | | | | | |
| | | | | United Kingdom — 6.6% |
| | 246 | | | Aberdeen Asset Management plc | | | 689 | |
| | 392 | | | Old Mutual plc | | | 988 | |
| | 22 | | | Standard Chartered plc | | | 776 | |
| | | | | | | | | |
| | | | | | | | | | | | 2,453 | |
| | | | | | | | | | | | | |
| | | | | United States — 29.6% |
| | 17 | | | ACE Ltd. | | | 1,001 | |
| | 3 | | | Alleghany Corp. (D)# | | | 924 | |
| | 33 | | | Bank of America Corp. | | | 1,228 | |
| | 28 | | | Capital One Financial Corp. | | | 1,500 | |
| | 103 | | | Discover Financial Services, Inc. | | | 1,874 | |
| | 63 | | | Invesco Ltd. | | | 1,613 | |
| | 46 | | | Och-Ziff Capital Management Group | | | 883 | |
| | 69 | | | Popular, Inc. (G) | | | 864 | |
| | 33 | | | Unum Group | | | 768 | |
| | 30 | | | Washington Mutual, Inc. (G) | | | 363 | |
| | | | | | | | | |
| | | | | | | | | | | | 11,018 | |
| | | | | | | | | | | | | |
| | | | | Total common stock
(cost $34,447) | | $ | 33,871 | |
| | | | | | | | | | | | | |
| | | | | | | | | | | | | |
| PREFERRED STOCK — 3.8% |
| | | | | Brazil — 2.1% |
| | 27 | | | Banco Itau Holding | | $ | 794 | |
| | | | | United States — 1.7% |
| | — | | | Washington Mutual, Inc. with Warrants (D)(A)(H)(X) | | | 632 | |
| | | | | | | | | |
| | | | | Total preferred stock
(cost $1,159) | | $ | 1,426 | |
| | | | | | | | | |
| | | | | Total long-term investments
(cost $35,606) | | $ | 35,297 | |
| | | | | | | | | | | | | |
| | | | | | | | | | | | | |
Principal
| | | | | | | | | |
| Amount | | | | | | | | | |
| |
| SHORT-TERM INVESTMENTS — 12.8% |
| | | | | Repurchase Agreements — 7.1% |
| | | | | Banc of America Securities TriParty Joint Repurchase Agreement (maturing on 05/01/2008 in the amount of $988, collateralized by FHLMC 5.00%, 2035, value of $1,008) | | | | |
| $ | 988 | | | 1.98% dated 04/30/2008 | | $ | 988 | |
| | | | | BNP Paribas Securities Corp. TriParty Joint Repurchase Agreement (maturing on 05/01/2008 in the amount of $485, collateralized by FNMA 5.50% — 6.50%, 2036 — 2038, value of $494) | | | | |
| | 485 | | | 2.00% dated 04/30/2008 | | | 485 | |
| | | | | Deutsche Bank Securities Joint Repurchase Agreement (maturing on 05/01/2008 in the amount of $1, collateralized by U. S. Treasury Note 3.63%, 2009, value of $1) | | | | |
| | 1 | | | 1.90% dated 04/30/2008 | | | 1 | |
| | | | | Deutsche Bank Securities TriParty Joint Repurchase Agreement (maturing on 05/01/2008 in the amount of $602, collateralized by FHLMC 4.50% — 7.00%, 2016 — 2038, value of $614) | | | | |
| | 602 | | | 2.00% dated 04/30/2008 | | | 602 | |
| | | | | JP Morgan Chase TriParty Joint Repurchase Agreement (maturing on 05/01/2008 in the amount of $580, collateralized by FNMA 4.50% — 7.00%, 2020 — 2038, value of $592) | | | | |
| | 580 | | | 1.96% dated 04/30/2008 | | | 580 | |
| | | | | | | | | |
| | | | | | | | | | | | 2,656 | |
| | | | | | | | | | | | | |
| | | | | | | | | | | | | |
| | | | | | | | | | | | | |
| Shares | | | | | | | | | |
| |
| | | | | Securities Purchased with Proceeds from Security Lending — 5.7% |
| | | | | Cash Collateral Reinvestment Fund: |
| | 1,078 | | | Goldman Sachs FS Prime Obligation/Institutional Fund | | | 1,078 | |
The accompanying notes are an integral part of these financial statements.
162
| | | | | | | | | | | | | |
| | | | | | | | | Market
| |
| Shares | | | | | | | | Value (W) | |
| |
| | | | | | | | | | | | | |
| SHORT-TERM INVESTMENTS — (continued) |
| | | | | | | | | | | | | |
| | | | | Securities Purchased with Proceeds from Security Lending — (continued) |
| | | | | | | | | | | | | |
| | | | | Cash Collateral Reinvestment Fund: — (continued) |
| $ | 1,026 | | | Mellon GSL DBT II Collateral Fund (H) | | $ | 1,026 | |
| | | | | | | | | |
| | | | | | | | | | | | 2,104 | |
| | | | | | | | | | | | | |
| | | | | Total short-term investments
(cost $4,760) | | $ | 4,760 | |
| | | | | | | | | |
| | | | | Total investments
(cost $40,366) (C) | | | 107.6 | % | | $ | 40,057 | |
| | | | | Other assets and liabilities | | | (7.6 | )% | | | (2,821 | ) |
| | | | | | | | | | | | | |
| | | | | Total net assets | | | 100.0 | % | | $ | 37,236 | |
| | | | | | | | | | | | | |
| |
| Note: | Percentage of investments as shown is the ratio of the total market value to total net assets. Market value of investments in foreign securities represents 63.50% of total net assets at April 30, 2008. |
| | |
| (C) | | At April 30, 2008, the cost of securities for federal income tax purposes was $40,504 and the aggregate gross unrealized appreciation and depreciation based on that cost were: |
| | | | | |
| Unrealized Appreciation | | $ | 1,401 | |
| Unrealized Depreciation | | | (1,848 | ) |
| | | | | |
| Net Unrealized Depreciation | | $ | (447 | ) |
| | | | | |
| | |
| # | | This security, or a portion of this security, has been segregated to cover funding requirements on investment transactions settling in the future. |
| |
| (A) | | The aggregate value of securities valued in good faith at fair value as determined under policies and procedures established by and under the supervision of the Funds’ Board of Directors at April 30, 2008, was $632, which represents 1.70% of total net assets. This calculation excludes securities that are principally traded on certain foreign markets and whose prices were adjusted solely pursuant to a third party pricing service methodology approved by the Board of Directors. |
| |
| (D) | | Currently non-income producing. |
| |
| (X) | | Convertible security. |
| |
| (G) | | Security is partially on loan at April 30, 2008. |
| |
| (Q) | | The cost of securities purchased on a when-issued or delayed delivery basis at April 30, 2008 was $110. |
| |
| (H) | | The following securities are considered illiquid. Illiquid securities are often purchased in private placement transactions, are not registered under the Securities Act of 1933 and may have contractual restrictions on resale. A security may also be considered illiquid if the security lacks a readily available market or if its valuation has not changed for a certain period of time. Notwithstanding the foregoing, although the Mellon GLS DBT II Collateral Fund has been deemed illiquid for purposes of this report, the Mellon GLS DBT II Collateral Fund has redeemed shares daily in respect of recalled loaned securities. |
| | | | | | | | | | | |
Period
| | | | | | | | |
Acquired | | Shares/Par | | | Security | | Cost Basis | |
| 04/2008 | | | — | | | Washington Mutual, Inc. with Warrants | | $ | 500 | |
12/2007 –
04/2008 | | | 1,026 | | | Mellon GSL DBT II Collateral Fund | | $ | 1,026 | |
| | |
| | The aggregate value of these securities at April 30, 2008 was $1,658, which represents 4.45% of total net assets. |
Forward Foreign Currency Contracts Outstanding at April 30, 2008
| | | | | | | | | | | | | | | | | |
| | | | | | | | | | | | Unrealized
| |
| | | Market
| | | Contract
| | | Delivery
| | | Appreciation/
| |
Description | | Value (W) | | | Amount | | | Date | | | (Depreciation) | |
| |
| Australian Dollar (Sell) | | $ | 333 | | | $ | 331 | | | | 05/01/08 | | | $ | (2 | ) |
| Australian Dollar (Sell) | | | 354 | | | | 349 | | | | 05/02/08 | | | | (5 | ) |
| British Pound (Buy) | | | 271 | | | | 271 | | | | 05/01/08 | | | | — | |
| Euro (Buy) | | | 636 | | | | 637 | | | | 05/02/08 | | | | (1 | ) |
| Euro (Buy) | | | 29 | | | | 29 | | | | 05/05/08 | | | | — | |
| Norwegian Krone (Buy) | | | 516 | | | | 515 | | | | 05/02/08 | | | | 1 | |
| Singapore Dollar (Buy) | | | 44 | | | | 44 | | | | 05/02/08 | | | | — | |
| Singapore Dollar (Buy) | | | 59 | | | | 59 | | | | 05/05/08 | | | | — | |
| South African Rand (Buy) | | | 110 | | | | 109 | | | | 05/08/08 | | | | 1 | |
| Swiss Franc (Buy) | | | 200 | | | | 200 | | | | 05/02/08 | | | | — | |
| | | | | | | | | | | | | | | | | |
| | | | | | | | | | | | | | | $ | (6 | ) |
| | | | | | | | | | | | | | | | | |
| | |
| (W) | | See Note 2b of accompanying Notes to Financial Statements regarding valuation of securities. |
Diversification by Industry
as of April 30, 2008
| | | | | |
| | | Percentage of
|
Industry | | Net Assets |
| Commercial Banking | | | 11.5 | % |
| |
| |
| Consumer Lending | | | 2.7 | |
| |
| |
| Depository Credit Banking | | | 24.6 | |
| |
| |
| Insurance Carriers | | | 19.4 | |
| |
| |
| International Trade Financing (Foreign Banks) | | | 9.8 | |
| |
| |
| Monetary Authorities — Central Bank | | | 2.6 | |
| |
| |
| Nondepository Credit Banking | | | 9.1 | |
| |
| |
| Other Financial Investment Activities | | | 6.0 | |
| |
| |
| Real Estate Credit (Mortgage Banking) | | | 4.6 | |
| |
| |
| Securities, Commodities and Brokerage | | | 4.5 | |
| |
| |
| Short-Term Investments | | | 12.8 | |
| |
| |
| Other Assets and Liabilities | | | (7.6 | ) |
| |
| |
Total | | | 100.0 | % |
| |
| |
The accompanying notes are an integral part of these financial statements.
163
The Hartford Global Growth Fund
Schedule of Investments
April 30, 2008 (Unaudited)
(000’s Omitted)
| | | | | | | | | | | | | |
| | | | | | | | | Market
| |
| Shares | | | | | | | | Value (W) | |
| COMMON STOCK — 98.3% |
| | | | | Basic Materials — 9.4% |
| | 425 | | | BHP Billiton plc | | $ | 15,170 | |
| | 212 | | | Cameco Corp. | | | 7,404 | |
| | 238 | | | Companhia Vale do Rio Doce ADR | | | 9,313 | |
| | 65 | | | Potash Corp. of Saskatchewan, Inc. | | | 12,030 | |
| | 105 | | | Praxair, Inc. (G) | | | 9,569 | |
| | 179 | | | Xstrata plc | | | 13,909 | |
| | | | | | | | | |
| | | | | | | | | | | | 67,395 | |
| | | | | | | | | | | | | |
| | | | | Capital Goods — 6.4% |
| | 57 | | | Alstom RGPT | | | 13,006 | |
| | 90 | | | Boeing Co. | | | 7,671 | |
| | 185 | | | Gamesa Corporacion Tecnologica S.A. | | | 8,911 | |
| | 177 | | | International Game Technology | | | 6,139 | |
| | 97 | | | Vestas Wind Systems A/S (D) | | | 10,517 | |
| | | | | | | | | |
| | | | | | | | | | | | 46,244 | |
| | | | | | | | | | | | | |
| | | | | Consumer Cyclical — 7.6% |
| | 352 | | | Arcandor AG (D)(G) | | | 6,579 | |
| | 2,182 | | | China Communications Construction Co., Ltd. | | | 5,182 | |
| | 99 | | | Daimler AG | | | 7,720 | |
| | 59 | | | LG Electronics, Inc. (D) | | | 9,111 | |
| | 473 | | | Mitsui & Co., Ltd. | | | 11,109 | |
| | 28 | | | Nintendo Co., Ltd. | | | 15,257 | |
| | | | | | | | | |
| | | | | | | | | | | | 54,958 | |
| | | | | | | | | | | | | |
| | | | | Consumer Staples — 4.5% |
| | 30 | | | Nestle S.A. | | | 14,360 | |
| | 162 | | | Reckitt Benckiser Group plc | | | 9,442 | |
| | 261 | | | Unilever N.V. CVA | | | 8,696 | |
| | | | | | | | | |
| | | | | | | | | | | | 32,498 | |
| | | | | | | | | | | | | |
| | | | | Energy — 8.8% |
| | 69 | | | Diamond Offshore Drilling, Inc. | | | 8,679 | |
| | 35 | | | Hess Corp. | | | 3,664 | |
| | 190 | | | Nabors Industries Ltd. (D) | | | 7,121 | |
| | 111 | | | Schlumberger Ltd. | | | 11,171 | |
| | 429 | | | Seadrill Ltd. | | | 12,928 | |
| | 75 | | | Suncor Energy, Inc. | | | 8,486 | |
| | 130 | | | Ultra Petroleum Corp. (D) | | | 10,832 | |
| | | | | | | | | |
| | | | | | | | | | | | 62,881 | |
| | | | | | | | | | | | | |
| | | | | Finance — 9.6% |
| | 420 | | | Bolsa De Mercadorias e Futuros | | | 4,269 | |
| | 51 | | | Deutsche Boerse AG (G) | | | 7,455 | |
| | 49 | | | Goldman Sachs Group, Inc. | | | 9,396 | |
| | 112 | | | Julius Baer Holding Ltd. | | | 8,177 | |
| | 1,073 | | | Man Group plc | | | 12,277 | |
| | 279 | | | MF Global Ltd. (D) | | | 3,673 | |
| | 124 | | | National Bank of Greece | | | 6,841 | |
| | 47 | | | Societe Generale Class A | | | 5,424 | |
| | 469 | | | Sun Hung Kai Properties Ltd. | | | 8,196 | |
| | 292 | | | Washington Mutual, Inc. PIPE (A)(H) | | | 3,231 | |
| | | | | | | | | |
| | | | | | | | | | | | 68,939 | |
| | | | | | | | | | | | | |
| | | | | Health Care — 9.7% |
| | 181 | | | Allergan, Inc. | | | 10,175 | |
| | 241 | | | CSL Ltd. | | | 9,020 | |
| | 412 | | | Elan Corp. plc ADR (D)(G) | | | 10,837 | |
| | 193 | | | Gilead Sciences, Inc. (D) | | | 9,974 | |
| | 88 | | | Monsanto Co. | | | 10,034 | |
| | 251 | | | St. Jude Medical, Inc. (D) | | | 10,984 | |
| | 186 | | | Teva Pharmaceutical Industries Ltd. ADR | | | 8,710 | |
| | | | | | | | | |
| | | | | | | | | | | | 69,734 | |
| | | | | | | | | | | | | |
| | | | | Services — 3.1% |
| | 61 | | | FedEx Corp. | | | 5,819 | |
| | 176 | | | Focus Media Holding Ltd. ADR (D)(G) | | | 6,507 | |
| | 132 | | | Las Vegas Sands Corp. (D)(G) | | | 10,076 | |
| | | | | | | | | |
| | | | | | | | | | | | 22,402 | |
| | | | | | | | | | | | | |
| | | | | Technology — 32.6% |
| | 362 | | | ABB Ltd. | | | 11,036 | |
| | 141 | | | America Movil S.A.B de C.V. ADR | | | 8,161 | |
| | 370 | | | American Tower Corp. Class A (D) | | | 16,074 | |
| | 52 | | | Apple, Inc. (D) | | | 9,115 | |
| | 360 | | | ASML Holding N.V. | | | 10,213 | |
| | 506 | | | Corning, Inc. | | | 13,510 | |
| | 120 | | | Danaher Corp. (G) | | | 9,362 | |
| | 478 | | | Electronic Arts, Inc. (D)(G) | | | 24,577 | |
| | 16 | | | Google, Inc. (D) | | | 9,361 | |
| | 165 | | | Hewlett-Packard Co. | | | 7,648 | |
| | 299 | | | Hologic, Inc. (D)(G) | | | 8,722 | |
| | 1,447 | | | Hon Hai Precision Industry Co., Ltd. | | | 8,364 | |
| | 664 | | | Metropcs Communications, Inc. (D)(G) | | | 13,037 | |
| | 420 | | | Microsoft Corp. | | | 11,964 | |
| | 100 | | | Millicom International Cellular S.A. (D) | | | 10,769 | |
| | 359 | | | Nokia Corp. | | | 10,801 | |
| | 582 | | | Oracle Corp. (D) | | | 12,139 | |
| | 261 | | | Qualcomm, Inc. | | | 11,290 | |
| | 102 | | | Research In Motion Ltd. (D) | | | 12,345 | |
| | 60 | | | Siemens AG | | | 7,073 | |
| | 308 | | | Telefonica S.A. | | | 8,852 | |
| | | | | | | | | |
| | | | | | | | | | | | 234,413 | |
| | | | | | | | | | | | | |
| | | | | Transportation — 2.8% |
| | 83 | | | General Dynamics Corp. | | | 7,505 | |
| | 233 | | | Royal Caribbean Cruises Ltd. | | | 7,445 | |
| | 181 | | | Ryanair Holdings plc ADR (D)(G) | | | 4,902 | |
| | | | | | | | | |
| | | | | | | | | | | | 19,852 | |
| | | | | | | | | | | | | |
| | | | | Utilities — 3.8% |
| | 1,643 | | | Iberdrola Renovables (D) | | | 11,931 | |
| | 96 | | | Sunpower Corp. (D)(G) | | | 8,404 | |
| | 153 | | | Suntech Power Holdings Co., Ltd. ADR (D)(G) | | | 6,844 | |
| | | | | | | | | |
| | | | | | | | | | | | 27,179 | |
| | | | | | | | | | | | | |
| | | | | Total common stock
(cost $585,873) | | $ | 706,495 | |
| | | | | | | | | |
| | | | | | | | | | | | | |
| | | | | | | | | | | | | |
| | | | | | | | | | | | | |
The accompanying notes are an integral part of these financial statements.
164
| | | | | | | | | | | | | |
| | | | | | | | | Market
| |
| Shares | | | | | | | | Value (W) | |
| PREFERRED STOCK — 0.4% |
| | | | | Finance — 0.4% |
| | — | | | Washington Mutual, Inc. (A)(D)(H)(X) | | $ | 2,528 | |
| | | | | | | | | |
| | | | | Total preferred stock
(cost $2,000) | | $ | 2,528 | |
| | | | | | | | | |
| | | | | Total long-term investments
(cost $587,873) | | $ | 709,023 | |
| | | | | | | | | | | | | |
| | | | | | | | | | | | | |
Principal
| | | | | | | | | |
| Amount | | | | | | | | | |
| |
| SHORT-TERM INVESTMENTS — 13.0% |
| | | | | Repurchase Agreements — 2.6% |
| | | | | Banc of America Securities TriParty Joint Repurchase Agreement (maturing on 05/01/2008 in the amount of $7,087, collateralized by FHLMC 5.00%, 2035, value of $7,228) | | | | |
| $ | 7,086 | | | 1.98% dated 04/30/2008 | | $ | 7,086 | |
| | | | | BNP Paribas Securities Corp. TriParty Joint Repurchase Agreement (maturing on 05/01/2008 in the amount of $3,475, collateralized by FNMA 5.50% — 6.50%, 2036 — 2038, value of $3,544) | | | | |
| | 3,475 | | | 2.00% dated 04/30/2008 | | | 3,475 | |
| | | | | Deutsche Bank Securities Joint Repurchase Agreement (maturing on 05/01/2008 in the amount of $7, collateralized by U. S. Treasury Note 3.63%, 2009, value of $7) | | | | |
| | 7 | | | 1.90% dated 04/30/2008 | | | 7 | |
| | | | | Deutsche Bank Securities TriParty Joint Repurchase Agreement (maturing on 05/01/2008 in the amount of $4,320, collateralized by FHLMC 4.50% — 7.00%, 2016 — 2038, value of $4,406) | | | | |
| | 4,320 | | | 2.00% dated 04/30/2008 | | | 4,320 | |
| | | | | JP Morgan Chase TriParty Joint Repurchase Agreement (maturing on 05/01/2008 in the amount of $4,163, collateralized by FNMA 4.50% — 7.00%, 2020 — 2038, value of $4,246) | | | | |
| | 4,163 | | | 1.96% dated 04/30/2008 | | | 4,163 | |
| | | | | | | | | |
| | | | | | | | | | | | 19,051 | |
| | | | | | | | | | | | | |
| | | | | | | | | | | | | |
| | | | | | | | | | | | | |
| Shares | | | | | | | | | |
| |
| | | | | Securities Purchased with Proceeds from Security Lending — 10.4% |
| | | | | Cash Collateral Reinvestment Fund: |
| | 36,575 | | | Goldman Sachs FS Prime Obligation/Institutional Fund | | | 36,575 | |
| | 38,043 | | | Mellon GSL DBT II Collateral Fund (H) | | | 38,042 | |
| | | | | | | | | |
| | | | | | | | | | | | 74,617 | |
| | | | | | | | | | | | | |
| | | | | Total short-term investments
(cost $93,668) | | $ | 93,668 | |
| | | | | | | | | |
| | | | | Total investments
(cost $681,541) (C) | | | 111.7 | % | | $ | 802,691 | |
| | | | | Other assets and liabilities | | | (11.7 | )% | | | (83,906 | ) |
| | | | | | | | | | | | | |
| | | | | Total net assets | | | 100.0 | % | | $ | 718,785 | |
| | | | | | | | | | | | | |
| |
| Note: | Percentage of investments as shown is the ratio of the total market value to total net assets. Market value of investments in foreign securities represents 55.39% of total net assets at April 30, 2008. |
| | |
| (C) | | At April 30, 2008, the cost of securities for federal income tax purposes was $682,109 and the aggregate gross unrealized appreciation and depreciation based on that cost were: |
| | | | | |
| Unrealized Appreciation | | $ | 144,861 | |
| Unrealized Depreciation | | | (24,279 | ) |
| | | | | |
| Net Unrealized Appreciation | | $ | 120,582 | |
| | | | | |
| | |
| (A) | | The aggregate value of securities valued in good faith at fair value as determined under policies and procedures established by and under the supervision of the Funds’ Board of Directors at April 30, 2008 was $5,759, which represents 0.80% of total net assets. This calculation excludes securities that are principally traded on certain foreign markets and whose prices were adjusted solely pursuant to a third party pricing service methodology approved by the Board of Directors. |
| |
| (D) | | Currently non-income producing. |
| |
| (G) | | Security is partially on loan at April 30, 2008. |
| |
| (X) | | Convertible security. |
| |
| (H) | | The following securities are considered illiquid. Illiquid securities are often purchased in private placement transactions, are not registered under the Securities Act of 1933 and may have contractual restrictions on resale. A security may also be considered illiquid if the security lacks a readily available market or if its valuation has not changed for a certain period of time. Notwithstanding the foregoing, although the Mellon GLS DBT II Collateral Fund has been deemed illiquid for purposes of this report, the Mellon GLS DBT II Collateral Fund has redeemed shares daily in respect of recalled loaned securities. |
| | | | | | | | | | | |
Period
| | | | | | | | |
Acquired | | Shares/Par | | | Security | | Cost Basis | |
| 04/2008 | | | — | | | Washington Mutual, Inc. Preferred Stock | | $ | 2,000 | |
| 04/2008 | | | 292 | | | Washington Mutual, Inc. PIPE - Reg D | | | 2,556 | |
12/2007 –
04/2008 | | | 38,043 | | | Mellon GSL DBT II Collateral Fund | | $ | 38,043 | |
| | |
| | The aggregate value of these securities at April 30, 2008 was $43,801, which represents 6.09% of total net assets. |
PIPE — Private Investment in Public Equity.
Forward Foreign Currency Contracts Outstanding at April 30, 2008
| | | | | | | | | | | | | | | | | |
| | | | | | | | | | | | Unrealized
| |
| | | Market
| | | Contract
| | | Delivery
| | | Appreciation/
| |
Description | | Value (W) | | | Amount | | | Date | | | (Depreciation) | |
| |
| Euro (Buy) | | $ | 3,625 | | | $ | 3,632 | | | | 05/02/08 | | | | $(7 | ) |
| Euro (Buy) | | | 1,187 | | | | 1,183 | | | | 05/05/08 | | | | 4 | |
| Euro (Buy) | | | 720 | | | | 719 | | | | 05/06/08 | | | | 1 | |
| | | | | | | | | | | | | | | | | |
| | | | | | | | | | | | | | | | $(2 | ) |
| | | | | | | | | | | | | | | | | |
| | |
| (W) | | See Note 2b of accompanying Notes to Financial Statements regarding valuation of securities. |
The accompanying notes are an integral part of these financial statements.
165
The Hartford Global Growth Fund
Schedule of Investments — (continued)
April 30, 2008 (Unaudited)
(000’s Omitted)
Diversification by Country
as of April 30, 2008
| | | | | |
| | | Percentage of
|
Country | | Net Assets |
| Australia | | | 1.2 | % |
| |
| |
| Brazil | | | 1.9 | |
| |
| |
| Canada | | | 5.6 | |
| |
| |
| China | | | 2.6 | |
| |
| |
| Denmark | | | 1.5 | |
| |
| |
| Finland | | | 1.5 | |
| |
| |
| France | | | 2.6 | |
| |
| |
| Germany | | | 4.0 | |
| |
| |
| Greece | | | 0.9 | |
| |
| |
| Hong Kong | | | 1.1 | |
| |
| |
| Ireland | | | 2.2 | |
| |
| |
| Israel | | | 1.2 | |
| |
| |
| Japan | | | 3.7 | |
| |
| |
| Luxembourg | | | 1.5 | |
| |
| |
| Mexico | | | 1.1 | |
| |
| |
| Netherlands | | | 2.6 | |
| |
| |
| Norway | | | 1.8 | |
| |
| |
| South Korea | | | 1.3 | |
| |
| |
| Spain | | | 4.1 | |
| |
| |
| Switzerland | | | 4.7 | |
| |
| |
| Taiwan | | | 1.2 | |
| |
| |
| United Kingdom | | | 7.1 | |
| |
| |
| United States | | | 43.3 | |
| |
| |
| Short-Term Investments | | | 13.0 | |
| |
| |
| Other Assets and Liabilities | | | (11.7 | ) |
| |
| |
Total | | | 100.0 | % |
| |
| |
The accompanying notes are an integral part of these financial statements.
166
The Hartford Global Health Fund
Schedule of Investments
April 30, 2008 (Unaudited)
(000’s Omitted)
| | | | | | | | | | | | | |
| | | | | | | | | Market
| |
| Shares | | | | | | | | Value (W) | |
| COMMON STOCK — 99.2% |
| | | | | Drugs & Druggists Sundries Wholesalers — 4.5% |
| | 713 | | | McKesson Corp. | | $ | 37,177 | |
| | | | | Electromedical Manufacturing — 7.5% |
| | 240 | | | Beckman Coulter, Inc. | | | 16,385 | |
| | 937 | | | Medtronic, Inc. | | | 45,594 | |
| | | | | | | | | |
| | | | | | | | | | | | 61,979 | |
| | | | | | | | | | | | | |
| | | | | General Medical and Surgical Hospitals — 2.1% |
| | 1,295 | | | Health Management Associates, Inc. Class A (D)(G) | | | 9,234 | |
| | 135 | | | Universal Health Services, Inc. Class B | | | 8,463 | |
| | | | | | | | | |
| | | | | | | | | | | | 17,697 | |
| | | | | | | | | | | | | |
| | | | | Health and Personal Care Stores — 2.8% |
| | 181 | | | Longs Drug Stores Corp. | | | 7,263 | |
| | 449 | | | Walgreen Co. | | | 15,633 | |
| | | | | | | | | |
| | | | | | | | | | | | 22,896 | |
| | | | | | | | | | | | | |
| | | | | Individual and Family Services — 0.1% |
| | 195 | | | Amil Participacoes S.A. | | | 1,184 | |
| | | | | Insurance Carriers — 3.9% |
| | 337 | | | Aetna, Inc. | | | 14,684 | |
| | 554 | | | UnitedHealth Group, Inc. | | | 18,063 | |
| | | | | | | | | |
| | | | | | | | | | | | 32,747 | |
| | | | | | | | | | | | | |
| | | | | Medical and Diagnostic Laboratories — 0.7% |
| | 318 | | | DiaSorin S.p.A. (D) | | | 5,741 | |
| | | | | Medical Equipment & Supplies Manufacturing — 8.7% |
| | 144 | | | Becton, Dickinson & Co. | | | 12,909 | |
| | 211 | | | Fresenius Medical Care AG ADR | | | 11,171 | |
| | 400 | | | St. Jude Medical, Inc. (D) | | | 17,530 | |
| | 517 | | | Symmetry Medical, Inc. (D) | | | 7,254 | |
| | 52 | | | Synthes, Inc. | | | 7,087 | |
| | 693 | | | Volcano Corp. (D) | | | 8,203 | |
| | 108 | | | Zimmer Holdings, Inc. (D) | | | 8,002 | |
| | | | | | | | | |
| | | | | | | | | | | | 72,156 | |
| | | | | | | | | | | | | |
| | | | | Outpatient Care Centers — 2.2% |
| | 415 | | | Coventry Health Care, Inc. (D) | | | 18,567 | |
| | | | | Pharmaceutical & Medicine Manufacturing — 56.0% |
| | 297 | | | 3SBio, Inc. ADR (D) | | | 3,104 | |
| | 968 | | | Abbott Laboratories | | | 51,036 | |
| | 221 | | | Amgen, Inc. (D) | | | 9,266 | |
| | 376 | | | Amylin Pharmaceuticals, Inc. (D)(G) | | | 10,370 | |
| | 552 | | | Astellas Pharma, Inc. | | | 22,719 | |
| | 442 | | | AstraZeneca plc ADR | | | 18,563 | |
| | 208 | | | Barr Pharmaceuticals, Inc. (D) | | | 10,438 | |
| | 466 | | | Bristol-Myers Squibb Co. | | | 10,227 | |
| | 280 | | | Cephalon, Inc. (D)(G) | | | 17,471 | |
| | 155 | | | Cougar Biotechnology PIPE (D) | | | 3,120 | |
| | 16 | | | Cougar Biotechnology, Inc. (D)(G) | | | 313 | |
| | 989 | | | Cytokinetics, Inc. (D)(G) | | | 3,412 | |
| | 894 | | | Daiichi Sankyo Co., Ltd. | | | 24,642 | |
| | 570 | | | Eisai Co., Ltd. (G) | | | 20,186 | |
| | 929 | | | Elan Corp. plc ADR (D) | | | 24,434 | |
| | 248 | | | Eli Lilly & Co. | | | 11,929 | |
| | 462 | | | Forest Laboratories, Inc. (D) | | | 16,043 | |
| | 562 | | | Gilead Sciences, Inc. (D) | | | 29,099 | |
| | 150 | | | H. Lundbeck A/S (G) | | | 3,697 | |
| | 243 | | | Hospira, Inc. (D) | | | 10,003 | |
| | 108 | | | Ipsen | | | 6,598 | |
| | 228 | | | Laboratorios Almiral S.A. (D) | | | 4,753 | |
| | 136 | | | OSI Pharmaceuticals, Inc. (D)(G) | | | 4,709 | |
| | 136 | | | Profarma Distribuidora | | | 2,442 | |
| | 912 | | | Progenics Pharmaceuticals, Inc. (D)(G) | | | 12,286 | |
| | 580 | | | Sanofi-Aventis S.A. ADR | | | 22,372 | |
| | 1,969 | | | Schering-Plough Corp. | | | 36,244 | |
| | 1,301 | | | Shionogi & Co., Ltd. | | | 25,127 | |
| | 276 | | | Teva Pharmaceutical Industries Ltd. ADR | | | 12,906 | |
| | 490 | | | UCB S.A. (G) | | | 21,078 | |
| | 305 | | | Vertex Pharmaceuticals, Inc. (D)(G) | | | 7,781 | |
| | 193 | | | Wyeth | | | 8,574 | |
| | | | | | | | | |
| | | | | | | | | | | | 464,942 | |
| | | | | | | | | | | | | |
| | | | | Professional Services — Computer System Design and Related — 0.6% |
| | 237 | | | Eclipsys Corp. (D)(G) | | | 4,925 | |
| | | | | Scientific Research & Development Services — 10.1% |
| | 830 | | | Applera Corp. — Celera Group (D) | | | 11,101 | |
| | 509 | | | Exelixis, Inc. (D)(G) | | | 3,870 | |
| | 335 | | | Genentech, Inc. (D) | | | 22,847 | |
| | 1,186 | | | Human Genome Sciences, Inc. (D)(G) | | | 7,770 | |
| | 378 | | | Incyte Corp. (D)(G) | | | 4,105 | |
| | 399 | | | Medicines Co. (D)(G) | | | 7,876 | |
| | 369 | | | Millennium Pharmaceuticals, Inc. (D) | | | 9,185 | |
| | 281 | | | Regeneron Pharmaceuticals, Inc. (D) | | | 5,519 | |
| | 392 | | | Seattle Genetics, Inc. (D)(G) | | | 3,982 | |
| | 831 | | | Zymogenetics, Inc. (D)(G) | | | 7,397 | |
| | | | | | | | | |
| | | | | | | | | | | | 83,652 | |
| | | | | | | | | | | | | |
| | | | | Total common stock
(cost $820,473) | | $ | 823,663 | |
| | | | | | | | | | | | | |
| | | | | | | | | | | | | |
| SHORT-TERM INVESTMENTS — 10.2% |
| | | | | Securities Purchased with Proceeds from Security Lending — 10.2% |
| | | | | Cash Collateral Reinvestment Fund: |
| $ | 85,065 | | | Navigator Prime Portfolio | | $ | 85,065 | |
| | | | | | | | | |
| | | | | Total short-term investments
(cost $85,065) | | $ | 85,065 | |
| | | | | | | | | |
| | | | | Total investments
(cost $905,538) (C) | | | 109.4 | % | | $ | 908,728 | |
| | | | | Other assets and liabilities | | | (9.4 | )% | | | (78,204 | ) |
| | | | | | | | | | | | | |
| | | | | Total net assets | | | 100.0 | % | | $ | 830,524 | |
| | | | | | | | | | | | | |
| |
| Note: | Percentage of investments as shown is the ratio of the total market value to total net assets. Market value of investments in foreign securities represents 28.63% of total net assets at April 30, 2008. |
| |
| | Foreign securities that are principally traded on certain foreign markets are adjusted daily pursuant to a third party pricing service methodology approved by the Board of Directors in order to reflect an adjustment for factors occurring after the close of the foreign market but before the close of the New York Stock Exchange. |
The accompanying notes are an integral part of these financial statements.
167
The Hartford Global Health Fund
Schedule of Investments — (continued)
April 30, 2008 (Unaudited)
(000’s Omitted)
| | |
| (C) | | At April 30, 2008, the cost of securities for federal income tax purposes was $906,983 and the aggregate gross unrealized appreciation and depreciation based on that cost were: |
| | | | | |
| Unrealized Appreciation | | $ | 68,545 | |
| Unrealized Depreciation | | | (66,800 | ) |
| | | | | |
| Net Unrealized Appreciation | | $ | 1,745 | |
| | | | | |
| | |
| (D) | | Currently non-income producing. |
| |
| (G) | | Security is partially on loan at April 30, 2008. |
| |
| | PIPE — Private Investment in Public Equity. |
Forward Foreign Currency Contracts Outstanding at April 30, 2008
| | | | | | | | | | | | | | | | | |
| | | | | | | | | | | | Unrealized
| |
| | | Market
| | | Contract
| | | Delivery
| | | Appreciation/
| |
Description | | Value (W) | | | Amount | | | Date | | | (Depreciation) | |
| |
| Japanese Yen (Sell) | | $ | 2,177 | | | $ | 2,168 | | | | 05/01/08 | | | $ | (9 | ) |
| | | | | | | | | | | | | | | | | |
| | |
| (W) | | See Note 2b of accompanying Notes to Financial Statements regarding valuation of securities. |
Diversification by Country
as of April 30, 2008
| | | | | |
| | | Percentage of
|
Country | | Net Assets |
| Belgium | | | 2.5 | % |
| |
| |
| Brazil | | | 0.4 | |
| |
| |
| China | | | 0.4 | |
| |
| |
| Denmark | | | 0.4 | |
| |
| |
| France | | | 3.5 | |
| |
| |
| Germany | | | 1.4 | |
| |
| |
| Ireland | | | 2.9 | |
| |
| |
| Israel | | | 1.6 | |
| |
| |
| Italy | | | 0.7 | |
| |
| |
| Japan | | | 11.2 | |
| |
| |
| Spain | | | 0.6 | |
| |
| |
| Switzerland | | | 0.9 | |
| |
| |
| United Kingdom | | | 2.2 | |
| |
| |
| United States | | | 70.5 | |
| |
| |
| Short-Term Investments | | | 10.2 | |
| |
| |
| Other Assets and Liabilities | | | (9.4 | ) |
| |
| |
Total | | | 100.0 | % |
| |
| |
The accompanying notes are an integral part of these financial statements.
168
The Hartford Global Technology Fund
Schedule of Investments
April 30, 2008 (Unaudited)
(000’s Omitted)
| | | | | | | | | | | | | |
| | | | | | | | | Market
| |
| Shares | | | | | | | | Value (W) | |
| COMMON STOCK — 98.4% |
| | | | | Activities Related to Credit Banking — 4.5% |
| | 6 | | | Visa, Inc. (D) | | $ | 517 | |
| | 97 | | | Western Union Co. | | | 2,238 | |
| | | | | | | | | |
| | | | | | | | | | | | 2,755 | |
| | | | | | | | | | | | | |
| | | | | Business Support Services — 0.3% |
| | 7 | | | Iron Mountain, Inc. (D)(G) | | | 199 | |
| | | | | Communications Equipment Manufacturing — 9.1% |
| | 78 | | | Qualcomm, Inc. | | | 3,347 | |
| | 18 | | | Research In Motion Ltd. (D) | | | 2,165 | |
| | | | | | | | | |
| | | | | | | | | | | | 5,512 | |
| | | | | | | | | | | | | |
| | | | | Computer and Peripheral — 13.5% |
| | 68 | | | Hewlett-Packard Co. | | | 3,156 | |
| | 360 | | | Hon Hai Precision Industry Co., Ltd. | | | 2,080 | |
| | 118 | | | NetApp, Inc. (D) | | | 2,851 | |
| | 7 | | | Teradata Corp. (D) | | | 147 | |
| | | | | | | | | |
| | | | | | | | | | | | 8,234 | |
| | | | | | | | | | | | | |
| | | | | Electrical and Electronic Merchandise Wholesalers — 2.8% |
| | 11 | | | LG Electronics, Inc. (D) | | | 1,715 | |
| | | | | Electrical Equipment Manufacturing — Component Other — 2.8% |
| | 30 | | | Ciena Corp. (D)(G) | | | 1,018 | |
| | 14 | | | CommScope, Inc. (D) | | | 656 | |
| | | | | | | | | |
| | | | | | | | | | | | 1,674 | |
| | | | | | | | | | | | | |
| | | | | Employment Services — 1.6% |
| | 14 | | | Manpower, Inc. | | | 967 | |
| | | | | Industrial Machinery Manufacturing — 1.2% |
| | 20 | | | Varian Semiconductor Equipment Associates, Inc. (D) | | | 733 | |
| | | | | Industrial Machinery, Equipment Rental & Leasing — 3.1% |
| | 109 | | | Comverse Technology, Inc. (D) | | | 1,899 | |
| | | | | Internet Providers & Web Search Portal — 5.7% |
| | 12 | | | Equinix, Inc. (D)(G) | | | 1,040 | |
| | 4 | | | Google, Inc. (D) | | | 2,455 | |
| | | | | | | | | |
| | | | | | | | | | | | 3,495 | |
| | | | | | | | | | | | | |
| | | | | Management, Scientific, Technical Consulting Service — 2.4% |
| | 27 | | | Accenture Ltd. Class A | | | 1,010 | |
| | 18 | | | Monster Worldwide, Inc. (D) | | | 440 | |
| | | | | | | | | |
| | | | | | | | | | | | 1,450 | |
| | | | | | | | | | | | | |
| | | | | Other Telecommunications — 4.7% |
| | 88 | | | Corning, Inc. | | | 2,358 | |
| | 309 | | | Foxconn International Holdings Ltd. (D) | | | 478 | |
| | | | | | | | | |
| | | | | | | | | | | | 2,836 | |
| | | | | | | | | | | | | |
| | | | | Professional & Commercial Equipment — 1.9% |
| | 67 | | | Ingram Micro, Inc. (D) | | | 1,145 | |
| | | | | Professional Services — Computer System Design and Related — 3.7% |
| | 28 | | | Automatic Data Processing, Inc. | | | 1,251 | |
| | 16 | | | DST Systems, Inc. (D)(G) | | | 975 | |
| | | | | | | | | |
| | | | | | | | | | | | 2,226 | |
| | | | | | | | | | | | | |
| | | | | Semiconductor, Electronic Component Manufacturing — 20.5% |
| | 59 | | | Applied Materials, Inc. | | | 1,094 | |
| | 74 | | | Asm Pacific Technology | | | 507 | |
| | 46 | | | ASML Holding N.V. | | | 1,291 | |
| | 36 | | | Broadcom Corp. Class A (D) | | | 927 | |
| | 51 | | | Fairchild Semiconductor International, Inc. (D) | | | 662 | |
| | 50 | | | Intel Corp. | | | 1,115 | |
| | 44 | | | Lam Research Corp. (D) | | | 1,793 | |
| | 71 | | | Marvell Technology Group Ltd. (D) | | | 913 | |
| | 70 | | | Maxim Integrated Products, Inc. | | | 1,464 | |
| | 242 | | | ON Semiconductor Corp. (D)(G) | | | 1,805 | |
| | 101 | | | Skyworks Solutions, Inc. (D) | | | 874 | |
| | | | | | | | | |
| | | | | | | | | | | | 12,445 | |
| | | | | | | | | | | | | |
| | | | | Software Publishers — 20.6% |
| | 13 | | | BMC Software, Inc. (D) | | | 462 | |
| | 64 | | | Electronic Arts, Inc. (D) | | | 3,268 | |
| | 21 | | | McAfee, Inc. (D) | | | 702 | |
| | 189 | | | Microsoft Corp. | | | 5,396 | |
| | 45 | | | Red Hat, Inc. (D)(G) | | | 920 | |
| | 17 | | | Temenos Group AG (D) | | | 464 | |
| | 32 | | | Tibco Software, Inc. (D) | | | 245 | |
| | 29 | | | VeriSign, Inc. (D)(G) | | | 1,042 | |
| | | | | | | | | |
| | | | | | | | | | | | 12,499 | |
| | | | | | | | | | | | | |
| | | | | Total common stock
(cost $58,023) | | $ | 59,784 | |
| | | | | | | | | | | | | |
| | | | | | | | | | | | | |
Principal
| | | | | | | | | |
| Amount | | | | | | | | | |
| |
| SHORT-TERM INVESTMENTS — 9.5% |
| | | | | Repurchase Agreements — 1.0% |
| | | | | Banc of America Securities TriParty Joint Repurchase Agreement (maturing on 05/01/2008 in the amount of $226, collateralized by FHLMC 5.00%, 2035, value of $230) | | | | |
| $ | 226 | | | 1.98% dated 04/30/2008 | | $ | 226 | |
| | | | | BNP Paribas Securities Corp. TriParty Joint Repurchase Agreement (maturing on 05/01/2008 in the amount of $111, collateralized by FNMA 5.50% — 6.50%, 2036 — 2038, value of $113) | | | | |
| | 111 | | | 2.00% dated 04/30/2008 | | | 111 | |
| | | | | Deutsche Bank Securities Joint Repurchase Agreement (maturing on 05/01/2008 in the amount of $—, collateralized by U. S. Treasury Note 3.63%, 2009, value of $—) | | | | |
| | — | | | 1.90% dated 04/30/2008 | | | — | |
| | | | | Deutsche Bank Securities TriParty Joint Repurchase Agreement (maturing on 05/01/2008 in the amount of $138, collateralized by FHLMC 4.50% — 7.00%, 2016 — 2038, value of $140) | | | | |
| | 137 | | | 2.00% dated 04/30/2008 | | | 137 | |
The accompanying notes are an integral part of these financial statements.
169
The Hartford Global Technology Fund
Schedule of Investments — (continued)
April 30, 2008 (Unaudited)
(000’s Omitted)
| | | | | | | | | | | | | |
Principal
| | | | | | | | Market
| |
| Amount | | | | | | | | Value (W) | |
| |
| | | | | | | | | | | | | |
| SHORT-TERM INVESTMENTS — (continued) |
| | | | | | | | | | | | | |
| | | | | Repurchase Agreements — (continued) |
| | | | | JP Morgan Chase TriParty Joint Repurchase Agreement (maturing on 05/01/2008 in the amount of $133, collateralized by FNMA 4.50% — 7.00%, 2020 — 2038, value of $135) | | | | |
| $ | 133 | | | 1.96% dated 04/30/2008 | | $ | 133 | |
| | | | | | | | | |
| | | | | | | | | | | | 607 | |
| | | | | | | | | | | | | |
| | | | | Securities Purchased with Proceeds from Security Lending — 8.5% |
| | | | | Cash Collateral Reinvestment Fund: |
| | 5,145 | | | Goldman Sachs FS Prime Obligation/Institutional Fund | | | 5,145 | |
| | | | | | | | | |
| | | | | Total short-term investments
(cost $5,752) | | $ | 5,752 | |
| | | | | | | | | |
| | | | | Total investments
(cost $63,775) (C) | | | 107.9 | % | | $ | 65,536 | |
| | | | | Other assets and liabilities | | | (7.9 | )% | | | (4,781 | ) |
| | | | | | | | | | | | | |
| | | | | Total net assets | | | 100.0 | % | | $ | 60,755 | |
| | | | | | | | | | | | | |
| |
| Note: | Percentage of investments as shown is the ratio of the total market value to total net assets. Market value of investments in foreign securities represents 14.32% of total net assets at April 30, 2008. |
Foreign securities that are principally traded on certain foreign markets are adjusted daily pursuant to a third party pricing service methodology approved by the Board of Directors in order to reflect an adjustment for factors occurring after the close of the foreign market but before the close of the New York Stock Exchange.
| | |
| (C) | | At April 30, 2008, the cost of securities for federal income tax purposes was $64,136 and the aggregate gross unrealized appreciation and depreciation based on that cost were: |
| | | | | |
| Unrealized Appreciation | | $ | 4,904 | |
| Unrealized Depreciation | | | (3,504 | ) |
| | | | | |
| Net Unrealized Appreciation | | $ | 1,400 | |
| | | | | |
| | |
| (D) | | Currently non-income producing. |
| |
| (G) | | Security is partially on loan at April 30, 2008. |
Forward Foreign Currency Contracts Outstanding at April 30, 2008
| | | | | | | | | | | | | | | | | |
| | | | | | | | | | | | Unrealized
| |
| | | Market
| | | Contract
| | | Delivery
| | | Appreciation/
| |
Description | | Value (W) | | | Amount | | | Date | | | (Depreciation) | |
| |
| British Pound (Sell) | | $ | 73 | | | $ | 73 | | | | 05/01/08 | | | $ | — | |
| | | | | | | | | | | | | | | | | |
| | |
| (W) | | See Note 2b of accompanying Notes to Financial Statements regarding valuation of securities. |
Diversification by Country
as of April 30, 2008
| | | | | |
| | | Percentage of
|
Country | | Net Assets |
| Canada | | | 3.6 | % |
| |
| |
| China | | | 0.8 | |
| |
| |
| Hong Kong | | | 0.8 | |
| |
| |
| Netherlands | | | 2.1 | |
| |
| |
| South Korea | | | 2.8 | |
| |
| |
| Switzerland | | | 0.8 | |
| |
| |
| Taiwan | | | 3.4 | |
| |
| |
| United States | | | 84.1 | |
| |
| |
| Short-Term Investments | | | 9.5 | |
| |
| |
| Other Assets and Liabilities | | | (7.9 | ) |
| |
| |
Total | | | 100.0 | % |
| |
| |
The accompanying notes are an integral part of these financial statements.
170
The Hartford Growth Allocation Fund
Schedule of Investments
April 30, 2008 (Unaudited)
(000’s Omitted)
| | | | | | | | | | | | | |
| | | | | | | | | Market
| |
| Shares | | | | | | | | Value (W) | |
| AFFILIATED INVESTMENT COMPANIES — 99.1% |
| EQUITY FUNDS — 79.1% |
| | | | | | | | | | �� | | | |
| | 4,674 | | | The Hartford Capital Appreciation Fund, Class Y | | $ | 195,861 | |
| | 2,045 | | | The Hartford Disciplined Equity Fund, Class Y | | | 28,093 | |
| | 2,876 | | | The Hartford Equity Income Fund, Class Y | | | 39,082 | |
| | 2,587 | | | The Hartford Global Growth Fund, Class Y | | | 52,751 | |
| | 343 | | | The Hartford Growth Fund, Class Y | | | 6,203 | |
| | 1,085 | | | The Hartford Growth Opportunities Fund, Class Y | | | 32,621 | |
| | 2,471 | | | The Hartford International Opportunities Fund, Class Y | | | 43,416 | |
| | 3,274 | | | The Hartford International Small Company Fund, Class Y | | | 46,125 | |
| | 1,861 | | | The Hartford Select MidCap Value Fund, Class Y | | | 17,830 | |
| | 3,986 | | | The Hartford Select SmallCap Value Fund, Class Y | | | 36,790 | |
| | 1,498 | | | The Hartford Small Company Fund, Class Y | | | 30,106 | |
| | 2 | | | The Hartford Stock Fund, Class Y | | | 48 | |
| | 10,962 | | | The Hartford Value Fund, Class Y | | | 135,925 | |
| | | | | | | | | |
| | | | | Total equity funds
(cost $656,708) | | $ | 664,851 | |
| | | | | | | | | | | | | |
| | | | | | | | | | | | | |
| FIXED INCOME FUNDS — 20.0% |
| | 651 | | | The Hartford Income Fund, Class Y | | $ | 6,411 | |
| | 3,113 | | | The Hartford Inflation Plus Fund, Class Y | | | 34,928 | |
| | 4,347 | | | The Hartford Short Duration Fund, Class Y | | | 41,469 | |
| | 8,068 | | | The Hartford Total Return Bond Fund, Class Y | | | 85,197 | |
| | | | | | | | | |
| | | | | Total fixed income funds
(cost $168,744) | | $ | 168,005 | |
| | | | | | | | | |
| | | | | Total investments in affiliated investment companies
(cost $825,452) | | $ | 832,856 | |
| | | | | | | | | | | | | |
| | | | | | | | | | | | | |
| | | | | | | | | Market
| |
| Shares | | | | | | | | Value (W) | |
| EXCHANGE TRADED FUNDS — 0.8% |
| | 10 | | | DJ Wilshire REIT ETF | | $ | 781 | |
| | 108 | | | SPDR DJ Wilshire International Real Estate ETF | | | 5,967 | |
| | | | | | | | | |
| | | | | Total investments in exchange traded funds
(cost $6,559) | | $ | 6,748 | |
| | | | | | | | | |
| | | | | Total investments
(cost $832,011) (C) | | | 99.9 | % | | $ | 839,604 | |
| | | | | Other assets and liabilities | | | 0.1 | % | | | 529 | |
| | | | | | | | | | | | | |
| | | | | Total net assets | | | 100.0 | % | | $ | 840,133 | |
| | | | | | | | | | | | | |
| |
| Note: | Percentage of investments as shown is the ratio of the total market value to total net assets. |
| | |
| (C) | | At April 30, 2008, the cost of securities for federal income tax purposes was $832,191 and the aggregate gross unrealized appreciation and depreciation based on that cost were: |
| | | | | |
| Unrealized Appreciation | | $ | 25,672 | |
| Unrealized Depreciation | | | (18,259 | ) |
| | | | | |
| Net Unrealized Appreciation | | $ | 7,413 | |
| | | | | |
| | |
| (W) | | See Note 2b of accompanying Notes to Financial Statements regarding valuation of securities. |
The accompanying notes are an integral part of these financial statements.
171
The Hartford Growth Fund
Schedule of Investments
April 30, 2008 (Unaudited)
(000’s Omitted)
| | | | | | | | | | | | | |
| | | | | | | | | Market
| |
| Shares | | | | | | | | Value (W) | |
| COMMON STOCK — 98.4% |
| | | | | Basic Materials — 14.6% |
| | 221 | | | Agrium, Inc. | | $ | 17,468 | |
| | 136 | | | Arch Coal, Inc. | | | 7,798 | |
| | 242 | | | Cameco Corp. | | | 8,452 | |
| | 249 | | | Companhia Vale do Rio Doce ADR | | | 9,722 | |
| | 228 | | | Consol Energy, Inc. | | | 18,490 | |
| | 119 | | | Freeport-McMoRan Copper & Gold, Inc. | | | 13,547 | |
| | 88 | | | Potash Corp. of Saskatchewan, Inc. | | | 16,250 | |
| | 115 | | | Precision Castparts Corp. | | | 13,511 | |
| | 428 | | | Steel Dynamics, Inc. | | | 14,901 | |
| | 138 | | | United States Steel Corp. | | | 21,277 | |
| | 271 | | | Vedanta Resources plc | | | 11,945 | |
| | | | | | | | | |
| | | | | | | | | | | | 153,361 | |
| | | | | | | | | | | | | |
| | | | | Capital Goods — 8.9% |
| | 430 | | | ABB Ltd. ADR | | | 13,199 | |
| | 67 | | | Boeing Co. | | | 5,709 | |
| | 236 | | | Caterpillar, Inc. | | | 19,325 | |
| | 261 | | | Cummins, Inc. | | | 16,335 | |
| | 190 | | | Deere & Co. | | | 15,968 | |
| | 109 | | | Gamesa Corporacion Tecnologica S.A. | | | 5,244 | |
| | 217 | | | Honeywell International, Inc. | | | 12,897 | |
| | 44 | | | Vestas Wind Systems A/S (D) | | | 4,748 | |
| | | | | | | | | |
| | | | | | | | | | | | 93,425 | |
| | | | | | | | | | | | | |
| | | | | Consumer Cyclical — 8.6% |
| | 259 | | | Coach, Inc. (D) | | | 9,207 | |
| | 1,058 | | | Ford Motor Co. (D)(G) | | | 8,735 | |
| | 192 | | | Foster Wheeler Ltd. (D) | | | 12,258 | |
| | 237 | | | Kohl’s Corp. (D) | | | 11,585 | |
| | 260 | | | NIKE, Inc. Class B | | | 17,394 | |
| | 17 | | | Nintendo Co., Ltd. | | | 9,276 | |
| | 344 | | | Staples, Inc. | | | 7,468 | |
| | 446 | | | Supervalu, Inc. | | | 14,768 | |
| | | | | | | | | |
| | | | | | | | | | | | 90,691 | |
| | | | | | | | | | | | | |
| | | | | Consumer Staples — 1.1% |
| | 24 | | | Nestle S.A. | | | 11,399 | |
| | | | | Energy — 8.5% |
| | 122 | | | EOG Resources, Inc. | | | 15,908 | |
| | 251 | | | Halliburton Co. | | | 11,535 | |
| | 129 | | | Hess Corp. | | | 13,680 | |
| | 31 | | | Occidental Petroleum Corp. | | | 2,589 | |
| | 85 | | | Petroleo Brasileiro S.A. ADR | | | 10,268 | |
| | 140 | | | Transocean, Inc. | | | 20,591 | |
| | 175 | | | Ultra Petroleum Corp. (D) | | | 14,575 | |
| | | | | | | | | |
| | | | | | | | | | | | 89,146 | |
| | | | | | | | | | | | | |
| | | | | Finance — 8.3% |
| | 225 | | | AON Corp. | | | 10,202 | |
| | 99 | | | Banco Itau Holding Financeira S.A. | | | 2,773 | |
| | 78 | | | Goldman Sachs Group, Inc. | | | 14,854 | |
| | 395 | | | Invesco Ltd. | | | 10,125 | |
| | 123 | | | Lehman Brothers Holdings, Inc. | | | 5,425 | |
| | 457 | | | MF Global Ltd. (D) | | | 6,016 | |
| | 109 | | | Visa, Inc. (D) | | | 9,088 | |
| | 467 | | | Washington Mutual, Inc. PIPE (A)(H) | | | 5,169 | |
| | 176 | | | Wellpoint, Inc. (D) | | | 8,763 | |
| | 661 | | | Western Union Co. | | | 15,209 | |
| | | | | | | | | |
| | | | | | | | | | | | 87,624 | |
| | | | | | | | | | | | | |
| | | | | Health Care — 10.5% |
| | 378 | | | Abbott Laboratories | | | 19,954 | |
| | 270 | | | Covidien Ltd. | | | 12,604 | |
| | 473 | | | Elan Corp. plc ADR (D) | | | 12,436 | |
| | 12 | | | Genentech, Inc. (D) | | | 842 | |
| | 146 | | | Gilead Sciences, Inc. (D) | | | 7,534 | |
| | 190 | | | McKesson Corp. | | | 9,888 | |
| | 250 | | | Merck & Co., Inc. | | | 9,495 | |
| | 92 | | | Monsanto Co. | | | 10,485 | |
| | 167 | | | St. Jude Medical, Inc. (D) | | | 7,318 | |
| | 216 | | | Teva Pharmaceutical Industries Ltd. ADR | | | 10,092 | |
| | 136 | | | Zimmer Holdings, Inc. (D) | | | 10,098 | |
| | | | | | | | | |
| | | | | | | | | | | | 110,746 | |
| | | | | | | | | | | | | |
| | | | | Services — 6.5% |
| | 236 | | | Accenture Ltd. Class A | | | 8,862 | |
| | 169 | | | Apollo Group, Inc. Class A (D) | | | 8,614 | |
| | 189 | | | Cognizant Technology Solutions Corp. (D) | | | 6,108 | |
| | 127 | | | Fluor Corp. | | | 19,376 | |
| | 299 | | | Focus Media Holding Ltd. ADR (D)(G) | | | 11,014 | |
| | 358 | | | Viacom, Inc. Class B (D) | | | 13,775 | |
| | | | | | | | | |
| | | | | | | | | | | | 67,749 | |
| | | | | | | | | | | | | |
| | | | | Technology — 30.6% |
| | 730 | | | Altera Corp. | | | 15,530 | |
| | 75 | | | Apple, Inc. (D) | | | 13,020 | |
| | 203 | | | BMC Software, Inc. (D) | | | 7,066 | |
| | 492 | | | Cisco Systems, Inc. (D) | | | 12,620 | |
| | 392 | | | Electronic Arts, Inc. (D) | | | 20,177 | |
| | 22 | | | Google, Inc. (D) | | | 12,629 | |
| | 238 | | | Hewlett-Packard Co. | | | 11,031 | |
| | 438 | | | Hologic, Inc. (D)(G) | | | 12,778 | |
| | 812 | | | Intel Corp. | | | 18,075 | |
| | 167 | | | Lockheed Martin Corp. | | | 17,731 | |
| | 295 | | | McAfee, Inc. (D) | | | 9,802 | |
| | 491 | | | Metropcs Communications, Inc. (D)(G) | | | 9,637 | |
| | 1,342 | | | Microsoft Corp. | | | 38,286 | |
| | 366 | | | NetApp, Inc. (D) | | | 8,868 | |
| | 378 | | | Nokia Corp. | | | 11,359 | |
| | 1,305 | | | Oracle Corp. (D) | | | 27,218 | |
| | 465 | | | Qualcomm, Inc. | | | 20,087 | |
| | 239 | | | Raytheon Co. | | | 15,313 | |
| | 124 | | | Research In Motion Ltd. (D) | | | 15,040 | |
| | 109 | | | Siemens AG ADR | | | 12,865 | |
| | 338 | | | VeriSign, Inc. (D)(G) | | | 12,193 | |
| | | | | | | | | |
| | | | | | | | | | | | 321,325 | |
| | | | | | | | | | | | | |
| | | | | Transportation — 0.8% |
| | 134 | | | Norfolk Southern Corp. | | | 7,996 | |
| | | | | | | | | |
| | | | | Total common stock
(cost $959,266) | | $ | 1,033,462 | |
| | | | | | | | | | | | | |
| | | | | | | | | | | | | |
The accompanying notes are an integral part of these financial statements.
172
| | | | | | | | | | | | | |
| | | | | | | | | Market
| |
| Shares | | | | | | | | Value (W) | |
| |
| PREFERRED STOCK — 0.4% |
| | | | | Finance — 0.4% |
| | — | | | Washington Mutual, Inc. (A)(D)(H)(X) | | $ | 4,045 | |
| | | | | | | | | |
| | | | | Total preferred stock
(cost $3,200) | | $ | 4,045 | |
| | | | | | | | | |
| | | | | Total long-term investments
(cost $962,466) | | $ | 1,037,507 | |
| | | | | | | | | | | | | |
| | | | | | | | | | | | | |
Principal
| | | | | | | | Market
| |
| Amount | | | | | | | | Value (W) | |
| |
| SHORT-TERM INVESTMENTS — 3.7% |
| | | | | Repurchase Agreements — 1.4% |
| | | | | Banc of America Securities TriParty Joint Repurchase Agreement (maturing on 05/01/2008 in the amount of $5,772, collateralized by FHLMC 5.00%, 2035, value of $5,887) | | | | |
| $ | 5,772 | | | 1.98% dated 04/30/2008 | | | 5,772 | |
| | | | | BNP Paribas Securities Corp. TriParty Joint Repurchase Agreement (maturing on 05/01/2008 in the amount of $2,831, collateralized by FNMA 5.50% — 6.50%, 2036 — 2038, value of $2,887) | | | | |
| | 2,831 | | | 2.00% dated 04/30/2008 | | | 2,830 | |
| | | | | Deutsche Bank Securities Joint Repurchase Agreement (maturing on 05/01/2008 in the amount of $6, collateralized by U. S. Treasury Note 3.63%, 2009, value of $6) | | | | |
| | 6 | | | 1.90% dated 04/30/2008 | | | 6 | |
| | | | | Deutsche Bank Securities TriParty Joint Repurchase Agreement (maturing on 05/01/2008 in the amount of $3,519, collateralized by FHLMC 4.50% — 7.00%, 2016 — 2038, value of $3,589) | | | | |
| | 3,519 | | | 2.00% dated 04/30/2008 | | | 3,519 | |
| | | | | JP Morgan Chase TriParty Joint Repurchase Agreement (maturing on 05/01/2008 in the amount of $3,391, collateralized by FNMA 4.50% — 7.00%, 2020 — 2038, value of $3,459) | | | | |
| | 3,391 | | | 1.96% dated 04/30/2008 | | | 3,391 | |
| | | | | | | | | |
| | | | | | | | | | | | 15,518 | |
| | | | | | | | | | | | | |
| | | | | | | | | | | | | |
| | | | | | | | | | | | | |
| Shares | | | | | | | | | |
| |
| | | | | Securities Purchased with Proceeds from Security Lending — 2.3% |
| | | | | Cash Collateral Reinvestment Fund: |
| | 23,983 | | | Navigator Prime Portfolio | | | 23,983 | |
| | | | | | | | | |
| | | | | Total short-term investments
(cost $39,501) | | $ | 39,501 | |
| | | | | | | | | |
| | | | | Total investments
(cost $1,001,967) (C) | | | 102.5 | % | | $ | 1,077,008 | |
| | | | | Other assets and liabilities | | | (2.5 | )% | | | (26,440 | ) |
| | | | | | | | | | | | | |
| | | | | Total net assets | | | 100.0 | % | | $ | 1,050,568 | |
| | | | | | | | | | | | | |
| |
| Note: | Percentage of investments as shown is the ratio of the total market value to total net assets. Market value of investments in foreign securities represents 18.42% of total net assets at April 30, 2008. |
| | |
| (C) | | At April 30, 2008, the cost of securities for federal income tax purposes was $1,003,889 and the aggregate gross unrealized appreciation and depreciation based on that cost were: |
| | | | | |
| Unrealized Appreciation | | $ | 126,593 | |
| Unrealized Depreciation | | | (53,474 | ) |
| | | | | |
| Net Unrealized Appreciation | | $ | 73,119 | |
| | | | | |
| | |
| (A) | | The aggregate value of securities valued in good faith at fair value as determined under policies and procedures established by and under the supervision of the Funds’ Board of Directors at April 30, 2008, was $9,214, which represents 0.88% of total net assets. This calculation excludes securities that are principally traded on certain foreign markets and whose prices were adjusted solely pursuant to a third party pricing service methodology approved by the Board of Directors. |
| |
| (D) | | Currently non-income producing. |
| |
| (G) | | Security is partially on loan at April 30, 2008. |
| |
| (X) | | Convertible security. |
| |
| (H) | | The following securities are considered illiquid. Illiquid securities are often purchased in private placement transactions, are not registered under the Securities Act of 1933 and may have contractual restrictions on resale. A security may also be considered illiquid if the security lacks a readily available market or if its valuation has not changed for a certain period of time. |
| | | | | | | | | | | |
Period
| | | | | | | | |
Acquired | | Shares/Par | | | Security | | Cost Basis | |
| 04/2008 | | | — | | | Washington Mutual, Inc. Preferred Stock | | $ | 3,200 | |
| 04/2008 | | | 467 | | | Washington Mutual, Inc. PIPE - Reg D | | | 4,089 | |
| | |
| | The aggregate value of these securities at April 30, 2008 was $9,214 which represents 0.88% of total net assets. |
PIPE — Private Investment in Public Equity.
| | |
| (W) | | See Note 2b of accompanying Notes to Financial Statements regarding valuation of securities. |
The accompanying notes are an integral part of these financial statements.
173
The Hartford Growth Opportunities Fund
Schedule of Investments
April 30, 2008 (Unaudited)
(000’s Omitted)
| | | | | | | | | | | | | |
| | | | | | | | | Market
| |
| Shares | | | | | | | | Value (W) | |
| COMMON STOCK — 97.1% |
| | | | | Basic Materials — 18.0% |
| | 721 | | | Arch Coal, Inc. (G) | | $ | 41,357 | |
| | 569 | | | Ball Corp. | | | 30,590 | |
| | 599 | | | Barrick Gold Corp. | | | 23,149 | |
| | 1,154 | | | Cameco Corp. | | | 40,385 | |
| | 936 | | | Companhia Vale do Rio Doce ADR | | | 36,559 | |
| | 433 | | | Consol Energy, Inc. | | | 35,039 | |
| | 413 | | | FMC Corp. | | | 25,932 | |
| | 239 | | | Freeport-McMoRan Copper & Gold, Inc. (G) | | | 27,209 | |
| | 1,121 | | | Jarden Corp. (D)(G) | | | 23,895 | |
| | 7,105 | | | Kingboard Chemical Holdings Ltd. | | | 33,529 | |
| | 1,122 | | | Kinross Gold Corp. | | | 21,211 | |
| | 433 | | | Owens-Illinois, Inc. (D) | | | 23,886 | |
| | 2,830 | | | Rexam plc | | | 25,051 | |
| | 1,118 | | | Sealed Air Corp. | | | 28,264 | |
| | 357 | | | Snap-On, Inc. | | | 21,180 | |
| | 591 | | | Terra Industries, Inc. (D)(G) | | | 22,390 | |
| | 275 | | | United States Steel Corp. | | | 42,367 | |
| | | | | | | | | |
| | �� | | | | | | | | | | 501,993 | |
| | | | | | | | | | | | | |
| | | | | Capital Goods — 7.9% |
| | 501 | | | Boeing Co. | | | 42,532 | |
| | 417 | | | Caterpillar, Inc. | | | 34,111 | |
| | 822 | | | Cummins, Inc. | | | 51,498 | |
| | 219 | | | Flowserve Corp. | | | 27,225 | |
| | 486 | | | Honeywell International, Inc. | | | 28,839 | |
| | 1,051 | | | Pall Corp. | | | 36,536 | |
| | 11 | | | Safran S.A. (G) | | | 230 | |
| | | | | | | | | |
| | | | | | | | | | | | 220,971 | |
| | | | | | | | | | | | | |
| | | | | Consumer Cyclical — 10.8% |
| | 340 | | | Altria Group, Inc. | | | 6,800 | |
| | 447 | | | Dick’s Sporting Goods, Inc. (D) | | | 12,787 | |
| | 1,471 | | | Gap, Inc. | | | 27,390 | |
| | 556 | | | Kohl’s Corp. (D)(G) | | | 27,151 | |
| | 1,402 | | | Konica Minolta Holdings, Inc. | | | 21,120 | |
| | 589 | | | Liz Claiborne, Inc. | | | 10,425 | |
| | 1,258 | | | Mitsui & Co., Ltd. | | | 29,534 | |
| | 63 | | | Nintendo Co., Ltd. | | | 35,046 | |
| | 600 | | | PACCAR, Inc. | | | 28,406 | |
| | 658 | | | Patterson Cos., Inc. (D) | | | 22,507 | |
| | 547 | | | Philip Morris International, Inc. (D) | | | 27,919 | |
| | 935 | | | Staples, Inc. | | | 20,285 | |
| | 994 | | | Supervalu, Inc. | | | 32,891 | |
| | | | | | | | | |
| | | | | | | | | | | | 302,261 | |
| | | | | | | | | | | | | |
| | | | | Consumer Staples — 3.0% |
| | 4 | | | Japan Tobacco, Inc. | | | 19,110 | |
| | 465 | | | PepsiCo, Inc. | | | 31,887 | |
| | 940 | | | Unilever N.V. NY Shares ADR (G) | | | 31,511 | |
| | | | | | | | | |
| | | | | | | | | | | | 82,508 | |
| | | | | | | | | | | | | |
| | | | | Energy — 9.7% |
| | 895 | | | Chesapeake Energy Corp. (G) | | | 46,282 | |
| | 258 | | | EOG Resources, Inc. | | | 33,612 | |
| | 460 | | | Forest Oil Corp. (D) | | | 27,131 | |
| | 335 | | | Lukoil ADR (G) | | | 29,989 | |
| | 622 | | | OAO Gazprom Class S ADR | | | 33,088 | |
| | 231 | | | Transocean, Inc. | | | 34,078 | |
| | 324 | | | Ultra Petroleum Corp. (D) | | | 26,915 | |
| | 652 | | | XTO Energy, Inc. | | | 40,343 | |
| | | | | | | | | |
| | | | | | | | | | | | 271,438 | |
| | | | | | | | | | | | | |
| | | | | Finance — 6.5% |
| | 549 | | | Citigroup, Inc. | | | 13,868 | |
| | 976 | | | Covanta Holding Corp. (D)(G) | | | 25,988 | |
| | 79 | | | Goldman Sachs Group, Inc. | | | 15,119 | |
| | 1,077 | | | Huntington Bancshares, Inc. (G) | | | 10,112 | |
| | 630 | | | Invesco Ltd. | | | 16,152 | |
| | 373 | | | Julius Baer Holding Ltd. | | | 27,334 | |
| | 1,056 | | | Washington Mutual, Inc. (G) | | | 12,972 | |
| | 2,575 | | | Western Union Co. | | | 59,225 | |
| | | | | | | | | |
| | | | | | | | | | | | 180,770 | |
| | | | | | | | | | | | | |
| | | | | Health Care — 15.1% |
| | 600 | | | Abbott Laboratories | | | 31,655 | |
| | 582 | | | Alkermes, Inc. (D)(G) | | | 7,236 | |
| | 828 | | | Amgen, Inc. (D) | | | 34,647 | |
| | 735 | | | Amylin Pharmaceuticals, Inc. (D)(G) | | | 20,271 | |
| | 567 | | | Auxilium Pharmaceuticals, Inc. (D)(G) | | | 17,444 | |
| | 530 | | | Barr Pharmaceuticals, Inc. (D) | | | 26,622 | |
| | 513 | | | Cephalon, Inc. (D)(G) | | | 31,998 | |
| | 480 | | | Charles River Laboratories International, Inc. (D) | | | 27,864 | |
| | 908 | | | Elan Corp. plc ADR (D)(G) | | | 23,858 | |
| | 300 | | | ImClone Systems, Inc. (D)(G) | | | 14,014 | |
| | 802 | | | McKesson Corp. | | | 41,774 | |
| | 1,044 | | | Pharmaceutical Product Development, Inc. | | | 43,222 | |
| | 1,487 | | | Shionogi & Co., Ltd. | | | 28,725 | |
| | 909 | | | St. Jude Medical, Inc. (D)(G) | | | 39,796 | |
| | 433 | | | Zimmer Holdings, Inc. (D) | | | 32,111 | |
| | | | | | | | | |
| | | | | | | | | | | | 421,237 | |
| | | | | | | | | | | | | |
| | | | | Services — 6.3% |
| | 100 | | | Aecom Technology Corp. (D) | | | 2,754 | |
| | 600 | | | Apollo Group, Inc. Class A (D) | | | 30,525 | |
| | 647 | | | DreamWorks Animation SKG, Inc. (D) | | | 18,084 | |
| | 343 | | | FedEx Corp. | | | 32,883 | |
| | 995 | | | Focus Media Holding Ltd. ADR (D) | | | 36,713 | |
| | 1,233 | | | Tetra Tech, Inc. (D)(G) | | | 26,049 | |
| | 723 | | | Viacom, Inc. Class B (D) | | | 27,781 | |
| | | | | | | | | |
| | | | | | | | | | | | 174,789 | |
| | | | | | | | | | | | | |
| | | | | Technology — 19.0% |
| | 994 | | | BMC Software, Inc. (D) | | | 34,562 | |
| | 372 | | | Equinix, Inc. (D)(G) | | | 33,636 | |
| | 1,104 | | | FLIR Systems, Inc. (D)(G) | | | 37,896 | |
| | 495 | | | Hewlett-Packard Co. | | | 22,939 | |
| | 655 | | | Hologic, Inc. (D)(G) | | | 19,125 | |
| | 483 | | | Lam Research Corp. (D) | | | 19,713 | |
| | 395 | | | Lockheed Martin Corp. | | | 41,886 | |
| | 1,038 | | | McAfee, Inc. (D) | | | 34,517 | |
| | 457 | | | Metropcs Communications, Inc. (D) | | | 8,983 | |
| | 1,069 | | | Microsoft Corp. | | | 30,488 | |
| | 1,557 | | | MTN Group Ltd. | | | 29,585 | |
| | 1,309 | | | NetApp, Inc. (D) | | | 31,683 | |
| | 1,794 | | | Nuance Communications, Inc. (D)(G) | | | 36,374 | |
| | 1,396 | | | Oracle Corp. (D) | | | 29,098 | |
| | 882 | | | Qualcomm, Inc. | | | 38,102 | |
| | 617 | | | Raytheon Co. (G) | | | 39,470 | |
The accompanying notes are an integral part of these financial statements.
174
| | | | | | | | | | | | | |
| | | | | | | | | Market
| |
| Shares | | | | | | | | Value (W) | |
| | | | | | | | | | | | | |
| COMMON STOCK — (continued) |
| | | | | | | | | | | | | |
| | | | | Technology — (continued) |
| | 254 | | | Red Hat, Inc. (D) | | $ | 5,230 | |
| | 1,055 | | | VeriSign, Inc. (D)(G) | | | 38,040 | |
| | | | | | | | | |
| | | | | | | | | | | | 531,327 | |
| | | | | | | | | | | | | |
| | | | | Transportation — 0.8% |
| | 526 | | | Kansas City Southern (D) | | | 23,708 | |
| | | | | | | | | |
| | | | | Total common stock
(cost $2,557,414) | | $ | 2,711,002 | |
| | | | | | | | | | | | | |
| | | | | | | | | | | | | |
Principal
| | | | | | | | | |
| Amount | | | | | | | | | |
| |
| SHORT-TERM INVESTMENTS — 15.8% |
| | | | | Repurchase Agreements — 4.5% |
| | | | | Banc of America Securities TriParty Joint Repurchase Agreement (maturing on 05/01/2008 in the amount of $46,949, collateralized by FHLMC 5.00%, 2035, value of $47,886) | | | | |
| $ | 46,947 | | | 1.98% dated 04/30/2008 | | $ | 46,947 | |
| | | | | BNP Paribas Securities Corp. TriParty Joint Repurchase Agreement (maturing on 05/01/2008 in the amount of $23,023, collateralized by FNMA 5.50% — 6.50%, 2036 — 2038, value of $23,482) | | | | |
| | 23,022 | | | 2.00% dated 04/30/2008 | | | 23,022 | |
| | | | | Deutsche Bank Securities Joint Repurchase Agreement (maturing on 05/01/2008 in the amount of $46, collateralized by U. S. Treasury Note 3.63%, 2009, value of $47) | | | | |
| | 46 | | | 1.90% dated 04/30/2008 | | | 46 | |
| | | | | Deutsche Bank Securities TriParty Joint Repurchase Agreement (maturing on 05/01/2008 in the amount of $28,621, collateralized by FHLMC 4.50% — 7.00%, 2016 — 2038, value of $29,192) | | | | |
| | 28,619 | | | 2.00% dated 04/30/2008 | | | 28,619 | |
| | | | | JP Morgan Chase TriParty Joint Repurchase Agreement (maturing on 05/01/2008 in the amount of $27,583, collateralized by FNMA 4.50% — 7.00%, 2020 — 2038, value of $28,133) | | | | |
| | 27,581 | | | 1.96% dated 04/30/2008 | | | 27,581 | |
| | | | | | | | | |
| | | | | | | | | | | | 126,215 | |
| | | | | | | | | | | | | |
| | | | | | | | | | | | | |
| | | | | | | | | | | | | |
| | | | | | | | | Market
| |
| Shares | | | | | | | | Value (W) | |
| |
| | | | | Securities Purchased with Proceeds from Security Lending — 11.3% |
| | | | | Cash Collateral Reinvestment Fund: |
| | 313,528 | | | Goldman Sachs FS Prime Obligation/Institutional Fund | | $ | 313,528 | |
| | | | | | | | | |
| | | | | Total short-term investments
(cost $439,743) | | $ | 439,743 | |
| | | | | | | | | |
| | | | | Total investments
(cost $2,997,157) (C) | | | 112.9 | % | | $ | 3,150,745 | |
| | | | | Other assets and liabilities | | | (12.9 | )% | | | (360,036 | ) |
| | | | | | | | | | | | | |
| | | | | Total net assets | | | 100.0 | % | | $ | 2,790,709 | |
| | | | | | | | | | | | | |
| |
| Note: | Percentage of investments as shown is the ratio of the total market value to total net assets. Market value of investments in foreign securities represents 18.84% of total net assets at April 30, 2008. |
Foreign securities that are principally traded on certain foreign markets are adjusted daily pursuant to a third party pricing service methodology approved by the Board of Directors in order to reflect an adjustment for factors occurring after the close of the foreign market but before the close of the New York Stock Exchange.
| | |
| (C) | | At April 30, 2008, the cost of securities for federal income tax purposes was $2,998,957 and the aggregate gross unrealized appreciation and depreciation based on that cost were: |
| | | | | |
| Unrealized Appreciation | | $ | 242,114 | |
| Unrealized Depreciation | | | (90,326 | ) |
| | | | | |
| Net Unrealized Appreciation | | $ | 151,788 | |
| | | | | |
| | |
| (D) | | Currently non-income producing. |
| |
| (G) | | Security is partially on loan at April 30, 2008. |
| |
| (W) | | See Note 2b of accompanying Notes to Financial Statements regarding valuation of securities. |
Forward Foreign Currency Contracts Outstanding at April 30, 2008
| | | | | | | | | | | | | | | | | |
| | | | | | | | | | | | Unrealized
| |
| | | Market
| | | Contract
| | | Delivery
| | | Appreciation/
| |
Description | | Value (W) | | | Amount | | | Date | | | (Depreciation) | |
| |
| British Pound (Buy) | | $ | 13,261 | | | $ | 13,283 | | | | 05/01/08 | | | $ | (22 | ) |
| British Pound (Buy) | | | 6,407 | | | | 6,341 | | | | 05/02/08 | | | | 66 | |
| British Pound (Buy) | | | 5,156 | | | | 5,147 | | | | 05/06/08 | | | | 9 | |
| Euro (Sell) | | | 3,623 | | | | 3,630 | | | | 05/02/08 | | | | 7 | |
| Euro (Sell) | | | 2,136 | | | | 2,129 | | | | 05/05/08 | | | | (7 | ) |
| Euro (Sell) | | | 1,028 | | | | 1,026 | | | | 05/06/08 | | | | (2 | ) |
| Japanese Yen (Sell) | | | 8,451 | | | | 8,416 | | | | 05/01/08 | | | | (35 | ) |
| Japanese Yen (Buy) | | | 27,902 | | | | 27,833 | | | | 05/07/08 | | | | 69 | |
| Swiss Franc (Sell) | | | 553 | | | | 553 | | | | 05/02/08 | | | | — | |
| Swiss Franc (Sell) | | | 161 | | | | 161 | | | | 05/05/08 | | | | — | |
| | | | | | | | | | | | | | | | | |
| | | | | | | | | | | | | | | $ | 85 | |
| | | | | | | | | | | | | | | | | |
The accompanying notes are an integral part of these financial statements.
175
The Hartford High Yield Fund
Schedule of Investments
April 30, 2008 (Unaudited)
(000’s Omitted)
| | | | | | | | | | | | | |
Principal
| | | | | | | | Market
| |
| Amount | | | | | | | | Value (W) | |
| ASSET & COMMERCIAL MORTGAGE BACKED SECURITIES — 0.3% |
| | | | | Finance — 0.3% |
| | | | | CBA Commercial Small Balance Commercial Mortgage | | | | |
| $ | 6,378 | | | 9.75%, 01/25/2039 (H)(c) | | $ | 622 | |
| | | | | Soundview NIM Trust | | | | |
| | 920 | | | 8.25%, 12/25/2036 (H) | | | 92 | |
| | | | | | | | | |
| | | | | Total asset & commercial
mortgage backed securities
(cost $1,454) | | $ | 714 | |
| | | | | | | | | | | | | |
| | | | | | | | | | | | | |
| CORPORATE BONDS: INVESTMENT GRADE — 0.3% |
| | | | | Consumer Cyclical — 0.3% |
| | | | | Phillips Van-Heusen Corp. | | | | |
| $ | 815 | | | 7.75%, 11/15/2023 | | $ | 792 | |
| | | | | | | | | |
| | | | | Total corporate bonds: investment grade
(cost $844) | | $ | 792 | |
| | | | | | | | | | | | | |
| | | | | | | | | | | | | |
| CORPORATE BONDS: NON-INVESTMENT GRADE — 84.9% |
| | | | | Basic Materials — 7.9% |
| | | | | AK Steel Corp. | | | | |
| $ | 1,375 | | | 7.75%, 06/15/2012 | | $ | 1,404 | |
| | | | | Aleris International, Inc. | | | | |
| | 1,375 | | | 9.00%, 12/15/2014 | | | 1,011 | |
| | | | | Berry Plastics Holding Co. | | | | |
| | 515 | | | 6.68%, 09/15/2014 (G)(L) | | | 438 | |
| | | | | Bowater, Inc. | | | | |
| | 1,340 | | | 5.80%, 03/15/2010 (L) | | | 904 | |
| | | | | Domtar Corp. | | | | |
| | 1,210 | | | 5.38%, 12/01/2013 | | | 1,101 | |
| | | | | Evraz Group S.A. | | | | |
| | 200 | | | 8.88%, 04/24/2013 (I) | | | 202 | |
| | | | | Freeport-McMoRan Copper & Gold, Inc. | | | | |
| | 1,850 | | | 8.25%, 04/01/2015 | | | 2,010 | |
| | | | | Georgia-Pacific Corp. | | | | |
| | 1,670 | | | 7.00%, 01/15/2015 (I) | | | 1,653 | |
| | | | | Goodyear Tire & Rubber Co. | | | | |
| | 1,620 | | | 8.66%, 12/01/2009 (L) | | | 1,622 | |
| | | | | Graham Packaging Co., Inc. | | | | |
| | 1,180 | | | 9.88%, 10/15/2014 (G) | | | 1,109 | |
| | | | | Hexion Specialty Chemicals | | | | |
| | 965 | | | 7.57%, 11/15/2014 (L) | | | 905 | |
| | | | | Huntsman International LLC | | | | |
| | 520 | | | 7.88%, 11/15/2014 | | | 549 | |
| | | | | MacDermid, Inc. | | | | |
| | 1,430 | | | 9.50%, 04/15/2017 (I) | | | 1,366 | |
| | | | | Momentive Performance | | | | |
| | 1,490 | | | 9.75%, 12/01/2014 (G) | | | 1,445 | |
| | | | | New Page Corp. | | | | |
| | 1,380 | | | 10.00%, 05/01/2012 (I) | | | 1,473 | |
| | | | | Potlatch Corp. | | | | |
| | 650 | | | 13.00%, 12/01/2009 (H)(L) | | | 722 | |
| | | | | Steel Dynamics, Inc. | | | | |
| | 920 | | | 7.38%, 11/01/2012 (I) | | | 936 | |
| | 390 | | | 7.75%, 04/15/2016 (I) | | | 399 | |
| | | | | Valmont Industries, Inc. | | | | |
| | 725 | | | 6.88%, 05/01/2014 (G) | | | 732 | |
| | | | | | | | | |
| | | | | | | | | | | | 19,981 | |
| | | | | | | | | | | | | |
| | | | | Capital Goods — 1.4% |
| | | | | Bombardier, Inc. | | | | |
| | 1,170 | | | 6.30%, 05/01/2014 (I)# | | | 1,170 | |
| | | | | SPX Corp. | | | | |
| | 865 | | | 7.63%, 12/15/2014 (I) | | | 904 | |
| | | | | Transdigm, Inc. | | | | |
| | 1,390 | | | 7.75%, 07/15/2014 | | | 1,421 | |
| | | | | | | | | |
| | | | | | | | | | | | 3,495 | |
| | | | | | | | | | | | | |
| | | | | Consumer Cyclical — 10.3% |
| | | | | Alliance One International, Inc. | | | | |
| | 860 | | | 8.50%, 05/15/2012 | | | 817 | |
| | | | | American Axle & Manufacturing Holdings, Inc. | | | | |
| | 2,675 | | | 7.88%, 03/01/2017 | | | 2,394 | |
| | | | | Amerigas Partners L.P. | | | | |
| | 320 | | | 7.13%, 05/20/2016 # | | | 322 | |
| | 1,080 | | | 7.25%, 05/20/2015 # | | | 1,091 | |
| | | | | Aramark Corp. | | | | |
| | 1,730 | | | 5.00%, 06/01/2012 | | | 1,557 | |
| | | | | Buffalo Thunder | | | | |
| | 1,325 | | | 9.38%, 12/15/2014 (I) | | | 901 | |
| | | | | D.R. Horton, Inc. | | | | |
| | 1,565 | | | 4.88%, 01/15/2010 | | | 1,487 | |
| | | | | Dollarama Group L.P. | | | | |
| | 1,125 | | | 8.88%, 08/15/2012 | | | 1,057 | |
| | | | | ESCO Corp. | | | | |
| | 1,360 | | | 8.63%, 12/15/2013 (I)# | | | 1,353 | |
| | | | | General Motors Corp. | | | | |
| | 4,900 | | | 7.20%, 01/15/2011 (G) | | | 4,337 | |
| | | | | Ingles Markets, Inc. | | | | |
| | 950 | | | 8.88%, 12/01/2011 | | | 964 | |
| | | | | KB Home & Broad Home Corp. | | | | |
| | 1,200 | | | 6.38%, 08/15/2011 (G) | | | 1,140 | |
| | | | | Michaels Stores, Inc. | | | | |
| | 495 | | | 11.38%, 11/01/2016 (G) | | | 444 | |
| | | | | Neiman Marcus Group, Inc. | | | | |
| | 550 | | | 9.00%, 10/15/2015 | | | 572 | |
| | 785 | | | 10.38%, 10/15/2015 (G) | | | 824 | |
| | | | | Pulte Homes, Inc. | | | | |
| | 700 | | | 7.88%, 08/01/2011 | | | 683 | |
| | | | | SGS International, Inc. | | | | |
| | 1,075 | | | 12.00%, 12/15/2013 | | | 925 | |
| | | | | Stater Brothers Holdings, Inc. | | | | |
| | 1,090 | | | 8.13%, 06/15/2012 | | | 1,106 | |
| | | | | Supervalu, Inc. | | | | |
| | 2,965 | | | 7.50%, 11/15/2014 | | | 3,069 | |
| | | | | TRW Automotive, Inc. | | | | |
| | 915 | | | 7.25%, 03/15/2017 (I) | | | 891 | |
| | | | | | | | | |
| | | | | | | | | | | | 25,934 | |
| | | | | | | | | | | | | |
| | | | | Consumer Staples — 1.1% |
| | | | | Appleton Papers, Inc. | | | | |
| | 550 | | | 9.75%, 06/15/2014 | | | 529 | |
| | | | | Constellation Brands, Inc. | | | | |
| | 1,250 | | | 8.38%, 12/15/2014 | | | 1,325 | |
| | | | | Dole Food Co., Inc. | | | | |
| | 1,030 | | | 8.63%, 05/01/2009 (G) | | | 997 | |
| | | | | | | | | |
| | | | | | | | | | | | 2,851 | |
| | | | | | | | | | | | | |
| | | | | Energy — 5.3% |
| | | | | Chesapeake Energy Corp. | | | | |
| | 595 | | | 6.63%, 01/15/2016 | | | 595 | |
| | 2,290 | | | 7.63%, 07/15/2013 # | | | 2,399 | |
| | | | | Cie Gen Geophysique | | | | |
| | 1,440 | | | 7.75%, 05/15/2017 | | | 1,487 | |
The accompanying notes are an integral part of these financial statements.
176
| | | | | | | | | | | | | |
Principal
| | | | | | | | Market
| |
| Amount | | | | | | | | Value (W) | |
| | | | | | | | | | | | | |
| CORPORATE BONDS: NON-INVESTMENT GRADE — (continued) |
| | | | | | | | | | | | | |
| | | | | Energy — (continued) |
| | | | | Encore Acquisition Co. | | | | |
| $ | 850 | | | 7.25%, 12/01/2017 | | $ | 824 | |
| | | | | Ferrell Gas Partners L.P. | | | | |
| | 1,120 | | | 8.75%, 06/15/2012 (G) | | | 1,151 | |
| | | | | Hilcorp Energy I L.P./Finance Co. | | | | |
| | 960 | | | 7.75%, 11/01/2015 (I) | | | 945 | |
| | | | | Inergy L.P. | | | | |
| | 1,190 | | | 8.25%, 03/01/2016 | | | 1,220 | |
| | | | | Key Energy Services, Inc. | | | | |
| | 1,275 | | | 8.38%, 12/01/2014 (G)(I) | | | 1,320 | |
| | | | | Petrohawk Energy Corp. | | | | |
| | 1,210 | | | 9.13%, 07/15/2013 # | | | 1,279 | |
| | | | | Pioneer Natural Resources Co. | | | | |
| | 1,100 | | | 5.88%, 07/15/2016 | | | 1,033 | |
| | | | | Tesoro Corp. | | | | |
| | 1,000 | | | 6.63%, 11/01/2015 | | | 940 | |
| | | | | | | | | |
| | | | | | | | | | | | 13,193 | |
| | | | | | | | | | | | | |
| | | | | Finance — 11.5% |
| | | | | American Real Estate Partners L.P. | | | | |
| | 1,855 | | | 7.13%, 02/15/2013 # | | | 1,730 | |
| | | | | Dow Jones CDX HY | | | | |
| | 1,089 | | | 8.75%, 12/29/2012 (I) | | | 1,064 | |
| | | | | El Paso Performance-Linked Trust | | | | |
| | 1,375 | | | 7.75%, 07/15/2011 (I) | | | 1,423 | |
| | | | | Ford Motor Credit Co. | | | | |
| | 3,430 | | | 5.46%, 01/13/2012 (L) | | | 2,884 | |
| | 1,900 | | | 5.80%, 01/12/2009 | | | 1,858 | |
| | 4,550 | | | 7.16%, 04/15/2012 (L)# | | | 4,460 | |
| | 1,030 | | | 7.38%, 02/01/2011 | | | 947 | |
| | | | | General Motors Acceptance Corp. | | | | |
| | 3,930 | | | 5.63%, 05/15/2009 (G) | | | 3,695 | |
| | 7,250 | | | 6.88%, 09/15/2011 | | | 6,042 | |
| | | | | Host Marriott L.P. | | | | |
| | 1,190 | | | 6.75%, 06/01/2016 | | | 1,163 | |
| | | | | LPL Holdings, Inc. | | | | |
| | 2,165 | | | 10.75%, 12/15/2015 (H) | | | 2,122 | |
| | | | | Northern Rock plc | | | | |
| | 323 | | | 5.60%, 04/30/2049 (I) | | | 188 | |
| | | | | Rainbow National Services LLC | | | | |
| | 810 | | | 10.38%, 09/01/2014 (I) | | | 871 | |
| | | | | Residential Capital Corp. | | | | |
| | 960 | | | 8.38%, 06/30/2010 (G)(L) | | | 521 | |
| | | | | | | | | |
| | | | | | | | | | | | 28,968 | |
| | | | | | | | | | | | | |
| | | | | Health Care — 5.8% |
| | | | | Axcan Intermediate Holdings, Inc. | | | | |
| | 560 | | | 12.75%, 03/01/2016 (I) | | | 554 | |
| | | | | HCA, Inc. | | | | |
| | 1,500 | | | 7.88%, 02/01/2011 | | | 1,519 | |
| | 2,300 | | | 9.25%, 11/15/2016 | | | 2,473 | |
| | | | | IASIS Healthcare Capital Corp. | | | | |
| | 1,830 | | | 8.75%, 06/15/2014 | | | 1,876 | |
| | | | | Invacare Corp. | | | | |
| | 1,390 | | | 9.75%, 02/15/2015 | | | 1,394 | |
| | | | | Multiplan Corp. | | | | |
| | 1,255 | | | 10.38%, 04/15/2016 (I) | | | 1,217 | |
| | | | | Psychiatric Solutions, Inc. | | | | |
| | 995 | | | 7.75%, 07/15/2015 | | | 1,017 | |
| | | | | Reable Therapeutics Finance LLC | | | | |
| | 730 | | | 11.75%, 11/15/2014 (G) | | | 673 | |
| | | | | Rite Aid Corp. | | | | |
| | 940 | | | 7.50%, 03/01/2017 (G) | | | 872 | |
| | 1,500 | | | 9.50%, 06/15/2017 (G) | | | 1,226 | |
| | | | | Skilled Healthcare Group, Inc. | | | | |
| | 650 | | | 11.00%, 01/15/2014 | | | 697 | |
| | | | | Warner Chilcott Corp. | | | | |
| | 1,150 | | | 8.75%, 02/01/2015 | | | 1,167 | |
| | | | | | | | | |
| | | | | | | | | | | | 14,685 | |
| | | | | | | | | | | | | |
| | | | | Services — 14.4% |
| | | | | Affinion Group, Inc. | | | | |
| | 1,580 | | | 11.50%, 10/15/2015 | | | 1,550 | |
| | | | | Allied Waste North America, Inc. | | | | |
| | 950 | | | 6.88%, 06/01/2017 (G) | | | 950 | |
| | 900 | | | 7.88%, 04/15/2013 | | | 935 | |
| | | | | AMC Entertainment, Inc. | | | | |
| | 940 | | | 11.00%, 02/01/2016 | | | 935 | |
| | | | | Cablevision Systems Corp. | | | | |
| | 850 | | | 8.00%, 04/15/2012 (G) | | | 846 | |
| | | | | Clear Channel Communications, Inc. | | | | |
| | 3,150 | | | 7.65%, 09/15/2010 | | | 3,275 | |
| | | | | Dex Media West LLC, Inc. | | | | |
| | 600 | | | 8.00%, 11/15/2013 # | | | 459 | |
| | 2,300 | | | 9.88%, 08/15/2013 # | | | 2,168 | |
| | | | | DirecTV Holdings LLC | | | | |
| | 870 | | | 8.38%, 03/15/2013 | | | 894 | |
| | | | | Echostar DBS Corp. | | | | |
| | 950 | | | 6.63%, 10/01/2014 | | | 929 | |
| | 600 | | | 7.00%, 10/01/2013 | | | 598 | |
| | 970 | | | 7.13%, 02/01/2016 | | | 953 | |
| | | | | Education Management LLC | | | | |
| | 1,120 | | | 10.25%, 06/01/2016 (G) | | | 941 | |
| | | | | FireKeepers Development Authority | | | | |
| | 720 | | | 13.88%, 05/01/2015 (I) | | | 731 | |
| | | | | Harland Clarke Holdings | | | | |
| | 1,395 | | | 9.50%, 05/15/2015 | | | 1,126 | |
| | | | | Harrah’s Operating Co., Inc. | | | | |
| | 4,780 | | | 10.75%, 02/01/2016 — 02/01/2018 (G)(I) | | | 4,080 | |
| | | | | Idearc, Inc. | | | | |
| | 2,160 | | | 8.00%, 11/15/2016 | | | 1,404 | |
| | | | | MGM Mirage, Inc. | | | | |
| | 1,780 | | | 6.75%, 09/01/2012 | | | 1,655 | |
| | 1,560 | | | 7.50%, 06/01/2016 | | | 1,412 | |
| | 700 | | | 8.50%, 09/15/2010 | | | 718 | |
| | | | | Pinnacle Entertainment, Inc. | | | | |
| | 960 | | | 8.75%, 10/01/2013 (G) | | | 974 | |
| | | | | Sheridan Group, Inc. | | | | |
| | 1,200 | | | 10.25%, 08/15/2011 | | | 1,107 | |
| | | | | Sirius Satellite Radio, Inc. | | | | |
| | 1,350 | | | 9.63%, 08/01/2013 (G) | | | 1,137 | |
| | | | | SunGard Data Systems, Inc. | | | | |
| | 3,063 | | | 10.25%, 08/15/2015 (G) | | | 3,254 | |
| | | | | TL Acquisitions, Inc. | | | | |
| | 1,480 | | | 10.50%, 01/15/2015 (G)(I) | | | 1,339 | |
| | | | | Videotron Ltd. | | | | |
| | 70 | | | 9.13%, 04/15/2018 (I) | | | 75 | |
| | | | | Wynn Las Vegas LLC | | | | |
| | 390 | | | 6.63%, 12/01/2014 | | | 380 | |
| | 860 | | | 6.63%, 12/01/2014 (I) | | | 839 | |
| | | | | XM Satellite Radio, Inc. | | | | |
| | 480 | | | 9.75%, 05/01/2014 (G) | | | 462 | |
| | | | | | | | | |
| | | | | | | | | | | | 36,126 | |
| | | | | | | | | | | | | |
| | | | | | | | | | | | | |
The accompanying notes are an integral part of these financial statements.
177
The Hartford High Yield Fund
Schedule of Investments — (continued)
April 30, 2008 (Unaudited)
(000’s Omitted)
| | | | | | | | | | | | | |
Principal
| | | | | | | | Market
| |
| Amount (B) | | | | | | | | Value (W) | |
| |
| | | | | | | | | | | | | |
| CORPORATE BONDS: NON-INVESTMENT GRADE — (continued) |
| | | | | Technology — 14.4% |
| | | | | Advanced Micro Devices, Inc. | | | | |
| $ | 1,000 | | | 5.75%, 08/15/2012 (G)(X) | | $ | 730 | |
| | | | | Broadview Networks Holdings, Inc. | | | | |
| | 1,050 | | | 11.38%, 09/01/2012 | | | 1,003 | |
| | | | | Canwest MediaWorks L.P. | | | | |
| | 1,800 | | | 9.25%, 08/01/2015 (G)(I) | | | 1,642 | |
| | | | | CCH I Holdings LLC | | | | |
| | 1,400 | | | 9.92%, 04/01/2014 (G) | | | 714 | |
| | | | | Charter Communications Operating LLC | | | | |
| | 1,655 | | | 8.00%, 04/30/2012 (I) | | | 1,597 | |
| | 1,930 | | | 10.88%, 09/15/2014 (G)(I) | | | 2,041 | |
| | | | | Cincinnati Bell, Inc. | | | | |
| | 1,065 | | | 7.25%, 07/15/2013 | | | 1,070 | |
| | | | | Citizens Communications Co. | | | | |
| | 1,370 | | | 7.88%, 01/15/2027 | | | 1,216 | |
| | | | | CSC Holdings, Inc. | | | | |
| | 2,660 | | | 7.63%, 04/01/2011 | | | 2,680 | |
| | 855 | | | 8.13%, 08/15/2009 | | | 872 | |
| | | | | Freescale Semiconductor, Inc. | | | | |
| | 2,050 | | | 9.13%, 12/15/2014 (G) | | | 1,686 | |
| | | | | General Cable Corp. | | | | |
| | 1,015 | | | 5.07%, 04/01/2015 (L) | | | 901 | |
| | | | | Hawaiian Telecom Communications, Inc. | | | | |
| | 1,045 | | | 12.50%, 05/01/2015 (G) | | | 266 | |
| | | | | Intelsat Bermuda Ltd. | | | | |
| | 460 | | | 9.25%, 06/15/2016 | | | 464 | |
| | 1,805 | | | 11.25%, 06/15/2016 | | | 1,830 | |
| | | | | Leap Wireless International, Inc. | | | | |
| | 915 | | | 9.38%, 11/01/2014 (G) | | | 898 | |
| | | | | Level 3 Financing, Inc. | | | | |
| | 1,200 | | | 9.25%, 11/01/2014 | | | 1,092 | |
| | | | | Mediacom LLC | | | | |
| | 2,185 | | | 7.88%, 02/15/2011 | | | 2,065 | |
| | | | | MetroPCS Wireless, Inc. | | | | |
| | 1,735 | | | 9.25%, 11/01/2014 | | | 1,705 | |
| | | | | Nortel Networks Ltd. | | | | |
| | 1,750 | | | 10.75%, 07/15/2016 (G) | | | 1,733 | |
| | | | | NXP B.V./NXP Funding LLC | | | | |
| | 720 | | | 5.46%, 10/15/2013 (G)(L) | | | 662 | |
| | | | | Qwest Communications International, Inc. | | | | |
| | 2,660 | | | 7.50%, 02/15/2014 (G) | | | 2,613 | |
| | | | | Qwest Corp. | | | | |
| | 750 | | | 7.88%, 09/01/2011 | | | 769 | |
| | | | | Sanmina-Sci Corp. | | | | |
| | 1,710 | | | 5.55%, 06/15/2010 — 06/15/2014 (I)(L) | | | 1,612 | |
| | | | | Spansion LLC | | | | |
| | 1,450 | | | 6.20%, 06/01/2013 (I)(L) | | | 1,088 | |
| | | | | Wind Acquisition | | | | |
| EUR | 680 | | | 9.75%, 12/01/2015 (I) | | | 1,110 | |
| | | | | Windstream Corp. | | | | |
| | 2,050 | | | 8.63%, 08/01/2016 | | | 2,147 | |
| | | | | | | | | |
| | | | | | | | | | | | 36,206 | |
| | | | | | | | | | | | | |
| | | | | Transportation — 2.0% |
| | | | | Bristow Group, Inc. | | | | |
| | 915 | | | 7.50%, 09/15/2017 | | | 945 | |
| | | | | Continental Airlines, Inc. | | | | |
| | 515 | | | 6.80%, 08/02/2018 # | | | 464 | |
| | 1,017 | | | 7.03%, 06/15/2011 | | | 930 | |
| | 1,128 | | | 7.37%, 12/15/2015 | | | 1,021 | |
| | 1,042 | | | 8.39%, 11/01/2020 | | | 969 | |
| | | | | PHI, Inc. | | | | |
| | 770 | | | 7.13%, 04/15/2013 (G) | | | 720 | |
| | | | | | | | | |
| | | | | | | | | | | | 5,049 | |
| | | | | | | | | | | | | |
| | | | | Utilities — 10.8% |
| | | | | AES Corp. | | | | |
| | 1,720 | | | 8.00%, 10/15/2017 | | | 1,793 | |
| | 1,150 | | | 9.50%, 06/01/2009 | | | 1,192 | |
| | | | | Copano Energy LLC | | | | |
| | 1,005 | | | 8.13%, 03/01/2016 | | | 1,045 | |
| | | | | Dynegy Holdings, Inc. | | | | |
| | 520 | | | 7.75%, 06/01/2019 | | | 517 | |
| | 1,910 | | | 8.75%, 02/15/2012 (G) | | | 2,025 | |
| | | | | Edison Mission Energy | | | | |
| | 1,350 | | | 7.20%, 05/15/2019 # | | | 1,360 | |
| | 1,590 | | | 7.50%, 06/15/2013 | | | 1,654 | |
| | | | | Energy Future Holdings | | | | |
| | 1,500 | | | 10.88%, 11/01/2017 (I) | | | 1,597 | |
| | | | | Kinder Morgan, Inc. | | | | |
| | 870 | | | 5.15%, 03/01/2015 | | | 805 | |
| | 400 | | | 6.50%, 09/01/2012 | | | 404 | |
| | | | | Markwest Energy Partners L.P. | | | | |
| | 1,220 | | | 8.50%, 07/15/2016 | | | 1,263 | |
| | | | | Mirant North America LLC | | | | |
| | 2,400 | | | 7.38%, 12/31/2013 | | | 2,490 | |
| | | | | NRG Energy, Inc. | | | | |
| | 880 | | | 7.25%, 02/01/2014 | | | 904 | |
| | 2,670 | | | 7.38%, 02/01/2016 | | | 2,750 | |
| | | | | Reliant Energy, Inc. | | | | |
| | 1,225 | | | 6.75%, 12/15/2014 | | | 1,265 | |
| | 1,400 | | | 7.63%, 06/15/2014 (G) | | | 1,456 | |
| | | | | Texas Competitive Electric Co. | | | | |
| | 3,275 | | | 10.25%, 11/01/2015 (I) | | | 3,414 | |
| | | | | Williams Partners L.P. | | | | |
| | 1,160 | | | 7.25%, 02/01/2017 | | | 1,198 | |
| | | | | | | | | |
| | | | | | | | | | | | 27,132 | |
| | | | | | | | | | | | | |
| | | | | Total corporate bonds: non-investment grade
(cost $218,630) | | $ | 213,620 | |
| | | | | | | | | | | | | |
| | | | | | | | | | | | | |
| SENIOR FLOATING RATE INTERESTS: NON-INVESTMENT GRADE (V) — 6.8% |
| | | | | Basic Materials — 0.4% |
| | | | | Boise Paper Holdings LLC | | | | |
| $ | 1,000 | | | 11.00%, 02/20/2015 (N) | | $ | 970 | |
| | | | | Capital Goods — 0.2% |
| | | | | Targus Group International | | | | |
| | 491 | | | 7.62%, 11/22/2012 (N) | | | 398 | |
| | | | | Consumer Cyclical — 0.6% |
| | | | | Appleseed’s Brands | | | | |
| | 1,092 | | | 8.37%, 06/25/2013 (H)(N) | | | 764 | |
| | | | | Hanesbrands, Inc. | | | | |
| | 650 | | | 6.66%, 03/05/2014 (N) | | | 642 | |
| | | | | | | | | |
| | | | | | | | | | | | 1,406 | |
| | | | | | | | | | | | | |
| | | | | Finance — 0.3% |
| | | | | United Rentals, Inc. | | | | |
| | 237 | | | 4.99%, 02/14/2011 (AA) | | | 231 | |
| | 561 | | | 5.10%, 02/14/2011 (N) | | | 549 | |
| | | | | | | | | |
| | | | | | | | | | | | 780 | |
| | | | | | | | | | | | | |
| | | | | | | | | | | | | |
The accompanying notes are an integral part of these financial statements.
178
| | | | | | | | | | | | | |
Principal
| | | | | | | | Market
| |
| Amount | | | | | | | | Value (W) | |
| | | | | | | | | | | | | |
| SENIOR FLOATING RATE INTERESTS: NON-INVESTMENT GRADE (V) — (continued) |
| | | | | Health Care — 0.6% |
| | | | | IASIS Healthcare Capital Corp. | | | | |
| $ | 1,543 | | | 8.13%, 06/15/2014 (N) | | $ | 1,358 | |
| | | | | Inverness Medical Innovation, Inc. | | | | |
| | 200 | | | 6.92%, 06/26/2015 (N) | | | 180 | |
| | | | | | | | | |
| | | | | | | | | | | | 1,538 | |
| | | | | | | | | | | | | |
| | | | | Services — 1.6% |
| | | | | Centaur LLC | | | | |
| | 123 | | | 4.00%, 10/30/2012 (N)(Q) | | | 101 | |
| | 577 | | | 6.70%, 10/30/2012 (N) | | | 488 | |
| | 330 | | | 10.20%, 10/30/2013 (H)(N) | | | 264 | |
| | | | | Marquee Holdings, Inc. | | | | |
| | 507 | | | 7.80%, 06/13/2012 (N) | | | 406 | |
| | | | | PITG Gaming Investor Holdings LLC | | | | |
| | 880 | | | 9.80%, 05/26/2008 (N) | | | 855 | |
| | | | | Tribune Co. | | | | |
| | 1,105 | | | 7.54%, 05/23/2015 (N) | | | 906 | |
| | | | | WideOpenWest Finance LLC | | | | |
| | 1,362 | | | 9.88%, 07/01/2015 (N) | | | 1,035 | |
| | | | | | | | | |
| | | | | | | | | | | | 4,055 | |
| | | | | | | | | | | | | |
| | | | | Technology — 2.2% |
| | | | | Infor Lux Bond Co. | | | | |
| | 1,596 | | | 10.70%, 07/28/2014 (H)(N) | | | 1,037 | |
| | | | | Integra Telecom Holdings, Inc. | | | | |
| | 650 | | | 10.70%, 04/08/2014 (N) | | | 595 | |
| | | | | Intelsat Bermuda Ltd. | | | | |
| | 2,450 | | | 8.25%, 01/15/2013 (AA)(Q) | | | 2,205 | |
| | | | | Mediacom Broadband LLC | | | | |
| | 343 | | | 4.26%, 03/31/2010 (N) | | | 316 | |
| | | | | Wind Acquisitions Holdings Finance S.A. | | | | |
| | 1,581 | | | 9.98%, 12/12/2011 (N) | | | 1,506 | |
| | | | | | | | | |
| | | | | | | | | | | | 5,659 | |
| | | | | | | | | | | | | |
| | | | | Utilities — 0.9% |
| | | | | Astoria Generating Co. Acquisitions LLC | | | | |
| | 500 | | | 6.35%, 08/23/2013 (N) | | | 468 | |
| | | | | Texas Competitive Electric Holdings Co. LLC | | | | |
| | 1,990 | | | 6.58%, 10/24/2014 — 10/31/2014 (N) | | | 1,905 | |
| | | | | | | | | |
| | | | | | | | | | | | 2,373 | |
| | | | | | | | | | | | | |
| | | | | Total senior floating rate interests: non-investment grade
(cost $19,001) | | $ | 17,179 | |
| | | | | | | | | | | | | |
| | | | | | | | | | | | | |
| Shares | | | | | | | | | |
| |
| COMMON STOCK — 0.0% |
| | | | | Consumer Cyclical — 0.0% |
| | 1 | | | Hosiery Corp. of America, Inc. Class A (A)(D)(H) | | $ | — | |
| | | | | Technology — 0.0% |
| | 1 | | | AboveNet, Inc. (D)(G) | | | 40 | |
| | — | | | XO Holdings, Inc. (D) | | | — | |
| | | | | | | | | |
| | | | | | | | | | | | 40 | |
| | | | | | | | | | | | | |
| | | | | Total common stock
(cost $21) | | $ | 40 | |
| | | | | | | | | | | | | |
| | | | | | | | | | | | | |
| WARRANTS — 0.0% |
| | | | | Technology — 0.0% |
| | — | | | AboveNet, Inc. (D)(H) | | $ | 19 | |
| | — | | | XO Holdings, Inc. (D)(H) | | | — | |
| | | | | | | | | |
| | | | | Total warrants
(cost $—) | | $ | 19 | |
| | | | | | | | | | | | | |
| | | | | | | | | | | | | |
| PREFERRED STOCK — 0.2% |
| | | | | Finance — 0.2% |
| | 17 | | | United Rentals Trust I (H)(X) | | $ | 504 | |
| | | | | | | | | |
| | | | | Total preferred stock
(cost $838) | | $ | 504 | |
| | | | | | | | | |
| | | | | Total long-term investments
(cost $240,788) | | $ | 232,868 | |
| | | | | | | | | | | | | |
| | | | | | | | | | | | | |
| SHORT-TERM INVESTMENTS — 21.6% |
| | | | | Investment Pools and Funds — 0.0% |
| | 17 | | | State Street Bank Money Market Fund | | $ | 17 | |
| | | | | | | | | | | | | |
| | | | | | | | | | | | | |
Principal
| | | | | | | | | |
| Amount | | | | | | | | | |
| |
| | | | | Repurchase Agreements — 6.4% |
| | | | | BNP Paribas Securities Corp. Repurchase Agreement (maturing on 05/01/2008 in the amount of $4,663, collateralized by U.S. Treasury Bond 5.50%, 2028, value of $4,810) | | | | |
| $ | 4,663 | | | 1.90% dated 04/30/2008 | | | 4,663 | |
| | | | | RBS Greenwich Capital Markets Repurchase Agreement (maturing on 05/01/2008 in the amount of $4,663, collateralized by U. S. Treasury Note 4.50%, 2011, value of $4,775) | | | | |
| | 4,663 | | | 1.90% dated 04/30/2008 | | | 4,663 | |
| | | | | UBS Securities, Inc. Repurchase Agreement (maturing on 05/01/2008 in the amount of $6,768, collateralized by U.S. Treasury Bond 6.00% — 8.75%, 2020 — 2026, U.S. Treasury Note 4.75% — 13.25%, 2008 — 2016, value of $6,933) | | | | |
| | 6,768 | | | 1.90% dated 04/30/2008 | | | 6,768 | |
| | | | | | | | | |
| | | | | | | | | | | | 16,094 | |
| | | | | | | | | | | | | |
| | | | | | | | | | | | | |
| | | | | | | | | | | | | |
| Shares | | | | | | | | | |
| |
| | | | | Securities Purchased with Proceeds from Security Lending — 15.1% |
| | | | | Cash Collateral Reinvestment Fund: |
| | 37,883 | | | Navigator Prime Portfolio | | | 37,883 | |
| | | | | | | | | | | | | |
| | | | | | | | | | | | | |
Principal
| | | | | | | | | |
| Amount | | | | | | | | | |
| |
| | | | | U.S. Treasury Bills — 0.1% |
| $ | 200 | | | 1.43%, 06/12/2008 (M)(S) | | $ | 200 | |
| | | | | | | | | |
| | | | | Total short-term investments
(cost $54,194) | | $ | 54,194 | |
| | | | | | | | | |
| | | | | Total investments
(cost $294,982) (C) | | | 114.1 | % | | $ | 287,062 | |
| | | | | Other assets and liabilities | | | (14.1 | )% | | | (35,538 | ) |
| | | | | | | | | | | | | |
| | | | | Total net assets | | | 100.0 | % | | $ | 251,524 | |
| | | | | | | | | | | | | |
The accompanying notes are an integral part of these financial statements.
179
The Hartford High Yield Fund
Schedule of Investments — (continued)
April 30, 2008 (Unaudited)
(000’s Omitted)
| |
| Note: | Percentage of investments as shown is the ratio of the total market value to total net assets. Market value of investments in foreign securities represents 4.12% of total net assets at April 30, 2008. |
| | |
| (C) | | At April 30, 2008, the cost of securities for federal income tax purposes was $295,435 and the aggregate gross unrealized appreciation and depreciation based on that cost were: |
| | | | | |
| Unrealized Appreciation | | $ | 2,630 | |
| Unrealized Depreciation | | | (11,003 | ) |
| | | | | |
| Net Unrealized Depreciation | | $ | (8,373 | ) |
| | | | | |
| | |
| # | | This security, or a portion of this security, has been segregated to cover funding requirements on investment transactions settling in the future. |
| |
| (A) | | The aggregate value of securities valued in good faith at fair value as determined under policies and procedures established by and under the supervision of the Funds’ Board of Directors at April 30, 2008 rounds to zero. This calculation excludes securities that are principally traded on certain foreign markets and whose prices were adjusted solely pursuant to a third party pricing service methodology approved by the Board of Directors. |
| |
| (AA) | | The interest rate disclosed for these securities represents an estimated average coupon as of April 30, 2008. |
| |
| (D) | | Currently non-income producing. |
| |
| (G) | | Security is partially on loan at April 30, 2008. |
| |
| (I) | | Securities issued within terms of a private placement memorandum, exempt from registration under Section 144A of the Securities Act of 1933, as amended, and may be sold only to qualified institutional buyers. Pursuant to guidelines adopted by the Board of Directors, these issues are determined to be liquid. The aggregate value of these securities at April 30, 2008 was $39,995, which represents 15.90% of total net assets. |
| |
| (L) | | Variable rate securities; the rate reported is the coupon rate in effect at April 30, 2008. |
| |
| (M) | | The interest rate disclosed for these securities represents the effective yield on the date of acquisition. |
| |
| (N) | | The interest rate disclosed for these securities represents the average coupon as of April 30, 2008. |
| |
| (V) | | Senior loans in which the Fund invests generally pay interest rates which are periodically adjusted by reference to a base short-term, floating lending rate plus a premium. These base lending rates are generally (i) the lending rate offered by one or more major European banks, such as the London Inter-Bank Offered Rate (LIBOR), (ii) the prime rate offered by one or more major United States Banks, or (iii) the bank’s certificate of deposit rate. Senior floating rate interests often require prepayments from excess cash flows or permit the borrower to repay at its election. The rate at which the borrower repays cannot be predicted with accuracy. As a result, the actual remaining maturity may be substantially less than the stated maturities shown. The interest rate indicated is the rate in effect at April 30, 2008. |
| |
| (c) | | The interest rates disclosed for interest only strips represent effective yields based upon estimated future cash flows at April 30, 2008. |
| |
| (Q) | | The cost of securities purchased on a when-issued or delayed delivery basis at April 30, 2008 was $2,328. |
| |
| (X) | | Convertible security. |
| |
| (B) | | All principal amounts are in U.S. dollars unless otherwise indicated. |
| | |
| (H) | | The following securities are considered illiquid. Illiquid securities are often purchased in private placement transactions, are not registered under the Securities Act of 1933 and may have contractual restrictions on resale. A security may also be considered illiquid if the security lacks a readily available market or if its valuation has not changed for a certain period of time. |
| | | | | | | | | | | |
Period
| | Shares/
| | | | | | |
Acquired | | Par | | | Security | | Cost Basis | |
| 09/2007 - 03/2008 | | | — | | | AboveNet, Inc. Warrants | | $ | — | |
| 07/2007 | | | 1,092 | | | Appleseed’s Brands, 8.37%, 06/25/2013 | | | 1,084 | |
| 11/2006 - 08/2007 | | | 6,378 | | | CBA Commercial Small Balance Commercial Mortgage, 9.75%, 01/25/2039 - 144A | | | 605 | |
| 10/2007 | | | 330 | | | Centaur LLC, 10.20%, 10/30/2013 | | | 324 | |
| | | | | | | | | | | |
| 10/1994 | | | 1 | | | Hosiery Corp. of America, Inc. Class A - 144A | | | 21 | |
| 03/2007 - 04/2008 | | | 1,596 | | | Infor Lux Bond Co., 10.70%, 07/28/2014 | | | 1,301 | |
| 08/2006 - 04/2008 | | | 2,165 | | | LPL Holdings, Inc., 10.75%, 12/15/2015 - 144A | | | 2,241 | |
| 05/2001 - 11/2001 | | | 650 | | | Potlatch Corp., 13.00%, 12/01/2009 | | | 649 | |
| 02/2007 | | | 920 | | | Soundview NIM Trust, 8.25%, 12/25/2036 - 144A | | | 849 | |
| 03/2007 - 07/2007 | | | 17 | | | United Rentals Trust I | | | 838 | |
| 05/2006 | | | — | | | XO Holdings, Inc. Warrants | | | — | |
| | |
| | The aggregate value of these securities at April 30, 2008 was $6,146, which represents 2.44% of total net assets. |
| |
| (S) | | Security pledged as initial margin deposit for open futures contracts at April 30, 2008. |
| |
| | Futures Contracts Outstanding at April 30, 2008 |
| | | | | | | | | | | | | | | | | |
| | | | | | | | | | | | Unrealized
| |
| | | Number of
| | | | | | Expiration
| | | Appreciation/
| |
Description | | Contracts* | | | Position | | | Month | | | (Depreciation) | |
| |
| 5 Year U.S. Treasury Note | | | 168 | | | | Long | | | | Jun 2008 | | | $ | (122 | ) |
| | | | | | | | | | | | | | | | | |
| | |
| | * The number of contracts does not omit 000’s. |
Forward Foreign Currency Contracts Outstanding at April 30, 2008
| | | | | | | | | | | | | | | | | |
| | | | | | | | | | | | Unrealized
| |
| | | Market
| | | Contract
| | | Delivery
| | | Appreciation/
| |
Description | | Value(W) | | | Amount | | | Date | | | (Depreciation) | |
| |
| Euro (Sell) | | $ | 2,286 | | | $ | 2,287 | | | | 07/29/08 | | | $ | 1 | |
| | | | | | | | | | | | | | | | | |
| | |
| (W) | | See Note 2b of accompanying Notes to Financial Statements regarding valuation of securities. |
The accompanying notes are an integral part of these financial statements.
180
Credit Default Swap Agreements Outstanding at April 30, 2008
| | | | | | | | | | | | | | | | | | | | | | | | | |
| | | | | | | | | | | | | | | | | | Unrealized
| |
| | | Reference
| | | Buy/Sell
| | | Pay/Receive
| | | Expiration
| | | Notional
| | | Appreciation/
| |
CounterParty | | Entity | | | Protection | | | Fixed Rate | | | Date | | | Amount | | | (Depreciation) | |
| |
| Lehman Brothers Special Financing, Inc. | | | GMAC | | | | Sell | | | | 6.65 | % | | | 09/20/08 | | | $ | 625 | | | $ | — | |
| | | | | | | | | | | | | | | | | | | | | | | | | |
The accompanying notes are an integral part of these financial statements.
181
The Hartford High Yield Municipal Bond Fund
Schedule of Investments
April 30, 2008 (Unaudited)
(000’s Omitted)
| | | | | | | | | | | | | |
Principal
| | | | | | | | Market
| |
| Amount | | | | | | | | Value (W) | |
| MUNICIPAL BONDS — 96.5% |
| | | | | Alabama — 0.3% |
| | | | | Huntsville-Redstone Village, AL, Special Care Fac FA | | | | |
| $ | 600 | | | 5.25%, 01/01/2015 # | | $ | 574 | |
| | | | | Arizona — 0.6% |
| | | | | Estrella Mountain Ranch Community GO | | | | |
| | 265 | | | 6.20%, 07/15/2032 (H) | | | 252 | |
| | | | | Show Low Bluff, AZ, Community Fac Dist Special Assessment | | | | |
| | 200 | | | 5.60%, 07/01/2031 (H) | | | 172 | |
| | | | | Tartesso West Community Facilities Dist | | | | |
| | 1,000 | | | 5.90%, 07/15/2032 (H) | | | 901 | |
| | | | | | | | | |
| | | | | | | | | | | | 1,325 | |
| | | | | | | | | | | | | |
| | | | | California — 12.3% |
| | | | | California Municipal FA, Biola University | | | | |
| | 1,000 | | | 5.80%, 10/01/2028 | | | 1,001 | |
| | | | | California Statewide Community DA, California Baptist University | | | | |
| | 2,800 | | | 5.50%, 11/01/2038 | | | 2,601 | |
| | | | | California Statewide Community DA, Drew School | | | | |
| | 250 | | | 5.30%, 10/01/2037 | | | 215 | |
| | | | | California Statewide Community DA, Huntington Park Rev | | | | |
| | 200 | | | 5.15%, 07/01/2030 | | | 171 | |
| | | | | California Statewide Community DA, Valleycare Health System | | | | |
| | 100 | | | 5.13%, 07/15/2031 (H) | | | 83 | |
| | | | | Central Basin Municipal Water Dist | | | | |
| | 2,500 | | | 4.95%, 08/01/2021 (L) | | | 2,500 | |
| | | | | Chino, CA, Community Fac Dist Special Tax B | | | | |
| | 500 | | | 5.00%, 09/01/2036 # | | | 399 | |
| | | | | Elk Grove, CA, Special Tax | | | | |
| | 500 | | | 5.25%, 09/01/2037 # | | | 334 | |
| | | | | Folsom, CA, Public FA Special Tax Rev | | | | |
| | 500 | | | 5.20%, 09/01/2032 # | | | 418 | |
| | | | | Golden Empire Schools Financing Auth | | | | |
| | 7,000 | | | 4.95%, 08/01/2034 (L) | | | 7,000 | |
| | | | | Morongo Band of Mission Indians Enterprise Rev | | | | |
| | 1,595 | | | 6.50%, 03/01/2028 | | | 1,601 | |
| | | | | Perris, CA, Public FA Local Agency Rev | | | | |
| | 1,000 | | | 5.80%, 09/01/2038 | | | 904 | |
| | | | | Rancho Santa Fe, CA, Community Services Dist Special Tax Community Fac Dist #1 | | | | |
| | 600 | | | 5.25%, 09/01/2030 | | | 519 | |
| | | | | Rialto, CA, Redev Agency | | | | |
| | 2,000 | | | 5.88%, 09/01/2033 | | | 2,081 | |
| | | | | Roseville, CA, Special Tax | | | | |
| | 1,000 | | | 6.00%, 09/01/2028 | | | 948 | |
| | | | | Vernon, CA, Natural Gas FA | | | | |
| | 5,000 | | | 5.00%, 08/01/2021 | | | 4,996 | |
| | | | | | | | | |
| | | | | | | | | | | | 25,771 | |
| | | | | | | | | | | | | |
| | | | | Colorado — 1.1% |
| | | | | Baptist Road Rural Transportation Auth, Sales & Use Tax Rev | | | | |
| | 800 | | | 5.00%, 12/01/2026 | | | 669 | |
| | | | | Colorado Educational & Cultural FA Rev, Charter School-Windsor Academy Proj | | | | |
| | 500 | | | 5.70%, 05/01/2037 (H) | | | 435 | |
| | | | | Denver, CO, City & County Special Fac Airport AMT | | | | |
| | 500 | | | 5.25%, 10/01/2032 # | | | 365 | |
| | | | | North Range, CO, Metropolitan Dist #2 | | | | |
| | 500 | | | 5.50%, 12/15/2027 (H) | | | 438 | |
| | | | | Park Meadows, CO, Business Improvement Dist Shared Sales Tax Rev | | | | |
| | 360 | | | 5.35%, 12/01/2031 | | | 335 | |
| | | | | | | | | |
| | | | | | | | | | | | 2,242 | |
| | | | | | | | | | | | | |
| | | | | Delaware — 0.8% |
| | | | | Millsboro, DE, Special Obligation Plantation Lakes Special Development | | | | |
| | 500 | | | 5.45%, 07/01/2036 (H) | | | 421 | |
| | | | | Sussex County, DE, Del Rev | | | | |
| | 1,235 | | | 5.90%, 01/01/2026 | | | 1,150 | |
| | | | | | | | | |
| | | | | | | | | | | | 1,571 | |
| | | | | | | | | | | | | |
| | | | | District of Columbia — 1.4% |
| | | | | District of Columbia Tobacco Settlement Financing Corp | | | | |
| | 3,000 | | | 6.50%, 05/15/2033 | | | 2,996 | |
| | | | | Florida — 11.2% |
| | | | | Beeline Community Development Dist | | | | |
| | 1,220 | | | 7.00%, 05/01/2037 # | | | 1,236 | |
| | | | | Jacksonville, FL, Econ Development Community AMT | | | | |
| | 1,000 | | | 5.30%, 05/01/2037 | | | 812 | |
| | | | | Jacksonville, FL, Econ Development Community Health Care Facilities | | | | |
| | 1,000 | | | 6.25%, 09/01/2027 (H) | | | 964 | |
| | | | | Lake Worth, FL, Utility System Rev | | | | |
| | 2,000 | | | 5.18%, 10/01/2034 (L) | | | 2,000 | |
| | | | | Lakeland, FL, Retirement Community Rev | | | | |
| | 500 | | | 6.25%, 01/01/2028 | | | 499 | |
| | 1,750 | | | 6.38%, 01/01/2043 | | | 1,752 | |
| | | | | Lee County, FL, Industrial DA | | | | |
| | 1,000 | | | 5.25%, 06/15/2027 | | | 857 | |
| | | | | Magnolia Creek, FL, Community Development Dist Capital Improvement | | | | |
| | 500 | | | 5.90%, 05/01/2039 | | | 421 | |
| | | | | Orange County, FL, Health Care FA Rev | | | | |
| | 200 | | | 5.50%, 07/01/2038 (H) | | | 166 | |
| | | | | Palm Beach County, FL, Health FA Rev Waterford Proj | | | | |
| | 2,400 | | | 5.88%, 11/15/2037 | | | 2,184 | |
| | | | | Parker Road, FL, Community Development Dist Cap Improvement Ser A | | | | |
| | 200 | | | 5.60%, 05/01/2038 | | | 163 | |
| | | | | Putnam County, FL, DA | | | | |
| | 3,125 | | | 5.35%, 03/15/2042 (Q) | | | 3,108 | |
| | | | | River Bend Community Development Dist, Capital Improvement Rev | | | | |
| | 2,000 | | | 7.13%, 11/01/2015 | | | 1,945 | |
| | | | | Seminole Tribe of Florida | | | | |
| | 2,000 | | | 5.25%, 10/01/2027 (I) | | | 1,804 | |
| | 1,000 | | | 5.50%, 10/01/2024 (I) | | | 956 | |
| | | | | Six Mile Creek, FL, Community Development Dist | | | | |
| | 1,525 | | | 5.88%, 05/01/2038 | | | 1,154 | |
The accompanying notes are an integral part of these financial statements.
182
| | | | | | | | | | | | | |
Principal
| | | | | | | | Market
| |
| Amount | | | | | | | | Value (W) | |
| | | | | | | | | | | | | |
| MUNICIPAL BONDS — (continued) |
| | | | | | | | | | | | | |
| | | | | Florida — (continued) |
| | | | | St. Johns County, FL, IDA | | | | |
| $ | 1,765 | | | 5.00%, 02/15/2027 | | $ | 1,523 | |
| | | | | Sweetwater Creek, FL, Community Development Dist Captial Improvement Rev | | | | |
| | 1,000 | | | 5.50%, 05/01/2038 # | | | 751 | |
| | | | | Tolomato, FL, Community Development Dist | | | | |
| | 800 | | | 6.65%, 05/01/2040 | | | 763 | |
| | | | | University Square Community Development | | | | |
| | 500 | | | 5.88%, 05/01/2038 | | | 437 | |
| | | | | | | | | |
| | | | | | | | | | | | 23,495 | |
| | | | | | | | | | | | | |
| | | | | Georgia — 8.3% |
| | | | | Augusta, GA, Airport Rev AMT | | | | |
| | 165 | | | 5.35%, 01/01/2028 | | | 149 | |
| | 230 | | | 5.45%, 01/01/2031 | | | 207 | |
| | | | | Burke County, GA, DA | | | | |
| | 7,000 | | | 8.00%, 01/01/2016 (L) | | | 7,000 | |
| | | | | Main Street Natural Gas, Inc., Gas Rev | | | | |
| | 10,000 | | | 6.25%, 07/15/2028 | | | 9,886 | |
| | | | | | | | | |
| | | | | | | | | | | | 17,242 | |
| | | | | | | | | | | | | |
| | | | | Idaho — 2.8% |
| | | | | Idaho Arts Charter School | | | | |
| | 1,000 | | | 6.25%, 12/01/2028 | | | 966 | |
| | | | | Nez Perce County, ID, Pollution Control | | | | |
| | 5,000 | | | 6.00%, 10/01/2024 | | | 4,853 | |
| | | | | | | | | |
| | | | | | | | | | | | 5,819 | |
| | | | | | | | | | | | | |
| | | | | Illinois — 2.3% |
| | | | | Belleville, IL, Tax Increment | | | | |
| | 1,000 | | | 5.70%, 05/01/2036 (H) | | | 875 | |
| | | | | Chicago, IL, O’Hare International Airport Special Fac Rev, American Airlines Inc. | | | | |
| | 250 | | | 5.50%, 12/01/2030 | | | 152 | |
| | | | | Hampshire, IL, Special Service Area #13, Tuscany Woods Proj | | | | |
| | 200 | | | 5.75%, 03/01/2037 | | | 169 | |
| | | | | Hampshire, IL, Special Service Area #16, Prairie Ridge Proj | | | | |
| | 200 | | | 6.00%, 03/01/2046 | | | 173 | |
| | | | | Illinois FA | | | | |
| | 300 | | | 5.38%, 11/15/2039 | | | 244 | |
| | 1,500 | | | 5.38%, 08/15/2039 (Q) | | | 1,468 | |
| | 1,500 | | | 5.50%, 08/15/2028 (Q) | | | 1,514 | |
| | 190 | | | 6.25%, 02/01/2033 | | | 205 | |
| | | | | | | | | |
| | | | | | | | | | | | 4,800 | |
| | | | | | | | | | | | | |
| | | | | Indiana — 0.9% |
| | | | | East Chicago Industrial Solid Waste Disposal AMT | | | | |
| | 1,000 | | | 5.50%, 09/01/2028 | | | 862 | |
| | | | | Fort Wayne, IN, Pollution Control Rev | | | | |
| | 675 | | | 6.20%, 10/15/2025 # | | | 577 | |
| | | | | Vigo County, IN, Union Hospital | | | | |
| | 500 | | | 5.70%, 09/01/2037 (I) | | | 436 | |
| | | | | | | | | |
| | | | | | | | | | | | 1,875 | |
| | | | | | | | | | | | | |
| | | | | Kansas — 0.2% |
| | | | | Olathe, KS, Tax Increment Rev, West Village Center | | | | |
| | 500 | | | 5.50%, 09/01/2026 | | | 459 | |
| | | | | Louisiana — 4.2% |
| | | | | Colonial Pinnacle Community Development Dist | | | | |
| | 2,655 | | | 6.75%, 05/01/2023 | | | 2,607 | |
| | | | | Louisiana Local Government Environmental Facilities & Community Development | | | | |
| | 5,000 | | | 6.75%, 11/01/2032 | | | 4,904 | |
| | | | | Louisiana Public Fac Auth, Susla Fac Inc | | | | |
| | 500 | | | 5.75%, 07/01/2039 (H) | | | 451 | |
| | | | | St. Johns Baptist Parish, LA, Marathon Oil Co. | | | | |
| | 1,000 | | | 5.13%, 06/01/2037 # | | | 907 | |
| | | | | | | | | |
| | | | | | | | | | | | 8,869 | |
| | | | | | | | | | | | | |
| | | | | Maryland — 0.4% |
| | | | | Maryland State Health and Higher Education FA Rev | | | | |
| | 770 | | | 6.00%, 01/01/2028 | | | 773 | |
| | | | | Michigan — 2.5% |
| | | | | Michigan Public Educational Facilities | | | | |
| | 3,000 | | | 6.50%, 09/01/2037 (I) | | | 2,793 | |
| | | | | Michigan Tobacco Settlement FA | | | | |
| | 2,600 | | | 6.00%, 06/01/2034 | | | 2,450 | |
| | | | | | | | | |
| | | | | | | | | | | | 5,243 | |
| | | | | | | | | | | | | |
| | | | | Minnesota — 1.7% |
| | | | | Falcon Heights, MN, Lease Rev | | | | |
| | 525 | | | 6.00%, 11/01/2037 | | | 474 | |
| | | | | Minneapolis, MN, Multifamily Housing Rev AMT | | | | |
| | 200 | | | 5.40%, 04/01/2028 | | | 178 | |
| | | | | Rochester, MN, Health Care Fac Rev | | | | |
| | 790 | | | 5.70%, 05/01/2022 (H) | | | 771 | |
| | | | | University of Minnesota | | | | |
| | 2,000 | | | 5.45%, 08/01/2031 (L) | | | 2,000 | |
| | | | | Worthington, MN, Housing Rev Ref, Meadows Worthington Proj | | | | |
| | 100 | | | 5.38%, 05/01/2037 | | | 84 | |
| | | | | | | | | |
| | | | | | | | | | | | 3,507 | |
| | | | | | | | | | | | | |
| | | | | Missouri — 0.4% |
| | | | | Branson Hills, MO, Infrastructure Fac | | | | |
| | 100 | | | 5.50%, 04/01/2027 # | | | 88 | |
| | | | | Branson, MO, Regional Airport Transportation Development AMT | | | | |
| | 300 | | | 6.00%, 07/01/2025 | | | 273 | |
| | | | | Kansas City, MO, Tax Increment Rev Maincor Proj Ser A | | | | |
| | 500 | | | 5.25%, 03/01/2018 | | | 478 | |
| | | | | | | | | |
| | | | | | | | | | | | 839 | |
| | | | | | | | | | | | | |
| | | | | Nevada — 0.4% |
| | | | | Las Vegas, NV, Special Improvement Dist #808 & 810, Summerlin Village | | | | |
| | 500 | | | 6.13%, 06/01/2031 | | | 456 | |
| | | | | Mesquite Special Improvement Dist #07-01 | | | | |
| | 500 | | | 6.00%, 08/01/2027 | | | 445 | |
| | | | | | | | | |
| | | | | | | | | | | | 901 | |
| | | | | | | | | | | | | |
| | | | | New Hampshire — 0.1% |
| | | | | New Hampshire State Business Fin Rev AMT | | | | |
| | 200 | | | 5.20%, 05/01/2027 | | | 171 | |
The accompanying notes are an integral part of these financial statements.
183
The Hartford High Yield Municipal Bond Fund
Schedule of Investments — (continued)
April 30, 2008 (Unaudited)
(000’s Omitted)
| | | | | | | | | | | | | |
Principal
| | | | | | | | Market
| |
| Amount | | | | | | | | Value (W) | |
| | | | | | | | | | | | | |
| MUNICIPAL BONDS — (continued) |
| | | | | New Jersey — 3.2% |
| | | | | Burlington County, NJ, Bridge Commission Econ Development Rev, The Evergreen Proj | | | | |
| $ | 1,500 | | | 5.63%, 01/01/2038 | | $ | 1,309 | |
| | | | | New Jersey Health Care Services | | | | |
| | 800 | | | 5.50%, 07/01/2030 | | | 722 | |
| | | | | New Jersey State Educational Facilities Auth | | | | |
| | 575 | | | 4.75%, 07/01/2037 (L) | | | 575 | |
| | 4,000 | | | 5.68%, 07/01/2037 (L) | | | 4,000 | |
| | | | | | | | | |
| | | | | | | | | | | | 6,606 | |
| | | | | | | | | | | | | |
| | | | | New Mexico — 0.5% |
| | | | | Montecito Estates Public Improvement Rev | | | | |
| | 1,000 | | | 7.00%, 10/01/2037 (H) | | | 944 | |
| | | | | Otero County, NM, Jail Proj | | | | |
| | 100 | | | 6.00%, 04/01/2023 | | | 94 | |
| | | | | | | | | |
| | | | | | | | | | | | 1,038 | |
| | | | | | | | | | | | | |
| | | | | New York — 12.2% |
| | | | | Buffalo, NY, Municipal Water FA | | | | |
| | 4,000 | | | 6.86%, 07/01/2035 (L) | | | 4,000 | |
| | | | | Erie County, NY, IDA Global Concepts Charter School Proj | | | | |
| | 700 | | | 6.25%, 10/01/2037 | | | 661 | |
| | | | | Genesee County, NY, IDA Civic Fac Rev, United Memorial Medical Center | | | | |
| | 500 | | | 5.00%, 12/01/2027 # | | | 422 | |
| | | | | Nassau County, NY, IDA Continuing Care Retirement, Amsterdam at Harborside Ser A | | | | |
| | 1,000 | | | 6.50%, 01/01/2027 | | | 986 | |
| | | | | New York State Dormitory Auth Non State Supported Debt, NYU Hospital Center Ser B | | | | |
| | 750 | | | 5.63%, 07/01/2037 | | | 707 | |
| | | | | New York State Dormitory Auth Non State Supported Debt, Orange Regional Med Center | | | | |
| | 3,125 | | | 6.13%, 12/01/2029 (Q) | | | 3,131 | |
| | | | | New York, NY, IDA American Airlines JFK International Airport AMT | | | | |
| | 515 | | | 7.13%, 08/01/2011 | | | 508 | |
| | 6,500 | | | 7.63%, 08/01/2025 | | | 6,308 | |
| | 1,725 | | | 8.00%, 08/01/2012 | | | 1,725 | |
| | | | | Trust for Cultural Residential Juilliard | | | | |
| | 4,000 | | | 15.00%, 07/01/2036 (L) | | | 4,000 | |
| | | | | Ulster County Industrial Development Agency | | | | |
| | 2,000 | | | 6.00%, 09/15/2042 | | | 1,808 | |
| | | | | Ulster County, NY, IDA | | | | |
| | 1,250 | | | 6.00%, 09/15/2037 | | | 1,144 | |
| | | | | | | | | |
| | | | | | | | | | | | 25,400 | |
| | | | | | | | | | | | | |
| | | | | North Carolina — 0.5% |
| | | | | Albemarle, NC, Hospital Auth Healthcare | | | | |
| | 1,000 | | | 5.25%, 10/01/2038 # | | | 895 | |
| | | | | Raleigh, NC, Medical Care Commission Retirement Fac Rev | | | | |
| | 200 | | | 5.25%, 01/01/2032 | | | 160 | |
| | | | | | | | | |
| | | | | | | | | | | | 1,055 | |
| | | | | | | | | | | | | |
| | | | | Ohio — 3.7% |
| | | | | Buckeye Tobacco Settlement FA | | | | |
| | 5,000 | | | 5.88%, 06/01/2047 | | | 4,406 | |
| | 3,500 | | | 6.50%, 06/01/2047 # | | | 3,404 | |
| | | | | | | | | |
| | | | | | | | | | | | 7,810 | |
| | | | | | | | | | | | | |
| | | | | Oklahoma — 0.2% |
| | | | | Oklahoma Development FA, Hospital Rev Great Plains Regional Medical Center | | | | |
| | 500 | | | 5.13%, 12/01/2036 | | | 436 | |
| | | | | Other U.S. Territories — 3.2% |
| | | | | Puerto Rico Commonwealth | | | | |
| | 3,200 | | | 2.90%, 07/01/2031 (L) | | | 3,200 | |
| | 3,570 | | | 5.50%, 07/01/2032 (Q) | | | 3,570 | |
| | | | | | | | | |
| | | | | | | | | | | | 6,770 | |
| | | | | | | | | | | | | |
| | | | | Pennsylvania — 4.2% |
| | | | | Allegheny County, PA, Hospital DA Rev | | | | |
| | 1,500 | | | 5.00%, 11/15/2028 # | | | 1,237 | |
| | | | | Delaware River, PA | | | | |
| | 5,000 | | | 4.50%, 01/01/2026 (L) | | | 5,000 | |
| | | | | Pennsylvania State Higher Educational FA Rev | | | | |
| | 1,300 | | | 5.08%, 11/01/2015 (L) | | | 1,300 | |
| | 855 | | | 5.75%, 07/01/2028 | | | 829 | |
| | | | | Philadelphia, PA, IDA | | | | |
| | 500 | | | 5.25%, 05/01/2037 | | | 425 | |
| | | | | | | | | |
| | | | | | | | | | | | 8,791 | |
| | | | | | | | | | | | | |
| | | | | South Carolina — 0.9% |
| | | | | Lancaster County, SC, Sun City Assessment | | | | |
| | 1,993 | | | 7.70%, 11/01/2017 | | | 1,947 | |
| | | | | Texas — 5.3% |
| | | | | Burnet County, TX, Public Fac Proj Rev | | | | |
| | 2,000 | | | 7.75%, 08/01/2029 | | | 1,967 | |
| | | | | Dallas-Fort Worth, TX, International Airport AMT | | | | |
| | 750 | | | 6.15%, 01/01/2016 | | | 738 | |
| | | | | Garza County, TX, Public Fac Corp Rev | | | | |
| | 1,000 | | | 5.75%, 10/01/2025 | | | 990 | |
| | | | | Guadalupe County, TX, Board Managers Joint Rev | | | | |
| | 2,000 | | | 5.50%, 08/15/2036 # | | | 2,033 | |
| | | | | Gulf Coast Waste Disposal Auth AMT | | | | |
| | 1,000 | | | 5.20%, 05/01/2028 | | | 850 | |
| | | | | Maverick County, TX, Public Fac Corp Proj Rev | | | | |
| | 1,685 | | | 6.25%, 02/01/2024 | | | 1,531 | |
| | | | | Travis County, TX, Health Fac, Querencia Barton Creek Project | | | | |
| | 600 | | | 5.65%, 11/15/2035 | | | 522 | |
| | | | | Willacy County, TX, GO | | | | |
| | 2,500 | | | 6.88%, 09/01/2028 | | | 2,473 | |
| | | | | | | | | |
| | | | | | | | | | | | 11,104 | |
| | | | | | | | | | | | | |
| | | | | Utah — 2.4% |
| | | | | Provo, UT, Lakeview Charter School | | | | |
| | 1,300 | | | 5.63%, 07/15/2037 | | | 1,146 | |
| | | | | Provo, UT, Renaissance Charter School | | | | |
| | 200 | | | 5.63%, 07/15/2037 | | | 176 | |
| | | | | Utah County, UT, Charter School Rev | | | | |
| | 1,000 | | | 6.00%, 02/15/2038 | | | 917 | |
| | | | | Utah State Charter School Financing Auth, Channing Hall Ser A | | | | |
| | 750 | | | 5.88%, 07/15/2027 (I) | | | 694 | |
| | 700 | | | 6.00%, 07/15/2037 (I) | | | 645 | |
| | | | | Utah State Charter School Financing Auth, Summit Academy Ser A | | | | |
| | 1,500 | | | 5.80%, 06/15/2038 | | | 1,409 | |
| | | | | | | | | |
| | | | | | | | | | | | 4,987 | |
| | | | | | | | | | | | | |
The accompanying notes are an integral part of these financial statements.
184
| | | | | | | | | | | | | |
Principal
| | | | | | | | Market
| |
| Amount | | | | | | | | Value (W) | |
| | | | | | | | | | | | | |
| MUNICIPAL BONDS — (continued) |
| | | | | Vermont — 1.2% |
| | | | | Vermont Educational & Health Buildings FA Rev | | | | |
| $ | 2,500 | | | 4.82%, 09/01/2036 (L) | | $ | 2,500 | |
| | | | | Virginia — 1.9% |
| | | | | James City County, VA, Econ DA Residential Care Fac | | | | |
| | 1,100 | | | 5.40%, 07/01/2027 | | | 965 | |
| | | | | Lexington, VA, IDA Residential Care Fac Rev | | | | |
| | 1,050 | | | 5.50%, 01/01/2037 | | | 893 | |
| | | | | Norfolk, VA, Redev & Housing Auth Rev | | | | |
| | 2,005 | | | 6.13%, 01/01/2035 | | | 1,847 | |
| | | | | Peninsula, VA, Turn Center Community Dev DA | | | | |
| | 300 | | | 6.45%, 09/01/2037 | | | 279 | |
| | | | | | | | | |
| | | | | | | | | | | | 3,984 | |
| | | | | | | | | | | | | |
| | | | | Washington — 1.6% |
| | | | | Skagit County, WA, Public Hospital Rev | | | | |
| | 2,000 | | | 5.75%, 12/01/2032 | | | 1,873 | |
| | | | | Washington State Health Care FA Rev | | | | |
| | 1,600 | | | 6.13%, 08/15/2037 (H) | | | 1,456 | |
| | | | | | | | | |
| | | | | | | | | | | | 3,329 | |
| | | | | | | | | | | | | |
| | | | | Wisconsin — 3.6% |
| | | | | Badger Tobacco Asset Securitization Corp. of WI | | | | |
| | 6,045 | | | 6.13%, 06/01/2027 | | | 6,020 | |
| | 1,000 | | | 6.38%, 06/01/2032 | | | 1,004 | |
| | | | | Wisconsin State Health & Educational Fac Auth, Wellington Homes Wis LLC | | | | |
| | 600 | | | 6.75%, 09/01/2037 (H) | | | 568 | |
| | | | | | | | | |
| | | | | | | | | | | | 7,592 | |
| | | | | | | | | | | | | |
| | | | | Total municipal bonds
(cost $209,309) | | $ | 201,821 | |
| | | | | | | | | | | | | |
| | | | | | | | | | | | | |
| Shares | | | | | | | | | |
| |
| SHORT-TERM INVESTMENTS — 6.8% |
| | | | | Investment Pools and Funds — 6.8% |
| | 14,193 | | | State Street Bank Tax Free Money Market Fund | | $ | 14,193 | |
| | | | | | | | | |
| | | | | Total short-term investments
(cost $14,193) | | $ | 14,193 | |
| | | | | | | | | |
| | | | | Total investments
(cost $223,502) (C) | | | 103.3 | % | | $ | 216,014 | |
| | | | | Other assets and liabilities | | | (3.3 | )% | | | (6,889 | ) |
| | | | | | | | | | | | | |
| | | | | Total net assets | | | 100.0 | % | | $ | 209,125 | |
| | | | | | | | | | | | | |
| |
| Note: | Percentage of investments as shown is the ratio of the total market value to total net assets. |
| | |
| (C) | | At April 30, 2008, the cost of securities for federal income tax purposes was $223,502 and the aggregate gross unrealized appreciation and depreciation based on that cost were: |
| | | | | |
| Unrealized Appreciation | | $ | 378 | |
| Unrealized Depreciation | | | (7,866 | ) |
| | | | | |
| Net Unrealized Depreciation | | $ | (7,488 | ) |
| | | | | |
| | |
| # | | This security, or a portion of this security, has been segregated to cover funding requirements on investment transactions settling in the future. |
| |
| (I) | | Securities issued within terms of a private placement memorandum, exempt from registration under Section 144A of the Securities Act of 1933, as amended, and may be sold only to qualified institutional buyers. Pursuant to guidelines adopted by the Board of Directors, these issues are determined to be liquid. The aggregate value of these securities at April 30, 2008, was $7,328, which represents 3.50% of total net assets. |
| |
| (L) | | Variable rate securities; the rate reported is the coupon rate in effect at April 30, 2008. |
| |
| (Q) | | The cost of securities purchased on a when-issued or delayed delivery basis at April 30, 2008 was $12,676. |
| |
| (H) | | The following securities are considered illiquid. Illiquid securities are often purchased in private placement transactions, are not registered under the Securities Act of 1933 and may have contractual restrictions on resale. A security may also be considered illiquid if the security lacks a readily available market or if its valuation has not changed for a certain period of time. |
| | | | | | | | | | | |
Period
| | | | | | | | |
Acquired | | Shares/Par | | | Security | | Cost Basis | |
| 09/2007 | | | 1,000 | | | Belleville, IL, Tax Increment, 5.70%, 05/01/2036 | | $ | 994 | |
| 05/2007 | | | 100 | | | California Statewide Community DA, Valleycare Health System, 5.13%, 07/15/2031 | | | 100 | |
| 06/2007 | | | 500 | | | Colorado Educational & Cultural FA Rev, Charter School-Windsor Academy Proj, 5.70%,
05/01/2037 - 144A | | | 500 | |
| 11/2007 | | | 265 | | | Estrella Mountain Ranch Community GO, 6.20%, 07/15/2032 | | | 265 | |
| 08/2007 | | | 1,000 | | | Jacksonville, FL, Econ Development Community Health Care Facilities, 6.25%, 09/01/2027 | | | 1,011 | |
| 07/2007 | | | 500 | | | Louisiana Public Fac Auth, Susla Fac Inc, 5.75%, 07/01/2039 - 144A | | | 504 | |
| 06/2007 | | | 500 | | | Millsboro, DE, Special Obligation Plantation Lakes Special Development, 5.45%, 07/01/2036 | | | 500 | |
| 12/2007 | | | 1,000 | | | Montecito Estates Public Improvement Rev, 7.00%, 10/01/2037 | | | 1,000 | |
| 06/2007 | | | 500 | | | North Range, CO, Metropolitan Dist #2, 5.50%, 12/15/2027 | | | 499 | |
| 06/2007 | | | 200 | | | Orange County, FL, Health Care FA Rev, 5.50%, 07/01/2038 | | | 195 | |
| 11/2007 | | | 790 | | | Rochester, MN, Health Care Fac Rev, 5.70%, 05/01/2022 | | | 790 | |
| 05/2007 | | | 200 | | | Show Low Bluff, AZ, Community Fac Dist Special Assessment, 5.60%, 07/01/2031 - 144A | | | 200 | |
| 09/2007 | | | 1,000 | | | Tartesso West Community Facilities Dist, 5.90%, 07/15/2032 | | | 1,000 | |
| 11/2007 | | | 1,600 | | | Washington State Health Care FA Rev, 6.13%, 08/15/2037 | | | 1,573 | |
| 08/2007 | | | 600 | | | Wisconsin State Health & Educational Fac Auth, Wellington Homes Wis LLC, 6.75%, 09/01/2037 | | | 600 | |
| | |
| | The aggregate value of these securities at April 30, 2008 was $8,897 which represents 4.25% of total net assets. |
| |
| (W) | | See Note 2b of accompanying Notes to Financial Statements regarding valuation of securities. |
| | | |
| AMT | | — Alternative Minimum Tax |
| DA | | — Development Authority |
| FA | | — Finance Authority |
| GO | | — General Obligations |
| IDA | | — Industrial Development Authority Bond |
| PA | | — Port Authority |
The accompanying notes are an integral part of these financial statements.
185
The Hartford Income Allocation Fund
Schedule of Investments
April 30, 2008 (Unaudited)
(000’s Omitted)
| | | | | | | | | | | | | |
| | | | | | | | | Market
| |
| Shares | | | | | | | | Value (W) | |
| AFFILIATED INVESTMENT COMPANIES — 97.6% |
| FIXED INCOME FUNDS — 95.6% |
| | 385 | | | The Hartford Floating Rate Fund, Class Y | | $ | 3,504 | |
| | 848 | | | The Hartford High Yield Fund, Class Y | | | 6,323 | |
| | 884 | | | The Hartford Income Fund, Class Y | | | 8,712 | |
| | 1,412 | | | The Hartford Inflation Plus Fund, Class Y | | | 15,845 | |
| | 1,411 | | | The Hartford Short Duration Fund, Class Y | | | 13,457 | |
| | 296 | | | The Hartford Strategic Income Fund, Class Y | | | 2,816 | |
| | 811 | | | The Hartford Total Return Bond Fund, Class Y | | | 8,563 | |
| | | | | | | | | |
| | | | | Total fixed income funds
(cost $59,884) | | $ | 59,220 | |
| | | | | | | | | | | | | |
| | | | | | | | | | | | | |
| MONEY MARKET FUNDS — 2.0% |
| | 1,275 | | | The Hartford Money Market Fund, Class Y | | $ | 1,275 | |
| | | | | | | | | |
| | | | | Total money market funds
(cost $1,275) | | $ | 1,275 | |
| | | | | | | | | |
| | | | | Total investments in affiliated investment companies
(cost $61,159) | | $ | 60,495 | |
| | | | | | | | | | | | | |
| | | | | | | | | | | | | |
| EXCHANGE TRADED FUNDS — 1.8% |
| | 43 | | | Powershares Emerging Markets Sovereign Debt Portfolio ETF | | $ | 1,116 | |
| | | | | | | | | |
| | | | | Total investments in exchange traded funds
(cost $1,121) | | $ | 1,116 | |
| | | | | | | | | |
| | | | | Total long-term investments
(cost $62,280) | | $ | 61,611 | |
| | | | | | | | | | | | | |
| | | | | | | | | | | | | |
| SHORT-TERM INVESTMENTS — 0.0% |
| | 5 | | | State Street Bank Money Market Fund | | $ | 5 | |
| | | | | | | | | |
| | | | | Total investments in short-term investments
(cost $5) | | $ | 5 | |
| | | | | | | | | |
| | | | | Total investments
(cost $62,285) (C) | | | 99.4 | % | | $ | 61,616 | |
| | | | | Other assets and liabilities | | | 0.6 | % | | | 346 | |
| | | | | | | | | | | | | |
| | | | | Total net assets | | | 100.0 | % | | $ | 61,962 | |
| | | | | | | | | | | | | |
| |
| Note: | Percentage of investments as shown is the ratio of the total market value to total net assets. |
| | |
| (C) | | At April 30, 2008, the cost of securities for federal income tax purposes was $62,818 and the aggregate gross unrealized appreciation and depreciation based on that cost were: |
| | | | | |
| Unrealized Appreciation | | $ | 254 | |
| Unrealized Depreciation | | | (1,456 | ) |
| | | | | |
| Net Unrealized Depreciation | | $ | (1,202 | ) |
| | | | | |
| | |
| (W) | | See Note 2b of accompanying Notes to Financial Statements regarding valuation of securities. |
The accompanying notes are an integral part of these financial statements.
186
The Hartford Income Fund
Schedule of Investments
April 30, 2008 (Unaudited)
(000’s Omitted)
| | | | | | | | | | | | | |
Principal
| | | | | | | | Market
| |
Amount | | | | | | | | Value (W) | |
| ASSET & COMMERCIAL MORTGAGE BACKED SECURITIES — 10.8% |
| | | | | Finance — 10.8% |
| | | | | Banc of America Commercial Mortgage, Inc. | | | | |
| $ | 25,553 | | | 5.50%, 11/10/2039 — 07/10/2043 (H)(N) | | $ | 265 | |
| | 7,314 | | | 5.75%, 06/10/2039 (H)(N) | | | 45 | |
| | | | | Bayview Commercial Asset Trust | | | | |
| | 200 | | | 3.26%, 04/25/2036 (H)(L) | | | 151 | |
| | 5,600 | | | 7.00%, 07/25/2037 (H)(N) | | | 627 | |
| | 10,335 | | | 7.50%, 09/25/2037 (H)(N) | | | 1,313 | |
| | | | | Bear Stearns Commercial Mortgage Securities, Inc. | | | | |
| | 1,650 | | | 5.15%, 10/12/2042 (L) | | | 1,634 | |
| | 1,700 | | | 5.33%, 02/11/2044 | | | 1,641 | |
| | 3,026 | | | 5.50%, 02/11/2041 (H)(N) | | | 44 | |
| | | | | Capital Automotive Receivables Asset Trust | | | | |
| | 50 | | | 5.77%, 05/20/2010 (H) | | | 49 | |
| | | | | Capital One Automotive Finance Trust | | | | |
| | 103 | | | 4.32%, 05/15/2010 | | | 103 | |
| | | | | CBA Commercial Small Balance Commercial Mortgage | | | | |
| | 5,417 | | | 7.00%, 07/25/2035 — 06/25/2038 (H)(N) | | | 442 | |
| | 6,727 | | | 9.75%, 01/25/2039 (H)(N) | | | 656 | |
| | | | | Citigroup Mortgage Loan Trust, Inc. | | | | |
| | 200 | | | 5.39%, 01/25/2037 (H)(L) | | | 16 | |
| | | | | Citigroup/Deutsche Bank Commercial Mortgage Trust | | | | |
| | 2,000 | | | 5.48%, 12/11/2049 (H)(L) | | | 1,416 | |
| | | | | Commercial Mortgage Pass-Through Certificates | | | | |
| | 6,043 | | | 5.50%, 03/10/2039 (H)(N) | | | 107 | |
| | | | | Countrywide Asset-Backed Certificates | | | | |
| | 48 | | | 5.46%, 07/25/2035 | | | 36 | |
| | | | | Credit-Based Asset Servicing and Securitization | | | | |
| | 214 | | | 3.17%, 05/25/2036 (H)(L) | | | 169 | |
| | | | | CW Capital Cobalt | | | | |
| | 825 | | | 5.48%, 04/15/2047 | | | 801 | |
| | | | | Equity One ABS, Inc. | | | | |
| | 6 | | | 5.39%, 07/25/2034 (H)(L) | | | 5 | |
| | 30 | | | 5.46%, 12/25/2033 | | | 25 | |
| | | | | Ford Credit Automotive Owner Trust | | | | |
| | 600 | | | 4.28%, 05/15/2012 | | | 598 | |
| | | | | GE Business Loan Trust | | | | |
| | 11,031 | | | 6.14%, 05/15/2034 (H)(N) | | | 67 | |
| | | | | GE Capital Commercial Mortgage Corp. | | | | |
| | 1,000 | | | 5.34%, 03/10/2044 (L) | | | 859 | |
| | 54,801 | | | 6.35%, 11/10/2045 (I) (N) | | | 77 | |
| | | | | GMAC Commercial Mortgage Securities, Inc. | | | | |
| | 2,020 | | | 4.86%, 12/10/2041 | | | 1,979 | |
| | 200 | | | 5.30%, 08/10/2038 | | | 201 | |
| | | | | GMAC Mortgage Corp. Loan Trust | | | | |
| | 270 | | | 5.75%, 10/25/2036 | | | 192 | |
| | | | | Green Tree Financial Corp. | | | | |
| | 15 | | | 6.48%, 12/01/2030 | | | 16 | |
| | 8 | | | 7.30%, 01/15/2026 | | | 8 | |
| | 11 | | | 7.35%, 05/15/2027 | | | 11 | |
| | | | | Greenwich Capital Commercial Funding Corp. | | | | |
| | 199 | | | 3.94%, 11/05/2021 (H)(L) | | | 173 | |
| | 190 | | | 4.14%, 11/05/2021 (H)(L) | | | 164 | |
| | 1,550 | | | 5.74%, 12/10/2049 (L) | | | 1,531 | |
| | | | | GS Mortgage Securities Corp. | | | | |
| | 2,350 | | | 5.70%, 12/20/2049 (H)(L) | | | 807 | |
| | | | | JP Morgan Automotive Receivable Trust | | | | |
| | 75 | | | 12.85%, 03/15/2012 (A)(H) | | | 45 | |
| | | | | JP Morgan Chase Commercial Mortgage Security Corp. | | | | |
| | 789 | | | 3.47%, 02/15/2020 (H)(L) | | | 673 | |
| | 502 | | | 5.47%, 04/15/2043 (L) | | | 496 | |
| | 2,270 | | | 5.50%, 01/15/2038 (H)(N) | | | 53 | |
| | 250 | | | 5.53%, 12/12/2044 (L) | | | 179 | |
| | 2,030 | | | 5.72%, 02/15/2051 | | | 1,991 | |
| | 1,700 | | | 5.75%, 02/12/2049 (L) | | | 1,688 | |
| | 17,150 | | | 6.00%, 09/12/2037 (H)(N) | | | 138 | |
| | 1,690 | | | 6.07%, 02/12/2051 (Q) | | | 1,698 | |
| | 190 | | | 6.16%, 05/12/2034 (H) | | | 196 | |
| | 830 | | | 6.20%, 02/12/2051 (I)(L) | | | 637 | |
| | | | | LB-UBS Commercial Mortgage Trust | | | | |
| | 25,056 | | | 5.26%, 06/15/2036 (H)(N) | | | 74 | |
| | 250 | | | 5.45%, 11/15/2038 (L) | | | 194 | |
| | 650 | | | 5.48%, 11/15/2038 (L) | | | 489 | |
| | | | | Lehman Brothers Commercial Mortgage Trust | | | | |
| | 200 | | | 3.52%, 07/15/2018 (H)(L) | | | 177 | |
| | | | | Lehman Brothers Small Balance Commercial | | | | |
| | 120 | | | 5.62%, 09/25/2036 (I) | | | 112 | |
| | | | | LNR CDO Ltd. | | | | |
| | 250 | | | 3.74%, 05/28/2043 (H)(L) | | | 62 | |
| | | | | Long Beach Asset Holdings Corp. | | | | |
| | 45 | | | 5.78%, 04/25/2046 (H) | | | — | |
| | | | | Marathon Real Estate CDO Ltd. | | | | |
| | 1,000 | | | 4.30%, 05/25/2046 (H)(L) | | | 545 | |
| | | | | Marlin Leasing Receivables LLC | | | | |
| | 440 | | | 5.33%, 09/16/2013 (I) | | | 446 | |
| | | | | Merrill Lynch Floating Trust | | | | |
| | 1,000 | | | 3.27%, 06/15/2022 (H)(L) | | | 790 | |
| | | | | Morgan Stanley Capital I | | | | |
| | 2,000 | | | 5.15%, 08/13/2042 (L) | | | 1,754 | |
| | 1,000 | | | 5.78%, 10/15/2042 (L) | | | 717 | |
| | 16,110 | | | 6.00%, 06/12/2047 (H)(N) | | | 161 | |
| | | | | Morgan Stanley Dean Witter Capital I | | | | |
| | 2,000 | | | 5.36%, 03/15/2044 | | | 1,930 | |
| | | | | Nationstar Home Equity Loan Trust | | | | |
| | 37 | | | 9.97%, 03/25/2037 (H)(L) | | | 28 | |
| | | | | Option One Mortgage Loan Trust Class M6 | | | | |
| | 725 | | | 6.99%, 03/25/2037 (H) | | | 104 | |
| | | | | Option One Mortgage Loan Trust Class M7 | | | | |
| | 500 | | | 6.99%, 03/25/2037 (H) | | | 70 | |
| | | | | Option One Mortgage Loan Trust Class M8 | | | | |
| | 475 | | | 6.99%, 03/25/2037 (H) | | | 57 | |
| | | | | PSE&G Transition Funding LLC | | | | |
| | 70 | | | 6.61%, 06/15/2015 | | | 75 | |
| | | | | Renaissance Home Equity Loan Trust | | | | |
| | 80 | | | 5.75%, 05/25/2036 (H)(L) | | | 62 | |
| | 200 | | | 6.16%, 05/25/2036 (H) | | | 89 | |
| | | | | Renaissance Home Equity Loan Trust Class M5 | | | | |
| | 600 | | | 7.00%, 09/25/2037 (H) | | | 146 | |
| | | | | Renaissance Home Equity Loan Trust Class M8 | | | | |
| | 750 | | | 7.00%, 09/25/2037 (H) | | | 125 | |
| | | | | USAA Automotive Owner Trust | | | | |
| | 845 | | | 5.36%, 06/15/2012 | | | 859 | |
| | | | | Wachovia Automotive Loan Owner Trust | | | | |
| | 250 | | | 5.15%, 07/20/2012 (H) | | | 247 | |
| | 260 | | | 5.29%, 06/20/2012 (I) | | | 257 | |
The accompanying notes are an integral part of these financial statements.
187
The Hartford Income Fund
Schedule of Investments — (continued)
April 30, 2008 (Unaudited)
(000’s Omitted)
| | | | | | | | | | | | | |
Principal
| | | | | | | | Market
| |
Amount | | | | | | | | Value (W) | |
| ASSET & COMMERCIAL MORTGAGE BACKED SECURITIES — (continued) |
| | | | | Finance — (continued) |
| | | | | Wachovia Bank Commercial Mortgage Trust | | | | |
| $ | 6,774 | | | 5.50%, 02/15/2041 (H)(N) | | $ | 129 | |
| | 2,010 | | | 5.93%, 06/15/2049 (L) | | | 1,992 | |
| | | | | Wamu Commercial Mortgage Securities Trust | | | | |
| | 1,220 | | | 6.31%, 03/23/2045 (I)(L) | | | 694 | |
| | | | | Wells Fargo Alternative Loan Trust | | | | |
| | 1,000 | | | 6.25%, 11/25/2037 | | | 874 | |
| | | | | | | | | |
| | | | | | | | | | | | 37,281 | |
| | | | | | | | | | | | | |
| | | | | Utilities — 0.0% |
| | | | | Detroit Edison Securitization | | | | |
| | 75 | | | 6.19%, 03/01/2013 | | | 78 | |
| | | | | | | | | |
| | | | | Total asset & commercial
mortgage backed securities
(cost $44,481) | | $ | 37,359 | |
| | | | | | | | | | | | | |
| | | | | | | | | | | | | |
| CORPORATE BONDS: INVESTMENT GRADE — 27.8% |
| | | | | Basic Materials — 0.7% |
| | | | | Kimberly-Clark Corp. | | | | |
| $ | 1,000 | | | 6.13%, 08/01/2017 (G) | | $ | 1,070 | |
| | 1,120 | | | 6.63%, 08/01/2037 | | | 1,221 | |
| | | | | | | | | |
| | | | | | | | | | | | 2,291 | |
| | | | | | | | | | | | | |
| | | | | Capital Goods — 0.1% |
| | | | | Hutchison Whampoa International Ltd. | | | | |
| | 200 | | | 6.25%, 01/24/2014 (I)# | | | 208 | |
| | | | | Consumer Cyclical — 0.1% |
| | | | | Safeway, Inc. | | | | |
| | 445 | | | 5.80%, 08/15/2012 (G) | | | 462 | |
| | | | | Consumer Staples — 0.8% |
| | | | | Diageo Finance B.V. | | | | |
| | 800 | | | 5.50%, 04/01/2013 | | | 828 | |
| | | | | Dr. Pepper Snapple Group | | | | |
| | 882 | | | 6.82%, 05/01/2018 (I) | | | 915 | |
| | | | | General Mills, Inc. | | | | |
| | 990 | | | 5.65%, 09/10/2012 | | | 1,019 | |
| | | | | | | | | |
| | | | | | | | | | | | 2,762 | |
| | | | | | | | | | | | | |
| | | | | Energy — 0.8% |
| | | | | Gaz Capital S.A. | | | | |
| | 250 | | | 7.34%, 04/11/2013 (I) | | | 262 | |
| | | | | Ras Laffan Liquefied Natural Gas Co., Ltd. | | | | |
| | 1,500 | | | 5.30%, 09/30/2020 (I) | | | 1,388 | |
| | | | | Sempra Energy | | | | |
| | 530 | | | 6.00%, 02/01/2013 | | | 552 | |
| | | | | TNK-BP Finance S.A. | | | | |
| | 505 | | | 7.50%, 03/13/2013 — 07/18/2016 (I) | | | 496 | |
| | | | | | | | | |
| | | | | | | | | | | | 2,698 | |
| | | | | | | | | | | | | |
| | | | | Finance — 15.7% |
| | | | | ABX Financing Co. | | | | |
| | 680 | | | 6.35%, 10/15/2036 (I) | | | 639 | |
| | | | | Ace INA Holdings, Inc. | | | | |
| | 125 | | | 5.88%, 06/15/2014 # | | | 129 | |
| | | | | Aetna, Inc. | | | | |
| | 245 | | | 6.00%, 06/15/2016 (G) | | | 245 | |
| | 880 | | | 6.63%, 06/15/2036 (G) | | | 851 | |
| | | | | American Express Co. | | | | |
| | 1,360 | | | 8.15%, 03/19/2038 | | | 1,582 | |
| | | | | American Real Estate Partners L.P. | | | | |
| | 685 | | | 7.13%, 02/15/2013 | | | 639 | |
| | | | | Arden Realty L.P. | | | | |
| | 150 | | | 5.20%, 09/01/2011 # | | | 152 | |
| | | | | Bank of America Corp. | | | | |
| | 2,639 | | | 8.00%, 12/29/2049 (L) | | | 2,685 | |
| | 731 | | | 8.13%, 12/29/2049 | | | 747 | |
| | | | | Barclays Bank plc | | | | |
| | 912 | | | 7.70%, 10/25/2049 (I)(L) | | | 944 | |
| | | | | BB&T Capital Trust IV | | | | |
| | 353 | | | 6.82%, 06/12/2057 (L)# | | | 310 | |
| | | | | CIT Group, Inc. | | | | |
| | 865 | | | 6.10%, 03/15/2067 (L)# | | | 452 | |
| | | | | Citigroup, Inc. | | | | |
| | 2,072 | | | 8.30%, 12/21/2057 (L) | | | 2,115 | |
| | 1,701 | | | 8.40%, 12/31/2049 (L) | | | 1,722 | |
| | | | | Comerica Capital Trust II | | | | |
| | 1,827 | | | 6.58%, 02/20/2037 (L)# | | | 1,250 | |
| | | | | Countrywide Financial Corp. | | | | |
| | 22 | | | 4.50%, 06/15/2010 | | | 20 | |
| | 183 | | | 5.80%, 06/07/2012 | | | 174 | |
| | 1,705 | | | 6.25%, 05/15/2016 | | | 1,500 | |
| | | | | Countrywide Home Loans, Inc. | | | | |
| | 370 | | | 4.00%, 03/22/2011 | | | 339 | |
| | 691 | | | 4.13%, 09/15/2009 | | | 645 | |
| | 82 | | | 6.25%, 04/15/2009 (G) | | | 78 | |
| | | | | Credit Agricole | | | | |
| | 1,975 | | | 6.64%, 05/31/2049 (I)(L) | | | 1,619 | |
| | | | | Credit Suisse First Boston USA, Inc. | | | | |
| | 350 | | | 6.50%, 01/15/2012 | | | 368 | |
| | | | | Credit Suisse New York | | | | |
| | 894 | | | 6.00%, 02/15/2018 | | | 906 | |
| | | | | Deutsche Bank Capital Funding Trust | | | | |
| | 90 | | | 5.63%, 01/31/2049 (I)# | | | 76 | |
| | | | | Fifth Third Bankcorp | | | | |
| | 2,375 | | | 8.25%, 03/01/2038 | | | 2,509 | |
| | | | | Financial Security Assurance Holdings | | | | |
| | 1,193 | | | 6.40%, 12/15/2066 (I)(L)# | | | 864 | |
| | | | | General Electric Capital Corp. | | | | |
| | 840 | | | 5.63%, 05/01/2018 | | | 849 | |
| | | | | Goldman Sachs Capital Trust II | | | | |
| | 2,200 | | | 5.79%, 12/29/2049 (L)# | | | 1,660 | |
| | | | | Goldman Sachs Group, Inc. | | | | |
| | 125 | | | 5.15%, 01/15/2014 # | | | 121 | |
| | | | | HBOS plc | | | | |
| | 500 | | | 5.92%, 07/29/2049 (I)# | | | 382 | |
| | | | | HSBK Europe B.V. | | | | |
| | 250 | | | 7.25%, 05/03/2017 (I)# | | | 219 | |
| | | | | ILFC E-Capital Trust II | | | | |
| | 4,410 | | | 6.25%, 12/21/2065 (I)(L)# | | | 3,915 | |
| | | | | International Lease Finance Corp. | | | | |
| | 1,700 | | | 6.38%, 03/25/2013 | | | 1,723 | |
| | | | | Janus Capital Group, Inc. | | | | |
| | 1,105 | | | 6.70%, 06/15/2017 # | | | 1,053 | |
| | | | | JP Morgan Chase & Co. | | | | |
| | 3,074 | | | 7.90%, 12/01/2049 | | | 3,131 | |
| | | | | Kuzneski (Bank of Moscow) | | | | |
| | 200 | | | 7.50%, 11/25/2015 (L) | | | 198 | |
The accompanying notes are an integral part of these financial statements.
188
| | | | | | | | | | | | | |
Principal
| | | | | | | | Market
| |
| Amount (W) | | | | | | | | Value (W) | |
| |
| | | | | | | | | | | | | |
| CORPORATE BONDS: INVESTMENT GRADE — (continued) |
| | | | | | | | | | | | | |
| | | | | Finance — (continued) |
| | | | | Lehman Brothers Holdings, Inc. | | | | |
| $ | 600 | | | 7.00%, 09/27/2027 | | $ | 588 | |
| | | | | Lincoln National Corp. | | | | |
| | 1,026 | | | 6.05%, 04/20/2067 | | | 881 | |
| | | | | Mellon Capital IV | | | | |
| | 764 | | | 6.24%, 06/20/2049 (L) | | | 632 | |
| | | | | Merrill Lynch & Co., Inc. | | | | |
| | 670 | | | 5.45%, 02/05/2013 | | | 652 | |
| | 680 | | | 6.22%, 09/15/2026 | | | 604 | |
| | | | | Natexis AMBS Co. LLC | | | | |
| | 100 | | | 8.44%, 12/29/2049 (I) | | | 101 | |
| | | | | National City Corp. | | | | |
| | 1,551 | | | 12.00%, 12/29/2049 | | | 1,530 | |
| | | | | Northgroup Preferred Capital Corp. | | | | |
| | 638 | | | 6.38%, 10/15/2049 (H)(L) | | | 443 | |
| | | | | PNC Preferred Funding Trust II | | | | |
| | 500 | | | 6.11%, 03/15/2049 (I)(L) | | | 351 | |
| | | | | Progressive Corp. | | | | |
| | 925 | | | 6.70%, 06/15/2037 (L) | | | 827 | |
| | | | | RBS Capital Trust IV | | | | |
| | 3,350 | | | 3.50%, 09/29/2049 (L) | | | 2,597 | |
| | | | | RSHB Capital | | | | |
| | 570 | | | 6.97%, 09/21/2016 (L) | | | 553 | |
| | | | | Shurgard Storage Centers, Inc. | | | | |
| | 75 | | | 5.88%, 03/15/2013 # | | | 74 | |
| | | | | State Street Capital Trust III | | | | |
| | 560 | | | 8.25%, 12/29/2049 (L) | | | 572 | |
| | | | | State Street Capital Trust IV | | | | |
| | 735 | | | 3.80%, 06/15/2037 (L) | | | 558 | |
| | | | | Unicredito Italiano Capital Trust | | | | |
| | 700 | | | 9.20%, 10/29/2049 (I) | | | 714 | |
| | | | | UnitedHealth Group, Inc. | | | | |
| | 1,251 | | | 4.88%, 02/15/2013 | | | 1,195 | |
| | | | | US Bank Realty Corp. | | | | |
| | 725 | | | 6.09%, 12/22/2049 (I)(L) | | | 533 | |
| | | | | Wachovia Capital Trust III | | | | |
| | 1,060 | | | 5.80%, 08/29/2049 | | | 843 | |
| | | | | Wachovia Corp. | | | | |
| | 1,511 | | | 7.98%, 02/28/2049 (L) | | | 1,487 | |
| | | | | Westfield Group | | | | |
| | 740 | | | 5.70%, 10/01/2016 (I) | | | 702 | |
| | | | | Westpac Capital Trust IV | | | | |
| | 100 | | | 5.26%, 12/29/2049 (I) | | | 78 | |
| | | | | ZFS Finance USA Trust I | | | | |
| | 721 | | | 6.50%, 05/09/2037 (I)(L) | | | 635 | |
| | | | | | | | | |
| | | | | | | | | | | | 53,961 | |
| | | | | | | | | | | | | |
| | | | | Foreign Governments — 2.7% |
| | | | | Bundesrepublic Deutschland | | | | |
| EUR | 4,495 | | | 4.50%, 01/04/2013 | | | 7,188 | |
| | | | | El Salvador (Republic of) | | | | |
| | 470 | | | 7.65%, 06/15/2035 (K) | | | 503 | |
| | | | | New Zealand Government | | | | |
| NZD | 2,140 | | | 6.00%, 07/15/2008 | | | 1,666 | |
| | | | | | | | | |
| | | | | | | | | | | | 9,357 | |
| | | | | | | | | | | | | |
| | | | | Health Care — 0.7% |
| | | | | Covidien International | | | | |
| | 519 | | | 5.45%, 10/15/2012 (I) | | | 523 | |
| | | | | CVS Caremark Corp. | | | | |
| | 1,500 | | | 6.30%, 06/01/2037 (L) | | | 1,283 | |
| | | | | Wyeth | | | | |
| | 465 | | | 5.95%, 04/01/2037 | | | 461 | |
| | | | | | | | | |
| | | | | | | | | | | | 2,267 | |
| | | | | | | | | | | | | |
| | | | | Services — 1.3% |
| | | | | Clear Channel Communications, Inc. | | | | |
| | 825 | | | 7.65%, 09/15/2010 | | | 858 | |
| | | | | Comcast Corp. | | | | |
| | 516 | | | 6.30%, 11/15/2017 | | | 536 | |
| | | | | Time Warner Entertainment Co., L.P. | | | | |
| | 410 | | | 8.38%, 07/15/2033 # | | | 477 | |
| | | | | Viacom, Inc. | | | | |
| | 500 | | | 6.88%, 04/30/2036 | | | 501 | |
| | | | | Walt Disney Co. | | | | |
| | 1,000 | | | 6.00%, 07/17/2017 | | | 1,067 | |
| | | | | Waste Management, Inc. | | | | |
| | 1,235 | | | 6.10%, 03/15/2018 | | | 1,238 | |
| | | | | | | | | |
| | | | | | | | | | | | 4,677 | |
| | | | | | | | | | | | | |
| | | | | Technology — 2.5% |
| | | | | Agilent Technologies, Inc. | | | | |
| | 744 | | | 6.50%, 11/01/2017 | | | 738 | |
| | | | | AT&T Corp. | | | | |
| | 480 | | | 8.00%, 11/15/2031 | | | 577 | |
| | | | | Cingular Wireless Services, Inc. | | | | |
| | 210 | | | 8.13%, 05/01/2012 # | | | 233 | |
| | 455 | | | 8.75%, 03/01/2031 | | | 560 | |
| | | | | Deutsche Telekom International Finance B.V. | | | | |
| | 850 | | | 5.25%, 07/22/2013 (G) | | | 852 | |
| | | | | France Telecom S.A. | | | | |
| | 150 | | | 7.75%, 03/01/2011 (L)# | | | 162 | |
| | | | | Motorola, Inc. | | | | |
| | 150 | | | 8.00%, 11/01/2011 | | | 153 | |
| | | | | Oracle Corp. | | | | |
| | 699 | | | 6.50%, 04/15/2038 | | | 723 | |
| | | | | Sprint Capital Corp. | | | | |
| | 1,220 | | | 8.75%, 03/15/2032 | | | 1,077 | |
| | | | | Tyco Electronics Group S.A. | | | | |
| | 727 | | | 6.00%, 10/01/2012 (I) | | | 741 | |
| | 763 | | | 6.55%, 10/01/2017 (I) | | | 781 | |
| | | | | Verizon Communications, Inc. | | | | |
| | 1,000 | | | 5.50%, 02/15/2018 | | | 1,003 | |
| | | | | Vodafone Group plc | | | | |
| | 1,166 | | | 6.15%, 02/27/2037 # | | | 1,149 | |
| | | | | | | | | |
| | | | | | | | | | | | 8,749 | |
| | | | | | | | | | | | | |
| | | | | Transportation — 0.8% |
| | | | | American Airlines, Inc. | | | | |
| | 1,475 | | | 7.86%, 10/01/2011 # | | | 1,475 | |
| | | | | Carnival Corp. | | | | |
| | 110 | | | 6.65%, 01/15/2028 # | | | 109 | |
| | | | | Continental Airlines, Inc. | | | | |
| | 100 | | | 6.56%, 02/15/2012 # | | | 99 | |
| | 77 | | | 6.80%, 08/02/2018 | | | 70 | |
| | 100 | | | 7.49%, 10/02/2010 | | | 99 | |
| | | | | Norfolk Southern Corp. | | | | |
| | 755 | | | 5.75%, 04/01/2018 (I) | | | 766 | |
| | | | | | | | | |
| | | | | | | | | | | | 2,618 | |
| | | | | | | | | | | | | |
The accompanying notes are an integral part of these financial statements.
189
The Hartford Income Fund
Schedule of Investments — (continued)
April 30, 2008 (Unaudited)
(000’s Omitted)
| | | | | | | | | | | | | |
Principal
| | | | | | | | Market
| |
| Amount | | | | | | | | Value (W) | |
| |
| | | | | | | | | | | | | |
| CORPORATE BONDS: INVESTMENT GRADE — (continued) |
| | | | | Utilities — 1.6% |
| | | | | CenterPoint Energy Resources Corp. | | | | |
| $ | 207 | | | 6.63%, 11/01/2037 | | $ | 200 | |
| | | | | Commonwealth Edison Co. | | | | |
| | 405 | | | 5.80%, 03/15/2018 | | | 405 | |
| | | | | Florida Power Corp. | | | | |
| | 296 | | | 5.80%, 09/15/2017 | | | 310 | |
| | | | | Kinder Morgan Energy Partners L.P. | | | | |
| | 230 | | | 6.50%, 02/01/2037 # | | | 220 | |
| | | | | NGPL Pipeco LLC | | | | |
| | 1,024 | | | 6.51%, 12/15/2012 (I) | | | 1,055 | |
| | | | | Northern States Power Co. | | | | |
| | 400 | | | 6.25%, 06/01/2036 (G) | | | 415 | |
| | | | | Taqa Abu Dhabi National Energy Co. | | | | |
| | 1,325 | | | 5.62%, 10/25/2012 (I) | | | 1,345 | |
| | | | | Tennessee Gas Pipeline Co. | | | | |
| | 100 | | | 8.38%, 06/15/2032 | | | 115 | |
| | | | | TransCanada Pipelines Ltd. | | | | |
| | 576 | | | 6.20%, 10/15/2037 | | | 553 | |
| | | | | Virginia Electric & Power Co. | | | | |
| | 1,000 | | | 5.95%, 09/15/2017 | | | 1,028 | |
| | | | | | | | | |
| | | | | | | | | | | | 5,646 | |
| | | | | | | | | | | | | |
| | | | | Total corporate bonds: investment grade
(cost $98,269) | | $ | 95,696 | |
| | | | | | | | | | | | | |
| | | | | | | | | | | | | |
| CORPORATE BONDS: NON-INVESTMENT GRADE — 9.7% |
| | | | | Basic Materials — 0.6% |
| | | | | Bowater, Inc. | | | | |
| $ | 225 | | | 5.80%, 03/15/2010 (L)# | | $ | 152 | |
| | | | | Evraz Group S.A. | | | | |
| | 240 | | | 8.25%, 11/10/2015 (K) | | | 234 | |
| | 200 | | | 8.88%, 04/24/2013 (I) | | | 202 | |
| | | | | Graham Packaging Co., Inc. | | | | |
| | 350 | | | 9.88%, 10/15/2014 (G) | | | 329 | |
| | | | | Huntsman International LLC | | | | |
| | 100 | | | 7.88%, 11/15/2014 | | | 106 | |
| | | | | Momentive Performance | | | | |
| | 645 | | | 9.75%, 12/01/2014 (G) | | | 626 | |
| | | | | Vitro S.A. | | | | |
| | 424 | | | 8.63%, 02/01/2012 (G) | | | 394 | |
| | | | | | | | | |
| | | | | | | | | | | | 2,043 | |
| | | | | | | | | | | | | |
| | | | | Capital Goods — 0.2% |
| | | | | Bombardier, Inc. | | | | |
| | 450 | | | 6.30%, 05/01/2014 (I)# | | | 450 | |
| | 100 | | | 6.75%, 05/01/2012 (I)# | | | 102 | |
| | | | | | | | | |
| | | | | | | | | | | | 552 | |
| | | | | | | | | | | | | |
| | | | | Consumer Cyclical — 1.0% |
| | | | | American Axle & Manufacturing Holdings, Inc. | | | | |
| | 760 | | | 7.88%, 03/01/2017 | | | 680 | |
| | | | | AutoNation, Inc. | | | | |
| | 150 | | | 4.71%, 04/15/2013 (G)(L) | | | 130 | |
| | | | | Desarrolladora Homes S.A. | | | | |
| | 330 | | | 7.50%, 09/28/2015 (G)(H) | | | 332 | |
| | | | | General Motors Corp. | | | | |
| | 310 | | | 6.38%, 05/01/2008 (G) | | | 310 | |
| | | | | KB Home & Broad Home Corp. | | | | |
| | 200 | | | 6.38%, 08/15/2011 (G) | | | 190 | |
| | | | | Neiman Marcus Group, Inc. | | | | |
| | 630 | | | 10.38%, 10/15/2015 (G) | | | 662 | |
| | | | | Parkson Retail Group Ltd. | | | | |
| | 460 | | | 7.88%, 11/14/2011 (H) | | | 455 | |
| | | | | SGS International, Inc. | | | | |
| | 150 | | | 12.00%, 12/15/2013 (G) | | | 129 | |
| | | | | Stater Brothers Holdings, Inc. | | | | |
| | 105 | | | 8.13%, 06/15/2012 | | | 107 | |
| | | | | Urbi Desarrollos Urbanos | | | | |
| | 430 | | | 8.50%, 04/19/2016 (H) | | | 436 | |
| | | | | | | | | |
| | | | | | | | | | | | 3,431 | |
| | | | | | | | | | | | | |
| | | | | Consumer Staples — 0.2% |
| | | | | MHP S.A. | | | | |
| | 705 | | | 10.25%, 11/30/2011 (H) | | | 687 | |
| | | | | Energy — 0.5% |
| | | | | Chesapeake Energy Corp. | | | | |
| | 140 | | | 6.63%, 01/15/2016 # | | | 140 | |
| | | | | Inergy L.P. | | | | |
| | 150 | | | 8.25%, 03/01/2016 # | | | 154 | |
| | | | | Key Energy Services, Inc. | | | | |
| | 75 | | | 8.38%, 12/01/2014 (I) | | | 78 | |
| | | | | MEI Euro Finance Ltd. | | | | |
| | 160 | | | 8.75%, 05/22/2010 (H) | | | 159 | |
| | | | | Petrohawk Energy Corp. | | | | |
| | 810 | | | 9.13%, 07/15/2013 # | | | 856 | |
| | | | | Petroleos de Venezuela S.A. | | | | |
| | 470 | | | 5.25%, 04/12/2017 | | | 310 | |
| | | | | | | | | |
| | | | | | | | | | | | 1,697 | |
| | | | | | | | | | | | | |
| | | | | Finance — 2.3% |
| | | | | Alfa Bank | | | | |
| | 265 | | | 8.20%, 06/25/2012 (I)# | | | 254 | |
| | | | | Citigroup (JSC Severstal) | | | | |
| | 466 | | | 9.25%, 04/19/2014 (K) | | | 497 | |
| | | | | Dow Jones CDX HY | | | | |
| | 2,129 | | | 7.63%, 06/29/2012 (I) | | | 2,062 | |
| | | | | El Paso Performance-Linked Trust | | | | |
| | 150 | | | 7.75%, 07/15/2011 (I)# | | | 155 | |
| | | | | Ford Motor Credit Co. | | | | |
| | 290 | | | 7.16%, 04/15/2012 (L)# | | | 284 | |
| | 305 | | | 7.38%, 02/01/2011 # | | | 281 | |
| | | | | General Motors Acceptance Corp. | | | | |
| | 330 | | | 5.63%, 05/15/2009 (G) | | | 310 | |
| | 1,885 | | | 6.88%, 09/15/2011 # | | | 1,571 | |
| | | | | Itabo Finance S.A. | | | | |
| | 350 | | | 10.88%, 10/05/2013 (H) | | | 342 | |
| | | | | Kazkommerts International B.V. | | | | |
| | 100 | | | 8.00%, 11/03/2015 (I) | | | 80 | |
| | | | | LPL Holdings, Inc. | | | | |
| | 930 | | | 10.75%, 12/15/2015 (H) | | | 911 | |
| | | | | Northern Rock plc | | | | |
| | 350 | | | 5.60%, 04/30/2049 (I) | | | 204 | |
| | | | | RBS-Zero Hora Editora Journalistica | | | | |
| BRL | 600 | | | 11.25%, 06/15/2017 (H) | | | 285 | |
| | | | | Russian Standard Bank | | | | |
| | 270 | | | 8.63%, 05/05/2011 (K)# | | | 248 | |
| | | | | Standard Bank (Privatbank) | | | | |
| | 250 | | | 8.75%, 02/09/2016 (H) | | | 226 | |
| | | | | TuranAlem Finance B.V. | | | | |
| | 100 | | | 7.75%, 04/25/2013 (K) | | | 85 | |
The accompanying notes are an integral part of these financial statements.
190
| | | | | | | | | | | | | |
Principal
| | | | | | | | Market
| |
| Amount (B) | | | | | | | | Value (W) | |
| |
| | | | | | | | | | | | | |
| CORPORATE BONDS: NON-INVESTMENT GRADE — (continued) |
| | | | | | | | | | | | | |
| | | | | Finance — (continued) |
| | | | | UK SPV Credit Finance (Privatbank) | | | | |
| $ | 300 | | | 8.00%, 02/06/2012 (H) | | $ | 274 | |
| | | | | | | | | |
| | | | | | | | | | | | 8,069 | |
| | | | | | | | | | | | | |
| | | | | Foreign Governments — 0.3% |
| | | | | Brazil (Republic of) | | | | |
| BRL | 940 | | | 10.00%, 01/01/2017 | | | 460 | |
| | | | | Sri Lanka (Republic of) | | | | |
| | 100 | | | 8.25%, 10/24/2012 (H) | | | 92 | |
| | | | | Sri Lanka (Republic of) ADR | | | | |
| | 400 | | | 8.25%, 10/24/2012 (G)(H) | | | 364 | |
| | | | | | | | | |
| | | | | | | | | | | | 916 | |
| | | | | | | | | | | | | |
| | | | | Health Care — 0.2% |
| | | | | HCA, Inc. | | | | |
| | 165 | | | 9.25%, 11/15/2016 | | | 177 | |
| | | | | IASIS Healthcare Capital Corp. | | | | |
| | 490 | | | 8.75%, 06/15/2014 # | | | 502 | |
| | | | | Reable Therapeutics Finance LLC | | | | |
| | 160 | | | 11.75%, 11/15/2014 (G) | | | 148 | |
| | | | | | | | | |
| | | | | | | | | | | | 827 | |
| | | | | | | | | | | | | |
| | | | | Services — 1.2% |
| | | | | Allied Waste North America, Inc. | | | | |
| | 450 | | | 6.88%, 06/01/2017 (G) | | | 450 | |
| | | | | AMC Entertainment, Inc. | | | | |
| | 500 | | | 11.00%, 02/01/2016 | | | 498 | |
| | | | | Belo Corp. | | | | |
| | 175 | | | 7.25%, 09/15/2027 # | | | 152 | |
| | | | | Education Management LLC | | | | |
| | 500 | | | 10.25%, 06/01/2016 (G) | | | 420 | |
| | | | | Harrah’s Operating Co., Inc. | | | | |
| | 645 | | | 10.75%, 02/01/2016 — 02/01/2018 (G)(I) | | | 545 | |
| | | | | Idearc, Inc. | | | | |
| | 500 | | | 8.00%, 11/15/2016 (G) | | | 325 | |
| | | | | MGM Mirage, Inc. | | | | |
| | 325 | | | 6.75%, 04/01/2013 | | | 299 | |
| | 550 | | | 7.50%, 06/01/2016 | | | 498 | |
| | | | | Sheridan Group, Inc. | | | | |
| | 150 | | | 10.25%, 08/15/2011 | | | 138 | |
| | | | | Sirius Satellite Radio, Inc. | | | | |
| | 550 | | | 9.63%, 08/01/2013 | | | 463 | |
| | | | | SunGard Data Systems, Inc. | | | | |
| | 450 | | | 10.25%, 08/15/2015 (G) | | | 478 | |
| | | | | Videotron Ltd. | | | | |
| | 50 | | | 9.13%, 04/15/2018 (I) | | | 53 | |
| | | | | | | | | |
| | | | | | | | | | | | 4,319 | |
| | | | | | | | | | | | | |
| | | | | Technology — 2.5% |
| | | | | Advanced Micro Devices, Inc. | | | | |
| | 775 | | | 5.75%, 08/15/2012 (G)(X) | | | 566 | |
| | 470 | | | 6.00%, 05/01/2015 (I)(X)# | | | 297 | |
| | | | | Canwest MediaWorks L.P. | | | | |
| | 400 | | | 9.25%, 08/01/2015 (I)# | | | 365 | |
| | | | | Charter Communications Operating LLC | | | | |
| | 830 | | | 8.00%, 04/30/2012 (I)# | | | 801 | |
| | | | | Citizens Communications Co. | | | | |
| | 440 | | | 9.00%, 08/15/2031 # | | | 406 | |
| | | | | CSC Holdings, Inc. | | | | |
| | 125 | | | 8.13%, 07/15/2009 # | | | 127 | |
| | | | | Intelsat Bermuda Ltd. | | | | |
| | 730 | | | 9.25%, 06/15/2016 # | | | 736 | |
| | | | | Leap Wireless International, Inc. | | | | |
| | 300 | | | 9.38%, 11/01/2014 (G) | | | 294 | |
| | | | | Maxcom Telecomunicaciones | | | | |
| | 300 | | | 11.00%, 12/15/2014 (G) | | | 314 | |
| | | | | Mediacom LLC | | | | |
| | 250 | | | 7.88%, 02/15/2011 | | | 236 | |
| | | | | MetroPCS Wireless, Inc. | | | | |
| | 720 | | | 9.25%, 11/01/2014 | | | 707 | |
| | | | | Nortel Networks Ltd. | | | | |
| | 805 | | | 10.75%, 07/15/2016 (G) | | | 797 | |
| | | | | PanAmSat Corp. | | | | |
| | 200 | | | 9.00%, 06/15/2016 | | | 202 | |
| | | | | Qwest Communications International, Inc. | | | | |
| | 820 | | | 7.50%, 02/15/2014 (G) | | | 806 | |
| | | | | Rural Cellular Corp. | | | | |
| | 490 | | | 6.08%, 06/01/2013 (L) | | | 495 | |
| | | | | Sanmina-Sci Corp. | | | | |
| | 260 | | | 5.55%, 06/15/2014 (I)(L) | | | 240 | |
| | | | | Vimpelcom | | | | |
| | 500 | | | 8.38%, 04/30/2013 (I) | | | 500 | |
| | | | | Windstream Corp. | | | | |
| | 685 | | | 8.63%, 08/01/2016 | | | 718 | |
| | | | | | | | | |
| | | | | | | | | | | | 8,607 | |
| | | | | | | | | | | | | |
| | | | | Transportation — 0.2% |
| | | | | Bristow Group, Inc. | | | | |
| | 425 | | | 7.50%, 09/15/2017 | | | 439 | |
| | | | | PHI, Inc. | | | | |
| | 385 | | | 7.13%, 04/15/2013 | | | 360 | |
| | | | | | | | | |
| | | | | | | | | | | | 799 | |
| | | | | | | | | | | | | |
| | | | | Utilities — 0.5% |
| | | | | AES China Generating Co. | | | | |
| | 100 | | | 8.25%, 06/26/2010 (H) | | | 93 | |
| | | | | Copano Energy LLC | | | | |
| | 315 | | | 8.13%, 03/01/2016 | | | 328 | |
| | | | | Dynegy Holdings, Inc. | | | | |
| | 180 | | | 7.75%, 06/01/2019 | | | 179 | |
| | | | | Markwest Energy Partners L.P. | | | | |
| | 125 | | | 8.50%, 07/15/2016 | | | 129 | |
| | | | | Mirant JPSCO Finance Ltd. | | | | |
| | 100 | | | 11.00%, 07/06/2016 (H) | | | 105 | |
| | | | | Rede Empresas De Energia | | | | |
| | 380 | | | 11.13%, 04/02/2049 (H) | | | 359 | |
| | | | | Texas Competitive Electric Co. | | | | |
| | 400 | | | 10.25%, 11/01/2015 (I) | | | 417 | |
| | | | | | | | | |
| | | | | | | | | | | | 1,610 | |
| | | | | | | | | | | | | |
| | | | | Total corporate bonds: non-investment grade
(cost $35,326) | | $ | 33,557 | |
| | | | | | | | | | | | | |
| | | | | | | | | | | | | |
| SENIOR FLOATING RATE INTERESTS: INVESTMENT GRADE (V) — 0.0% |
| | | | | Technology — 0.0% |
| | | | | Freescale Semiconductor, Inc. | | | | |
| $ | 52 | | | 4.46%, 11/28/2013 (N) | | $ | 45 | |
| | | | | | | | | |
| | | | | Total senior floating rate interests: investment grade
(cost $44) | | $ | 45 | |
| | | | | | | | | | | | | |
| | | | | | | | | | | | | |
The accompanying notes are an integral part of these financial statements.
191
The Hartford Income Fund
Schedule of Investments — (continued)
April 30, 2008 (Unaudited)
(000’s Omitted)
| | | | | | | | | | | | | |
Principal
| | | | | | | | Market
| |
| Amount | | | | | | | | Value (W) | |
| |
| SENIOR FLOATING RATE INTERESTS: NON-INVESTMENT GRADE (V) — 7.3% |
| | | | | Basic Materials — 1.0% |
| | | | | Cenveo, Inc. | | | | |
| $ | 55 | | | 4.35%, 06/21/2013 — 03/16/2014 (N) | | $ | 51 | |
| | | | | Georgia-Pacific Corp. | | | | |
| | 695 | | | 4.73%, 02/14/2013 (N) | | | 666 | |
| | | | | Goodyear Tire & Rubber Co. | | | | |
| | 500 | | | 4.54%, 04/18/2014 (N) | | | 475 | |
| | | | | Graphic Packaging Corp. | | | | |
| | 55 | | | 4.80%, 08/08/2010 (N) | | | 53 | |
| | | | | Huntsman International LLC | | | | |
| | 291 | | | 4.64%, 04/23/2014 (N) | | | 282 | |
| | | | | ISP Chemco LLC | | | | |
| | 199 | | | 4.69%, 05/31/2014 (N) | | | 187 | |
| | | | | Jarden Corp. | | | | |
| | 410 | | | 4.45%, 01/24/2012 (N) | | | 390 | |
| | 1,211 | | | 5.20%, 01/24/2012 (N) | | | 1,170 | |
| | | | | Newpage Corp. | | | | |
| | 120 | | | 6.31%, 12/21/2014 (N) | | | 119 | |
| | | | | | | | | |
| | | | | | | | | | | | 3,393 | |
| | | | | | | | | | | | | |
| | | | | Capital Goods — 0.0% |
| | | | | Yankee Candle Co. | | | | |
| | 190 | | | 4.61%, 02/06/2014 (N) | | | 171 | |
| | | | | Consumer Cyclical — 1.0% |
| | | | | AM General LLC | | | | |
| | 77 | | | 5.71%, 09/30/2013 (AA)(Q) | | | 73 | |
| | | | | American General Finance Corp. | | | | |
| | 3 | | | 5.73%, 09/01/2013 (AA)(Q) | | | 3 | |
| | | | | Aramark Corp. Letter of Credit | | | | |
| | 29 | | | 3.18%, 01/19/2014 (N) | | | 28 | |
| | | | | Aramark Corp. Term Loan B | | | | |
| | 460 | | | 4.57%, 01/19/2014 (N) | | | 440 | |
| | | | | Ford Motor Co. | | | | |
| | 1,225 | | | 5.80%, 12/15/2013 (N) | | | 1,125 | |
| | | | | Lear Corp. | | | | |
| | 162 | | | 5.34%, 04/25/2012 (N) | | | 156 | |
| | | | | Masonite International Corp. Canadian Term Loan | | | | |
| | 247 | | | 4.89%, 04/30/2010 (N) | | | 221 | |
| | | | | Masonite International Corp. U.S. Term Loan | | | | |
| | 247 | | | 4.89%, 04/30/2010 (N) | | | 223 | |
| | | | | Michaels Stores, Inc. | | | | |
| | 187 | | | 5.10%, 11/11/2013 (AA)(Q) | | | 165 | |
| | | | | Oshkosh Truck Corp. | | | | |
| | 438 | | | 4.51%, 12/06/2013 (N) | | | 411 | |
| | | | | Roundy’s Supermarkets, Inc. | | | | |
| | 123 | | | 5.47%, 11/03/2011 (N) | | | 115 | |
| | | | | William Carter Co. | | | | |
| | 432 | | | 4.39%, 07/14/2012 (N) | | | 411 | |
| | | | | | | | | |
| | | | | | | | | | | | 3,371 | |
| | | | | | | | | | | | | |
| | | | | Consumer Staples — 0.3% |
| | | | | Dole Food Co., Inc. | | | | |
| | 94 | | | 4.58%, 04/12/2013 (AA) | | | 87 | |
| | 690 | | | 4.83%, 04/12/2013 (N) | | | 640 | |
| | 207 | | | 5.01%, 04/12/2013 (N) | | | 192 | |
| | | | | | | | | |
| | | | | | | | | | | | 919 | |
| | | | | | | | | | | | | |
| | | | | Energy — 0.3% |
| | | | | Big West Oil LLC Delayed Draw Term Loan | | | | |
| | 550 | | | 2.29%, 02/02/2015 (N)(Q) | | | 517 | |
| | | | | Big West Oil LLC Term Loan | | | | |
| | 443 | | | 5.00%, 02/02/2015 (N) | | | 416 | |
| | | | | | | | | |
| | | | | | | | | | | | 933 | |
| | | | | | | | | | | | | |
| | | | | Finance — 0.5% |
| | | | | Chrysler Financial Services NA | | | | |
| | 250 | | | 9.30%, 08/03/2013 (N) | | | 200 | |
| | | | | Crescent Resources LLC | | | | |
| | 298 | | | 5.80%, 09/07/2012 (N) | | | 198 | |
| | | | | General Growth Properties, Inc. | | | | |
| | 94 | | | 4.20%, 02/24/2010 (N) | | | 83 | |
| | | | | Kar Holdings, Inc. | | | | |
| | 993 | | | 4.95%, 10/17/2013 (N) | | | 939 | |
| | | | | Nuveen Investments, Inc. | | | | |
| | 150 | | | 5.87%, 11/02/2014 (N) | | | 143 | |
| | | | | | | | | |
| | | | | | | | | | | | 1,563 | |
| | | | | | | | | | | | | |
| | | | | Health Care — 0.6% |
| | | | | Carestream Health, Inc. | | | | |
| | 935 | | | 4.83%, 04/12/2013 (N) | | | 798 | |
| | | | | HCA, Inc. | | | | |
| | 436 | | | 4.70%, 11/14/2012 (N) | | | 412 | |
| | 345 | | | 4.95%, 11/17/2013 (N) | | | 327 | |
| | | | | HealthSouth Corp. | | | | |
| | 40 | | | 5.23%, 03/07/2013 (N) | | | 38 | |
| | | | | LifePoint Hospitals, Inc. | | | | |
| | 210 | | | 4.71%, 04/15/2012 (N) | | | 201 | |
| | | | | Skilled Healthcare Group, Inc. | | | | |
| | 75 | | | 4.89%, 06/15/2012 (N) | | | 67 | |
| | | | | Vanguard Health Holdings Co. II LLC | | | | |
| | 75 | | | 5.13%, 09/23/2011 (N) | | | 72 | |
| | | | | | | | | |
| | | | | | | | | | | | 1,915 | |
| | | | | | | | | | | | | |
| | | | | Services — 2.2% |
| | | | | Affinion Group, Inc. | | | | |
| | 185 | | | 5.56%, 10/07/2012 (N) | | | 175 | |
| | | | | Bresnan Communications LLC | | | | |
| | 1,000 | | | 5.02%, 09/29/2013 (N) | | | 935 | |
| | | | | Cedar Fair L.P. | | | | |
| | 345 | | | 4.86%, 07/21/2013 (N) | | | 328 | |
| | | | | CSC Holdings, Inc. | | | | |
| | 496 | | | 4.48%, 03/24/2013 (N) | | | 477 | |
| | | | | Gray Television, Inc. | | | | |
| | 278 | | | 4.19%, 12/31/2014 (N) | | | 243 | |
| | | | | Idearc, Inc. | | | | |
| | 500 | | | 4.24%, 11/17/2013 (N) | | | 430 | |
| | 645 | | | 4.71%, 11/17/2014 (N) | | | 531 | |
| | | | | inVentiv Health, Inc. | | | | |
| | 494 | | | 4.45%, 07/05/2014 (N) | | | 457 | |
| | | | | Las Vegas Sands Corp. | | | | |
| | 17 | | | 0.75%, 05/23/2014 (N)(Q) | | | 15 | |
| | 83 | | | 4.45%, 05/23/2014 (N) | | | 76 | |
| | | | | PITG Gaming Investor Holdings LLC | | | | |
| | 200 | | | 9.80%, 05/26/2008 (N) | | | 195 | |
| | | | | R.H. Donnelley, Inc. | | | | |
| | 680 | | | 4.41%, 06/30/2011 (N) | | | 643 | |
| | | | | Regal Cinemas, Inc. | | | | |
| | 418 | | | 4.20%, 10/27/2013 (N) | | | 397 | |
The accompanying notes are an integral part of these financial statements.
192
| | | | | | | | | | | | | |
Principal
| | | | | | | | Market
| |
| Amount | | | | | | | | Value (W) | |
| |
| | | | | | | | | | | | | |
| SENIOR FLOATING RATE INTERESTS: NON-INVESTMENT GRADE (V) — (continued) |
| | | | | | | | | | | | | |
| | | | | Services — (continued) |
| | | | | SunGard Data Systems, Inc. | | | | |
| $ | 328 | | | 4.88%, 02/28/2014 (N) | | $ | 310 | |
| | | | | Tribune Co. | | | | |
| | 952 | | | 7.54%, 05/23/2015 (N) | | | 781 | |
| | | | | UPC Financing Partnership | | | | |
| | 500 | | | 4.46%, 12/31/2014 (N) | | | 468 | |
| | | | | Weight Watchers International, Inc. | | | | |
| | 446 | | | 3.75%, 01/24/2013 (N) | | | 424 | |
| | | | | West Corp. | | | | |
| | 500 | | | 7.85%, 10/24/2013 (AA)(Q) | | | 496 | |
| | | | | WideOpenWest Finance LLC | | | | |
| | 504 | | | 9.88%, 07/01/2015 (N) | | | 383 | |
| | | | | | | | | |
| | | | | | | | | | | | 7,764 | |
| | | | | | | | | | | | | |
| | | | | Technology — 1.0% |
| | | | | Charter Communications Operating LLC | | | | |
| | 65 | | | 4.90%, 04/28/2013 (N) | | | 58 | |
| | | | | Cincinnati Bell, Inc. | | | | |
| | 264 | | | 4.64%, 08/31/2012 (N) | | | 260 | |
| | | | | DaVita, Inc. | | | | |
| | 400 | | | 4.23%, 10/05/2012 (N) | | | 384 | |
| | | | | Fleetcor Technologies Operating Co. LLC | | | | |
| | 825 | | | 4.96%, 04/30/2013 (N) | | | 763 | |
| | 167 | | | 4.98%, 04/30/2013 (N) | | | 154 | |
| | | | | Intelsat Bermuda Ltd. | | | | |
| | 189 | | | 5.18%, 01/03/2014 (N) | | | 178 | |
| | 600 | | | 9.25%, 01/15/2013 (AA)(Q) | | | 540 | |
| | | | | Intesat Ltd. | | | | |
| | 187 | | | 5.20%, 01/11/2014 (N) | | | 186 | |
| | | | | MetroPCS Wireless, Inc. | | | | |
| | 175 | | | 5.32%, 11/02/2013 (N) | | | 164 | |
| | | | | RCN Corp. | | | | |
| | 993 | | | 5.00%, 04/19/2014 (N) | | | 855 | |
| | | | | Time Warner Telecom Holdings, Inc. | | | | |
| | 46 | | | 4.87%, 07/01/2013 (N) | | | 43 | |
| | | | | | | | | |
| | | | | | | | | | | | 3,585 | |
| | | | | | | | | | | | | |
| | | | | Utilities — 0.4% |
| | | | | Calpine Corp. | | | | |
| | 105 | | | 5.58%, 03/29/2014 (N) | | | 99 | |
| | | | | NRG Energy, Inc. | | | | |
| | 97 | | | 2.60%, 02/01/2013 (N) | | | 92 | |
| | 198 | | | 4.20%, 06/08/2013 (N) | | | 190 | |
| | | | | Texas Competitive Electric Holdings Co. LLC | | | | |
| | 1,107 | | | 6.58%, 10/31/2014 (N) | | | 1,059 | |
| | | | | | | | | |
| | | | | | | | | | | | 1,440 | |
| | | | | | | | | | | | | |
| | | | | Total senior floating rate interests: non-investment grade
(cost $26,645) | | $ | 25,054 | |
| | | | | | | | | | | | | |
| | | | | | | | | | | | | |
| U.S. GOVERNMENT AGENCIES — 27.6% |
| | | | | Federal Home Loan Mortgage Corporation — 11.2% |
| | | | | Mortgage Backed Securities: |
| $ | 3,641 | | | 5.50%, 2032 — 2037 | | $ | 3,669 | |
| | 15,280 | | | 6.00%, 2037 | | | 15,645 | |
| | 7,969 | | | 6.50%, 2037 | | | 8,261 | |
| | | | | | | | | |
| | | | | | | | | | | | 27,575 | |
| | | | | | | | | | | | | |
| | | | | Notes: |
| | 1,220 | | | 5.50%, 2016 (G) | | | 1,327 | |
| | 390 | | | 6.25%, 2032 (G) | | | 462 | |
| | | | | | | | | |
| | | | | | | | | | | | 1,789 | |
| | | | | | | | | | | | | |
| | | | | Remic — Pac’s: |
| | 8,960 | | | 6.00%, 2032 # | | | 9,196 | |
| | | | | | | | | |
| | | | | | | | | | | | 38,560 | |
| | | | | | | | | | | | | |
| | | | | Federal National Mortgage Association — 15.9% |
| | | | | Mortgage Backed Securities: |
| | 613 | | | 5.00%, 2017 — 2022 | | | 619 | |
| | 213 | | | 5.22%, 2035 (L) | | | 216 | |
| | 5,537 | | | 5.50%, 2032 — 2037 | | | 5,579 | |
| | 851 | | | 5.99%, 2037 (L) | | | 866 | |
| | 16,167 | | | 6.00%, 2036 — 2037 | | | 16,547 | |
| | 22,517 | | | 6.50%, 2036 — 2037 | | | 23,325 | |
| | 3,294 | | | 7.00%, 2037 | | | 3,467 | |
| | | | | | | | | |
| | | | | | | | | | | | 50,619 | |
| | | | | | | | | | | | | |
| | | | | Notes: |
| | 4,000 | | | 5.38%, 2017 (G) | | | 4,323 | |
| | | | | | | | | |
| | | | | | | | | | | | 54,942 | |
| | | | | | | | | | | | | |
| | | | | Other Government Agencies — 0.5% |
| | | | | Small Business Administration Participation Certificates: |
| | 790 | | | 4.92%, 2023 | | | 792 | |
| | 862 | | | 5.35%, 2026 # | | | 878 | |
| | | | | | | | | |
| | | | | | | | | | | | 1,670 | |
| | | | | | | | | | | | | |
| | | | | Total U.S. government agencies
(cost $93,251) | | $ | 95,172 | |
| | | | | | | | | | | | | |
| | | | | | | | | | | | | |
| U.S. GOVERNMENT SECURITIES — 11.0% |
| | | | | U.S. Treasury Securities — 11.0% |
| | | | | U.S. Treasury Bonds: |
| $ | 7,593 | | | 5.00%, 2037 (G) | | $ | 8,229 | |
| | | | | U.S. Treasury Notes: |
| | 14,977 | | | 2.50%, 2013 (G) | | | 14,615 | |
| | 1,824 | | | 3.50%, 2018 (G) | | | 1,785 | |
| | 13,037 | | | 4.00%, 2009 (G) | | | 13,373 | |
| | | | | | | | | |
| | | | | | | | | | | | 29,773 | |
| | | | | | | | | | | | | |
| | | | | Total U.S. government securities
(cost $38,489) | | $ | 38,002 | |
| | | | | | | | | | | | | |
| | | | | | | | | | | | | |
| Shares | | | | | | | | | |
| |
| PREFERRED STOCK — 0.6% |
| | | | | Finance — 0.6% |
| | 38 | | | Federal Home Loan Mortgage Corp. | | $ | 969 | |
| | 44 | | | Federal National Mortgage Association | | | 1,104 | |
| | | | | | | | | |
| | | | | Total preferred stock
(cost $2,053) | | $ | 2,073 | |
| | | | | | | | | |
| | | | | Total long-term investments
(cost $338,558) | | $ | 326,958 | |
| | | | | | | | | | | | | |
| | | | | | | | | | | | | |
The accompanying notes are an integral part of these financial statements.
193
The Hartford Income Fund
Schedule of Investments — (continued)
April 30, 2008 (Unaudited)
(000’s Omitted)
| | | | | | | | | | | | | |
| | | | | | | | | Market
| |
| Shares | | | | | | | | Value (W) | |
| |
| SHORT-TERM INVESTMENTS — 20.4% |
| | | | | Investment Pools and Funds — 0.0% |
| | 43 | | | State Street Bank Money Market Fund | | $ | 43 | |
| | | | | | | | | | | | | |
| | | | | | | | | | | | | |
Principal
| | | | | | | | | |
| Amount | | | | | | | | | |
| |
| | | | | Repurchase Agreements — 4.7% |
| | | | | BNP Paribas Securities Corp. Repurchase Agreement (maturing on 05/01/2008 in the amount of $4,718, collateralized by U.S. Treasury Bond 5.50%, 2028, value of $4,866) | | | | |
| $ | 4,718 | | | 1.90% dated 04/30/2008 | | | 4,718 | |
| | | | | RBS Greenwich Capital Markets Repurchase Agreement (maturing on 05/01/2008 in the amount of $4,718, collateralized by U.S. Treasury Note 4.50%, 2011, value of $4,831) | | | | |
| | 4,718 | | | 1.90% dated 04/30/2008 | | | 4,718 | |
| | | | | UBS Securities, Inc. Repurchase Agreement (maturing on 05/01/2008 in the amount of $6,848, collateralized by U.S. Treasury Bond 6.00% — 8.75%, 2020 — 2026, U.S. Treasury Note 4.75% — 13.25%, 2008 — 2016, value of $7,014) | | | | |
| | 6,847 | | | 1.90% dated 04/30/2008 | | | 6,847 | |
| | | | | | | | | |
| | | | | | | | | | | | 16,283 | |
| | | | | | | | | | | | | |
| | | | | | | | | | | | | |
| | | | | | | | | | | | | |
| | | | | Securities Purchased with Proceeds from Security Lending — 15.4% |
| | | | | Cash Collateral Reinvestment Fund: |
| | 52,840 | | | Navigator Prime Portfolio | | | 52,840 | |
| | | | | | | | | | | | | |
| | | | | | | | | | | | | |
Principal
| | | | | | | | | |
| Amount | | | | | | | | | |
| |
| | | | | U.S. Treasury Bills — 0.3% |
| $ | 1,015 | | | 1.43%, 06/12/2008 (M)(S) | | | 1,014 | |
| | | | | | | | | |
| | | | | Total short-term investments
(cost $70,180) | | $ | 70,180 | |
| | | | | | | | | |
| | | | | Total investments
(cost $408,738) (C) | | | 115.2 | % | | $ | 397,138 | |
| | | | | Other assets and liabilities | | | (15.2 | )% | | | (52,509 | ) |
| | | | | | | | | | | | | |
| | | | | Total net assets | | | 100.0 | % | | $ | 344,629 | |
| | | | | | | | | | | | | |
| |
| Note: | Percentage of investments as shown is the ratio of the total market value to total net assets. Market value of investments in foreign securities represents 9.45% of total net assets at April 30, 2008. |
| | |
| (C) | | At April 30, 2008, the cost of securities for federal income tax purposes was $408,782 and the aggregate gross unrealized appreciation and depreciation based on that cost were: |
| | | | | |
| Unrealized Appreciation | | $ | 4,867 | |
| Unrealized Depreciation | | | (16,511 | ) |
| | | | | |
| Net Unrealized Depreciation | | $ | (11,644 | ) |
| | | | | |
| | |
| # | | This security, or a portion of this security, has been segregated to cover funding requirements on investment transactions settling in the future. |
| |
| (A) | | The aggregate value of securities valued in good faith at fair value as determined under policies and procedures established by and under the supervision of the Funds’ Board of Directors at April 30, 2008, was $45, which represents 0.01% of total net assets. This calculation excludes securities that are principally traded on certain foreign markets and whose prices were adjusted solely pursuant to a third party pricing service methodology approved by the Board of Directors. |
| |
| (AA) | | The interest rate disclosed for these securities represents an estimated average coupon as of April 30, 2008. |
| |
| (G) | | Security is partially on loan at April 30, 2008. |
| |
| (I) | | Securities issued within terms of a private placement memorandum, exempt from registration under Section 144A of the Securities Act of 1933, as amended, and may be sold only to qualified institutional buyers. Pursuant to guidelines adopted by the Board of Directors, these issues are determined to be liquid. The aggregate value of these securities at April 30, 2008, was $29,280, which represents 8.50% of total net assets. |
| |
| (K) | | Securities contain some restrictions as to public resale. These securities comply with Regulation S, rules governing offers and sales made outside the United States without registration under the Securities Act of 1933, and are determined to be liquid. At April 30, 2008, the market value of these securities amounted to $1,567 or 0.45% of net assets. |
| |
| (L) | | Variable rate securities; the rate reported is the coupon rate in effect at April 30, 2008. |
| |
| (M) | | The interest rate disclosed for these securities represents the effective yield on the date of acquisition. |
| |
| (N) | | The interest rate disclosed for these securities represents the average coupon as of April 30, 2008. |
| |
| (N) | | The interest rates disclosed for interest only strips represent effective yields based upon estimated future cash flows at April 30, 2008. |
| |
| (Q) | | The cost of securities purchased on a when-issued or delayed delivery basis at April 30, 2008 was $3,400. |
| |
| (V) | | Senior loans in which the Fund invests generally pay interest rates which are periodically adjusted by reference to a base short-term, floating lending rate plus a premium. These base lending rates are generally (i) the lending rate offered by one or more major European banks, such as the London Inter-Bank Offered Rate (LIBOR), (ii) the prime rate offered by one or more major United States Banks, or (iii) the bank’s certificate of deposit rate. Senior floating rate interests often require prepayments from excess cash flows or permit the borrower to repay at its election. The rate at which the borrower repays cannot be predicted with accuracy. As a result, the actual remaining maturity may be substantially less than the stated maturities shown. The interest rate indicated is the rate in effect at April 30, 2008. |
| |
| (X) | | Convertible security. |
| |
| (B) | | All principal amounts are in U.S. dollars unless otherwise indicated. |
| | | |
| BRL | | — Brazilian Real |
| EUR | | — Euro |
| NZD | | — New Zealand Dollar |
The accompanying notes are an integral part of these financial statements.
194
| | |
| (H) | | The following securities are considered illiquid. Illiquid securities are often purchased in private placement transactions, are not registered under the Securities Act of 1933 and may have contractual restrictions on resale. A security may also be considered illiquid if the security lacks a readily available market or if its valuation has not changed for a certain period of time. |
| | | | | | | | | | | |
Period
| | | | | | | | |
Acquired | | Shares/Par | | | Security | | Cost Basis | |
| 08/2005 | | | 100 | | | AES China Generating Co., 8.25%, 06/26/2010 | | $ | 101 | |
03/2004 –
06/2005 | | | 25,553 | | | Banc of America Commercial Mortgage, Inc., 5.50%, 11/10/2039 — 07/10/2043 - 144A | | | 307 | |
| 07/2004 | | | 7,314 | | | Banc of America Commercial Mortgage, Inc., 5.75%, 06/10/2039 - 144A | | | 46 | |
| 03/2006 | | | 200 | | | Bayview Commercial Asset Trust, 3.26%, 04/25/2036 - 144A | | | 200 | |
| 05/2007 | | | 5,600 | | | Bayview Commercial Asset Trust, 7.00%, 07/25/2037 - 144A | | | 798 | |
| 08/2007 | | | 10,335 | | | Bayview Commercial Asset Trust, 7.50%, 09/25/2037 - 144A | | | 1,425 | |
| 03/2004 | | | 3,026 | | | Bear Stearns Commercial Mortgage Securities, Inc., 5.50%, 02/11/2041 - 144A | | | 62 | |
| 08/2006 | | | 50 | | | Capital Automotive Receivables Asset Trust, 5.77%, 05/20/2010 - 144A | | | 50 | |
04/2006 –
08/2007 | | | 5,417 | | | CBA Commercial Small Balance Commercial Mortgage, 7.00%, 07/25/2035 — 06/25/2038 - 144A | | | 314 | |
11/2006 –
08/2007 | | | 6,727 | | | CBA Commercial Small Balance Commercial Mortgage, 9.75%, 01/25/2039 - 144A | | | 638 | |
| 01/2007 | | | 200 | | | Citigroup Mortgage Loan Trust, Inc., 5.39%, 01/25/2037 - 144A | | | 166 | |
| 09/2007 | | | 2,000 | | | Citigroup/Deutsche Bank Commercial Mortgage Trust, 5.48%, 12/11/2049 | | | 1,857 | |
| 03/2004 | | | 6,043 | | | Commercial Mortgage Pass-Through Certificates, 5.50%, 03/10/2039 - 144A | | | 140 | |
| 07/2007 | | | 214 | | | Credit-Based Asset Servicing and Securitization, 3.17%, 05/25/2036 - 144A | | | 209 | |
| 01/2008 | | | 330 | | | Desarrolladora Homes S.A., 7.50%, 09/28/2015 | | | 331 | |
| 07/2004 | | | 6 | | | Equity One ABS, Inc., 5.39%, 07/25/2034 | | | 6 | |
| 06/2006 | | | 11,031 | | | GE Business Loan Trust, 6.14%, 05/15/2034 - 144A | | | 65 | |
| 05/2007 | | | 199 | | | Greenwich Capital Commercial Funding Corp., 3.94%, 11/05/2021 - 144A | | | 193 | |
| 05/2007 | | | 190 | | | Greenwich Capital Commercial Funding Corp., 4.14%, 11/05/2021 - 144A | | | 184 | |
05/2007 –
08/2007 | | | 2,350 | | | GS Mortgage Securities Corp., 5.70%, 12/20/2049 - 144A | | | 2,279 | |
09/2006 –
10/2007 | | | 350 | | | Itabo Finance S.A., 10.88%, 10/05/2013 - 144A | | | 357 | |
| 03/2007 | | | 75 | | | JP Morgan Automotive Receivable Trust, 12.85%, 03/15/2012 | | | 75 | |
| 05/2007 | | | 789 | | | JP Morgan Chase Commercial Mortgage Security Corp., 3.47%, 02/15/2020 - 144A | | | 790 | |
03/2004 –
08/2006 | | | 2,270 | | | JP Morgan Chase Commercial Mortgage Security Corp., 5.50%, 01/15/2038 - 144A | | | 57 | |
| 07/2005 | | | 17,150 | | | JP Morgan Chase Commercial Mortgage Security Corp., 6.00%, 09/12/2037 - 144A | | | 158 | |
| 11/2004 | | | 190 | | | JP Morgan Chase Commercial Mortgage Security Corp., 6.16%, 05/12/2034 | | | 208 | |
04/2005 –
10/2007 | | | 25,056 | | | LB-UBS Commercial Mortgage Trust, 5.26%, 06/15/2036 - 144A | | | 71 | |
| 04/2006 | | | 200 | | | Lehman Brothers Commercial Mortgage Trust, 3.52%, 07/15/2018 - 144A | | | 200 | |
| 02/2006 | | | 250 | | | LNR CDO Ltd., 3.74%, 05/28/2043 - 144A | | | 250 | |
| 03/2006 | | | 45 | | | Long Beach Asset Holdings Corp., 5.78%, 04/25/2046 - 144A | | | 45 | |
09/2007 –
10/2007 | | | 930 | | | LPL Holdings, Inc., 10.75%, 12/15/2015 - 144A | | | 944 | |
| 04/2007 | | | 1,000 | | | Marathon Real Estate CDO Ltd., 4.30%, 05/25/2046 - 144A | | | 976 | |
08/2005 –
11/2006 | | | 160 | | | MEI Euro Finance Ltd., 8.75%, 05/22/2010 - Reg S | | | 161 | |
| 05/2007 | | | 1,000 | | | Merrill Lynch Floating Trust, 3.27%, 06/15/2022 - 144A | | | 1,000 | |
11/2006 –
01/2007 | | | 265 | | | MHP S.A., 10.25%, 11/30/2011 - 144A | | | 270 | |
06/2007 –
09/2007 | | | 440 | | | MHP S.A., 10.25%, 11/30/2011 - Reg S | | | 454 | |
| 09/2006 | | | 100 | | | Mirant JPSCO Finance Ltd., 11.00%, 07/06/2016 - 144A | | | 102 | |
| 07/2005 | | | 16,110 | | | Morgan Stanley Capital I, 6.00%, 06/12/2047 - 144A | | | 197 | |
| 04/2007 | | | 37 | | | Nationstar Home Equity Loan Trust, 9.97%, 03/25/2037 - 144A | | | 37 | |
| 05/2007 | | | 638 | | | Northgroup Preferred Capital Corp., 6.38%, 10/15/2049 - 144A | | | 638 | |
| 03/2007 | | | 725 | | | Option One Mortgage Loan Trust Class M6, 6.99%, 03/25/2037 | | | 702 | |
| 03/2007 | | | 500 | | | Option One Mortgage Loan Trust Class M7, 6.99%, 03/25/2037 | | | 437 | |
| 03/2007 | | | 475 | | | Option One Mortgage Loan Trust Class M8, 6.99%, 03/25/2037 | | | 378 | |
02/2007 –
09/2007 | | | 460 | | | Parkson Retail Group Ltd., 7.88%, 11/14/2011 | | | 468 | |
| 10/2007 | | | 600 | | | RBS-Zero Hora Editora Journalistica, 11.25%, 06/15/2017 - Reg S | | | 311 | |
| 06/2007 | | | 380 | | | Rede Empresas De Energia, 11.13%, 04/02/2049 - 144A | | | 394 | |
| 03/2006 | | | 80 | | | Renaissance Home Equity Loan Trust, 5.75%, 05/25/2036 | | | 80 | |
| 03/2006 | | | 200 | | | Renaissance Home Equity Loan Trust, 6.16%, 05/25/2036 | | | 200 | |
| 08/2007 | | | 600 | | | Renaissance Home Equity Loan Trust Class M5, 7.00%, 09/25/2037 | | | 461 | |
| 08/2007 | | | 750 | | | Renaissance Home Equity Loan Trust Class M8, 7.00%, 09/25/2037 | | | 433 | |
The accompanying notes are an integral part of these financial statements.
195
The Hartford Income Fund
Schedule of Investments — (continued)
April 30, 2008 (Unaudited)
(000’s Omitted)
| | | | | | | | | | | |
Period
| | | | | | | | |
Acquired | | Shares/Par | | | Security | | Cost Basis | |
| 01/2008 | | | 100 | | | Sri Lanka (Republic of), 8.25%, 10/24/2012 - Reg S | | $ | 95 | |
| 10/2007 | | | 400 | | | Sri Lanka (Republic of) ADR, 8.25%, 10/24/2012 - 144A | | | 401 | |
12/2006 –
01/2007 | | | 250 | | | Standard Bank (Privatbank), 8.75%, 02/09/2016 | | | 254 | |
| 10/2007 | | | 300 | | | UK SPV Credit Finance (Privatbank), 8.00%, 02/06/2012 - Reg S | | | 283 | |
| 10/2007 | | | 430 | | | Urbi Desarrollos Urbanos, 8.50%, 04/19/2016 - Reg S | | | 435 | |
| 09/2006 | | | 250 | | | Wachovia Automotive Loan Owner Trust, 5.15%, 07/20/2012 - 144A | | | 250 | |
| 02/2004 | | | 6,774 | | | Wachovia Bank Commercial Mortgage Trust, 5.50%, 02/15/2041 - 144A | | | 132 | |
| | |
| | The aggregate value of these securities at April 30, 2008 was $16,050 which represents 4.66% of total net assets. |
| |
| (S) | | Security pledged as initial margin deposit for open futures contracts at April 30, 2008. |
| |
| | Futures Contracts Outstanding at April 30, 2008 |
| | | | | | | | | | | | | | | | | |
| | | | | | | | | | | | Unrealized
| |
| | | Number of
| | | | | | Expiration
| | | Appreciation/
| |
Description | | Contracts* | | | Position | | | Month | | | (Depreciation) | |
| |
| 2 Year U.S. Treasury Note | | | 913 | | | | Long | | | | Jun 2008 | | | $ | (989 | ) |
| 5 Year U.S. Treasury Note | | | 363 | | | | Long | | | | Jun 2008 | | | | (192 | ) |
| 10 Year U.S. Treasury Note | | | 17 | | | | Short | | | | Jun 2008 | | | | (7 | ) |
| U.S. Long Bond | | | 256 | | | | Short | | | | Jun 2008 | | | | 421 | |
| | | | | | | | | | | | | | | | | |
| | | | | | | | | | | | | | | $ | (767 | ) |
| | | | | | | | | | | | | | | | | |
| | |
| | * The number of contracts does not omit 000’s. |
Forward Foreign Currency Contracts Outstanding at April 30, 2008
| | | | | | | | | | | | | | | | | |
| | | | | | | | | | | | Unrealized
| |
| | | Market
| | | Contract
| | | Delivery
| | | Appreciation/
| |
Description | | Value (W) | | | Amount | | | Date | | | (Depreciation) | |
| |
| Euro (Sell) | | $ | 7,299 | | | $ | 7,155 | | | | 06/17/08 | | | $ | (144 | ) |
| | | | | | | | | | | | | | | | | |
| | |
| (W) | | See Note 2b of accompanying Notes to Financial Statements regarding valuation of securities. |
The accompanying notes are an integral part of these financial statements.
196
The Hartford Inflation Plus Fund
Schedule of Investments
April 30, 2008 (Unaudited)
(000’s Omitted)
| | | | | | | | | | | | | |
Principal
| | | | | | | | Market
| |
| Amount | | | | | | | | Value (W) | |
| SENIOR FLOATING RATE INTERESTS: NON-INVESTMENT GRADE (V) — 2.1% |
| | | | | Basic Materials — 0.1% |
| | | | | Rockwood Holdings, Inc. | | | | |
| $ | 995 | | | 4.40%, 07/30/2012 (N) | | $ | 950 | |
| | | | | Consumer Cyclical — 0.3% |
| | | | | Supervalu, Inc. | | | | |
| | 916 | | | 4.21%, 05/30/2013 (N) | | | 895 | |
| | | | | William Carter Co. | | | | |
| | 1,489 | | | 4.39%, 07/14/2012 (N) | | | 1,415 | |
| | | | | | | | | |
| | | | | | | | | | | | 2,310 | |
| | | | | | | | | | | | | |
| | | | | Finance — 0.2% |
| | | | | Community Health Systems, Inc. | | | | |
| | 93 | | | 1.00%, 07/02/2014 (N)(Q) | | | 89 | |
| | 1,814 | | | 5.34%, 07/02/2014 (N) | | | 1,736 | |
| | | | | | | | | |
| | | | | | | | | | | | 1,825 | |
| | | | | | | | | | | | | |
| | | | | Health Care — 0.2% |
| | | | | Orthofix Holdings, Inc. | | | | |
| | 1,386 | | | 4.64%, 09/22/2013 (N) | | | 1,220 | |
| | | | | Services — 1.0% |
| | | | | Casella Waste Systems, Inc. | | | | |
| | 1,000 | | | 4.75%, 04/28/2010 (N) | | | 963 | |
| | | | | Dex Media West LLC, Inc. | | | | |
| | 1,000 | | | 4.99%, 10/22/2014 (N) | | | 914 | |
| | | | | Idearc, Inc. | | | | |
| | 995 | | | 4.71%, 11/17/2014 (N) | | | 818 | |
| | | | | MGM Mirage, Inc. | | | | |
| | 2,000 | | | 3.30%, 10/03/2011 (N) | | | 1,778 | |
| | | | | Regal Cinemas, Inc. | | | | |
| | 1,955 | | | 4.20%, 10/27/2013 (N) | | | 1,857 | |
| | | | | Weight Watchers International, Inc. | | | | |
| | 1,500 | | | 3.75%, 01/24/2013 (N) | | | 1,425 | |
| | | | | | | | | |
| | | | | | | | | | | | 7,755 | |
| | | | | | | | | | | | | |
| | | | | Technology — 0.1% |
| | | | | DaVita, Inc. | | | | |
| | 1,000 | | | 4.23%, 10/05/2012 (N) | | | 960 | |
| | | | | Utilities — 0.2% |
| | | | | NRG Energy, Inc. | | | | |
| | 586 | | | 2.60%, 02/01/2013 (N) | | | 559 | |
| | 1,199 | | | 4.20%, 06/08/2013 (N) | | | 1,151 | |
| | | | | | | | | |
| | | | | | | | | | | | 1,710 | |
| | | | | | | | | | | | | |
| | | | | Total senior floating rate interests: non-investment grade
(cost $17,766) | | $ | 16,730 | |
| | | | | | | | | | | | | |
| | | | | | | | | | | | | |
| U.S. GOVERNMENT SECURITIES — 102.4% |
| | | | | U.S. Treasury Securities — 102.4% |
| | | | | U.S. Treasury Bonds: |
| $ | 23,975 | | | 2.00%, 2026 (O)# | | $ | 25,411 | |
| | 93,887 | | | 2.38%, 2025 — 2027 (O) | | | 105,315 | |
| | 24,000 | | | 3.63%, 2028 (O)# | | | 39,300 | |
| | 12,000 | | | 3.88%, 2029 (O) | | | 20,138 | |
| | 20,100 | | | 6.63%, 2027 | | | 25,497 | |
| | | | | | | | | |
| | | | | | | | | | | | 215,661 | |
| | | | | | | | | | | | | |
| | | | | U.S. Treasury Notes: |
| | 16,755 | | | 0.63%, 2013 (O) | | | 16,586 | |
| | 7,137 | | | 1.63%, 2015 (O) | | | 8,144 | |
| | 20,235 | | | 1.88%, 2013 (O) | | | 24,498 | |
| | 168,252 | | | 2.00%, 2014 — 2016 (O)# | | | 192,948 | |
| | 101,000 | | | 2.00%, 2012 (O) | | | 110,808 | |
| | 156,327 | | | 2.38%, 2011 — 2017 (O)(V) | | | 176,443 | |
| | 47,841 | | | 3.00%, 2012 (O)# | | | 61,705 | |
| | 1,715 | | | 3.38%, 2012 (O)# | | | 2,252 | |
| | | | | | | | | |
| | | | | | | | | | | | 593,384 | |
| | | | | | | | | | | | | |
| | | | | Total U.S. government securities
(cost $804,319) | | $ | 809,045 | |
| | | | | | | | | | | | | |
| | | | | | | | | | | | | |
| Contracts | | | | | | | | | |
| |
| CALL OPTIONS PURCHASED — 0.2% |
| | | | | Long Call Interest Rate Option Contract — 0.2% |
| | | | | 10 Year U.S. Treasury Note | | | | |
| | 1 | | | Expiration: August, 2008, Exercise Price: $117.50 | | $ | 813 | |
| | | | | 2 Year U.S. Treasury Note | | | | |
| | 1 | | | Expiration: May, 2008, Exercise Price: $106.50 | | | 406 | |
| | | | | | | | | |
| | | | | Total call options purchased
(cost $1,162) | | $ | 1,219 | |
| | | | | | | | | | | | | |
| | | | | | | | | | | | | |
| PUT OPTIONS PURCHASED — 0.0% |
| | | | | Long Call Interest Rate Option Contract — 0.0% |
| | | | | 5 Year U.S. Treasury Note | | | | |
| | 1 | | | Expiration: May, 2008, Exercise Price: $111.00 | | $ | 193 | |
| | | | | | | | | |
| | | | | Total put options purchased
(cost $424) | | $ | 193 | |
| | | | | | | | | |
| | | | | Total long-term investments
(cost $823,671) | | $ | 827,187 | |
| | | | | | | | | | | | | |
| | | | | | | | | | | | | |
| Shares | | | | | | | | | |
| |
| SHORT-TERM INVESTMENTS — 0.7% |
| | | | | Investment Pools and Funds — 0.0% |
| | 18 | | | State Street Bank Money Market Fund | | $ | 18 | |
| | | | | | | | | | | | | |
| | | | | | | | | | | | | |
Principal
| | | | | | | | | |
| Amount | | | | | | | | | |
| |
| | | | | Repurchase Agreements — 0.6% |
| | | | | BNP Paribas Securities Corp. Repurchase Agreement (maturing on 05/01/2008 in the amount of $1,362, collateralized by U.S. Treasury Bond 5.50%, 2028, value of $1,404) | | | | |
| $ | 1,361 | | | 1.90% dated 04/30/2008 | | | 1,361 | |
The accompanying notes are an integral part of these financial statements.
197
The Hartford Inflation Plus Fund
Schedule of Investments — (continued)
April 30, 2008 (Unaudited)
(000’s Omitted)
| | | | | | | | | | | | | |
Principal
| | | | | | | | Market
| |
| Amount | | | | | | | | Value (W) | |
| |
| | | | | | | | | | | | | |
| | | | | Repurchase Agreements — (continued) |
| | | | | RBS Greenwich Capital Markets Repurchase Agreement (maturing on 05/01/2008 in the amount of $1,362, collateralized by U. S. Treasury Note 4.50%, 2011, value of $1,394) | | | | |
| $ | 1,362 | | | 1.90% dated 04/30/2008 | | $ | 1,362 | |
| | | | | UBS Securities, Inc. Repurchase Agreement (maturing on 05/01/2008 in the amount of $1,976, collateralized by U.S. Treasury Bond 6.00% — 8.75%, 2020 — 2026, U.S. Treasury Note 4.75% — 13.25%, 2008 — 2016, value of $2,024) | | | | |
| | 1,976 | | | 1.90% dated 04/30/2008 | | | 1,976 | |
| | | | | | | | | |
| | | | | | | | | | | | 4,699 | |
| | | | | | | | | | | | | |
| | | | | U.S. Treasury Bills — 0.1% |
| | 1,050 | | | 1.43%, 06/12/2008 (M)(S)(U) | | $ | 1,048 | |
| | | | | | | | | |
| | | | | Total short-term investments
(cost $5,765) | | $ | 5,765 | |
| | | | | | | | | |
| | | | | Total investments
(cost $829,436) (C) | | | 105.4 | % | | $ | 832,952 | |
| | | | | Other assets and liabilities | | | (5.4 | )% | | | (42,782 | ) |
| | | | | | | | | | | | | |
| | | | | Total net assets | | | 100.0 | % | | $ | 790,170 | |
| | | | | | | | | | | | | |
| |
| Note: | Percentage of investments as shown is the ratio of the total market value to total net assets. |
| | |
| (C) | | At April 30, 2008, the cost of securities for federal income tax purposes was $832,214 and the aggregate gross unrealized appreciation and depreciation based on that cost were: |
| | | | | |
| Unrealized Appreciation | | $ | 8,714 | |
| Unrealized Depreciation | | | (7,976 | ) |
| | | | | |
| Net Unrealized Appreciation | | $ | 738 | |
| | | | | |
| | |
| # | | This security, or a portion of this security, has been segregated to cover funding requirements on investment transactions settling in the future. |
| |
| (M) | | The interest rate disclosed for these securities represents the effective yield on the date of acquisition. |
| |
| (N) | | The interest rate disclosed for these securities represents the average coupon as of April 30, 2008. |
| |
| (O) | | U.S. Treasury inflation-protected securities (TIPS) are securities in which the principal amount is adjusted for inflation and the semiannual interest payments equal a fixed percentage of the inflation-adjusted principal amount. |
| |
| (Q) | | The cost of securities purchased on a when-issued or delayed delivery basis at April 30, 2008 was $124. |
| |
| (V) | | Senior loans in which the Fund invests generally pay interest rates which are periodically adjusted by reference to a base short-term, floating lending rate plus a premium. These base lending rates are generally (i) the lending rate offered by one or more major European banks, such as the London Inter-Bank Offered Rate (LIBOR), (ii) the prime rate offered by one or more major United States Banks, or (iii) the bank’s certificate of deposit rate. Senior floating rate interests often require prepayments from excess cash flows or permit the borrower to repay at its election. The rate at which the borrower repays cannot be predicted with accuracy. As a result, the actual remaining maturity may be substantially less than the stated maturities shown. The interest rate indicated is the rate in effect at April 30, 2008. |
| |
| (V) | | Denotes all or a portion of securities subject to repurchase under the Reverse Repurchase Agreement as of April 30, 2008. |
| |
| (S) | | Security pledged as initial margin deposit for open futures contracts at April 30, 2008. |
| |
| | Futures Contracts Outstanding at April 30, 2008 |
| | | | | | | | | | | | | | | | | |
| | | | | | | | | | | | Unrealized
| |
| | | Number of
| | | | | | Expiration
| | | Appreciation/
| |
Description | | Contracts* | | | Position | | | Month | | | (Depreciation) | |
| |
| 2 Year U.S. Treasury Note | | | 199 | | | | Short | | | | Jun 2008 | | | $ | (150 | ) |
| | | | | | | | | | | | | | | | | |
| | |
| | * The number of contracts does not omit 000’s. |
| |
| (U) | | At April 30, 2008, securities designated to cover open call options written as follows (see Note 3 to accompanying Notes to Financial Statements): |
| | | | | | | | | | | | | | | | | | | | | |
| | | Number of
| | | Exercise
| | | Exercise
| | | Market
| | | Premiums
| |
Issuer | | Contracts* | | | Price | | | Date | | | Value (W) | | | Received | |
| |
| 10 Year U.S. Treasury Note | | | 1,000 | | | $ | 119.00 | | | | Aug 2008 | | | $ | 516 | | | $ | 1,013 | |
| 2 Year U.S. Treasury Note | | | 1,000 | | | | 106.75 | | | | May 2008 | | | | 234 | | | | 247 | |
| | | | | | | | | | | | | | | | | | | | | |
| | | | | | | | | | | | | | | $ | 750 | | | $ | 1,260 | |
| | | | | | | | | | | | | | | | | | | | | |
| | |
| | * The number of contracts does not omit 000’s. |
| |
| | |
Reverse Repurchase Agreements Outstanding at April 30, 2008
| | | | | | | | | |
| | | Principal
| | | Market
| |
Description | | Amount | | | Value (W) | |
| |
| BNP Paribas Securities Corp. | | $ | 50,738 | | | $ | 50,738 | |
| | | | | | | | | |
| | |
| (W) | | See Note 2b of accompanying Notes to Financial Statements regarding valuation of securities. |
The accompanying notes are an integral part of these financial statements.
198
The Hartford International Growth Fund
Schedule of Investments
April 30, 2008 (Unaudited)
(000’s Omitted)
| | | | | | | | | | | | | |
| | | | | | | | | Market
| |
| Shares | | | | | | | | Value (W) | |
| COMMON STOCK — 97.1% |
| | | | | Australia — 1.9% |
| | 282 | | | CSL Ltd. | | $ | 10,538 | |
| | | | | Belgium — 1.0% |
| | 1,324 | | | Hansen Transmissions (D) | | | 5,793 | |
| | | | | Brazil — 1.8% |
| | 179 | | | Companhia Vale do Rio Doce ADR | | | 6,991 | |
| | 27 | | | Petroleo Brasileiro S.A. ADR | | | 3,218 | |
| | | | | | | | | |
| | | | | | | | 10,209 | |
| | | | | | | | | |
| | | | | Canada — 6.6% |
| | 122 | | | Cameco Corp. | | | 4,255 | |
| | 103 | | | Potash Corp. of Saskatchewan, Inc. | | | 18,873 | |
| | 113 | | | Research In Motion Ltd. (D) | | | 13,696 | |
| | | | | | | | | |
| | | | | | | | 36,824 | |
| | | | | | | | | |
| | | | | China — 2.3% |
| | 1,123 | | | China Communications Construction Co., Ltd. | | | 2,667 | |
| | 1,084 | | | China Merchants Bank Co., Ltd. | | | 4,526 | |
| | 184 | | | LDK Solar Co. Ltd (D)(G) | | | 5,827 | |
| | | | | | | | | |
| | | | | | | | 13,020 | |
| | | | | | | | | |
| | | | | Denmark — 3.3% |
| | 57 | | | Novo Nordisk A/S | | | 3,872 | |
| | 136 | | | Vestas Wind Systems A/S (D) | | | 14,789 | |
| | | | | | | | | |
| | | | | | | | 18,661 | |
| | | | | | | | | |
| | | | | Egypt — 2.2% |
| | 163 | | | Orascom Telecom Holding SAE GDR | | | 12,177 | |
| | | | | Finland — 4.1% |
| | 768 | | | Nokia Oyj (G) | | | 23,088 | |
| | | | | France — 8.8% |
| | 59 | | | Alstom RGPT (G) | | | 13,666 | |
| | 91 | | | AXA S.A. | | | 3,355 | |
| | 69 | | | BNP Paribas | | | 7,326 | |
| | 116 | | | Carrefour S.A. | | | 8,127 | |
| | 64 | | | Societe Generale Class A | | | 7,409 | |
| | 35 | | | Vallourec | | | 9,615 | |
| | | | | | | | | |
| | | | | | | | 49,498 | |
| | | | | | | | | |
| | | | | Germany — 11.3% |
| | 46 | | | Allianz SE-REG | | | 9,423 | |
| | 880 | | | Arcandor AG (D)(G) | | | 16,449 | |
| | 180 | | | Commerzbank AG | | | 6,440 | |
| | 96 | | | Daimler AG # | | | 7,499 | |
| | 40 | | | K + S AG | | | 16,377 | |
| | 49 | | | Merck KGaA | | | 7,009 | |
| | | | | | | | | |
| | | | | | | | 63,197 | |
| | | | | | | | | |
| | | | | Hong Kong — 1.9% |
| | 602 | | | China Mobile Ltd. | | | 10,359 | |
| | | | | Ireland — 2.5% |
| | 280 | | | Elan Corp. plc ADR (D)# | | | 7,356 | |
| | 248 | | | Ryanair Holdings plc ADR (D)(G) | | | 6,734 | |
| | | | | | | | | |
| | | | | | | | 14,090 | |
| | | | | | | | | |
| | | | | Israel — 2.0% |
| | 243 | | | Teva Pharmaceutical Industries Ltd. ADR # | | | 11,353 | |
| | | | | Japan — 12.7% |
| | 111 | | | Canon, Inc. | | | 5,561 | |
| | 180 | | | Honda Motor Co., Ltd. | | | 5,732 | |
| | — | | | Japan Tobacco, Inc. | | | 1,906 | |
| | 292 | | | Komatsu Ltd. | | | 8,899 | |
| | 312 | | | Mitsubishi UFJ Financial Group, Inc. | | | 3,434 | |
| | 535 | | | Mitsui & Co., Ltd. | | | 12,565 | |
| | 283 | | | Mitsui Fudosan Co., Ltd. | | | 7,151 | |
| | 2 | | | Mizuho Financial Group, Inc. | | | 8,530 | |
| | 24 | | | Nintendo Co., Ltd. | | | 13,211 | |
| | 504 | | | Sumitomo Trust & Banking Co., Ltd. | | | 4,531 | |
| | | | | | | | | |
| | | | | | | | 71,520 | |
| | | | | | | | | |
| | | | | Luxembourg — 0.5% |
| | 29 | | | Arcelor | | | 2,548 | |
| | | | | Netherlands — 5.2% |
| | 492 | | | ASML Holding N.V. | | | 13,943 | |
| | 456 | | | Unilever N.V. CVA | | | 15,228 | |
| | | | | | | | | |
| | | | | | | | 29,171 | |
| | | | | | | | | |
| | | | | Norway — 1.7% |
| | 205 | | | Renewable Energy Corp. AS (D) | | | 6,927 | |
| | 84 | | | Seadrill Ltd. | | | 2,539 | |
| | | | | | | | | |
| | | | | | | | 9,466 | |
| | | | | | | | | |
| | | | | Russia — 0.7% |
| | 73 | | | OAO Gazprom Class S ADR | | | 3,889 | |
| | | | | South Africa — 1.1% |
| | 337 | | | MTN Group Ltd. (Q) | | | 6,396 | |
| | | | | South Korea — 2.2% |
| | 41 | | | LG Electronics, Inc. (D) | | | 6,322 | |
| | 8 | | | Samsung Electronics Co., Ltd. | | | 5,862 | |
| | | | | | | | | |
| | | | | | | | 12,184 | |
| | | | | | | | | |
| | | | | Spain — 1.0% |
| | 792 | | | Iberdrola Renovables (D) | | | 5,753 | |
| | | | | Sweden — 0.4% |
| | 986 | | | Telefonaktiebolaget LM Ericsson | | | 2,491 | |
| | | | | Switzerland — 4.3% |
| | 30 | | | Nestle S.A. | | | 14,112 | |
| | 2 | | | Sonova Holding AG | | | 161 | |
| | 295 | | | UBS AG (D) | | | 9,746 | |
| | | | | | | | | |
| | | | | | | | 24,019 | |
| | | | | | | | | |
| | | | | United Kingdom — 17.6% |
| | 344 | | | 3I Group plc | | | 5,854 | |
| | 6,143 | | | Arm Holdings plc | | | 12,194 | |
| | 269 | | | Autonomy Corp. plc (D) | | | 4,530 | |
| | 230 | | | British Land Co. plc | | | 3,813 | |
| | 2,958 | | | Carphone Warehouse Group plc # | | | 15,872 | |
| | 821 | | | easyJet plc (D) | | | 5,024 | |
| | 177 | | | Eurasian Natural Resources Corp. (D) | | | 4,215 | |
| | 2,343 | | | Kingfisher plc | | | 6,123 | |
| | 1,618 | | | Man Group plc | | | 18,510 | |
| | 1,138 | | | Michael Page International plc | | | 6,480 | |
| | 204 | | | Smith & Nephew plc | | | 2,643 | |
The accompanying notes are an integral part of these financial statements.
199
The Hartford International Growth Fund
Schedule of Investments — (continued)
April 30, 2008 (Unaudited)
(000’s Omitted)
| | | | | | | | | | | | | |
| | | | | | | | | Market
| |
| Shares | | | | | | | | Value (W) | |
| | | | | | | | | | | | | |
| COMMON STOCK — (continued) |
| | | | | | | | | | | | | |
| | | | | United Kingdom — (continued) |
| | 172 | | | Xstrata plc | | $ | 13,414 | |
| | | | | | | | | |
| | | | | | | | 98,672 | |
| | | | | | | | | |
| | | | | Total common stock
(cost $521,974) | | $ | 544,916 | |
Principal
| | | | | | | | | |
| Amount | | | | | | | | | |
| | | | | | | | | | | | | |
| | | | | | | | | | | | | |
| SHORT-TERM INVESTMENTS — 11.8% |
| | | | | Repurchase Agreements — 3.4% |
| | | | | Banc of America Securities TriParty Joint Repurchase Agreement (maturing on 05/01/2008 in the amount of $7,260, collateralized by FHLMC 5.00%, 2035, value of $7,405) | | | | |
| $ | 7,260 | | | 1.98% dated 04/30/2008 | | $ | 7,260 | |
| | | | | BNP Paribas Securities Corp. TriParty Joint Repurchase Agreement (maturing on 05/01/2008 in the amount of $3,560, collateralized by FNMA 5.50% — 6.50%, 2036 — 2038, value of $3,631) | | | | |
| | 3,560 | | | 2.00% dated 04/30/2008 | | | 3,560 | |
| | | | | Deutsche Bank Securities Joint Repurchase Agreement (maturing on 05/01/2008 in the amount of $7, collateralized by U. S. Treasury Note 3.63%, 2009, value of $7) | | | | |
| | 7 | | | 1.90% dated 04/30/2008 | | | 7 | |
| | | | | Deutsche Bank Securities TriParty Joint Repurchase Agreement (maturing on 05/01/2008 in the amount of $4,426, collateralized by FHLMC 4.50% — 7.00%, 2016 — 2038, value of $4,514) | | | | |
| | 4,426 | | | 2.00% dated 04/30/2008 | | | 4,426 | |
| | | | | JP Morgan Chase TriParty Joint Repurchase Agreement (maturing on 05/01/2008 in the amount of $4,265, collateralized by FNMA 4.50% — 7.00%, 2020 — 2038, value of $4,351) | | | | |
| | 4,265 | | | 1.96% dated 04/30/2008 | | | 4,265 | |
| | | | | | | | | |
| | | | | | | | 19,518 | |
| | | | | | | | | |
| | | | | | | | | | | | | |
| | | | | | | | | | | | | |
| Shares | | | | | | | | | |
| |
| | | | | Securities Purchased with Proceeds from Security Lending — 8.4% |
| | | | | Cash Collateral Reinvestment Fund: |
| | 37,950 | | | Goldman Sachs FS Prime Obligation/Institutional Fund | | $ | 37,949 | |
| | 9,098 | | | Mellon GSL DBT II Collateral Fund (H) | | | 9,098 | |
| | | | | | | | | |
| | | | | | | | 47,047 | |
| | | | | | | | | |
| | | | | Total short-term investments
(cost $66,565) | | $ | 66,565 | |
| | | | | | | | | |
| | | | | Total investments
(cost $588,539) (C) | | | 108.9 | % | | $ | 611,481 | |
| | | | | Other assets and liabilities | | | (8.9 | )% | | | (50,191 | ) |
| | | | | | | | | | | | | |
| | | | | Total net assets | | | 100.0 | % | | $ | 561,290 | |
| | | | | | | | | | | | | |
| |
| Note: | Percentage of investments as shown is the ratio of the total market value to total net assets. Market value of investments in foreign securities represents 97.08% of total net assets at April 30, 2008. |
Foreign securities that are principally traded on certain foreign markets are adjusted daily pursuant to a third party pricing service methodology approved by the Board of Directors in order to reflect an adjustment for factors occurring after the close of the foreign market but before the close of the New York Stock Exchange.
| | |
| (C) | | At April 30, 2008, the cost of securities for federal income tax purposes was $589,389 and the aggregate gross unrealized appreciation and depreciation based on that cost were: |
| | | | | |
| Unrealized Appreciation | | $ | 42,463 | |
| Unrealized Depreciation | | | (20,371 | ) |
| | | | | |
| Net Unrealized Appreciation | | $ | 22,092 | |
| | | | | |
| | |
| # | | This security, or a portion of this security, has been segregated to cover funding requirements on investment transactions settling in the future. |
| |
| (D) | | Currently non-income producing. |
| |
| (G) | | Security is partially on loan at April 30, 2008. |
| |
| (Q) | | The cost of securities purchased on a when-issued or delayed delivery basis at April 30, 2008 was $1,844. |
| |
| (H) | | The following securities are considered illiquid. Illiquid securities are often purchased in private placement transactions, are not registered under the Securities Act of 1933 and may have contractual restrictions on resale. A security may also be considered illiquid if the security lacks a readily available market or if its valuation has not changed for a certain period of time. Notwithstanding the foregoing, although the Mellon GLS DBT II Collateral Fund has been deemed illiquid for purposes of this report, the Mellon GLS DBT II Collateral Fund has redeemed shares daily in respect of recalled loaned securities. |
| | | | | | | | | | | |
Period
| | | | | | | | |
Acquired | | Shares/Par | | | Security | | Cost Basis | |
12/2007 –
04/2008 | | | 9,098 | | | Mellon GSL DBT II Collateral Fund | | $ | 9,098 | |
| | | | | | | | | | | |
| | |
| | The aggregate value of these securities at April 30, 2008 was $9,098, which represents 1.62% of total net assets. |
The accompanying notes are an integral part of these financial statements.
200
Forward Foreign Currency Contracts Outstanding at April 30, 2008
| | | | | | | | | | | | | | | | | |
| | | | | | | | | | | | Unrealized
| |
| | | Market
| | | Contract
| | | Delivery
| | | Appreciation/
| |
Description | | Value (W) | | | Amount | | | Date | | | (Depreciation) | |
| |
| British Pound (Buy) | | $ | 453 | | | $ | 454 | | | | 05/01/08 | | | $ | (1 | ) |
| British Pound (Sell) | | | 2,734 | | | | 2,706 | | | | 05/02/08 | | | | (28 | ) |
| British Pound (Sell) | | | 1,907 | | | | 1,903 | | | | 05/06/08 | | | | (4 | ) |
| Danish Krone (Sell) | | | 874 | | | | 875 | | | | 05/02/08 | | | | 1 | |
| Danish Krone (Sell) | | | 892 | | | | 889 | | | | 05/05/08 | | | | (3 | ) |
| Euro (Buy) | | | 3,185 | | | | 3,191 | | | | 05/02/08 | | | | (6 | ) |
| Euro (Buy) | | | 2,498 | | | | 2,490 | | | | 05/05/08 | | | | 8 | |
| Euro (Sell) | | | 1,296 | | | | 1,294 | | | | 05/06/08 | | | | (2 | ) |
| Euro (Buy) | | | 25,756 | | | | 26,037 | | | | 06/05/08 | | | | (281 | ) |
| Euro (Sell) | | | 25,756 | | | | 25,385 | | | | 06/05/08 | | | | (371 | ) |
| Japanese Yen (Buy) | | | 3,651 | | | | 3,636 | | | | 05/01/08 | | | | 15 | |
| Japanese Yen (Buy) | | | 5,867 | | | | 5,843 | | | | 05/02/08 | | | | 24 | |
| Japanese Yen (Buy) | | | 1,928 | | | | 1,923 | | | | 05/07/08 | | | | 5 | |
| Norwegian Krone (Buy) | | | 1,216 | | | | 1,212 | | | | 05/06/08 | | | | 4 | |
| South African Rand (Buy) | | | 913 | | | | 907 | | | | 05/07/08 | | | | 6 | |
| South African Rand (Buy) | | | 932 | | | | 926 | | | | 05/08/08 | | | | 6 | |
| Swedish Krona (Sell) | | | 2,742 | | | | 2,731 | | | | 05/05/08 | | | | (11 | ) |
| Swedish Krona (Buy) | | | 2,501 | | | | 2,503 | | | | 05/06/08 | | | | (2 | ) |
| Swiss Franc (Sell) | | | 234 | | | | 234 | | | | 05/02/08 | | | | — | |
| Swiss Franc (Sell) | | | 196 | | | | 196 | | | | 05/05/08 | | | | — | |
| Swiss Franc (Sell) | | | 835 | | | | 831 | | | | 05/06/08 | | | | (4 | ) |
| | | | | | | | | | | | | | | | | |
| | | | | | | | | | | | | | | $ | (644 | ) |
| | | | | | | | | | | | | | | | | |
| | |
| (W) | | See Note 2b of accompanying Notes to Financial Statements regarding valuation of securities. |
Diversification by Industry
as of April 30, 2008
| | | | | |
| | | Percentage of
|
Industry | | Net Assets |
| Basic Materials | | | 13.6 | % |
| |
| |
| Capital Goods | | | 7.7 | |
| |
| |
| Consumer Cyclical | | | 16.8 | |
| |
| |
| Consumer Staples | | | 6.6 | |
| |
| |
| Energy | | | 1.7 | |
| |
| |
| Finance | | | 16.8 | |
| |
| |
| Health Care | | | 7.6 | |
| |
| |
| Services | | | 1.2 | |
| |
| |
| Technology | | | 20.7 | |
| |
| |
| Transportation | | | 2.1 | |
| |
| |
| Utilities | | | 2.3 | |
| |
| |
| Short-Term Investments | | | 11.8 | |
| |
| |
| Other Assets and Liabilities | | | (8.9 | ) |
| |
| |
Total | | | 100.0 | % |
| |
| |
The accompanying notes are an integral part of these financial statements.
201
The Hartford International Opportunities Fund
Schedule of Investments
April 30, 2008 (Unaudited)
(000’s Omitted)
| | | | | | | | | | | | | |
| | | | | | | | | Market
| |
| Shares | | | | | | | | Value (W) | |
| COMMON STOCK — 95.3% |
| | | | | Austria — 1.3% |
| | 77 | | | OMV AG | | $ | 5,809 | |
| | | | | Belgium — 0.3% |
| | 33 | | | UCB S.A. (G) | | | 1,411 | |
| | | | | Brazil — 5.1% |
| | 245 | | | All America Latina Logistica S.A. | | | 3,195 | |
| | 296 | | | Banco Bradesco S.A. | | | 6,689 | |
| | 277 | | | Bolsa De Mercadorias e Futuros | | | 2,815 | |
| | 146 | | | MMX Mineracao E Metalicos S.A. (D) | | | 4,898 | |
| | 50 | | | Petroleo Brasileiro S.A. ADR | | | 6,010 | |
| | | | | | | | | |
| | | | | | | | | | | | 23,607 | |
| | | | | | | | | | | | | |
| | | | | Canada — 2.1% |
| | 113 | | | Canadian Natural Resources Ltd. | | | 9,582 | |
| | | | | China — 4.9% |
| | 10,602 | | | Bank of China Ltd. (G) | | | 5,402 | |
| | 2,406 | | | China Communications Construction Co., Ltd. (G) | | | 5,714 | |
| | 1,245 | | | China Merchants Bank Co., Ltd. (G) | | | 5,196 | |
| | 23 | | | PetroChina Co. Ltd. ADR (G) | | | 3,521 | |
| | 4,468 | | | Shanghai Electric Group Co., Ltd. (G) | | | 2,505 | |
| | | | | | | | | |
| | | | | | | | | | | | 22,338 | |
| | | | | | | | | | | | | |
| | | | | Denmark — 1.0% |
| | 66 | | | Novo Nordisk A/S | | | 4,541 | |
| | | | | Egypt — 1.5% |
| | 93 | | | Orascom Telecom Holding SAE GDR (G) | | | 6,919 | |
| | | | | Finland — 1.9% |
| | 290 | | | Nokia Oyj | | | 8,726 | |
| | | | | France — 10.3% |
| | 44 | | | Air France | | | 1,365 | |
| | 113 | | | AXA S.A. (G) | | | 4,184 | |
| | 67 | | | BNP Paribas (G) | | | 7,188 | |
| | 51 | | | Bouygues S.A. | | | 3,783 | |
| | 97 | | | Cie Generale d’Optique Essilor International S.A. (D)(G) | | | 6,027 | |
| | 176 | | | France Telecom S.A. | | | 5,510 | |
| | 99 | | | Sanofi-Aventis S.A. (G) | | | 7,616 | |
| | 31 | | | Schneider Electric S.A. (G) | | | 3,781 | |
| | 110 | | | Veolia Environment S.A. (G) | | | 7,924 | |
| | | | | | | | | |
| | | | | | | | | | | | 47,378 | |
| | | | | | | | | | | | | |
| | | | | Germany — 8.3% |
| | 46 | | | Allianz SE-REG | | | 9,385 | |
| | 22 | | | Continental AG (G) | | | 2,545 | |
| | 52 | | | Daimler AG (G) | | | 4,058 | |
| | 51 | | | Deutsche Boerse AG (G) | | | 7,463 | |
| | 51 | | | Deutsche Postbank AG (G) | | | 4,401 | |
| | 30 | | | E.On AG (G) | | | 6,064 | |
| | 36 | | | Siemens AG | | | 4,237 | |
| | | | | | | | | |
| | | | | | | | | | | | 38,153 | |
| | | | | | | | | | | | | |
| | | | | Hong Kong — 1.3% |
| | 2,170 | | | Shangri-La Asia Ltd. | | | 6,021 | |
| | | | | India — 1.0% |
| | 200 | | | Bharti Televentures (D) | | | 4,445 | |
| | | | | Ireland — 1.6% |
| | 100 | | | Elan Corp. plc ADR (D) | | | 2,639 | |
| | 144 | | | Ryanair Holdings plc (D) | | | 658 | |
| | 151 | | | Ryanair Holdings plc ADR (D)(G) | | | 4,103 | |
| | | | | | | | | |
| | | | | | | | | | | | 7,400 | |
| | | | | | | | | | | | | |
| | | | | Israel — 1.7% |
| | 121 | | | Israel Chemicals Ltd. | | | 2,217 | |
| | 122 | | | Teva Pharmaceutical Industries Ltd. ADR | | | 5,712 | |
| | | | | | | | | |
| | | | | | | | | | | | 7,929 | |
| | | | | | | | | | | | | |
| | | | | Japan — 8.7% |
| | 135 | | | Canon, Inc. | | | 6,793 | |
| | 127 | | | Honda Motor Co., Ltd. | | | 4,066 | |
| | 3 | | | Japan Tobacco, Inc. | | | 12,239 | |
| | 156 | | | Mitsubishi Estate Co., Ltd. | | | 4,537 | |
| | 381 | | | Mitsui & Co., Ltd. | | | 8,948 | |
| | 412 | | | Toshiba Corp. (G) | | | 3,420 | |
| | | | | | | | | |
| | | | | | | | | | | | 40,003 | |
| | | | | | | | | | | | | |
| | | | | Luxembourg — 2.0% |
| | 105 | | | Arcelor | | | 9,244 | |
| | | | | Mexico — 0.5% |
| | 116 | | | Grupo Aeroportuario Del ADR | | | 2,514 | |
| | | | | Netherlands — 5.8% |
| | 355 | | | Aegon N.V. (G) | | | 5,656 | |
| | 263 | | | ASML Holding N.V. (G) | | | 7,456 | |
| | 155 | | | Koninklijke Philips Electronics N.V. | | | 5,821 | |
| | 225 | | | Unilever N.V. CVA | | | 7,512 | |
| | | | | | | | | |
| | | | | | | | | | | | 26,445 | |
| | | | | | | | | | | | | |
| | | | | Norway — 2.9% |
| | 166 | | | Aker Kvaerner (G) | | | 4,186 | |
| | 421 | | | Norsk Hydro ASA (G) | | | 6,190 | |
| | 152 | | | Telenor ASA (G) | | | 3,046 | |
| | | | | | | | | |
| | | | | | | | | | | | 13,422 | |
| | | | | | | | | | | | | |
| | | | | Russia — 3.2% |
| | 135 | | | OAO Gazprom Class S ADR | | | 7,160 | |
| | 513 | | | OAO Rosneft Oil Co. (K) | | | 5,028 | |
| | 51 | | | Uralkali (D)(I) | | | 2,717 | |
| | | | | | | | | |
| | | | | | | | | | | | 14,905 | |
| | | | | | | | | | | | | |
| | | | | South Africa — 2.2% |
| | 137 | | | Impala Platinum Holdings Ltd. | | | 5,527 | |
| | 231 | | | MTN Group Ltd. | | | 4,385 | |
| | | | | | | | | |
| | | | | | | | | | | | 9,912 | |
| | | | | | | | | | | | | |
| | | | | South Korea — 1.0% |
| | 29 | | | LG Electronics, Inc. (D) | | | 4,492 | |
| | | | | Spain — 2.5% |
| | 528 | | | Banco Santander Central Hispano S.A. (G) | | | 11,414 | |
| | | | | Sweden — 1.1% |
| | 321 | | | Sandvik Ab (G) | | | 4,901 | |
| | | | | Switzerland — 7.1% |
| | 280 | | | ABB Ltd. | | | 8,550 | |
| | 105 | | | Julius Baer Holding Ltd. | | | 7,729 | |
| | 25 | | | Nestle S.A. | | | 12,001 | |
The accompanying notes are an integral part of these financial statements.
202
| | | | | | | | | | | | | |
| | | | | | | | | Market
| |
| Shares | | | | | | | | Value (W) | |
| | | | | | | | | | | | | |
| COMMON STOCK — (continued) |
| | | | | | | | | | | | | |
| | | | | Switzerland — (continued) |
| | 30 | | | Synthes, Inc. | | $ | 4,080 | |
| | | | | | | | | |
| | | | | | | | | | | | 32,360 | |
| | | | | | | | | | | | | |
| | | | | United Kingdom — 14.1% |
| | 209 | | | BG Group plc | | | 5,106 | |
| | 522 | | | British Airways plc (D) | | | 2,330 | |
| | 66 | | | Johnson Matthey plc | | | 2,620 | |
| | 120 | | | Reckitt Benckiser Group plc | | | 6,994 | |
| | 354 | | | SABMiller plc | | | 8,166 | |
| | 452 | | | Smith & Nephew plc | | | 5,850 | |
| | 177 | | | Standard Chartered plc | | | 6,256 | |
| | 2,663 | | | Vodafone Group plc | | | 8,427 | |
| | 243 | | | Xstrata plc | | | 18,927 | |
| | | | | | | | | |
| | | | | | | | | | | | 64,676 | |
| | | | | | | | | | | | | |
| | | | | United States — 1.9% |
| | 341 | | | Invesco Ltd. | | | 8,754 | |
| | | | | | | | | |
| | | | | Total common stock
(cost $410,986) | | $ | 437,301 | |
| | | | | | | | | | | | | |
| | | | | | | | | | | | | |
| EXCHANGE TRADED FUNDS — 1.2% |
| | | | | United States — 1.2% |
| | 72 | | | ishares MSCI EAFE Index Fund | | $ | 5,458 | |
| | | | | | | | | |
| | | | | Total exchange traded funds
(cost $5,473) | | $ | 5,458 | |
| | | | | | | | | |
| | | | | Total long-term investments
(cost $416,459) | | $ | 442,759 | |
| | | | | | | | | | | | | |
| | | | | | | | | | | | | |
Principal
| | | | | | | | | |
| Amount | | | | | | | | | |
| |
| SHORT-TERM INVESTMENTS — 23.8% |
| | | | | Repurchase Agreements — 4.6% |
| | | | | Banc of America Securities TriParty Joint Repurchase Agreement (maturing on 05/01/2008 in the amount of $7,767, collateralized by FHLMC 5.00%, 2035, value of $7,922) | | | | |
| $ | 7,767 | | | 1.98% dated 04/30/2008 | | $ | 7,767 | |
| | | | | BNP Paribas Securities Corp. TriParty Joint Repurchase Agreement (maturing on 05/01/2008 in the amount of $3,809, collateralized by FNMA 5.50% — 6.50%, 2036 — 2038, value of $3,885) | | | | |
| | 3,809 | | | 2.00% dated 04/30/2008 | | | 3,809 | |
| | | | | Deutsche Bank Securities Joint Repurchase Agreement (maturing on 05/01/2008 in the amount of $8, collateralized by U. S. Treasury Note 3.63%, 2009, value of $8) | | | | |
| | 7 | | | 1.90% dated 04/30/2008 | | | 7 | |
| | | | | Deutsche Bank Securities TriParty Joint Repurchase Agreement (maturing on 05/01/2008 in the amount of $4,735, collateralized by FHLMC 4.50% — 7.00%, 2016 — 2038, value of $4,829) | | | | |
| | 4,735 | | | 2.00% dated 04/30/2008 | | | 4,735 | |
| | | | | JP Morgan Chase TriParty Joint Repurchase Agreement (maturing on 05/01/2008 in the amount of $4,563, collateralized by FNMA 4.50% — 7.00%, 2020 — 2038, value of $4,654) | | | | |
| | 4,563 | | | 1.96% dated 04/30/2008 | | | 4,563 | |
| | | | | | | | | |
| | | | | | | | | | | | 20,881 | |
| | | | | | | | | | | | | |
| | | | | | | | | | | | | |
| | | | | | | | | | | | | |
| Shares | | | | | | | | | |
| |
| | | | | Securities Purchased with Proceeds from Security Lending — 19.2% |
| | | | | Cash Collateral Reinvestment Fund: |
| | 88,124 | | | Navigator Prime Portfolio | | $ | 88,124 | |
| | | | | | | | | |
| | | | | Total short-term investments
(cost $109,005) | | $ | 109,005 | |
| | | | | | | | | |
| | | | | Total investments
(cost $525,464) (C) | | | 120.3 | % | | $ | 551,764 | |
| | | | | Other assets and liabilities | | | (20.3 | )% | | | (92,919 | ) |
| | | | | | | | | | | | | |
| | | | | Total net assets | | | 100.0 | % | | $ | 458,845 | |
| | | | | | | | | | | | | |
| |
| Note: | Percentage of investments as shown is the ratio of the total market value to total net assets. Market value of investments in foreign securities represents 93.40% of total net assets at April 30, 2008. |
Foreign securities that are principally traded on certain foreign markets are adjusted daily pursuant to a third party pricing service methodology approved by the Board of Directors in order to reflect an adjustment for factors occurring after the close of the foreign market but before the close of the New York Stock Exchange.
| | |
| (C) | | At April 30, 2008, the cost of securities for federal income tax purposes was $526,251 and the aggregate gross unrealized appreciation and depreciation based on that cost were: |
| | | | | |
| Unrealized Appreciation | | $ | 37,298 | |
| Unrealized Depreciation | | | (11,785 | ) |
| | | | | |
| Net Unrealized Appreciation | | $ | 25,513 | |
| | | | | |
| | |
| (D) | | Currently non-income producing. |
| |
| (G) | | Security is partially on loan at April 30, 2008. |
| |
| (I) | | Securities issued within terms of a private placement memorandum, exempt from registration under Section 144A of the Securities Act of 1933, as amended, and may be sold only to qualified institutional buyers. Pursuant to guidelines adopted by the Board of Directors, these issues are determined to be liquid. The aggregate value of these securities at April 30, 2008, was $2,717, which represents 0.59% of total net assets. |
| |
| (K) | | Securities contain some restrictions as to public resale. These securities comply with Regulation S, rules governing offers and sales made outside the United States without registration under the Securities Act of 1933, and are determined to be liquid. At April 30, 2008, the market value of these securities amounted to $5,028 or 1.10% of net assets. |
| |
| (W) | | See Note 2b of accompanying Notes to Financial Statements regarding valuation of securities. |
The accompanying notes are an integral part of these financial statements.
203
The Hartford International Opportunities Fund
Schedule of Investments — (continued)
April 30, 2008 (Unaudited)
(000’s Omitted)
Forward Foreign Currency Contracts Outstanding at April 30, 2008
| | | | | | | | | | | | | | | | | |
| | | | | | | | | | | | Unrealized
| |
| | | Market
| | | Contract
| | | Delivery
| | | Appreciation/
| |
Description | | Value (W) | | | Amount | | | Date | | | (Depreciation) | |
| |
| Australian Dollar (Sell) | | $ | 607 | | | $ | 603 | | | | 05/01/08 | | | $ | (4 | ) |
| Australian Dollar (Sell) | | | 438 | | | | 433 | | | | 05/02/08 | | | | (5 | ) |
| British Pound (Buy) | | | 661 | | | | 662 | | | | 05/01/08 | | | | (1 | ) |
| British Pound (Buy) | | | 339 | | | | 335 | | | | 05/02/08 | | | | 4 | |
| British Pound (Buy) | | | 1,092 | | | | 1,090 | | | | 05/06/08 | | | | 2 | |
| Canadian Dollar (Sell) | | | 2,309 | | | | 2,297 | | | | 05/01/08 | | | | (12 | ) |
| Euro (Buy) | | | 1,630 | | | | 1,633 | | | | 05/02/08 | | | | (3 | ) |
| Euro (Buy) | | | 693 | | | | 692 | | | | 05/05/08 | | | | 1 | |
| Euro (Buy) | | | 747 | | | | 748 | | | | 05/05/08 | | | | (1 | ) |
| Euro (Buy) | | | 233 | | | | 233 | | | | 05/06/08 | | | | — | |
| Japanese Yen (Sell) | | | 619 | | | | 616 | | | | 05/01/08 | | | | (3 | ) |
| South African Rand (Buy) | | | 411 | | | | 404 | | | | 05/05/08 | | | | 7 | |
| | | | | | | | | | | | | | | | | |
| | | | | | | | | | | | | | | $ | (15 | ) |
| | | | | | | | | | | | | | | | | |
Diversification by Industry
as of April 30, 2008
| | | | | |
| | | Percentage of
|
Industry | | Net Assets |
| Basic Materials | | | 13.2 | |
| |
| |
| Capital Goods | | | 1.6 | |
| |
| |
| Consumer Cyclical | | | 8.5 | |
| |
| |
| Consumer Staples | | | 8.4 | |
| |
| |
| Energy | | | 8.1 | |
| |
| |
| Finance | | | 22.4 | |
| |
| |
| Health Care | | | 8.3 | |
| |
| |
| Services | | | 2.1 | |
| |
| |
| Technology | | | 17.8 | |
| |
| |
| Transportation | | | 3.1 | |
| |
| |
| Utilities | | | 3.0 | |
| |
| |
| Short-Term Investments | | | 23.8 | |
| |
| |
| Other Assets and Liabilities | | | (20.3 | ) |
| |
| |
Total | | | 100.0 | % |
| |
| |
The accompanying notes are an integral part of these financial statements.
204
The Hartford International Small Company Fund
Schedule of Investments
April 30, 2008 (Unaudited)
(000’s Omitted)
| | | | | | | | | | | | | |
| | | | | | | | | Market
| |
| Shares | | | | | | | | Value (W) | |
| COMMON STOCK — 96.2% |
| | | | | Australia — 5.7% |
| | 225 | | | Asciano Group | | $ | 854 | |
| | 611 | | | Babcock & Brown Power | | | 1,091 | |
| | 1,758 | | | Centamin Egypt Ltd. (D) | | | 2,328 | |
| | 844 | | | Energy World Corp., Ltd. (D) | | | 1,110 | |
| | 356 | | | Oxiana Ltd. (G) | | | 1,105 | |
| | 496 | | | Programmed Maintenance Services Ltd. | | | 2,358 | |
| | 188 | | | Ramsay Health Care Ltd. | | | 2,109 | |
| | 231 | | | Transurban Group (G) | | | 1,490 | |
| | 323 | | | Whitehaven Coal Ltd. (D) | | | 840 | |
| | 804 | | | WHK Group Ltd. | | | 1,045 | |
| | 217 | | | Zinifex Ltd. (G) | | | 2,063 | |
| | | | | | | | | |
| | | | | | | | | | | | 16,393 | |
| | | | | | | | | | | | | |
| | | | | Belgium — 0.6% |
| | 31 | | | Umicore (D) | | | 1,658 | |
| | | | | Brazil — 2.8% |
| | 72 | | | Dufry South America Ltd. (D) | | | 1,443 | |
| | 17 | | | Fertilizantes Fosfatados | | | 1,011 | |
| | 115 | | | Lupatech S.A. (D) | | | 4,237 | |
| | 3 | | | MPX Mineracao e Energia S.A. (D) | | | 1,513 | |
| | | | | | | | | |
| | | | | | | | | | | | 8,204 | |
| | | | | | | | | | | | | |
| | | | | Canada — 1.3% |
| | 19 | | | First Quantum Minerals Ltd. | | | 1,626 | |
| | 245 | | | Uranium Participation Corp. (D)(G) | | | 2,086 | |
| | | | | | | | | |
| | | | | | | | | | | | 3,712 | |
| | | | | | | | | | | | | |
| | | | | China — 3.4% |
| | 1,162 | | | Cosco Pacific Ltd. | | | 2,197 | |
| | 62 | | | Mindray Medical International Ltd. | | | 2,118 | |
| | 1,124 | | | Shandong Weigao Group Medical Polymer Co., Ltd. (G) | | | 1,837 | |
| | 2,760 | | | Sinofert Holdings Ltd. (G) | | | 2,105 | |
| | 1,162 | | | Stella International | | | 1,727 | |
| | | | | | | | | |
| | | | | | | | | | | | 9,984 | |
| | | | | | | | | | | | | |
| | | | | Denmark — 0.6% |
| | 33 | | | Genmab A/S (D)(G) | | | 1,793 | |
| | | | | Finland — 2.3% |
| | 80 | | | Nokian Rendaat Oyj (G) | | | 3,374 | |
| | 55 | | | Outotec Oyj | | | 3,449 | |
| | | | | | | | | |
| | | | | | | | | | | | 6,823 | |
| | | | | | | | | | | | | |
| | | | | France — 6.2% |
| | 26 | | | BioMerieux S.A. | | | 2,812 | |
| | 8 | | | Cegedim S.A. (G) | | | 743 | |
| | 8 | | | Guerbet S.A. | | | 1,488 | |
| | 65 | | | Ipsen | | | 4,000 | |
| | 46 | | | Korian | | | 1,702 | |
| | 100 | | | Maurel ET Prom | | | 2,310 | |
| | 105 | | | Rhodia S.A. (D)(G) | | | 2,164 | |
| | 19 | | | Seche Environment | | | 2,748 | |
| | | | | | | | | |
| | | | | | | | | | | | 17,967 | |
| | | | | | | | | | | | | |
| | | | | Germany — 5.0% |
| | 104 | | | Arcandor AG (D)(G) | | | 1,942 | |
| | 16 | | | Hochtief AG (G) | | | 1,670 | |
| | 20 | | | MTU Aero Engines Holdings AG (G) | | | 915 | |
| | 120 | | | Rhoen-Klinikum AG | | | 3,624 | |
| | 51 | | | Stada Arzneimittel AG | | | 3,476 | |
| | 111 | | | Symrise AG | | | 2,727 | |
| | | | | | | | | |
| | | | | | | | | | | | 14,354 | |
| | | | | | | | | | | | | |
| | | | | Hong Kong — 5.9% |
| | 382 | | | China Mengniu Dairy Co. | | | 1,140 | |
| | 104 | | | Dickson Concept International | | | 76 | |
| | 2,016 | | | Far East Pharmaceutical Technology Co., Ltd. (A)(D)(G)(H) | | | — | |
| | 3,230 | | | First Pacific Co., Ltd. | | | 2,367 | |
| | 723 | | | Hidili Industry International Development (D) | | | 1,102 | |
| | 2,420 | | | Huabao International Holdings Ltd. | | | 2,156 | |
| | 388 | | | Kingboard Chemical Holdings Ltd. | | | 1,831 | |
| | 2,128 | | | Peace Mark Holdings Ltd. | | | 2,481 | |
| | 1,189 | | | Shangri-La Asia Ltd. | | | 3,298 | |
| | 1,982 | | | Shun Tak Holdings Ltd. (G) | | | 2,645 | |
| | | | | | | | | |
| | | | | | | | | | | | 17,096 | |
| | | | | | | | | | | | | |
| | | | | India — 0.6% |
| | 110 | | | Dr. Reddy’s Laboratories Ltd. ADR | | | 1,683 | |
| | | | | Israel — 0.8% |
| | 253 | | | Makhteshim-Agan Industries Ltd. | | | 2,323 | |
| | | | | Italy — 5.4% |
| | 171 | | | Antichi Pellettieri S.p.A. | | | 2,014 | |
| | 112 | | | Autogrill S.p.A (G) | | | 1,693 | |
| | 95 | | | DiaSorin S.p.A. (D) | | | 1,707 | |
| | 123 | | | Enia S.p.A. (D) | | | 1,718 | |
| | 368 | | | Immobiliare Grande Distribuzione (G) | | | 1,268 | |
| | 55 | | | Mariella Burani Fashion Group S.p.A. (G) | | | 1,445 | |
| | 58 | | | Pirelli & C. Real Estate S.p.A. (G) | | | 1,735 | |
| | 86 | | | Prysmian S.p.A. | | | 2,022 | |
| | 347 | | | Saras S.p.A. | | | 1,981 | |
| | | | | | | | | |
| | | | | | | | | | | | 15,583 | |
| | | | | | | | | | | | | |
| | | | | Japan — 23.6% |
| | 88 | | | Aeon Delight Co., Ltd. | | | 1,828 | |
| | 73 | | | AEON Mall Co., Ltd. (G) | | | 2,276 | |
| | 115 | | | Asics Corp. | | | 1,166 | |
| | 89 | | | Benesse Corp. | | | 3,919 | |
| | 130 | | | Gunma Bank Ltd. | | | 1,043 | |
| | 39 | | | Hisamitsu Pharmaceutical Co., Inc. | | | 1,450 | |
| | 267 | | | Hitachi Metals Ltd. (G) | | | 4,009 | |
| | 40 | | | Ibiden Co., Ltd. | | | 1,754 | |
| | 201 | | | Iino Kaiun Kaisha Ltd. (G) | | | 2,266 | |
| | 4 | | | Jupiter Telecommunications Co., Ltd. (D) | | | 3,735 | |
| | 2 | | | KK DaVinci Advisors (D)(G) | | | 1,605 | |
| | 78 | | | Kobayashi Pharmaceutical Co., Ltd. (G) | | | 2,729 | |
| | 18 | | | Micronics Japan Co. | | | 631 | |
| | 175 | | | Mitsubishi Tanabe Pharma Corp. | | | 2,090 | |
| | 76 | | | Miura Co., Ltd. (G) | | | 1,959 | |
| | 88 | | | Modec, Inc. (G) | | | 3,084 | |
| | 220 | | | Nabtesco Corp. | | | 3,258 | |
| | 240 | | | NTN Corp. (G) | | | 1,847 | |
| | 74 | | | OBIC Business Consultants Ltd. (G) | | | 3,840 | |
| | 22 | | | OBIC Co., Ltd. | | | 4,050 | |
| | 53 | | | Point, Inc. (G) | | | 2,341 | |
| | 1 | | | RISA Partners, Inc. (G) | | | 1,315 | |
| | 101 | | | Securities Carbon Ltd. | | | 736 | |
| | 170 | | | Shinko Plantech Co., Ltd. | | | 2,665 | |
| | 123 | | | Shionogi & Co., Ltd. | | | 2,378 | |
The accompanying notes are an integral part of these financial statements.
205
The Hartford International Small Company Fund
Schedule of Investments — (continued)
April 30, 2008 (Unaudited)
(000’s Omitted)
| | | | | | | | | | | | | |
| | | | | | | | | Market
| |
| Shares | | | | | | | | Value (W) | |
| | | | | | | | | | | | | |
| COMMON STOCK — (continued) |
| | | | | | | | | | | | | |
| | | | | Japan — (continued) |
| | 514 | | | Sumitomo Osaka Cement Co., Ltd. | | $ | 1,126 | |
| | 75 | | | Sysmex Corp. (G) | | | 3,067 | |
| | 68 | | | Taiyo Ink Manufacturing Co., Ltd. (G) | | | 1,644 | |
| | 108 | | | Tokai Carbon Co. (G) | | | 1,132 | |
| | 51 | | | Toyota Boshoku Corp. | | | 1,450 | |
| | 27 | | | Uni-Charm Corp. | | | 1,881 | |
| | | | | | | | | |
| | | | | | | | | | | | 68,274 | |
| | | | | | | | | | | | | |
| | | | | Liechtenstein — 0.8% |
| | 9 | | | Verwalt & Privat-Bank AG | | | 2,354 | |
| | | | | Malaysia — 0.5% |
| | 3,548 | | | Air Asia BHD (D) | | | 1,417 | |
| | | | | Netherlands — 2.7% |
| | 525 | | | Dockwise Ltd. (D) | | | 1,578 | |
| | 98 | | | SBM Offshore N.V. | | | 3,721 | |
| | 154 | | | Spazio Investment N.V. | | | 2,526 | |
| | | | | | | | | |
| | | | | | | | | | | | 7,825 | |
| | | | | | | | | | | | | |
| | | | | Norway — 2.5% |
| | 1,009 | | | DNO International ASA (D)(G) | | | 1,898 | |
| | 13 | | | Kongsberg Gruppen ASA | | | 856 | |
| | 160 | | | TGS Nopec Geophysical Co. ASA (D)(G) | | | 2,572 | |
| | 258 | | | Wavefield Inseis ASA (D) | | | 1,946 | |
| | | | | | | | | |
| | | | | | | | | | | | 7,272 | |
| | | | | | | | | | | | | |
| | | | | Papua New Guinea — 0.5% |
| | 126 | | | New Britain Palm Oil Ltd. | | | 1,418 | |
| | | | | Singapore — 0.7% |
| | 1,519 | | | Goodpack Ltd. (G) | | | 1,960 | |
| | | | | South Korea — 3.0% |
| | 9 | | | Cheil Communications, Inc. (D) | | | 2,532 | |
| | 37 | | | Hana Tour Service, Inc. | | | 2,210 | |
| | 25 | | | Hanjin Heavy Industrial & Construction | | | 1,427 | |
| | 41 | | | Hotel Shilla Co., Ltd. (G) | | | 1,047 | |
| | 15 | | | Samsung Engineering Co., Ltd. | | | 1,368 | |
| | | | | | | | | |
| | | | | | | | | | | | 8,584 | |
| | | | | | | | | | | | | |
| | | | | Spain — 1.1% |
| | 105 | | | Laboratorios Almiral S.A. (D) | | | 2,203 | |
| | 23 | | | Prosegur Compania de Seguridad S.A. | | | 1,001 | |
| | | | | | | | | |
| | | | | | | | | | | | 3,204 | |
| | | | | | | | | | | | | |
| | | | | Sweden — 3.1% |
| | 201 | | | Lundin Petroleum Ab (D)(G) | | | 2,790 | |
| | 138 | | | Munters Ab (G) | | | 1,413 | |
| | 220 | | | Swedish Match Ab (G) | | | 4,798 | |
| | | | | | | | | |
| | | | | | | | | | | | 9,001 | |
| | | | | | | | | | | | | |
| | | | | Switzerland — 4.0% |
| | 17 | | | Bachem Holding AG Class B | | | 1,532 | |
| | 63 | | | Dufry Group | | | 6,914 | |
| | 75 | | | Paris RE Holdings Ltd. (D) | | | 1,683 | |
| | 54 | | | Temenos Group AG (D)(G) | | | 1,511 | |
| | | | | | | | | |
| | | | | | | | | | | | 11,640 | |
| | | | | | | | | | | | | |
| | | | | United Kingdom — 13.1% |
| | 182 | | | Admiral Group plc | | | 3,124 | |
| | 64 | | | Aveva Group plc | | | 1,532 | |
| | 80 | | | Babcock International Group plc | | | 937 | |
| | 329 | | | British Airways plc (D) | | | 1,470 | |
| | 359 | | | Clapham House Group plc (D) | | | 1,172 | |
| | 98 | | | Close Brothers Group plc | | | 1,342 | |
| | 351 | | | Detica Group plc | | | 2,093 | |
| | 343 | | | easyJet plc (D) | | | 2,095 | |
| | 352 | | | Fenner plc | | | 1,749 | |
| | 1,645 | | | Guinness Peat Group plc | | | 2,221 | |
| | 122 | | | Hamworthy KSE | | | 1,182 | |
| | 82 | | | ICAP plc | | | 947 | |
| | 236 | | | Informa Group plc | | | 1,612 | |
| | 243 | | | Lancashire Holdings Ltd. | | | 1,464 | |
| | 379 | | | Mears Group plc | | | 2,353 | |
| | 400 | | | Meggitt plc | | | 2,349 | |
| | 378 | | | Rexam plc | | | 3,349 | |
| | 635 | | | Senior plc | | | 1,379 | |
| | 106 | | | Ultra Electronics Holdings plc | | | 2,691 | |
| | 106 | | | VT Group plc | | | 1,423 | |
| | 4 | | | Wellstream Holdings plc (D) | | | 89 | |
| | 456 | | | Wolfson Microelectronics plc (D) | | | 1,275 | |
| | | | | | | | | |
| | | | | | | | | | | | 37,848 | |
| | | | | | | | | | | | | |
| | | | | Total common stock
(cost $280,716) | | $ | 278,370 | |
| | | | | | | | | | | | | |
| | | | | | | | | | | | | |
Principal
| | | | | | | | | |
| Amount | | | | | | | | | |
| |
| SHORT-TERM INVESTMENTS — 21.5% |
| | | | | Repurchase Agreements — 3.8% |
| | | | | Banc of America Securities TriParty Joint Repurchase Agreement (maturing on 05/01/2008 in the amount of $4,134, collateralized by FHLMC 5.00%, 2035, value of $4,216) | | | | |
| $ | 4,134 | | | 1.98% dated 04/30/2008 | | $ | 4,134 | |
| | | | | BNP Paribas Securities Corp. TriParty Joint Repurchase Agreement (maturing on 05/01/2008 in the amount of $2,027, collateralized by FNMA 5.50% — 6.50%, 2036 — 2038, value of $2,068) | | | | |
| | 2,027 | | | 2.00% dated 04/30/2008 | | | 2,027 | |
| | | | | Deutsche Bank Securities Joint Repurchase Agreement (maturing on 05/01/2008 in the amount of $4, collateralized by U. S. Treasury Note 3.63%, 2009, value of $4) | | | | |
| | 4 | | | 1.90% dated 04/30/2008 | | | 4 | |
| | | | | Deutsche Bank Securities TriParty Joint Repurchase Agreement (maturing on 05/01/2008 in the amount of $2,520, collateralized by FHLMC 4.50% — 7.00%, 2016 — 2038, value of $2,570) | | | | |
| | 2,520 | | | 2.00% dated 04/30/2008 | | | 2,520 | |
| | | | | JP Morgan Chase TriParty Joint Repurchase Agreement (maturing on 05/01/2008 in the amount of $2,429, collateralized by FNMA 4.50% — 7.00%, 2020 — 2038, value of $2,477) | | | | |
| | 2,428 | | | 1.96% dated 04/30/2008 | | | 2,428 | |
| | | | | | | | | |
| | | | | | | | | | | | 11,113 | |
| | | | | | | | | | | | | |
| | | | | | | | | | | | | |
The accompanying notes are an integral part of these financial statements.
206
| | | | | | | | | | | | | |
Principal
| | | | | | | | Market
| |
| Amount | | | | | | | | Value (W) | |
| |
| | | | | | | | | | | | | |
| SHORT-TERM INVESTMENTS — (continued) |
| | | | | Securities Purchased with Proceeds from Security Lending — 17.7% |
| | | | | Cash Collateral Reinvestment Fund: |
| $ | 51,115 | | | Navigator Prime Portfolio | | $ | 51,115 | |
| | | | | | | | | |
| | | | | Total short-term investments
(cost $62,228) | | $ | 62,228 | |
| | | | | | | | | |
| | | | | Total investments
(cost $342,944) (C) | | | 117.7 | % | | $ | 340,598 | |
| | | | | Other assets and liabilities | | | (17.7 | )% | | | (51,211 | ) |
| | | | | | | | | | | | | |
| | | | | Total net assets | | | 100.0 | % | | $ | 289,387 | |
| | | | | | | | | | | | | |
| |
| Note: | Percentage of investments as shown is the ratio of the total market value to total net assets. Market value of investments in foreign securities represents 96.19% of total net assets at April 30, 2008. |
| | |
| (C) | | At April 30, 2008, the cost of securities for federal income tax purposes was $345,256 and the aggregate gross unrealized appreciation and depreciation based on that cost were: |
| | | | | |
| Unrealized Appreciation | | $ | 20,279 | |
| Unrealized Depreciation | | | (24,937 | ) |
| | | | | |
| Net Unrealized Depreciation | | $ | (4,658 | ) |
| | | | | |
| | |
| (A) | | The aggregate value of securities valued in good faith at fair value as determined under policies and procedures established by and under the supervision of the Funds’ Board of Directors at April 30, 2008 rounds to zero. This calculation excludes securities that are principally traded on certain foreign markets and whose prices were adjusted solely pursuant to a third party pricing service methodology approved by the Board of Directors. |
| |
| (D) | | Currently non-income producing. |
| |
| (G) | | Security is partially on loan at April 30, 2008. |
| |
| (H) | | The following securities are considered illiquid. Illiquid securities are often purchased in private placement transactions, are not registered under the Securities Act of 1933 and may have contractual restrictions on resale. A security may also be considered illiquid if the security lacks a readily available market or if its valuation has not changed for a certain period of time. |
| | | | | | | | | | | |
Period
| | | | | | | | |
Acquired | | Shares/Par | | | Security | | Cost Basis | |
03/2004 –
05/2004 | | | 2,016 | | | Far East Pharmaceutical Technology Co., Ltd. | | $ | 293 | |
| | |
| | The aggregate value of these securities at April 30, 2008 rounds to zero. |
Forward Foreign Currency Contracts Outstanding at April 30, 2008
| | | | | | | | | | | | | | | | | |
| | | | | | | | | | | | Unrealized
| |
| | | Market
| | | Contract
| | | Delivery
| | | Appreciation/
| |
Description | | Value (W) | | | Amount | | | Date | | | (Depreciation) | |
| |
| Australian Dollar (Buy) | | $ | 1,946 | | | $ | 1,934 | | | | 05/01/08 | | | $ | 12 | |
| Australian Dollar (Buy) | | | 61 | | | | 60 | | | | 05/02/08 | | | | 1 | |
| Australian Dollar (Sell) | | | 1,265 | | | | 1,255 | | | | 05/05/08 | | | | (10 | ) |
| British Pound (Sell) | | | 1,059 | | | | 1,057 | | | | 05/06/08 | | | | (2 | ) |
| Euro (Buy) | | | 290 | | | | 289 | | | | 05/05/08 | | | | 1 | |
| Hong Kong Dollar (Buy) | | | 51 | | | | 51 | | | | 05/02/08 | | | | — | |
| Hong Kong Dollar (Buy) | | | 26 | | | | 26 | | | | 05/05/08 | | | | — | |
| Japanese Yen (Buy) | | | 1,508 | | | | 1,502 | | | | 05/02/08 | | | | 6 | |
| Japanese Yen (Buy) | | | 417 | | | | 416 | | | | 05/07/08 | | | | 1 | |
| Norwegian Krone (Buy) | | | 76 | | | | 76 | | | | 05/02/08 | | | | — | |
| Swedish Krona (Sell) | | | 503 | | | | 503 | | | | 05/02/08 | | | | — | |
| | | | | | | | | | | | | | | | | |
| | | | | | | | | | | | | | | $ | 9 | |
| | | | | | | | | | | | | | | | | |
| | |
| (W) | | See Note 2b of accompanying Notes to Financial Statements regarding valuation of securities. |
Diversification by Industry
as of April 30, 2008
| | | | | |
| | | Percentage of
|
Industry | | Net Assets |
| Basic Materials | | | 16.5 | % |
| |
| |
| Capital Goods | | | 4.4 | |
| |
| |
| Consumer Cyclical | | | 12.2 | |
| |
| |
| Consumer Staples | | | 2.5 | |
| |
| |
| Energy | | | 7.5 | |
| |
| |
| Finance | | | 9.7 | |
| |
| |
| Health Care | | | 15.8 | |
| |
| |
| Services | | | 9.6 | |
| |
| |
| Technology | | | 8.7 | |
| |
| |
| Transportation | | | 6.3 | |
| |
| |
| Utilities | | | 3.0 | |
| |
| |
| Short-Term Investments | | | 21.5 | |
| |
| |
| Other Assets and Liabilities | | | (17.7 | ) |
| |
| |
Total | | | 100.0 | % |
| |
| |
The accompanying notes are an integral part of these financial statements.
207
The Hartford LargeCap Growth Fund
Schedule of Investments
April 30, 2008 (Unaudited)
(000’s Omitted)
| | | | | | | | | | | | | |
| | | | | | | | | Market
| |
| Shares | | | | | | | | Value (W) | |
| COMMON STOCK — 98.7% |
| | | | | Basic Materials — 2.7% |
| | 1 | | | AK Steel Holding Corp. | | $ | 43 | |
| | 1 | | | Consol Energy, Inc. | | | 46 | |
| | — | | | Freeport-McMoRan Copper & Gold, Inc. | | | 40 | |
| | 1 | | | Massey Energy Co. | | | 36 | |
| | 1 | | | Owens-Illinois, Inc. (D) | | | 48 | |
| | 1 | | | Praxair, Inc. | | | 51 | |
| | — | | | Southern Copper Corp. | | | 45 | |
| | | | | | | | | |
| | | | | | | | | | | | 309 | |
| | | | | | | | | | | | | |
| | | | | Capital Goods — 7.3% |
| | 1 | | | 3M Co. | | | 76 | |
| | 1 | | | Baker Hughes, Inc. | | | 44 | |
| | 2 | | | Boeing Co. | | | 137 | |
| | 1 | | | Caterpillar, Inc. | | | 93 | |
| | — | | | Flowserve Corp. | | | 41 | |
| | 1 | | | Hasbro, Inc. | | | 44 | |
| | 2 | | | Honeywell International, Inc. | | | 90 | |
| | 1 | | | Joy Global, Inc. | | | 52 | |
| | 1 | | | National Oilwell Varco, Inc. (D) | | | 55 | |
| | 1 | | | Pitney Bowes, Inc. | | | 37 | |
| | — | | | Smith International, Inc. | | | 34 | |
| | 1 | | | United Technologies Corp. | | | 76 | |
| | 1 | | | Varian Semiconductor Equipment Associates, Inc. (D) | | | 54 | |
| | | | | | | | | |
| | | | | | | | | | | | 833 | |
| | | | | | | | | | | | | |
| | | | | Consumer Cyclical — 10.0% |
| | 1 | | | Abercrombie & Fitch Co. Class A | | | 56 | |
| | 5 | | | Altria Group, Inc. | | | 95 | |
| | 1 | | | Amazon.com, Inc. (D) | | | 45 | |
| | — | | | AutoZone, Inc. (D) | | | 38 | |
| | 2 | | | Best Buy Co., Inc. | | | 73 | |
| | 1 | | | Coach, Inc. (D) | | | 38 | |
| | 1 | | | Costco Wholesale Corp. | | | 43 | |
| | 2 | | | eBay, Inc. (D) | | | 64 | |
| | 1 | | | Fastenal Co. | | | 51 | |
| | 1 | | | Foster Wheeler Ltd. (D) | | | 55 | |
| | 2 | | | Lowe’s Co., Inc. | | | 47 | |
| | 1 | | | McDonald’s Corp. | | | 52 | |
| | — | | | Mosaic Co. (D) | | | 60 | |
| | 1 | | | NIKE, Inc. Class B | | | 69 | |
| | 1 | | | Philip Morris International, Inc. (D) | | | 73 | |
| | 1 | | | Target Corp. | | | 62 | |
| | 1 | | | Urban Outfitters, Inc. (D) | | | 38 | |
| | 3 | | | Wal-Mart Stores, Inc. | | | 171 | |
| | | | | | | | | |
| | | | | | | | | | | | 1,130 | |
| | | | | | | | | | | | | |
| | | | | Consumer Staples — 6.0% |
| | 1 | | | Anheuser-Busch Cos., Inc. | | | 57 | |
| | 1 | | | Avon Products, Inc. | | | 34 | |
| | 2 | | | Coca-Cola Co. | | | 144 | |
| | 1 | | | Colgate-Palmolive Co. | | | 94 | |
| | 3 | | | PepsiCo, Inc. | | | 189 | |
| | 2 | | | Procter & Gamble Co. | | | 166 | |
| | | | | | | | | |
| | | | | | | | | | | | 684 | |
| | | | | | | | | | | | | |
| | | | | Energy — 9.5% |
| | 1 | | | Chesapeake Energy Corp. | | | 48 | |
| | — | | | Constellation Energy Group, Inc. | | | 35 | |
| | — | | | Diamond Offshore Drilling, Inc. | | | 35 | |
| | 1 | | | ENSCO International, Inc. | | | 50 | |
| | 2 | | | Exxon Mobil Corp. | | | 185 | |
| | 2 | | | Frontier Oil Corp. | | | 53 | |
| | 2 | | | Halliburton Co. | | | 74 | |
| | 1 | | | Holly Corp. | | | 36 | |
| | 1 | | | Noble Corp. | | | 38 | |
| | 2 | | | Schlumberger Ltd. | | | 198 | |
| | 1 | | | Sunoco, Inc. | | | 39 | |
| | 1 | | | Transocean, Inc. | | | 93 | |
| | 1 | | | Valero Energy Corp. | | | 49 | |
| | 1 | | | W&T Offshore, Inc. | | | 48 | |
| | 1 | | | Weatherford International Ltd. (D) | | | 49 | |
| | 1 | | | XTO Energy, Inc. | | | 51 | |
| | | | | | | | | |
| | | | | | | | | | | | 1,081 | |
| | | | | | | | | | | | | |
| | | | | Finance — 7.7% |
| | 1 | | | Aflac, Inc. | | | 40 | |
| | 1 | | | American Express Co. | | | 56 | |
| | 3 | | | Charles Schwab Corp. | | | 66 | |
| | — | | | CME Group, Inc. | | | 63 | |
| | 1 | | | Federated Investors, Inc. | | | 46 | |
| | — | | | Goldman Sachs Group, Inc. | | | 42 | |
| | 2 | | | Health Net, Inc. (D) | | | 54 | |
| | 1 | | | Humana, Inc. (D) | | | 37 | |
| | — | | | Mastercard, Inc. | | | 120 | |
| | 1 | | | Nymex Holdings, Inc. | | | 58 | |
| | 1 | | | NYSE Euronext | | | 36 | |
| | 1 | | | State Street Corp. | | | 38 | |
| | 1 | | | T. Rowe Price Group, Inc. | | | 42 | |
| | 2 | | | UnitedHealth Group, Inc. | | | 70 | |
| | 1 | | | Wellcare Health Plans, Inc. (D) | | | 54 | |
| | 2 | | | Western Union Co. | | | 54 | |
| | | | | | | | | |
| | | | | | | | | | | | 876 | |
| | | | | | | | | | | | | |
| | | | | Health Care — 17.1% |
| | 3 | | | Abbott Laboratories | | | 145 | |
| | 1 | | | Amerisource Bergen Corp. | | | 36 | |
| | 2 | | | Amgen, Inc. (D) | | | 80 | |
| | — | | | Bard (C.R.), Inc. | | | 41 | |
| | 1 | | | Baxter International, Inc. | | | 69 | |
| | 1 | | | Becton, Dickinson & Co. | | | 72 | |
| | 3 | | | Bristol-Myers Squibb Co. | | | 59 | |
| | 1 | | | Cardinal Health, Inc. | | | 43 | |
| | 2 | | | CVS/Caremark Corp. | | | 70 | |
| | 1 | | | Eli Lilly & Co. | | | 66 | |
| | 1 | | | Genentech, Inc. (D) | | | 74 | |
| | 2 | | | Gilead Sciences, Inc. (D) | | | 89 | |
| | 2 | | | Herbalife Ltd. | | | 76 | |
| | — | | | Intuitive Surgical, Inc. (D) | | | 40 | |
| | 1 | | | Invitrogen Corp. (D) | | | 51 | |
| | 2 | | | Johnson & Johnson | | | 130 | |
| | 1 | | | Medco Health Solutions, Inc. (D) | | | 37 | |
| | 2 | | | Medtronic, Inc. | | | 97 | |
| | 3 | | | Merck & Co., Inc. | | | 112 | |
| | 1 | | | Monsanto Co. | | | 122 | |
| | 3 | | | NBTY, Inc. (D) | | | 74 | |
| | 2 | | | Schering-Plough Corp. | | | 34 | |
| | 1 | | | St. Jude Medical, Inc. (D) | | | 61 | |
| | 1 | | | Varian Medical Systems, Inc. (D) | | | 47 | |
| | 1 | | | Walgreen Co. | | | 50 | |
| | 2 | | | Watson Pharmaceuticals, Inc. (D) | | | 56 | |
The accompanying notes are an integral part of these financial statements.
208
| | | | | | | | | | | | | |
| | | | | | | | | Market
| |
| Shares | | | | | | | | Value (W) | |
| | | | | | | | | | | | | |
| COMMON STOCK — (continued) |
| | | | | | | | | | | | | |
| | | | | Health Care — (continued) |
| | 2 | | | Wyeth | | $ | 71 | |
| | — | | | Zimmer Holdings, Inc. (D) | | | 36 | |
| | | | | | | | | |
| | | | | | | | | | | | 1,938 | |
| | | | | | | | | | | | | |
| | | | | Services — 7.3% |
| | 1 | | | Apollo Group, Inc. Class A (D) | | | 39 | |
| | 1 | | | Autodesk, Inc. (D) | | | 36 | |
| | 1 | | | Brink’s Co. | | | 43 | |
| | 1 | | | C.H. Robinson Worldwide, Inc. | | | 39 | |
| | 3 | | | Comcast Corp. Class A | | | 69 | |
| | 2 | | | DirecTV Group, Inc. (D) | | | 52 | |
| | 1 | | | Express Scripts, Inc. (D) | | | 65 | |
| | — | | | Fluor Corp. | | | 43 | |
| | 1 | | | McGraw-Hill Cos., Inc. | | | 39 | |
| | 1 | | | Moody’s Corp. | | | 47 | |
| | 1 | | | Omnicom Group, Inc. | | | 44 | |
| | 1 | | | Paychex, Inc. | | | 51 | |
| | 2 | | | Regal Entertainment Group | | | 35 | |
| | 2 | | | SEI Investments Co. | | | 51 | |
| | 1 | | | United Parcel Service, Inc. Class B | | | 60 | |
| | 2 | | | Viacom, Inc. Class B (D) | | | 59 | |
| | 2 | | | Walt Disney Co. | | | 58 | |
| | | | | | | | | |
| | | | | | | | | | | | 830 | |
| | | | | | | | | | | | | |
| | | | | Technology — 28.5% |
| | 1 | | | Adobe Systems, Inc. (D) | | | 40 | |
| | 2 | | | Apple, Inc. (D) | | | 284 | |
| | 4 | | | Applied Materials, Inc. | | | 73 | |
| | 11 | | | Cisco Systems, Inc. (D) | | | 274 | |
| | 3 | | | Corning, Inc. | | | 93 | |
| | 4 | | | Dell, Inc. (D) | | | 80 | |
| | 1 | | | Dolby Laboratories, Inc. Class A (D) | | | 34 | |
| | 1 | | | Dun & Bradstreet Corp. | | | 49 | |
| | 4 | | | EMC Corp. (D) | | | 56 | |
| | 1 | | | Emerson Electric Co. | | | 63 | |
| | — | | | First Solar, Inc. (D) | | | 78 | |
| | 2 | | | Garmin Ltd. | | | 66 | |
| | 1 | | | General Electric Co. | | | 43 | |
| | — | | | Google, Inc. (D) | | | 221 | |
| | 4 | | | Hewlett-Packard Co. | | | 187 | |
| | 11 | | | Intel Corp. | | | 240 | |
| | 2 | | | International Business Machines Corp. | | | 234 | |
| | 1 | | | Lexmark International, Inc. ADR (D) | | | 38 | |
| | 1 | | | Lockheed Martin Corp. | | | 100 | |
| | 1 | | | MEMC Electronic Materials, Inc. (D) | | | 68 | |
| | 15 | | | Microsoft Corp. | | | 434 | |
| | 2 | | | NVIDIA Corp. (D) | | | 47 | |
| | 7 | | | Oracle Corp. (D) | | | 150 | |
| | 3 | | | Qualcomm, Inc. | | | 137 | |
| | 1 | | | Rockwell Collins, Inc. | | | 33 | |
| | 3 | | | Texas Instruments, Inc. | | | 75 | |
| | 2 | | | Yahoo!, Inc. (D) | | | 47 | |
| | | | | | | | | |
| | | | | | | | | | | | 3,244 | |
| | | | | | | | | | | | | |
| | | | | Transportation — 2.3% |
| | 1 | | | Burlington Northern Santa Fe Corp. | | | 70 | |
| | 1 | | | CSX Corp. | | | 41 | |
| | 1 | | | Frontline Ltd. | | | 44 | |
| | 1 | | | McDermott International, Inc. (D) | | | 40 | |
| | — | | | Union Pacific Corp. | | | 63 | |
| | | | | | | | | |
| | | | | | | | | | | | 258 | |
| | | | | | | | | | | | | |
| | | | | Utilities — 0.3% |
| | — | | | Exelon Corp. | | | 36 | |
| | | | | | | | | |
| | | | | Total common stock
(cost $11,191) | | $ | 11,219 | |
| | | | | | | | | | | | | |
| | | | | | | | | | | | | |
| EXCHANGE TRADED FUNDS — 0.7% |
| | | | | Other Investment Pools and Funds — 0.7% |
| | 1 | | | iShares Russell 1000 | | $ | 80 | |
| | | | | | | | | |
| | | | | Total exchange traded funds
(cost $80) | | $ | 80 | |
| | | | | | | | | |
| | | | | Total long-term investments
(cost $11,271) | | $ | 11,299 | |
| | | | | | | | | | | | | |
| | | | | | | | | | | | | |
Principal
| | | | | | | | | |
| Amount | | | | | | | | | |
| |
| SHORT-TERM INVESTMENTS — 0.2% |
| | | | | Repurchase Agreements — 0.2% |
| | | | | BNP Paribas Securities Corp. Repurchase Agreement (maturing on 05/01/2008 in the amount of $6, collateralized by U.S. Treasury Bond 5.50%, 2028, value of $7) | | | | |
| $ | 6 | | | 1.90% dated 04/30/2008 | | $ | 6 | |
| | | | | RBS Greenwich Capital Markets Repurchase Agreement (maturing on 05/01/2008 in the amount of $7, collateralized by U. S. Treasury Note 4.50%, 2011, value of $7) | | | | |
| | 7 | | | 1.90% dated 04/30/2008 | | | 7 | |
| | | | | UBS Securities, Inc. Repurchase Agreement (maturing on 05/01/2008 in the amount of $9, collateralized by U.S. Treasury Bond 6.00% — 8.75%, 2020 — 2026, U.S. Treasury Note 4.75% — 13.25%, 2008 — 2016, value of $9) | | | | |
| | 9 | | | 1.90% dated 04/30/2008 | | | 9 | |
| | | | | | | | | |
| | | | | Total short-term investments
(cost $22) | | $ | 22 | |
| | | | | | | | | |
| | | | | Total investments
(cost $11,293) (C) | | | 99.6 | % | | $ | 11,321 | |
| | | | | Other assets and liabilities | | | 0.4 | % | | | 45 | |
| | | | | | | | | | | | | |
| | | | | Total net assets | | | 100.0 | % | | $ | 11,366 | |
| | | | | | | | | | | | | |
| |
| Note: | Percentage of investments as shown is the ratio of the total market value to total net assets. |
| | |
| (C) | | At April 30, 2008, the cost of securities for federal income tax purposes was $11,320 and the aggregate gross unrealized appreciation and depreciation based on that cost were: |
| | | | | |
| Unrealized Appreciation | | $ | 508 | |
| Unrealized Depreciation | | | (507 | ) |
| | | | | |
| Net Unrealized Appreciation | | $ | 1 | |
| | | | | |
| | |
| (D) | | Currently non-income producing. |
| |
| (W) | | See Note 2b of accompanying Notes to Financial Statements regarding valuation of securities. |
The accompanying notes are an integral part of these financial statements.
209
The Hartford MidCap Fund
Schedule of Investments
April 30, 2008 (Unaudited)
(000’s Omitted)
| | | | | | | | | | | | | |
| | | | | | | | | Market
| |
| Shares | | | | | | | | Value (W) | |
| COMMON STOCK — 96.6% |
| | | | | Basic Materials — 9.3% |
| | 265 | | | Agrium, Inc. (G) | | $ | 20,959 | |
| | 198 | | | CF Industries Holdings, Inc. (G) | | | 26,499 | |
| | 153 | | | Cleveland-Cliffs, Inc. (G) | | | 24,477 | |
| | 322 | | | Consol Energy, Inc. (G) | | | 26,037 | |
| | 530 | | | FMC Corp. (G) | | | 33,292 | |
| | 275 | | | Lupatech S.A. (D) | | | 10,162 | |
| | 311 | | | Nucor Corp. (G) | | | 23,503 | |
| | 170 | | | Peabody Energy Corp. (G) | | | 10,374 | |
| | 128 | | | Precision Castparts Corp. | | | 15,071 | |
| | 1,046 | | | Sealed Air Corp. (G) | | | 26,456 | |
| | 351 | | | Teck Cominco Ltd. Class B | | | 15,344 | |
| | 654 | | | Thompson Creek Metals Co., Inc (D) | | | 14,107 | |
| | 215 | | | United States Steel Corp. | | | 33,130 | |
| | | | | | | | | |
| | | | | | | | | | | | 279,411 | |
| | | | | | | | | | | | | |
| | | | | Capital Goods — 2.8% |
| | 222 | | | Alliant Techsystems, Inc. (D)(G) | | | 24,460 | |
| | 813 | | | Kennametal, Inc. | | | 28,264 | |
| | 223 | | | Scientific Games Corp. Class A (D)(G) | | | 6,280 | |
| | 579 | | | Toro Co. (G) | | | 24,531 | |
| | | | | | | | | |
| | | | | | | | | | | | 83,535 | |
| | | | | | | | | | | | | |
| | | | | Consumer Cyclical — 11.2% |
| | 665 | | | American Eagle Outfitters, Inc. | | | 12,212 | |
| | 1,212 | | | BJ’s Wholesale Club, Inc. (D)(G) | | | 46,194 | |
| | 479 | | | BorgWarner, Inc. (G) | | | 23,538 | |
| | 608 | | | Dick’s Sporting Goods, Inc. (D)(G) | | | 17,376 | |
| | 336 | | | Foster Wheeler Ltd. (D) | | | 21,400 | |
| | 275 | | | Gildan Activewear, Inc. (D)(G) | | | 7,084 | |
| | 8,386 | | | Li & Fung Ltd. | | | 34,597 | |
| | 538 | | | Liz Claiborne, Inc. (G) | | | 9,520 | |
| | 29 | | | NVR, Inc. (D)(G) | | | 18,037 | |
| | 750 | | | O’Reilly Automotive, Inc. (D)(G) | | | 21,655 | |
| | 640 | | | PACCAR, Inc. (G) | | | 30,275 | |
| | 1,026 | | | Patterson Cos., Inc. (D)(G) | | | 35,089 | |
| | 4,440 | | | Peace Mark Holdings Ltd. | | | 5,177 | |
| | 1,228 | | | Supervalu, Inc. (G) | | | 40,653 | |
| | 273 | | | Tiffany & Co. | | | 11,869 | |
| | 129 | | | Under Armour, Inc. Class A (D)(G) | | | 4,296 | |
| | | | | | �� | | | |
| | | | | | | | | | | | 338,972 | |
| | | | | | | | | | | | | |
| | | | | Consumer Staples — 1.9% |
| | 786 | | | Avon Products, Inc. (G) | | | 30,654 | |
| | 498 | | | Clorox Co. (G) | | | 26,405 | |
| | | | | | | | | |
| | | | | | | | | | | | 57,059 | |
| | | | | | | | | | | | | |
| | | | | Energy — 10.4% |
| | 528 | | | Cie Gen Geophysique ADR (D) | | | 26,486 | |
| | 165 | | | Diamond Offshore Drilling, Inc. (G) | | | 20,642 | |
| | 902 | | | Forest Oil Corp. (D)(G) | | | 53,131 | |
| | 487 | | | Noble Energy, Inc. | | | 42,326 | |
| | 1,041 | | | Seadrill Ltd. | | | 31,356 | |
| | 783 | | | Southwestern Energy Co. (D) | | | 33,112 | |
| | 561 | | | St. Mary Land & Exploration Co. (G) | | | 24,540 | |
| | 1,356 | | | UGI Corp. | | | 35,248 | |
| | 549 | | | Ultra Petroleum Corp. (D) | | | 45,597 | |
| | | | | | | | | |
| | | | | | | | | | | | 312,438 | |
| | | | | | | | | | | | | |
| | | | | Finance — 10.6% |
| | 7,182 | | | Aberdeen Asset Management plc | | | 20,079 | |
| | 99 | | | Blackrock, Inc. (G) | | | 20,018 | |
| | 729 | | | Bovespa Holding S.A. | | | 11,080 | |
| | 206 | | | Everest Re Group Ltd. | | | 18,612 | |
| | 374 | | | Forest City Enterprises, Inc. Class A (G) | | | 13,804 | |
| | 674 | | | Humana, Inc. (D) | | | 32,230 | |
| | 589 | | | Huntington Bancshares, Inc. (G) | | | 5,534 | |
| | 368 | | | Kimco Realty Corp. (G) | | | 14,683 | |
| | 130 | | | M&T Bank Corp. (G) | | | 12,082 | |
| | 282 | | | MSCI, Inc. (D) | | | 8,732 | |
| | 803 | | | Popular, Inc. (G) | | | 10,010 | |
| | 285 | | | T. Rowe Price Group, Inc. (G) | | | 16,690 | |
| | 1,562 | | | Unum Group (G) | | | 36,252 | |
| | 502 | | | Waddell and Reed Financial, Inc. Class A (G) | | | 16,992 | |
| | 292 | | | Washington Mutual, Inc. PIPE (A)(H) | | | 3,230 | |
| | 904 | | | Washington Mutual, Inc. (G) | | | 11,110 | |
| | 2,248 | | | Western Union Co. | | | 51,706 | |
| | 33 | | | White Mountains Insurance Group Ltd. | | | 15,759 | |
| | | | | | | | | |
| | | | | | | | | | | | 318,603 | |
| | | | | | | | | | | | | |
| | | | | Health Care — 16.1% |
| | 786 | | | Amylin Pharmaceuticals, Inc. (D)(G) | | | 21,675 | |
| | 872 | | | Barr Pharmaceuticals, Inc. (D)(G) | | | 43,780 | |
| | 811 | | | Beckman Coulter, Inc. (G) | | | 55,385 | |
| | 386 | | | Cephalon, Inc. (D)(G) | | | 24,098 | |
| | 250 | | | Charles River Laboratories International, Inc. (D)(G) | | | 14,524 | |
| | 1,390 | | | Community Health Systems, Inc. (D)(G) | | | 52,182 | |
| | 796 | | | Elan Corp. plc ADR (D)(G) | | | 20,937 | |
| | 114 | | | Intuitive Surgical, Inc. (D)(G) | | | 32,947 | |
| | 68 | | | Invitrogen Corp. (D) | | | 6,401 | |
| | 1,850 | | | Millennium Pharmaceuticals, Inc. (D)(G) | | | 46,000 | |
| | 674 | | | Perrigo Co. (G) | | | 27,619 | |
| | 647 | | | Regeneron Pharmaceuticals, Inc. (D)(G) | | | 12,700 | |
| | 717 | | | Sepracor, Inc. (D)(G) | | | 15,460 | |
| | 822 | | | St. Jude Medical, Inc. (D) | | | 35,978 | |
| | 787 | | | Universal Health Services, Inc. Class B | | | 49,285 | |
| | 274 | | | Varian Medical Systems, Inc. (D)(G) | | | 12,845 | |
| | 179 | | | Zimmer Holdings, Inc. (D) | | | 13,290 | |
| | | | | | | | | |
| | | | | | | | | | | | 485,106 | |
| | | | | | | | | | | | | |
| | | | | Services — 13.3% |
| | 3,254 | | | Allied Waste Industries, Inc. (D)(G) | | | 40,223 | |
| | 175 | | | Apollo Group, Inc. Class A (D) | | | 8,918 | |
| | 724 | | | Autodesk, Inc. (D)(G) | | | 27,501 | |
| | 379 | | | C.H. Robinson Worldwide, Inc. (G) | | | 23,743 | |
| | 1,301 | | | Cadence Design Systems, Inc. (D)(G) | | | 14,476 | |
| | 1,197 | | | DreamWorks Animation SKG, Inc. (D)(G) | | | 33,480 | |
| | 1,244 | | | Equifax, Inc. (D)(G) | | | 47,615 | |
| | 360 | | | Factset Research Systems, Inc. (G) | | | 21,623 | |
| | 119 | | | Fluor Corp. (G) | | | 18,253 | |
| | 227 | | | Focus Media Holding Ltd. ADR (D)(G) | | | 8,389 | |
| | 212 | | | ITT Educational Services, Inc. (D)(G) | | | 16,290 | |
| | 692 | | | Manpower, Inc. | | | 46,447 | |
| | 1,647 | | | Republic Services, Inc. | | | 52,366 | |
| | 1,245 | | | Robert Half International, Inc. (G) | | | 29,497 | |
| | 67 | | | Strayer Education, Inc. (G) | | | 12,478 | |
| | | | | | | | | |
| | | | | | | | | | | | 401,299 | |
| | | | | | | | | | | | | |
| | | | | Technology — 15.3% |
| | 520 | | | Activision, Inc. (D) | | | 14,055 | |
| | 1,919 | | | Altera Corp. (G) | | | 40,836 | |
| | 381 | | | American Tower Corp. Class A (D) | | | 16,557 | |
| | 1,026 | | | BMC Software, Inc. (D) | | | 35,646 | |
| | 784 | | | Ciena Corp. (D)(G) | | | 26,514 | |
| | 183 | | | Ctrip.Com International Ltd. | | | 11,382 | |
| | 728 | | | Electronic Arts, Inc. (D)(G) | | | 37,450 | |
| | 334 | | | Equinix, Inc. (D)(G) | | | 30,228 | |
| | 913 | | | FLIR Systems, Inc. (D)(G) | | | 31,350 | |
| | 659 | | | Global Payments, Inc. (G) | | | 29,167 | |
| | 653 | | | Lam Research Corp. (D)(G) | | | 26,669 | |
| | 786 | | | Linear Technology Corp. (G) | | | 27,489 | |
| | 1,204 | | | McAfee, Inc. (D) | | | 40,020 | |
| | 210 | | | National Instruments Corp. (G) | | | 6,174 | |
| | 390 | | | NetApp, Inc. (D)(G) | | | 9,438 | |
| | 238 | | | Rockwell Collins, Inc. | | | 15,008 | |
The accompanying notes are an integral part of these financial statements.
210
| | | | | | | | | | | | | |
| | | | | | | | | Market
| |
| Shares | | | | | | | | Value (W) | |
| | | | | | | | | | | | | |
| COMMON STOCK — (continued) |
| | | | | | | | | | | | | |
| | | | | Technology — (continued) |
| | 687 | | | Teradata Corp. (D) | | $ | 14,622 | |
| | 1,314 | | | VeriSign, Inc. (D)(G) | | | 47,373 | |
| | | | | | | | | |
| | | | | | | | | | | | 459,978 | |
| | | | | | | | | | | | | |
| | | | | Transportation — 3.5% |
| | 378 | | | Con-way, Inc. (G) | | | 17,473 | |
| | 279 | | | Expeditors International of Washington, Inc. (G) | | | 13,008 | |
| | 717 | | | J.B. Hunt Transport Services, Inc. (G) | | | 24,343 | |
| | 579 | | | Kansas City Southern (D)(G) | | | 26,119 | |
| | 484 | | | Landstar System, Inc. (G) | | | 25,159 | |
| | | | | | | | | |
| | | | | | | | | | | | 106,102 | |
| | | | | | | | | | | | | |
| | | | | Utilities — 2.2% |
| | 1,232 | | | DPL, Inc. (G) | | | 34,284 | |
| | 1,220 | | | Northeast Utilities | | | 32,102 | |
| | | | | | | | | |
| | | | | | | | | | | | 66,386 | |
| | | | | | | | | | | | | |
| | | | | Total common stock
(cost $2,652,130) | | $ | 2,908,889 | |
| | | | | | | | | | | | | |
| | | | | | | | | | | | | |
| PREFERRED STOCK — 0.1% |
| | | | | Finance — 0.1% |
| | — | | | Washington Mutual, Inc. (A)(D)(H)(X) | | $ | 2,529 | |
| | | | | | | | | |
| | | | | Total preferred stock
(cost $2,000) | | $ | 2,529 | |
| | | | | | | | | |
| | | | | Total long-term investments
(cost $2,654,130) | | $ | 2,911,418 | |
| | | | | | | | | | | | | |
| | | | | | | | | | | | | |
Principal
| | | | | | | | | |
| Amount | | | | | | | | | |
| |
| SHORT-TERM INVESTMENTS — 31.2% |
| | | | | Repurchase Agreements — 4.1% |
| | | | | Banc of America Securities TriParty Joint Repurchase Agreement (maturing on 05/01/2008 in the amount of $45,366, collateralized by FHLMC 5.00%, 2035, value of $46,271) | | | | |
| $ | 45,364 | | | 1.98% dated 04/30/2008 | | $ | 45,364 | |
| | | | | BNP Paribas Securities Corp. TriParty Joint Repurchase Agreement (maturing on 05/01/2008 in the amount of $22,247, collateralized by FNMA 5.50% — 6.50%, 2036 — 2038, value of $22,691) | | | | |
| | 22,246 | | | 2.00% dated 04/30/2008 | | | 22,246 | |
| | | | | Deutsche Bank Securities Joint Repurchase Agreement (maturing on 05/01/2008 in the amount of $44, collateralized by U.S. Treasury Note 3.63%, 2009, value of $45) | | | | |
| | 44 | | | 1.90% dated 04/30/2008 | | | 44 | |
| | | | | Deutsche Bank Securities TriParty Joint Repurchase Agreement (maturing on 05/01/2008 in the amount of $27,656, collateralized by FHLMC 4.50% — 7.00%, 2016 — 2038, value of $28,207) | | | | |
| $ | 27,654 | | | 2.00% dated 04/30/2008 | | | 27,654 | |
| | | | | JP Morgan Chase TriParty Joint Repurchase Agreement (maturing on 05/01/2008 in the amount of $26,653, collateralized by FNMA 4.50% — 7.00%, 2020 — 2038, value of $27,184) | | | | |
| | 26,651 | | | 1.96% dated 04/30/2008 | | | 26,651 | |
| | | | | | | | | |
| | | | | | | | | | | | 121,959 | |
| | | | | | | | | | | | | |
| | | | | | | | | | | | | |
| | | | | | | | | | | | | |
| Shares | | | | | | | | | |
| |
| | | | | Securities Purchased with Proceeds from Security Lending — 27.1% |
| | | | | Cash Collateral Reinvestment Fund: |
| | 488,032 | | | Goldman Sachs FS Prime Obligation/Institutional Fund | | $ | 488,032 | |
| | 329,279 | | | Mellon GSL DBT II Collateral Fund (H) | | | 329,279 | |
| | | | | | | | | |
| | | | | | | | | | | | 817,311 | |
| | | | | | | | | | | | | |
| | | | | Total short-term investments
(cost $939,270) | | $ | 939,270 | |
| | | | | | | | | |
| | | | | Total investments
(cost $3,593,400) (C) | | | 127.9 | % | | $ | 3,850,688 | |
| | | | | Other assets and liabilities | | | (27.9 | )% | | | (839,607 | ) |
| | | | | | | | | | | | | |
| | | | | Total net assets | | | 100.0 | % | | $ | 3,011,081 | |
| | | | | | | | | | | | | |
| |
| Note: | Percentage of investments as shown is the ratio of the total market value to total net assets. Market value of investments in foreign securities represents 7.88% of total net assets at April 30, 2008. |
| | |
| (C) | | At April 30, 2008, the cost of securities for federal income tax purposes was $3,594,305 and the aggregate gross unrealized appreciation and depreciation based on that cost were: |
| | | | | |
| Unrealized Appreciation | | $ | 382,278 | |
| Unrealized Depreciation | | | (125,895 | ) |
| | | | | |
| Net Unrealized Appreciation | | $ | 256,383 | |
| | | | | |
| | |
| (A) | | The aggregate value of securities valued in good faith at fair value as determined under policies and procedures established by and under the supervision of the Funds’ Board of Directors at April 30, 2008 was $5,759, which represents 0.19% of total net assets. This calculation excludes securities that are principally traded on certain foreign markets and whose prices were adjusted solely pursuant to a third party pricing service methodology approved by the Board of Directors. |
| |
| (D) | | Currently non-income producing. |
| |
| (G) | | Security is partially on loan at April 30, 2008. |
| |
| (X) | | Convertible security. |
| |
| (H) | | The following securities are considered illiquid. Illiquid securities are often purchased in private placement transactions, are not registered under the Securities Act of 1933 and may have contractual restrictions on resale. A security may also be considered illiquid if the security lacks a readily available market or if its valuation has not changed for a certain period of time. Notwithstanding the foregoing, although the Mellon GLS DBT II Collateral Fund has been deemed illiquid for purposes of this report, the Mellon GLS DBT II Collateral Fund has redeemed shares daily in respect of recalled loaned securities. |
| | | | | | | | | | | |
Period
| | | | | | | | |
Acquired | | Shares/Par | | | Security | | Cost Basis | |
12/2007 –
04/2008 | | | 329,279 | | | Mellon GSL DBT II Collateral Fund | | $ | 329,279 | |
| 04/2008 | | | — | | | Washington Mutual, Inc. Preferred Stock | | | 2,000 | |
| 04/2008 | | | 292 | | | Washington Mutual, Inc. PIPE - Reg D | | | 2,556 | |
| | |
| | The aggregate value of these securities at April 30, 2008 was $335,038, which represents 11.13% of total net assets. |
| |
| | PIPE — Private Investment in Public Equity. |
The accompanying notes are an integral part of these financial statements.
211
The Hartford MidCap Fund
Schedule of Investments — (continued)
April 30, 2008 (Unaudited)
(000’s Omitted)
| | |
| (W) | | See Note 2b of accompanying Notes to Financial Statements regarding valuation of securities. |
The accompanying notes are an integral part of these financial statements.
212
The Hartford MidCap Growth Fund (formerly The Hartford Select MidCap Growth Fund)
Schedule of Investments
April 30, 2008 (Unaudited)
(000’s Omitted)
| | | | | | | | | | | | | |
| | | | | | | | | Market
| |
| Shares | | | | | | | | Value (W) | |
| COMMON STOCK — 99.2% |
| | | | | Basic Materials — 9.3% |
| | 3 | | | Airgas, Inc. | | $ | 140 | |
| | 3 | | | Ball Corp. (G) | | | 135 | |
| | 9 | | | Cabot Corp. (G) | | | 250 | |
| | 4 | | | Carlisle Cos., Inc. (G) | | | 104 | |
| | 2 | | | Carpenter Technology Corp. (G) | | | 103 | |
| | 73 | | | Chemtura Corp. | | | 502 | |
| | 3 | | | Church & Dwight Co., Inc. (G) | | | 177 | |
| | 1 | | | Cleveland-Cliffs, Inc. | | | 148 | |
| | 71 | | | Domtar Corp. (D)(G) | | | 423 | |
| | 4 | | | Lubrizol Corp. | | | 238 | |
| | 3 | | | Massey Energy Co. (G) | | | 145 | |
| | 8 | | | Nalco Holding Co. (G) | | | 177 | |
| | 3 | | | Owens-Illinois, Inc. (D) | | | 189 | |
| | 6 | | | Packaging Corp. of America | | | 133 | |
| | 6 | | | Pactiv Corp. (D) | | | 136 | |
| | 2 | | | Rohm & Haas Co. (G) | | | 105 | |
| | 11 | | | RPM International, Inc. (G) | | | 251 | |
| | 7 | | | Sealed Air Corp. (G) | | | 188 | |
| | 3 | | | Steel Dynamics, Inc. | | | 112 | |
| | 14 | | | Valspar Corp. (G) | | | 313 | |
| | | | | | | | | |
| | | | | | | | | | | | 3,969 | |
| | | | | | | | | | | | | |
| | | | | Capital Goods — 6.0% |
| | 1 | | | Alliant Techsystems, Inc. (D)(G) | | | 106 | |
| | 4 | | | Donaldson Co., Inc. (G) | | | 165 | |
| | 1 | | | Flowserve Corp. | | | 159 | |
| | 4 | | | Graco, Inc. (G) | | | 145 | |
| | 3 | | | Ingersoll-Rand Co. Class A | | | 138 | |
| | 7 | | | International Game Technology (G) | | | 236 | |
| | 5 | | | Joy Global, Inc. | | | 366 | |
| | 7 | | | Lennox International, Inc. (G) | | | 240 | |
| | 2 | | | Lincoln Electric Holdings, Inc. | | | 141 | |
| | 3 | | | National Oilwell Varco, Inc. (D) | | | 183 | |
| | 8 | | | Pitney Bowes, Inc. | | | 271 | |
| | 2 | | | Rockwell Automation, Inc. | | | 103 | |
| | 2 | | | Smith International, Inc. (G) | | | 115 | |
| | 4 | | | Textron, Inc. | | | 221 | |
| | | | | | | | | |
| | | | | | | | | | | | 2,589 | |
| | | | | | | | | | | | | |
| | | | | Consumer Cyclical — 12.7% |
| | 4 | | | Abercrombie & Fitch Co. Class A (G) | | | 328 | |
| | 3 | | | Avery Dennison Corp. | | | 152 | |
| | 5 | | | Barnes & Noble, Inc. (G) | | | 166 | |
| | 6 | | | Big Lots, Inc. (D) | | | 154 | |
| | 7 | | | Copart, Inc. (D)(G) | | | 286 | |
| | 7 | | | Dick’s Sporting Goods, Inc. (D)(G) | | | 203 | |
| | 7 | | | Fastenal Co. (G) | | | 335 | |
| | 3 | | | Foster Wheeler Ltd. (D) | | | 167 | |
| | 11 | | | GameStop Corp. Class A (D)(G) | | | 586 | |
| | 6 | | | Hill-Rom Holdings, Inc. (G) | | | 151 | |
| | 9 | | | Masco Corp. | | | 155 | |
| | 2 | | | MSC Industrial Direct Co., Inc. | | | 110 | |
| | — | | | NVR, Inc. (D)(G) | | | 260 | |
| | 4 | | | Patterson Cos., Inc. (D)(G) | | | 150 | |
| | 8 | | | RadioShack Corp. (G) | | | 116 | |
| | 4 | | | Reliance Steel & Aluminum | | | 271 | |
| | 8 | | | Ross Stores, Inc. (G) | | | 255 | |
| | 4 | | | Scotts Miracle-Gro Co. Class A (G) | | | 141 | |
| | 3 | | | Sherwin-Williams Co. | | | 159 | |
| | 5 | | | Tim Hortons, Inc. (G) | | | 175 | |
| | 9 | | | TJX Cos., Inc. | | | 279 | |
| | 17 | | | Urban Outfitters, Inc. (D) | | | 569 | |
| | 7 | | | Yum! Brands, Inc. | | | 286 | |
| | | | | | | | | |
| | | | | | | | | | | | 5,454 | |
| | | | | | | | | | | | | |
| | | | | Consumer Staples — 2.4% |
| | 5 | | | Avon Products, Inc. (G) | | | 187 | |
| | 4 | | | Hansen National Corp. (D)(G) | | | 134 | |
| | 2 | | | Loews Corp. — Carolina Group (G) | | | 139 | |
| | 5 | | | UST, Inc. (G) | | | 260 | |
| | 4 | | | William Wrigley, Jr. Co. (G) | | | 287 | |
| | | | | | | | | |
| | | | | | | | | | | | 1,007 | |
| | | | | | | | | | | | | |
| | | | | Energy — 9.6% |
| | 7 | | | BJ Services Co. (G) | | | 209 | |
| | 6 | | | Chesapeake Energy Corp. | | | 286 | |
| | 1 | | | Constellation Energy Group, Inc. (G) | | | 107 | |
| | 3 | | | ENSCO International, Inc. | | | 168 | |
| | 10 | | | Frontier Oil Corp. (G) | | | 240 | |
| | 7 | | | Helix Energy Solutions Group, Inc. (D) | | | 245 | |
| | 3 | | | Holly Corp. (G) | | | 139 | |
| | 6 | | | Nabors Industries Ltd. (D)(G) | | | 220 | |
| | 4 | | | Pride International, Inc. (D)(G) | | | 188 | |
| | 6 | | | Rowan Companies, Inc. (G) | | | 221 | |
| | 7 | | | Sunoco, Inc. (G) | | | 323 | |
| | 2 | | | Superior Energy Services, Inc. (D)(G) | | | 102 | |
| | 20 | | | Tesoro Corp. (G) | | | 494 | |
| | 4 | | | Unit Corp. (D)(G) | | | 257 | |
| | 8 | | | W&T Offshore, Inc. (G) | | | 318 | |
| | 3 | | | Weatherford International Ltd. (D)(G) | | | 204 | |
| | 37 | | | Western Refining, Inc. (G) | | | 374 | |
| | | | | | | | | |
| | | | | | | | | | | | 4,095 | |
| | | | | | | | | | | | | |
| | | | | Finance — 13.9% |
| | 2 | | | Bank of Hawaii Corp. | | | 110 | |
| | 1 | | | Blackrock, Inc. (G) | | | 202 | |
| | 4 | | | Eaton Vance Corp. (G) | | | 132 | |
| | 2 | | | Erie Indemnity Co. | | | 101 | |
| | 1 | | | Federal Realty Investment Trust | | | 119 | |
| | 9 | | | Federated Investors, Inc. (G) | | | 301 | |
| | 43 | | | GLG Partners, Inc. (G) | | | 356 | |
| | 5 | | | Health Care, Inc. (G) | | | 221 | |
| | 10 | | | Health Net, Inc. (D) | | | 289 | |
| | 9 | | | Hudson City Bancorp, Inc. | | | 165 | |
| | 9 | | | Humana, Inc. (D) | | | 425 | |
| | 1 | | | IntercontinentalExchange, Inc. (D) | | | 195 | |
| | 6 | | | Invesco Ltd. | | | 142 | |
| | 2 | | | Investment Technology Group, Inc. (D) | | | 116 | |
| | 2 | | | Mastercard, Inc. (G) | | | 685 | |
| | 7 | | | Nasdaq Stock Market, Inc. (D)(G) | | | 261 | |
| | 2 | | | Northern Trust Corp. (G) | | | 165 | |
| | 1 | | | Nymex Holdings, Inc. | | | 112 | |
| | 2 | | | PartnerRe Ltd. (G) | | | 176 | |
| | 1 | | | Public Storage | | | 125 | |
| | 4 | | | T. Rowe Price Group, Inc. (G) | | | 211 | |
| | 5 | | | Taubman Centers, Inc. (G) | | | 303 | |
| | 9 | | | TD Ameritrade Holding Corp. (D) | | | 160 | |
| | 7 | | | UDR, Inc. | | | 169 | |
| | 7 | | | Ventas, Inc. | | | 353 | |
| | 8 | | | Wellcare Health Plans, Inc. (D)(G) | | | 341 | |
| | | | | | | | | |
| | | | | | | | | | | | 5,935 | |
| | | | | | | | | | | | | |
| | | | | | | | | | | | | |
The accompanying notes are an integral part of these financial statements.
213
The Hartford MidCap Growth Fund (formerly The Hartford Select MidCap Growth Fund)
Schedule of Investments — (continued)
April 30, 2008 (Unaudited)
(000’s Omitted)
| | | | | | | | | | | | | |
| | | | | | | | | Market
| |
| Shares | | | | | | | | Value (W) | |
| | | | | | | | | | | | | |
| COMMON STOCK — (continued) |
| | | | | Health Care — 7.7% |
| | 2 | | | Allergan, Inc. | | $ | 122 | |
| | 4 | | | Amerisource Bergen Corp. | | | 150 | |
| | 2 | | | Bard (C.R.), Inc. | | | 215 | |
| | 3 | | | Community Health Systems, Inc. (D) | | | 120 | |
| | 3 | | | Covance, Inc. (D) | | | 214 | |
| | 3 | | | Coventry Health Care, Inc. (D)(G) | | | 142 | |
| | 9 | | | Endo Pharmaceuticals Holdings, Inc. (D)(G) | | | 215 | |
| | 4 | | | Forest Laboratories, Inc. (D) | | | 153 | |
| | 6 | | | Herbalife Ltd. (G) | | | 249 | |
| | 4 | | | Hospira, Inc. (D) | | | 145 | |
| | 1 | | | Intuitive Surgical, Inc. (D)(G) | | | 348 | |
| | 4 | | | Kinetic Concepts, Inc. (D) | | | 151 | |
| | 2 | | | Laboratory Corp. of America Holdings (D)(G) | | | 113 | |
| | 5 | | | Pharmaceutical Product Development, Inc. | | | 195 | |
| | 10 | | | Sepracor, Inc. (D)(G) | | | 212 | |
| | 3 | | | St. Jude Medical, Inc. (D)(G) | | | 136 | |
| | 4 | | | Varian Medical Systems, Inc. (D)(G) | | | 204 | |
| | 7 | | | Watson Pharmaceuticals, Inc. (D)(G) | | | 209 | |
| | | | | | | | | |
| | | | | | | | | | | | 3,293 | |
| | | | | | | | | | | | | |
| | | | | Services — 9.9% |
| | 6 | | | Apollo Group, Inc. Class A (D)(G) | | | 291 | |
| | 6 | | | Autodesk, Inc. (D)(G) | | | 228 | |
| | 9 | | | Broadridge Financial Solutions (G) | | | 169 | |
| | 2 | | | C.H. Robinson Worldwide, Inc. (G) | | | 150 | |
| | 11 | | | CTC Media, Inc. (D) | | | 281 | |
| | 2 | | | DST Systems, Inc. (D)(G) | | | 122 | |
| | 12 | | | Electronic Data Systems Corp. (G) | | | 231 | |
| | 3 | | | Express Scripts, Inc. (D) | | | 240 | |
| | 2 | | | Factset Research Systems, Inc. (G) | | | 105 | |
| | 1 | | | Fluor Corp. (G) | | | 119 | |
| | 2 | | | Harsco Corp. | | | 110 | |
| | 6 | | | Hewitt Associates, Inc. (D) | | | 237 | |
| | 1 | | | Jacobs Engineering Group, Inc. (D) | | | 113 | |
| | 4 | | | Liberty Global, Inc. (D)(G) | | | 132 | |
| | 3 | | | Paychex, Inc. (G) | | | 109 | |
| | 3 | | | Pediatrix Medical Group, Inc. (D) | | | 212 | |
| | 10 | | | Regal Entertainment Group | | | 197 | |
| | 5 | | | Republic Services, Inc. | | | 153 | |
| | 4 | | | SEI Investments Co. | | | 100 | |
| | 3 | | | Stericycle, Inc. (D)(G) | | | 166 | |
| | 11 | | | Synopsys, Inc. (D) | | | 243 | |
| | 9 | | | URS Corp. (D) | | | 366 | |
| | 4 | | | Weight Watchers International, Inc. | | | 170 | |
| | | | | | | | | |
| | | | | | | | | | | | 4,244 | |
| | | | | | | | | | | | | |
| | | | | Technology — 23.5% |
| | 14 | | | Activision, Inc. (D) | | | 384 | |
| | 4 | | | Affiliated Computer Services, Inc. Class A (D)(G) | | | 236 | |
| | 4 | | | Agilent Technologies, Inc. (D)(G) | | | 114 | |
| | 3 | | | Amphenol Corp. Class A (G) | | | 115 | |
| | 4 | | | Analog Devices, Inc. | | | 139 | |
| | 6 | | | Applera Corp. — Applied Biosystems Group | | | 176 | |
| | 5 | | | Arrow Electronics, Inc. (D)(G) | | | 123 | |
| | 12 | | | BMC Software, Inc. (D)(G) | | | 413 | |
| | 39 | | | Brocade Communications Systems, Inc. (D)(G) | | | 279 | |
| | 9 | | | CA, Inc. (G) | | | 206 | |
| | 15 | | | Citizens Communications Co. (G) | | | 158 | |
| | 26 | | | Compuware Corp. (D)(G) | | | 196 | |
| | 5 | | | Cree, Inc. (D)(G) | | | 119 | |
| | 4 | | | Dentsply International, Inc. (G) | | | 167 | |
| | 10 | | | Dolby Laboratories, Inc. Class A (D) | | | 410 | |
| | 3 | | | Electronic Arts, Inc. (D) | | | 131 | |
| | 2 | | | First Solar, Inc. (D)(G) | | | 443 | |
| | 2 | | | Fiserv, Inc. (D) | | | 109 | |
| | 3 | | | Harris Corp. | | | 179 | |
| | 4 | | | Hubbell, Inc. Class B | | | 174 | |
| | 6 | | | IMS Health, Inc. | | | 144 | |
| | 2 | | | L-3 Communications Holdings, Inc. | | | 192 | |
| | 4 | | | Lam Research Corp. (D)(G) | | | 176 | |
| | 26 | | | LSI Corp. (D)(G) | | | 159 | |
| | 3 | | | McAfee, Inc. (D) | | | 103 | |
| | 2 | | | MEMC Electronic Materials, Inc. (D) | | | 129 | |
| | 6 | | | Microchip Technology, Inc. (G) | | | 234 | |
| | 3 | | | Millipore Corp. (D)(G) | | | 179 | |
| | 20 | | | National Semiconductor Corp. (G) | | | 409 | |
| | 8 | | | NCR Corp. (D)(G) | | | 187 | |
| | 9 | | | NetApp, Inc. (D)(G) | | | 214 | |
| | 8 | | | NVIDIA Corp. (D)(G) | | | 171 | |
| | 21 | | | QLogic Corp. (D) | | | 340 | |
| | 3 | | | Rockwell Collins, Inc. (G) | | | 161 | |
| | 7 | | | SBA Communications Corp. (D)(G) | | | 213 | |
| | 21 | | | Seagate Technology (G) | | | 400 | |
| | 9 | | | Silicon Laboratories, Inc. (D)(G) | | | 307 | |
| | 12 | | | Telephone and Data Systems, Inc. | | | 475 | |
| | 8 | | | Teradata Corp. (D)(G) | | | 169 | |
| | 5 | | | US Cellular Corp. (D)(G) | | | 271 | |
| | 8 | | | VeriSign, Inc. (D)(G) | | | 297 | |
| | 5 | | | Waters Corp. (D)(G) | | | 284 | |
| | 14 | | | Western Digital Corp. (D)(G) | | | 394 | |
| | 5 | | | Zebra Technologies Corp. Class A (D)(G) | | | 176 | |
| | | | | | | | | |
| | | | | | | | | | | | 10,055 | |
| | | | | | | | | | | | | |
| | | | | Transportation — 1.6% |
| | 3 | | | CSX Corp. (G) | | | 214 | |
| | 5 | | | Frontline Ltd. (G) | | | 297 | |
| | 3 | | | Kirby Corp. (D)(G) | | | 186 | |
| | | | | | | | | |
| | | | | | | | | | | | 697 | |
| | | | | | | | | | | | | |
| | | | | Utilities — 2.6% |
| | 21 | | | CenterPoint Energy, Inc. (G) | | | 313 | |
| | 18 | | | Dynegy Holdings, Inc. (D)(G) | | | 154 | |
| | 5 | | | NRG Energy, Inc. (D)(G) | | | 223 | |
| | 32 | | | Sierra Pacific Resources | | | 435 | |
| | | | | | | | | |
| | | | | | | | | | | | 1,125 | |
| | | | | | | | | | | | | |
| | | | | Total common stock
(cost $44,144) | | $ | 42,463 | |
| | | | | | | | | | | | | |
| | | | | | | | | | | | | |
| EXCHANGE TRADED FUNDS — 0.3% |
| | | | | Other Investment Pools and Funds — 0.3% |
| | 1 | | | iShares Russell Midcap Growth | | $ | 130 | |
| | | | | | | | | |
| | | | | Total exchange traded funds
(cost $128) | | $ | 130 | |
| | | | | | | | | |
| | | | | Total long-term investments
(cost $44,272) | | $ | 42,593 | |
| | | | | | | | | |
| | | | | | | | | | | | | |
| | | | | | | | | | | | | |
| | | | | | | | | | | | | |
The accompanying notes are an integral part of these financial statements.
214
| | | | | | | | | | | | | |
Principal
| | | | | | | | Market
| |
| Amount | | | | | | | | Value (W) | |
| |
| SHORT-TERM INVESTMENTS — 28.4% |
| | | | | Repurchase Agreements — 0.2% |
| | | | | BNP Paribas Securities Corp. Repurchase Agreement (maturing on 05/01/2008 in the amount of $29, collateralized by U.S. Treasury Bond 5.50%, 2028, value of $30) | | | | |
| $ | 29 | | | 1.90% dated 04/30/2008 | | $ | 29 | |
| | | | | RBS Greenwich Capital Markets Repurchase Agreement (maturing on 05/01/2008 in the amount of $29, collateralized by U. S. Treasury Note 4.50%, 2011, value of $29) | | | | |
| | 29 | | | 1.90% dated 04/30/2008 | | | 29 | |
| | | | | UBS Securities, Inc. Repurchase Agreement (maturing on 05/01/2008 in the amount of $42, collateralized by U.S. Treasury Bond 6.00% — 8.75%, 2020 — 2026, U.S. Treasury Note 4.75% — 13.25%, 2008 — 2016, value of $43) | | | | |
| | 41 | | | 1.90% dated 04/30/2008 | | | 41 | |
| | | | | | | | | |
| | | | | | | | | | | | 99 | |
| | | | | | | | | | | | | |
| | | | | | | | | | | | | |
| | | | | | | | | | | | | |
| Shares | | | | | | | | | |
| |
| | | | | Securities Purchased with Proceeds from Security Lending — 28.1% |
| | | | | Cash Collateral Reinvestment Fund: |
| | 12,046 | | | Navigator Prime Portfolio | | | 12,046 | |
| | | | | | | | | | | | | |
| | | | | | | | | | | | | |
Principal
| | | | | | | | | |
| Amount | | | | | | | | | |
| |
| | | | | U.S. Treasury Bills — 0.1% |
| $ | 20 | | | 1.43%, 06/12/2008 (M)(S) | | | 20 | |
| | | | | | | | | |
| | | | | Total short-term investments
(cost $12,165) | | $ | 12,165 | |
| | | | | | | | | |
| | | | | Total investments
(cost $56,437) (C) | | | 127.9 | % | | $ | 54,758 | |
| | | | | Other assets and liabilities | | | (27.9 | )% | | | (11,932 | ) |
| | | | | | | | | | | | | |
| | | | | Total net assets | | | 100.0 | % | | $ | 42,826 | |
| | | | | | | | | | | | | |
| |
| Note: | Percentage of investments as shown is the ratio of the total market value to total net assets. |
| | |
| (C) | | At April 30, 2008, the cost of securities for federal income tax purposes was $56,482 and the aggregate gross unrealized appreciation and depreciation based on that cost were: |
| | | | | |
| Unrealized Appreciation | | $ | 2,558 | |
| Unrealized Depreciation | | | (4,282 | ) |
| | | | | |
| Net Unrealized Depreciation | | $ | (1,724 | ) |
| | | | | |
| | |
| (D) | | Currently non-income producing. |
| |
| (G) | | Security is partially on loan at April 30, 2008. |
| |
| (M) | | The interest rate disclosed for these securities represents the effective yield on the date of acquisition. |
| |
| (S) | | Security pledged as initial margin deposit for open futures contracts at April 30, 2008. |
| |
| | Futures Contracts Outstanding at April 30, 2008 |
| | | | | | | | | | | | | | | | | |
| | | | | | | | | | | | Unrealized
| |
| | | Number of
| | | | | | Expiration
| | | Appreciation/
| |
Description | | Contracts* | | | Position | | | Month | | | (Depreciation) | |
| |
| S&P Mid 400 Mini Futures | | | 1 | | | | Long | | | | Jun 2008 | | | $ | 7 | |
| | | | | | | | | | | | | | | | | |
| | |
| | * The number of contracts does not omit 000’s. |
| |
| (W) | | See Note 2b of accompanying Notes to Financial Statements regarding valuation of securities. |
The accompanying notes are an integral part of these financial statements.
215
The Hartford MidCap Value Fund
Schedule of Investments
April 30, 2008 (Unaudited)
(000’s Omitted)
| | | | | | | | | | | | | |
| | | | | | | | | Market
| |
| Shares | | | | | | | | Value (W) | |
| COMMON STOCK — 97.7% |
| | | | | Basic Materials — 16.1% |
| | 71 | | | Agrium, Inc. | | $ | 5,617 | |
| | 23 | | | Arch Coal, Inc. | | | 1,291 | |
| | 111 | | | Celanese Corp. (G) | | | 4,963 | |
| | 58 | | | Chemtura Corp. | | | 398 | |
| | 25 | | | Cleveland-Cliffs, Inc. (G) | | | 4,026 | |
| | 20 | | | Cytec Industries, Inc. | | | 1,156 | |
| | 122 | | | FMC Corp. | | | 7,659 | |
| | 67 | | | Greif, Inc. | | | 4,302 | |
| | 5,146 | | | Kingboard Laminates Holdings (G) | | | 3,529 | |
| | 78 | | | Owens-Illinois, Inc. (D) | | | 4,291 | |
| | 135 | | | Pactiv Corp. (D) | | | 3,202 | |
| | 122 | | | Pentair, Inc. (G) | | | 4,501 | |
| | 163 | | | Rhodia S.A. (D) | | | 3,359 | |
| | 32 | | | Ternium S.A. ADR | | | 1,106 | |
| | 466 | | | Uranium One, Inc. (D) | | | 2,152 | |
| | 148 | | | USEC, Inc. (D)(G) | | | 685 | |
| | | | | | | | | |
| | | | | | | | | | | | 52,237 | |
| | | | | | | | | | | | | |
| | | | | Capital Goods — 8.1% |
| | 20 | | | AGCO Corp. (D)(G) | | | 1,172 | |
| | 52 | | | Alliant Techsystems, Inc. (D)(G) | | | 5,752 | |
| | 117 | | | Kennametal, Inc. | | | 4,061 | |
| | 220 | | | Teradyne, Inc. (D) | | | 2,928 | |
| | 101 | | | Toro Co. (G) | | | 4,298 | |
| | 224 | | | Varian Semiconductor Equipment Associates, Inc. (D)(G) | | | 8,188 | |
| | | | | | | | | |
| | | | | | | | | | | | 26,399 | |
| | | | | | | | | | | | | |
| | | | | Consumer Cyclical — 9.0% |
| | 169 | | | American Eagle Outfitters, Inc. | | | 3,104 | |
| | 2,375 | | | Buck Holdings L.P. (A)(D)(H) | | | 2,138 | |
| | 80 | | | Copart, Inc. (D) | | | 3,274 | |
| | 112 | | | Liz Claiborne, Inc. (G) | | | 1,987 | |
| | 120 | | | MDC Holdings, Inc. | | | 5,238 | |
| | 113 | | | Newell Rubbermaid, Inc. | | | 2,316 | |
| | 190 | | | TRW Automotive Holdings Corp. (D) | | | 4,844 | |
| | 83 | | | United Stationers, Inc. (D)(G) | | | 3,659 | |
| | 60 | | | Wabco Holdings, Inc. | | | 2,889 | |
| | | | | | | | | |
| | | | | | | | | | | | 29,449 | |
| | | | | | | | | | | | | |
| | | | | Consumer Staples — 6.6% |
| | 25 | | | Bunge Ltd. Finance Corp. (G) | | | 2,818 | |
| | 2,284 | | | Chaoda Modern Agriculture | | | 3,285 | |
| | 99 | | | Cosan Ltd. (D) | | | 1,307 | |
| | 208 | | | Dean Foods Co. (D)(G) | | | 4,841 | |
| | 129 | | | Marfig Frigorificos E Comer | | | 1,503 | |
| | 7,821 | | | Marine Harvest (D)(G) | | | 5,133 | |
| | 87 | | | Smithfield Foods, Inc. (D)(G) | | | 2,498 | |
| | | | | | | | | |
| | | | | | | | | | | | 21,385 | |
| | | | | | | | | | | | | |
| | | | | Energy — 6.3% |
| | 166 | | | Brasil EcoDiesel ADR (D) | | | 466 | |
| | 314 | | | Brasil EcoDiesel Industria (D)(I) | | | 882 | |
| | 79 | | | Cie Gen Geophysique ADR (D) | | | 3,952 | |
| | 124 | | | Newfield Exploration Co. (D) | | | 7,522 | |
| | 32 | | | Noble Energy, Inc. | | | 2,775 | |
| | 195 | | | UGI Corp. | | | 5,062 | |
| | | | | | | | | |
| | | | | | | | | | | | 20,659 | |
| | | | | | | | | | | | | |
| | | | | Finance — 16.3% |
| | 42 | | | Affiliated Managers Group, Inc. (D)(G) | | | 4,152 | |
| | 373 | | | CIT Group, Inc. (G) | | | 4,061 | |
| | 42 | | | Everest Re Group Ltd. | | | 3,795 | |
| | 222 | | | Genesis Lease Ltd. | | | 2,996 | |
| | 304 | | | Huntington Bancshares, Inc. (G) | | | 2,857 | |
| | 128 | | | Liberty Property Trust (G) | | | 4,473 | |
| | 50 | | | M&T Bank Corp. (G) | | | 4,643 | |
| | 68 | | | National City Corp. (A)(H) | | | 386 | |
| | 214 | | | PHH Corp. (D)(G) | | | 4,197 | |
| | 124 | | | Platinum Underwriters Holdings Ltd. | | | 4,459 | |
| | 344 | | | Popular, Inc. (G) | | | 4,284 | |
| | 120 | | | Reinsurance Group of America, Inc. (G) | | | 6,252 | |
| | 402 | | | Sovereign Bancorp, Inc. (G) | | | 3,002 | |
| | 154 | | | Unum Group (G) | | | 3,567 | |
| | | | | | | | | |
| | | | | | | | | | | | 53,124 | |
| | | | | | | | | | | | | |
| | | | | Health Care — 8.8% |
| | 171 | | | Barr Pharmaceuticals, Inc. (D) | | | 8,564 | |
| | 89 | | | Cooper Co., Inc. (G) | | | 3,129 | |
| | 187 | | | Endo Pharmaceuticals Holdings, Inc. (D) | | | 4,646 | |
| | 456 | | | Impax Laboratories, Inc. (D) | | | 4,220 | |
| | 186 | | | Theravance, Inc. (D)(G) | | | 2,328 | |
| | 120 | | | West Pharmaceutical Services (G) | | | 5,624 | |
| | | | | | | | | |
| | | | | | | | | | | | 28,511 | |
| | | | | | | | | | | | | |
| | | | | Services — 4.5% |
| | 137 | | | CACI International, Inc. Class A (D)(G) | | | 6,882 | |
| | 138 | | | R.R. Donnelley & Sons Co. | | | 4,231 | |
| | 85 | | | URS Corp. (D) | | | 3,409 | |
| | | | | | | | | |
| | | | | | | | | | | | 14,522 | |
| | | | | | | | | | | | | |
| | | | | Technology — 12.9% |
| | 235 | | | Arrow Electronics, Inc. (D) | | | 6,397 | |
| | 62 | | | Embarq Corp. (G) | | | 2,569 | |
| | 336 | | | Fairchild Semiconductor International, Inc. (D) | | | 4,387 | |
| | 4,042 | | | First Pacific Co., Ltd. | | | 2,962 | |
| | 582 | | | Flextronics International Ltd. (D) | | | 6,044 | |
| | 340 | | | JDS Uniphase Corp. (D)(G) | | | 4,871 | |
| | 143 | | | McAfee, Inc. (D) | | | 4,765 | |
| | 60 | | | NCR Corp. (D)(G) | | | 1,483 | |
| | 182 | | | Solar Cayman Ltd. (A)(D)(H) | | | 2,445 | |
| | 47 | | | Teleflex, Inc. | | | 2,611 | |
| | 211 | | | Virgin Media, Inc. (G) | | | 2,719 | |
| | 12 | | | Whirlpool Corp. (G) | | | 866 | |
| | | | | | | | | |
| | | | | | | | | | | | 42,119 | |
| | | | | | | | | | | | | |
| | | | | Transportation — 3.8% |
| | 195 | | | American Commercial Lines, Inc. (D)(G) | | | 3,085 | |
| | 492 | | | Northwest Airlines Corp. (D)(G) | | | 4,750 | |
| | 226 | | | Werner Enterprises, Inc. (G) | | | 4,399 | |
| | | | | | | | | |
| | | | | | | | | | | | 12,234 | |
| | | | | | | | | | | | | |
| | | | | Utilities — 5.3% |
| | 189 | | | Northeast Utilities | | | 4,972 | |
| | 41 | | | SBM Offshore N.V. | | | 1,564 | |
| | 330 | | | Sierra Pacific Resources | | | 4,498 | |
| | 132 | | | Wisconsin Energy Corp. | | | 6,269 | |
| | | | | | | | | |
| | | | | | | | | | | | 17,303 | |
| | | | | | | | | | | | | |
| | | | | Total common stock
(cost $310,761) | | $ | 317,942 | |
| | | | | | | | | |
| | | | | | | | | | | | | |
| | | | | | | | | | | | | |
| | | | | | | | | | | | | |
The accompanying notes are an integral part of these financial statements.
216
| | | | | | | | | | | | | |
| | | | | | | | | Market
| |
| Shares | | | | | | | | Value (W) | |
| PREFERRED STOCK — 1.1% |
| | | | | Finance — 1.1% |
| | — | | | National City Corp. (A)(D)(H)(X) | | $ | 3,289 | |
| | 45 | | | Thornburg Mortgage, Inc. (X) | | | 213 | |
| | | | | | | | | |
| | | | | Total preferred stock
(cost $3,943) | | $ | 3,502 | |
| | | | | | | | | |
| | | | | Total long-term investments
(cost $314,704) | | $ | 321,444 | |
| | | | | | | | | | | | | |
| | | | | | | | | | | | | |
Principal
| | | | | | | | | |
| Amount | | | | | | | | | |
| |
| SHORT-TERM INVESTMENTS — 28.8% |
| | | | | Repurchase Agreements — 1.0% |
| | | | | Banc of America Securities TriParty Joint Repurchase Agreement (maturing on 05/01/2008 in the amount of $1,201, collateralized by FHLMC 5.00%, 2035, value of $1,225) | | | | |
| $ | 1,201 | | | 1.98% dated 04/30/2008 | | $ | 1,201 | |
| | | | | BNP Paribas Securities Corp. TriParty Joint Repurchase Agreement (maturing on 05/01/2008 in the amount of $589, collateralized by FNMA 5.50% — 6.50%, 2036 — 2038, value of $601) | | | | |
| | 589 | | | 2.00% dated 04/30/2008 | | | 589 | |
| | | | | Deutsche Bank Securities Joint Repurchase Agreement (maturing on 05/01/2008 in the amount of $1, collateralized by U. S. Treasury Note 3.63%, 2009, value of $1) | | | | |
| | 1 | | | 1.90% dated 04/30/2008 | | | 1 | |
| | | | | Deutsche Bank Securities TriParty Joint Repurchase Agreement (maturing on 05/01/2008 in the amount of $732, collateralized by FHLMC 4.50% — 7.00%, 2016 — 2038, value of $747) | | | | |
| | 732 | | | 2.00% dated 04/30/2008 | | | 732 | |
| | | | | JP Morgan Chase TriParty Joint Repurchase Agreement (maturing on 05/01/2008 in the amount of $705, collateralized by FNMA 4.50% — 7.00%, 2020 — 2038, value of $720) | | | | |
| | 705 | | | 1.96% dated 04/30/2008 | | | 705 | |
| | | | | | | | | |
| | | | | | | | | | | | 3,228 | |
| | | | | | | | | | | | | |
| | | | | | | | | | | | | |
| | | | | | | | | | | | | |
| Shares | | | | | | | | | |
| |
| | | | | Securities Purchased with Proceeds from Security Lending — 27.8% |
| | | | | Cash Collateral Reinvestment Fund: |
| | 61,763 | | | Goldman Sachs FS Prime Obligation/Institutional Fund | | | 61,763 | |
| | 28,655 | | | Mellon GSL DBT II Collateral Fund (H) | | | 28,655 | |
| | | | | | | | | |
| | | | | | | | | | | | 90,418 | |
| | | | | | | | | | | | | |
| | | | | Total short-term investments
(cost $93,646) | | $ | 93,646 | |
| | | | | | | | | |
| | | | | Total investments
(cost $408,350) (C) | | | 127.6 | % | | $ | 415,090 | |
| | | | | Other assets and liabilities | | | (27.6 | )% | | | (89,828 | ) |
| | | | | | | | | | | | | |
| | | | | Total net assets | | | 100.0 | % | | $ | 325,262 | |
| | | | | | | | | | | | | |
| |
| Note: | Percentage of investments as shown is the ratio of the total market value to total net assets. Market value of investments in foreign securities represents 12.24% of total net assets at April 30, 2008. |
| | |
| (C) | | At April 30, 2008, the cost of securities for federal income tax purposes was $409,019 and the aggregate gross unrealized appreciation and depreciation based on that cost were: |
| | | | | |
| I L l | | | | |
| Unrealized Appreciation | | $ | 44,118 | |
| Unrealized Depreciation | | | (38,047 | ) |
| | | | | |
| Net Unrealized Appreciation | | $ | 6,071 | |
| | | | | |
| | |
| (A) | | The aggregate value of securities valued in good faith at fair value as determined under policies and procedures established by and under the supervision of the Funds’ Board of Directors at April 30, 2008 was $8,258, which represents 2.54% of total net assets. This calculation excludes securities that are principally traded on certain foreign markets and whose prices were adjusted solely pursuant to a third party pricing service methodology approved by the Board of Directors. |
| |
| (D) | | Currently non-income producing. |
| |
| (G) | | Security is partially on loan at April 30, 2008. |
| |
| (I) | | Securities issued within terms of a private placement memorandum, exempt from registration under Section 144A of the Securities Act of 1933, as amended, and may be sold only to qualified institutional buyers. Pursuant to guidelines adopted by the Board of Directors, these issues are determined to be liquid. The aggregate value of these securities at April 30, 2008 was $882, which represents 0.27% of total net assets. |
| |
| (X) | | Convertible security. |
| |
| (H) | | The following securities are considered illiquid. Illiquid securities are often purchased in private placement transactions, are not registered under the Securities Act of 1933 and may have contractual restrictions on resale. A security may also be considered illiquid if the security lacks a readily available market or if its valuation has not changed for a certain period of time. Notwithstanding the foregoing, although the Mellon GLS DBT II Collateral Fund has been deemed illiquid for purposes of this report, the Mellon GLS DBT II Collateral Fund has redeemed shares daily in respect of recalled loaned securities. |
| | | | | | | | | | | |
Period
| | | | | | | | |
Acquired | | Shares/Par | | | Security | | Cost Basis | |
| 06/2007 | | | 2,375 | | | Buck Holdings L.P. | | $ | 2,378 | |
12/2007 –
04/2008 | | | 28,655 | | | Mellon GSL DBT II Collateral Fund | | | 28,655 | |
| 04/2008 | | | 68 | | | National City Corp. | | | 341 | |
| 04/2008 | | | — | | | National City Corp. Preferred Stock | | | 2,900 | |
| 03/2007 | | | 182 | | | Solar Cayman Ltd. | | | 2,733 | |
| | |
| | The aggregate value of these securities at April 30, 2008 was $36,913, which represents 11.35% of total net assets. |
| |
| (W) | | See Note 2b of accompanying Notes to Financial Statements regarding valuation of securities. |
The accompanying notes are an integral part of these financial statements.
217
The Hartford Money Market Fund
Schedule of Investments
April 30, 2008 (Unaudited)
(000’s Omitted)
| | | | | | | | | | | | | |
Principal
| | | | | | | | Market
| |
| Amount | | | | | | | | Value (W) | |
| | | | | Capital Goods — 1.0% |
| | | | | Caterpillar, Inc. | | | | |
| $ | 6,000 | | | 2.14%, 05/05/2008 | | $ | 5,999 | |
| | | | | Consumer Cyclical — 2.6% |
| | | | | Eksportfinans AS | | | | |
| | 5,000 | | | 2.28%, 07/07/2008 (I) | | | 4,979 | |
| | 3,400 | | | 2.76%, 06/03/2008 (I) | | | 3,391 | |
| | 7,750 | | | 2.85%, 05/13/2008 (I) | | | 7,743 | |
| | | | | | | | | |
| | | | | | | | | | | | 16,113 | |
| | | | | | | | | | | | | |
| | | | | Consumer Staples — 2.4% |
| | | | | KFW International Holdings | | | | |
| | 2,000 | | | 2.25%, 05/12/2008 (I) | | | 1,999 | |
| | | | | Unilever Capital Corp. | | | | |
| | 3,750 | | | 2.19%, 05/16/2008 (I) | | | 3,746 | |
| | 9,250 | | | 2.71%, 08/11/2008 (I)(L) | | | 9,248 | |
| | | | | | | | | |
| | | | | | | | | | | | 14,993 | |
| | | | | | | | | | | | | |
| | | | | Energy — 2.5% |
| | | | | ConocoPhillips | | | | |
| | 3,250 | | | 2.30%, 05/01/2008 (I) | | | 3,250 | |
| | 3,000 | | | 2.37%, 05/28/2008 (I) | | | 2,995 | |
| | 3,250 | | | 2.75%, 05/06/2008 | | | 3,249 | |
| | 6,250 | | | 2.76%, 05/06/2008 (I) | | | 6,247 | |
| | | | | | | | | |
| | | | | | | | | | | | 15,741 | |
| | | | | | | | | | | | | |
| | | | | Finance — 86.5% |
| | | | | American Express Credit Corp. | | | | |
| | 3,750 | | | 2.47%, 05/05/2008 | | | 3,749 | |
| | 4,000 | | | 2.54%, 06/17/2008 | | | 3,987 | |
| | 5,250 | | | 2.78%, 05/20/2008 | | | 5,242 | |
| | | | | American General Finance. | | | | |
| | 3,250 | | | 2.76%, 05/29/2008 | | | 3,243 | |
| | 3,000 | | | 2.81%, 06/09/2008 | | | 2,991 | |
| | | | | American Honda Finance Corp. | | | | |
| | 2,750 | | | 2.82%, 04/02/2009 (I)(L) | | | 2,750 | |
| | 3,700 | | | 2.96%, 09/18/2008 (I)(L) | | | 3,700 | |
| | 4,600 | | | 3.07%, 09/05/2008 (I)(L) | | | 4,603 | |
| | 2,500 | | | 3.15%, 08/06/2008 (I)(L) | | | 2,499 | |
| | | | | Australia & New Zealand Banking GR | | | | |
| | 6,250 | | | 2.43%, 06/02/2008 (I) | | | 6,237 | |
| | 3,500 | | | 2.82%, 07/24/2008 (I) | | | 3,477 | |
| | 3,000 | | | 3.00%, 05/06/2008 (I) | | | 2,999 | |
| | | | | Bank of America Corp. | | | | |
| | 3,750 | | | 2.75%, 08/25/2008 | | | 3,717 | |
| | 3,500 | | | 2.78%, 07/21/2008 | | | 3,478 | |
| | 5,500 | | | 2.90%, 06/06/2008 | | | 5,484 | |
| | | | | Bank of Nova Scotia | | | | |
| | 6,250 | | | 2.71%, 05/13/2008 | | | 6,244 | |
| | 4,750 | | | 2.77%, 04/09/2009 (I)(L) | | | 4,750 | |
| | 4,000 | | | 5.54%, 06/19/2008 | | | 3,986 | |
| | | | | Bank of Scotland | | | | |
| | 5,250 | | | 2.65%, 05/09/2008 | | | 5,247 | |
| | 3,750 | | | 2.93%, 06/24/2008 | | | 3,734 | |
| | | | | Caterpillar Financial Services Corp. | | | | |
| | 7,000 | | | 2.73%, 09/10/2008 (L) | | | 6,995 | |
| | | | | Citigroup Funding, Inc. | | | | |
| | 3,750 | | | 2.87%, 07/28/2008 | | | 3,724 | |
| | 3,500 | | | 3.01%, 06/20/2008 | | | 3,485 | |
| | 4,500 | | | 3.16%, 05/02/2008 (L) | | | 4,500 | |
| | 4,700 | | | 4.90%, 05/01/2008 | | | 4,700 | |
| | | | | Danske Bank | | | | |
| | 4,600 | | | 2.68%, 06/12/2008 | | | 4,586 | |
| | 3,000 | | | 2.77%, 08/19/2008 (I)(L) | | | 3,000 | |
| | | | | Danske Corp. | | | | |
| | 1,500 | | | 2.77%, 05/27/2008 | | | 1,497 | |
| | 3,000 | | | 2.87%, 06/04/2008 | | | 2,992 | |
| | | | | Federal Home Loan Bank | | | | |
| | 4,500 | | | 2.02%, 05/23/2008 | | | 4,495 | |
| | 5,500 | | | 2.05%, 07/23/2008 | | | 5,474 | |
| | 5,000 | | | 2.07%, 07/11/2008 | | | 4,980 | |
| | 6,500 | | | 2.09%, 06/25/2008 | | | 6,479 | |
| | 8,000 | | | 2.11%, 06/13/2008 | | | 7,980 | |
| | 9,016 | | | 2.12%, 09/26/2008 — 10/29/2008 | | | 8,930 | |
| | 5,500 | | | 2.13%, 10/03/2008 | | | 5,450 | |
| | 4,000 | | | 2.14%, 09/03/2008 | | | 3,971 | |
| | 4,500 | | | 2.17%, 06/11/2008 | | | 4,489 | |
| | | | | Federal Home Loan Mortgage Corp. | | | | |
| | 12,750 | | | 2.07%, 07/07/2008 — 08/15/2008 | | | 12,683 | |
| | 6,000 | | | 2.08%, 06/12/2008 | | | 5,986 | |
| | 4,250 | | | 2.10%, 10/20/2008 | | | 4,208 | |
| | 4,500 | | | 2.11%, 09/29/2008 | | | 4,461 | |
| | 5,300 | | | 2.14%, 09/08/2008 | | | 5,259 | |
| | 6,000 | | | 2.65%, 04/07/2009 (L) | | | 6,000 | |
| | 6,250 | | | 2.70%, 05/19/2008 | | | 6,242 | |
| | 7,500 | | | 3.87%, 06/15/2008 | | | 7,503 | |
| | | | | Federal National Mortgage Association | | | | |
| | 6,500 | | | 2.08%, 07/31/2008 | | | 6,466 | |
| | 9,500 | | | 2.11%, 09/17/2008 — 10/08/2008 | | | 9,416 | |
| | 5,000 | | | 2.12%, 10/22/2008 | | | 4,949 | |
| | 6,500 | | | 2.13%, 08/01/2008 | | | 6,465 | |
| | 7,676 | | | 2.71%, 05/14/2008 | | | 7,669 | |
| | 6,250 | | | 2.72%, 05/14/2008 | | | 6,244 | |
| | 8,500 | | | 3.43%, 06/27/2008 | | | 8,454 | |
| | 2,500 | | | 3.85%, 05/02/2008 | | | 2,500 | |
| | | | | General Electric Capital Corp. | | | | |
| | 4,500 | | | 2.37%, 07/18/2008 | | | 4,477 | |
| | 2,250 | | | 2.76%, 12/12/2008 (L) | | | 2,250 | |
| | 2,600 | | | 2.91%, 05/22/2009 (L) | | | 2,600 | |
| | 5,800 | | | 3.12%, 05/19/2008 (L) | | | 5,800 | |
| | 5,000 | | | 4.10%, 05/08/2008 | | | 4,996 | |
| | | | | Goldman Sachs Group, Inc. | | | | |
| | 6,000 | | | 3.93%, 05/23/2008 | | | 5,986 | |
| | | | | Greenwich Capital Holdings | | | | |
| | 1,750 | | | 3.01%, 09/22/2008 | | | 1,729 | |
| | | | | HBOS Treasury Services plc | | | | |
| | 3,560 | | | 2.72%, 09/08/2008 (I)(L) | | | 3,560 | |
| | | | | HSBC Finance Corp. | | | | |
| | 6,250 | | | 2.35%, 05/22/2008 | | | 6,241 | |
| | 3,500 | | | 2.76%, 09/06/2008 (L) | | | 3,500 | |
| | | | | John Deere Capital Corp. | | | | |
| | 4,750 | | | 2.19%, 06/05/2008 (I) | | | 4,740 | |
| | 4,000 | | | 2.21%, 06/09/2008 | | | 3,990 | |
The accompanying notes are an integral part of these financial statements.
218
| | | | | | | | | | | | | |
Principal
| | | | | | | | Market
| |
| Amount | | | | | | | | Value (W) | |
| | | | | | | | | | | | | |
| | | | | Finance — (continued) |
| | | | | JP Morgan Chase & Co. | | | | |
| $ | 5,750 | | | 2.14%, 05/01/2008 | | $ | 5,750 | |
| | 3,000 | | | 2.30%, 05/05/2008 | | | 2,999 | |
| | 3,800 | | | 2.69%, 09/02/2008 (L) | | | 3,800 | |
| | 3,000 | | | 3.00%, 05/05/2008 | | | 2,999 | |
| | 2,750 | | | 3.05%, 07/14/2008 | | | 2,733 | |
| | | | | KFW | | | | |
| | 4,750 | | | 2.12%, 07/29/2008 (I) | | | 4,725 | |
| | 5,000 | | | 2.17%, 06/30/2008 (I) | | | 4,982 | |
| | 3,000 | | | 2.30%, 05/02/2008 (I) | | | 3,000 | |
| | 4,000 | | | 2.72%, 05/05/2008 (I) | | | 3,999 | |
| | | | | Lehman Brothers Holdings, Inc. | | | | |
| | 3,000 | | | 2.81%, 11/26/2008 (L) | | | 3,000 | |
| | 3,500 | | | 3.02%, 05/21/2008 (I) | | | 3,494 | |
| | | | | Merrill Lynch & Co., Inc. | | | | |
| | 4,000 | | | 2.55%, 06/26/2008 (L) | | | 4,000 | |
| | 3,000 | | | 3.04%, 08/22/2008 (L) | | | 3,000 | |
| | | | | Morgan Stanley Dean Witter, Inc. | | | | |
| | 3,750 | | | 3.06%, 08/04/2008 | | | 3,720 | |
| | 3,000 | | | 5.01%, 05/19/2008 | | | 2,993 | |
| | | | | Nordea Bank Ab | | | | |
| | 3,300 | | | 2.72%, 09/08/2008 (I)(L) | | | 3,300 | |
| | | | | Nordea Bank Finland NY | | | | |
| | 4,500 | | | 2.72%, 04/09/2009 (L) | | | 4,481 | |
| | | | | Nordea North America | | | | |
| | 4,500 | | | 2.70%, 05/15/2008 | | | 4,495 | |
| | 5,000 | | | 2.76%, 05/13/2008 | | | 4,995 | |
| | | | | Royal Bank of Canada | | | | |
| | 4,250 | | | 2.46%, 06/17/2008 | | | 4,250 | |
| | 4,650 | | | 2.55%, 07/15/2008 | | | 4,650 | |
| | 3,750 | | | 3.12%, 05/15/2009 (I)(L) | | | 3,750 | |
| | | | | Royal Bank of Scotland Group plc | | | | |
| | 2,750 | | | 2.66%, 08/12/2008 | | | 2,729 | |
| | 5,350 | | | 2.73%, 06/18/2008 | | | 5,331 | |
| | 2,750 | | | 3.02%, 05/09/2008 | | | 2,748 | |
| | | | | Skandinaviska Enskilda Bank Ab | | | | |
| | 3,500 | | | 2.59%, 08/22/2008 (I)(L) | | | 3,502 | |
| | 5,750 | | | 2.84%, 05/21/2008 (I) | | | 5,741 | |
| | | | | Skandinaviska Enskilda Bank NY | | | | |
| | 3,400 | | | 2.73%, 09/08/2008 (I)(L) | | | 3,400 | |
| | | | | State Street Bank and Trust Co. | | | | |
| | 2,000 | | | 2.54%, 05/20/2008 | | | 2,000 | |
| | | | | State Street Corp. | | | | |
| | 3,750 | | | 2.72%, 07/24/2008 | | | 3,726 | |
| | 7,000 | | | 2.80%, 06/10/2008 | | | 7,000 | |
| | | | | Svenska Handelsbanken Ab | | | | |
| | 2,250 | | | 2.57%, 05/07/2008 | | | 2,249 | |
| | 3,000 | | | 2.71%, 05/13/2009 (I)(L) | | | 3,000 | |
| | 3,600 | | | 2.94%, 05/06/2009 (I)(L) | | | 3,600 | |
| | 4,000 | | | 2.97%, 05/12/2008 | | | 3,996 | |
| | | | | Swedbank | | | | |
| | 8,000 | | | 2.74%, 05/08/2008 — 05/27/2008 | | | 7,990 | |
| | 5,000 | | | 3.06%, 06/05/2008 | | | 4,985 | |
| | | | | Toyota Motor Credit Corp. | | | | |
| | 7,000 | | | 2.25%, 07/17/2008 (L) | | | 7,000 | |
| | 9,000 | | | 2.85%, 05/16/2008 | | | 8,989 | |
| | | | | UBS Finance LLC | | | | |
| | 4,750 | | | 2.93%, 05/27/2008 | | | 4,740 | |
| | 5,000 | | | 2.94%, 07/08/2008 | | | 4,972 | |
| | 3,000 | | | 3.04%, 05/27/2008 | | | 2,993 | |
| | | | | Wachovia Bank NA | | | | |
| | 7,000 | | | 2.64%, 06/27/2008 (L) | | | 7,001 | |
| | 4,750 | | | 2.65%, 10/03/2008 (L) | | | 4,752 | |
| | 6,000 | | | 2.91%, 05/01/2009 (L) | | | 6,000 | |
| | | | | Wells Fargo & Co. | | | | |
| | 5,500 | | | 2.15%, 07/25/2008 | | | 5,472 | |
| | 3,750 | | | 2.29%, 05/02/2008 | | | 3,750 | |
| | 3,000 | | | 2.88%, 05/18/2009 (L) | | | 3,000 | |
| | | | | Westpac Banking Corp. | | | | |
| | 3,000 | | | 2.69%, 06/05/2008 (I) | | | 2,992 | |
| | 3,400 | | | 2.71%, 09/15/2008 (I)(L) | | | 3,400 | |
| | 2,250 | | | 2.76%, 07/09/2008 (I) | | | 2,238 | |
| | 4,250 | | | 3.31%, 01/28/2009 (L) | | | 4,250 | |
| | | | | | | | | |
| | | | | | | | | | | | 542,879 | |
| | | | | | | | | | | | | |
| | | | | Health Care — 2.0% |
| | | | | Astrazeneca plc | | | | |
| | 3,750 | | | 2.74%, 11/25/2008 (I) | | | 3,692 | |
| | 3,500 | | | 2.95%, 06/19/2008 (I) | | | 3,486 | |
| | 5,200 | | | 4.16%, 06/03/2008 (I) | | | 5,180 | |
| | | | | | | | | |
| | | | | | | | | | | | 12,358 | |
| | | | | | | | | | | | | |
| | | | | Repurchase Agreements — 1.2% |
| | | | | BNP Paribas Securities Corp. Repurchase Agreement (maturing on 05/01/2008 in the amount of $2,234, collateralized by U.S. Treasury Bond 5.50%, 2028, value of $2,304) | | | | |
| | 2,234 | | | 1.90% dated 04/30/2008 | | | 2,234 | |
| | | | | RBS Greenwich Capital Markets Repurchase Agreement (maturing on 05/01/2008 in the amount of $2,234, collateralized by U. S. Treasury Note 4.50%, 2011, value of $2,288) | | | | |
| | 2,234 | | | 1.90% dated 04/30/2008 | | | 2,234 | |
| | | | | UBS Securities, Inc. Repurchase Agreement (maturing on 05/01/2008 in the amount of $3,242, collateralized by U.S. Treasury Bond 6.00% — 8.75%, 2020 — 2026, U.S. Treasury Note 4.75% — 13.25%, 2008 — 2016, value of $3,321) | | | | |
| | 3,242 | | | 1.90% dated 04/30/2008 | | | 3,242 | |
| | | | | | | | | |
| | | | | | | | | | | | 7,710 | |
| | | | | | | | | | | | | |
| | | | | Services — 1.9% |
| | | | | Walt Disney Co. | | | | |
| | 12,250 | | | 2.18%, 05/01/2008 — 05/02/2008 | | | 12,249 | |
| | | | | | | | | |
| | | | | Total investments
(cost $628,042) (C) | | | 100.1 | % | | $ | 628,042 | |
| | | | | Other assets and liabilities | | | (0.1 | )% | | | (314 | ) |
| | | | | | | | | | | | | |
| | | | | Total net assets | | | 100.0 | % | | $ | 627,728 | |
| | | | | | | | | | | | | |
| |
| Note: | Percentage of investments as shown is the ratio of the total market value to total net assets. The rates presented in this Schedule of Investments are yields, unless otherwise noted. Market value of |
The accompanying notes are an integral part of these financial statements.
219
The Hartford Money Market Fund
Schedule of Investments — (continued)
April 30, 2008 (Unaudited)
(000’s Omitted)
| |
| investments in U.S. Dollar denominated securities of foreign issuers represents 26.98% of total net assets at April 30, 2008. |
| | |
| | Foreign securities that are principally traded on certain foreign markets are adjusted daily pursuant to a third party pricing service methodology approved by the Board of Directors in order to reflect an adjustment for factors occurring after the close of the foreign market but before the close of the New York Stock Exchange. |
| |
| (C) | | Also represents cost for tax purposes. |
| |
| (I) | | Securities issued within terms of a private placement memorandum, exempt from registration under Section 144A of the Securities Act of 1933, as amended, and may be sold only to qualified institutional buyers. Pursuant to guidelines adopted by the Board of Directors, these issues are determined to be liquid. The aggregate value of these securities at April 30, 2008, was $153,394, which represents 24.44% of total net assets. |
| |
| (L) | | Variable rate securities; the yield reported is the rate in effect at April 30, 2008. |
| |
| (W) | | See Note 2b of accompanying Notes to Financial Statements regarding valuation of securities. |
Diversification by Country
as of April 30, 2008
| | | | | |
| | | Percentage of
|
Country | | Net Assets |
| Australia | | | 4.1 | |
| |
| |
| Canada | | | 4.4 | |
| |
| |
| Denmark | | | 1.2 | |
| |
| |
| Finland | | | 0.7 | |
| |
| |
| Germany | | | 2.7 | |
| |
| |
| Norway | | | 2.6 | |
| |
| |
| Sweden | | | 5.6 | |
| |
| |
| United Kingdom | | | 5.7 | |
| |
| |
| United States | | | 73.1 | |
| |
| |
| Other Assets and Liabilities | | | (0.1 | ) |
| |
| |
Total | | | 100.0 | % |
| |
| |
The accompanying notes are an integral part of these financial statements.
220
The Hartford Retirement Income Fund
Schedule of Investments
April 30, 2008 (Unaudited)
(000’s Omitted)
| | | | | | | | | | | | | |
| | | | | | | | | Market
| |
| Shares | | | | | | | | Value (W) | |
| AFFILIATED INVESTMENT COMPANIES — 99.0% |
| EQUITY FUNDS — 29.5% |
| | 12 | | | The Hartford Capital Appreciation Fund, Class Y | | $ | 499 | |
| | 18 | | | The Hartford Disciplined Equity Fund, Class Y | | | 241 | |
| | 12 | | | The Hartford Equity Income Fund, Class Y | | | 162 | |
| | 5 | | | The Hartford Global Growth Fund, Class Y | | | 107 | |
| | 4 | | | The Hartford Growth Fund, Class Y | | | 76 | |
| | 14 | | | The Hartford International Opportunities Fund, Class Y | | | 242 | |
| | 12 | | | The Hartford International Small Company Fund, Class Y | | | 174 | |
| | 5 | | | The Hartford Select MidCap Value Fund, Class Y | | | 47 | |
| | 4 | | | The Hartford Select SmallCap Value Fund, Class Y | | | 36 | |
| | 2 | | | The Hartford Stock Fund, Class Y | | | 45 | |
| | 41 | | | The Hartford Value Fund, Class Y | | | 508 | |
| | 3 | | | The Hartford Value Opportunities Fund, Class Y | | | 41 | |
| | | | | | | | | |
| | | | | Total equity funds
(cost $2,222) | | $ | 2,178 | |
| | | | | | | | | | | | | |
| | | | | | | | | | | | | |
| FIXED INCOME FUNDS — 68.1% |
| | 45 | | | The Hartford Floating Rate Fund, Class Y | | $ | 406 | |
| | 34 | | | The Hartford High Yield Fund, Class Y | | | 257 | |
| | 73 | | | The Hartford Income Fund, Class Y | | | 722 | |
| | 83 | | | The Hartford Inflation Plus Fund, Class Y | | | 934 | |
| | 146 | | | The Hartford Short Duration Fund, Class Y | | | 1,395 | |
| | 57 | | | The Hartford Strategic Income Fund, Class Y | | | 538 | |
| | 74 | | | The Hartford Total Return Bond Fund, Class Y | | | 777 | |
| | | | | | | | | |
| | | | | Total fixed income funds
(cost $5,080) | | $ | 5,029 | |
| | | | | | | | | | | | | |
| | | | | | | | | | | | | |
| MONEY MARKET FUNDS — 1.4% |
| | 99 | | | The Hartford Money Market Fund, Class Y | | $ | 99 | |
| | | | | | | | | |
| | | | | Total money market funds
(cost $99) | | $ | 99 | |
| | | | | | | | | |
| | | | | Total investments in affiliated investment companies
(cost $7,401) | | $ | 7,306 | |
| | | | | | | | | |
| | | | | Total investments
(cost $7,401) (C) | | | 99.0 | % | | $ | 7,306 | |
| | | | | Other assets and liabilities | | | 1.0 | % | | | 75 | |
| | | | | | | | | | | | | |
| | | | | Total net assets | | | 100.0 | % | | $ | 7,381 | |
| | | | | | | | | | | | | |
| |
| Note: | Percentage of investments as shown is the ratio of the total market value to total net assets. |
| | |
| (C) | | At April 30, 2008, the cost of securities for federal income tax purposes was $7,407 and the aggregate gross unrealized appreciation and depreciation based on that cost were: |
| | | | | |
| Unrealized Appreciation | | $ | 47 | |
| Unrealized Depreciation | | | (148 | ) |
| | | | | |
| Net Unrealized Depreciation | | $ | (101 | ) |
| | | | | |
| | |
| (W) | | See Note 2b of accompanying Notes to Financial Statements regarding valuation of securities. |
The accompanying notes are an integral part of these financial statements.
221
The Hartford Select MidCap Value Fund
Schedule of Investments
April 30, 2008 (Unaudited)
(000’s Omitted)
| | | | | | | | | | | | | |
| | | | | | | | | Market
| |
| Shares | | | | | | | | Value (W) | |
| COMMON STOCK — 98.4% |
| | | | | Basic Materials — 4.9% |
| | 2 | | | Air Products and Chemicals, Inc. | | $ | 236 | |
| | 5 | | | Airgas, Inc. | | | 226 | |
| | 8 | | | Carlisle Cos., Inc. | | | 228 | |
| | 5 | | | Carpenter Technology Corp. | | | 272 | |
| | 12 | | | Commercial Metals Co. | | | 374 | |
| | 9 | | | Crane Co. | | | 375 | |
| | 5 | | | Lubrizol Corp. | | | 262 | |
| | 8 | | | Pentair, Inc. | | | 309 | |
| | 7 | | | Shaw Group, Inc. (D) | | | 366 | |
| | 8 | | | Snap-On, Inc. | | | 463 | |
| | 4 | | | United States Steel Corp. | | | 623 | |
| | 9 | | | USG Corp. (D)(G) | | | 304 | |
| | | | | | | | | |
| | | | | | | | | | | | 4,038 | |
| | | | | | | | | | | | | |
| | | | | Capital Goods — 5.1% |
| | 12 | | | AGCO Corp. (D)(G) | | | 704 | |
| | 2 | | | Alliant Techsystems, Inc. (D)(G) | | | 258 | |
| | 3 | | | Flowserve Corp. | | | 379 | |
| | 7 | | | Gardner Denver Machinery, Inc. (D) | | | 325 | |
| | 5 | | | Ingersoll-Rand Co. Class A | | | 204 | |
| | 8 | | | Lennox International, Inc. | | | 259 | |
| | 8 | | | Lincoln Electric Holdings, Inc. | | | 633 | |
| | 6 | | | Parker-Hannifin Corp. | | | 507 | |
| | 26 | | | Spirit Aerosystems Holdings, Inc. (D)(G) | | | 764 | |
| | 16 | | | Xerox Corp. | | | 218 | |
| | | | | | | | | |
| | | | | | | | | | | | 4,251 | |
| | | | | | | | | | | | | |
| | | | | Consumer Cyclical — 8.0% |
| | 13 | | | Avnet, Inc. (D)(G) | | | 343 | |
| | 8 | | | Barnes & Noble, Inc. (G) | | | 265 | |
| | 6 | | | BJ’s Wholesale Club, Inc. (D) | | | 236 | |
| | 13 | | | BorgWarner, Inc. | | | 644 | |
| | 15 | | | Brunswick Corp. | | | 257 | |
| | 15 | | | Copart, Inc. (D)(G) | | | 613 | |
| | 52 | | | Ford Motor Co. (D)(G) | | | 429 | |
| | 19 | | | Gap, Inc. | | | 346 | |
| | 13 | | | Ingram Micro, Inc. (D)(G) | | | 220 | |
| | 13 | | | Masco Corp. | | | 240 | |
| | 4 | | | Mosaic Co. (D) | | | 472 | |
| | 1 | | | NVR, Inc. (D)(G) | | | 564 | |
| | 14 | | | Penske Automotive Group, Inc. | | | 301 | |
| | 7 | | | Reliance Steel & Aluminum | | | 438 | |
| | 6 | | | Scotts Miracle-Gro Co. Class A | | | 212 | |
| | 11 | | | Supervalu, Inc. | | | 351 | |
| | 4 | | | V.F. Corp. | | | 275 | |
| | 5 | | | W.W. Grainger, Inc. | | | 390 | |
| | | | | | | | | |
| | | | | | | | | | | | 6,596 | |
| | | | | | | | | | | | | |
| | | | | Consumer Staples — 3.0% |
| | 14 | | | Alberto-Culver Co. | | | 357 | |
| | 4 | | | Bunge Ltd. Finance Corp. (G) | | | 399 | |
| | 11 | | | Coca-Cola Enterprises, Inc. | | | 239 | |
| | 14 | | | Constellation Brands, Inc. Class A (D)(G) | | | 259 | |
| | 9 | | | Loews Corp. — Carolina Group | | | 601 | |
| | 11 | | | Pepsi Bottling Group, Inc. | | | 364 | |
| | 10 | | | PepsiAmericas, Inc. | | | 247 | |
| | | | | | | | | |
| | | | | | | | | | | | 2,466 | |
| | | | | | | | | | | | | |
| | | | | Energy — 14.7% |
| | 8 | | | Atmos Energy Corp. | | | 221 | |
| | 17 | | | Chesapeake Energy Corp. | | | 879 | |
| | 6 | | | Cimarex Energy Co. | | | 361 | |
| | 7 | | | Constellation Energy Group, Inc. | | | 597 | |
| | 13 | | | Energen Corp. | | | 874 | |
| | 17 | | | ENSCO International, Inc. | | | 1,109 | |
| | 12 | | | Frontier Oil Corp. | | | 308 | |
| | 11 | | | Helmerich & Payne, Inc. | | | 591 | |
| | 4 | | | Hess Corp. | | | 435 | |
| | 4 | | | Murphy Oil Corp. | | | 389 | |
| | 5 | | | National Fuel Gas Co. | | | 276 | |
| | 12 | | | Noble Energy, Inc. | | | 1,053 | |
| | 5 | | | Oneok, Inc. | | | 250 | |
| | 50 | | | Patterson-UTI Energy, Inc. | | | 1,403 | |
| | 14 | | | Pride International, Inc. (D) | | | 611 | |
| | 6 | | | Seacor Holdings, Inc. (D)(G) | | | 490 | |
| | 8 | | | Sempra Energy | | | 462 | |
| | 22 | | | St. Mary Land & Exploration Co. | | | 966 | |
| | 10 | | | UGI Corp. | | | 268 | |
| | 4 | | | Unit Corp. (D) | | | 235 | |
| | 12 | | | Vectren Corp. | | | 331 | |
| | | | | | | | | |
| | | | | | | | | | | | 12,109 | |
| | | | | | | | | | | | | |
| | | | | Finance — 33.2% |
| | 26 | | | Allied World Assurance Holdings Ltd. | | | 1,051 | |
| | 7 | | | AMB Property Corp. | | | 410 | |
| | 82 | | | AMBAC Financial Group, Inc. | | | 380 | |
| | 13 | | | American Financial Group, Inc. | | | 351 | |
| | 81 | | | AmeriCredit Corp. (D)(G) | | | 1,124 | |
| | 5 | | | Ameriprise Financial, Inc. | | | 228 | |
| | 27 | | | Annaly Capital Management, Inc. | | | 449 | |
| | 12 | | | Arch Capital Group Ltd. (D) | | | 873 | |
| | 3 | | | Assurant, Inc. | | | 208 | |
| | 27 | | | Axis Capital Holdings Ltd. (G) | | | 922 | |
| | 13 | | | Bancorpsouth, Inc. | | | 317 | |
| | 14 | | | Bank of Hawaii Corp. | | | 779 | |
| | 8 | | | BOK Financial Corp. | | | 445 | |
| | 6 | | | Boston Properties, Inc. | | | 619 | |
| | 45 | | | CIT Group, Inc. | | | 487 | |
| | 8 | | | City National Corp. | | | 383 | |
| | 18 | | | Colonial Properties Trust | | | 434 | |
| | 9 | | | Commerce Bankshares, Inc. | | | 383 | |
| | 16 | | | Endurance Specialty Holdings Ltd. (G) | | | 598 | |
| | 29 | | | Equity Residential Properties Trust | | | 1,208 | |
| | 5 | | | Everest Re Group Ltd. | | | 411 | |
| | 3 | | | Federal Realty Investment Trust | | | 271 | |
| | 31 | | | Genworth Financial, Inc. | | | 703 | |
| | 12 | | | HCC Insurance Holdings, Inc. | | | 289 | |
| | 22 | | | HCP, Inc. | | | 768 | |
| | 10 | | | Hospitality Properties Trust | | | 328 | |
| | 13 | | | Host Hotels & Resorts, Inc. | | | 225 | |
| | 25 | | | Janus Capital Group, Inc. | | | 702 | |
| | 5 | | | Kimco Realty Corp. | | | 196 | |
| | 77 | | | MBIA, Inc. | | | 804 | |
| | 36 | | | MF Global Ltd. (D) | | | 469 | |
| | 17 | | | Nationwide Financial Services, Inc. Class A | | | 835 | |
| | 11 | | | Northern Trust Corp. | | | 793 | |
| | 6 | | | PartnerRe Ltd. (G) | | | 440 | |
| | 10 | | | Plum Creek Timber Co., Inc. | | | 412 | |
| | 23 | | | Popular, Inc. (G) | | | 281 | |
| | 8 | | | Principal Financial Group, Inc. | | | 402 | |
| | 8 | | | ProLogis | | | 495 | |
| | 4 | | | Protective Life Corp. | | | 183 | |
The accompanying notes are an integral part of these financial statements.
222
| | | | | | | | | | | | | |
| | | | | | | | | Market
| |
| Shares | | | | | | | | Value (W) | |
| | | | | | | | | | | | | |
| COMMON STOCK — (continued) |
| | | | | | | | | | | | | |
| | | | | Finance — (continued) |
| | 5 | | | Public Storage | | $ | 408 | |
| | 60 | | | Radian Group, Inc. | | | 324 | |
| | 12 | | | Raymond James Financial, Inc. | | | 340 | |
| | 14 | | | RenaissanceRe Holdings Ltd. ADR (G) | | | 741 | |
| | 13 | | | Safeco Corp. | | | 844 | |
| | 4 | | | SL Green Realty Corp. | | | 325 | |
| | 7 | | | StanCorp Financial Group, Inc. | | | 359 | |
| | 13 | | | Taubman Centers, Inc. | | | 711 | |
| | 15 | | | TCF Financial Corp. | | | 256 | |
| | 5 | | | Torchmark Corp. | | | 343 | |
| | 3 | | | Transatlantic Holdings, Inc. | | | 221 | |
| | 17 | | | W.R. Berkley Corp. | | | 424 | |
| | 16 | | | Whitney Holding Corp. | | | 365 | |
| | 9 | | | Wilmington Trust Corp. | | | 279 | |
| | 22 | | | XL Capital Ltd. Class A (G) | | | 783 | |
| | | | | | | | | |
| | | | | | | | | | | | 27,379 | |
| | | | | | | | | | | | | |
| | | | | Health Care — 4.8% |
| | 14 | | | Amerisource Bergen Corp. | | | 576 | |
| | 16 | | | Coventry Health Care, Inc. (D)(G) | | | 733 | |
| | 8 | | | Kinetic Concepts, Inc. (D)(G) | | | 297 | |
| | 33 | | | King Pharmaceuticals, Inc. (D)(G) | | | 313 | |
| | 35 | | | Omnicare, Inc. | | | 702 | |
| | 6 | | | Quest Diagnostics, Inc. | | | 291 | |
| | 8 | | | Sigma-Aldrich Corp. | | | 428 | |
| | 20 | | | Watson Pharmaceuticals, Inc. (D)(G) | | | 622 | |
| | | | | | | | | |
| | | | | | | | | | | | 3,962 | |
| | | | | | | | | | | | | |
| | | | | Services — 4.7% |
| | 3 | | | Central European Media Enterprises Ltd. (D)(G) | | | 334 | |
| | 6 | | | Computer Sciences Corp. (D) | | | 242 | |
| | 18 | | | Discovery Holding Co. (D) | | | 415 | |
| | 21 | | | DreamWorks Animation SKG, Inc. (D) | | | 576 | |
| | 11 | | | Electronic Data Systems Corp. | | | 210 | |
| | 13 | | | Hewitt Associates, Inc. (D) | | | 550 | |
| | 11 | | | Liberty Global, Inc. (D)(G) | | | 375 | |
| | 13 | | | R.R. Donnelley & Sons Co. | | | 395 | |
| | 16 | | | Regal Entertainment Group | | | 305 | |
| | 47 | | | Unisys Corp. (D)(G) | | | 196 | |
| | 6 | | | URS Corp. (D) | | | 254 | |
| | | | | | | | | |
| | | | | | | | | | | | 3,852 | |
| | | | | | | | | | | | | |
| | | | | Technology — 9.7% |
| | 11 | | | Applera Corp. — Applied Biosystems Group | | | 348 | |
| | 11 | | | Arrow Electronics, Inc. (D) | | | 291 | |
| | 66 | | | Atmel Corp. (D) | | | 244 | |
| | 23 | | | CA, Inc. | | | 505 | |
| | 13 | | | CommScope, Inc. (D)(G) | | | 623 | |
| | 6 | | | Cooper Industries Ltd. | | | 267 | |
| | 6 | | | Dover Corp. | | | 277 | |
| | 3 | | | Energizer Holdings, Inc. (D)(G) | | | 225 | |
| | 19 | | | Fair Isaac, Inc. | | | 476 | |
| | 10 | | | Hubbell, Inc. Class B | | | 443 | |
| | 44 | | | Jabil Circuit, Inc. | | | 480 | |
| | 4 | | | L-3 Communications Holdings, Inc. | | | 412 | |
| | 33 | | | Lexmark International, Inc. ADR (D)(G) | | | 1,037 | |
| | 93 | | | LSI Corp. (D)(G) | | | 574 | |
| | 30 | | | QLogic Corp. (D) | | | 479 | |
| | 9 | | | SanDisk Corp. (D)(G) | | | 252 | |
| | 10 | | | Seagate Technology (G) | | | 193 | |
| | 7 | | | Teleflex, Inc. | | | 399 | |
| | 13 | | | Teradata Corp. (D)(G) | | | 273 | |
| | 3 | | | Whirlpool Corp. | | | 218 | |
| | | | | | | | | |
| | | | | | | | | | | | 8,016 | |
| | | | | | | | | | | | | |
| | | | | Transportation — 1.6% |
| | 12 | | | CSX Corp. | | | 762 | |
| | 12 | | | Kansas City Southern (D)(G) | | | 541 | |
| | | | | | | | | |
| | | | | | | | | | | | 1,303 | |
| | | | | | | | | | | | | |
| | | | | Utilities — 8.7% |
| | 9 | | | American Electric Power Co., Inc. | | | 402 | |
| | 7 | | | Consolidated Edison, Inc. | | | 297 | |
| | 9 | | | DPL, Inc. | | | 239 | |
| | 7 | | | Edison International | | | 370 | |
| | 15 | | | El Paso Corp. | | | 264 | |
| | 16 | | | Energy East Corp. | | | 353 | |
| | 13 | | | Hawaiian Electric Industry | | | 321 | |
| | 4 | | | Integrys Energy Group, Inc. | | | 196 | |
| | 11 | | | NiSource, Inc. | | | 202 | |
| | 10 | | | Northeast Utilities | | | 250 | |
| | 7 | | | OGE Energy Corp. | | | 216 | |
| | 7 | | | PPL Corp. | | | 327 | |
| | 9 | | | Progress Energy, Inc. | | | 382 | |
| | 32 | | | Puget Energy, Inc. | | | 873 | |
| | 5 | | | Questar Corp. | | | 304 | |
| | 20 | | | Reliant Resources, Inc. (D) | | | 505 | |
| | 8 | | | SCANA Corp. | | | 315 | |
| | 15 | | | Spectra Energy Corp. | | | 366 | |
| | 16 | | | TECO Energy, Inc. | | | 250 | |
| | 8 | | | Wisconsin Energy Corp. | | | 399 | |
| | 19 | | | Xcel Energy, Inc. | | | 395 | |
| | | | | | | | | |
| | | | | | | | 7,226 | |
| | | | | | | | | |
| | | | | Total common stock
(cost $86,240) | | $ | 81,198 | |
| | | | | | | | | |
| SHORT-TERM INVESTMENTS — 18.2% |
| | | | | Repurchase Agreements — 1.3% |
| | | | | BNP Paribas Securities Corp. Repurchase Agreement (maturing on 05/01/2008 in the amount of $313, collateralized by U.S. Treasury Bond 5.50%, 2028, value of $323) | | | | |
| | 313 | | | 1.90% dated 04/30/2008 | | $ | 313 | |
| | | | | RBS Greenwich Capital Markets Repurchase Agreement (maturing on 05/01/2008 in the amount of $313, collateralized by U.S. Treasury Note 4.50%, 2011, value of $321) | | | | |
| | 313 | | | 1.90% dated 04/30/2008 | | | 313 | |
| | | | | UBS Securities, Inc. Repurchase Agreement (maturing on 05/01/2008 in the amount of $455, collateralized by U.S. Treasury Bond 6.00% — 8.75%, 2020 — 2026, U.S. Treasury Note 4.75% — 13.25%, 2008 — 2016, value of $466) | | | | |
| | 455 | | | 1.90% dated 04/30/2008 | | | 455 | |
| | | | | | | | | |
| | | | | | | | | | | | 1,081 | |
| | | | | | | | | | | | | |
| | | | | Securities Purchased with Proceeds from Security Lending — 16.7% |
| | | | | Cash Collateral Reinvestment Fund: |
| | 13,720 | | | Navigator Prime Portfolio | | | 13,720 | |
| | | | | | | | | |
| | | | | | | | | | | | | |
| | | | | | | | | | | | | |
| | | | | | | | | | | | | |
The accompanying notes are an integral part of these financial statements.
223
The Hartford Select MidCap Value Fund
Schedule of Investments — (continued)
April 30, 2008 (Unaudited)
(000’s Omitted)
| | | | | | | | | | | | | |
Principal
| | | | | | | | | |
| Amount | | | | | | | | | |
| |
| | | | | | | | | | | | | |
| SHORT-TERM INVESTMENTS — (continued) |
Principal
| | | | | | | | | |
| Amount | | | | | | | | | |
| |
| | | | | U.S. Treasury Bills — 0.2% |
| $ | 175 | | | 1.43%, 06/12/2008 (M)(S) | | | 175 | |
| | | | | | | | | |
| | | | | Total short-term investments
(cost $14,976) | | $ | 14,976 | |
| | | | | | | | | |
| | | | | Total investments
(cost $101,216) (C) | | | 116.6 | % | | $ | 96,174 | |
| | | | | Other assets and liabilities | | | (16.6 | )% | | | (13,670 | ) |
| | | | | | | | | | | | | |
| | | | | Total net assets | | | 100.0 | % | | $ | 82,504 | |
| | | | | | | | | | | | | |
| |
| Note: | Percentage of investments as shown is the ratio of the total market value to total net assets. |
| | |
| (C) | | At April 30, 2008, the cost of securities for federal income tax purposes was $101,882 and the aggregate gross unrealized appreciation and depreciation based on that cost were: |
| | | | | |
| Unrealized Appreciation | | $ | 4,487 | |
| Unrealized Depreciation | | | (10,195 | ) |
| | | | | |
| Net Unrealized Depreciation | | $ | (5,708 | ) |
| | | | | |
| | |
| (D) | | Currently non-income producing. |
| |
| (G) | | Security is partially on loan at April 30, 2008. |
| |
| (M) | | The interest rate disclosed for these securities represents the effective yield on the date of acquisition. |
| |
| (S) | | Security pledged as initial margin deposit for open futures contracts at April 30, 2008. |
| |
| | Futures Contracts Outstanding at April 30, 2008 |
| | | | | | | | | | | | | | | | | |
| | | | | | | | | | | | Unrealized
| |
| | | Number of
| | | | | | Expiration
| | | Appreciation/
| |
Description | | Contracts* | | | Position | | | Month | | | (Depreciation) | |
| |
| S&P Mid 400 Mini Futures | | | 10 | | | | Long | | | | Jun 2008 | | | $ | 5 | |
| | | | | | | | | | | | | | | | | |
| | |
| | * The number of contracts does not omit 000’s. |
| |
| (W) | | See Note 2b of accompanying Notes to Financial Statements regarding valuation of securities. |
The accompanying notes are an integral part of these financial statements.
224
The Hartford Select SmallCap Value Fund
Schedule of Investments
April 30, 2008 (Unaudited)
(000’s Omitted)
| | | | | | | | | | | | | |
| | | | | | | | | Market
| |
| Shares | | | | | | | | Value (W) | |
| COMMON STOCK — 96.1% |
| | | | | Basic Materials — 8.6% |
| | 4 | | | Ampco-Pittsburgh Corp. | | $ | 172 | |
| | 6 | | | AptarGroup, Inc. | | | 278 | |
| | 1 | | | Arch Chemicals, Inc. | | | 37 | |
| | 41 | | | Balchem Corp. | | | 946 | |
| | 1 | | | Barnes Group, Inc. | | | 31 | |
| | 3 | | | Blount International (D) | | | 33 | |
| | 10 | | | Buckeye Technologies, Inc. (D) | | | 90 | |
| | 3 | | | Cambrex Corp. | | | 17 | |
| | 4 | | | CF Industries Holdings, Inc. | | | 521 | |
| | 4 | | | Champion Enterprises, Inc. (D) | | | 38 | |
| | 1 | | | CIRCOR International, Inc. | | | 48 | |
| | — | | | Coeur d’Alene Mines Corp. (D) | | | 1 | |
| | 10 | | | Cooper Tire & Rubber Co. | | | 126 | |
| | 5 | | | Crown Media Holdings, Inc. (D) | | | 21 | |
| | 2 | | | CSS Industries, Inc. | | | 47 | |
| | 57 | | | Glatfelter | | | 830 | |
| | 4 | | | H.B. Fuller Co. | | | 96 | |
| | 5 | | | Hercules, Inc. | | | 93 | |
| | 2 | | | Innophos Holdings, Inc. | | | 38 | |
| | — | | | L.B. Foster Co. Class A (D) | | | 3 | |
| | 41 | | | Matthews International Corp. Class A | | | 2,042 | |
| | 4 | | | Minerals Technologies, Inc. | | | 237 | |
| | 2 | | | Mueller Industries, Inc. | | | 61 | |
| | 18 | | | Neenah Paper, Inc. | | | 414 | |
| | 2 | | | Newmarket Corp. | | | 130 | |
| | 6 | | | Olin Corp. | | | 111 | |
| | 2 | | | OM Group, Inc. (D) | | | 130 | |
| | 2 | | | Quanex Building Products Corp. (D) | | | 36 | |
| | 3 | | | Rock Tenn Co. Class A | | | 92 | |
| | 5 | | | Rockwood Holdings, Inc. (D) | | | 194 | |
| | 3 | | | Schnitzer Steel Industries, Inc. | | | 238 | |
| | 3 | | | Sensient Technologies Corp. | | | 100 | |
| | 1 | | | Silgan Holdings, Inc. | | | 34 | |
| | 1 | | | Superior Essex, Inc. (D) | | | 42 | |
| | 90 | | | Tempur-Pedic International, Inc. | | | 999 | |
| | 4 | | | Tredegar Corp. | | | 67 | |
| | 5 | | | Tupperware Brands Corp. | | | 197 | |
| | 7 | | | USEC, Inc. (D) | | | 32 | |
| | 4 | | | W.R. Grace & Co. (D) | | | 91 | |
| | 14 | | | Watts Water Technologies, Inc. | | | 376 | |
| | 5 | | | Worthington Industries, Inc. | | | 81 | |
| | | | | | | | | |
| | | | | | | | | | | | 9,170 | |
| | | | | | | | | | | | | |
| | | | | Capital Goods — 6.0% |
| | 8 | | | Blyth, Inc. | | | 127 | |
| | 3 | | | Briggs & Stratton Corp. | | | 52 | |
| | 3 | | | Brooks Automation, Inc. (D) | | | 27 | |
| | 1 | | | Cascade Bancorp | | | 56 | |
| | 43 | | | Clarcor, Inc. | | | 1,808 | |
| | 3 | | | Columbus McKinnon Corp. (D) | | | 74 | |
| | 13 | | | Compass Diversified Holdings | | | 157 | |
| | 3 | | | Cymer, Inc. (D) | | | 65 | |
| | 6 | | | Enpro Industries, Inc. (D) | | | 211 | |
| | 87 | | | Entegris, Inc. (D) | | | 656 | |
| | 3 | | | Jakks Pacific, Inc. (D) | | | 78 | |
| | — | | | Kadant, Inc. (D) | | | 3 | |
| | — | | | Kaman Corp. | | | 8 | |
| | 1 | | | Leapfrog Enterprises, Inc. (D) | | | 6 | |
| | 27 | | | Lincoln Electric Holdings, Inc. | | | 2,068 | |
| | 1 | | | Marvel Entertainment, Inc. (D) | | | 40 | |
| | 6 | | | Mattson Technology, Inc. (D) | | | 28 | |
| | 4 | | | MKS Instruments, Inc. (D) | | | 87 | |
| | 1 | | | Modine Manufacturing Co. | | | 12 | |
| | 3 | | | Nordson Corp. | | | 157 | |
| | 4 | | | Oil States International, Inc. (D) | | | 175 | |
| | 2 | | | Orbital Sciences Corp. (D) | | | 48 | |
| | 4 | | | Photronics, Inc. (D) | | | 42 | |
| | 19 | | | RC2 Corp. (D) | | | 344 | |
| | 2 | | | Robbins & Myers, Inc. | | | 60 | |
| | 3 | | | Rudolph Technologies, Inc. (D) | | | 32 | |
| | 1 | | | Tecumseh Products Co. Class A (D) | | | 38 | |
| | | | | | | | | |
| | | | | | | | | | | | 6,459 | |
| | | | | | | | | | | | | |
| | | | | Consumer Cyclical — 13.7% |
| | 2 | | | Adaptec, Inc. (D) | | | 4 | |
| | 7 | | | AFC Enterprises, Inc. (D) | | | 72 | |
| | 28 | | | Aftermarket Technology Corp. (D) | | | 631 | |
| | 4 | | | American Axle & Manufacturing Holdings, Inc. | | | 89 | |
| | 7 | | | Applied Industrial Technologies, Inc. | | | 172 | |
| | — | | | Beazer Homes USA, Inc. | | | 1 | |
| | 25 | | | Blockbuster, Inc. Class A (D) | | | 72 | |
| | — | | | Bob Evans Farms, Inc. | | | 11 | |
| | 92 | | | Borders Group, Inc. | | | 580 | |
| | 1 | | | Brown Shoe Co., Inc. | | | 14 | |
| | 11 | | | Callaway Golf Co. | | | 148 | |
| | 2 | | | Casey’s General Stores, Inc. | | | 51 | |
| | 3 | | | CBRL Group, Inc. | | | 107 | |
| | 1 | | | CEC Entertainment, Inc. (D) | | | 30 | |
| | 2 | | | Charming Shoppes, Inc. (D) | | | 8 | |
| | 21 | | | Chemed Corp. | | | 726 | |
| | 35 | | | Cherokee, Inc. | | | 1,000 | |
| | 33 | | | Children’s Place Retail Stores, Inc. (D) | | | 767 | |
| | 1 | | | Collective Brands, Inc. (D) | | | 14 | |
| | 1 | | | Columbia Sportswear Co. | | | 50 | |
| | 1 | | | Comfort Systems USA, Inc. | | | 15 | |
| | — | | | Compx International, Inc. | | | 1 | |
| | — | | | Domino’s Pizza, Inc. | | | 5 | |
| | 8 | | | Dress Barn, Inc. (D) | | | 108 | |
| | 4 | | | Dycom Industries, Inc. (D) | | | 52 | |
| | — | | | Eddie Bauer Holdings, Inc. (D) | | | — | |
| | 7 | | | EMCOR Group, Inc. (D) | | | 163 | |
| | 6 | | | Ethan Allen Interiors, Inc. | | | 159 | |
| | 3 | | | FTD Group, Inc. | | | 44 | |
| | 1 | | | Gaiam, Inc., Class A (D) | | | 14 | |
| | 4 | | | Granite Construction, Inc. | | | 127 | |
| | 25 | | | Group 1 Automotive, Inc. | | | 667 | |
| | 9 | | | hhgregg, Inc. (D) | | | 87 | |
| | 3 | | | Hooker Furniture Corp. | | | 55 | |
| | 6 | | | Hot Topic, Inc. (D) | | | 32 | |
| | 35 | | | Huttig Building Products, Inc. (D) | | | 90 | |
| | 20 | | | ICU Medical, Inc. (D) | | | 502 | |
| | 3 | | | IKON Office Solutions, Inc. | | | 32 | |
| | 6 | | | Insight Enterprises, Inc. (D) | | | 74 | |
| | — | | | Integrated Electrical Services, Inc. (D) | | | 7 | |
| | 1 | | | Interline Brands, Inc. (D) | | | 21 | |
| | 2 | | | Jack in the Box, Inc. (D) | | | 42 | |
| | 9 | | | Lear Corp. (D) | | | 254 | |
| | 2 | | | Maidenform Brands, Inc. (D) | | | 27 | |
| | 66 | | | McGrath RentCorp | | | 1,700 | |
| | 4 | | | Nash Finch Co. | | | 161 | |
The accompanying notes are an integral part of these financial statements.
225
The Hartford Select SmallCap Value Fund
Schedule of Investments — (continued)
April 30, 2008 (Unaudited)
(000’s Omitted)
| | | | | | | | | | | | | |
| | | | | | | | | Market
| |
| Shares | | | | | | | | Value (W) | |
| | | | | | | | | | | | | |
| COMMON STOCK — (continued) |
| | | | | | | | | | | | | |
| | | | | Consumer Cyclical — (continued) |
| | 38 | | | Owens & Minor, Inc. | | $ | 1,700 | |
| | 1 | | | Oxford Industries | | | 33 | |
| | 24 | | | Papa John’s International, Inc. (D) | | | 642 | |
| | 1 | | | Perini Corp. (D) | | | 33 | |
| | — | | | Scansource, Inc. (D) | | | 5 | |
| | 25 | | | School Specialty, Inc. (D) | | | 718 | |
| | 1 | | | Sealy Corp. | | | 4 | |
| | 1 | | | Spartan Stores, Inc. | | | 19 | |
| | 2 | | | Systemax, Inc. | | | 27 | |
| | 15 | | | United Stationers, Inc. (D) | | | 659 | |
| | 2 | | | Village Super Market, Inc. | | | 75 | |
| | 21 | | | Volcom, Inc. (D) | | | 399 | |
| | 4 | | | Warnaco Group, Inc. (D) | | | 185 | |
| | 1 | | | Wolverine World Wide, Inc. | | | 34 | |
| | 45 | | | World Fuel Services Corp. | | | 1,115 | |
| | | | | | | | | |
| | | | | | | | | | | | 14,634 | |
| | | | | | | | | | | | | |
| | | | | Consumer Staples — 2.5% |
| | 3 | | | Cal-Maine Foods, Inc. | | | 100 | |
| | 19 | | | Chattem, Inc. (D) | | | 1,307 | |
| | 2 | | | Elizabeth Arden, Inc. (D) | | | 39 | |
| | 2 | | | Hain Celestial Group, Inc. (D) | | | 54 | |
| | 24 | | | J&J Snack Foods Corp. | | | 673 | |
| | 4 | | | Ralcorp Holdings, Inc. (D) | | | 226 | |
| | 1 | | | TreeHouse Foods, Inc. (D) | | | 19 | |
| | 4 | | | Universal Corp. | | | 244 | |
| | 1 | | | Vector Group Ltd. | | | 9 | |
| | | | | | | | | |
| | | | | | | | | | | | 2,671 | |
| | | | | | | | | | | | | |
| | | | | Energy — 7.0% |
| | 3 | | | Berry Petroleum Co. | | | 139 | |
| | 2 | | | Bill Barrett Corp. (D) | | | 90 | |
| | 4 | | | Bois d’Arc Energy, Inc. (D) | | | 88 | |
| | 2 | | | Cal Dive International, Inc. (D) | | | 28 | |
| | — | | | Callon Petroleum Corp. (D) | | | 7 | |
| | — | | | Clayton Williams Energy, Inc. (D) | | | 19 | |
| | 1 | | | Comstock Resources, Inc. (D) | | | 23 | |
| | 41 | | | Crosstex Energy, Inc. | | | 1,409 | |
| | 4 | | | Delek U.S. Holdings, Inc. | | | 40 | |
| | 7 | | | Energy Partners Ltd. (D) | | | 89 | |
| | 2 | | | Exterran Holdings, Inc. (D) | | | 100 | |
| | 24 | | | Grey Wolf, Inc. (D) | | | 150 | |
| | 1 | | | Harvest Natural Resources, Inc. (D) | | | 12 | |
| | 5 | | | Headwaters, Inc. (D) | | | 59 | |
| | 4 | | | Laclede Group, Inc. | | | 163 | |
| | 15 | | | New Jersey Resources Corp. | | | 478 | |
| | 1 | | | Newpark Resources, Inc. (D) | | | 5 | |
| | 1 | | | Nicor, Inc. | | | 46 | |
| | 3 | | | Northwest Natural Gas Co. | | | 157 | |
| | 10 | | | Oceaneering International, Inc. (D) | | | 634 | |
| | 5 | | | Oilsands Quest, Inc. (D) | | | 22 | |
| | 5 | | | Petrohawk Energy Corp. (D) | | | 106 | |
| | 4 | | | Piedmont Natural Gas | | | 95 | |
| | 20 | | | Quicksilver Resources, Inc. (D) | | | 830 | |
| | 8 | | | Rosetta Resources, Inc. (D) | | | 170 | |
| | — | | | South Jersey Industries, Inc. | | | 11 | |
| | 4 | | | Southwest Gas Corp. | | | 103 | |
| | 4 | | | Stone Energy Corp. (D) | | | 270 | |
| | 36 | | | TETRA Technologies, Inc. (D) | | | 582 | |
| | 5 | | | Trico Marine Services, Inc. (D) | | | 173 | |
| | 36 | | | WD40 Co. | | | 1,133 | |
| | 5 | | | WGL Holdings, Inc. | | | 151 | |
| | 1 | | | Whiting Petroleum Corp. (D) | | | 107 | |
| | | | | | | | | |
| | | | | | | | | | | | 7,489 | |
| | | | | | | | | | | | | |
| | | | | Finance — 23.7% |
| | 2 | | | AMCORE Financial, Inc. | | | 29 | |
| | 8 | | | American Equity Investment Life Holding Co. | | | 77 | |
| | 4 | | | American Physicians Capital, Inc. | | | 167 | |
| | 4 | | | Amerigroup Corp. (D) | | | 105 | |
| | 1 | | | Amtrust Financial Services | | | 19 | |
| | 3 | | | Anchor Bancorp Wisconsin | | | 41 | |
| | 8 | | | Anthracite Capital, Inc. | | | 62 | |
| | — | | | Anworth Mortgage Asset Corp. | | | 1 | |
| | — | | | Apollo Investment Corp. | | | 5 | |
| | 147 | | | Ares Capital Corp. | | | 1,653 | |
| | — | | | Ares Capital Corp. Rights | | | — | |
| | 1 | | | Argo Group International Holdings Ltd. (D) | | | 53 | |
| | 14 | | | Ashford Hospitality | | | 83 | |
| | 8 | | | Aspen Insurance Holdings Ltd. | | | 195 | |
| | 3 | | | Assured Guaranty Ltd. | | | 78 | |
| | 1 | | | Asta Funding, Inc. | | | 16 | |
| | 1 | | | Bancfirst Corp. | | | 53 | |
| | 10 | | | Banco Latinoamericano de Exportaciones S.A. ADR Class E | | | 179 | |
| | 9 | | | Bankatlantick Bancorp, Inc. Class A | | | 28 | |
| | 2 | | | Berkshire Hills Bancorp, Inc. | | | 49 | |
| | 57 | | | Boston Private Financial Holdings, Inc. | | | 527 | |
| | — | | | Calamos Asset Management, Inc. | | | 5 | |
| | 9 | | | Capital Corp. of the West | | | 58 | |
| | 15 | | | CapLease, Inc. | | | 123 | |
| | 81 | | | Cathay General Bancorp | | | 1,373 | |
| | 4 | | | Cedar Shopping Court | | | 46 | |
| | 6 | | | Centene Corp. (D) | | | 107 | |
| | 7 | | | Centennial Bank Holdings, Inc. (D) | | | 41 | |
| | 5 | | | Centerline Holding Co. | | | 18 | |
| | 4 | | | Central Pacific Financial Corp. | | | 72 | |
| | 5 | | | Chemical Financial Corp. | | | 128 | |
| | 17 | | | Citizens Republic Bancorp, Inc. | | | 139 | |
| | — | | | Citizens, Inc. (D) | | | 3 | |
| | — | | | City Bank Lynnwood Wash | | | 5 | |
| | 4 | | | City Holding Co. | | | 146 | |
| | 4 | | | Clayton Holdings, Inc. (D) | | | 20 | |
| | 54 | | | Colonial BancGroup, Inc. | | | 436 | |
| | — | | | Columbia Banking Systems, Inc. | | | 6 | |
| | 2 | | | CompuCredit Corp. (D) | | | 20 | |
| | 84 | | | Corus Bankshares, Inc. | | | 620 | |
| | 74 | | | CVB Financial Corp. | | | 850 | |
| | 25 | | | DCT Industrial Trust, Inc. | | | 248 | |
| | 2 | | | Delphi Financial Group Class A | | | 46 | |
| | 13 | | | Diamondrock Hospitality | | | 168 | |
| | 1 | | | Downey Financial Corp. | | | 7 | |
| | 7 | | | Education Realty Trust, Inc. | | | 92 | |
| | 7 | | | Encore Capital Group, Inc. (D) | | | 47 | |
| | 33 | | | Entertainment Properties Trust | | | 1,756 | |
| | 1 | | | Extra Space Storage, Inc. | | | 22 | |
| | 4 | | | FBL Financial Group Class A | | | 118 | |
| | 1 | | | Federal Agricultural Mortgage Corp. | | | 22 | |
| | 34 | | | Financial Federal Corp. | | | 782 | |
| | 3 | | | First Bancorp NC | | | 62 | |
| | 4 | | | First Bancorp Puerto Rico | | | 41 | |
The accompanying notes are an integral part of these financial statements.
226
| | | | | | | | | | | | | |
| | | | | | | | | Market
| |
| Shares | | | | | | | | Value (W) | |
| | | | | | | | | | | | | |
| COMMON STOCK — (continued) |
| | | | | | | | | | | | | |
| | | | | Finance — (continued) |
| | 9 | | | First Commonwealth Financial Corp. | | $ | 107 | |
| | — | | | First Community Bancorp, Inc. | | | 6 | |
| | 3 | | | First Industrial Realty Trust, Inc. | | | 88 | |
| | 4 | | | First Merchants Corp. | | | 114 | |
| | 5 | | | First Mercury Financial Corp. (D) | | | 74 | |
| | — | | | First Midwest Bancorp, Inc. | | | 11 | |
| | 17 | | | First Niagara Financial Group, Inc. | | | 245 | |
| | 1 | | | First Place Financial | | | 13 | |
| | 3 | | | FirstFed Financial Corp. (D) | | | 40 | |
| | 5 | | | FirstMerit Corp. | | | 109 | |
| | 6 | | | Flagstone Reinsurance Holdings | | | 77 | |
| | 6 | | | FNB Corp. | | | 88 | |
| | 3 | | | FPIC Insurance Group, Inc. (D) | | | 121 | |
| | 27 | | | Friedman Billings Ramsey Group, Inc. | | | 68 | |
| | 1 | | | Frontier Financial Corp. | | | 13 | |
| | 5 | | | Gramercy Capital Corp. | | | 94 | |
| | 5 | | | Great Southern Bancorp, Inc. | | | 73 | |
| | 3 | | | Green Bankshares, Inc. | | | 58 | |
| | 1 | | | Hanmi Financial Corp. | | | 4 | |
| | — | | | Harleysville Group, Inc. | | | 4 | |
| | 3 | | | Hercules Technology Growth | | | 25 | |
| | 15 | | | Hersha Hospitality Trust | | | 139 | |
| | 1 | | | HFF, Inc. (D) | | | 3 | |
| | 9 | | | Hilltop Holdings, Inc. (D) | | | 94 | |
| | 6 | | | Horace Mann Educators Corp. | | | 97 | |
| | 13 | | | IMPAC Mortgage Holdings, Inc. | | | 16 | |
| | 1 | | | Imperial Capital Bancorp, Inc. | | | 20 | |
| | 8 | | | Independent Bank Corp. Michigan | | | 63 | |
| | 16 | | | Infinity Property & Casualty Corp. | | | 616 | |
| | 4 | | | Integra Bank Corp. | | | 64 | |
| | 28 | | | International Bancshares Corp. | | | 692 | |
| | 9 | | | IPC Holdings Ltd. | | | 256 | |
| | 8 | | | Irwin Financial Corp. | | | 46 | |
| | 4 | | | JER Investors Trust, Inc. | | | 34 | |
| | 1 | | | Kansas City Life Insurance Co. | | | 40 | |
| | 7 | | | Kearny Financial Corp. | | | 78 | |
| | 3 | | | Knight Capital Group, Inc. (D) | | | 65 | |
| | 6 | | | Knology, Inc. (D) | | | 76 | |
| | 6 | | | LaBranche & Co., Inc. (D) | | | 40 | |
| | 2 | | | Lakeland Bancorp, Inc. | | | 37 | |
| | 5 | | | LaSalle Hotel Properties | | | 170 | |
| | 14 | | | Lexington Realty Trust | | | 205 | |
| | 9 | | | Luminent Mortgage Trust | | | 2 | |
| | — | | | MainSource Financial Group, Inc. | | | 5 | |
| | 2 | | | Max Capital Group, Ltd. | | | 42 | |
| | 139 | | | MCG Capital Corp. | | | 1,071 | |
| | — | | | MCG Capital Corp. Rights | | | — | |
| | 2 | | | Medical Properties Trust, Inc. | | | 24 | |
| | 22 | | | MFA Mortgage Investments, Inc. | | | 151 | |
| | 4 | | | Molina Healthcare, Inc. (D) | | | 89 | |
| | 13 | | | Montpelier Re Holdings Ltd. | | | 216 | |
| | 1 | | | N B T Bancorp | | | 25 | |
| | 44 | | | National Financial Partners Corp. | | | 1,190 | |
| | 1 | | | National Health Investors, Inc. | | | 18 | |
| | 5 | | | National Penn Bancshares, Inc. | | | 81 | |
| | 9 | | | National Retail Properties, Inc. | | | 199 | |
| | 3 | | | Navigators Group, Inc. (D) | | | 147 | |
| | 2 | | | Nelnet, Inc. | | | 21 | |
| | 1 | | | Newcastle Investment Corp. | | | 11 | |
| | — | | | Newstar Financial, Inc. (D) | | | 2 | |
| | 9 | | | NGP Capital Resources Co. | | | 148 | |
| | 1 | | | Odyssey Re Holdings Corp. | | | 29 | |
| | 10 | | | Old National Bankcorp | | | 172 | |
| | 9 | | | Oriental Financial Group, Inc. | | | 164 | |
| | 7 | | | Pacific Capital Bancorp | | | 150 | |
| | 1 | | | Parkway Properties, Inc. | | | 24 | |
| | 8 | | | Penn Real Estate Investment Trust | | | 199 | |
| | 2 | | | PennantPark Investment Corp. | | | 16 | |
| | — | | | Peoples Bancorp, Inc. | | | 7 | |
| | 8 | | | Phoenix Cos. | | | 103 | |
| | 3 | | | Piper Jaffray Cos. (D) | | | 93 | |
| | 3 | | | Platinum Underwriters Holdings Ltd. | | | 100 | |
| | 17 | | | PMA Capital Corp. Class A (D) | | | 155 | |
| | — | | | ProAssurance Corp. (D) | | | 11 | |
| | 4 | | | Provident Bankshares Corp. | | | 49 | |
| | 6 | | | Provident Financial Services, Inc. | | | 88 | |
| | 8 | | | Pzena Investment Management, Inc. | | | 91 | |
| | 1 | | | QC Holdings, Inc. | | | 4 | |
| | 5 | | | Rent-A-Center, Inc. (D) | | | 106 | |
| | 2 | | | Republic Bancorp, Inc. | | | 42 | |
| | 1 | | | RLI Corp. | | | 29 | |
| | 5 | | | S&T Bancorp, Inc. | | | 174 | |
| | — | | | Sandy Spring Bancorp, Inc. | | | 8 | |
| | — | | | Santander BanCorp | | | 5 | |
| | 3 | | | Seabright Insurance Holdings (D) | | | 48 | |
| | 46 | | | Selective Insurance Group | | | 977 | |
| | 5 | | | Senior Housing Properties Trust | | | 119 | |
| | 2 | | | Simmons First National Corp. | | | 74 | |
| | 27 | | | Solera Holdings, Inc. (D) | | | 698 | |
| | 5 | | | South Financial Group, Inc. | | | 30 | |
| | 2 | | | Southwest Bancorp | | | 30 | |
| | 12 | | | StanCorp Financial Group, Inc. | | | 589 | |
| | 1 | | | Sterling Bancshares, Inc. | | | 7 | |
| | 3 | | | Sterling Financial Corp. | | | 38 | |
| | 14 | | | Strategic Hotels & Resorts, Inc. | | | 206 | |
| | 1 | | | Suffolk Bancorp | | | 29 | |
| | — | | | Sun Bancorp, Inc. (D) | | | 2 | |
| | 12 | | | Sunstone Hotel Investors, Inc. | | | 222 | |
| | 7 | | | Susquehanna Bancshares, Inc. | | | 143 | |
| | 1 | | | SWS Group, Inc. | | | 7 | |
| | 8 | | | Symmetricom, Inc. (D) | | | 32 | |
| | 5 | | | Taylor Capital Group, Inc. | | | 79 | |
| | 71 | | | Trustco Bank Corp. | | | 616 | |
| | 1 | | | Trustmark Corp. | | | 24 | |
| | 1 | | | Umpqua Holdings Corp. | | | 7 | |
| | 1 | | | United Bankshares, Inc. | | | 22 | |
| | 2 | | | United Community Financial | | | 17 | |
| | 1 | | | United Fire & Casualty | | | 36 | |
| | 4 | | | Universal American Financial Corp. (D) | | | 41 | |
| | 1 | | | U-Store-It | | | 10 | |
| | 335 | | | W Holding Co., Inc. | | | 352 | |
| | 5 | | | Waddell and Reed Financial, Inc. Class A | | | 165 | |
| | 6 | | | WesBanco, Inc. | | | 131 | |
| | — | | | Wilshire Bancorp, Inc. | | | 2 | |
| | 1 | | | Wintrust Financial Corp. | | | 44 | |
| | | | | | | | | |
| | | | | | | | | | | | 25,388 | |
| | | | | | | | | | | | | |
| | | | | Health Care — 4.5% |
| | 30 | | | Advanced Medical Optics, Inc. (D) | | | 624 | |
| | — | | | Albany Molecular Research, Inc. (D) | | | 2 | |
| | — | | | Alliance Imaging, Inc. (D) | | | 4 | |
The accompanying notes are an integral part of these financial statements.
227
The Hartford Select SmallCap Value Fund
Schedule of Investments — (continued)
April 30, 2008 (Unaudited)
(000’s Omitted)
| | | | | | | | | | | | | |
| | | | | | | | | Market
| |
| Shares | | | | | | | | Value (W) | |
| | | | | | | | | | | | | |
| COMMON STOCK — (continued) |
| | | | | | | | | | | | | |
| | | | | Health Care — (continued) |
| | 5 | | | Amicus Therapeutics, Inc. (D) | | $ | 48 | |
| | 2 | | | AmSurg Corp. (D) | | | 54 | |
| | 3 | | | Animal Health International, Inc. (D) | | | 25 | |
| | 4 | | | Applera Corp. — Celera Group (D) | | | 51 | |
| | 2 | | | Apria Healthcare Group, Inc. (D) | | | 41 | |
| | 1 | | | CONMED Corp. (D) | | | 36 | |
| | 13 | | | Cooper Co., Inc. | | | 438 | |
| | 21 | | | Emergency Medical Services (D) | | | 472 | |
| | 4 | | | Enzon, Inc. (D) | | | 34 | |
| | 1 | | | Forrester Research, Inc. (D) | | | 22 | |
| | 1 | | | Genoptix, Inc. (D) | | | 16 | |
| | 1 | | | Incyte Corp. (D) | | | 9 | |
| | 4 | | | Invacare Corp. | | | 72 | |
| | 23 | | | Landauer, Inc. | | | 1,203 | |
| | 19 | | | Magellan Health Services, Inc. (D) | | | 718 | |
| | 2 | | | Martek Biosciences Corp. (D) | | | 53 | |
| | 1 | | | MedCath Corp. (D) | | | 17 | |
| | — | | | Odyssey HealthCare, Inc. (D) | | | 4 | |
| | — | | | Par Pharmaceutical Cos., Inc. (D) | | | 3 | |
| | 1 | | | Perrigo Co. | | | 36 | |
| | 10 | | | Prestige Brands Holdings, Inc. (D) | | | 92 | |
| | 6 | | | Rehabcare Group, Inc. (D) | | | 109 | |
| | 1 | | | Res-Care, Inc. (D) | | | 21 | |
| | 2 | | | Sciele Pharma, Inc. (D) | | | 40 | |
| | 6 | | | STERIS Corp. | | | 172 | |
| | — | | | Sunrise Senior Living, Inc. (D) | | | 4 | |
| | 1 | | | ViroPharma, Inc. (D) | | | 13 | |
| | 21 | | | Young Innovations, Inc. | | | 369 | |
| | | | | | | | | |
| | | | | | | | | | | | 4,802 | |
| | | | | | | | | | | | | |
| | | | | Services — 13.3% |
| | 1 | | | A.H. Belo Corp. — Class A (D) | | | 6 | |
| | 75 | | | ABM Industries, Inc. | | | 1,560 | |
| | 2 | | | Aecom Technology Corp. (D) | | | 49 | |
| | 6 | | | American Greetings Corp. Class A | | | 113 | |
| | 35 | | | AMN Healthcare Services, Inc. (D) | | | 511 | |
| | 1 | | | Asset Acceptance | | | 16 | |
| | 38 | | | Avid Technology, Inc. (D) | | | 793 | |
| | 3 | | | Belo Corp. Class A | | | 33 | |
| | 1 | | | Black Box Corp. | | | 16 | |
| | 5 | | | Bowne & Co., Inc. | | | 85 | |
| | — | | | Brady Corp. Class A | | | 7 | |
| | 15 | | | CACI International, Inc. Class A (D) | | | 782 | |
| | 3 | | | Carmike Cinemas, Inc. | | | 22 | |
| | 1 | | | Casella Waste Systems, Inc. (D) | | | 9 | |
| | 6 | | | Central European Media Enterprises Ltd. (D) | | | 599 | |
| | 1 | | | CIBER, Inc. (D) | | | 4 | |
| | 20 | | | Citadel Broadcasting Corp. | | | 27 | |
| | 25 | | | Computer Services, Inc. | | | 842 | |
| | 1 | | | Entercom Communications Corp. | | | 11 | |
| | 1 | | | Entravision Communications Corp. Class A (D) | | | 7 | |
| | 3 | | | Foundry Networks, Inc. (D) | | | 32 | |
| | 15 | | | G & K Services, Inc. Class A | | | 479 | |
| | 1 | | | Great Wolf Resorts, Inc. (D) | | | 4 | |
| | 1 | | | Healthspring, Inc. (D) | | | 14 | |
| | — | | | Heidrick & Struggles International, Inc. | | | 3 | |
| | 55 | | | Jackson Hewitt Tax Service, Inc. | | | 820 | |
| | 6 | | | JDA Software Group, Inc. (D) | | | 117 | |
| | 5 | | | Journal Communications, Inc. | | | 26 | |
| | 3 | | | Kelly Services, Inc. | | | 65 | |
| | — | | | Kforce, Inc. (D) | | | 1 | |
| | — | | | Korn/Ferry International (D) | | | 7 | |
| | 4 | | | Lee Enterprises, Inc. | | | 33 | |
| | 1 | | | Lin TV Corp. (D) | | | 6 | |
| | 1 | | | Manhattan Associates, Inc. (D) | | | 28 | |
| | — | | | Mantech International Corp. Class A (D) | | | 19 | |
| | 5 | | | MAXIMUS, Inc. | | | 186 | |
| | 1 | | | Monroe Muffler, Inc. | | | 8 | |
| | 1 | | | MPS Group, Inc. (D) | | | 14 | |
| | — | | | Multi-Color Corp. | | | 4 | |
| | 57 | | | Navigant Consulting, Inc. (D) | | | 1,147 | |
| | 7 | | | Pacer International, Inc. | | | 128 | |
| | 6 | | | Parametric Technology Corp. (D) | | | 103 | |
| | 7 | | | Perot Systems Corp. Class A (D) | | | 107 | |
| | 25 | | | Plexus Corp. (D) | | | 593 | |
| | 8 | | | Premiere Global Services, Inc. (D) | | | 116 | |
| | 1 | | | Radio One, Inc. Class D (D) | | | 1 | |
| | 3 | | | Regis Corp. | | | 79 | |
| | 28 | | | Resources Connection, Inc. | | | 562 | |
| | 8 | | | SAIC, Inc. (D) | | | 146 | |
| | 5 | | | Scholastic Corp. (D) | | | 130 | |
| | 18 | | | Spherion Corp. (D) | | | 90 | |
| | — | | | Standard Parking Corp. (D) | | | 10 | |
| | 15 | | | Stewart Enterprises, Inc. | | | 106 | |
| | 63 | | | Syntel, Inc. | | | 2,079 | |
| | 3 | | | Tetra Tech, Inc. (D) | | | 55 | |
| | 13 | | | Unifirst Corp. | | | 623 | |
| | 109 | | | Unisys Corp. (D) | | | 453 | |
| | 4 | | | Viad Corp. | | | 113 | |
| | — | | | Volt Information Sciences, Inc. (D) | | | 3 | |
| | 5 | | | Waste Connections, Inc. (D) | | | 149 | |
| | 2 | | | Watson Wyatt Worldwide, Inc. | | | 98 | |
| | 5 | | | Westwood One, Inc. | | | 8 | |
| | | | | | | | | |
| | | | | | | | | | | | 14,257 | |
| | | | | | | | | | | | | |
| | | | | Technology — 10.4% |
| | 1 | | | A.O. Smith Corp. | | | 38 | |
| | 6 | | | Actel Corp. (D) | | | 91 | |
| | — | | | Actuant Corp. Class A | | | 3 | |
| | 1 | | | Acuity Brands, Inc. | | | 38 | |
| | — | | | ADTRAN, Inc. | | | 10 | |
| | 4 | | | Alaska Communication Systems Holdings, Inc. | | | 45 | |
| | 55 | | | American Reprographics Co. LLC (D) | | | 868 | |
| | 14 | | | AMETEK, Inc. | | | 674 | |
| | 2 | | | Analogic Corp. | | | 92 | |
| | 1 | | | Anaren Microwave, Inc. (D) | | | 8 | |
| | — | | | Arris Group, Inc. (D) | | | 3 | |
| | 4 | | | Avocent Corp. (D) | | | 74 | |
| | — | | | Badger Meter, Inc. | | | 5 | |
| | 1 | | | Bio-Rad Laboratories, Inc. Class A (D) | | | 99 | |
| | — | | | Bottomline Technologies, Inc. (D) | | | 2 | |
| | 6 | | | Checkpoint Systems, Inc. (D) | | | 160 | |
| | 27 | | | Cincinnati Bell, Inc. (D) | | | 125 | |
| | 1 | | | CMGI, Inc. (D) | | | 19 | |
| | 3 | | | Cognex Corp. | | | 73 | |
| | 26 | | | Coherent, Inc. (D) | | | 766 | |
| | — | | | comScore, Inc. (D) | | | 4 | |
| | 5 | | | Consolidated Communications Holdings, Inc. | | | 77 | |
| | 28 | | | Credence Systems Corp. (D) | | | 29 | |
| | 5 | | | CSG Systems International, Inc. (D) | | | 55 | |
| | 3 | | | CTS Corp. | | | 34 | |
The accompanying notes are an integral part of these financial statements.
228
| | | | | | | | | | | | | |
| | | | | | | | | Market
| |
| Shares | | | | | | | | Value (W) | |
| | | | | | | | | | | | | |
| COMMON STOCK — (continued) |
| | | | | | | | | | | | | |
| | | | | Technology — (continued) |
| | 3 | | | Cubic Corp. | | $ | 81 | |
| | 2 | | | Datascope Corp. | | | 60 | |
| | 5 | | | Deluxe Corp. | | | 98 | |
| | 1 | | | DG Fastchannel, Inc. (D) | | | 21 | |
| | 6 | | | Digi International, Inc. (D) | | | 52 | |
| | 54 | | | Electronics for Imaging, Inc. (D) | | | 774 | |
| | 9 | | | Emulex Corp. (D) | | | 117 | |
| | 2 | | | Enersys (D) | | | 40 | |
| | — | | | Esterline Technologies Corp. (D) | | | 22 | |
| | 1 | | | Extreme Networks, Inc. (D) | | | 4 | |
| | 68 | | | General Communication, Inc. Class A (D) | | | 422 | |
| | 4 | | | GeoEye, Inc. (D) | | | 99 | |
| | 5 | | | GrafTech International Ltd. (D) | | | 105 | |
| | 1 | | | Greatbatch, Inc. (D) | | | 24 | |
| | 17 | | | Harris Interactive, Inc. (D) | | | 42 | |
| | 6 | | | Interactive Data Corp. | | | 157 | |
| | 8 | | | Interwoven, Inc. (D) | | | 86 | |
| | 21 | | | iPCS, Inc. | | | 648 | |
| | 40 | | | Jabil Circuit, Inc. | | | 437 | |
| | 5 | | | Kemet Corp. (D) | | | 20 | |
| | 1 | | | Lawson Software, Inc. (D) | | | 11 | |
| | 2 | | | Littelfuse, Inc. (D) | | | 78 | |
| | 2 | | | Measurement Specialties, Inc. (D) | | | 28 | |
| | 11 | | | Methode Electronics, Inc. | | | 120 | |
| | 1 | | | Movado Group | | | 15 | |
| | 56 | | | MSC.Software Corp. (D) | | | 686 | |
| | 3 | | | Newport Corp. (D) | | | 33 | |
| | 7 | | | Nexstar Broadcasting Group A (D) | | | 39 | |
| | 11 | | | Palm, Inc. | | | 63 | |
| | 4 | | | Park Electrochemical Corp. | | | 111 | |
| | 8 | | | Pegasystems, Inc. | | | 80 | |
| | 8 | | | PeopleSupport, Inc. (D) | | | 74 | |
| | 2 | | | Pericom Semiconductor Corp. (D) | | | 38 | |
| | 7 | | | Plantronics, Inc. | | | 184 | |
| | 3 | | | Polypore International, Inc. (D) | | | 80 | |
| | 2 | | | Quantum Corp. (D) | | | 3 | |
| | 3 | | | RCN Corp. | | | 39 | |
| | 23 | | | RF Micro Devices, Inc. (D) | | | 77 | |
| | 34 | | | Schwak, Inc. | | | 543 | |
| | 3 | | | Semtech Corp. (D) | | | 44 | |
| | — | | | Shenandoah Telecommunications Co. | | | 3 | |
| | 1 | | | SI International (D) | | | 25 | |
| | 33 | | | Silicon Storage Technology, Inc. (D) | | | 100 | |
| | 5 | | | Skyworks Solutions, Inc. (D) | | | 39 | |
| | 8 | | | SonicWALL, Inc. (D) | | | 61 | |
| | 5 | | | Spansion, Inc. (D) | | | 18 | |
| | 1 | | | Standard Microsystems Corp. (D) | | | 24 | |
| | 7 | | | Stoneridge, Inc. (D) | | | 106 | |
| | 8 | | | Sybase, Inc. (D) | | | 225 | |
| | 2 | | | Sycamore Networks, Inc. (D) | | | 6 | |
| | 6 | | | Syniverse Holdings, Inc. (D) | | | 94 | |
| | 5 | | | Technitrol, Inc. | | | 97 | |
| | — | | | Teledyne Technologies, Inc. (D) | | | 12 | |
| | 20 | | | Tibco Software, Inc. (D) | | | 151 | |
| | 1 | | | TriQuint Semiconductor, Inc. (D) | | | 10 | |
| | 16 | | | Trizetto Group, Inc. (D) | | | 330 | |
| | 6 | | | TTM Technologies, Inc. (D) | | | 85 | |
| | 9 | | | United Online, Inc. | | | 95 | |
| | 1 | | | Varian, Inc. (D) | | | 38 | |
| | 28 | | | VeriFone Holdings, Inc. (D) | | | 314 | |
| | 10 | | | Vignette Corp. (D) | | | 110 | |
| | 11 | | | Zoran Corp. (D) | | | 139 | |
| | | | | | | | | |
| | | | | | | | | | | | 11,129 | |
| | | | | | | | | | | | | |
| | | | | Transportation — 4.7% |
| | 1 | | | Alaska Air Group, Inc. (D) | | | 17 | |
| | — | | | Arkansas Best Corp. | | | 4 | |
| | 4 | | | Atlas Air Worldwide Holdings, Inc. (D) | | | 218 | |
| | 5 | | | ExpressJet Holdings, Inc. (D) | | | 15 | |
| | 22 | | | Forward Air Corp. | | | 760 | |
| | 4 | | | General Maritime Corp. | | | 102 | |
| | 3 | | | Heartland Express, Inc. | | | 54 | |
| | 3 | | | Hornbeck Offshore Services, Inc. (D) | | | 154 | |
| | 55 | | | Landstar System, Inc. | | | 2,806 | |
| | 3 | | | Polaris Industries, Inc. | | | 154 | |
| | 7 | | | Republic Airways Holdings, Inc. (D) | | | 118 | |
| | 10 | | | SkyWest, Inc. | | | 183 | |
| | 15 | | | Thor Industries, Inc. | | | 440 | |
| | 5 | | | Wabash National Corp. | | | 42 | |
| | 2 | | | Winnebago Industries, Inc. | | | 24 | |
| | | | | | | | | |
| | | | | | | | | | | | 5,091 | |
| | | | | | | | | | | | | |
| | | | | Utilities — 1.7% |
| | 16 | | | Aquila, Inc. (D) | | | 57 | |
| | 3 | | | Avista Corp. | | | 59 | |
| | 2 | | | Black Hills Corp. | | | 86 | |
| | — | | | Central Vermont Public Service Corp. | | | 2 | |
| | 1 | | | CH Energy Group | | | 25 | |
| | 2 | | | Cleco Corp. | | | 46 | |
| | 9 | | | El Paso Electric Co. (D) | | | 201 | |
| | 1 | | | IDACORP, Inc. | | | 42 | |
| | — | | | MGE Energy, Inc. | | | 14 | |
| | 49 | | | Pike Electric Corp. (D) | | | 783 | |
| | 6 | | | PNM Resources, Inc. | | | 83 | |
| | 5 | | | Portland General Electric Co. | | | 115 | |
| | 2 | | | UIL Holdings Corp. | | | 72 | |
| | 2 | | | UniSource Energy Corp. | | | 47 | |
| | 8 | | | Westar Energy, Inc. | | | 183 | |
| | | | | | | | | |
| | | | | | | | | | | | 1,815 | |
| | | | | | | | | | | | | |
| | | | | Total common stock
(cost $119,506) | | $ | 102,905 | |
| | | | | | | | | | | | | |
| | | | | | | | | | | | | |
| PREFERRED STOCK — 0.5% |
| | | | | Finance — 0.5% |
| | — | | | East West Bancorp, Inc. (X) | | $ | 529 | |
| | | | | | | | | |
| | | | | Total preferred stock
(cost $482) | | $ | 529 | |
| | | | | | | | | |
| | | | | Total long-term investments
(cost $119,988) | | $ | 103,434 | |
| | | | | | | | | | | | | |
| | | | | | | | | | | | | |
Principal
| | | | | | | | | |
| Amount | | | | | | | | | |
| |
| SHORT-TERM INVESTMENTS — 3.1% |
| | | | | Finance — 1.0% |
| | | | | Wells Fargo | | | | |
| $ | 1,082 | | | 2.25%, 05/01/2008 | | $ | 1,082 | |
| | | | | | | | | | | | | |
| | | | | | | | | | | | | |
The accompanying notes are an integral part of these financial statements.
229
The Hartford Select SmallCap Value Fund
Schedule of Investments — (continued)
April 30, 2008 (Unaudited)
(000’s Omitted)
| | | | | | | | | | | | | |
| | | | | | | | | Market
| |
| Shares | | | | | | | | Value (W) | |
| |
| | | | | Investment Pools and Funds — 2.1% |
| | 1,063 | | | Federated Investors Prime Obligations Fund | | $ | 1,063 | |
| | 1,170 | | | State Street Bank Money Market Fund | | | 1,169 | |
| | | | | | | | | |
| | | | | | | | | | | | 2,232 | |
| | | | | | | | | | | | | |
| | | | | Total short-term investments
(cost $3,314) | | $ | 3,314 | |
| | | | | | | | | |
| | | | | Total investments
(cost $123,302) (C) | | | 99.7 | % | | $ | 106,748 | |
| | | | | Other assets and liabilities | | | 0.3 | % | | | 334 | |
| | | | | | | | | | | | | |
| | | | | Total net assets | | | 100.0 | % | | $ | 107,082 | |
| | | | | | | | | | | | | |
| |
| Note: | Percentage of investments as shown is the ratio of the total market value to total net assets. Market value of investments in foreign securities represents 0.19% of total net assets at April 30, 2008. |
| | |
| | Foreign securities that are principally traded on certain foreign markets are adjusted daily pursuant to a third party pricing service methodology approved by the Board of Directors in order to reflect an adjustment for factors occurring after the close of the foreign market but before the close of the New York Stock Exchange. |
| |
| (C) | | At April 30, 2008, the cost of securities for federal income tax purposes was $123,302 and the aggregate gross unrealized appreciation and depreciation based on that cost were: |
| | | | | |
| Unrealized Appreciation | | $ | 7,573 | |
| Unrealized Depreciation | | | (24,127 | ) |
| | | | | |
| Net Unrealized Depreciation | | $ | (16,554 | ) |
| | | | | |
| | |
| (D) | | Currently non-income producing. |
| |
| (X) | | Convertible security. |
| |
| | Futures Contracts Outstanding at April 30, 2008 |
| | | | | | | | | | | | | | | | | |
| | | | | | | | | | | | Unrealized
| |
| | | Number of
| | | | | | Expiration
| | | Appreciation/
| |
Description | | Contracts* | | | Position | | | Month | | | (Depreciation) | |
| |
| Russell Mini Futures | | | 14 | | | | Long | | | | Jun 2008 | | | $ | 51 | |
| | | | | | | | | | | | | | | | | |
| | |
| | * The number of contracts does not omit 000’s. |
| |
| | Cash of $59 was pledged as initial margin deposit for open futures contracts at April 30, 2008. |
| |
| (W) | | See Note 2b of accompanying Notes to Financial Statements regarding valuation of securities. |
The accompanying notes are an integral part of these financial statements.
230
The Hartford Short Duration Fund
Schedule of Investments
April 30, 2008 (Unaudited)
(000’s Omitted)
| | | | | | | | | | | | | |
Principal
| | | | | | | | Market
| |
| Amount | | | | | | | | Value (W) | |
| ASSET & COMMERCIAL MORTGAGE BACKED SECURITIES — 30.8% |
| | | | | Finance — 30.8% |
| | | | | American Express Credit Account Master Trust | | | | |
| $ | 32 | | | 3.22%, 02/15/2012 (I)(L) | | $ | 30 | |
| | | | | AmeriCredit Automobile Receivables Trust | | | | |
| | 600 | | | 5.04%, 05/06/2011 | | | 590 | |
| | 1,389 | | | 5.07%, 07/06/2010 | | | 1,392 | |
| | 846 | | | 5.21%, 10/06/2011 | | | 826 | |
| | | | | Banc of America Securities Automotive Trust | | | | |
| | 1,500 | | | 4.49%, 02/18/2013 (H) | | | 1,505 | |
| | | | | Bayview Commercial Asset Trust | | | | |
| | 422 | | | 3.89%, 01/25/2035 (H)(L) | | | 324 | |
| | 6,250 | | | 7.00%, 07/25/2037 (H)(N) | | | 700 | |
| | 12,192 | | | 7.18%, 01/25/2037 (H)(N) | | | 1,133 | |
| | 10,545 | | | 7.50%, 09/25/2037 (H)(N) | | | 1,339 | |
| | | | | Bayview Financial Acquisition Trust | | | | |
| | 1,185 | | | 4.91%, 02/25/2033 (H) | | | 1,156 | |
| | 2,000 | | | 5.64%, 11/28/2036 (H) | | | 1,450 | |
| | | | | Bear Stearns Asset Backed Securities, Inc. | | | | |
| | 707 | | | 5.16%, 09/25/2033 (H) | | | 577 | |
| | | | | Bear Stearns Commercial Mortgage Securities, Inc. | | | | |
| | 21,142 | | | 4.12%, 11/11/2041 (H)(N) | | | 456 | |
| | 53,002 | | | 4.65%, 02/11/2041 (H)(N) | | | 486 | |
| | 106,822 | | | 6.25%, 12/11/2040 (H)(N) | | | 389 | |
| | | | | Capital Automotive Receivables Asset Trust | | | | |
| | 800 | | | 5.55%, 01/18/2011 (H) | | | 805 | |
| | 200 | | | 5.77%, 05/20/2010 (H) | | | 197 | |
| | 225 | | | 6.15%, 04/20/2011 (H) | | | 216 | |
| | 1,000 | | | 6.35%, 03/17/2014 (I) | | | 874 | |
| | | | | Capital One Multi-Asset Execution Trust | | | | |
| | 1,000 | | | 4.13%, 03/15/2013 (M) | | | 1,000 | |
| | 1,000 | | | 4.50%, 06/15/2011 | | | 998 | |
| | | | | Capital One Prime Automotive Receivables Trust | | | | |
| | 1,000 | | | 5.68%, 06/16/2014 (H) | | | 972 | |
| | | | | Carmax Automotive Owner Trust | | | | |
| | 1,000 | | | 6.12%, 07/15/2013 (H) | | | 981 | |
| | | | | CBA Commercial Small Balance Commercial Mortgage | | | | |
| | 42,419 | | | 7.00%, 07/25/2035 — 06/25/2038 (H)(N) | | | 2,841 | |
| | 10,921 | | | 9.75%, 01/25/2039 (H)(N) | | | 1,065 | |
| | | | | Citibank Credit Card Issuance Trust | | | | |
| | 2,000 | | | 2.96%, 01/09/2012 (H)(L) | | | 1,839 | |
| | | | | Citicorp Residential Mortgage Securities | | | | |
| | 100 | | | 6.27%, 06/25/2037 (L) | | | 92 | |
| | | | | CNH Equipment Trust | | | | |
| | 750 | | | 4.93%, 12/17/2012 (H) | | | 687 | |
| | | | | Commercial Mortgage Pass-Through Certificates | | | | |
| | 1,500 | | | 3.17%, 12/15/2020 (I)(L) | | | 1,420 | |
| | 2,899 | | | 3.59%, 03/10/2039 (H)(N) | | | 54 | |
| | | | | Countrywide Asset-Backed Certificates | | | | |
| | 1,500 | | | 5.57%, 11/25/2035 | | | 938 | |
| | 1,000 | | | 5.71%, 11/25/2035 | | | 362 | |
| | | | | CS First Boston Mortgage Securities Corp. | | | | |
| | 12,743 | | | 4.17%, 07/15/2036 (H)(N) | | | 181 | |
| | | | | DaimlerChrysler Automotive Trust | | | | |
| | 800 | | | 4.48%, 08/08/2014 | | | 782 | |
| | 800 | | | 5.14%, 09/08/2012 | | | 796 | |
| | | | | Equity One ABS, Inc. | | | | |
| | 34 | | | 5.39%, 07/25/2034 (H)(L) | | | 32 | |
| | | | | Ford Credit Automotive Owner Trust | | | | |
| | 2,924 | | | 5.29%, 04/15/2011 | | | 2,962 | |
| | 750 | | | 5.48%, 09/15/2011 | | | 752 | |
| | 500 | | | 5.68%, 06/15/2012 (H) | | | 448 | |
| | 1,000 | | | 5.69%, 11/15/2012 | | | 965 | |
| | | | | GE Capital Commercial Mortgage Corp. | | | | |
| | 7,920 | | | 3.76%, 03/10/2040 (H)(N) | | | 110 | |
| | | | | GMAC Mortgage Corp. Loan Trust | | | | |
| | 1,196 | | | 4.09%, 04/25/2033 | | | 889 | |
| | 308 | | | 4.62%, 04/25/2033 | | | 211 | |
| | 715 | | | 5.75%, 10/25/2036 | | | 509 | |
| | | | | Goldman Sachs Automotive Loan Trust | | | | |
| | 199 | | | 4.98%, 11/15/2013 (H) | | | 199 | |
| | | | | Goldman Sachs Mortgage Securities Corp. II | | | | |
| | 2,000 | | | 4.32%, 10/10/2028 | | | 1,975 | |
| | 18,649 | | | 4.38%, 08/10/2038 (H)(N) | | | 134 | |
| | | | | Green Tree Financial Corp. | | | | |
| | 8 | | | 7.30%, 01/15/2026 | | | 8 | |
| | | | | Hasco NIM Trust | | | | |
| | 34 | | | 6.25%, 12/26/2035 (H) | | | 26 | |
| | | | | Hertz Vehicle Financing LLC | | | | |
| | 1,000 | | | 4.93%, 02/25/2010 (I) | | | 985 | |
| | | | | Home Equity Asset Trust | | | | |
| | 400 | | | 5.10%, 07/25/2037 (H)(L) | | | 35 | |
| | | | | Hyundai Automotive Receivables Trust | | | | |
| | 168 | | | 4.10%, 08/15/2011 | | | 167 | |
| | 1,304 | | | 4.45%, 02/15/2012 (H) | | | 1,292 | |
| | | | | JP Morgan Chase Commercial Mortgage Security Corp. | | | | |
| | 1,183 | | | 3.47%, 02/15/2020 (H)(L) | | | 1,009 | |
| | 12,714 | | | 4.65%, 10/15/2037 (H)(N) | | | 175 | |
| | 35,230 | | | 4.82%, 08/12/2037 (H)(N) | | | 105 | |
| | 1,197 | | | 5.34%, 05/12/2045 | | | 1,201 | |
| | | | | LaSalle Commercial Mortgage Securities | | | | |
| | 17,218 | | | 6.20%, 09/20/2043 (H)(N) | | | 508 | |
| | | | | LB-UBS Commercial Mortgage Trust | | | | |
| | 224 | | | 3.63%, 10/15/2029 | | | 222 | |
| | 1,533 | | | 4.25%, 12/15/2036 (H)(N) | | | 35 | |
| | | | | Lehman Brothers Small Balance Commercial | | | | |
| | 1,060 | | | 6.77%, 09/27/2036 (H) | | | 1,027 | |
| | | | | Long Beach Asset Holdings Corp. | | | | |
| | 180 | | | 5.78%, 04/25/2046 (H) | | | 2 | |
| | | | | Marlin Leasing Receivables LLC | | | | |
| | 233 | | | 5.09%, 08/15/2012 (H) | | | 233 | |
| | 1,600 | | | 5.33%, 09/16/2013 (I) | | | 1,621 | |
| | 396 | | | 5.63%, 09/16/2013 (H) | | | 381 | |
| | | | | MBNA Credit Card Master Note Trust | | | | |
| | 550 | | | 6.80%, 07/15/2014 | | | 498 | |
| | | | | Merrill Lynch Mortgage Trust | | | | |
| | 16,347 | | | 3.81%, 08/12/2039 (H)(N) | | | 347 | |
| | 18,056 | | | 3.96%, 10/12/2041 (H)(N) | | | 397 | |
| | 26,245 | | | 4.67%, 09/12/2042 (H)(N) | | | 221 | |
| | | | | Morgan Stanley Capital I | | | | |
| | 122 | | | 3.96%, 06/15/2040 | | | 122 | |
| | | | | Morgan Stanley Dean Witter Capital I | | | | |
| | 110 | | | 5.38%, 01/15/2039 | | | 111 | |
| | | | | Nationstar Home Equity Loan Trust | | | | |
| | 22 | | | 9.97%, 03/25/2037 (H)(L) | | | 17 | |
| | | | | Ocwen Advance Receivables Backed Notes | | | | |
| | 1,500 | | | 5.34%, 11/24/2015 (H) | | | 1,320 | |
The accompanying notes are an integral part of these financial statements.
231
The Hartford Short Duration Fund
Schedule of Investments — (continued)
April 30, 2008 (Unaudited)
(000’s Omitted)
| | | | | | | | | | | | | |
Principal
| | | | | | | | Market
| |
| Amount | | | | | | | | Value (W) | |
| | | | | | | | | | | | | |
| ASSET & COMMERCIAL MORTGAGE BACKED SECURITIES — (continued) |
| | | | | | | | | | | | | |
| | | | | Finance — (continued) |
| | | | | Renaissance Home Equity Loan Trust | | | | |
| $ | 675 | | | 7.00%, 09/25/2037 (H) | | $ | 138 | |
| | 405 | | | 7.50%, 04/25/2037 (H) | | | 49 | |
| | 108 | | | 9.79%, 04/25/2037 (H) | | | 54 | |
| | | | | Structured Asset Investment Loan Trust | | | | |
| | 291 | | | 5.52%, 11/25/2033 (H)(L) | | | 148 | |
| | | | | Structured Asset Securities Corp. | | | | |
| | 850 | | | 5.39%, 01/25/2037 — 02/25/2037 (H)(L) | | | 114 | |
| | | | | Superior Wholesale Inventory Financing Trust | | | | |
| | 500 | | | 3.20%, 06/15/2010 (L) | | | 499 | |
| | | | | Swift Master Automotive Receivables Trust | | | | |
| | 1,000 | | | 4.17%, 10/15/2012 (L) | | | 898 | |
| | | | | USAA Automotive Owner Trust | | | | |
| | 1,560 | | | 4.16%, 04/16/2012 | | | 1,546 | |
| | 820 | | | 5.01%, 09/15/2010 | | | 826 | |
| | 860 | | | 5.07%, 06/15/2013 | | | 861 | |
| | 1,000 | | | 5.66%, 03/15/2013 (H) | | | 928 | |
| | | | | Wachovia Automotive Loan Owner Trust | | | | |
| | 1,700 | | | 5.42%, 04/21/2014 (H) | | | 1,545 | |
| | 1,000 | | | 5.54%, 12/20/2012 (H) | | | 911 | |
| | | | | Wachovia Bank Commercial Mortgage Trust | | | | |
| | 155 | | | 3.48%, 08/15/2041 | | | 154 | |
| | 5,390 | | | 3.65%, 02/15/2041 (H)(N) | | | 106 | |
| | | | | Washington Mutual Master Note Trust | | | | |
| | 1,500 | | | 3.10%, 10/15/2013 (H)(L) | | | 1,334 | |
| | | | | Washington Mutual, Inc. | | | | |
| | 17,631 | | | 7.00%, 11/23/2043 (H)(N) | | | 693 | |
| | | | | Wells Fargo Home Equity Trust | | | | |
| | 1,900 | | | 3.20%, 04/25/2034 (L) | | | 1,668 | |
| | | | | WFS Financial Owner Trust | | | | |
| | 1,091 | | | 4.76%, 05/17/2013 (H) | | | 1,024 | |
| | | | | World Financial Network Credit Card Master | | | | |
| | 1,000 | | | 5.17%, 05/15/2012 (L) | | | 1,001 | |
| | | | | World Omni Automotive Receivables Trust | | | | |
| | 72 | | | 3.62%, 07/12/2011 | | | 72 | |
| | | | | | | | | |
| | | | | Total asset & commercial
mortgage backed securities
(cost $71,725) | | $ | 65,273 | |
| | | | | | | | | | | | | |
| | | | | | | | | | | | | |
| CERTIFICATE OF DEPOSIT — 0.8% |
| | | | | Finance — 0.8% |
| | | | | Bank of New York Co., Inc. | | | | |
| $ | 500 | | | 5.05%, 03/03/2009 | | $ | 505 | |
| | | | | Comerica Bank | | | | |
| | 1,350 | | | 2.79%, 08/07/2009 (L) | | | 1,228 | |
| | | | | | | | | |
| | | | | Total certificate of deposit
(cost $1,837) | | $ | 1,733 | |
| | | | | | | | | | | | | |
| | | | | | | | | | | | | |
| CORPORATE BONDS: INVESTMENT GRADE — 42.0% |
| | | | | Basic Materials — 1.2% |
| | | | | Xstrata Finance Dubai Ltd. | | | | |
| $ | 2,500 | | | 3.42%, 11/13/2009 (I)(L) | | $ | 2,434 | |
| | | | | Capital Goods — 1.3% |
| | | | | Deere & Co. | | | | |
| | 534 | | | 7.85%, 05/15/2010 | | | 577 | |
| | | | | Honeywell International, Inc. | | | | |
| | 1,092 | | | 4.25%, 03/01/2013 | | | 1,085 | |
| | | | | United Technologies Corp. | | | | |
| | 987 | | | 6.10%, 05/15/2012 | | | 1,050 | |
| | | | | | | | | |
| | | | | | | | | | | | 2,712 | |
| | | | | | | | | | | | | |
| | | | | Consumer Cyclical — 1.8% |
| | | | | DaimlerChrysler NA Holdings Corp. | | | | |
| | 600 | | | 5.88%, 03/15/2011 | | | 614 | |
| | | | | Kroger Co. | | | | |
| | 750 | | | 7.25%, 06/01/2009 | | | 766 | |
| | 750 | | | 8.05%, 02/01/2010 | | | 792 | |
| | | | | SABMiller plc | | | | |
| | 510 | | | 3.00%, 07/01/2009 (I)(L) | | | 511 | |
| | | | | Safeway, Inc. | | | | |
| | 700 | | | 4.95%, 08/16/2010 | | | 710 | |
| | 500 | | | 7.50%, 09/15/2009 | | | 522 | |
| | | | | | | | | |
| | | | | | | | | | | | 3,915 | |
| | | | | | | | | | | | | |
| | | | | Consumer Staples — 1.7% |
| | | | | Clorox Co. | | | | |
| | 1,000 | | | 6.13%, 02/01/2011 | | | 1,026 | |
| | | | | Diageo Capital plc | | | | |
| | 1,460 | | | 7.25%, 11/01/2009 | | | 1,528 | |
| | | | | Miller Brewing Co. | | | | |
| | 1,000 | | | 4.25%, 08/15/2008 (I) | | | 1,003 | |
| | | | | | | | | |
| | | | | | | | | | | | 3,557 | |
| | | | | | | | | | | | | |
| | | | | Energy — 0.9% |
| | | | | Transocean, Inc. | | | | |
| | 2,000 | | | 3.21%, 09/05/2008 (L) | | | 1,996 | |
| | | | | Finance — 22.7% |
| | | | | American Express Credit Corp. | | | | |
| | 1,700 | | | 2.78%, 11/09/2009 (L) | | | 1,679 | |
| | | | | American General Finance Corp. | | | | |
| | 1,000 | | | 2.75%, 06/15/2008 | | | 998 | |
| | | | | Capital One Bank | | | | |
| | 415 | | | 4.25%, 12/01/2008 | | | 412 | |
| | | | | Capital One Financial Corp. | | | | |
| | 1,000 | | | 3.27%, 09/10/2009 (L) | | | 911 | |
| | | | | Capmark Financial Group | | | | |
| | 2,000 | | | 3.75%, 05/10/2010 (L) | | | 1,655 | |
| | | | | Caterpillar Financial Services Corp. | | | | |
| | 900 | | | 3.16%, 08/20/2010 (L) | | | 889 | |
| | 1,000 | | | 4.15%, 01/15/2010 | | | 1,007 | |
| | | | | CIT Group, Inc. | | | | |
| | 750 | | | 3.19%, 08/17/2009 (L) | | | 651 | |
| | | | | Citicorp | | | | |
| | 1,584 | | | 6.38%, 11/15/2008 | | | 1,601 | |
| | | | | Countrywide Financial Corp. | | | | |
| | 2,000 | | | 3.60%, 05/07/2012 (L) | | | 1,770 | |
| | 79 | | | 4.50%, 06/15/2010 | | | 72 | |
| | 162 | | | 5.80%, 06/07/2012 | | | 154 | |
| | | | | Countrywide Home Loans, Inc. | | | | |
| | 175 | | | 4.00%, 03/22/2011 | | | 160 | |
| | 362 | | | 4.13%, 09/15/2009 | | | 338 | |
| | 291 | | | 6.25%, 04/15/2009 | | | 279 | |
| | | | | Credit Suisse First Boston NY | | | | |
| | 220 | | | 6.50%, 05/01/2008 (I) | | | 220 | |
| | | | | Credit Suisse First Boston USA, Inc. | | | | |
| | 2,000 | | | 4.13%, 01/15/2010 | | | 2,003 | |
| | | | | ERAC USA Finance Co. | | | | |
| | 1,000 | | | 7.35%, 06/15/2008 (I) | | | 1,004 | |
The accompanying notes are an integral part of these financial statements.
232
| | | | | | | | | | | | | |
Principal
| | | | | | | | Market
| |
| Amount | | | | | | | | Value (W) | |
| | | | | | | | | | | | | |
| CORPORATE BONDS: INVESTMENT GRADE — (continued) |
| | | | | | | | | | | | | |
| | | | | Finance — (continued) |
| | | | | FleetBoston Financial Corp. | | | | |
| $ | 1,500 | | | 7.38%, 12/01/2009 | | $ | 1,570 | |
| | | | | General Electric Capital Corp. | | | | |
| | 1,880 | | | 4.00%, 02/17/2009 | | | 1,885 | |
| | | | | Goldman Sachs Group, Inc. | | | | |
| | 200 | | | 2.68%, 12/23/2009 (L) | | | 196 | |
| | 800 | | | 2.75%, 03/30/2009 (L) | | | 794 | |
| | 1,270 | | | 3.15%, 11/16/2009 (L) | | | 1,252 | |
| | | | | HSBC Bank USA | | | | |
| | 2,000 | | | 3.88%, 09/15/2009 | | | 1,992 | |
| | | | | J.P. Morgan Chase & Co. | | | | |
| | 1,145 | | | 6.00%, 02/15/2009 | | | 1,156 | |
| | | | | John Deere Capital Corp. | | | | |
| | 600 | | | 3.00%, 10/16/2009 (L) | | | 598 | |
| | | | | Key Bank NA | | | | |
| | 250 | | | 3.26%, 11/03/2009 (L) | | | 246 | |
| | | | | Lehman Brothers Holdings, Inc. | | | | |
| | 885 | | | 3.17%, 11/16/2009 (L) | | | 848 | |
| | | | | Merrill Lynch & Co., Inc. | | | | |
| | 2,000 | | | 2.70%, 03/23/2010 (L) | | | 1,898 | |
| | 720 | | | 3.14%, 12/04/2009 (L) | | | 687 | |
| | | | | Morgan Stanley | | | | |
| | 1,200 | | | 2.85%, 05/07/2010 (L) | | | 1,158 | |
| | 1,100 | | | 3.21%, 02/09/2009 (L) | | | 1,090 | |
| | 375 | | | 3.26%, 05/07/2010 (L) | | | 362 | |
| | | | | National City Bank of Ohio | | | | |
| | 1,000 | | | 2.93%, 01/21/2010 (L) | | | 910 | |
| | | | | National Westminster Bank | | | | |
| | 1,130 | | | 7.38%, 10/01/2009 | | | 1,176 | |
| | | | | North Street Referenced Linked Notes | | | | |
| | 1,000 | | | 3.95%, 07/30/2010 (H)(L) | | | 900 | |
| | 500 | | | 4.30%, 07/30/2010 (H)(L) | | | 363 | |
| | | | | Prudential Financial, Inc. | | | | |
| | 650 | | | 3.75%, 05/01/2008 | | | 650 | |
| | 1,000 | | | 5.10%, 12/14/2011 | | | 1,005 | |
| | | | | Prudential Funding LLC | | | | |
| | 1,000 | | | 6.60%, 05/15/2008 (I) | | | 1,001 | |
| | | | | Simon Property Group L.P. | | | | |
| | 1,463 | | | 3.75%, 01/30/2009 | | | 1,449 | |
| | | | | Sovereign Bancorp, Inc. | | | | |
| | 2,000 | | | 2.83%, 03/23/2010 (L) | | | 1,712 | |
| | | | | SunTrust Banks, Inc. | | | | |
| | 500 | | | 7.75%, 05/01/2010 | | | 524 | |
| | | | | UnitedHealth Group, Inc. | | | | |
| | 1,000 | | | 2.78%, 06/21/2010 (L) | | | 945 | |
| | 1,000 | | | 3.75%, 02/10/2009 | | | 991 | |
| | | | | US Bank NA | | | | |
| | 1,000 | | | 3.40%, 03/02/2009 | | | 991 | |
| | | | | Wachovia Corp. | | | | |
| | 2,000 | | | 5.63%, 12/15/2008 (L) | | | 2,010 | |
| | | | | Wellpoint, Inc. | | | | |
| | 500 | | | 4.25%, 12/15/2009 | | | 497 | |
| | 525 | | | 5.00%, 01/15/2011 | | | 521 | |
| | | | | Zion Bancorp | | | | |
| | 1,000 | | | 2.92%, 09/15/2008 (L) | | | 990 | |
| | | | | | | | | |
| | | | | | | | | | | | 48,170 | |
| | | | | | | | | | | | | |
| | | | | Health Care — 2.2% |
| | | | | Cardinal Health, Inc. | | | | |
| | 2,000 | | | 2.96%, 10/02/2009 (L) | | | 1,952 | |
| | | | | CVS Caremark Corp. | | | | |
| | 2,685 | | | 3.38%, 06/01/2010 (L) | | | 2,606 | |
| | | | | | | | | |
| | | | | | | | | | | | 4,558 | |
| | | | | | | | | | | | | |
| | | | | Services — 3.4% |
| | | | | Comcast Corp. | | | | |
| | 1,490 | | | 3.01%, 07/14/2009 (L) | | | 1,463 | |
| | | | | Time Warner, Inc. | | | | |
| | 2,520 | | | 3.30%, 11/13/2009 (L) | | | 2,432 | |
| | | | | Walt Disney Co. | | | | |
| | 1,120 | | | 2.78%, 07/16/2010 (L) | | | 1,108 | |
| | 1,200 | | | 3.09%, 09/10/2009 (L) | | | 1,198 | |
| | | | | Waste Management, Inc. | | | | |
| | 1,000 | | | 6.88%, 05/15/2009 | | | 1,026 | |
| | | | | | | | | |
| | | | | | | | | | | | 7,227 | |
| | | | | | | | | | | | | |
| | | | | Technology — 4.3% |
| | | | | AT&T, Inc. | | | | |
| | 684 | | | 4.13%, 09/15/2009 | | | 686 | |
| | 1,000 | | | 5.88%, 02/01/2012 | | | 1,037 | |
| | | | | Deutsche Telekom International Finance B.V. | | | | |
| | 1,000 | | | 2.78%, 03/23/2009 (L) | | | 988 | |
| | | | | Embarq Corp. | | | | |
| | 1,000 | | | 6.74%, 06/01/2013 | | | 998 | |
| | | | | Hewlett-Packard Co. | | | | |
| | 986 | | | 4.50%, 03/01/2013 | | | 994 | |
| | | | | Lockheed Martin Corp. | | | | |
| | 1,500 | | | 8.20%, 12/01/2009 | | | 1,598 | |
| | | | | Oracle Corp. | | | | |
| | 1,000 | | | 5.00%, 01/15/2011 | | | 1,024 | |
| | | | | Telecom Italia Capital | | | | |
| | 750 | | | 4.00%, 01/15/2010 | | | 737 | |
| | | | | Vodafone Group plc | | | | |
| | 1,000 | | | 7.75%, 02/15/2010 | | | 1,055 | |
| | | | | | | | | |
| | | | | | | | | | | | 9,117 | |
| | | | | | | | | | | | | |
| | | | | Transportation — 1.8% |
| | | | | Canadian National Railway Co. | | | | |
| | 1,379 | | | 4.25%, 08/01/2009 | | | 1,383 | |
| | | | | Norfolk Southern Corp. | | | | |
| | 1,500 | | | 6.20%, 04/15/2009 | | | 1,532 | |
| | 365 | | | 8.63%, 05/15/2010 | | | 396 | |
| | | | | Union Pacific Corp. | | | | |
| | 540 | | | 7.38%, 09/15/2009 | | | 559 | |
| | | | | | | | | |
| | | | | | | | | | | | 3,870 | |
| | | | | | | | | | | | | |
| | | | | Utilities — 0.7% |
| | | | | Ohio Power Co. | | | | |
| | 1,500 | | | 2.91%, 04/05/2010 (L) | | | 1,449 | |
| | | | | | | | | |
| | | | | Total corporate bonds: investment grade
(cost $90,879) | | $ | 89,005 | |
| | | | | | | | | | | | | |
| | | | | | | | | | | | | |
| U.S. GOVERNMENT AGENCIES — 10.9% |
| | | | | Federal Home Loan Mortgage Corporation — 6.0% |
| | | | | Notes: |
| $ | 5,000 | | | 6.00%, 2011 | | $ | 5,407 | |
| | | | | Remic — Pac’s: |
| | 7,205 | | | 6.00%, 2032 | | | 7,387 | |
| | | | | | | | | |
| | | | | | | | | | | | 12,794 | |
| | | | | | | | | | | | | |
| | | | | | | | | | | | | |
The accompanying notes are an integral part of these financial statements.
233
The Hartford Short Duration Fund
Schedule of Investments — (continued)
April 30, 2008 (Unaudited)
(000’s Omitted)
| | | | | | | | | | | | | |
Principal
| | | | | | | | Market
| |
| Amount | | | | | | | | Value (W) | |
| | | | | | | | | | | | | |
| U.S. GOVERNMENT AGENCIES — (continued) |
| | | | | Federal National Mortgage Association — 3.9% |
| | | | | Notes: |
| $ | 5,000 | | | 3.25%, 2013 | | $ | 4,919 | |
| | | | | Remic — Pac’s: |
| | 3,261 | | | 5.50%, 2014 | | | 3,308 | |
| | | | | | | | | |
| | | | | | | | | | | | 8,227 | |
| | | | | | | | | | | | | |
| | | | | Government National Mortgage Association — 1.0% |
| | | | | Remic — Pac’s: |
| | 1,946 | | | 6.50%, 2031 | | | 2,026 | |
| | | | | | | | | |
| | | | | Total U.S. government agencies
(cost $22,886) | | $ | 23,047 | |
| | | | | | | | | | | | | |
| | | | | | | | | | | | | |
| U.S. GOVERNMENT SECURITIES — 6.8% |
| | | | | Other Direct Federal Obligations — 2.5% |
| | | | | Federal Home Loan Bank: |
| $ | 5,000 | | | 5.38%, 2011 | | $ | 5,337 | |
| | | | | U.S. Treasury Securities — 4.3% |
| | | | | U.S. Treasury Notes: |
| | 3,100 | | | 2.00%, 2010 | | | 3,086 | |
| | 2,000 | | | 2.50%, 2013 | | | 1,952 | |
| | 4,075 | | | 3.13%, 2013 | | | 4,091 | |
| | | | | | | | | |
| | | | | | | | | | | | 9,129 | |
| | | | | | | | | | | | | |
| | | | | Total U.S. government securities
(cost $14,494) | | $ | 14,466 | |
| | | | | | | | | |
| | | | | Total long-term investments
(cost $201,821) | | $ | 193,524 | |
| | | | | | | | | | | | | |
| | | | | | | | | | | | | |
| SHORT-TERM INVESTMENTS — 10.0% |
| | | | | Basic Materials — 1.4% |
| | | | | Praxair, Inc. | | | | |
| $ | 3,000 | | | 2.11%, 05/12/2008 | | $ | 2,998 | |
| | | | | Consumer Staples — 1.6% |
| | | | | Kraft Foods, Inc. | | | | |
| | 3,300 | | | 2.84%, 05/14/2008 | | | 3,296 | |
| | | | | Finance — 7.0% |
| | | | | BNP Paribas Finance | | | | |
| | 3,063 | | | 2.44%, 05/01/2008 | | | 3,063 | |
| | | | | Deutsche Bank | | | | |
| | 3,000 | | | 2.30%, 05/01/2008 | | | 3,000 | |
| | | | | General Electric Capital Corp. | | | | |
| | 1,400 | | | 2.30%, 05/12/2008 | | | 1,399 | |
| | | | | Rabobank USA | | | | |
| | 3,000 | | | 2.31%, 05/01/2008 | | | 3,000 | |
| | | | | Societe Generale NA | | | | |
| | 3,000 | | | 2.45%, 05/01/2008 | | | 3,000 | |
| | | | | Svenska Handelsbanken AB | | | | |
| | 1,300 | | | 2.30%, 05/05/2008 | | | 1,299 | |
| | | | | | | | | |
| | | | | | | | | | | | 14,761 | |
| | | | | | | | | | | | | |
| | | | | Total short-term investments
(cost $21,055) | | $ | 21,055 | |
| | | | | | | | | |
| | | | | Total investments
(cost $222,876) (C) | | | 101.3 | % | | $ | 214,579 | |
| | | | | Other assets and liabilities | | | (1.3 | )% | | | (2,669 | ) |
| | | | | | | | | | | | | |
| | | | | Total net assets | | | 100.0 | % | | $ | 211,910 | |
| | | | | | | | | | | | | |
| |
| Note: | Percentage of investments as shown is the ratio of the total market value to total net assets. Market value of investments in foreign securities represents 4.73% of total net assets at April 30, 2008. |
| | |
| | Foreign securities that are principally traded on certain foreign markets are adjusted daily pursuant to a third party pricing service methodology approved by the Board of Directors in order to reflect an adjustment for factors occurring after the close of the foreign market but before the close of the New York Stock Exchange. |
| |
| (C) | | At April 30, 2008, the cost of securities for federal income tax purposes was $222,883 and the aggregate gross unrealized appreciation and depreciation based on that cost were: |
| | | | | |
| Unrealized Appreciation | | $ | 1,511 | |
| Unrealized Depreciation | | | (9,815 | ) |
| | | | | |
| Net Unrealized Depreciation | | $ | (8,304 | ) |
| | | | | |
| | |
| (I) | | Securities issued within terms of a private placement memorandum, exempt from registration under Section 144A of the Securities Act of 1933, as amended, and may be sold only to qualified institutional buyers. Pursuant to guidelines adopted by the Board of Directors, these issues are determined to be liquid. The aggregate value of these securities at April 30, 2008, was $11,103, which represents 5.24% of total net assets. |
| |
| (L) | | Variable rate securities; the rate reported is the coupon rate in effect at April 30, 2008. |
| |
| (M) | | The interest rate disclosed for these securities represents the effective yield on the date of acquisition. |
| |
| (N) | | The interest rates disclosed for interest only strips represent effective yields based upon estimated future cash flows at April 30, 2008. |
| |
| (H) | | The following securities are considered illiquid. Illiquid securities are often purchased in private placement transactions, are not registered under the Securities Act of 1933 and may have contractual restrictions on resale. A security may also be considered illiquid if the security lacks a readily available market or if its valuation has not changed for a certain period of time. |
| | | | | | | | | | | |
Period
| | | | | | | | |
Acquired | | Shares/Par | | | Security | | Cost Basis | |
| 06/2005 | | | 1,500 | | | Banc of America Securities Automotive Trust, 4.49%, 02/18/2013 | | $ | 1,500 | |
| 12/2004 | | | 422 | | | Bayview Commercial Asset Trust, 3.89%, 01/25/2035 - 144A | | | 422 | |
| 05/2007 | | | 6,250 | | | Bayview Commercial Asset Trust, 7.00%, 07/25/2037 - 144A | | | 886 | |
| 12/2006 | | | 12,192 | | | Bayview Commercial Asset Trust, 7.18%, 01/25/2037 - 144A | | | 1,330 | |
| 08/2007 | | | 10,545 | | | Bayview Commercial Asset Trust, 7.50%, 09/25/2037 - 144A | | | 1,452 | |
| 11/2006 | | | 1,185 | | | Bayview Financial Acquisition Trust, 4.91%, 02/25/2033 - 144A | | | 1,153 | |
| 11/2006 | | | 2,000 | | | Bayview Financial Acquisition Trust, 5.64%, 11/28/2036 | | | 2,000 | |
| 08/2006 | | | 707 | | | Bear Stearns Asset Backed Securities, Inc., 5.16%, 09/25/2033 | | | 695 | |
| 12/2004 | | | 21,142 | | | Bear Stearns Commercial Mortgage Securities, Inc., 4.12%, 11/11/2041 | | | 479 | |
03/2005 –
08/2007 | | | 53,002 | | | Bear Stearns Commercial Mortgage Securities, Inc., 4.65%, 02/11/2041 | | | 514 | |
The accompanying notes are an integral part of these financial statements.
234
| | | | | | | | | | | |
Period
| | | | | | | | |
Acquired | | Shares/Par | | | Security | | Cost Basis | |
| 12/2005 | | | 106,822 | | | Bear Stearns Commercial Mortgage Securities, Inc., 6.25%, 12/11/2040 - 144A | | $ | 430 | |
| 02/2006 | | | 800 | | | Capital Automotive Receivables Asset Trust, 5.55%, 01/18/2011 | | | 800 | |
| 08/2006 | | | 200 | | | Capital Automotive Receivables Asset Trust, 5.77%, 05/20/2010 - 144A | | | 200 | |
| 08/2006 | | | 225 | | | Capital Automotive Receivables Asset Trust, 6.15%, 04/20/2011 - 144A | | | 225 | |
| 09/2007 | | | 1,000 | | | Capital One Prime Automotive Receivables Trust, 5.68%, 06/16/2014 | | | 1,000 | |
| 09/2007 | | | 1,000 | | | Carmax Automotive Owner Trust, 6.12%, 07/15/2013 | | | 1,000 | |
04/2006 –
11/2007 | | | 42,419 | | | CBA Commercial Small Balance Commercial Mortgage, 7.00%, 07/25/2035 — 06/25/2038 - 144A | | | 1,860 | |
11/2006 –
08/2007 | | | 10,921 | | | CBA Commercial Small Balance Commercial Mortgage, 9.75%, 01/25/2039 - 144A | | | 1,036 | |
| 12/2006 | | | 2,000 | | | Citibank Credit Card Issuance Trust, 2.96%, 01/09/2012 | | | 2,000 | |
| 09/2005 | | | 750 | | | CNH Equipment Trust, 4.93%, 12/17/2012 | | | 748 | |
03/2004 –
08/2006 | | | 2,899 | | | Commercial Mortgage Pass-Through Certificates, 3.59%, 03/10/2039 - 144A | | | 57 | |
08/2004 –
08/2006 | | | 12,743 | | | CS First Boston Mortgage Securities Corp., 4.17%, 07/15/2036 - 144A | | | 185 | |
| 07/2004 | | | 34 | | | Equity One ABS, Inc., 5.39%, 07/25/2034 | | | 34 | |
| 08/2006 | | | 500 | | | Ford Credit Automotive Owner Trust, 5.68%, 06/15/2012 | | | 500 | |
| 04/2004 | | | 7,920 | | | GE Capital Commercial Mortgage Corp., 3.76%, 03/10/2040 - 144A | | | 111 | |
| 08/2005 | | | 199 | | | Goldman Sachs Automotive Loan Trust, 4.98%, 11/15/2013 | | | 199 | |
| 07/2004 | | | 18,649 | | | Goldman Sachs Mortgage Securities Corp. II, 4.38%, 08/10/2038 - 144A | | | 143 | |
| 03/2006 | | | 34 | | | Hasco NIM Trust, 6.25%, 12/26/2035 - 144A | | | 34 | |
| 03/2007 | | | 400 | | | Home Equity Asset Trust, 5.10%, 07/25/2037 | | | 392 | |
| 06/2005 | | | 1,304 | | | Hyundai Automotive Receivables Trust, 4.45%, 02/15/2012 | | | 1,304 | |
| 03/2006 | | | 1,183 | | | JP Morgan Chase Commercial Mortgage Security Corp., 3.47%, 02/15/2020 - 144A | | | 1,182 | |
| 03/2005 | | | 12,714 | | | JP Morgan Chase Commercial Mortgage Security Corp., 4.65%, 10/15/2037 - 144A | | | 183 | |
| 03/2005 | | | 35,230 | | | JP Morgan Chase Commercial Mortgage Security Corp., 4.82%, 08/12/2037 | | | 91 | |
12/2006 –
08/2007 | | | 17,218 | | | LaSalle Commercial Mortgage Securities, 6.20%, 09/20/2043 - 144A | | | 666 | |
| 03/2003 | | | 1,533 | | | LB-UBS Commercial Mortgage Trust, 4.25%, 12/15/2036 - 144A | | | 23 | |
09/2006 –
07/2007 | | | 1,060 | | | Lehman Brothers Small Balance Commercial, 6.77%, 09/27/2036 - 144A | | | 1,059 | |
| 03/2006 | | | 180 | | | Long Beach Asset Holdings Corp., 5.78%, 04/25/2046 - 144A | | | 180 | |
08/2005 –
12/2006 | | | 233 | | | Marlin Leasing Receivables LLC, 5.09%, 08/15/2012 - 144A | | | 233 | |
| 09/2006 | | | 396 | | | Marlin Leasing Receivables LLC, 5.63%, 09/16/2013 - 144A | | | 396 | |
| 09/2004 | | | 16,347 | | | Merrill Lynch Mortgage Trust, 3.81%, 08/12/2039 - 144A | | | 373 | |
11/2004 –
08/2006 | | | 18,056 | | | Merrill Lynch Mortgage Trust, 3.96%, 10/12/2041 - 144A | | | 428 | |
| 03/2005 | | | 26,245 | | | Merrill Lynch Mortgage Trust, 4.67%, 09/12/2042 | | | 210 | |
| 04/2007 | | | 22 | | | Nationstar Home Equity Loan Trust, 9.97%, 03/25/2037 - 144A | | | 22 | |
10/2006–
11/2006 | | | 1,000 | | | North Street Referenced Linked Notes, 3.95%, 07/30/2010 - 144A | | | 962 | |
| 11/2006 | | | 500 | | | North Street Referenced Linked Notes, 4.30%, 07/30/2010 - 144A | | | 452 | |
| 11/2006 | | | 1,500 | | | Ocwen Advance Receivables Backed Notes, 5.34%, 11/24/2015 - 144A | | | 1,500 | |
| 08/2007 | | | 675 | | | Renaissance Home Equity Loan Trust, 7.00%, 09/25/2037 | | | 487 | |
| 03/2007 | | | 405 | | | Renaissance Home Equity Loan Trust, 7.50%, 04/25/2037 | | | 357 | |
| 03/2007 | | | 108 | | | Renaissance Home Equity Loan Trust, 9.79%, 04/25/2037 - 144A | | | 108 | |
| 06/2005 | | | 291 | | | Structured Asset Investment Loan Trust, 5.52%, 11/25/2033 | | | 296 | |
| 03/2007 | | | 850 | | | Structured Asset Securities Corp., 5.39%, 01/25/2037 — 02/25/2037 - 144A | | | 839 | |
| 08/2006 | | | 1,000 | | | USAA Automotive Owner Trust, 5.66%, 03/15/2013 | | | 1,000 | |
| 09/2006 | | | 1,700 | | | Wachovia Automotive Loan Owner Trust, 5.42%, 04/21/2014 - 144A | | | 1,700 | |
| 10/2006 | | | 1,000 | | | Wachovia Automotive Loan Owner Trust, 5.54%, 12/20/2012 - 144A | | | 1,000 | |
| 02/2004 | | | 5,390 | | | Wachovia Bank Commercial Mortgage Trust, 3.65%, 02/15/2041 - 144A | | | 100 | |
| 11/2006 | | | 1,500 | | | Washington Mutual Master Note Trust, 3.10%, 10/15/2013 - 144A | | | 1,500 | |
| 11/2006 | | | 17,631 | | | Washington Mutual, Inc., 7.00%, 11/23/2043 - 144A | | | 843 | |
07/2005–
09/2007 | | | 1,091 | | | WFS Financial Owner Trust, 4.76%, 05/17/2013 | | | 1,088 | |
| | |
| | The aggregate value of these securities at April 30, 2008 was $35,713 which represents 16.85% of total net assets. |
| |
| (W) | | See Note 2b of accompanying Notes to Financial Statements regarding valuation of securities. |
The accompanying notes are an integral part of these financial statements.
235
The Hartford Small Company Fund
Schedule of Investments
April 30, 2008 (Unaudited)
(000’s Omitted)
| | | | | | | | | | | | | |
| | | | | | | | | Market
| |
| Shares | | | | | | | | Value (W) | |
| COMMON STOCK — 93.4% |
| | | | | Basic Materials — 10.9% |
| | 35 | | | Alpha Natural Resources, Inc. (D)(G) | | $ | 1,683 | |
| | 84 | | | Arch Coal, Inc. | | | 4,799 | |
| | 85 | | | Ball Corp. | | | 4,593 | |
| | 27 | | | Cabot Microelectronics Corp. (D)(G) | | | 916 | |
| | 18 | | | Century Aluminum Co. (D)(G) | | | 1,251 | |
| | 23 | | | Ceradyne, Inc. (D) | | | 900 | |
| | 14 | | | CF Industries Holdings, Inc. | | | 1,899 | |
| | 91 | | | Church & Dwight Co., Inc. (G) | | | 5,191 | |
| | 21 | | | Dynamic Materials Corp. | | | 981 | |
| | 87 | | | FMC Corp. (G) | | | 5,462 | |
| | 52 | | | Foundation Coal Holdings, Inc. (G) | | | 3,104 | |
| | 73 | | | Greif, Inc. | | | 4,764 | |
| | 47 | | | Hercules, Inc. | | | 889 | |
| | 607 | | | Kingboard Chemical Holdings Ltd. | | | 2,865 | |
| | 63 | | | Lupatech S.A. (D) | | | 2,322 | |
| | 16 | | | Matthews International Corp. Class A (G) | | | 782 | |
| | 144 | | | OfficeMax, Inc. | | | 2,633 | |
| | 58 | | | Owens-Illinois, Inc. (D) | | | 3,195 | |
| | 292 | | | Rexam plc | | | 2,581 | |
| | 139 | | | Sealed Air Corp. | | | 3,514 | |
| | 65 | | | Snap-On, Inc. | | | 3,828 | |
| | 48 | | | Sturm Ruger & Co., Inc. (D) | | | 359 | |
| | 82 | | | Tempur-Pedic International, Inc. (G) | | | 908 | |
| | 138 | | | Terra Industries, Inc. (D)(G) | | | 5,247 | |
| | 115 | | | Titan International, Inc. | | | 4,111 | |
| | 29 | | | Tupperware Brands Corp. (G) | | | 1,156 | |
| | 42 | | | Valmont Industries, Inc. (G) | | | 4,094 | |
| | | | | | | | | |
| | | | | | | | | | | | 74,027 | |
| | | | | | | | | | | | | |
| | | | | Capital Goods — 4.8% |
| | 39 | | | Bally Technologies, Inc. (D)(G) | | | 1,321 | |
| | 16 | | | Blue Nile, Inc. (D)(G) | | | 787 | |
| | 10 | | | Bucyrus International, Inc. | | | 1,297 | |
| | 31 | | | Columbus McKinnon Corp. (D) | | | 868 | |
| | 44 | | | Daktronics, Inc. (G) | | | 649 | |
| | 58 | | | Dril-Quip, Inc. (D)(G) | | | 3,341 | |
| | 50 | | | Flotek Industries, Inc. (D)(G) | | | 930 | |
| | 26 | | | Flowserve Corp. (G) | | | 3,268 | |
| | 16 | | | Heico Corp. | | | 826 | |
| | 47 | | | Hexcel Corp. (D)(G) | | | 1,050 | |
| | 17 | | | II-VI, Inc. (D)(G) | | | 635 | |
| | 17 | | | Lufkin Industries, Inc. (G) | | | 1,261 | |
| | 174 | | | Marvel Entertainment, Inc. (D)(G) | | | 4,994 | |
| | 16 | | | NATCO Group, Inc. (D) | | | 818 | |
| | 13 | | | Nordson Corp. | | | 774 | |
| | 34 | | | Orbital Sciences Corp. (D) | | | 912 | |
| | 96 | | | Pall Corp. (G) | | | 3,321 | |
| | 18 | | | T-3 Energy Services, Inc. (D)(G) | | | 960 | |
| | 49 | | | Tessera Technologies, Inc. (D)(G) | | | 988 | |
| | 29 | | | TransDigm Group, Inc. (D)(G) | | | 1,083 | |
| | 31 | | | WMS Industries, Inc. (D)(G) | | | 1,131 | |
| | 38 | | | Woodward Governor Co. (G) | | | 1,343 | |
| | | | | | | | | |
| | | | | | | | | | | | 32,557 | |
| | | | | | | | | | | | | |
| | | | | Consumer Cyclical — 10.0% |
| | 48 | | | 1-800-Flowers.com, Inc. (D) | | | 422 | |
| | 97 | | | Advance Automotive Parts, Inc. (G) | | | 3,371 | |
| | 55 | | | Aeropostale, Inc. (D)(G) | | | 1,734 | |
| | 145 | | | Big Lots, Inc. (D)(G) | | | 3,924 | |
| | 139 | | | BJ’s Wholesale Club, Inc. (D)(G) | | | 5,313 | |
| | 20 | | | The Buckle, Inc. (G) | | | 963 | |
| | 30 | | | Cash America International, Inc. (G) | | | 1,220 | |
| | 13 | | | Cental Euro Distribution Corp. (D)(G) | | | 811 | |
| | 23 | | | Chemed Corp. (G) | | | 797 | |
| | 13 | | | Chipotle Mexican Grill, Inc. (D)(G) | | | 1,100 | |
| | 81 | | | Christopher & Banks Corp. (G) | | | 964 | |
| | 129 | | | Darden Restaurants, Inc. (G) | | | 4,582 | |
| | 15 | | | Deckers Outdoor Corp. (D)(G) | | | 2,085 | |
| | 131 | | | Dick’s Sporting Goods, Inc. (D)(G) | | | 3,749 | |
| | 53 | | | Dufry Group | | | 5,723 | |
| | 23 | | | Great Atlantic & Pacific Tea Co., Inc. (D)(G) | | | 644 | |
| | 49 | | | Herman Miller, Inc. (G) | | | 1,135 | |
| | 36 | | | Integrated Electrical Services, Inc. (D)(G) | | | 596 | |
| | 28 | | | J. Crew Group, Inc. (D)(G) | | | 1,326 | |
| | 33 | | | Lear Corp. (D)(G) | | | 948 | |
| | 195 | | | LKQ Corp. (D)(G) | | | 4,260 | |
| | 44 | | | Men’s Wearhouse, Inc. (G) | | | 1,184 | |
| | 19 | | | Nuco2, Inc. (D)(G) | | | 512 | |
| | 31 | | | Owens & Minor, Inc. (G) | | | 1,414 | |
| | 116 | | | Patterson Cos., Inc. (D)(G) | | | 3,963 | |
| | 39 | | | Perini Corp. (D)(G) | | | 1,417 | |
| | 221 | | | Pier 1 Imports, Inc. (D)(G) | | | 1,722 | |
| | 44 | | | PSS World Medical, Inc. (D)(G) | | | 733 | |
| | 35 | | | Sotheby’s Holdings (G) | | | 967 | |
| | 23 | | | UbiSoft Entertainment S.A. (D) | | | 2,346 | |
| | 21 | | | United Stationers, Inc. (D)(G) | | | 926 | |
| | 67 | | | VistaPrint Ltd. (D)(G) | | | 2,283 | |
| | 22 | | | Walter Industries (G) | | | 1,505 | |
| | 36 | | | Warnaco Group, Inc. (D)(G) | | | 1,679 | |
| | 96 | | | Zumiez, Inc. (D)(G) | | | 2,019 | |
| | | | | | | | | |
| | | | | | | | | | | | 68,337 | |
| | | | | | | | | | | | | |
| | | | | Consumer Staples — 0.9% |
| | 29 | | | Cal-Maine Foods, Inc. (G) | | | 860 | |
| | 21 | | | Chattem, Inc. (D)(G) | | | 1,479 | |
| | 38 | | | Flowers Foods, Inc. (G) | | | 988 | |
| | 21 | | | Lancaster Colony Corp. (G) | | | 818 | |
| | 12 | | | Ralcorp Holdings, Inc. (D) | | | 723 | |
| | 63 | | | Vector Group Ltd. (G) | | | 1,089 | |
| | | | | | | | | |
| | | | | | | | | | | | 5,957 | |
| | | | | | | | | | | | | |
| | | | | Energy — 6.4% |
| | 19 | | | Arena Resources, Inc. (D)(G) | | | 858 | |
| | 23 | | | Atwood Oceanics, Inc. (D)(G) | | | 2,341 | |
| | 17 | | | Bill Barrett Corp. (D)(G) | | | 875 | |
| | 99 | | | Cabot Oil & Gas Corp. | | | 5,628 | |
| | 104 | | | Cal Dive International, Inc. (D) | | | 1,271 | |
| | 28 | | | Complete Production Services, Inc. (D) | | | 770 | |
| | 28 | | | Comstock Resources, Inc. (D)(G) | | | 1,270 | |
| | 33 | | | Concho Resources, Inc. (D) | | | 899 | |
| | 17 | | | Contango Oil & Gas Co. (D)(G) | | | 1,285 | |
| | 13 | | | Dawson Geophysical Co. (D)(G) | | | 976 | |
| | 31 | | | Delta Petroleum Corp. (D)(G) | | | 753 | |
| | 121 | | | Denbury Resources, Inc. (D) | | | 3,699 | |
| | 67 | | | Encore Acquisition Co. (D)(G) | | | 3,070 | |
| | 86 | | | Forest Oil Corp. (D) | | | 5,056 | |
| | 29 | | | Goodrich Petroleum Corp. (D)(G) | | | 986 | |
| | 168 | | | Grey Wolf, Inc. (D)(G) | | | 1,052 | |
| | 135 | | | Hercules Offshore, Inc. (D)(G) | | | 3,575 | |
| | 39 | | | Mariner Energy, Inc. (D)(G) | | | 1,071 | |
| | 15 | | | Penn Virginia Corp. (G) | | | 797 | |
The accompanying notes are an integral part of these financial statements.
236
| | | | | | | | | | | | | |
| | | | | | | | | Market
| |
| Shares | | | | | | | | Value (W) | |
| | | | | | | | | | | | | |
| COMMON STOCK — (continued) |
| | | | | | | | | | | | | |
| | | | | Energy — (continued) |
| | 75 | | | Petrohawk Energy Corp. (D)(G) | | $ | 1,779 | |
| | 59 | | | PetroQuest Energy, Inc. (D)(G) | | | 1,218 | |
| | 31 | | | Sevan Marine ASA (D) | | | 433 | |
| | 207 | | | Warren Resources, Inc. (D)(G) | | | 2,540 | |
| | 21 | | | W-H Energy Services (D)(G) | | | 1,646 | |
| | | | | | | | | |
| | | | | | | | | | | | 43,848 | |
| | | | | | | | | | | | | |
| | | | | Finance — 10.0% |
| | 195 | | | Aercap Holdings N.V. (D) | | | 3,366 | |
| | 8 | | | Alexandria Real Estate Equities, Inc. (G) | | | 798 | |
| | 124 | | | Allied World Assurance Holdings Ltd. | | | 5,094 | |
| | 96 | | | Boston Private Financial Holdings, Inc. (G) | | | 890 | |
| | 86 | | | Centene Corp. (D) | | | 1,572 | |
| | 209 | | | Covanta Holding Corp. (D)(G) | | | 5,569 | |
| | 21 | | �� | Digital Realty Trust, Inc. (G) | | | 798 | |
| | 58 | | | eHealth, Inc. (D)(G) | | | 1,557 | |
| | 13 | | | Equity Lifestyle Properties, Inc. | | | 632 | |
| | 24 | | | FCStone Group, Inc. (D) | | | 992 | |
| | 64 | | | GFI Group, Inc. (G) | | | 753 | |
| | 27 | | | Greenhill & Co., Inc. (G) | | | 1,753 | |
| | 55 | | | Grubb & Ellis Co. | | | 336 | |
| | 39 | | | Heartland Payment Systems, Inc. (G) | | | 864 | |
| | 13 | | | Home Properties of New York, Inc. (G) | | | 698 | |
| | 164 | | | Huntington Bancshares, Inc. (G) | | | 1,543 | |
| | 76 | | | Interactive Brokers Group (D)(G) | | | 2,399 | |
| | 76 | | | International Bancshares Corp. | | | 1,910 | |
| | 78 | | | Knight Capital Group, Inc. (D)(G) | | | 1,458 | |
| | 413 | | | Liberty Acquisition Holdings Corp. (D)(G) | | | 4,213 | |
| | 62 | | | MB Financial, Inc. (G) | | | 1,779 | |
| | 27 | | | Mercadolibre, Inc. (D) | | | 1,371 | |
| | 177 | | | MF Global Ltd. (D)(G) | | | 2,325 | |
| | 24 | | | Morningstar, Inc. (D)(G) | | | 1,395 | |
| | 37 | | | Nationwide Health Properties, Inc. (G) | | | 1,336 | |
| | 189 | | | Net 1 UEPS Technologies, Inc. (D)(G) | | | 4,432 | |
| | 61 | | | optionsXpress Holdings, Inc. (G) | | | 1,302 | |
| | 109 | | | ProAssurance Corp. (D)(G) | | | 5,748 | |
| | 65 | | | Signature Bank (D) | | | 1,711 | |
| | 47 | | | Solera Holdings, Inc. (D) | | | 1,220 | |
| | 142 | | | Sovereign Bancorp, Inc. (G) | | | 1,058 | |
| | 136 | | | Sunstone Hotel Investors, Inc. (G) | | | 2,538 | |
| | 94 | | | UCBH Holdings, Inc. (G) | | | 684 | |
| | 70 | | | Waddell and Reed Financial, Inc. | | | 2,379 | |
| | 28 | | | Washington Real Estate Investment Trust (G) | | | 998 | |
| | 22 | | | World Acceptance Corp. (D) | | | 859 | |
| | | | | | | | | |
| | | | | | | | | | | | 68,330 | |
| | | | | | | | | | | | | |
| | | | | Health Care — 15.6% |
| | 82 | | | Accuray, Inc. (D)(G) | | | 646 | |
| | 38 | | | Acorda Therapeutics, Inc. (D) | | | 800 | |
| | 43 | | | Albany Molecular Research, Inc. (D) | | | 496 | |
| | 13 | | | Alexion Pharmaceuticals, Inc. (D)(G) | | | 922 | |
| | 199 | | | Alkermes, Inc. (D)(G) | | | 2,475 | |
| | 80 | | | Alliance Imaging, Inc. (D) | | | 654 | |
| | 32 | | | Alnylam Pharmaceuticals, Inc. (D)(G) | | | 790 | |
| | 17 | | | Amedisys, Inc. (D)(G) | | | 891 | |
| | 152 | | | American Oriental Bioengineering, Inc. (D)(G) | | | 1,459 | |
| | 82 | | | Amylin Pharmaceuticals, Inc. (D)(G) | | | 2,249 | |
| | 21 | | | Angiodynamics, Inc. (D) | | | 314 | |
| | 137 | | | Applera Corp. — Celera Group (D)(G) | | | 1,831 | |
| | 69 | | | Apria Healthcare Group, Inc. (D) | | | 1,219 | |
| | 158 | | | Arena Pharmaceuticals, Inc. (D)(G) | | | 881 | |
| | 36 | | | ArthroCare Corp. (D)(G) | | | 1,621 | |
| | 39 | | | Auxilium Pharmaceuticals, Inc. (D)(G) | | | 1,205 | |
| | 58 | | | Barr Pharmaceuticals, Inc. (D) | | | 2,890 | |
| | 55 | | | Biomarin Pharmaceutical, Inc. (D)(G) | | | 2,005 | |
| | 31 | | | Cephalon, Inc. (D) | | | 1,939 | |
| | 91 | | | Charles River Laboratories International, Inc. (D)(G) | | | 5,305 | |
| | 56 | | | Cubist Pharmaceuticals, Inc. (D)(G) | | | 1,084 | |
| | 51 | | | Dr. Reddy’s Laboratories Ltd. ADR (G) | | | 785 | |
| | 88 | | | Enzon, Inc. (D)(G) | | | 766 | |
| | 271 | | | HealthSouth Corp. (D)(G) | | | 5,334 | |
| | 27 | | | Healthways, Inc. (D)(G) | | | 1,002 | |
| | 226 | | | Human Genome Sciences, Inc. (D) | | | 1,479 | |
| | 19 | | | Illumina, Inc. (D)(G) | | | 1,511 | |
| | 42 | | | ImClone Systems, Inc. (D)(G) | | | 1,945 | |
| | 50 | | | Immucor, Inc. (D)(G) | | | 1,355 | |
| | 57 | | | Incyte Corp. (D) | | | 623 | |
| | 29 | | | Integra LifeSciences Holdings Corp. (D)(G) | | | 1,217 | |
| | 52 | | | Isis Pharmaceuticals, Inc. (D)(G) | | | 616 | |
| | 24 | | | Kendle International, Inc. (D)(G) | | | 1,042 | |
| | 42 | | | KV Pharmaceutical Co. (D)(G) | | | 1,025 | |
| | 25 | | | Lifecell Corp. (D)(G) | | | 1,256 | |
| | 18 | | | Longs Drug Stores Corp. (G) | | | 737 | |
| | 29 | | | Magellan Health Services, Inc. (D) | | | 1,138 | |
| | 160 | | | Medicines Co. (D)(G) | | | 3,172 | |
| | 60 | | | Medicis Pharmaceutical Corp. Class A (G) | | | 1,237 | |
| | 38 | | | Meridian Bioscience, Inc. (G) | | | 1,021 | |
| | 277 | | | Millennium Pharmaceuticals, Inc. (D) | | | 6,895 | |
| | 64 | | | Mindray Medical International Ltd. (G) | | | 2,178 | |
| | 16 | | | Myriad Genetics, Inc. (D)(G) | | | 672 | |
| | 102 | | | Obagi Medical Products, Inc. (D) | | | 818 | |
| | 53 | | | Onyx Pharmaceuticals, Inc. (D)(G) | | | 1,860 | |
| | 30 | | | OSI Pharmaceuticals, Inc. (D)(G) | | | 1,050 | |
| | 58 | | | Par Pharmaceutical Cos., Inc. (D)(G) | | | 992 | |
| | 42 | | | PAREXEL International Corp. (D) | | | 1,057 | |
| | 155 | | | Perrigo Co. (G) | | | 6,377 | |
| | 201 | | | Pharmaceutical Product Development, Inc. | | | 8,337 | |
| | 34 | | | PharmaNet Development Group, Inc. (D) | | | 806 | |
| | 20 | | | Psychiatric Solutions, Inc. (D)(G) | | | 703 | |
| | 59 | | | Quidel Corp. (D)(G) | | | 951 | |
| | 141 | | | Salix Pharmaceuticals Ltd. (D)(G) | | | 988 | |
| | 43 | | | Sciele Pharma, Inc. (D)(G) | | | 823 | |
| | 248 | | | SSL International plc | | | 2,254 | |
| | 48 | | | STERIS Corp. (G) | | | 1,317 | |
| | 18 | | | United Therapeutics Corp. (D)(G) | | | 1,544 | |
| | 34 | | | Usana Health Sciences, Inc. (D)(G) | | | 668 | |
| | 77 | | | Valeant Pharmaceuticals International (D)(G) | | | 1,019 | |
| | 138 | | | ViroPharma, Inc. (D)(G) | | | 1,266 | |
| | 161 | | | Volcano Corp. (D) | | | 1,904 | |
| | 123 | | | Warner Chilcott Ltd. (D) | | | 2,110 | |
| | 19 | | | Xenoport, Inc. (D) | | | 808 | |
| | | | | | | | | |
| | | | | | | | | | | | 106,334 | |
| | | | | | | | | | | | | |
| | | | | Services — 9.3% |
| | 30 | | | Administaff, Inc. (G) | | | 782 | |
| | 18 | | | Advisory Board Co. (D) | | | 821 | |
| | 6 | | | Aecom Technology Corp. (D) | | | 173 | |
| | 21 | | | American Public Education, Inc. (D) | | | 675 | |
| | 49 | | | Atheros Communications, Inc. (D)(G) | | | 1,315 | |
| | 19 | | | Bankrate, Inc. (D)(G) | | | 970 | |
The accompanying notes are an integral part of these financial statements.
237
The Hartford Small Company Fund
Schedule of Investments — (continued)
April 30, 2008 (Unaudited)
(000’s Omitted)
| | | | | | | | | | | | | |
| | | | | | | | | Market
| |
| Shares | | | | | | | | Value (W) | |
| | | | | | | | | | | | | |
| COMMON STOCK — (continued) |
| | | | | | | | | | | | | |
| | | | | Services — (continued) |
| | 18 | | | Capella Education Co. (D) | | $ | 1,137 | |
| | 29 | | | CDI Corp. | | | 791 | |
| | 13 | | | Clean Harbors, Inc. (D) | | | 857 | |
| | 18 | | | Corvel (D) | | | 598 | |
| | 37 | | | DeVry, Inc. (G) | | | 2,088 | |
| | 41 | | | Digital River, Inc. (D)(G) | | | 1,331 | |
| | 66 | | | Epicor Software Corp. (D)(G) | | | 528 | |
| | 110 | | | Equifax, Inc. (D)(G) | | | 4,218 | |
| | 63 | | | Factset Research Systems, Inc. (G) | | | 3,773 | |
| | 135 | | | Focus Media Holding Ltd. ADR (D)(G) | | | 4,992 | |
| | 292 | | | Foundry Networks, Inc. (D)(G) | | | 3,712 | |
| | 85 | | | FTI Consulting, Inc. (D)(G) | | | 5,385 | |
| | 32 | | | Gartner, Inc. Class A (D) | | | 738 | |
| | 36 | | | Healthcare Services Group, Inc. (G) | | | 543 | |
| | 21 | | | Hub Group, Inc. (D) | | | 690 | |
| | 19 | | | Huron Consulting Group, Inc. (D)(G) | | | 809 | |
| | 77 | | | Jack Henry & Associates, Inc. (G) | | | 2,026 | |
| | 49 | | | JDA Software Group, Inc. (D) | | | 922 | |
| | 75 | | | Live Nation, Inc. (D)(G) | | | 1,037 | |
| | 58 | | | Micros Systems (D)(G) | | | 2,066 | |
| | 23 | | | Monarch Casino & Resort, Inc. (D)(G) | | | 309 | |
| | 74 | | | Nice Systems Ltd. (D) | | | 2,365 | |
| | 53 | | | Parametric Technology Corp. (D) | | | 926 | |
| | 70 | | | Premiere Global Services, Inc. (D)(G) | | | 1,020 | |
| | 27 | | | Priceline.com, Inc. (D)(G) | | | 3,369 | |
| | 66 | | | Quest Software, Inc. (D) | | | 881 | |
| | 88 | | | Sapient Corp. (D)(G) | | | 627 | |
| | 178 | | | Secure Computing Corp. (D)(G) | | | 1,180 | |
| | 11 | | | Strayer Education, Inc. (G) | | | 1,972 | |
| | 39 | | | Taleo Corp. Class A (D)(G) | | | 764 | |
| | 153 | | | Tetra Tech, Inc. (D)(G) | | | 3,222 | |
| | 52 | | | Tyler Corp. (D) | | | 752 | |
| | 122 | | | ValueVision International, Inc. Class A (D)(G) | | | 680 | |
| | 59 | | | Waste Connections, Inc. (D)(G) | | | 1,883 | |
| | 22 | | | Wright Express Corp. (D) | | | 728 | |
| | | | | | | | | |
| | | | | | | | | | | | 63,655 | |
| | | | | | | | | | | | | |
| | | | | Technology — 22.3% |
| | 33 | | | ACI Worldwide, Inc. (D) | | | 720 | |
| | 181 | | | Activision, Inc. (D)(G) | | | 4,898 | |
| | 40 | | | Actuant Corp. Class A | | | 1,360 | |
| | 143 | | | Actuate Corp. (D)(G) | | | 581 | |
| | 35 | | | Acuity Brands, Inc. (G) | | | 1,673 | |
| | 244 | | | Advanced Analogic Technologies, Inc. (D) | | | 1,686 | |
| | 38 | | | Advent Software, Inc. (D)(G) | | | 1,535 | |
| | 46 | | | American Medical Systems Holdings (D)(G) | | | 642 | |
| | 139 | | | Amkor Technology, Inc. (D)(G) | | | 1,326 | |
| | 42 | | | Ansoft Corp. (D)(G) | | | 1,377 | |
| | 181 | | | Ansys, Inc. (D)(G) | | | 7,270 | |
| | 167 | | | Art Technology Group, Inc. (D)(G) | | | 598 | |
| | 27 | | | ATMI, Inc. (D) | | | 797 | |
| | 38 | | | Benchmark Electronics, Inc. (D) | | | 682 | |
| | 43 | | | Blackbaud, Inc. (G) | | | 1,017 | |
| | 30 | | | Blackboard, Inc. (D)(G) | | | 1,022 | |
| | 68 | | | Blue Coat Systems, Inc. (D)(G) | | | 1,436 | |
| | 39 | | | BMC Software, Inc. (D)(G) | | | 1,356 | |
| | 47 | | | Bruker Corp. (D) | | | 575 | |
| | 179 | | | Cellcom Israel Ltd. | | | 5,920 | |
| | 108 | | | Chordiant Software, Inc. (D) | | | 490 | |
| | 111 | | | CNET Networks, Inc. (D)(G) | | | 860 | |
| | 36 | | | Cognex Corp. (G) | | | 903 | |
| | 20 | | | Commvault Systems, Inc. (D)(G) | | | 248 | |
| | 62 | | | Concur Technologies, Inc. (D)(G) | | | 2,051 | |
| | 15 | | | CoStar Group, Inc. (D)(G) | | | 742 | |
| | 42 | | | Ctrip.Com International Ltd. | | | 2,584 | |
| | 88 | | | CyberSource Corp. (D)(G) | | | 1,589 | |
| | 58 | | | Dice Holdings, Inc. (D) | | | 394 | |
| | 31 | | | Diodes, Inc. (D)(G) | | | 826 | |
| | 19 | | | Dionex Corp. (D) | | | 1,498 | |
| | 125 | | | DivX, Inc. (D)(G) | | | 934 | |
| | 56 | | | Emulex Corp. (D) | | | 727 | |
| | 74 | | | Equinix, Inc. (D)(G) | | | 6,675 | |
| | 87 | | | Evergreen Solar, Inc. (D)(G) | | | 744 | |
| | 94 | | | Fairchild Semiconductor International, Inc. (D)(G) | | | 1,227 | |
| | 63 | | | FalconStor Software, Inc. (D)(G) | | | 513 | |
| | 88 | | | Faro Technologies (D) | | | 3,084 | |
| | 226 | | | FLIR Systems, Inc. (D)(G) | | | 7,740 | |
| | 50 | | | Fossil, Inc. (D)(G) | | | 1,777 | |
| | 30 | | | GeoEye, Inc. (D) | | | 681 | |
| | 30 | | | HMS Holdings Corp. (D)(G) | | | 773 | |
| | 205 | | | Hologic, Inc. (D)(G) | | | 5,976 | |
| | 116 | | | IHS, Inc. (D)(G) | | | 7,658 | |
| | 88 | | | Informatica Corp. (D) | | | 1,408 | |
| | 182 | | | Interactive Data Corp. (G) | | | 4,927 | |
| | 51 | | | Interdigital, Inc. (D)(G) | | | 1,028 | |
| | 59 | | | ION Geophysical Corp. (D) | | | 934 | |
| | 13 | | | Itron, Inc. (D)(G) | | | 1,254 | |
| | 50 | | | j2 Global Communications, Inc. (D)(G) | | | 1,065 | |
| | 84 | | | McAfee, Inc. (D) | | | 2,786 | |
| | 40 | | | Microsemi Corp. (D)(G) | | | 969 | |
| | 11 | | | MicroStrategy, Inc. (D) | | | 994 | |
| | 48 | | | Mine Safety Appliances Co. (G) | | | 1,769 | |
| | 50 | | | Netflix, Inc. (D)(G) | | | 1,596 | |
| | 28 | | | Netlogic Microsystems, Inc. (D)(G) | | | 902 | |
| | 310 | | | Nuance Communications, Inc. (D)(G) | | | 6,286 | |
| | 115 | | | O2Micro International Ltd. ADR (D) | | | 872 | |
| | 34 | | | Omniture, Inc. (D) | | | 783 | |
| | 224 | | | ON Semiconductor Corp. (D)(G) | | | 1,672 | |
| | 298 | | | Orbitz Worldwide, Inc. (D)(G) | | | 2,372 | |
| | 69 | | | Phase Forward, Inc. (D)(G) | | | 1,271 | |
| | 281 | | | PMC — Sierra, Inc. (D)(G) | | | 2,186 | |
| | 37 | | | Polycom, Inc. (D)(G) | | | 825 | |
| | 25 | | | Progress Software Corp. (D) | | | 754 | |
| | 164 | | | Red Hat, Inc. (D) | | | 3,369 | |
| | 67 | | | RightNow Technologies, Inc. (D) | | | 798 | |
| | 80 | | | Semtech Corp. (D)(G) | | | 1,299 | |
| | 149 | | | Silicon Image, Inc. (D) | | | 889 | |
| | 33 | | | Sirona Dental Systems, Inc. (D)(G) | | | 888 | |
| | 99 | | | Skyworks Solutions, Inc. (D)(G) | | | 863 | |
| | 35 | | | Sohu.com, Inc. (D) | | | 2,403 | |
| | 32 | | | SPSS, Inc. (D)(G) | | | 1,360 | |
| | 88 | | | Teledyne Technologies, Inc. (D)(G) | | | 5,152 | |
| | 46 | | | Time Warner Telecom, Inc. Class A (D)(G) | | | 900 | |
| | 92 | | | TradeStation Group, Inc. (D)(G) | | | 860 | |
| | 144 | | | Trizetto Group, Inc. (D)(G) | | | 3,035 | |
| | 73 | | | United Online, Inc. (G) | | | 783 | |
| | 93 | | | Valueclick, Inc. (D)(G) | | | 1,863 | |
| | 19 | | | Varian, Inc. (D) | | | 986 | |
| | 28 | | | ViaSat, Inc. (D)(G) | | | 624 | |
| | 27 | | | Vocus, Inc. (D) | | | 737 | |
The accompanying notes are an integral part of these financial statements.
238
| | | | | | | | | | | | | |
| | | | | | | | | Market
| |
| Shares | | | | | | | | Value (W) | |
| | | | | | | | | | | | | |
| COMMON STOCK — (continued) |
| | | | | | | | | | | | | |
| | | | | Technology — (continued) |
| | 58 | | | Websense, Inc. (D)(G) | | $ | 1,135 | |
| | 74 | | | Wind River Systems, Inc. (D)(G) | | | 610 | |
| | | | | | | | | |
| | | | | | | | | | | | 152,372 | |
| | | | | | | | | | | | | |
| | | | | Transportation — 3.0% |
| | 13 | | | Air Methods Corp. (D)(G) | | | 518 | |
| | 84 | | | Con-way, Inc. (G) | | | 3,900 | |
| | 87 | | | J.B. Hunt Transport Services, Inc. (G) | | | 2,969 | |
| | 90 | | | Kansas City Southern (D)(G) | | | 4,076 | |
| | 91 | | | Landstar System, Inc. (G) | | | 4,745 | |
| | 38 | | | Polaris Industries, Inc. (G) | | | 1,757 | |
| | 107 | | | UTI Worldwide, Inc. (G) | | | 2,341 | |
| | | | | | | | | |
| | | | | | | | | | | | 20,306 | |
| | | | | | | | | | | | | |
| | | | | Utilities — 0.2% |
| | 28 | | | ITC Holdings Corp. (G) | | | 1,585 | |
| | | | | | | | | |
| | | | | Total common stock
(cost $617,011) | | $ | 637,308 | |
| | | | | | | | | | | | | |
| | | | | | | | | | | | | |
| EXCHANGE TRADED FUNDS — 1.6% |
| | | | | Other Investment Pools and Funds — 1.6% |
| | 147 | | | iShares Russell 2000 Growth Index Fund (G) | | $ | 11,251 | |
| | | | | | | | | |
| | | | | Total exchange traded funds
(cost $11,466) | | $ | 11,251 | |
| | | | | | | | | |
| | | | | Total long-term investments
(cost $628,477) | | $ | 648,559 | |
| | | | | | | | | | | | | |
| | | | | | | | | | | | | |
Principal
| | | | | | | | | |
| Amount | | | | | | | | | |
| |
| SHORT-TERM INVESTMENTS — 47.0% |
| | | | | Repurchase Agreements — 4.1% |
| | | | | Banc of America Securities TriParty Joint Repurchase Agreement (maturing on 05/01/2008 in the amount of $6,522, collateralized by FHLMC 5.00%, 2035, value of $6,652) | | | | |
| $ | 6,522 | | | 1.98% dated 04/30/2008 | | $ | 6,522 | |
| | | | | BNP Paribas Securities Corp. Repurchase Agreement (maturing on 05/01/2008 in the amount of $3,011, collateralized by U.S. Treasury Bond 5.50%, 2028, value of $3,106) | | | | |
| | 3,011 | | | 1.90% dated 04/30/2008 | | | 3,011 | |
| | | | | BNP Paribas Securities Corp. TriParty Joint Repurchase Agreement (maturing on 05/01/2008 in the amount of $3,198, collateralized by FNMA 5.50% — 6.50%, 2036 — 2038, value of $3,262) | | | | |
| | 3,198 | | | 2.00% dated 04/30/2008 | | | 3,198 | |
| | | | | Deutsche Bank Securities Joint Repurchase Agreement (maturing on 05/01/2008 in the amount of $6, collateralized by U. S. Treasury Note 3.63%, 2009, value of $7) | | | | |
| | 6 | | | 1.90% dated 04/30/2008 | | | 6 | |
| | | | | Deutsche Bank Securities TriParty Joint Repurchase Agreement (maturing on 05/01/2008 in the amount of $3,976, collateralized by FHLMC 4.50% — 7.00%, 2016 — 2038, value of $4,055) | | | | |
| | 3,976 | | | 2.00% dated 04/30/2008 | | | 3,976 | |
| | | | | JP Morgan Chase TriParty Joint Repurchase Agreement (maturing on 05/01/2008 in the amount of $3,832, collateralized by FNMA 4.50% — 7.00%, 2020 — 2038, value of $3,908) | | | | |
| | 3,831 | | | 1.96% dated 04/30/2008 | | | 3,831 | |
| | | | | RBS Greenwich Capital Markets Repurchase Agreement (maturing on 05/01/2008 in the amount of $3,011, collateralized by U. S. Treasury Note 4.50%, 2011, value of $3,083) | | | | |
| | 3,011 | | | 1.90% dated 04/30/2008 | | | 3,011 | |
| | | | | UBS Securities, Inc. Repurchase Agreement (maturing on 05/01/2008 in the amount of $4,370, collateralized by U.S. Treasury Bond 6.00% — 8.75%, 2020 — 2026, U.S. Treasury Note 4.75% — 13.25%, 2008 — 2016, value of $4,476) | | | | |
| | 4,370 | | | 1.90% dated 04/30/2008 | | | 4,370 | |
| | | | | | | | | |
| | | | | | | | | | | | 27,925 | |
| | | | | | | | | | | | | |
| | | | | | | | | | | | | |
| | | | | | | | | | | | | |
| Shares | | | | | | | | | |
| |
| | | | | Securities Purchased with Proceeds from Security Lending — 42.6% |
| | | | | Cash Collateral Reinvestment Fund: |
| | 195,320 | | | Goldman Sachs FS Prime Obligation/Institutional Fund | | | 195,320 | |
| | 95,456 | | | Mellon GSL DBT II Collateral Fund (H) | | | 95,456 | |
| | | | | | | | | |
| | | | | | | | | | | | 290,776 | |
| | | | | | | | | | | | | |
| | | | | | | | | | | | | |
| | | | | | | | | | | | | |
Principal
| | | | | | | | | |
| Amount | | | | | | | | | |
| |
| | | | | U.S. Treasury Bills — 0.3% |
| $ | 1,750 | | | 1.40%, 06/12/2008 (M)(S) | | | 1,748 | |
| | | | | | | | | |
| | | | | Total short-term investments
(cost $320,448) | | $ | 320,449 | |
| | | | | | | | | |
| | | | | Total investments
(cost $948,925) (C) | | | 142.0 | % | | $ | 969,008 | |
| | | | | Other assets and liabilities | | | (42.0 | )% | | | (286,552 | ) |
| | | | | | | | | | | | | |
| | | | | Total net assets | | | 100.0 | % | | $ | 682,456 | |
| | | | | | | | | | | | | |
| |
| Note: | Percentage of investments as shown is the ratio of the total market value to total net assets. Market value of investments in foreign securities represents 6.53% of total net assets at April 30, 2008. |
| | |
| | Foreign securities that are principally traded on certain foreign markets are adjusted daily pursuant to a third party pricing service methodology approved by the Board of Directors in order to reflect an adjustment for factors occurring after the close of the foreign market but before the close of the New York Stock Exchange. |
The accompanying notes are an integral part of these financial statements.
239
The Hartford Small Company Fund
Schedule of Investments — (continued)
April 30, 2008 (Unaudited)
(000’s Omitted)
| | |
| (C) | | At April 30, 2008, the cost of securities for federal income tax purposes was $951,593 and the aggregate gross unrealized appreciation and depreciation based on that cost were: |
| | | | | |
| Unrealized Appreciation | | $ | 56,805 | |
| Unrealized Depreciation | | | (39,390 | ) |
| | | | | |
| Net Unrealized Appreciation | | $ | 17,415 | |
| | | | | |
| | |
| (D) | | Currently non-income producing. |
| |
| (G) | | Security is partially on loan at April 30, 2008. |
| |
| (M) | | The interest rate disclosed for these securities represents the effective yield on the date of acquisition. |
| |
| (H) | | The following securities are considered illiquid. Illiquid securities are often purchased in private placement transactions, are not registered under the Securities Act of 1933 and may have contractual restrictions on resale. A security may also be considered illiquid if the security lacks a readily available market or if its valuation has not changed for a certain period of time. Notwithstanding the foregoing, although the Mellon GLS DBT II Collateral Fund has been deemed illiquid for purposes of this report, the Mellon GLS DBT II Collateral Fund has redeemed shares daily in respect of recalled loaned securities. |
| | | | | | | | | | | |
Period
| | | | | | | | |
Acquired | | Shares/Par | | | Security | | Cost Basis | |
12/2007 –
04/2008 | | | 95,456 | | | Mellon GSL DBT II Collateral Fund | | $ | 95,456 | |
| | |
| | The aggregate value of these securities at April 30, 2008 was $95,456 which represents 13.99% of total net assets. |
| |
| (S) | | Security pledged as initial margin deposit for open futures contracts at April 30, 2008. |
| |
| | Futures Contracts Outstanding at April 30, 2008 |
| | | | | | | | | | | | | | | | | |
| | | | | | | | | | | | Unrealized
| |
| | | Number of
| | | | | | Expiration
| | | Appreciation/
| |
Description | | Contracts* | | | Position | | | Month | | | (Depreciation) | |
| |
| Russell Mini Futures | | | 160 | | | | Long | | | | Jun 2008 | | | $ | 172 | |
| | | | | | | | | | | | | | | | | |
| | |
| | * The number of contracts does not omit 000’s. |
Forward Foreign Currency Contracts Outstanding at April 30, 2008
| | | | | | | | | | | | | | | | | |
| | | | | | | | | | | | Unrealized
| |
| | | Market
| | | Contract
| | | Delivery
| | | Appreciation/
| |
Description | | Value (W) | | | Amount | | | Date | | | (Depreciation) | |
| |
| British Pound (Buy) | | $ | 368 | | | $ | 364 | | | | 05/02/08 | | | $ | 4 | |
| British Pound (Buy) | | | 296 | | | | 295 | | | | 05/06/08 | | | | 1 | |
| Hong Kong Dollar (Buy) | | | 170 | | | | 170 | | | | 05/02/08 | | | | — | |
| Swiss Franc (Buy) | | | 138 | | | | 138 | | | | 05/05/08 | | | | — | |
| | | | | | | | | | | | | | | | | |
| | | | | | | | | | | | | | | $ | 5 | |
| | | | | | | | | | | | | | | | | |
| | |
| (W) | | See Note 2b of accompanying Notes to Financial Statements regarding valuation of securities. |
The accompanying notes are an integral part of these financial statements.
240
The Hartford SmallCap Growth Fund
Schedule of Investments
April 30, 2008 (Unaudited)
(000’s Omitted)
| | | | | | | | | | | | | |
| | | | | | | | | Market
| |
| Shares | | | | | | | | Value (W) | |
| COMMON STOCK — 98.9% |
| | | | | Basic Materials — 6.8% |
| | 38 | | | Alpha Natural Resources, Inc. (D)(G) | | $ | 1,858 | |
| | 6 | | | Cabot Microelectronics Corp. (D)(G) | | | 201 | |
| | 23 | | | Century Aluminum Co. (D)(G) | | | 1,589 | |
| | 51 | | | Ceradyne, Inc. (D)(G) | | | 2,001 | |
| | 22 | | | CF Industries Holdings, Inc. | | | 2,854 | |
| | 22 | | | Cleveland-Cliffs, Inc. | | | 3,529 | |
| | 23 | | | Drew Industries (D) | | | 568 | |
| | 4 | | | Dynamic Materials Corp. | | | 180 | |
| | 4 | | | Greif, Inc. | | | 229 | |
| | 11 | | | Hercules, Inc. | | | 211 | |
| | 14 | | | L.B. Foster Co. Class A (D) | | | 453 | |
| | 23 | | | Massey Energy Co. | | | 1,224 | |
| | 3 | | | Matthews International Corp. Class A | | | 168 | |
| | 12 | | | Sturm Ruger & Co., Inc. (D) | | | 92 | |
| | 67 | | | Sun Hydraulics Corp. (G) | | | 2,021 | |
| | 19 | | | Tempur-Pedic International, Inc. (G) | | | 212 | |
| | 68 | | | Terra Industries, Inc. (D)(G) | | | 2,589 | |
| | 7 | | | Tupperware Brands Corp. | | | 282 | |
| | 2 | | | Valmont Industries, Inc. | | | 167 | |
| | 33 | | | W.R. Grace & Co. (D)(G) | | | 824 | |
| | | | | | | | | |
| | | | | | | | | | | | 21,252 | |
| | | | | | | | | | | | | |
| | | | | Capital Goods — 6.3% |
| | 8 | | | Bally Technologies, Inc. (D)(G) | | | 262 | |
| | 3 | | | Blue Nile, Inc. (D)(G) | | | 169 | |
| | 13 | | | Bucyrus International, Inc. (G) | | | 1,732 | |
| | 24 | | | Columbus McKinnon Corp. (D) | | | 669 | |
| | 8 | | | Daktronics, Inc. (G) | | | 113 | |
| | 5 | | | Dril-Quip, Inc. (D) | | | 292 | |
| | 11 | | | Flotek Industries, Inc. (D)(G) | | | 199 | |
| | 39 | | | Graco, Inc. (G) | | | 1,619 | |
| | 11 | | | Gulf Island Fabrication (G) | | | 439 | |
| | 3 | | | Heico Corp. | | | 175 | |
| | 11 | | | Hexcel Corp. (D)(G) | | | 250 | |
| | 4 | | | II-VI, Inc. (D) | | | 141 | |
| | 60 | | | Intevac, Inc. (D) | | | 794 | |
| | 80 | | | Jakks Pacific, Inc. (D)(G) | | | 1,875 | |
| | 30 | | | Lennox International, Inc. (G) | | | 1,004 | |
| | 13 | | | Lufkin Industries, Inc. | | | 1,003 | |
| | 48 | | | MKS Instruments, Inc. (D) | | | 1,088 | |
| | 3 | | | NATCO Group, Inc. (D) | | | 159 | |
| | 3 | | | Nordson Corp. | | | 168 | |
| | 6 | | | Orbital Sciences Corp. (D) | | | 170 | |
| | 56 | | | Robbins & Myers, Inc. (G) | | | 2,240 | |
| | 73 | | | Steelcase, Inc. (G) | | | 812 | |
| | 3 | | | T-3 Energy Services, Inc. (D) | | | 171 | |
| | 8 | | | Tessera Technologies, Inc. (D)(G) | | | 170 | |
| | 6 | | | TransDigm Group, Inc. (D) | | | 229 | |
| | 89 | | | Varian Semiconductor Equipment Associates, Inc. (D)(G) | | | 3,260 | |
| | 7 | | | WMS Industries, Inc. (D) | | | 242 | |
| | 8 | | | Woodward Governor Co. (G) | | | 296 | |
| | | | | | | | | |
| | | | | | | | | | | | 19,741 | |
| | | | | | | | | | | | | |
| | | | | Consumer Cyclical — 11.3% |
| | 10 | | | 1-800-Flowers.com, Inc. (D) | | | 90 | |
| | 94 | | | Aeropostale, Inc. (D)(G) | | | 2,987 | |
| | 59 | | | Applied Industrial Technologies, Inc. | | | 1,416 | |
| | 47 | | | BJ’s Wholesale Club, Inc. (D)(G) | | | 1,807 | |
| | 49 | | | Brown Shoe Co., Inc. (G) | | | 819 | |
| | 5 | | | The Buckle, Inc. (G) | | | 225 | |
| | 6 | | | Cash America International, Inc. | | | 261 | |
| | 24 | | | CEC Entertainment, Inc. (D) | | | 896 | |
| | 21 | | | Cental Euro Distribution Corp. (D)(G) | | | 1,235 | |
| | 29 | | | Charlotte Russe Holding, Inc. (D)(G) | | | 456 | |
| | 5 | | | Chemed Corp. (G) | | | 171 | |
| | 3 | | | Chipotle Mexican Grill, Inc. (D)(G) | | | 228 | |
| | 18 | | | Christopher & Banks Corp. | | | 210 | |
| | 13 | | | Deckers Outdoor Corp. (D)(G) | | | 1,802 | |
| | 16 | | | Dollar Tree, Inc. (D) | | | 502 | |
| | 26 | | | Global Sources Ltd. (D)(G) | | | 354 | |
| | 5 | | | Great Atlantic & Pacific Tea Co., Inc. (D)(G) | | | 148 | |
| | 11 | | | Herman Miller, Inc. (G) | | | 246 | |
| | 39 | | | Hill-Rom Holdings, Inc. | | | 967 | |
| | 171 | | | Hot Topic, Inc. (D) | | | 908 | |
| | 6 | | | Integrated Electrical Services, Inc. (D)(G) | | | 108 | |
| | 72 | | | J. Crew Group, Inc. (D)(G) | | | 3,418 | |
| | 8 | | | Lear Corp. (D)(G) | | | 226 | |
| | 10 | | | LKQ Corp. (D) | | | 210 | |
| | 29 | | | Maidenform Brands, Inc. (D) | | | 434 | |
| | 30 | | | Men’s Wearhouse, Inc. (G) | | | 802 | |
| | 17 | | | Nash Finch Co. (G) | | | 633 | |
| | 4 | | | Nuco2, Inc. (D)(G) | | | 110 | |
| | 34 | | | Owens & Minor, Inc. | | | 1,537 | |
| | 56 | | | P. F. Chang’s China Bistro, Inc. (D)(G) | | | 1,722 | |
| | 22 | | | Panera Bread Co. Class A (D)(G) | | | 1,129 | |
| | 22 | | | Perini Corp. (D)(G) | | | 783 | |
| | 10 | | | PSS World Medical, Inc. (D)(G) | | | 170 | |
| | 54 | | | Red Robin Gourmet Burgers, Inc. (D)(G) | | | 2,219 | |
| | 29 | | | Sigma Designs, Inc. (D)(G) | | | 511 | |
| | 65 | | | Skechers U.S.A., Inc. Class A (D) | | | 1,529 | |
| | 7 | | | Sotheby’s Holdings (G) | | | 197 | |
| | 250 | | | Source Information Management Co. (D)(G) | | | 352 | |
| | 30 | | | Spartan Stores, Inc. (G) | | | 631 | |
| | 32 | | | Tenneco Automotive, Inc. (D)(G) | | | 806 | |
| | 4 | | | United Stationers, Inc. (D) | | | 188 | |
| | 8 | | | VistaPrint Ltd. (D)(G) | | | 281 | |
| | 22 | | | Walter Industries (G) | | | 1,484 | |
| | 6 | | | Warnaco Group, Inc. (D) | | | 299 | |
| | | | | | | | | |
| | | | | | | | | | | | 35,507 | |
| | | | | | | | | | | | | |
| | | | | Consumer Staples — 0.8% |
| | 5 | | | Cal-Maine Foods, Inc. (G) | | | 143 | |
| | 5 | | | Chattem, Inc. (D)(G) | | | 315 | |
| | 44 | | | Darling International, Inc. (D) | | | 670 | |
| | 8 | | | Flowers Foods, Inc. | | | 207 | |
| | 5 | | | Lancaster Colony Corp. | | | 173 | |
| | 2 | | | Ralcorp Holdings, Inc. (D) | | | 124 | |
| | 84 | | | Sally Beauty Co., Inc. (D)(G) | | | 509 | |
| | 15 | | | Vector Group Ltd. (G) | | | 254 | |
| | | | | | | | | |
| | | | | | | | | | | | 2,395 | |
| | | | | | | | | | | | | |
| | | | | Energy — 7.3% |
| | 5 | | | Arena Resources, Inc. (D) | | | 238 | |
| | 5 | | | Atwood Oceanics, Inc. (D)(G) | | | 545 | |
| | 3 | | | Bill Barrett Corp. (D) | | | 166 | |
| | 29 | | | Cabot Oil & Gas Corp. | | | 1,629 | |
| | 22 | | | Cal Dive International, Inc. (D) | | | 264 | |
| | 96 | | | Complete Production Services, Inc. (D)(G) | | | 2,586 | |
| | 24 | | | Comstock Resources, Inc. (D) | | | 1,086 | |
| | 7 | | | Concho Resources, Inc. (D) | | | 190 | |
The accompanying notes are an integral part of these financial statements.
241
The Hartford SmallCap Growth Fund
Schedule of Investments — (continued)
April 30, 2008 (Unaudited)
(000’s Omitted)
| | | | | | | | | | | | | |
| | | | | | | | | Market
| |
| Shares | | | | | | | | Value (W) | |
| | | | | | | | | | | | | |
| COMMON STOCK — (continued) |
| | | | | | | | | | | | | |
| | | | | Energy — (continued) |
| | 4 | | | Contango Oil & Gas Co. (D) | | $ | 276 | |
| | 17 | | | Dawson Geophysical Co. (D)(G) | | | 1,221 | |
| | 87 | | | Delek U.S. Holdings, Inc. (G) | | | 955 | |
| | 8 | | | Delta Petroleum Corp. (D)(G) | | | 188 | |
| | 83 | | | Frontier Oil Corp. | | | 2,070 | |
| | 7 | | | Goodrich Petroleum Corp. (D)(G) | | | 243 | |
| | 37 | | | Grey Wolf, Inc. (D)(G) | | | 235 | |
| | 100 | | | Headwaters, Inc. (D)(G) | | | 1,144 | |
| | 9 | | | Hercules Offshore, Inc. (D)(G) | | | 224 | |
| | 9 | | | Mariner Energy, Inc. (D)(G) | | | 237 | |
| | 3 | | | Penn Virginia Corp. | | | 161 | |
| | 16 | | | Petrohawk Energy Corp. (D) | | | 383 | |
| | 14 | | | PetroQuest Energy, Inc. (D)(G) | | | 282 | |
| | 93 | | | Pioneer Drilling Co. (D)(G) | | | 1,520 | |
| | 50 | | | St. Mary Land & Exploration Co. (G) | | | 2,164 | |
| | 25 | | | Swift Energy Co. (D) | | | 1,293 | |
| | 49 | | | Trico Marine Services, Inc. (D)(G) | | | 1,854 | |
| | 94 | | | Union Drilling, Inc. (D)(G) | | | 1,595 | |
| | 4 | | | W-H Energy Services (D) | | | 302 | |
| | | | | | | | | |
| | | | | | | | | | | | 23,051 | |
| | | | | | | | | | | | | |
| | | | | Finance — 8.0% |
| | 41 | | | Advanta Corp. Class B (G) | | | 357 | |
| | 2 | | | Alexander’s, Inc. (D) | | | 748 | |
| | 2 | | | Alexandria Real Estate Equities, Inc. (G) | | | 210 | |
| | 25 | | | Allied World Assurance Holdings Ltd. | | | 1,035 | |
| | 128 | | | Amerisafe, Inc. (D) | | | 1,824 | |
| | 73 | | | Anworth Mortgage Asset Corp. | | | 486 | |
| | 11 | | | Arch Capital Group Ltd. (D) | | | 791 | |
| | 68 | | | Aspen Insurance Holdings Ltd. | | | 1,773 | |
| | 39 | | | Assured Guaranty Ltd. | | | 984 | |
| | 19 | | | Centene Corp. (D) | | | 349 | |
| | 4 | | | Digital Realty Trust, Inc. (G) | | | 167 | |
| | 37 | | | Dollar Financial Corp. (D)(G) | | | 794 | |
| | 12 | | | eHealth, Inc. (D) | | | 318 | |
| | 3 | | | Equity Lifestyle Properties, Inc. | | | 153 | |
| | 16 | | | FCStone Group, Inc. (D) | | | 679 | |
| | 12 | | | First Community Bancorp, Inc. (G) | | | 262 | |
| | 52 | | | GFI Group, Inc. (G) | | | 608 | |
| | 6 | | | Greenhill & Co., Inc. (G) | | | 376 | |
| | 12 | | | Grubb & Ellis Co. | | | 71 | |
| | 7 | | | Heartland Payment Systems, Inc. (G) | | | 158 | |
| | 3 | | | Home Properties of New York, Inc. | | | 150 | |
| | 16 | | | Interactive Brokers Group (D) | | | 516 | |
| | 16 | | | Knight Capital Group, Inc. (D)(G) | | | 294 | |
| | 6 | | | Mercadolibre, Inc. (D) | | | 283 | |
| | 120 | | | MFA Mortgage Investments, Inc. (G) | | | 837 | |
| | 15 | | | Morningstar, Inc. (D)(G) | | | 842 | |
| | 8 | | | Nationwide Health Properties, Inc. (G) | | | 287 | |
| | 53 | | | Net 1 UEPS Technologies, Inc. (D) | | | 1,237 | |
| | 13 | | | optionsXpress Holdings, Inc. (G) | | | 279 | |
| | 13 | | | Signature Bank (D)(G) | | | 336 | |
| | 10 | | | Solera Holdings, Inc. (D) | | | 258 | |
| | 48 | | | Strategic Hotels & Resorts, Inc. | | | 685 | |
| | 158 | | | Sunstone Hotel Investors, Inc. (G) | | | 2,944 | |
| | 49 | | | Universal American Financial Corp. (D) | | | 525 | |
| | 19 | | | Validus Holdings Ltd. | | | 441 | |
| | 84 | | | Waddell and Reed Financial, Inc. Class A (G) | | | 2,846 | |
| | 6 | | | Washington Real Estate Investment Trust (G) | | | 213 | |
| | 4 | | | World Acceptance Corp. (D) | | | 146 | |
| | | | | | | | | |
| | | | | | | | | | | | 25,262 | |
| | | | | | | | | | | | | |
| | | | | Health Care — 17.9% |
| | 110 | | | Acadia Pharmaceuticals, Inc. (D)(G) | | | 880 | |
| | 20 | | | Accuray, Inc. (D)(G) | | | 154 | |
| | 10 | | | Acorda Therapeutics, Inc. (D) | | | 203 | |
| | 9 | | | Albany Molecular Research, Inc. (D) | | | 106 | |
| | 3 | | | Alexion Pharmaceuticals, Inc. (D)(G) | | | 232 | |
| | 250 | | | Alkermes, Inc. (D)(G) | | | 3,108 | |
| | 17 | | | Alliance Imaging, Inc. (D) | | | 142 | |
| | 7 | | | Alnylam Pharmaceuticals, Inc. (D)(G) | | | 186 | |
| | 4 | | | Amedisys, Inc. (D) | | | 187 | |
| | 110 | | | American Oriental Bioengineering, Inc. (D)(G) | | | 1,056 | |
| | 145 | | | Applera Corp. — Celera Group (D)(G) | | | 1,935 | |
| | 14 | | | Apria Healthcare Group, Inc. (D) | | | 248 | |
| | 207 | | | Arena Pharmaceuticals, Inc. (D)(G) | | | 1,155 | |
| | 8 | | | ArthroCare Corp. (D)(G) | | | 343 | |
| | 13 | | | Biomarin Pharmaceutical, Inc. (D)(G) | | | 467 | |
| | 37 | | | CONMED Corp. (D)(G) | | | 942 | |
| | 12 | | | Cubist Pharmaceuticals, Inc. (D)(G) | | | 239 | |
| | 294 | | | CV Therapeutics, Inc. (D)(G) | | | 2,690 | |
| | 193 | | | Cytokinetics, Inc. (D)(G) | | | 666 | |
| | 17 | | | Enzon, Inc. (D)(G) | | | 152 | |
| | 112 | | | Exelixis, Inc. (D)(G) | | | 854 | |
| | 6 | | | Healthways, Inc. (D)(G) | | | 213 | |
| | 170 | | | Human Genome Sciences, Inc. (D) | | | 1,116 | |
| | 4 | | | Illumina, Inc. (D)(G) | | | 288 | |
| | 10 | | | Immucor, Inc. (D) | | | 268 | |
| | 152 | | | Incyte Corp. (D) | | | 1,657 | |
| | 5 | | | Integra LifeSciences Holdings Corp. (D)(G) | | | 229 | |
| | 175 | | | Invacare Corp. (G) | | | 3,162 | |
| | 13 | | | Isis Pharmaceuticals, Inc. (D)(G) | | | 153 | |
| | 32 | | | Kendle International, Inc. (D)(G) | | | 1,359 | |
| | 10 | | | KV Pharmaceutical Co. (D)(G) | | | 247 | |
| | 5 | | | Lifecell Corp. (D)(G) | | | 269 | |
| | 117 | | | LifePoint Hospitals, Inc. (D)(G) | | | 3,524 | |
| | 61 | | | Longs Drug Stores Corp. (G) | | | 2,409 | |
| | 6 | | | Magellan Health Services, Inc. (D) | | | 222 | |
| | 52 | | | Mannatech, Inc. (G) | | | 342 | |
| | 11 | | | Medicines Co. (D)(G) | | | 207 | |
| | 13 | | | Medicis Pharmaceutical Corp. Class A (G) | | | 277 | |
| | 8 | | | Meridian Bioscience, Inc. (G) | | | 222 | |
| | 3 | | | Myriad Genetics, Inc. (D) | | | 143 | |
| | 330 | | | NPS Pharmaceuticals, Inc. (D)(G) | | | 1,243 | |
| | 67 | | | Obagi Medical Products, Inc. (D)(G) | | | 539 | |
| | 7 | | | OSI Pharmaceuticals, Inc. (D)(G) | | | 232 | |
| | 11 | | | Par Pharmaceutical Cos., Inc. (D) | | | 189 | |
| | 9 | | | PAREXEL International Corp. (D) | | | 220 | |
| | 134 | | | Perrigo Co. (G) | | | 5,468 | |
| | 8 | | | PharmaNet Development Group, Inc. (D) | | | 179 | |
| | 32 | | | Progenics Pharmaceuticals, Inc. (D)(G) | | | 424 | |
| | 4 | | | Psychiatric Solutions, Inc. (D)(G) | | | 149 | |
| | 12 | | | Quidel Corp. (D) | | | 189 | |
| | 146 | | | Regeneron Pharmaceuticals, Inc. (D)(G) | | | 2,870 | |
| | 134 | | | Rigel Pharmaceuticals, Inc. (D)(G) | | | 3,022 | |
| | 148 | | | Salix Pharmaceuticals Ltd. (D)(G) | | | 1,043 | |
| | 10 | | | Sciele Pharma, Inc. (D)(G) | | | 193 | |
| | 11 | | | STERIS Corp. | | | 308 | |
| | 20 | | | SurModics, Inc. (D)(G) | | | 885 | |
The accompanying notes are an integral part of these financial statements.
242
| | | | | | | | | | | | | |
| | | | | | | | | Market
| |
| Shares | | | | | | | | Value (W) | |
| | | | | | | | | | | | | |
| COMMON STOCK — (continued) |
| | | | | | | | | | | | | |
| | | | | Health Care — (continued) |
| | 66 | | | Symmetry Medical, Inc. (D)(G) | | $ | 929 | |
| | 4 | | | United Therapeutics Corp. (D)(G) | | | 344 | |
| | 8 | | | Usana Health Sciences, Inc. (D)(G) | | | 152 | |
| | 16 | | | Valeant Pharmaceuticals International (D)(G) | | | 214 | |
| | 15 | | | Vermillion, Inc. (D)(G) | | | 16 | |
| | 52 | | | Vertex Pharmaceuticals, Inc. (D)(G) | | | 1,335 | |
| | 32 | | | ViroPharma, Inc. (D)(G) | | | 297 | |
| | 52 | | | Xenoport, Inc. (D) | | | 2,209 | |
| | 127 | | | Zymogenetics, Inc. (D)(G) | | | 1,126 | |
| | | | | | | | | |
| | | | | | | | | | | | 56,027 | |
| | | | | | | | | | | | | |
| | | | | Services — 13.1% |
| | 7 | | | Administaff, Inc. | | | 182 | |
| | 3 | | | Advisory Board Co. (D) | | | 158 | |
| | 4 | | | American Public Education, Inc. (D) | | | 145 | |
| | 12 | | | Atheros Communications, Inc. (D)(G) | | | 312 | |
| | 4 | | | Bankrate, Inc. (D)(G) | | | 216 | |
| | 4 | | | Capella Education Co. (D) | | | 259 | |
| | 7 | | | CDI Corp. | | | 193 | |
| | 16 | | | Central European Media Enterprises Ltd. (D) | | | 1,686 | |
| | 3 | | | Clean Harbors, Inc. (D) | | | 175 | |
| | 30 | | | Comsys IT Partners, Inc. (D)(G) | | | 243 | |
| | 17 | | | Consolidated Graphics, Inc. (D) | | | 1,006 | |
| | 5 | | | Corvel (D) | | | 156 | |
| | 27 | | | CPI Corp. (G) | | | 513 | |
| | 57 | | | DeVry, Inc. | | | 3,223 | |
| | 10 | | | Digital River, Inc. (D) | | | 318 | |
| | 14 | | | Epicor Software Corp. (D)(G) | | | 113 | |
| | 23 | | | Factset Research Systems, Inc. (G) | | | 1,351 | |
| | 24 | | | Foundry Networks, Inc. (D)(G) | | | 305 | |
| | 6 | | | FTI Consulting, Inc. (D) | | | 395 | |
| | 7 | | | Gartner, Inc. Class A (D) | | | 157 | |
| | 7 | | | Healthcare Services Group, Inc. (G) | | | 111 | |
| | 73 | | | Healthspring, Inc. (D) | | | 1,231 | |
| | 77 | | | Hub Group, Inc. (D)(G) | | | 2,529 | |
| | 4 | | | Huron Consulting Group, Inc. (D) | | | 175 | |
| | 58 | | | ICF International, Inc. (D) | | | 1,031 | |
| | 54 | | | ITT Educational Services, Inc. (D)(G) | | | 4,120 | |
| | 16 | | | Jack Henry & Associates, Inc. | | | 433 | |
| | 39 | | | JDA Software Group, Inc. (D) | | | 744 | |
| | 32 | | | Mantech International Corp. Class A (D) | | | 1,543 | |
| | 13 | | | MAXIMUS, Inc. (G) | | | 504 | |
| | 90 | | | Mentor Graphics Corp. (D)(G) | | | 901 | |
| | 12 | | | Micros Systems (D)(G) | | | 438 | |
| | 5 | | | Monarch Casino & Resort, Inc. (D)(G) | | | 66 | |
| | 11 | | | Parametric Technology Corp. (D) | | | 199 | |
| | 31 | | | Plexus Corp. (D)(G) | | | 737 | |
| | 67 | | | Premier Exhibitions, Inc. (D)(G) | | | 390 | |
| | 14 | | | Premiere Global Services, Inc. (D) | | | 210 | |
| | 11 | | | Pre-Paid Legal Services, Inc. (D) | | | 464 | |
| | 34 | | | Priceline.com, Inc. (D)(G) | | | 4,389 | |
| | 15 | | | Quest Software, Inc. (D) | | | 206 | |
| | 36 | | | Radiant Systems, Inc. (D) | | | 486 | |
| | 42 | | | Resources Connection, Inc. (G) | | | 851 | |
| | 169 | | | Sapient Corp. (D)(G) | | | 1,203 | |
| | 39 | | | Secure Computing Corp. (D)(G) | | | 258 | |
| | 58 | | | Soapstone Networks, Inc. | | | 405 | |
| | 2 | | | Strayer Education, Inc. (G) | | | 395 | |
| | 8 | | | Taleo Corp. Class A (D) | | | 150 | |
| | 11 | | | Tyler Corp. (D) | | | 161 | |
| | 41 | | | Valassis Communications, Inc. (D) | | | 578 | |
| | 21 | | | ValueVision International, Inc. Class A (D) | | | 119 | |
| | 5 | | | Waste Connections, Inc. (D) | | | 167 | |
| | 79 | | | Watson Wyatt Worldwide, Inc. | | | 4,637 | |
| | 4 | | | Wright Express Corp. (D)(G) | | | 144 | |
| | | | | | | | | |
| | | | | | | | | | | | 41,081 | |
| | | | | | | | | | | | | |
| | | | | Technology — 24.3% |
| | 23 | | | A.O. Smith Corp. (G) | | | 712 | |
| | 7 | | | ACI Worldwide, Inc. (D)(G) | | | 153 | |
| | 45 | | | Actuant Corp. Class A | | | 1,539 | |
| | 26 | | | Actuate Corp. (D) | | | 106 | |
| | 91 | | | Acuity Brands, Inc. (G) | | | 4,363 | |
| | 33 | | | ADC Telecommunications, Inc. (D)(G) | | | 457 | |
| | 84 | | | Advanced Energy Industries, Inc. (D)(G) | | | 1,172 | |
| | 9 | | | Advent Software, Inc. (D)(G) | | | 362 | |
| | 10 | | | American Medical Systems Holdings (D)(G) | | | 136 | |
| | 28 | | | Amkor Technology, Inc. (D) | | | 268 | |
| | 8 | | | Ansoft Corp. (D) | | | 277 | |
| | 86 | | | Ansys, Inc. (D) | | | 3,445 | |
| | 191 | | | Arris Group, Inc. (D)(G) | | | 1,545 | |
| | 258 | | | Art Technology Group, Inc. (D) | | | 920 | |
| | 26 | | | Atlantic Tele-Network, Inc. | | | 822 | |
| | 6 | | | ATMI, Inc. (D) | | | 171 | |
| | 56 | | | Avocent Corp. (D) | | | 1,094 | |
| | 31 | | | Belden, Inc. (G) | | | 1,036 | |
| | 81 | | | Benchmark Electronics, Inc. (D) | | | 1,436 | |
| | 10 | | | Blackbaud, Inc. (G) | | | 239 | |
| | 6 | | | Blackboard, Inc. (D)(G) | | | 211 | |
| | 58 | | | Blue Coat Systems, Inc. (D)(G) | | | 1,222 | |
| | 94 | | | Brocade Communications Systems, Inc. (D) | | | 674 | |
| | 106 | | | Bruker Corp. (D) | | | 1,283 | |
| | 104 | | | Centennial Cellular Corp. Class A (D)(G) | | | 628 | |
| | 27 | | | Chordiant Software, Inc. (D) | | | 124 | |
| | 20 | | | CNET Networks, Inc. (D) | | | 157 | |
| | 7 | | | Cognex Corp. | | | 165 | |
| | 58 | | | CommScope, Inc. (D)(G) | | | 2,767 | |
| | 7 | | | Concur Technologies, Inc. (D)(G) | | | 232 | |
| | 3 | | | CoStar Group, Inc. (D)(G) | | | 158 | |
| | 89 | | | CSG Systems International, Inc. (D)(G) | | | 1,077 | |
| | 18 | | | Cubic Corp. | | | 496 | |
| | 19 | | | CyberSource Corp. (D) | | | 346 | |
| | 10 | | | Dice Holdings, Inc. (D) | | | 70 | |
| | 8 | | | Diodes, Inc. (D) | | | 223 | |
| | 4 | | | Dionex Corp. (D) | | | 293 | |
| | 27 | | | DivX, Inc. (D) | | | 200 | |
| | 18 | | | EMS Technologies, Inc. (D) | | | 473 | |
| | 267 | | | Emulex Corp. (D)(G) | | | 3,500 | |
| | 20 | | | Esterline Technologies Corp. (D) | | | 1,085 | |
| | 16 | | | Evergreen Solar, Inc. (D)(G) | | | 139 | |
| | 13 | | | FalconStor Software, Inc. (D)(G) | | | 109 | |
| | 16 | | | FLIR Systems, Inc. (D) | | | 539 | |
| | 39 | | | Fossil, Inc. (D) | | | 1,402 | |
| | 23 | | | GeoEye, Inc. (D) | | | 535 | |
| | 6 | | | HMS Holdings Corp. (D) | | | 162 | |
| | 24 | | | Hologic, Inc. (D) | | | 696 | |
| | 5 | | | IHS, Inc. (D) | | | 319 | |
| | 18 | | | Informatica Corp. (D) | | | 283 | |
| | 51 | | | Integrated Device Technology, Inc. (D) | | | 541 | |
| | 9 | | | Interactive Data Corp. | | | 231 | |
| | 10 | | | Interdigital, Inc. (D)(G) | | | 194 | |
The accompanying notes are an integral part of these financial statements.
243
The Hartford SmallCap Growth Fund
Schedule of Investments — (continued)
April 30, 2008 (Unaudited)
(000’s Omitted)
| | | | | | | | | | | | | |
| | | | | | | | | Market
| |
| Shares | | | | | | | | Value (W) | |
| | | | | | | | | | | | | |
| COMMON STOCK — (continued) |
| | | | | | | | | | | | | |
| | | | | Technology — (continued) |
| | 13 | | | ION Geophysical Corp. (D) | | $ | 200 | |
| | 2 | | | Itron, Inc. (D)(G) | | | 216 | |
| | 74 | | | j2 Global Communications, Inc. (D)(G) | | | 1,568 | |
| | 69 | | | Magma Design Automation, Inc. (D)(G) | | | 647 | |
| | 9 | | | Microsemi Corp. (D)(G) | | | 230 | |
| | 10 | | | MicroStrategy, Inc. (D)(G) | | | 830 | |
| | 12 | | | Middleby Corp. (D)(G) | | | 728 | |
| | 62 | | | Netflix, Inc. (D)(G) | | | 1,984 | |
| | 7 | | | Netlogic Microsystems, Inc. (D)(G) | | | 239 | |
| | 20 | | | Neustar, Inc. (D)(G) | | | 545 | |
| | 57 | | | NTELOS Holdings Corp. | | | 1,475 | |
| | 24 | | | Nuance Communications, Inc. (D)(G) | | | 482 | |
| | 36 | | | Omniture, Inc. (D)(G) | | | 819 | |
| | 39 | | | ON Semiconductor Corp. (D)(G) | | | 295 | |
| | 60 | | | Orbitz Worldwide, Inc. (D)(G) | | | 475 | |
| | 84 | | | PeopleSupport, Inc. (D) | | | 832 | |
| | 13 | | | Phase Forward, Inc. (D) | | | 245 | |
| | 29 | | | Phoenix Technologies Ltd. (D) | | | 344 | |
| | 51 | | | PMC — Sierra, Inc. (D) | | | 400 | |
| | 9 | | | Polycom, Inc. (D)(G) | | | 207 | |
| | 5 | | | Progress Software Corp. (D) | | | 158 | |
| | 15 | | | RightNow Technologies, Inc. (D)(G) | | | 175 | |
| | 18 | | | Rofin-Sinar Technologies, Inc. (D) | | | 674 | |
| | 17 | | | Semtech Corp. (D)(G) | | | 276 | |
| | 32 | | | Silicon Image, Inc. (D) | | | 189 | |
| | 7 | | | Sirona Dental Systems, Inc. (D)(G) | | | 189 | |
| | 351 | | | Skyworks Solutions, Inc. (D)(G) | | | 3,048 | |
| | 86 | | | Smart Modular Technologies, Inc. (D) | | | 516 | |
| | 36 | | | Sohu.com, Inc. (D) | | | 2,485 | |
| | 40 | | | SPSS, Inc. (D)(G) | | | 1,697 | |
| | 52 | | | Sybase, Inc. (D)(G) | | | 1,536 | |
| | 63 | | | Technitrol, Inc. | | | 1,321 | |
| | 31 | | | Teledyne Technologies, Inc. (D) | | | 1,856 | |
| | 25 | | | THQ, Inc. (D)(G) | | | 536 | |
| | 9 | | | Time Warner Telecom, Inc. Class A (D)(G) | | | 178 | |
| | 16 | | | TradeStation Group, Inc. (D) | | | 152 | |
| | 8 | | | Triumph Group, Inc. | | | 465 | |
| | 88 | | | Trizetto Group, Inc. (D)(G) | | | 1,846 | |
| | 123 | | | Ultra Clean Holdings, Inc. (D) | | | 1,316 | |
| | 128 | | | United Online, Inc. (G) | | | 1,362 | |
| | 20 | | | Valueclick, Inc. (D) | | | 401 | |
| | 4 | | | Varian, Inc. (D) | | | 224 | |
| | 7 | | | ViaSat, Inc. (D) | | | 156 | |
| | 64 | | | Virgin Mobile USA, Inc. (D)(G) | | | 267 | |
| | 130 | | | Vishay Intertechnology, Inc. (D) | | | 1,228 | |
| | 6 | | | Vocus, Inc. (D) | | | 159 | |
| | 13 | | | Websense, Inc. (D) | | | 248 | |
| | 18 | | | Wind River Systems, Inc. (D) | | | 149 | |
| | | | | | | | | |
| | | | | | | | | | | | 76,355 | |
| | | | | | | | | | | | | |
| | | | | Transportation — 3.0% |
| | 31 | | | Air Methods Corp. (D)(G) | | | 1,250 | |
| | 21 | | | Freighter America, Inc. (G) | | | 787 | |
| | 71 | | | Knight Transportation, Inc. (G) | | | 1,199 | |
| | 61 | | | Landstar System, Inc. | | | 3,149 | |
| | 8 | | | Overseas Shipholding Group, Inc. (G) | | | 595 | |
| | 8 | | | Polaris Industries, Inc. (G) | | | 350 | |
| | 28 | | | SkyWest, Inc. | | | 531 | |
| | 78 | | | Werner Enterprises, Inc. (G) | | | 1,525 | |
| | | | | | | | | |
| | | | | | | | | | | | 9,386 | |
| | | | | | | | | | | | | |
| | | | | Utilities — 0.1% |
| | 6 | | | ITC Holdings Corp. (G) | | | 322 | |
| | | | | | | | | |
| | | | | Total common stock
(cost $312,267) | | $ | 310,379 | |
| | | | | | | | | | | | | |
| | �� | | | | | | | | | | | |
Principal
| | | | | | | | | |
| Amount | | | | | | | | | |
| |
| SHORT-TERM INVESTMENTS — 42.9% |
| | | | | Repurchase Agreements — 1.4% |
| | | | | Banc of America Securities TriParty Joint Repurchase Agreement (maturing on 05/01/2008 in the amount of $1,168, collateralized by FHLMC 5.00%, 2035, value of $1,191) | | | | |
| $ | 1,168 | | | 1.98% dated 04/30/2008 | | $ | 1,168 | |
| | | | | BNP Paribas Securities Corp. Repurchase Agreement (maturing on 05/01/2008 in the amount of $308, collateralized by U.S. Treasury Bond 5.50%, 2028, value of $318) | | | | |
| | 308 | | | 1.90% dated 04/30/2008 | | | 308 | |
| | | | | BNP Paribas Securities Corp. TriParty Joint Repurchase Agreement (maturing on 05/01/2008 in the amount of $573, collateralized by FNMA 5.50% — 6.50%, 2036 — 2038, value of $584) | | | | |
| | 573 | | | 2.00% dated 04/30/2008 | | | 573 | |
| | | | | Deutsche Bank Securities Joint Repurchase Agreement (maturing on 05/01/2008 in the amount of $1, collateralized by U. S. Treasury Note 3.63%, 2009, value of $1) | | | | |
| | 1 | | | 1.90% dated 04/30/2008 | | | 1 | |
| | | | | Deutsche Bank Securities TriParty Joint Repurchase Agreement (maturing on 05/01/2008 in the amount of $712, collateralized by FHLMC 4.50% — 7.00%, 2016 — 2038, value of $726) | | | | |
| | 712 | | | 2.00% dated 04/30/2008 | | | 712 | |
| | | | | JP Morgan Chase TriParty Joint Repurchase Agreement (maturing on 05/01/2008 in the amount of $686, collateralized by FNMA 4.50% — 7.00%, 2020 — 2038, value of $700) | | | | |
| | 686 | | | 1.96% dated 04/30/2008 | | | 686 | |
| | | | | RBS Greenwich Capital Markets Repurchase Agreement (maturing on 05/01/2008 in the amount of $308, collateralized by U. S. Treasury Note 4.50%, 2011, value of $316) | | | | |
| | 308 | | | 1.90% dated 04/30/2008 | | | 308 | |
| | | | | UBS Securities, Inc. Repurchase Agreement (maturing on 05/01/2008 in the amount of $448, collateralized by U.S. Treasury Bond 6.00% — 8.75%, 2020 — 2026, U.S. Treasury Note 4.75% — 13.25%, 2008 — 2016, value of $458) | | | | |
| | 448 | | | 1.90% dated 04/30/2008 | | | 448 | |
| | | | | | | | | |
| | | | | | | | | | | | 4,204 | |
| | | | | | | | | | | | | |
| | | | | | | | | | | | | |
| | | | | | | | | | | | | |
The accompanying notes are an integral part of these financial statements.
244
| | | | | | | | | | | | | |
Principal
| | | | | | | | Market
| |
| Amount | | | | | | | | Value (W) | |
| |
| | | | | | | | | | | | | |
| SHORT-TERM INVESTMENTS — (continued) |
| | | | | | | | | Market
| |
| Shares | | | | | | | | Value (W) | |
| |
| | | | | Securities Purchased with Proceeds from Security Lending — 41.4% |
| | | | | Cash Collateral Reinvestment Fund: |
| | 68,241 | | | Goldman Sachs FS Prime Obligation/Institutional Fund | | $ | 68,241 | |
| | 61,738 | | | Mellon GSL DBT II Collateral Fund (H) | | | 61,738 | |
| | | | | | | | | |
| | | | | | | | | | | | 129,979 | |
| | | | | | | | | | | | | |
| | | | | | | | | | | | | |
| | | | | | | | | | | | | |
Principal
| | | | | | | | | |
| Amount | | | | | | | | | |
| |
| | | | | U.S. Treasury Bills — 0.1% |
| $ | 375 | | | 1.43%, 06/12/2008 (M)(S) | | $ | 374 | |
| | | | | | | | | |
| | | | | Total short-term investments
(cost $134,557) | | $ | 134,557 | |
| | | | | | | | | |
| | | | | Total investments
(cost $446,824) (C) | | | 141.8 | % | | $ | 444,936 | |
| | | | | Other assets and liabilities | | | (41.8 | )% | | | (131,201 | ) |
| | | | | | | | | | | | | |
| | | | | Total net assets | | | 100.0 | % | | $ | 313,735 | |
| | | | | | | | | | | | | |
| |
| Note: | Percentage of investments as shown is the ratio of the total market value to total net assets. Market value of investments in foreign securities represents 1.13% of total net assets at April 30, 2008. |
| | |
| | Foreign securities that are principally traded on certain foreign markets are adjusted daily pursuant to a third party pricing service methodology approved by the Board of Directors in order to reflect an adjustment for factors occurring after the close of the foreign market but before the close of the New York Stock Exchange. |
| |
| (C) | | At April 30, 2008, the cost of securities for federal income tax purposes was $453,991 and the aggregate gross unrealized appreciation and depreciation based on that cost were: |
| | | | | |
| Unrealized Appreciation | | $ | 31,082 | |
| Unrealized Depreciation | | | (40,137 | ) |
| | | | | |
| Net Unrealized Depreciation | | $ | (9,055 | ) |
| | | | | |
| | |
| (D) | | Currently non-income producing. |
| |
| (G) | | Security is partially on loan at April 30, 2008. |
| |
| (M) | | The interest rate disclosed for these securities represents the effective yield on the date of acquisition. |
| |
| (H) | | The following securities are considered illiquid. Illiquid securities are often purchased in private placement transactions, are not registered under the Securities Act of 1933 and may have contractual restrictions on resale. A security may also be considered illiquid if the security lacks a readily available market or if its valuation has not changed for a certain period of time. Notwithstanding the foregoing, although the Mellon GLS DBT II Collateral Fund has been deemed illiquid for purposes of this report, the Mellon GLS DBT II Collateral Fund has redeemed shares daily in respect of recalled loaned securities. |
| | | | | | | | | | | |
Period
| | | | | | | | |
Acquired | | Shares/Par | | | Security | | Cost Basis | |
12/2007 –
04/2008 | | | 61,738 | | | Mellon GSL DBT II Collateral Fund | | $ | 61,738 | |
| | |
| | The aggregate value of these securities at April 30, 2008 was $61,738 which represents 19.68% of total net assets. |
| |
| (S) | | Security pledged as initial margin deposit for open futures contracts at April 30, 2008. |
| |
| | Futures Contracts Outstanding at April 30, 2008 |
| | | | | | | | | | | | | | | | | |
| | | | | | | | | | | | Unrealized
| |
| | | Number of
| | | | | | Expiration
| | | Appreciation/
| |
Description | | Contracts* | | | Position | | | Month | | | (Depreciation) | |
| |
| Russell Mini Futures | | | 18 | | | | Long | | | | Jun 2008 | | | $ | 39 | |
| | | | | | | | | | | | | | | | | |
| | |
| | * The number of contracts does not omit 000’s. |
| |
| (W) | | See Note 2b of accompanying Notes to Financial Statements regarding valuation of securities. |
The accompanying notes are an integral part of these financial statements.
245
The Hartford Stock Fund
Schedule of Investments
April 30, 2008 (Unaudited)
(000’s Omitted)
| | | | | | | | | | | | | |
| | | | | | | | | Market
| |
| Shares | | | | | | | | Value (W) | |
| COMMON STOCK — 98.9% |
| | | | | Basic Materials — 5.3% |
| | 32 | | | Agrium, Inc. | | $ | 2,516 | |
| | 273 | | | Alcoa, Inc. | | | 9,481 | |
| | 89 | | | ArcelorMittal | | | 7,938 | |
| | 192 | | | Cameco Corp. | | | 6,701 | |
| | 72 | | | Consol Energy, Inc. | | | 5,845 | |
| | 74 | | | Freeport-McMoRan Copper & Gold, Inc. | | | 8,429 | |
| | 26 | | | United States Steel Corp. | | | 4,003 | |
| | | | | | | | | |
| | | | | | | | | | | | 44,913 | |
| | | | | | | | | | | | | |
| | | | | Consumer Cyclical — 7.3% |
| | 2,495 | | | Buck Holdings L.P. (A)(D)(H) | | | 2,245 | |
| | 743 | | | Ford Motor Co. (D)(G) | | | 6,138 | |
| | 142 | | | Honda Motor Co., Ltd. | | | 4,516 | |
| | 338 | | | Kohl’s Corp. (D) | | | 16,506 | |
| | 416 | | | Lowe’s Co., Inc. | | | 10,467 | |
| | 226 | | | Safeway, Inc. | | | 7,129 | |
| | 184 | | | Supervalu, Inc. | | | 6,100 | |
| | 149 | | | Wal-Mart Stores, Inc. | | | 8,616 | |
| | | | | | | | | |
| | | | | | | | | | | | 61,717 | |
| | | | | | | | | | | | | |
| | | | | Consumer Staples — 3.5% |
| | 40 | | | Bunge Ltd. Finance Corp. | | | 4,563 | |
| | 1 | | | Japan Tobacco, Inc. | | | 5,140 | |
| | 146 | | | PepsiCo, Inc. | | | 10,005 | |
| | 146 | | | Procter & Gamble Co. | | | 9,756 | |
| | | | | | | | | |
| | | | | | | | | | | | 29,464 | |
| | | | | | | | | | | | | |
| | | | | Energy — 9.7% |
| | 180 | | | Chesapeake Energy Corp. | | | 9,306 | |
| | 101 | | | EnCana Corp. | | | 8,129 | |
| | 196 | | | Exxon Mobil Corp. | | | 18,270 | |
| | 209 | | | Halliburton Co. | | | 9,594 | |
| | 110 | | | Hess Corp. | | | 11,682 | |
| | 252 | | | OAO Gazprom Class S ADR | | | 13,388 | |
| | 117 | | | Schlumberger Ltd. | | | 11,734 | |
| | | | | | | | | |
| | | | | | | | | | | | 82,103 | |
| | | | | | | | | | | | | |
| | | | | Finance — 21.8% |
| | 178 | | | American International Group, Inc. | | | 8,245 | |
| | 574 | | | Bank of America Corp. | | | 21,541 | |
| | 289 | | | Capital One Financial Corp. (G) | | | 15,312 | |
| | 379 | | | Citigroup, Inc. | | | 9,577 | |
| | 544 | | | Discover Financial Services, Inc. | | | 9,903 | |
| | 217 | | | Federal Home Loan Mortgage Corp. | | | 5,408 | |
| | 311 | | | Federal National Mortgage Association | | | 8,798 | |
| | 90 | | | Goldman Sachs Group, Inc. | | | 17,204 | |
| | 108 | | | ING Groep N.V. ADR | | | 4,084 | |
| | 552 | | | Invesco Ltd. (G) | | | 14,147 | |
| | 64 | | | Julius Baer Holding Ltd. | | | 4,701 | |
| | 143 | | | Morgan Stanley | | | 6,935 | |
| | 159 | | | National City Corp. (G) | | | 1,002 | |
| | 636 | | | Sovereign Bancorp, Inc. (G) | | | 4,750 | |
| | 91 | | | State Street Corp. | | | 6,572 | |
| | 263 | | | UBS AG Rights (D)(H) | | | 445 | |
| | 263 | | | UBS AG (D) | | | 8,846 | |
| | 356 | | | UnitedHealth Group, Inc. | | | 11,626 | |
| | 208 | | | Wachovia Corp. | | | 6,063 | |
| | 633 | | | Washington Mutual, Inc. (G) | | | 7,775 | |
| | 73 | | | Wellpoint, Inc. (D) | | | 3,622 | |
| | 354 | | | Western Union Co. | | | 8,142 | |
| | | | | | | | | |
| | | | | | | | | | | | 184,698 | |
| | | | | | | | | | | | | |
| | | | | Health Care — 14.2% |
| | 100 | | | Astellas Pharma, Inc. | | | 4,125 | |
| | 90 | | | AstraZeneca plc | | | 3,768 | |
| | 147 | | | Daiichi Sankyo Co., Ltd. | | | 4,053 | |
| | 113 | | | Eisai Co., Ltd. (G) | | | 3,996 | |
| | 595 | | | Elan Corp. plc ADR (D) | | | 15,645 | |
| | 261 | | | Eli Lilly & Co. | | | 12,555 | |
| | 104 | | | Genentech, Inc. (D) | | | 7,120 | |
| | 237 | | | Medtronic, Inc. | | | 11,527 | |
| | 107 | | | Sanofi-Aventis S.A. ADR | | | 4,109 | |
| | 748 | | | Schering-Plough Corp. | | | 13,761 | |
| | 514 | | | Shionogi & Co., Ltd. | | | 9,927 | |
| | 95 | | | UCB S.A. (G) | | | 4,081 | |
| | 136 | | | Vertex Pharmaceuticals, Inc. (D)(G) | | | 3,466 | |
| | 183 | | | Walgreen Co. | | | 6,378 | |
| | 353 | | | Wyeth | | | 15,693 | |
| | | | | | | | | |
| | | | | | | | | | | | 120,204 | |
| | | | | | | | | | | | | |
| | | | | Services — 11.3% |
| | 131 | | | Accenture Ltd. Class A | | | 4,908 | |
| | 63 | | | Autodesk, Inc. (D) | | | 2,375 | |
| | 1,027 | | | Comcast Corp. Class A | | | 21,097 | |
| | 116 | | | FedEx Corp. | | | 11,073 | |
| | 156 | | | Monster Worldwide, Inc. (D) | | | 3,788 | |
| | 928 | | | Time Warner, Inc. | | | 13,784 | |
| | 211 | | | United Parcel Service, Inc. Class B | | | 15,242 | |
| | 177 | | | Viacom, Inc. Class B (D) | | | 6,802 | |
| | 273 | | | Waste Management, Inc. | | | 9,848 | |
| | 653 | | | XM Satellite Radio Holdings, Inc. Class A (D) | | | 7,275 | |
| | | | | | | | | |
| | | | | | | | | | | | 96,192 | |
| | | | | | | | | | | | | |
| | | | | Technology — 24.2% |
| | 651 | | | Applied Materials, Inc. | | | 12,138 | |
| | 101 | | | Canon, Inc. | | | 5,063 | |
| | 819 | | | Cisco Systems, Inc. (D) | | | 20,992 | |
| | 195 | | | Electronic Arts, Inc. (D) | | | 10,016 | |
| | 573 | | | Flextronics International Ltd. (D) | | | 5,958 | |
| | 1,174 | | | General Electric Co. | | | 38,383 | |
| | 19 | | | Google, Inc. (D) | | | 10,797 | |
| | 729 | | | Intel Corp. | | | 16,230 | |
| | 140 | | | Lam Research Corp. (D) | | | 5,734 | |
| | 41 | | | Lockheed Martin Corp. | | | 4,305 | |
| | 623 | | | Maxim Integrated Products, Inc. | | | 13,091 | |
| | 252 | | | Metropcs Communications, Inc. (D)(G) | | | 4,947 | |
| | 851 | | | Microsoft Corp. | | | 24,268 | |
| | 478 | | | NetApp, Inc. (D) | | | 11,570 | |
| | 271 | | | Nokia Corp. | | | 8,140 | |
| | 301 | | | Qualcomm, Inc. | | | 12,987 | |
| | | | | | | | | |
| | | | | | | | | | | | 204,619 | |
| | | | | | | | | | | | | |
| | | | | Transportation — 0.6% |
| | 612 | | | Delta Air Lines, Inc. (D)(G) | | | 5,208 | |
| | | | | Utilities — 1.0% |
| | 188 | | | Suntech Power Holdings Co., Ltd. ADR (D) | | | 8,387 | |
| | | | | | | | | |
| | | | | Total common stock
(cost $880,195) | | $ | 837,505 | |
| | | | | | | | | | | | | |
| | | | | | | | | | | | | |
The accompanying notes are an integral part of these financial statements.
246
| | | | | | | | | | | | | |
| | | | | | | | | Market
| |
| Shares | | | | | | | | Value (W) | |
| |
| PREFERRED STOCK — 1.0% |
| | | | | Finance — 1.0% |
| | — | | | Washington Mutual, Inc. with Warrants (D)(A)(H) | | $ | 8,470 | |
| | | | | | | | | |
| | | | | Total Preferred stock
(cost $6,700) | | $ | 8,470 | |
| | | | | | | | | |
| | | | | Total long-term investments
(cost $886,895) | | $ | 845,975 | |
| | | | | | | | | |
| | | | | | | | | | | | | |
| | | | | | | | | | | | | |
Principal
| | | | | | | | Market
| |
| Amount | | | | | | | | Value (W) | |
| |
| SHORT-TERM INVESTMENTS — 6.9% |
| | | | | Repurchase Agreements — 0.3% |
| | | | | Banc of America Securities TriParty Joint Repurchase Agreement (maturing on 05/01/2008 in the amount of $921, collateralized by FHLMC 5.00%, 2035, value of $940) | | | | |
| $ | 921 | | | 1.98% dated 04/30/2008 | | $ | 921 | |
| | | | | BNP Paribas Securities Corp. TriParty Joint Repurchase Agreement (maturing on 05/01/2008 in the amount of $452, collateralized by FNMA 5.50% — 6.50%, 2036 — 2038, value of $461) | | | | |
| | 452 | | | 2.00% dated 04/30/2008 | | | 452 | |
| | | | | Deutsche Bank Securities Joint Repurchase Agreement (maturing on 05/01/2008 in the amount of $1, collateralized by U. S. Treasury Note 3.63%, 2009, value of $1) | | | | |
| | 1 | | | 1.90% dated 04/30/2008 | | | 1 | |
| | | | | Deutsche Bank Securities TriParty Joint Repurchase Agreement (maturing on 05/01/2008 in the amount of $562, collateralized by FHLMC 4.50% — 7.00%, 2016 — 2038, value of $573) | | | | |
| | 562 | | | 2.00% dated 04/30/2008 | | | 562 | |
| | | | | JP Morgan Chase TriParty Joint Repurchase Agreement (maturing on 05/01/2008 in the amount of $541, collateralized by FNMA 4.50% — 7.00%, 2020 — 2038, value of $552) | | | | |
| | 541 | | | 1.96% dated 04/30/2008 | | | 541 | |
| | | | | | | | | |
| | | | | | | | | | | | 2,477 | |
| | | | | | | | | | | | | |
| | | | | | | | | | | | | |
| | | | | | | | | | | | | |
| Shares | | | | | | | | | |
| |
| | | | | Securities Purchased with Proceeds from Security Lending — 6.6% |
| | | | | Cash Collateral Reinvestment Fund: |
| | 55,962 | | | Navigator Prime Portfolio | | | 55,962 | |
| | | | | | | | | |
| | | | | Total short-term investments
(cost $58,439) | | $ | 58,439 | |
| | | | | | | | | |
| | | | | Total investments
(cost $945,334) (C) | | | 106.8 | % | | $ | 904,414 | |
| | | | | Other assets and liabilities | | | (6.8 | )% | | | (57,612 | ) |
| | | | | | | | | | | | | |
| | | | | Total net assets | | | 100.0 | % | | $ | 846,802 | |
| | | | | | | | | | | | | |
| |
| Note: | Percentage of investments as shown is the ratio of the total market value to total net assets. Market value of investments in foreign securities represents 16.26% of total net assets at April 30, 2008. |
| | |
| (C) | | At April 30, 2008, the cost of securities for federal income tax purposes was $956,613 and the aggregate gross unrealized appreciation and depreciation based on that cost were: |
| | | | | |
| Unrealized Appreciation | | $ | 40,831 | |
| Unrealized Depreciation | | | (93,030 | ) |
| | | | | |
| Net Unrealized Depreciation | | $ | (52,199 | ) |
| | | | | |
| | |
| (A) | | The aggregate value of securities valued in good faith at fair value as determined under policies and procedures established by and under the supervision of the Funds’ Board of Directors at April 30, 2008, was $10,715, which represents 1.27% of total net assets. This calculation excludes securities that are principally traded on certain foreign markets and whose prices were adjusted solely pursuant to a third party pricing service methodology approved by the Board of Directors. |
| |
| (D) | | Currently non-income producing. |
| |
| (G) | | Security is partially on loan at April 30, 2008. |
| |
| (H) | | The following securities are considered illiquid. Illiquid securities are often purchased in private placement transactions, are not registered under the Securities Act of 1933 and may have contractual restrictions on resale. A security may also be considered illiquid if the security lacks a readily available market or if its valuation has not changed for a certain period of time. |
| | | | | | | | | | | |
Period
| | | | | | | | |
Acquired | | Shares/Par | | | Security | | Cost Basis | |
| 06/2007 | | | 2,495 | | | Buck Holdings L.P. | | $ | 2,497 | |
| 10/2006 – 03/2008 | | | 263 | | | UBS AG Rights | | | — | |
| 04/2008 | | | — | | | Washington Mutual, Inc. with Warrants | | | 6,700 | |
| | |
| | The aggregate value of these securities at April 30, 2008 was $11,160 which represents 1.32% of total net assets. |
Forward Foreign Currency Contracts Outstanding at April 30, 2008
| | | | | | | | | | | | | | | | | |
| | | | | | | | | | | | Unrealized
| |
| | | Market
| | | Contract
| | | Delivery
| | | Appreciation/
| |
Description | | Value (W) | | | Amount | | | Date | | | (Depreciation) | |
| |
| Euro (Sell) | | $ | 52,589 | | | $ | 50,593 | | | | 06/03/08 | | | $ | (1,996 | ) |
| | | | | | | | | | | | | | | | | |
| | |
| (W) | | See Note 2b of accompanying Notes to Financial Statements regarding valuation of securities. |
The accompanying notes are an integral part of these financial statements.
247
The Hartford Strategic Income Fund
Schedule of Investments
April 30, 2008 (Unaudited)
(000’s Omitted)
| | | | | | | | | | | | | |
Principal
| | | | | | | | Market
| |
| Amount | | | | | | | | Value (W) | |
| |
| ASSET & COMMERCIAL MORTGAGE BACKED SECURITIES — 9.2% |
| | | | | Finance — 9.2% |
| | | | | Banc of America Commercial Mortgage, Inc. | | | | |
| $ | 2,000 | | | 5.45%, 01/15/2049 | | $ | 1,943 | |
| | | | | Bank of America Credit Card Trust | | | | |
| | 500 | | | 5.17%, 06/15/2019 | | | 473 | |
| | | | | Bayview Commercial Asset Trust | | | | |
| | 1,280 | | | 7.50%, 09/25/2037 (H)(N) | | | 162 | |
| | | | | Bayview Financial Acquisition Trust | | | | |
| | 250 | | | 8.05%, 08/28/2047 (H) | | | 180 | |
| | | | | Bear Stearns Commercial Mortgage Securities, Inc. | | | | |
| | 600 | | | 5.90%, 06/11/2040 (I)(L) | | | 433 | |
| | | | | CBA Commercial Small Balance Commercial Mortgage | | | | |
| �� | 4,900 | | | 7.25%, 07/25/2039 (H)(N) | | | 471 | |
| | | | | Citigroup/Deutsche Bank Commercial Mortgage Trust | | | | |
| | 375 | | | 5.32%, 12/11/2049 | | | 362 | |
| | | | | Cobalt CMBS Commercial Funding Corp. | | | | |
| | 375 | | | 5.25%, 08/15/2048 | | | 338 | |
| | | | | Commercial Mortgage Pass-Through Certificates | | | | |
| | 500 | | | 5.31%, 12/10/2046 | | | 485 | |
| | 600 | | | 5.99%, 06/10/2046 (L) | | | 568 | |
| | | | | Credit-Based Asset Servicing and Securitization | | | | |
| | 93 | | | 3.17%, 05/25/2036 (H)(L) | | | 73 | |
| | | | | CW Capital Cobalt | | | | |
| | 550 | | | 5.48%, 04/15/2047 | | | 534 | |
| | | | | GMAC Commercial Mortgage Securities, Inc. | | | | |
| | 930 | | | 4.86%, 12/10/2041 | | | 911 | |
| | | | | GMAC Mortgage Corp. Loan Trust | | | | |
| | 555 | | | 6.05%, 12/25/2037 (L) | | | 329 | |
| | | | | Goldman Sachs Mortgage Securities Corp. II | | | | |
| | 500 | | | 5.99%, 08/10/2045 (L) | | | 361 | |
| | | | | Greenwich Capital Commercial Funding Corp. | | | | |
| | 300 | | | 3.94%, 11/05/2021 (H)(L) | | | 261 | |
| | 325 | | | 4.14%, 11/05/2021 (H)(L) | | | 280 | |
| | 375 | | | 5.44%, 03/10/2039 (L) | | | 365 | |
| | 1,000 | | | 5.74%, 12/10/2049 (L) | | | 988 | |
| | | | | GS Mortgage Securities Corp. II | | | | |
| | 1,000 | | | 5.99%, 08/10/2045 (L) | | | 998 | |
| | | | | Honda Automotive Receivables Owner Trust | | | | |
| | 450 | | | 5.28%, 01/23/2012 | | | 457 | |
| | | | | IMPAC Commercial Mortgage Backed Trust | | | | |
| | 315 | | | 4.39%, 02/25/2036 (L) | | | 177 | |
| | | | | JP Morgan Chase Commercial Mortgage Security Corp. | | | | |
| | 339 | | | 4.16%, 01/12/2039 (I) | | | 323 | |
| | 920 | | | 5.72%, 02/15/2051 | | | 902 | |
| | 1,125 | | | 5.75%, 02/12/2049 (L) | | | 1,117 | |
| | 1,090 | | | 6.07%, 02/12/2051 (Q) | | | 1,095 | |
| | 105 | | | 6.20%, 02/12/2051 (I)(L) | | | 81 | |
| | 500 | | | 6.26%, 02/15/2051 (L) | | | 379 | |
| | | | | Lehman Brothers Small Balance Commercial | | | | |
| | 851 | | | 5.91%, 06/25/2037 (I) | | | 832 | |
| | | | | MBNA Credit Card Master Note Trust | | | | |
| | 300 | | | 6.80%, 07/15/2014 | | | 272 | |
| | | | | Merrill Lynch Mortgage Trust | | | | |
| | 600 | | | 5.42%, 11/12/2037 (L) | | | 514 | |
| | | | | Morgan Stanley Capital I | | | | |
| | 300 | | | 5.69%, 04/15/2049 (L) | | | 295 | |
| | 500 | | | 5.88%, 04/15/2049 (L) | | | 461 | |
| | 600 | | | 5.91%, 04/15/2049 (I)(L) | | | 433 | |
| | | | | Morgan Stanley Dean Witter Capital I | | | | |
| | 900 | | | 5.36%, 03/15/2044 | | | 869 | |
| | | | | Renaissance Home Equity Loan Trust, Class M5 | | | | |
| | 100 | | | 7.00%, 09/25/2037 (H) | | | 24 | |
| | | | | Renaissance Home Equity Loan Trust, Class M8 | | | | |
| | 125 | | | 7.00%, 09/25/2037 (H) | | | 21 | |
| | | | | USAA Automotive Owner Trust | | | | |
| | 500 | | | 4.63%, 05/15/2012 | | | 503 | |
| | | | | Wachovia Bank Commercial Mortgage Trust | | | | |
| | 500 | | | 5.87%, 07/15/2045 (L) | | | 389 | |
| | 930 | | | 5.93%, 06/15/2049 (L) | | | 922 | |
| | 142,974 | | | 10.00%, 02/15/2051 (H)(N) | | | 222 | |
| | | | | Wells Fargo Alternative Loan Trust | | | | |
| | 634 | | | 6.25%, 11/25/2037 | | | 554 | |
| | | | | | | | | |
| | | | | Total asset & commercial
mortgage backed securities
(cost $22,661) | | $ | 21,357 | |
| | | | | | | | | | | | | |
| | | | | | | | | | | | | |
| CORPORATE BONDS: INVESTMENT GRADE — 26.3% |
| | | | | Capital Goods — 0.5% |
| | | | | Xerox Corp. | | | | |
| $ | 1,135 | | | 6.35%, 05/15/2018 | | $ | 1,141 | |
| | | | | Consumer Staples — 0.3% |
| | | | | Dr. Pepper Snapple Group | | | | |
| | 730 | | | 6.82%, 05/01/2018 (I) | | | 757 | |
| | | | | Energy — 1.3% |
| | | | | Gaz Capital S.A. | | | | |
| | 800 | | | 7.34%, 04/11/2013 (I) | | | 837 | |
| | | | | Lukoil International Finance B.V. | | | | |
| | 1,050 | | | 6.66%, 06/07/2022 (K) | | | 930 | |
| | | | | TNK-BP Finance S.A. | | | | |
| | 100 | | | 6.63%, 03/20/2017 (K) | | | 91 | |
| | 1,100 | | | 7.50%, 03/13/2013 — 07/18/2016 (I) | | | 1,093 | |
| | | | | | | | | |
| | | | | | | | | | | | 2,951 | |
| | | | | | | | | | | | | |
| | | | | Finance — 18.0% |
| | | | | American Real Estate Partners L.P. | | | | |
| | 775 | | | 7.13%, 02/15/2013 | | | 723 | |
| | | | | Ameriprise Financial, Inc. | | | | |
| | 1,225 | | | 7.52%, 06/01/2066 | | | 1,131 | |
| | | | | Bank of America Corp. | | | | |
| | 1,250 | | | 8.00%, 12/29/2049 (L)# | | | 1,272 | |
| | | | | Barclays Bank plc | | | | |
| | 740 | | | 7.70%, 10/25/2049 (I)(L) | | | 766 | |
| | | | | CIT Group, Inc. | | | | |
| | 750 | | | 6.10%, 03/15/2067 (L) | | | 392 | |
| | | | | Citigroup, Inc. | | | | |
| | 974 | | | 8.30%, 12/21/2057 (L)# | | | 994 | |
| | 1,114 | | | 8.40%, 12/31/2049 (L) | | | 1,127 | |
| | | | | Comerica Capital Trust II | | | | |
| | 300 | | | 6.58%, 02/20/2037 (L)# | | | 205 | |
The accompanying notes are an integral part of these financial statements.
248
| | | | | | | | | | | | | |
Principal
| | | | | | | | Market
| |
| Amount (B) | | | | | | | | Value (W) | |
| |
| | | | | | | | | | | | | |
| CORPORATE BONDS: INVESTMENT GRADE — (continued) |
| | | | | | | | | | | | | |
| | | | | Finance — (continued) |
| | | | | Countrywide Financial Corp. | | | | |
| $ | 842 | | | 6.25%, 05/15/2016 | | $ | 741 | |
| | | | | Countrywide Home Loans, Inc. | | | | |
| | 158 | | | 4.00%, 03/22/2011 | | | 145 | |
| | 1,685 | | | 4.13%, 09/15/2009 | | | 1,574 | |
| | | | | Fifth Third Bankcorp | | | | |
| | 1,400 | | | 8.25%, 03/01/2038 | | | 1,479 | |
| | | | | General Electric Capital Corp. | | | | |
| | 2,300 | | | 5.88%, 01/14/2038 | | | 2,193 | |
| | | | | Goldman Sachs Capital Trust II | | | | |
| | 1,500 | | | 5.79%, 12/29/2049 (L) | | | 1,131 | |
| | | | | HSBK Europe B.V. | | | | |
| | 100 | | | 7.25%, 05/03/2017 (I) | | | 87 | |
| | 650 | | | 7.25%, 05/03/2017 (K) | | | 575 | |
| | | | | International Lease Finance Corp. | | | | |
| | 1,500 | | | 6.38%, 03/25/2013 | | | 1,520 | |
| | | | | JP Morgan Chase & Co. | | | | |
| | 2,993 | | | 7.90%, 12/01/2049 | | | 3,049 | |
| | | | | Kreditanstalt fuer Wiederaufbau | | | | |
| ISK | 18,700 | | | 11.75%, 08/08/2008 | | | 248 | |
| | | | | Kreditanstalt fuer Wiederaufbau International Finance | | | | |
| ISK | 53,600 | | | 10.00%, 10/27/2008 | | | 718 | |
| | | | | Kuzneski (Bank of Moscow) | | | | |
| | 700 | | | 7.50%, 11/25/2015 (L) | | | 693 | |
| | | | | Lehman Brothers Holdings, Inc. | | | | |
| | 1,230 | | | 7.00%, 09/27/2027 | | | 1,205 | |
| | | | | Morgan Stanley | | | | |
| BRL | 1,400 | | | 10.09%, 05/03/2017 (I) | | | 691 | |
| | | | | National City Corp. | | | | |
| | 1,470 | | | 12.00%, 12/29/2049 | | | 1,450 | |
| | | | | New South Wales Treasury Corp. | | | | |
| AUD | 6,935 | | | 7.00%, 12/01/2010 | | | 6,535 | |
| | | | | Progressive Corp. | | | | |
| | 1,000 | | | 6.70%, 06/15/2037 (L) | | | 894 | |
| | | | | RBS Capital Trust IV | | | | |
| | 2,050 | | | 3.50%, 09/29/2049 (L) | | | 1,589 | |
| | | | | RSHB Capital | | | | |
| | 275 | | | 6.30%, 05/15/2017 (K) | | | 258 | |
| | 800 | | | 6.97%, 09/21/2016 (L) | | | 776 | |
| | | | | SB Capital S.A. | | | | |
| | 800 | | | 6.48%, 05/15/2013 | | | 814 | |
| | | | | State Street Capital Trust III | | | | |
| | 1,235 | | | 8.25%, 12/29/2049 (L) | | | 1,261 | |
| | | | | Transcapitalinves Ltd. | | | | |
| | 1,000 | | | 5.67%, 03/05/2014 (I)# | | | 949 | |
| | | | | UBS Preferred Funding Trust I | | | | |
| | 500 | | | 8.62%, 10/29/2049 | | | 503 | |
| | | | | Unicredito Italiano Capital Trust | | | | |
| | 450 | | | 9.20%, 10/29/2049 (I) | | | 459 | |
| | | | | Wachovia Capital Trust III | | | | |
| | 1,000 | | | 5.80%, 08/29/2049 | | | 795 | |
| | | | | Wachovia Corp. | | | | |
| | 1,031 | | | 7.98%, 02/28/2049 (L) | | | 1,014 | |
| | | | | Washington Mutual, Inc. | | | | |
| | 2,000 | | | 5.50%, 08/24/2011 | | | 1,831 | |
| | | | | | | | | |
| | | | | | | | | | | | 41,787 | |
| | | | | | | | | | | | | |
| | | | | Foreign Governments — 3.1% |
| | | | | El Salvador (Republic of) | | | | |
| | 615 | | | 7.65%, 06/15/2035 (K) | | | 658 | |
| | | | | New Zealand Government | | | | |
| NZD | 3,760 | | | 6.00%, 07/15/2008 | | | 2,928 | |
| | | | | Norwegian Government | | | | |
| NOK | 17,995 | | | 5.50%, 05/15/2009 # | | | 3,541 | |
| | | | | | | | | |
| | | | | | | | | | | | 7,127 | |
| | | | | | | | | | | | | |
| | | | | Health Care — 0.6% |
| | | | | CVS Caremark Corp. | | | | |
| | 1,500 | | | 6.30%, 06/01/2037 (L) | | | 1,283 | |
| | | | | Services — 0.7% |
| | | | | Clear Channel Communications, Inc. | | | | |
| | 400 | | | 7.65%, 09/15/2010 | | | 416 | |
| | | | | Waste Management, Inc. | | | | |
| | 1,200 | | | 6.10%, 03/15/2018 | | | 1,203 | |
| | | | | | | | | |
| | | | | | | | | | | | 1,619 | |
| | | | | | | | | | | | | |
| | | | | Technology — 1.3% |
| | | | | Sprint Capital Corp. | | | | |
| | 1,400 | | | 7.63%, 01/30/2011 | | | 1,326 | |
| | 370 | | | 8.75%, 03/15/2032 | | | 327 | |
| | | | | Telecom Italia Capital | | | | |
| | 1,500 | | | 5.25%, 11/15/2013 | | | 1,438 | |
| | | | | | | | | |
| | | | | | | | | | | | 3,091 | |
| | | | | | | | | | | | | |
| | | | | Utilities — 0.5% |
| | | | | AES El Savador Trust | | | | |
| | 700 | | | 6.75%, 02/01/2016 (H) | | | 649 | |
| | | | | Taqa Abu Dhabi National Energy Co. | | | | |
| | 500 | | | 5.62%, 10/25/2012 (I) | | | 508 | |
| | | | | | | | | |
| | | | | | | | | | | | 1,157 | |
| | | | | | | | | | | | | |
| | | | | Total corporate bonds: investment grade
(cost $60,530) | | $ | 60,913 | |
| | | | | | | | | | | | | |
| | | | | | | | | | | | | |
| CORPORATE BONDS: NON-INVESTMENT GRADE — 31.9% |
| | | | | Basic Materials — 1.6% |
| | | | | Berry Plastics Holding Co. | | | | |
| | 250 | | | 6.68%, 09/15/2014 (L) | | $ | 212 | |
| | | | | Evraz Group S.A. | | | | |
| | 400 | | | 8.25%, 11/10/2015 (K) | | | 391 | |
| | 400 | | | 8.88%, 04/24/2013 (I) | | | 405 | |
| | | | | Goodyear Tire & Rubber Co. | | | | |
| | 570 | | | 8.66%, 12/01/2009 (L) | | | 571 | |
| | | | | Huntsman International LLC | | | | |
| | 100 | | | 7.88%, 11/15/2014 | | | 105 | |
| | | | | MacDermid, Inc. | | | | |
| | 350 | | | 9.50%, 04/15/2017 (I)# | | | 334 | |
| | | | | Momentive Performance | | | | |
| | 260 | | | 9.75%, 12/01/2014 | | | 252 | |
| | | | | New Page Corp. | | | | |
| | 500 | | | 10.00%, 05/01/2012 (I) | | | 534 | |
| | | | | RBS Global & Rexnord Corp. | | | | |
| | 150 | | | 11.75%, 08/01/2016 # | | | 144 | |
| | | | | Steel Dynamics, Inc. | | | | |
| | 200 | | | 7.38%, 11/01/2012 (I) | | | 204 | |
| | | | | Vitro S.A. | | | | |
| | 745 | | | 8.63%, 02/01/2012 | | | 693 | |
| | | | | | | | | |
| | | | | | | | | | | | 3,845 | |
| | | | | | | | | | | | | |
The accompanying notes are an integral part of these financial statements.
249
The Hartford Strategic Income Fund
Schedule of Investments — (continued)
April 30, 2008 (Unaudited)
(000’s Omitted)
| | | | | | | | | | | | | |
Principal
| | | | | | | | Market
| |
| Amount (B) | | | | | | | | Value (W) | |
| |
| | | | | | | | | | | | | |
| CORPORATE BONDS: NON-INVESTMENT GRADE — (continued) |
| | | | | Capital Goods — 0.1% |
| | | | | SPX Corp. | | | | |
| $ | 275 | | | 7.63%, 12/15/2014 (I) | | $ | 287 | |
| | | | | Consumer Cyclical — 4.5% |
| | | | | American Axle & Manufacturing Holdings, Inc. | | | | |
| | 1,160 | | | 7.88%, 03/01/2017 | | | 1,038 | |
| | | | | Aramark Corp. | | | | |
| | 940 | | | 5.00%, 06/01/2012 | | | 846 | |
| | | | | AutoNation, Inc. | | | | |
| | 370 | | | 4.71%, 04/15/2013 (L) | | | 320 | |
| | | | | China Properties Group Ltd. | | | | |
| | 200 | | | 9.13%, 05/04/2014 (H) | | | 140 | |
| | | | | D.R. Horton, Inc. | | | | |
| | 945 | | | 4.88%, 01/15/2010 | | | 898 | |
| | | | | Desarrolladora Homes S.A. | | | | |
| | 700 | | | 7.50%, 09/28/2015 (H) | | | 705 | |
| | | | | Dollarama Group L.P. | | | | |
| | 450 | | | 8.88%, 08/15/2012 | | | 423 | |
| | | | | ESCO Corp. | | | | |
| | 300 | | | 8.63%, 12/15/2013 (I) | | | 298 | |
| | | | | General Motors Corp. | | | | |
| | 1,150 | | | 7.20%, 01/15/2011 | | | 1,018 | |
| | | | | Ingles Markets, Inc. | | | | |
| | 400 | | | 8.88%, 12/01/2011 | | | 406 | |
| | | | | KB Home & Broad Home Corp. | | | | |
| | 450 | | | 6.38%, 08/15/2011 | | | 427 | |
| | | | | Neiman Marcus Group, Inc. | | | | |
| | 500 | | | 10.38%, 10/15/2015 | | | 525 | |
| | | | | Parkson Retail Group Ltd. | | | | |
| | 700 | | | 7.88%, 11/14/2011 (H) | | | 693 | |
| | | | | Pulte Homes, Inc. | | | | |
| | 600 | | | 7.88%, 08/01/2011 | | | 585 | |
| | | | | Supervalu, Inc. | | | | |
| | 700 | | | 7.50%, 11/15/2014 | | | 725 | |
| | | | | TRW Automotive, Inc. | | | | |
| | 450 | | | 7.25%, 03/15/2017 (I)# | | | 438 | |
| | | | | Urbi Desarrollos Urbanos | | | | |
| | 890 | | | 8.50%, 04/19/2016 (H) | | | 903 | |
| | | | | | | | | |
| | | | | | | | | | | | 10,388 | |
| | | | | | | | | | | | | |
| | | | | Consumer Staples — 0.8% |
| | | | | Constellation Brands, Inc. | | | | |
| | 615 | | | 8.38%, 12/15/2014 | | | 652 | |
| | | | | Dole Food Co., Inc. | | | | |
| | 500 | | | 8.63%, 05/01/2009 | | | 484 | |
| | | | | MHP S.A. | | | | |
| | 800 | | | 10.25%, 11/30/2011 (H) | | | 784 | |
| | | | | | | | | |
| | | | | | | | | | | | 1,920 | |
| | | | | | | | | | | | | |
| | | | | Energy — 2.2% |
| | | | | Chesapeake Energy Corp. | | | | |
| | 775 | | | 7.63%, 07/15/2013 | | | 812 | |
| | | | | Encore Acquisition Co. | | | | |
| | 200 | | | 7.25%, 12/01/2017 | | | 194 | |
| | | | | Hilcorp Energy I L.P./Finance Co. | | | | |
| | 400 | | | 7.75%, 11/01/2015 (I) | | | 394 | |
| | | | | Inergy L.P. | | | | |
| | 550 | | | 8.25%, 03/01/2016 (I) | | | 564 | |
| | | | | Key Energy Services, Inc. | | | | |
| | 640 | | | 8.38%, 12/01/2014 (I) | | | 662 | |
| | | | | MEI Euro Finance Ltd. | | | | |
| | 612 | | | 8.75%, 05/22/2010 (H) | | | 608 | |
| | | | | Petrohawk Energy Corp. | | | | |
| | 620 | | | 9.13%, 07/15/2013 | | | 656 | |
| | | | | Petroleos de Venezuela S.A. | | | | |
| | 1,700 | | | 5.25%, 04/12/2017 | | | 1,122 | |
| | | | | | | | | |
| | | | | | | | | | | | 5,012 | |
| | | | | | | | | | | | | |
| | | | | Finance — 4.9% |
| | | | | Alfa Bank | | | | |
| | 200 | | | 8.20%, 06/25/2012 (I)# | | | 191 | |
| | | | | Citigroup (JSC Severstal) | | | | |
| | 710 | | | 9.25%, 04/19/2014 (K)# | | | 757 | |
| | | | | Dow Jones CDX HY | | | | |
| | 1,955 | | | 7.63%, 06/29/2012 (I)# | | | 1,894 | |
| | 545 | | | 8.75%, 12/29/2012 (I) | | | 532 | |
| | | | | Ford Motor Credit Co. | | | | |
| | 650 | | | 5.46%, 01/13/2012 (L) | | | 547 | |
| | 750 | | | 5.80%, 01/12/2009 | | | 733 | |
| | 600 | | | 7.16%, 04/15/2012 (L) | | | 588 | |
| | | | | General Motors Acceptance Corp. | | | | |
| | 1,050 | | | 5.63%, 05/15/2009 | | | 987 | |
| | 1,710 | | | 6.88%, 09/15/2011 # | | | 1,425 | |
| | | | | Itabo Finance S.A. | | | | |
| | 500 | | | 10.88%, 10/05/2013 (H) | | | 489 | |
| | | | | Kazkommerts International B.V. | | | | |
| | 800 | | | 8.00%, 11/03/2015 (I) | | | 640 | |
| | | | | LPL Holdings, Inc. | | | | |
| | 870 | | | 10.75%, 12/15/2015 (H) | | | 853 | |
| | | | | Northern Rock plc | | | | |
| | 205 | | | 5.60%, 04/30/2049 (I) | | | 120 | |
| | | | | RBS-Zero Hora Editora Journalistica | | | | |
| BRL | 700 | | | 11.25%, 06/15/2017 (H) | | | 333 | |
| | | | | Residential Capital Corp. | | �� | | |
| | 360 | | | 8.38%, 06/30/2010 (L) | | | 195 | |
| | | | | Rouse Co. | | | | |
| | 500 | | | 3.63%, 03/15/2009 | | | 475 | |
| | | | | Russian Standard Bank | | | | |
| | 200 | | | 8.63%, 05/05/2011 (K)# | | | 184 | |
| | | | | Standard Bank (Privatbank) | | | | |
| | 200 | | | 8.75%, 02/09/2016 (H) | | | 180 | |
| | | | | UK SPV Credit Finance (Privatbank) | | | | |
| | 200 | | | 8.00%, 02/06/2012 (H) | | | 183 | |
| | | | | | | | | |
| | | | | | | | | | | | 11,306 | |
| | | | | | | | | | | | | |
| | | | | Foreign Governments — 0.7% |
| | | | | Brazil (Republic of) | | | | |
| BRL | 1,200 | | | 10.00%, 01/01/2017 | | | 588 | |
| | | | | Sri Lanka (Republic of) | | | | |
| | 800 | | | 8.25%, 10/24/2012 (H) | | | 732 | |
| | | | | Sri Lanka (Republic of) ADR | | | | |
| | 400 | | | 8.25%, 10/24/2012 (H) | | | 364 | |
| | | | | | | | | |
| | | | | | | | | | | | 1,684 | |
| | | | | | | | | | | | | |
| | | | | Health Care — 2.1% |
| | | | | HCA, Inc. | | | | |
| | 500 | | | 7.88%, 02/01/2011 | | | 506 | |
| | 1,650 | | | 9.25%, 11/15/2016 | | | 1,774 | |
| | | | | IASIS Healthcare Capital Corp. | | | | |
| | 700 | | | 8.75%, 06/15/2014 # | | | 717 | |
The accompanying notes are an integral part of these financial statements.
250
| | | | | | | | | | | | | |
Principal
| | | | | | | | Market
| |
| Amount | | | | | | | | Value (W) | |
| |
| | | | | | | | | | | | | |
| CORPORATE BONDS: NON-INVESTMENT GRADE — (continued) |
| | | | | | | | | | | | | |
| | | | | Health Care — (continued) |
| | | | | Invacare Corp. | | | | |
| $ | 100 | | | 9.75%, 02/15/2015 # | | $ | 100 | |
| | | | | Psychiatric Solutions, Inc. | | | | |
| | 260 | | | 7.75%, 07/15/2015 | | | 266 | |
| | | | | Reable Therapeutics Finance LLC | | | | |
| | 245 | | | 11.75%, 11/15/2014 | | | 226 | |
| | | | | Rite Aid Corp. | | | | |
| | 950 | | | 7.50%, 03/01/2017 | | | 881 | |
| | | | | Warner Chilcott Corp. | | | | |
| | 300 | | | 8.75%, 02/01/2015 | | | 305 | |
| | | | | | | | | |
| | | | | | | | | | | | 4,775 | |
| | | | | | | | | | | | | |
| | | | | Services — 4.4% |
| | | | | Affinion Group, Inc. | | | | |
| | 500 | | | 11.50%, 10/15/2015 # | | | 491 | |
| | | | | Allied Waste North America, Inc. | | | | |
| | 500 | | | 5.75%, 02/15/2011 | | | 495 | |
| | 500 | | | 7.13%, 05/15/2016 | | | 504 | |
| | | | | AMC Entertainment, Inc. | | | | |
| | 500 | | | 11.00%, 02/01/2016 # | | | 497 | |
| | | | | Dex Media West LLC, Inc. | | | | |
| | 605 | | | 9.88%, 08/15/2013 # | | | 570 | |
| | | | | Echostar DBS Corp. | | | | |
| | 150 | | | 6.38%, 10/01/2011 | | | 149 | |
| | 150 | | | 6.63%, 10/01/2014 | | | 147 | |
| | 400 | | | 7.13%, 02/01/2016 | | | 393 | |
| | | | | FireKeepers Development Authority | | | | |
| | 280 | | | 13.88%, 05/01/2015 (I)(Q) | | | 284 | |
| | | | | Harland Clarke Holdings | | | | |
| | 455 | | | 9.50%, 05/15/2015 # | | | 367 | |
| | | | | Harrah’s Operating Co., Inc. | | | | |
| | 2,345 | | | 10.75%, 02/01/2016 — 02/01/2018 (I) | | | 2,006 | |
| | | | | Idearc, Inc. | | | | |
| | 865 | | | 8.00%, 11/15/2016 # | | | 562 | |
| | | | | MGM Mirage, Inc. | | | | |
| | 1,175 | | | 6.75%, 09/01/2012 — 04/01/2013 | | | 1,086 | |
| | 450 | | | 7.50%, 06/01/2016 # | | | 407 | |
| | | | | Pinnacle Entertainment, Inc. | | | | |
| | 380 | | | 8.75%, 10/01/2013 | | | 386 | |
| | | | | Sirius Satellite Radio, Inc. | | | | |
| | 200 | | | 9.63%, 08/01/2013 # | | | 168 | |
| | | | | SunGard Data Systems, Inc. | | | | |
| | 1,000 | | | 10.25%, 08/15/2015 # | | | 1,062 | |
| | | | | TL Acquisitions, Inc. | | | | |
| | 485 | | | 10.50%, 01/15/2015 (I)# | | | 439 | |
| | | | | Videotron Ltd. | | | | |
| | 70 | | | 9.13%, 04/15/2018 (I) | | | 75 | |
| | | | | XM Satellite Radio, Inc. | | | | |
| | 200 | | | 9.75%, 05/01/2014 | | | 193 | |
| | | | | | | | | |
| | | | | | | | | | | | 10,281 | |
| | | | | | | | | | | | | |
| | | | | Technology — 6.0% |
| | | | | Advanced Micro Devices, Inc. | | | | |
| | 250 | | | 5.75%, 08/15/2012 (X) | | | 182 | |
| | | | | Bio-Rad Laboratories, Inc. | | | | |
| | 300 | | | 7.50%, 08/15/2013 | | | 301 | |
| | | | | Canwest MediaWorks L.P. | | | | |
| | 535 | | | 9.25%, 08/01/2015 (I) | | | 488 | |
| | | | | CCH I Holdings LLC | | | | |
| | 300 | | | 9.92%, 04/01/2014 | | | 153 | |
| | | | | Charter Communications Operating LLC | | | | |
| | 500 | | | 8.00%, 04/30/2012 (I) | | | 482 | |
| | 925 | | | 10.88%, 09/15/2014 (I) | | | 978 | |
| | | | | Cincinnati Bell, Inc. | | | | |
| | 105 | | | 7.25%, 07/15/2013 | | | 106 | |
| | | | | CSC Holdings, Inc. | | | | |
| | 750 | | | 7.63%, 04/01/2011 | | | 756 | |
| | 610 | | | 8.13%, 08/15/2009 | | | 622 | |
| | | | | Freescale Semiconductor, Inc. | | | | |
| | 850 | | | 9.13%, 12/15/2014 | | | 699 | |
| | | | | Intelsat Bermuda Ltd. | | | | |
| | 370 | | | 11.25%, 06/15/2016 # | | | 375 | |
| | | | | Leap Wireless International, Inc. | | | | |
| | 145 | | | 9.38%, 11/01/2014 | | | 142 | |
| | | | | Level 3 Financing, Inc. | | | | |
| | 600 | | | 9.25%, 11/01/2014 # | | | 546 | |
| | | | | Maxcom Telecomunicaciones | | | | |
| | 700 | | | 11.00%, 12/15/2014 | | | 732 | |
| | | | | Mediacom LLC | | | | |
| | 1,000 | | | 7.88%, 02/15/2011 | | | 945 | |
| | | | | MetroPCS Wireless, Inc. | | | | |
| | 500 | | | 9.25%, 11/01/2014 | | | 491 | |
| | | | | Mobile Telesystems Finance S.A. | | | | |
| | 770 | | | 8.00%, 01/28/2012 (K) | | | 787 | |
| | | | | Nortel Networks Ltd. | | | | |
| | 900 | | | 10.75%, 07/15/2016 | | | 891 | |
| | | | | NXP B.V./NXP Funding LLC | | | | |
| | 350 | | | 5.46%, 10/15/2013 (L) | | | 322 | |
| | | | | Qwest Communications International, Inc. | | | | |
| | 1,000 | | | 7.50%, 02/15/2014 # | | | 983 | |
| | | | | Sanmina-Sci Corp. | | | | |
| | 930 | | | 5.55%, 06/15/2014 (I)(L) | | | 858 | |
| | | | | Spansion LLC | | | | |
| | 320 | | | 6.20%, 06/01/2013 (I)(L) | | | 240 | |
| | | | | Vimpelcom | | | | |
| | 800 | | | 8.38%, 04/30/2013 (I) | | | 800 | |
| | | | | Windstream Corp. | | | | |
| | 1,000 | | | 8.63%, 08/01/2016 | | | 1,048 | |
| | | | | | | | | |
| | | | | | | | | | | | 13,927 | |
| | | | | | | | | | | | | |
| | | | | Transportation — 0.8% |
| | | | | Bristow Group, Inc. | | | | |
| | 110 | | | 7.50%, 09/15/2017 | | | 114 | |
| | | | | Continental Airlines, Inc. | | | | |
| | 424 | | | 7.03%, 06/15/2011 | | | 388 | |
| | | | | Grupo Senda Autotransporte | | | | |
| | 900 | | | 10.50%, 10/03/2015 (H) | | | 846 | |
| | | | | Ultrapetrol Bahamas Ltd. | | | | |
| | 560 | | | 9.00%, 11/24/2014 (H) | | | 512 | |
| | | | | | | | | |
| | | | | | | | | | | | 1,860 | |
| | | | | | | | | | | | | |
| | | | | Utilities — 3.8% |
| | | | | AES China Generating Co. | | | | |
| | 800 | | | 8.25%, 06/26/2010 (H) | | | 747 | |
| | | | | AES Corp. | | | | |
| | 325 | | | 8.00%, 10/15/2017 # | | | 339 | |
| | | | | Copano Energy LLC | | | | |
| | 135 | | | 8.13%, 03/01/2016 | | | 140 | |
| | | | | Edison Mission Energy | | | | |
| | 500 | | | 7.20%, 05/15/2019 | | | 504 | |
| | 300 | | | 7.50%, 06/15/2013 | | | 312 | |
The accompanying notes are an integral part of these financial statements.
251
The Hartford Strategic Income Fund
Schedule of Investments — (continued)
April 30, 2008 (Unaudited)
(000’s Omitted)
| | | | | | | | | | | | | |
Principal
| | | | | | | | Market
| |
| Amount | | | | | | | | Value (W) | |
| |
| | | | | | | | | | | | | |
| CORPORATE BONDS: NON-INVESTMENT GRADE — (continued) |
| | | | | | | | | | | | | |
| | | | | Utilities — (continued) |
| | | | | Energy Future Holdings | | | | |
| $ | 250 | | | 10.88%, 11/01/2017 (I) | | $ | 266 | |
| | | | | Kinder Morgan, Inc. | | | | |
| | 550 | | | 5.15%, 03/01/2015 | | | 509 | |
| | 100 | | | 6.50%, 09/01/2012 | | | 101 | |
| | | | | Majapahit Holdings, Inc. | | | | |
| | 700 | | | 7.25%, 06/28/2017 | | | 664 | |
| | 700 | | | 7.25%, 06/28/2017 (I)# | | | 660 | |
| | | | | Markwest Energy Partners L.P. | | | | |
| | 500 | | | 8.50%, 07/15/2016 | | | 518 | |
| | | | | Mirant JPSCO Finance Ltd. | | | | |
| | 600 | | | 11.00%, 07/06/2016 (H) | | | 630 | |
| | | | | NRG Energy, Inc. | | | | |
| | 260 | | | 7.38%, 01/15/2017 | | | 268 | |
| | | | | Rede Empresas De Energia | | | | |
| | 820 | | | 11.13%, 04/02/2049 (H) | | | 775 | |
| | | | | Reliant Energy, Inc. | | | | |
| | 525 | | | 7.63%, 06/15/2014 | | | 546 | |
| | | | | Texas Competitive Electric Co. | | | | |
| | 1,675 | | | 10.25%, 11/01/2015 (I) | | | 1,746 | |
| | | | | | | | | |
| | | | | | | | | | | | 8,725 | |
| | | | | | | | | | | | | |
| | | | | Total corporate bonds: non-investment grade
(cost $74,686) | | $ | 74,010 | |
| | | | | | | | | | | | | |
| | | | | | | | | | | | | |
| SENIOR FLOATING RATE INTERESTS: NON-INVESTMENT GRADE (V) — 9.9% |
| | | | | Basic Materials — 2.1% |
| | | | | Arizona Chemical Co. | | | | |
| $ | 375 | | | 4.85%, 02/27/2013 (AA)(Q) | | $ | 292 | |
| | 250 | | | 8.59%, 02/27/2014 (N) | | | 150 | |
| | | | | Boise Paper Holdings LLC | | | | |
| | 1,000 | | | 11.00%, 02/20/2015 (N) | | | 970 | |
| | | | | Calumet Lubricants Co. L.P. | | | | |
| | 115 | | | 6.53%, 12/17/2014 (N) | | | 109 | |
| | 883 | | | 7.07%, 12/17/2014 (N) | | | 830 | |
| | | | | Coffeyville Resources | | | | |
| | 763 | | | 5.45%, 12/21/2013 (N) | | | 718 | |
| | 235 | | | 5.95%, 12/21/2010 (AA) | | | 219 | |
| | | | | John Maneely Co. | | | | |
| | 679 | | | 6.03%, 12/08/2013 (N) | | | 615 | |
| | | | | Newpage Corp. | | | | |
| | 998 | | | 6.31%, 12/21/2014 (N) | | | 990 | |
| | | | | | | | | |
| | | | | | | | | | | | 4,893 | |
| | | | | | | | | | | | | |
| | | | | Capital Goods — 0.4% |
| | | | | Macandrews Amg Holdings LLC | | | | |
| | 463 | | | 8.65%, 04/17/2012 (N) | | | 389 | |
| | | | | Scitor Acquisition Corp. | | | | |
| | 498 | | | 7.12%, 09/26/2014 (H)(N) | | | 480 | |
| | | | | | | | | |
| | | | | | | | | | | | 869 | |
| | | | | | | | | | | | | |
| | | | | Consumer Cyclical — 0.9% |
| | | | | Brand Energy & Infrastructure Services | | | | |
| | 495 | | | 6.02%, 02/07/2014 (N) | | | 441 | |
| | | | | Ford Motor Co. | | | | |
| | 742 | | | 5.80%, 12/15/2013 (N) | | | 682 | |
| | | | | Lear Corp. | | | | |
| | 1,000 | | | 5.34%, 04/25/2012 (N) | | | 967 | |
| | | | | | | | | |
| | | | | | | | | | | | 2,090 | |
| | | | | | | | | | | | | |
| | | | | Consumer Staples — 0.2% |
| | | | | Piere Foods, Inc. | | | | |
| | 868 | | | 6.97%, 06/30/2010 (H)(N) | | | 569 | |
| | | | | Finance — 0.9% |
| | | | | BNY Convergex Group LLC & EZE Castle Software | | | | |
| | 500 | | | 5.70%, 08/30/2013 (N) | | | 469 | |
| | | | | Chrysler Financial Services NA | | | | |
| | 498 | | | 6.80%, 08/03/2012 (N) | | | 452 | |
| | 250 | | | 9.30%, 08/03/2013 (N) | | | 200 | |
| | | | | Crescent Resources LLC | | | | |
| | 675 | | | 5.80%, 09/07/2012 (N) | | | 449 | |
| | | | | Realogy Corp. | | | | |
| | 105 | | | 3.10%, 10/05/2013 (N) | | | 90 | |
| | 391 | | | 5.72%, 10/05/2014 (N) | | | 334 | |
| | | | | | | | | |
| | | | | | | | | | | | 1,994 | |
| | | | | | | | | | | | | |
| | | | | Health Care — 1.3% |
| | | | | DJO Finance LLC | | | | |
| | 998 | | | 5.70%, 04/07/2013 (N) | | | 964 | |
| | | | | Generics International, Inc. | | | | |
| | 998 | | | 6.20%, 11/19/2014 (H)(N) | | | 942 | |
| | | | | Inverness Medical Innovation, Inc. | | | | |
| | 250 | | | 6.92%, 06/26/2015 (N) | | | 225 | |
| | | | | Mylan, Inc. | | | | |
| | 798 | | | 6.03%, 12/17/2014 (N) | | | 783 | |
| | | | | | | | | |
| | | | | | | | | | | | 2,914 | |
| | | | | | | | | | | | | |
| | | | | Services — 2.3% |
| | | | | Centaur LLC | | | | |
| | 88 | | | 4.00%, 10/30/2012 (N)(Q) | | | 72 | |
| | 412 | | | 6.70%, 10/30/2012 (N) | | | 348 | |
| | | | | Emdeon Business Services LLC | | | | |
| | 500 | | | 7.70%, 05/16/2014 (N) | | | 462 | |
| | | | | Golden Nugget, Inc. | | | | |
| | 250 | | | 6.05%, 12/31/2014 (N) | | | 175 | |
| | | | | Greenwood Racing, Inc. | | | | |
| | 1,470 | | | 5.12%, 11/14/2011 (H)(AA)(Q) | | | 1,330 | |
| | | | | New World Gaming Partners Ltd. | | | | |
| | 500 | | | 8.19%, 03/31/2015 (H)(N) | | | 350 | |
| | | | | Philosophy, Inc. | | | | |
| | 249 | | | 4.89%, 03/15/2014 (N) | | | 201 | |
| | | | | PITG Gaming Investor Holdings LLC | | | | |
| | 400 | | | 9.80%, 05/26/2008 (N) | | | 389 | |
| | | | | Sirius Satellite Radio, Inc. | | | | |
| | 498 | | | 5.13%, 09/01/2012 (N) | | | 458 | |
| | | | | Telesat Canada | | | | |
| | 39 | | | 3.67%, 09/01/2014 (N)(Q) | | | 37 | |
| | 459 | | | 5.90%, 09/01/2014 (N) | | | 432 | |
| | | | | West Corp. | | | | |
| | 1,000 | | | 7.85%, 10/24/2013 (AA) | | | 993 | |
| | | | | WideOpenWest Finance LLC | | | | |
| | 252 | | | 9.88%, 07/01/2015 (N) | | | 192 | |
| | | | | | | | | |
| | | | | | | | | | | | 5,439 | |
| | | | | | | | | | | | | |
| | | | | Technology — 0.6% |
| | | | | Infor Global Solutions, Delayed Draw Term Loan | | | | |
| | 260 | | | 6.45%, 07/28/2012 (N) | | | 213 | |
| | | | | Infor Global Solutions, U.S. Term Loan | | | | |
| | 498 | | | 6.45%, 07/28/2012 (N) | | | 408 | |
The accompanying notes are an integral part of these financial statements.
252
| | | | | | | | | | | | | |
Principal
| | | | | | | | Market
| |
| Amount | | | | | | | | Value (W) | |
| |
| | | | | | | | | | | | | |
| SENIOR FLOATING RATE INTERESTS: NON-INVESTMENT GRADE (V) — (continued) |
| | | | | | | | | | | | | |
| | | | | Technology — (continued) |
| | | | | Intelsat Bermuda Ltd. | | | | |
| $ | 400 | | | 9.25%, 01/15/2013 (AA)(Q) | | $ | 360 | |
| | | | | One Communications Corp. | | | | |
| | 497 | | | 6.81%, 06/30/2012 (N) | | | 424 | |
| | | | | | | | | |
| | | | | | | | | | | | 1,405 | |
| | | | | | | | | | | | | |
| | | | | Utilities — 1.2% |
| | | | | Astoria Generating Co. Acquisitions LLC | | | | |
| | 500 | | | 6.35%, 08/23/2013 (N) | | | 469 | |
| | | | | Atlas Pipeline Partners L.P. | | | | |
| | 1,000 | | | 5.62%, 07/27/2014 (N) | | | 979 | |
| | | | | Texas Competitive Electric Holdings Co. LLC, Term Loan B2 | | | | |
| | 498 | | | 6.58%, 10/24/2014 (N) | | | 477 | |
| | | | | Texas Competitive Electric Holdings Co. LLC, Term Loan B3 | | | | |
| | 498 | | | 6.58%, 10/31/2014 (N) | | | 476 | |
| | | | | TPF Generation Holdings LLC | | | | |
| | 500 | | | 6.95%, 12/21/2014 (N) | | | 446 | |
| | | | | | | | | |
| | | | | | | | | | | | 2,847 | |
| | | | | | | | | | | | | |
| | | | | Total senior floating rate interests: non-investment grade
(cost $24,644) | | $ | 23,020 | |
| | | | | | | | | | | | | |
| | | | | | | | | | | | | |
| U.S. GOVERNMENT AGENCIES — 19.3% |
| | | | | Federal Home Loan Mortgage Corporation — 3.5% |
| | | | | Mortgage Backed Securities: |
| $ | 1,961 | | | 6.00%, 2037 # | | $ | 1,989 | |
| | 5,880 | | | 6.50%, 2037 — 2038 | | | 6,096 | |
| | | | | | | | | |
| | | | | | | | | | | | 8,085 | |
| | | | | | | | | | | | | |
| | | | | Federal National Mortgage Association — 13.2% |
| | | | | Mortgage Backed Securities: |
| | 2,998 | | | 6.00%, 2037 # | | | 3,037 | |
| | 7,729 | | | 6.50%, 2037 — 2038 | | | 8,005 | |
| | 9,167 | | | 6.50%, 2037 # | | | 9,496 | |
| | 9,671 | | | 7.00%, 2037 # | | | 10,179 | |
| | | | | | | | | |
| | | | | | | | | | | | 30,717 | |
| | | | | | | | | | | | | |
| | | | | Other Government Agencies — 2.6% |
| | | | | Small Business Administration Participation Certificates: |
| | 3,000 | | | 5.16%, 2028 | | | 3,029 | |
| | 3,028 | | | 5.31%, 2027 | | | 3,055 | |
| | | | | | | | | |
| | | | | | | | | | | | 6,084 | |
| | | | | | | | | | | | | |
| | | | | Total U.S. government agencies
(cost $44,586) | | $ | 44,886 | |
| | | | | | | | | | | | | |
| | | | | | | | | | | | | |
| U.S. GOVERNMENT SECURITIES — 0.3% |
| | | | | U.S. Treasury Securities — 0.3% |
| | | | | U.S. Treasury Notes: |
| $ | 656 | | | 3.50%, 2018 | | $ | 642 | |
| | | | | | | | | |
| | | | | Total U.S. government securities
(cost $643) | | $ | 642 | |
| | | | | | | | | | | | | |
| | | | | | | | | | | | | |
| | | | | | | | | Market
| |
| Shares | | | | | | | | Value (W) | |
| |
| PREFERRED STOCK — 0.5% |
| | | | | Finance — 0.5% |
| | 30 | | | Federal Home Loan Mortgage Corp. | | $ | 767 | |
| | 14 | | | Federal National Mortgage Association | | | 349 | |
| | | | | | | | | |
| | | | | Total preferred stock
(cost $1,101) | | $ | 1,116 | |
| | | | | | | | | |
| | | | | Total long-term investments
(cost $228,851) | | $ | 225,944 | |
| | | | | | | | | | | | | |
| | | | | | | | | | | | | |
| SHORT-TERM INVESTMENTS — 3.4% |
| | | | | Investment Pools and Funds — 0.0% |
| | 20 | | | State Street Bank Money Market Fund | | $ | 20 | |
| | | | | | | | | | | | | |
| | | | | | | | | | | | | |
Principal
| | | | | | | | | |
| Amount | | | | | | | | | |
| |
| | | | | Repurchase Agreements — 3.0% |
| | | | | BNP Paribas Securities Corp. Repurchase Agreement (maturing on 05/01/2008 in the amount of $2,001, collateralized by U.S. Treasury Bond 5.50%, 2028, value of $2,064) | | | | |
| $ | 2,001 | | | 1.90% dated 04/30/2008 | | $ | 2,001 | |
| | | | | RBS Greenwich Capital Markets Repurchase Agreement (maturing on 05/01/2008 in the amount of $2,001, collateralized by U. S. Treasury Note 4.50%, 2011, value of $2,049) | | | | |
| | 2,001 | | | 1.90% dated 04/30/2008 | | | 2,001 | |
| | | | | UBS Securities, Inc. Repurchase Agreement (maturing on 05/01/2008 in the amount of $2,904, collateralized by U.S. Treasury Bond 6.00% — 8.75%, 2020 — 2026, U.S. Treasury Note 4.75% — 13.25%, 2008 — 2016, value of $2,975) | | | | |
| | 2,904 | | | 1.90% dated 04/30/2008 | | | 2,904 | |
| | | | | | | | | |
| | | | | | | | | | | | 6,906 | |
| | | | | | | | | | | | | |
| | | | | U.S. Treasury Bills — 0.4% |
| | 1,005 | | | 1.43%, 06/12/2008 (M)(S) | | | 1,004 | |
| | | | | | | | | |
| | | | | Total short-term investments
(cost $7,930) | | $ | 7,930 | |
| | | | | | | | | |
| | | | | Total investments
(cost $236,781) (C) | | | 100.8 | % | | $ | 233,874 | |
| | | | | Other assets and liabilities | | | (0.8 | )% | | | (1,874 | ) |
| | | | | | | | | | | | | |
| | | | | Total net assets | | | 100.0 | % | | $ | 232,000 | |
| | | | | | | | | | | | | |
| |
| Note: | Percentage of investments as shown is the ratio of the total market value to total net assets. Market value of investments in foreign securities represents 19.03% of total net assets at April 30, 2008. |
| | |
| | Foreign securities that are principally traded on certain foreign markets are adjusted daily pursuant to a third party pricing service methodology approved by the Board of Directors in order to reflect an adjustment for factors occurring after the close of the foreign market but before the close of the New York Stock Exchange. |
The accompanying notes are an integral part of these financial statements.
253
The Hartford Strategic Income Fund
Schedule of Investments — (continued)
April 30, 2008 (Unaudited)
(000’s Omitted)
| | |
| (C) | | At April 30, 2008, the cost of securities for federal income tax purposes was $236,803 and the aggregate gross unrealized appreciation and depreciation based on that cost were: |
| | | | | |
| Unrealized Appreciation | | $ | 2,887 | |
| Unrealized Depreciation | | | (5,816 | ) |
| | | | | |
| Net Unrealized Depreciation | | $ | (2,929 | ) |
| | | | | |
| | |
| # | | This security, or a portion of this security, has been segregated to cover funding requirements on investment transactions settling in the future. |
| |
| (AA) | | The interest rate disclosed for these securities represents an estimated average coupon as of April 30, 2008. |
| |
| (I) | | Securities issued within terms of a private placement memorandum, exempt from registration under Section 144A of the Securities Act of 1933, as amended, and may be sold only to qualified institutional buyers. Pursuant to guidelines adopted by the Board of Directors, these issues are determined to be liquid. The aggregate value of these securities at April 30, 2008, was $25,068, which represents 10.81% of total net assets. |
| |
| (K) | | Securities contain some restrictions as to public resale. These securities comply with Regulation S, rules governing offers and sales made outside the United States without registration under the Securities Act of 1933, and are determined to be liquid. At April 30, 2008, the market value of these securities amounted to $4,631 or 2.00% of net assets. |
| |
| (L) | | Variable rate securities; the rate reported is the coupon rate in effect at April 30, 2008. |
| |
| (M) | | The interest rate disclosed for these securities represents the effective yield on the date of acquisition. |
| |
| (N) | | The interest rate disclosed for these securities represents the average coupon as of April 30, 2008. |
| |
| (N) | | The interest rates disclosed for interest only strips represent effective yields based upon estimated future cash flows at April 30, 2008. |
| |
| (Q) | | The cost of securities purchased on a when-issued or delayed delivery basis at April 30, 2008 was $3,454. |
| |
| (V) | | Senior loans in which the Fund invests generally pay interest rates which are periodically adjusted by reference to a base short-term, floating lending rate plus a premium. These base lending rates are generally (i) the lending rate offered by one or more major European banks, such as the London Inter-Bank Offered Rate (LIBOR), (ii) the prime rate offered by one or more major United States Banks, or (iii) the bank’s certificate of deposit rate. Senior floating rate interests often require prepayments from excess cash flows or permit the borrower to repay at its election. The rate at which the borrower repays cannot be predicted with accuracy. As a result, the actual remaining maturity may be substantially less than the stated maturities shown. The interest rate indicated is the rate in effect at April 30, 2008. |
| |
| (X) | | Convertible security. |
| |
| (B) | | All principal amounts are in U.S. dollars unless otherwise indicated. |
| | | |
| AUD | | — Australian Dollar |
| BRL | | — Brazilian Real |
| ISK | | — Iceland Krona |
| NOK | | — Norwegian Krone |
| NZD | | — New Zealand Dollar |
| | |
| (H) | | The following securities are considered illiquid. Illiquid securities are often purchased in private placement transactions, are not registered under the Securities Act of 1933 and may have contractual restrictions on resale. A security may also be considered illiquid if the security lacks a readily available market or if its valuation has not changed for a certain period of time. |
| | | | | | | | | | | |
Period
| | | | | | | | |
Acquired | | Shares/Par | | | Security | | Cost Basis | |
| 04/2008 | | | 800 | | | AES China Generating Co., 8.25%, 06/26/2010 | | $ | 745 | |
| 04/2008 | | | 700 | | | AES El Savador Trust, 6.75%, 02/01/2016 - Reg D | | | 648 | |
| 08/2007 | | | 1,280 | | | Bayview Commercial Asset Trust, 7.50%, 09/25/2037 - 144A | | | 178 | |
| 07/2007 | | | 250 | | | Bayview Financial Acquisition Trust, 8.05%, 08/28/2047 | | | 250 | |
| 05/2007 | | | 4,900 | | | CBA Commercial Small Balance Commercial Mortgage, 7.25%, 07/25/2039 - 144A | | | 431 | |
05/2007 –
10/2007 | | | 200 | | | China Properties Group Ltd., 9.13%, 05/04/2014 - 144A | | | 192 | |
| 07/2007 | | | 93 | | | Credit-Based Asset Servicing and Securitization, 3.17%, 05/25/2036 - 144A | | | 91 | |
| 01/2008 | | | 700 | | | Desarrolladora Homes S.A., 7.50%, 09/28/2015 | | | 702 | |
| 11/2007 | | | 998 | | | Generics International, Inc., 6.20%, 11/19/2014 | | | 988 | |
| 05/2007 | | | 300 | | | Greenwich Capital Commercial Funding Corp., 3.94%, 11/05/2021 - 144A | | | 291 | |
| 05/2007 | | | 325 | | | Greenwich Capital Commercial Funding Corp., 4.14%, 11/05/2021 - 144A | | | 315 | |
| 04/2008 | | | 1,470 | | | Greenwood Racing, Inc., 5.12%, 11/14/2011 | | | 1,336 | |
10/2007 –
01/2008 | | | 900 | | | Grupo Senda Autotransporte, 10.50%, 10/03/2015 - 144A | | | 897 | |
05/2007 –
11/2007 | | | 500 | | | Itabo Finance S.A., 10.88%, 10/05/2013 - 144A | | | 515 | |
09/2007 –
04/2008 | | | 870 | | | LPL Holdings, Inc., 10.75%, 12/15/2015 - 144A | | | 869 | |
05/2007 –
10/2007 | | | 612 | | | MEI Euro Finance Ltd., 8.75%, 05/22/2010 - Reg D | | | 621 | |
| 05/2007 | | | 100 | | | MHP S.A., 10.25%, 11/30/2011 - 144A | | | 105 | |
06/2007 –
03/2008 | | | 700 | | | MHP S.A., 10.25%, 11/30/2011 - Reg D | | | 694 | |
05/2007 –
02/2008 | | | 600 | | | Mirant JPSCO Finance Ltd., 11.00%, 07/06/2016 - 144A | | | 649 | |
| 07/2007 | | | 500 | | | New World Gaming Partners Ltd., 8.19%, 03/31/2015 | | | 500 | |
08/2007 –
12/2007 | | | 700 | | | Parkson Retail Group Ltd., 7.88%, 11/14/2011 | | | 704 | |
| 11/2007 | | | 868 | | | Piere Foods, Inc., 6.97%, 06/30/2010 | | | 856 | |
| 10/2007 | | | 700 | | | RBS-Zero Hora Editora Journalistica, 11.25, 06/15/2017 - Reg D | | | 363 | |
05/2007 –
04/2008 | | | 820 | | | Rede Empresas De Energia, 11.13%, 04/02/2049 - 144A | | | 814 | |
| 08/2007 | | | 100 | | | Renaissance Home Equity Loan Trust, Class M5, 7.00%, 09/25/2037 | | | 77 | |
The accompanying notes are an integral part of these financial statements.
254
| | | | | | | | | | | |
Period
| | | | | | | | |
Acquired | | Shares/Par | | | Security | | Cost Basis | |
| 08/2007 | | | 125 | | | Renaissance Home Equity Loan Trust, Class M8, 7.00%, 09/25/2037 | | $ | 72 | |
| 09/2007 | | | 498 | | | Scitor Acquisition Corp., 7.12%, 09/26/2014 | | | 493 | |
01/2008 –
04/2008 | | | 800 | | | Sri Lanka (Republic of), 8.25%, 10/24/2012 - Reg D | | | 741 | |
| 10/2007 | | | 400 | | | Sri Lanka (Republic of) ADR, 8.25%, 10/24/2012 - 144A | | | 401 | |
| 05/2007 | | | 200 | | | Standard Bank (Privatbank), 8.75%, 02/09/2016 | | | 201 | |
| 10/2007 | | | 200 | | | UK SPV Credit Finance (Privatbank), 8.00%, 02/06/2012 - Reg D | | | 188 | |
| 02/2008 | | | 560 | | | Ultrapetrol Bahamas Ltd., 9.00%, 11/24/2014 | | | 516 | |
10/2007 –
01/2008 | | | 890 | | | Urbi Desarrollos Urbanos, 8.50%, 04/19/2016 - Reg D | | | 900 | |
| 08/2007 | | | 142,974 | | | Wachovia Bank Commercial Mortgage Trust, 10.00%, 02/15/2051 | | | 231 | |
| | |
| | The aggregate value of these securities at April 30, 2008 was $16,491 which represents 7.11% of total net assets. |
| |
| (S) | | Security pledged as initial margin deposit for open futures contracts at April 30, 2008. |
| |
| | Futures Contracts Outstanding at April 30, 2008 |
| | | | | | | | | | | | | | | | | |
| | | | | | | | | | | | Unrealized
| |
| | | Number of
| | | | | | Expiration
| | | Appreciation/
| |
Description | | Contracts* | | | Position | | | Month | | | (Depreciation) | |
| |
| 2 Year U.S. Treasury Note | | | 10 | | | | Long | | | | Jun 2008 | | | $ | (2 | ) |
| 5 Year U.S. Treasury Note | | | 710 | | | | Long | | | | Jun 2008 | | | | (515 | ) |
| 10 Year U.S. Treasury Note | | | 40 | | | | Short | | | | Jun 2008 | | | | (2 | ) |
| U.S. Long Bond | | | 27 | | | | Long | | | | Jun 2008 | | | | (25 | ) |
| | | | | | | | | | | | | | | | | |
| | | | | | | | | | | | | | | $ | (544 | ) |
| | | | | | | | | | | | | | | | | |
| | |
| | * The number of contracts does not omit 000’s. |
| |
| (W) | | See Note 2b of accompanying Notes to Financial Statements regarding valuation of securities. |
The accompanying notes are an integral part of these financial statements.
255
The Hartford Target Retirement 2010 Fund
Schedule of Investments
April 30, 2008 (Unaudited)
(000’s Omitted)
| | | | | | | | | | | | | |
| | | | | | | | | Market
| |
| Shares | | | | | | | | Value (W) | |
| AFFILIATED INVESTMENT COMPANIES — 96.9% |
| EQUITY FUNDS — 54.9% |
| | 46 | | | The Hartford Capital Appreciation Fund, Class Y | | $ | 1,944 | |
| | 20 | | | The Hartford Capital Appreciation II Fund, Class Y | | | 271 | |
| | 26 | | | The Hartford Dividend and Growth Fund, Class Y | | | 539 | |
| | 37 | | | The Hartford Equity Income Fund, Class Y | | | 509 | |
| | 21 | | | The Hartford Global Growth Fund, Class Y | | | 421 | |
| | 22 | | | The Hartford Growth Fund, Class Y | | | 393 | |
| | 11 | | | The Hartford Growth Opportunities Fund, Class Y | | | 334 | |
| | 61 | | | The Hartford International Opportunities Fund, Class Y | | | 1,067 | |
| | 57 | | | The Hartford International Small Company Fund, Class Y | | | 798 | |
| | 44 | | | The Hartford Select SmallCap Value Fund, Class Y | | | 402 | |
| | 20 | | | The Hartford Small Company Fund, Class Y | | | 399 | |
| | 132 | | | The Hartford Value Fund, Class Y | | | 1,640 | |
| | | | | | | | | |
| | | | | Total equity funds
(cost $8,543) | | $ | 8,717 | |
| | | | | | | | | | | | | |
| �� | | | | | | | | | | | | |
| FIXED INCOME FUNDS — 42.0% |
| | 75 | | | The Hartford Floating Rate Fund, Class Y | | $ | 687 | |
| | 191 | | | The Hartford Income Fund, Class Y | | | 1,883 | |
| | 122 | | | The Hartford Inflation Plus Fund, Class Y | | | 1,368 | |
| | 75 | | | The Hartford Short Duration Fund, Class Y | | | 712 | |
| | 71 | | | The Hartford Strategic Income Fund, Class Y | | | 672 | |
| | 127 | | | The Hartford Total Return Bond Fund, Class Y | | | 1,339 | |
| | | | | | | | | |
| | | | | Total fixed income funds
(cost $6,705) | | $ | 6,661 | |
| | | | | | | | | |
| | | | | Total investments in affiliated investment companies
(cost $15,248) | | $ | 15,378 | |
| | | | | | | | | | | | | |
| | | | | | | | | | | | | |
| EXCHANGE TRADED FUNDS — 2.6% |
| | 3 | | | DJ Wilshire REIT ETF | | $ | 188 | |
| | 4 | | | SPDR DJ Wilshire International Real Estate ETF | | | 221 | |
| | | | | | | | | |
| | | | | Total investments in exchange traded funds
(cost $399) | | $ | 409 | |
| | | | | | | | | |
| | | | | Total investments
(cost $15,647) (C) | | | 99.5 | % | | $ | 15,787 | |
| | | | | Other assets and liabilities | | | 0.5 | % | | | 76 | |
| | | | | | | | | | | | | |
| | | | | Total net assets | | | 100.0 | % | | $ | 15,863 | |
| | | | | | | | | | | | | |
| |
| Note: | Percentage of investments as shown is the ratio of the total market value to total net assets. |
| | |
| (C) | | At April 30, 2008, the cost of securities for federal income tax purposes was $15,650 and the aggregate gross unrealized appreciation and depreciation based on that cost were: |
| | | | | |
| Unrealized Appreciation | | $ | 270 | |
| Unrealized Depreciation | | | (133 | ) |
| | | | | |
| Net Unrealized Appreciation | | $ | 137 | |
| | | | | |
| | |
| (W) | | See Note 2b of accompanying Notes to Financial Statements regarding valuation of securities. |
The accompanying notes are an integral part of these financial statements.
256
The Hartford Target Retirement 2020 Fund
Schedule of Investments
April 30, 2008 (Unaudited)
(000’s Omitted)
| | | | | | | | | | | | | |
| | | | | | | | | Market
| |
| Shares | | | | | | | | Value (W) | |
| AFFILIATED INVESTMENT COMPANIES — 99.3% |
| EQUITY FUNDS — 70.2% |
| | 113 | | | The Hartford Capital Appreciation Fund, Class Y | | $ | 4,749 | |
| | 69 | | | The Hartford Capital Appreciation II Fund, Class Y | | | 946 | |
| | 70 | | | The Hartford Dividend and Growth Fund, Class Y | | | 1,442 | |
| | 113 | | | The Hartford Equity Income Fund, Class Y | | | 1,531 | |
| | 41 | | | The Hartford Global Growth Fund, Class Y | | | 839 | |
| | 51 | | | The Hartford Growth Fund, Class Y | | | 925 | |
| | 48 | | | The Hartford Growth Opportunities Fund, Class Y | | | 1,443 | |
| | 57 | | | Hartford International Capital Appreciation Fund, Class Y | | | 797 | |
| | 101 | | | The Hartford International Opportunities Fund, Class Y | | | 1,768 | |
| | 157 | | | The Hartford International Small Company Fund, Class Y | | | 2,212 | |
| | 87 | | | The Hartford Select MidCap Value Fund, Class Y | | | 831 | |
| | 130 | | | The Hartford Select SmallCap Value Fund, Class Y | | | 1,203 | |
| | 41 | | | The Hartford Small Company Fund, Class Y | | | 833 | |
| | 275 | | | The Hartford Value Fund, Class Y | | | 3,411 | |
| | | | | | | | | |
| | | | | Total equity funds
(cost $23,118) | | $ | 22,930 | |
| | | | | | | | | | | | | |
| | | | | | | | | | | | | |
| FIXED INCOME FUNDS — 29.1% |
| | 107 | | | The Hartford Floating Rate Fund, Class Y | | $ | 978 | |
| | 170 | | | The Hartford Income Fund, Class Y | | | 1,673 | |
| | 182 | | | The Hartford Inflation Plus Fund, Class Y | | | 2,039 | |
| | 107 | | | The Hartford Short Duration Fund, Class Y | | | 1,017 | |
| | 156 | | | The Hartford Strategic Income Fund, Class Y | | | 1,485 | |
| | 219 | | | The Hartford Total Return Bond Fund, Class Y | | | 2,315 | |
| | | | | | | | | |
| | | | | Total fixed income funds
(cost $9,593) | | $ | 9,507 | |
| | | | | | | | | |
| | | | | Total investments in affiliated investment companies
(cost $32,711) | | $ | 32,437 | |
| | | | | | | | | | | | | |
| | | | | | | | | | | | | |
| EXCHANGE TRADED FUNDS — 0.4% |
| | 2 | | | SPDR DJ Wilshire International Real Estate ETF | | $ | 122 | |
| | | | | | | | | |
| | | | | Total investments in exchange traded funds
(cost $120) | | $ | 122 | |
| | | | | | | | | |
| | | | | Total investments
(cost $32,831) (C) | | | 99.7 | % | | $ | 32,559 | |
| | | | | Other assets and liabilities | | | 0.3 | % | | | 88 | |
| | | | | | | | | | | | | |
| | | | | Total net assets | | | 100.0 | % | | $ | 32,647 | |
| | | | | | | | | | | | | |
| |
| Note: | Percentage of investments as shown is the ratio of the total market value to total net assets. |
| | |
| (C) | | At April 30, 2008, the cost of securities for federal income tax purposes was $32,834 and the aggregate gross unrealized appreciation and depreciation based on that cost were: |
| | | | | |
| Unrealized Appreciation | | $ | 340 | |
| Unrealized Depreciation | | | (615 | ) |
| | | | | |
| Net Unrealized Depreciation | | $ | (275 | ) |
| | | | | |
| | |
| (W) | | See Note 2b of accompanying Notes to Financial Statements regarding valuation of securities. |
The accompanying notes are an integral part of these financial statements.
257
The Hartford Target Retirement 2030 Fund
Schedule of Investments
April 30, 2008 (Unaudited)
(000’s Omitted)
| | | | | | | | | | | | | |
| | | | | | | | | Market
| |
| Shares | | | | | | | | Value (W) | |
| AFFILIATED INVESTMENT COMPANIES — 98.4% |
| EQUITY FUNDS — 79.8% |
| | 115 | | | The Hartford Capital Appreciation Fund, Class Y | | $ | 4,816 | |
| | 49 | | | The Hartford Capital Appreciation II Fund, Class Y | | | 679 | |
| | 53 | | | The Hartford Dividend and Growth Fund, Class Y | | | 1,095 | |
| | 87 | | | The Hartford Equity Income Fund, Class Y | | | 1,183 | |
| | 43 | | | The Hartford Global Growth Fund, Class Y | | | 877 | |
| | 51 | | | The Hartford Growth Fund, Class Y | | | 913 | |
| | 35 | | | The Hartford Growth Opportunities Fund, Class Y | | | 1,055 | |
| | 45 | | | Hartford International Capital Appreciation Fund, Class Y | | | 631 | |
| | 79 | | | The Hartford International Opportunities Fund, Class Y | | | 1,383 | |
| | 135 | | | The Hartford International Small Company Fund, Class Y | | | 1,899 | |
| | 84 | | | The Hartford Select MidCap Value Fund, Class Y | | | 804 | |
| | 149 | | | The Hartford Select SmallCap Value Fund, Class Y | | | 1,373 | |
| | 40 | | | The Hartford Small Company Fund, Class Y | | | 808 | |
| | 260 | | | The Hartford Value Fund, Class Y | | | 3,218 | |
| | | | | | | | | |
| | | | | Total equity funds
(cost $21,126) | | $ | 20,734 | |
| | | | | | | | | | | | | |
| | | | | | | | | | | | | |
| FIXED INCOME FUNDS — 18.6% |
| | 126 | | | The Hartford Inflation Plus Fund, Class Y | | $ | 1,412 | |
| | 84 | | | The Hartford Short Duration Fund, Class Y | | | 803 | |
| | 250 | | | The Hartford Total Return Bond Fund, Class Y | | | 2,637 | |
| | | | | | | | | |
| | | | | Total fixed income funds
(cost $4,868) | | $ | 4,852 | |
| | | | | | | | | |
| | | | | Total investments in affiliated investment companies
(cost $25,994) | | $ | 25,586 | |
| | | | | | | | | | | | | |
| | | | | | | | | | | | | |
| EXCHANGE TRADED FUNDS — 1.3% |
| | 1 | | | DJ Wilshire REIT ETF | | $ | 62 | |
| | 5 | | | SPDR DJ Wilshire International Real Estate ETF | | | 271 | |
| | | | | | | | | |
| | | | | Total investments in exchange traded funds
(cost $326) | | $ | 333 | |
| | | | | | | | | |
| | | | | Total investments
(cost $26,320) (C) | | | 99.7 | % | | $ | 25,919 | |
| | | | | Other assets and liabilities | | | 0.3 | % | | | 74 | |
| | | | | | | | | | | | | |
| | | | | Total net assets | | | 100.0 | % | | $ | 25,993 | |
| | | | | | | | | | | | | |
| |
| Note: | Percentage of investments as shown is the ratio of the total market value to total net assets. |
| | |
| (C) | | At April 30, 2008, the cost of securities for federal income tax purposes was $26,322 and the aggregate gross unrealized appreciation and depreciation based on that cost were: |
| | | | | |
| Unrealized Appreciation | | $ | 205 | |
| Unrealized Depreciation | | | (608 | ) |
| | | | | |
| Net Unrealized Depreciation | | $ | (403 | ) |
| | | | | |
| | |
| (W) | | See Note 2b of accompanying Notes to Financial Statements regarding valuation of securities. |
The accompanying notes are an integral part of these financial statements.
258
The Hartford Tax-Free California Fund
Schedule of Investments
April 30, 2008 (Unaudited)
(000’s Omitted)
| | | | | | | | | | | | | |
Principal
| | | | | | | | Market
| |
| Amount | | | | | | | | Value (W) | |
| MUNICIPAL BONDS — 94.2% |
| | | | | Airport Revenues — 2.4% |
| | | | | San Jose, CA, Airport Rev AMT | | | | |
| $ | 1,000 | | | 5.00%, 03/01/2037 | | $ | 921 | |
| | | | | General Obligations — 2.5% |
| | | | | Chabot-Las Positas, CA, Community College Dist | | | | |
| | 1,895 | | | 5.05%, 08/01/2033 (M) | | | 474 | |
| | | | | Puerto Rico Commonwealth | | | | |
| | 500 | | | 5.50%, 07/01/2032 (Q) | | | 500 | |
| | | | | | | | | |
| | | | | | | | | | | | 974 | |
| | | | | | | | | | | | | |
| | | | | Health Care/Services — 8.9% |
| | | | | California ABAG FA for Non-Profit Corps, San Diego Hospital Assoc | | | | |
| | 200 | | | 5.38%, 03/01/2021 | | | 200 | |
| | | | | California Health Fac FA, Catholic Healthcare West | | | | |
| | 250 | | | 5.25%, 07/01/2023 | | | 252 | |
| | | | | California Statewide Community DA, Front Porch Communities & Services | | | | |
| | 500 | | | 5.13%, 04/01/2037 (H) | | | 430 | |
| | | | | California Statewide Community DA, Health Services Rev | | | | |
| | 250 | | | 6.00%, 10/01/2023 | | | 265 | |
| | | | | Rancho Mirage, CA, Joint Powers FA Rev Eisenhower Medical Center | | | | |
| | 500 | | | 5.00%, 07/01/2038 | | | 458 | |
| | | | | Sierra View, CA, Local Health Care Dist | | | | |
| | 1,000 | | | 5.25%, 07/01/2032 | | | 944 | |
| | | | | Turlock, CA, Health Fac Rev, Emanuel Medical Center | | | | |
| | 500 | | | 5.13%, 10/15/2037 | | | 422 | |
| | | | | Washington Township, CA, Health Care Dist Rev | | | | |
| | 500 | | | 5.00%, 07/01/2037 | | | 467 | |
| | | | | | | | | |
| | | | | | | | | | | | 3,438 | |
| | | | | | | | | | | | | |
| | | | | Higher Education (Univ., Dorms, etc.) — 14.3% |
| | | | | California Educational Fac Auth, Dominican University | | | | |
| | 300 | | | 5.00%, 12/01/2025 | | | 269 | |
| | | | | California Educational Fac Auth, Golden Gate University | | | | |
| | 455 | | | 5.00%, 10/01/2025 # | | | 445 | |
| | | | | California Educational Fac Auth, La Verne University | | | | |
| | 180 | | | 5.00%, 06/01/2031 | | | 161 | |
| | | | | California Educational Fac Auth, Pitzer College | | | | |
| | 630 | | | 5.00%, 04/01/2030 # | | | 620 | |
| | | | | California Educational Fac Auth, University of the Pacific | | | | |
| | 750 | | | 5.00%, 11/01/2036 # | | | 740 | |
| | | | | California Educational Fac Auth, Woodbury University | | | | |
| | 200 | | | 5.00%, 01/01/2025 | | | 184 | |
| | | | | California Municipal FA, Biola University | | | | |
| | 335 | | | 5.80%, 10/01/2028 | | | 336 | |
| | | | | California Municipal FA, University Students Coop Assoc | | | | |
| | 250 | | | 4.75%, 04/01/2027 | | | 216 | |
| | | | | California Statewide Community DA, California Baptist University | | | | |
| | 1,000 | | | 5.50%, 11/01/2038 | | | 929 | |
| | | | | California Statewide Community DA, Drew School | | | | |
| | 750 | | | 5.30%, 10/01/2037 | | | 646 | |
| | | | | California Statewide Community DA, Huntington Park Rev | | | | |
| | 600 | | | 5.15%, 07/01/2030 | | | 512 | |
| | | | | California Statewide Community DA, John F Kennedy University Rev | | | | |
| | 250 | | | 6.75%, 10/01/2033 | | | 258 | |
| | | | | California Statewide Community DA, Windrush School | | | | |
| | 250 | | | 5.50%, 07/01/2037 | | | 219 | |
| | | | | | | | | |
| | | | | | | | | | | | 5,535 | |
| | | | | | | | | | | | | |
| | | | | Housing (HFA’s, etc.) — 1.1% |
| | | | | Monterey County, CA, Certificate of Participation | | | | |
| | 500 | | | 4.50%, 08/01/2037 | | | 446 | |
| | | | | Industrial — 3.2% |
| | | | | California State Enterprise Auth Sewer FA Rev AMT | | | | |
| | 500 | | | 5.30%, 09/01/2047 | | | 462 | |
| | | | | Chula Vista, CA, IDR Daily San Diego Gas | | | | |
| | 300 | | | 5.30%, 07/01/2021 | | | 307 | |
| | | | | Virgin Islands Public FA Rev AMT | | | | |
| | 250 | | | 4.70%, 07/01/2022 | | | 215 | |
| | | | | Virgin Islands Public FA, Revhovenska Refinery | | | | |
| | 250 | | | 6.13%, 07/01/2022 | | | 251 | |
| | | | | | | | | |
| | | | | | | | | | | | 1,235 | |
| | | | | | | | | | | | | |
| | | | | Miscellaneous — 3.9% |
| | | | | Golden State Tobacco Securitization Agency | | | | |
| | 510 | | | 5.00%, 06/01/2017 | | | 499 | |
| | | | | Kern County, CA, Tobacco Securitization Agency | | | | |
| | 1,000 | | | 6.00%, 06/01/2029 # | | | 1,003 | |
| | | | | | | | | |
| | | | | | | | | | | | 1,502 | |
| | | | | | | | | | | | | |
| | | | | Pollution Control — 1.8% |
| | | | | Big Bear Municipal Water Dist, Ref Lake Improvements | | | | |
| | 250 | | | 5.00%, 11/01/2024 | | | 249 | |
| | | | | Sacramento, CA, Pollution Control FA AMT | | | | |
| | 500 | | | 4.75%, 12/01/2023 | | | 439 | |
| | | | | | | | | |
| | | | | | | | | | | | 688 | |
| | | | | | | | | | | | | |
| | | | | Prerefunded — 6.5% |
| | | | | Beaumont, CA, FA Local Agency Rev Ser A | | | | |
| | 50 | | | 7.25%, 09/01/2020 | | | 56 | |
| | | | | California Infrastructure & Econ Development, Bay Area Toll Bridges | | | | |
| | 500 | | | 5.00%, 07/01/2022 | | | 546 | |
| | | | | California State Water Dept, Res Power Supply Rev | | | | |
| | 250 | | | 5.88%, 05/01/2016 | | | 280 | |
| | | | | California Statewide Community DA, Thomas Jefferson School of Law | | | | |
| | 175 | | | 4.88%, 10/01/2035 | | | 187 | |
| | | | | Capistrano, CA, USD Community Fac Dist Special Tax Talega | | | | |
| | 100 | | | 5.88%, 09/01/2022 | | | 114 | |
The accompanying notes are an integral part of these financial statements.
259
The Hartford Tax-Free California Fund
Schedule of Investments — (continued)
April 30, 2008 (Unaudited)
(000’s Omitted)
| | | | | | | | | | | | | |
Principal
| | | | | | | | Market
| |
| Amount | | | | | | | | Value (W) | |
| | | | | | | | | | | | | |
| MUNICIPAL BONDS — (continued) |
| | | | | | | | | | | | | |
| | | | | Prerefunded — (continued) |
| | | | | Contra Costa County, CA, Public FA Tax Allocation | | | | |
| $ | 330 | | | 5.63%, 08/01/2033 | | $ | 371 | |
| | | | | Oakland, CA, Redev Agency Tax Allocation, Colliseum Area Redev | | | | |
| | 250 | | | 5.25%, 09/01/2033 | | | 276 | |
| | | | | Santa Margarita, CA, Water Dist Special Tax Community Fac Dist | | | | |
| | 200 | | | 6.00%, 09/01/2030 | | | 229 | |
| | | | | Solano, CA, MBIA Certificate of Participation | | | | |
| | 425 | | | 5.25%, 11/01/2021 | | | 467 | |
| | | | | | | | | |
| | | | | | | | | | | | 2,526 | |
| | | | | | | | | | | | | |
| | | | | Public Facilities — 1.3% |
| | | | | California Public Works Board, Dept of Health Services Richmond Lab | | | | |
| | 300 | | | 5.00%, 11/01/2030 | | | 300 | |
| | | | | California Public Works Board, Dept of Mental Health Patton | | | | |
| | 200 | | | 5.38%, 04/01/2028 | | | 206 | |
| | | | | | | | | |
| | | | | | | | | | | | 506 | |
| | | | | | | | | | | | | |
| | | | | Special Tax Assessment — 26.7% |
| | | | | Aliso Viejo, CA, Community Fac Dist Special Tax | | | | |
| | 500 | | | 6.00%, 09/01/2038 | | | 486 | |
| | | | | Azusa, CA, Special Tax Community Fac Dist Mountain Cove | | | | |
| | 100 | | | 5.75%, 09/01/2021 | | | 98 | |
| | | | | Beaumont, CA, FA Improvement Area #8 | | | | |
| | 250 | | | 5.05%, 09/01/2037 | | | 202 | |
| | | | | Carlsbad CA Special Tax | | | | |
| | 260 | | | 6.05%, 09/01/2028 | | | 248 | |
| | | | | Chino, CA, Community Fac Dist Special Tax #2 | | | | |
| | 225 | | | 5.00%, 09/01/2036 | | | 182 | |
| | | | | Chino, CA, Community Fac Dist Special Tax B | | | | |
| | 500 | | | 5.00%, 09/01/2036 | | | 399 | |
| | | | | Elk Grove, CA, Special Tax | | | | |
| | 750 | | | 5.25%, 09/01/2037 | | | 500 | |
| | | | | Folsom, CA, Public FA Special Tax Rev | | | | |
| | 250 | | | 5.20%, 09/01/2032 | | | 209 | |
| | | | | Hemet, CA, USD Community Fac Dist Special Tax #2005-1 | | | | |
| | 250 | | | 5.13%, 09/01/2036 | | | 210 | |
| | | | | Hemet, CA, USD Community Fac Dist Special Tax #2005-3 | | | | |
| | 500 | | | 5.75%, 09/01/2039 | | | 446 | |
| | | | | Imperial, CA, Special Tax Community Fac | | | | |
| | 325 | | | 5.00%, 09/01/2026 | | | 277 | |
| | | | | Indio, CA, Community Fac Dist Special Tax | | | | |
| | 300 | | | 5.05%, 09/01/2026 | | | 260 | |
| | | | | Indio, CA, Public FA Rev Local Agency | | | | |
| | 135 | | | 5.00%, 09/02/2014 # | | | 133 | |
| | | | | Indio, CA, Public Improvement Act Special Assessment #2002-3 GO | | | | |
| | 57 | | | 6.35%, 09/02/2027 | | | 56 | |
| | | | | Irivine, CA, Improvement Bond Act 1915 | | | | |
| | 300 | | | 5.00%, 09/02/2030 | | | 266 | |
| | | | | Irvine, CA, Community Fac Dist #2005-2 | | | | |
| | 225 | | | 5.20%, 09/01/2026 # | | | 204 | |
| | | | | Jurapa, CA, Community Services Dist Special Tax Dist #30 | | | | |
| | 500 | | | 5.60%, 09/01/2037 | | | 458 | |
| | | | | Jurupa, CA, Community Services Dist Special Tax Dist #17 | | | | |
| | 250 | | | 5.20%, 09/01/2036 | | | 208 | |
| | | | | Jurupa, CA, Community Services Dist Special Tax Dist #6 | | | | |
| | 100 | | | 5.88%, 09/01/2032 | | | 93 | |
| | | | | Lake Elsinore, CA, Special Tax Community Fac Dist #2005-6 | | | | |
| | 150 | | | 5.00%, 09/01/2030 | | | 123 | |
| | | | | Lake Elsinore, CA, Special Tax Community Fac Dist#2005-1A | | | | |
| | 200 | | | 5.35%, 09/01/2036 | | | 170 | |
| | | | | Lake Elsinore, CA, Special Tax Community Fac Dist#2-A | | | | |
| | 100 | | | 5.85%, 09/01/2024 | | | 95 | |
| | | | | Lake Elsinore, CA, Special Tax Community Fac Dist#3 | | | | |
| | 250 | | | 5.15%, 09/01/2025 | | | 226 | |
| | | | | Lee Lake, CA, Water Dist Community Fac Dist #3 Special Tax Retreat | | | | |
| | 150 | | | 5.75%, 09/01/2023 | | | 143 | |
| | | | | Moreno Valley, CA, USD Community Fac Special Tax #2002-1 | | | | |
| | 110 | | | 5.60%, 09/01/2017 | | | 108 | |
| | | | | Orange County, CA, Community Fac Dist Special Tax Ladera Ranch | | | | |
| | 100 | | | 5.20%, 08/15/2019 | | | 97 | |
| | 200 | | | 5.40%, 08/15/2022 | | | 194 | |
| | | | | Orange County, CA, Special Tax Assessment | | | | |
| | 165 | | | 5.05%, 09/02/2033 | | | 143 | |
| | | | | Perris, CA, Public FA Local Agency Rev | | | | |
| | 1,000 | | | 5.80%, 09/01/2038 | | | 904 | |
| | 100 | | | 6.25%, 09/01/2033 | | | 98 | |
| | | | | Roseville, CA, FA Special Tax Rev | | | | |
| | 500 | | | 5.00%, 09/01/2033 | | | 412 | |
| | | | | Roseville, CA, Special Tax | | | | |
| | 1,140 | | | 6.00%, 09/01/2028 | | | 1,081 | |
| | | | | Roseville, CA, Special Tax Dist Westpark | | | | |
| | 200 | | | 5.25%, 09/01/2025 | | | 175 | |
| | | | | Sun Ranch, CA, Municipal Water Dist | | | | |
| | 200 | | | 5.00%, 09/01/2036 | | | 164 | |
| | | | | Tustin, CA, Community Fac Special Tax B | | | | |
| | 500 | | | 6.00%, 09/01/2036 | | | 470 | |
| | | | | Tustin, CA, USD Community Fac Dist Special Tax #97 Jr Lien | | | | |
| | 250 | | | 5.60%, 09/01/2029 | | | 224 | |
| | | | | Val Verde, CA, USD FA Special Tax Rev Jr Lien | | | | |
| | 200 | | | 6.00%, 10/01/2021 | | | 203 | |
| | | | | William S Hart USD Special Tax | | | | |
| | 300 | | | 5.25%, 09/01/2026 | | | 264 | |
| | 125 | | | 5.85%, 09/01/2022 | | | 124 | |
| | | | | | | | | |
| | | | | | | | | | | | 10,353 | |
| | | | | | | | | | | | | |
| | | | | Tax Allocation — 8.7% |
| | | | | Burbank, CA, FA Rev South San Fernando Redev Proj | | | | |
| | 350 | | | 5.50%, 12/01/2023 | | | 353 | |
The accompanying notes are an integral part of these financial statements.
260
| | | | | | | | | | | | | |
Principal
| | | | | | | | Market
| |
| Amount | | | | | | | | Value (W) | |
| | | | | | | | | | | | | |
| MUNICIPAL BONDS — (continued) |
| | | | | | | | | | | | | |
| | | | | Tax Allocation — (continued) |
| | | | | Contra Costa County, CA, Public FA Tax Allocation | | | | |
| $ | 70 | | | 5.63%, 08/01/2033 | | $ | 70 | |
| | | | | Corona, CA, Redev Agency Tax Allocation | | | | |
| | 300 | | | 4.50%, 11/01/2032 | | | 276 | |
| | | | | Fontana, CA, Redev Agency Tax Allocation Ref, Jurupa Hills Redev Proj | | | | |
| | 400 | | | 5.50%, 10/01/2027 # | | | 408 | |
| | | | | Huntington Park, CA, Public FA Rev Ref | | | | |
| | 400 | | | 5.25%, 09/01/2019 | | | 433 | |
| | | | | Oceanside, CA, Community Development Committee, Downtown Redev Proj | | | | |
| | 300 | | | 5.70%, 09/01/2025 | | | 308 | |
| | | | | Riverside County, CA, Public FA Tax Allocation Jurupa Desert & Interstate | | | | |
| | 200 | | | 4.50%, 10/01/2037 | | | 188 | |
| | | | | Sacramento, CA, FA Lease Rev MBIA AMT | | | | |
| | 350 | | | 4.30%, 07/15/2027 (L) | | | 340 | |
| | | | | San Diego, CA, Redev Agency Centre City Sub Pkg | | | | |
| | 200 | | | 5.25%, 09/01/2026 | | | 199 | |
| | | | | San Diego, CA, Redev Agency Tax Allocation, North Bay Redev Proj | | | | |
| | 150 | | | 5.60%, 09/01/2017 | | | 154 | |
| | | | | San Diego, CA, Redev Agency Tax Allocation, North Park Redev Proj | | | | |
| | 175 | | | 5.30%, 09/01/2016 | | | 179 | |
| | | | | Temecula, CA, Redev Agency Tax Allocation Rev | | | | |
| | 250 | | | 5.63%, 12/15/2038 | | | 225 | |
| | | | | Virgin Islands Public FA Rev | | | | |
| | 300 | | | 4.25%, 10/01/2029 | | | 258 | |
| | | | | | | | | |
| | | | | | | | | | | | 3,391 | |
| | | | | | | | | | | | | |
| | | | | Utilities — Electric — 5.1% |
| | | | | Riverside CA Electric | | | | |
| | 2,000 | | | 4.25%, 10/01/2035 (L) | | | 2,000 | |
| | | | | Utilities — Gas — 4.9% |
| | | | | Long Beach, CA, Bond FA Natural Gas Purchase Rev Ser A | | | | |
| | 1,000 | | | 5.50%, 11/15/2037 | | | 920 | |
| | | | | Vernon, CA, Natural Gas FA | | | | |
| | 1,000 | | | 5.00%, 08/01/2021 | | | 999 | |
| | | | | | | | | |
| | | | | | | | | | | | 1,919 | |
| | | | | | | | | | | | | |
| | | | | Utilities — Water and Sewer — 2.9% |
| | | | | Atwater, CA, Public FA Sewer & Water Proj | | | | |
| | 500 | | | 5.50%, 05/01/2028 # | | | 501 | |
| | | | | Lathrop, CA, FA Rev Water Supply Proj | | | | |
| | 250 | | | 6.00%, 06/01/2035 | | | 236 | |
| | | | | Stockton, CA, Wastewater System Proj MBIA | | | | |
| | 375 | | | 5.20%, 09/01/2029 | | | 382 | |
| | | | | | | | | |
| | | | | | | | | | | | 1,119 | |
| | | | | | | | | | | | | |
| | | | | Total municipal bonds
(cost $38,676) | | $ | 36,553 | |
| | | | | | | | | | | | | |
| | | | | | | | | | | | | |
| | | | | | | | | Market
| |
| Shares | | | | | | | | Value (W) | |
| |
| SHORT-TERM INVESTMENTS — 5.6% |
| | | | | Investment Pools and Funds — 5.6% |
| $ | 2,168 | | | Dreyfus Basic California Municipal Money Market Fund | | $ | 2,168 | |
| | | | | | | | | |
| | | | | Total short-term investments
(cost $2,168) | | $ | 2,168 | |
| | | | | | | | | |
| | | | | Total investments
(cost $40,844) (C) | | | 99.8 | % | | $ | 38,721 | |
| | | | | Other assets and liabilities | | | 0.2 | % | | | 82 | |
| | | | | | | | | | | | | |
| | | | | Total net assets | | | 100.0 | % | | $ | 38,803 | |
| | | | | | | | | | | | | |
| |
| Note: | Percentage of investments as shown is the ratio of the total market value to total net assets. |
| | |
| (C) | | At April 30, 2008, the cost of securities for federal income tax purposes was $40,844 and the aggregate gross unrealized appreciation and depreciation based on that cost were: |
| | | | | |
| Unrealized Appreciation | | $ | 362 | |
| Unrealized Depreciation | | | (2,485 | ) |
| | | | | |
| Net Unrealized Depreciation | | $ | (2,123 | ) |
| | | | | |
| | |
| # | | This security, or a portion of this security, has been segregated to cover funding requirements on investment transactions settling in the future. |
| |
| (L) | | Variable rate securities; the rate reported is the coupon rate in effect at April 30, 2008. |
| |
| (M) | | The interest rate disclosed for these securities represents the effective yield on the date of acquisition. |
| |
| (Q) | | The cost of securities purchased on a when-issued or delayed delivery basis at April 30, 2008 was $491. |
| |
| (H) | | The following securities are considered illiquid. Illiquid securities are often purchased in private placement transactions, are not registered under the Securities Act of 1933 and may have contractual restrictions on resale. A security may also be considered illiquid if the security lacks a readily available market or if its valuation has not changed for a certain period of time. |
| | | | | | | | | | | |
Period
| | | | | | | | |
Acquired | | Shares/Par | | | Security | | Cost Basis | |
| 05/2007 | | | 500 | | | California Statewide Community DA, Front Porch Communities & Services, 5.13%, 04/01/2037 - 144A | | $ | 505 | |
| | |
| | The aggregate value of these securities at April 30, 2008 was $430 which represents 1.11% of total net assets. |
| |
| (W) | | See Note 2b of accompanying Notes to Financial Statements regarding valuation of securities. |
| | | |
| AMT | | — Alternative Minimum Tax |
| DA | | — Development Authority |
| FA | | — Finance Authority |
| GO | | — General Obligations |
| IDR | | — Industrial Development Revenue Bond |
| MBIA | | — Municipal Bond Insurance Association |
| USD | | — United School District |
The accompanying notes are an integral part of these financial statements.
261
The Hartford Tax-Free Minnesota Fund
Schedule of Investments
April 30, 2008 (Unaudited)
(000’s Omitted)
| | | | | | | | | | | | | |
Principal
| | | | | | | | Market
| |
| Amount | | | | | | | | Value (W) | |
| MUNICIPAL BONDS — 98.3% |
| | | | | Airport Revenues — 2.9% |
| | | | | Minneapolis & St Paul, MN, Airport Commission FGIC AMT | | | | |
| $ | 1,000 | | | 5.63%, 01/01/2018 | | $ | 1,018 | |
| | | | | General Obligations — 14.0% |
| | | | | Brainerd, MN, ISD #181 GO FGIC | | | | |
| | 500 | | | 5.38%, 02/01/2016 | | | 538 | |
| | | | | Minneapolis, MN, Parking Assessment GO | | | | |
| | 250 | | | 5.00%, 12/01/2020 | | | 262 | |
| | | | | Puerto Rico Commonwealth | | | | |
| | 1,000 | | | 2.90%, 07/01/2031 (L) | | | 1,000 | |
| | 715 | | | 5.50%, 07/01/2032 (Q) | | | 715 | |
| | | | | Rosemount, MN, ISD #196 GO MBIA | | | | |
| | 1,950 | | | 5.70%, 04/01/2015 | | | 1,473 | |
| | | | | Todd, Morrison, Cass, & Wadena County, MN, Hospital Lakewood Health Care Fac | | | | |
| | 725 | | | 5.25%, 12/01/2026 | | | 694 | |
| | | | | Willmar, MN, Rice Memorial Hospital Proj FSA | | | | |
| | 250 | | | 5.00%, 02/01/2025 | | | 257 | |
| | | | | | | | | |
| | | | | | | | | | | | 4,939 | |
| | | | | | | | | | | | | |
| | | | | Health Care/Services — 19.3% |
| | | | | Bemidji, MN, Health Care Fac Ref, North Country Health Services | | | | |
| | 500 | | | 5.00%, 09/01/2021 — 09/01/2024 | | | 499 | |
| | | | | Chippewa County, MN, Gross Rev Montevideo Hospital Proj | | | | |
| | 500 | | | 5.50%, 03/01/2037 | | | 430 | |
| | | | | Hastings, MN, Housing Rev | | | | |
| | 500 | | | 5.25%, 11/01/2031 | | | 424 | |
| | | | | Inver Grove Heights, MN, Presbyterian Homes Care | | | | |
| | 350 | | | 5.50%, 10/01/2033 | | | 328 | |
| | | | | Minneapolis & St Paul, MN, Housing & Redev Auth Health Care | | | | |
| | 750 | | | 3.75%, 11/15/2034 (L) | | | 750 | |
| | | | | Northfield, MN, Hospital Rev | | | | |
| | 330 | | | 5.38%, 11/01/2031 | | | 299 | |
| | | | | Prior Lake, MN, Shepherds Path Sr Housing | | | | |
| | 350 | | | 5.75%, 08/01/2041 | | | 325 | |
| | | | | Rochester, MN, Health Care Fac Rev | | | | |
| | 1,000 | | | 5.00%, 11/15/2036 | | | 997 | |
| | 540 | | | 5.70%, 05/01/2022 (H) | | | 527 | |
| | | | | St Louis Park, MN, Roitenberg Family Assisted Proj | | | | |
| | 300 | | | 5.55%, 08/15/2029 | | | 268 | |
| | | | | St Paul, MN, Housing & Redev Auth Hospital Rev | | | | |
| | 335 | | | 6.00%, 11/15/2025 | | | 337 | |
| | | | | Winona, MN, Health Care Fac Rev | | | | |
| | 1,000 | | | 5.15%, 07/01/2031 | | | 915 | |
| | | | | Woodbury, MN Economic DA, Summerhouse Proj | | | | |
| | 500 | | | 5.75%, 06/01/2041 | | | 446 | |
| | | | | Worthington, MN, Housing Rev Ref, Meadows Worthington Proj | | | | |
| | 300 | | | 5.38%, 05/01/2037 | | | 251 | |
| | | | | | | | | |
| | | | | | | | | | | | 6,796 | |
| | | | | | | | | | | | | |
| | | | | Higher Education (Univ., Dorms, etc.) — 15.9% |
| | | | | Falcon Heights, MN, Lease Rev | | | | |
| | 225 | | | 6.00%, 11/01/2037 | | | 203 | |
| | | | | Minneapolis, MN, Housing Rev | | | | |
| | 400 | | | 5.00%, 10/01/2037 | | | 323 | |
| | | | | Minnesota Higher Education FA, Augsburg College | | | | |
| | 1,000 | | | 5.00%, 05/01/2020 — 05/01/2023 | | | 1,006 | |
| | | | | Minnesota Higher Education FA, College of St Benedict | | | | |
| | 350 | | | 5.25%, 03/01/2024 | | | 354 | |
| | | | | Minnesota Higher Education FA, Minneapolis College of Art and Design | | | | |
| | 300 | | | 5.00%, 05/01/2026 | | | 295 | |
| | | | | Ramsey, MN, Lease Rev Pact Charter School Proj | | | | |
| | 250 | | | 6.50%, 12/01/2022 | | | 249 | |
| | | | | St Paul, MN, Housing & Redev Auth, Achieve Language Academy | | | | |
| | 300 | | | 6.75%, 12/01/2022 | | | 297 | |
| | | | | St Paul, MN, Housing & Redev Auth, Hmong Academy Proj | | | | |
| | 260 | | | 6.00%, 09/01/2036 (H) | | | 239 | |
| | | | | St Paul, MN, Housing & Redev Auth, Hope Community Academy Proj | | | | |
| | 450 | | | 6.25%, 12/01/2019 | | | 453 | |
| | | | | St Paul, MN, Housing & Redev Auth, Lease Rev | | | | |
| | 825 | | | 5.00%, 12/01/2036 | | | 697 | |
| | | | | University of Minnesota | | | | |
| | 1,000 | | | 5.45%, 08/01/2031 (L) | | | 1,000 | |
| | | | | University Virgin Islands | | | | |
| | 270 | | | 5.13%, 12/01/2022 | | | 266 | |
| | 225 | | | 5.25%, 12/01/2023 — 12/01/2024 | | | 220 | |
| | | | | | | | | |
| | | | | | | | | | | | 5,602 | |
| | | | | | | | | | | | | |
| | | | | Housing (HFA’s, etc.) — 7.3% |
| | | | | Duluth, MN, Housing & Redev Auth | | | | |
| | 885 | | | 5.88%, 11/01/2033 | | | 805 | |
| | | | | Golden Valley, MN, Calvary Center Apts Proj AMT | | | | |
| | 500 | | | 4.85%, 12/20/2041 | | | 452 | |
| | | | | Minneapolis, MN, Multifamily Housing Rev AMT | | | | |
| | 350 | | | 5.40%, 04/01/2028 | | | 313 | |
| | | | | Minnesota Residential Housing Fin Agency | | | | |
| | 665 | | | 5.00%, 01/01/2020 | | | 651 | |
| | | | | Stillwater, MN, Multifamily Housing Rev AMT | | | | |
| | 400 | | | 5.38%, 02/01/2032 | | | 346 | |
| | | | | | | | | |
| | | | | | | | | | | | 2,567 | |
| | | | | | | | | | | | | |
| | | | | Industrial — 2.1% |
| | | | | Virgin Islands Public FA, Revhovenska Refinery | | | | |
| | 750 | | | 6.13%, 07/01/2022 | | | 752 | |
| | | | | Miscellaneous — 2.7% |
| | | | | Guam Economic DA, Tobacco Settlement | | | | |
| | 1,000 | | | 5.63%, 06/01/2047 | | | 958 | |
| | | | | Pollution Control — 1.4% |
| | | | | Cohasset, MN, Pollution Control Rev Ref Coll Allete Inc Proj | | | | |
| | 500 | | | 4.95%, 07/01/2022 | | | 495 | |
| | | | | Prerefunded — 20.5% |
| | | | | Becker, MN, ISD #726 GO FSA | | | | |
| | 1,300 | | | 6.00%, 02/01/2017 | | | 1,372 | |
| | | | | Duluth, MN, Econ DA Health Care Fac Rev Benedictine Health System St Mary’s | | | | |
| | 1,130 | | | 5.50%, 02/15/2023 # | | | 1,245 | |
| | | | | Golden Valley, MN, Breck School Proj Rev | | | | |
| | 1,000 | | | 5.88%, 10/01/2019 | | | 1,049 | |
The accompanying notes are an integral part of these financial statements.
262
| | | | | | | | | | | | | |
Principal
| | | | | | | | Market
| |
| Amount | | | | | | | | Value (W) | |
| | | | | | | | | | | | | |
| MUNICIPAL BONDS — (continued) |
| | | | | | | | | | | | | |
| | | | | Prerefunded — (continued) |
| | | | | Minneapolis, MN, Health Care System Allina Health | | | | |
| $ | 250 | | | 6.00%, 11/15/2018 | | $ | 281 | |
| | | | | Minnesota Agriculture and Econ Development Healthcare Fac, Benedictine Health | | | | |
| | 1,000 | | | 5.25%, 02/15/2014 | | | 1,059 | |
| | | | | University of Minnesota | | | | |
| | 1,000 | | | 5.75%, 07/01/2018 | | | 1,169 | |
| | | | | Waconia, MN, Health Care Fac Rev, Ridgeview Medical Center Proj | | | | |
| | 1,000 | | | 6.10%, 01/01/2019 | | | 1,058 | |
| | | | | | | | | |
| | | | | | | | | | | | 7,233 | |
| | | | | | | | | | | | | |
| | | | | Public Facilities — 3.3% |
| | | | | Minnesota Intermediate School Dist Lease Rev | | | | |
| | 370 | | | 5.30%, 11/01/2032 (H) | | | 331 | |
| | | | | Renville County, MN, Housing & Redev Auth, Health & Human Services | | | | |
| | 360 | | | 4.60%, 02/01/2027 | | | 330 | |
| | | | | St Paul, MN, PA Lease Rev | | | | |
| | 500 | | | 5.00%, 12/01/2019 | | | 520 | |
| | | | | | | | | |
| | | | | | | | | | | | 1,181 | |
| | | | | | | | | | | | | |
| | | | | Tax Allocation — 3.3% |
| | | | | Minneapolis, MN, Tax Increment Grant Park Proj | | | | |
| | 350 | | | 5.35%, 02/01/2030 | | | 310 | |
| | | | | Minnesota Agricultural Society, State Fair Rev | | | | |
| | 835 | | | 5.13%, 09/15/2023 | | | 856 | |
| | | | | | | | | |
| | | | | | | | | | | | 1,166 | |
| | | | | | | | | | | | | |
| | | | | Utilities — Electric — 2.3% |
| | | | | Chaska, MN, Electric Rev Ref Generating Fac | | | | |
| | 500 | | | 5.00%, 10/01/2030 | | | 504 | |
| | | | | Princeton, MN, Public Utility System Rev | | | | |
| | 300 | | | 5.00%, 04/01/2024 | | | 298 | |
| | | | | | | | | |
| | | | | | | | | | | | 802 | |
| | | | | | | | | | | | | |
| | | | | Utilities — Water and Sewer — 3.3% |
| | | | | Puerto Rico Commonwealth Aqueduct & Sewer Auth Rev | | | | |
| | 1,000 | | | 6.25%, 07/01/2013 # | | | 1,149 | |
| | | | | | | | | |
| | | | | Total municipal bonds
(cost $34,991) | | $ | 34,658 | |
| | | | | | | | | | | | | |
| | | | | | | | | | | | | |
| Shares | | | | | | | | | |
| |
| SHORT-TERM INVESTMENTS — 2.5% |
| | | | | Investment Pools and Funds — 2.5% |
| | 867 | | | State Street Bank Tax Free Money Market Fund | | $ | 867 | |
| | | | | | | | | |
| | | | | Total short-term investments
(cost $867) | | $ | 867 | |
| | | | | | | | | |
| | | | | Total investments
(cost $35,858) (C) | | | 100.8 | % | | $ | 35,525 | |
| | | | | Other assets and liabilities | | | (0.8 | )% | | | (268 | ) |
| | | | | | | | | | | | | |
| | | | | Total net assets | | | 100.0 | % | | $ | 35,257 | |
| | | | | | | | | | | | | |
| |
| Note: | Percentage of investments as shown is the ratio of the total market value to total net assets. |
| | |
| (C) | | At April 30, 2008, the cost of securities for federal income tax purposes was $35,858 and the aggregate gross unrealized appreciation and depreciation based on that cost were: |
| | | | | |
| Unrealized Appreciation | | $ | 870 | |
| Unrealized Depreciation | | | (1,203 | ) |
| | | | | |
| Net Unrealized Depreciation | | $ | (333 | ) |
| | | | | |
| | |
| # | | This security, or a portion of this security, has been segregated to cover funding requirements on investment transactions settling in the future. |
| |
| (L) | | Variable rate securities; the rate reported is the coupon rate in effect at April 30, 2008. |
| |
| (Q) | | The cost of securities purchased on a when-issued or delayed delivery basis at April 30, 2008 was $703. |
| |
| (H) | | The following securities are considered illiquid. Illiquid securities are often purchased in private placement transactions, are not registered under the Securities Act of 1933 and may have contractual restrictions on resale. A security may also be considered illiquid if the security lacks a readily available market or if its valuation has not changed for a certain period of time. |
| | | | | | | | | | | |
Period
| | | | | | | | |
Acquired | | Shares/Par | | | Security | | Cost Basis | |
09/2006-
11/2007 | | | 370 | | | Minnesota Intermediate School Dist Lease Rev, 5.30%, 11/01/2032 | | $ | 376 | |
| 11/2007 | | | 540 | | | Rochester, MN, Health Care Fac Rev, 5.70%, 05/01/2022 | | | 540 | |
| 09/2006 | | | 260 | | | St Paul, MN, Housing & Redev Auth, Hmong Academy Proj, 6.00%, 09/01/2036 | | | 262 | |
| | |
| | The aggregate value of these securities at April 30, 2008 was $1,097 which represents 3.11% of total net assets. |
| |
| (W) | | See Note 2b of accompanying Notes to Financial Statements regarding valuation of securities. |
| | | |
| AMT | | — Alternative Minimum Tax |
| DA | | — Development Authority |
| FA | | — Finance Authority |
| FGIC | | — Financial Guaranty Insurance Company |
| FSA | | — Financial Security Assurance |
| GO | | — General Obligations |
| ISD | | — Independent School District |
| MBIA | | — Municipal Bond Insurance Association |
| PA | | — Port Authority |
The accompanying notes are an integral part of these financial statements.
263
The Hartford Tax-Free National Fund
Schedule of Investments
April 30, 2008 (Unaudited)
(000’s Omitted)
| | | | | | | | | | | | | |
Principal
| | | | | | | | Market
| |
| Amount | | | | | | | | Value (W) | |
| MUNICIPAL BONDS — 98.4% |
| | | | | Alabama — 1.0% |
| | | | | Huntsville, AL, GO | | | | |
| $ | 1,855 | | | 5.25%, 05/01/2022 | | $ | 1,968 | |
| | | | | Alaska — 0.5% |
| | | | | Alaska Housing Finance Corp, Home Mortgage AMT | | | | |
| | 1,000 | | | 4.70%, 06/01/2027 # | | | 922 | |
| | | | | Arizona — 2.5% |
| | | | | Arizona Sundance Community Fac Dist, Special Assess Rev #2 | | | | |
| | 389 | | | 7.13%, 07/01/2027 (H) | | | 393 | |
| | | | | Estrella Mountain Ranch Community GO | | | | |
| | 265 | | | 6.20%, 07/15/2032 (H) | | | 252 | |
| | | | | Phoenix, AZ, GO | | | | |
| | 1,800 | | | 6.25%, 07/01/2017 | | | 2,155 | |
| | | | | Pima County, AZ, Charter Schools Proj | | | | |
| | 1,100 | | | 5.75%, 07/01/2016 (H) | | | 1,115 | |
| | | | | Pima County, AZ, Noah Webster Basic School | | | | |
| | 1,000 | | | 5.60%, 12/15/2019 | | | 999 | |
| | | | | Vistancia, AZ, Community Fac Dist GO | | | | |
| | 200 | | | 6.75%, 07/15/2022 (H) | | | 207 | |
| | | | | | | | | |
| | | | | | | | | | | | 5,121 | |
| | | | | | | | | | | | | |
| | | | | California — 16.2% |
| | | | | California Educational Fac Auth, University of the Pacific | | | | |
| | 1,000 | | | 5.00%, 11/01/2036 | | | 987 | |
| | | | | California Municipal FA, Biola University | | | | |
| | 1,665 | | | 5.80%, 10/01/2028 | | | 1,667 | |
| | | | | California State Public Works Board | | | | |
| | 1,000 | | | 5.25%, 06/01/2030 | | | 1,017 | |
| | | | | Capistrano, CA, USD Community Fac Dist Special Tax #90-2 Talega | | | | |
| | 250 | | | 5.90%, 09/01/2020 | | | 285 | |
| | | | | Central Basin Municipal Water Dist | | | | |
| | 2,500 | | | 4.95%, 08/01/2021 (L) | | | 2,500 | |
| | | | | Golden Empire Schools FA | | | | |
| | 975 | | | 4.95%, 08/01/2034 (L) | | | 975 | |
| | | | | Golden Empire Schools FA Lease Rev | | | | |
| | 5,000 | | | 5.00%, 08/01/2034 (L) | | | 5,000 | |
| | | | | Indio, CA, Public FA Rev Local Agency | | | | |
| | 625 | | | 5.63%, 09/02/2018 | | | 600 | |
| | | | | Indio, CA, Public Improvement Act Special Assessment #2002-3 GO | | | | |
| | 38 | | | 6.35%, 09/02/2027 | | | 37 | |
| | | | | Jurupa, CA, Community Services Dist Special Tax Dist #6 | | | | |
| | 400 | | | 5.88%, 09/01/2032 | | | 374 | |
| | | | | Lathrop, CA, FA Rev Water Supply Proj | | | | |
| | 750 | | | 6.00%, 06/01/2035 | | | 709 | |
| | | | | Moreno Valley, CA, USD Community Fac Dist Special Tax #2002-1 | | | | |
| | 500 | | | 6.00%, 09/01/2022 | | | 495 | |
| | | | | Morongo Band of Mission Indians Enterprise Rev | | | | |
| | 2,655 | | | 6.50%, 03/01/2028 | | | 2,664 | |
| | | | | Oceanside, CA, Community Development Committee, Downtown Redev Proj | | | | |
| | 700 | | | 5.70%, 09/01/2025 | | | 718 | |
| | | | | Palm Springs, CA, Community Redev Agency | | | | |
| | 535 | | | 5.50%, 09/01/2023 | | | 550 | |
| | | | | Perris, CA, Public FA Local Agency Rev | | | | |
| | 495 | | | 6.25%, 09/01/2033 | | | 484 | |
| | | | | Pomona, CA, Public FA Rev Sub-Merged Redev | | | | |
| | 1,000 | | | 5.50%, 02/01/2023 | | | 1,103 | |
| | | | | San Diego, CA, Redev Agency Centre City Sub Pkg | | | | |
| | 500 | | | 5.25%, 09/01/2026 | | | 498 | |
| | | | | San Jose, CA, Santa Clara County University | | | | |
| | 1,800 | | | 4.91%, 08/01/2027 | | | 646 | |
| | | | | San Manuel, CA, Entertainment Auth Public Improvement | | | | |
| | 1,000 | | | 4.50%, 12/01/2016 (H) | | | 953 | |
| | | | | Val Verde, CA, USD FA Special Tax Rev Jr Lien | | | | |
| | 800 | | | 6.00%, 10/01/2021 | | | 813 | |
| | | | | Vernon, CA, Natural Gas FA | | | | |
| | 10,000 | | | 5.00%, 08/01/2021 | | | 9,991 | |
| | | | | | | | | |
| | | | | | | | | | | | 33,066 | |
| | | | | | | | | | | | | |
| | | | | Colorado — 5.8% |
| | | | | Antelope Heights Metro Dist GO | | | | |
| | 1,125 | | | 5.00%, 12/01/2037 | | | 1,043 | |
| | | | | Arapaho County, CO, Conservatory Metro Dist | | | | |
| | 2,000 | | | 5.13%, 12/01/2037 | | | 1,951 | |
| | | | | Bromley Park, CO, Metro Dist #2 GO | | | | |
| | 2,000 | | | 5.13%, 12/01/2037 | | | 1,894 | |
| | | | | Colorado Educational & Cultural Fac Auth, Charter School Banning Lewis | | | | |
| | 1,000 | | | 6.13%, 12/15/2035 (H) | | | 908 | |
| | | | | Denver, CO, Rendezvous Residential Metro Dist GO | | | | |
| | 600 | | | 5.38%, 12/01/2021 | | | 537 | |
| | | | | Ebert Metro Dist | | | | |
| | 3,000 | | | 5.35%, 12/01/2037 | | | 2,969 | |
| | | | | Fort Collins, CO, PCR Ref, Anheuser Busch Proj | | | | |
| | 1,000 | | | 4.70%, 09/01/2040 | | | 869 | |
| | | | | Pinery West, CO, Metro Dist #2 GO | | | | |
| | 1,000 | | | 4.50%, 12/01/2032 | | | 866 | |
| | | | | Reata, CO, North Metro Dist GO | | | | |
| | 1,000 | | | 5.50%, 12/01/2032 (H) | | | 794 | |
| | | | | | | | | |
| | | | | | | | | | | | 11,831 | |
| | | | | | | | | | | | | |
| | | | | Florida — 10.9% |
| | | | | Amelia Walk Community Development | | | | |
| | 1,000 | | | 5.50%, 05/01/2037 (H) | | | 801 | |
| | | | | Bellalgo, FL, Education Fac Benefits Dist Capital | | | | |
| | 925 | | | 5.85%, 05/01/2022 (H) | | | 914 | |
| | | | | Colonial Country Club Community Development Dist, Capital Improvement Rev | | | | |
| | 480 | | | 6.40%, 05/01/2033 | | | 491 | |
| | | | | Florida Dept of Environmental Protection Preservation, MBIA | | | | |
| | 1,250 | | | 5.38%, 07/01/2015 # | | | 1,351 | |
| | | | | Florida Gateway Services Community Development Dist, Special Assessment Sun City Center Fort Meyers Proj | | | | |
| | 145 | | | 5.50%, 05/01/2010 | | | 143 | |
| | | | | Jacksonville, FL, Econ Development Community Health Care Facilities | | | | |
| | 5,000 | | | 6.25%, 09/01/2027 (H) | | | 4,820 | |
| | | | | Jacksonville, FL, Econ Development Rev AMT | | | | |
| | 2,000 | | | 4.75%, 03/01/2047 | | | 1,667 | |
The accompanying notes are an integral part of these financial statements.
264
| | | | | | | | | | | | | |
Principal
| | | | | | | | Market
| |
| Amount | | | | | | | | Value (W) | |
| | | | | | | | | | | | | |
| MUNICIPAL BONDS — (continued) |
| | | | | | | | | | | | | |
| | | | | Florida — (continued) |
| | | | | Lake Worth, FL, Utility System Rev | | | | |
| $ | 5,000 | | | 5.18%, 10/01/2034 (L) | | $ | 5,000 | |
| | | | | Lee County, FL, Industrial DA | | | | |
| | 1,500 | | | 5.25%, 06/15/2027 | | | 1,286 | |
| | | | | Palm Beach County, FL, Health FA Rev Waterford Proj | | | | |
| | 3,300 | | | 5.75%, 11/15/2026 | | | 3,083 | |
| | | | | River Bend Community Development Dist, Capital Improvement Rev | | | | |
| | 1,000 | | | 7.13%, 11/01/2015 | | | 973 | |
| | | | | Rolling Hills Community Development Dist | | | | |
| | 100 | | | 5.45%, 05/01/2037 | | | 80 | |
| | | | | Tolomato, FL, Community Development Dist | | | | |
| | 1,200 | | | 6.65%, 05/01/2040 | | | 1,144 | |
| | | | | University Square Community Development | | | | |
| | 500 | | | 5.88%, 05/01/2038 | | | 437 | |
| | | | | | | | | |
| | | | | | | | | | | | 22,190 | |
| | | | | | | | | | | | | |
| | | | | Georgia — 7.0% |
| | | | | Fulton County, GA, School Dist GO | | | | |
| | 1,105 | | | 5.38%, 01/01/2018 | | | 1,245 | |
| | | | | Fulton County, GA, Water & Sewer Rev FGIC | | | | |
| | 35 | | | 6.38%, 01/01/2014 | | | 39 | |
| | | | | Fulton County, GA, Water & Sewer Rev FGIC Part (Prerefunded with Cash Escrow) | | | | |
| | 1,765 | | | 6.38%, 01/01/2014 | | | 1,953 | |
| | | | | Georgia Municipal Electric Auth, Power Rev | | | | |
| | 985 | | | 6.50%, 01/01/2017 | | | 1,150 | |
| | | | | Georgia Municipal Electric Auth, Power Rev (Prerefunded with US Gov’t Securities) | | | | |
| | 15 | | | 6.50%, 01/01/2017 | | | 17 | |
| | | | | Main Street Natural Gas, Inc., Gas Rev | | | | |
| | 10,000 | | | 6.25%, 07/15/2028 | | | 9,886 | |
| | | | | | | | | |
| | | | | | | | | | | | 14,290 | |
| | | | | | | | | | | | | |
| | | | | Illinois — 7.1% |
| | | | | Bolingbrook, IL, Sales Tax Rev | | | | |
| | 445 | | | 6.25%, 01/01/2024 | | | 452 | |
| | | | | Chicago, IL, Board of Education GO MBIA | | | | |
| | 960 | | | 5.25%, 12/01/2019 | | | 1,014 | |
| | | | | Chicago, IL, O’Hare International Airport Special Fac Rev, American Airlines Inc. | | | | |
| | 750 | | | 5.50%, 12/01/2030 | | | 455 | |
| | | | | Chicago, IL, Tax Increment Allocation Jr Lien Pilsen Redev B | | | | |
| | 1,000 | | | 6.75%, 06/01/2022 | | | 1,033 | |
| | | | | Hampshire, IL, Special Service Area #13, Tuscany Woods Proj | | | | |
| | 1,800 | | | 5.75%, 03/01/2037 | | | 1,521 | |
| | | | | Hampshire, IL, Special Service Area #16, Prairie Ridge Proj | | | | |
| | 800 | | | 6.00%, 03/01/2046 | | | 694 | |
| | | | | Huntley, IL, Special Service Area #9 | | | | |
| | 1,500 | | | 5.10%, 03/01/2028 | | | 1,502 | |
| | | | | Illinois Education FA, Augustana College Ser A | | | | |
| | 500 | | | 5.70%, 10/01/2032 | | | 507 | |
| | | | | Illinois FA | | | | |
| | 1,500 | | | 5.38%, 08/15/2039 (Q) | | | 1,468 | |
| | 1,500 | | | 5.50%, 08/15/2028 (Q) | | | 1,514 | |
| | 310 | | | 6.25%, 02/01/2033 | | | 335 | |
| | | | | Plano, IL, Lakewood Springs Proj Special Services Area | | | | |
| | 497 | | | 6.10%, 03/01/2035 | | | 466 | |
| | | | | Round Lake, IL, Special Tax Rev | | | | |
| | 965 | | | 4.70%, 03/01/2033 | | | 911 | |
| | 498 | | | 6.70%, 03/01/2033 | | | 570 | |
| | | | | Wauconda, IL, Special Service Area #1 Special Tax Liberty Lakes Proj | | | | |
| | 1,000 | | | 6.63%, 03/01/2033 | | | 1,022 | |
| | | | | Yorkville, IL, United City Special Service Area Tax Raintree Village Proj | | | | |
| | 947 | | | 6.88%, 03/01/2033 (H) | | | 964 | |
| | | | | | | | | |
| | | | | | | | | | | | 14,428 | |
| | | | | | | | | | | | | |
| | | | | Indiana — 0.3% |
| | | | | East Chicago Industrial Solid Waste Disposal AMT | | | | |
| | 700 | | | 5.50%, 09/01/2028 | | | 603 | |
| | | | | Iowa — 0.4% |
| | | | | Iowa FA, Single Family Mortgage Rev AMT | | | | |
| | 1,000 | | | 4.80%, 01/01/2037 | | | 871 | |
| | | | | Kansas — 0.8% |
| | | | | La Cygne, KS, Kansas City Power & Light | | | | |
| | 260 | | | 4.65%, 09/01/2035 | | | 239 | |
| | | | | Lawrence, KS, Lawrence Memorial Hospital | | | | |
| | 500 | | | 5.13%, 07/01/2036 | | | 484 | |
| | | | | Salina, KS, Salina Regional Health Hospital Rev | | | | |
| | 1,000 | | | 4.63%, 10/01/2031 | | | 920 | |
| | | | | | | | | |
| | | | | | | | 1,643 | |
| | | | | | | | | |
| | | | | Kentucky — 0.1% |
| | | | | Boone County, KY, Pollution Control Dayton Power & Light | | | | |
| | 150 | | | 4.70%, 01/01/2028 | | | 139 | |
| | | | | Louisiana — 1.7% |
| | | | | Louisiana Public Fac Auth, Ochsner Clinic Foundation Proj | | | | |
| | 500 | | | 5.50%, 05/15/2027 | | | 562 | |
| | | | | Louisiana Public Fac Auth, Oschner Clinic Foundation Proj | | | | |
| | 2,000 | | | 5.50%, 05/15/2047 | | | 1,920 | |
| | | | | Louisiana Public Fac Auth, Susla Fac Inc | | | | |
| | 1,000 | | | 5.75%, 07/01/2039 (H) | | | 901 | |
| | | | | | | | | |
| | | | | | | | | | | | 3,383 | |
| | | | | | | | | | | | | |
| | | | | Maryland — 1.3% |
| | | | | Maryland Econ Development Corp, Student Housing Rev University of Maryland College Park Proj | | | | |
| | 1,000 | | | 6.50%, 06/01/2027 | | | 1,161 | |
| | | | | Maryland State Health and Higher Education FA Rev | | | | |
| | 1,385 | | | 6.00%, 01/01/2028 | | | 1,390 | |
| | | | | | | | | |
| | | | | | | | | | | | 2,551 | |
| | | | | | | | | | | | | |
| | | | | Massachusetts — 0.5% |
| | | | | Massachusetts, GO Consolidated Loan | | | | |
| | 940 | | | 5.25%, 03/01/2021 | | | 1,010 | |
The accompanying notes are an integral part of these financial statements.
265
The Hartford Tax-Free National Fund
Schedule of Investments — (continued)
April 30, 2008 (Unaudited)
(000’s Omitted)
| | | | | | | | | | | | | |
Principal
| | | | | | | | Market
| |
| Amount | | | | | | | | Value (W) | |
| | | | | | | | | | | | | |
| MUNICIPAL BONDS — (continued) |
| | | | | | | | | | | | | |
| | | | | Massachusetts — (continued) |
| | | | | Massachusetts, GO Consolidated Loan FSA (Prerefunded with US Gov’t Securities) | | | | |
| $ | 60 | | | 5.25%, 03/01/2021 | | $ | 64 | |
| | | | | | | | | |
| | | | | | | | | | | | 1,074 | |
| | | | | | | | | | | | | |
| | | | | Michigan — 2.3% |
| | | | | Detroit, MI, GO MBIA | | | | |
| | 500 | | | 5.50%, 04/01/2020 | | | 538 | |
| | | | | Detroit, MI, Water Supply System Ref Rev FGIC | | | | |
| | 1,750 | | | 6.50%, 07/01/2015 | | | 1,991 | |
| | | | | Macomb County, MI, Hospital FA, Mt Clemens Hospital | | | | |
| | 1,000 | | | 5.75%, 11/15/2025 | | | 932 | |
| | | | | Michigan Hospital FA, Rev Ref Henry Ford Health System | | | | |
| | 500 | | | 5.63%, 03/01/2017 | | | 547 | |
| | | | | Michigan Strategic Fund Ltd, Rev Ref Dow Chemical Proj AMT | | | | |
| | 750 | | | 5.50%, 12/01/2028 | | | 771 | |
| | | | | | | | | |
| | | | | | | | | | | | 4,779 | |
| | | | | | | | | | | | | |
| | | | | Minnesota — 2.4% |
| | | | | Inver Grove Heights, MN, Presbyterian Homes Care | | | | |
| | 175 | | | 5.50%, 10/01/2033 | | | 164 | |
| | | | | Minneapolis, MN, Health Care System Allina Health | | | | |
| | 750 | | | 6.00%, 11/15/2018 | | | 844 | |
| | | | | Minnesota Residential Housing Fin Agency | | | | |
| | 660 | | | 5.00%, 01/01/2020 # | | | 646 | |
| | | | | Ramsey, MN, Lease Rev Pact Charter School Proj | | | | |
| | 500 | | | 6.50%, 12/01/2022 | | | 497 | |
| | | | | Rochester, MN, Health Care Fac Rev | | | | |
| | 790 | | | 5.70%, 05/01/2022 (H) | | | 771 | |
| | | | | St Paul, MN, Housing & Redev Auth Lease Rev | | | | |
| | 860 | | | 6.00%, 12/01/2018 | | | 859 | |
| | | | | St Paul, MN, Housing & Redev Auth, Achieve Language Academy | | | | |
| | 500 | | | 6.75%, 12/01/2022 | | | 496 | |
| | | | | St Paul, MN, Housing & Redev Auth, Hmong Academy Proj | | | | |
| | 740 | | | 6.00%, 09/01/2036 (H) | | | 681 | |
| | | | | | | | | |
| | | | | | | | | | | | 4,958 | |
| | | | | | | | | | | | | |
| | | | | Mississippi — 0.1% |
| | | | | Lowndes County, MS, Solid Waste Disposal & Pollution Control Rev Ref Weyerhaeuser Co Proj | | | | |
| | 250 | | | 6.80%, 04/01/2022 | | | 268 | |
| | | | | Missouri — 1.4% |
| | | | | Branson Hills, MO, Infrastructure Fac | | | | |
| | 650 | | | 5.50%, 04/01/2027 | | | 569 | |
| | | | | Lees Summit, MO, Industrial DA, Kensington Farms Improvement Proj | | | | |
| | 1,000 | | | 5.75%, 03/01/2029 (H) | | | 902 | |
| | | | | St Louis, MO, Industrial DA, Confluence Academy Proj | | | | |
| | 550 | | | 5.35%, 06/15/2032 (H) | | | 467 | |
| | | | | Stone Canyon, MO, Community Improvement Proj | | | | |
| | 1,000 | | | 5.75%, 04/01/2027 | | | 894 | |
| | | | | | | | | |
| | | | | | | | | | | | 2,832 | |
| | | | | | | | | | | | | |
| | | | | Nevada — 1.2% |
| | | | | Clark County, NV, Improvement Dist #142 | | | | |
| | 980 | | | 6.38%, 08/01/2023 | | | 960 | |
| | | | | Reno, NV, Renown Regional Medical Center Proj | | | | |
| | 1,485 | | | 5.25%, 06/01/2032 | | | 1,409 | |
| | | | | | | | | |
| | | | | | | | | | | | 2,369 | |
| | | | | | | | | | | | | |
| | | | | New Hampshire — 0.4% |
| | | | | New Hampshire Health & Education Fac, Elliot Hospital | | | | |
| | 750 | | | 5.60%, 10/01/2022 | | | 780 | |
| | | | | New Jersey — 1.2% |
| | | | | New Jersey Education Fac, Fairleigh Dickinson University | | | | |
| | 275 | | | 6.00%, 07/01/2025 | | | 279 | |
| | | | | New Jersey Tobacco Settlement Financing Corp | | | | |
| | 1,950 | | | 6.13%, 06/01/2024 | | | 2,075 | |
| | | | | | | | | |
| | | | | | | | | | | | 2,354 | |
| | | | | | | | | | | | | |
| | | | | New Mexico — 2.2% |
| | | | | Cabezon, NM, Public Improvement Dist | | | | |
| | 665 | | | 5.20%, 09/01/2015 (H) | | | 652 | |
| | | | | New Mexico Mortgage FA AMT | | | | |
| | 985 | | | 4.75%, 01/01/2031 | | | 877 | |
| | | | | New Mexico Mtg FA AMT | | | | |
| | 2,600 | | | 6.15%, 07/01/2037 | | | 2,660 | |
| | | | | Otero County, NM, Jail Proj | | | | |
| | 400 | | | 6.00%, 04/01/2023 | | | 375 | |
| | | | | | | | | |
| | | | | | | | | | | | 4,564 | |
| | | | | | | | | | | | | |
| | | | | New York — 6.2% |
| | | | | Dutchess County, NY, IDA Civic Fac Rev Ref, Marist College | | | | |
| | 250 | | | 5.00%, 07/01/2022 | | | 254 | |
| | | | | Erie County, NY, IDA Applied Tech Charter School Proj | | | | |
| | 550 | | | 6.75%, 06/01/2025 | | | 519 | |
| | | | | Nassau County, NY, IDA Continuing Care Retirement, Amsterdam at Harborside Ser A | | | | |
| | 1,000 | | | 6.50%, 01/01/2027 | | | 986 | |
| | | | | New York State Dormitory Auth Non State Supported Debt, Orange Regional Med Center | | | | |
| | 3,125 | | | 6.13%, 12/01/2029 (Q) | | | 3,131 | |
| | | | | New York, NY, GO | | | | |
| | 75 | | | 5.75%, 03/01/2019 | | | 83 | |
| | | | | New York, NY, IDA American Airlines JFK International Airport AMT | | | | |
| | 1,060 | | | 7.13%, 08/01/2011 | | | 1,046 | |
| | | | | New York, NY, IDA Terminal One Group Assoc Proj AMT | | | | |
| | 1,000 | | | 5.50%, 01/01/2024 | | | 1,016 | |
| | | | | Seneca Nation Indians Capital Improvement Special Tax | | | | |
| | 1,000 | | | 5.00%, 12/01/2023 (H) | | | 881 | |
The accompanying notes are an integral part of these financial statements.
266
| | | | | | | | | | | | | |
Principal
| | | | | | | | Market
| |
| Amount | | | | | | | | Value (W) | |
| | | | | | | | | | | | | |
| MUNICIPAL BONDS — (continued) |
| | | | | | | | | | | | | |
| | | | | New York — (continued) |
| | | | | Ulster County, NY, IDA Kingston Regional Senior Living Proj | | | | |
| $ | 3,975 | | | 6.00%, 09/15/2027 | | $ | 3,774 | |
| | | | | Utica, NY, IDA Civic Fac Rev, Utica College | | | | |
| | 560 | | | 6.88%, 12/01/2014 | | | 593 | |
| | | | | Westchester County, NY, IDA Continuing Care Retirement, Kendal on Hudson Proj | | | | |
| | 400 | | | 6.38%, 01/01/2024 | | | 401 | |
| | | | | | | | | |
| | | | | | | | | | | | 12,684 | |
| | | | | | | | | | | | | |
| | | | | North Carolina — 1.0% |
| | | | | North Carolina Municipal Power Agency, Catawba Elec Rev | | | | |
| | 500 | | | 5.50%, 01/01/2014 | | | 538 | |
| | | | | Raleigh, NC, Medical Care Commission Retirement Fac Rev | | | | |
| | 2,000 | | | 5.25%, 01/01/2032 | | | 1,601 | |
| | | | | | | | | |
| | | | | | | | | | | | 2,139 | |
| | | | | | | | | | | | | |
| | | | | Ohio — 0.9% |
| | | | | Cuyahoga County, OH, Rev Ref Class A | | | | |
| | 300 | | | 5.50%, 01/01/2029 | | | 306 | |
| | | | | Hamilton, OH, School Dist Improvement | | | | |
| | 1,270 | | | 6.15%, 12/01/2016 # | | | 1,504 | |
| | | | | | | | | |
| | | | | | | | | | | | 1,810 | |
| | | | | | | | | | | | | |
| | | | | Oklahoma — 0.6% |
| | | | | Tulsa County, OK, St Francis Health Care System | | | | |
| | 1,210 | | | 5.00%, 12/15/2029 | | | 1,191 | |
| | | | | Other U.S. Territories — 0.4% |
| | | | | Virgin Islands Public FA, Revhovenska Refinery | | | | |
| | 750 | | | 6.13%, 07/01/2022 | | | 752 | |
| | | | | Pennsylvania — 4.7% |
| | | | | Delaware River PA | | | | |
| | 5,000 | | | 4.40%, 01/01/2026 (L)# | | | 5,000 | |
| | | | | Montgomery County, PA, IDA Whitemarsh Continuing Care Proj | | | | |
| | 800 | | | 6.13%, 02/01/2028 (H) | | | 742 | |
| | | | | Pennsylvania State Higher Educational FA Rev | | | | |
| | 2,145 | | | 5.75%, 07/01/2028 | | | 2,080 | |
| | | | | Scranton Parking Auth | | | | |
| | 1,825 | | | 5.25%, 06/01/2034 | | | 1,777 | |
| | | | | | | | | |
| | | | | | | | | | | | 9,599 | |
| | | | | | | | | | | | | |
| | | | | Rhode Island — 0.6% |
| | | | | Central Falls, RI, Detention FA Fac Rev | | | | |
| | 1,000 | | | 6.75%, 01/15/2013 | | | 1,021 | |
| | | | | Rhode Island Health & Education Bldg Corp Fin | | | | |
| | 250 | | | 6.50%, 08/15/2032 | | | 285 | |
| | | | | | | | | |
| | | | | | | | | | | | 1,306 | |
| | | | | | | | | | | | | |
| | | | | South Carolina — 4.6% |
| | | | | Dorchester County, SC, School Dist #2 Installment Purchase | | | | |
| | 1,000 | | | 5.25%, 12/01/2024 | | | 1,021 | |
| | | | | Lancaster County, SC, Sun City Carolina Lakes Improvement | | | | |
| | 750 | | | 5.45%, 12/01/2037 | | | 592 | |
| | | | | South Carolina Jobs Econ DA Rev | | | | |
| | 2,000 | | | 4.70%, 04/01/2035 | | | 1,785 | |
| | | | | Tobacco Settlement Rev Management Auth | | | | |
| | 6,000 | | | 6.38%, 05/15/2028 | | | 6,040 | |
| | | | | | | | | |
| | | | | | | | | | | | 9,438 | |
| | | | | | | | | | | | | |
| | | | | Tennessee — 0.1% |
| | | | | McMinn County, TN, IDA PCR Calhoun Newsprint Co Proj | | | | |
| | 500 | | | 7.63%, 03/01/2016 | | | 300 | |
| | | | | Texas — 5.7% |
| | | | | Brazoria, TX, Brazos River Habor Navigation Dow Chemical Co | | | | |
| | 1,500 | | | 4.95%, 05/15/2033 # | | | 1,351 | |
| | | | | Guadalupe County, TX, Board Managers Joint Rev | | | | |
| | 3,000 | | | 5.50%, 08/15/2036 | | | 3,049 | |
| | | | | Maverick County, TX, Public Fac Corp Proj Rev | | | | |
| | 490 | | | 6.25%, 02/01/2024 | | | 445 | |
| | | | | North Texas Tollway Auth | | | | |
| | 4,000 | | | 6.00%, 01/01/2025 | | | 4,300 | |
| | | | | Travis County, TX, Health Fac, Querencia Barton Creek Project | | | | |
| | 1,000 | | | 5.65%, 11/15/2035 | | | 870 | |
| | | | | Willacy County, TX, Corp Revival Proj (Prerefunded with cash Escrow) | | | | |
| | 540 | | | 6.00%, 03/01/2009 | | | 555 | |
| | | | | Willacy County, TX, GO | | | | |
| | 1,000 | | | 6.88%, 09/01/2028 | | | 989 | |
| | | | | | | | | |
| | | | | | | | | | | | 11,559 | |
| | | | | | | | | | | | | |
| | | | | Vermont — 1.2% |
| | | | | Vermont Educational & Health Buildings FA Rev | | | | |
| | 2,500 | | | 4.82%, 09/01/2036 (L) | | | 2,500 | |
| | | | | Virginia — 3.0% |
| | | | | James City County, VA, Econ DA Residential Care Fac | | | | |
| | 840 | | | 5.40%, 07/01/2027 | | | 737 | |
| | 2,000 | | | 5.50%, 07/01/2037 | | | 1,676 | |
| | | | | Norfolk, VA, Redev & Housing Auth First Mortgage Retirement Community | | | | |
| | 500 | | | 6.00%, 01/01/2025 | | | 471 | |
| | | | | Peninsula, VA, PA Fac, CSX Transport Proj Rev | | | | |
| | 1,000 | | | 6.00%, 12/15/2012 | | | 1,049 | |
| | | | | Peninsula, VA, Turn Center Community Dev DA | | | | |
| | 700 | | | 6.45%, 09/01/2037 | | | 650 | |
| | | | | Virginia Tobacco Settlement Funding Corp | | | | |
| | 1,455 | | | 5.50%, 06/01/2026 | | | 1,601 | |
| | | | | | | | | |
| | | | | | | | | | | | 6,184 | |
| | | | | | | | | | | | | |
| | | | | Washington — 1.4% |
| | | | | King County, WA, ISD #210 GO | | | | |
| | 670 | | | 5.00%, 06/01/2019 | | | 697 | |
| | | | | Washington State Health Care FA Rev | | | | |
| | 2,400 | | | 6.13%, 08/15/2037 (H) | | | 2,184 | |
| | | | | | | | | |
| | | | | | | | | | | | 2,881 | |
| | | | | | | | | | | | | |
| | | | | Wisconsin — 0.7% |
| | | | | Badger Tobacco Asset Securitization Corp. of WI | | | | |
| | 1,000 | | | 6.38%, 06/01/2032 | | | 1,004 | |
The accompanying notes are an integral part of these financial statements.
267
The Hartford Tax-Free National Fund
Schedule of Investments — (continued)
April 30, 2008 (Unaudited)
(000’s Omitted)
| | | | | | | | | | | | | |
Principal
| | | | | | | | Market
| |
| Amount | | | | | | | | Value (W) | |
| | | | | | | | | | | | | |
| MUNICIPAL BONDS — (continued) |
| | | | | | | | | | | | | |
| | | | | Wisconsin — (continued) |
| | | | | Wisconsin Housing & Econ DA, GO Home Ownership Rev | | | | |
| $ | 345 | | | 4.85%, 09/01/2017 | | $ | 342 | |
| | | | | | | | | |
| | | | | | | | 1,346 | |
| | | | | | | | | |
| | | | | Total municipal bonds
(cost $204,778) | | $ | 200,673 | |
| | | | | | | | | | | | | |
| | | | | | | | | | | | | |
| Shares | | | | | | | | | |
| |
| SHORT-TERM INVESTMENTS — 4.2% |
| | | | | Investment Pools and Funds — 4.2% |
| | 8,635 | | | State Street Bank Tax Free Money Market Fund | | $ | 8,635 | |
| | | | | | | | | |
| | | | | Total short-term investments
(cost $8,635) | | $ | 8,635 | |
| | | | | | | | | |
| | | | | Total investments
(cost $213,413) (C) | | | 102.6 | % | | $ | 209,308 | |
| | | | | Other assets and liabilities | | | (2.6 | )% | | | (5,350 | ) |
| | | | | | | | | | | | | |
| | | | | Total net assets | | | 100.0 | % | | $ | 203,958 | |
| | | | | | | | | | | | | |
| |
| Note: | Percentage of investments as shown is the ratio of the total market value to total net assets. |
| | |
| (C) | | At April 30, 2008, the cost of securities for federal income tax purposes was $213,413 and the aggregate gross unrealized appreciation and depreciation based on that cost were: |
| | | | | |
| Unrealized Appreciation | | $ | 3,132 | |
| Unrealized Depreciation | | | (7,237 | ) |
| | | | | |
| Net Unrealized Depreciation | | $ | (4,105 | ) |
| | | | | |
| | |
| # | | This security, or a portion of this security, has been segregated to cover funding requirements on investment transactions settling in the future. |
| |
| (L) | | Variable rate securities; the rate reported is the coupon rate in effect at April 30, 2008. |
| |
| (Q) | | The cost of securities purchased on a when-issued or delayed delivery basis at April 30, 2008 was $6,042. |
| |
| (H) | | The following securities are considered illiquid. Illiquid securities are often purchased in private placement transactions, are not registered under the Securities Act of 1933 and may have contractual restrictions on resale. A security may also be considered illiquid if the security lacks a readily available market or if its valuation has not changed for a certain period of time. |
| | | | | | | | | | | |
Period
| | | | | | | | |
Acquired | | Shares/Par | | | Security | | Cost Basis | |
| 06/2006 | | | 1,000 | | | Amelia Walk Community Development, 5.50%, 05/01/2037 | | $ | 1,000 | |
| 04/2003 | | | 389 | | | Arizona Sundance Community Fac Dist, Special Assess Rev #2, 7.13%, 07/01/2027 - 144A | | | 389 | |
| 04/2004 | | | 925 | | | Bellalgo, FL, Education Fac Benefits Dist Capital, 5.85%, 05/01/2022 | | | 925 | |
| 01/2005 | | | 665 | | | Cabezon, NM, Public Improvement Dist, 5.20%, 09/01/2015 | | | 665 | |
| 06/2006 | | | 1,000 | | | Colorado Educational & Cultural Fac Auth, Charter School Banning Lewis, 6.13%, 12/15/2035 - 144A | | | 1,000 | |
| 11/2007 | | | 265 | | | Estrella Mountain Ranch Community GO, 6.20%, 07/15/2032 | | | 265 | |
| 08/2007 | | | 5,000 | | | Jacksonville, FL, Econ Development Community Health Care Facilities, 6.25%, 09/01/2027 | | | 5,053 | |
| 04/2007 | | | 1,000 | | | Lees Summit, MO, Industrial DA, Kensington Farms Improvement Proj, 5.75%, 03/01/2029 | | | 1,024 | |
| 07/2007 | | | 1,000 | | | Louisiana Public Fac Auth, Susla Fac Inc, 5.75%, 07/01/2039 - 144A | | | 1,007 | |
| 01/2005 | | | 800 | | | Montgomery County, PA, IDA Whitemarsh Continuing Care Proj, 6.13%, 02/01/2028 | | | 789 | |
| 04/2004 | | | 1,100 | | | Pima County, AZ, Charter Schools Proj, 5.75%, 07/01/2016 | | | 1,100 | |
| 04/2007 | | | 1,000 | | | Reata, CO, North Metro Dist GO, 5.50%, 12/01/2032 - 144A | | | 1,000 | |
| 11/2007 | | | 790 | | | Rochester, MN, Health Care Fac Rev, 5.70%, 05/01/2022 | | | 790 | |
| 11/2004 | | | 1,000 | | | San Manuel, CA, Entertainment Auth Public Improvement, 4.50%, 12/01/2016 - 144A | | | 1,000 | |
| 04/2007 | | | 1,000 | | | Seneca Nation Indians Capital Improvement Special Tax, 5.00%, 12/01/2023 - 144A | | | 995 | |
| 02/2007 | | | 550 | | | St Louis, MO, Industrial DA, Confluence Academy Proj, 5.35%, 06/15/2032 | | | 550 | |
| 09/2006 | | | 740 | | | St Paul, MN, Housing & Redev Auth, Hmong Academy Proj, 6.00%, 09/01/2036 | | | 745 | |
| 12/2002 | | | 200 | | | Vistancia, AZ, Community Fac Dist GO, 6.75%, 07/15/2022 | | | 200 | |
| 11/2007 | | | 2,400 | | | Washington State Health Care FA Rev, 6.13%, 08/15/2037 | | | 2,360 | |
| 08/2003 | | | 947 | | | Yorkville, IL, United City Special Service Area Tax Raintree Village Proj, 6.88%, 03/01/2033 | | | 947 | |
| | |
| | The aggregate value of these securities at April 30, 2008 was $20,302 which represents 9.95% of total net assets. |
| |
| (W) | | See Note 2b of accompanying Notes to Financial Statements regarding valuation of securities. |
| | | |
| AMT | | — Alternative Minimum Tax |
| DA | | — Development Authority |
| FA | | — Finance Authority |
| FGIC | | — Financial Guaranty Insurance Company |
| FSA | | — Financial Security Assurance |
| GO | | — General Obligations |
| IDA | | — Industrial Development Authority Bond |
| ISD | | — Independent School District |
| MBIA | | — Municipal Bond Insurance Association |
| PA | | — Port Authority |
| PCR | | — Pollution Control Revenue Bond |
| USD | | — United School District |
The accompanying notes are an integral part of these financial statements.
268
The Hartford Tax-Free New York Fund
Schedule of Investments
April 30, 2008 (Unaudited)
(000’s Omitted)
| | | | | | | | | | | | | |
Principal
| | | | | | | | Market
| |
| Amount | | | | | | | | Value (W) | |
| MUNICIPAL BONDS — 95.6% |
| | | | | General Obligations — 4.2% |
| | | | | New York, NY, GO | | | | |
| $ | 15 | | | 5.75%, 03/01/2019 | | $ | 16 | |
| | | | | New York, NY, GO Ser J | | | | |
| | 450 | | | 5.00%, 03/01/2030 | | | 455 | |
| | | | | Puerto Rico Commonwealth | | | | |
| | 215 | | | 5.50%, 07/01/2032 (Q) | | | 215 | |
| | | | | | | | | |
| | | | | | | | 686 | |
| | | | | | | | | |
| | | | | Health Care/Services — 19.3% |
| | | | | Albany, NY, IDA Civic Fac Rev | | | | |
| | 100 | | | 5.25%, 11/15/2032 | | | 95 | |
| | | | | Chemung County, NY, IDA Civic Fac Rev, Arnot Ogden Medical Center | | | | |
| | 125 | | | 5.00%, 11/01/2034 | | | 118 | |
| | | | | Genesee County, NY, IDA United Memorial Medical Center Proj | | | | |
| | 160 | | | 5.00%, 12/01/2032 | | | 129 | |
| | | | | Madison County, NY, IDA Civic Fac Rev Oneida Health System | | | | |
| | 250 | | | 5.50%, 02/01/2032 | | | 233 | |
| | | | | Nassau County, NY, IDA Continuing Care Retirement, Amsterdam at Harborside Ser A | | | | |
| | 500 | | | 6.50%, 01/01/2027 | | | 493 | |
| | | | | New York Dorm Auth, College & University Rev | | | | |
| | 150 | | | 5.00%, 11/01/2034 | | | 142 | |
| | | | | New York Dorm Auth, St Barnabas FHA | | | | |
| | 450 | | | 5.13%, 02/01/2022 | | | 467 | |
| | | | | New York Dorm Auth, Winthrop South Nassau University | | | | |
| | 200 | | | 5.50%, 07/01/2023 | | | 199 | |
| | | | | New York State Dormitory Auth Non State Supported Debt, NYU Hospital Center Ser B | | | | |
| | 250 | | | 5.63%, 07/01/2037 | | | 236 | |
| | | | | Suffolk County, NY, Jeffersons Ferry Proj | | | | |
| | 500 | | | 5.00%, 11/01/2028 | | | 439 | |
| | | | | Ulster County, NY, IDA Kingston Regional Senior Living Proj | | | | |
| | 500 | | | 6.00%, 09/15/2027 | | | 475 | |
| | | | | Westchester County, NY, IDA Continuing Care Retirement, Kendal on Hudson Proj | | | | |
| | 100 | | | 6.38%, 01/01/2024 | | | 100 | |
| | | | | | | | | |
| | | | | | | | 3,126 | |
| | | | | | | | | |
| | | | | Higher Education (Univ., Dorms, etc.) — 22.1% |
| | | | | Albany, NY, Brighter Choice Charter School | | | | |
| | 200 | | | 5.00%, 04/01/2037 # | | | 168 | |
| | | | | Albany, NY, IDA Civic Fac Rev | | | | |
| | 250 | | | 5.00%, 07/01/2037 # | | | 221 | |
| | | | | Cattaraugus County, NY, IDR St Bonaventure University | | | | |
| | 175 | | | 5.10%, 05/01/2031 | | | 156 | |
| | | | | Dutchess County, NY, IDA Civic Fac Rev Ref, Marist College | | | | |
| | 250 | | | 5.00%, 07/01/2022 # | | | 254 | |
| | | | | Erie County, NY, IDA Applied Tech Charter School Proj | | | | |
| | 250 | | | 6.75%, 06/01/2025 | | | 236 | |
| | | | | Erie County, NY, IDA Global Concepts Charter School Proj | | | | |
| | 300 | | | 6.25%, 10/01/2037 | | | 283 | |
| | | | | New York Dorm Auth, Brooklyn Law School | | | | |
| | 250 | | | 5.50%, 07/01/2019 | | | 260 | |
| | | | | New York Dorm Auth, Fordham University FGIC | | | | |
| | 80 | | | 5.00%, 07/01/2020 | | | 83 | |
| | | | | New York Dorm Auth, Mount St Mary College | | | | |
| | 400 | | | 5.00%, 07/01/2027 | | | 400 | |
| | | | | New York Dorm Auth, Rochester University | | | | |
| | 135 | | | 5.25%, 07/01/2022 | | | 141 | |
| | | | | New York Dorm Auth, Upstate Community College | | | | |
| | 250 | | | 5.25%, 07/01/2021 | | | 262 | |
| | | | | New York State Dormitory Auth Non State Supported Debt, Orange Regional Med Center | | | | |
| | 250 | | | 6.13%, 12/01/2029 (Q) | | | 250 | |
| | | | | Otsego County, NY, IDA Civic Fac Rev Hartwick College Proj | | | | |
| | 200 | | | 6.00%, 07/01/2011 | | | 206 | |
| | | | | Rensselaer County, NY, Industrial Improvements | | | | |
| | 200 | | | 5.00%, 01/01/2036 | | | 203 | |
| | | | | St Lawrence, NY, IDA Civic Fac Rev, Clarkson University Proj | | | | |
| | 450 | | | 5.00%, 07/01/2023 | | | 458 | |
| | | | | | | | | |
| | | | | | | | 3,581 | |
| | | | | | | | | |
| | | | | Industrial — 9.4% |
| | | | | Jefferson County, NY, IDA Waste Disposal | | | | |
| | 450 | | | 5.20%, 12/01/2020 | | | 401 | |
| | | | | Liberty, NY, Corp Development Goldman Sachs Headquarters | | | | |
| | 200 | | | 5.25%, 10/01/2035 | | | 206 | |
| | | | | Liberty, NY, Development Corp Rev Golman Sachs Headquarters | | | | |
| | 200 | | | 5.50%, 10/01/2037 | | | 214 | |
| | | | | New York, NY, IDA American Airlines JFK International Airport AMT | | | | |
| | 150 | | | 7.13%, 08/01/2011 | | | 148 | |
| | 150 | | | 8.00%, 08/01/2012 | | | 150 | |
| | | | | New York, NY, IDA Terminal One Group Assoc Proj AMT | | | | |
| | 150 | | | 5.50%, 01/01/2024 | | | 152 | |
| | | | | Virgin Islands Public FA, Revhovenska Refinery | | | | |
| | 250 | | | 6.13%, 07/01/2022 | | | 251 | |
| | | | | | | | | |
| | | | | | | | 1,522 | |
| | | | | | | | | |
| | | | | Miscellaneous — 13.3% |
| | | | | Nassau County, NY, Tobacco Settlement Corp | | | | |
| | 1,000 | | | 5.00%, 06/01/2035 | | | 907 | |
| | | | | New York, NY, IDA Civic Fac Rev, YMCA of Greater NY Proj | | | | |
| | 250 | | | 5.25%, 08/01/2021 | | | 253 | |
| | | | | Seneca Nation Indians Capital Improvement Special Tax | | | | |
| | 160 | | | 5.00%, 12/01/2023 (H) | | | 141 | |
| | | | | Tobacco Settlement FA of NY | | | | |
| | 400 | | | 5.50%, 06/01/2022 | | | 415 | |
| | | | | TSACS, Inc, NY, Tobacco Settlement | | | | |
| | 500 | | | 5.13%, 06/01/2042 | | | 448 | |
| | | | | | | | | |
| | | | | | | | 2,164 | |
| | | | | | | | | |
| | | | | Pollution Control — 0.9% |
| | | | | Onondaga County, NY, IDA PCR | | | | |
| | 150 | | | 4.88%, 07/01/2041 | | | 140 | |
| | | | | Prerefunded — 6.4% |
| | | | | New York Dorm Auth, State University Dorm Fac | | | | |
| | 450 | | | 5.00%, 07/01/2032 | | | 487 | |
The accompanying notes are an integral part of these financial statements.
269
The Hartford Tax-Free New York Fund
Schedule of Investments — (continued)
April 30, 2008 (Unaudited)
(000’s Omitted)
| | | | | | | | | | | | | |
Principal
| | | | | | | | Market
| |
| Amount | | | | | | | | Value (W) | |
| | | | | | | | | | | | | |
| MUNICIPAL BONDS — (continued) |
| | | | | | | | | | | | | |
| | | | | Prerefunded — (continued) |
| | | | | New York, NY, GO | | | | |
| $ | 410 | | | 5.75%, 03/01/2019 | | $ | 459 | |
| | | | | Utica, NY, IDA Civic Fac Rev, Utica College | | | | |
| | 90 | | | 6.88%, 12/01/2014 | | | 95 | |
| | | | | | | | | |
| | | | | | | | 1,041 | |
| | | | | | | | | |
| | | | | Public Facilities — 6.9% |
| | | | | Niagara Falls, NY, School Dist Certificate of Participation | | | | |
| | 500 | | | 5.00%, 06/15/2028 | | | 513 | |
| | | | | Rensselaer, NY, School Dist Certificate of Participation | | | | |
| | 600 | | | 5.00%, 06/01/2036 | | | 599 | |
| | | | | | | | | |
| | | | | | | | 1,112 | |
| | | | | | | | | |
| | | | | Tax Allocation — 5.9% |
| | | | | Nassau County, NY, Interim FA | | | | |
| | 500 | | | 4.22%, 11/15/2016 (L) | | | 500 | |
| | | | | New York, NY, Transitional FA Future Tax Secured | | | | |
| | 450 | | | 5.00%, 08/01/2023 | | | 462 | |
| | | | | | | | | |
| | | | | | | | 962 | |
| | | | | | | | | |
| | | | | Transportation — 2.8% |
| | | | | New York Metropolitan Transportation Auth | | | | |
| | 450 | | | 5.13%, 11/15/2031 | | | 455 | |
| | | | | Utilities — Electric — 1.5% |
| | | | | New York Energy Research & DA, Elec Fac Rev Adj Long Island Lighting Co Proj | | | | |
| | 250 | | | 5.30%, 08/01/2025 | | | 252 | |
| | | | | Utilities — Water and Sewer — 2.9% |
| | | | | New York Environmental Fac Corp | | | | |
| | 450 | | | 5.00%, 07/15/2026 | | | 464 | |
| | | | | | | | | |
| | | | | Total municipal bonds
(cost $15,829) | | $ | 15,505 | |
| | | | | | | | | | | | | |
| | | | | | | | | | | | | |
| SHORT-TERM INVESTMENTS — 4.7% |
| | | | | Investment Pools and Funds — 4.7% |
| $ | 752 | | | Dreyfus Basic New York Municipal Money Market Fund | | $ | 752 | |
| | | | | | | | | |
| | | | | Total short-term investments
(cost $752) | | $ | 752 | |
| | | | | | | | | |
| | | | | Total investments
(cost $16,581) (C) | | | 100.3 | % | | $ | 16,257 | |
| | | | | Other assets and liabilities | | | (0.3 | )% | | | (44 | ) |
| | | | | | | | | | | | | |
| | | | | Total net assets | | | 100.0 | % | | $ | 16,213 | |
| | | | | | | | | | | | | |
| |
| Note: | Percentage of investments as shown is the ratio of the total market value to total net assets. |
| | |
| (C) | | At April 30, 2008, the cost of securities for federal income tax purposes was $16,581 and the aggregate gross unrealized appreciation and depreciation based on that cost were: |
| | | | | |
| Unrealized Appreciation | | $ | 182 | |
| Unrealized Depreciation | | | (506 | ) |
| | | | | |
| Net Unrealized Depreciation | | $ | (324 | ) |
| | | | | |
| | |
| # | | This security, or a portion of this security, has been segregated to cover funding requirements on investment transactions settling in the future. |
| |
| (L) | | Variable rate securities; the rate reported is the coupon rate in effect at April 30, 2008. |
| |
| (Q) | | The cost of securities purchased on a when-issued or delayed delivery basis at April 30, 2008 was $456. |
| |
| (H) | | The following securities are considered illiquid. Illiquid securities are often purchased in private placement transactions, are not registered under the Securities Act of 1933 and may have contractual restrictions on resale. A security may also be considered illiquid if the security lacks a readily available market or if its valuation has not changed for a certain period of time. |
| | | | | | | | | | | |
Period
| | | | | | | | |
Acquired | | Shares/Par | | | Security | | Cost Basis | |
| 04/2007 | | | 160 | | | Seneca Nation Indians Capital Improvement Special Tax, 5.00%, 12/01/2023 - 144A | | $ | 159 | |
| | |
| | The aggregate value of these securities at April 30, 2008 was $141 which represents 0.87% of total net assets. |
| |
| (W) | | See Note 2b of accompanying Notes to Financial Statements regarding valuation of securities. |
| | | |
| AMT | | — Alternative Minimum Tax |
| DA | | — Development Authority |
| FA | | — Finance Authority |
| FGIC | | — Financial Guaranty Insurance Company |
| GO | | — General Obligations |
| IDA | | — Industrial Development Authority Bond |
| IDR | | — Industrial Development Revenue Bond |
| PCR | | — Pollution Control Revenue Bond |
The accompanying notes are an integral part of these financial statements.
270
The Hartford Total Return Bond Fund
Schedule of Investments
April 30, 2008 (Unaudited)
(000’s Omitted)
| | | | | | | | | | | | | |
Principal
| | | | | | | | Market
| |
| Amount | | | | | | | | Value (W) | |
| ASSET & COMMERCIAL MORTGAGE BACKED SECURITIES — 11.6% |
| | | | | Finance — 11.6% |
| | | | | ACT Depositor Corp. | | | | |
| $ | 2,050 | | | 5.41%, 09/22/2041 (H)(L) | | $ | 1,025 | |
| | | | | Banc of America Commercial Mortgage, Inc. | | | | |
| | 16,555 | | | 1.35%, 09/11/2036 (H) (N) | | | 368 | |
| | | | | Banc of America Securities Automotive Trust | | | | |
| | 1,230 | | | 4.49%, 02/18/2013 (H) | | | 1,234 | |
| | | | | Bayview Commercial Asset Trust | | | | |
| | 19,908 | | | 7.50%, 09/25/2037 (H) (N) | | | 2,528 | |
| | | | | Bayview Financial Acquisition Trust | | | | |
| | 1,000 | | | 4.54%, 05/28/2037 (H)(L) | | | 400 | |
| | | | | Bear Stearns Commercial Mortgage Securities, Inc. | | | | |
| | 11,867 | | | 0.82%, 07/11/2042 (H) (N) | | | 290 | |
| | 9,364 | | | 4.12%, 11/11/2041 (H) (N) | | | 202 | |
| | 2,895 | | | 5.33%, 02/11/2044 | | | 2,795 | |
| | 22,593 | | | 5.50%, 02/11/2041 (H) (N) | | | 328 | |
| | 5,480 | | | 5.74%, 09/11/2042 (L) | | | 5,412 | |
| | | | | CBA Commercial Small Balance Commercial Mortgage — Class X1 | | | | |
| | 17,921 | | | 7.00%, 06/25/2038 (H) (N) | | | 1,532 | |
| | | | | CBA Commercial Small Balance Commercial Mortgage — Class X2 | | | | |
| | 9,905 | | | 7.00%, 07/25/2035 (H) (N) | | | 635 | |
| | | | | Citigroup Commercial Mortgage Trust | | | | |
| | 2,050 | | | 5.41%, 10/15/2049 # | | | 2,020 | |
| | 4,000 | | | 5.89%, 12/10/2049 (L) | | | 3,970 | |
| | 3,900 | | | 5.92%, 03/15/2049 (L) | | | 3,927 | |
| | | | | Citigroup Mortgage Loan Trust, Inc. | | | | |
| | 9,672 | | | 5.91%, 07/25/2037 (L) | | | 9,215 | |
| | 3,475 | | | 6.10%, 12/10/2049 (L) | | | 3,521 | |
| | 318 | | | 12.00%, 01/25/2037 (H) | | | 658 | |
| | | | | Citigroup/Deutsche Bank Commercial Mortgage Trust | | | | |
| | 3,330 | | | 5.32%, 12/11/2049 | | | 3,212 | |
| | | | | Countrywide Asset-Backed Certificates | | | | |
| | 293 | | | 5.46%, 07/25/2035 # | | | 222 | |
| | | | | Countrywide Home Loans, Inc. | | | | |
| | 10,477 | | | 6.00%, 10/25/2037 # | | | 9,489 | |
| | | | | Credit Suisse Mortgage Capital Certificates | | | | |
| | 3,400 | | | 5.45%, 01/15/2049 | | | 3,380 | |
| | | | | Credit-Based Asset Servicing and Securitization | | | | |
| | 819 | | | 3.17%, 05/25/2036 (H)(L) | | | 646 | |
| | 1,125 | | | 5.86%, 04/25/2037 # | | | 848 | |
| | | | | CS First Boston Mortgage Securities Corp. | | | | |
| | 418 | | | 4.51%, 07/15/2037 # | | | 415 | |
| | | | | CW Capital Cobalt | | | | |
| | 3,400 | | | 5.48%, 04/15/2047 | | | 3,302 | |
| | | | | DB Master Finance LLC | | | | |
| | 2,600 | | | 5.78%, 06/20/2031 (I) # | | | 2,340 | |
| | | | | First Horizon Mortgage Pass-Through Trust | | | | |
| | 10,158 | | | 5.85%, 05/25/2037 (H)(L) | | | 9,665 | |
| | | | | Ford Credit Floorplan Master Owner Trust | | | | |
| | 2,600 | | | 2.90%, 06/15/2011 (L) | | | 2,514 | |
| | | | | GE Business Loan Trust | | | | |
| | 1,847 | | | 3.72%, 05/15/2034 (H)(L) | | | 1,202 | |
| | 58,695 | | | 6.14%, 05/15/2034 (H) (N) | | | 359 | |
| | | | | GMAC Commercial Mortgage Securities, Inc. | | | | |
| | 3,400 | | | 4.86%, 12/10/2041 | | | 3,332 | |
| | | | | Goldman Sachs Mortgage Securities Corp. II | | | | |
| | 26,042 | | | 4.38%, 08/10/2038 (H) (N) | | | 188 | |
| | | | | Green Tree Financial Corp. | | | | |
| | 238 | | | 7.24%, 06/15/2028 | | | 247 | |
| | | | | Greenwich Capital Commercial Funding Corp. | | | | |
| | 6,300 | | | 5.74%, 12/10/2049 (L) | | | 6,223 | |
| | 4,140 | | | 6.11%, 07/10/2038 (L) | | | 4,217 | |
| | | | | GS Mortgage Securities Corp. II | | | | |
| | 4,000 | | | 5.99%, 08/10/2045 (L) | | | 3,994 | |
| | | | | JP Morgan Automotive Receivable Trust | | | | |
| | 385 | | | 12.85%, 03/15/2012 (A)(H) | | | 229 | |
| | | | | JP Morgan Chase Commercial Mortgage Security Corp. | | | | |
| | 89,557 | | | 0.31%, 05/12/2045 (H) (N) | | | 1,785 | |
| | 4,549 | | | 4.16%, 01/12/2039 (I) | | | 4,327 | |
| | 89,994 | | | 4.82%, 08/12/2037 (H) (N) | | | 268 | |
| | 4,650 | | | 5.47%, 04/15/2043 (L) | | | 4,588 | |
| | 4,300 | | | 5.54%, 12/12/2043 (L) | | | 3,247 | |
| | 3,940 | | | 5.72%, 02/15/2051 | | | 3,864 | |
| | 4,885 | | | 5.75%, 02/12/2049 (L) | | | 4,851 | |
| | 3,450 | | | 6.07%, 02/12/2051 (Q) | | | 3,467 | |
| | 3,040 | | | 6.20%, 02/12/2051 (I) (L) | | | 2,333 | |
| | | | | LB-UBS Commercial Mortgage Trust | | | | |
| | 24,869 | | | 5.26%, 09/15/2039 (N) | | | 641 | |
| | 975 | | | 5.45%, 11/15/2038 (L) | | | 755 | |
| | 2,445 | | | 5.48%, 11/15/2038 (L)# | | | 1,839 | |
| | | | | Lehman Brothers Small Balance Commercial | | | | |
| | 971 | | | 5.52%, 09/25/2030 (I) | | | 920 | |
| | 1,100 | | | 5.62%, 09/25/2036 (I) # | | | 1,027 | |
| | | | | Marlin Leasing Receivables LLC | | | | |
| | 2,870 | | | 5.33%, 09/16/2013 (I) | | | 2,908 | |
| | | | | Merrill Lynch/Countrywide Commercial Mortgage Trust | | | | |
| | 21,859 | | | 5.27%, 07/12/2046 (N) | | | 646 | |
| | | | | Morgan Stanley Capital I | | | | |
| | 3,100 | | | 5.23%, 09/15/2042 | | | 3,074 | |
| | | | | Morgan Stanley Dean Witter Capital I | | | | |
| | 2,800 | | | 5.36%, 03/15/2044 | | | 2,703 | |
| | 3,682 | | | 8.05%, 08/25/2032 (H) (N) | | | — | |
| | | | | Nationstar Home Equity Loan Trust | | | | |
| | 81 | | | 9.97%, 03/25/2037 (H)(L) | | | 61 | |
| | | | | Option One Mortgage Loan Trust | | | | |
| | 2,075 | | | 6.99%, 03/25/2037 (H) | | | 281 | |
| | | | | Popular ABS Mortgage Pass-Through Trust | | | | |
| | 650 | | | 4.75%, 12/25/2034 | | | 584 | |
| | 540 | | | 5.42%, 04/25/2035 | | | 461 | |
| | | | | Renaissance Home Equity Loan Trust | | | | |
| | 800 | | | 5.36%, 05/25/2035 (H) | | | 569 | |
| | 1,260 | | | 5.75%, 05/25/2036 (H)(L) | | | 978 | |
The accompanying notes are an integral part of these financial statements.
271
The Hartford Total Return Bond Fund
Schedule of Investments — (continued)
April 30, 2008 (Unaudited)
(000’s Omitted)
| | | | | | | | | | | | | |
Principal
| | | | | | | | Market
| |
| Amount | | | | | | | | Value (W) | |
| | | | | | | | | | | | | |
| ASSET & COMMERCIAL MORTGAGE BACKED SECURITIES — (continued) |
| | | | | | | | | | | | | |
| | | | | Finance — (continued) |
| | | | | Renaissance Home Equity Loan Trust — Class M5 | | | | |
| $ | 1,550 | | | 7.00%, 09/25/2037 (H) | | $ | 377 | |
| | | | | Renaissance Home Equity Loan Trust — Class M8 | | | | |
| | 1,950 | | | 7.00%, 09/25/2037 (H) | | | 326 | |
| | | | | Soundview NIM Trust | | | | |
| | 87 | | | 6.41%, 12/25/2036 (H) | | | 22 | |
| | | | | Swift Master Automotive Receivables Trust | | | | |
| | 4,225 | | | 3.37%, 10/15/2012 (L) | | | 4,016 | |
| | | | | Wachovia Bank Commercial Mortgage Trust | | | | |
| | 8,470 | | | 3.65%, 02/15/2041 (H) (N) | | | 167 | |
| | 417 | | | 4.52%, 05/15/2044 | | | 413 | |
| | 3,400 | | | 5.34%, 12/15/2043 | | | 3,277 | |
| | 4,100 | | | 5.74%, 06/15/2049 (L) | | | 4,063 | |
| | 686,001 | | | 10.00%, 02/15/2051 (H) (N) | | | 1,063 | |
| | | | | Wachovia Bank Commercial Mortgage Trust — Class A2 | | | | |
| | 2,650 | | | 5.42%, 01/15/2045 # | | | 2,655 | |
| | | | | Wamu Commercial Mortgage Securities Trust | | | | |
| | 4,760 | | | 6.31%, 03/23/2045 (I) (L) | | | 2,707 | |
| | | | | Wells Fargo Alternative Loan Trust | | | | |
| | 3,926 | | | 6.25%, 11/25/2037 | | | 3,431 | |
| | | | | | | | | |
| | | | | Total asset & commercial
mortgage backed securities
(cost $177,061) | | $ | 164,778 | |
| | | | | | | | | | | | | |
| | | | | | | | | | | | | |
| CORPORATE BONDS: INVESTMENT GRADE — 31.5% |
| | | | | Basic Materials — 0.5% |
| | | | | Kimberly-Clark Corp. | | | | |
| $ | 4,271 | | | 6.63%, 08/01/2037 (G) | | $ | 4,655 | |
| | | | | Rohm & Haas Holdings | | | | |
| | 2,156 | | | 5.60%, 03/15/2013 | | | 2,189 | |
| | | | | | | | | |
| | | | | | | | | | | | 6,844 | |
| | | | | | | | | | | | | |
| | | | | Capital Goods — 0.8% |
| | | | | Honeywell International, Inc. | | | | |
| | 4,722 | | | 4.25%, 03/01/2013 | | | 4,693 | |
| | | | | United Technologies Corp. | | | | |
| | 3,620 | | | 5.38%, 12/15/2017 | | | 3,694 | |
| | | | | Xerox Corp. | | | | |
| | 2,800 | | | 6.35%, 05/15/2018 | | | 2,814 | |
| | | | | | | | | |
| | | | | | | | | | | | 11,201 | |
| | | | | | | | | | | | | |
| | | | | Consumer Cyclical — 0.8% |
| | | | | Kroger Co. | | | | |
| | 4,890 | | | 6.15%, 01/15/2020 | | | 5,092 | |
| | | | | Safeway, Inc. | | | | |
| | 1,643 | | | 5.80%, 08/15/2012 (G) | | | 1,704 | |
| | | | | Tesco plc | | | | |
| | 2,969 | | | 5.50%, 11/15/2017 (I) | | | 2,991 | |
| | | | | Wal-Mart Stores, Inc. | | | | |
| | 1,130 | | | 6.50%, 08/15/2037 | | | 1,199 | |
| | | | | | | | | |
| | | | | | | | | | | | 10,986 | |
| | | | | | | | | | | | | |
| | | | | Consumer Staples — 0.8% |
| | | | | Diageo Capital plc | | | | |
| | 3,170 | | | 5.50%, 09/30/2016 | | | 3,185 | |
| | | | | Diageo Finance B.V. | | | | |
| | 1,490 | | | 5.30%, 10/28/2015 (G) | | | 1,485 | |
| | 2,917 | | | 5.50%, 04/01/2013 # | | | 3,018 | |
| | | | | Dr. Pepper Snapple Group | | | | |
| | 2,256 | | | 6.82%, 05/01/2018 (I) | | | 2,340 | |
| | | | | General Mills, Inc. | | | | |
| | 950 | | | 5.65%, 09/10/2012 | | | 978 | |
| | | | | | | | | |
| | | | | | | | | | | | 11,006 | |
| | | | | | | | | | | | | |
| | | | | Energy — 1.3% |
| | | | | Canadian National Resources Ltd. | | | | |
| | 391 | | | 6.25%, 03/15/2038 # | | | 382 | |
| | 2,805 | | | 6.50%, 02/15/2037 # | | | 2,822 | |
| | | | | Consumers Energy Co. | | | | |
| | 400 | | | 5.15%, 02/15/2017 # | | | 387 | |
| | 1,595 | | | 5.38%, 04/15/2013 # | | | 1,608 | |
| | | | | Enterprise Products Operating L.P. | | | | |
| | 1,215 | | | 4.63%, 10/15/2009 # | | | 1,220 | |
| | | | | Enterprise Products Operations LLC | | | | |
| | 2,617 | | | 6.50%, 01/31/2019 | | | 2,699 | |
| | | | | Petro-Canada | | | | |
| | 2,940 | | | 5.95%, 05/15/2035 # | | | 2,673 | |
| | | | | Ras Laffan Liquefied Natural Gas Co., Ltd. | | | | |
| | 241 | | | 3.44%, 09/15/2009 (I)# | | | 242 | |
| | 4,940 | | | 5.30%, 09/30/2020 (I)# | | | 4,572 | |
| | | | | Sempra Energy | | | | |
| | 710 | | | 6.00%, 02/01/2013 # | | | 740 | |
| | | | | TNK-BP Finance S.A. | | | | |
| | 590 | | | 7.50%, 07/18/2016 (I)# | | | 572 | |
| | 900 | | | 7.50%, 03/13/2013 (I) | | | 902 | |
| | | | | | | | | |
| | | | | | | | | | | | 18,819 | |
| | | | | | | | | | | | | |
| | | | | Finance — 14.2% |
| | | | | ABX Financing Co. | | | | |
| | 2,232 | | | 6.35%, 10/15/2036 (I)# | | | 2,097 | |
| | | | | American Capital Strategies Ltd. | | | | |
| | 2,597 | | | 6.85%, 08/01/2012 # | | | 2,453 | |
| | | | | American Express Co. | | | | |
| | 2,547 | | | 5.50%, 04/16/2013 | | | 2,548 | |
| | 2,313 | | | 5.55%, 10/17/2012 | | | 2,315 | |
| | 1,960 | | | 8.15%, 03/19/2038 | | | 2,280 | |
| | | | | American Real Estate Partners L.P. | | | | |
| | 2,295 | | | 7.13%, 02/15/2013 | | | 2,140 | |
| | | | | Amvescap plc | | | | |
| | 3,110 | | | 4.50%, 12/15/2009 # | | | 3,090 | |
| | 1,206 | | | 5.38%, 02/27/2013 # | | | 1,166 | |
| | | | | Army Hawaii Family Housing Trust Certificates | | | | |
| | 915 | | | 5.52%, 06/15/2050 (I)# | | | 788 | |
| | | | | BAE Systems Holdings, Inc. | | | | |
| | 2,980 | | | 5.20%, 08/15/2015 (I)# | | | 2,883 | |
| | | | | Bank of America Corp. | | | | |
| | 10,630 | | | 8.00%, 12/29/2049 (L) | | | 10,815 | |
| | 3,243 | | | 8.13%, 12/29/2049 | | | 3,314 | |
| | | | | Barclays Bank plc | | | | |
| | 2,602 | | | 7.70%, 10/25/2049 (I)(L) | | | 2,692 | |
The accompanying notes are an integral part of these financial statements.
272
| | | | | | | | | | | | | |
Principal
| | | | | | | | Market
| |
| Amount(B) | | | | | | | | Value (W) | |
| |
| | | | | | | | | | | | | |
| CORPORATE BONDS: INVESTMENT GRADE — (continued) |
| | | | | | | | | | | | | |
| | | | | Finance — (continued) |
| | | | | BB&T Capital Trust IV | | | | |
| $ | 964 | | | 6.82%, 06/12/2057 (L)# | | $ | 848 | |
| | | | | CIT Group, Inc. | | | | |
| | 3,020 | | | 6.10%, 03/15/2067 (L)# | | | 1,577 | |
| | | | | Citigroup, Inc. | | | | |
| | 6,610 | | | 8.30%, 12/21/2057 (L) | | | 6,748 | |
| | 6,946 | | | 8.40%, 12/31/2049 (L) | | | 7,030 | |
| | | | | Comerica Capital Trust II | | | | |
| | 2,998 | | | 6.58%, 02/20/2037 (L)# | | | 2,052 | |
| | | | | Countrywide Financial Corp. | | | | |
| | 87 | | | 4.50%, 06/15/2010 | | | 80 | |
| | 795 | | | 5.80%, 06/07/2012 # | | | 758 | |
| | 6,354 | | | 6.25%, 05/15/2016 (G) | | | 5,591 | |
| | | | | Countrywide Home Loans, Inc. | | | | |
| | 1,386 | | | 4.00%, 03/22/2011 | | | 1,269 | |
| | 2,526 | | | 4.13%, 09/15/2009 | | | 2,359 | |
| | 318 | | | 6.25%, 04/15/2009 | | | 304 | |
| | | | | Credit Agricole | | | | |
| | 7,159 | | | 6.64%, 05/31/2049 (I)(L)# | | | 5,870 | |
| | | | | Credit Suisse First Boston USA, Inc. | | | | |
| | 1,059 | | | 6.50%, 01/15/2012 # | | | 1,115 | |
| | | | | Credit Suisse New York | | | | |
| | 3,375 | | | 6.00%, 02/15/2018 | | | 3,421 | |
| | | | | Development Bank of Japan | | | | |
| JPY | 1,332,000 | | | 1.75%, 06/21/2010 | | | 13,006 | |
| | | | | ERAC USA Finance Co. | | | | |
| | 2,865 | | | 5.60%, 05/01/2015 (G)(I) | | | 2,546 | |
| | | | | Fifth Third Bankcorp | | | | |
| | 3,235 | | | 8.25%, 03/01/2038 | | | 3,418 | |
| | | | | General Electric Capital Corp. | | | | |
| | 3,180 | | | 5.25%, 10/19/2012 | | | 3,256 | |
| | 3,410 | | | 5.63%, 05/01/2018 | | | 3,445 | |
| | 5,280 | | | 6.37%, 11/15/2067 (L) | | | 5,285 | |
| | | | | Goldman Sachs Capital Trust II | | | | |
| | 7,360 | | | 5.79%, 12/29/2049 (L)# | | | 5,552 | |
| | | | | International Lease Finance Corp. | | | | |
| | 4,000 | | | 6.38%, 03/25/2013 | | | 4,054 | |
| | | | | Janus Capital Group, Inc. | | | | |
| | 4,470 | | | 6.70%, 06/15/2017 # | | | 4,259 | |
| | | | | JP Morgan Chase & Co. | | | | |
| | 12,741 | | | 7.90%, 12/01/2049 | | | 12,979 | |
| | | | | Lehman Brothers Holdings, Inc. | | | | |
| | 1,550 | | | 7.00%, 09/27/2027 | | | 1,519 | |
| | | | | Lincoln National Corp. | | | | |
| | 4,371 | | | 6.05%, 04/20/2067 # | | | 3,755 | |
| | | | | Mellon Capital IV | | | | |
| | 1,824 | | | 6.24%, 06/20/2049 (L)# | | | 1,510 | |
| | | | | Merrill Lynch & Co., Inc. | | | | |
| | 5,740 | | | 5.45%, 02/05/2013 | | | 5,585 | |
| | | | | Metlife, Inc. | | | | |
| | 220 | | | 5.38%, 12/15/2012 # | | | 225 | |
| | | | | National City Corp. | | | | |
| | 6,607 | | | 12.00%, 12/29/2049 | | | 6,519 | |
| | | | | North Street Referenced Linked Notes | | | | |
| | 850 | | | 4.30%, 07/30/2010 (H)(L) | | | 616 | |
| | | | | Northgroup Preferred Capital Corp. | | | | |
| | 2,685 | | | 6.38%, 10/15/2049 (H)(L) | | | 1,865 | |
| | | | | PNC Preferred Funding Trust II | | | | |
| | 8,000 | | | 6.11%, 03/15/2049 (I)(L)# | | | 5,608 | |
| | | | | Progressive Corp. | | | | |
| | 3,610 | | | 6.70%, 06/15/2037 (L)# | | | 3,228 | |
| | | | | Prudential Financial, Inc. | | | | |
| | 3,215 | | | 5.15%, 01/15/2013 | | | 3,191 | |
| | | | | RBS Capital Trust IV | | | | |
| | 5,350 | | | 3.50%, 09/29/2049 (L) | | | 4,147 | |
| | | | | State Street Capital Trust III | | | | |
| | 2,048 | | | 8.25%, 12/29/2049 (L) | | | 2,091 | |
| | | | | Unicredito Italiano Capital Trust | | | | |
| | 1,300 | | | 9.20%, 10/29/2049 (I) | | | 1,326 | |
| | | | | Unicredito Luxembourg Finance S.A. | | | | |
| | 4,490 | | | 6.00%, 10/31/2017 (I) | | | 4,345 | |
| | | | | UnitedHealth Group, Inc. | | | | |
| | 3,256 | | | 4.88%, 02/15/2013 | | | 3,109 | |
| | | | | US Bank Realty Corp. | | | | |
| | 4,700 | | | 6.09%, 12/22/2049 (I)(L)# | | | 3,455 | |
| | | | | Wachovia Capital Trust III | | | | |
| | 4,030 | | | 5.80%, 08/29/2049 | | | 3,204 | |
| | | | | Wachovia Corp. | | | | |
| | 5,690 | | | 7.98%, 02/28/2049 (L) | | | 5,598 | |
| | | | | Westfield Group | | | | |
| | 2,683 | | | 5.70%, 10/01/2016 (I)# | | | 2,544 | |
| | | | | ZFS Finance USA Trust I | | | | |
| | 3,725 | | | 6.50%, 05/09/2037 (I)(L)# | | | 3,281 | |
| | | | | | | | | |
| | | | | | | | | | | | 202,124 | |
| | | | | | | | | | | | | |
| | | | | Foreign Governments — 4.0% |
| | | | | Bundesrepublic Deutschland | | | | |
| EUR | 18,990 | | | 4.50%, 01/04/2013 | | | 30,367 | |
| | | | | El Salvador (Republic of) | | | | |
| | 700 | | | 8.50%, 07/25/2011 (K) | | | 774 | |
| | | | | United Kingdom Government | | | | |
| GBP | 12,440 | | | 5.00%, 03/07/2018 | | | 25,386 | |
| | | | | | | | | |
| | | | | | | | | | | | 56,527 | |
| | | | | | | | | | | | | |
| | | | | Health Care — 0.6% |
| | | | | Covidien International | | | | |
| | 4,123 | | | 5.45%, 10/15/2012 (I) | | | 4,157 | |
| | | | | CVS Caremark Corp. | | | | |
| | 5,046 | | | 6.30%, 06/01/2037 (L)# | | | 4,317 | |
| | | | | | | | | |
| | | | | | | | | | | | 8,474 | |
| | | | | | | | | | | | | |
| | | | | Services — 1.6% |
| | | | | Clear Channel Communications, Inc. | | | | |
| | 2,200 | | | 7.65%, 09/15/2010 | | | 2,287 | |
| | | | | Comcast Corp. | | | | |
| | 3,252 | | | 6.30%, 11/15/2017 | | | 3,379 | |
| | 1,280 | | | 6.50%, 01/15/2015 | | | 1,335 | |
| | | | | COX Communications, Inc. | | | | |
| | 2,800 | | | 5.45%, 12/15/2014 # | | | 2,786 | |
| | 2,981 | | | 5.88%, 12/01/2016 (I)# | | | 3,014 | |
| | | | | Electronic Data Systems Corp. | | | | |
| | 435 | | | 3.88%, 07/15/2023 (X)# | | | 427 | |
| | | | | Mashantucket Western Pequot Revenue Bond | | | | |
| | 813 | | | 5.91%, 09/01/2021 (H) | | | 764 | |
| | | | | Time Warner Entertainment Co., L.P. | | | | |
| | 3,725 | | | 8.38%, 07/15/2033 # | | | 4,336 | |
| | | | | Time Warner, Inc. | | | | |
| | 1,550 | | | 6.50%, 11/15/2036 # | | | 1,462 | |
The accompanying notes are an integral part of these financial statements.
273
The Hartford Total Return Bond Fund
Schedule of Investments — (continued)
April 30, 2008 (Unaudited)
(000’s Omitted)
| | | | | | | | | | | | | |
Principal
| | | | | | | | Market
| |
| Amount | | | | | | | | Value (W) | |
| |
| | | | | | | | | | | | | |
| CORPORATE BONDS: INVESTMENT GRADE — (continued) |
| | | | | | | | | | | | | |
| | | | | Services — (continued) |
| | | | | Waste Management, Inc. | | | | |
| $ | 3,498 | | | 6.10%, 03/15/2018 | | $ | 3,508 | |
| | | | | | | | | |
| | | | | | | | | | | | 23,298 | |
| | | | | | | | | | | | | |
| | | | | Technology — 3.9% |
| | | | | Agilent Technologies, Inc. | | | | |
| | 1,911 | | | 6.50%, 11/01/2017 | | | 1,896 | |
| | | | | AT&T, Inc. | | | | |
| | 2,983 | | | 4.95%, 01/15/2013 | | | 3,003 | |
| | 6,172 | | | 5.50%, 02/01/2018 | | | 6,171 | |
| | | | | British Telecommunications plc | | | | |
| | 2,607 | | | 5.15%, 01/15/2013 | | | 2,619 | |
| | | | | Cingular Wireless Services, Inc. | | | | |
| | 4,780 | | | 8.75%, 03/01/2031 # | | | 5,883 | |
| | | | | Embarq Corp. | | | | |
| | 3,690 | | | 7.08%, 06/01/2016 | | | 3,661 | |
| | | | | Hewlett-Packard Co. | | | | |
| | 2,123 | | | 4.50%, 03/01/2013 | | | 2,140 | |
| | | | | Koninklijke Philips Electronics N.V. | | | | |
| | 3,748 | | | 5.75%, 03/11/2018 | | | 3,846 | |
| | | | | Oracle Corp. | | | | |
| | 1,298 | | | 4.95%, 04/15/2013 | | | 1,321 | |
| | 2,802 | | | 6.50%, 04/15/2038 | | | 2,896 | |
| | | | | Rogers Wireless, Inc. | | | | |
| | 1,332 | | | 6.38%, 03/01/2014 | | | 1,359 | |
| | | | | Sprint Capital Corp. | | | | |
| | 2,675 | | | 8.75%, 03/15/2032 | | | 2,361 | |
| | | | | TCI Communications, Inc. | | | | |
| | 685 | | | 8.75%, 08/01/2015 # | | | 777 | |
| | | | | Tele-Communications, Inc. | | | | |
| | 2,075 | | | 7.88%, 08/01/2013 # | | | 2,256 | |
| | | | | Tyco Electronics Group S.A. | | | | |
| | 1,467 | | | 6.00%, 10/01/2012 (I) | | | 1,496 | |
| | 1,540 | | | 6.55%, 10/01/2017 (I) | | | 1,577 | |
| | | | | Verizon Communications, Inc. | | | | |
| | 5,802 | | | 5.50%, 02/15/2018 | | | 5,818 | |
| | | | | Verizon Virginia, Inc. | | | | |
| | 3,770 | | | 4.63%, 03/15/2013 | | | 3,648 | |
| | | | | Vodafone Group plc | | | | |
| | 3,510 | | | 6.15%, 02/27/2037 (G) | | | 3,458 | |
| | | | | | | | | |
| | | | | | | | | | | | 56,186 | |
| | | | | | | | | | | | | |
| | | | | Transportation — 0.6% |
| | | | | American Airlines, Inc. | | | | |
| | 1,035 | | | 7.86%, 10/01/2011 # | | | 1,035 | |
| | | | | Continental Airlines, Inc. | | | | |
| | 916 | | | 6.70%, 06/15/2021 # | | | 880 | |
| | 771 | | | 8.05%, 11/01/2020 # | | | 771 | |
| | | | | CSX Corp. | | | | |
| | 3,205 | | | 6.75%, 03/15/2011 (G) | | | 3,355 | |
| | | | | Norfolk Southern Corp. | | | | |
| | 1,803 | | | 5.75%, 04/01/2018 (I) | | | 1,828 | |
| | | | | Union Pacific Corp. | | | | |
| | 1,459 | | | 5.70%, 08/15/2018 | | | 1,476 | |
| | | | | | | | | |
| | | | | | | | | | | | 9,345 | |
| | | | | | | | | | | | | |
| | | | | Utilities — 2.4% |
| | | | | CenterPoint Energy Resources Corp. | | | | |
| | 3,110 | | | 6.13%, 11/01/2017 | | | 3,131 | |
| | 690 | | | 6.63%, 11/01/2037 | | | 668 | |
| | | | | CenterPoint Energy, Inc. | | | | |
| | 2,775 | | | 6.85%, 06/01/2015 # | | | 2,899 | |
| | | | | Commonwealth Edison Co. | | | | |
| | 1,866 | | | 5.80%, 03/15/2018 | | | 1,866 | |
| | | | | Detroit Edison Co. | | | | |
| | 565 | | | 6.13%, 10/01/2010 # | | | 592 | |
| | | | | Duke Energy Corp. | | | | |
| | 1,280 | | | 5.25%, 01/15/2018 | | | 1,284 | |
| | | | | E.On International Finance | | | | |
| | 4,160 | | | 5.80%, 04/30/2018 (I) | | | 4,191 | |
| | | | | Florida Power Corp. | | | | |
| | 1,152 | | | 5.80%, 09/15/2017 (G) | | | 1,206 | |
| | | | | Kinder Morgan Energy Partners L.P. | | | | |
| | 1,065 | | | 6.50%, 02/01/2037 # | | | 1,017 | |
| | | | | NGPL Pipeco LLC | | | | |
| | 2,509 | | | 6.51%, 12/15/2012 (I) | | | 2,584 | |
| | | | | Northern States Power Co. | | | | |
| | 1,170 | | | 6.25%, 06/01/2036 # | | | 1,212 | |
| | | | | Pacific Gas & Electric Co. | | | | |
| | 1,655 | | | 5.63%, 11/30/2017 | | | 1,685 | |
| | | | | PSEG Power | | | | |
| | 1,287 | | | 5.00%, 04/01/2014 (G) | | | 1,245 | |
| | | | | Puget Sound Energy, Inc. | | | | |
| | 630 | | | 7.96%, 02/22/2010 # | | | 669 | |
| | | | | Scana Corp. | | | | |
| | 3,300 | | | 6.25%, 04/01/2020 | | | 3,352 | |
| | | | | Taqa Abu Dhabi National Energy Co. | | | | |
| | 3,350 | | | 5.62%, 10/25/2012 (I) | | | 3,400 | |
| | | | | TransCanada Pipelines Ltd. | | | | |
| | 2,079 | | | 6.20%, 10/15/2037 | | | 1,997 | |
| | | | | Virginia Electric & Power Co. | | | | |
| | 1,627 | | | 5.10%, 11/30/2012 | | | 1,654 | |
| | | | | Westar Energy, Inc. | | | | |
| | 250 | | | 5.15%, 01/01/2017 # | | | 240 | |
| | | | | | | | | |
| | | | | | | | | | | | 34,892 | |
| | | | | | | | | | | | | |
| | | | | Total corporate bonds: investment grade
(cost $458,687) | | $ | 449,702 | |
| | | | | | | | | | | | | |
| | | | | | | | | | | | | |
| CORPORATE BONDS: NON-INVESTMENT GRADE — 5.2% |
| | | | | Basic Materials — 0.4% |
| | | | | AK Steel Corp. | | | | |
| | 2,225 | | | 7.75%, 06/15/2012 | | $ | 2,272 | |
| | | | | Evraz Group S.A. | | | | |
| | 400 | | | 8.25%, 11/10/2015 (K) | | | 391 | |
| | 400 | | | 8.88%, 04/24/2013 (I) | | | 405 | |
| | | | | Potlatch Corp. | | | | |
| | 1,900 | | | 13.00%, 12/01/2009 (H)(L) | | | 2,109 | |
| | | | | Valmont Industries, Inc. | | | | |
| | 305 | | | 6.88%, 05/01/2014 | | | 308 | |
| | | | | Vitro S.A. | | | | |
| | 740 | | | 8.63%, 02/01/2012 | | | 688 | |
| | | | | | | | | |
| | | | | | | | | | | | 6,173 | |
| | | | | | | | | | | | | |
| | | | | Capital Goods — 0.1% |
| | | | | Bombardier, Inc. | | | | |
| | 1,830 | | | 6.30%, 05/01/2014 (I)# | | | 1,830 | |
| | | | | | | | | |
| | | | | | | | | | | | | |
The accompanying notes are an integral part of these financial statements.
274
| | | | | | | | | | | | | |
Principal
| | | | | | | | Market
| |
| Amount | | | | | | | | Value (W) | |
| |
| | | | | | | | | | | | | |
| CORPORATE BONDS: NON-INVESTMENT GRADE — (continued) |
Principal
| | | | | | | | Market
| |
| Amount(B) | | | | | | | | Value (W) | |
| |
| | | | | Consumer Cyclical — 0.3% |
| | | | | American Axle & Manufacturing Holdings, Inc. | | | | |
| | 1,030 | | | 7.88%, 03/01/2017 | | | 922 | |
| | | | | Parkson Retail Group Ltd. | | | | |
| | 800 | | | 7.88%, 11/14/2011 (H) | | | 792 | |
| | | | | Supervalu, Inc. | | | | |
| | 2,150 | | | 7.50%, 11/15/2014 | | | 2,225 | |
| | | | | | | | | |
| | | | | | | | | | | | 3,939 | |
| | | | | | | | | | | | | |
| | | | | Consumer Staples — 0.1% |
| | | | | MHP S.A. | | | | |
| | 1,555 | | | 10.25%, 11/30/2011 (H) | | | 1,493 | |
| | | | | Energy — 0.2% |
| | | | | Key Energy Services, Inc. | | | | |
| | 205 | | | 8.38%, 12/01/2014 (I) | | | 212 | |
| | | | | Petrohawk Energy Corp. | | | | |
| | 580 | | | 9.13%, 07/15/2013 | | | 614 | |
| | | | | Range Resources Corp. | | | | |
| | 1,920 | | | 7.38%, 07/15/2013 | | | 1,944 | |
| | | | | | | | | |
| | | | | | | | | | | | 2,770 | |
| | | | | | | | | | | | | |
| | | | | Finance — 0.7% |
| | | | | Citigroup (JSC Severstal) | | | | |
| | 1,250 | | | 9.25%, 04/19/2014 (K)# | | | 1,333 | |
| | | | | Ford Motor Credit Co. | | | | |
| | 2,430 | | | 7.16%, 04/15/2012 (L)# | | | 2,382 | |
| | | | | General Motors Acceptance Corp. | | | | |
| | 3,370 | | | 6.88%, 09/15/2011 | | | 2,808 | |
| | | | | Kazkommerts International B.V. | | | | |
| | 412 | | | 8.00%, 11/03/2015 (I) | | | 330 | |
| | | | | LPL Holdings, Inc. | | | | |
| | 1,110 | | | 10.75%, 12/15/2015 (H) | | | 1,088 | |
| | | | | Northern Rock plc | | | | |
| | 774 | | | 5.60%, 04/30/2049 (I) | | | 452 | |
| | | | | RBS-Zero Hora Editora Journalistica | | | | |
| BRL | 1,000 | | | 11.25%, 06/15/2017 (H) | | | 475 | |
| | | | | TuranAlem Finance B.V. | | | | |
| | 350 | | | 7.75%, 04/25/2013 (K) | | | 297 | |
| | | | | | | | | |
| | | | | | | | | | | | 9,165 | |
| | | | | | | | | | | | | |
| | | | | Foreign Governments — 0.4% |
| | | | | Argentina (Republic of) | | | | |
| | 1,240 | | | 7.00%, 10/03/2015 | | | 889 | |
| | | | | Brazil (Republic of) | | | | |
| BRL | 1,680 | | | 10.00%, 01/01/2017 | | | 823 | |
| | | | | Sri Lanka (Republic of) ADR | | | | |
| | 700 | | | 8.25%, 10/24/2012 (G)(H) | | | 637 | |
| | | | | Venezuela (Republic of) | | | | |
| | 3,595 | | | 3.91%, 04/20/2011 (K)(L) | | | 3,135 | |
| | | | | | | | | |
| | | | | | | | | | | | 5,484 | |
| | | | | | | | | | | | | |
| | | | | Health Care — 0.4% |
| | | | | HCA, Inc. | | | | |
| | 2,635 | | | 9.25%, 11/15/2016 | | | 2,833 | |
| | | | | Reable Therapeutics Finance LLC | | | | |
| | 530 | | | 11.75%, 11/15/2014 (G) | | | 489 | |
| | | | | Rite Aid Corp. | | | | |
| | 2,150 | | | 7.50%, 03/01/2017 | | | 1,994 | |
| | | | | | | | | |
| | | | | | | | | | | | 5,316 | |
| | | | | | | | | | | | | |
| | | | | Services — 0.9% |
| | | | | Dex Media West LLC, Inc. | | | | |
| | 1,980 | | | 9.88%, 08/15/2013 | | | 1,866 | |
| | | | | Echostar DBS Corp. | | | | |
| | 2,825 | | | 6.38%, 10/01/2011 | | | 2,811 | |
| | | | | Harrah’s Operating Co., Inc. | | | | |
| | 3,355 | | | 10.75%, 02/01/2016 — 02/01/2018 (I) | | | 2,861 | |
| | | | | MGM Mirage, Inc. | | | | |
| | 3,300 | | | 6.75%, 04/01/2013 | | | 3,036 | |
| | | | | SunGard Data Systems, Inc. | | | | |
| | 2,194 | | | 10.25%, 08/15/2015 | | | 2,331 | |
| | | | | Videotron Ltd. | | | | |
| | 170 | | | 9.13%, 04/15/2018 (I) | | | 181 | |
| | | | | | | | | |
| | | | | | | | | | | | 13,086 | |
| | | | | | | | | | | | | |
| | | | | Technology — 1.2% |
| | | | | Advanced Micro Devices, Inc. | | | | |
| | 2,200 | | | 6.00%, 05/01/2015 (I)(X)# | | | 1,391 | |
| | | | | Charter Communications Operating LLC | | | | |
| | 3,450 | | | 8.00%, 04/30/2012 (I)# | | | 3,329 | |
| | | | | CSC Holdings, Inc. | | | | |
| | 2,785 | | | 7.63%, 04/01/2011 | | | 2,806 | |
| | | | | Intelsat Bermuda Ltd. | | | | |
| | 3,500 | | | 9.25%, 06/15/2016 # | | | 3,531 | |
| | | | | Vimpelcom | | | | |
| | 2,000 | | | 8.38%, 04/30/2013 (G)(I) | | | 2,000 | |
| | | | | Windstream Corp. | | | | |
| | 3,400 | | | 8.63%, 08/01/2016 # | | | 3,561 | |
| | | | | | | | | |
| | | | | | | | | | | | 16,618 | |
| | | | | | | | | | | | | |
| | | | | Transportation — 0.1% |
| | | | | Bristow Group, Inc. | | | | |
| | 1,570 | | | 7.50%, 09/15/2017 | | | 1,621 | |
| | | | | Utilities — 0.4% |
| | | | | NRG Energy, Inc. | | | | |
| | 1,745 | | | 7.38%, 01/15/2017 | | | 1,797 | |
| | | | | Rede Empresas De Energia | | | | |
| | 275 | | | 11.13%, 04/02/2049 (H) | | | 260 | |
| | | | | Texas Competitive Electric Co. | | | | |
| | 3,830 | | | 10.25%, 11/01/2015 (I) | | | 3,993 | |
| | | | | | | | | |
| | | | | | | | | | | | 6,050 | |
| | | | | | | | | | | | | |
| | | | | Total corporate bonds: non-investment grade
(cost $75,088) | | $ | 73,545 | |
| | | | | | | | | | | | | |
| | | | | | | | | | | | | |
| MUNICIPAL BONDS — 0.1% |
| | | | | General Obligations — 0.1% |
| | | | | Oregon School Boards Association, Taxable Pension | | | | |
| $ | 1,250 | | | 4.76%, 06/30/2028 | | $ | 1,139 | |
| | | | | | | | | |
| | | | | Total municipal bonds
(cost $1,250) | | $ | 1,139 | |
| | | | | | | | | |
| | | | | | | | | | | | | |
| | | | | | | | | | | | | |
| | | | | | | | | | | | | |
The accompanying notes are an integral part of these financial statements.
275
The Hartford Total Return Bond Fund
Schedule of Investments — (continued)
April 30, 2008 (Unaudited)
(000’s Omitted)
| | | | | | | | | | | | | |
Principal
| | | | | | | | Market
| |
| Amount | | | | | | | | Value (W) | |
| |
| SENIOR FLOATING RATE INTERESTS: INVESTMENT GRADE (V) — 0.0% |
| | | | | Technology — 0.0% |
| | | | | Freescale Semiconductor, Inc. | | | | |
| $ | 662 | | | 4.46%, 11/28/2013 (N) | | $ | 578 | |
| | | | | | | | | |
| | | �� | | Total senior floating rate interests: investment grade
(cost $558) | | $ | 578 | |
| | | | | | | | | | | | | |
| | | | | | | | | | | | | |
| SENIOR FLOATING RATE INTERESTS: NON-INVESTMENT GRADE (V) — 6.0% |
| | | | | Basic Materials — 0.9% |
| | | | | Cenveo, Inc. | | | | |
| $ | 1,326 | | | 4.35%, 06/21/2013 — 03/16/2014 (N)(Q) | | $ | 1,231 | |
| | | | | Georgia-Pacific Corp. | | | | |
| | 2,061 | | | 4.73%, 02/14/2013 (N) | | | 1,975 | |
| | | | | Goodyear Tire & Rubber Co. | | | | |
| | 1,000 | | | 4.54%, 04/18/2014 (N) | | | 951 | |
| | | | | Graham Packaging Co., Inc. | | | | |
| | 1,766 | | | 5.04%, 04/03/2014 (N) | | | 1,684 | |
| | | | | Graphic Packaging Corp. | | | | |
| | 655 | | | 4.80%, 08/08/2010 (N) | | | 629 | |
| | | | | Hexion Specialty Chemicals | | | | |
| | 735 | | | 5.10%, 05/15/2013 (AA)(Q) | | | 694 | |
| | | | | Huntsman International LLC | | | | |
| | 1,356 | | | 4.64%, 04/23/2014 (N) | | | 1,312 | |
| | | | | Ineos Group | | | | |
| | 503 | | | 5.10%, 02/01/2013 (AA)(Q) | | | 469 | |
| | 503 | | | 5.60%, 12/16/2014 (AA)(Q) | | | 468 | |
| | | | | ISP Chemco LLC | | | | |
| | 437 | | | 4.69%, 05/31/2014 (N) | | | 411 | |
| | | | | Jarden Corp. | | | | |
| | 1,561 | | | 5.20%, 01/24/2012 (N) | | | 1,509 | |
| | | | | Newpage Corp. | | | | |
| | 459 | | | 6.31%, 12/21/2014 (N) | | | 455 | |
| | | | | Novelis, Inc. CA Term Loan | | | | |
| | 256 | | | 4.85%, 07/06/2014 (AA)(Q) | | | 243 | |
| | | | | Novelis, Inc. US Term Loan | | | | |
| | 564 | | | 4.85%, 07/06/2014 (AA)(Q) | | | 538 | |
| | | | | | | | | |
| | | | | | | | | | | | 12,569 | |
| | | | | | | | | | | | | |
| | | | | Capital Goods — 0.1% |
| | | | | Yankee Candle Co. | | | | |
| | 785 | | | 4.61%, 02/06/2014 (N) | | | 706 | |
| | | | | Consumer Cyclical — 0.9% |
| | | | | AM General LLC | | | | |
| | 985 | | | 5.71%, 09/30/2013 (N)(Q) | | | 931 | |
| | | | | American General Finance Corp. | | | | |
| | 37 | | | 5.73%, 09/01/2013 (N)(Q) | | | 35 | |
| | | | | Aramark Corp., Letter of Credit | | | | |
| | 38 | | | 3.18%, 01/19/2014 (N) | | | 36 | |
| | | | | Aramark Corp., Term Loan B | | | | |
| | 620 | | | 4.57%, 01/19/2014 (N) | | | 594 | |
| | | | | Delphi Corp. | | | | |
| | 980 | | | 6.88%, 07/01/2008 (N) | | | 982 | |
| | | | | Ford Motor Co. | | | | |
| | 5,985 | | | 5.80%, 12/15/2013 (N)# | | | 5,496 | |
| | | | | Lear Corp. | | | | |
| | 629 | | | 5.34%, 04/25/2012 (N) | | | 608 | |
| | | | | Masonite International Corp., Canadian Term Loan | | | | |
| | 580 | | | 4.89%, 04/30/2010 (N)# | | | 520 | |
| | | | | Masonite International Corp., U.S. Term Loan | | | | |
| | 581 | | | 4.89%, 04/30/2010 (N)# | | | 524 | |
| | | | | Michaels Stores, Inc. | | | | |
| | 776 | | | 5.10%, 11/11/2013 (N)(Q) | | | 685 | |
| | | | | Oshkosh Truck Corp. | | | | |
| | 390 | | | 4.51%, 12/06/2013 (N)# | | | 366 | |
| | | | | Roundy’s Supermarkets, Inc. | | | | |
| | 1,333 | | | 5.47%, 11/03/2011 (N)(Q) | | | 1,252 | |
| | | | | William Carter Co. | | | | |
| | 1,258 | | | 4.39%, 07/14/2012 (N) | | | 1,195 | |
| | | | | | | | | |
| | | | | | | | | | | | 13,224 | |
| | | | | | | | | | | | | |
| | | | | Consumer Staples — 0.1% |
| | | | | Dole Food Co., Inc. | | | | |
| | 52 | | | 4.58%, 04/12/2013 (AA)# | | | 48 | |
| | 380 | | | 4.83%, 04/12/2013 (N)# | | | 352 | |
| | 114 | | | 5.01%, 04/12/2013 (N)# | | | 106 | |
| | | | | | | | | |
| | | | | | | | | | | | 506 | |
| | | | | | | | | | | | | |
| | | | | Energy — 0.0% |
| | | | | Big West Oil LLC, Delayed Draw Term Loan | | | | |
| | 202 | | | 2.29%, 02/02/2015 (N)(Q) | | | 190 | |
| | | | | Big West Oil LLC, Term Loan B | | | | |
| | 162 | | | 5.00%, 02/02/2015 (N)# | | | 153 | |
| | | | | | | | | |
| | | | | | | | | | | | 343 | |
| | | | | | | | | | | | | |
| | | | | Finance — 0.6% |
| | | | | Brickman Group Holdings, Inc. | | | | |
| | 1,194 | | | 4.69%, 01/24/2014 (AA)(Q) | | | 1,110 | |
| | | | | Chrysler Financial Services NA | | | | |
| | 930 | | | 6.80%, 08/03/2012 (N) | | | 846 | |
| | 569 | | | 9.30%, 08/03/2013 (N) | | | 455 | |
| | | | | Community Health Systems, Inc. | | | | |
| | 139 | | | 1.00%, 07/02/2014 (N)(Q) | | | 133 | |
| | 2,721 | | | 5.34%, 07/02/2014 (N) | | | 2,604 | |
| | | | | Crescent Resources LLC | | | | |
| | 1,428 | | | 5.80%, 09/07/2012 (N)# | | | 949 | |
| | | | | General Growth Properties, Inc. | | | | |
| | 657 | | | 4.20%, 02/24/2010 (N) | | | 584 | |
| | | | | Golden Gate National | | | | |
| | 960 | | | 5.61%, 03/14/2011 (N) | | | 886 | |
| | | | | Nuveen Investments, Inc. | | | | |
| | 615 | | | 5.87%, 11/02/2014 (N) | | | 587 | |
| | | | | | | | | |
| | | | | | | | | | | | 8,154 | |
| | | | | | | | | | | | | |
| | | | | Health Care — 0.5% |
| | | | | Carestream Health, Inc. | | | | |
| | 1,189 | | | 4.83%, 04/12/2013 (N) | | | 1,014 | |
| | | | | HCA, Inc. | | | | |
| | 987 | | | 4.70%, 11/14/2012 (N) | | | 932 | |
| | 2,062 | | | 4.95%, 11/17/2013 (N)# | | | 1,960 | |
| | | | | HealthSouth Corp. | | | | |
| | 708 | | | 5.23%, 03/07/2013 (N) | | | 671 | |
| | | | | IASIS Healthcare Capital Corp. | | | | |
| | 66 | | | 4.78%, 03/15/2014 (AA) | | | 63 | |
| | 249 | | | 4.86%, 03/15/2014 (N) | | | 236 | |
| | 721 | | | 4.88%, 01/15/2014 (N) | | | 686 | |
The accompanying notes are an integral part of these financial statements.
276
| | | | | | | | | | | | | |
Principal
| | | | | | | | Market
| |
| Amount | | | | | | | | Value (W) | |
| |
| | | | | | | | | | | | | |
| SENIOR FLOATING RATE INTERESTS: NON-INVESTMENT GRADE (V) — (continued) |
| | | | | | | | | | | | | |
| | | | | Health Care — (continued) |
| | | | | LifePoint Hospitals, Inc. | | | | |
| $ | 245 | | | 4.71%, 04/15/2012 (N) | | $ | 235 | |
| | | | | Skilled Healthcare Group, Inc. | | | | |
| | 1,705 | | | 4.89%, 06/15/2012 (N)(Q) | | | 1,526 | |
| | | | | Vanguard Health Holdings Co. II LLC | | | | |
| | 304 | | | 5.13%, 09/23/2011 (N) | | | 292 | |
| | | | | | | | | |
| | | | | | | | | | | | 7,615 | |
| | | | | | | | | | | | | |
| | | | | Services — 1.7% |
| | | | | Affinion Group, Inc. | | | | |
| | 765 | | | 5.56%, 10/07/2012 (N) | | | 724 | |
| | | | | Cedar Fair L.P., Term Loan B | | | | |
| | 1,246 | | | 4.86%, 07/21/2013 (N)# | | | 1,185 | |
| | | | | CSC Holdings, Inc. | | | | |
| | 1,391 | | | 4.48%, 03/24/2013 (N)(Q) | | | 1,338 | |
| | | | | Emdeon Business Services LLC | | | | |
| | 1,815 | | | 4.70%, 11/16/2013 (AA)(Q) | | | 1,708 | |
| | | | | Gray Television, Inc. | | | | |
| | 710 | | | 4.19%, 12/31/2014 (N) | | | 621 | |
| | | | | Harrah’s Entertainment Inc. | | | | |
| | 960 | | | 5.91%, 01/28/2015 (AA)(Q) | | | 901 | |
| | | | | Idearc, Inc. | | | | |
| | 2,215 | | | 4.24%, 11/17/2013 (N) | | | 1,905 | |
| | 1,206 | | | 4.71%, 11/17/2014 (N) | | | 992 | |
| | | | | inVentiv Health, Inc. | | | | |
| | 602 | | | 4.45%, 07/05/2014 (N) | | | 557 | |
| | | | | Las Vegas Sands Corp. | | | | |
| | 353 | | | 4.45%, 05/23/2014 (N) | | | 324 | |
| | | | | Las Vegas Sands Corp., Delayed Draw Term Loan 1 | | | | |
| | 71 | | | 0.75%, 05/23/2014 (N)(Q) | | | 65 | |
| | | | | Metavante Corp. | | | | |
| | 959 | | | 4.99%, 10/31/2014 (N) | | | 914 | |
| | | | | MGM Mirage, Inc. | | | | |
| | 1,649 | | | 3.30%, 10/03/2011 (N) | | | 1,466 | |
| | | | | R.H. Donnelley, Inc. | | | | |
| | 1,287 | | | 4.41%, 06/30/2011 (N) | | | 1,218 | |
| | | | | Regal Cinemas, Inc. | | | | |
| | 1,332 | | | 4.20%, 10/27/2013 (N) | | | 1,266 | |
| | | | | SunGard Data Systems, Inc. | | | | |
| | 1,460 | | | 4.88%, 02/28/2014 (N) | | | 1,382 | |
| | | | | Telesat Canada Delayed Draw Term Loan | | | | |
| | 98 | | | 5.85%, 09/01/2014 (AA)(Q) | | | 92 | |
| | | | | Telesat Canada Term Loan B | | | | |
| | 1,142 | | | 5.85%, 09/01/2014 (AA)(Q) | | | 1,075 | |
| | | | | Tribune Co. | | | | |
| | 1,981 | | | 7.54%, 05/23/2015 (N) | | | 1,624 | |
| | | | | UPC Financing Partnership | | | | |
| | 1,447 | | | 4.46%, 12/31/2014 (N) | | | 1,353 | |
| | | | | West Corp. | | | | |
| | 1,835 | | | 5.28%, 10/23/2013 (N)# | | | 1,681 | |
| | | | | WideOpenWest Finance LLC | | | | |
| | 2,622 | | | 9.88%, 07/01/2015 (N)(Q) | | | 1,993 | |
| | | | | | | | | |
| | | | | | | | | | | | 24,384 | |
| | | | | | | | | | | | | |
| | | | | Technology — 0.8% |
| | | | | Charter Communications Operating LLC | | | | |
| | 808 | | | 4.90%, 04/28/2013 (N) | | | 714 | |
| | | | | Cincinnati Bell, Inc. | | | | |
| | 472 | | | 4.64%, 08/31/2012 (N) | | | 465 | |
| | | | | First Data Corp. | | | | |
| | 918 | | | 5.65%, 09/24/2014 (AA)(Q) | | | 863 | |
| | | | | Intelsat Bermuda Ltd. | | | | |
| | 776 | | | 5.20%, 01/11/2014 (N) | | | 773 | |
| | 2,500 | | | 9.25%, 01/15/2013 (AA)(Q) | | | 2,250 | |
| | | | | Intelsat Bermuda Ltd. Term Loan B 2A | | | | |
| | 261 | | | 5.18%, 01/03/2014 (N) | | | 247 | |
| | | | | Intelsat Bermuda Ltd. Term Loan B 2B | | | | |
| | 261 | | | 5.18%, 01/03/2014 (N) | | | 246 | |
| | | | | Intelsat Bermuda Ltd. Term Loan B 2C | | | | |
| | 261 | | | 5.18%, 01/03/2014 (N) | | | 246 | |
| | | | | Leap Wireless International, Inc. | | | | |
| | 958 | | | 5.70%, 06/15/2013 (N) | | | 942 | |
| | | | | Mediacom Broadband LLC, Term Loan D1 | | | | |
| | 1,539 | | | 4.52%, 01/31/2015 (N)# | | | 1,395 | |
| | | | | Mediacom Broadband LLC, Term Loan D2 | | | | |
| | 393 | | | 4.52%, 01/31/2015 (N) | | | 361 | |
| | | | | Mediacom LLC, Term Loan C | | | | |
| | 437 | | | 4.52%, 01/31/2015 (N)# | | | 400 | |
| | | | | MetroPCS Wireless, Inc. | | | | |
| | 1,343 | | | 5.32%, 11/02/2013 (N)(Q) | | | 1,264 | |
| | | | | Time Warner Telecom Holdings, Inc. | | | | |
| | 1,628 | | | 4.87%, 07/01/2013 (N)(Q) | | | 1,532 | |
| | | | | | | | | |
| | | | | | | | | | | | 11,698 | |
| | | | | | | | | | | | | |
| | | | | Utilities — 0.4% |
| | | | | Astoria Generating Co. Acquisitions LLC | | | | |
| | 372 | | | 4.66%, 02/23/2012 (N) | | | 356 | |
| | 390 | | | 6.35%, 08/23/2013 (N) | | | 366 | |
| | | | | Calpine Corp. | | | | |
| | 1,282 | | | 5.58%, 03/29/2014 (N) | | | 1,205 | |
| | | | | Mirant North America LLC | | | | |
| | 581 | | | 4.61%, 01/03/2013 (N)# | | | 565 | |
| | | | | NRG Energy, Inc. | | | | |
| | 1,178 | | | 4.20%, 06/08/2013 (N) | | | 1,130 | |
| | 575 | | | 4.60%, 02/01/2013 (AA) | | | 549 | |
| | | | | Texas Competitive Electric Holdings Co. LLC, Term Loan B2 | | | | |
| | 796 | | | 6.58%, 10/24/2014 (N) | | | 763 | |
| | | | | Texas Competitive Electric Holdings Co. LLC, Term Loan B3 | | | | |
| | 796 | | | 6.58%, 10/31/2014 (N) | | | 761 | |
| | | | | | | | | |
| | | | | | | | | | | | 5,695 | |
| | | | | | | | | | | | | |
| | | | | Total senior floating rate interests:
non-investment grade
(cost $88,872) | | $ | 84,894 | |
| | | | | | | | | |
| | | | | | | | | | | | | |
| | | | | | | | | | | | | |
| | | | | | | | | | | | | |
The accompanying notes are an integral part of these financial statements.
277
The Hartford Total Return Bond Fund
Schedule of Investments — (continued)
April 30, 2008 (Unaudited)
(000’s Omitted)
| | | | | | | | | | | | | |
Principal
| | | | | | | | Market
| |
| Amount | | | | | | | | Value (W) | |
| |
| U.S. GOVERNMENT AGENCIES — 34.8% |
| | | | | Federal Home Loan Mortgage Corporation — 13.0% |
| | | | | Mortgage Backed Securities: |
| $ | 2,489 | | | 5.03%, 2035 (L)# | | $ | 2,520 | |
| | 5,712 | | | 5.31%, 2037 (L)# | | | 5,808 | |
| | 6,875 | | | 5.40%, 2037 (L) | | | 6,993 | |
| | 2,410 | | | 5.42%, 2036 (L)# | | | 2,444 | |
| | 837 | | | 5.45%, 2036 (L) | | | 850 | |
| | 43,790 | | | 5.50%, 2037 | | | 44,005 | |
| | 1,271 | | | 5.82%, 2036 (L) | | | 1,303 | |
| | 70,232 | | | 6.00%, 2023 — 2038 | | | 71,987 | |
| | 2,385 | | | 6.00%, 2034 # | | | 2,448 | |
| | 37,523 | | | 6.50%, 2037 — 2038 | | | 38,901 | |
| | | | | | | | | |
| | | | | | | | | | | | 177,259 | |
| | | | | | | | | | | | | |
| | | | | Remic — Pac’s: |
| | 8,425 | | | 5.00%, 2034 # | | | 8,106 | |
| | | | | | | | | |
| | | | | | | | | | | | 185,365 | |
| | | | | | | | | | | | | |
| | | | | Federal National Mortgage Association — 18.3% |
| | | | | Mortgage Backed Securities: |
| | 593 | | | 4.66%, 2034 (L) | | | 601 | |
| | 2,284 | | | 4.69%, 2035 (L) | | | 2,283 | |
| | 1,321 | | | 4.76%, 2035 (L) | | | 1,324 | |
| | 489 | | | 4.80%, 2035 (L) | | | 491 | |
| | 821 | | | 4.87%, 2035 (L) | | | 829 | |
| | 621 | | | 4.89%, 2035 (L) | | | 631 | |
| | 1,598 | | | 4.94%, 2035 (L) | | | 1,601 | |
| | 60,398 | | | 5.00%, 2018 — 2034 | | | 59,859 | |
| | 2,632 | | | 5.00%, 2018 # | | | 2,660 | |
| | 1,167 | | | 5.08%, 2035 (L) | | | 1,184 | |
| | 19,858 | | | 5.28%, 2038 | | | 20,174 | |
| | 78,659 | | | 5.50%, 2017 — 2037 | | | 79,228 | |
| | 9,857 | | | 5.50%, 2033 # | | | 9,946 | |
| | 25,480 | | | 6.00%, 2013 — 2036 | | | 26,093 | |
| | 3,182 | | | 6.00%, 2033 # | | | 3,273 | |
| | 44,771 | | | 6.50%, 2031 — 2037 | | | 46,378 | |
| | 1,785 | | | 6.50%, 2038 (Q) | | | 1,849 | |
| | 2,162 | | | 7.00%, 2037 | | | 2,275 | |
| | 251 | | | 7.50%, 2029 — 2031 | | | 270 | |
| | | | | | | | | |
| | | | | | | | | | | | 260,949 | |
| | | | | | | | | | | | | |
| | | | | Government National Mortgage Association — 2.7% |
| | | | | Mortgage Backed Securities: |
| | 6,500 | | | 5.50%, 2038 | | | 6,596 | |
| | 4,209 | | | 5.50%, 2033 — 2035 # | | | 4,277 | |
| | 21,625 | | | 6.00%, 2037 | | | 22,230 | |
| | 3,365 | | | 6.00%, 2032 — 2034 # | | | 3,468 | |
| | 2,728 | | | 6.50%, 2028 — 2032 # | | | 2,850 | |
| | | | | | | | | |
| | | | | | | | | | | | 39,421 | |
| | | | | | | | | | | | | |
| | | | | Other Government Agencies — 0.8% |
| | | | | Small Business Administration Participation Certificates: |
| | 5,234 | | | 5.56%, 2027 | | | 5,356 | |
| | 5,524 | | | 5.57%, 2027 | | | 5,632 | |
| | | | | | | | | |
| | | | | | | | | | | | 10,988 | |
| | | | | | | | | | | | | |
| | | | | Total U.S. government agencies
(cost $490,564) | | $ | 496,723 | |
| | | | | | | | | | | | | |
| | | | | | | | | | | | | |
| U.S. GOVERNMENT SECURITIES — 4.5% |
| | | | | U.S. Treasury Securities — 4.5% |
| | | | | U.S. Treasury Bonds: |
| $ | 7,287 | | | 5.00%, 2037 (G) | | $ | 7,897 | |
| | | | | U.S. Treasury Notes: |
| | 41,105 | | | 2.50%, 2013 | | | 40,110 | |
| | 3,690 | | | 2.75%, 2013 (G) | | | 3,643 | |
| | 9,990 | | | 3.13%, 2013 | | | 10,029 | |
| | 2,205 | | | 3.50%, 2018 | | | 2,158 | |
| | | | | | | | | |
| | | | | | | | | | | | 55,940 | |
| | | | | | | | | | | | | |
| | | | | Total U.S. government securities
(cost $64,376) | | $ | 63,837 | |
| | | | | | | | | | | | | |
| | | | | | | | | | | | | |
| Shares | | | | | | | | | |
| |
| PREFERRED STOCK — 0.4% |
| | | | | Finance — 0.4% |
| | 88 | | | Federal Home Loan Mortgage Corp. | | $ | 2,249 | |
| | 155 | | | Federal National Mortgage Association | | | 3,887 | |
| | | | | | | | | |
| | | | | Total preferred stock
(cost $6,092) | | $ | 6,136 | |
| | | | | | | | | |
| | | | | Total long-term investments
(cost $1,362,548) | | $ | 1,341,332 | |
Principal
| | | | | | | | | |
| Amount | | | | | | | | | |
| |
| SHORT-TERM INVESTMENTS — 8.5% |
| | | | | Finance — 3.9% |
| | | | | BNP Paribas Finance | | | | |
| $ | 14,000 | | | 2.44%, 05/01/2008 | | $ | 13,999 | |
| | | | | Deutsche Bank | | | | |
| | 14,000 | | | 2.30%, 05/01/2008 | | | 13,999 | |
| | | | | Rabobank USA | | | | |
| | 14,000 | | | 2.31%, 05/01/2008 | | | 13,999 | |
| | | | | Societe Generale NA | | | | |
| | 14,000 | | | 2.45%, 05/01/2008 | | | 13,999 | |
| | | | | | | | | |
| | | | | | | | | | | | 55,996 | |
| | | | | | | | | | | | | |
| | | | | | | | | | | | | |
| | | | | | | | | | | | | |
| Shares | | | | | | | | | |
| |
| | | | | Investment Pools and Funds — 0.0% |
| | 114 | | | State Street Bank Money Market Fund | | | 114 | |
Principal
| | | | | | | | | |
| Amount | | | | | | | | | |
| |
| | | | | Repurchase Agreements — 2.2% |
| | | | | BNP Paribas Securities Corp. Repurchase Agreement (maturing on 05/01/2008 in the amount of $8,908, collateralized by U.S. Treasury Bond 5.50%, 2028, value of $9,188) | | | | |
| $ | 8,908 | | | 1.90% dated 04/30/2008 | | | 8,908 | |
| | | | | RBS Greenwich Capital Markets Repurchase Agreement (maturing on 05/01/2008 in the amount of $8,908, collateralized by U. S. Treasury Note 4.50%, 2011, value of $9,122) | | | | |
| | 8,908 | | | 1.90% dated 04/30/2008 | | | 8,908 | |
The accompanying notes are an integral part of these financial statements.
278
| | | | | | | | | | | | | |
Principal
| | | | | | | | Market
| |
| Amount | | | | | | | | Value (W) | |
| |
| | | | | | | | | | | | | |
| | | | | Repurchase Agreements — (continued) |
| | | | | UBS Securities, Inc. Repurchase Agreement (maturing on 05/01/2008 in the amount of $12,930, collateralized by U.S. Treasury Bond 6.00% — 8.75%, 2020 — 2026, U.S. Treasury Note 4.75% — 13.25%, 2008 — 2016, value of $13,243) | | | | |
| $ | 12,929 | | | 1.90% dated 04/30/2008 | | $ | 12,929 | |
| | | | | | | | | |
| | | | | | | | | | | | 30,745 | |
| | | | | | | | | | | | | |
| | | | | | | | | | | | | |
| | | | | | | | | | | | | |
| Shares | | | | | | | | | |
| |
| | | | | Securities Purchased with Proceeds from Security Lending — 2.2% |
| | | | | Cash Collateral Reinvestment Fund: |
| | 30,978 | | | Navigator Prime Portfolio | | | 30,978 | |
| | | | | | | | | | | | | |
| | | | | | | | | | | | | |
Principal
| | | | | | | | | |
| Amount | | | | | | | | | |
| |
| | | | | U.S. Treasury Bills — 0.2% |
| $ | 3,050 | | | 1.10%, 06/12/2008 (M)(S) | | | 3,046 | |
| | | | | | | | | |
| | | | | Total short-term investments
(cost $120,878) | | $ | 120,879 | |
| | | | | | | | | |
| | | | | Total investments
(cost $1,483,426) (C) | | | 102.6 | % | | $ | 1,462,211 | |
| | | | | Other assets and liabilities | | | (2.6 | )% | | | (36,740 | ) |
| | | | | | | | | | | | | |
| | | | | Total net assets | | | 100.0 | % | | $ | 1,425,471 | |
| | | | | | | | | | | | | |
| |
| Note: | Percentage of investments as shown is the ratio of the total market value to total net assets. Market value of investments in foreign securities represents 11.07% of total net assets at April 30, 2008. |
| | |
| (C) | | At April 30, 2008, the cost of securities for federal income tax purposes was $1,483,884 and the aggregate gross unrealized appreciation and depreciation based on that cost were: |
| | | | | |
| Unrealized Appreciation | | $ | 16,070 | |
| Unrealized Depreciation | | | (37,743 | ) |
| | | | | |
| Net Unrealized Depreciation | | $ | (21,673 | ) |
| | | | | |
| | |
| # | | This security, or a portion of this security, has been segregated to cover funding requirements on investment transactions settling in the future. |
| |
| (A) | | The aggregate value of securities valued in good faith at fair value as determined under policies and procedures established by and under the supervision of the Funds’ Board of Directors at April 30, 2008, was $229, which represents 0.02% of total net assets. This calculation excludes securities that are principally traded on certain foreign markets and whose prices were adjusted solely pursuant to a third party pricing service methodology approved by the Board of Directors. |
| |
| (AA) | | The interest rate disclosed for these securities represents an estimated average coupon as of April 30, 2008. |
| |
| (G) | | Security is partially on loan at April 30, 2008. |
| |
| (I) | | Securities issued within terms of a private placement memorandum, exempt from registration under Section 144A of the Securities Act of 1933, as amended, and may be sold only to qualified institutional buyers. Pursuant to guidelines adopted by the Board of Directors, these issues are determined to be liquid. The aggregate value of these securities at April 30, 2008, was $104,847, which represents 7.36% of total net assets. |
| |
| (K) | | Securities contain some restrictions as to public resale. These securities comply with Regulation S, rules governing offers and sales made outside the United States without registration under the Securities Act of 1933, and are determined to be liquid. At April 30, 2008, the market value of these securities amounted to $5,930 or 0.42% of net assets. |
| |
| (L) | | Variable rate securities; the rate reported is the coupon rate in effect at April 30, 2008. |
| |
| (M) | | The interest rate disclosed for these securities represents the effective yield on the date of acquisition. |
| |
| (N) | | The interest rate disclosed for these securities represents the average coupon as of April 30, 2008. |
| |
| (N) | | The interest rates disclosed for interest only strips represent effective yields based upon estimated future cash flows at April 30, 2008. |
| |
| (Q) | | The cost of securities purchased on a when-issued or delayed delivery basis at April 30, 2008 was $21,657. |
| |
| (V) | | Senior loans in which the Fund invests generally pay interest rates which are periodically adjusted by reference to a base short-term, floating lending rate plus a premium. These base lending rates are generally (i) the lending rate offered by one or more major European banks, such as the London Inter-Bank Offered Rate (LIBOR), (ii) the prime rate offered by one or more major United States Banks, or (iii) the bank’s certificate of deposit rate. Senior floating rate interests often require prepayments from excess cash flows or permit the borrower to repay at its election. The rate at which the borrower repays cannot be predicted with accuracy. As a result, the actual remaining maturity may be substantially less than the stated maturities shown. The interest rate indicated is the rate in effect at April 30, 2008. |
| |
| (X) | | Convertible security. |
| |
| (B) | | All principal amounts are in U.S. dollars unless otherwise indicated. |
| | | |
| BRL | | — Brazilian Real |
| EUR | | — Euro |
| GBP | | — British Pound |
| JPY | | — Japanese Yen |
| | |
| (H) | | The following securities are considered illiquid. Illiquid securities are often purchased in private placement transactions, are not registered under the Securities Act of 1933 and may have contractual restrictions on resale. A security may also be considered illiquid if the security lacks a readily available market or if its valuation has not changed for a certain period of time. |
| | | | | | | | | | | |
Period
| | | | | | | | |
Acquired | | Shares/Par | | | Security | | Cost Basis | |
| 10/2006 | | | 2,050 | | | ACT Depositor Corp., 5.41%, 09/22/2041 - 144A | | $ | 1,996 | |
| 03/2005 | | | 16,555 | | | Banc of America Commercial Mortgage, Inc., 1.35%, 09/11/2036 - 144A | | | 368 | |
| 08/2006 | | | 1,230 | | | Banc of America Securities Automotive Trust, 4.49%, 02/18/2013 | | | 1,227 | |
| 08/2007 | | | 19,908 | | | Bayview Commercial Asset Trust, 7.50%, 09/25/2037 - 144A | | | 2,745 | |
| 04/2007 | | | 1,000 | | | Bayview Financial Acquisition Trust, 4.54%, 05/28/2037 | | | 1,000 | |
The accompanying notes are an integral part of these financial statements.
279
The Hartford Total Return Bond Fund
Schedule of Investments — (continued)
April 30, 2008 (Unaudited)
(000’s Omitted)
| | | | | | | | | | | |
Period
| | | | | | | | |
Acquired | | Shares/Par | | | Security | | Cost Basis | |
| 10/2004 | | | 11,867 | | | Bear Stearns Commercial Mortgage Securities, Inc., 0.82%, 07/11/2042 | | $ | 280 | |
| 12/2004 | | | 9,364 | | | Bear Stearns Commercial Mortgage Securities, Inc., 4.12%, 11/11/2041 | | | 206 | |
| 03/2004 | | | 22,593 | | | Bear Stearns Commercial Mortgage Securities, Inc., 5.50%, 02/11/2041 - 144A | | | 467 | |
| 04/2006 – 08/2007 | | | 17,921 | | | CBA Commercial Small Balance Commercial Mortgage — Class X1, 7.00%, 06/25/2038 - 144A | | | 1,022 | |
| 04/2006 | | | 9,905 | | | CBA Commercial Small Balance Commercial Mortgage — Class X2, 7.00%, 07/25/2035 - 144A | | | 621 | |
| 02/2007 | | | — | | | Citigroup Mortgage Loan Trust, Inc., 0.00%, 01/25/2037 - 144A | | | — | |
| 02/2007 – 12/2007 | | | 318 | | | Citigroup Mortgage Loan Trust, Inc., 12.00%, 01/25/2037 - 144A | | | 602 | |
| 07/2007 | | | 819 | | | Credit-Based Asset Servicing and Securitization, 3.17%, 05/25/2036 - 144A | | | 799 | |
| 05/2007 | | | 10,158 | | | First Horizon Mortgage Pass-Through Trust, 5.85%, 05/25/2037 | | | 10,181 | |
| 06/2006 | | | 1,847 | | | GE Business Loan Trust, 3.72%, 05/15/2034 - 144A | | | 1,847 | |
| 06/2006 | | | 58,695 | | | GE Business Loan Trust, 6.14%, 05/15/2034 - 144A | | | 345 | |
| 07/2004 | | | 26,042 | | | Goldman Sachs Mortgage Securities Corp. II, 4.38%, 08/10/2038 - 144A | | | 186 | |
| 03/2007 | | | 385 | | | JP Morgan Automotive Receivable Trust, 12.85%, 03/15/2012 | | | 385 | |
| 09/2006 | | | 89,557 | | | JP Morgan Chase Commercial Mortgage Security Corp., 0.31%, 05/12/2045 | | | 1,882 | |
| 03/2005 | | | 89,994 | | | JP Morgan Chase Commercial Mortgage Security Corp., 4.82%, 08/12/2037 | | | 233 | |
| 10/2007 | | | 1,110 | | | LPL Holdings, Inc., 10.75%, 12/15/2015 - 144A | | | 1,130 | |
| 07/2005 | | | 813 | | | Mashantucket Western Pequot Revenue Bond, 5.91%, 09/01/2021 - 144A | | | 813 | |
| 11/2006 | | | 1,555 | | | MHP S.A., 10.25%, 11/30/2011 - 144A | | | 1,560 | |
| 04/2005 – 08/2006 | | | 3,682 | | | Morgan Stanley Dean Witter Capital I, 8.05%, 08/25/2032 - Reg — | | | 84 | |
| 04/2007 | | | 81 | | | Nationstar Home Equity Loan Trust, 9.97%, 03/25/2037 - 144A | | | 81 | |
| 11/2006 | | | 850 | | | North Street Referenced Linked Notes, 4.30%, 07/30/2010 - 144A | | | 768 | |
| 05/2007 | | | 2,685 | | | Northgroup Preferred Capital Corp., 6.38%, 10/15/2049 - 144A | | | 2,685 | |
| 03/2007 | | | 2,075 | | | Option One Mortgage Loan Trust, 6.99%, 03/25/2037 | | | 1,849 | |
| 10/2007 | | | 800 | | | Parkson Retail Group Ltd., 7.88%, 11/14/2011 | | | 813 | |
| 10/2001 – | | | 1,900 | | | Potlatch Corp., 13.00%, 12/01/2009 | | | 1,943 | |
| 11/2001 10/2007 | | | 1,000 | | | RBS-Zero Hora Editora Journalistica, 11.25, 06/15/2017 - Reg — | | | 518 | |
| 04/2008 | | | 275 | | | Rede Empresas De Energia, 11.13%, 04/02/2049 - 144A | | | 262 | |
| 03/2005 | | | 800 | | | Renaissance Home Equity Loan Trust, 5.36%, 05/25/2035 | | | 800 | |
| 03/2006 | | | 1,260 | | | Renaissance Home Equity Loan Trust, 5.75%, 05/25/2036 | | | 1,260 | |
| 08/2007 | | | 1,550 | | | Renaissance Home Equity Loan Trust — Class M5, 7.00%, 09/25/2037 | | | 1,192 | |
| 08/2007 | | | 1,950 | | | Renaissance Home Equity Loan Trust — Class M8, 7.00%, 09/25/2037 | | | 1,126 | |
| 02/2007 | | | 87 | | | Soundview NIM Trust, 6.41%, 12/25/2036 - 144A | | | 87 | |
| 10/2007 | | | 700 | | | Sri Lanka (Republic of) ADR, 8.25%, 10/24/2012 - 144A | | | 701 | |
| 02/2004 | | | 8,470 | | | Wachovia Bank Commercial Mortgage Trust, 3.65%, 02/15/2041 - 144A | | | 153 | |
08/2007 –
10/2007 | | | 686,001 | | | Wachovia Bank Commercial Mortgage Trust, 10.00%, 02/15/2051 | | | 1,105 | |
| | |
| | The aggregate value of these securities at April 30, 2008 was $37,485 which represents 2.63% of total net assets. |
| |
| (S) | | Security pledged as initial margin deposit for open futures contracts at April 30, 2008. |
| |
| | Futures Contracts Outstanding at April 30, 2008 |
| | | | | | | | | | | | | | | | | |
| | | | | | | | | | | | Unrealized
| |
| | | Number of
| | | | | | Expiration
| | | Appreciation/
| |
Description | | Contracts* | | | Position | | | Month | | | (Depreciation) | |
| |
| 2 Year U.S. Treasury Note | | | 2,121 | | | | Long | | | | Jun 2008 | | | $ | (1,675 | ) |
| 5 Year U.S. Treasury Note | | | 1,946 | | | | Long | | | | Jun 2008 | | | | (3,093 | ) |
| 10 Year U.S. Treasury Note | | | 393 | | | | Short | | | | Jun 2008 | | | | 123 | |
| U.S. Long Bond | | | 642 | | | | Short | | | | Jun 2008 | | | | 1,228 | |
| | | | | | | | | | | | | | | | | |
| | | | | | | | | | | | | | | $ | (3,417 | ) |
| | | | | | | | | | | | | | | | | |
| | |
| | * The number of contracts does not omit 000’s. |
Forward Foreign Currency Contracts Outstanding at April 30, 2008
| | | | | | | | | | | | | | | | | |
| | | | | | | | | | | | Unrealized
| |
| | | Market
| | | Contract
| | | Delivery
| | | Appreciation/
| |
Description | | Value | | | Amount | | | Date | | | (Depreciation) | |
| |
| British Pound (Sell) | | $ | 26,241 | | | $ | 26,486 | | | | 05/13/08 | | | $ | 245 | |
| Euro (Buy) | | | 13,349 | | | | 13,143 | | | | 06/17/08 | | | | 206 | |
| Euro (Buy) | | | 9,003 | | | | 9,004 | | | | 06/17/08 | | | | (1 | ) |
| Euro (Sell) | | | 39,843 | | | | 39,058 | | | | 06/17/08 | | | | (785 | ) |
| Euro (Sell) | | | 13,340 | | | | 13,077 | | | | 06/18/08 | | | | (263 | ) |
| Japanese Yen (Buy) | | | 19,428 | | | | 19,746 | | | | 05/08/08 | | | | (318 | ) |
| Japanese Yen (Sell) | | | 25,924 | | | | 26,477 | | | | 05/08/08 | | | | 553 | |
| Japanese Yen (Buy) | | | 6,409 | | | | 6,386 | | | | 05/09/08 | | | | 23 | |
| | | | | | | | | | | | | | | | | |
| | | | | | | | | | | | | | | $ | (340 | ) |
| | | | | | | | | | | | | | | | | |
| | |
| (W) | | See Note 2b of accompanying Notes to Financial Statements regarding valuation of securities. |
The accompanying notes are an integral part of these financial statements.
280
The Hartford U.S. Government Securities Fund
Schedule of Investments
April 30, 2008 (Unaudited)
(000’s Omitted)
| | | | | | | | | | | | | |
Principal
| | | | | | | | Market
| |
| Amount | | | | | | | | Value (W) | |
| ASSET & COMMERCIAL MORTGAGE BACKED SECURITIES — 7.9% |
| | | | | Finance — 7.9% |
| | | | | Bayview Commercial Asset Trust | | | | |
| $ | 12,501 | | | 7.00%, 07/25/2037 (H)(N) | | $ | 1,400 | |
| | 6,899 | | | 7.50%, 09/25/2037 (H)(N) | | | 876 | |
| | | | | Bayview Financial Acquisition Trust | | | | |
| | 2,100 | | | 4.54%, 05/28/2037 (H)(L) | | | 840 | |
| | | | | CBA Commercial Small Balance Commercial Mortgage | | | | |
| | 370 | | | 6.09%, 07/25/2039 (H)(L) | | | 223 | |
| | 390 | | | 6.50%, 07/25/2039 (H)(L) | | | 183 | |
| | 8,819 | | | 7.25%, 07/25/2039 (H)(N) | | | 847 | |
| | | | | Countrywide Asset-Backed Certificates | | | | |
| | 2,000 | | | 5.76%, 06/25/2035 | | | 1,084 | |
| | 2,000 | | | 5.80%, 07/25/2034 | | | 1,533 | |
| | | | | Lehman XS Trust | | | | |
| | 1,860 | | | 6.50%, 05/25/2037 (H)(L) | | | 1,782 | |
| | | | | Merrill Lynch/Countrywide Commercial Mortgage Trust | | | | |
| | 4,000 | | | 5.46%, 07/12/2046 (L) | | | 3,653 | |
| | | | | Nationstar Home Equity Loan Trust | | | | |
| | 55 | | | 9.97%, 03/25/2037 (H)(L) | | | 42 | |
| | | | | Option One Mortgage Loan Trust | | | | |
| | 1,000 | | | 6.99%, 03/25/2037 (H) | | | 140 | |
| | | | | Renaissance Home Equity Loan Trust | | | | |
| | 1,430 | | | 7.00%, 09/25/2037 (H) | | | 413 | |
| | 1,080 | | | 7.50%, 04/25/2037 — 06/25/2037 (H) | | | 126 | |
| | | | | Spirit Master Funding LLC | | | | |
| | 1,923 | | | 5.76%, 03/20/2024 (H) | | | 1,873 | |
| | | | | Wamu Commercial Mortgage Securities Trust | | | | |
| | 3,000 | | | 6.31%, 03/23/2045 (I)(L) | | | 1,706 | |
| | | | | | | | | |
| | | | | Total asset & commercial
mortgage backed securities
(cost $24,221) | | $ | 16,721 | |
| | | | | | | | | | | | | |
| | | | | | | | | | | | | |
| CORPORATE BONDS: INVESTMENT GRADE — 0.2% |
| | | | | Finance — 0.2% |
| | | | | North Street Referenced Linked Notes | | | | |
| $ | 500 | | | 4.30%, 07/30/2010 (H)(L) | | $ | 363 | |
| | | | | | | | | |
| | | | | Total corporate bonds: investment grade
(cost $452) | | $ | 363 | |
| | | | | | | | | | | | | |
| | | | | | | | | | | | | |
| U.S. GOVERNMENT AGENCIES — 77.8% |
| | | | | Federal Home Loan Mortgage Corporation — 16.8% |
| | | | | Mortgage Backed Securities: |
| $ | 9,179 | | | 6.00%, 2032 — 2037 | | $ | 9,405 | |
| | 56 | | | 7.00%, 2029 — 2031 | | | 59 | |
| | 86 | | | 9.00%, 2022 | | | 95 | |
| | 44 | | | 11.50%, 2015 — 2019 | | | 47 | |
| | 23 | | | 11.75%, 2011 | | | 25 | |
| | 5 | | | 12.50%, 2019 | | | 5 | |
| | | | | | | | | |
| | | | | | | | | | | | 9,636 | |
| | | | | | | | | | | | | |
| | | | | Remic — Pac’s: |
| | 25,581 | | | 6.00%, 2032 | | | 26,227 | |
| | | | | | | | | |
| | | | | | | | | | | | 35,863 | |
| | | | | | | | | | | | | |
| | | | | Federal National Mortgage Association — 48.8% |
| | | | | Mortgage Backed Securities: |
| $ | 9,743 | | | 5.48%, 2036 (L) | | $ | 9,775 | |
| | 14,926 | | | 5.50%, 2015 — 2037 | | | 14,985 | |
| | 4,598 | | | 5.99%, 2037 (L) | | | 4,678 | |
| | 1,668 | | | 6.00%, 2016 — 2031 | | | 1,720 | |
| | 1,261 | | | 6.01%, 2009 | | | 1,267 | |
| | 41,686 | | | 6.50%, 2013 �� 2038 | | | 43,123 | |
| | 18 | | | 7.50%, 2030 | | | 19 | |
| | 17 | | | 8.00%, 2025 | | | 19 | |
| | 47 | | | 8.50%, 2022 | | | 51 | |
| | 9 | | | 9.75%, 2020 | | | 9 | |
| | 54 | | | 10.00%, 2020 | | | 60 | |
| | 28 | | | 10.50%, 2012 — 2018 | | | 32 | |
| | — | | | 10.75%, 2013 | | | — | |
| | 113 | | | 11.00%, 2015 — 2020 | | | 124 | |
| | 13 | | | 11.25%, 2013 | | | 13 | |
| | 4 | | | 11.50%, 2015 | | | 4 | |
| | 15 | | | 12.00%, 2014 | | | 17 | |
| | 47 | | | 12.50%, 2015 | | | 52 | |
| | | | | | | | | |
| | | | | | | | | | | | 75,948 | |
| | | | | | | | | | | | | |
| | | | | Notes: |
| | 15,000 | | | 4.14%, 2015 (G) | | | 15,009 | |
| | 10,500 | | | 6.25%, 2029 | | | 12,241 | |
| | | | | | | | | |
| | | | | | | | | | | | 27,250 | |
| | | | | | | | | | | | | |
| | | | | Remic — Pac’s: |
| | 666 | | | 6.50%, 2012 | | | 689 | |
| | | | | | | | | |
| | | | | | | | | | | | 103,887 | |
| | | | | | | | | | | | | |
| | | | | Government National Mortgage Association — 2.3% |
| | | | | Mortgage Backed Securities: |
| | 333 | | | 6.00%, 2034 | | | 343 | |
| | 2,838 | | | 6.50%, 2031 — 2032 | | | 2,963 | |
| | 32 | | | 7.00%, 2030 | | | 34 | |
| | 92 | | | 8.00%, 2022 | | | 100 | |
| | 311 | | | 9.50%, 2016 — 2019 | | | 345 | |
| | 22 | | | 11.00%, 2015 — 2018 | | | 25 | |
| | | | | | | | | |
| | | | | | | | | | | | 3,810 | |
| | | | | | | | | | | | | |
| | | | | Remic — Pac’s: |
| | 973 | | | 6.50%, 2031 | | | 1,013 | |
| | | | | | | | | |
| | | | | | | | | | | | 4,823 | |
| | | | | | | | | | | | | |
| | | | | Other Government Agencies — 9.9% |
| | | | | Small Business Administration Participation Certificates: |
| | 1,000 | | | 5.35%, 2026 | | | 1,018 | |
| | 3,929 | | | 5.57%, 2027 | | | 4,005 | |
| | 2,301 | | | 5.66%, 2022 | | | 2,372 | |
| | 1,746 | | | 5.70%, 2026 | | | 1,812 | |
| | 1,043 | | | 5.78%, 2021 | | | 1,077 | |
| | 3,352 | | | 5.82%, 2026 | | | 3,481 | |
| | 2,440 | | | 5.98%, 2022 | | | 2,535 | |
| | 2,224 | | | 6.07%, 2026 | | | 2,333 | |
| | 2,348 | | | 6.14%, 2022 | | | 2,449 | |
| | | | | | | | | |
| | | | | | | | | | | | 21,082 | |
| | | | | | | | | | | | | |
| | | | | Total U.S. government agencies
(cost $163,150) | | $ | 165,655 | |
| | | | | | | | | | | | | |
| | | | | | | | | | | | | |
| U.S. GOVERNMENT SECURITIES — 9.5% |
| | | | | U.S. Treasury Securities — 9.5% |
| | | | | U.S. Treasury Notes: |
| $ | 11,000 | | | 2.75%, 2013 (G) | | $ | 10,859 | |
| | 5,000 | | | 3.25%, 2009 (G) | | | 5,084 | |
| | 4,076 | | | 4.50%, 2017 (G) | | | 4,319 | |
| | | | | | | | | |
| | | | | Total U.S. government securities
(cost $20,276) | | $ | 20,262 | |
| | | | | | | | | |
| | | | | Total long-term investments
(cost $208,099) | | $ | 203,001 | |
| | | | | | | | | |
| | | | | | | | | | | | | |
| | | | | | | | | | | | | |
| | | | | | | | | | | | | |
The accompanying notes are an integral part of these financial statements.
281
The Hartford U.S. Government Securities Fund
Schedule of Investments — (continued)
April 30, 2008 (Unaudited)
(000’s Omitted)
| | | | | | | | | | | | | |
Principal
| | | | | | | | Market
| |
| Amount | | | | | | | | Value (W) | |
| SHORT-TERM INVESTMENTS — 20.2% |
| | | | | Repurchase Agreements — 3.0% |
| | | | | BNP Paribas Securities Corp. Repurchase Agreement (maturing on 05/01/2008 in the amount of $1,863, collateralized by U.S. Treasury Bond 5.50%, 2028, value of $1,921) | | | | |
| $ | 1,862 | | | 1.90% dated 04/30/2008 | | $ | 1,862 | |
| | | | | RBS Greenwich Capital Markets Repurchase Agreement (maturing on 05/01/2008 in the amount of $1,863, collateralized by U. S. Treasury Note 4.50%, 2011, value of $1,907) | | | | |
| | 1,863 | | | 1.90% dated 04/30/2008 | | | 1,863 | |
| | | | | UBS Securities, Inc. Repurchase Agreement (maturing on 05/01/2008 in the amount of $2,703, collateralized by U.S. Treasury Bond 6.00% — 8.75%, 2020 — 2026, U.S. Treasury Note 4.75% — 13.25%, 2008 — 2016, value of $2,769) | | | | |
| | 2,703 | | | 1.90% dated 04/30/2008 | | | 2,703 | |
| | | | | | | | | |
| | | | | | | | | | | | 6,428 | |
| | | | | | | | | | | | | |
| | | | | | | | | | | | | |
| | | | | | | | | | | | | |
| Shares | | | | | | | | | |
| |
| | | | | Securities Purchased with Proceeds from Security Lending — 16.9% |
| | | | | Cash Collateral Reinvestment Fund: |
| | 35,906 | | | Navigator Prime Portfolio | | | 35,906 | |
| | | | | | | | | | | | | |
Principal
| | | | | | | | | |
| Amount | | | | | | | | | |
| |
| | | | | U.S. Treasury Bills — 0.3% |
| $ | 750 | | | 1.43%, 06/12/2008 (M)(S) | | | 749 | |
| | | | | | | | | |
| | | | | Total short-term investments
(cost $43,083) | | $ | 43,083 | |
| | | | | | | | | |
| | | | | Total investments
(cost $251,182) (C) | | | 115.6 | % | | $ | 246,084 | |
| | | | | Other assets and liabilities | | | (15.6 | )% | | | (33,265 | ) |
| | | | | | | | | | | | | |
| | | | | Total net assets | | | 100.0 | % | | $ | 212,819 | |
| | | | | | | | | | | | | |
| |
| Note: | Percentage of investments as shown is the ratio of the total market value to total net assets. |
| | |
| (C) | | At April 30, 2008, the cost of securities for federal income tax purposes was $251,280 and the aggregate gross unrealized appreciation and depreciation based on that cost were: |
| | | | | |
| Unrealized Appreciation | | $ | 2,856 | |
| Unrealized Depreciation | | | (8,052 | ) |
| | | | | |
| Net Unrealized Depreciation | | $ | (5,196 | ) |
| | | | | |
| | |
| (I) | | Securities issued within terms of a private placement memorandum, exempt from registration under Section 144A of the Securities Act of 1933, as amended, and may be sold only to qualified institutional buyers. Pursuant to guidelines adopted by the Board of Directors, these issues are determined to be liquid. The aggregate value of these securities at April 30, 2008, was $1,706, which represents 0.80% of total net assets. |
| |
| (L) | | Variable rate securities; the rate reported is the coupon rate in effect at April 30, 2008. |
| |
| (M) | | The interest rate disclosed for these securities represents the effective yield on the date of acquisition. |
| |
| (G) | | Security is partially on loan at April 30, 2008. |
| |
| (N) | | The interest rates disclosed for interest only strips represent effective yields based upon estimated future cash flows at April 30, 2008. |
| |
| (H) | | The following securities are considered illiquid. Illiquid securities are often purchased in private placement transactions, are not registered under the Securities Act of 1933 and may have contractual restrictions on resale. A security may also be considered illiquid if the security lacks a readily available market or if its valuation has not changed for a certain period of time. |
| | | | | | | | | | | |
Period
| | | | | | | | |
Acquired | | Shares/Par | | | Security | | Cost Basis | |
| 05/2007 | | | 12,501 | | | Bayview Commercial Asset Trust, 7.00%, 07/25/2037 - 144A | | $ | 1,772 | |
| 08/2007 | | | 6,899 | | | Bayview Commercial Asset Trust, 7.50%, 09/25/2037 - 144A | | | 957 | |
| 04/2007 | | | 2,100 | | | Bayview Financial Acquisition Trust, 4.54%, 05/28/2037 | | | 2,100 | |
| 05/2007 | | | 370 | | | CBA Commercial Small Balance Commercial Mortgage, 6.09%, 07/25/2039 - 144A | | | 370 | |
| 05/2007 | | | 390 | | | CBA Commercial Small Balance Commercial Mortgage, 6.50%, 07/25/2039 - 144A | | | 390 | |
| 05/2007 | | | 8,819 | | | CBA Commercial Small Balance Commercial Mortgage, 7.25%, 07/25/2039 - 144A | | | 775 | |
| 10/2007 | | | 1,860 | | | Lehman XS Trust, 6.50%, 05/25/2037 | | | 1,840 | |
| 04/2007 | | | 55 | | | Nationstar Home Equity Loan Trust, 9.97%, 03/25/2037 - 144A | | | 55 | |
| 11/2006 | | | 500 | | | North Street Referenced Linked Notes, 4.30%, 07/30/2010 - 144A | | | 452 | |
| 03/2007 | | | 1,000 | | | Option One Mortgage Loan Trust, 6.99%, 03/25/2037 | | | 874 | |
| 08/2007 | | | 1,430 | | | Renaissance Home Equity Loan Trust, 7.00%, 09/25/2037 | | | 1,166 | |
03/2007 –
05/2007 | | | 1,080 | | | Renaissance Home Equity Loan Trust, 7.50%, 04/25/2037 — 06/25/2037 | | | 988 | |
| 03/2006 | | | 1,923 | | | Spirit Master Funding LLC, 5.76%, 03/20/2024 - 144A | | | 1,923 | |
| | |
| | The aggregate value of these securities at April 30, 2008 was $9,108 which represents 4.28% of total net assets. |
| |
| (S) | | Security pledged as initial margin deposit for open futures contracts at April 30, 2008. |
Futures Contracts Outstanding at April 30, 2008
| | | | | | | | | | | | | | | | | |
| | | | | | | | | | | | Unrealized
| |
| | | Number of
| | | | | | Expiration
| | | Appreciation/
| |
Description | | Contracts* | | | Position | | | Month | | | (Depreciation) | |
| |
| 2 Year U.S. Treasury Note | | | 281 | | | | Long | | | | Jun 2008 | | | $ | (341 | ) |
| 5 Year U.S. Treasury Note | | | 100 | | | | Short | | | | Jun 2008 | | | | (30 | ) |
| 10 Year U.S. Treasury Note | | | 132 | | | | Long | | | | Jun 2008 | | | | (64 | ) |
| U.S. Long Bond | | | 28 | | | | Short | | | | Jun 2008 | | | | 37 | |
| | | | | | | | | | | | | | | | | |
| | | | | | | | | | | | | | | $ | (398 | ) |
| | | | | | | | | | | | | | | | | |
| | |
| | * The number of contracts does not omit 000’s. |
| |
| (W) | | See Note 2b of accompanying Notes to Financial Statements regarding valuation of securities. |
The accompanying notes are an integral part of these financial statements.
282
The Hartford Value Fund
Schedule of Investments
April 30, 2008 (Unaudited)
(000’s Omitted)
| | | | | | | | | | | | | |
| | | | | | | | | Market
| |
| Shares | | | | | | | | Value (W) | |
| COMMON STOCK — 97.7% |
| | | | | Basic Materials — 5.1% |
| | 63 | | | Agrium, Inc. (G) | | $ | 4,945 | |
| | 27 | | | Cleveland-Cliffs, Inc. (G) | | | 4,395 | |
| | 98 | | | E.I. DuPont de Nemours & Co. | | | 4,808 | |
| | 95 | | | Kimberly-Clark Corp. | | | 6,086 | |
| | 217 | | | Smurfit-Stone Container Corp. (D) | | | 1,177 | |
| | | | | | | | | |
| | | | | | | | | | | | 21,411 | |
| | | | | | | | | | | | | |
| | | | | Capital Goods — 1.5% |
| | 99 | | | Cummins, Inc. | | | 6,171 | |
| | | | | Consumer Cyclical — 7.0% |
| | 189 | | | Altria Group, Inc. | | | 3,778 | |
| | 106 | | | Gap, Inc. (G) | | | 1,974 | |
| | 215 | | | Ingram Micro, Inc. (D) | | | 3,651 | |
| | 164 | | | Kroger Co. | | | 4,466 | |
| | 92 | | | Macy’s, Inc. | | | 2,334 | |
| | 82 | | | Philip Morris International, Inc. (D) | | | 4,200 | |
| | 120 | | | Safeway, Inc. (G) | | | 3,792 | |
| | 161 | | | Supervalu, Inc. | | | 5,319 | |
| | | | | | | | | |
| | | | | | | | | | | | 29,514 | |
| | | | | | | | | | | | | |
| | | | | Consumer Staples — 5.4% |
| | 38 | | | Colgate-Palmolive Co. | | | 2,694 | |
| | 159 | | | ConAgra Foods, Inc. | | | 3,756 | |
| | 5 | | | Kellogg Co. | | | 276 | |
| | 26 | | | Nestle S.A. ADR | | | 3,137 | |
| | 128 | | | PepsiCo, Inc. | | | 8,758 | |
| | 216 | | | Tyson Foods, Inc. Class A | | | 3,850 | |
| | | | | | | | | |
| | | | | | | | | | | | 22,471 | |
| | | | | | | | | | | | | |
| | | | | Energy — 17.3% |
| | 88 | | | Chevron Corp. | | | 8,471 | |
| | 71 | | | ConocoPhillips Holding Co. | | | 6,082 | |
| | 228 | | | Exxon Mobil Corp. | | | 21,248 | |
| | 170 | | | Newfield Exploration Co. (D) | | | 10,342 | |
| | 182 | | | Occidental Petroleum Corp. | | | 15,119 | |
| | 67 | | | Total S.A. ADR | | | 5,603 | |
| | 91 | | | XTO Energy, Inc. | | | 5,643 | |
| | | | | | | | | |
| | | | | | | | | | | | 72,508 | |
| | | | | | | | | | | | | |
| | | | | Finance — 24.5% |
| | 162 | | | ACE Ltd. | | | 9,791 | |
| | 121 | | | Aetna, Inc. | | | 5,258 | |
| | 125 | | | Allstate Corp. | | | 6,305 | |
| | 179 | | | Bank of America Corp. | | | 6,716 | |
| | 99 | | | Bank of New York Mellon Corp. | | | 4,320 | |
| | 99 | | | Chubb Corp. | | | 5,255 | |
| | 256 | | | Citigroup, Inc. | | | 6,479 | |
| | 338 | | | Discover Financial Services, Inc. (G) | | | 6,148 | |
| | 32 | | | Goldman Sachs Group, Inc. | | | 6,162 | |
| | 303 | | | Host Hotels & Resorts, Inc. (G) | | | 5,213 | |
| | 244 | | | JP Morgan Chase & Co. | | | 11,622 | |
| | 179 | | | Lloyd’s TSB Group plc ADR (G) | | | 6,124 | |
| | 124 | | | Morgan Stanley | | | 6,031 | |
| | 84 | | | PNC Financial Services Group, Inc. | | | 5,791 | |
| | 61 | | | UBS AG Rights (D)(H) | | | 103 | |
| | 61 | | | UBS AG (D)(G) | | | 2,046 | |
| | 236 | | | US Bancorp | | | 7,988 | |
| | 38 | | | Wells Fargo & Co. | | | 1,133 | |
| | | | | | | | | |
| | | | | | | | | | | | 102,485 | |
| | | | | | | | | | | | | |
| | | | | Health Care — 7.5% |
| | 72 | | | Abbott Laboratories | | | 3,808 | |
| | 109 | | | Baxter International, Inc. | | | 6,762 | |
| | 165 | | | Bristol-Myers Squibb Co. | | | 3,621 | |
| | 226 | | | CVS/Caremark Corp. | | | 9,103 | |
| | 191 | | | Schering-Plough Corp. | | | 3,507 | |
| | 104 | | | Wyeth | | | 4,625 | |
| | | | | | | | | |
| | | | | | | | | | | | 31,426 | |
| | | | | | | | | | | | | |
| | | | | Services — 2.4% |
| | 199 | | | Comcast Corp. Class A (G) | | | 4,082 | |
| | 181 | | | Sun Microsystems, Inc. (D) | | | 2,836 | |
| | 200 | | | Time Warner, Inc. | | | 2,968 | |
| | | | | | | | | |
| | | | | | | | | | | | 9,886 | |
| | | | | | | | | | | | | |
| | | | | Technology — 14.5% |
| | 322 | | | AT&T, Inc. | | | 12,448 | |
| | 210 | | | Cisco Systems, Inc. (D) | | | 5,379 | |
| | 473 | | | General Electric Co. | | | 15,461 | |
| | 130 | | | Hewlett-Packard Co. | | | 6,035 | |
| | 298 | | | Intel Corp. | | | 6,629 | |
| | 40 | | | International Business Machines Corp. | | | 4,804 | |
| | 165 | | | Microsoft Corp. | | | 4,717 | |
| | 130 | | | Verizon Communications, Inc. | | | 5,002 | |
| | | | | | | | | |
| | | | | | | | | | | | 60,475 | |
| | | | | | | | | | | | | |
| | | | | Transportation — 3.0% |
| | 255 | | | Delta Air Lines, Inc. (D)(G) | | | 2,167 | |
| | 113 | | | General Dynamics Corp. | | | 10,227 | |
| | | | | | | | | |
| | | | | | | | | | | | 12,394 | |
| | | | | | | | | | | | | |
| | | | | Utilities — 9.5% |
| | 59 | | | Entergy Corp. | | | 6,777 | |
| | 104 | | | Exelon Corp. | | | 8,856 | |
| | 194 | | | FPL Group, Inc. | | | 12,853 | |
| | 94 | | | NRG Energy, Inc. (D) | | | 4,149 | |
| | 80 | | | SCANA Corp. | | | 3,170 | |
| | 110 | | | Southern Co. | | | 4,099 | |
| | | | | | | | | |
| | | | | | | | | | | | 39,904 | |
| | | | | | | | | | | | | |
| | | | | Total common stock
(cost $378,421) | | $ | 408,645 | |
| | | | | | | | | | | | | |
| | | | | | | | | | | | | |
Principal
| | | | | | | | | |
| Amount | | | | | | | | | |
| |
| SHORT-TERM INVESTMENTS — 2.8% |
| | | | | Repurchase Agreements — 1.8% |
| | | | | Banc of America Securities TriParty Joint Repurchase Agreement (maturing on 05/01/2008 in the amount of $2,814, collateralized by FHLMC 5.00%, 2035, value of $2,871) | | | | |
| $ | 2,814 | | | 1.98% dated 04/30/2008 | | $ | 2,814 | |
| | | | | BNP Paribas Securities Corp. TriParty Joint Repurchase Agreement (maturing on 05/01/2008 in the amount of $1,380, collateralized by FNMA 5.50% — 6.50%, 2036 — 2038, value of $1,408) | | | | |
| | 1,380 | | | 2.00% dated 04/30/2008 | | | 1,380 | |
The accompanying notes are an integral part of these financial statements.
283
The Hartford Value Fund
Schedule of Investments — (continued)
April 30, 2008 (Unaudited)
(000’s Omitted)
| | | | | | | | | | | | | |
Principal
| | | | | | | | Market
| |
| Amount | | | | | | | | Value (W) | |
| |
| | | | | | | | | | | | | |
| SHORT-TERM INVESTMENTS — (continued) |
| | | | | | | | | | | | | |
| | | | | Repurchase Agreements — (continued) |
| | | | | Deutsche Bank Securities Joint Repurchase Agreement (maturing on 05/01/2008 in the amount of $3, collateralized by U. S. Treasury Note 3.63%, 2009, value of $3) | | | | |
| $ | 3 | | | 1.90% dated 04/30/2008 | | $ | 3 | |
| | | | | Deutsche Bank Securities TriParty Joint Repurchase Agreement (maturing on 05/01/2008 in the amount of $1,716, collateralized by FHLMC 4.50% — 7.00%, 2016 — 2038, value of $1,750) | | | | |
| | 1,716 | | | 2.00% dated 04/30/2008 | | | 1,716 | |
| | | | | JP Morgan Chase TriParty Joint Repurchase Agreement (maturing on 05/01/2008 in the amount of $1,653, collateralized by FNMA 4.50% — 7.00%, 2020 — 2038, value of $1,686) | | | | |
| | 1,653 | | | 1.96% dated 04/30/2008 | | | 1,653 | |
| | | | | | | | | |
| | | | | | | | | | | | 7,566 | |
| | | | | | | | | | | | | |
| | | | | | | | | | | | | |
| | | | | | | | | | | | | |
| Shares | | | | | | | | | |
| |
| | | | | Securities Purchased with Proceeds from Security Lending — 1.0% |
| | | | | Cash Collateral Reinvestment Fund: |
| | 4,145 | | | Goldman Sachs FS Prime Obligation/Institutional Fund | | | 4,145 | |
| | | | | | | | | |
| | | | | Total short-term investments
(cost $11,711) | | $ | 11,711 | |
| | | | | | | | | |
| | | | | Total investments
(cost $390,132) (C) | | | 100.5 | % | | $ | 420,356 | |
| | | | | Other assets and liabilities | | | (0.5 | )% | | | (1,999 | ) |
| | | | | | | | | | | | | |
| | | | | Total net assets | | | 100.0 | % | | $ | 418,357 | |
| | | | | | | | | | | | | |
| |
| Note: | Percentage of investments as shown is the ratio of the total market value to total net assets. Market value of investments in foreign securities represents 5.25% of total net assets at April 30, 2008. |
| | |
| | Foreign securities that are principally traded on certain foreign markets are adjusted daily pursuant to a third party pricing service methodology approved by the Board of Directors in order to reflect an adjustment for factors occurring after the close of the foreign market but before the close of the New York Stock Exchange. |
| |
| (C) | | At April 30, 2008, the cost of securities for federal income tax purposes was $390,216 and the aggregate gross unrealized appreciation and depreciation based on that cost were: |
| | | | | |
| Unrealized Appreciation | | $ | 48,949 | |
| Unrealized Depreciation | | | (18,809 | ) |
| | | | | |
| Net Unrealized Appreciation | | $ | 30,140 | |
| | | | | |
| | |
| (D) | | Currently non-income producing. |
| |
| (G) | | Security is partially on loan at April 30, 2008. |
| |
| (H) | | The following securities are considered illiquid. Illiquid securities are often purchased in private placement transactions, are not registered under the Securities Act of 1933 and may have contractual restrictions on resale. A security may also be considered illiquid if the security lacks a readily available market or if its valuation has not changed for a certain period of time. |
| | | | | | | | | | | |
Period
| | | | | | | | |
Acquired | | Shares/Par | | | Security | | Cost Basis | |
| 04/2008 | | | 61 | | | UBS AG Rights | | $ | — | |
| | |
| | The aggregate value of these securities at April 30, 2008 was $103 which represents 0.02% of total net assets. |
| |
| (W) | | See Note 2b of accompanying Notes to Financial Statements regarding valuation of securities. |
The accompanying notes are an integral part of these financial statements.
284
The Hartford Value Opportunities Fund
Schedule of Investments
April 30, 2008 (Unaudited)
(000’s Omitted)
| | | | | | | | | | | | | |
| | | | | | | | | Market
| |
| Shares | | | | | | | | Value (W) | |
| COMMON STOCK — 97.0% |
| | | | | Basic Materials — 5.1% |
| | 40 | | | Alcoa, Inc. | | $ | 1,384 | |
| | 16 | | | Arch Coal, Inc. | | | 918 | |
| | 22 | | | Celanese Corp. | | | 973 | |
| | 61 | | | Chemtura Corp. | | | 424 | |
| | 20 | | | Owens-Illinois, Inc. (D) | | | 1,109 | |
| | 146 | | | Rexam plc | | | 1,288 | |
| | 144 | | | Smurfit-Stone Container Corp. (D) | | | 781 | |
| | 467 | | | Uranium One, Inc. (D) | | | 2,154 | |
| | 394 | | | USEC, Inc. (D)(G) | | | 1,830 | |
| | | | | | | | | |
| | | | | | | | | | | | 10,861 | |
| | | | | | | | | | | | | |
| | | | | Capital Goods — 5.5% |
| | 19 | | | Alliant Techsystems, Inc. (D) | | | 2,090 | |
| | 31 | | | Baker Hughes, Inc. | | | 2,507 | |
| | 37 | | | Deere & Co. | | | 3,119 | |
| | 40 | | | Kennametal, Inc. | | | 1,373 | |
| | 66 | | | Varian Semiconductor Equipment Associates, Inc. (D) | | | 2,407 | |
| | | | | | | | | |
| | | | | | | | | | | | 11,496 | |
| | | | | | | | | | | | | |
| | | | | Consumer Cyclical — 6.1% |
| | 337 | | | Ford Motor Co. (D)(G) | | | 2,779 | |
| | 117 | | | Home Depot, Inc. | | | 3,361 | |
| | 49 | | | Liz Claiborne, Inc. | | | 860 | |
| | 46 | | | MDC Holdings, Inc. | | | 2,000 | |
| | 149 | | | TRW Automotive Holdings Corp. (D) | | | 3,811 | |
| | | | | | | | | |
| | | | | | | | | | | | 12,811 | |
| | | | | | | | | | | | | |
| | | | | Consumer Staples — 7.4% |
| | 61 | | | Avon Products, Inc. | | | 2,369 | |
| | 1,462 | | | Chaoda Modern Agriculture | | | 2,103 | |
| | 60 | | | Cosan Ltd. (D) | | | 794 | |
| | 111 | | | Dean Foods Co. (D) | | | 2,568 | |
| | — | | | Japan Tobacco, Inc. | | | 2,018 | |
| | 4,032 | | | Marine Harvest (D)(G) | | | 2,646 | |
| | 94 | | | Unilever N.V. NY Shares ADR | | | 3,139 | |
| | | | | | | | | |
| | | | | | | | | | | | 15,637 | |
| | | | | | | | | | | | | |
| | | | | Energy — 10.6% |
| | 249 | | | Brasil EcoDiesel Industria (D) | | | 711 | |
| | 42 | | | Exxon Mobil Corp. | | | 3,890 | |
| | 70 | | | Newfield Exploration Co. (D) | | | 4,229 | |
| | 41 | | | Noble Energy, Inc. | | | 3,593 | |
| | 38 | | | Petro-Canada | | | 1,894 | |
| | 187 | | | Talisman Energy, Inc. | | | 3,803 | |
| | 44 | | | Total S.A. ADR | | | 3,674 | |
| | 25 | | | UGI Corp. | | | 650 | |
| | | | | | | | | |
| | | | | | | | | | | | 22,444 | |
| | | | | | | | | | | | | |
| | | | | Finance — 24.9% |
| | 137 | | | ACE Ltd. | | | 8,254 | |
| | 65 | | | Aetna, Inc. | | | 2,821 | |
| | 182 | | | AMBAC Financial Group, Inc. (G) | | | 841 | |
| | 219 | | | Bank of America Corp. | | | 8,226 | |
| | 56 | | | Capital One Financial Corp. (G) | | | 2,961 | |
| | 263 | | | CIT Group, Inc. (G) | | | 2,865 | |
| | 47 | | | Citigroup, Inc. | | | 1,198 | |
| | 39 | | | Everest Re Group Ltd. | | | 3,478 | |
| | 110 | | | Federal National Mortgage Association | | | 3,110 | |
| | 152 | | | Genesis Lease Ltd. | | | 2,057 | |
| | 179 | | | Huntington Bancshares, Inc. | | | 1,676 | |
| | 45 | | | National City Corp. (A)(H) | | | 253 | |
| | 76 | | | Oaktree Capital (D)(I) | | | 2,128 | |
| | 145 | | | PennantPark Investment Corp. | | | 1,071 | |
| | 45 | | | Platinum Underwriters Holdings Ltd. | | | 1,628 | |
| | 576 | | | Royal Bank of Scotland Group plc | | | 3,896 | |
| | 72 | | | Sovereign Bancorp, Inc. | | | 537 | |
| | 79 | | | TD Ameritrade Holding Corp. (D) | | | 1,434 | |
| | 84 | | | UBS AG Rights (D)(H) | | | 142 | |
| | 84 | | | UBS AG (D)(G) | | | 2,832 | |
| | 102 | | | Washington Mutual, Inc. PIPE (A)(H) | | | 1,131 | |
| | | | | | | | | |
| | | | | | | | | | | | 52,539 | |
| | | | | | | | | | | | | |
| | | | | Health Care — 11.2% |
| | 93 | | | Alkermes, Inc. (D) | | | 1,151 | |
| | 24 | | | Amgen, Inc. (D) | | | 1,022 | |
| | 22 | | | Astellas Pharma, Inc. | | | 885 | |
| | 29 | | | Bristol-Myers Squibb Co. | | | 646 | |
| | 107 | | | Cooper Co., Inc. (G) | | | 3,745 | |
| | 29 | | | Covidien Ltd. | | | 1,340 | |
| | 261 | | | Impax Laboratories, Inc. (D) | | | 2,410 | |
| | 21 | | | Sanofi-Aventis S.A. | | | 1,601 | |
| | 223 | | | Schering-Plough Corp. | | | 4,098 | |
| | 149 | | | Wyeth | | | 6,621 | |
| | | | | | | | | |
| | | | | | | | | | | | 23,519 | |
| | | | | | | | | | | | | |
| | | | | Services — 8.8% |
| | 208 | | | BearingPoint, Inc. (D) | | | 385 | |
| | 56 | | | CACI International, Inc. Class A (D) | | | 2,792 | |
| | 259 | | | Comcast Corp. Class A | | | 5,328 | |
| | 341 | | | Comcast Corp. Special Class A | | | 6,892 | |
| | 95 | | | R.H. Donnelley Corp. (D)(G) | | | 457 | |
| | 38 | | | United Parcel Service, Inc. Class B | | | 2,723 | |
| | | | | | | | | |
| | | | | | | | | | | | 18,577 | |
| | | | | | | | | | | | | |
| | | | | Technology — 13.0% |
| | 64 | | | Arrow Electronics, Inc. (D) | | | 1,733 | |
| | 164 | | | Cisco Systems, Inc. (D) | | | 4,197 | |
| | 122 | | | Corning, Inc. | | | 3,261 | |
| | 88 | | | Fairchild Semiconductor International, Inc. (D) | | | 1,144 | |
| | 242 | | | Flextronics International Ltd. (D) | | | 2,509 | |
| | 210 | | | JDS Uniphase Corp. (D)(G) | | | 3,010 | |
| | 109 | | | Microsoft Corp. | | | 3,095 | |
| | 83 | | | Qualcomm, Inc. | | | 3,602 | |
| | 74 | | | Solar Cayman Ltd. (A)(D)(H) | | | 986 | |
| | 103 | | | Telefonaktiebolaget LM Ericsson ADR (G) | | | 2,585 | |
| | 95 | | | Virgin Media, Inc. (G) | | | 1,223 | |
| | | | | | | | | |
| | | | | | | | | | | | 27,345 | |
| | | | | | | | | | | | | |
| | | | | Transportation — 3.5% |
| | 196 | | | Delta Air Lines, Inc. (D)(G) | | | 1,666 | |
| | 480 | | | Northwest Airlines Corp. (D) | | | 4,640 | |
| | 108 | | | US Airways Group, Inc. (D) | | | 929 | |
| | 28 | | | US Airways Group, Inc. (D)(J) | | | 238 | |
| | | | | | | | | |
| | | | | | | | | | | | 7,473 | |
| | | | | | | | | | | | | |
| | | | | Utilities — 0.9% |
| | 46 | | | Progress Energy, Inc. | | | 1,927 | |
| | | | | | | | | |
| | | | | Total common stock
(cost $232,602) | | $ | 204,629 | |
| | | | | | | | | | | | | |
| | | | | | | | | | | | | |
| PREFERRED STOCK — 1.6% |
| | | | | Finance — 1.6% |
| | — | | | National City Corp. (A)(D)(H)(X) | | | 2,154 | |
| | 65 | | | Thornburg Mortgage, Inc. (X) | | | 311 | |
| | — | | | Washington Mutual, Inc. (A)(D)(H)(X) | | | 885 | |
| | | | | | | | | |
| | | | | Total preferred stock
(cost $4,170) | | $ | 3,350 | |
| | | | | | | | | |
| | | | | Total long-term investments
(cost $236,772) | | $ | 207,979 | |
| | | | | | | | | | | | | |
| | | | | | | | | | | | | |
The accompanying notes are an integral part of these financial statements.
285
The Hartford Value Opportunities Fund
Schedule of Investments — (continued)
April 30, 2008 (Unaudited)
(000’s Omitted)
| | | | | | | | | | | | | |
Principal
| | | | | | | | | |
| Amount | | | | | | | | | |
| |
| SHORT-TERM INVESTMENTS — 11.2% |
| | | | | Repurchase Agreements — 1.2% |
| | | | | Banc of America Securities TriParty Joint Repurchase Agreement (maturing on 05/01/2008 in the amount of $949, collateralized by FHLMC 5.00%, 2035, value of $968) | | | | |
| $ | 949 | | | 1.98% dated 04/30/2008 | | $ | 949 | |
| | | | | BNP Paribas Securities Corp. TriParty Joint Repurchase Agreement (maturing on 05/01/2008 in the amount of $466, collateralized by FNMA 5.50% — 6.50%, 2036 — 2038, value of $475) | | | | |
| | 465 | | | 2.00% dated 04/30/2008 | | | 465 | |
| | | | | Deutsche Bank Securities Joint Repurchase Agreement (maturing on 05/01/2008 in the amount of $1, collateralized by U. S. Treasury Note 3.63%, 2009, value of $1) | | | | |
| | 1 | | | 1.90% dated 04/30/2008 | | | 1 | |
| | | | | Deutsche Bank Securities TriParty Joint Repurchase Agreement (maturing on 05/01/2008 in the amount of $579, collateralized by FHLMC 4.50% — 7.00%, 2016 — 2038, value of $590) | | | | |
| | 579 | | | 2.00% dated 04/30/2008 | | | 579 | |
| | | | | JP Morgan Chase TriParty Joint Repurchase Agreement (maturing on 05/01/2008 in the amount of $558, collateralized by FNMA 4.50% — 7.00%, 2020 — 2038, value of $569) | | | | |
| | 558 | | | 1.96% dated 04/30/2008 | | | 558 | |
| | | | | | | | | |
| | | | | | | | | | | | 2,552 | |
| | | | | | | | | | | | | |
| | | | | | | | | | | | | |
| | | | | | | | | | | | | |
| Shares | | | | | | | | | |
| |
| | | | | Securities Purchased with Proceeds from Security Lending — 10.0% |
| | | | | Cash Collateral Reinvestment Fund: |
| | 20,981 | | | Goldman Sachs FS Prime Obligation/Institutional Fund | | | 20,981 | |
| | | | | | | | | |
| | | | | Total short-term investments
(cost $23,533) | | $ | 23,533 | |
| | | | | | | | | |
| | | | | Total investments
(cost $260,305) (C) | | | 109.8 | % | | $ | 231,512 | |
| | | | | Other assets and liabilities | | | (9.8 | )% | | | (20,581 | ) |
| | | | | | | | | | | | | |
| | | | | Total net assets | | | 100.0 | % | | $ | 210,931 | |
| | | | | | | | | | | | | |
| |
| Note: | Percentage of investments as shown is the ratio of the total market value to total net assets. Market value of investments in foreign securities represents 18.12% of total net assets at April 30, 2008. |
| | |
| (C) | | At April 30, 2008, the cost of securities for federal income tax purposes was $260,626 and the aggregate gross unrealized appreciation and depreciation based on that cost were: |
| | | | | |
| Unrealized Appreciation | | $ | 15,644 | |
| Unrealized Depreciation | | | (44,758 | ) |
| | | | | |
| Net Unrealized Depreciation | | $ | (29,114 | ) |
| | | | | |
| | |
| (A) | | The aggregate value of securities valued in good faith at fair value as determined under policies and procedures established by and under the supervision of the Funds’ Board of Directors at April 30, 2008, was $5,409, which represents 2.56% of total net assets. This calculation excludes securities that are principally traded on certain foreign markets and whose prices were adjusted solely pursuant to a third party pricing service methodology approved by the Board of Directors. |
| |
| (D) | | Currently non-income producing. |
| |
| (G) | | Security is partially on loan at April 30, 2008. |
| |
| (I) | | Securities issued within terms of a private placement memorandum, exempt from registration under Section 144A of the Securities Act of 1933, as amended, and may be sold only to qualified institutional buyers. Pursuant to guidelines adopted by the Board of Directors, these issues are determined to be liquid. The aggregate value of these securities at April 30, 2008, was $2,128, which represents 1.01% of total net assets. |
| |
| (J) | | Securities exempt from registration under Regulation D of the Securities Act of 1933. These securities are determined to be liquid. At April 30, 2008, the market value of these securities was $238, which represents 0.11% of total net assets. |
| |
| (X) | | Convertible security. |
| |
| (H) | | The following securities are considered illiquid. Illiquid securities are often purchased in private placement transactions, are not registered under the Securities Act of 1933 and may have contractual restrictions on resale. A security may also be considered illiquid if the security lacks a readily available market or if its valuation has not changed for a certain period of time. |
| | | | | | | | | | | |
Period
| | | | | | | | |
Acquired | | Shares/Par | | | Security | | Cost Basis | |
| 04/2008 | | | 45 | | | National City Corp. | | $ | 223 | |
| 04/2008 | | | — | | | National City Corp. Preferred Stock | | | 1,900 | |
| 03/2007 | | | 74 | | | Solar Cayman Ltd. | | | 1,103 | |
01/2006 –
11/2007 | | | 84 | | | UBS AG Rights | | | — | |
| 04/2008 | | | — | | | Washington Mutual, Inc. Preferred Stock | | | 700 | |
| 04/2008 | | | 102 | | | Washington Mutual, Inc. PIPE - Reg D | | | 894 | |
| | |
| | The aggregate value of these securities at April 30, 2008 was $5,551 which represents 2.63% of total net assets. |
| |
| | PIPE — Private Investment in Public Equity |
Forward Foreign Currency Contracts Outstanding at April 30, 2008
| | | | | | | | | | | | | | | | | |
| | | | | | | | | | | | Unrealized
| |
| | | Market
| | | Contract
| | | Delivery
| | | Appreciation/
| |
Description | | Value (W) | | | Amount | | | Date | | | (Depreciation) | |
| |
| British Pound (Sell) | | $ | 3,987 | | | $ | 3,949 | | | | 07/31/08 | | | $ | (38 | ) |
| Japanese Yen (Sell) | | | 23 | | | | 23 | | | | 05/02/08 | | | | — | |
| Norwegian Krone (Sell) | | | 21 | | | | 21 | | | | 05/02/08 | | | | — | |
| | | | | | | | | | | | | | | | | |
| | | | | | | | | | | | | | | $ | (38 | ) |
| | | | | | | | | | | | | | | | | |
| | |
| (W) | | See Note 2b of accompanying Notes to Financial Statements regarding valuation of securities. |
The accompanying notes are an integral part of these financial statements.
286
(This page intentionally left blank)
287
The Hartford Mutual Funds, Inc. and The Hartford Mutual Funds II, Inc.
Statement of Assets and Liabilities
April 30, 2008 (Unaudited)
(000’s Omitted)
| | | | | | | | | | | | | |
| | | | | | Balanced
| | | Balanced
| |
| | | Advisers
| | | Allocation
| | | Income
| |
| | | Fund | | | Fund | | | Fund | |
Assets: | | | | | | | | | | | | |
| Investments in securities, at value; (amortized cost for Money Market) @ | | $ | 1,420,200 | | | $ | 5,343 | | | $ | 55,924 | |
| Investments in underlying affiliated funds, at value (S) | | | — | | | | 971,086 | | | | — | |
| Cash | | | — | | | | — | | | | — | |
| Foreign currency on deposit with custodian # | | | 13 | | | | — | | | | — | |
| Unrealized appreciation on forward foreign currency contracts | | | — | | | | — | | | | 2 | |
| Receivables: | | | | | | | | | | | | |
| Investment securities sold | | | 20,462 | | | | — | | | | 11 | |
| Fund shares sold | | | 507 | | | | 2,526 | | | | 138 | |
| Dividends and interest | | | 5,162 | | | | 1,466 | | | | 518 | |
| Variation margin | | | — | | | | — | | | | 8 | |
| Other assets | | | 63 | | | | 74 | | | | 23 | |
| | | | | | | | | | | | | |
| Total assets | | | 1,446,407 | | | | 980,495 | | | | 56,624 | |
| | | | | | | | | | | | | |
| | | | | | | | | | | | | |
Liabilities: | | | | | | | | | | | | |
| Unrealized depreciation on forward foreign currency contracts | | | 1,967 | | | | — | | | | 4 | |
| Bank overdraft — U.S. Dollars | | | 178 | | | | — | | | | — | |
| Bank overdraft — foreign cash | | | — | | | | — | | | | — | |
| Payable upon return of securities loaned (Note 2d) (I) | | | 104,889 | | | | — | | | | — | |
| Payables: | | | | | | | | | | | | |
| Investment securities purchased | | | 26,971 | | | | 22 | | | | 249 | |
| Fund shares redeemed | | | 2,156 | | | | 1,578 | | | | 38 | |
| Investment advisory and management fees (Note 5) | | | 138 | | | | 20 | | | | 7 | |
| Dividends | | | — | | | | — | | | | — | |
| Distribution fees (Note 5) | | | 97 | | | | 83 | | | | 3 | |
| Reverse repurchase agreements (Note 2g) | | | — | | | | — | | | | — | |
| Variation margin | | | — | | | | — | | | | 4 | |
| Accrued interest expense | | | — | | | | — | | | | — | |
| Accrued expenses | | | 528 | | | | 200 | | | | 7 | |
| Written options contracts | | | — | | | | — | | | | — | |
| | | | | | | | | | | | | |
| Total liabilities | | | 136,924 | | | | 1,903 | | | | 312 | |
| | | | | | | | | | | | | |
| Net assets | | $ | 1,309,483 | | | $ | 978,592 | | | $ | 56,312 | |
| | | | | | | | | | | | | |
| | | | | | | | | | | | | |
Summary of Net Assets: | | | | | | | | | | | | |
Capital stock and paid-in-capital | | $ | 1,356,542 | | | $ | 955,355 | | | $ | 56,937 | |
| Accumulated undistributed (distribution in excess of) net investment income (loss) | | | 2,421 | | | | (16,982 | ) | | | 224 | |
| Accumulated net realized gain (loss) on investments and foreign currency transactions | | | (13,583 | ) | | | 41,336 | | | | (438 | ) |
| Unrealized appreciation (depreciation) of investments and the translations of assets and liabilities denominated in foreign currency | | | (35,897 | ) | | | (1,117 | ) | | | (411 | ) |
| | | | | | | | | | | | | |
| Net assets | | $ | 1,309,483 | | | $ | 978,592 | | | $ | 56,312 | |
| | | | | | | | | | | | | |
| @ Cost of securities | | $ | 1,454,119 | | | $ | 5,223 | | | $ | 56,337 | |
| | | | | | | | | | | | | |
| @ Market value of securities on loan | | $ | 102,433 | | | $ | — | | | $ | — | |
| | | | | | | | | | | | | |
| (S) Cost of investments in underlying affiliated funds | | $ | — | | | $ | 972,323 | | | $ | — | |
| | | | | | | | | | | | | |
| # Cost of foreign currency on deposit with custodian | | $ | 13 | | | $ | — | | | $ | — | |
| | | | | | | | | | | | | |
| (I) Market Value of non-cash collateral for securities lending valued at | | $ | — | | | $ | — | | | $ | — | |
| | | | | | | | | | | | | |
| | |
| (F) | | Cash of $874 was designated to cover open put options written. |
The accompanying notes are an integral part of these financial statements.
288
| | | | | | | | | | | | | | | | | | | | | | | | | | | | | | | | |
| | | Capital
| | Capital
| | | Checks
| | | Conservative
| | | Disciplined
| | | Dividend and
| | | Equity Growth
| | | | |
| | | Appreciation
| | Appreciation II
| | | and Balances
| | | Allocation
| | | Equity
| | | Growth
| | | Allocation
| | | Equity Income
| |
| | | Fund | | Fund | | | Fund | | | Fund | | | Fund | | | Fund | | | Fund | | | Fund | |
| | | | | | | | | | | | | | | | | | | | | | | | | | | | | | | | |
| | | $ | 22,896,245 | | $ | 1,590,716 | | | $ | — | | | $ | 929 | | | $ | 298,520 | | | $ | 4,536,956 | | | $ | 2,398 | | | $ | 974,630 | |
| | | | — | | | — | | | | 721,365 | | | | 216,478 | | | | — | | | | — | | | | 285,493 | | | | — | |
| | | | 1 | | | 1,603 | | | | — | | | | — | | | | 875 | (F) | | | 1,598 | | | | — | | | | — | |
| | | | 2,180 | | | 1,708 | | | | — | | | | — | | | | — | | | | — | | | | — | | | | — | |
| | | | 59 | | | 9 | | | | — | | | | — | | | | — | | | | — | | | | — | | | | — | |
| | | | | | | | | | | | | | | | | | | | | | | | | | | | | | | | |
| | | | 140,261 | | | 25,773 | | | | — | | | | — | | | | 1,161 | | | | 21,258 | | | | — | | | | 6,831 | |
| | | | 105,400 | | | 6,689 | | | | 18,014 | | | | 789 | | | | 32 | | | | 10,211 | | | | 578 | | | | 1,778 | |
| | | | 31,038 | | | 1,691 | | | | 840 | | | | 472 | | | | 183 | | | | 6,502 | | | | 1 | | | | 1,800 | |
| | | | — | | | — | | | | — | | | | — | | | | — | | | | — | | | | — | | | | — | |
| | | | 691 | | | 136 | | | | 129 | | | | 58 | | | | 87 | | | | 138 | | | | 60 | | | | 86 | |
| | | | | | | | | | | | | | | | | | | | | | | | | | | | | | | | |
| | | | 23,175,875 | | | 1,628,325 | | | | 740,348 | | | | 218,726 | | | | 300,858 | | | | 4,576,663 | | | | 288,530 | | | | 985,125 | |
| | | | | | | | | | | | | | | | | | | | | | | | | | | | | | | | |
| | | | | | | | | | | | | | | | | | | | | | | | | | | | | | | | |
| | | | | | | | | | | | | | | | | | | | | | | | | | | | | | | | |
| | | | 64,073 | | | 82 | | | | — | | | | — | | | | — | | | | — | | | | — | | | | — | |
| | | | — | | | — | | | | — | | | | — | | | | — | | | | — | | | | — | | | | 100 | |
| | | | — | | | — | | | | — | | | | — | | | | — | | | | — | | | | — | | | | — | |
| | | | 1,307,869 | | | 106,539 | | | | — | | | | — | | | | 11,118 | | | | 342,027 | | | | — | | | | 17,370 | |
| | | | | | | | | | | | | | | | | | | | | | | | | | | | | | | | |
| | | | 50,904 | | | 24,518 | | | | 4,902 | | | | 389 | | | | 65 | | | | 12,170 | | | | 48 | | | | 2,338 | |
| | | | 23,061 | | | 2,277 | | | | 805 | | | | 235 | | | | 263 | | | | 3,935 | | | | 287 | | | | 739 | |
| | | | 2,332 | | | 222 | | | | — | | | | 5 | | | | 38 | | | | 432 | | | | 7 | | | | 115 | |
| | | | — | | | — | | | | — | | | | — | | | | — | | | | — | | | | — | | | | — | |
| | | | 1,595 | | | 123 | | | | 58 | | | | 18 | | | | 13 | | | | 237 | | | | 26 | | | | 48 | |
| | | | — | | | — | | | | — | | | | — | | | | — | | | | — | | | | — | | | | — | |
| | | | — | | | — | | | | — | | | | — | | | | — | | | | — | | | | — | | | | — | |
| | | | — | | | — | | | | — | | | | — | | | | — | | | | — | | | | — | | | | — | |
| | | | 4,058 | | | 274 | | | | 44 | | | | 46 | | | | 103 | | | | 951 | | | | 74 | | | | 180 | |
| | | | — | | | 5 | | | | — | | | | — | | | | 27 | | | | — | | | | — | | | | — | |
| | | | | | | | | | | | | | | | | | | | | | | | | | | | | | | | |
| | | | 1,453,892 | | | 134,040 | | | | 5,809 | | | | 693 | | | | 11,627 | | | | 359,752 | | | | 442 | | | | 20,890 | |
| | | | | | | | | | | | | | | | | | | | | | | | | | | | | | | | |
| | | $ | 21,721,983 | | $ | 1,494,285 | | | $ | 734,539 | | | $ | 218,033 | | | $ | 289,231 | | | $ | 4,216,911 | | | $ | 288,088 | | | $ | 964,235 | |
| | | | | | | | | | | | | | | | | | | | | | | | | | | | | | | | |
| | | | | | | | | | | | | | | | | | | | | | | | | | | | | | | | |
| | | | | | | | | | | | | | | | | | | | | | | | | | | | | | | | |
| | | $ | 18,924,791 | | $ | 1,536,861 | | | $ | 736,116 | | | $ | 217,817 | | | $ | 288,202 | | | $ | 3,609,713 | | | $ | 278,453 | | | $ | 886,524 | |
| | | | 97,852 | | | (908 | ) | | | (1,699 | ) | | | (1,607 | ) | | | 235 | | | | 5,190 | | | | (10,537 | ) | | | 1,576 | |
| | | | 491,686 | | | (17,626 | ) | | | 11,822 | | | | 4,447 | | | | (10,294 | ) | | | 102,636 | | | | 22,293 | | | | 3,392 | |
| | | | 2,207,654 | | | (24,042 | ) | | | (11,700 | ) | | | (2,624 | ) | | | 11,088 | | | | 499,372 | | | | (2,121 | ) | | | 72,743 | |
| | | | | | | | | | | | | | | | | | | | | | | | | | | | | | | | |
| | | $ | 21,721,983 | | $ | 1,494,285 | | | $ | 734,539 | | | $ | 218,033 | | | $ | 289,231 | | | $ | 4,216,911 | | | $ | 288,088 | | | $ | 964,235 | |
| | | | | | | | | | | | | | | | | | | | | | | | | | | | | | | | |
| | | $ | 20,624,435 | | $ | 1,614,665 | | | $ | — | | | $ | 897 | | | $ | 287,455 | | | $ | 4,037,584 | | | $ | 2,330 | | | $ | 901,887 | |
| | | | | | | | | | | | | | | | | | | | | | | | | | | | | | | | |
| | | $ | 1,260,719 | | $ | 102,940 | | | $ | — | | | $ | — | | | $ | 10,765 | | | $ | 333,009 | | | | | | | $ | 16,962 | |
| | | | | | | | | | | | | | | | | | | | | | | | | | | | | | | | |
| | | $ | — | | $ | — | | | $ | 733,065 | | | $ | 219,134 | | | $ | — | | | $ | — | | | $ | 287,682 | | | $ | — | |
| | | | | | | | | | | | | | | | | | | | | | | | | | | | | | | | |
| | | $ | 2,141 | | $ | 1,717 | | | $ | — | | | $ | — | | | $ | — | | | $ | — | | | $ | — | | | $ | — | |
| | | | | | | | | | | | | | | | | | | | | | | | | | | | | | | | |
| | | $ | — | | $ | — | | | $ | — | | | $ | — | | | $ | — | | | $ | — | | | $ | — | | | $ | — | |
| | | | | | | | | | | | | | | | | | | | | | | | | | | | | | | | |
289
The Hartford Mutual Funds, Inc. and The Hartford Mutual Funds II, Inc.
Statement of Assets and Liabilities — (continued)
April 30, 2008 (Unaudited)
(000’s Omitted)
| | | | | | | | | | | | | |
| | | | | | Balanced
| | | Balanced
| |
| | | Advisers
| | | Allocation
| | | Income
| |
| | | Fund | | | Fund | | | Fund | |
| Shares authorized | | | 910,000 | | | | 400,000 | | | | 800,000 | |
| | | | | | | | | | | | | |
| Par value | | | 0.001 | | | | 0.001 | | | | 0.001 | |
| | | | | | | | | | | | | |
| | | | | | | | | | | | | |
Class A: Net asset value per share/Maximum offering price per share | | $ | 15.16/$16.04 | | | $ | 11.49/$12.16 | | | $ | 10.43/$11.04 | |
| | | | | | | | | | | | | |
| Shares outstanding | | | 61,743 | | | | 53,083 | | | | 4,603 | |
| | | | | | | | | | | | | |
| Net assets | | $ | 936,121 | | | $ | 610,092 | | | $ | 48,021 | |
| | | | | | | | | | | | | |
Class B: Net asset value per share | | $ | 15.00 | | | $ | 11.46 | | | $ | 10.40 | |
| | | | | | | | | | | | | |
| Shares outstanding | | | 12,326 | | | | 11,429 | | | | 258 | |
| | | | | | | | | | | | | |
| Net assets | | $ | 184,884 | | | $ | 130,964 | | | $ | 2,680 | |
| | | | | | | | | | | | | |
Class C: Net asset value per share | | $ | 15.16 | | | $ | 11.45 | | | $ | 10.39 | |
| | | | | | | | | | | | | |
| Shares outstanding | | | 11,320 | | | | 19,500 | | | | 529 | |
| | | | | | | | | | | | | |
| Net assets | | $ | 171,612 | | | $ | 223,352 | | | $ | 5,500 | |
| | | | | | | | | | | | | |
Class I: Net asset value per share | | $ | — | | | $ | 11.49 | | | $ | — | |
| | | | | | | | | | | | | |
| Shares outstanding | | | — | | | | 274 | | | | — | |
| | | | | | | | | | | | | |
| Net assets | | $ | — | | | $ | 3,151 | | | $ | — | |
| | | | | | | | | | | | | |
Class L: Net asset value per share | | $ | — | | | $ | — | | | $ | — | |
| | | | | | | | | | | | | |
| Shares outstanding | | | — | | | | — | | | | — | |
| | | | | | | | | | | | | |
| Net assets | | $ | — | | | $ | — | | | $ | — | |
| | | | | | | | | | | | | |
Class R3: Net asset value per share | | $ | 15.32 | | | $ | 11.46 | | | $ | — | |
| | | | | | | | | | | | | |
| Shares outstanding | | | 1 | | | | 45 | | | | — | |
| | | | | | | | | | | | | |
| Net assets | | $ | 12 | | | $ | 513 | | | $ | — | |
| | | | | | | | | | | | | |
Class R4: Net asset value per share | | $ | 15.33 | | | $ | 11.49 | | | $ | — | |
| | | | | | | | | | | | | |
| Shares outstanding | | | 13 | | | | 660 | | | | — | |
| | | | | | | | | | | | | |
| Net assets | | $ | 198 | | | $ | 7,579 | | | $ | — | |
| | | | | | | | | | | | | |
Class R5: Net asset value per share | | $ | 15.34 | | | $ | 11.50 | | | $ | — | |
| | | | | | | | | | | | | |
| Shares outstanding | | | 1 | | | | 256 | | | | — | |
| | | | | | | | | | | | | |
| Net assets | | $ | 10 | | | $ | 2,941 | | | $ | — | |
| | | | | | | | | | | | | |
Class Y: Net asset value per share | | $ | 15.34 | | | $ | — | | | $ | 10.45 | |
| | | | | | | | | | | | | |
| Shares outstanding | | | 1,085 | | | | — | | | | 11 | |
| | | | | | | | | | | | | |
| Net assets | | $ | 16,646 | | | $ | — | | | $ | 111 | |
| | | | | | | | | | | | | |
The accompanying notes are an integral part of these financial statements.
290
| | | | | | | | | | | | | | | | | | | | | | | | | | | | | | | | |
| | | Capital
| | Capital
| | | Checks and
| | | Conservative
| | | Disciplined
| | | Dividend and
| | | Equity Growth
| | | | |
| | | Appreciation
| | Appreciation II
| | | Balances
| | | Allocation
| | | Equity
| | | Growth
| | | Allocation
| | | Equity Income
| |
| | | Fund | | Fund | | | Fund | | | Fund | | | Fund | | | Fund | | | Fund | | | Fund | |
| | | | 1,215,000 | | | 1,000,000 | | | | 850,000 | | | | 400,000 | | | | 450,000 | | | | 700,000 | | | | 400,000 | | | | 500,000 | |
| | | | | | | | | | | | | | | | | | | | | | | | | | | | | | | | |
| | | | 0.001 | | | 0.001 | | | | 0.001 | | | | 0.001 | | | | 0.001 | | | | 0.001 | | | | 0.001 | | | | 0.001 | |
| | | | | | | | | | | | | | | | | | | | | | | | | | | | | | | | |
| | | | | | | | | | | | | | | | | | | | | | | | | | | | | | | | |
| | | $ | 38.91/$41.17 | | $ | 13.61/$14.40 | | | $ | 9.96/$10.54 | | | $ | 10.60/$11.22 | | | $ | 13.31/$14.08 | | | $ | 20.27/$21.45 | | | $ | 12.62/$13.35 | | | $ | 13.53/$14.32 | |
| | | | | | | | | | | | | | | | | | | | | | | | | | | | | | | | |
| | | | 357,611 | | | 60,989 | | | | 49,928 | | | | 12,361 | | | | 10,948 | | | | 152,074 | | | | 13,461 | | | | 53,899 | |
| | | | | | | | | | | | | | | | | | | | | | | | | | | | | | | | |
| | | $ | 13,914,556 | | $ | 829,862 | | | $ | 497,493 | | | $ | 130,994 | | | $ | 145,728 | | | $ | 3,082,064 | | | $ | 169,933 | | | $ | 729,103 | |
| | | | | | | | | | | | | | | | | | | | | | | | | | | | | | | | |
| | | $ | 34.63 | | $ | 13.26 | | | $ | 9.94 | | | $ | 10.59 | | | $ | 12.62 | | | $ | 19.93 | | | $ | 12.52 | | | $ | 13.49 | |
| | | | | | | | | | | | | | | | | | | | | | | | | | | | | | | | |
| | | | 55,001 | | | 7,926 | | | | 6,450 | | | | 2,484 | | | | 1,692 | | | | 17,070 | | | | 3,562 | | | | 3,417 | |
| | | | | | | | | | | | | | | | | | | | | | | | | | | | | | | | |
| | | $ | 1,904,860 | | $ | 105,114 | | | $ | 64,090 | | | $ | 26,305 | | | $ | 21,352 | | | $ | 340,261 | | | $ | 44,613 | | | $ | 46,110 | |
| | | | | | | | | | | | | | | | | | | | | | | | | | | | | | | | |
| | | $ | 34.85 | | $ | 13.30 | | | $ | 9.94 | | | $ | 10.58 | | | $ | 12.63 | | | $ | 19.89 | | | $ | 12.52 | | | $ | 13.51 | |
| | | | | | | | | | | | | | | | | | | | | | | | | | | | | | | | |
| | | | 123,841 | | | 32,715 | | | | 17,313 | | | | 4,937 | | | | 1,722 | | | | 16,458 | | | | 5,484 | | | | 4,526 | |
| | | | | | | | | | | | | | | | | | | | | | | | | | | | | | | | |
| | | $ | 4,316,181 | | $ | 435,124 | | | $ | 172,069 | | | $ | 52,248 | | | $ | 21,753 | | | $ | 327,313 | | | $ | 68,657 | | | $ | 61,153 | |
| | | | | | | | | | | | | | | | | | | | | | | | | | | | | | | | |
| | | $ | 38.81 | | $ | 13.69 | | | $ | 9.96 | | | $ | 10.58 | | | $ | — | | | $ | 20.22 | | | $ | 12.64 | | | $ | 13.50 | |
| | | | | | | | | | | | | | | | | | | | | | | | | | | | | | | | |
| | | | 6,548 | | | 7,512 | | | | 89 | | | | 59 | | | | — | | | | 259 | | | | 38 | | | | 69 | |
| | | | | | | | | | | | | | | | | | | | | | | | | | | | | | | | |
| | | $ | 254,146 | | $ | 102,803 | | | $ | 887 | | | $ | 623 | | | $ | — | | | $ | 5,236 | | | $ | 480 | | | $ | 931 | |
| | | | | | | | | | | | | | | | | | | | | | | | | | | | | | | | |
| | | $ | — | | $ | — | | | $ | — | | | $ | — | | | $ | — | | | $ | — | | | $ | — | | | $ | — | |
| | | | | | | | | | | | | | | | | | | | | | | | | | | | | | | | |
| | | | — | | | — | | | | — | | | | — | | | | — | | | | — | | | | — | | | | — | |
| | | | | | | | | | | | | | | | | | | | | | | | | | | | | | | | |
| | | $ | — | | $ | — | | | $ | — | | | $ | — | | | $ | — | | | $ | — | | | $ | — | | | $ | — | |
| | | | | | | | | | | | | | | | | | | | | | | | | | | | | | | | |
| | | $ | 41.43 | | $ | 13.62 | | | $ | — | | | $ | 10.58 | | | $ | 13.69 | | | $ | 20.48 | | | $ | 12.58 | | | $ | 13.57 | |
| | | | | | | | | | | | | | | | | | | | | | | | | | | | | | | | |
| | | | 12 | | | 324 | | | | — | | | | 2 | | | | 1 | | | | 12 | | | | 67 | | | | 7 | |
| | | | | | | | | | | | | | | | | | | | | | | | | | | | | | | | |
| | | $ | 479 | | $ | 4,410 | | | $ | — | | | $ | 21 | | | $ | 11 | | | $ | 246 | | | $ | 842 | | | $ | 102 | |
| | | | | | | | | | | | | | | | | | | | | | | | | | | | | | | | |
| | | $ | 41.65 | | $ | 13.70 | | | $ | — | | | $ | 10.59 | | | $ | 13.72 | | | $ | 20.51 | | | $ | 12.59 | | | $ | 13.58 | |
| | | | | | | | | | | | | | | | | | | | | | | | | | | | | | | | |
| | | | 1,157 | | | 89 | | | | — | | | | 561 | | | | 1 | | | | 331 | | | | 195 | | | | 1 | |
| | | | | | | | | | | | | | | | | | | | | | | | | | | | | | | | |
| | | $ | 48,193 | | $ | 1,218 | | | $ | — | | | $ | 5,937 | | | $ | 10 | | | $ | 6,797 | | | $ | 2,452 | | | $ | 10 | |
| | | | | | | | | | | | | | | | | | | | | | | | | | | | | | | | |
| | | $ | 41.80 | | $ | 13.75 | | | $ | — | | | $ | 10.60 | | | $ | 13.73 | | | $ | 20.54 | | | $ | 12.64 | | | $ | 13.59 | |
| | | | | | | | | | | | | | | | | | | | | | | | | | | | | | | | |
| | | | 534 | | | 16 | | | | — | | | | 180 | | | | 1 | | | | 14 | | | | 88 | | | | 1 | |
| | | | | | | | | | | | | | | | | | | | | | | | | | | | | | | | |
| | | $ | 22,325 | | $ | 222 | | | $ | — | | | $ | 1,905 | | | $ | 10 | | | $ | 295 | | | $ | 1,111 | | | $ | 10 | |
| | | | | | | | | | | | | | | | | | | | | | | | | | | | | | | | |
| | | $ | 41.90 | | $ | 13.78 | | | $ | — | | | $ | — | | | $ | 13.74 | | | $ | 20.54 | | | $ | — | | | $ | 13.59 | |
| | | | | | | | | | | | | | | | | | | | | | | | | | | | | | | | |
| | | | 30,102 | | | 1,128 | | | | — | | | | — | | | | 7,304 | | | | 22,138 | | | | — | | | | 9,330 | |
| | | | | | | | | | | | | | | | | | | | | | | | | | | | | | | | |
| | | $ | 1,261,243 | | $ | 15,532 | | | $ | — | | | $ | — | | | $ | 100,367 | | | $ | 454,699 | | | $ | — | | | $ | 126,816 | |
| | | | | | | | | | | | | | | | | | | | | | | | | | | | | | | | |
291
The Hartford Mutual Funds, Inc. and The Hartford Mutual Funds II, Inc.
Statement of Assets and Liabilities — (continued)
April 30, 2008 (Unaudited)
(000’s Omitted)
| | | | | | | | | | | | | |
| | | | | | Fundamental
| | | Global
| |
| | | Floating Rate
| | | Growth
| | | Communications
| |
| | | Fund | | | Fund | | | Fund | |
Assets: | | | | | | | | | | | | |
| Investments in securities, at value; (amortized cost for Money Market) @ | | $ | 2,909,162 | | | $ | 76,845 | | | $ | 49,242 | |
| Investments in underlying affiliated funds, at value (S) | | | — | | | | — | | | | — | |
| Cash | | | — | | | | — | | | | 4 | |
| Foreign currency on deposit with custodian # | | | — | | | | — | | | | 35 | |
| Unrealized appreciation on forward foreign currency contracts | | | — | | | | — | | | | — | |
| Receivables: | | | | | | | | | | | | |
| Investment securities sold | | | 55,749 | | | | 407 | | | | 255 | |
| Fund shares sold | | | 20,750 | | | | 290 | | | | 122 | |
| Dividends and interest | | | 27,706 | | | | 61 | | | | 191 | |
| Variation margin | | | — | | | | — | | | | — | |
| Other assets | | | 236 | | | | 41 | | | | 36 | |
| | | | | | | | | | | | | |
| Total assets | | | 3,013,603 | | | | 77,644 | | | | 49,885 | |
| | | | | | | | | | | | | |
| | | | | | | | | | | | | |
Liabilities: | | | | | | | | | | | | |
| Unrealized depreciation on forward foreign currency contracts | | | — | | | | — | | | | — | |
| Bank overdraft — U.S. Dollars | | | 5,196 | | | | — | | | | — | |
| Bank overdraft — foreign cash | | | — | | | | — | | | | — | |
| Payable upon return of securities loaned (Note 2d) (I) | | | — | | | | 16,528 | | | | 3,810 | |
| Payables: | | | | | | | | | | | | |
| Investment securities purchased | | | 75,383 | | | | 722 | | | | — | |
| Fund shares redeemed | | | 11,760 | | | | 39 | | | | 247 | |
| Investment advisory and management fees (Note 5) | | | 288 | | | | 8 | | | | 7 | |
| Dividends | | | 4,269 | | | | — | | | | — | |
| Distribution fees (Note 5) | | | 272 | | | | 5 | | | | 4 | |
| Reverse repurchase agreements (Note 2g) | | | — | | | | — | | | | — | |
| Variation margin | | | — | | | | — | | | | — | |
| Accrued interest expense | | | — | | | | — | | | | — | |
| Accrued expenses | | | 625 | | | | 28 | | | | 12 | |
| Written options contracts | | | — | | | | — | | | | — | |
| | | | | | | | | | | | | |
| Total liabilities | | | 97,793 | | | | 17,330 | | | | 4,080 | |
| | | | | | | | | | | | | |
| Net assets | | $ | 2,915,810 | | | $ | 60,314 | | | $ | 45,805 | |
| | | | | | | | | | | | | |
| | | | | | | | | | | | | |
Summary of Net Assets: | | | | | | | | | | | | |
Capital stock and paid-in-capital | | $ | 3,389,370 | | | $ | 57,306 | | | $ | 39,155 | |
| Accumulated undistributed (distribution in excess of) net investment income (loss) | | | 4,406 | | | | (130 | ) | | | 226 | |
| Accumulated net realized gain (loss) on investments and foreign currency transactions | | | (161,676 | ) | | | (1,108 | ) | | | (524 | ) |
| Unrealized appreciation (depreciation) of investments and the translations of assets and liabilities denominated in foreign currency | | | (316,290 | ) | | | 4,246 | | | | 6,948 | |
| | | | | | | | | | | | | |
| Net assets | | $ | 2,915,810 | | | $ | 60,314 | | | $ | 45,805 | |
| | | | | | | | | | | | | |
| @ Cost of securities | | $ | 3,225,451 | | | $ | 72,599 | | | $ | 42,296 | |
| | | | | | | | | | | | | |
| @ Market value of securities on loan | | $ | — | | | $ | 16,612 | | | $ | 3,704 | |
| | | | | | | | | | | | | |
| (S) Cost of investments in underlying affiliated funds | | $ | — | | | $ | — | | | $ | — | |
| | | | | | | | | | | | | |
| # Cost of foreign currency on deposit with custodian | | $ | — | | | $ | — | | | $ | 33 | |
| | | | | | | | | | | | | |
| (I) Market Value of non-cash collateral for securities lending valued at | | $ | — | | | $ | 467 | | | $ | — | |
| | | | | | | | | | | | | |
| | |
| (a) | | Commenced operations on February 29, 2008. |
| (F) | | Cash of $7 was designated to cover open futures contracts. |
The accompanying notes are an integral part of these financial statements.
292
| | | | | | | | | | | | | | | | | | | | | | | | | | | | | | | | | |
| | | | | | Global Financial
| | | | | | | | | Global
| | | Growth
| | | | | | Growth
| |
| | | Global Equity
| | | Services
| | | Global Growth
| | | Global Health
| | | Technology
| | | Allocation
| | | Growth
| | | Opportunities
| |
| | | Fund (a) | | | Fund | | | Fund | | | Fund | | | Fund | | | Fund | | | Fund | | | Fund | |
| | | | | | | | | | | | | | | | | | | | | | | | | | | | | | | | | |
| | | $ | 20,458 | | | $ | 40,057 | | | $ | 802,691 | | | $ | 908,728 | | | $ | 65,536 | | | $ | 6,748 | | | $ | 1,077,008 | | | $ | 3,150,745 | |
| | | | — | | | | — | | | | — | | | | — | | | | — | | | | 832,856 | | | | — | | | | — | |
| | | | 8 | (F) | | | 499 | | | | — | | | | — | | | | 1 | | | | — | | | | 1 | | | | — | |
| | | | — | | | | — | | | | 244 | | | | 32 | | | | 31 | | | | — | | | | — | | | | — | |
| | | | — | | | | 2 | | | | 5 | | | | — | | | | — | | | | — | | | | — | | | | 151 | |
| | | | | | | | | | | | | | | | | | | | | | | | | | | | | | | | | |
| | | | 288 | | | | 687 | | | | — | | | | 8,660 | | | | 1,884 | | | | — | | | | 3,545 | | | | 67,439 | |
| | | | 30 | | | | 416 | | | | 297 | | | | 933 | | | | 86 | | | | 2,030 | | | | 1,269 | | | | 14,037 | |
| | | | 35 | | | | 100 | | | | 1,083 | | | | 1,779 | | | | 25 | | | | 593 | | | | 773 | | | | 1,964 | |
| | | | — | | | | — | | | | — | | | | — | | | | — | | | | — | | | | — | | | | — | |
| | | | 96 | | | | 45 | | | | 121 | | | | 92 | | | | 117 | | | | 71 | | | | 117 | | | | 273 | |
| | | | | | | | | | | | | | | | | | | | | | | | | | | | | | | | | |
| | | | 20,915 | | | | 41,806 | | | | 804,441 | | | | 920,224 | | | | 67,680 | | | | 842,298 | | | | 1,082,713 | | | | 3,234,609 | |
| | | | | | | | | | | | | | | | | | | | | | | | | | | | | | | | | |
| | | | | | | | | | | | | | | | | | | | | | | | | | | | | | | | | |
| | | | | | | | | | | | | | | | | | | | | | | | | | | | | | | | | |
| | | | 1 | | | | 8 | | | | 7 | | | | 9 | | | | — | | | | — | | | | — | | | | 66 | |
| | | | — | | | | — | | | | — | | | | 2,518 | | | | — | | | | — | | | | — | | | | 3,009 | |
| | | | — | | | | 1 | | | | — | | | | — | | | | — | | | | — | | | | — | | | | — | |
| | | | — | | | | 2,104 | | | | 74,617 | | | | 85,065 | | | | 5,145 | | | | — | | | | 23,983 | | | | 313,528 | |
| | | | | | | | | | | | | | | | | | | | | | | | | | | | | | | | | |
| | | | 204 | | | | 2,357 | | | | 9,793 | | | | — | | | | 1,651 | | | | 368 | | | | 6,331 | | | | 118,114 | |
| | | | — | | | | 78 | | | | 832 | | | | 1,707 | | | | 78 | | | | 1,493 | | | | 1,326 | | | | 8,434 | |
| | | | 3 | | | | 5 | | | | 97 | | | | 121 | | | | 9 | | | | 18 | | | | 128 | | | | 327 | |
| | | | — | | | | — | | | | — | | | | — | | | | — | | | | — | | | | — | | | | — | |
| | | | 1 | | | | 3 | | | | 37 | | | | 49 | | | | 5 | | | | 78 | | | | 51 | | | | 149 | |
| | | | — | | | | — | | | | — | | | | — | | | | — | | | | — | | | | — | | | | — | |
| | | | 1 | | | | — | | | | — | | | | — | | | | — | | | | — | | | | — | | | | — | |
| | | | — | | | | — | | | | — | | | | — | | | | — | | | | — | | | | — | | | | — | |
| | | | 1 | | | | 14 | | | | 273 | | | | 231 | | | | 37 | | | | 208 | | | | 326 | | | | 273 | |
| | | | — | | | | — | | | | — | | | | — | | | | — | | | | — | | | | — | | | | — | |
| | | | | | | | | | | | | | | | | | | | | | | | | | | | | | | | | |
| | | | 211 | | | | 4,570 | | | | 85,656 | | | | 89,700 | | | | 6,925 | | | | 2,165 | | | | 32,145 | | | | 443,900 | |
| | | | | | | | | | | | | | | | | | | | | | | | | | | | | | | | | |
| | | $ | 20,704 | | | $ | 37,236 | | | $ | 718,785 | | | $ | 830,524 | | | $ | 60,755 | | | $ | 840,133 | | | $ | 1,050,568 | | | $ | 2,790,709 | |
| | | | | | | | | | | | | | | | | | | | | | | | | | | | | | | | | |
| | | | | | | | | | | | | | | | | | | | | | | | | | | | | | | | | |
| | | | | | | | | | | | | | | | | | | | | | | | | | | | | | | | | |
| | | $ | 20,061 | | | $ | 39,739 | | | $ | 577,551 | | | $ | 817,710 | | | $ | 100,928 | | | $ | 800,769 | | | $ | 939,416 | | | $ | 2,679,870 | |
| | | | 37 | | | | 246 | | | | (1,353 | ) | | | (1,118 | ) | | | (289 | ) | | | (22,096 | ) | | | (1,205 | ) | | | (1,260 | ) |
| | | | (41 | ) | | | (2,441 | ) | | | 21,424 | | | | 10,792 | | | | (41,645 | ) | | | 53,867 | | | | 37,326 | | | | (41,554 | ) |
| | | | 647 | | | | (308 | ) | | | 121,163 | | | | 3,140 | | | | 1,761 | | | | 7,593 | | | | 75,031 | | | | 153,653 | |
| | | | | | | | | | | | | | | | | | | | | | | | | | | | | | | | | |
| | | $ | 20,704 | | | $ | 37,236 | | | $ | 718,785 | | | $ | 830,524 | | | $ | 60,755 | | | $ | 840,133 | | | $ | 1,050,568 | | | $ | 2,790,709 | |
| | | | | | | | | | | | | | | | | | | | | | | | | | | | | | | | | |
| | | $ | 19,815 | | | $ | 40,366 | | | $ | 681,541 | | | $ | 905,538 | | | $ | 63,775 | | | $ | 6,559 | | | $ | 1,001,967 | | | $ | 2,997,157 | |
| | | | | | | | | | | | | | | | | | | | | | | | | | | | | | | | | |
| | | $ | — | | | $ | 1,970 | | | $ | 71,962 | | | $ | 82,144 | | | $ | 4,999 | | | $ | — | | | $ | 23,338 | | | $ | 305,966 | |
| | | | | | | | | | | | | | | | | | | | | | | | | | | | | | | | | |
| | | $ | — | | | $ | — | | | $ | — | | | $ | — | | | $ | — | | | $ | 825,452 | | | $ | — | | | $ | — | |
| | | | | | | | | | | | | | | | | | | | | | | | | | | | | | | | | |
| | | $ | — | | | $ | — | | | $ | 231 | | | $ | 32 | | | $ | 31 | | | $ | — | | | $ | — | | | $ | — | |
| | | | | | | | | | | | | | | | | | | | | | | | | | | | | | | | | |
| | | $ | — | | | $ | — | | | $ | — | | | $ | 76 | | | $ | — | | | $ | — | | | $ | — | | | $ | — | |
| | | | | | | | | | | | | | | | | | | | | | | | | | | | | | | | | |
293
The Hartford Mutual Funds, Inc. and The Hartford Mutual Funds II, Inc.
Statement of Assets and Liabilities — (continued)
April 30, 2008 (Unaudited)
(000’s Omitted)
| | | | | | | | | | | | | |
| | | | | | Fundamental
| | | Global
| |
| | | Floating Rate
| | | Growth
| | | Communications
| |
| | | Fund | | | Fund | | | Fund | |
| Shares authorized | | | 2,400,000 | | | | 300,000 | | | | 300,000 | |
| | | | | | | | | | | | | |
| Par value | | | 0.001 | | | | 0.001 | | | | 0.001 | |
| | | | | | | | | | | | | |
| | | | | | | | | | | | | |
Class A: Net asset value per share/Maximum offering price per share | | $ | 9.11/$9.39 | | | $ | 11.61/$12.29 | | | $ | 9.52/$10.07 | |
| | | | | | | | | | | | | |
| Shares outstanding | | | 129,684 | | | | 3,144 | | | | 3,086 | |
| | | | | | | | | | | | | |
| Net assets | | $ | 1,181,372 | | | $ | 36,503 | | | $ | 29,377 | |
| | | | | | | | | | | | | |
Class B: Net asset value per share | | $ | 9.11 | | | $ | 11.05 | | | $ | 9.15 | |
| | | | | | | | | | | | | |
| Shares outstanding | | | 6,313 | | | | 952 | | | | 626 | |
| | | | | | | | | | | | | |
| Net assets | | $ | 57,496 | | | $ | 10,518 | | | $ | 5,731 | |
| | | | | | | | | | | | | |
Class C: Net asset value per share | | $ | 9.11 | | | $ | 11.06 | | | $ | 9.14 | |
| | | | | | | | | | | | | |
| Shares outstanding | | | 144,626 | | | | 1,164 | | | | 1,073 | |
| | | | | | | | | | | | | |
| Net assets | | $ | 1,316,850 | | | $ | 12,877 | | | $ | 9,806 | |
| | | | | | | | | | | | | |
Class I: Net asset value per share | | $ | 9.12 | | | $ | — | | | $ | — | |
| | | | | | | | | | | | | |
| Shares outstanding | | | 26,638 | | | | — | | | | — | |
| | | | | | | | | | | | | |
| Net assets | | $ | 242,808 | | | $ | — | | | $ | — | |
| | | | | | | | | | | | | |
Class L: Net asset value per share | | $ | — | | | $ | — | | | $ | — | |
| | | | | | | | | | | | | |
| Shares outstanding | | | — | | | | — | | | | — | |
| | | | | | | | | | | | | |
| Net assets | | $ | — | | | $ | — | | | $ | — | |
| | | | | | | | | | | | | |
Class R3: Net asset value per share | | $ | 9.12 | | | $ | — | | | $ | — | |
| | | | | | | | | | | | | |
| Shares outstanding | | | 57 | | | | — | | | | — | |
| | | | | | | | | | | | | |
| Net assets | | $ | 518 | | | $ | — | | | $ | — | |
| | | | | | | | | | | | | |
Class R4: Net asset value per share | | $ | 9.11 | | | $ | — | | | $ | — | |
| | | | | | | | | | | | | |
| Shares outstanding | | | 63 | | | | — | | | | — | |
| | | | | | | | | | | | | |
| Net assets | | $ | 572 | | | $ | — | | | $ | — | |
| | | | | | | | | | | | | |
Class R5: Net asset value per share | | $ | 9.14 | | | $ | — | | | $ | — | |
| | | | | | | | | | | | | |
| Shares outstanding | | | 21 | | | | — | | | | — | |
| | | | | | | | | | | | | |
| Net assets | | $ | 192 | | | $ | — | | | $ | — | |
| | | | | | | | | | | | | |
Class Y: Net asset value per share | | $ | 9.11 | | | $ | 11.94 | | | $ | 9.73 | |
| | | | | | | | | | | | | |
| Shares outstanding | | | 12,740 | | | | 35 | | | | 92 | |
| | | | | | | | | | | | | |
| Net assets | | $ | 116,002 | | | $ | 416 | | | $ | 891 | |
| | | | | | | | | | | | | |
| | |
| (a) | | Commenced operations on February 29, 2008. |
The accompanying notes are an integral part of these financial statements.
294
| | | | | | | | | | | | | | | | | | | | | | | | | | | | | | | | |
| | | | | Global Financial
| | | | | | | | | Global
| | | Growth
| | | | | | Growth
| |
| | | Global Equity
| | Services
| | | Global Growth
| | | Global Health
| | | Technology
| | | Allocation
| | | Growth
| | | Opportunities
| |
| | | Fund (a) | | Fund | | | Fund | | | Fund | | | Fund | | | Fund | | | Fund | | | Fund | |
| | | | 850,000 | | | 300,000 | | | | 450,000 | | | | 500,000 | | | | 300,000 | | | | 400,000 | | | | 27,000,000 | | | | 23,750,000 | |
| | | | | | | | | | | | | | | | | | | | | | | | | | | | | | | | |
| | | | 0.001 | | | 0.001 | | | | 0.001 | | | | 0.001 | | | | 0.001 | | | | 0.001 | | | | 0.0001 | | | | 0.0001 | |
| | | | | | | | | | | | | | | | | | | | | | | | | | | | | | | | |
| | | | | | | | | | | | | | | | | | | | | | | | | | | | | | | | |
| | | $ | 10.32/$10.92 | | $ | 10.31/$10.91 | | | $ | 19.27/$20.39 | | | $ | 15.73/$16.65 | | | $ | 6.15/$6.51 | | | $ | 12.24/$12.95 | | | $ | 17.45/$18.47 | | | $ | 29.04/$30.73 | |
| | | | | | | | | | | | | | | | | | | | | | | | | | | | | | | | |
| | | | 1,793 | | | 2,524 | | | | 21,825 | | | | 27,056 | | | | 5,654 | | | | 38,951 | | | | 29,482 | | | | 52,267 | |
| | | | | | | | | | | | | | | | | | | | | | | | | | | | | | | | |
| | | $ | 18,504 | | $ | 26,040 | | | $ | 420,545 | | | $ | 425,647 | | | $ | 34,769 | | | $ | 476,745 | | | $ | 514,317 | | | $ | 1,517,789 | |
| | | | | | | | | | | | | | | | | | | | | | | | | | | | | | | | |
| | | $ | 10.31 | | $ | 10.14 | | | $ | 17.74 | | | $ | 14.62 | | | $ | 5.81 | | | $ | 12.15 | | | $ | 14.84 | | | $ | 23.75 | |
| | | | | | | | | | | | | | | | | | | | | | | | | | | | | | | | |
| | | | 30 | | | 339 | | | | 3,128 | | | | 4,745 | | | | 1,979 | | | | 11,010 | | | | 2,268 | | | | 2,470 | |
| | | | | | | | | | | | | | | | | | | | | | | | | | | | | | | | |
| | | $ | 311 | | $ | 3,437 | | | $ | 55,508 | | | $ | 69,357 | | | $ | 11,496 | | | $ | 133,771 | | | $ | 33,658 | | | $ | 58,664 | |
| | | | | | | | | | | | | | | | | | | | | | | | | | | | | | | | |
| | | $ | 10.31 | | $ | 10.08 | | | $ | 17.84 | | | $ | 14.65 | | | $ | 5.77 | | | $ | 12.14 | | | $ | 14.90 | | | $ | 23.82 | |
| | | | | | | | | | | | | | | | | | | | | | | | | | | | | | | | |
| | | | 32 | | | 607 | | | | 3,484 | | | | 8,340 | | | | 2,204 | | | | 18,226 | | | | 5,028 | | | | 12,530 | |
| | | | | | | | | | | | | | | | | | | | | | | | | | | | | | | | |
| | | $ | 329 | | $ | 6,115 | | | $ | 62,164 | | | $ | 122,218 | | | $ | 12,726 | | | $ | 221,317 | | | $ | 74,899 | | | $ | 298,399 | |
| | | | | | | | | | | | | | | | | | | | | | | | | | | | | | | | |
| | | $ | 10.33 | | $ | — | | | $ | — | | | $ | 15.85 | | | $ | — | | | $ | 12.21 | | | $ | 17.56 | | | $ | 29.19 | |
| | | | | | | | | | | | | | | | | | | | | | | | | | | | | | | | |
| | | | 31 | | | — | | | | — | | | | 1,082 | | | | — | | | | 106 | | | | 2,091 | | | | 3,982 | |
| | | | | | | | | | | | | | | | | | | | | | | | | | | | | | | | |
| | | $ | 322 | | $ | — | | | $ | — | | | $ | 17,160 | | | $ | — | | | $ | 1,296 | | | $ | 36,717 | | | $ | 116,221 | |
| | | | | | | | | | | | | | | | | | | | | | | | | | | | | | | | |
| | | $ | — | | $ | — | | | $ | — | | | $ | — | | | $ | — | | | $ | — | | | $ | 17.78 | | | $ | 29.65 | |
| | | | | | | | | | | | | | | | | | | | | | | | | | | | | | | | |
| | | | — | | | — | | | | — | | | | — | | | | — | | | | — | | | | 15,265 | | | | 21,959 | |
| | | | | | | | | | | | | | | | | | | | | | | | | | | | | | | | |
| | | $ | — | | $ | — | | | $ | — | | | $ | — | | | $ | — | | | $ | — | | | $ | 271,389 | | | $ | 651,081 | |
| | | | | | | | | | | | | | | | | | | | | | | | | | | | | | | | |
| | | $ | 10.32 | | $ | — | | | $ | 20.16 | | | $ | 16.37 | | | $ | — | | | $ | 12.17 | | | $ | 17.87 | | | $ | 29.82 | |
| | | | | | | | | | | | | | | | | | | | | | | | | | | | | | | | |
| | | | 30 | | | — | | | | 1 | | | | 7 | | | | — | | | | 5 | | | | 1 | | | | 154 | |
| | | | | | | | | | | | | | | | | | | | | | | | | | | | | | | | |
| | | $ | 309 | | $ | — | | | $ | 18 | | | $ | 108 | | | $ | — | | | $ | 62 | | | $ | 17 | | | $ | 4,591 | |
| | | | | | | | | | | | | | | | | | | | | | | | | | | | | | | | |
| | | $ | 10.32 | | $ | — | | | $ | 20.22 | | | $ | 16.47 | | | $ | — | | | $ | 12.20 | | | $ | 17.96 | | | $ | 29.95 | |
| | | | | | | | | | | | | | | | | | | | | | | | | | | | | | | | |
| | | | 30 | | | — | | | | 1 | | | | 172 | | | | — | | | | 419 | | | | 87 | | | | 444 | |
| | | | | | | | | | | | | | | | | | | | | | | | | | | | | | | | |
| | | $ | 309 | | $ | — | | | $ | 11 | | | $ | 2,838 | | | $ | — | | | $ | 5,117 | | | $ | 1,571 | | | $ | 13,301 | |
| | | | | | | | | | | | | | | | | | | | | | | | | | | | | | | | |
| | | $ | 10.32 | | $ | — | | | $ | 20.35 | | | $ | 16.55 | | | $ | — | | | $ | 12.25 | | | $ | 18.03 | | | $ | 30.02 | |
| | | | | | | | | | | | | | | | | | | | | | | | | | | | | | | | |
| | | | 30 | | | — | | | | 1 | | | | 86 | | | | — | | | | 149 | | | | 4 | | | | 29 | |
| | | | | | | | | | | | | | | | | | | | | | | | | | | | | | | | |
| | | $ | 310 | | $ | — | | | $ | 21 | | | $ | 1,431 | | | $ | — | | | $ | 1,825 | | | $ | 73 | | | $ | 867 | |
| | | | | | | | | | | | | | | | | | | | | | | | | | | | | | | | |
| | | $ | 10.33 | | $ | 10.46 | | | $ | 20.39 | | | $ | 16.57 | | | $ | 6.34 | | | $ | — | | | $ | 18.07 | | | $ | 30.07 | |
| | | | | | | | | | | | | | | | | | | | | | | | | | | | | | | | |
| | | | 30 | | | 157 | | | | 8,851 | | | | 11,573 | | | | 278 | | | | — | | | | 6,527 | | | | 4,316 | |
| | | | | | | | | | | | | | | | | | | | | | | | | | | | | | | | |
| | | $ | 310 | | $ | 1,644 | | | $ | 180,518 | | | $ | 191,765 | | | $ | 1,764 | | | $ | — | | | $ | 117,927 | | | $ | 129,796 | |
| | | | | | | | | | | | | | | | | | | | | | | | | | | | | | | | |
295
The Hartford Mutual Funds, Inc. and The Hartford Mutual Funds II, Inc.
Statement of Assets and Liabilities — (continued)
April 30, 2008 (Unaudited)
(000’s Omitted)
| | | | | | | | | | | | | |
| | | | | | High Yield
| | | Income
| |
| | | High Yield
| | | Municipal Bond
| | | Allocation
| |
| | | Fund | | | Fund | | | Fund | |
Assets: | | | | | | | | | | | | |
| Investments in securities, at value; (amortized cost for Money Market) @ | | $ | 287,062 | | | $ | 216,014 | | | $ | 1,121 | |
| Investments in underlying affiliated funds, at value (S) | | | — | | | | — | | | | 60,495 | |
| Cash | | | — | | | | — | | | | — | |
| Foreign currency on deposit with custodian # | | | 1,262 | | | | — | | | | — | |
| Unrealized appreciation on forward foreign currency contracts | | | 1 | | | | — | | | | — | |
| Receivables: | | | | | | | | | | | | |
| Investment securities sold | | | 1,924 | | | | 909 | | | | 79 | |
| Fund shares sold | | | 813 | | | | 9,920 | | | | 134 | |
| Dividends and interest | | | 5,419 | | | | 2,687 | | | | 234 | |
| Variation margin | | | 58 | | | | — | | | | — | |
| Other assets | | | 136 | | | | 105 | | | | 70 | |
| | | | | | | | | | | | | |
| Total assets | | | 296,675 | | | | 229,635 | | | | 62,133 | |
| | | | | | | | | | | | | |
| | | | | | | | | | | | | |
Liabilities: | | | | | | | | | | | | |
| Unrealized depreciation on forward foreign currency contracts | | | — | | | | — | | | | — | |
| Bank overdraft — U.S. Dollars | | | — | | | | — | | | | — | |
| Bank overdraft — foreign cash | | | — | | | | — | | | | — | |
| Payable upon return of securities loaned (Note 2d) (I) | | | 37,883 | | | | — | | | | — | |
| Payables: | | | | | | | | | | | | |
| Investment securities purchased | | | 6,564 | | | | 19,930 | | | | — | |
| Fund shares redeemed | | | 236 | | | | 181 | | | | 152 | |
| Investment advisory and management fees (Note 5) | | | 29 | | | | 18 | | | | 2 | |
| Dividends | | | 289 | | | | 364 | | | | — | |
| Distribution fees (Note 5) | | | 17 | | | | 13 | | | | 5 | |
| Reverse repurchase agreements (Note 2g) | | | — | | | | — | | | | — | |
| Variation margin | | | — | | | | — | | | | — | |
| Accrued interest expense | | | — | | | | — | | | | — | |
| Accrued expenses | | | 133 | | | | 4 | | | | 12 | |
| Written options contracts | | | — | | | | — | | | | — | |
| | | | | | | | | | | | | |
| Total liabilities | | | 45,151 | | | | 20,510 | | | | 171 | |
| | | | | | | | | | | | | |
| Net assets | | $ | 251,524 | | | $ | 209,125 | | | $ | 61,962 | |
| | | | | | | | | | | | | |
| | | | | | | | | | | | | |
Summary of Net Assets: | | | | | | | | | | | | |
Capital stock and paid-in-capital | | $ | 343,461 | | | $ | 217,394 | | | $ | 63,347 | |
| Accumulated undistributed (distribution in excess of) net investment income (loss) | | | 210 | | | | 83 | | | | 11 | |
| Accumulated net realized gain (loss) on investments and foreign currency transactions | | | (84,110 | ) | | | (864 | ) | | | (727 | ) |
| Unrealized appreciation (depreciation) of investments and the translations of assets and liabilities denominated in foreign currency | | | (8,037 | ) | | | (7,488 | ) | | | (669 | ) |
| | | | | | | | | | | | | |
| Net assets | | $ | 251,524 | | | $ | 209,125 | | | $ | 61,962 | |
| | | | | | | | | | | | | |
| @ Cost of securities | | $ | 294,982 | | | $ | 223,502 | | | $ | 1,126 | |
| | | | | | | | | | | | | |
| @ Market value of securities on loan | | $ | 37,114 | | | $ | — | | | $ | — | |
| | | | | | | | | | | | | |
| (S) Cost of investments in underlying affiliated funds | | $ | — | | | $ | — | | | $ | 61,159 | |
| | | | | | | | | | | | | |
| # Cost of foreign currency on deposit with custodian | | $ | 1,258 | | | $ | — | | | $ | — | |
| | | | | | | | | | | | | |
| (I) Market Value of non-cash collateral for securities lending valued at | | $ | — | | | $ | — | | | $ | — | |
| | | | | | | | | | | | | |
| | |
| (1) | | Formerly known as The Hartford Select MidCap Growth Fund. |
The accompanying notes are an integral part of these financial statements.
296
| | | | | | | | | | | | | | | | | | | | | | | | | | | | | | | | | |
| | | | | | | | | International
| | | International
| | | International
| | | LargeCap
| | | | | | | |
| | | Income
| | | Inflation Plus
| | | Growth
| | | Opportunities
| | | Small Company
| | | Growth
| | | MidCap
| | | MidCap Growth
| |
| | | Fund | | | Fund | | | Fund | | | Fund | | | Fund | | | Fund | | | Fund | | | Fund (1) | |
| | | | | | | | | | | | | | | | | | | | | | | | | | | | | | | | | |
| | | $ | 397,138 | | | $ | 832,952 | | | $ | 611,481 | | | $ | 551,764 | | | $ | 340,598 | | | $ | 11,321 | | | $ | 3,850,688 | | | $ | 54,758 | |
| | | | — | | | | — | | | | — | | | | — | | | | — | | | | — | | | | — | | | | — | |
| | | | — | | | | — | | | | 3,250 | | | | — | | | | — | | | | — | | | | 1 | | | | 27 | |
| | | | 79 | | | | 4 | | | | 3,843 | | | | 1 | | | | — | | | | — | | | | 34 | | | | — | |
| | | | — | | | | — | | | | 69 | | | | 14 | | | | 21 | | | | — | | | | — | | | | — | |
| | | | | | | | | | | | | | | | | | | | | | | | | | | | | | | | | |
| | | | 1,599 | | | | 18,576 | | | | 23,939 | | | | 6,892 | | | | 5,191 | | | | 4,193 | | | | 32,077 | | | | — | |
| | | | 390 | | | | 2,073 | | | | 1,334 | | | | 2,728 | | | | 351 | | | | 1 | | | | 3,179 | | | | 122 | |
| | | | 3,403 | | | | 3,524 | | | | 1,514 | | | | 1,084 | | | | 1,239 | | | | 6 | | | | 1,013 | | | | 14 | |
| | | | 481 | | | | — | | | | — | | | | — | | | | — | | | | — | | | | — | | | | — | |
| | | | 57 | | | | 168 | | | | 93 | | | | 85 | | | | 73 | | | | 32 | | | | 86 | | | | 53 | |
| | | | | | | | | | | | | | | | | | | | | | | | | | | | | | | | | |
| | | | 403,147 | | | | 857,297 | | | | 645,523 | | | | 562,568 | | | | 347,473 | | | | 15,553 | | | | 3,887,078 | | | | 54,974 | |
| | | | | | | | | | | | | | | | | | | | | | | | | | | | | | | | | |
| | | | | | | | | | | | | | | | | | | | | | | | | | | | | | | | | |
| | | | | | | | | | | | | | | | | | | | | | | | | | | | | | | | | |
| | | | 144 | | | | — | | | | 713 | | | | 29 | | | | 12 | | | | — | | | | — | | | | — | |
| | | | — | | | | — | | | | — | | | | 774 | | | | 455 | | | | — | | | | — | | | | — | |
| | | | — | | | | — | | | | — | | | | — | | | | — | | | | — | | | | — | | | | — | |
| | | | 52,840 | | | | — | | | | 47,047 | | | | 88,124 | | | | 51,115 | | | | — | | | | 817,311 | | | | 12,046 | |
| | | | | | | | | | | | | | | | | | | | | | | | | | | | | | | | | |
| | | | 4,895 | | | | 12,803 | | | | 34,857 | | | | 14,130 | | | | 5,893 | | | | 4,183 | | | | 53,566 | | | | 27 | |
| | | | 220 | | | | 2,023 | | | | 1,334 | | | | 461 | | | | 485 | | | | — | | | | 3,694 | | | | 48 | |
| | | | 31 | | | | 69 | | | | 83 | | | | 64 | | | | 42 | | | | 1 | | | | 363 | | | | 5 | |
| | | | 142 | | | | 467 | | | | — | | | | — | | | | — | | | | — | | | | — | | | | — | |
| | | | 9 | | | | 61 | | | | 31 | | | | 22 | | | | 11 | | | | — | | | | 213 | | | | 3 | |
| | | | — | | | | 50,738 | | | | — | | | | — | | | | — | | | | — | | | | — | | | | — | |
| | | | 207 | | | | 78 | | | | — | | | | — | | | | — | | | | — | | | | — | | | | — | |
| | | | — | | | | 3 | | | | — | | | | — | | | | — | | | | — | | | | — | | | | — | |
| | | | 30 | | | | 135 | | | | 168 | | | | 119 | | | | 73 | | | | 3 | | | | 850 | | | | 19 | |
| | | | — | | | | 750 | | | | — | | | | — | | | | — | | | | — | | | | — | | | | — | |
| | | | | | | | | | | | | | | | | | | | | | | | | | | | | | | | | |
| | | | 58,518 | | | | 67,127 | | | | 84,233 | | | | 103,723 | | | | 58,086 | | | | 4,187 | | | | 875,997 | | | | 12,148 | |
| | | | | | | | | | | | | | | | | | | | | | | | | | | | | | | | | |
| | | $ | 344,629 | | | $ | 790,170 | | | $ | 561,290 | | | $ | 458,845 | | | $ | 289,387 | | | $ | 11,366 | | | $ | 3,011,081 | | | $ | 42,826 | |
| | | | | | | | | | | | | | | | | | | | | | | | | | | | | | | | | |
| | | | | | | | | | | | | | | | | | | | | | | | | | | | | | | | | |
| | | | | | | | | | | | | | | | | | | | | | | | | | | | | | | | | |
| | | $ | 359,145 | | | $ | 777,410 | | | $ | 555,687 | | | $ | 413,326 | | | $ | 290,258 | | | $ | 12,095 | | | $ | 2,672,943 | | | $ | 45,327 | |
| | | | 386 | | | | 1,085 | | | | (43 | ) | | | 580 | | | | (566 | ) | | | (14 | ) | | | (4,922 | ) | | | (38 | ) |
| | | | (2,395 | ) | | | 7,799 | | | | (16,915 | ) | | | 18,634 | | | | 2,058 | | | | (743 | ) | | | 85,772 | | | | (791 | ) |
| | | | (12,507 | ) | | | 3,876 | | | | 22,561 | | | | 26,305 | | | | (2,363 | ) | | | 28 | | | | 257,288 | | | | (1,672 | ) |
| | | | | | | | | | | | | | | | | | | | | | | | | | | | | | | | | |
| | | $ | 344,629 | | | $ | 790,170 | | | $ | 561,290 | | | $ | 458,845 | | | $ | 289,387 | | | $ | 11,366 | | | $ | 3,011,081 | | | $ | 42,826 | |
| | | | | | | | | | | | | | | | | | | | | | | | | | | | | | | | | |
| | | $ | 408,738 | | | $ | 829,436 | | | $ | 588,539 | | | $ | 525,464 | | | $ | 342,944 | | | $ | 11,293 | | | $ | 3,593,400 | | | $ | 56,437 | |
| | | | | | | | | | | | | | | | | | | | | | | | | | | | | | | | | |
| | | $ | 51,792 | | | $ | — | | | $ | 44,771 | | | $ | 84,968 | | | $ | 49,652 | | | $ | — | | | $ | 793,026 | | | $ | 11,848 | |
| | | | | | | | | | | | | | | | | | | | | | | | | | | | | | | | | |
| | | $ | — | | | $ | — | | | $ | — | | | $ | — | | | $ | — | | | $ | — | | | $ | — | | | $ | — | |
| | | | | | | | | | | | | | | | | | | | | | | | | | | | | | | | | |
| | | $ | 79 | | | $ | 3 | | | $ | 3,599 | | | $ | 1 | | | $ | — | | | $ | — | | | $ | 34 | | | $ | — | |
| | | | | | | | | | | | | | | | | | | | | | | | | | | | | | | | | |
| | | $ | — | | | $ | — | | | $ | — | | | $ | 1,145 | | | $ | 1,295 | | | $ | — | | | $ | — | | | $ | 92 | |
| | | | | | | | | | | | | | | | | | | | | | | | | | | | | | | | | |
297
The Hartford Mutual Funds, Inc. and The Hartford Mutual Funds II, Inc.
Statement of Assets and Liabilities — (continued)
April 30, 2008 (Unaudited)
(000’s Omitted)
| | | | | | | | | | | | | |
| | | | | | High Yield
| | | Income
| |
| | | High Yield
| | | Municipal Bond
| | | Allocation
| |
| | | Fund | | | Fund | | | Fund | |
| Shares authorized | | | 500,000 | | | | 650,000 | | | | 400,000 | |
| | | | | | | | | | | | | |
| Par value | | | 0.001 | | | | 0.001 | | | | 0.001 | |
| | | | | | | | | | | | | |
| | | | | | | | | | | | | |
Class A: Net asset value per share/Maximum offering price per share | | $ | 7.46/$7.81 | | | $ | 8.76/$9.17 | | | $ | 9.77/$10.23 | |
| | | | | | | | | | | | | |
| Shares outstanding | | | 23,471 | | | | 13,586 | | | | 4,204 | |
| | | | | | | | | | | | | |
| Net assets | | $ | 175,082 | | | $ | 119,046 | | | $ | 41,093 | |
| | | | | | | | | | | | | |
Class B: Net asset value per share | | $ | 7.44 | | | $ | 8.76 | | | $ | 9.77 | |
| | | | | | | | | | | | | |
| Shares outstanding | | | 3,658 | | | | 341 | | | | 652 | |
| | | | | | | | | | | | | |
| Net assets | | $ | 27,233 | | | $ | 2,986 | | | $ | 6,375 | |
| | | | | | | | | | | | | |
Class C: Net asset value per share | | $ | 7.45 | | | $ | 8.77 | | | $ | 9.77 | |
| | | | | | | | | | | | | |
| Shares outstanding | | | 4,892 | | | | 5,437 | | | | 1,345 | |
| | | | | | | | | | | | | |
| Net assets | | $ | 36,438 | | | $ | 47,656 | | | $ | 13,138 | |
| | | | | | | | | | | | | |
Class I: Net asset value per share | | $ | 7.46 | | | $ | 8.77 | | | $ | 9.78 | |
| | | | | | | | | | | | | |
| Shares outstanding | | | 13 | | | | 4,497 | | | | 84 | |
| | | | | | | | | | | | | |
| Net assets | | $ | 98 | | | $ | 39,437 | | | $ | 821 | |
| | | | | | | | | | | | | |
Class L: Net asset value per share | | $ | — | | | $ | — | | | $ | — | |
| | | | | | | | | | | | | |
| Shares outstanding | | | — | | | | — | | | | — | |
| | | | | | | | | | | | | |
| Net assets | | $ | — | | | $ | — | | | $ | — | |
| | | | | | | | | | | | | |
Class R3: Net asset value per share | | $ | 7.46 | | | $ | — | | | $ | 9.78 | |
| | | | | | | | | | | | | |
| Shares outstanding | | | 2 | | | | — | | | | 2 | |
| | | | | | | | | | | | | |
| Net assets | | $ | 12 | | | $ | — | | | $ | 16 | |
| | | | | | | | | | | | | |
Class R4: Net asset value per share | | $ | 7.46 | | | $ | — | | | $ | 9.77 | |
| | | | | | | | | | | | | |
| Shares outstanding | | | 1 | | | | — | | | | 52 | |
| | | | | | | | | | | | | |
| Net assets | | $ | 10 | | | $ | — | | | $ | 507 | |
| | | | | | | | | | | | | |
Class R5: Net asset value per share | | $ | 7.46 | | | $ | — | | | $ | 9.78 | |
| | | | | | | | | | | | | |
| Shares outstanding | | | 1 | | | | — | | | | 1 | |
| | | | | | | | | | | | | |
| Net assets | | $ | 10 | | | $ | — | | | $ | 12 | |
| | | | | | | | | | | | | |
Class Y: Net asset value per share | | $ | 7.46 | | | $ | — | | | $ | — | |
| | | | | | | | | | | | | |
| Shares outstanding | | | 1,694 | | | | — | | | | — | |
| | | | | | | | | | | | | |
| Net assets | | $ | 12,641 | | | $ | — | | | $ | — | |
| | | | | | | | | | | | | |
| | |
| (1) | | Formerly known as The Hartford Select MidCap Growth Fund. |
The accompanying notes are an integral part of these financial statements.
298
| | | | | | | | | | | | | | | | | | | | | | | | | | | | | | | | |
| | | | | | | | International
| | | International
| | | International
| | | LargeCap
| | | | | | | |
| | | Income
| | Inflation Plus
| | | Growth
| | | Opportunities
| | | Small Company
| | | Growth
| | | MidCap
| | | MidCap Growth
| |
| | | Fund | | Fund | | | Fund | | | Fund | | | Fund | | | Fund | | | Fund | | | Fund (1) | |
| | | | 300,000 | | | 600,000 | | | | 500,000 | | | | 500,000 | | | | 350,000 | | | | 800,000 | | | | 460,000 | | | | 800,000 | |
| | | | | | | | | | | | | | | | | | | | | | | | | | | | | | | | |
| | | | 0.001 | | | 0.001 | | | | 0.001 | | | | 0.001 | | | | 0.001 | | | | 0.001 | | | | 0.001 | | | | 0.001 | |
| | | | | | | | | | | | | | | | | | | | | | | | | | | | | | | | |
| | | | | | | | | | | | | | | | | | | | | | | | | | | | | | | | |
| | | $ | 9.87/$10.34 | | $ | 11.19/$11.72 | | | $ | 13.61/$14.40 | | | $ | 16.97/$17.96 | | | $ | 13.88/$14.69 | | | $ | 9.44/$9.99 | | | $ | 21.03/$22.25 | | | $ | 9.72/$10.29 | |
| | | | | | | | | | | | | | | | | | | | | | | | | | | | | | | | |
| | | | 10,992 | | | 24,797 | | | | 27,550 | | | | 14,995 | | | | 8,579 | | | | 1,076 | | | | 94,553 | | | | 3,426 | |
| | | | | | | | | | | | | | | | | | | | | | | | | | | | | | | | |
| | | $ | 108,449 | | $ | 277,495 | | | $ | 374,895 | | | $ | 254,454 | | | $ | 119,053 | | | $ | 10,146 | | | $ | 1,988,190 | | | $ | 33,283 | |
| | | | | | | | | | | | | | | | | | | | | | | | | | | | | | | | |
| | | $ | 9.87 | | $ | 11.17 | | | $ | 12.85 | | | $ | 15.64 | | | $ | 13.37 | | | $ | 9.33 | | | $ | 18.59 | | | $ | 9.49 | |
| | | | | | | | | | | | | | | | | | | | | | | | | | | | | | | | |
| | | | 1,002 | | | 6,983 | | | | 3,295 | | | | 2,075 | | | | 1,168 | | | | 42 | | | | 19,117 | | | | 456 | |
| | | | | | | | | | | | | | | | | | | | | | | | | | | | | | | | |
| | | $ | 9,889 | | $ | 77,996 | | | $ | 42,341 | | | $ | 32,448 | | | $ | 15,619 | | | $ | 393 | | | $ | 355,403 | | | $ | 4,328 | |
| | | | | | | | | | | | | | | | | | | | | | | | | | | | | | | | |
| | | $ | 9.89 | | $ | 11.16 | | | $ | 12.87 | | | $ | 15.48 | | | $ | 13.20 | | | $ | 9.34 | | | $ | 18.75 | | | $ | 9.44 | |
| | | | | | | | | | | | | | | | | | | | | | | | | | | | | | | | |
| | | | 1,657 | | | 20,298 | | | | 4,300 | | | | 2,468 | | | | 1,909 | | | | 78 | | | | 23,595 | | | | 529 | |
| | | | | | | | | | | | | | | | | | | | | | | | | | | | | | | | |
| | | $ | 16,378 | | $ | 226,581 | | | $ | 55,340 | | | $ | 38,199 | | | $ | 25,188 | | | $ | 730 | | | $ | 442,509 | | | $ | 4,996 | |
| | | | | | | | | | | | | | | | | | | | | | | | | | | | | | | | |
| | | $ | — | | $ | 11.22 | | | $ | 13.52 | | | $ | — | | | $ | 13.87 | | | $ | — | | | $ | — | | | $ | — | |
| | | | | | | | | | | | | | | | | | | | | | | | | | | | | | | | |
| | | | — | | | 1,171 | | | | 209 | | | | — | | | | 42 | | | | — | | | | — | | | | — | |
| | | | | | | | | | | | | | | | | | | | | | | | | | | | | | | | |
| | | $ | — | | $ | 13,146 | | | $ | 2,827 | | | $ | — | | | $ | 583 | | | $ | — | | | $ | — | | | $ | — | |
| | | | | | | | | | | | | | | | | | | | | | | | | | | | | | | | |
| | | $ | — | | $ | — | | | $ | — | | | $ | — | | | $ | — | | | $ | — | | | $ | — | | | $ | — | |
| | | | | | | | | | | | | | | | | | | | | | | | | | | | | | | | |
| | | | — | | | — | | | | — | | | | — | | | | — | | | | — | | | | — | | | | — | |
| | | | | | | | | | | | | | | | | | | | | | | | | | | | | | | | |
| | | $ | — | | $ | — | | | $ | — | | | $ | — | | | $ | — | | | $ | — | | | $ | — | | | $ | — | |
| | | | | | | | | | | | | | | | | | | | | | | | | | | | | | | | |
| | | $ | — | | $ | 11.20 | | | $ | 13.84 | | | $ | 17.47 | | | $ | — | | | $ | — | | | $ | — | | | $ | — | |
| | | | | | | | | | | | | | | | | | | | | | | | | | | | | | | | |
| | | | — | | | 9 | | | | 12 | | | | 4 | | | | — | | | | — | | | | — | | | | — | |
| | | | | | | | | | | | | | | | | | | | | | | | | | | | | | | | |
| | | $ | — | | $ | 97 | | | $ | 171 | | | $ | 61 | | | $ | — | | | $ | — | | | $ | — | | | $ | — | |
| | | | | | | | | | | | | | | | | | | | | | | | | | | | | | | | |
| | | $ | — | | $ | 11.20 | | | $ | 13.91 | | | $ | 17.55 | | | $ | — | | | $ | — | | | $ | — | | | $ | — | |
| | | | | | | | | | | | | | | | | | | | | | | | | | | | | | | | |
| | | | — | | | 1 | | | | 2 | | | | 4 | | | | — | | | | — | | | | — | | | | — | |
| | | | | | | | | | | | | | | | | | | | | | | | | | | | | | | | |
| | | $ | — | | $ | 11 | | | $ | 31 | | | $ | 78 | | | $ | — | | | $ | — | | | $ | — | | | $ | — | |
| | | | | | | | | | | | | | | | | | | | | | | | | | | | | | | | |
| | | $ | — | | $ | 11.21 | | | $ | 13.98 | | | $ | 17.56 | | | $ | — | | | $ | — | | | $ | — | | | $ | — | |
| | | | | | | | | | | | | | | | | | | | | | | | | | | | | | | | |
| | | | — | | | 1 | | | | 1 | | | | 1 | | | | — | | | | — | | | | — | | | | — | |
| | | | | | | | | | | | | | | | | | | | | | | | | | | | | | | | |
| | | $ | — | | $ | 11 | | | $ | 11 | | | $ | 12 | | | $ | — | | | $ | — | | | $ | — | | | $ | — | |
| | | | | | | | | | | | | | | | | | | | | | | | | | | | | | | | |
| | | $ | 9.85 | | $ | 11.22 | | | $ | 14.01 | | | $ | 17.57 | | | $ | 14.09 | | | $ | 9.48 | | | $ | 22.72 | | | $ | 9.86 | |
| | | | | | | | | | | | | | | | | | | | | | | | | | | | | | | | |
| | | | 21,303 | | | 17,366 | | | | 6,115 | | | | 7,604 | | | | 9,153 | | | | 10 | | | | 9,903 | | | | 22 | |
| | | | | | | | | | | | | | | | | | | | | | | | | | | | | | | | |
| | | $ | 209,913 | | $ | 194,833 | | | $ | 85,674 | | | $ | 133,593 | | | $ | 128,944 | | | $ | 97 | | | $ | 224,979 | | | $ | 219 | |
| | | | | | | | | | | | | | | | | | | | | | | | | | | | | | | | |
299
The Hartford Mutual Funds, Inc. and The Hartford Mutual Funds II, Inc.
Statement of Assets and Liabilities — (continued)
April 30, 2008 (Unaudited)
(000’s Omitted)
| | | | | | | | | | | | | |
| | | | | | | | | Retirement
| |
| | | MidCap Value
| | | Money Market
| | | Income
| |
| | | Fund | | | Fund | | | Fund | |
Assets: | | | | | | | | | | | | |
| Investments in securities, at value; (amortized cost for Money Market) @ | | $ | 415,090 | | | $ | 628,042 | | | $ | — | |
| Investments in underlying affiliated funds, at value (S) | | | — | | | | — | | | | 7,306 | |
| Cash | | | — | | | | 1 | | | | — | |
| Foreign currency on deposit with custodian # | | | — | | | | — | | | | — | |
| Unrealized appreciation on forward foreign currency contracts | | | — | | | | — | | | | — | |
| Receivables: | | | | | | | | | | | | |
| Investment securities sold | | | 2,998 | | | | — | | | | 1 | |
| Fund shares sold | | | 12 | | | | 983 | | | | 1 | |
| Dividends and interest | | | 233 | | | | 505 | | | | 19 | |
| Variation margin | | | — | | | | — | | | | — | |
| Other assets | | | 114 | | | | 187 | | | | 58 | |
| | | | | | | | | | | | | |
| Total assets | | | 418,447 | | | | 629,718 | | | | 7,385 | |
| | | | | | | | | | | | | |
| | | | | | | | | | | | | |
Liabilities: | | | | | | | | | | | | |
| Unrealized depreciation on forward foreign currency contracts | | | — | | | | — | | | | — | |
| Bank overdraft — U.S. Dollars | | | — | | | | — | | | | — | |
| Bank overdraft — foreign cash | | | — | | | | — | | | | — | |
| Payable upon return of securities loaned (Note 2d) (I) | | | 90,418 | | | | — | | | | — | |
| Payables: | | | | | | | | | | | | |
| Investment securities purchased | | | 1,772 | | | | — | | | | — | |
| Fund shares redeemed | | | 759 | | | | 1,758 | | | | 2 | |
| Investment advisory and management fees (Note 5) | | | 45 | | | | 46 | | | | — | |
| Dividends | | | — | | | | 57 | | | | — | |
| Distribution fees (Note 5) | | | 24 | | | | 44 | | | | — | |
| Reverse repurchase agreements (Note 2g) | | | — | | | | — | | | | — | |
| Variation margin | | | — | | | | — | | | | — | |
| Accrued interest expense | | | — | | | | — | | | | — | |
| Accrued expenses | | | 167 | | | | 85 | | | | 2 | |
| Written options contracts | | | — | | | | — | | | | — | |
| | | | | | | | | | | | | |
| Total liabilities | | | 93,185 | | | | 1,990 | | | | 4 | |
| | | | | | | | | | | | | |
| Net assets | | $ | 325,262 | | | $ | 627,728 | | | $ | 7,381 | |
| | | | | | | | | | | | | |
| | | | | | | | | | | | | |
Summary of Net Assets: | | | | | | | | | | | | |
Capital stock and paid-in-capital | | $ | 335,644 | | | $ | 627,728 | | | $ | 7,481 | |
| Accumulated undistributed (distribution in excess of) net investment income (loss) | | | (174 | ) | | | — | | | | (34 | ) |
| Accumulated net realized gain (loss) on investments and foreign currency transactions | | | (16,948 | ) | | | — | | | | 29 | |
| Unrealized appreciation (depreciation) of investments and the translations of assets and liabilities denominated in foreign currency | | | 6,740 | | | | — | | | | (95 | ) |
| | | | | | | | | | | | | |
| Net assets | | $ | 325,262 | | | $ | 627,728 | | | $ | 7,381 | |
| | | | | | | | | | | | | |
| @ Cost of securities | | $ | 408,350 | | | $ | 628,042 | | | $ | — | |
| | | | | | | | | | | | | |
| @ Market value of securities on loan | | $ | 86,581 | | | $ | — | | | $ | — | |
| | | | | �� | | | | | | | | |
| (S) Cost of investments in underlying affiliated funds | | $ | — | | | $ | — | | | $ | 7,401 | |
| | | | | | | | | | | | | |
| # Cost of foreign currency on deposit with custodian | | $ | — | | | $ | — | | | $ | — | |
| | | | | | | | | | | | | |
| (I) Market Value of non-cash collateral for securities lending valued at | | $ | — | | | $ | — | | | $ | — | |
| | | | | | | | | | | | | |
| | |
| (F) | | Cash of $59 was designated to cover open futures contracts. |
The accompanying notes are an integral part of these financial statements.
300
| | | | | | | | | | | | | | | | | | | | | | | | | | | | | | | | | |
| | | Select MidCap
| | | Select SmallCap
| | | | | | | | | SmallCap
| | | | | | | | | | |
| | | Value
| | | Value
| | | Short Duration
| | | Small Company
| | | Growth
| | | Stock
| | | Strategic Income
| | | Target
| |
| | | Fund | | | Fund | | | Fund | | | Fund | | | Fund | | | Fund | | | Fund | | | Retirement 2010 Fund | |
| | | | | | | | | | | | | | | | | | | | | | | | | | | | | | | | | |
| | | $ | 96,174 | | | $ | 106,748 | | | $ | 214,579 | | | $ | 969,008 | | | $ | 444,936 | | | $ | 904,414 | | | $ | 233,874 | | | $ | 409 | |
| | | | — | | | | — | | | | — | | | | — | | | | — | | | | — | | | | — | | | | 15,378 | |
| | | | — | | | | 59 | (F) | | | 17 | | | | 99 | | | | 1 | | | | 1 | | | | 19 | | | | — | |
| | | | — | | | | — | | | | — | | | | — | | | | — | | | | 9 | | | | 116 | | | | — | |
| | | | — | | | | — | | | | — | | | | 5 | | | | — | | | | — | | | | — | | | | — | |
| | | | | | | | | | | | | | | | | | | | | | | | | | | | | | | | | |
| | | | — | | | | 232 | | | | — | | | | 4,390 | | | | 222 | | | | 9,526 | | | | 3,506 | | | | — | |
| | | | 61 | | | | — | | | | 358 | | | | 5,193 | | | | 198 | | | | 169 | | | | 2,350 | | | | 24 | |
| | | | 51 | | | | 84 | | | | 1,611 | | | | 170 | | | | 77 | | | | 808 | | | | 3,543 | | | | 25 | |
| | | | — | | | | — | | | | — | | | | — | | | | — | | | | — | | | | 269 | | | | — | |
| | | | 54 | | | | 20 | | | | 41 | | | | 105 | | | | 115 | | | | 385 | | | | 97 | | | | 56 | |
| | | | | | | | | | | | | | | | | | | | | | | | | | | | | | | | | |
| | | | 96,340 | | | | 107,143 | | | | 216,606 | | | | 978,970 | | | | 445,549 | | | | 915,312 | | | | 243,774 | | | | 15,892 | |
| | | | | | | | | | | | | | | | | | | | | | | | | | | | | | | | | |
| | | | | | | | | | | | | | | | | | | | | | | | | | | | | | | | | |
| | | | | | | | | | | | | | | | | | | | | | | | | | | | | | | | | |
| | | | — | | | | — | | | | — | | | | — | | | | — | | | | 1,996 | | | | — | | | | — | |
| | | | — | | | | — | | | | — | | | | — | | | | — | | | | — | | | | — | | | | — | |
| | | | — | | | | — | | | | — | | | | 91 | | | | — | | | | — | | | | — | | | | — | |
| | | | 13,720 | | | | — | | | | — | | | | 290,776 | | | | 129,979 | | | | 55,962 | | | | — | | | | — | |
| | | | | | | | | | | | | | | | | | | | | | | | | | | | | | | | | |
| | | | — | | | | 20 | | | | 3,998 | | | | 4,800 | | | | 247 | | | | 8,456 | | | | 11,051 | | | | 24 | |
| | | | 74 | | | | — | | | | 564 | | | | 553 | | | | 1,255 | | | | 1,430 | | | | 301 | | | | — | |
| | | | 10 | | | | 18 | | | | 18 | | | | 90 | | | | 42 | | | | 102 | | | | 21 | | | | — | |
| | | | — | | | | — | | | | 71 | | | | — | | | | — | | | | — | | | | 353 | | | | — | |
| | | | 2 | | | | 1 | | | | 8 | | | | 30 | | | | 15 | | | | 61 | | | | 16 | | | | 1 | |
| | | | — | | | | — | | | | — | | | | — | | | | — | | | | — | | | | — | | | | — | |
| | | | 1 | | | | 3 | | | | — | | | | 33 | | | | 3 | | | | — | | | | 17 | | | | — | |
| | | | — | | | | — | | | | — | | | | — | | | | — | | | | — | | | | — | | | | — | |
| | | | 29 | | | | 19 | | | | 37 | | | | 141 | | | | 273 | | | | 503 | | | | 15 | | | | 4 | |
| | | | — | | | | — | | | | — | | | | — | | | | — | | | | — | | | | — | | | | — | |
| | | | | | | | | | | | | | | | | | | | | | | | | | | | | | | | | |
| | | | 13,836 | | | | 61 | | | | 4,696 | | | | 296,514 | | | | 131,814 | | | | 68,510 | | | | 11,774 | | | | 29 | |
| | | | | | | | | | | | | | | | | | | | | | | | | | | | | | | | | |
| | | $ | 82,504 | | | $ | 107,082 | | | $ | 211,910 | | | $ | 682,456 | | | $ | 313,735 | | | $ | 846,802 | | | $ | 232,000 | | | $ | 15,863 | |
| | | | | | | | | | | | | | | | | | | | | | | | | | | | | | | | | |
| | | | | | | | | | | | | | | | | | | | | | | | | | | | | | | | | |
| | | | | | | | | | | | | | | | | | | | | | | | | | | | | | | | | |
| | | $ | 100,400 | | | $ | 124,732 | | | $ | 222,327 | | | $ | 692,109 | | | $ | 350,396 | | | $ | 1,047,989 | | | $ | 234,803 | | | $ | 15,778 | |
| | | | 266 | | | | 411 | | | | 12 | | | | (808 | ) | | | (296 | ) | | | 929 | | | | 322 | | | | (148 | ) |
| | | | (13,125 | ) | | | (1,558 | ) | | | (2,132 | ) | | | (29,100 | ) | | | (34,516 | ) | | | (159,187 | ) | | | 319 | | | | 93 | |
| | | | (5,037 | ) | | | (16,503 | ) | | | (8,297 | ) | | | 20,255 | | | | (1,849 | ) | | | (42,929 | ) | | | (3,444 | ) | | | 140 | |
| | | | | | | | | | | | | | | | | | | | | | | | | | | | | | | | | |
| | | $ | 82,504 | | | $ | 107,082 | | | $ | 211,910 | | | $ | 682,456 | | | $ | 313,735 | | | $ | 846,802 | | | $ | 232,000 | | | $ | 15,863 | |
| | | | | | | | | | | | | | | | | | | | | | | | | | | | | | | | | |
| | | $ | 101,216 | | | $ | 123,302 | | | $ | 222,876 | | | $ | 948,925 | | | $ | 446,824 | | | $ | 945,334 | | | $ | 236,781 | | | $ | 399 | |
| | | | | | | | | | | | | | | | | | | | | | | | | | | | | | | | | |
| | | $ | 13,992 | | | $ | — | | | $ | — | | | $ | 279,792 | | | $ | 124,419 | | | $ | 54,298 | | | $ | — | | | $ | — | |
| | | | | | | | | | | | | | | | | | | | | | | | | | | | | | | | | |
| | | $ | — | | | $ | — | | | $ | — | | | $ | — | | | $ | — | | | $ | — | | | $ | — | | | $ | 15,248 | |
| | | | | | | | | | | | | | | | | | | | | | | | | | | | | | | | | |
| | | $ | — | | | $ | — | | | $ | — | | | $ | — | | | $ | — | | | $ | 9 | | | $ | 117 | | | $ | — | |
| | | | | | | | | | | | | | | | | | | | | | | | | | | | | | | | | |
| | | $ | 616 | | | $ | — | | | $ | — | | | $ | — | | | $ | — | | | $ | — | | | $ | — | | | $ | — | |
| | | | | | | | | | | | | | | | | | | | | | | | | | | | | | | | | |
301
The Hartford Mutual Funds, Inc. and The Hartford Mutual Funds II, Inc.
Statement of Assets and Liabilities — (continued)
April 30, 2008 (Unaudited)
(000’s Omitted)
| | | | | | | | | | | | | |
| | | | | | | | | Retirement
| |
| | | MidCap Value
| | | Money Market
| | | Income
| |
| | | Fund | | | Fund | | | Fund | |
| Shares authorized | | | 300,000 | | | | 2,900,000 | | | | 950,000 | |
| | | | | | | | | | | | | |
| Par value | | | 0.001 | | | | 0.001 | | | | 0.001 | |
| | | | | | | | | | | | | |
| | | | | | | | | | | | | |
Class A: Net asset value per share/Maximum offering price per share | | $ | 10.00/$10.58 | | | $ | 1.00/$1.00 | | | $ | 9.53/$10.08 | |
| | | | | | | | | | | | | |
| Shares outstanding | | | 22,569 | | | | 402,637 | | | | 385 | |
| | | | | | | | | | | | | |
| Net assets | | $ | 225,688 | | | $ | 402,637 | | | $ | 3,670 | |
| | | | | | | | | | | | | |
Class B: Net asset value per share | | $ | 9.27 | | | $ | 1.00 | | | $ | 9.54 | |
| | | | | | | | | | | | | |
| Shares outstanding | | | 4,670 | | | | 40,370 | | | | 33 | |
| | | | | | | | | | | | | |
| Net assets | | $ | 43,270 | | | $ | 40,370 | | | $ | 315 | |
| | | | | | | | | | | | | |
Class C: Net asset value per share | | $ | 9.27 | | | $ | 1.00 | | | $ | 9.55 | |
| | | | | | | | | | | | | |
| Shares outstanding | | | 4,801 | | | | 111,051 | | | | 102 | |
| | | | | | | | | | | | | |
| Net assets | | $ | 44,531 | | | $ | 111,051 | | | $ | 977 | |
| | | | | | | | | | | | | |
Class I: Net asset value per share | | $ | — | | | $ | — | | | $ | — | |
| | | | | | | | | | | | | |
| Shares outstanding | | | — | | | | — | | | | — | |
| | | | | | | | | | | | | |
| Net assets | | $ | — | | | $ | — | | | $ | — | |
| | | | | | | | | | | | | |
Class L: Net asset value per share | | $ | — | | | $ | — | | | $ | — | |
| | | | | | | | | | | | | |
| Shares outstanding | | | — | | | | — | | | | — | |
| | | | | | | | | | | | | |
| Net assets | | $ | — | | | $ | — | | | $ | — | |
| | | | | | | | | | | | | |
Class R3: Net asset value per share | | $ | — | | | $ | 1.00 | | | $ | 9.53 | |
| | | | | | | | | | | | | |
| Shares outstanding | | | — | | | | 14 | | | | 9 | |
| | | | | | | | | | | | | |
| Net assets | | $ | — | | | $ | 14 | | | $ | 88 | |
| | | | | | | | | | | | | |
Class R4: Net asset value per share | | $ | — | | | $ | 1.00 | | | $ | 9.54 | |
| | | | | | | | | | | | | |
| Shares outstanding | | | — | | | | 62,384 | | | | 140 | |
| | | | | | | | | | | | | |
| Net assets | | $ | — | | | $ | 62,384 | | | $ | 1,340 | |
| | | | | | | | | | | | | |
Class R5: Net asset value per share | | $ | — | | | $ | 1.00 | | | $ | 9.55 | |
| | | | | | | | | | | | | |
| Shares outstanding | | | — | | | | 7,522 | | | | 91 | |
| | | | | | | | | | | | | |
| Net assets | | $ | — | | | $ | 7,522 | | | $ | 869 | |
| | | | | | | | | | | | | |
Class Y: Net asset value per share | | $ | 10.50 | | | $ | 1.00 | | | $ | 9.54 | |
| | | | | | | | | | | | | |
| Shares outstanding | | | 1,121 | | | | 3,750 | | | | 13 | |
| | | | | | | | | | | | | |
| Net assets | | $ | 11,773 | | | $ | 3,750 | | | $ | 122 | |
| | | | | | | | | | | | | |
The accompanying notes are an integral part of these financial statements.
302
| | | | | | | | | | | | | | | | | | | | | | | | | | | | | | | | |
| | | Select MidCap
| | Select SmallCap
| | | | | | | | | SmallCap
| | | | | | | | | | |
| | | Value
| | Value
| | | Short Duration
| | | Small Company
| | | Growth
| | | Stock
| | | Strategic Income
| | | Target
| |
| | | Fund | | Fund | | | Fund | | | Fund | | | Fund | | | Fund | | | Fund | | | Retirement 2010 Fund | |
| | | | 800,000 | | | 800,000 | | | | 300,000 | | | | 500,000 | | | | 27,000,000 | | | | 500,000 | | | | 700,000 | | | | 950,000 | |
| | | | | | | | | | | | | | | | | | | | | | | | | | | | | | | | |
| | | | 0.001 | | | 0.001 | | | | 0.001 | | | | 0.001 | | | | 0.0001 | | | | 0.001 | | | | 0.001 | | | | 0.001 | |
| | | | | | | | | | | | | | | | | | | | | | | | | | | | | | | | |
| | | | | | | | | | | | | | | | | | | | | | | | | | | | | | | | |
| | | $ | 9.57/$10.13 | | $ | 9.23/$9.77 | | | $ | 9.55/$9.85 | | | $ | 18.72/$19.81 | | | $ | 25.71/$27.21 | | | $ | 21.47/$22.72 | | | $ | 9.49/$9.94 | | | $ | 9.84/$10.41 | |
| | | | | | | | | | | | | | | | | | | | | | | | | | | | | | | | |
| | | | 2,615 | | | 1,800 | | | | 3,922 | | | | 17,894 | | | | 4,770 | | | | 24,980 | | | | 9,907 | | | | 999 | |
| | | | | | | | | | | | | | | | | | | | | | | | | | | | | | | | |
| | | $ | 25,021 | | $ | 16,611 | | | $ | 37,470 | | | $ | 334,888 | | | $ | 122,645 | | | $ | 536,296 | | | $ | 94,062 | | | $ | 9,831 | |
| | | | | | | | | | | | | | | | | | | | | | | | | | | | | | | | |
| | | $ | 9.37 | | $ | 9.13 | | | $ | 9.55 | | | $ | 16.80 | | | $ | 22.53 | | | $ | 19.84 | | | $ | 9.50 | | | $ | 9.83 | |
| | | | | | | | | | | | | | | | | | | | | | | | | | | | | | | | |
| | | | 359 | | | 55 | | | | 604 | | | | 2,137 | | | | 585 | | | | 5,808 | | | | 605 | | | | 72 | |
| | | | | | | | | | | | | | | | | | | | | | | | | | | | | | | | |
| | | $ | 3,366 | | $ | 498 | | | $ | 5,768 | | | $ | 35,898 | | | $ | 13,184 | | | $ | 115,234 | | | $ | 5,749 | | | $ | 705 | |
| | | | | | | | | | | | | | | | | | | | | | | | | | | | | | | | |
| | | $ | 9.35 | | $ | 9.14 | | | $ | 9.56 | | | $ | 16.80 | | | $ | 22.42 | | | $ | 20.02 | | | $ | 9.51 | | | $ | 9.83 | |
| | | | | | | | | | | | | | | | | | | | | | | | | | | | | | | | |
| | | | 534 | | | 83 | | | | 3,066 | | | | 3,306 | | | | 740 | | | | 5,896 | | | | 7,446 | | | | 70 | |
| | | | | | | | | | | | | | | | | | | | | | | | | | | | | | | | |
| | | $ | 4,994 | | $ | 756 | | | $ | 29,297 | | | $ | 55,543 | | | $ | 16,593 | | | $ | 118,068 | | | $ | 70,815 | | | $ | 686 | |
| | | | | | | | | | | | | | | | | | | | | | | | | | | | | | | | |
| | | $ | — | | $ | — | | | $ | — | | | $ | 18.83 | | | $ | 25.79 | | | $ | — | | | $ | 9.52 | | | $ | — | |
| | | | | | | | | | | | | | | | | | | | | | | | | | | | | | | | |
| | | | — | | | — | | | | — | | | | 658 | | | | 128 | | | | — | | | | 3,243 | | | | — | |
| | | | | | | | | | | | | | | | | | | | | | | | | | | | | | | | |
| | | $ | — | | $ | — | | | $ | — | | | $ | 12,382 | | | $ | 3,305 | | | $ | — | | | $ | 30,857 | | | $ | — | |
| | | | | | | | | | | | | | | | | | | | | | | | | | | | | | | | |
| | | $ | — | | $ | — | | | $ | — | | | $ | — | | | $ | 25.91 | | | $ | — | | | $ | — | | | $ | — | |
| | | | | | | | | | | | | | | | | | | | | | | | | | | | | | | | |
| | | | — | | | — | | | | — | | | | — | | | | 4,214 | | | | — | | | | — | | | | — | |
| | | | | | | | | | | | | | | | | | | | | | | | | | | | | | | | |
| | | $ | — | | $ | — | | | $ | — | | | $ | — | | | $ | 109,182 | | | $ | — | | | $ | — | | | $ | — | |
| | | | | | | | | | | | | | | | | | | | | | | | | | | | | | | | |
| | | $ | — | | $ | — | | | $ | — | | | $ | 19.88 | | | $ | 26.21 | | | $ | 22.20 | | | $ | — | | | $ | 9.84 | |
| | | | | | | | | | | | | | | | | | | | | | | | | | | | | | | | |
| | | | — | | | — | | | | — | | | | 98 | | | | — | | | | 1 | | | | — | | | | 1 | |
| | | | | | | | | | | | | | | | | | | | | | | | | | | | | | | | |
| | | $ | — | | $ | — | | | $ | — | | | $ | 1,948 | | | $ | 12 | | | $ | 30 | | | $ | — | | | $ | 11 | |
| | | | | | | | | | | | | | | | | | | | | | | | | | | | | | | | |
| | | $ | — | | $ | — | | | $ | — | | | $ | 19.98 | | | $ | 26.30 | | | $ | 22.32 | | | $ | — | | | $ | 9.84 | |
| | | | | | | | | | | | | | | | | | | | | | | | | | | | | | | | |
| | | | — | | | — | | | | — | | | | 793 | | | | 62 | | | | 2 | | | | — | | | | 360 | |
| | | | | | | | | | | | | | | | | | | | | | | | | | | | | | | | |
| | | $ | — | | $ | — | | | $ | — | | | $ | 15,839 | | | $ | 1,641 | | | $ | 39 | | | $ | — | | | $ | 3,540 | |
| | | | | | | | | | | | | | | | | | | | | | | | | | | | | | | | |
| | | $ | — | | $ | — | | | $ | — | | | $ | 20.06 | | | $ | 26.41 | | | $ | 22.34 | | | $ | — | | | $ | 9.84 | |
| | | | | | | | | | | | | | | | | | | | | | | | | | | | | | | | |
| | | | — | | | — | | | | — | | | | 246 | | | | — | | | | — | | | | — | | | | 96 | |
| | | | | | | | | | | | | | | | | | | | | | | | | | | | | | | | |
| | | $ | — | | $ | — | | | $ | — | | | $ | 4,934 | | | $ | 9 | | | $ | 10 | | | $ | — | | | $ | 941 | |
| | | | | | | | | | | | | | | | | | | | | | | | | | | | | | | | |
| | | $ | 9.58 | | $ | 9.23 | | | $ | 9.54 | | | $ | 20.10 | | | $ | 26.46 | | | $ | 22.35 | | | $ | 9.50 | | | $ | 9.85 | |
| | | | | | | | | | | | | | | | | | | | | | | | | | | | | | | | |
| | | | 5,128 | | | 9,670 | | | | 14,609 | | | | 10,996 | | | | 1,783 | | | | 3,451 | | | | 3,213 | | | | 15 | |
| | | | | | | | | | | | | | | | | | | | | | | | | | | | | | | | |
| | | $ | 49,123 | | $ | 89,217 | | | $ | 139,375 | | | $ | 221,024 | | | $ | 47,164 | | | $ | 77,125 | | | $ | 30,517 | | | $ | 149 | |
| | | | | | | | | | | | | | | | | | | | | | | | | | | | | | | | |
303
The Hartford Mutual Funds, Inc. and The Hartford Mutual Funds II, Inc.
Statement of Assets and Liabilities — (continued)
April 30, 2008 (Unaudited)
(000’s Omitted)
| | | | | | | | | | | | | |
| | | Target
| | | Target
| | | Tax-Free
| |
| | | Retirement 2020
| | | Retirement 2030
| | | California
| |
| | | Fund | | | Fund | | | Fund | |
Assets: | | | | | | | | | | | | |
| Investments in securities, at value; (amortized cost for Money Market) @ | | $ | 122 | | | $ | 333 | | | $ | 38,721 | |
| Investments in underlying affiliated funds, at value (S) | | | 32,437 | | | | 25,586 | | | | — | |
| Cash | | | — | | | | — | | | | — | |
| Foreign currency on deposit with custodian # | | | — | | | | — | | | | — | |
| Unrealized appreciation on forward foreign currency contracts | | | — | | | | — | | | | — | |
| Receivables: | | | | | | | | | | | | |
| Investment securities sold | | | — | | | | — | | | | 246 | |
| Fund shares sold | | | 107 | | | | 189 | | | | 46 | |
| Dividends and interest | | | 36 | | | | 16 | | | | 472 | |
| Variation margin | | | — | | | | — | | | | — | |
| Other assets | | | 59 | | | | 57 | | | | 13 | |
| | | | | | | | | | | | | |
| Total assets | | | 32,761 | | | | 26,181 | | | | 39,498 | |
| | | | | | | | | | | | | |
| | | | | | | | | | | | | |
Liabilities: | | | | | | | | | | | | |
| Unrealized depreciation on forward foreign currency contracts | | | — | | | | — | | | | — | |
| Bank overdraft — U.S. Dollars | | | — | | | | — | | | | — | |
| Bank overdraft — foreign cash | | | — | | | | — | | | | — | |
| Payable upon return of securities loaned (Note 2d) (I) | | | — | | | | — | | | | — | |
| Payables: | | | | | | | | | | | | |
| Investment securities purchased | | | 103 | | | | 183 | | | | 491 | |
| Fund shares redeemed | | | 5 | | | | — | | | | 158 | |
| Investment advisory and management fees (Note 5) | | | 1 | | | | 1 | | | | 4 | |
| Dividends | | | — | | | | — | | | | 34 | |
| Distribution fees (Note 5) | | | 1 | | | | 1 | | | | 2 | |
| Reverse repurchase agreements (Note 2g) | | | — | | | | — | | | | — | |
| Variation margin | | | — | | | | — | | | | — | |
| Accrued interest expense | | | — | | | | — | | | | — | |
| Accrued expenses | | | 4 | | | | 3 | | | | 6 | |
| Written options contracts | | | — | | | | — | | | | — | |
| | | | | | | | | | | | | |
| Total liabilities | | | 114 | | | | 188 | | | | 695 | |
| | | | | | | | | | | | | |
| Net assets | | $ | 32,647 | | | $ | 25,993 | | | $ | 38,803 | |
| | | | | | | | | | | | | |
| | | | | | | | | | | | | |
Summary of Net Assets: | | | | | | | | | | | | |
Capital stock and paid-in-capital | | $ | 32,963 | | | $ | 26,054 | | | $ | 42,006 | |
| Accumulated undistributed (distribution in excess of) net investment income (loss) | | | (423 | ) | | | (417 | ) | | | 3 | |
| Accumulated net realized gain (loss) on investments and foreign currency transactions | | | 379 | | | | 757 | | | | (1,083 | ) |
| Unrealized appreciation (depreciation) of investments and the translations of assets and liabilities denominated in foreign currency | | | (272 | ) | | | (401 | ) | | | (2,123 | ) |
| | | | | | | | | | | | | |
| Net assets | | $ | 32,647 | | | $ | 25,993 | | | $ | 38,803 | |
| | | | | | | | | | | | | |
| @ Cost of securities | | $ | 120 | | | $ | 326 | | | $ | 40,844 | |
| | | | | | | | | | | | | |
| @ Market value of securities on loan | | $ | — | | | $ | — | | | $ | — | |
| | | | | | | | | | | | | |
| (S) Cost of investments in underlying affiliated funds | | $ | 32,711 | | | $ | 25,994 | | | $ | — | |
| | | | | | | | | | | | | |
| # Cost of foreign currency on deposit with custodian | | $ | — | | | $ | — | | | $ | — | |
| | | | | | | | | | | | | |
| (I) Market Value of non-cash collateral for securities lending valued at | | $ | — | | | $ | — | | | $ | — | |
| | | | | | | | | | | | | |
The accompanying notes are an integral part of these financial statements.
304
| | | | | | | | | | | | | | | | | | | | | | | | | | | | | |
| | | Tax-Free
| | | Tax-Free
| | | Tax-Free
| | | Total Return
| | | U.S. Government
| | | | | | Value
| |
| | | Minnesota
| | | National
| | | New York
| | | Bond
| | | Securities
| | | Value
| | | Opportunities
| |
| | | Fund | | | Fund | | | Fund | | | Fund | | | Fund | | | Fund | | | Fund | |
| | | | | | | | | | | | | | | | | | | | | | | | | | | | | |
| | | $ | 35,525 | | | $ | 209,308 | | | $ | 16,257 | | | $ | 1,462,211 | | | $ | 246,084 | | | $ | 420,356 | | | $ | 231,512 | |
| | | | — | | | | — | | | | — | | | | — | | | | — | | | | — | | | | — | |
| | | | — | | | | — | | | | — | | | | 27,057 | | | | 6 | | | | 1 | | | | — | |
| | | | — | | | | — | | | | — | | | | 692 | | | | — | | | | — | | | | — | |
| | | | — | | | | — | | | | — | | | | 1,027 | | | | — | | | | — | | | | — | |
| | | | | | | | | | | | | | | | | | | | | | | | | | | | | |
| | | | — | | | | 4,078 | | | | — | | | | 37,044 | | | | 2 | | | | 3,079 | | | | 1,604 | |
| | | | 9 | | | | 1,347 | | | | 150 | | | | 4,473 | | | | 1,226 | | | | 519 | | | | 189 | |
| | | | 531 | | | | 2,778 | | | | 261 | | | | 11,791 | | | | 1,690 | | | | 687 | | | | 424 | |
| | | | — | | | | — | | | | — | | | | 1,578 | | | | 165 | | | | — | | | | — | |
| | | | 11 | | | | 97 | | | | 11 | | | | 182 | | | | 84 | | | | 70 | | | | 115 | |
| | | | | | | | | | | | | | | | | | | | | | | | | | | | | |
| | | | 36,076 | | | | 217,608 | | | | 16,679 | | | | 1,546,055 | | | | 249,257 | | | | 424,712 | | | | 233,844 | |
| | | | | | | | | | | | | | | | | | | | | | | | | | | | | |
| | | | | | | | | | | | | | | | | | | | | | | | | | | | | |
| | | | | | | | | | | | | | | | | | | | | | | | | | | | | |
| | | | — | | | | — | | | | — | | | | 1,367 | | | | — | | | | — | | | | 38 | |
| | | | — | | | | — | | | | — | | | | — | | | | — | | | | — | | | | 13 | |
| | | | — | | | | — | | | | — | | | | — | | | | — | | | | — | | | | — | |
| | | | — | | | | — | | | | — | | | | 30,978 | | | | 35,906 | | | | 4,145 | | | | 20,981 | |
| | | | | | | | | | | | | | | | | | | | | | | | | | | | | |
| | | | 703 | | | | 13,100 | | | | 456 | | | | 85,555 | | | | — | | | | 2,014 | | | | 1,031 | |
| | | | 75 | | | | 231 | | | | — | | | | 1,338 | | | | 235 | | | | 77 | | | | 720 | |
| | | | 3 | | | | 18 | | | | 1 | | | | 121 | | | | 19 | | | | 55 | | | | 29 | |
| | | | 26 | | | | 241 | | | | 3 | | | | 188 | | | | 147 | | | | — | | | | — | |
| | | | 1 | | | | 11 | | | | 1 | | | | 60 | | | | 10 | | | | 7 | | | | 12 | |
| | | | — | | | | — | | | | — | | | | — | | | | — | | | | — | | | | — | |
| | | | — | | | | — | | | | — | | | | 704 | | | | 56 | | | | — | | | | — | |
| | | | — | | | | — | | | | — | | | | — | | | | — | | | | — | | | | — | |
| | | | 11 | | | | 49 | | | | 5 | | | | 273 | | | | 65 | | | | 57 | | | | 89 | |
| | | | — | | | | — | | | | — | | | | — | | | | — | | | | — | | | | — | |
| | | | | | | | | | | | | | | | | | | | | | | | | | | | | |
| | | | 819 | | | | 13,650 | | | | 466 | | | | 120,584 | | | | 36,438 | | | | 6,355 | | | | 22,913 | |
| | | | | | | | | | | | | | | | | | | | | | | | | | | | | |
| | | $ | 35,257 | | | $ | 203,958 | | | $ | 16,213 | | | $ | 1,425,471 | | | $ | 212,819 | | | $ | 418,357 | | | $ | 210,931 | |
| | | | | | | | | | | | | | | | | | | | | | | | | | | | | |
| | | | | | | | | | | | | | | | | | | | | | | | | | | | | |
| | | | | | | | | | | | | | | | | | | | | | | | | | | | | |
| | | $ | 35,648 | | | $ | 214,564 | | | $ | 16,597 | | | $ | 1,447,838 | | | $ | 234,025 | | | $ | 385,176 | | | $ | 251,796 | |
| | | | 5 | | | | 61 | | | | 2 | | | | 545 | | | | 131 | | | | 2,317 | | | | 758 | |
| | | | (63 | ) | | | (6,562 | ) | | | (62 | ) | | | 2,060 | | | | (15,841 | ) | | | 640 | | | | (12,792 | ) |
| | | | (333 | ) | | | (4,105 | ) | | | (324 | ) | | | (24,972 | ) | | | (5,496 | ) | | | 30,224 | | | | (28,831 | ) |
| | | | | | | | | | | | | | | | | | | | | | | | | | | | | |
| | | $ | 35,257 | | | $ | 203,958 | | | $ | 16,213 | | | $ | 1,425,471 | | | $ | 212,819 | | | $ | 418,357 | | | $ | 210,931 | |
| | | | | | | | | | | | | | | | | | | | | | | | | | | | | |
| | | $ | 35,858 | | | $ | 213,413 | | | $ | 16,581 | | | $ | 1,483,426 | | | $ | 251,182 | | | $ | 390,132 | | | $ | 260,305 | |
| | | | | | | | | | | | | | | | | | | | | | | | | | | | | |
| | | $ | — | | | $ | — | | | $ | — | | | $ | 30,362 | | | $ | 35,190 | | | $ | 4,022 | | | $ | 20,150 | |
| | | | | | | | | | | | | | | | | | | | | | | | | | | | | |
| | | $ | — | | | $ | — | | | $ | — | | | $ | — | | | $ | — | | | $ | — | | | $ | — | |
| | | | | | | | | | | | | | | | | | | | | | | | | | | | | |
| | | $ | — | | | $ | — | | | $ | — | | | $ | 701 | | | $ | — | | | $ | — | | | $ | — | |
| | | | | | | | | | | | | | | | | | | | | | | | | | | | | |
| | | $ | — | | | $ | — | | | $ | — | | | $ | — | | | $ | — | | | $ | — | | | $ | — | |
| | | | | | | | | | | | | | | | | | | | | | | | | | | | | |
305
The Hartford Mutual Funds, Inc. and The Hartford Mutual Funds II, Inc.
Statement of Assets and Liabilities — (continued)
April 30, 2008 (Unaudited)
(000’s Omitted)
| | | | | | | | | | | | | |
| | | Target
| | | Target
| | | Tax-Free
| |
| | | Retirement 2020
| | | Retirement 2030
| | | California
| |
| | | Fund | | | Fund | | | Fund | |
| Shares authorized | | | 950,000 | | | | 950,000 | | | | 250,000 | |
| | | | | | | | | | | | | |
| Par value | | | 0.001 | | | | 0.001 | | | | 0.001 | |
| | | | | | | | | | | | | |
| | | | | | | | | | | | | |
Class A: Net asset value per share/Maximum offering price per share | | $ | 10.64/$11.26 | | | $ | 9.72/$10.29 | | | $ | 9.57/$10.02 | |
| | | | | | | | | | | | | |
| Shares outstanding | | | 1,775 | | | | 1,735 | | | | 3,363 | |
| | | | | | | | | | | | | |
| Net assets | | $ | 18,892 | | | $ | 16,865 | | | $ | 32,172 | |
| | | | | | | | | | | | | |
Class B: Net asset value per share | | $ | 10.64 | | | $ | 9.73 | | | $ | 9.55 | |
| | | | | | | | | | | | | |
| Shares outstanding | | | 84 | | | | 74 | | | | 174 | |
| | | | | | | | | | | | | |
| Net assets | | $ | 889 | | | $ | 719 | | | $ | 1,662 | |
| | | | | | | | | | | | | |
Class C: Net asset value per share | | $ | 10.63 | | | $ | 9.71 | | | $ | 9.58 | |
| | | | | | | | | | | | | |
| Shares outstanding | | | 82 | | | | 95 | | | | 519 | |
| | | | | | | | | | | | | |
| Net assets | | $ | 867 | | | $ | 927 | | | $ | 4,969 | |
| | | | | | | | | | | | | |
Class I: Net asset value per share | | $ | — | | | $ | — | | | $ | — | |
| | | | | | | | | | | | | |
| Shares outstanding | | | — | | | | — | | | | — | |
| | | | | | | | | | | | | |
| Net assets | | $ | — | | | $ | — | | | $ | — | |
| | | | | | | | | | | | | |
Class L: Net asset value per share | | $ | — | | | $ | — | | | $ | — | |
| | | | | | | | | | | | | |
| Shares outstanding | | | — | | | | — | | | | — | |
| | | | | | | | | | | | | |
| Net assets | | $ | — | | | $ | — | | | $ | — | |
| | | | | | | | | | | | | |
Class R3: Net asset value per share | | $ | 10.64 | | | $ | 9.71 | | | $ | — | |
| | | | | | | | | | | | | |
| Shares outstanding | | | 1 | | | | 1 | | | | — | |
| | | | | | | | | | | | | |
| Net assets | | $ | 11 | | | $ | 11 | | | $ | — | |
| | | | | | | | | | | | | |
Class R4: Net asset value per share | | $ | 10.63 | | | $ | 9.69 | | | $ | — | |
| | | | | | | | | | | | | |
| Shares outstanding | | | 607 | | | | 609 | | | | — | |
| | | | | | | | | | | | | |
| Net assets | | $ | 6,456 | | | $ | 5,900 | | | $ | — | |
| | | | | | | | | | | | | |
Class R5: Net asset value per share | | $ | 10.64 | | | $ | 9.71 | | | $ | — | |
| | | | | | | | | | | | | |
| Shares outstanding | | | 519 | | | | 158 | | | | — | |
| | | | | | | | | | | | | |
| Net assets | | $ | 5,520 | | | $ | 1,536 | | | $ | — | |
| | | | | | | | | | | | | |
Class Y: Net asset value per share | | $ | 10.65 | | | $ | 9.75 | | | $ | — | |
| | | | | | | | | | | | | |
| Shares outstanding | | | 1 | | | | 4 | | | | — | |
| | | | | | | | | | | | | |
| Net assets | | $ | 12 | | | $ | 35 | | | $ | — | |
| | | | | | | | | | | | | |
The accompanying notes are an integral part of these financial statements.
306
| | | | | | | | | | | | | | | | | | | | | | | | | | | | |
| | | Tax-Free
| | Tax-Free
| | | Tax-Free
| | | Total Return
| | | U.S. Government
| | | | | | Value
| |
| | | Minnesota
| | National
| | | New York
| | | Bond
| | | Securities
| | | Value
| | | Opportunities
| |
| | | Fund | | Fund | | | Fund | | | Fund | | | Fund | | | Fund | | | Fund | |
| | | | 19,250,000 | | | 19,300,000 | | | | 250,000 | | | | 550,000 | | | | 19,250,000 | | | | 500,000 | | | | 27,000,000 | |
| | | | | | | | | | | | | | | | | | | | | | | | | | | | |
| | | | 0.0001 | | | 0.0001 | | | | 0.001 | | | | 0.001 | | | | 0.0001 | | | | 0.001 | | | | 0.0001 | |
| | | | | | | | | | | | | | | | | | | | | | | | | | | | |
| | | | | | | | | | | | | | | | | | | | | | | | | | | | |
| | | $ | 9.73/$10.19 | | $ | 10.31/$10.80 | | | $ | 9.86/$10.32 | | | $ | 10.44/$10.93 | | | $ | 9.05/$9.48 | | | $ | 12.46/$13.19 | | | $ | 12.55/$13.28 | |
| | | | | | | | | | | | | | | | | | | | | | | | | | | | |
| | | | 1,054 | | | 13,264 | | | | 1,202 | | | | 66,053 | | | | 7,580 | | | | 6,523 | | | | 8,792 | |
| | | | | | | | | | | | | | | | | | | | | | | | | | | | |
| | | $ | 10,256 | | $ | 136,790 | | | $ | 11,853 | | | $ | 689,624 | | | $ | 68,578 | | | $ | 81,298 | | | $ | 110,327 | |
| | | | | | | | | | | | | | | | | | | | | | | | | | | | |
| | | $ | 9.74 | | $ | 10.24 | | | $ | 9.86 | | | $ | 10.38 | | | $ | 9.00 | | | $ | 12.18 | | | $ | 11.35 | |
| | | | | | | | | | | | | | | | | | | | | | | | | | | | |
| | | | 78 | | | 623 | | | | 159 | | | | 8,196 | | | | 1,683 | | | | 926 | | | | 1,210 | |
| | | | | | | | | | | | | | | | | | | | | | | | | | | | |
| | | $ | 756 | | $ | 6,381 | | | $ | 1,569 | | | $ | 85,093 | | | $ | 15,153 | | | $ | 11,277 | | | $ | 13,730 | |
| | | | | | | | | | | | | | | | | | | | | | | | | | | | |
| | | $ | 9.75 | | $ | 10.27 | | | $ | 9.86 | | | $ | 10.46 | | | $ | 9.00 | | | $ | 12.19 | | | $ | 11.31 | |
| | | | | | | | | | | | | | | | | | | | | | | | | | | | |
| | | | 103 | | | 2,618 | | | | 283 | | | | 10,280 | | | | 2,705 | | | | 1,064 | | | | 1,957 | |
| | | | | | | | | | | | | | | | | | | | | | | | | | | | |
| | | $ | 1,002 | | $ | 26,871 | | | $ | 2,791 | | | $ | 107,505 | | | $ | 24,353 | | | $ | 12,970 | | | $ | 22,120 | |
| | | | | | | | | | | | | | | | | | | | | | | | | | | | |
| | | $ | — | | $ | 10.33 | | | $ | — | | | $ | 10.44 | | | $ | — | | | $ | 12.46 | | | $ | 12.43 | |
| | | | | | | | | | | | | | | | | | | | | | | | | | | | |
| | | | — | | | 397 | | | | — | | | | 585 | | | | — | | | | 19 | | | | 99 | |
| | | | | | | | | | | | | | | | | | | | | | | | | | | | |
| | | $ | — | | $ | 4,103 | | | $ | — | | | $ | 6,105 | | | $ | — | | | $ | 241 | | | $ | 1,234 | |
| | | | | | | | | | | | | | | | | | | | | | | | | | | | |
| | | $ | 9.76 | | $ | 10.28 | | | $ | — | | | $ | — | | | $ | 9.04 | | | $ | — | | | $ | 12.59 | |
| | | | | | | | | | | | | | | | | | | | | | | | | | | | |
| | | | 285 | | | 727 | | | | — | | | | — | | | | 3,234 | | | | — | | | | 2,501 | |
| | | | | | | | | | | | | | | | | | | | | | | | | | | | |
| | | $ | 2,786 | | $ | 7,478 | | | $ | — | | | $ | — | | | $ | 29,226 | | | $ | — | | | $ | 31,482 | |
| | | | | | | | | | | | | | | | | | | | | | | | | | | | |
| | | $ | — | | $ | — | | | $ | — | | | $ | 10.56 | | | $ | — | | | $ | 12.36 | | | $ | 12.74 | |
| | | | | | | | | | | | | | | | | | | | | | | | | | | | |
| | | | — | | | — | | | | — | | | | 3 | | | | — | | | | 1 | | | | 71 | |
| | | | | | | | | | | | | | | | | | | | | | | | | | | | |
| | | $ | — | | $ | — | | | $ | — | | | $ | 35 | | | $ | — | | | $ | 10 | | | $ | 910 | |
| | | | | | | | | | | | | | | | | | | | | | | | | | | | |
| | | $ | — | | $ | — | | | $ | — | | | $ | 10.57 | | | $ | — | | | $ | 12.38 | | | $ | 12.81 | |
| | | | | | | | | | | | | | | | | | | | | | | | | | | | |
| | | | — | | | — | | | | — | | | | 930 | | | | — | | | | 1 | | | | 187 | |
| | | | | | | | | | | | | | | | | | | | | | | | | | | | |
| | | $ | — | | $ | — | | | $ | — | | | $ | 9,835 | | | $ | — | | | $ | 10 | | | $ | 2,395 | |
| | | | | | | | | | | | | | | | | | | | | | | | | | | | |
| | | $ | — | | $ | — | | | $ | — | | | $ | 10.57 | | | $ | — | | | $ | 12.39 | | | $ | 12.86 | |
| | | | | | | | | | | | | | | | | | | | | | | | | | | | |
| | | | — | | | — | | | | — | | | | 29 | | | | — | | | | 1 | | | | 1 | |
| | | | | | | | | | | | | | | | | | | | | | | | | | | | |
| | | $ | — | | $ | — | | | $ | — | | | $ | 302 | | | $ | — | | | $ | 11 | | | $ | 9 | |
| | | | | | | | | | | | | | | | | | | | | | | | | | | | |
| | | $ | 9.73 | | $ | 10.29 | | | $ | — | | | $ | 10.56 | | | $ | 9.06 | | | $ | 12.40 | | | $ | 12.92 | |
| | | | | | | | | | | | | | | | | | | | | | | | | | | | |
| | | | 2,103 | | | 2,171 | | | | — | | | | 49,886 | | | | 8,333 | | | | 25,205 | | | | 2,223 | |
| | | | | | | | | | | | | | | | | | | | | | | | | | | | |
| | | $ | 20,457 | | $ | 22,335 | | | $ | — | | | $ | 526,972 | | | $ | 75,509 | | | $ | 312,540 | | | $ | 28,724 | |
| | | | | | | | | | | | | | | | | | | | | | | | | | | | |
307
The Hartford Mutual Funds, Inc. and The Hartford Mutual Funds II, Inc.
Statement of Operations
For the Six Month Period Ended April 30, 2008 (Unaudited)
(000’s Omitted)
| | | | | | | | | | | | | |
| | | | | | Balanced
| | | | |
| | | Advisers
| | | Allocation
| | | Balanced Income
| |
| | | Fund | | | Fund | | | Fund | |
Investment Income: | | | | | | | | | | | | |
| Dividends | | $ | 7,482 | | | $ | — | | | $ | 441 | |
| Dividends from underlying affiliated funds | | | — | | | | 14,002 | | | | — | |
| Interest | | | 12,098 | | | | 3 | | | | 867 | |
| Securities lending | | | 462 | | | | — | | | | — | |
| Less: Foreign tax withheld | | | (98 | ) | | | — | | | | (5 | ) |
| | | | | | | | | | | | | |
| Total investment income, net | | | 19,944 | | | | 14,005 | | | | 1,303 | |
| | | | | | | | | | | | | |
| | | | | | | | | | | | | |
Expenses: | | | | | | | | | | | | |
| Investment management and advisory fees | | | 4,373 | | | | 596 | | | | 184 | |
| Transfer agent fees | | | 1,495 | | | | 470 | | | | 23 | |
| Distribution fees | | | | | | | | | | | | |
| Class A | | | 1,213 | | | | 739 | | | | 54 | |
| Class B | | | 1,037 | | | | 642 | | | | 12 | |
| Class C | | | 910 | | | | 1,083 | | | | 24 | |
| Class L | | | — | | | | — | | | | — | |
| Class R3 | | | — | | | | 1 | | | | — | |
| Class R4 | | | — | | | | 5 | | | | — | |
| Custodian fees | | | 9 | | | | — | | | | 6 | |
| Accounting services | | | 117 | | | | 53 | | | | 4 | |
| Registration and filing fees | | | 67 | | | | 69 | | | | 15 | |
| Board of Directors’ fees and expense | | | 12 | | | | 7 | | | | — | |
| Interest & dividend expense | | | — | | | | — | | | | — | |
| Other expenses | | | 278 | | | | 163 | | | | 10 | |
| | | | | | | | | | | | | |
| Total expenses (before waivers and fees paid indirectly) | | | 9,511 | | | | 3,828 | | | | 332 | |
| Expense waivers | | | — | | | | — | | | | (1 | ) |
| Transfer agent fee waivers | | | — | | | | — | | | | — | |
| Commission recapture | | | (30 | ) | | | — | | | | — | |
| Custodian fee offset | | | (7 | ) | | | — | | | | — | |
| | | | | | | | | | | | | |
| Total waivers and fees paid indirectly | | | (37 | ) | | | — | | | | (1 | ) |
| | | | | | | | | | | | | |
| Total expenses, net | | | 9474 | | | | 3,828 | | | | 331 | |
| | | | | | | | | | | | | |
| Net investment income (loss) | | | 10,470 | | | | 10,177 | | | | 972 | |
| | | | | | | | | | | | | |
| | | | | | | | | | | | | |
Net Realized Gain (Loss) on Investments, Futures, Options and Swap Contracts and Foreign Currency Transactions: | | | | | | | | | | | | |
| Capital gain distribution received from underlying affiliated funds | | | — | | | | 42,094 | | | | — | |
| Net realized gain (loss) on investments in underlying affiliated funds | | | — | | | | (403 | ) | | | — | |
| Net realized gain (loss) on investments; unaffiliated | | | (8,272 | ) | | | — | | | | (471 | ) |
| Net realized gain (loss) on futures, written options and swap contracts | | | 305 | † | | | — | | | | 36 | |
| Net realized gain (loss) on foreign currency transactions | | | (1,312 | ) | | | — | | | | 11 | |
| | | | | | | | | | | | | |
Net Realized Gain (Loss) on Investments, Futures, Options and Swap Contracts and Foreign Currency Transactions | | | (9,279 | ) | | | 41,691 | | | | (424 | ) |
| | | | | | | | | | | | | |
| | | | | | | | | | | | | |
Net Changes in Unrealized Appreciation (Depreciation) of Investments, Futures, Options and Swap Contracts and Foreign Currency Transactions: | | | | | | | | | | | | |
| Net unrealized appreciation (depreciation) of investments | | | (111,260 | ) | | | (103,904 | ) | | | (1,984 | ) |
| Net unrealized appreciation (depreciation) of futures, written options and swap contracts | | | 13 | | | | — | | | | (6 | ) |
| Net unrealized appreciation (depreciation) on translation of other assets and liabilities in foreign currencies | | | (1,978 | ) | | | — | | | | (3 | ) |
| | | | | | | | | | | | | |
Net Changes in Unrealized Appreciation (Depreciation) of Investments, Futures, Options and Swap Contracts and Foreign Currency Transactions | | | (113,225 | ) | | | (103,904 | ) | | | (1,993 | ) |
| | | | | | | | | | | | | |
Net Gain (Loss) on Investments, Futures, Options and Swap Contracts and Foreign Currency Transactions | | | (122,504 | ) | | | (62,213 | ) | | | (2,417 | ) |
| | | | | | | | | | | | | |
Net Increase (Decrease) in Net Assets Resulting from Operations | | $ | (112,034 | ) | | $ | (52,036 | ) | | $ | (1,445 | ) |
| | | | | | | | | | | | | |
| | |
| (AA) | | Realized gains on written options were $212. |
| † | | Realized gains on written options were $305. |
The accompanying notes are an integral part of these financial statements.
308
| | | | | | | | | | | | | | | | | | | | | | | | | | | | | | | | | |
| | | Capital
| | | Capital
| | | Checks and
| | | Conservative
| | | Disciplined
| | | Dividend and
| | | Equity Growth
| | | | |
| | | Appreciation
| | | Appreciation II
| | | Balances
| | | Allocation
| | | Equity
| | | Growth
| | | Allocation
| | | Equity Income
| |
| | | Fund | | | Fund | | | Fund | | | Fund | | | Fund | | | Fund | | | Fund | | | Fund | |
| | | | | | | | | | | | | | | | | | | | | | | | | | | | | | | | | |
| | | $ | 126,458 | | | $ | 9,803 | | | $ | — | | | $ | — | | | $ | 2,507 | | | $ | 49,149 | | | $ | — | | | $ | 16,123 | |
| | | | — | | | | — | | | | 5,382 | | | | 3,616 | | | | — | | | | — | | | | 1,739 | | | | — | |
| | | | 21,509 | | | | 1,155 | | | | — | | | | — | | | | 63 | | | | 2,504 | | | | 1 | | | | 484 | |
| | | | 3,731 | | | | 637 | | | | — | | | | — | | | | 37 | | | | 853 | | | | — | | | | 47 | |
| | | | (4,831 | ) | | | (435 | ) | | | — | | | | — | | | | — | | | | (552 | ) | | | — | | | | (115 | ) |
| | | | | | | | | | | | | | | | | | | | | | | | | | | | | | | | | |
| | | | 146,867 | | | | 11,160 | | | | 5,382 | | | | 3,616 | | | | 2,607 | | | | 51,954 | | | | 1,740 | | | | 16,539 | |
| | | | | | | | | | | | | | | | | | | | | | | | | | | | | | | | | |
| | | | | | | | | | | | | | | | | | | | | | | | | | | | | | | | | |
| | | | | | | | | | | | | | | | | | | | | | | | | | | | | | | | | |
| | | | 65,933 | | | | 6,384 | | | | — | | | | 150 | | | | 1,229 | | | | 12,585 | | | | 208 | | | | 3,437 | |
| | | | 13,288 | | | | 1,072 | | | | 214 | | | | 87 | | | | 308 | | | | 2,972 | | | | 275 | | | | 594 | |
| | | | | | | | | | | | | | | | | | | | | | | | | | | | | | | | | |
| | | | 15,994 | | | | 987 | | | | 388 | | | | 152 | | | | 195 | | | | 3,773 | | | | 205 | | | | 891 | |
| | | | 9,644 | | | | 498 | | | | 187 | | | | 126 | | | | 124 | | | | 1,762 | | | | 218 | | | | 235 | |
| | | | 20,486 | | | | 2,055 | | | | 531 | | | | 243 | | | | 117 | | | | 1,654 | | | | 335 | | | | 319 | |
| | | | — | | | | — | | | | — | | | | — | | | | — | | | | — | | | | — | | | | — | |
| | | | — | | | | 5 | | | | — | | | | — | | | | — | | | | 1 | | | | 2 | | | | — | |
| | | | 38 | | | | 1 | | | | — | | | | 3 | | | | — | | | | 5 | | | | 2 | | | | — | |
| | | | 308 | | | | 35 | | | | — | | | | — | | | | 4 | | | | 4 | | | | — | | | | 3 | |
| | | | 1,543 | | | | 100 | | | | 26 | | | | 11 | | | | 24 | | | | 315 | | | | 16 | | | | 68 | |
| | | | 468 | | | | 100 | | | | 64 | | | | 43 | | | | 40 | | | | 133 | | | | 52 | | | | 76 | |
| | | | 131 | | | | 9 | | | | 1 | | | | 4 | | | | 3 | | | | 30 | | | | 2 | | | | 7 | |
| | | | — | | | | — | | | | — | | | | — | | | | — | | | | — | | | | — | | | | — | |
| | | | 2,870 | | | | 191 | | | | 40 | | | | 35 | | | | 59 | | | | 621 | | | | 48 | | | | 149 | |
| | | | | | | | | | | | | | | | | | | | | | | | | | | | | | | | | |
| | | | 130,703 | | | | 11,437 | | | | 1,451 | | | | 854 | | | | 2,103 | | | | 23,855 | | | | 1,363 | | | | 5,779 | |
| | | | — | | | | — | | | | — | | | | (7 | ) | | | (40 | ) | | | — | | | | (3 | ) | | | (237 | ) |
| | | | — | | | | — | | | | — | | | | — | | | | (20 | ) | | | — | | | | — | | | | — | |
| | | | (273 | ) | | | (57 | ) | | | — | | | | — | | | | (4 | ) | | | (42 | ) | | | — | | | | (16 | ) |
| | | | (8 | ) | | | — | | | | — | | | | — | | | | (1 | ) | | | (2 | ) | | | — | | | | — | |
| | | | | | | | | | | | | | | | | | | | | | | | | | | | | | | | | |
| | | | (281 | ) | | | (57 | ) | | | — | | | | (7 | ) | | | (65 | ) | | | (44 | ) | | | (3 | ) | | | (253 | ) |
| | | | | | | | | | | | | | | | | | | | | | | | | | | | | | | | | |
| | | | 130,422 | | | | 11,380 | | | | 1,451 | | | | 847 | | | | 2,038 | | | | 23,811 | | | | 1,360 | | | | 5,526 | |
| | | | | | | | | | | | | | | | | | | | | | | | | | | | | | | | | |
| | | | 16,445 | | | | (220 | ) | | | 3,931 | | | | 2,769 | | | | 569 | | | | 28,143 | | | | 380 | | | | 11,013 | |
| | | | | | | | | | | | | | | | | | | | | | | | | | | | | | | | | |
| | | | | | | | | | | | | | | | | | | | | | | | | | | | | | | | | |
| | | | | | | | | | | | | | | | | | | | | | | | | | | | | | | | | |
| | | | — | | | | — | | | | 11,822 | | | | 5,443 | | | | — | | | | — | | | | 22,142 | | | | — | |
| | | | — | | | | — | | | | — | | | | (565 | ) | | | — | | | | — | | | | 151 | | | | — | |
| | | | 563,301 | | | | (13,507 | ) | | | — | | | | — | | | | 248 | | | | 105,299 | | | | — | | | | 3,465 | |
| | | | — | | | | — | | | | — | | | | — | | | | 119 | (AA) | | | — | | | | — | | | | — | |
| | | | (70,838 | ) | | | (246 | ) | | | — | | | | — | | | | — | | | | — | | | | — | | | | (10 | ) |
| | | | | | | | | | | | | | | | | | | | | | | | | | | | | | | | | |
| | | | | | | | | | | | | | | | | | | | | | | | | | | | | | | | | |
| | | | 492,463 | | | | (13,753 | ) | | | 11,822 | | | | 4,878 | | | | 367 | | | | 105,299 | | | | 22,293 | | | | 3,455 | |
| | | | | | | | | | | | | | | | | | | | | | | | | | | | | | | | | |
| | | | | | | | | | | | | | | | | | | | | | | | | | | | | | | | | |
| | | | | | | | | | | | | | | | | | | | | | | | | | | | | | | | | |
| | | | | | | | | | | | | | | | | | | | | | | | | | | | | | | | | |
| | | | (2,171,024 | ) | | | (188,686 | ) | | | (19,845 | ) | | | (13,807 | ) | | | (36,922 | ) | | | (410,413 | ) | | | (53,173 | ) | | | (87,595 | ) |
| | | | | | | | | | | | | | | | | | | | | | | | | | | | | | | | | |
| | | | — | | | | (1 | ) | | | — | | | | — | | | | (32 | ) | | | — | | | | — | | | | — | |
| | | | | | | | | | | | | | | | | | | | | | | | | | | | | | | | | |
| | | | 11,088 | | | | (91 | ) | | | — | | | | — | | | | — | | | | — | | | | — | | | | — | |
| | | | | | | | | | | | | | | | | | | | | | | | | | | | | | | | | |
| | | | | | | | | | | | | | | | | | | | | | | | | | | | | | | | | |
| | | | (2,159,936 | ) | | | (188,778 | ) | | | (19,845 | ) | | | (13,807 | ) | | | (36,954 | ) | | | (410,413 | ) | | | (53,173 | ) | | | (87,595 | ) |
| | | | | | | | | | | | | | | | | | | | | | | | | | | | | | | | | |
| | | | | | | | | | | | | | | | | | | | | | | | | | | | | | | | | |
| | | | (1,667,473 | ) | | | (202,531 | ) | | | (8,023 | ) | | | (8,929 | ) | | | (36,587 | ) | | | (305,114 | ) | | | (30,880 | ) | | | (84,140 | ) |
| | | | | | | | | | | | | | | | | | | | | | | | | | | | | | | | | |
| | | $ | (1,651,028 | ) | | $ | (202,751 | ) | | $ | (4,092 | ) | | $ | (6,160 | ) | | $ | (36,018 | ) | | $ | (276,971 | ) | | $ | (30,500 | ) | | $ | (73,127 | ) |
| | | | | | | | | | | | | | | | | | | | | | | | | | | | | | | | | |
309
The Hartford Mutual Funds, Inc. and The Hartford Mutual Funds II, Inc.
Statement of Operations — (continued)
For the Six Month Period Ended April 30, 2008 (Unaudited)
(000’s Omitted)
| | | | | | | | | | | | | |
| | | | | | Fundamental
| | | Global
| |
| | | Floating Rate
| | | Growth
| | | Communications
| |
| | | Fund | | | Fund | | | Fund | |
Investment Income: | | | | | | | | | | | | |
| Dividends | | $ | — | | | $ | 343 | | | $ | 716 | |
| Dividends from underlying affiliated funds | | | — | | | | — | | | | — | |
| Interest | | | 130,751 | | | | 21 | | | | 22 | |
| Securities lending | | | — | | | | 22 | | | | 22 | |
| Less: Foreign tax withheld | | | — | | | | (5 | ) | | | (73 | ) |
| | | | | | | | | | | | | |
| Total investment income, net | | | 130,751 | | | | 381 | | | | 687 | |
| | | | | | | | | | | | | |
| | | | | | | | | | | | | |
Expenses: | | | | | | | | | | | | |
| Investment management and advisory fees | | | 10,569 | | | | 250 | | | | 209 | |
| Transfer agent fees | | | 1,039 | | | | 70 | | | | 58 | |
| Distribution fees | | | | | | | | | | | | |
| Class A | | | 1,838 | | | | 44 | | | | 36 | |
| Class B | | | 313 | | | | 53 | | | | 29 | |
| Class C | | | 7,710 | | | | 62 | | | | 52 | |
| Class L | | | — | | | | — | | | | — | |
| Class R3 | | | 1 | | | | — | | | | — | |
| Class R4 | | | — | | | | — | | | | — | |
| Custodian fees | | | 9 | | | | 2 | | | | 6 | |
| Accounting services | | | 293 | | | | 3 | | | | 3 | |
| Registration and filing fees | | | 271 | | | | 19 | | | | 19 | |
| Board of Directors’ fees and expense | | | 27 | | | | 1 | | | | — | |
| Interest & dividend expense | | | — | | | | — | | | | — | |
| Other expenses | | | 715 | | | | 17 | | | | 11 | |
| | | | | | | | | | | | | |
| Total expenses (before waivers and fees paid indirectly) | | | 22,785 | | | | 521 | | | | 423 | |
| Expense waivers | | | (41 | ) | | | (10 | ) | | | (3 | ) |
| Transfer agent fee waivers | | | — | | | | — | | | | (2 | ) |
| Commission recapture | | | — | | | | — | | | | — | |
| Custodian fee offset | | | (8 | ) | | | — | | | | — | |
| | | | | | | | | | | | | |
| Total waivers and fees paid indirectly | | | (49 | ) | | | (10 | ) | | | (5 | ) |
| | | | | | | | | | | | | |
| Total expenses, net | | | 22,736 | | | | 511 | | | | 418 | |
| | | | | | | | | | | | | |
| Net investment income (loss) | | | 108,015 | | | | (130 | ) | | | 269 | |
| | | | | | | | | | | | | |
| | | | | | | | | | | | | |
Net Realized Gain (Loss) on Investments, Futures, Options and Swap Contracts and Foreign Currency Transactions: | | | | | | | | | | | | |
| Capital gain distribution received from underlying affiliated funds | | | — | | | | — | | | | — | |
| Net realized gain (loss) on investments in underlying affiliated funds | | | — | | | | — | | | | — | |
| Net realized gain (loss) on investments; unaffiliated | | | (110,274 | ) | | | (1,035 | ) | | | 129 | |
| Net realized gain (loss) on futures, written options and swap contracts | | | — | | | | — | | | | — | |
| Net realized gain (loss) on foreign currency transactions | | | (130 | ) | | | — | | | | (4 | ) |
| | | | | | | | | | | | | |
Net Realized Gain (Loss) on Investments, Futures, Options and Swap Contracts and Foreign Currency Transactions: | | | (110,404 | ) | | | (1,035 | ) | | | 125 | |
| | | | | | | | | | | | | |
Net Changes in Unrealized Appreciation (Depreciation) of Investments, Futures, Options and Swap Contracts and Foreign Currency Transactions: | | | | | | | | | | | | |
| Net unrealized appreciation (depreciation) of investments | | | (179,763 | ) | | | (2,927 | ) | | | (5,271 | ) |
| Net unrealized appreciation (depreciation) of futures, written options and swap contracts | | | — | | | | — | | | | — | |
| Net unrealized appreciation (depreciation) on translation of other assets and liabilities in foreign currencies | | | 760 | | | | — | | | | 3 | |
| | | | | | | | | | | | | |
Net Changes in Unrealized Appreciation (Depreciation) of Investments, Futures, Options and Swap Contracts and Foreign Currency Transactions: | | | (179,003 | ) | | | (2,927 | ) | | | (5,268 | ) |
| | | | | | | | | | | | | |
Net Gain (Loss) on Investments, Futures, Options and Swap Contracts and Foreign Currency Transactions: | | | (289,407 | ) | | | (3,962 | ) | | | (5,143 | ) |
| | | | | | | | | | | | | |
Net Increase (Decrease) in Net Assets Resulting from Operations | | $ | (181,392 | ) | | $ | (4,092 | ) | | $ | (4,874 | ) |
| | | | | | | | | | | | | |
| | |
| (a) | | Commenced operations on February 29, 2008. |
The accompanying notes are an integral part of these financial statements.
310
| | | | | | | | | | | | | | | | | | | | | | | | | | | | | | | | | |
| | | | | | Global Financial
| | | | | | | | | Global
| | | Growth
| | | | | | Growth
| |
| | | Global Equity
| | | Services
| | | Global Growth
| | | Global Health
| | | Technology
| | | Allocation
| | | Growth
| | | Opportunities
| |
| | | Fund (a) | | | Fund | | | Fund | | | Fund | | | Fund | | | Fund | | | Fund | | | Fund | |
| | | | | | | | | | | | | | | | | | | | | | | | | | | | | | | | | |
| | | $ | 91 | | | $ | 608 | | | $ | 3,654 | | | $ | 5,104 | | | $ | 227 | | | $ | — | | | $ | 4,918 | | | $ | 10,387 | |
| | | | — | | | | — | | | | — | | | | — | | | | — | | | | 8,289 | | | | — | | | | — | |
| | | | 5 | | | | 28 | | | | 241 | | | | 179 | | | | 13 | | | | 2 | | | | 300 | | | | 2,237 | |
| | | | — | | | | 11 | | | | 255 | | | | 316 | | | | 10 | | | | — | | | | 206 | | | | 976 | |
| | | | (8 | ) | | | (64 | ) | | | (294 | ) | | | (212 | ) | | | (4 | ) | | | — | | | | (155 | ) | | | (280 | ) |
| | | | | | | | | | | | | | | | | | | | | | | | | | | | | | | | | |
| | | | 88 | | | | 583 | | | | 3,856 | | | | 5,387 | | | | 246 | | | | 8,291 | | | | 5,269 | | | | 13,320 | |
| | | | | | | | | | | | | | | | | | | | | | | | | | | | | | | | | |
| | | | | | | | | | | | | | | | | | | | | | | | | | | | | | | | | |
| | | | | | | | | | | | | | | | | | | | | | | | | | | | | | | | | |
| | | | 30 | | | | 147 | | | | 2,983 | | | | 3,903 | | | | 284 | | | | 536 | | | | 3,905 | | | | 8,294 | |
| | | | — | | | | 38 | | | | 905 | | | | 757 | | | | 151 | | | | 614 | | | | 738 | | | | 1,598 | |
| | | | | | | | | | | | | | | | | | | | | | | | | | | | | | | | | |
| | | | 7 | | | | 29 | | | | 533 | | | | 581 | | | | 46 | | | | 584 | | | | 673 | | | | 1,399 | |
| | | | — | | | | 16 | | | | 318 | | | | 376 | | | | 59 | | | | 661 | | | | 176 | | | | 277 | |
| | | | — | | | | 26 | | | | 323 | | | | 641 | | | | 64 | | | | 1,093 | | | | 379 | | | | 1,258 | |
| | | | — | | | | — | | | | — | | | | — | | | | — | | | | — | | | | 349 | | | | 854 | |
| | | | — | | | | — | | | | — | | | | — | | | | — | | | | — | | | | — | | | | 5 | |
| | | | — | | | | — | | | | — | | | | 2 | | | | — | | | | 4 | | | | 1 | | | | 10 | |
| | | | — | | | | 9 | | | | 16 | | | | 6 | | | | 5 | | | | — | | | | 5 | | | | 22 | |
| | | | 1 | | | | 2 | | | | 57 | | | | 64 | | | | 4 | | | | 47 | | | | 70 | | | | 150 | |
| | | | 9 | | | | 19 | | | | 58 | | | | 60 | | | | 29 | | | | 66 | | | | 75 | | | | 129 | |
| | | | — | | | | — | | | | 6 | | | | 7 | | | | 1 | | | | 6 | | | | 10 | | | | 13 | |
| | | | — | | | | — | | | | — | | | | — | | | | — | | | | — | | | | — | | | | — | |
| | | | 4 | | | | 13 | | | | 130 | | | | 150 | | | | 17 | | | | 144 | | | | 201 | | | | 267 | |
| | | | | | | | | | | | | | | | | | | | | | | | | | | | | | | | | |
| | | | 51 | | | | 299 | | | | 5,329 | | | | 6,547 | | | | 660 | | | | 3,755 | | | | 6,582 | | | | 14,276 | |
| | | | — | | | | (9 | ) | | | (50 | ) | | | — | | | | (68 | ) | | | — | | | | (48 | ) | | | (45 | ) |
| | | | — | | | | (4 | ) | | | (58 | ) | | | (19 | ) | | | (54 | ) | | | — | | | | (18 | ) | | | (9 | ) |
| | | | — | | | | — | | | | (12 | ) | | | (12 | ) | | | (3 | ) | | | — | | | | (41 | ) | | | (125 | ) |
| | | | — | | | | — | | | | (1 | ) | | | (2 | ) | | | — | | | | — | | | | (1 | ) | | | (1 | ) |
| | | | | | | | | | | | | | | | | | | | | | | | | | | | | | | | | |
| | | | — | | | | (13 | ) | | | (121 | ) | | | (33 | ) | | | (125 | ) | | | — | | | | (108 | ) | | | (180 | ) |
| | | | | | | | | | | | | | | | | | | | | | | | | | | | | | | | | |
| | | | 51 | | | | 286 | | | | 5,208 | | | | 6,514 | | | | 535 | | | | 3,755 | | | | 6,474 | | | | 14,096 | |
| | | | | | | | | | | | | | | | | | | | | | | | | | | | | | | | | |
| | | | 37 | | | | 297 | | | | (1,352 | ) | | | (1,127 | ) | | | (289 | ) | | | 4,536 | | | | (1,205 | ) | | | (776 | ) |
| | | | | | | | | | | | | | | | | | | | | | | | | | | | | | | | | |
| | | | | | | | | | | | | | | | | | | | | | | | | | | | | | | | | |
| | | | | | | | | | | | | | | | | | | | | | | | | | | | | | | | | |
| | | | | | | | | | | | | | | | | | | | | | | | | | | | | | | | | |
| | | | — | | | | — | | | | — | | | | — | | | | — | | | | 53,859 | | | | — | | | | — | |
| | | | — | | | | — | | | | — | | | | — | | | | — | | | | 188 | | | | — | | | | — | |
| | | | (37 | ) | | | (2,324 | ) | | | 22,007 | | | | 12,192 | | | | (1,260 | ) | | | — | | | | 39,293 | | | | (39,113 | ) |
| | | | (1 | ) | | | — | | | | — | | | | — | | | | — | | | | — | | | | — | | | | — | |
| | | | (3 | ) | | | (7 | ) | | | (17 | ) | | | 36 | | | | 1 | | | | — | | | | (46 | ) | | | (663 | ) |
| | | | | | | | | | | | | | | | | | | | | | | | | | | | | | | | | |
| | | | | | | | | | | | | | | | | | | | | | | | | | | | | | | | | |
| | | | (41 | ) | | | (2,331 | ) | | | 21,990 | | | | 12,228 | | | | (1,259 | ) | | | 54,047 | | | | 39,247 | | | | (39,776 | ) |
| | | | | | | | | | | | | | | | | | | | | | | | | | | | | | | | | |
| | | | | | | | | | | | | | | | | | | | | | | | | | | | | | | | | |
| | | | | | | | | | | | | | | | | | | | | | | | | | | | | | | | | |
| | | | 643 | | | | (4,118 | ) | | | (129,918 | ) | | | (109,649 | ) | | | (10,503 | ) | | | (124,574 | ) | | | (170,671 | ) | | | (265,641 | ) |
| | | | | | | | | | | | | | | | | | | | | | | | | | | | | | | | | |
| | | | 5 | | | | — | | | | — | | | | — | | | | — | | | | — | | | | — | | | | — | |
| | | | (1 | ) | | | — | | | | — | | | | (38 | ) | | | (4 | ) | | | — | | | | (10 | ) | | | 60 | |
| | | | | | | | | | | | | | | | | | | | | | | | | | | | | | | | | |
| | | | | | | | | | | | | | | | | | | | | | | | | | | | | | | | | |
| | | | 647 | | | | (4,118 | ) | | | (129,918 | ) | | | (109,687 | ) | | | (10,507 | ) | | | (124,574 | ) | | | (170,681 | ) | | | (265,581 | ) |
| | | | | | | | | | | | | | | | | | | | | | | | | | | | | | | | | |
| | | | | | | | | | | | | | | | | | | | | | | | | | | | | | | | | |
| | | | 606 | | | | (6,449 | ) | | | (107,928 | ) | | | (97,459 | ) | | | (11,766 | ) | | | (70,527 | ) | | | (131,434 | ) | | | (305,357 | ) |
| | | | | | | | | | | | | | | | | | | | | | | | | | | | | | | | | |
| | | $ | 643 | | | $ | (6,152 | ) | | $ | (109,280 | ) | | $ | (98,586 | ) | | $ | (12,055 | ) | | $ | (65,991 | ) | | $ | (132,639 | ) | | $ | (306,133 | ) |
| | | | | | | | | | | | | | | | | | | | | | | | | | | | | | | | | |
311
The Hartford Mutual Funds, Inc. and The Hartford Mutual Funds II, Inc.
Statement of Operations — (continued)
For the Six Month Period Ended April 30, 2008 (Unaudited)
(000’s Omitted)
| | | | | | | | | | | | | |
| | | | | | High Yield
| | | Income
| |
| | | High Yield
| | | Municipal Bond
| | | Allocation
| |
| | | Fund | | | Fund | | | Fund | |
Investment Income: | | | | | | | | | | | | |
| Dividends | | $ | 28 | | | $ | — | | | $ | 16 | |
| Dividends from underlying affiliated funds | | | — | | | | — | | | | 1,477 | |
| Interest | | | 9,855 | | | | 3,199 | | | | 1 | |
| Securities lending | | | 158 | | | | — | | | | — | |
| Less: Foreign tax withheld | | | — | | | | — | | | | — | |
| | | | | | | | | | �� | | | |
| Total investment income, net | | | 10,041 | | | | 3,199 | | | | 1,494 | |
| | | | | | | | | | | | | |
| | | | | | | | | | | | | |
Expenses: | | | | | | | | | | | | |
| Investment management and advisory fees | | | 785 | | | | 297 | | | | 42 | |
| Transfer agent fees | | | 266 | | | | 12 | | | | 31 | |
| Distribution fees | | | | | | | | | | | | |
| Class A | | | 195 | | | | 87 | | | | 47 | |
| Class B | | | 143 | | | | 10 | | | | 31 | |
| Class C | | | 160 | | | | 110 | | | | 53 | |
| Class L | | | — | | | | — | | | | — | |
| Class R3 | | | — | | | | — | | | | — | |
| Class R4 | | | — | | | | — | | | | 1 | |
| Custodian fees | | | 4 | | | | 2 | | | | — | |
| Accounting services | | | 19 | | | | 9 | | | | 4 | |
| Registration and filing fees | | | 49 | | | | 41 | | | | 39 | |
| Board of Directors’ fees and expense | | | 2 | | | | 1 | | | | — | |
| Interest & dividend expense | | | — | | | | — | | | | — | |
| Other expenses | | | 56 | | | | 12 | | | | 15 | |
| | | | | | | | | | | | | |
| Total expenses (before waivers and fees paid indirectly) | | | 1,679 | | | | 581 | | | | 263 | |
| Expense waivers | | | (174 | ) | | | (331 | ) | | | (44 | ) |
| Transfer agent fee waivers | | | (2 | ) | | | — | | | | — | |
| Commission recapture | | | — | | | | — | | | | — | |
| Custodian fee offset | | | (1 | ) | | | — | | | | — | |
| | | | | | | | | | | | | |
| Total waivers and fees paid indirectly | | | (177 | ) | | | (331 | ) | | | (44 | ) |
| | | | | | | | | | | | | |
| Total expenses, net | | | 1,502 | | | | 250 | | | | 219 | |
| | | | | | | | | | | | | |
| Net investment income (loss) | | | 8,539 | | | | 2,949 | | | | 1,275 | |
| | | | | | | | | | | | | |
| | | | | | | | | | | | | |
Net Realized Gain (Loss) on Investments, Futures, Options and Swap Contracts and Foreign Currency Transactions: | | | | | | | | | | | | |
| Capital gain distribution received from underlying affiliated funds | | | — | | | | — | | | | — | |
| Net realized gain (loss) on investments in underlying affiliated funds | | | — | | | | — | | | | (60 | ) |
| Net realized gain (loss) on investments; unaffiliated | | | (9,707 | ) | | | (580 | ) | | | — | |
| Net realized gain (loss) on futures, written options and swap contracts | | | 1,254 | | | | — | | | | — | |
| Net realized gain (loss) on foreign currency transactions | | | (91 | ) | | | — | | | | — | |
| | | | | | | | | | | | | |
Net Realized Gain (Loss) on Investments, Futures, Options and Swap Contracts and Foreign Currency Transactions: | | | (8,544 | ) | | | (580 | ) | | | (60 | ) |
| | | | | | | | | | | | | |
| | | | | | | | | | | | | |
Net Changes in Unrealized Appreciation (Depreciation) of Investments, Futures, Options and Swap Contracts and Foreign Currency Transactions: | | | | | | | | | | | | |
| Net unrealized appreciation (depreciation) of investments | | | (4,704 | ) | | | (6,439 | ) | | | (552 | ) |
| Net unrealized appreciation (depreciation) of futures, written options and swap contracts | | | (234 | ) | | | — | | | | — | |
| Net unrealized appreciation (depreciation) on translation of other assets and liabilities in foreign currencies | | | 96 | | | | — | | | | — | |
| | | | | | | | | | | | | |
Net Changes in Unrealized Appreciation (Depreciation) of Investments, Futures, Options and Swap Contracts and Foreign Currency Transactions: | | | (4,842 | ) | | | (6,439 | ) | | | (552 | ) |
| | | | | | | | | | | | | |
Net Gain (Loss) on Investments, Futures, Options and Swap Contracts and Foreign Currency Transactions: | | | (13,386 | ) | | | (7,019 | ) | | | (612 | ) |
| | | | | | | | | | | | | |
Net Increase (Decrease) in Net Assets Resulting from Operations | | $ | (4,847 | ) | | $ | (4,070 | ) | | $ | 663 | |
| | | | | | | | | | | | | |
| | |
| (1) | | Formerly known as The Hartford Select MidCap Growth Fund. |
| (D) | | Realized losses on written options were $1,078. |
The accompanying notes are an integral part of these financial statements.
312
| | | | | | | | | | | | | | | | | | | | | | | | | | | | | | | | | |
| | | | | | | | | International
| | | International
| | | International
| | | LargeCap
| | | | | | | |
| | | Income
| | | Inflation Plus
| | | Growth
| | | Opportunities
| | | Small Company
| | | Growth
| | | MidCap
| | | MidCap Growth
| |
| | | Fund | | | Fund | | | Fund | | | Fund | | | Fund | | | Fund | | | Fund | | | Fund (1) | |
| | | | | | | | | | | | | | | | | | | | | | | | | | | | | | | | | |
| | | $ | 53 | | | $ | — | | | $ | 4,279 | | | $ | 3,979 | | | $ | 3,003 | | | $ | 60 | | | $ | 12,684 | | | $ | 186 | |
| | | | — | | | | — | | | | — | | | | — | | | | — | | | | — | | | | — | | | | — | |
| | | | 10,676 | | | | 16,992 | | | | 385 | | | | 295 | | | | 127 | | | | 1 | | | | 1,150 | | | | (10 | ) |
| | | | 170 | | | | — | | | | 97 | | | | 283 | | | | 339 | | | | — | | | | 1,837 | | | | 33 | |
| | | | — | | | | — | | | | (527 | ) | | | (503 | ) | | | (283 | ) | | | — | | | | (60 | ) | | | — | |
| | | | | | | | | | | | | | | | | | | | | | | | | | | | | | | | | |
| | | | 10,899 | | | | 16,992 | | | | 4,234 | | | | 4,054 | | | | 3,186 | | | | 61 | | | | 15,611 | | | | 209 | |
| | | | | | | | | | | | | | | | | | | | | | | | | | | | | | | | | |
| | | | | | | | | | | | | | | | | | | | | | | | | | | | | | | | | |
| | | | | | | | | | | | | | | | | | | | | | | | | | | | | | | | | |
| | | | 926 | | | | 1,846 | | | | 2,526 | | | | 1,815 | | | | 1,291 | | | | 37 | | | | 10,755 | | | | 125 | |
| | | | 86 | | | | 271 | | | | 571 | | | | 421 | | | | 213 | | | | 3 | | | | 2,493 | | | | 54 | |
| | | | | | | | | | | | | | | | | | | | | | | | | | | | | | | | | |
| | | | 129 | | | | 290 | | | | 482 | | | | 293 | | | | 150 | | | | 13 | | | | 2,419 | | | | 31 | |
| | | | 49 | | | | 367 | | | | 223 | | | | 167 | | | | 81 | | | | 2 | | | | 1,879 | | | | 20 | |
| | | | 76 | | | | 959 | | | | 292 | | | | 166 | | | | 134 | | | | 3 | | | | 2,246 | | | | 23 | |
| | | | — | | | | — | | | | — | | | | — | | | | — | | | | — | | | | — | | | | — | |
| | | | — | | | | — | | | | — | | | | — | | | | — | | | | — | | | | — | | | | — | |
| | | | — | | | | — | | | | — | | | | — | | | | — | | | | — | | | | — | | | | — | |
| | | | 5 | | | | 3 | | | | 26 | | | | 19 | | | | 22 | | | | 2 | | | | 9 | | | | 6 | |
| | | | 28 | | | | 59 | | | | 48 | | | | 36 | | | | 24 | | | | 1 | | | | 210 | | | | 2 | |
| | | | 25 | | | | 54 | | | | 69 | | | | 48 | | | | 39 | | | | 25 | | | | 72 | | | | 22 | |
| | | | 2 | | | | 5 | | | | 3 | | | | 3 | | | | 2 | | | | — | | | | 26 | | | | — | |
| | | | — | | | | 199 | | | | — | | | | — | | | | — | | | | — | | | | — | | | | — | |
| | | | 47 | | | | 81 | | | | 90 | | | | 67 | | | | 49 | | | | 7 | | | | 513 | | | | 6 | |
| | | | | | | | | | | | | | | | | | | | | | | | | | | | | | | | | |
| | | | 1,373 | | | | 4,134 | | | | 4,330 | | | | 3,035 | | | | 2,005 | | | | 93 | | | | 20,622 | | | | 289 | |
| | | | (28 | ) | | | (252 | ) | | | — | | | | (15 | ) | | | (10 | ) | | | (18 | ) | | | — | | | | (33 | ) |
| | | | — | | | | — | | | | (12 | ) | | | (27 | ) | | | (13 | ) | | | — | | | | — | | | | (9 | ) |
| | | | — | | | | — | | | | (41 | ) | | | (9 | ) | | | (3 | ) | | | — | | | | (99 | ) | | | — | |
| | | | (1 | ) | | | — | | | | — | | | | (2 | ) | | | — | | | | — | | | | (2 | ) | | | — | |
| | | | | | | | | | | | | | | | | | | | | | | | | | | | | | | | | |
| | | | (29 | ) | | | (252 | ) | | | (53 | ) | | | (53 | ) | | | (26 | ) | | | (18 | ) | | | (101 | ) | | | (42 | ) |
| | | | | | | | | | | | | | | | | | | | | | | | | | | | | | | | | |
| | | | 1,344 | | | | 3,882 | | | | 4,277 | | | | 2,982 | | | | 1,979 | | | | 75 | | | | 20,521 | | | | 247 | |
| | | | | | | | | | | | | | | | | | | | | | | | | | | | | | | | | |
| | | | 9,555 | | | | 13,110 | | | | (43 | ) | | | 1,072 | | | | 1,207 | | | | (14 | ) | | | (4,910 | ) | | | (38 | ) |
| | | | | | | | | | | | | | | | | | | | | | | | | | | | | | | | | |
| | | | | | | | | | | | | | | | | | | | | | | | | | | | | | | | | |
| | | | | | | | | | | | | | | | | | | | | | | | | | | | | | | | | |
| | | | | | | | | | | | | | | | | | | | | | | | | | | | | | | | | |
| | | | | | | | | | | | | | | | | | | | | | | | | | | | | | | | | |
| | | | | | | | | | | | | | | | | | | | | | | | | | | | | | | | | |
| | | | — | | | | — | | | | — | | | | — | | | | — | | | | — | | | | — | | | | — | |
| | | | — | | | | — | | | | — | | | | — | | | | — | | | | — | | | | — | | | | — | |
| | | | (7,288 | ) | | | 21,505 | | | | (15,922 | ) | | | 20,695 | | | | 2,539 | | | | (709 | ) | | | 86,820 | | | | (708 | ) |
| | | | 6,146 | | | | 5,441 | (D) | | | — | | | | — | | | | — | | | | (7 | ) | | | — | | | | (12 | ) |
| | | | (289 | ) | | | 53 | | | | (201 | ) | | | (248 | ) | | | (9 | ) | | | — | | | | (143 | ) | | | — | |
| | | | | | | | | | | | | | | | | | | | | | | | | | | | | | | | | |
| | | | | | | | | | | | | | | | | | | | | | | | | | | | | | | | | |
| | | | | | | | | | | | | | | | | | | | | | | | | | | | | | | | | |
| | | | | | | | | | | | | | | | | | | | | | | | | | | | | | | | | |
| | | | (1,431 | ) | | | 26,999 | | | | (16,123 | ) | | | 20,447 | | | | 2,530 | | | | (716 | ) | | | 86,677 | | | | (720 | ) |
| | | | | | | | | | | | | | | | | | | | | | | | | | | | | | | | | |
| | | | | | | | | | | | | | | | | | | | | | | | | | | | | | | | | |
| | | | | | | | | | | | | | | | | | | | | | | | | | | | | | | | | |
| | | | | | | | | | | | | | | | | | | | | | | | | | | | | | | | | |
| | | | (7,347 | ) | | | 468 | | | | (94,760 | ) | | | (56,298 | ) | | | (44,035 | ) | | | (923 | ) | | | (312,681 | ) | | | (3,190 | ) |
| | | | | | | | | | | | | | | | | | | | | | | | | | | | | | | | | |
| | | | (972 | ) | | | 835 | | | | — | | | | — | | | | — | | | | — | | | | — | | | | 7 | |
| | | | | | | | | | | | | | | | | | | | | | | | | | | | | | | | | |
| | | | 295 | | | | — | | | | (388 | ) | | | 6 | | | | (23 | ) | | | — | | | | — | | | | — | |
| | | | | | | | | | | | | | | | | | | | | | | | | | | | | | | | | |
| | | | | | | | | | | | | | | | | | | | | | | | | | | | | | | | | |
| | | | (8,024 | ) | | | 1,303 | | | | (95,148 | ) | | | (56,292 | ) | | | (44,058 | ) | | | (923 | ) | | | (312,681 | ) | | | (3,183 | ) |
| | | | | | | | | | | | | | | | | | | | | | | | | | | | | | | | | |
| | | | | | | | | | | | | | | | | | | | | | | | | | | | | | | | | |
| | | | (9,455 | ) | | | 28,302 | | | | (111,271 | ) | | | (35,845 | ) | | | (41,528 | ) | | | (1,639 | ) | | | (226,004 | ) | | | (3,903 | ) |
| | | | | | | | | | | | | | | | | | | | | | | | | | | | | | | | | |
| | | $ | 100 | | | $ | 41,412 | | | $ | (111,314 | ) | | $ | (34,773 | ) | | $ | (40,321 | ) | | $ | (1,653 | ) | | $ | (230,914 | ) | | $ | (3,941 | ) |
| | | | | | | | | | | | | | | | | | | | | | | | | | | | | | | | | |
313
The Hartford Mutual Funds, Inc. and The Hartford Mutual Funds II, Inc.
Statement of Operations — (continued)
For the Six Month Period Ended April 30, 2008 (Unaudited)
(000’s Omitted)
| | | | | | | | | | | | | |
| | | MidCap
| | | Money
| | | Retirement
| |
| | | Value
| | | Market
| | | Income
| |
| | | Fund | | | Fund | | | Fund | |
Investment Income: | | | | | | | | | | | | |
| Dividends | | $ | 2,272 | | | $ | — | | | $ | — | |
| Dividends from underlying affiliated funds | | | — | | | | — | | | | 104 | |
| Interest | | | 68 | | | | 10,518 | | | | — | |
| Securities lending | | | 295 | | | | — | | | | — | |
| Less: Foreign tax withheld | | | (3 | ) | | | — | | | | — | |
| | | | | | | | | | | | | |
| Total investment income, net | | | 2,632 | | | | 10,518 | | | | 104 | |
| | | | | | | | | | | | | |
Expenses: | | | | | | | | | | | | |
| Investment management and advisory fees | | | 1,510 | | | | 1,226 | | | | 4 | |
| Transfer agent fees | | | 455 | | | | 463 | | | | 1 | |
| Distribution fees Class A | | | 312 | | | | 458 | | | | 4 | |
| Class B | | | 243 | | | | 173 | | | | 1 | |
| Class C | | | 251 | | | | 494 | | | | 3 | |
| Class L | | | — | | | | — | | | | — | |
| Class R3 | | | — | | | | — | | | | — | |
| Class R4 | | | — | | | | 48 | | | | 1 | |
| Custodian fees | | | 7 | | | | 2 | | | | — | |
| Accounting services | | | 26 | | | | 43 | | | | — | |
| Registration and filing fees | | | 24 | | | | 62 | | | | 35 | |
| Board of Directors’ fees and expense | | | 4 | | | | 3 | | | | — | |
| Interest & dividend expense | | | — | | | | — | | | | — | |
| Other expenses | | | 80 | | | | 84 | | | | 8 | |
| | | | | | | | | | | | | |
| Total expenses (before waivers and fees paid indirectly) | | | 2,912 | | | | 3,056 | | | | 57 | |
| Expense waivers | | | (80 | ) | | | (165 | ) | | | (42 | ) |
| Transfer agent fee waivers | | | (11 | ) | | | — | | | | — | |
| Commission recapture | | | (19 | ) | | | — | | | | — | |
| Custodian fee offset | | | — | | | | (1 | ) | | | — | |
| | | | | | | | | | | | | |
| Total waivers and fees paid indirectly | | | (110 | ) | | | (166 | ) | | | (42 | ) |
| | | | | | | | | | | | | |
| Total expenses, net | | | 2,802 | | | | 2,890 | | | | 15 | |
| | | | | | | | | | | | | |
| Net investment income (loss) | | | (170 | ) | | | 7,628 | | | | 89 | |
| | | | | | | | | | | | | |
Net Realized Gain (Loss) on Investments, Futures, Options and Swap Contracts and Foreign Currency Transactions: | | | | | | | | | | | | |
| Capital gain distribution received from underlying affiliated funds | | | — | | | | — | | | | 81 | |
| Net realized gain (loss) on investments in underlying affiliated funds | | | — | | | | — | | | | (46 | ) |
| Net realized gain (loss) on investments; unaffiliated | | | (16,286 | ) | | | — | | | | — | |
| Net realized gain (loss) on futures, written options and swap contracts | | | — | | | | — | | | | — | |
| Net realized gain (loss) on foreign currency transactions | | | (12 | ) | | | — | | | | — | |
| | | | | | | | | | | | | |
Net Realized Gain (Loss) on Investments, Futures, Options and Swap Contracts and Foreign Currency Transactions: | | | (16,298 | ) | | | — | | | | 35 | |
| | | | | | | | | | | | | |
Net Changes in Unrealized Appreciation (Depreciation) of Investments, Futures, Options and Swap Contracts and Foreign Currency Transactions: | | | | | | | | | | | | |
| Net unrealized appreciation (depreciation) of investments | | | (60,111 | ) | | | — | | | | (161 | ) |
| Net unrealized appreciation (depreciation) of futures, written options and swap contracts | | | — | | | | — | | | | — | |
| Net unrealized appreciation (depreciation) on translation of other assets and liabilities in foreign currencies | | | — | | | | — | | | | — | |
| | | | | | | | | | | | | |
Net Changes in Unrealized Appreciation (Depreciation) of Investments, Futures, Options and Swap Contracts and Foreign Currency Transactions: | | | (60,111 | ) | | | — | | | | (161 | ) |
| | | | | | | | | | | | | |
Net Gain (Loss) on Investments, Futures, Options and Swap Contracts and Foreign Currency Transactions: | | | (76,409 | ) | | | — | | | | (126 | ) |
| | | | | | | | | | | | | |
Net Increase (Decrease) in Net Assets Resulting from Operations | | $ | (76,579 | ) | | $ | 7,628 | | | $ | (37 | ) |
| | | | | | | | | | | | | |
| | |
| (I) | | Realized gains on written options were $70. |
The accompanying notes are an integral part of these financial statements.
314
| | | | | | | | | | | | | | | | | | | | | | | | | | | | | | | | | |
| | | Select MidCap
| | | Select SmallCap
| | | Short
| | | Small
| | | SmallCap
| | | | | | Strategic
| | | Target
| |
| | | Value
| | | Value
| | | Duration
| | | Company
| | | Growth
| | | Stock
| | | Income
| | | Retirement 2010
| |
| | | Fund | | | Fund | | | Fund | | | Fund | | | Fund | | | Fund | | | Fund | | | Fund | |
| | | | | | | | | | | | | | | | | | | | | | | | | | | | | | | | | |
| | | $ | 890 | | | $ | 1,125 | | | $ | — | | | $ | 1,811 | | | $ | 994 | | | $ | 7,265 | | | $ | 29 | | | $ | — | |
| | | | — | | | | — | | | | — | | | | — | | | | — | | | | — | | | | — | | | | 187 | |
| | | | 20 | | | | 89 | | | | 5,287 | | | | 506 | | | | 78 | | | | 70 | | | | 6,128 | | | | — | |
| | | | 42 | | | | — | | | | — | | | | 910 | | | | 653 | | | | 105 | | | | — | | | | — | |
| | | | — | | | | (2 | ) | | | — | | | | (89 | ) | | | — | | | | (102 | ) | | | — | | | | — | |
| | | | | | | | | | | | | | | | | | | | | | | | | | | | | | | | | |
| | | | 952 | | | | 1,212 | | | | 5,287 | | | | 3,138 | | | | 1,725 | | | | 7,338 | | | | 6,157 | | | | 187 | |
| | | | | | | | | | | | | | | | | | | | | | | | | | | | | | | | | |
| | | | | | | | | | | | | | | | | | | | | | | | | | | | | | | | | |
| | | | 333 | | | | 528 | | | | 525 | | | | 2,420 | | | | 1,314 | | | | 3,254 | | | | 446 | | | | 9 | |
| | | | 66 | | | | 9 | | | | 46 | | | | 520 | | | | 374 | | | | 1,416 | | | | 47 | | | | 2 | |
| | | | 37 | | | | 21 | | | | 50 | | | | 355 | | | | 166 | | | | 705 | | | | 88 | | | | 10 | |
| | | | 18 | | | | 3 | | | | 29 | | | | 207 | | | | 70 | | | | 670 | | | | 22 | | | | 3 | |
| | | | 29 | | | | 4 | | | | 131 | | | | 279 | | | | 92 | | | | 629 | | | | 227 | | | | 3 | |
| | | | — | | | | — | | | | — | | | | — | | | | 143 | | | | — | | | | — | | | | — | |
| | | | — | | | | — | | | | — | | | | 2 | | | | — | | | | — | | | | — | | | | — | |
| | | | — | | | | — | | | | — | | | | 15 | | | | 1 | | | | — | | | | — | | | | 2 | |
| | | | 5 | | | | 3 | | | | 1 | | | | 18 | | | | 9 | | | | 18 | | | | 3 | | | | — | |
| | | | 6 | | | | 7 | | | | 18 | | | | 47 | | | | 25 | | | | 64 | | | | 14 | | | | 1 | |
| | | | 20 | | | | 13 | | | | 23 | | | | 55 | | | | 49 | | | | 47 | | | | 43 | | | | 35 | |
| | | | 1 | | | | 1 | | | | 2 | | | | 4 | | | | 4 | | | | 10 | | | | 1 | | | | — | |
| | | | — | | | | — | | | | — | | | | — | | | | — | | | | — | | | | — | | | | — | |
| | | | 20 | | | | 23 | | | | 34 | | | | 95 | | | | 65 | | | | 201 | | | | 20 | | | | 10 | |
| | | | | | | | | | | | | | | | | | | | | | | | | | | | | | | | | |
| | | | 535 | | | | 612 | | | | 859 | | | | 4,017 | | | | 2,312 | | | | 7,014 | | | | 911 | | | | 75 | |
| | | | (31 | ) | | | (1 | ) | | | (17 | ) | | | (30 | ) | | | (173 | ) | | | (416 | ) | | | (446 | ) | | | (40 | ) |
| | | | (5 | ) | | | (1 | ) | | | — | | | | (20 | ) | | | (116 | ) | | | (171 | ) | | | — | | | | — | |
| | | | — | | | | — | | | | — | | | | (18 | ) | | | — | | | | (33 | ) | | | — | | | | — | |
| | | | — | | | | (1 | ) | | | (1 | ) | | | (3 | ) | | | (2 | ) | | | (1 | ) | | | — | | | | — | |
| | | | | | | | | | | | | | | | | | | | | | | | | | | | | | | | | |
| | | | (36 | ) | | | (3 | ) | | | (18 | ) | | | (71 | ) | | | (291 | ) | | | (621 | ) | | | (446 | ) | | | (40 | ) |
| | | | | | | | | | | | | | | | | | | | | | | | | | | | | | | | | |
| | | | 499 | | | | 609 | | | | 841 | | | | 3,946 | | | | 2,021 | | | | 6,393 | | | | 465 | | | | 35 | |
| | | | | | | | | | | | | | | | | | | | | | | | | | | | | | | | | |
| | | | 453 | | | | 603 | | | | 4,446 | | | | (808 | ) | | | (296 | ) | | | 945 | | | | 5,692 | | | | 152 | |
| | | | | | | | | | | | | | | | | | | | | | | | | | | | | | | | | |
| | | | | | | | | | | | | | | | | | | | | | | | | | | | | | | | | |
| | | | — | | | | — | | | | — | | | | — | | | | — | | | | — | | | | — | | | | 381 | |
| | | | — | | | | — | | | | — | | | | — | | | | — | | | | — | | | | — | | | | (285 | ) |
| | | | (12,324 | ) | | | (1,370 | ) | | | 262 | | | | (25,126 | ) | | | (27,165 | ) | | | (8,426 | ) | | | (2,081 | ) | | | — | |
| | | | (135 | ) | | | (199 | ) | | | — | | | | (1,159 | ) | | | (173 | ) | | | 70 | (I) | | | 2,452 | | | | — | |
| | | | — | | | | — | | | | — | | | | 10 | | | | — | | | | (1,331 | ) | | | 29 | | | | — | |
| | | | | | | | | | | | | | | | | | | | | | | | | | | | | | | | | |
| | | | | | | | | | | | | | | | | | | | | | | | | | | | | | | | | |
| | | | (12,459 | ) | | | (1,569 | ) | | | 262 | | | | (26,275 | ) | | | (27,338 | ) | | | (9,687 | ) | | | 400 | | | | 96 | |
| | | | | | | | | | | | | | | | | | | | | | | | | | | | | | | | | |
| | | | | | | | | | | | | | | | | | | | | | | | | | | | | | | | | |
| | | | | | | | | | | | | | | | | | | | | | | | | | | | | | | | | |
| | | | (633 | ) | | | (16,955 | ) | | | (6,201 | ) | | | (56,745 | ) | | | (27,668 | ) | | | (118,928 | ) | | | (2,889 | ) | | | (366 | ) |
| | | | | | | | | | | | | | | | | | | | | | | | | | | | | | | | | |
| | | | 4 | | | | 33 | | | | — | | | | 4 | | | | 27 | | | | 15 | | | | (604 | ) | | | — | |
| | | | | | | | | | | | | | | | | | | | | | | | | | | | | | | | | |
| | | | — | | | | — | | | | — | | | | (2 | ) | | | — | | | | (2,009 | ) | | | 205 | | | | — | |
| | | | | | | | | | | | | | | | | | | | | | | | | | | | | | | | | |
| | | | | | | | | | | | | | | | | | | | | | | | | | | | | | | | | |
| | | | (629 | ) | | | (16,922 | ) | | | (6,201 | ) | | | (56,743 | ) | | | (27,641 | ) | | | (120,922 | ) | | | (3,288 | ) | | | (366 | ) |
| | | | | | | | | | | | | | | | | | | | | | | | | | | | | | | | | |
| | | | | | | | | | | | | | | | | | | | | | | | | | | | | | | | | |
| | | | (13,088 | ) | | | (18,491 | ) | | | (5,939 | ) | | | (83,018 | ) | | | (54,979 | ) | | | (130,609 | ) | | | (2,888 | ) | | | (270 | ) |
| | | | | | | | | | | | | | | | | | | | | | | | | | | | | | | | | |
| | | $ | (12,635 | ) | | $ | (17,888 | ) | | $ | (1,493 | ) | | $ | (83,826 | ) | | $ | (55,275 | ) | | $ | (129,664 | ) | | $ | 2,804 | | | $ | (118 | ) |
| | | | | | | | | | | | | | | | | | | | | | | | | | | | | | | | | |
315
The Hartford Mutual Funds, Inc. and The Hartford Mutual Funds II, Inc.
Statement of Operations — (continued)
For the Six Month Period Ended April 30, 2008 (Unaudited)
(000’s Omitted)
| | | | | | | | | | | | | |
| | | Target
| | | Target
| | | Tax-Free
| |
| | | Retirement
| | | Retirement
| | | California
| |
| | | 2020 Fund | | | 2030 Fund | | | Fund | |
Investment Income: | | | | | | | | | | | | |
| Dividends | | $ | — | | | $ | — | | | $ | — | |
| Dividends from underlying affiliated funds | | | 336 | | | | 190 | | | | — | |
| Interest | | | — | | | | — | | | | 1,142 | |
| Securities lending | | | — | | | | — | | | | — | |
| Less: Foreign tax withheld | | | — | | | | — | | | | — | |
| | | | | | | | | | | | | |
| Total investment income, net | | | 336 | | | | 190 | | | | 1,142 | |
| | | | | | | | | | | | | |
Expenses: | | | | | | | | | | | | |
| Investment management and advisory fees | | | 19 | | | | 15 | | | | 118 | |
| Transfer agent fees | | | 7 | | | | 8 | | | | 5 | |
| Distribution fees Class A | | | 22 | | | | 19 | | | | 45 | |
| Class B | | | 4 | | | | 3 | | | | 9 | |
| Class C | | | 4 | | | | 3 | | | | 26 | |
| Class L | | | — | | | | — | | | | — | |
| Class R3 | | | — | | | | — | | | | — | |
| Class R4 | | | 4 | | | | 4 | | | | — | |
| Custodian fees | | | — | | | | — | | | | 1 | |
| Accounting services | | | 1 | | | | 1 | | | | 3 | |
| Registration and filing fees | | | 35 | | | | 35 | | | | 3 | |
| Board of Directors’ fees and expense | | | — | | | | — | | | | — | |
| Interest & dividend expense | | | — | | | | — | | | | — | |
| Other expenses | | | 11 | | | | 10 | | | | 12 | |
| | | | | | | | | | | | | |
| Total expenses (before waivers and fees paid indirectly) | | | 107 | | | | 98 | | | | 222 | |
| Expense waivers | | | (38 | ) | | | (40 | ) | | | (13 | ) |
| Transfer agent fee waivers | | | — | | | | (1 | ) | | | — | |
| Commission recapture | | | — | | | | — | | | | — | |
| Custodian fee offset | | | — | | | | — | | | | — | |
| | | | | | | | | | | | | |
| Total waivers and fees paid indirectly | | | (38 | ) | | | (41 | ) | | | (13 | ) |
| | | | | | | | | | | | | |
| Total expenses, net | | | 69 | | | | 57 | | | | 209 | |
| | | | | | | | | | | | | |
| Net investment income (loss) | | | 267 | | | | 133 | | | | 933 | |
| | | | | | | | | | | | | |
Net Realized Gain (Loss) on Investments, Futures, Options and Swap Contracts and Foreign Currency Transactions: | | | | | | | | | | | | |
| Capital gain distribution received from underlying affiliated funds | | | 938 | | | | 1,002 | | | | — | |
| Net realized gain (loss) on investments in underlying affiliated funds | | | (556 | ) | | | (243 | ) | | | — | |
| Net realized gain (loss) on investments; unaffiliated | | | — | | | | — | | | | (811 | ) |
| Net realized gain (loss) on futures, written options and swap contracts | | | — | | | | — | | | | — | |
| Net realized gain (loss) on foreign currency transactions | | | — | | | | — | | | | — | |
| | | | | | | | | | | | | |
Net Realized Gain (Loss) on Investments, Futures, Options and Swap Contracts and Foreign Currency Transactions: | | | 382 | | | | 759 | | | | (811 | ) |
| | | | | | | | | | | | | |
Net Changes in Unrealized Appreciation (Depreciation) of Investments, Futures, Options and Swap Contracts and Foreign Currency Transactions: | | | | | | | | | | | | |
| Net unrealized appreciation (depreciation) of investments | | | (1,510 | ) | | | (1,839 | ) | | | (1,821 | ) |
| Net unrealized appreciation (depreciation) of futures, written options and swap contracts | | | — | | | | — | | | | — | |
| Net unrealized appreciation (depreciation) on translation of other assets and liabilities in foreign currencies | | | — | | | | — | | | | — | |
| | | | | | | | | | | | | |
Net Changes in Unrealized Appreciation (Depreciation) of Investments, Futures, Options and Swap Contracts and Foreign Currency Transactions: | | | (1,510 | ) | | | (1,839 | ) | | | (1,821 | ) |
| | | | | | | | | | | | | |
Net Gain (Loss) on Investments, Futures, Options and Swap Contracts and Foreign Currency Transactions: | | | (1,128 | ) | | | (1,080 | ) | | | (2,632 | ) |
| | | | | | | | | | | | | |
Net Increase (Decrease) in Net Assets Resulting from Operations | | $ | (861 | ) | | $ | (947 | ) | | $ | (1,699 | ) |
| | | | | | | | | | | | | |
| | |
| # | | Realized gains on written options were $75. |
The accompanying notes are an integral part of these financial statements.
316
| | | | | | | | | | | | | | | | | | | | | | | | | | | | | |
| | | Tax-Free
| | | Tax-Free
| | | Tax-Free
| | | Total
| | | U.S.
| | | | | | Value
| |
| | | Minnesota
| | | National
| | | New York
| | | Return Bond
| | | Government
| | | Value
| | | Opportunities
| |
| | | Fund | | | Fund | | | Fund | | | Fund | | | Securities Fund | | | Fund | | | Fund | |
| | | | | | | | | | | | | | | | | | | | | | | | | | | | | |
| | | $ | — | | | $ | — | | | $ | — | | | $ | 157 | | | $ | — | | | $ | 4,995 | | | $ | 2,259 | |
| | | | — | | | | — | | | | — | | | | — | | | | — | | | | — | | | | — | |
| | | | 899 | | | | 5,292 | | | | 390 | | | | 35,103 | | | | 5,799 | | | | 205 | | | | 94 | |
| | | | — | | | | — | | | | — | | | | 442 | | | | 66 | | | | 8 | | | | 134 | |
| | | | — | | | | — | | | | — | | | | — | | | | — | | | | (1 | ) | | | (54 | ) |
| | | | | | | | | | | | | | | | | | | | | | | | | | | | | |
| | | | 899 | | | | 5,292 | | | | 390 | | | | 35,702 | | | | 5,865 | | | | 5,207 | | | | 2,433 | |
| | | | | | | | | | | | | | | | | | | | | | | | | | | | | |
| | | | | | | | | | | | | | | | | | | | | | | | | | | | | |
| | | | 97 | | | | 531 | | | | 43 | | | | 3,330 | | | | 561 | | | | 1,606 | | | | 977 | |
| | | | 4 | | | | 33 | | | | 1 | | | | 796 | | | | 109 | | | | 113 | | | | 230 | |
| | | | 12 | | | | 158 | | | | 14 | | | | 803 | | | | 76 | | | | 101 | | | | 157 | |
| | | | 4 | | | | 33 | | | | 8 | | | | 418 | | | | 72 | | | | 58 | | | | 80 | |
| | | | 3 | | | | 122 | | | | 13 | | | | 486 | | | | 102 | | | | 63 | | | | 126 | |
| | | | 3 | | | | 10 | | | | — | | | | — | | | | 38 | | | | — | | | | 43 | |
| | | | — | | | | — | | | | — | | | | — | | | | — | | | | — | | | | 1 | |
| | | | — | | | | — | | | | — | | | | 8 | | | | — | | | | — | | | | 2 | |
| | | | 1 | | | | 2 | | | | 1 | | | | 10 | | | | 4 | | | | 2 | | | | 8 | |
| | | | 3 | | | | 14 | | | | 1 | | | | 107 | | | | 16 | | | | 29 | | | | 17 | |
| | | | 5 | | | | 40 | | | | 3 | | | | 67 | | | | 28 | | | | 44 | | | | 59 | |
| | | | 1 | | | | 1 | | | | — | | | | 8 | | | | 2 | | | | 3 | | | | 2 | |
| | | | — | | | | — | | | | — | | | | — | | | | — | | | | — | | | | — | |
| | | | 13 | | | | 34 | | | | 8 | | | | 183 | | | | 47 | | | | 57 | | | | 58 | |
| | | | | | | | | | | | | | | | | | | | | | | | | | | | | |
| | | | 146 | | | | 978 | | | | 92 | | | | 6,216 | | | | 1,055 | | | | 2,076 | | | | 1,760 | |
| | | | (9 | ) | | | (78 | ) | | | (10 | ) | | | (128 | ) | | | (60 | ) | | | (4 | ) | | | (76 | ) |
| | | | — | | | | — | | | | — | | | | (17 | ) | | | (7 | ) | | | (3 | ) | | | (12 | ) |
| | | | — | | | | — | | | | — | | | | — | | | | — | | | | (7 | ) | | | (5 | ) |
| | | | — | | | | (2 | ) | | | — | | | | (2 | ) | | | — | | | | — | | | | (1 | ) |
| | | | | | | | | | | | | | | | | | | | | | | | | | | | | |
| | | | (9 | ) | | | (80 | ) | | | (10 | ) | | | (147 | ) | | | (67 | ) | | | (14 | ) | | | (94 | ) |
| | | | | | | | | | | | | | | | | | | | | | | | | | | | | |
| | | | 137 | | | | 898 | | | | 82 | | | | 6,069 | | | | 988 | | | | 2,062 | | | | 1,666 | |
| | | | | | | | | | | | | | | | | | | | | | | | | | | | | |
| | | | 762 | | | | 4,394 | | | | 308 | | | | 29,633 | | | | 4,877 | | | | 3,145 | | | | 767 | |
| | | | | | | | | | | | | | | | | | | | | | | | | | | | | |
| | | | | | | | | | | | | | | | | | | | | | | | | | | | | |
| | | | — | | | | — | | | | — | | | | — | | | | — | | | | — | | | | — | |
| | | | — | | | | — | | | | — | | | | — | | | | — | | | | — | | | | — | |
| | | | 51 | | | | (5,675 | ) | | | (10 | ) | | | (10,812 | ) | | | 1,088 | | | | 724 | | | | (12,459 | ) |
| | | | — | | | | — | | | | — | | | | 19,072 | # | | | 2,959 | | | | — | | | | — | |
| | | | — | | | | — | | | | — | | | | 2,516 | | | | (18 | ) | | | — | | | | (22 | ) |
| | | | | | | | | | | | | | | | | | | | | | | | | | | | | |
| | | | | | | | | | | | | | | | | | | | | | | | | | | | | |
| | | | 51 | | | | (5,675 | ) | | | (10 | ) | | | 10,776 | | | | 4,029 | | | | 724 | | | | (12,481 | ) |
| | | | | | | | | | | | | | | | | | | | | | | | | | | | | |
| | | | | | | | | | | | | | | | | | | | | | | | | | | | | |
| | | | | | | | | | | | | | | | | | | | | | | | | | | | | |
| | | | (813 | ) | | | (4,741 | ) | | | (434 | ) | | | (14,542 | ) | | | (4,540 | ) | | | (31,379 | ) | | | (41,556 | ) |
| | | | | | | | | | | | | | | | | | | | | | | | | | | | | |
| | | | — | | | | — | | | | — | | | | (3,674 | ) | | | (510 | ) | | | — | | | | — | |
| | | | | | | | | | | | | | | | | | | | | | | | | | | | | |
| | | | — | | | | — | | | | — | | | | (231 | ) | | | — | | | | — | | | | (39 | ) |
| | | | | | | | | | | | | | | | | | | | | | | | | | | | | |
| | | | | | | | | | | | | | | | | | | | | | | | | | | | | |
| | | | (813 | ) | | | (4,741 | ) | | | (434 | ) | | | (18,447 | ) | | | (5,050 | ) | | | (31,379 | ) | | | (41,595 | ) |
| | | | | | | | | | | | | | | | | | | | | | | | | | | | | |
| | | | | | | | | | | | | | | | | | | | | | | | | | | | | |
| | | | (762 | ) | | | (10,416 | ) | | | (444 | ) | | | (7,671 | ) | | | (1,021 | ) | | | (30,655 | ) | | | (54,076 | ) |
| | | | | | | | | | | | | | | | | | | | | | | | | | | | | |
| | | $ | — | | | $ | (6,022 | ) | | $ | (136 | ) | | $ | 21,962 | | | $ | 3,856 | | | $ | (27,510 | ) | | $ | (53,309 | ) |
| | | | | | | | | | | | | | | | | | | | | | | | | | | | | |
317
The Hartford Mutual Funds, Inc. and The Hartford Mutual Funds II, Inc.
Statement of Changes in Net Assets
(000’s Omitted)
| | | | | | | | | | | | | | | | | |
| | | Advisers
| | | Balanced Allocation
| |
| | | Fund | | | Fund | |
| | | For the
| | | | | | For the
| | | | |
| | | Six-Month
| | | | | | Six-Month
| | | | |
| | | Period Ended
| | | For the
| | | Period Ended
| | | For the
| |
| | | April 30, 2008
| | | Year Ended
| | | April 30, 2008
| | | Year Ended
| |
| | | (Unaudited) | | | October 31, 2007 | | | (Unaudited) | | | October 31, 2007 | |
Operations: | | | | | | | | | | | | | | | | |
| Net investment income (loss) | | $ | 10,470 | | | $ | 23,390 | | | $ | 10,177 | | | $ | 15,407 | |
| Net realized gain (loss) on investments, futures, options and swap contracts and foreign currency transactions | | | (9,279 | ) | | | 172,391 | | | | 41,691 | | | | 49,799 | |
| Net unrealized appreciation (depreciation) of investments, futures, options and swap contracts and foreign currency transactions | | | (113,225 | ) | | | 2,117 | | | | (103,904 | ) | | | 51,767 | |
| Payment from affiliate | | | — | | | | 1,265 | | | | — | | | | — | |
| | | | | | | | | | | | | | | | | |
| Net increase (decrease) in net assets resulting from operations | | | (112,034 | ) | | | 199,163 | | | | (52,036 | ) | | | 116,973 | |
| | | | | | | | | | | | | | | | | |
| | | | | | | | | | | | | | | | | |
Distributions to Shareholders: | | | | | | | | | | | | | | | | |
| From net investment income | | | | | | | | | | | | | | | | |
| Class A | | | (8,207 | ) | | | (19,328 | ) | | | (18,556 | ) | | | (15,079 | ) |
| Class B | | | (805 | ) | | | (2,614 | ) | | | (3,543 | ) | | | (2,566 | ) |
| Class C | | | (877 | ) | | | (2,237 | ) | | | (6,050 | ) | | | (4,197 | ) |
| Class E (L) | | | — | | | | — | | | | — | | | | — | |
| Class H (L) | | | — | | | | — | | | | — | | | | — | |
| Class I | | | — | | | | — | | | | (49 | ) | | | (27 | ) |
| Class L | | | — | | | | — | | | | — | | | | — | |
| Class M (L) | | | — | | | | — | | | | — | | | | — | |
| Class N (L) | | | — | | | | — | | | | — | | | | — | |
| Class R3 | | | — | | | | — | | | | (6 | ) | | | (1 | ) |
| Class R4 | | | (1 | ) | | | — | | | | (111 | ) | | | (8 | ) |
| Class R5 | | | — | | | | — | | | | (37 | ) | | | (4 | ) |
| Class Y | | | (199 | ) | | | (418 | ) | | | — | | | | — | |
From net realized gain on investments | | | | | | | | | | | | | | | | |
| Class A | | | (116,370 | ) | | | (6,251 | ) | | | (26,812 | ) | | | (10,441 | ) |
| Class B | | | (26,714 | ) | | | (1,942 | ) | | | (5,971 | ) | | | (2,511 | ) |
| Class C | | | (22,170 | ) | | | (1,238 | ) | | | (9,928 | ) | | | (3,938 | ) |
| Class E (L) | | | — | | | | — | | | | — | | | | — | |
| Class H (L) | | | — | | | | — | | | | — | | | | — | |
| Class I | | | — | | | | — | | | | (41 | ) | | | (8 | ) |
| Class L | | | — | | | | — | | | | — | | | | — | |
| Class M (L) | | | — | | | | — | | | | — | | | | — | |
| Class N (L) | | | — | | | | — | | | | — | | | | — | |
| Class R3 | | | (1 | ) | | | — | | | | (5 | ) | | | — | |
| Class R4 | | | (6 | ) | | | — | | | | (145 | ) | | | — | |
| Class R5 | | | (1 | ) | | | — | | | | (32 | ) | | | — | |
| Class Y | | | (2,135 | ) | | | (99 | ) | | | — | | | | — | |
| Class Z (L) | | | — | | | | — | | | | — | | | | — | |
| | | | | | | | | | | | | | | | | |
| Total distributions | | | (177,486 | ) | | | (34,127 | ) | | | (71,286 | ) | | | (38,780 | ) |
| | | | | | | | | | | | | | | | | |
| | | | | | | | | | | | | | | | | |
Capital Share Transactions: | | | | | | | | | | | | | | | | |
| Class A | | | 49,125 | | | | (133,135 | ) | | | 78,877 | | | | 106,188 | |
| Class B | | | (17,071 | ) | | | (124,064 | ) | | | 12,478 | | | | 15,343 | |
| Class C | | | 3,149 | | | | (34,409 | ) | | | 26,809 | | | | 35,931 | |
| Class E (L) | | | — | | | | — | | | | — | | | | — | |
| Class H (L) | | | — | | | | — | | | | — | | | | — | |
| Class I | | | — | | | | — | | | | 2,319 | | | | 499 | |
| Class L | | | — | | | | — | | | | — | | | | — | |
| Class M (L) | | | — | | | | — | | | | — | | | | — | |
| Class N (L) | | | — | | | | — | | | | — | | | | — | |
| Class R3 | | | 4 | | | | 10 | | | | 405 | | | | 110 | |
| Class R4 | | | 151 | | | | 52 | | | | 5,201 | | | | 2,595 | |
| Class R5 | | | 1 | | | | 10 | | | | 2,240 | | | | 691 | |
| Class Y | | | 441 | | | | 317 | | | | — | | | | — | |
| Class Z (L) | | | — | | | | — | | | | — | | | | — | |
| | | | | | | | | | | | | | | | | |
| Net increase (decrease) from capital share transactions | | | 35,800 | | | | (291,219 | ) | | | 128,329 | | | | 161,357 | |
| | | | | | | | | | | | | | | | | |
| Net increase (decrease) in net assets | | | (253,720 | ) | | | (126,183 | ) | | | 5,007 | | | | 239,550 | |
| | | | | | | | | | | | | | | | | |
Net Assets: | | | | | | | | | | | | | | | | |
| Beginning of period | | | 1,563,203 | | | | 1,689,386 | | | | 973,585 | | | | 734,035 | |
| | | | | | | | | | | | | | | | | |
| End of period | | $ | 1,309,483 | | | $ | 1,563,203 | | | $ | 978,592 | | | $ | 973,585 | |
| | | | | | | | | | | | | | | | | |
| Accumulated undistributed (distribution in excess of) net investment income | | $ | 2,421 | | | $ | 2,040 | | | $ | (16,982 | ) | | $ | 1,193 | |
| | | | | | | | | | | | | | | | | |
| | |
| ** | | Commencement of operations. |
| (L) | | Classes H, M and N were merged into Class L and Class E and Class Z were merged into Class Y on February 9, 2007. Please refer to Note 8 in the Notes to Financials for further details. |
The accompanying notes are an integral part of these financial statements.
318
| | | | | | | | | | | | | | | | | | | | | | | | | | | | | | | | | |
| | | Balanced Income
| | | Capital Appreciation
| | | Capital Appreciation II
| | | Checks and Balances
| |
| | | Fund | | | Fund | | | Fund | | | Fund | |
| | | For the
| | | | | | For the
| | | | | | For the
| | | | | | For the
| | | For the
| |
| | | Six-Month
| | | | | | Six-Month
| | | | | | Six-Month
| | | | | | Six-Month
| | | Period
| |
| | | Period Ended
| | | For the
| | | Period Ended
| | | For the
| | | Period Ended
| | | For the
| | | Period Ended
| | | May 31, 2007 **
| |
| | | April 30, 2008
| | | Year Ended
| | | April 30, 2008
| | | Year Ended
| | | April 30, 2008
| | | Year Ended
| | | April 30, 2008
| | | through
| |
| | | (Unaudited) | | | October 31, 2007 | | | (Unaudited) | | | October 31, 2007 | | | (Unaudited) | | | October 31, 2007 | | | (Unaudited) | | | October 31, 2007 | |
| | | | | | | | | | | | | | | | | | | | | | | | | | | | | | | | | |
| | | $ | 972 | | | $ | 975 | | | $ | 16,445 | | | $ | 30,020 | | | $ | (220 | ) | | $ | (2,086 | ) | | $ | 3,931 | | | $ | 641 | |
| | | | (424 | ) | | | 203 | | | | 492,463 | | | | 1,862,223 | | | | (13,753 | ) | | | 100,180 | | | | 11,822 | | | | — | |
| | | | (1,993 | ) | | | 1,146 | | | | (2,159,936 | ) | | | 2,292,940 | | | | (188,778 | ) | | | 140,398 | | | | (19,845 | ) | | | 8,145 | |
| | | | — | | | | — | | | | — | | | | 5,181 | | | | — | | | | — | | | | — | | | | — | |
| | | | | | | | | | | | | | | | | | | | | | | | | | | | | | | | | |
| | | | (1,445 | ) | | | 2,324 | | | | (1,651,028 | ) | | | 4,190,364 | | | | (202,751 | ) | | | 238,492 | | | | (4,092 | ) | | | 8,786 | |
| | | | | | | | | | | | | | | | | | | | | | | | | | | | | | | | | |
| | | | | | | | | | | | | | | | | | | | | | | | | | | | | | | | | |
| | | | | | | | | | | | | | | | | | | | | | | | | | | | | | | | | |
| | | | | | | | | | | | | | | | | | | | | | | | | | | | | | | | | |
| | | | (790 | ) | | | (786 | ) | | | — | | | | (33,636 | ) | | | — | | | | — | | | | (4,330 | ) | | | (374 | ) |
| | | | (33 | ) | | | (30 | ) | | | — | | | | — | | | | — | | | | — | | | | (387 | ) | | | (30 | ) |
| | | | (70 | ) | | | (50 | ) | | | — | | | | — | | | | — | | | | — | | | | (1,132 | ) | | | (79 | ) |
| | | | — | | | | — | | | | — | | | | — | | | | — | | | | — | | | | — | �� | | | — | |
| | | | — | | | | — | | | | — | | | | — | | | | — | | | | — | | | | — | | | | — | |
| | | | — | | | | — | | | | — | | | | (197 | ) | | | — | | | | — | | | | (1 | ) | | | — | |
| | | | — | | | | — | | | | — | | | | — | | | | — | | | | — | | | | — | | | | — | |
| | | | — | | | | — | | | | — | | | | — | | | | — | | | | — | | | | — | | | | — | |
| | | | — | | | | — | | | | — | | | | — | | | | — | | | | — | | | | — | | | | — | |
| | | | — | | | | — | | | | — | | | | — | | | | — | | | | — | | | | — | | | | — | |
| | | | — | | | | — | | | | — | | | | — | | | | — | | | | — | | | | — | | | | — | |
| | | | — | | | | — | | | | — | | | | — | | | | — | | | | — | | | | — | | | | — | |
| | | | (2 | ) | | | (4 | ) | | | — | | | | (4,697 | ) | | | — | | | | — | | | | — | | | | — | |
| | | | | | | | | | | | | | | | | | | | | | | | | | | | | | | | | |
| | | | (167 | ) | | | — | | | | (1,110,145 | ) | | | (715,257 | ) | | | (57,297 | ) | | | (5,732 | ) | | | — | | | | — | |
| | | | (10 | ) | | | — | | | | (197,872 | ) | | | (156,558 | ) | | | (7,516 | ) | | | (710 | ) | | | — | | | | — | |
| | | | (18 | ) | | | — | | | | (395,137 | ) | | | (249,010 | ) | | | (29,945 | ) | | | (2,391 | ) | | | — | | | | — | |
| | | | — | | | | — | | | | — | | | | — | | | | — | | | | — | | | | — | | | | — | |
| | | | — | | | | — | | | | — | | | | — | | | | — | | | | — | | | | — | | | | — | |
| | | | — | | | | — | | | | (13,451 | ) | | | (501 | ) | | | (6,004 | ) | | | (201 | ) | | | — | | | | — | |
| | | | — | | | | — | | | | — | | | | — | | | | — | | | | — | | | | — | | | | — | |
| | | | — | | | | — | | | | — | | | | — | | | | — | | | | — | | | | — | | | | — | |
| | | | — | | | | — | | | | — | | | | — | | | | — | | | | — | | | | — | | | | — | |
| | | | — | | | | — | | | | (3 | ) | | | — | | | | (33 | ) | | | — | | | | — | | | | — | |
| | | | — | | | | — | | | | (1,432 | ) | | | — | | | | (1 | ) | | | — | | | | — | | | | — | |
| | | | — | | | | — | | | | (353 | ) | | | — | | | | (12 | ) | | | — | | | | — | | | | — | |
| | | | — | | | | — | | | | (79,569 | ) | | | (35,768 | ) | | | (11 | ) | | | (3 | ) | | | — | | | | — | |
| | | | — | | | | — | | | | — | | | | — | | | | — | | | | — | | | | — | | | | — | |
| | | | | | | | | | | | | | | | | | | | | | | | | | | | | | | | | |
| | | | (1,090 | ) | | | (870 | ) | | | (1,797,962 | ) | | | (1,195,624 | ) | | | (100,819 | ) | | | (9,037 | ) | | | (5,850 | ) | | | (483 | ) |
| | | | | | | | | | | | | | | | | | | | | | | | | | | | | | | | | |
| | | | | | | | | | | | | | | | | | | | | | | | | | | | | | | | | |
| | | | | | | | | | | | | | | | | | | | | | | | | | | | | | | | | |
| | | | 9,693 | | | | 27,689 | | | | 2,367,940 | | | | 2,431,543 | | | | 180,589 | | | | 443,858 | | | | 331,915 | | | | 166,707 | |
| | | | 517 | | | | 1,922 | | | | 76,446 | | | | 41,383 | | | | 22,649 | | | | 58,670 | | | | 45,004 | | | | 19,089 | |
| | | | 1,483 | | | | 3,761 | | | | 655,872 | | | | 850,051 | | | | 110,227 | | | | 253,343 | | | | 119,262 | | | | 53,328 | |
| | | | — | | | | — | | | | — | | | | — | | | | — | | | | — | | | | — | | | | — | |
| | | | — | | | | — | | | | — | | | | — | | | | — | | | | — | | | | — | | | | — | |
| | | | — | | | | — | | | | 121,069 | | | | 132,728 | | | | 36,763 | | | | 69,323 | | | | 873 | | | | — | |
| | | | — | | | | — | | | | — | | | | — | | | | — | | | | — | | | | — | | | | — | |
| | | | — | | | | — | | | | — | | | | — | | | | — | | | | — | | | | — | | | | — | |
| | | | — | | | | — | | | | — | | | | — | | | | — | | | | — | | | | — | | | | — | |
| | | | — | | | | — | | | | 436 | | | | 34 | | | | 4,042 | | | | 386 | | | | — | | | | — | |
| | | | — | | | | — | | | | 34,078 | | | | 14,997 | | | | 1,230 | | | | 11 | | | | — | | | | — | |
| | | | — | | | | — | | | | 21,288 | | | | 1,139 | | | | 121 | | | | 121 | | | | — | | | | — | |
| | | | 2 | | | | 4 | | | | 378,911 | | | | 479,269 | | | | 15,544 | | | | 3 | | | | — | | | | — | |
| | | | — | | | | — | | | | — | | | | — | | | | — | | | | — | | | | — | | | | — | |
| | | | | | | | | | | | | | | | | | | | | | | | | | | | | | | | | |
| | | | 11,695 | | | | 33,376 | | | | 3,656,040 | | | | 3,951,144 | | | | 371,165 | | | | 825,715 | | | | 497,054 | | | | 239,124 | |
| | | | | | | | | | | | | | | | | | | | | | | | | | | | | | | | | |
| | | | 9,160 | | | | 34,830 | | | | 207,050 | | | | 6,945,884 | | | | 67,595 | | | | 1,055,170 | | | | 487,112 | | | | 247,427 | |
| | | | | | | | | | | | | | | | | | | | | | | | | | | | | | | | | |
| | | | | | | | | | | | | | | | | | | | | | | | | | | | | | | | | |
| | | | 47,152 | | | | 12,322 | | | | 21,514,933 | | | | 14,569,049 | | | | 1,426,690 | | | | 371,520 | | | | 247,427 | | | | — | |
| | | | | | | | | | | | | | | | | | | | | | | | | | | | | | | | | |
| | | $ | 56,312 | | | $ | 47,152 | | | $ | 21,721,983 | | | $ | 21,514,933 | | | $ | 1,494,285 | | | $ | 1,426,690 | | | $ | 734,539 | | | $ | 247,427 | |
| | | | | | | | | | | | | | | | | | | | | | | | | | | | | | | | | |
| | | $ | 224 | | | $ | 147 | | | $ | 97,852 | | | $ | 81,407 | | | $ | (908 | ) | | $ | (688 | ) | | $ | (1,699 | ) | | $ | 220 | |
| | | | | | | | | | | | | | | | | | | | | | | | | | | | | | | | | |
319
The Hartford Mutual Funds, Inc. and The Hartford Mutual Funds II, Inc.
Statement of Changes in Net Assets — (continued)
(000’s Omitted)
| | | | | | | | | | | | | | | | | |
| | | Conservative Allocation
| | | Disciplined Equity
| |
| | | Fund | | | Fund | |
| | | For the
| | | | | | For the
| | | | |
| | | Six-Month
| | | | | | Six-Month
| | | | |
| | | Period Ended
| | | For the
| | | Period Ended
| | | For the
| |
| | | April 30, 2008
| | | Year Ended
| | | April 30, 2008
| | | Year Ended
| |
| | | (Unaudited) | | | October 31, 2007 | | | (Unaudited) | | | October 31, 2007 | |
Operations: | | | | | | | | | | | | | | | | |
| Net investment income (loss) | | $ | 2,769 | | | $ | 4,618 | | | $ | 569 | | | $ | 1,252 | |
| Net realized gain (loss) on investments, futures, options and swap contracts and foreign currency transactions | | | 4,878 | | | | 7,548 | | | | 367 | | | | 50,332 | |
| Net unrealized appreciation (depreciation) of investments, futures, options and swap contracts and foreign currency transactions | | | (13,807 | ) | | | 5,004 | | | | (36,954 | ) | | | (6,869 | ) |
| Payment from affiliate | | | — | | | | — | | | | — | | | | 292 | |
| | | | | | | | | | | | | | | | | |
| Net increase (decrease) in net assets resulting from operations | | | (6,160 | ) | | | 17,170 | | | | (36,018 | ) | | | 45,007 | |
| | | | | | | | | | | | | | | | | |
| | | | | | | | | | | | | | | | | |
Distributions to Shareholders: | | | | | | | | | | | | | | | | |
| From net investment income | | | | | | | | | | | | | | | | |
| Class A | | | (3,072 | ) | | | (3,533 | ) | | | (266 | ) | | | (1,382 | ) |
| Class B | | | (547 | ) | | | (622 | ) | | | — | | | | (40 | ) |
| Class C | | | (1,070 | ) | | | (1,157 | ) | | | — | | | | (19 | ) |
| Class E (L) | | | — | | | | — | | | | — | | | | — | |
| Class H (L) | | | — | | | | — | | | | — | | | | — | |
| Class I | | | (36 | ) | | | (54 | ) | | | — | | | | — | |
| Class L | | | — | | | | — | | | | — | | | | — | |
| Class M (L) | | | — | | | | — | �� | | | — | | | | — | |
| Class N (L) | | | — | | | | — | | | | — | | | | — | |
| Class R3 | | | — | | | | — | | | | — | | | | — | |
| Class R4 | | | (55 | ) | | | (2 | ) | | | — | | | | — | |
| Class R5 | | | (19 | ) | | | (2 | ) | | | — | | | | — | |
| Class Y | | | — | | | | — | | | | (754 | ) | | | (659 | ) |
| From net realized gain on investments | | | | | | | | | | | | | | | | |
| Class A | | | (4,167 | ) | | | (2,432 | ) | | | — | | | | — | |
| Class B | | | (882 | ) | | | (541 | ) | | | — | | | | — | |
| Class C | | | (1,608 | ) | | | (933 | ) | | | — | | | | — | |
| Class E (L) | | | — | | | | — | | | | — | | | | — | |
| Class H (L) | | | — | | | | — | | | | — | | | | — | |
| Class I | | | (57 | ) | | | — | | | | — | | | | — | |
| Class L | | | — | | | | — | | | | — | | | | — | |
| Class M (L) | | | — | | | | — | | | | — | | | | — | |
| Class N (L) | | | — | | | | — | | | | — | | | | — | |
| Class R3 | | | (1 | ) | | | — | | | | — | | | | — | |
| Class R4 | | | (22 | ) | | | — | | | | — | | | | — | |
| Class R5 | | | (22 | ) | | | — | | | | — | | | | — | |
| Class Y | | | — | | | | — | | | | — | | | | — | |
| Class Z (L) | | | — | | | | — | | | | — | | | | — | |
| | | | | | | | | | | | | | | | | |
| Total distributions | | | (11,558 | ) | | | (9,276 | ) | | | (1,020 | ) | | | (2,100 | ) |
| | | | | | | | | | | | | | | | | |
| | | | | | | | | | | | | | | | | |
Capital Share Transactions: | | | | | | | | | | | | | | | | |
| Class A | | | 20,420 | | | | 23,133 | | | | (12,839 | ) | | | (34,732 | ) |
| Class B | | | 2,724 | | | | 4,085 | | | | (5,502 | ) | | | (9,835 | ) |
| Class C | | | 10,102 | | | | 8,445 | | | | (1,883 | ) | | | (6,068 | ) |
| Class E (L) | | | — | | | | — | | | | — | | | | — | |
| Class H (L) | | | — | | | | — | | | | — | | | | — | |
| Class I | | | (741 | ) | | | 1,372 | | | | — | | | | — | |
| Class L | | | — | | | | — | | | | — | | | | — | |
| Class M (L) | | | — | | | | — | | | | — | | | | — | |
| Class N (L) | | | — | | | | — | | | | — | | | | — | |
| Class R3 | | | 2 | | | | 19 | | | | 1 | | | | 10 | |
| Class R4 | | | 5,520 | | | | 419 | | | | — | | | | 10 | |
| Class R5 | | | 1,254 | | | | 684 | | | | — | | | | 10 | |
| Class Y | | | — | | | | — | | | | 1,744 | | | | (71,369 | ) |
| Class Z (L) | | | — | | | | — | | | | — | | | | — | |
| | | | | | | | | | | | | | | | | |
| Net increase (decrease) from capital share transactions | | | 39,281 | | | | 38,157 | | | | (18,479 | ) | | | (121,974 | ) |
| | | | | | | | | | | | | | | | | |
| Net increase (decrease) in net assets | | | 21,563 | | | | 46,051 | | | | (55,517 | ) | | | (79,067 | ) |
| | | | | | | | | | | | | | | | | |
Net Assets: | | | | | | | | | | | | | | | | |
| Beginning of period | | | 196,470 | | | | 150,419 | | | | 344,748 | | | | 423,815 | |
| | | | | | | | | | | | | | | | | |
| End of period | | $ | 218,033 | | | $ | 196,470 | | | $ | 289,231 | | | $ | 344,748 | |
| | | | | | | | | | | | | | | | | |
| Accumulated undistributed (distribution in excess of) net investment income | | $ | (1,607 | ) | | $ | 423 | | | $ | 235 | | | $ | 686 | |
| | | | | | | | | | | | | | | | | |
| | |
| (L) | | Classes H, M and N were merged into Class L and Class E and Class Z were merged into Class Y on February 9, 2007. Please refer to Note 8 in the Notes to Financials for further details. |
The accompanying notes are an integral part of these financial statements.
320
| | | | | | | | | | | | | | | | | | | | | | | | | | | | | | | | | |
| | | Dividend and Growth
| | | Equity Growth Allocation
| | | Equity Income
| | | Floating Rate
| |
| | | Fund | | | Fund | | | Fund | | | Fund | |
| | | For the
| | | | | | For the
| | | | | | For the
| | | | | | For the
| | | | |
| | | Six-Month
| | | | | | Six-Month
| | | | | | Six-Month
| | | | | | Six-Month
| | | | |
| | | Period Ended
| | | For the
| | | Period Ended
| | | For the
| | | Period Ended
| | | For the
| | | Period Ended
| | | For the
| |
| | | April 30, 2008
| | | Year Ended
| | | April 30, 2008
| | | Year Ended
| | | April 30, 2008
| | | Year Ended
| | | April 30, 2008
| | | Year Ended
| |
| | | (Unaudited) | | | October 31, 2007 | | | (Unaudited) | | | October 31, 2007 | | | (Unaudited) | | | October 31, 2007 | | | (Unaudited) | | | October 31, 2007 | |
| | | | | | | | | | | | | | | | | | | | | | | | | | | | | | | | | |
| | | $ | 28,143 | | | $ | 46,424 | | | $ | 380 | | | $ | (828 | ) | | $ | 11,013 | | | $ | 16,868 | | | $ | 108,015 | | | $ | 258,356 | |
| | | | 105,299 | | | | 229,113 | | | | 22,293 | | | | 21,836 | | | | 3,455 | | | | 26,554 | | | | (110,404 | ) | | | (48,190 | ) |
| | | | (410,413 | ) | | | 287,647 | | | | (53,173 | ) | | | 28,992 | | | | (87,595 | ) | | | 75,895 | | | | (179,003 | ) | | | (133,017 | ) |
| | | | — | | | | 1,018 | | | | — | | | | — | | | | — | | | | — | | | | — | | | | — | |
| | | | | | | | | | | | | | | | | | | | | | | | | | | | | | | | | |
| | | | (276,971 | ) | | | 564,202 | | | | (30,500 | ) | | | 50,000 | | | | (73,127 | ) | | | 119,317 | | | | (181,392 | ) | | | 77,149 | |
| | | | | | | | | | | | | | | | | | | | | | | | | | | | | | | | | |
| | | | | | | | | | | | | | | | | | | | | | | | | | | | | | | | | |
| | | | | | | | | | | | | | | | | | | | | | | | | | | | | | | | | |
| | | | | | | | | | | | | | | | | | | | | | | | | | | | | | | | | |
| | | | (22,216 | ) | | | (37,212 | ) | | | (6,891 | ) | | | (2,190 | ) | | | (8,256 | ) | | | (12,051 | ) | | | (46,970 | ) | | | (136,560 | ) |
| | | | (1,026 | ) | | | (1,617 | ) | | | (1,544 | ) | | | (428 | ) | | | (332 | ) | | | (495 | ) | | | (1,754 | ) | | | (3,576 | ) |
| | | | (1,212 | ) | | | (1,949 | ) | | | (2,397 | ) | | | (664 | ) | | | (483 | ) | | | (767 | ) | | | (43,156 | ) | | | (89,045 | ) |
| | | | — | | | | — | | | | — | | | | — | | | | — | | | | — | | | | — | | | | — | |
| | | | — | | | | — | | | | — | | | | — | | | | — | | | | — | | | | — | | | | — | |
| | | | (30 | ) | | | (14 | ) | | | (8 | ) | | | — | | | | (12 | ) | | | (13 | ) | | | (10,017 | ) | | | (26,124 | ) |
| | | | — | | | | — | | | | — | | | | — | | | | — | | | | — | | | | — | | | | — | |
| | | | — | | | | — | | | | — | | | | — | | | | — | | | | — | | | | — | | | | — | |
| | | | — | | | | — | | | | — | | | | — | | | | — | | | | — | | | | — | | | | — | |
| | | | (1 | ) | | | — | | | | (33 | ) | | | — | | | | (1 | ) | | | — | | | | (13 | ) | | | (4 | ) |
| | | | (30 | ) | | | (1 | ) | | | (40 | ) | | | — | | | | — | | | | — | | | | (9 | ) | | | (1 | ) |
| | | | (2 | ) | | | — | | | | (4 | ) | | | — | | | | — | | | | — | | | | (6 | ) | | | (6 | ) |
| | | | (2,963 | ) | | | (2,241 | ) | | | — | | | | — | | | | (1,642 | ) | | | (2,902 | ) | | | (3,431 | ) | | | (5,224 | ) |
| | | | | | | | | | | | | | | | | | | | | | | | | | | | | | | | | |
| | | | (173,551 | ) | | | (164,850 | ) | | | (10,090 | ) | | | (2,496 | ) | | | (19,859 | ) | | | (20,565 | ) | | | — | | | | — | |
| | | | (21,507 | ) | | | (23,203 | ) | | | (2,786 | ) | | | (715 | ) | | | (1,368 | ) | | | (1,677 | ) | | | — | | | | — | |
| | | | (19,864 | ) | | | (20,178 | ) | | | (4,315 | ) | | | (1,115 | ) | | | (1,893 | ) | | | (2,383 | ) | | | — | | | | — | |
| | | | — | | | | — | | | | — | | | | — | | | | — | | | | — | | | | — | | | | — | |
| | | | — | | | | — | | | | — | | | | — | | | | — | | | | — | | | | — | | | | — | |
| | | | (129 | ) | | | (2 | ) | | | (4 | ) | | | — | | | | (24 | ) | | | (4 | ) | | | — | | | | — | |
| | | | — | | | | — | | | | — | | | | — | | | | — | | | | — | | | | — | | | | — | |
| | | | — | | | | — | | | | — | | | | — | | | | — | | | | — | | | | — | | | | — | |
| | | | — | | | | — | | | | — | | | | — | | | | — | | | | — | | | | — | | | | — | |
| | | | (9 | ) | | | — | | | | (55 | ) | | | — | | | | (3 | ) | | | — | | | | — | | | | — | |
| | | | (106 | ) | | | — | | | | (47 | ) | | | — | | | | — | | | | — | | | | — | | | | — | |
| | | | (10 | ) | | | — | | | | (4 | ) | | | — | | | | — | | | | — | | | | — | | | | — | |
| | | | (14,212 | ) | | | (7,549 | ) | | | — | | | | — | | | | (3,379 | ) | | | (1,849 | ) | | | — | | | | — | |
| | | | — | | | | — | | | | — | | | | — | | | | — | | | | — | | | | — | | | | — | |
| | | | | | | | | | | | | | | | | | | | | | | | | | | | | | | | | |
| | | | (256,868 | ) | | | (258,816 | ) | | | (28,218 | ) | | | (7,608 | ) | | | (37,252 | ) | | | (42,706 | ) | | | (105,356 | ) | | | (260,540 | ) |
| | | | | | | | | | | | | | | | | | | | | | | | | | | | | | | | | |
| | | | | | | | | | | | | | | | | | | | | | | | | | | | | | | | | |
| | | | | | | | | | | | | | | | | | | | | | | | | | | | | | | | | |
| | | | 251,017 | | | | 372,656 | | | | 31,232 | | | | 32,237 | | | | 53,065 | | | | 174,908 | | | | (692,263 | ) | | | 584,619 | |
| | | | (5,150 | ) | | | 167 | | | | 6,154 | | | | 7,666 | | | | (593 | ) | | | 5,152 | | | | (9,038 | ) | | | 31,641 | |
| | | | 8,055 | | | | 21,475 | | | | 9,005 | | | | 11,542 | | | | (3,645 | ) | | | 5,519 | | | | (427,964 | ) | | | 1,110,429 | |
| | | | — | | | | — | | | | — | | | | — | | | | — | | | | — | | | | — | | | | — | |
| | | | — | | | | — | | | | — | | | | — | | | | — | | | | — | | | | — | | | | — | |
| | | | 3,635 | | | | 1,802 | | | | 435 | | | | 43 | | | | 122 | | | | 750 | | | | (138,292 | ) | | | 366,570 | |
| | | | — | | | | — | | | | — | | | | — | | | | — | | | | — | | | | — | | | | — | |
| | | | — | | | | — | | | | — | | | | — | | | | — | | | | — | | | | — | | | | — | |
| | | | — | | | | — | | | | — | | | | — | | | | — | | | | — | | | | — | | | | — | |
| | | | 89 | | | | 168 | | | | 70 | | | | 910 | | | | 17 | | | | 93 | | | | 262 | | | | 290 | |
| | | | 4,943 | | | | 1,991 | | | | 2,172 | | | | 418 | | | | 1 | | | | 10 | | | | 574 | | | | 11 | |
| | | | 121 | | | | 193 | | | | 1,020 | | | | 70 | | | | — | | | | 10 | | | | 1 | | | | 211 | |
| | | | 230,887 | | | | 110,477 | | | | — | | | | — | | | | 10,342 | | | | 110,119 | | | | 18,152 | | | | 56,559 | |
| | | | ��� | | | | — | | | | — | | | | — | | | | — | | | | — | | | | — | | | | — | |
| | | | | | | | | | | | | | | | | | | | | | | | | | | | | | | | | |
| | | | 493,597 | | | | 508,929 | | | | 50,088 | | | | 52,886 | | | | 59,309 | | | | 296,561 | | | | (1,248,568 | ) | | | 2,150,330 | |
| | | | | | | | | | | | | | | | | | | | | | | | | | | | | | | | | |
| | | | (40,242 | ) | | | 814,315 | | | | (8,630 | ) | | | 95,278 | | | | (51,070 | ) | | | 373,172 | | | | (1,535,316 | ) | | | 1,966,939 | |
| | | | | | | | | | | | | | | | | | | | | | | | | | | | | | | | | |
| | | | | | | | | | | | | | | | | | | | | | | | | | | | | | | | | |
| | | | 4,257,153 | | | | 3,442,838 | | | | 296,718 | | | | 201,440 | | | | 1,015,305 | | | | 642,133 | | | | 4,451,126 | | | | 2,484,187 | |
| | | | | | | | | | | | | | | | | | | | | | | | | | | | | | | | | |
| | | $ | 4,216,911 | | | $ | 4,257,153 | | | $ | 288,088 | | | $ | 296,718 | | | $ | 964,235 | | | $ | 1,015,305 | | | $ | 2,915,810 | | | $ | 4,451,126 | |
| | | | | | | | | | | | | | | | | | | | | | | | | | | | | | | | | |
| | | $ | 5,190 | | | $ | 4,527 | | | $ | (10,537 | ) | | $ | — | | | $ | 1,576 | | | $ | 1,289 | | | $ | 4,406 | | | $ | 1,747 | |
| | | | | | | | | | | | | | | | | | | | | | | | | | | | | | | | | |
321
The Hartford Mutual Funds, Inc. and The Hartford Mutual Funds II, Inc.
Statement of Changes in Net Assets — (continued)
(000’s Omitted)
| | | | | | | | | | | | | | | | | |
| | | Fundamental Growth
| | | Global Communications
| |
| | | Fund | | | Fund | |
| | | For the
| | | | | | For the
| | | | |
| | | Six-Month
| | | | | | Six-Month
| | | | |
| | | Period Ended
| | | For the
| | | Period Ended
| | | For the
| |
| | | April 30, 2008
| | | Year Ended
| | | April 30, 2008
| | | Year Ended
| |
| | | (Unaudited) | | | October 31, 2007 | | | (Unaudited) | | | October 31, 2007 | |
Operations: | | | | | | | | | | | | | | | | |
| Net investment income (loss) | | $ | (130 | ) | | $ | (381 | ) | | $ | 269 | | | $ | 22 | |
| Net realized gain (loss) on investments, futures, options and swap contracts and foreign currency transactions | | | (1,035 | ) | | | 8,960 | | | | 125 | | | | 1,784 | |
| Net unrealized appreciation (depreciation) of investments, futures, options and swap contracts and foreign currency transactions | | | (2,927 | ) | | | 6,222 | | | | (5,268 | ) | | | 10,286 | |
| Payment from affiliate | | | — | | | | 193 | | | | — | | | | 6 | |
| | | | | | | | | | | | | | | | | |
| Net increase (decrease) in net assets resulting from operations | | | (4,092 | ) | | | 14,994 | | | | (4,874 | ) | | | 12,098 | |
| | | | | | | | | | | | | | | | | |
| | | | | | | | | | | | | | | | | |
Distributions to Shareholders: | | | | | | | | | | | | | | | | |
| From net investment income | | | | | | | | | | | | | | | | |
| Class A | | | — | | | | — | | | | (31 | ) | | | (304 | ) |
| Class B | | | — | | | | — | | | | — | | | | (61 | ) |
| Class C | | | — | | | | — | | | | — | | | | (78 | ) |
| Class E (L) | | | — | | | | — | | | | — | | | | — | |
| Class H (L) | | | — | | | | — | | | | — | | | | — | |
| Class I | | | — | | | | — | | | | — | | | | — | |
| Class L | | | — | | | | — | | | | — | | | | — | |
| Class M (L) | | | — | | | | — | | | | — | | | | — | |
| Class N (L) | | | — | | | | — | | | | — | | | | — | |
| Class R3 | | | — | | | | — | | | | — | | | | — | |
| Class R4 | | | — | | | | — | | | | — | | | | — | |
| Class R5 | | | — | | | | — | | | | — | | | | — | |
| Class Y | | | — | | | | — | | | | (9 | ) | | | (20 | ) |
| From net realized gain on investments | | | | | | | | | | | | | | | | |
| Class A | | | (4,325 | ) | | | — | | | | (1,352 | ) | | | (50 | ) |
| Class B | | | (1,393 | ) | | | — | | | | (282 | ) | | | (12 | ) |
| Class C | | | (1,555 | ) | | | — | | | | (502 | ) | | | (16 | ) |
| Class E (L) | | | — | | | | — | | | | — | | | | — | |
| Class H (L) | | | — | | | | — | | | | — | | | | — | |
| Class I | | | — | | | | — | | | | — | | | | — | |
| Class L | | | — | | | | — | | | | — | | | | — | |
| Class M (L) | | | — | | | | — | | | | — | | | | — | |
| Class N (L) | | | — | | | | — | | | | — | | | | — | |
| Class R3 | | | — | | | | — | | | | — | | | | — | |
| Class R4 | | | — | | | | — | | | | — | | | | — | |
| Class R5 | | | — | | | | — | | | | — | | | | — | |
| Class Y | | | (42 | ) | | | — | | | | (43 | ) | | | (3 | ) |
| Class Z (L) | | | — | | | | — | | | | — | | | | — | |
| | | | | | | | | | | | | | | | | |
| Total distributions | | | (7,315 | ) | | | — | | | | (2,219 | ) | | | (544 | ) |
| | | | | | | | | | | | | | | | | |
| | | | | | | | | | | | | | | | | |
Capital Share Transactions: | | | | | | | | | | | | | | | | |
| Class A | | | 3,394 | | | | (9,466 | ) | | | 3,771 | | | | 5,601 | |
| Class B | | | 403 | | | | (3,729 | ) | | | 457 | | | | 456 | |
| Class C | | | 1,599 | | | | (2,306 | ) | | | 391 | | | | 3,314 | |
| Class E (L) | | | — | | | | — | | | | — | | | | — | |
| Class H (L) | | | — | | | | — | | | | — | | | | — | |
| Class I | | | — | | | | — | | | | — | | | | — | |
| Class L | | | — | | | | — | | | | — | | | | — | |
| Class M (L) | | | — | | | | — | | | | — | | | | — | |
| Class N (L) | | | — | | | | — | | | | — | | | | — | |
| Class R3 | | | — | | | | — | | | | — | | | | — | |
| Class R4 | | | — | | | | — | | | | — | | | | — | |
| Class R5 | | | — | | | | — | | | | — | | | | — | |
| Class Y | | | 94 | | | | (191 | ) | | | 143 | | | | (317 | ) |
| Class Z (L) | | | — | | | | — | | | | — | | | | — | |
| | | | | | | | | | | | | | | | | |
| Net increase (decrease) from capital share transactions | | | 5,490 | | | | (15,692 | ) | | | 4,762 | | | | 9,054 | |
| | | | | | | | | | | | | | | | | |
| Net increase (decrease) in net assets | | | (5,917 | ) | | | (698 | ) | | | (2,331 | ) | | | 20,608 | |
| | | | | | | | | | | | | | | | | |
Net Assets: | | | | | | | | | | | | | | | | |
| Beginning of period | | | 66,231 | | | | 66,929 | | | | 48,136 | | | | 27,528 | |
| | | | | | | | | | | | | | | | | |
| End of period | | $ | 60,314 | | | $ | 66,231 | | | $ | 45,805 | | | $ | 48,136 | |
| | | | | | | | | | | | | | | | | |
| Accumulated undistributed (distribution in excess of) net investment income | | $ | (130 | ) | | $ | — | | | $ | 226 | | | $ | (3 | ) |
| | | | | | | | | | | | | | | | | |
| | |
| ** | | Commencement of operations. |
| (L) | | Classes H, M and N were merged into Class L and Class E and Class Z were merged into Class Y on February 9, 2007. Please refer to Note 8 in the Notes to Financials for further details. |
The accompanying notes are an integral part of these financial statements.
322
| | | | | | | | | | | | | | | | | | | | | | | | | | | | | |
| | | Global Equity
| | | Global Financial Services
| | | Global Growth
| | | Global Health
| |
| | | Fund | | | Fund | | | Fund | | | Fund | |
| | | For the Period
| | | For the
| | | | | | For the
| | | | | | For the
| | | | |
| | | February 29,
| | | Six-Month
| | | | | | Six-Month
| | | | | | Six-Month
| | | | |
| | | 2008 ** through
| | | Period Ended
| | | For the
| | | Period Ended
| | | For the
| | | Period Ended
| | | For the
| |
| | | April 30, 2008
| | | April 30, 2008
| | | Year Ended
| | | April 30, 2008
| | | Year Ended
| | | April 30, 2008
| | | Year Ended
| |
| | | (Unaudited) | | | (Unaudited) | | | October 31, 2007 | | | (Unaudited) | | | October 31, 2007 | | | (Unaudited) | | | October 31, 2007 | |
| | | | | | | | | | | | | | | | | | | | | | | | | | | | | |
| | | $ | 37 | | | $ | 297 | | | $ | 379 | | | $ | (1,352 | ) | | $ | (4,543 | ) | | $ | (1,127 | ) | | $ | (2,821 | ) |
| | | | (41 | ) | | | (2,331 | ) | | | 3,917 | | | | 21,990 | | | | 99,720 | | | | 12,228 | | | | 69,145 | |
| | | | 647 | | | | (4,118 | ) | | | (1,517 | ) | | | (129,918 | ) | | | 142,454 | | | | (109,687 | ) | | | 11,971 | |
| | | | — | | | | — | | | | 6 | | | | — | | | | 1,914 | | | | — | | | | 105 | |
| | | | | | | | | | | | | | | | | | | | | | | | | | | | | |
| | | | 643 | | | | (6,152 | ) | | | 2,785 | | | | (109,280 | ) | | | 239,545 | | | | (98,586 | ) | | | 78,400 | |
| | | | | | | | | | | | | | | | | | | | | | | | | | | | | |
| | | | | | | | | | | | | | | | | | | | | | | | | | | | | |
| | | | | | | | | | | | | | | | | | | | | | | | | | | | | |
| | | | | | | | | | | | | | | | | | | | | | | | | | | | | |
| | | | — | | | | (356 | ) | | | (170 | ) | | | — | | | | — | | | | — | | | | — | |
| | | | — | | | | (16 | ) | | | (7 | ) | | | — | | | | — | | | | — | | | | — | |
| | | | — | | | | (30 | ) | | | (13 | ) | | | — | | | | — | | | | — | | | | — | |
| | | | — | | | | — | | | | — | | | | — | | | | — | | | | — | | | | — | |
| | | | — | | | | — | | | | — | | | | — | | | | — | | | | — | | | | — | |
| | | | — | | | | — | | | | — | | | | — | | | | — | | | | — | | | | — | |
| | | | — | | | | — | | | | — | | | | — | | | | — | | | | — | | | | — | |
| | | | — | | | | — | | | | — | | | | — | | | | — | | | | — | | | | — | |
| | | | — | | | | — | | | | — | | | | — | | | | — | | | | — | | | | — | |
| | | | — | | | | — | | | | — | | | | — | | | | — | | | | — | | | | — | |
| | | | — | | | | — | | | | — | | | | — | | | | — | | | | — | | | | — | |
| | | | — | | | | — | | | | — | | | | — | | | | — | | | | — | | | | — | |
| | | | — | | | | (23 | ) | | | (10 | ) | | | — | | | | — | | | | — | | | | — | |
| | | | | | | | | | | | | | | | | | | | | | | | | | | | | |
| | | | — | | | | (2,765 | ) | | | (1,199 | ) | | | (52,363 | ) | | | (21,115 | ) | | | (35,137 | ) | | | (14,366 | ) |
| | | | — | | | | (428 | ) | | | (238 | ) | | | (8,994 | ) | | | (4,013 | ) | | | (6,084 | ) | | | (3,261 | ) |
| | | | — | | | | (593 | ) | | | (255 | ) | | | (8,596 | ) | | | (3,527 | ) | | | (10,053 | ) | | | (3,961 | ) |
| | | | — | | | | — | | | | — | | | | — | | | | — | | | | — | | | | — | |
| | | | — | | | | — | | | | — | | | | — | | | | — | | | | — | | | | — | |
| | | | — | | | | — | | | | — | | | | — | | | | — | | | | (1,046 | ) | | | (28 | ) |
| | | | — | | | | — | | | | — | | | | — | | | | — | | | | — | | | | — | |
| | | | — | | | | — | | | | — | | | | — | | | | — | | | | — | | | | — | |
| | | | — | | | | — | | | | — | | | | — | | | | �� | | | | — | | | | — | |
| | | | — | | | | — | | | | — | | | | (1 | ) | | | — | | | | (7 | ) | | | — | |
| | | | — | | | | — | | | | — | | | | (1 | ) | | | — | | | | (36 | ) | | | — | |
| | | | — | | | | — | | | | — | | | | (1 | ) | | | — | | | | (26 | ) | | | — | |
| | | | — | | | | (166 | ) | | | (56 | ) | | | (19,921 | ) | | | (8,887 | ) | | | (14,030 | ) | | | (7,108 | ) |
| | | | — | | | | — | | | | — | | | | — | | | | — | | | | — | | | | — | |
| | | | | | | | | | | | | | | | | | | | | | | | | | | | | |
| | | | — | | | | (4,377 | ) | | | (1,948 | ) | | | (89,877 | ) | | | (37,542 | ) | | | (66,419 | ) | | | (28,724 | ) |
| | | | | | | | | | | | | | | | | | | | | | | | | | | | | |
| | | | | | | | | | | | | | | | | | | | | | | | | | | | | |
| | | | | | | | | | | | | | | | | | | | | | | | | | | | | |
| | | | 17,929 | | | | 9,231 | | | | 2,363 | | | | 44,428 | | | | (39,418 | ) | | | 2,562 | | | | 112,453 | |
| | | | 301 | | | | 671 | | | | (69 | ) | | | (3,868 | ) | | | (14,043 | ) | | | 1,144 | | | | (1,331 | ) |
| | | | 319 | | | | 2,415 | | | | 1,007 | | | | 5,047 | | | | (7,369 | ) | | | 9,811 | | | | 33,372 | |
| | | | — | | | | — | | | | — | | | | — | | | | — | | | | — | | | | — | |
| | | | — | | | | — | | | | — | | | | — | | | | — | | | | — | | | | — | |
| | | | 312 | | | | — | | | | — | | | | — | | | | — | | | | 5,751 | | | | 13,622 | |
| | | | — | | | | — | | | | — | | | | — | | | | — | | | | — | | | | — | |
| | | | — | | | | — | | | | — | | | | — | | | | — | | | | — | | | | — | |
| | | | — | | | | — | | | | — | | | | — | | | | — | | | | — | | | | — | |
| | | | 300 | | | | — | | | | — | | | | 8 | | | | 10 | | | | 16 | | | | 111 | |
| | | | 300 | | | | — | | | | — | | | | 16 | | | | 10 | | | | 2,525 | | | | 481 | |
| | | | 300 | | | | — | | | | — | | | | 11 | | | | 10 | | | | 1,144 | | | | 439 | |
| | | | 300 | | | | 555 | | | | 534 | | | | 29,124 | | | | (26,063 | ) | | | 14,035 | | | | 7,304 | |
| | | | — | | | | — | | | | — | | | | — | | | | — | | | | — | | | | — | |
| | | | | | | | | | | | | | | | | | | | | | | | | | | | | |
| | | | 20,061 | | | | 12,872 | | | | 3,835 | | | | 74,766 | | | | (86,863 | ) | | | 36,988 | | | | 166,451 | |
| | | | | | | | | | | | | | | | | | | | | | | | | | | | | |
| | | | 20,704 | | | | 2,343 | | | | 4,672 | | | | (124,391 | ) | | | 115,140 | | | | (128,017 | ) | | | 216,127 | |
| | | | | | | | | | | | | | | | | | | | | | | | | | | | | |
| | | | | | | | | | | | | | | | | | | | | | | | | | | | | |
| | | | — | | | | 34,893 | | | | 30,221 | | | | 843,176 | | | | 728,036 | | | | 958,541 | | | | 742,414 | |
| | | | | | | | | | | | | | | | | | | | | | | | | | | | | |
| | | $ | 20,704 | | | $ | 37,236 | | | $ | 34,893 | | | $ | 718,785 | | | $ | 843,176 | | | $ | 830,524 | | | $ | 958,541 | |
| | | | | | | | | | | | | | | | | | | | | | | | | | | | | |
| | | $ | 37 | | | $ | 246 | | | $ | 374 | | | $ | (1,353 | ) | | $ | (1 | ) | | $ | (1,118 | ) | | $ | 9 | |
| | | | | | | | | | | | | | | | | | | | | | | | | | | | | |
323
The Hartford Mutual Funds, Inc. and The Hartford Mutual Funds II, Inc.
Statement of Changes in Net Assets — (continued)
(000’s Omitted)
| | | | | | | | | | | | | | | | | |
| | | Global Technology
| | | Growth Allocation
| |
| | | Fund | | | Fund | |
| | | For the
| | | | | | For the
| | | | |
| | | Six-Month
| | | | | | Six-Month
| | | | |
| | | Period Ended
| | | For the
| | | Period Ended
| | | For the
| |
| | | April 30, 2008
| | | Year Ended
| | | April 30, 2008
| | | Year Ended
| |
| | | (Unaudited) | | | October 31, 2007 | | | (Unaudited) | | | October 31, 2007 | |
Operations: | | | | | | | | | | | | | | | | |
| Net investment income (loss) | | $ | (289 | ) | | $ | (735 | ) | | $ | 4,536 | | | $ | 4,831 | |
| Net realized gain (loss) on investments, futures, options and swap contracts and foreign currency transactions | | | (1,259 | ) | | | 11,223 | | | | 54,047 | | | | 56,969 | |
| Net unrealized appreciation (depreciation) of investments, futures, options and swap contracts and foreign currency transactions | | | (10,507 | ) | | | 5,071 | | | | (124,574 | ) | | | 73,180 | |
| Payment from affiliate | | | — | | | | 22 | | | | — | | | | — | |
| | | | | | | | | | | | | | | | | |
| Net increase (decrease) in net assets resulting from operations | | | (12,055 | ) | | | 15,581 | | | | (65,991 | ) | | | 134,980 | |
| | | | | | | | | | | | | | | | | |
| | | | | | | | | | | | | | | | | |
Distributions to Shareholders: | | | | | | | | | | | | | | | | |
| From net investment income | | | | | | | | | | | | | | | | |
| Class A | | | — | | | | — | | | | (17,401 | ) | | | (7,234 | ) |
| Class B | | | — | | | | — | | | | (4,046 | ) | | | (1,483 | ) |
| Class C | | | — | | | | — | | | | (6,814 | ) | | | (2,548 | ) |
| Class E (L) | | | — | | | | — | | | | — | | | | — | |
| Class H (L) | | | — | | | | — | | | | — | | | | — | |
| Class I | | | — | | | | — | | | | (31 | ) | | | (5 | ) |
| Class L | | | — | | | | — | | | | — | | | | — | |
| Class M (L) | | | — | | | | — | | | | — | | | | — | |
| Class N (L) | | | — | | | | — | | | | — | | | | — | |
| Class R3 | | | — | | | | — | | | | (2 | ) | | | — | |
| Class R4 | | | — | | | | — | | | | (51 | ) | | | — | |
| Class R5 | | | — | | | | — | | | | (26 | ) | | | — | |
| Class Y | | | — | | | | — | | | | — | | | | — | |
| From net realized gain on investments | | | | | | | | | | | | | | | | |
| Class A | | | — | | | | — | | | | (27,625 | ) | | | (8,062 | ) |
| Class B | | | — | | | | — | | | | (7,937 | ) | | | (2,375 | ) |
| Class C | | | — | | | | — | | | | (13,242 | ) | | | (3,987 | ) |
| Class E (L) | | | — | | | | — | | | | — | | | | — | |
| Class H (L) | | | — | | | | — | | | | — | | | | — | |
| Class I | | | — | | | | — | | | | (44 | ) | | | — | |
| Class L | | | — | | | | — | | | | — | | | | — | |
| Class M (L) | | | — | | | | — | | | | — | | | | — | |
| Class N (L) | | | — | | | | — | | | | — | | | | — | |
| Class R3 | | | — | | | | — | | | | (3 | ) | | | — | |
| Class R4 | | | — | | | | — | | | | (69 | ) | | | — | |
| Class R5 | | | — | | | | — | | | | (39 | ) | | | — | |
| Class Y | | | — | | | | — | | | | — | | | | — | |
| Class Z (L) | | | — | | | | — | | | | — | | | | — | |
| | | | | | | | | | | | | | | | | |
| Total distributions | | | — | | | | — | | | | (77,330 | ) | | | (25,694 | ) |
| | | | | | | | | | | | | | | | | |
| | | | | | | | | | | | | | | | | |
Capital Share Transactions: | | | | | | | | | | | | | | | | |
| Class A | | | (5,009 | ) | | | 4,442 | | | | 54,966 | | | | 70,608 | |
| Class B | | | (812 | ) | | | (1,335 | ) | | | 13,637 | | | | 17,733 | |
| Class C | | | (319 | ) | | | 880 | | | | 20,706 | | | | 28,652 | |
| Class E (L) | | | — | | | | — | | | | — | | | | — | |
| Class H (L) | | | — | | | | — | | | | — | | | | — | |
| Class I | | | — | | | | — | | | | 606 | | | | 702 | |
| Class L | | | — | | | | — | | | | — | | | | — | |
| Class M (L) | | | — | | | | — | | | | — | | | | — | |
| Class N (L) | | | — | | | | — | | | | — | | | | — | |
| Class R3 | | | — | | | | — | | | | 18 | | | | 50 | |
| Class R4 | | | — | | | | — | | | | 4,967 | | | | 308 | |
| Class R5 | | | — | | | | — | | | | 1,108 | | | | 757 | |
| Class Y | | | (539 | ) | | | 1,110 | | | | — | | | | — | |
| Class Z (L) | | | — | | | | — | | | | — | | | | — | |
| | | | | | | | | | | | | | | | | |
| Net increase (decrease) from capital share transactions | | | (6,679 | ) | | | 5,097 | | | | 96,008 | | | | 118,810 | |
| | | | | | | | | | | | | | | | | |
| Net increase (decrease) in net assets | | | (18,734 | ) | | | 20,678 | | | | (47,313 | ) | | | 228,096 | |
| | | | | | | | | | | | | | | | | |
Net Assets: | | | | | | | | | | | | | | | | |
| Beginning of period | | | 79,489 | | | | 58,811 | | | | 887,446 | | | | 659,350 | |
| | | | | | | | | | | | | | | | | |
| End of period | | $ | 60,755 | | | $ | 79,489 | | | $ | 840,133 | | | $ | 887,446 | |
| | | | | | | | | | | | | | | | | |
| Accumulated undistributed (distribution in excess of) net investment income | | $ | (289 | ) | | $ | — | | | $ | (22,096 | ) | | $ | 1,739 | |
| | | | | | | | | | | | | | | | | |
| | |
| ** | | Commencement of operations. |
| (L) | | Classes H, M and N were merged into Class L and Class E and Class Z were merged into Class Y on February 9, 2007. Please refer to Note 8 in the Notes to Financials for further details. |
The accompanying notes are an integral part of these financial statements.
324
| | | | | | | | | | | | | | | | | | | | | | | | | | | | | | | | | |
| | | Growth
| | | Growth Opportunities
| | | High Yield
| | | High Yield Municipal Bond
| |
| | | Fund | | | Fund | | | Fund | | | Fund | |
| | | For the
| | | | | | For the
| | | | | | For the
| | | | | | For the
| | | For the
| |
| | | Six-Month
| | | | | | Six-Month
| | | | | | Six-Month
| | | | | | Six-Month
| | | Period
| |
| | | Period Ended
| | | For the
| | | Period Ended
| | | For the
| | | Period Ended
| | | For the
| | | Period Ended
| | | May 1, 2007 **
| |
| | | April 30, 2008
| | | Year Ended
| | | April 30, 2008
| | | Year Ended
| | | April 30, 2008
| | | Year Ended
| | | April 30, 2008
| | | through
| |
| | | (Unaudited) | | | October 31, 2007 | | | (Unaudited) | | | October 31, 2007 | | | (Unaudited) | | | October 31, 2007 | | | (Unaudited) | | | October 31, 2007 | |
| | | | | | | | | | | | | | | | | | | | | | | | | | | | | | | | | |
| | | $ | (1,205 | ) | | $ | (3,863 | ) | | $ | (776 | ) | | $ | 233 | | | $ | 8,539 | | | $ | 18,849 | | | $ | 2,949 | | | $ | 707 | |
| | | | 39,247 | | | | 95,187 | | | | (39,776 | ) | | | 261,090 | | | | (8,544 | ) | | | 6,406 | | | | (580 | ) | | | (284 | ) |
| | | | (170,681 | ) | | | 158,395 | | | | (265,581 | ) | | | 273,877 | | | | (4,842 | ) | | | (6,511 | ) | | | (6,439 | ) | | | (1,049 | ) |
| | | | — | | | | 154 | | | | — | | | | 413 | | | | — | | | | — | | | | — | | | | — | |
| | | | | | | | | | | | | | | | | | | | | | | | | | | | | | | | | |
| | | | (132,639 | ) | | | 249,873 | | | | (306,133 | ) | | | 535,613 | | | | (4,847 | ) | | | 18,744 | | | | (4,070 | ) | | | (626 | ) |
| | | | | | | | | | | | | | | | | | | | | | | | | | | | | | | | | |
| | | | | | | | | | | | | | | | | | | | | | | | | | | | | | | | | |
| | | | | | | | | | | | | | | | | | | | | | | | | | | | | | | | | |
| | | | | | | | | | | | | | | | | | | | | | | | | | | | | | | | | |
| | | | — | | | | — | | | | — | | | | — | | | | (6,058 | ) | | | (13,611 | ) | | | (1,912 | ) | | | (529 | ) |
| | | | — | | | | — | | | | — | | | | — | | | | (1,005 | ) | | | (2,286 | ) | | | (46 | ) | | | (16 | ) |
| | | | — | | | | — | | | | — | | | | — | | | | (1,126 | ) | | | (2,480 | ) | | | (526 | ) | | | (82 | ) |
| | | | — | | | | — | | | | — | | | | — | | | | — | | | | — | | | | — | | | | — | |
| | | | — | | | | — | | | | — | | | | — | | | | — | | | | — | | | | — | | | | — | |
| | | | — | | | | — | | | | (167 | ) | | | — | | | | (6 | ) | | | (1 | ) | | | (421 | ) | | | (57 | ) |
| | | | — | | | | — | | | | (256 | ) | | | — | | | | — | | | | — | | | | — | | | | — | |
| | | | — | | | | — | | | | — | | | | — | | | | — | | | | — | | | | — | | | | — | |
| | | | — | | | | — | | | | — | | | | — | | | | — | | | | — | | | | — | | | | — | |
| | | | — | | | | — | | | | — | | | | — | | | | — | | | | (1 | ) | | | — | | | | — | |
| | | | — | | | | — | | | | (8 | ) | | | — | | | | — | | | | (1 | ) | | | — | | | | — | |
| | | | — | | | | — | | | | — | | | | — | | | | — | | | | (1 | ) | | | — | | | | — | |
| | | | — | | | | — | | | | (319 | ) | | | — | | | | (289 | ) | | | (306 | ) | | | — | | | | — | |
| | | | | | | | | | | | | | | | | | | | | | | | | | | | | | | | | |
| | | | (46,494 | ) | | | (45,649 | ) | | | (115,156 | ) | | | (30,496 | ) | | | — | | | | — | | | | — | | | | — | |
| | | | (3,520 | ) | | | (3,502 | ) | | | (7,805 | ) | | | (2,833 | ) | | | — | | | | — | | | | — | | | | — | |
| | | | (7,327 | ) | | | (6,798 | ) | | | (28,975 | ) | | | (3,986 | ) | | | — | | | | — | | | | — | | | | — | |
| | | | — | | | | — | | | | — | | | | — | | | | — | | | | — | | | | — | | | | — | |
| | | | — | | | | (1,203 | ) | | | — | | | | (2,782 | ) | | | — | | | | — | | | | — | | | | — | |
| | | | (2,683 | ) | | | (1,187 | ) | | | (5,017 | ) | | | (7 | ) | | | — | | | | — | | | | — | | | | — | |
| | | | (23,556 | ) | | | (19,029 | ) | | | (88,663 | ) | | | (40,538 | ) | | | — | | | | — | | | | — | | | | — | |
| | | | — | | | | (1,264 | ) | | | — | | | | (1,749 | ) | | | — | | | | — | | | | — | | | | — | |
| | | | — | | | | (300 | ) | | | — | | | | (440 | ) | | | — | | | | — | | | | — | | | | — | |
| | | | (1 | ) | | | — | | | | (36 | ) | | | — | | | | — | | | | — | | | | — | | | | — | |
| | | | (21 | ) | | | — | | | | (449 | ) | | | — | | | | — | | | | — | | | | — | | | | — | |
| | | | (5 | ) | | | — | | | | (10 | ) | | | — | | | | — | | | | — | | | | — | | | | — | |
| | | | (7,436 | ) | | | (7,557 | ) | | | (14,810 | ) | | | (4,107 | ) | | | — | | | | — | | | | — | | | | — | |
| | | | — | | | | — | | | | — | | | | (2,429 | ) | | | — | | | | — | | | | — | | | | — | |
| | | | | | | | | | | | | | | | | | | | | | | | | | | | | | | | | |
| | | | (91,043 | ) | | | (86,489 | ) | | | (261,671 | ) | | | (89,367 | ) | | | (8,484 | ) | | | (18,687 | ) | | | (2,905 | ) | | | (684 | ) |
| | | | | | | | | | | | | | | | | | | | | | | | | | | | | | | | | |
| | | | | | | | | | | | | | | | | | | | | | | | | | | | | | | | | |
| | | | | | | | | | | | | | | | | | | | | | | | | | | | | | | | | |
| | | | 2,903 | | | | (165,249 | ) | | | 774,120 | | | | 389,075 | | | | 12,817 | | | | (18,862 | ) | | | 77,462 | | | | 47,287 | |
| | | | 466 | | | | (7,550 | ) | | | 18,453 | | | | 11,718 | | | | (2,507 | ) | | | (5,591 | ) | | | 1,779 | | | | 1,375 | |
| | | | 6,561 | | | | (10,245 | ) | | | 160,369 | | | | 127,289 | | | | 3,316 | | | | (4,978 | ) | | | 37,786 | | | | 11,403 | |
| | | | — | | | | — | | | | — | | | | — | | | | — | | | | — | | | | — | | | | — | |
| | | | — | | | | (30,977 | ) | | | — | | | | (55,681 | ) | | | — | | | | — | | | | — | | | | — | |
| | | | 7,601 | | | | 28,927 | | | | 88,685 | | | | 37,203 | | | | (38 | ) | | | 151 | | | | 33,364 | | | | 6,954 | |
| | | | 6,209 | | | | 33,986 | | | | 55,664 | | | | 61,754 | | | | — | | | | — | | | | — | | | | — | |
| | | | — | | | | (26,366 | ) | | | — | | | | (31,466 | ) | | | — | | | | — | | | | — | | | | — | |
| | | | — | | | | (7,503 | ) | | | — | | | | (8,248 | ) | | | — | | | | — | | | | — | | | | — | |
| | | | 4 | | | | 14 | | | | 4,394 | | | | 284 | | | | 2 | | | | 11 | | | | — | | | | — | |
| | | | 1,335 | | | | 262 | | | | 10,923 | | | | 3,230 | | | | — | | | | 11 | | | | — | | | | — | |
| | | | 24 | | | | 56 | | | | 817 | | | | 67 | | | | — | | | | 11 | | | | — | | | | — | |
| | | | 31,989 | | | | (40,641 | ) | | | 25,143 | | | | 40,778 | | | | 8,026 | | | | (19,604 | ) | | | — | | | | — | |
| | | | — | | | | — | | | | — | | | | (43,669 | ) | | | — | | | | — | | | | — | | | | — | |
| | | | | | | | | | | | | | | | | | | | | | | | | | | | | | | | | |
| | | | 57,092 | | | | (225,286 | ) | | | 1,138,568 | | | | 532,334 | | | | 21,616 | | | | (48,851 | ) | | | 150,391 | | | | 67,019 | |
| | | | | | | | | | | | | | | | | | | | | | | | | | | | | | | | | |
| | | | (166,590 | ) | | | (61,902 | ) | | | 570,764 | | | | 978,580 | | | | 8,285 | | | | (48,794 | ) | | | 143,416 | | | | 65,709 | |
| | | | | | | | | | | | | | | | | | | | | | | | | | | | | | | | | |
| | | | | | | | | | | | | | | | | | | | | | | | | | | | | | | | | |
| | | | 1,217,158 | | | | 1,279,060 | | | | 2,219,945 | | | | 1,241,365 | | | | 243,239 | | | | 292,033 | | | | 65,709 | | | | — | |
| | | | | | | | | | | | | | | | | | | | | | | | | | | | | | | | | |
| | | $ | 1,050,568 | | | $ | 1,217,158 | | | $ | 2,790,709 | | | $ | 2,219,945 | | | $ | 251,524 | | | $ | 243,239 | | | $ | 209,125 | | | $ | 65,709 | |
| | | | | | | | | | | | | | | | | | | | | | | | | | | | | | | | | |
| | | $ | (1,205 | ) | | $ | — | | | $ | (1,260 | ) | | $ | 266 | | | $ | 210 | | | $ | 155 | | | $ | 83 | | | $ | 39 | |
| | | | | | | | | | | | | | | | | | | | | | | | | | | | | | | | | |
325
The Hartford Mutual Funds, Inc. and The Hartford Mutual Funds II, Inc.
Statement of Changes in Net Assets — (continued)
(000’s Omitted)
| | | | | | | | | | | | | | | | | |
| | | Income Allocation
| | | Income
| |
| | | Fund | | | Fund | |
| | | For the
| | | | | | For the
| | | | |
| | | Six-Month
| | | | | | Six-Month
| | | | |
| | | Period Ended
| | | For the
| | | Period Ended
| | | For the
| |
| | | April 30, 2008
| | | Year Ended
| | | April 30, 2008
| | | Year Ended
| |
| | | (Unaudited) | | | October 31, 2007 | | | (Unaudited) | | | October 31, 2007 | |
Operations: | | | | | | | | | | | | | | | | |
| Net investment income (loss) | | $ | 1,275 | | | $ | 1,947 | | | $ | 9,555 | | | $ | 13,237 | |
| Net realized gain (loss) on investments, futures, options and swap contracts and foreign currency transactions | | | (60 | ) | | | (222 | ) | | | (1,431 | ) | | | (292 | ) |
| Net unrealized appreciation (depreciation) of investments, futures, options and swap contracts and foreign currency transactions | | | (552 | ) | | | 66 | | | | (8,024 | ) | | | (5,084 | ) |
| Payment from affiliate | | | — | | | | — | | | | — | | | | — | |
| | | | | | | | | | | | | | | | | |
| Net increase (decrease) in net assets resulting from operations | | | 663 | | | | 1,791 | | | | 100 | | | | 7,861 | |
| | | | | | | | | | | | | | | | | |
| | | | | | | | | | | | | | | | | |
Distributions to Shareholders: | | | | | | | | | | | | | | | | |
| From net investment income | | | | | | | | | | | | | | | | |
| Class A | | | (903 | ) | | | (1,401 | ) | | | (2,756 | ) | | | (3,789 | ) |
| Class B | | | (122 | ) | | | (208 | ) | | | (225 | ) | | | (425 | ) |
| Class C | | | (215 | ) | | | (301 | ) | | | (347 | ) | | | (588 | ) |
| Class E (L) | | | — | | | | — | | | | — | | | | — | |
| Class H (L) | | | — | | | | — | | | | — | | | | — | |
| Class I | | | (25 | ) | | | (31 | ) | | | — | | | | — | |
| Class L | | | — | | | | — | | | | — | | | | — | |
| Class M (L) | | | — | | | | — | | | | — | | | | — | |
| Class N (L) | | | — | | | | — | | | | — | | | | — | |
| Class R3 | | | — | | | | — | | | | — | | | | — | |
| Class R4 | | | (10 | ) | | | (1 | ) | | | — | | | | — | |
| Class R5 | | | — | | | | — | | | | — | | | | — | |
| Class Y | | | — | | | | — | | | | (5,936 | ) | | | (8,464 | ) |
| From net realized gain on investments | | | | | | | | | | | | | | | | |
| Class A | | | — | | | | — | | | | — | | | | — | |
| Class B | | | — | | | | — | | | | — | | | | — | |
| Class C | | | — | | | | — | | | | — | | | | — | |
| Class E (L) | | | — | | | | — | | | | — | | | | — | |
| Class H (L) | | | — | | | | — | | | | — | | | | — | |
| Class I | | | — | | | | — | | | | — | | | | — | |
| Class L | | | — | | | | — | | | | — | | | | — | |
| Class M (L) | | | — | | | | — | | | | — | | | | — | |
| Class N (L) | | | — | | | | — | | | | — | | | | — | |
| Class R3 | | | — | | | | — | | | | — | | | | — | |
| Class R4 | | | — | | | | — | | | | — | | | | — | |
| Class R5 | | | — | | | | — | | | | — | | | | — | |
| Class Y | | | — | | | | — | | | | — | | | | — | |
| Class Z (L) | | | — | | | | — | | | | — | | | | — | |
| | | | | | | | | | | | | | | | | |
| Total distributions | | | (1,275 | ) | | | (1,942 | ) | | | (9,264 | ) | | | (13,266 | ) |
| | | | | | | | | | | | | | | | | |
| | | | | | | | | | | | | | | | | |
Capital Share Transactions: | | | | | | | | | | | | | | | | |
| Class A | | | 7,154 | | | | 9,091 | | | | 13,151 | | | | 62,672 | |
| Class B | | | 686 | | | | 247 | | | | 321 | | | | 2,803 | |
| Class C | | | 4,561 | | | | 669 | | | | 2,535 | | | | 6,409 | |
| Class E (L) | | | — | | | | — | | | | — | | | | — | |
| Class H (L) | | | — | | | | — | | | | — | | | | — | |
| Class I | | | (290 | ) | | | 1,114 | | | | — | | | | — | |
| Class L | | | — | | | | — | | | | — | | | | — | |
| Class M (L) | | | — | | | | — | | | | — | | | | — | |
| Class N (L) | | | — | | | | — | | | | — | | | | — | |
| Class R3 | | | 6 | | | | 10 | | | | — | | | | — | |
| Class R4 | | | 419 | | | | 95 | | | | — | | | | — | |
| Class R5 | | | 2 | | | | 10 | | | | — | | | | — | |
| Class Y | | | — | | | | — | | | | 2,222 | | | | 155,902 | |
| Class Z (L) | | | — | | | | — | | | | — | | | | — | |
| | | | | | | | | | | | | | | | | |
| Net increase (decrease) from capital share transactions | | | 12,538 | | | | 11,236 | | | | 18,229 | | | | 227,786 | |
| | | | | | | | | | | | | | | | | |
| Net increase (decrease) in net assets | | | 11,926 | | | | 11,085 | | | | 9,065 | | | | 222,381 | |
| | | | | | | | | | | | | | | | | |
Net Assets: | | | | | | | | | | | | | | | | |
| Beginning of period | | | 50,036 | | | | 38,951 | | | | 335,564 | | | | 113,183 | |
| | | | | | | | | | | | | | | | | |
| End of period | | $ | 61,962 | | | $ | 50,036 | | | $ | 344,629 | | | $ | 335,564 | |
| | | | | | | | | | | | | | | | | |
| Accumulated undistributed (distribution in excess of) net investment income | | $ | 11 | | | $ | 11 | | | $ | 386 | | | $ | 95 | |
| | | | | | | | | | | | | | | | | |
| | |
| (L) | | Classes H, M and N were merged into Class L and Class E and Class Z were merged into Class Y on February 9, 2007. Please refer to Note 8 in the Notes to Financials for further details. |
The accompanying notes are an integral part of these financial statements.
326
| | | | | | | | | | | | | | | | | | | | | | | | | | | | | | | | | |
| | | Inflation Plus
| | | International Growth
| | | International Opportunities
| | | International Small Company
| |
| | | Fund | | | Fund | | | Fund | | | Fund | |
| | | For the
| | | | | | For the
| | | | | | For the
| | | | | | For the
| | | | |
| | | Six-Month
| | | | | | Six-Month
| | | | | | Six-Month
| | | | | | Six-Month
| | | | |
| | | Period Ended
| | | For the
| | | Period Ended
| | | For the
| | | Period Ended
| | | For the
| | | Period Ended
| | | For the
| |
| | | April 30, 2008
| | | Year Ended
| | | April 30, 2008
| | | Year Ended
| | | April 30, 2008
| | | Year Ended
| | | April 30, 2008
| | | Year Ended
| |
| | | (Unaudited) | | | October 31, 2007 | | | (Unaudited) | | | October 31, 2007 | | | (Unaudited) | | | October 31, 2007 | | | (Unaudited) | | | October 31, 2007 | |
| | | | | | | | | | | | | | | | | | | | | | | | | | | | | | | | | |
| | | $ | 13,110 | | | $ | 17,073 | | | $ | (43 | ) | | $ | (159 | ) | | $ | 1,072 | | | $ | 1,234 | | | $ | 1,207 | | | $ | 1,039 | |
| | | | 26,999 | | | | (1,012 | ) | | | (16,123 | ) | | | 82,495 | | | | 20,447 | | | | 65,439 | | | | 2,530 | | | | 38,012 | |
| | | | 1,303 | | | | 13,079 | | | | (95,148 | ) | | | 69,202 | | | | (56,292 | ) | | | 54,308 | | | | (44,058 | ) | | | 25,590 | |
| | | | — | | | | — | | | | — | | | | 6 | | | | — | | | | 28 | | | | — | | | | — | |
| | | | | | | | | | | | | | | | | | | | | | | | | | | | | | | | | |
| | | | 41,412 | | | | 29,140 | | | | (111,314 | ) | | | 151,544 | | | | (34,773 | ) | | | 121,009 | | | | (40,321 | ) | | | 64,641 | |
| | | | | | | | | | | | | | | | | | | | | | | | | | | | | | | | | |
| | | | | | | | | | | | | | | | | | | | | | | | | | | | | | | | | |
| | | | | | | | | | | | | | | | | | | | | | | | | | | | | | | | | |
| | | | | | | | | | | | | | | | | | | | | | | | | | | | | | | | | |
| | | | (4,930 | ) | | | (7,108 | ) | | | — | | | | (232 | ) | | | (816 | ) | | | (570 | ) | | | (1,501 | ) | | | (818 | ) |
| | | | (1,320 | ) | | | (2,291 | ) | | | — | | | | — | | | | — | | | | — | | | | (75 | ) | | | (72 | ) |
| | | | (3,384 | ) | | | (5,280 | ) | | | — | | | | — | | | | — | | | | — | | | | (139 | ) | | | (81 | ) |
| | | | — | | | | — | | | | — | | | | — | | | | — | | | | — | | | | — | | | | — | |
| | | | — | | | | — | | | | — | | | | — | | | | — | | | | — | | | | — | | | | — | |
| | | | (185 | ) | | | (64 | ) | | | — | | | | (1 | ) | | | — | | | | — | | | | (5 | ) | | | — | |
| | | | — | | | | — | | | | — | | | | — | | | | — | | | | — | | | | — | | | | — | |
| | | | — | | | | — | | | | — | | | | — | | | | — | | | | — | | | | — | | | | — | |
| | | | — | | | | — | | | | — | | | | — | | | | — | | | | — | | | | — | | | | — | |
| | | | (1 | ) | | | — | | | | — | | | | — | | | | — | | | | — | | | | — | | | | — | |
| | | | — | | | | — | | | | — | | | | — | | | | — | | | | — | | | | — | | | | — | |
| | | | — | | | | — | | | | — | | | | — | | | | — | | | | — | | | | — | | | | — | |
| | | | (4,195 | ) | | | (4,301 | ) | | | — | | | | — | | | | (994 | ) | | | (1,105 | ) | | | (1,960 | ) | | | (1,414 | ) |
| | | | | | | | | | | | | | | | | | | | | | | | | | | | | | | | | |
| | | | — | | | | — | | | | (55,090 | ) | | | (19,852 | ) | | | (35,677 | ) | | | (4,324 | ) | | | (16,627 | ) | | | (8,745 | ) |
| | | | — | | | | — | | | | (6,888 | ) | | | (3,152 | ) | | | (5,943 | ) | | | (834 | ) | | | (2,221 | ) | | | (1,537 | ) |
| | | | — | | | | — | | | | (8,792 | ) | | | (4,097 | ) | | | (4,984 | ) | | | (606 | ) | | | (3,750 | ) | | | (2,387 | ) |
| | | | — | | | | — | | | | — | | | | — | | | | — | | | | — | | | | — | | | | — | |
| | | | — | | | | — | | | | — | | | | — | | | | — | | | | — | | | | — | | | | — | |
| | | | — | | | | — | | | | (462 | ) | | | (1 | ) | | | — | | | | — | | | | (26 | ) | | | — | |
| | | | — | | | | — | | | | — | | | | — | | | | — | | | | — | | | | — | | | | — | |
| | | | — | | | | — | | | | — | | | | — | | | | — | | | | — | | | | — | | | | — | |
| | | | — | | | | — | | | | — | | | | — | | | | — | | | | — | | | | — | | | | — | |
| | | | — | | | | — | | | | (2 | ) | | | — | | | | (4 | ) | | | — | | | | — | | | | — | |
| | | | — | | | | — | | | | (2 | ) | | | — | | | | (2 | ) | | | — | | | | — | | | | — | |
| | | | — | | | | — | | | | (2 | ) | | | — | | | | (2 | ) | | | — | | | | — | | | | — | |
| | | | — | | | | — | | | | (9,496 | ) | | | (3,442 | ) | | | (18,133 | ) | | | (1,811 | ) | | | (14,283 | ) | | | (11,031 | ) |
| | | | — | | | | — | | | | — | | | | — | | | | — | | | | — | | | | — | | | | — | |
| | | | | | | | | | | | | | | | | | | | | | | | | | | | | | | | | |
| | | | (14,015 | ) | | | (19,044 | ) | | | (80,734 | ) | | | (30,777 | ) | | | (66,555 | ) | | | (9,250 | ) | | | (40,587 | ) | | | (26,085 | ) |
| | | | | | | | | | | | | | | | | | | | | | | | | | | | | | | | | |
| | | | | | | | | | | | | | | | | | | | | | | | | | | | | | | | | |
| | | | | | | | | | | | | | | | | | | | | | | | | | | | | | | | | |
| | | | 84,537 | | | | (101,233 | ) | | | 75,130 | | | | 127,656 | | | | 68,485 | | | | 21,004 | | | | 2,266 | | | | 66,720 | |
| | | | 6,121 | | | | (24,879 | ) | | | 6,781 | | | | 7,592 | | | | 4,048 | | | | (1,443 | ) | | | 804 | | | | 5,494 | |
| | | | 60,211 | | | | (90,399 | ) | | | 10,025 | | | | 9,034 | | | | 14,746 | | | | 2,716 | | | | 175 | | | | 11,172 | |
| | | | — | | | | — | | | | — | | | | — | | | | — | | | | — | | | | — | | | | — | |
| | | | — | | | | — | | | | — | | | | — | | | | — | | | | — | | | | — | | | | — | |
| | | | 9,492 | | | | 3,376 | | | | 351 | | | | 3,023 | | | | — | | | | — | | | | 449 | | | | 161 | |
| | | | — | | | | — | | | | — | | | | — | | | | — | | | | — | | | | — | | | | — | |
| | | | — | | | | — | | | | — | | | | — | | | | — | | | | — | | | | — | | | | — | |
| | | | — | | | | — | | | | — | | | | — | | | | — | | | | — | | | | — | | | | — | |
| | | | 88 | | | | 10 | | | | 165 | | | | 12 | | | | 38 | | | | 22 | | | | — | | | | — | |
| | | | — | | | | 10 | | | | 21 | | | | 10 | | | | 48 | | | | 10 | | | | — | | | | — | |
| | | | — | | | | 10 | | | | 2 | | | | 10 | | | | 2 | | | | 10 | | | | — | | | | — | |
| | | | 22,419 | | | | 20,307 | | | | 32,098 | | | | 100 | | | | 35,578 | | | | 50,162 | | | | 28,131 | | | | 29,216 | |
| | | | — | | | | — | | | | — | | | | — | | | | — | | | | — | | | | — | | | | — | |
| | | | | | | | | | | | | | | | | | | | | | | | | | | | | | | | | |
| | | | 182,868 | | | | (192,798 | ) | | | 124,573 | | | | 147,437 | | | | 122,945 | | | | 72,481 | | | | 31,825 | | | | 112,763 | |
| | | | | | | | | | | | | | | | | | | | | | | | | | | | | | | | | |
| | | | 210,265 | | | | (182,702 | ) | | | (67,475 | ) | | | 268,204 | | | | 21,617 | | | | 184,240 | | | | (49,083 | ) | | | 151,319 | |
| | | | | | | | | | | | | | | | | | | | | | | | | | | | | | | | | |
| | | | | | | | | | | | | | | | | | | | | | | | | | | | | | | | | |
| | | | 579,905 | | | | 762,607 | | | | 628,765 | | | | 360,561 | | | | 437,228 | | | | 252,988 | | | | 338,470 | | | | 187,151 | |
| | | | | | | | | | | | | | | | | | | | | | | | | | | | | | | | | |
| | | $ | 790,170 | | | $ | 579,905 | | | $ | 561,290 | | | $ | 628,765 | | | $ | 458,845 | | | $ | 437,228 | | | $ | 289,387 | | | $ | 338,470 | |
| | | | | | | | | | | | | | | | | | | | | | | | | | | | | | | | | |
| | | $ | 1,085 | | | $ | 1,990 | | | $ | (43 | ) | | $ | — | | | $ | 580 | | | $ | 1,318 | | | $ | (566 | ) | | $ | 1,907 | |
| | | | | | | | | | | | | | | | | | | | | | | | | | | | | | | | | |
327
The Hartford Mutual Funds, Inc. and The Hartford Mutual Funds II, Inc.
Statement of Changes in Net Assets — (continued)
(000’s Omitted)
| | | | | | | | | | | | | | | | | |
| | | LargeCap Growth
| | | MidCap
| |
| | | Fund | | | Fund | |
| | | For the
| | | | | | For the
| | | | |
| | | Six-Month
| | | For the Period
| | | Six-Month
| | | | |
| | | Period Ended
| | | November 30, 2006 **
| | | Period Ended
| | | For the Year
| |
| | | April 30, 2008
| | | through
| | | April 30, 2008
| | | Ended
| |
| | | (Unaudited) | | | October 31, 2007 | | | (Unaudited) | | | October 31, 2007 | |
Operations: | | | | | | | | | | | | | | | | |
| Net investment income (loss) | | $ | (14 | ) | | $ | (13 | ) | | $ | (4,910 | ) | | $ | (755 | ) |
| Net realized gain (loss) on investments, futures, options and swap contracts and foreign currency transactions | | | (716 | ) | | | 200 | | | | 86,677 | | | | 515,686 | |
| Net unrealized appreciation (depreciation) of investments, futures, options and swap contracts and foreign currency transactions | | | (923 | ) | | | 951 | | | | (312,681 | ) | | | 206,436 | |
| Payment from affiliate | | | — | | | | — | | | | — | | | | 2,459 | |
| | | | | | | | | | | | | | | | | |
| Net increase (decrease) in net assets resulting from operations | | | (1,653 | ) | | | 1,138 | | | | (230,914 | ) | | | 723,826 | |
| | | | | | | | | | | | | | | | | |
| | | | | | | | | | | | | | | | | |
Distributions to Shareholders: | | | | | | | | | | | | | | | | |
| From net investment income | | | | | | | | | | | | | | | | |
| Class A | | | — | | | | (12 | ) | | | (10,672 | ) | | | — | |
| Class B | | | — | | | | — | | | | — | | | | — | |
| Class C | | | — | | | | — | | | | — | | | | — | |
| Class E (L) | | | — | | | | — | | | | — | | | | — | |
| Class H (L) | | | — | | | | — | | | | — | | | | — | |
| Class I | | | — | | | | — | | | | — | | | | — | |
| Class L | | | — | | | | — | | | | — | | | | — | |
| Class M (L) | | | — | | | | — | | | | — | | | | — | |
| Class N (L) | | | — | | | | — | | | | — | | | | — | |
| Class R3 | | | — | | | | — | | | | — | | | | — | |
| Class R4 | | | — | | | | — | | | | — | | | | — | |
| Class R5 | | | — | | | | — | | | | — | | | | — | |
| Class Y | | | — | | | | — | | | | (1,203 | ) | | | — | |
| From net realized gain on investments | | | | | | | | | | | | | | | | |
| Class A | | | (196 | ) | | | — | | | | (324,294 | ) | | | (291,498 | ) |
| Class B | | | (7 | ) | | | — | | | | (73,929 | ) | | | (77,097 | ) |
| Class C | | | (10 | ) | | | — | | | | (85,395 | ) | | | (85,148 | ) |
| Class E (L) | | | — | | | | — | | | | — | | | | — | |
| Class H (L) | | | — | | | | — | | | | — | | | | — | |
| Class I | | | — | | | | — | | | | — | | | | — | |
| Class L | | | — | | | | — | | | | — | | | | — | |
| Class M (L) | | | — | | | | — | | | | — | | | | — | |
| Class N (L) | | | — | | | | — | | | | — | | | | — | |
| Class R3 | | | — | | | | — | | | | — | | | | — | |
| Class R4 | | | — | | | | — | | | | — | | | | — | |
| Class R5 | | | — | | | | — | | | | — | | | | — | |
| Class Y | | | (2 | ) | | | — | | | | (18,628 | ) | | | (27,642 | ) |
| Class Z (L) | | | — | | | | — | | | | — | | | | — | |
| | | | | | | | | | | | | | | | | |
| Total distributions | | | (215 | ) | | | (12 | ) | | | (514,121 | ) | | | (481,385 | ) |
| | | | | | | | | | | | | | | | | |
| | | | | | | | | | | | | | | | | |
Capital Share Transactions: | | | | | | | | | | | | | | | | |
| Class A | | | 508 | | | | 10,305 | | | | 271,058 | | | | 194,559 | |
| Class B | | | 88 | | | | 331 | | | | 9,780 | | | | (20,047 | ) |
| Class C | | | 271 | | | | 503 | | | | 39,132 | | | | (705 | ) |
| Class E (L) | | | — | | | | — | | | | — | | | | — | |
| Class H (L) | | | — | | | | — | | | | — | | | | — | |
| Class I | | | — | | | | — | | | | — | | | | — | |
| Class L | | | — | | | | — | | | | — | | | | — | |
| Class M (L) | | | — | | | | — | | | | — | | | | — | |
| Class N (L) | | | — | | | | — | | | | — | | | | — | |
| Class R3 | | | — | | | | — | | | | — | | | | — | |
| Class R4 | | | — | | | | — | | | | — | | | | — | |
| Class R5 | | | — | | | | — | | | | — | | | | — | |
| Class Y | | | 2 | | | | 100 | | | | 112,937 | | | | (63,076 | ) |
| Class Z (L) | | | — | | | | — | | | | — | | | | — | |
| | | | | | | | | | | | | | | | | |
| Net increase (decrease) from capital share transactions | | | 869 | | | | 11,239 | | | | 432,907 | | | | 110,731 | |
| | | | | | | | | | | | | | | | | |
| Net increase (decrease) in net assets | | | (999 | ) | | | 12,365 | | | | (312,128 | ) | | | 353,172 | |
| | | | | | | | | | | | | | | | | |
Net Assets: | | | | | | | | | | | | | | | | |
| Beginning of period | | | 12,365 | | | | — | | | | 3,323,209 | | | | 2,970,037 | |
| | | | | | | | | | | | | | | | | |
| End of period | | $ | 11,366 | | | $ | 12,365 | | | $ | 3,011,081 | | | $ | 3,323,209 | |
| | | | | | | | | | | | | | | | | |
| Accumulated undistributed (distribution in excess of) net investment income | | $ | (14 | ) | | $ | — | | | $ | (4,922 | ) | | $ | 11,863 | |
| | | | | | | | | | | | | | | | | |
| | |
| ** | | Commencement of operations. |
| (L) | | Classes H, M and N were merged into Class L and Class E and Class Z were merged into Class Y on February 9, 2007. Please refer to Note 8 in the Notes to Financials for further details. |
| (l) | | Capital Share transactions for each class include merger activity in the amount of $13,927 for Class A, $592 for Class B, $1,147 for Class C and $118 for Class Y. Please refer to Note 8 in the Notes to Financial Statements for further details. |
| (1) | | Formerly known as The Hartford Select MidCap Growth Fund. |
The accompanying notes are an integral part of these financial statements.
328
| | | | | | | | | | | | | | | | | | | | | | | | | | | | | | | | | |
| | | MidCap Growth
| | | MidCap Value
| | | Money Market
| | | Retirement Income
| |
| | | Fund (1) | | | Fund | | | Fund | | | Fund | |
| | | For the
| | | | | | For the
| | | | | | For the
| | | | | | For the
| | | | |
| | | Six-Month
| | | | | | Six-Month
| | | | | | Six-Month
| | | | | | Six-Month
| | | | |
| | | Period Ended
| | | For the Year
| | | Period Ended
| | | For the Year
| | | Period Ended
| | | For the Year
| | | Period Ended
| | | For the Year
| |
| | | April 30, 2008
| | | Ended
| | | April 30, 2008
| | | Ended
| | | April 30, 2008
| | | Ended
| | | April 30, 2008
| | | Ended
| |
| | | (Unaudited) | | | October 31, 2007 | | | (Unaudited) | | | October 31, 2007 | | | (Unaudited) | | | October 31, 2007 | | | (Unaudited) | | | October 31, 2007 | |
| | | | | | | | | | | | | | | | | | | | | | | | | | | | | | | | | |
| | | $ | (38 | ) | | $ | (182 | ) | | $ | (170 | ) | | $ | (913 | ) | | $ | 7,628 | | | $ | 13,462 | | | $ | 89 | | | $ | 66 | |
| | | | (720 | ) | | | 4,250 | | | | (16,298 | ) | | | 74,605 | | | | — | | | | — | | | | 35 | | | | 53 | |
| | | | (3,183 | ) | | | 1,185 | | | | (60,111 | ) | | | (4,689 | ) | | | — | | | | — | | | | (161 | ) | | | 51 | |
| | | | — | | | | — | | | | — | | | | 55 | | | | — | | | | — | | | | — | | | | — | |
| | | | | | | | | | | | | | | | | | | | | | | | | | | | | | | | | |
| | | | (3,941 | ) | | | 5,253 | | | | (76,579 | ) | | | 69,058 | | | | 7,628 | | | | 13,462 | | | | (37 | ) | | | 170 | |
| | | | | | | | | | | | | | | | | | | | | | | | | | | | | | | | | |
| | | | | | | | | | | | | | | | | | | | | | | | | | | | | | | | | |
| | | | | | | | | | | | | | | | | | | | | | | | | | | | | | | | | |
| | | | | | | | | | | | | | | | | | | | | | | | | | | | | | | | | |
| | | | — | | | | — | | | | — | | | | — | | | | (5,501 | ) | | | (11,050 | ) | | | (87 | ) | | | (54 | ) |
| | | | — | | | | — | | | | — | | | | — | | | | (382 | ) | | | (974 | ) | | | (6 | ) | | | (6 | ) |
| | | | — | | | | — | | | | — | | | | — | | | | (1,095 | ) | | | (1,162 | ) | | | (12 | ) | | | (5 | ) |
| | | | — | | | | — | | | | — | | | | — | | | | — | | | | — | | | | — | | | | — | |
| | | | — | | | | — | | | | — | | | | — | | | | — | | | | — | | | | — | | | | — | |
| | | | — | | | | — | | | | — | | | | — | | | | — | | | | — | | | | — | | | | — | |
| | | | — | | | | — | | | | — | | | | — | | | | — | | | | — | | | | — | | | | — | |
| | | | — | | | | — | | | | — | | | | — | | | | — | | | | — | | | | — | | | | — | |
| | | | — | | | | — | | | | — | | | | — | | | | — | | | | — | | | | — | | | | — | |
| | | | — | | | | — | | | | — | | | | — | | | | — | | | | — | | | | (1 | ) | | | — | |
| | | | — | | | | — | | | | — | | | | — | | | | (546 | ) | | | (78 | ) | | | (8 | ) | | | — | |
| | | | — | | | | — | | | | — | | | | — | | | | (46 | ) | | | (5 | ) | | | (8 | ) | | | — | |
| | | | — | | | | — | | | | — | | | | — | | | | (58 | ) | | | (193 | ) | | | (3 | ) | | | (4 | ) |
| | | | | | | | | | | | | | | | | | | | | | | | | | | | | | | | | |
| | | | (2,740 | ) | | | (1,002 | ) | | | (51,758 | ) | | | (39,788 | ) | | | — | | | | — | | | | (44 | ) | | | — | |
| | | | (571 | ) | | | (160 | ) | | | (10,795 | ) | | | (8,536 | ) | | | — | | | | — | | | | (3 | ) | | | — | |
| | | | (598 | ) | | | (168 | ) | | | (11,178 | ) | | | (8,588 | ) | | | — | | | | — | | | | (4 | ) | | | — | |
| | | | — | | | | — | | | | — | | | | — | | | | — | | | | — | | | | — | | | | — | |
| | | | — | | | | — | | | | — | | | | — | | | | — | | | | — | | | | — | | | | — | |
| | | | — | | | | — | | | | — | | | | — | | | | — | | | | — | | | | — | | | | — | |
| | | | — | | | | — | | | | — | | | | — | | | | — | | | | — | | | | — | | | | — | |
| | | | — | | | | — | | | | — | | | | — | | | | — | | | | — | | | | — | | | | — | |
| | | | — | | | | — | | | | — | | | | — | | | | — | | | | — | | | | — | | | | — | |
| | | | — | | | | — | | | | — | | | | — | | | | — | | | | — | | | | — | | | | — | |
| | | | — | | | | — | | | | — | | | | — | | | | — | | | | — | | | | — | | | | — | |
| | | | — | | | | — | | | | — | | | | — | | | | — | | | | — | | | | — | | | | — | |
| | | | (14 | ) | | | (616 | ) | | | (318 | ) | | | (2,054 | ) | | | — | | | | — | | | | (2 | ) | | | — | |
| | | | — | | | | — | | | | — | | | | — | | | | — | | | | — | | | | — | | | | — | |
| | | | | | | | | | | | | | | | | | | | | | | | | | | | | | | | | |
| | | | (3,923 | ) | | | (1,946 | ) | | | (74,049 | ) | | | (58,966 | ) | | | (7,628 | ) | | | (13,462 | ) | | | (178 | ) | | | (69 | ) |
| | | | | | | | | | | | | | | | | | | | | | | | | | | | | | | | | |
| | | | | | | | | | | | | | | | | | | | | | | | | | | | | | | | | |
| | | | | | | | | | | | | | | | | | | | | | | | | | | | | | | | | |
| | | | 16,709 | (l) | | | (3,914 | ) | | | 20,055 | | | | (3,457 | ) | | | 87,765 | | | | 107,280 | | | | 833 | | | | 2,523 | |
| | | | 952 | (l) | | | 321 | | | | 3,853 | | | | (2,595 | ) | | | 11,151 | | | | 1,224 | | | | 112 | | | | 33 | |
| | | | 1,427 | (l) | | | 427 | | | | 3,551 | | | | (1,116 | ) | | | 51,476 | | | | 42,579 | | | | 747 | | | | 73 | |
| | | | — | | | | — | | | | — | | | | ��� | | | | — | | | | — | | | | — | | | | — | |
| | | | — | | | | — | | | | — | | | | — | | | | — | | | | — | | | | — | | | | — | |
| | | | — | | | | — | | | | — | | | | — | | | | — | | | | — | | | | — | | | | — | |
| | | | — | | | | — | | | | — | | | | — | | | | — | | | | — | | | | — | | | | — | |
| | | | — | | | | — | | | | — | | | | — | | | | — | | | | — | | | | — | | | | — | |
| | | | — | | | | — | | | | — | | | | — | | | | — | | | | — | | | | — | | | | — | |
| | | | — | | | | — | | | | — | | | | — | | | | 4 | | | | 10 | | | | 78 | | | | 10 | |
| | | | — | | | | — | | | | — | | | | — | | | | 45,145 | | | | 17,239 | | | | 1,318 | | | | 16 | |
| | | | — | | | | — | | | | — | | | | — | | | | 6,293 | | | | 1,229 | | | | 865 | | | | 10 | |
| | | | 132 | (l) | | | (28,667 | ) | | | 10,994 | | | | (27,471 | ) | | | 1,043 | | | | (10,922 | ) | | | 5 | | | | 4 | |
| | | | — | | | | — | | | | — | | | | — | | | | — | | | | — | | | | — | | | | — | |
| | | | | | | | | | | | | | | | | | | | | | | | | | | | | | | | | |
| | | | 19,220 | | | | (31,833 | ) | | | 38,453 | | | | (34,639 | ) | | | 202,877 | | | | 158,639 | | | | 3,958 | | | | 2,669 | |
| | | | | | | | | | | | | | | | | | | | | | | | | | | | | | | | | |
| | | | 11,356 | | | | (28,526 | ) | | | (112,175 | ) | | | (24,547 | ) | | | 202,877 | | | | 158,639 | | | | 3,743 | | | | 2,770 | |
| | | | | | | | | | | | | | | | | | | | | | | | | | | | | | | | | |
| | | | | | | | | | | | | | | | | | | | | | | | | | | | | | | | | |
| | | | 31,470 | | | | 59,996 | | | | 437,437 | | | | 461,984 | | | | 424,851 | | | | 266,212 | | | | 3,638 | | | | 868 | |
| | | | | | | | | | | | | | | | | | | | | | | | | | | | | | | | | |
| | | $ | 42,826 | | | $ | 31,470 | | | $ | 325,262 | | | $ | 437,437 | | | $ | 627,728 | | | $ | 424,851 | | | $ | 7,381 | | | $ | 3,638 | |
| | | | | | | | | | | | | | | | | | | | | | | | | | | | | | | | | |
| | | $ | (38 | ) | | $ | — | | | $ | (174 | ) | | $ | (4 | ) | | $ | — | | | $ | — | | | $ | (34 | ) | | $ | 2 | |
| | | | | | | | | | | | | | | | | | | | | | | | | | | | | | | | | |
329
The Hartford Mutual Funds, Inc. and The Hartford Mutual Funds II, Inc.
Statement of Changes in Net Assets — (continued)
(000’s Omitted)
| | | | | | | | | | | | | | | | | |
| | | Select MidCap Value
| | | Select SmallCap Value
| |
| | | Fund | | | Fund | |
| | | For the
| | | | | | For the
| | | | |
| | | Six-Month
| | | | | | Six-Month
| | | | |
| | | Period Ended
| | | For the Year
| | | Period Ended
| | | For the Year
| |
| | | April 30, 2008
| | | Ended
| | | April 30, 2008
| | | Ended
| |
| | | (Unaudited) | | | October 31, 2007 | | | (Unaudited) | | | October 31, 2007 | |
Operations: | | | | | | | | | | | | | | | | |
| Net investment income (loss) | | $ | 453 | | | $ | 243 | | | $ | 603 | | | $ | 935 | |
| Net realized gain (loss) on investments, futures, options and swap contracts and foreign currency transactions | | | (12,459 | ) | | | 10,255 | | | | (1,569 | ) | | | 7,364 | |
| Net unrealized appreciation (depreciation) of investments, futures, options and swap contracts and foreign currency transactions | | | (629 | ) | | | (10,487 | ) | | | (16,922 | ) | | | (897 | ) |
| Payment from affiliate | | | — | | | | — | | | | — | | | | — | |
| | | | | | | | | | | | | | | | | |
| Net increase (decrease) in net assets resulting from operations | | | (12,635 | ) | | | 11 | | | | (17,888 | ) | | | 7,402 | |
| | | | | | | | | | | | | | | | | |
| | | | | | | | | | | | | | | | | |
Distributions to Shareholders: | | | | | | | | | | | | | | | | |
| From net investment income | | | | | | | | | | | | | | | | |
| Class A | | | (34 | ) | | | — | | | | (105 | ) | | | — | |
| Class B | | | — | | | | — | | | | — | | | | — | |
| Class C | | | — | | | | — | | | | — | | | | — | |
| Class E (L) | | | — | | | | — | | | | — | | | | — | |
| Class H (L) | | | — | | | | — | | | | — | | | | — | |
| Class I | | | — | | | | — | | | | — | | | | — | |
| Class L | | | — | | | | — | | | | — | | | | — | |
| Class M (L) | | | — | | | | — | | | | — | | | | — | |
| Class N (L) | | | — | | | | — | | | | — | | | | — | |
| Class R3 | | | — | | | | — | | | | — | | | | — | |
| Class R4 | | | — | | | | — | | | | — | | | | — | |
| Class R5 | | | — | | | | — | | | | — | | | | — | |
| Class Y | | | (316 | ) | | | — | | | | (775 | ) | | | (240 | ) |
| From net realized gain on investments | | | | | | | | | | | | | | | | |
| Class A | | | (3,926 | ) | | | (1,959 | ) | | | (1,215 | ) | | | (30 | ) |
| Class B | | | (444 | ) | | | (170 | ) | | | (38 | ) | | | (1 | ) |
| Class C | | | (831 | ) | | | (295 | ) | | | (49 | ) | | | — | |
| Class E (L) | | | — | | | | — | | | | — | | | | — | |
| Class H (L) | | | — | | | | — | | | | — | | | | — | |
| Class I | | | — | | | | — | | | | — | | | | — | |
| Class L | | | — | | | | — | | | | — | | | | — | |
| Class M (L) | | | — | | | | — | | | | — | | | | — | |
| Class N (L) | | | — | | | | — | | | | — | | | | — | |
| Class R3 | | | — | | | | — | | | | — | | | | — | |
| Class R4 | | | — | | | | — | | | | — | | | | — | |
| Class R5 | | | — | | | | — | | | | — | | | | — | |
| Class Y | | | (5,606 | ) | | | (503 | ) | | | (6,095 | ) | | | (102 | ) |
| Class Z (L) | | | — | | | | — | | | | — | | | | — | |
| | | | | | | | | | | | | | | | | |
| Total distributions | | | (11,157 | ) | | | (2,927 | ) | | | (8,277 | ) | | | (373 | ) |
| | | | | | | | | | | | | | | | | |
| | | | | | | | | | | | | | | | | |
Capital Share Transactions: | | | | | | | | | | | | | | | | |
| Class A | | | (5,634 | ) | | | (7,344 | ) | | | 1,828 | | | | 2,021 | |
| Class B | | | 29 | | | | 357 | | | | 43 | | | | 255 | |
| Class C | | | (1,513 | ) | | | 1,206 | | | | 180 | | | | 448 | |
| Class E (L) | | | — | | | | — | | | | — | | | | — | |
| Class H (L) | | | — | | | | — | | | | — | | | | — | |
| Class I | | | — | | | | — | | | | — | | | | — | |
| Class L | | | — | | | | — | | | | — | | | | — | |
| Class M (L) | | | — | | | | — | | | | — | | | | — | |
| Class N (L) | | | — | | | | — | | | | — | | | | — | |
| Class R3 | | | — | | | | — | | | | — | | | | — | |
| Class R4 | | | — | | | | — | | | | — | | | | — | |
| Class R5 | | | — | | | | — | | | | — | | | | — | |
| Class Y | | | 7,681 | | | | 34,914 | | | | 19,565 | | | | 83,880 | |
| Class Z (L) | | | — | | | | — | | | | — | | | | — | |
| | | | | | | | | | | | | | | | | |
| Net increase (decrease) from capital share transactions | | | 563 | | | | 29,133 | | | | 21,616 | | | | 86,604 | |
| | | | | | | | | | | | | | | | | |
| Net increase (decrease) in net assets | | | (23,229 | ) | | | 26,217 | | | | (4,549 | ) | | | 93,633 | |
| | | | | | | | | | | | | | | | | |
Net Assets: | | | | | | | | | | | | | | | | |
| Beginning of period | | | 105,733 | | | | 79,516 | | | | 111,631 | | | | 17,998 | |
| | | | | | | | | | | | | | | | | |
| End of period | | $ | 82,504 | | | $ | 105,733 | | | $ | 107,082 | | | $ | 111,631 | |
| | | | | | | | | | | | | | | | | |
| Accumulated undistributed (distribution in excess of) net investment income | | $ | 266 | | | $ | 163 | | | $ | 411 | | | $ | 688 | |
| | | | | | | | | | | | | | | | | |
| | |
| (L) | | Classes H, M and N were merged into Class L and Class E and Class Z were merged into Class Y on February 9, 2007. Please refer to Note 8 in the Notes to Financials for further details. |
The accompanying notes are an integral part of these financial statements.
330
| | | | | | | | | | | | | | | | | | | | | | | | | | | | | | | | | |
| | | Short Duration
| | | Small Company
| | | SmallCap Growth
| | | Stock
| |
| | | Fund | | | Fund | | | Fund | | | Fund | |
| | | For the
| | | | | | For the
| | | | | | For the
| | | | | | For the
| | | | |
| | | Six-Month
| | | | | | Six-Month
| | | | | | Six-Month
| | | | | | Six-Month
| | | | |
| | | Period Ended
| | | For the Year
| | | Period Ended
| | | For the Year
| | | Period Ended
| | | For the Year
| | | Period Ended
| | | For the Year
| |
| | | April 30, 2008
| | | Ended
| | | April 30, 2008
| | | Ended
| | | April 30, 2008
| | | Ended
| | | April 30, 2008
| | | Ended
| |
| | | (Unaudited) | | | October 31, 2007 | | | (Unaudited) | | | October 31, 2007 | | | (Unaudited) | | | October 31, 2007 | | | (Unaudited) | | | October 31, 2007 | |
| | | | | | | | | | | | | | | | | | | | | | | | | | | | | | | | | |
| | | $ | 4,446 | | | $ | 8,928 | | | $ | (808 | ) | | $ | (2,189 | ) | | $ | (296 | ) | | $ | (1,297 | ) | | $ | 945 | | | $ | 956 | |
| | | | 262 | | | | (198 | ) | | | (26,275 | ) | | | 66,274 | | | | (27,338 | ) | | | 34,762 | | | | (9,687 | ) | | | 170,454 | |
| | | | (6,201 | ) | | | (1,432 | ) | | | (56,743 | ) | | | 40,992 | | | | (27,641 | ) | | | (4,661 | ) | | | (120,922 | ) | | | 6,660 | |
| | | | — | | | | — | | | | — | | | | 1,808 | | | | — | | | | 39 | | | | — | | | | 1,568 | |
| | | | | | | | | | | | | | | | | | | | | | | | | | | | | | | | | |
| | | | (1,493 | ) | | | 7,298 | | | | (83,826 | ) | | | 106,885 | | | | (55,275 | ) | | | 28,843 | | | | (129,664 | ) | | | 179,638 | |
| | | | | | | | | | | | | | | | | | | | | | | | | | | | | | | | | |
| | | | | | | | | | | | | | | | | | | | | | | | | | | | | | | | | |
| | | | | | | | | | | | | | | | | | | | | | | | | | | | | | | | | |
| | | | | | | | | | | | | | | | | | | | | | | | | | | | | | | | | |
| | | | (833 | ) | | | (1,283 | ) | | | — | | | | — | | | | — | | | | — | | | | (726 | ) | | | (3,091 | ) |
| | | | (100 | ) | | | (233 | ) | | | — | | | | — | | | | — | | | | — | | | | — | | | | — | |
| | | | (441 | ) | | | (588 | ) | | | — | | | | — | | | | — | | | | — | | | | — | | | | — | |
| | | | — | | | | — | | | | — | | | | — | | | | — | | | | — | | | | — | | | | — | |
| | | | — | | | | — | | | | — | | | | — | | | | — | | | | — | | | | — | | | | — | |
| | | | — | | | | — | | | | — | | | | — | | | | — | | | | — | | | | — | | | | — | |
| | | | — | | | | — | | | | — | | | | — | | | | — | | | | — | | | | — | | | | — | |
| | | | — | | | | — | | | | — | | | | — | | | | — | | | | — | | | | — | | | | — | |
| | | | — | | | | — | | | | — | | | | — | | | | — | | | | — | | | | — | | | | — | |
| | | | — | | | | — | | | | — | | | | — | | | | — | | | | — | | | | — | | | | — | |
| | | | — | | | | — | | | | — | | | | — | | | | — | | | | — | | | | — | | | | — | |
| | | | — | | | | — | | | | — | | | | — | | | | — | | | | — | | | | — | | | | — | |
| | | | (3,078 | ) | | | (6,779 | ) | | | — | | | | — | | | | — | | | | — | | | | (469 | ) | | | (1,030 | ) |
| | | | | | | | | | | | | | | | | | | | | | | | | | | | | | | | | |
| | | | — | | | | — | | | | (32,052 | ) | | | (16,937 | ) | | | (16,120 | ) | | | — | | | | — | | | | — | |
| | | | — | | | | — | | | | (6,169 | ) | | | (4,857 | ) | | | (1,911 | ) | | | — | | | | — | | | | — | |
| | | | — | | | | — | | | | (7,503 | ) | | | (4,469 | ) | | | (2,577 | ) | | | — | | | | — | | | | — | |
| | | | — | | | | — | | | | — | | | | — | | | | — | | | | — | | | | — | | | | — | |
| | | | — | | | | — | | | | — | | | | — | | | | — | | | | — | | | | — | | | | — | |
| | | | — | | | | — | | | | (439 | ) | | | (8 | ) | | | (439 | ) | | | — | | | | — | | | | — | |
| | | | — | | | | — | | | | — | | | | — | | | | (13,612 | ) | | | — | | | | — | | | | — | |
| | | | — | | | | — | | | | — | | | | — | | | | — | | | | — | | | | — | | | | — | |
| | | | — | | | | — | | | | — | | | | — | | | | — | | | | — | | | | — | | | | — | |
| | | | — | | | | — | | | | (20 | ) | | | — | | | | (1 | ) | | | — | | | | — | | | | — | |
| | | | — | | | | — | | | | (1,013 | ) | | | — | | | | (30 | ) | | | — | | | | — | | | | — | |
| | | | — | | | | — | | | | (56 | ) | | | — | | | | (1 | ) | | | — | | | | — | | | | — | |
| | | | — | | | | — | | | | (19,626 | ) | | | (8,399 | ) | | | (4,586 | ) | | | — | | | | — | | | | — | |
| | | | — | | | | — | | | | — | | | | — | | | | — | | | | — | | | | — | | | | — | |
| | | | | | | | | | | | | | | | | | | | | | | | | | | | | | | | | |
| | | | (4,452 | ) | | | (8,883 | ) | | | (66,878 | ) | | | (34,670 | ) | | | (39,277 | ) | | | — | | | | (1,195 | ) | | | (4,121 | ) |
| | | | | | | | | | | | | | | | | | | | | | | | | | | | | | | | | |
| | | | | | | | | | | | | | | | | | | | | | | | | | | | | | | | | |
| | | | | | | | | | | | | | | | | | | | | | | | | | | | | | | | | |
| | | | 4,084 | | | | 8,135 | | | | 106,331 | | | | 71,318 | | | | (526 | ) | | | (80,506 | ) | | | (48,291 | ) | | | (121,878 | ) |
| | | | (417 | ) | | | (362 | ) | | | (3,270 | ) | | | (5,491 | ) | | | 213 | | | | (2,918 | ) | | | (33,836 | ) | | | (83,356 | ) |
| | | | 7,753 | | | | 8,105 | | | | 8,269 | | | | 9,046 | | | | (1,194 | ) | | | (1,798 | ) | | | (12,837 | ) | | | (35,239 | ) |
| | | | — | | | | — | | | | — | | | | — | | | | — | | | | — | | | | — | | | | — | |
| | | | — | | | | — | | | | — | | | | — | | | | — | | | | (25,058 | ) | | | — | | | | — | |
| | | | — | | | | — | | | | 9,257 | | | | 3,584 | | | | (247 | ) | | | 4,300 | | | | — | | | | — | |
| | | | — | | | | — | | | | — | | | | — | | | | 4,514 | | | | 35,964 | | | | — | | | | — | |
| | | | — | | | | — | | | | — | | | | — | | | | — | | | | (25,903 | ) | | | — | | | | — | |
| | | | — | | | | — | | | | — | | | | — | | | | — | | | | (10,379 | ) | | | — | | | | — | |
| | | | — | | | | — | | | | 1,815 | | | | 167 | | | | 4 | | | | 10 | | | | (5 | ) | | | 40 | |
| | | | — | | | | — | | | | 8,445 | | | | 8,963 | | | | 1,387 | | | | 302 | | | | — | | | | 40 | |
| | | | — | | | | — | | | | 4,665 | | | | 584 | | | | 1 | | | | 10 | | | | — | | | | 10 | |
| | | | 934 | | | | 41,142 | | | | 73,070 | | | | 60,917 | | | | 11,790 | | | | (63,006 | ) | | | 13,120 | | | | (77,302 | ) |
| | | | — | | | | — | | | | — | | | | — | | | | — | | | | — | | | | — | | | | — | |
| | | | | | | | | | | | | | | | | | | | | | | | | | | | | | | | | |
| | | | 12,354 | | | | 57,020 | | | | 208,582 | | | | 149,088 | | | | 15,942 | | | | (168,982 | ) | | | (81,849 | ) | | | (317,685 | ) |
| | | | | | | | | | | | | | | | | | | | | | | | | | | | | | | | | |
| | | | 6,409 | | | | 55,435 | | | | 57,878 | | | | 221,303 | | | | (78,610 | ) | | | (140,139 | ) | | | (212,708 | ) | | | (142,168 | ) |
| | | | | | | | | | | | | | | | | | | | | | | | | | | | | | | | | |
| | | | | | | | | | | | | | | | | | | | | | | | | | | | | | | | | |
| | | | 205,501 | | | | 150,066 | | | | 624,578 | | | | 403,275 | | | | 392,345 | | | | 532,484 | | | | 1,059,510 | | | | 1,201,678 | |
| | | | | | | | | | | | | | | | | | | | | | | | | | | | | | | | | |
| | | $ | 211,910 | | | $ | 205,501 | | | $ | 682,456 | | | $ | 624,578 | | | $ | 313,735 | | | $ | 392,345 | | | $ | 846,802 | | | $ | 1,059,510 | |
| | | | | | | | | | | | | | | | | | | | | | | | | | | | | | | | | |
| | | $ | 12 | | | $ | 18 | | | $ | (808 | ) | | $ | — | | | $ | (296 | ) | | $ | — | | | $ | 929 | | | $ | 1,179 | |
| | | | | | | | | | | | | | | | | | | | | | | | | | | | | | | | | |
331
The Hartford Mutual Funds, Inc. and The Hartford Mutual Funds II, Inc.
Statement of Changes in Net Assets — (continued)
(000’s Omitted)
| | | | | | | | | | | | | | | | | |
| | | Strategic Income
| | | Target Retirement 2010
| |
| | | Fund | | | Fund | |
| | | For the
| | | | | | For the
| | | | |
| | | Six-Month
| | | For the Period
| | | Six-Month
| | | | |
| | | Period Ended
| | | May 15, 2007 **
| | | Period Ended
| | | For the Year
| |
| | | April 30, 2008
| | | through
| | | April 30, 2008
| | | Ended
| |
| | | (Unaudited) | | | October 31, 2007 | | | (Unaudited) | | | October 31, 2007 | |
Operations: | | | | | | | | | | | | | | | | |
| Net investment income (loss) | | $ | 5,692 | | | $ | 1,318 | | | $ | 152 | | | $ | 150 | |
| Net realized gain (loss) on investments, futures, options and swap contracts and foreign currency transactions | | | 400 | | | | 8 | | | | 96 | | | | 206 | |
| Net unrealized appreciation (depreciation) of investments, futures, options and swap contracts and foreign currency transactions | | | (3,288 | ) | | | (156 | ) | | | (366 | ) | | | 461 | |
| Payment from affiliate | | | — | | | | — | | | | — | | | | — | |
| | | | | | | | | | | | | | | | | |
| Net increase (decrease) in net assets resulting from operations | | | 2,804 | | | | 1,170 | | | | (118 | ) | | | 817 | |
| | | | | | | | | | | | | | | | | |
| | | | | | | | | | | | | | | | | |
Distributions to Shareholders: | | | | | | | | | | | | | | | | |
| From net investment income | | | | | | | | | | | | | | | | |
| Class A | | | (2,495 | ) | | | (879 | ) | | | (251 | ) | | | (124 | ) |
| Class B | | | (136 | ) | | | (37 | ) | | | (16 | ) | | | (8 | ) |
| Class C | | | (1,403 | ) | | | (190 | ) | | | (14 | ) | | | (12 | ) |
| Class E (L) | | | — | | | | — | | | | — | | | | — | |
| Class H (L) | | | — | | | | — | | | | — | | | | — | |
| Class I | | | (742 | ) | | | (114 | ) | | | — | | | | — | |
| Class L | | | — | | | | — | | | | — | | | | — | |
| Class M (L) | | | — | | | | — | | | | — | | | | — | |
| Class N (L) | | | — | | | | — | | | | — | | | | — | |
| Class R3 | | | — | | | | — | | | | — | | | | — | |
| Class R4 | | | — | | | | — | | | | (31 | ) | | | — | |
| Class R5 | | | — | | | | — | | | | (3 | ) | | | — | |
| Class Y | | | (775 | ) | | | (40 | ) | | | (5 | ) | | | (4 | ) |
| From net realized gain on investments | | | | | | | | | | | | | | | | |
| Class A | | | — | | | | — | | | | (155 | ) | | | — | |
| Class B | | | — | | | | — | | | | (10 | ) | | | — | |
| Class C | | | — | | | | — | | | | (14 | ) | | | — | |
| Class E (L) | | | — | | | | — | | | | — | | | | — | |
| Class H (L) | | | — | | | | — | | | | — | | | | — | |
| Class I | | | — | | | | — | | | | — | | | | — | |
| Class L | | | — | | | | — | | | | — | | | | — | |
| Class M (L) | | | — | | | | — | | | | — | | | | — | |
| Class N (L) | | | — | | | | — | | | | — | | | | — | |
| Class R3 | | | — | | | | — | | | | — | | | | — | |
| Class R4 | | | — | | | | — | | | | (9 | ) | | | — | |
| Class R5 | | | — | | | | — | | | | — | | | | — | |
| Class Y | | | — | | | | — | | | | (3 | ) | | | — | |
| Class Z (L) | | | — | | | | — | | | | — | | | | — | |
| | | | | | | | | | | | | | | | | |
| Total distributions | | | (5,551 | ) | | | (1,260 | ) | | | (511 | ) | | | (148 | ) |
| | | | | | | | | | | | | | | | | |
| | | | | | | | | | | | | | | | | |
Capital Share Transactions: | | | | | | | | | | | | | | | | |
| Class A | | | 52,532 | | | | 43,152 | | | | 2,853 | | | | 5,388 | |
| Class B | | | 3,194 | | | | 2,641 | | | | 213 | | | | 263 | |
| Class C | | | 54,162 | | | | 17,197 | | | | (8 | ) | | | 208 | |
| Class E (L) | | | — | | | | — | | | | — | | | | — | |
| Class H (L) | | | — | | | | — | | | | — | | | | — | |
| Class I | | | 19,959 | | | | 11,175 | | | | — | | | | — | |
| Class L | | | — | | | | — | | | | — | | | | — | |
| Class M (L) | | | — | | | | — | | | | — | | | | — | |
| Class N (L) | | | — | | | | — | | | | — | | | | — | |
| Class R3 | | | — | | | | — | | | | 1 | | | | 10 | |
| Class R4 | | | — | | | | — | | | | 3,068 | | | | 434 | |
| Class R5 | | | — | | | | — | | | | 917 | | | | 10 | |
| Class Y | | | 20,189 | | | | 10,636 | | | | 8 | | | | 4 | |
| Class Z (L) | | | — | | | | — | | | | — | | | | — | |
| | | | | | | | | | | | | | | | | |
| Net increase (decrease) from capital share transactions | | | 150,036 | | | | 84,801 | | | | 7,052 | | | | 6,317 | |
| | | | | | | | | | | | | | | | | |
| Net increase (decrease) in net assets | | | 147,289 | | | | 84,711 | | | | 6,423 | | | | 6,986 | |
| | | | | | | | | | | | | | | | | |
Net Assets: | | | | | | | | | | | | | | | | |
| Beginning of period | | | 84,711 | | | | — | | | | 9,440 | | | | 2,454 | |
| | | | | | | | | | | | | | | | | |
| End of period | | $ | 232,000 | | | $ | 84,711 | | | $ | 15,863 | | | $ | 9,440 | |
| | | | | | | | | | | | | | | | | |
| Accumulated undistributed (distribution in excess of) net investment income | | $ | 322 | | | $ | 181 | | | $ | (148 | ) | | $ | 20 | |
| | | | | | | | | | | | | | | | | |
| | |
| ** | | Commencement of operations. |
| (L) | | Classes H, M and N were merged into Class L and Class E and Class Z were merged into Class Y on February 9, 2007. Please refer to Note 8 in the Notes to Financials for further details. |
The accompanying notes are an integral part of these financial statements.
332
| | | | | | | | | | | | | | | | | | | | | | | | | | | | | | | | | |
| | | Target Retirement 2020
| | | Target Retirement 2030
| | | | | | | | | Tax-Free Minnesota
| |
| | | Fund | | | Fund | | | Tax-Free California
| | | Fund | |
| | | For the
| | | | | | For the
| | | | | | Fund | | | For the
| | | | |
| | | Six-Month
| | | | | | Six-Month
| | | | | | For the
| | | | | | Six-Month
| | | | |
| | | Period Ended
| | | For the Year
| | | Period Ended
| | | For the Year
| | | Six-Month
| | | For the Year
| | | Period Ended
| | | For the Year
| |
| | | April 30, 2008
| | | Ended
| | | April 30, 2008
| | | Ended
| | | Period Ended
| | | Ended
| | | April 30, 2008
| | | Ended
| |
| | | (Unaudited) | | | October 31, 2007 | | | (Unaudited) | | | October 31, 2007 | | | April 30, 2008 (Unaudited) | | | October 31, 2007 | | | (Unaudited) | | | October 31, 2007 | |
| | | | | | | | | | | | | | | | | | | | | | | | | | | | | | | | | |
| | | $ | 267 | | | $ | 178 | | | $ | 133 | | | $ | 66 | | | $ | 933 | | | $ | 1,379 | | | $ | 762 | | | $ | 1,488 | |
| | | | 382 | | | | 192 | | | | 759 | | | | 187 | | | | (811 | ) | | | (267 | ) | | | 51 | | | | (114 | ) |
| | | | (1,510 | ) | | | 1,155 | | | | (1,839 | ) | | | 1,356 | | | | (1,821 | ) | | | (1,256 | ) | | | (813 | ) | | | (1,098 | ) |
| | | | — | | | | — | | | | — | | | | — | | | | — | | | | — | | | | — | | | | — | |
| | | | | | | | | | | | | | | | | | | | | | | | | | | | | | | | | |
| | | | (861 | ) | | | 1,525 | | | | (947 | ) | | | 1,609 | | | | (1,699 | ) | | | (144 | ) | | | — | | | | 276 | |
| | | | | | | | | | | | | | | | | | | | | | | | | | | | | | | | | |
| | | | | | | | | | | | | | | | | | | | | | | | | | | | | | | | | |
| | | | | | | | | | | | | | | | | | | | | | | | | | | | | | | | | |
| | | | | | | | | | | | | | | | | | | | | | | | | | | | | | | | | |
| | | | (585 | ) | | | (165 | ) | | | (532 | ) | | | (39 | ) | | | (814 | ) | | | (1,171 | ) | | | (212 | ) | | | (357 | ) |
| | | | (23 | ) | | | (5 | ) | | | (17 | ) | | | (3 | ) | | | (34 | ) | | | (57 | ) | | | (13 | ) | | | (27 | ) |
| | | | (19 | ) | | | (7 | ) | | | (14 | ) | | | (2 | ) | | | (96 | ) | | | (139 | ) | | | (12 | ) | | | (24 | ) |
| | | | — | | | | — | | | | — | | | | — | | | | — | | | | — | | | | — | | | | (249 | ) |
| | | | — | | | | — | | | | — | | | | — | | | | — | | | | — | | | | — | | | | (1 | ) |
| | | | — | | | | — | | | | — | | | | — | | | | — | | | | — | | | | — | | | | — | |
| | | | — | | | | — | | | | — | | | | — | | | | — | | | | — | | | | (59 | ) | | | (122 | ) |
| | | | — | | | | — | | | | — | | | | — | | | | — | | | | — | | | | — | | | | (1 | ) |
| | | | — | | | | — | | | | — | | | | — | | | | — | | | | — | | | | — | | | | (1 | ) |
| | | | — | | | | — | | | | — | | | | — | | | | — | | | | — | | | | — | | | | — | |
| | | | (66 | ) | | | (2 | ) | | | (34 | ) | | | — | | | | — | | | | — | | | | — | | | | — | |
| | | | (22 | ) | | | — | | | | — | | | | — | | | | — | | | | — | | | | — | | | | — | |
| | | | — | | | | — | | | | (1 | ) | | | — | | | | — | | | | — | | | | (464 | ) | | | (713 | ) |
| | | | | | | | | | | | | | | | | | | | | | | | | | | | | | | | | |
| | | | (138 | ) | | | (9 | ) | | | (147 | ) | | | (1 | ) | | | — | | | | — | | | | — | | | | (40 | ) |
| | | | (6 | ) | | | (1 | ) | | | (5 | ) | | | — | | | | — | | | | — | | | | — | | | | (5 | ) |
| | | | (5 | ) | | | (2 | ) | | | (4 | ) | | | — | | | | — | | | | — | | | | — | | | | (2 | ) |
| | | | — | | | | — | | | | — | | | | — | | | | — | | | | — | | | | — | | | | (132 | ) |
| | | | — | | | | — | | | | — | | | | — | | | | — | | | | — | | | | — | | | | (1 | ) |
| | | | — | | | | — | | | | — | | | | — | | | | — | | | | — | | | | — | | | | — | |
| | | | — | | | | — | | | | — | | | | — | | | | — | | | | — | | | | — | | | | (15 | ) |
| | | | — | | | | — | | | | — | | | | — | | | | — | | | | — | | | | — | | | | (1 | ) |
| | | | — | | | | — | | | | — | | | | — | | | | — | | | | — | | | | — | | | | (1 | ) |
| | | | — | | | | — | | | | — | | | | — | | | | — | | | | — | | | | — | | | | — | |
| | | | (13 | ) | | | — | | | | (7 | ) | | | — | | | | — | | | | — | | | | — | | | | — | |
| | | | — | | | | — | | | | — | | | | — | | | | — | | | | — | | | | — | | | | — | |
| | | | — | | | | — | | | | — | | | | — | | | | — | | | | — | | | | — | | | | — | |
| | | | — | | | | — | | | | — | | | | — | | | | — | | | | — | | | | — | | | | — | |
| | | | | | | | | | | | | | | | | | | | | | | | | | | | | | | | | |
| | | | (877 | ) | | | (191 | ) | | | (761 | ) | | | (45 | ) | | | (944 | ) | | | (1,367 | ) | | | (760 | ) | | | (1,692 | ) |
| | | | | | | | | | | | | | | | | | | | | | | | | | | | | | | | | |
| | | | | | | | | | | | | | | | | | | | | | | | | | | | | | | | | |
| | | | | | | | | | | | | | | | | | | | | | | | | | | | | | | | | |
| | | | 2,755 | | | | 14,410 | | | | 3,284 | | | | 11,970 | | | | (3,260 | ) | | | 14,112 | | | | 550 | | | | 3,419 | |
| | | | 239 | | | | 367 | | | | 254 | | | | 160 | | | | (157 | ) | | | 432 | | | | 13 | | | | (14 | ) |
| | | | 270 | | | | 249 | | | | 563 | | | | 280 | | | | 132 | | | | 1,896 | | | | 453 | | | | 180 | |
| | | | — | | | | — | | | | — | | | | — | | | | — | | | | — | | | | — | | | | (21,995 | ) |
| | | | — | | | | — | | | | — | | | | — | | | | — | | | | — | | | | — | | | | (125 | ) |
| | | | — | | | | — | | | | — | | | | — | | | | — | | | | — | | | | — | | | | — | |
| | | | — | | | | — | | | | — | | | | — | | | | — | | | | — | | | | (86 | ) | | | 405 | |
| | | | — | | | | — | | | | — | | | | — | | | | — | | | | — | | | | — | | | | (106 | ) |
| | | | — | | | | — | | | | — | | | | — | | | | — | | | | — | | | | — | | | | (195 | ) |
| | | | — | | | | 10 | | | | — | | | | 10 | | | | — | | | | — | | | | — | | | | — | |
| | | | 5,364 | | | | 1,095 | | | | 5,224 | | | | 618 | | | | — | | | | — | | | | — | | | | — | |
| | | | 5,517 | | | | 10 | | | | 1,487 | | | | 10 | | | | — | | | | — | | | | — | | | | — | |
| | | | 1 | | | | — | | | | 2 | | | | — | | | | — | | | | — | | | | (1,054 | ) | | | 21,018 | |
| | | | — | | | | — | | | | — | | | | — | | | | — | | | | — | | | | — | | | | — | |
| | | | | | | | | | | | | | | | | | | | | | | | | | | | | | | | | |
| | | | 14,146 | | | | 16,141 | | | | 10,814 | | | | 13,048 | | | | (3,285 | ) | | | 16,440 | | | | (124 | ) | | | 2,587 | |
| | | | | | | | | | | | | | | | | | | | | | | | | | | | | | | | | |
| | | | 12,408 | | | | 17,475 | | | | 9,106 | | | | 14,612 | | | | (5,928 | ) | | | 14,929 | | | | (884 | ) | | | 1,171 | |
| | | | | | | | | | | | | | | | | | | | | | | | | | | | | | | | | |
| | | | | | | | | | | | | | | | | | | | | | | | | | | | | | | | | |
| | | | 20,239 | | | | 2,764 | | | | 16,887 | | | | 2,275 | | | | 44,731 | | | | 29,802 | | | | 36,141 | | | | 34,970 | |
| | | | | | | | | | | | | | | | | | | | | | | | | | | | | | | | | |
| | | $ | 32,647 | | | $ | 20,239 | | | $ | 25,993 | | | $ | 16,887 | | | $ | 38,803 | | | $ | 44,731 | | | $ | 35,257 | | | $ | 36,141 | |
| | | | | | | | | | | | | | | | | | | | | | | | | | | | | | | | | |
| | | $ | (423 | ) | | $ | 25 | | | $ | (417 | ) | | $ | 48 | | | $ | 3 | | | $ | 14 | | | $ | 5 | | | $ | 3 | |
| | | | | | | | | | | | | | | | | | | | | | | | | | | | | | | | | |
333
The Hartford Mutual Funds, Inc. and The Hartford Mutual Funds II, Inc.
Statement of Changes in Net Assets — (continued)
(000’s Omitted)
| | | | | | | | | | | | | | | | | |
| | | Tax-Free National
| | | Tax-Free New York
| |
| | | Fund | | | Fund | |
| | | For the
| | | | | | For the
| | | | |
| | | Six-Month
| | | | | | Six-Month
| | | | |
| | | Period Ended
| | | For the Year
| | | Period Ended
| | | For the Year
| |
| | | April 30, 2008
| | | Ended
| | | April 30, 2008
| | | Ended
| |
| | | (Unaudited) | | | October 31, 2007 | | | (Unaudited) | | | October 31, 2007 | |
Operations: | | | | | | | | | | | | | | | | |
| Net investment income (loss) | | $ | 4,394 | | | $ | 6,502 | | | $ | 308 | | | $ | 589 | |
| Net realized gain (loss) on investments, futures, options and swap contracts and foreign currency transactions | | | (5,675 | ) | | | (887 | ) | | | (10 | ) | | | (52 | ) |
| Net unrealized appreciation (depreciation) of investments, futures, options and swap contracts and foreign currency transactions | | | (4,741 | ) | | | (5,677 | ) | | | (434 | ) | | | (486 | ) |
| Payment from affiliate | | | — | | | | — | | | | — | | | | — | |
| | | | | | | | | | | | | | | | | |
| Net increase (decrease) in net assets resulting from operations | | | (6,022 | ) | | | (62 | ) | | | (136 | ) | | | 51 | |
| | | | | | | | | | | | | | | | | |
| | | | | | | | | | | | | | | | | |
Distributions to Shareholders: | | | | | | | | | | | | | | | | |
| From net investment income | | | | | | | | | | | | | | | | |
| Class A | | | (2,927 | ) | | | (3,965 | ) | | | (238 | ) | | | (444 | ) |
| Class B | | | (129 | ) | | | (249 | ) | | | (28 | ) | | | (57 | ) |
| Class C | | | (477 | ) | | | (643 | ) | | | (45 | ) | | | (85 | ) |
| Class E (L) | | | — | | | | (321 | ) | | | — | | | | — | |
| Class H (L) | | | — | | | | (1 | ) | | | — | | | | — | |
| Class I | | | (92 | ) | | | (18 | ) | | | — | | | | — | |
| Class L | | | (184 | ) | | | (349 | ) | | | — | | | | — | |
| Class M (L) | | | — | | | | (11 | ) | | | — | | | | — | |
| Class N (L) | | | — | | | | (3 | ) | | | — | | | | — | |
| Class R3 | | | — | | | | — | | | | — | | | | — | |
| Class R4 | | | — | | | | — | | | | — | | | | — | |
| Class R5 | | | — | | | | — | | | | — | | | | — | |
| Class Y | | | (591 | ) | | | (878 | ) | | | — | | | | — | |
| From net realized gain on investments | | | | | | | | | | | | | | | | |
| Class A | | | — | | | | (206 | ) | | | — | | | | (61 | ) |
| Class B | | | — | | | | (19 | ) | | | — | | | | (10 | ) |
| Class C | | | — | | | | (37 | ) | | | — | | | | (14 | ) |
| Class E (L) | | | — | | | | (83 | ) | | | — | | | | — | |
| Class H (L) | | | — | | | | — | | | | — | | | | — | |
| Class I | | | — | | | | — | | | | — | | | | — | |
| Class L | | | — | | | | (22 | ) | | | — | | | | — | |
| Class M (L) | | | — | | | | (4 | ) | | | — | | | | — | |
| Class N (L) | | | — | | | | (1 | ) | | | — | | | | — | |
| Class R3 | | | — | | | | — | | | | — | | | | — | |
| Class R4 | | | — | | | | — | | | | — | | | | — | |
| Class R5 | | | — | | | | — | | | | — | | | | — | |
| Class Y | | | — | | | | — | | | | — | | | | — | |
| Class Z (L) | | | — | | | | — | | | | — | | | | — | |
| | | | | | | | | | | | | | | | | |
| Total distributions | | | (4,400 | ) | | | (6,810 | ) | | | (311 | ) | | | (671 | ) |
| | | | | | | | | | | | | | | | | |
| | | | | | | | | | | | | | | | | |
Capital Share Transactions: | | | | | | | | | | | | | | | | |
| Class A | | | 28,141 | | | | 47,774 | | | | 900 | | | | 536 | |
| Class B | | | (104 | ) | | | 411 | | | | (59 | ) | | | (57 | ) |
| Class C | | | 5,733 | | | | 10,438 | | | | 197 | | | | 281 | |
| Class E (L) | | | — | | | | (23,648 | ) | | | — | | | | — | |
| Class H (L) | | | — | | | | (174 | ) | | | — | | | | — | |
| Class I | | | 791 | | | | 3,499 | | | | — | | | | — | |
| Class L | | | (477 | ) | | | 1,084 | | | | — | | | | — | |
| Class M (L) | | | — | | | | (1,216 | ) | | | — | | | | — | |
| Class N (L) | | | — | | | | (373 | ) | | | — | | | | — | |
| Class R3 | | | — | | | | — | | | | — | | | | — | |
| Class R4 | | | — | | | | — | | | | — | | | | — | |
| Class R5 | | | — | | | | — | | | | — | | | | — | |
| Class Y | | | (2,629 | ) | | | 22,088 | | | | — | | | | — | |
| Class Z (L) | | | — | | | | — | | | | — | | | | — | |
| | | | | | | | | | | | | | | | | |
| Net increase (decrease) from capital share transactions | | | 31,455 | | | | 59,883 | | | | 1,038 | | | | 760 | |
| | | | | | | | | | | | | | | | | |
| Net increase (decrease) in net assets | | | 21,033 | | | | 53,011 | | | | 591 | | | | 140 | |
| | | | | | | | | | | | | | | | | |
Net Assets: | | | | | | | | | | | | | | | | |
| Beginning of period | | | 182,925 | | | | 129,914 | | | | 15,622 | | | | 15,482 | |
| | | | | | | | | | | | | | | | | |
| End of period | | $ | 203,958 | | | $ | 182,925 | | | $ | 16,213 | | | $ | 15,622 | |
| | | | | | | | | | | | | | | | | |
| Accumulated undistributed (distribution in excess of) net investment income | | $ | 61 | | | $ | 67 | | | $ | 2 | | | $ | 5 | |
| | | | | | | | | | | | | | | | | |
| | |
| (L) | | Classes H, M and N were merged into Class L and Class E and Class Z were merged into Class Y on February 9, 2007. Please refer to Note 8 in the Notes to Financials for further details. |
The accompanying notes are an integral part of these financial statements.
334
| | | | | | | | | | | | | | | | | | | | | | | | | | | | | | | | | |
| | | Total Return Bond
| | | U.S. Government Securities
| | | Value
| | | Value Opportunities
| |
| | | Fund | | | Fund | | | Fund | | | Fund | |
| | | For the
| | | | | | For the
| | | | | | For the
| | | | | | For the
| | | | |
| | | Six-Month
| | | | | | Six-Month
| | | | | | Six-Month
| | | | | | Six-Month
| | | | |
| | | Period Ended
| | | For the Year
| | | Period Ended
| | | For the Year
| | | Period Ended
| | | For the Year
| | | Period Ended
| | | For the Year
| |
| | | April 30, 2008
| | | Ended
| | | April 30, 2008
| | | Ended
| | | April 30, 2008
| | | Ended
| | | April 30, 2008
| | | Ended
| |
| | | (Unaudited) | | | October 31, 2007 | | | (Unaudited) | | | October 31, 2007 | | | (Unaudited) | | | October 31, 2007 | | | (Unaudited) | | | October 31, 2007 | |
| | | | | | | | | | | | | | | | | | | | | | | | | | | | | | | | | |
| | | $ | 29,633 | | | $ | 47,453 | | | $ | 4,877 | | | $ | 9,325 | | | $ | 3,145 | | | $ | 4,208 | | | $ | 767 | | | $ | 897 | |
| | | | 10,776 | | | | 3,072 | | | | 4,029 | | | | (1,114 | ) | | | 724 | | | | 18,974 | | | | (12,481 | ) | | | 41,292 | |
| | | | (18,447 | ) | | | (9,619 | ) | | | (5,050 | ) | | | (2,297 | ) | | | (31,379 | ) | | | 35,852 | | | | (41,595 | ) | | | (23,144 | ) |
| | | | — | | | | — | | | | — | | | | — | | | | — | | | | 11 | | | | — | | | | 16 | |
| | | | | | | | | | | | | | | | | | | | | | | | | | | | | | | | | |
| | | | 21,962 | | | | 40,906 | | | | 3,856 | | | | 5,914 | | | | (27,510 | ) | | | 59,045 | | | | (53,309 | ) | | | 19,061 | |
| | | | | | | | | | | | | | | | | | | | | | | | | | | | | | | | | |
| | | | | | | | | | | | | | | | | | | | | | | | | | | | | | | | | |
| | | | | | | | | | | | | | | | | | | | | | | | | | | | | | | | | |
| | | | | | | | | | | | | | | | | | | | | | | | | | | | | | | | | |
| | | | (16,353 | ) | | | (24,374 | ) | | | (1,413 | ) | | | (2,302 | ) | | | (680 | ) | | | — | | | | (466 | ) | | | (987 | ) |
| | | | (1,851 | ) | | | (3,230 | ) | | | (291 | ) | | | (624 | ) | | | — | | | | — | | | | — | | | | (49 | ) |
| | | | (2,097 | ) | | | (3,121 | ) | | | (398 | ) | | | (420 | ) | | | (2 | ) | | | — | | | | — | | | | (123 | ) |
| | | | — | | | | — | | | | — | | | | (1,114 | ) | | | — | | | | — | | | | — | | | | — | |
| | | | — | | | | — | | | | — | | | | (18 | ) | | | — | | | | — | | | | — | | | | — | |
| | | | (121 | ) | | | (96 | ) | | | — | | | | — | | | | (1 | ) | | | — | | | | (30 | ) | | | (3 | ) |
| | | | — | | | | — | | | | (732 | ) | | | (1,572 | ) | | | — | | | | — | | | | (198 | ) | | | (275 | ) |
| | | | — | | | | — | | | | — | | | | (20 | ) | | | — | | | | — | | | | — | | | | (4 | ) |
| | | | — | | | | — | | | | — | | | | (7 | ) | | | — | | | | — | | | | — | | | | (3 | ) |
| | | | — | | | | — | | | | — | | | | — | | | | — | | | | — | | | | (2 | ) | | | — | |
| | | | (153 | ) | | | (12 | ) | | | — | | | | — | | | | — | | | | — | | | | (6 | ) | | | — | |
| | | | (6 | ) | | | (1 | ) | | | — | | | | — | | | | — | | | | — | | | | — | | | | — | |
| | | | (11,475 | ) | | | (16,520 | ) | | | (1,941 | ) | | | (3,159 | ) | | | (3,717 | ) | | | (1,650 | ) | | | (198 | ) | | | — | |
| | | | | | | | | | | | | | | | | | | | | | | | | | | | | | | | | |
| | | | — | | | | — | | | | — | | | | — | | | | (4,005 | ) | | | (4,894 | ) | | | (22,278 | ) | | | (9,357 | ) |
| | | | — | | | | — | | | | — | | | | — | | | | (599 | ) | | | (754 | ) | | | (3,201 | ) | | | (1,654 | ) |
| | | | — | | | | — | | | | — | | | | — | | | | (630 | ) | | | (809 | ) | | | (5,032 | ) | | | (2,027 | ) |
| | | | — | | | | — | | | | — | | | | — | | | | — | | | | — | | | | — | | | | — | |
| | | | — | | | | — | | | | — | | | | — | | | | — | | | | — | | | | — | | | | (326 | ) |
| | | | — | | | | — | | | | — | | | | — | | | | (2 | ) | | | — | | | | (676 | ) | | | (1 | ) |
| | | | — | | | | — | | | | — | | | | — | | | | — | | | | — | | | | (6,052 | ) | | | (2,739 | ) |
| | | | — | | | | — | | | | — | | | | — | | | | — | | | | — | | | | — | | | | (627 | ) |
| | | | — | | | | — | | | | — | | | | — | | | | — | | | | — | | | | — | | | | (186 | ) |
| | | | — | | | | — | | | | — | | | | — | | | | (1 | ) | | | — | | | | (12 | ) | | | — | |
| | | | — | | | | — | | | | — | | | | — | | | | (1 | ) | | | — | | | | (123 | ) | | | — | |
| | | | — | | | | — | | | | — | | | | — | | | | (1 | ) | | | — | | | | (1 | ) | | | — | |
| | | | — | | | | — | | | | — | | | | — | | | | (13,683 | ) | | | (9,092 | ) | | | (3,723 | ) | | | (4,266 | ) |
| | | | — | | | | — | | | | — | | | | — | | | | — | | | | — | | | | — | | | | — | |
| | | | | | | | | | | | | | | | | | | | | | | | | | | | | | | | | |
| | | | (32,056 | ) | | | (47,354 | ) | | | (4,775 | ) | | | (9,236 | ) | | | (23,322 | ) | | | (17,199 | ) | | | (41,998 | ) | | | (22,627 | ) |
| | | | | | | | | | | | | | | | | | | | | | | | | | | | | | | | | |
| | | | | | | | | | | | | | | | | | | | | | | | | | | | | | | | | |
| | | | | | | | | | | | | | | | | | | | | | | | | | | | | | | | | |
| | | | 93,734 | | | | 172,188 | | | | 14,600 | | | | 9,399 | | | | 3,055 | | | | 1,573 | | | | 4,591 | | | | 46,067 | |
| | | | 3,420 | | | | 3,481 | | | | 1,382 | | | | (2,901 | ) | | | (167 | ) | | | (87 | ) | | | (18 | ) | | | 2,594 | |
| | | | 23,659 | | | | 10,139 | | | | 10,167 | | | | 4,947 | | | | 871 | | | | (372 | ) | | | 396 | | | | 10,458 | |
| | | | — | | | | — | | | | — | | | | (117,292 | ) | | | — | | | | — | | | | — | | | | — | |
| | | | — | | | | — | | | | — | | | | (317 | ) | | | — | | | | — | | | | — | | | | (2,422 | ) |
| | | | 3,111 | | | | 3,007 | | | | — | | | | — | | | | 195 | | | | 45 | | | | (1,683 | ) | | | 4,834 | |
| | | | — | | | | — | | | | (2,447 | ) | | | (1,191 | ) | | | — | | | | — | | | | 2,562 | | | | 6,642 | |
| | | | — | | | | — | | | | — | | | | (1,163 | ) | | | — | | | | — | | | | — | | | | (5,452 | ) |
| | | | — | | | | — | | | | — | | | | (478 | ) | | | — | | | | — | | | | — | | | | (1,723 | ) |
| | | | 25 | | | | 10 | | | | — | | | | — | | | | 1 | | | | 10 | | | | 835 | | | | 125 | |
| | | | 6,975 | | | | 2,917 | | | | — | | | | — | | | | 1 | | | | 10 | | | | 2,011 | | | | 728 | |
| | | | 166 | | | | 140 | | | | — | | | | — | | | | 1 | | | | 10 | | | | 2 | | | | 10 | |
| | | | 170,353 | | | | 75,992 | | | | (3,290 | ) | | | 108,077 | | | | 47,631 | | | | 198,136 | | | | 11,068 | | | | (72,513 | ) |
| | | | — | | | | — | | | | — | | | | — | | | | — | | | | — | | | | — | | | | — | |
| | | | | | | | | | | | | | | | | | | | | | | | | | | | | | | | | |
| | | | 301,443 | | | | 267,874 | | | | 20,412 | | | | (919 | ) | | | 51,588 | | | | 199,325 | | | | 19,764 | | | | (10,652 | ) |
| | | | | | | | | | | | | | | | | | | | | | | | | | | | | | | | | |
| | | | 291,349 | | | | 261,426 | | | | 19,493 | | | | (4,241 | ) | | | 756 | | | | 241,171 | | | | (75,543 | ) | | | (14,218 | ) |
| | | | | | | | | | | | | | | | | | | | | | | | | | | | | | | | | |
| | | | | | | | | | | | | | | | | | | | | | | | | | | | | | | | | |
| | | | 1,134,122 | | | | 872,696 | | | | 193,326 | | | | 197,567 | | | | 417,601 | | | | 176,430 | | | | 286,474 | | | | 300,692 | |
| | | | | | | | | | | | | | | | | | | | | | | | | | | | | | | | | |
| | | $ | 1,425,471 | | | $ | 1,134,122 | | | $ | 212,819 | | | $ | 193,326 | | | $ | 418,357 | | | $ | 417,601 | | | $ | 210,931 | | | $ | 286,474 | |
| | | | | | | | | | | | | | | | | | | | | | | | | | | | | | | | | |
| | | $ | 545 | | | $ | 2,968 | | | $ | 131 | | | $ | 29 | | | $ | 2,317 | | | $ | 3,572 | | | $ | 758 | | | $ | 891 | |
| | | | | | | | | | | | | | | | | | | | | | | | | | | | | | | | | |
335
The Hartford Mutual Funds, Inc. and The Hartford Mutual Funds II, Inc.
Notes to Financial Statements
April 30, 2008 (Unaudited)
(000’s Omitted)
The Hartford Mutual Funds, Inc. and The Hartford Mutual Funds II, Inc. (the “Companies”) are open-end management investment companies comprised of fifty-five portfolios (each a “Fund” or together the “Funds”). Fifty-four portfolios are included in these Financial Statements. They are The Hartford Advisers Fund (Advisers Fund), The Hartford Balanced Allocation Fund (Balanced Allocation Fund), The Hartford Balanced Income Fund (Balanced Income Fund), The Hartford Capital Appreciation Fund (Capital Appreciation Fund), The Hartford Capital Appreciation II Fund (Capital Appreciation II Fund), The Hartford Checks and Balances Fund (Checks and Balances Fund), The Hartford Conservative Allocation Fund (Conservative Allocation Fund), The Hartford Disciplined Equity Fund (Disciplined Equity Fund), The Hartford Dividend and Growth Fund (Dividend and Growth Fund), The Hartford Equity Growth Allocation Fund (Equity Growth Allocation Fund), The Hartford Equity Income Fund (Equity Income Fund), The Hartford Floating Rate Fund (Floating Rate Fund), The Hartford Fundamental Growth Fund (Fundamental Growth Fund), The Hartford Global Communications Fund (Global Communications Fund), The Hartford Global Equity Fund (Global Equity Fund), The Hartford Global Financial Services Fund (Global Financial Services Fund), The Hartford Global Growth Fund (Global Growth Fund), The Hartford Global Health Fund (Global Health Fund), The Hartford Global Technology Fund (Global Technology Fund), The Hartford Growth Allocation Fund (Growth Allocation Fund), The Hartford Growth Fund (Growth Fund), The Hartford Growth Opportunities Fund (Growth Opportunities Fund), The Hartford High Yield Fund (High Yield Fund), The Hartford High Yield Municipal Bond Fund (High Yield Municipal Bond Fund), The Hartford Income Allocation Fund (Income Allocation Fund), The Hartford Income Fund (Income Fund), The Hartford Inflation Plus Fund (Inflation Plus Fund), The Hartford International Growth Fund (International Growth Fund), The Hartford International Opportunities Fund (International Opportunities Fund), The Hartford International Small Company Fund (International Small Company Fund), The Hartford LargeCap Growth Fund (LargeCap Growth Fund), The Hartford MidCap Fund (MidCap Fund), The Hartford MidCap Growth Fund (MidCap Growth Fund), The Hartford MidCap Value Fund (MidCap Value Fund), The Hartford Money Market Fund (Money Market Fund), The Hartford Retirement Income Fund (Retirement Income Fund), The Hartford Select MidCap Value Fund (Select MidCap Value Fund), The Hartford Select SmallCap Value Fund (Select SmallCap Value Fund), The Hartford Short Duration Fund (Short Duration Fund), The Hartford Small Company Fund (Small Company Fund), The Hartford SmallCap Growth Fund (SmallCap Growth Fund), The Hartford Stock Fund (Stock Fund), The Hartford Strategic Income Fund (Strategic Income Fund), The Hartford Target Retirement 2010 Fund (Target Retirement 2010 Fund), The Hartford Target Retirement 2020 Fund (Target Retirement 2020 Fund), The Hartford Target Retirement 2030 Fund (Target Retirement 2030 Fund), The Hartford Tax-Free California Fund (Tax-Free California Fund), The Hartford Tax-Free Minnesota Fund (Tax-Free Minnesota Fund), The Hartford Tax-Free National Fund (Tax-Free National Fund), The Hartford Tax-Free New York Fund (Tax-Free New York Fund), The Hartford Total Return Bond Fund (Total Return Bond Fund), The Hartford U.S. Government Securities Fund (U.S. Government Securities Fund), The Hartford Value Fund (Value Fund) and The Hartford Value Opportunities Fund (Value Opportunities Fund).
The Companies are organized under the laws of the State of Maryland and are registered with the Securities and Exchange Commission (“SEC”) under the Investment Company Act of 1940, as amended (“1940 Act”), as diversified open-end management investment companies, except for Floating Rate Fund, Global Communications Fund, Global Financial Services Fund, Global Health Fund, Global Technology Fund, High Yield Municipal Bond Fund, Inflation Plus Fund, Tax-Free California Fund and Tax-Free New York Fund, which are non-diversified.
Class A shares are sold with a front-end sales charge of up to 5.50%, except for High Yield Fund, High Yield Municipal Bond Fund, Income Allocation Fund, Income Fund, Inflation Plus Fund, Strategic Income Fund, Tax-Free California Fund, Tax-Free Minnesota Fund, Tax-Free National Fund, Tax-Free New York Fund, Total Return Bond Fund and U.S. Government Securities Fund, which have a maximum front-end sales charge of up to 4.50%; and the Floating Rate Fund and Short Duration Fund have a maximum front-end sales charge of up to 3.00%. A front-end charge is not assessed on Class A shares for Money Market Fund. Class B shares are sold with a contingent deferred sales charge which is assessed on the lesser of the net asset value (“NAV”) of the shares at the time of redemption or the original purchase price, and declines from up to 5.00% to zero depending on the period of time the shares are held. Class C shares are sold with a contingent deferred sales charge of up to 1.00% on shares redeemed within 12 months of purchase. Class I shares are sold without sales charges to certain eligible investors through advisory fee-based wrap programs. Class L shares are sold with a sales charge of up to 4.75%. Classes R3, R4, R5 shares, which are offered to employer-sponsored retirement plans, and Y shares, which are sold to certain eligible institutional investors are sold without a sales charge. All classes of shares have identical voting, redemption, dividend, liquidation and other rights and the same terms and conditions, except that each class may have different expenses, which may affect performance, and except that Class B shares automatically converts to Class A shares after 8 years.
Balanced Allocation Fund, Checks and Balances Fund, Conservative Allocation Fund, Equity Growth Allocation Fund, Growth Allocation Fund and Income Allocation Fund (collectively, the “Asset Allocation Funds”) and Retirement Income Fund, Target Retirement 2010 Fund, Target Retirement 2020 Fund and Target Retirement 2030 Fund (collectively, the “Target Retirement Funds”) are referred to as “Fund of Funds”, which invests the majority of its assets in Class Y shares of other Hartford mutual funds: domestic and international equity funds and fixed income funds (“Underlying Funds”) as well as certain exchange-traded funds (“ETFs”). The Asset Allocation Funds and the Target Retirement Funds seek their investment goals through implementation of a strategic asset allocation recommendation provided by Hartford Investment Management Company (“Hartford Investment Management”), a wholly-owned indirect subsidiary of The Hartford Financial Services Group, Inc. (“The Hartford”). Checks and Balances Fund seeks its investment goal through investment in a combination of Hartford mutual funds: Capital Appreciation Fund, Dividend and Growth Fund and Total Return Bond Fund. Checks and Balances Fund is managed by Hartford Investment Financial Services, LLC’s (“HIFSCO”) Investment Oversight Committee.
| |
| 2. | Significant Accounting Policies: |
The following is a summary of significant accounting policies of the Funds, which are in accordance with U.S. Generally Accepted Accounting Principles (“GAAP”) in the investment company industry:
| | |
| | a) | Security Transactions and Investment Income — Security transactions are recorded on the trade date (the date the order to buy or sell is executed). Security gains and losses are determined on the basis of identified cost. |
336
Trade date for senior floating rate interests purchased in the primary market is considered the date on which the loan allocations are determined. Trade date for senior floating rate interests purchased in the secondary market is the date on which the transaction is entered into.
Dividend income is accrued as of the ex-dividend date, except that certain dividends for foreign securities where the ex-dividend date may have passed are recorded as soon as the Fund is informed of the dividend in the exercise of reasonable diligence. Interest income, including amortization of premium and accretion of discounts, is accrued on a daily basis. Income and capital gain distributions from Underlying Funds are recorded on the ex-dividend date.
| | |
| | b) | Security Valuation — Except for the Money Market Fund, the Funds (references to “Funds” in this section relate, if applicable, to certain Underlying Funds in the case of a Fund of Funds) generally use market prices in valuing portfolio securities. If market quotations are not readily available or are deemed unreliable, a Fund will use the fair value of the security as determined in good faith under policies and procedures established by and under the supervision of that Fund’s Board of Directors. Market prices may be deemed unreliable, for example, if a security is thinly traded or if an event has occurred after the close of the exchange on which a portfolio security is principally traded but before the close of the New York Stock Exchange (the “Exchange”) (normally 4:00 p.m. Eastern Time, referred to as the “Valuation Time”) that is expected to affect the value of the portfolio security. The circumstances in which a Fund may use fair value pricing include, among others: (i) the occurrence of events that are significant to a particular issuer, such as mergers, restructuring or defaults; (ii) the occurrence of events that are significant to an entire market, such as natural disasters in a particular region or governmental actions; (iii) trading restrictions on securities; (iv) thinly traded securities and (v) market events such as trading halts and early market closings. In addition, with respect to the valuation of securities principally traded on foreign markets, each Fund uses a fair value pricing service approved by that Fund’s Board of Directors which employs quantitative models to adjust for “stale” prices caused by the movement of other markets and other factors occurring after the close of the foreign markets but before the close of the Exchange. Securities that are principally traded on foreign markets may trade on days that are not business days of the Funds. Because the NAV of each Fund’s shares is determined only on business days of the Funds, the value of the portfolio securities of a Fund that invests in foreign securities may change on days when a shareholder will not be able to purchase or redeem shares of the Fund. Fair value pricing is subjective in nature and the use of fair value pricing by the Funds may cause the NAV of their respective shares to differ significantly from the NAV that would have been calculated using market prices at the close of the exchange on which a portfolio security is principally traded but before the close of the Exchange. There can be no assurance that any Fund could obtain the fair value assigned to a security if the Fund were to sell the security at approximately the time at which that Fund determines its NAV per share. |
Debt securities (other than short-term obligations and senior floating rate interests) held by the Fund are valued on the basis of valuations furnished by an unaffiliated pricing service which determines valuations for normal institutional size trading units of debt securities. Senior floating rate interests generally trade in over-the-counter (“OTC”) markets and are priced through an unaffiliated pricing service utilizing independent market quotations from loan dealers or financial institutions. Securities for which prices are not available from an independent pricing service, but where an active market exists, are valued using market quotations obtained from one or more dealers that make markets in the securities or from a widely-used quotation system in accordance with procedures established by that Fund’s Board of Directors. Generally, each Fund may use fair valuation in regards to debt securities when a Fund holds defaulted or distressed securities or securities in a company in which reorganization is pending. Short-term investments with a maturity of more than 60 days when purchased are valued based on market quotations until the remaining days to maturity become less than 61 days. The Money Market Fund’s investments and investments that mature in 60 days or less are valued at amortized cost, which approximates market value.
Exchange traded equity securities shall be valued at the last reported sale price on the exchange or market on which the security is primarily traded (the “Primary Market”) at the Valuation Time. If the security did not trade on the Primary Market, it may be valued at the Valuation Time at the last reported sale price on another exchange where it trades. The value of an equity security not traded on any exchange but traded on the Nasdaq Stock Market, Inc. (“Nasdaq”) or another OTC market shall be valued at the last reported sale price or official closing price on the exchange or market on which the security is traded as of the Valuation Time. If it is not possible to determine the last reported sale price or official closing price on the relevant exchange or market at the Valuation Time, the value of the security shall be taken to be the most recent bid quotation on such exchange or market at the Valuation Time.
Securities of foreign issuers and non-dollar securities are translated from the local currency into U.S. dollars using prevailing exchange rates.
Options contracts on securities, currencies, indexes, futures contracts and other instruments shall be valued at their most recent sales price at the Valuation Time on the Primary Market on which the instrument is traded. If the instrument did not trade on the Primary Market, it may be valued at the most recent sales price at the Valuation Time on another exchange or market where it did trade.
Futures contracts shall be valued at the final settlement price reported by an exchange on which they are principally traded. If there were no trades as of the valuation day, then the contract shall be valued at the closing bid price as of the Valuation Time.
Financial instruments for which prices are not available from an independent pricing service, but where an active market exists, are valued using market quotations obtained from one or more dealers that make markets in securities or from a widely-used quotation system in accordance with procedures established by the Fund’s Board of Directors.
A forward currency contract shall be valued based on the price of the underlying currency at the prevailing interpolated exchange rate, which is a combination of the spot currency rate and the forward currency rate. Spot currency rates and forward currency rates are obtained from an independent pricing service on a daily basis not more than one hour before the Valuation Time. In the event that the applicable pricing service cannot provide the spot currency rates and forward currency rates in a timely fashion, such rates may be obtained from a widely-used quotation system in accordance with procedures established by the Fund’s Board of Directors.
Swaps and other derivative or contractual type instruments shall be valued using market prices if such instruments trade on an exchange or market. If such instruments do not trade on an exchange or market, such instruments shall be valued at a price at which the counterparty to such contract would
337
The Hartford Mutual Funds, Inc. and The Hartford Mutual Funds II, Inc.
Notes to Financial Statements — (continued)
April 30, 2008 (Unaudited)
(000’s Omitted)
repurchase the instrument. In the event that the counterparty cannot provide a price, such valuation may be determined in accordance with procedures established by the Fund’s Board of Directors.
Investments in open-end mutual funds are valued at the respective NAV of each open-end mutual fund on the valuation date.
| | |
| | c) | Foreign Currency Transactions — The accounting records of the Funds are maintained in U.S. dollars. All assets and liabilities initially expressed in foreign currencies are converted into U.S. dollars at the prevailing exchange rates. Purchases and sales of investment securities, dividend and interest income and certain expenses are translated at the rates of exchange prevailing on the respective dates of such transactions. |
The Funds do not isolate that portion of portfolio security valuation resulting from fluctuations in the foreign currency exchange rates on portfolio securities from the fluctuations arising from changes in the market prices of securities held. Such fluctuations are included with the net realized and unrealized gain or loss on investments in the accompanying financial statements.
Net realized foreign exchange gains or losses arise from sales of foreign currencies and the difference between asset and liability amounts initially stated in foreign currencies and the U.S. dollar value of the amounts actually received or paid. Net unrealized foreign exchange gains or losses arise from changes in the value of other assets and liabilities at the end of the reporting period, resulting from changes in the exchange rates.
| | |
| | d) | Securities Lending — The Funds, except for the Money Market Fund, may lend their securities to certain qualified brokers who pay these Funds negotiated lender fees. The loans are fully collateralized at all times with cash and/or U. S. Government Securities and/or repurchase agreements. The cash collateral is then invested in short-term money market instruments. The repurchase agreements are fully collateralized by U.S. Government Securities. The adequacy of the collateral for securities on loan is monitored on a daily basis. For instances where the market value of collateral falls below the market value of the securities out on loan, such collateral is supplemented on the following day. |
While securities are on loan, each Fund is subject to: the following risks: 1) that the borrower may default on the loan and that the collateral could be inadequate in the event the borrower defaults, 2) that the earnings on the collateral invested may not be sufficient to pay fees incurred in connection with the loan, 3) that the principal value of the collateral invested may decline and may not be sufficient to pay back the borrower for the amount of the collateral posted, 4) that the borrower may use the loaned securities to cover a short sale which may place downward pressure on the market prices of the loaned securities, 5) that return of loaned securities could be delayed and could interfere with portfolio management decisions and 6) that any efforts to recall the securities for purposes of voting a proxy may not be effective.
| | |
| | e) | Joint Trading Account — Pursuant to an exemptive order issued by the SEC, the Funds may transfer uninvested cash balances into a joint trading account managed by Hartford Investment Management or Wellington Management Company, LLP (“Wellington”). These balances may be invested in one or more repurchase agreements and/or short-term money market instruments. |
| |
| | f) | Repurchase Agreements — A repurchase agreement is an agreement by which the seller of a security agrees to repurchase the security sold at a mutually agreed upon time and price. At the time the Funds enter into a repurchase agreement, the value of the underlying collateral security(ies), including accrued interest, will be equal to or exceed the value of the repurchase agreement. Securities that serve to collateralize the repurchase agreement are held by each Fund’s custodian in book entry or physical form in the custodial account of the Funds or in a third party custodial account. Repurchase agreements are valued at cost plus accrued interest. Certain Funds, as shown on the Schedule of Investments, had outstanding repurchase agreements as of April 30, 2008. |
| |
| | g) | Reverse Repurchase Agreements — Each Fund, may also enter into reverse repurchase agreements. Reverse repurchase agreements involve sales by a Fund of portfolio assets concurrently with an agreement by a Fund to repurchase the same assets at a later date at a fixed price. Reverse repurchase agreements carry the risk that the market value of the securities which a Fund is obligated to repurchase may decline below the repurchase price. A reverse repurchase agreement is viewed as a collateralized borrowing by a Fund. Borrowing magnifies the potential for gain or loss on the portfolio securities of a Fund and, therefore, increases the possibility of fluctuation in a Fund’s NAV. Reverse Repurchase Agreements are valued at proceeds plus accrued interest. Certain Funds, as shown on the Schedule of Investments, had outstanding reverse repurchase agreements as of April 30, 2008. |
| |
| | h) | Forward Foreign Currency Contracts — At April 30, 2008, certain Funds have entered into forward foreign currency contracts that obligate the Funds to repurchase/replace or sell currencies at specified future dates. The Funds may enter into forward foreign currency contracts to hedge against adverse fluctuations in exchange rates between currencies. |
Forward foreign currency contracts involve elements of market risk in excess of the amount reflected in the Statements of Assets and Liabilities. In addition, risks may arise upon entering into these contracts from the potential inability of the counterparties to meet the terms of the contracts and from unanticipated movements in the value of the foreign currencies relative to the U.S. dollar.
| | |
| | i) | Indexed Securities — The Funds may invest in indexed securities whose values are linked to changes in interest rates, indices, or other underlying instruments. The Funds use these securities to increase or decrease their exposure to different underlying instruments and to gain exposure to markets that might be difficult to invest in using conventional securities. Indexed securities may be more volatile than their underlying instruments, but any loss is limited to the amount of the original investment and there may be a limit to the potential appreciation of the investment. Certain Funds had investments in indexed securities, as of April 30, 2008, as shown in the Schedule of Investments under Exchange Traded Funds. |
| |
| | j) | Fund Share Valuation and Dividend Distributions to Shareholders — Orders for the Funds’ shares are executed in accordance with the investment instructions of the shareholders. The NAV of each Fund’s shares is determined as of the close of each business day of the Exchange. The NAV per share is determined separately for each class of each Fund by dividing the Fund’s net assets attributable to that class by the number of shares of the class outstanding. Orders for the purchase of a Fund’s shares prior to the close of the Exchange on any day on which the Exchange is open for business are priced at the per-share NAV determined as of the close of the Exchange. Orders after the close of the Exchange, or on a day on which the Exchange and/or the Fund is not open for business, are priced at the next determined per-share NAV. |
338
Each Fund intends to distribute substantially all of its net investment income and net realized capital gains to shareholders no less frequently than once a year. Normally, dividends from net investment income of Capital Appreciation Fund, Capital Appreciation II Fund, Disciplined Equity Fund, Equity Growth Allocation Fund, Fundamental Growth Fund, Global Communications Fund, Global Equity Fund, Global Financial Services Fund, Global Growth Fund, Global Health Fund, Global Technology Fund, Growth Allocation Fund, Growth Fund, Growth Opportunities Fund, International Growth Fund, International Opportunities Fund, International Small Company Fund, LargeCap Growth Fund, MidCap Fund, MidCap Growth Fund, MidCap Value Fund, Select MidCap Value Fund, Select SmallCap Value Fund, Small Company Fund, SmallCap Growth Fund, Stock Fund, Target Retirement 2030 Fund, Value Fund and Value Opportunities Fund are declared and paid annually; dividends from net investment income of Advisers Fund, Balanced Allocation Fund, Balanced Income Fund, Checks and Balances Fund, Conservative Allocation Fund, Dividend and Growth Fund, Equity Income Fund, Target Retirement 2010 Fund and Target Retirement 2020 Fund are declared and paid quarterly; dividends from the net investment income of Income Allocation Fund and Retirement Income Fund are declared and paid monthly and dividends from net investment income of Floating Rate Fund, High Yield Fund, High Yield Municipal Bond Fund, Income Fund, Inflation Plus Fund, Money Market Fund, Short Duration Fund, Strategic Income Fund, Tax-Free California Fund, Tax-Free Minnesota Fund, Tax-Free National Fund, Tax-Free New York Fund, Total Return Bond Fund and U.S. Government Securities Fund are declared daily and paid monthly. Dividends are paid on shares beginning on the business day after the day when the funds used to purchase your shares are collected by the transfer agent for the funds declaring daily dividends. Long-term capital gains distributions received from the underlying funds are distributed to shareholders at least annually, when required. Unless shareholders specify otherwise, all dividends and distributions will be automatically reinvested in additional full or fractional shares of each Fund.
Distributions from net investment income, realized capital gains and capital are determined in accordance with federal income tax regulations, which may differ from U.S. GAAP with respect to character and timing. These differences include foreign currency gains and losses, losses deferred due to wash sales adjustments related to Passive Foreign Investment Companies and certain derivatives and excise tax regulations. Permanent book and federal income tax basis differences relating to shareholder distributions will result in reclassifications to certain of the Funds’ capital accounts (see Note 3 (c)).
| | |
| | k) | Illiquid and Restricted Securities — Each Fund is permitted to invest up to 15% of its net assets in illiquid securities, except for Inflation Plus Fund and Money Market Fund which may invest up to 10% in such securities. “Illiquid Securities” are those that may not be sold or disposed of in the ordinary course of business within seven days, at approximately the price used to determine a Fund’s NAV per share. A Fund may not be able to sell illiquid securities or other investments when its sub-adviser considers it desirable to do so or may have to sell such securities or investments at a price that is lower than the price that could be obtained if the securities or investments were more liquid. A sale of illiquid securities or other investments may require more time and may result in higher dealer discounts and other selling expenses than does the sale of those that are liquid. Illiquid securities and investments also may be more difficult to value, due to the unavailability of reliable market quotations for such securities or investments, and investment in them may have an adverse impact on NAV. Each Fund may also purchase certain restricted securities, commonly known as Rule 144A securities, that can be resold to institutions and which may be determined to be liquid pursuant to policies and guidelines established by the Funds’ Board of Directors. |
| |
| | l) | Securities Purchased on a When-Issued or Delayed-Delivery Basis — Delivery and payment for securities that have been purchased by the Funds on a forward commitment or when-issued or delayed-delivery basis take place beyond the customary settlement period. During this period, such securities are subject to market fluctuations, and the Funds identify securities segregated in their records with value at least equal to the amount of the commitment. As of April 30, 2008, the Funds entered into outstanding when-issued or forward commitments as follows: |
| | | | | |
Fund | | Cost | |
| |
| Balanced Income Fund | | $ | 19 | |
| Capital Appreciation II Fund | | | 273 | |
| Floating Rate Fund | | | 55,667 | |
| Global Financial Services Fund | | | 110 | |
| High Yield Fund | | | 2,328 | |
| High Yield Municipal Bond Fund | | | 12,676 | |
| Income Fund | | | 3,400 | |
| Inflation Plus Fund | | | 124 | |
| International Growth Fund | | | 1,844 | |
| Strategic Income Fund | | | 3,454 | |
| Tax-Free California Fund | | | 491 | |
| Tax-Free Minnesota Fund | | | 703 | |
| Tax-Free National Fund | | | 6,042 | |
| Tax-Free New York Fund | | | 456 | |
| Total Return Bond Fund | | | 21,657 | |
| | |
| | m) | Credit Risk — Credit risk depends largely on the perceived financial health of bond issuers. In general, lower rated bonds have higher credit risk. High yield bond prices can fall on bad news about the economy, an industry or a company. The share price, yield and total return of a Fund which holds securities with higher credit risk may fluctuate more than with less aggressive bond funds. |
| |
| | n) | Senior Floating Rate Interests — Certain Funds as shown in the Schedule of Investments, may invest in senior floating rate interests. Senior floating rate interests hold the most senior position in the capital structure of a business entity (the “Borrower”), are typically secured by specific collateral and have a claim on the assets and/or stock of the Borrower that is senior to that held by subordinated debtholders and stockholders of the Borrower. Senior floating rate interests are typically structured and administered by a financial institution that acts as the agent of the lenders participating in the senior floating rate interest. Senior floating rate interests are typically rated below-investment-grade, which suggests they are more likely to default and generally pay higher interest rates than investment-grade loans. A default could lead to non-payment of income which would result in a reduction of |
339
The Hartford Mutual Funds, Inc. and The Hartford Mutual Funds II, Inc.
Notes to Financial Statements — (continued)
April 30, 2008 (Unaudited)
(000’s Omitted)
| | |
| | | income to the Fund and there can be no assurance that the liquidation of any collateral would satisfy the Borrower’s obligation in the event of non-payment of scheduled interest or principal payments, or that such collateral could be readily liquidated. |
| | |
| | o) | Prepayment Risks — Most senior floating rate interests and certain debt securities allow for prepayment of principal without penalty. Senior floating rate interests and securities subject to prepayment risk generally offer less potential for gains when interest rates decline, and may offer a greater potential for loss when interest rates rise. In addition, with respect to securities, rising interest rates may cause prepayments to occur at a slower than expected rate, thereby effectively lengthening the maturity of the security and making the security more sensitive to interest rate changes. Prepayment risk is a major risk of mortgage-backed securities and certain asset-backed securities. Accordingly, the potential for the value of a senior floating rate interests or security to increase in response to interest rate declines is limited. For certain asset-backed securities, the actual maturity may be less than the stated maturity shown in the Schedule of Investments. As a result, the timing of income recognition relating to these securities may vary based upon the actual maturity. Senior floating rate interests or debt securities purchased to replace a prepaid loan or a debt security may have lower yields than the yield on the prepaid loan or debt security. |
Senior floating rate interests generally are subject to mandatory and/or optional prepayment. Because of these mandatory prepayment conditions and because there may be significant economic incentives for the Borrower to repay, prepayments of senior floating rate interests may occur. As a result, the actual remaining maturity of senior floating rate interests held may be substantially less than the stated maturities shown in the Schedule of Investments.
| | |
| | p) | Use of Estimates — The preparation of financial statements in conformity with U.S. GAAP requires management to make estimates and assumptions that affect the reported amounts of assets and liabilities as of the date of the financial statements and the reported amounts of income and expenses during the period. Operating results in the future could vary from the amounts derived from management’s estimates. |
| |
| | q) | Swaps — Certain Funds may enter into event linked swaps, including credit default swaps. The credit default swap market allows a Fund to manage credit risk through buying and selling credit protection on a specific issuer, an index, or a basket of issuers. A “buyer” of credit protection agrees to pay a counterparty to assume the credit risk of an issuer upon the occurrence of certain events. The “seller” of the protection receives periodic payments and agrees to assume the credit risk of an issuer upon the occurrence of certain events. A “seller’s” exposure is limited to the total notional amount of the credit default swap contract. A Fund will generally not buy protection on issuers that are not currently held by such Fund. |
Certain Funds may enter into interest rate swaps. In a typical interest rate swap, one party agrees to make regular payments equal to a floating interest rate multiplied by a “notional principal amount,” in return for payments equal to a fixed rate multiplied by the same amount, for a specific period of time. If a swap agreement provides for payments in different currencies, the parties might agree to exchange the notional principal amount as well. Swaps may also depend on other prices or rates, such as the value of an index or mortgage prepayment rates. Certain Funds, as shown in the Schedule of Investments, had outstanding swaps as of April 30, 2008.
| | |
| | r) | Financial Accounting Standards Board Financial Accounting Standards No. 157 — In September 2006, FASB issued Statement on Financial Accounting Standards No. 157, “Fair Value Measurements” (“FAS 157”). This standard clarifies the definition of fair value for financial reporting, establishes a framework for measuring fair value and requires additional disclosures about the use of fair value measurements. FAS 157 is effective for the Funds’ financial statements issued for fiscal years after November 15, 2007, and interim periods within those fiscal years. As of April 30, 2008, the Funds do not believe the adoption of FAS 157 will impact the amounts reported in the financial statements, however, additional disclosures will be required about the inputs used to develop the measurements of fair value and the effect of certain measurements reported in the Statements of Operations for a fiscal period. |
| |
| | s) | Financial Accounting Standards Board Financial Accounting Standards No. 161 — In March 2008, FASB released Statement of Financial Accounting Standards No. 161, “Disclosures about Derivative Instruments and Hedging Activities” (“FAS 161”). FAS 161 requires companies to disclose information detailing the objectives and strategies for using derivative instruments, the level of derivative activity entered into by the company and any credit risk-related contingent features of the agreements. The application of FAS 161 is required for fiscal years beginning after November 15, 2008 and interim periods within those fiscal years. At this time, management is evaluating the implications of FAS 161 and its impact on the financial statements has not yet been determined. |
Indemnifications: Under the Companies’ organizational documents, each Company shall indemnify its officers and directors to the full extent required or permitted under Maryland Corporate Law and the federal securities law. In addition, the Companies, on behalf of the Funds, may enter contracts that contain a variety of indemnifications. The Companies maximum exposure under these arrangements is unknown. However, the Companies have not had prior claims or losses pursuant to these contracts and expect the risk of loss to be remote.
Futures and Options Transactions — Certain Funds may invest in futures and options contracts in order to gain exposure to or protect against changes in the market. A futures contract is an agreement between two parties to buy and sell a security at a set price on a future date. When the Funds enter into such futures contracts, they are required to deposit with a futures commission merchant an amount of “initial margin” of cash, commercial paper or U.S. Treasury Bills. Subsequent payments, called maintenance margin, to and from the broker, are made on a daily basis as the price of the underlying security fluctuates, making the long and short positions in the futures contract more or less valuable (i.e., mark-to-market), which results in an unrealized gain or loss to the Funds.
At any time prior to the expiration of the futures contract, a Fund may close the position by taking an opposite position, which would effectively terminate the position in the futures contract. A final determination of maintenance margin is then made, additional cash is required to be paid by or released to the Fund and the Fund realizes a gain or loss.
The use of futures contracts involve elements of market risk, which may exceed the amounts recognized in the Statements of Assets and Liabilities. Changes in the value of the futures contracts may decrease the effectiveness of the Funds’ strategies and potentially result in loss. Certain Funds, as shown on the Schedule of Investments, had outstanding futures contracts as of April 30, 2008.
340
The premium paid by a Fund for the purchase of a call or put option is included in the Fund’s Statement of Assets and Liabilities as an investment and subsequently “marked-to-market” through net unrealized appreciation (depreciation) of options to reflect the current market value of the option as of the end of the reporting period.
The Funds may write covered options. “Covered” means that so long as the Fund is obligated as the writer of an option, it will own either the underlying securities or currency or an option to purchase or sell the same underlying securities or currency having an expiration date of the covered option and an exercise price equal to or less than the exercise price of the covered option, or will establish or maintain with its custodian for the term of the option a “segregated account” consisting of cash or other liquid securities having a value equal to or greater than the fluctuating market value of the option securities or currencies. A Fund receives a premium for writing a call or put option, which is recorded on the Fund’s Statement of Assets and Liabilities and subsequently “market-to-market” through net unrealized appreciation (depreciation) of options. There is a risk of loss from a change in the value of such options, which may exceed the related premiums received. Transactions involving written option contracts for the Funds during the six-month period ended April 30, 2008 are summarized below:
| | | | | | | | | |
| | | The Hartford Advisers Fund
|
| | | Options Contract Activity During the
|
| | | Six-Month Period Ended April 30, 2008 |
Call Options Written During the Period | | Number of Contracts* | | Premium Amounts |
| |
| Beginning of the period | | | 243 | | | $ | 67 | |
| Written | | | — | | | | — | |
| Expired | | | — | | | | — | |
| Closed | | | (243 | ) | | | (67 | ) |
| Exercised | | | — | | | | — | |
| | | | | | | | | |
| End of Period | | | — | | | $ | — | |
| | | | | | | | | |
| | | | | | | | | |
Put Options Written During the Period | | Number of Contracts* | | Premium Amounts |
| |
| Beginning of the period | | | — | | | $ | — | |
| Written | | | 2,085 | | | | 546 | |
| Expired | | | — | | | | — | |
| Closed | | | (2,085 | ) | | | (546 | ) |
| Exercised | | | — | | | | — | |
| | | | | | | | | |
| End of Period | | | — | | | $ | — | |
| | | | | | | | | |
| | | | | | | | | |
| | | The Hartford Capital Appreciation II
|
| | | Fund Options Contract Activity During
|
| | | the Six-Month Period Ended April 30, 2008 |
Call Options Written During the Period | | Number of Contracts* | | Premium Amounts |
| |
| Beginning of the period | | | — | | | | — | |
| Written | | | 9 | | | | 4 | |
| Expired | | | — | | | | — | |
| Closed | | | — | | | | — | |
| Exercised | | | — | | | | — | |
| | | | | | | | | |
| End of Period | | | 9 | | | $ | 4 | |
| | | | | | | | | |
| | | | | | | | | |
| | | The Hartford Disciplined Equity Fund
|
| | | Options Contract Activity During the
|
| | | Six-Month Period Ended April 30, 2008 |
Call Options Written During the Period | | Number of Contracts* | | Premium Amounts |
| |
| Beginning of the period | | | 140 | | | $ | 19 | |
| Written | | | 1,979 | | | | 214 | |
| Expired | | | (1,272 | ) | | | (138 | ) |
| Closed | | | (449 | ) | | | (45 | ) |
| Exercised | | | (96 | ) | | | (7 | ) |
| | | | | | | | | |
| End of Period | | | 302 | | | $ | 43 | |
| | | | | | | | | |
341
The Hartford Mutual Funds, Inc. and The Hartford Mutual Funds II, Inc.
Notes to Financial Statements — (continued)
April 30, 2008 (Unaudited)
(000’s Omitted)
| | | | | | | | | |
| | | The Hartford Disciplined Equity Fund
|
| | | Options Contract Activity During the
|
| | | Six-Month Period Ended April 30, 2008 |
Put Options Written During the Period | | Number of Contracts* | | Premium Amounts |
| |
| Beginning of the period | | | 29 | | | $ | 3 | |
| Written | | | 552 | | | | 61 | |
| Expired | | | (413 | ) | | | (49 | ) |
| Closed | | | (29 | ) | | | (3 | ) |
| Exercised | | | (103 | ) | | | (5 | ) |
| | | | | | | | | |
| End of Period | | | 36 | | | $ | 7 | |
| | | | | | | | | |
| | | | | | | | | |
| | | The Hartford Inflation Plus Fund
|
| | | Options Contract Activity During the
|
| | | Six-Month Period Ended April 30, 2008 |
Call Options Written During the Period | | Number of Contracts* | | Premium Amounts |
| |
| Beginning of the period | | | — | | | $ | — | |
| Written | | | 12,000 | | | | 6,472 | |
| Expired | | | — | | | | — | |
| Closed | | | (10,000 | ) | | | (5,212 | ) |
| Exercised | | | — | | | | — | |
| | | | | | | | | |
| End of Period | | | 2,000 | | | $ | 1,260 | |
| | | | | | | | | |
| | | | | | | | | |
Put Options Written During the Period | | Number of Contracts* | | Premium Amounts |
| |
| Beginning of the period | | | 500 | | | $ | 209 | |
| Written | | | 8,250 | | | | 2,999 | |
| Expired | | | — | | | | — | |
| Closed | | | (8,750 | ) | | | (3,208 | ) |
| Exercised | | | — | | | | — | |
| | | | | | | | | |
| End of Period | | | — | | | $ | — | |
| | | | | | | | | |
| | | | | | | | | |
| | | The Hartford Stock Fund Options
|
| | | Contract Activity During the
|
| | | Six-Month Period Ended April 30, 2008 |
Call Options Written During the Period | | Number of Contracts* | | Premium Amounts |
| |
| Beginning of the period | | | 264 | | | $ | 73 | |
| Written | | | — | | | | — | |
| Expired | | | — | | | | — | |
| Closed | | | (264 | ) | | | (73 | ) |
| Exercised | | | — | | | | — | |
| | | | | | | | | |
| End of Period | | | — | | | $ | — | |
| | | | | | | | | |
| | | | | | | | | |
| | | The Hartford Total Return Bond Fund
|
| | | Options Contract Activity During the
|
| | | Six-Month Period Ended April 30, 2008 |
Call Options Written During the Period | | Number of Contracts* | | Premium Amounts |
| |
| Beginning of the period | | | — | | | | — | |
| Written | | | 398 | | | | 206 | |
| Expired | | | — | | | | — | |
| Closed | | | (398 | ) | | | (206 | ) |
| Exercised | | | — | | | | — | |
| | | | | | | | | |
| End of Period | | | — | | | $ | — | |
| | | | | | | | | |
| | |
| | * | The number of contracts does not omit 000’s. |
| | |
| | a) | Federal Income Taxes — For federal income tax purposes, the Funds intend to continue to qualify as regulated investment companies under Subchapter M of the Internal Revenue Code (“IRC”) by distributing substantially all of their taxable net investment income and net realized capital gains to their shareholders and otherwise complying with the requirements of regulated investment companies. The Funds have distributed |
342
| | |
| | | substantially all of their income and capital gains in prior years and each Fund intends to distribute substantially all of its income and gains during the calendar year ending December 31, 2008. Accordingly, no provision for federal income or excise taxes has been made in the accompanying financial statements. Distributions from short-term capital gains are treated as ordinary income distribution for federal income tax purposes. |
| | |
| | b) | The tax character of distributions paid for the periods indicated is as follows (as adjusted for dividends payable): |
| | | | | | | | | | | | | | | | | | | | | | | | | | | | | |
| | | For the Year Ended
| | | For the Year Ended
| |
| | | October 31, 2007 | | | October 31, 2006 | |
| | | Tax Exempt
| | | Ordinary
| | | Long-Term
| | | Tax Exempt
| | | Ordinary
| | | Long-Term
| | | Tax Return
| |
| | | Income (a) | | | Income | | | Capital Gains (b) | | | Income (a) | | | Income | | | Capital Gains (b) | | | of Capital | |
| |
| Advisers Fund | | $ | — | | | $ | 24,582 | | | $ | 9,545 | | | $ | — | | | $ | 28,170 | | | $ | — | | | $ | — | |
| Balanced Allocation Fund | | | — | | | | 22,740 | | | | 16,040 | | | | — | | | | 9,607 | | | | 300 | | | | — | |
| Balanced Income Fund* | | | — | | | | 870 | | | | — | | | | — | | | | 60 | | | | — | | | | — | |
| Capital Appreciation Fund | | | — | | | | 455,689 | | | | 739,935 | | | | — | | | | 60,755 | | | | 884,027 | | | | — | |
| Capital Appreciation II Fund | | | — | | | | 7,427 | | | | 1,610 | | | | — | | | | 1,192 | | | | — | | | | — | |
| Checks and Balances Fund (A) | | | — | | | | 483 | | | | — | | | | — | | | | — | | | | — | | | | — | |
| Conservative Allocation Fund | | | — | | | | 5,741 | | | | 3,535 | | | | — | | | | 3,915 | | | | 685 | | | | — | |
| Disciplined Equity Fund | | | — | | | | 2,100 | | | | — | | | | — | | | | 878 | | | | — | | | | — | |
| Dividend and Growth Fund | | | — | | | | 57,157 | | | | 201,659 | | | | — | | | | 52,205 | | | | 98,292 | | | | — | |
| Equity Growth Allocation Fund | | | — | | | | 2,242 | | | | 5,366 | | | | — | | | | 91 | | | | 552 | | | | — | |
| Equity Income Fund | | | — | | | | 17,199 | | | | 25,507 | | | | — | | | | 12,225 | | | | — | | | | — | |
| Floating Rate Fund | | | — | | | | 252,120 | | | | — | | | | — | | | | 77,852 | | | | — | | | | — | |
| Fundamental Growth Fund | | | — | | | | — | | | | — | | | | — | | | | 321 | | | | — | | | | — | |
| Global Communications Fund | | | — | | | | 391 | | | | 153 | | | | — | | | | 333 | | | | — | | | | — | |
| Global Financial Services Fund | | | — | | | | 200 | | | | 1,748 | | | | — | | | | 167 | | | | — | | | | — | |
| Global Growth Fund | | | — | | | | 15,315 | | | | 22,227 | | | | — | | | | 919 | | | | 7,457 | | | | — | |
| Global Health Fund | | | — | | | | 6,779 | | | | 21,945 | | | | — | | | | 14,523 | | | | 17,.300 | | | | — | |
| Growth Allocation Fund | | | — | | | | 11,270 | | | | 14,424 | | | | — | | | | 2,935 | | | | 776 | | | | — | |
| Growth Fund | | | — | | | | — | | | | 86,489 | | | | — | | | | — | | | | — | | | | — | |
| Growth Opportunities Fund | | | — | | | | 26,275 | | | | 63,092 | | | | — | | | | — | | | | 69,508 | | | | — | |
| High Yield Fund | | | — | | | | 18,374 | | | | — | | | | — | | | | 20,130 | | | | — | | | | — | |
| High Yield Municipal Bond Fund # | | | 584 | | | | — | | | | — | | | | — | | | | — | | | | — | | | | — | |
| Income Allocation Fund | | | — | | | | 1,942 | | | | — | | | | — | | | | 1,498 | | | | — | | | | — | |
| Income Fund | | | — | | | | 13,076 | | | | — | | | | — | | | | 3,796 | | | | — | | | | — | |
| Inflation Plus Fund | | | — | | | | 18,827 | | | | — | | | | — | | | | 33,608 | | | | 3,229 | | | | — | |
| International Growth Fund | | | — | | | | 20,540 | | | | 10,237 | | | | — | | | | 2,096 | | | | 1,965 | | | | — | |
| International Opportunities Fund | | | — | | | | 1,675 | | | | 7,575 | | | | — | | | | 509 | | | | — | | | | — | |
| International Small Company Fund | | | — | | | | 16,470 | | | | 9,615 | | | | — | | | | 10,298 | | | | 5,091 | | | | — | |
| LargeCap Growth Fund (Y) | | | — | | | | 12 | | | | — | | | | — | | | | — | | | | — | | | | — | |
| MidCap Fund | | | — | | | | 42,383 | | | | 439,002 | | | | — | | | | 63,745 | | | | 411,745 | | | | — | |
| MidCap Growth Fund | | | — | | | | 127 | | | | — | | | | — | | | | — | | | | — | | | | — | |
| MidCap Value Fund | | | — | | | | 14,105 | | | | 44,861 | | | | — | | | | 13,883 | | | | 30,157 | | | | — | |
| Money Market Fund | | | — | | | | 13,462 | | | | — | | | | — | | | | 9,518 | | | | — | | | | — | |
| Retirement Income Fund | | | — | | | | 69 | | | | — | | | | — | | | | 18 | | | | — | | | | — | |
| Select MidCap Value Fund | | | — | | | | 2,388 | | | | 539 | | | | — | | | | 649 | | | | — | | | | — | |
| Select SmallCap Value Fund | | | — | | | | 361 | | | | 12 | | | | — | | | | — | | | | — | | | | — | |
| Short Duration Fund | | | — | | | | 8,826 | | | | — | | | | — | | | | 4,804 | | | | — | | | | — | |
| Small Company Fund | | | — | | | | — | | | | 34,670 | | | | — | | | | — | | | | — | | | | — | |
| Stock Fund | | | — | | | | 4,121 | | | | — | | | | — | | | | 2,297 | | | | — | | | | — | |
| Strategic Income Fund @ | | | — | | | | 1,168 | | | | 1 | | | | — | | | | — | | | | — | | | | — | |
| Target Retirement 2010 Fund | | | — | | | | 148 | | | | — | | | | — | | | | 21 | | | | — | | | | 3 | |
| Target Retirement 2020 Fund | | | — | | | | 188 | | | | 3 | | | | — | | | | 17 | | | | — | | | | — | |
| Target Retirement 2030 Fund | | | — | | | | 44 | | | | 1 | | | | — | | | | 3 | | | | — | | | | 4 | |
| Tax-Free California Fund | | | 1,337 | | | | — | | | | — | | | | 800 | | | | — | | | | 12 | | | | — | |
| Tax-Free Minnesota Fund | | | 1,495 | | | | 24 | | | | 173 | | | | 1,373 | | | | 57 | | | | — | | | | — | |
| Tax-Free National Fund | | | 6,250 | | | | — | | | | 372 | | | | 4,528 | | | | 698 | | | | — | | | | — | |
| Tax-Free New York Fund | | | 583 | | | | — | | | | 85 | | | | 555 | | | | 6 | | | | 26 | | | | — | |
| Total Return Bond Fund | | | — | | | | 47,180 | | | | — | | | | — | | | | 32,844 | | | | 1,319 | | | | — | |
| U.S. Government Securities Fund | | | — | | | | 9,082 | | | | — | | | | — | | | | 9,827 | | | | — | | | | — | |
| Value Fund | | | — | | | | 2,008 | | | | 15,191 | | | | — | | | | 1,254 | | | | — | | | | — | |
| Value Opportunities Fund | | | — | | | | 6,712 | | | | 15,915 | | | | — | | | | 2,423 | | | | 5,424 | | | | — | |
| | |
| (a) | | The Funds designate these distributions as exempt interest per IRC Sec. 852(b) (5). |
| (b) | | The Funds designate these distributions as long-term gain capital dividends per IRC code Sec. 852(b) (3) (C). |
| (A) | | For the period May 31, 2007 (commencement of operations) through October 31, 2007. |
| # | | For the period May 1, 2007 (commencement of operations) through October 31, 2007. |
| @ | | For the period May 15, 2007 (commencement of operations) through October 31, 2007. |
343
The Hartford Mutual Funds, Inc. and The Hartford Mutual Funds II, Inc.
Notes to Financial Statements — (continued)
April 30, 2008 (Unaudited)
(000’s Omitted)
| | |
| (Y) | | For the period November 30, 2006 (commencement of operations) through October 31, 2007. |
| * | | For the period July 31, 2006 (commencement of operations) through October 31, 2006. |
As of October 31, 2007, the components of distributable earnings (deficit) on tax basis were as follows:
| | | | | | | | | | | | | | | | | | | | | |
| | | | | | | | | | | | | | | Total
| |
| | | Undistributed
| | | Undistributed
| | | Accumulated
| | | Unrealized
| | | Accumulated
| |
| | | Ordinary
| | | Long-Term
| | | Capital Gains
| | | Appreciation
| | | Earnings
| |
| | | Income | | | Capital Gain | | | (Losses)* | | | (Depreciation)@ | | | (Deficit) | |
| |
| Advisers Fund | | $ | 104,422 | | | $ | 65,012 | | | $ | — | | | $ | 73,027 | | | $ | 242,461 | |
| Balanced Allocation Fund | | | 3,469 | | | | 40,661 | | | | — | | | | 102,429 | | | | 146,559 | |
| Balanced Income Fund | | | 294 | | | | 19 | | | | — | | | | 1,597 | | | | 1,910 | |
| Capital Appreciation Fund | | | 474,330 | | | | 1,323,670 | | | | — | | | | 4,442,059 | | | | 6,240,059 | |
| Capital Appreciation II Fund | | | 75,890 | | | | 24,958 | | | | — | | | | 160,146 | | | | 260,994 | |
| Checks and Balances Fund | | | 220 | | | | — | | | | — | | | | 8,145 | | | | 8,365 | |
| Conservative Allocation Fund | | | 1,301 | | | | 5,880 | | | | — | | | | 10,753 | | | | 17,934 | |
| Disciplined Equity Fund | | | 685 | | | | — | | | | (10,424 | ) | | | 47,806 | | | | 38,067 | |
| Dividend and Growth Fund | | | 25,034 | | | | 208,878 | | | | — | | | | 907,125 | | | | 1,141,037 | |
| Equity Growth Allocation Fund | | | 68 | | | | 17,233 | | | | — | | | | 51,052 | | | | 68,353 | |
| Equity Income Fund | | | 6,167 | | | | 21,647 | | | | — | | | | 160,276 | | | | 188,090 | |
| Floating Rate Fund | | | 10,167 | | | | — | | | | (49,504 | ) | | | (139,055 | ) | | | (178,392 | ) |
| Fundamental Growth Fund | | | 6,221 | | | | 1,095 | | | | — | | | | 7,099 | | | | 14,415 | |
| Global Communications Fund | | | — | | | | 2,179 | | | | — | | | | 11,564 | | | | 13,743 | |
| Global Financial Services Fund | | | 659 | | | | 3,695 | | | | — | | | | 3,672 | | | | 8,026 | |
| Global Growth Fund | | | 18,485 | | | | 71,394 | | | | — | | | | 250,512 | | | | 340,391 | |
| Global Health Fund | | | 18,256 | | | | 48,171 | | | | — | | | | 111,392 | | | | 177,819 | |
| Global Technology Fund | | | — | | | | — | | | | (40,025 | ) | | | 11,907 | | | | (28,118 | ) |
| Growth Allocation Fund | | | 4,425 | | | | 46,273 | | | | — | | | | 131,987 | | | | 182,685 | |
| Growth Fund | | | 9,424 | | | | 81,620 | | | | — | | | | 243,790 | | | | 334,834 | |
| Growth Opportunities Fund | | | 160,989 | | | | 100,232 | | | | — | | | | 417,422 | | | | 678,643 | |
| High Yield Fund | | | 537 | | | | — | | | | (75,104 | ) | | | (3,726 | ) | | | (78,293 | ) |
| High Yield Municipal Bond Fund | | | 139 | | | | — | | | | (284 | ) | | | (1,049 | ) | | | (1,194 | ) |
| Income Allocation Fund | | | 11 | | | | — | | | | (134 | ) | | | (650 | ) | | | (773 | ) |
| Income Fund | | | 361 | | | | — | | | | (734 | ) | | | (4,788 | ) | | | (5,161 | ) |
| Inflation Plus Fund | | | 2,207 | | | | — | | | | (16,802 | ) | | | 175 | | | | (14,420 | ) |
| International Growth Fund | | | 46,150 | | | | 34,643 | | | | — | | | | 116,858 | | | | 197,651 | |
| International Opportunities Fund | | | 37,285 | | | | 29,223 | | | | (1,470 | ) | | | 81,809 | | | | 146,847 | |
| International Small Company Fund | | | 25,139 | | | | 15,515 | | | | — | | | | 39,383 | | | | 80,037 | |
| LargeCap Growth Fund | | | 214 | | | | — | | | | — | | | | 925 | | | | 1,139 | |
| MidCap Fund | | | 151,045 | | | | 363,061 | | | | — | | | | 569,067 | | | | 1,083,173 | |
| MidCap Growth Fund | | | 3,446 | | | | 479 | | | | — | | | | 2,482 | | | | 6,407 | |
| MidCap Value Fund | | | 10,964 | | | | 63,099 | | | | — | | | | 66,183 | | | | 140,246 | |
| Retirement Income Fund | | | 40 | | | | 15 | | | | — | | | | 60 | | | | 115 | |
| Select MidCap Value Fund | | | 6,567 | | | | 4,404 | | | | — | | | | (5,075 | ) | | | 5,896 | |
| Select SmallCap Value Fund | | | 7,480 | | | | 605 | | | | — | | | | 430 | | | | 8,515 | |
| Short Duration Fund | | | 74 | | | | — | | | | (2,387 | ) | | | (2,103 | ) | | | (4,416 | ) |
| Small Company Fund | | | 43,268 | | | | 23,621 | | | | — | | | | 74,162 | | | | 141,051 | |
| SmallCap Growth Fund | | | 5,180 | | | | 34,098 | | | | — | | | | 18,613 | | | | 57,891 | |
| Stock Fund | | | 1,180 | | | | — | | | | (138,221 | ) | | | 66,713 | | | | (70,328 | ) |
| Strategic Income Fund | | | 283 | | | | — | | | | — | | | | (248 | ) | | | 35 | |
| Target Retirement 2010 Fund | | | 128 | | | | 83 | | | | — | | | | 503 | | | | 714 | |
| Target Retirement 2020 Fund | | | 96 | | | | 91 | | | | — | | | | 1,235 | | | | 1,422 | |
| Target Retirement 2030 Fund | | | 134 | | | | 77 | | | | — | | | | 1,436 | | | | 1,647 | |
| Tax-Free California Fund | | | 44 | | | | — | | | | (272 | ) | | | (302 | ) | | | (530 | ) |
| Tax-Free Minnesota Fund | | | 27 | | | | — | | | | (114 | ) | | | 480 | | | | 393 | |
| Tax-Free National Fund | | | 255 | | | | — | | | | (887 | ) | | | 636 | | | | 4 | |
| Tax-Free New York Fund | | | 8 | | | | — | | | | (52 | ) | | | 110 | | | | 66 | |
| Total Return Bond Fund | | | 3,779 | | | | — | | | | (8,505 | ) | | | (7,373 | ) | | | (12,099 | ) |
| U.S. Government Securities Fund | | | 183 | | | | — | | | | (19,660 | ) | | | (656 | ) | | | (20,133 | ) |
| Value Fund | | | 13,079 | | | | 9,415 | | | | — | | | | 61,519 | | | | 84,013 | |
| Value Opportunities Fund | | | 11,034 | | | | 30,965 | | | | — | | | | 12,443 | | | | 54,442 | |
| | |
| * | | Certain Funds had capital loss carryforwards that are identified in Note 4 (d). |
344
| | |
| @ | | The difference between book-basis and tax-basis unrealized appreciation (depreciation) is attributable primarily to the tax deferral of wash sales losses, the mark-to-market adjustment for certain derivatives in accordance with IRC Sec. 1256, the mark to market for Passive Foreign Investment Companies and basis differences in real estate investment trusts. |
| | |
| | c) | Reclassification of Capital Accounts: |
In accordance with American Institute of Certified Public Accountants (AICPA) Statement of Position 93-2, Determination, Disclosure, and Financial Statement Presentation of Income, Capital Gain, and Return of Capital Distributions by Investment Companies, the Funds have recorded reclassifications in their capital accounts. These reclassifications had no impact on the NAV per share of the Funds and are designed generally to present accumulated undistributed (distribution in excess of) net investment income and accumulated net realized gains (losses) on investments on a tax basis which is considered to be more informative to a shareholder. The reclassifications are a result of permanent differences between GAAP and tax accounting for such items as foreign currency, capital loss carryforward expiration and net operating losses that reduce capital gain distribution requirements. Adjustments are made to reflect the impact these items have on current and future distributions to shareholders. Therefore, the source of a Fund’s distributions may be shown in the accompanying Statements of Changes in Net Assets as from net investment income, from net realized gains on investments or from capital depending on the type of book and tax differences that exist. As of October 31, 2007, the Funds recorded the following reclassifications to increase (decrease) the accounts listed below.
| | | | | | | | | | | | | |
| | | Undistributed
| | | Accumulated
| | | | |
| | | Net Investment
| | | Net Realized
| | | | |
| | | Income | | | Gain (Loss) | | | Paid-in-Capital | |
| |
| Advisers Fund | | $ | (100 | ) | | $ | 100 | | | $ | — | |
| Balanced Allocation Fund | | | 7,173 | | | | (7,173 | ) | | | — | |
| Capital Appreciation Fund | | | 63,651 | | | | (65,726 | ) | | | 2,075 | |
| Capital Appreciation II Fund | | | 1,592 | | | | (1,605 | ) | | | 13 | |
| Checks and Balances Fund | | | 62 | | | | — | | | | (62 | ) |
| Conservative Allocation Fund | | | 913 | | | | (913 | ) | | | — | |
| Dividend and Growth Fund | | | (61 | ) | | | 61 | | | | — | |
| Equity Growth Allocation Fund | | | 4,110 | | | | (4,314 | ) | | | 204 | |
| Equity Income Fund | | | (16 | ) | | | 15 | | | | 1 | |
| Floating Rate Fund | | | 1,839 | | | | (1,839 | ) | | | — | |
| Fundamental Growth Fund | | | 328 | | | | (328 | ) | | | — | |
| Global Communications Fund | | | 68 | | | | (69 | ) | | | 1 | |
| Global Financial Services Fund | | | 13 | | | | (13 | ) | | | — | |
| Global Growth Fund | | | 5,609 | | | | (5,610 | ) | | | 1 | |
| Global Health Fund | | | 2,801 | | | | (2,802 | ) | | | 1 | |
| Global Technology Fund | | | 729 | | | | 11 | | | | (740 | ) |
| Growth Allocation Fund | | | 8,178 | | | | (8,179 | ) | | | 1 | |
| Growth Fund | | | 3,821 | | | | (3,821 | ) | | | — | |
| Growth Opportunities Fund | | | (80 | ) | | | 80 | | | | — | |
| High Yield Fund | | | (49 | ) | | | 49 | | | | — | |
| High Yield Municipal Bond Fund | | | 16 | | | | — | | | | (16 | ) |
| Income Allocation Fund | | | 1 | | | | — | | | | (1 | ) |
| Income Fund | | | 70 | | | | (70 | ) | | | — | |
| Inflation Plus Fund | | | (164 | ) | | | 164 | | | | — | |
| International Growth Fund | | | 544 | | | | (545 | ) | | | 1 | |
| International Opportunities Fund | | | 30 | | | | (30 | ) | | | — | |
| International Small Company Fund | | | 1,011 | | | | (1,012 | ) | | | 1 | |
| LargeCap Growth Fund | | | 25 | | | | (12 | ) | | | (13 | ) |
| MidCap Fund | | | 11,947 | | | | (14,336 | ) | | | 2,389 | |
| MidCap Growth Fund | | | 182 | | | | (182 | ) | | | — | |
| MidCap Value Fund | | | 894 | | | | (893 | ) | | | (1 | ) |
| Retirement Income Fund | | | 5 | | | | (5 | ) | | | — | |
| Select MidCap Value Fund | | | (80 | ) | | | 63 | | | | 17 | |
| Select SmallCap Value Fund | | | (49 | ) | | | 48 | | | | 1 | |
| Short Duration Fund | | | (28 | ) | | | 28 | | | | — | |
| Small Company Fund | | | 869 | | | | (970 | ) | | | 101 | |
| SmallCap Growth Fund | | | 1,286 | | | | (1,123 | ) | | | (163 | ) |
| Stock Fund | | | (191 | ) | | | 191 | | | | — | |
| Strategic Income Fund | | | 123 | | | | (89 | ) | | | (34 | ) |
| Target Retirement 2010 Fund | | | 18 | | | | (18 | ) | | | — | |
| Target Retirement 2020 Fund | | | 26 | | | | (26 | ) | | | — | |
| Target Retirement 2030 Fund | | | 26 | | | | (26 | ) | | | — | |
| Total Return Bond Fund | | | 2,213 | | | | (2,288 | ) | | | 75 | |
| U.S. Government Securities Fund | | | (71 | ) | | | 71 | | | | — | |
345
The Hartford Mutual Funds, Inc. and The Hartford Mutual Funds II, Inc.
Notes to Financial Statements — (continued)
April 30, 2008 (Unaudited)
(000’s Omitted)
| | | | | | | | | | | | | |
| | | Undistributed
| | | Accumulated
| | | | |
| | | Net Investment
| | | Net Realized
| | | | |
| | | Income | | | Gain (Loss) | | | Paid-in-Capital | |
| |
| Value Fund | | | (10 | ) | | | 10 | | | | — | |
| Value Opportunities Fund | | | 3 | | | | (4 | ) | | | 1 | |
| | |
| | d) | Capital Loss Carryforward: |
At October 31, 2007 (tax-year-end), the following Funds had capital loss carryforwards for U.S. federal income tax purposes of approximately:
| | | | | | | | | | | | | | | | | | | | | | | | | | | | | | | | | | | | | |
Fund | | 2008 | | | 2009 | | | 2010 | | | 2011 | | | 2012 | | | 2013 | | | 2014 | | | 2015 | | | Total | |
| |
| Disciplined Equity Fund | | | — | | | | — | | | | — | | | | 10,424 | | | | — | | | | — | | | | — | | | | — | | | | 10,424 | |
| Floating Rate Fund | | | — | | | | — | | | | — | | | | — | | | | — | | | | — | | | | 1,227 | | | | 48,277 | | | | 49,504 | |
| Global Technology Fund | | | — | | | | 5,132 | | | | 34,893 | | | | — | | | | — | | | | — | | | | — | | | | — | | | | 40,025 | |
| High Yield Fund | | | 16,050 | | | | 1,643 | | | | 25,246 | | | | 28,570 | | | | — | | | | — | | | | 3,595 | | | | — | | | | 75,104 | |
| High Yield Municipal Bond Fund | | | — | | | | — | | | | — | | | | — | | | | — | | | | — | | | | — | | | | 284 | | | | 284 | |
| Income Allocation Fund | | | — | | | | — | | | | — | | | | — | | | | — | | | | — | | | | 38 | | | | 96 | | | | 134 | |
| Income Fund | | | — | | | | — | | | | — | | | | — | | | | — | | | | 311 | | | | 262 | | | | 161 | | | | 734 | |
| Inflation Plus Fund | | | — | | | | — | | | | — | | | | — | | | | — | | | | — | | | | 8,467 | | | | 8,335 | | | | 16,802 | |
| International Opportunities Fund | | | — | | | | 959 | | | | 511 | | | | — | | | | — | | | | — | | | | — | | | | — | | | | 1,470 | |
| Short Duration Fund | | | — | | | | — | | | | — | | | | 221 | | | | 295 | | | | 977 | | | | 732 | | | | 162 | | | | 2,387 | |
| Stock Fund | | | — | | | | — | | | | — | | | | 138,221 | | | | — | | | | — | | | | — | | | | — | | | | 138,221 | |
| Tax-Free California Fund | | | — | | | | — | | | | — | | | | — | | | | — | | | | — | | | | 5 | | | | 267 | | | | 272 | |
| Tax-Free Minnesota Fund | | | — | | | | — | | | | — | | | | — | | | | — | | | | — | | | | — | | | | 114 | | | | 114 | |
| Tax-Free National Fund | | | — | | | | — | | | | — | | | | — | | | | — | | | | — | | | | — | | | | 887 | | | | 887 | |
| Tax-Free New York Fund | | | — | | | | — | | | | — | | | | — | | | | — | | | | — | | | | — | | | | 52 | | | | 52 | |
| Total Return Bond Fund | | | — | | | | — | | | | — | | | | — | | | | — | | | | — | | | | 8,505 | | | | — | | | | 8,505 | |
| U.S. Government Securities Fund | | | 2,205 | | | | 3,597 | | | | — | | | | 672 | | | | 3,591 | | | | 2,517 | | | | 6,198 | | | | 880 | | | | 19,660 | |
| | |
| | | Based on certain provisions in the IRC, various limitations regarding the future utilization of International Opportunities Fund and High Yield Fund carryforwards may apply. |
| | |
| | e) | Financial Accounting Standards Board Interpretation No. 48 — On July 13, 2006, the Financial Accounting Standards Board (FASB) released FASB Interpretation No. 48 “Accounting for Uncertainty in Income Taxes” (“FIN 48”). FIN 48 provides guidance for how uncertain tax positions should be recognized, measured, presented and disclosed in the financial statements. Management has evaluated the implications of FIN 48, for all open tax years (tax years ended December 31, 2005-2007) and has determined there is no impact to the Funds’ financial statements. |
| | |
| | a) | Investment Management and Advisory Agreements — HIFSCO serves as investment manager to each Fund pursuant to an Investment Advisory Agreement for The Hartford Mutual Funds, Inc. and The Hartford Mutual Funds II, Inc. As investment manager, HIFSCO has overall investment supervisory responsibility for each Fund. In addition, HIFSCO provides administrative personnel, services, equipment and facilities and office space for proper operation of the Funds. HIFSCO has contracted with Wellington for the provision of day-to-day investment management services to Advisers Fund, Balanced Income Fund, Capital Appreciation Fund, Capital Appreciation II Fund, Disciplined Equity Fund, Dividend and Growth Fund, Equity Income Fund, Fundamental Growth Fund, Global Communications Fund, Global Equity Fund, Global Financial Services Fund, Global Health Fund, Global Growth Fund, Global Technology Fund, Growth Fund, Growth Opportunities Fund, International Growth Fund, International Opportunities Fund, International Small Company Fund, MidCap Fund, MidCap Value Fund, Small Company Fund, SmallCap Growth Fund, Stock Fund, Value Fund and Value Opportunities Fund in accordance with each Fund’s investment objective and policies. In addition, HIFSCO has contracted with Hartford Investment Management, for the provision of day to day investment management services for Balanced Allocation Fund, Conservative Allocation Fund, Equity Growth Allocation Fund, Floating Rate Fund, Growth Allocation Fund, High Yield Fund, High Yield Municipal Bond Fund, Income Fund, Income Allocation Fund, Inflation Plus Fund, LargeCap Growth Fund, MidCap Growth Fund, Money Market Fund, Retirement Income Fund, Select MidCap Value Fund, Short Duration Fund, Small Company Fund, SmallCap Growth Fund, Strategic Income Fund, Target Retirement 2010 Fund, Target Retirement 2020 Fund, Target Retirement 2030 Fund, Tax-Free California Fund, Tax-Free Minnesota Fund, Tax-Free National Fund, Tax-Free New York Fund, Total Return Bond Fund and U.S. Government Securities Fund. HIFSCO has contracted for the provision of day to day investment management services with Kayne Anderson Rudnick Investment Management, LLC (“KAR”), Metropolitan West Capital Management, LLC (“MetWest Capital”) and SSgA Funds Management, Inc. (“SSgA FM”) for Select SmallCap Value Fund. Each Fund pays a fee to HIFSCO, a portion of which may be used to compensate Hartford Investment Management, KAR, MetWest Capital, SSgA FM and Wellington, as applicable. Checks and Balances Fund is managed by HIFSCO’s Investment Oversight Committee. |
The schedule below reflects the rates of compensation paid to HIFSCO for investment advisory services rendered during the six-month period ended April 30, 2008; the rates are accrued daily and paid monthly:
346
Capital Appreciation II Fund
| | | | | |
Average Daily Net Assets | | Annual Fee | |
| |
| On first $250 million | | | 1.00% | |
| On next $250 million | | | 0.95% | |
| On next $500 million | | | 0.90% | |
| Over $1 billion | | | 0.85% | |
Select SmallCap Value Fund
| | | | | |
Average Daily Net Assets | | Annual Fee | |
| |
| On first $500 million | | | 1.00% | |
| On next $500 million | | | 0.95% | |
| Over $1 billion | | | 0.90% | |
Global Equity Fund
| | | | | |
Average Daily Net Assets | | Annual Fee | |
| |
| On first $100 million | | | 0.95% | |
| On next $150 million | | | 0.90% | |
| Over $250 million | | | 0.85% | |
Global Communications Fund,
Global Financial Services Fund, Global Health Fund,
Global Technology Fund, International Growth Fund
and International Small Company Fund
| | | | | |
Average Daily Net Assets | | Annual Fee | |
| |
| On first $500 million | | | 0.90% | |
| On next $500 million | | | 0.85% | |
| Over $1 billion | | | 0.80% | |
SmallCap Growth Fund
| | | | | |
Average Daily Net Assets | | Annual Fee | |
| |
| On first $100 million | | | 0.90% | |
| On next $150 million | | | 0.80% | |
| On next $250 million | | | 0.70% | |
| Over $500 million | | | 0.65% | |
Growth Fund, Growth Opportunities Fund,
and Value Opportunities Fund
| | | | | |
Average Daily Net Assets | | Annual Fee | |
| |
| On first $100 million | | | 0.90% | |
| On next $150 million | | | 0.80% | |
| Over $250 million | | | 0.70% | |
Fundamental Growth Fund
| | | | | |
Average Daily Net Assets | | Annual Fee | |
| |
| On first $500 million | | | 0.85% | |
| On next $500 million | | | 0.80% | |
| Over $1 billion | | | 0.75% | |
Small Company Fund
| | | | | |
Average Daily Net Assets | | Annual Fee | |
| |
| On first $250 million | | | 0.85% | |
| On next $250 million | | | 0.80% | |
| On next $500 million | | | 0.75% | |
| On next $500 million | | | 0.70% | |
| Over $1 billion | | | 0.65% | |
Global Growth Fund,
International Opportunities Fund,
MidCap Fund
and MidCap Value Fund
| | | | | |
Average Daily Net Assets | | Annual Fee | |
| |
| On first $500 million | | | 0.85% | |
| On next $500 million | | | 0.75% | |
| Over $1 billion | | | 0.70% | |
Capital Appreciation Fund,
Disciplined Equity Fund
and Value Fund
| | | | | |
Average Daily Net Assets | | Annual Fee | |
| |
| On first $500 million | | | 0.80% | |
| On next $500 million | | | 0.70% | |
| Over $1 billion | | | 0.65% | |
347
The Hartford Mutual Funds, Inc. and The Hartford Mutual Funds II, Inc.
Notes to Financial Statements — (continued)
April 30, 2008 (Unaudited)
(000’s Omitted)
Equity Income Fund (1),
MidCap Growth Fund,
Select MidCap Value Fund
and Stock Fund
| | | | | |
Average Daily Net Assets | | Annual Fee | |
| |
| On first $500 million | | | 0.75% | |
| On next $500 million | | | 0.70% | |
| Over $1 billion | | | 0.65% | |
| | |
| (1) | | Effective November 1, 2007, HIFSCO has voluntarily agreed to waive management fees of 0.05% of average total net assets until October 31, 2008 |
Dividend and Growth Fund
| | | | | |
Average Daily Net Assets | | Annual Fee | |
| |
| On first $500 million | | | 0.75% | |
| On next $500 million | | | 0.65% | |
| Over $1 billion | | | 0.60% | |
Balanced Income Fund
| | | | | |
Average Daily Net Assets | | Annual Fee | |
| |
| On first $250 million | | | 0.725% | |
| On next $250 million | | | 0.700% | |
| On next $500 million | | | 0.675% | |
| Over $1 billion | | | 0.650% | |
High Yield Fund
| | | | | |
Average Daily Net Assets | | Annual Fee | |
| |
| On first $500 million | | | 0.70% | |
| On next $500 million | | | 0.65% | |
| On next $4 billion | | | 0.60% | |
| On next $5 billion | | | 0.58% | |
| Over $10 billion | | | 0.57% | |
Advisers Fund
| | | | | |
Average Daily Net Assets | | Annual Fee | |
| |
| On first $500 million | | | 0.690% | |
| On next $500 million | | | 0.625% | |
| Over $1 billion | | | 0.575% | |
Floating Rate Fund
| | | | | |
Average Daily Net Assets | | Annual Fee | |
| |
| On first $500 million | | | 0.65% | |
| On next $4.5 billion | | | 0.60% | |
| On next $5 billion | | | 0.58% | |
| Over $10 billion | | | 0.57% | |
LargeCap Growth Fund
| | | | | |
Average Daily Net Assets | | Annual Fee | |
| |
| On first $500 million | | | 0.65% | |
| On next $500 million | | | 0.60% | |
| Over $1 billion | | | 0.55% | |
Total Return Bond Fund
| | | | | |
Average Daily Net Assets | | Annual Fee | |
| |
| On first $500 million | | | 0.550% | |
| On next $500 million | | | 0.525% | |
| On next $4 billion | | | 0.500% | |
| On next $5 billion | | | 0.480% | |
| Over $10 billion | | | 0.470% | |
Income Fund, Inflation Plus Fund,
Tax-Free California Fund, Tax-Free Minnesota Fund,
Tax-Free National Fund, Tax-Free New York Fund
and U.S. Government Securities Fund
| | | | | |
Average Daily Net Assets | | Annual Fee | |
| |
| On first $500 million | | | 0.55% | |
| On next $4.5 billion | | | 0.50% | |
| On next $5 billion | | | 0.48% | |
| Over $10 billion | | | 0.47% | |
High Yield Municipal Bond Fund (2)
and Strategic Income Fund (2)
| | | | | |
Average Daily Net Assets | | Annual Fee | |
| |
| On first $500 million | | | 0.550% | |
| On next $500 million | | | 0.500% | |
| On next $4 billion | | | 0.475% | |
| On next $5 billion | | | 0.455% | |
| Over $10 billion | | | 0.445% | |
| | |
| (2) | | Effective June 1, 2007, HIFSCO has voluntarily agreed to waive 100% of the management fees until August 31, 2008 |
348
Short Duration Fund
| | | | | |
Average Daily Net Assets | | Annual Fee | |
| |
| On first $500 million | | | 0.50% | |
| On next $4.5 billion | | | 0.45% | |
| On next $5 billion | | | 0.43% | |
| Over $10 billion | | | 0.42% | |
Money Market Fund
| | | | | |
Average Daily Net Assets | | Annual Fee | |
| |
| On first $1 billion | | | 0.45% | |
| On next $4 billion | | | 0.40% | |
| On next $5 billion | | | 0.38% | |
| Over $10 billion | | | 0.37% | |
Balanced Allocation Fund, Conservative Allocation Fund,
Equity Growth Allocation Fund, Growth Allocation Fund,
Income Allocation Fund, Retirement Income Fund,
Target Retirement 2010 Fund, Target Retirement 2020 Fund
and Target Retirement 2030 Fund
| | | | | |
Average Daily Net Assets | | Annual Fee | |
| |
| On first $500 million | | | 0.15% | |
| Over $500 million | | | 0.10% | |
| | |
| | b) | Accounting Services Agreement — Pursuant to the Fund Accounting Agreement between Hartford Life Insurance Company (“HLIC”) and the Funds, HLIC provides accounting services to the Funds and received monthly compensation at the annual rate of 0.015% of each Fund’s average daily net assets through December 31, 2007. Balanced Allocation Fund, Conservative Allocation Fund, Equity Growth Allocation Fund, Growth Allocation Fund, Income Allocation Fund, Retirement Income Fund, Target Retirement 2010 Fund, Target Retirement 2020 Fund and Target Retirement 2030 Fund each paid a fee of 0.01% of each Fund’s average daily net assets through December 31, 2007. The Funds’ accounting services fees are accrued daily and paid monthly. |
Effective January 1, 2008, the rates of compensation paid to HLIC is as follows:
Advisers Fund, Balanced Income Fund,
Capital Appreciation Fund, Floating Rate Fund,
High Yield Fund, High Yield Municipal Bond Fund, Income Fund, Inflation Plus Fund, International Growth Fund, International Opportunities Fund,
International Small Company Fund, Short Duration Fund,
Strategic Income Fund and Total Return Bond Fund
| | | | | |
Average Daily Net Assets | | Annual Fee | |
| |
| On first $5 billion | | | 0.018% | |
| On next $5 billion | | | 0.016% | |
| Over $10 billion | | | 0.014% | |
Disciplined Equity Fund, Dividend and Growth Fund, Global Equity Fund, Global Growth Fund,
Money Market Fund, Small Company Fund,
SmallCap Growth Fund
and U.S. Government Securities Fund
| | | | | |
Average Daily Net Assets | | Annual Fee | |
| |
| On first $5 billion | | | 0.016% | |
| On next $5 billion | | | 0.014% | |
| Over $10 billion | | | 0.012% | |
Capital Appreciation II Fund, Equity Income Fund,
Global Health Fund, Income Allocation Fund,
MidCap Fund, MidCap Value Fund,
Retirement Income Fund, Stock Fund,
Tax-Free California Fund, Tax-Free Minnesota Fund, Tax-Free National Fund, Tax-Free New York Fund,
Value Fund and Value Opportunities Fund
| | | | | |
Average Daily Net Assets | | Annual Fee | |
| |
| On first $5 billion | | | 0.014% | |
| On next $5 billion | | | 0.012% | |
| Over $10 billion | | | 0.010% | |
Balanced Allocation Fund, Checks and Balances Fund,
Conservative Allocation Fund, Equity Growth Allocation Fund, Global Communications Fund, Global Financial Services Fund, Global Technology Fund, Growth Allocation Fund, Growth Fund, Growth Opportunities Fund, LargeCap Growth Fund, MidCap Growth Fund, Select MidCap Value Fund, Select SmallCap Value Fund, Target Retirement 2010 Fund, Target Retirement 2020 Fund
and Target Retirement 2030 Fund
| | | | | |
Average Daily Net Assets | | Annual Fee | |
| |
| On first $5 billion | | | 0.012% | |
| Over $5 billion | | | 0.010% | |
349
The Hartford Mutual Funds, Inc. and The Hartford Mutual Funds II, Inc.
Notes to Financial Statements — (continued)
April 30, 2008 (Unaudited)
(000’s Omitted)
Fundamental Growth Fund
| | | | | |
Average Daily Net Assets | | Annual Fee | |
| |
| All assets | | | 0.010% | |
| | |
| | c) | Operating Expenses — Allocable expenses incurred by the Funds are allocated to each Fund in proportion to the average daily net assets of each Fund, except where allocation of certain expenses is more fairly made directly to the Fund or to specific classes within a Fund. During the six-month period ended April 30, 2008, HIFSCO has contractually limited the total operating expenses of the Class A, B, C, I, L, R3, R4, R5 and Y shares of some of the Funds, exclusive of taxes, interest, brokerage commissions, certain distribution expenses and extraordinary expenses as follows: |
| | | | | | | | | | | | | | | | | | | | | | | | | | | | | | | | | | | | | |
Fund | | Class A | | | Class B | | | Class C | | | Class I | | | Class L | | | Class R3 | | | Class R4 | | | Class R5 | | | Class Y | |
| |
| Advisers Fund | | | 1.18 | % | | | NA | | | | NA | | | | NA | | | | NA | | | | 1.43 | % | | | 1.13 | % | | | 0.83 | % | | | NA | |
| Balanced Allocation Fund * | | | 1.40 | % | | | 2.15 | % | | | 2.15 | % | | | 1.15 | % | | | NA | | | | 1.78 | % | | | 1.48 | % | | | 1.18 | % | | | NA | |
| Balanced Income Fund | | | 1.25 | % | | | 2.00 | % | | | 2.00 | % | | | NA | | | | NA | | | | NA | | | | NA | | | | NA | | | | 0.90 | % |
| Capital Appreciation Fund | | | 1.29 | % | | | NA | | | | NA | | | | 1.04 | % | | | NA | | | | 1.54 | % | | | 1.24 | % | | | 0.94 | % | | | NA | |
| Capital Appreciation II Fund | | | 1.60 | % | | | 2.35 | % | | | 2.35 | % | | | 1.35 | % | | | NA | | | | 1.85 | % | | | 1.55 | % | | | 1.25 | % | | | 1.25 | % |
| Checks and Balances Fund * | | | 1.15 | % | | | 1.90 | % | | | 1.90 | % | | | 0.90 | % | | | NA | | | | NA | | | | NA | | | | NA | | | | NA | |
| Conservative Allocation Fund * | | | 1.35 | % | | | 2.10 | % | | | 2.10 | % | | | 1.10 | % | | | NA | | | | 1.78 | % | | | 1.48 | % | | | 1.18 | % | | | NA | |
| Disciplined Equity Fund | | | 1.40 | % | | | 2.15 | % | | | 2.15 | % | | | NA | | | | NA | | | | 1.65 | % | | | 1.35 | % | | | 1.05 | % | | | 1.00 | % |
| Dividend and Growth Fund | | | 1.25 | % | | | NA | | | | NA | | | | 1.00 | % | | | NA | | | | 1.50 | % | | | 1.20 | % | | | 0.90 | % | | | NA | |
| Equity Growth Allocation Fund * | | | 1.60 | % | | | 2.35 | % | | | 2.35 | % | | | 1.35 | % | | | NA | | | | 1.85 | % | | | 1.55 | % | | | 1.25 | % | | | NA | |
| Equity Income Fund | | | 1.25 | % | | | 2.00 | % | | | 2.00 | % | | | 1.00 | % | | | NA | | | | 1.60 | % | | | 1.30 | % | | | 1.00 | % | | | 0.90 | % |
| Floating Rate Fund + | | | 1.00 | % | | | 1.75 | % | | | 1.75 | % | | | 0.75 | % | | | NA | | | | 1.25 | % | | | 1.00 | % | | | 0.85 | % | | | 0.75 | % |
| Fundamental Growth Fund | | | 1.45 | % | | | 2.20 | % | | | 2.20 | % | | | NA | | | | NA | | | | NA | | | | NA | | | | NA | | | | 1.05 | % |
| Global Communications Fund | | | 1.60 | % | | | 2.35 | % | | | 2.35 | % | | | NA | | | | NA | | | | NA | | | | NA | | | | NA | | | | 1.20 | % |
| Global Equity Fund | | | 1.65 | % | | | 2.40 | % | | | 2.40 | % | | | 1.40 | % | | | NA | | | | 1.90 | % | | | 1.65 | % | | | 1.40 | % | | | 1.30 | % |
| Global Financial Services Fund | | | 1.60 | % | | | 2.35 | % | | | 2.35 | % | | | NA | | | | NA | | | | NA | | | | NA | | | | NA | | | | 1.20 | % |
| Global Growth Fund | | | 1.48 | % | | | 2.23 | % | | | 2.23 | % | | | NA | | | | NA | | | | 1.73 | % | | | 1.43 | % | | | 1.13 | % | | | 1.13 | % |
| Global Health Fund | | | 1.60 | % | | | 2.35 | % | | | 2.35 | % | | | 1.35 | % | | | NA | | | | 1.85 | % | | | 1.55 | % | | | 1.25 | % | | | 1.20 | % |
| Global Technology Fund | | | 1.60 | % | | | 2.35 | % | | | 2.35 | % | | | NA | | | | NA | | | | NA | | | | NA | | | | NA | | | | 1.20 | % |
| Growth Allocation Fund * | | | 1.50 | % | | | 2.25 | % | | | 2.25 | % | | | 1.25 | % | | | NA | | | | 1.81 | % | | | 1.51 | % | | | 1.21 | % | | | NA | |
| Growth Fund | | | 1.30 | % | | | 2.05 | % | | | 2.05 | % | | | 1.05 | % | | | 1.42 | % | | | 1.55 | % | | | 1.25 | % | | | 0.95 | % | | | 0.95 | % |
| Growth Opportunities Fund | | | 1.36 | % | | | 2.11 | % | | | 2.11 | % | | | 1.11 | % | | | 1.45 | % | | | 1.61 | % | | | 1.31 | % | | | 1.01 | % | | | 1.01 | % |
| High Yield Fund | | | 1.15 | % | | | 1.90 | % | | | 1.90 | % | | | 0.90 | % | | | NA | | | | 1.40 | % | | | 1.10 | % | | | 0.90 | % | | | 0.90 | % |
| High Yield Municipal Fund | | | 1.00 | % | | | 1.75 | % | | | 1.75 | % | | | 0.75 | % | | | NA | | | | NA | | | | NA | | | | NA | | | | NA | |
| Income Allocation Fund * | | | 1.20 | % | | | 1.95 | % | | | 1.95 | % | | | 0.95 | % | | | NA | | | | 1.59 | % | | | 1.29 | % | | | 0.99 | % | | | NA | |
| Income Fund | | | 0.95 | % | | | 1.70 | % | | | 1.70 | % | | | 0.75 | % | | | NA | | | | NA | | | | NA | | | | NA | | | | 0.70 | % |
| Inflation Plus Fund | | | 0.85 | % | | | 1.60 | % | | | 1.60 | % | | | 0.60 | % | | | NA | | | | 1.25 | % | | | 1.00 | % | | | 0.76 | % | | | 0.60 | % |
| International Growth Fund | | | 1.60 | % | | | 2.35 | % | | | 2.35 | % | | | 1.35 | % | | | NA | | | | 1.85 | % | | | 1.55 | % | | | 1.25 | % | | | 1.20 | % |
| International Opportunities Fund | | | 1.57 | % | | | 2.32 | % | | | 2.32 | % | | | NA | | | | NA | | | | 1.82 | % | | | 1.52 | % | | | 1.22 | % | | | 1.22 | % |
| International Small Company Fund | | | 1.60 | % | | | 2.35 | % | | | 2.35 | % | | | 1.35 | % | | | NA | | | | NA | | | | NA | | | | NA | | | | 1.20 | % |
| LargeCap Growth Fund | | | 1.25 | % | | | 2.00 | % | | | 2.00 | % | | | NA | | | | NA | | | | NA | | | | NA | | | | NA | | | | 0.85 | % |
| MidCap Fund | | | 1.37 | % | | | NA | | | | NA | | | | NA | | | | NA | | | | NA | | | | NA | | | | NA | | | | NA | |
| MidCap Growth Fund | | | 1.35 | % | | | 2.10 | % | | | 2.10 | % | | | NA | | | | NA | | | | NA | | | | NA | | | | NA | | | | 0.95 | % |
| MidCap Value Fund | | | 1.40 | % | | | 2.15 | % | | | 2.15 | % | | | NA | | | | NA | | | | NA | | | | NA | | | | NA | | | | 1.00 | % |
| Money Market Fund | | | 0.90 | % | | | 1.65 | % | | | 1.65 | % | | | NA | | | | NA | | | | 1.15 | % | | | 0.85 | % | | | 0.65 | % | | | 0.65 | % |
| Retirement Income Fund * | | | 1.20 | % | | | 1.95 | % | | | 1.95 | % | | | NA | | | | NA | | | | 1.60 | % | | | 1.30 | % | | | 1.00 | % | | | 0.85 | % |
| Select MidCap Value Fund | | | 1.30 | % | | | 2.05 | % | | | 2.05 | % | | | NA | | | | NA | | | | NA | | | | NA | | | | NA | | | | 0.90 | % |
| Select SmallCap Value Fund | | | 1.60 | % | | | 2.35 | % | | | 2.35 | % | | | NA | | | | NA | | | | NA | | | | NA | | | | NA | | | | 1.20 | % |
| Short Duration Fund | | | 0.90 | % | | | 1.65 | % | | | 1.65 | % | | | NA | | | | NA | | | | NA | | | | NA | | | | NA | | | | 0.65 | % |
| SmallCap Growth Fund | | | 1.40 | % | | | 2.15 | % | | | 2.15 | % | | | 1.15 | % | | | 1.25 | % | | | 1.65 | % | | | 1.35 | % | | | 1.05 | % | | | 1.05 | % |
| Small Company Fund | | | 1.40 | % | | | 2.15 | % | | | 2.15 | % | | | 1.15 | % | | | NA | | | | 1.65 | % | | | 1.35 | % | | | 1.05 | % | | | 1.00 | % |
| Stock Fund | | | 1.25 | % | | | NA | | | | NA | | | | NA | | | | NA | | | | 1.50 | % | | | 1.20 | % | | | 0.90 | % | | | NA | |
| Strategic Income Fund | | | 1.15 | % | | | 1.90 | % | | | 1.90 | % | | | 0.90 | % | | | NA | | | | NA | | | | NA | | | | NA | | | | 0.90 | % |
| Target Retirement 2010 Fund * | | | 1.25 | % | | | 2.00 | % | | | 2.00 | % | | | NA | | | | NA | | | | 1.65 | % | | | 1.35 | % | | | 1.05 | % | | | 0.90 | % |
| Target Retirement 2020 Fund * | | | 1.30 | % | | | 2.05 | % | | | 2.05 | % | | | NA | | | | NA | | | | 1.70 | % | | | 1.40 | % | | | 1.10 | % | | | 0.95 | % |
| Target Retirement 2030 Fund * | | | 1.35 | % | | | 2.10 | % | | | 2.10 | % | | | NA | | | | NA | | | | 1.75 | % | | | 1.45 | % | | | 1.15 | % | | | 1.00 | % |
| Tax-Free California Fund | | | 0.85 | % | | | 1.60 | % | | | 1.60 | % | | | NA | | | | NA | | | | NA | | | | NA | | | | NA | | | | NA | |
| Tax-Free Minnesota Fund | | | 0.85 | % | | | 1.60 | % | | | 1.60 | % | | | NA | | | | 0.90 | % | | | NA | | | | NA | | | | NA | | | | 0.75 | % |
| Tax-Free National Fund | | | 0.85 | % | | | 1.60 | % | | | 1.60 | % | | | 0.60 | % | | | 0.80 | % | | | NA | | | | NA | | | | NA | | | | 0.60 | % |
| Tax-Free New York Fund | | | 0.85 | % | | | 1.60 | % | | | 1.60 | % | | | NA | | | | NA | | | | NA | | | | NA | | | | NA | | | | NA | |
| Total Return Bond Fund + | | | 1.00 | % | | | 1.75 | % | | | 1.75 | % | | | 0.75 | % | | | NA | | | | 1.25 | % | | | 1.00 | % | | | 0.85 | % | | | 0.75 | % |
350
| | | | | | | | | | | | | | | | | | | | | | | | | | | | | | | | | | | | | |
Fund | | Class A | | | Class B | | | Class C | | | Class I | | | Class L | | | Class R3 | | | Class R4 | | | Class R5 | | | Class Y | |
| |
| U.S. Government Securities Fund + | | | 1.00 | % | | | 1.75 | % | | | 1.75 | % | | | NA | | | | 1.00 | % | | | NA | | | | NA | | | | NA | | | | 0.75 | % |
| Value Fund | | | 1.40 | % | | | 2.15 | % | | | 2.15 | % | | | 1.15 | % | | | NA | | | | 1.65 | % | | | 1.35 | % | | | 1.05 | % | | | 1.00 | % |
| Value Opportunities Fund | | | 1.40 | % | | | 2.15 | % | | | 2.15 | % | | | 1.15 | % | | | 1.45 | % | | | 1.65 | % | | | 1.35 | % | | | 1.05 | % | | | 1.05 | % |
| | |
| * | | Voluntary limitations for total operating expenses include expenses incurred as the result of investing in other investment companies. |
| + | | Permanent expense caps. |
| | |
| | d) | Fees Paid Indirectly — The Funds have entered into agreements with State Street Global Advisors, LLC and Frank Russell Securities, Inc. to partially recapture non-discounted trade commissions. Such rebates are used to pay a portion of the Funds’ expenses. In addition, the Funds’ custodian bank has also agreed to reduce its fees when the Funds maintain cash on deposit in the non-interest-bearing custody account. For the six-month period ended April 30, 2008, these amounts are included in the Statements of Operations. |
| | |
| | | The ratio of expenses to average net assets in the accompanying financial highlights excludes the reduction in expenses related to fees paid indirectly. Had the fees paid indirectly been included, the annualized expense ratio for the periods listed below would have been as follows: |
| | | | | | | | | | | | | | | | | |
| | | Annualized
| | | | | | | | | | |
| | | Six-Month
| | | | | | | | | | |
| | | Period Ended
| | | Year Ended
| | | Year Ended
| | | Year Ended
| |
Fund | | April 30, 2008 | | | October 31, 2007 | | | October 31, 2006 | | | October 31, 2005 | |
| |
Advisers Fund | | | | | | | | | | | | | | | | |
| Class A Shares | | | 1.16 | % | | | 1.09 | % | | | 1.11 | % | | | 1.18 | % |
| Class B Shares | | | 2.01 | % | | | 1.90 | % | | | 1.90 | % | | | 1.96 | % |
| Class C Shares | | | 1.86 | % | | | 1.78 | % | | | 1.81 | % | | | 1.88 | % |
| Class R3 Shares | | | 1.43 | % | | | 1.40 | %(f) | | | | | | | | |
| Class R4 Shares | | | 1.12 | % | | | 1.05 | %(f) | | | | | | | | |
| Class R5 Shares | | | 0.80 | % | | | 0.80 | %(f) | | | | | | | 0.73 | % |
| Class Y Shares | | | 0.70 | % | | | 0.63 | % | | | 0.65 | % | | | | |
Balanced Allocation Fund | | | | | | | | | | | | | | | | |
| Class A Shares | | | 0.53 | % | | | 0.54 | % | | | 0.62 | % | | | 0.60 | % |
| Class B Shares | | | 1.35 | % | | | 1.33 | % | | | 1.36 | % | | | 1.31 | % |
| Class C Shares | | | 1.28 | % | | | 1.29 | % | | | 1.36 | % | | | 1.31 | % |
| Class I Shares | | | 0.21 | % | | | 0.22 | % | | | 0.39 | %(d) | | | | |
| Class R3 Shares | | | 0.94 | % | | | 0.93 | %(f) | | | | | | | | |
| Class R4 Shares | | | 0.59 | % | | | 0.66 | %(f) | | | | | | | | |
| Class R5 Shares | | | 0.29 | % | | | 0.36 | %(f) | | | | | | | | |
Balanced Income Fund | | | | | | | | | | | | | | | | |
| Class A Shares | | | 1.20 | % | | | 1.19 | % | | | 1.26 | %(c) | | | | |
| Class B Shares | | | 2.00 | % | | | 2.00 | % | | | 2.00 | %(c) | | | | |
| Class C Shares | | | 1.98 | % | | | 2.00 | % | | | 2.00 | %(c) | | | | |
| Class Y Shares | | | 0.87 | % | | | 0.90 | % | | | 0.90 | %(c) | | | | |
Capital Appreciation Fund | | | | | | | | | | | | | | | | |
| Class A Shares | | | 1.09 | % | | | 1.11 | % | | | 1.17 | % | | | 1.22 | % |
| Class B Shares | | | 1.91 | % | | | 1.91 | % | | | 1.96 | % | | | 1.99 | % |
| Class C Shares | | | 1.82 | % | | | 1.83 | % | | | 1.88 | % | | | 1.91 | % |
| Class I Shares | | | 0.79 | % | | | 0.78 | % | | | 0.88 | %(d) | | | | |
| Class R3 Shares | | | 1.58 | % | | | 1.47 | %(f) | | | | | | | | |
| Class R4 Shares | | | 1.11 | % | | | 1.13 | %(f) | | | | | | | | |
| Class R5 Shares | | | 0.81 | % | | | 0.84 | %(f) | | | | | | | | |
| Class Y Shares | | | 0.71 | % | | | 0.71 | % | | | 0.73 | % | | | 0.75 | % |
| Class A Shares | | | 1.37 | % | | | 1.43 | % | | | 1.59 | % | | | 1.60 | % |
| Class B Shares | | | 2.23 | % | | | 2.29 | % | | | 2.34 | % | | | 2.35 | % |
| Class C Shares | | | 2.11 | % | | | 2.16 | % | | | 2.32 | % | | | 2.35 | % |
| Class I Shares | | | 1.06 | % | | | 1.10 | % | | | 0.80 | %(d) | | | | |
| Class R3 Shares | | | 1.72 | % | | | 1.86 | %(f) | | | | | | | | |
| Class R4 Shares | | | 1.40 | % | | | 1.47 | %(f) | | | | | | | | |
| Class R5 Shares | | | 1.11 | % | | | 1.22 | %(f) | | | | | | | | |
| Class Y Shares | | | 0.98 | % | | | 1.01 | % | | | 1.13 | % | | | 1.15 | % |
Checks and Balances Fund | | | | | | | | | | | | | | | | |
| Class A Shares | | | 0.40 | % | | | 0.43 | %(i) | | | | | | | | |
| Class B Shares | | | 1.22 | % | | | 1.25 | %(i) | | | | | | | | |
| Class C Shares | | | 1.15 | % | | | 1.18 | %(i) | | | | | | | | |
| Class I Shares | | | 0.17 | %(k) | | | | | | | | | | | | |
Conservative Allocation Fund | | | | | | | | | | | | | | | | |
351
The Hartford Mutual Funds, Inc. and The Hartford Mutual Funds II, Inc.
Notes to Financial Statements — (continued)
April 30, 2008 (Unaudited)
(000’s Omitted)
| | | | | | | | | | | | | | | | | |
| | | Annualized
| | | | | | | | | | |
| | | Six-Month
| | | | | | | | | | |
| | | Period Ended
| | | Year Ended
| | | Year Ended
| | | Year Ended
| |
Fund | | April 30, 2008 | | | October 31, 2007 | | | October 31, 2006 | | | October 31, 2005 | |
| |
| Class A Shares | | | 0.57 | % | | | 0.59 | % | | | 0.63 | % | | | 0.60 | % |
| Class B Shares | | | 1.33 | % | | | 1.28 | % | | | 1.31 | % | | | 1.26 | % |
| Class C Shares | | | 1.33 | % | | | 1.28 | % | | | 1.31 | % | | | 1.26 | % |
| Class I Shares | | | 0.28 | % | | | 0.26 | % | | | 0.41 | %(d) | | | | |
| Class R3 Shares | | | 1.02 | % | | | 1.03 | %(f) | | | | | | | | |
| Class R4 Shares | | | 0.62 | % | | | 0.75 | %(f) | | | | | | | | |
| Class R5 Shares | | | 0.32 | % | | | 0.47 | %(f) | | | | | | | | |
Disciplined Equity Fund | | | | | | | | | | | | | | | | |
| Class A Shares | | | 1.40 | % | | | 1.40 | % | | | 1.39 | % | | | 1.38 | % |
| Class B Shares | | | 1.98 | % | | | 2.08 | % | | | 2.07 | % | | | 2.13 | % |
| Class C Shares | | | 2.11 | % | | | 2.09 | % | | | 2.09 | % | | | 2.10 | % |
| Class R3 Shares | | | 1.65 | % | | | 1.65 | %(f) | | | | | | | | |
| Class R4 Shares | | | 1.28 | % | | | 1.34 | %(f) | | | | | | | | |
| Class R5 Shares | | | 0.99 | % | | | 1.05 | %(f) | | | | | | | | |
| Class Y Shares | | | 0.89 | % | | | 0.88 | % | | | 0.88 | % | | | 0.89 | % |
Dividend and Growth Fund | | | | | | | | | | | | | | | | |
| Class A Shares | | | 1.08 | % | | | 1.09 | % | | | 1.13 | % | | | 1.16 | % |
| Class B Shares | | | 1.95 | % | | | 1.95 | % | | | 1.98 | % | | | 2.01 | % |
| Class C Shares | | | 1.82 | % | | | 1.82 | % | | | 1.86 | % | | | 1.88 | % |
| Class I Shares | | | 0.78 | % | | | 0.76 | % | | | 0.98 | %(d) | | | | |
| Class R3 Shares | | | 1.50 | % | | | 1.40 | %(f) | | | | | | | | |
| Class R4 Shares | | | 1.08 | % | | | 1.09 | %(f) | | | | | | | | |
| Class R5 Shares | | | 0.79 | % | | | 0.82 | %(f) | | | | | | | | |
| Class Y Shares | | | 0.68 | % | | | 0.68 | % | | | 0.70 | % | | | 0.72 | % |
Equity Growth Allocation Fund | | | | | | | | | | | | | | | | |
| Class A Shares | | | 0.67 | % | | | 0.69 | % | | | 0.72 | % | | | 0.68 | % |
| Class B Shares | | | 1.49 | % | | | 1.37 | % | | | 1.37 | % | | | 1.33 | % |
| Class C Shares | | | 1.42 | % | | | 1.37 | % | | | 1.37 | % | | | 1.34 | % |
| Class I Shares | | | 0.29 | % | | | 0.37 | % | | | 0.48 | %(d) | | | | |
| Class R3 Shares | | | 0.95 | % | | | 0.96 | %(f) | | | | | | | | |
| Class R4 Shares | | | 0.64 | % | | | 0.70 | %(f) | | | | | | | | |
| Class R5 Shares | | | 0.34 | % | | | 0.38 | %(f) | | | | | | | | |
Equity Income Fund | | | | | | | | | | | | | | | | |
| Class A Shares | | | 1.13 | % | | | 1.12 | % | | | 1.00 | % | | | 0.50 | % |
| Class B Shares | | | 1.98 | % | | | 1.96 | % | | | 1.84 | % | | | 1.38 | % |
| Class C Shares | | | 1.86 | % | | | 1.83 | % | | | 1.70 | % | | | 1.22 | % |
| Class I Shares | | | 0.83 | % | | | 0.81 | % | | | 0.80 | %(d) | | | | |
| Class R3 Shares | | | 1.48 | % | | | 1.50 | %(f) | | | | | | | | |
| Class R4 Shares | | | 1.12 | % | | | 1.18 | %(f) | | | | | | | | |
| Class R5 Shares | | | 0.84 | % | | | 0.89 | %(f) | | | | | | | | |
| Class Y Shares | | | 0.74 | % | | | 0.73 | % | | | 0.57 | % | | | 0.10 | % |
Floating Rate Fund | | | | | | | | | | | | | | | | |
| Class A Shares | | | 0.99 | % | | | 0.96 | % | | | 0.50 | % | | | | |
| Class B Shares | | | 1.75 | % | | | 1.75 | % | | | 1.35 | % | | | | |
| Class C Shares | | | 1.75 | % | | | 1.74 | % | | | 1.28 | % | | | | |
| Class I Shares | | | 0.73 | % | | | 0.71 | % | | | 0.43 | %(d) | | | | |
| Class R3 Shares | | | 1.25 | % | | | 1.24 | %(f) | | | | | | | | |
| Class R4 Shares | | | 1.00 | % | | | 1.00 | %(f) | | | | | | | | |
| Class R5 Shares | | | 0.85 | % | | | 0.85 | %(f) | | | | | | | | |
| Class Y Shares | | | 0.69 | % | | | 0.68 | % | | | 0.15 | % | | | | |
Fundamental Growth Fund | | | | | | | | | | | | | | | | |
| Class A Shares | | | 1.45 | % | | | 1.47 | % | | | 1.48 | % | | | 1.57 | % |
| Class B Shares | | | 2.20 | % | | | 2.22 | % | | | 2.23 | % | | | 2.32 | % |
| Class C Shares | | | 2.20 | % | | | 2.20 | % | | | 2.23 | % | | | 2.32 | % |
| Class Y Shares | | | 1.00 | % | | | 1.02 | % | | | 1.05 | % | | | 1.13 | % |
Global Communications Fund | | | | | | | | | | | | | | | | |
| Class A Shares | | | 1.56 | % | | | 1.60 | % | | | 1.11 | % | | | 1.49 | % |
| Class B Shares | | | 2.27 | % | | | 2.30 | % | | | 1.73 | % | | | 2.24 | % |
| Class C Shares | | | 2.30 | % | | | 2.34 | % | | | 1.85 | % | | | 2.23 | % |
352
| | | | | | | | | | | | | | | | | |
| | | Annualized
| | | | | | | | | | |
| | | Six-Month
| | | | | | | | | | |
| | | Period Ended
| | | Year Ended
| | | Year Ended
| | | Year Ended
| |
Fund | | April 30, 2008 | | | October 31, 2007 | | | October 31, 2006 | | | October 31, 2005 | |
| |
| Class Y Shares | | | 1.07 | % | | | 1.11 | % | | | 0.70 | % | | | 1.04 | % |
Global Equity Fund | | | | | | | | | | | | | | | | |
| Class A Shares | | | 1.64 | %(k) | | | | | | | | | | | | |
| Class B Shares | | | 2.39 | %(k) | | | | | | | | | | | | |
| Class C Shares | | | 2.39 | %(k) | | | | | | | | | | | | |
| Class I Shares | | | 1.39 | %(k) | | | | | | | | | | | | |
| Class R3 Shares | | | 1.90 | %(k) | | | | | | | | | | | | |
| Class R4 Shares | | | 1.67 | %(k) | | | | | | | | | | | | |
| Class R5 Shares | | | 1.43 | %(k) | | | | | | | | | | | | |
| Class Y Shares | | | 1.32 | %(k) | | | | | | | | | | | | |
Global Financial Services Fund | | | | | | | | | | | | | | | | |
| Class A Shares | | | 1.59 | % | | | 1.60 | % | | | 1.14 | % | | | 1.48 | % |
| Class B Shares | | | 2.07 | % | | | 2.22 | % | | | 1.77 | % | | | 2.25 | % |
| Class C Shares | | | 2.35 | % | | | 2.35 | % | | | 1.90 | % | | | 2.25 | % |
| Class Y Shares | | | 1.17 | % | | | 1.14 | % | | | 0.74 | % | | | 1.07 | % |
Global Growth Fund | | | | | | | | | | | | | | | | |
| Class A Shares | | | 1.45 | % | | | 1.47 | % | | | 1.45 | % | | | 1.36 | % |
| Class B Shares | | | 2.04 | % | | | 2.18 | % | | | 2.15 | % | | | 2.23 | % |
| Class C Shares | | | 2.14 | % | | | 2.14 | % | | | 2.18 | % | | | 2.13 | % |
| Class R3 Shares | | | 1.72 | % | | | 1.65 | %(f) | | | | | | | | |
| Class R4 Shares | | | 1.43 | % | | | 1.34 | %(f) | | | | | | | | |
| Class R5 Shares | | | 0.98 | % | | | 1.05 | %(f) | | | | | | | | |
| Class Y Shares | | | 0.89 | % | | | 0.89 | % | | | 0.91 | % | | | 0.85 | % |
Global Health Fund | | | | | | | | | | | | | | | | |
| Class A Shares | | | 1.40 | % | | | 1.40 | % | | | 1.60 | % | | | 1.58 | % |
| Class B Shares | | | 2.25 | % | | | 2.29 | % | | | 2.31 | % | | | 2.33 | % |
| Class C Shares | | | 2.14 | % | | | 2.14 | % | | | 2.31 | % | | | 2.33 | % |
| Class I Shares | | | 1.12 | % | | | 1.08 | % | | | 1.14 | %(d) | | | | |
| Class R3 Shares | | | 1.73 | % | | | 1.77 | %(f) | | | | | | | | |
| Class R4 Shares | | | 1.35 | % | | | 1.45 | %(f) | | | | | | | | |
| Class R5 Shares | | | 1.06 | % | | | 1.17 | %(f) | | | | | | | | |
| Class Y Shares | | | 0.94 | % | | | 0.95 | % | | | 1.08 | % | | | 1.06 | % |
Global Technology Fund | | | | | | | | | | | | | | | | |
| Class A Shares | | | 1.43 | % | | | 1.43 | % | | | 1.32 | % | | | 1.53 | % |
| Class B Shares | | | 1.98 | % | | | 2.03 | % | | | 1.96 | % | | | 2.28 | % |
| Class C Shares | | | 2.28 | % | | | 2.30 | % | | | 2.21 | % | | | 2.28 | % |
| Class Y Shares | | | 1.07 | % | | | 1.08 | % | | | 1.17 | % | | | 1.13 | % |
Growth Allocation Fund | | | | | | | | | | | | | | | | |
| Class A Shares | | | 0.58 | % | | | 0.60 | % | | | 0.67 | % | | | 0.64 | % |
| Class B Shares | | | 1.40 | % | | | 1.32 | % | | | 1.32 | % | | | 1.29 | % |
| Class C Shares | | | 1.33 | % | | | 1.31 | % | | | 1.32 | % | | | 1.29 | % |
| Class I Shares | | | 0.22 | % | | | 0.23 | % | | | 0.42 | %(d) | | | | |
| Class R3 Shares | | | 1.00 | % | | | 0.93 | %(f) | | | | | | | | |
| Class R4 Shares | | | 0.60 | % | | | 0.65 | %(f) | | | | | | | | |
| Class R5 Shares | | | 0.30 | % | | | 0.38 | %(f) | | | | | | | | |
Growth Fund | | | | | | | | | | | | | | | | |
| Class A Shares | | | 1.26 | % | | | 1.27 | % | | | 1.31 | % | | | 1.31 | % |
| Class B Shares | | | 1.94 | % | | | 2.08 | % | | | 2.08 | % | | | 2.13 | % |
| Class C Shares | | | 1.96 | % | | | 1.98 | % | | | 2.00 | % | | | 2.03 | % |
| Class I Shares | | | 0.89 | % | | | 0.90 | % | | | 0.91 | %(d) | | | | |
| Class L Shares | | | 1.03 | % | | | 1.04 | % | | | 1.03 | % | | | 1.04 | % |
| Class R3 Shares | | | 1.55 | % | | | 1.57 | %(f) | | | | | | | | |
| Class R4 Shares | | | 1.20 | % | | | 1.18 | %(f) | | | | | | | | |
| Class R5 Shares | | | 0.93 | % | | | 0.91 | %(f) | | | | | | | | |
| Class Y Shares | | | 0.80 | % | | | 0.81 | % | | | 0.81 | % | | | 0.83 | % |
Growth Opportunities Fund | | | | | | | | | | | | | | | | |
| Class A Shares | | | 1.24 | % | | | 1.31 | % | | | 1.18 | % | | | 1.30 | % |
| Class B Shares | | | 2.06 | % | | | 2.10 | % | | | 2.05 | % | | | 2.08 | % |
| Class C Shares | | | 1.90 | % | | | 1.97 | % | | | 2.05 | % | | | 2.07 | % |
353
The Hartford Mutual Funds, Inc. and The Hartford Mutual Funds II, Inc.
Notes to Financial Statements — (continued)
April 30, 2008 (Unaudited)
(000’s Omitted)
| | | | | | | | | | | | | | | | | |
| | | Annualized
| | | | | | | | | | |
| | | Six-Month
| | | | | | | | | | |
| | | Period Ended
| | | Year Ended
| | | Year Ended
| | | Year Ended
| |
Fund | | April 30, 2008 | | | October 31, 2007 | | | October 31, 2006 | | | October 31, 2005 | |
| |
| Class I Shares | | | 0.84 | % | | | 0.86 | % | | | 1.11 | %(d) | | | | |
| Class L Shares | | | 0.99 | % | | | 1.03 | % | | | 1.04 | % | | | 1.02 | % |
| Class R3 Shares | | | 1.48 | % | | | 1.57 | %(f) | | | | | | | | |
| Class R4 Shares | | | 1.16 | % | | | 1.23 | %(f) | | | | | | | | |
| Class R5 Shares | | | 0.89 | % | | | 0.92 | %(f) | | | | | | | | |
| Class Y Shares | | | 0.76 | % | | | 0.79 | % | | | 0.81 | % | | | 0.82 | % |
High Yield Fund | | | | | | | | | | | | | | | | |
| Class A Shares | | | 1.15 | % | | | 1.15 | % | | | 1.20 | % | | | 1.33 | % |
| Class B Shares | | | 1.89 | % | | | 1.90 | % | | | 1.94 | % | | | 2.10 | % |
| Class C Shares | | | 1.90 | % | | | 1.83 | % | | | 1.89 | % | | | 2.00 | % |
| Class I Shares | | | 0.83 | % | | | 0.75 | %(i) | | | | | | | | |
| Class R3 Shares | | | 1.40 | % | | | 1.40 | %(f) | | | | | | | | |
| Class R4 Shares | | | 1.10 | % | | | 1.10 | %(f) | | | | | | | | |
| Class R5 Shares | | | 0.90 | % | | | 0.85 | %(f) | | | | | | | | |
| Class Y Shares | | | 0.82 | % | | | 0.67 | % | | | 0.73 | % | | | 0.87 | % |
High Yield Municipal Bond Fund | | | | | | | | | | | | | | | | |
| Class A Shares | | | 0.32 | % | | | 0.25 | %(g) | | | | | | | | |
| Class B Shares | | | 1.10 | % | | | 1.00 | %(g) | | | | | | | | |
| Class C Shares | | | 1.10 | % | | | 1.00 | %(g) | | | | | | | | |
| Class I Shares | | | 0.09 | % | | | 0.00 | %(g) | | | | | | | | |
Income Allocation Fund | | | | | | | | | | | | | | | | |
| Class A Shares | | | 0.56 | % | | | 0.58 | % | | | 0.61 | % | | | 0.56 | % |
| Class B Shares | | | 1.31 | % | | | 1.28 | % | | | 1.31 | % | | | 1.26 | % |
| Class C Shares | | | 1.31 | % | | | 1.28 | % | | | 1.31 | % | | | 1.26 | % |
| Class I Shares | | | 0.31 | % | | | 0.33 | % | | | 0.37 | %(d) | | | | |
| Class R3 Shares | | | 0.95 | % | | | 0.97 | %(f) | | | | | | | | |
| Class R4 Shares | | | 0.65 | % | | | 0.68 | %(f) | | | | | | | | |
| Class R5 Shares | | | 0.35 | % | | | 0.37 | %(f) | | | | | | | | |
Income Fund | | | | | | | | | | | | | | | | |
| Class A Shares | | | 0.95 | % | | | 0.95 | % | | | 0.95 | % | | | 0.95 | % |
| Class B Shares | | | 1.70 | % | | | 1.70 | % | | | 1.70 | % | | | 1.70 | % |
| Class C Shares | | | 1.70 | % | | | 1.70 | % | | | 1.70 | % | | | 1.70 | % |
| Class Y Shares | | | 0.62 | % | | | 0.68 | % | | | 0.70 | % | | | 0.70 | % |
Inflation Plus Fund | | | | | | | | | | | | | | | | |
| Class A Shares | | | 0.85 | % | | | 0.85 | % | | | 0.95 | % | | | 0.95 | % |
| Class B Shares | | | 1.60 | % | | | 1.60 | % | | | 1.70 | % | | | 1.70 | % |
| Class C Shares | | | 1.60 | % | | | 1.60 | % | | | 1.70 | % | | | 1.70 | % |
| Class I Shares | | | 0.61 | % | | | 0.58 | % | | | 0.70 | %(d) | | | | |
| Class R3 Shares | | | 1.26 | % | | | 1.23 | %(f) | | | | | | | | |
| Class R4 Shares | | | 1.00 | % | | | 0.98 | %(f) | | | | | | | | |
| Class R5 Shares | | | 0.70 | % | | | 0.72 | %(f) | | | | | | | | |
| Class Y Shares | | | 0.60 | % | | | 0.56 | % | | | 0.68 | % | | | 0.68 | % |
International Growth Fund | | | | | | | | | | | | | | | | |
| Class A Shares | | | 1.44 | % | | | 1.48 | % | | | 1.56 | % | | | 1.53 | % |
| Class B Shares | | | 2.27 | % | | | 2.32 | % | | | 2.26 | % | | | 2.28 | % |
| Class C Shares | | | 2.16 | % | | | 2.19 | % | | | 2.31 | % | | | 2.28 | % |
| Class I Shares | | | 1.06 | % | | | 1.09 | % | | | 1.35 | %(d) | | | | |
| Class R3 Shares | | | 1.84 | % | | | 1.83 | %(f) | | | | | | | | |
| Class R4 Shares | | | 1.54 | % | | | 1.45 | %(f) | | | | | | | | |
| Class R5 Shares | | | 1.07 | % | | | 1.16 | %(f) | | | | | | | | |
| Class Y Shares | | | 0.97 | % | | | 1.01 | % | | | 1.12 | % | | | 1.13 | % |
International Opportunities Fund | | | | | | | | | | | | | | | | |
| Class A Shares | | | 1.43 | % | | | 1.49 | % | | | 1.54 | % | | | 1.52 | % |
| Class B Shares | | | 2.15 | % | | | 2.18 | % | | | 2.12 | % | | | 2.30 | % |
| Class C Shares | | | 2.17 | % | | | 2.21 | % | | | 2.30 | % | | | 2.30 | % |
| Class R3 Shares | | | 1.78 | % | | | 1.71 | %(f) | | | | | | | | |
| Class R4 Shares | | | 1.38 | % | | | 1.40 | %(f) | | | | | | | | |
| Class R5 Shares | | | 1.03 | % | | | 1.11 | %(f) | | | | | | | | |
| Class Y Shares | | | 0.93 | % | | | 0.95 | % | | | 0.99 | % | | | 1.01 | % |
354
| | | | | | | | | | | | | | | | | |
| | | Annualized
| | | | | | | | | | |
| | | Six-Month
| | | | | | | | | | |
| | | Period Ended
| | | Year Ended
| | | Year Ended
| | | Year Ended
| |
Fund | | April 30, 2008 | | | October 31, 2007 | | | October 31, 2006 | | | October 31, 2005 | |
| |
International Small Company Fund | | | | | | | | | | | | | | | | |
| Class A Shares | | | 1.48 | % | | | 1.49 | % | | | 1.58 | % | | | 1.55 | % |
| Class B Shares | | | 2.19 | % | | | 2.25 | % | | | 2.22 | % | | | 2.30 | % |
| Class C Shares | | | 2.23 | % | | | 2.23 | % | | | 2.33 | % | | | 2.30 | % |
| Class I Shares | | | 1.15 | % | | | 1.18 | %(i) | | | | | | | | |
| Class Y Shares | | | 1.00 | % | | | 1.01 | % | | | 1.18 | % | | | 1.15 | % |
LargeCap Growth Fund | | | | | | | | | | | | | | | | |
| Class A Shares | | | 1.25 | % | | | 1.11 | %(e) | | | | | | | | |
| Class B Shares | | | 2.00 | % | | | 1.96 | %(e) | | | | | | | | |
| Class C Shares | | | 2.00 | % | | | 1.93 | %(e) | | | | | | | | |
| Class Y Shares | | | 0.85 | % | | | 0.85 | %(e) | | | | | | | | |
MidCap Fund | | | | | | | | | | | | | | | | |
| Class A Shares | | | 1.22 | % | | | 1.21 | % | | | 1.25 | % | | | 1.28 | % |
| Class B Shares | | | 2.00 | % | | | 1.98 | % | | | 2.01 | % | | | 2.06 | % |
| Class C Shares | | | 1.91 | % | | | 1.90 | % | | | 1.93 | % | | | 1.97 | % |
| Class Y Shares | | | 0.79 | % | | | 0.78 | % | | | 0.78 | % | | | 0.81 | % |
MidCap Growth Fund | | | | | | | | | | | | | | | | |
| Class A Shares | | | 1.34 | % | | | 1.36 | % | | | 1.48 | % | | | 1.49 | %(a) |
| Class B Shares | | | 1.85 | % | | | 1.95 | % | | | 2.09 | % | | | 2.24 | %(a) |
| Class C Shares | | | 2.00 | % | | | 2.11 | % | | | 2.23 | % | | | 2.24 | %(a) |
| Class Y Shares | | | 0.95 | % | | | 1.01 | % | | | 1.08 | % | | | 1.09 | %(a) |
MidCap Value Fund | | | | | | | | | | | | | | | | |
| Class A Shares | | | 1.39 | % | | | 1.39 | % | | | 1.39 | % | | | 1.38 | % |
| Class B Shares | | | 2.09 | % | | | 2.15 | % | | | 2.14 | % | | | 2.13 | % |
| Class C Shares | | | 2.13 | % | | | 2.09 | % | | | 2.14 | % | | | 2.13 | % |
| Class Y Shares | | | 0.93 | % | | | 0.89 | % | | | 0.93 | % | | | 0.94 | % |
Money Market Fund | | | | | | | | | | | | | | | | |
| Class A Shares | | | 0.90 | % | | | 0.95 | % | | | 0.95 | % | | | 0.95 | % |
| Class B Shares | | | 1.65 | % | | | 1.70 | % | | | 1.70 | % | | | 1.70 | % |
| Class C Shares | | | 1.56 | % | | | 1.69 | % | | | 1.70 | % | | | 1.70 | % |
| Class R3 Shares | | | 1.15 | % | | | 1.20 | %(f) | | | | | | | | |
| Class R4 Shares | | | 0.85 | % | | | 0.90 | %(f) | | | | | | | | |
| Class R5 Shares | | | 0.61 | % | | | 0.60 | %(f) | | | | | | | | |
| Class Y Shares | | | 0.51 | % | | | 0.55 | % | | | 0.55 | % | | | 0.55 | % |
Retirement Income Fund | | | | | | | | | | | | | | | | |
| Class A Shares | | | 0.49 | % | | | 0.48 | % | | | 0.54 | % | | | | |
| Class B Shares | | | 1.24 | % | | | 1.23 | % | | | 1.30 | % | | | | |
| Class C Shares | | | 1.25 | % | | | 1.23 | % | | | 1.30 | % | | | | |
| Class R3 Shares | | | 0.89 | % | | | 0.88 | %(f) | | | | | | | | |
| Class R4 Shares | | | 0.60 | % | | | 0.59 | %(f) | | | | | | | | |
| Class R5 Shares | | | 0.29 | % | | | 0.27 | %(f) | | | | | | | | |
| Class Y Shares | | | 0.13 | % | | | 0.18 | % | | | 0.24 | % | | | | |
Select MidCap Value Fund | | | | | | | | | | | | | | | | |
| Class A Shares | | | 1.30 | % | | | 1.32 | % | | | 1.50 | % | | | 1.54 | %(b) |
| Class B Shares | | | 1.81 | % | | | 2.00 | % | | | 2.25 | % | | | 2.29 | %(b) |
| Class C Shares | | | 2.02 | % | | | 2.07 | % | | | 2.25 | % | | | 2.29 | %(b) |
| Class Y Shares | | | 0.87 | % | | | 0.83 | % | | | 1.11 | % | | | 1.14 | %(b) |
Select SmallCap Value Fund | | | | | | | | | | | | | | | | |
| Class A Shares | | | 1.39 | % | | | 1.40 | % | | | 1.60 | %(c) | | | | |
| Class B Shares | | | 2.27 | % | | | 2.35 | % | | | 2.35 | %(c) | | | | |
| Class C Shares | | | 2.26 | % | | | 2.32 | % | | | 2.35 | %(c) | | | | |
| Class Y Shares | | | 1.09 | % | | | 1.13 | % | | | 1.20 | %(c) | | | | |
Short Duration Fund | | | | | | | | | | | | | | | | |
| Class A Shares | | | 0.90 | % | | | 0.90 | % | | | 0.90 | % | | | 0.90 | % |
| Class B Shares | | | 1.65 | % | | | 1.65 | % | | | 1.65 | % | | | 1.65 | % |
| Class C Shares | | | 1.65 | % | | | 1.65 | % | | | 1.65 | % | | | 1.65 | % |
| Class Y Shares | | | 0.58 | % | | | 0.64 | % | | | 0.65 | % | | | 0.65 | % |
Small Company Fund | | | | | | | | | | | | | | | | |
| Class A Shares | | | 1.38 | % | | | 1.39 | % | | | 1.37 | % | | | 1.35 | % |
355
The Hartford Mutual Funds, Inc. and The Hartford Mutual Funds II, Inc.
Notes to Financial Statements — (continued)
April 30, 2008 (Unaudited)
(000’s Omitted)
| | | | | | | | | | | | | | | | | |
| | | Annualized
| | | | | | | | | | |
| | | Six-Month
| | | | | | | | | | |
| | | Period Ended
| | | Year Ended
| | | Year Ended
| | | Year Ended
| |
Fund | | April 30, 2008 | | | October 31, 2007 | | | October 31, 2006 | | | October 31, 2005 | |
| |
| Class B Shares | | | 2.04 | % | | | 2.11 | % | | | 2.12 | % | | | 2.10 | % |
| Class C Shares | | | 2.13 | % | | | 2.14 | % | | | 2.11 | % | | | 2.10 | % |
| Class I Shares | | | 1.06 | % | | | 1.12 | % | | | 1.10 | %(d) | | | | |
| Class R3 Shares | | | 1.65 | % | | | 1.65 | %(f) | | | | | | | | |
| Class R4 Shares | | | 1.28 | % | | | 1.36 | %(f) | | | | | | | | |
| Class R5 Shares | | | 0.99 | % | | | 1.10 | %(f) | | | | | | | | |
| Class Y Shares | | | 0.88 | % | | | 0.90 | % | | | 0.91 | % | | | 0.92 | % |
SmallCap Growth Fund | | | | | | | | | | | | | | | | |
| Class A Shares | | | 1.26 | % | | | 1.30 | % | | | 1.34 | % | | | 1.38 | % |
| Class B Shares | | | 1.85 | % | | | 2.00 | % | | | 2.00 | % | | | 2.13 | % |
| Class C Shares | | | 2.11 | % | | | 2.14 | % | | | 2.13 | % | | | 2.13 | % |
| Class I Shares | | | 1.15 | % | | | 1.15 | % | | | 1.15 | %(d) | | | | |
| Class L Shares | | | 1.14 | % | | | 1.15 | % | | | 1.13 | % | | | 1.20 | % |
| Class R3 Shares | | | 1.42 | % | | | 1.66 | %(f) | | | | | | | | |
| Class R4 Shares | | | 1.28 | % | | | 1.37 | %(f) | | | | | | | | |
| Class R5 Shares | | | 1.01 | % | | | 1.06 | %(f) | | | | | | | | |
| Class Y Shares | | | 0.90 | % | | | 0.93 | % | | | 0.90 | % | | | 0.97 | % |
Stock Fund | | | | | | | | | | | | | | | | |
| Class A Shares | | | 1.21 | % | | | 1.27 | % | | | 1.26 | % | | | 1.31 | % |
| Class B Shares | | | 2.12 | % | | | 2.10 | % | | | 2.10 | % | | | 2.21 | % |
| Class C Shares | | | 2.05 | % | | | 1.97 | % | | | 2.01 | % | | | 2.07 | % |
| Class R3 Shares | | | 1.49 | % | | | 1.51 | %(f) | | | | | | | | |
| Class R4 Shares | | | 1.19 | % | | | 1.19 | %(f) | | | | | | | | |
| Class R5 Shares | | | 0.88 | % | | | 0.92 | %(f) | | | | | | | | |
| Class Y Shares | | | 0.80 | % | | | 0.75 | % | | | 0.76 | % | | | 0.82 | % |
Strategic Income Fund | | | | | | | | | | | | | | | | |
| Class A Shares | | | 0.41 | % | | | 0.46 | %(h) | | | | | | | | |
| Class B Shares | | | 1.19 | % | | | 1.25 | %(h) | | | | | | | | |
| Class C Shares | | | 1.17 | % | | | 1.26 | %(h) | | | | | | | | |
| Class I Shares | | | 0.17 | % | | | 0.27 | %(h) | | | | | | | | |
| Class Y Shares | | | 0.10 | % | | | 0.24 | %(j) | | | | | | | | |
Target Retirement 2010 Fund | | | | | | | | | | | | | | | | |
| Class A Shares | | | 0.51 | % | | | 0.51 | % | | | 0.54 | % | | | | |
| Class B Shares | | | 1.26 | % | | | 1.26 | % | | | 1.29 | % | | | | |
| Class C Shares | | | 1.25 | % | | | 1.25 | % | | | 1.30 | % | | | | |
| Class R3 Shares | | | 0.90 | % | | | 0.91 | %(f) | | | | | | | | |
| Class R4 Shares | | | 0.61 | % | | | 0.62 | %(f) | | | | | | | | |
| Class R5 Shares | | | 0.32 | % | | | 0.30 | %(f) | | | | | | | | |
| Class Y Shares | | | 0.15 | % | | | 0.20 | % | | | 0.23 | % | | | | |
Target Retirement 2020 Fund | | | | | | | | | | | | | | | | |
| Class A Shares | | | 0.52 | % | | | 0.52 | % | | | 0.53 | % | | | | |
| Class B Shares | | | 1.25 | % | | | 1.26 | % | | | 1.29 | % | | | | |
| Class C Shares | | | 1.27 | % | | | 1.26 | % | | | 1.30 | % | | | | |
| Class R3 Shares | | | 0.91 | % | | | 0.91 | %(f) | | | | | | | | |
| Class R4 Shares | | | 0.62 | % | | | 0.63 | %(f) | | | | | | | | |
| Class R5 Shares | | | 0.32 | % | | | 0.31 | %(f) | | | | | | | | |
| Class Y Shares | | | 0.16 | % | | | 0.21 | % | | | 0.22 | % | | | | |
Target Retirement 2030 Fund | | | | | | | | | | | | | | | | |
| Class A Shares | | | 0.54 | % | | | 0.54 | % | | | 0.53 | % | | | | |
| Class B Shares | | | 1.06 | % | | | 1.15 | % | | | 1.24 | % | | | | |
| Class C Shares | | | 1.24 | % | | | 1.25 | % | | | 1.10 | % | | | | |
| Class R3 Shares | | | 0.94 | % | | | 0.93 | %(f) | | | | | | | | |
| Class R4 Shares | | | 0.65 | % | | | 0.66 | %(f) | | | | | | | | |
| Class R5 Shares | | | 0.35 | % | | | 0.33 | %(f) | | | | | | | | |
| Class Y Shares | | | 0.19 | % | | | 0.23 | % | | | 0.20 | % | | | | |
Tax-Free California Fund | | | | | | | | | | | | | | | | |
| Class A Shares | | | 0.85 | % | | | 0.85 | % | | | 0.89 | % | | | 0.89 | % |
| Class B Shares | | | 1.60 | % | | | 1.60 | % | | | 1.64 | % | | | 1.64 | % |
| Class C Shares | | | 1.60 | % | | | 1.60 | % | | | 1.64 | % | | | 1.64 | % |
356
| | | | | | | | | | | | | | | | | |
| | | Annualized
| | | | | | | | | | |
| | | Six-Month
| | | | | | | | | | |
| | | Period Ended
| | | Year Ended
| | | Year Ended
| | | Year Ended
| |
Fund | | April 30, 2008 | | | October 31, 2007 | | | October 31, 2006 | | | October 31, 2005 | |
| |
Tax-Free Minnesota Fund | | | | | | | | | | | | | | | | |
| Class A Shares | | | 0.85 | % | | | 0.85 | % | | | 0.84 | % | | | 0.84 | % |
| Class B Shares | | | 1.60 | % | | | 1.60 | % | | | 1.56 | % | | | 1.59 | % |
| Class C Shares | | | 1.60 | % | | | 1.59 | % | | | 1.56 | % | | | 1.59 | % |
| Class L Shares | | | 0.90 | % | | | 0.90 | % | | | 0.86 | % | | | 0.89 | % |
| Class Y Shares | | | 0.69 | % | | | 0.71 | % | | | 0.83 | % | | | 0.90 | % |
Tax-Free National Fund | | | | | | | | | | | | | | | | |
| Class A Shares | | | 0.85 | % | | | 0.85 | % | | | 1.00 | % | | | 1.01 | % |
| Class B Shares | | | 1.60 | % | | | 1.60 | % | | | 1.75 | % | | | 1.75 | % |
| Class C Shares | | | 1.60 | % | | | 1.60 | % | | | 1.75 | % | | | 1.75 | % |
| Class L Shares | | | 0.80 | % | | | 0.86 | % | | | 1.05 | % | | | 1.05 | % |
| Class I Shares | | | 0.60 | % | | | 0.61 | %(i) | | | | | | | | |
| Class Y Shares | | | 0.60 | % | | | 0.64 | % | | | 0.89 | % | | | 0.98 | % |
Tax-Free New York Fund | | | | | | | | | | | | | | | | |
| Class A Shares | | | 0.85 | % | | | 0.84 | % | | | 0.83 | % | | | 0.84 | % |
| Class B Shares | | | 1.60 | % | | | 1.59 | % | | | 1.58 | % | | | 1.59 | % |
| Class C Shares | | | 1.60 | % | | | 1.59 | % | | | 1.58 | % | | | 1.59 | % |
Total Return Bond Fund | | | | | | | | | | | | | | | | |
| Class A Shares | | | 1.00 | % | | | 1.00 | % | | | 1.19 | % | | | 1.20 | % |
| Class B Shares | | | 1.71 | % | | | 1.75 | % | | | 1.95 | % | | | 1.95 | % |
| Class C Shares | | | 1.74 | % | | | 1.75 | % | | | 1.86 | % | | | 1.87 | % |
| Class I Shares | | | 0.68 | % | | | 0.72 | % | | | 0.91 | %(d) | | | | |
| Class R3 Shares | | | 1.22 | % | | | 1.25 | %(f) | | | | | | | | |
| Class R4 Shares | | | 0.99 | % | | | 1.00 | %(f) | | | | | | | | |
| Class R5 Shares | | | 0.77 | % | | | 0.79 | %(f) | | | | | | | | |
| Class Y Shares | | | 0.59 | % | | | 0.61 | % | | | 0.70 | % | | | 0.74 | % |
U.S. Government Securities Fund | | | | | | | | | | | | | | | | |
| Class A Shares | | | 1.00 | % | | | 1.00 | % | | | 1.15 | % | | | 1.15 | % |
| Class B Shares | | | 1.65 | % | | | 1.71 | % | | | 1.91 | % | | | 1.90 | % |
| Class C Shares | | | 1.75 | % | | | 1.75 | % | | | 1.90 | % | | | 1.90 | % |
| Class L Shares | | | 0.88 | % | | | 0.91 | % | | | 1.08 | % | | | 1.08 | % |
| Class Y Shares | | | 0.65 | % | | | 0.68 | % | | | 0.83 | % | | | 0.86 | % |
Value Fund | | | | | | | | | | | | | | | | |
| Class A Shares | | | 1.30 | % | | | 1.32 | % | | | 1.37 | % | | | 1.39 | % |
| Class B Shares | | | 2.09 | % | | | 2.15 | % | | | 2.12 | % | | | 2.14 | % |
| Class C Shares | | | 2.07 | % | | | 2.09 | % | | | 2.14 | % | | | 2.14 | % |
| Class I Shares | | | 0.92 | % | | | 1.00 | %(i) | | | | | | | | |
| Class R3 Shares | | | 1.57 | % | | | 1.65 | %(f) | | | | | | | | |
| Class R4 Shares | | | 1.26 | % | | | 1.35 | %(f) | | | | | | | | |
| Class R5 Shares | | | 0.97 | % | | | 1.05 | %(f) | | | | | | | | |
| Class Y Shares | | | 0.87 | % | | | 0.88 | % | | | 0.91 | % | | | 0.92 | % |
Value Opportunities Fund | | | | | | | | | | | | | | | | |
| Class A Shares | | | 1.39 | % | | | 1.40 | % | | | 1.39 | % | | | 1.39 | % |
| Class B Shares | | | 2.00 | % | | | 2.13 | % | | | 2.11 | % | | | 2.14 | % |
| Class C Shares | | | 2.14 | % | | | 2.15 | % | | | 2.14 | % | | | 2.14 | % |
| Class I Shares | | | 1.09 | % | | | 1.16 | % | | | 1.15 | %(d) | | | | |
| Class L Shares | | | 1.19 | % | | | 1.24 | % | | | 1.22 | % | | | 1.30 | % |
| Class R3 Shares | | | 1.66 | % | | | 1.68 | %(f) | | | | | | | | |
| Class R4 Shares | | | 1.35 | % | | | 1.38 | %(f) | | | | | | | | |
| Class R5 Shares | | | 1.05 | % | | | 1.05 | %(f) | | | | | | | | |
| Class Y Shares | | | 0.96 | % | | | 0.94 | % | | | 0.99 | % | | | 1.06 | % |
357
The Hartford Mutual Funds, Inc. and The Hartford Mutual Funds II, Inc.
Notes to Financial Statements — (continued)
April 30, 2008 (Unaudited)
(000’s Omitted)
| | |
| (a) | | From January 1, 2005 (commencement of operations), through October 31, 2005. |
| | |
| (b) | | From April 29, 2005 (commencement of operations), through October 31, 2005. |
| (c) | | From July 31, 2006 (commencement of operations), through October 31, 2006. |
| (d) | | From August 31, 2006 (commencement of operations), through October 31, 2006. |
| (e) | | From November 30, 2006 (commencement of operations), through October 31, 2007. |
| (f) | | From December 22, 2006 (commencement of operations), through October 31, 2007. |
| (g) | | From May 1, 2007 (commencement of operations), through October 31, 2007. |
| (h) | | From May 15, 2007 (commencement of operations), through October 31, 2007. |
| (i) | | From May 31, 2007 (commencement of operations), through October 31, 2007. |
| (j) | | From August 31, 2007 (commencement of operations), through October 31, 2007. |
| (k) | | From February 29, 2008 (commencement of operations), through April 30, 2008. |
| | |
| | e) | Distribution and Service Plan for Class A, B, C and L Shares — HIFSCO is the principal underwriter and distributor of the Funds. HIFSCO is engaged in distribution activities, which include marketing and distribution of shares through broker-dealers, financing distribution costs and maintaining financial books and records. For the six-month period ended April 30, 2008, the following revenues were received by HIFSCO: |
| | | | | | | | | |
| | | Front-end Load
| | | Contingent Deferred
| |
| | | Sales Charge | | | Sales Charge | |
| |
| Advisers Fund | | $ | 420 | | | $ | 94 | |
| Balanced Allocation Fund | | | 2,323 | | | | 177 | |
| Balanced Income Fund | | | 184 | | | | 2 | |
| Capital Appreciation Fund | | | 22,387 | | | | 1,354 | |
| Capital Appreciation II Fund | | | 3,976 | | | | 243 | |
| Checks and Balances Fund | | | 11,809 | | | | 117 | |
| Conservative Allocation Fund | | | 661 | | | | 61 | |
| Disciplined Equity Fund | | | 79 | | | | 13 | |
| Dividend and Growth Fund | | | 7,287 | | | | 242 | |
| Equity Growth Allocation Fund | | | 840 | | | | 64 | |
| Equity Income Fund | | | 2,016 | | | | 35 | |
| Floating Rate Fund | | | 507 | | | | 1,679 | |
| Fundamental Growth Fund | | | 27 | | | | 3 | |
| Global Communications Fund | | | 98 | | | | 9 | |
| Global Equity Fund | | | 1 | | | | — | |
| Global Financial Services Fund | | | 181 | | | | 3 | |
| Global Growth Fund | | | 426 | | | | 25 | |
| Global Health Fund | | | 594 | | | | 73 | |
| Global Technology Fund | | | 62 | | | | 7 | |
| Growth Allocation Fund | | | 1,761 | | | | 183 | |
| Growth Fund | | | 433 | | | | 41 | |
| Growth Opportunities Fund | | | 3,428 | | | | 125 | |
| High Yield Fund | | | 95 | | | | 23 | |
| High Yield Municipal Bond Fund | | | 890 | | | | 12 | |
| Income Allocation Fund | | | 127 | | | | 19 | |
| Income Fund | | | 371 | | | | 10 | |
| Inflation Plus Fund | | | 672 | | | | 99 | |
| International Growth Fund | | | 1,455 | | | | 52 | |
| International Opportunities Fund | | | 748 | | | | 21 | |
| International Small Company Fund | | | 213 | | | | 27 | |
| LargeCap Growth Fund | | | 11 | | | | 1 | |
| MidCap Fund | | | 109 | | | | 105 | |
| MidCap Growth Fund | | | 75 | | | | 6 | |
| MidCap Value Fund | | | 31 | | | | 24 | |
| Money Market Fund | | | — | | | | 212 | |
| Retirement Income Fund | | | 14 | | | | — | |
| Select MidCap Value Fund | | | 68 | | | | 8 | |
| Select SmallCap Value Fund | | | 22 | | | | 1 | |
| Short Duration Fund | | | 101 | | | | 19 | |
| Small Company Fund | | | 398 | | | | 16 | |
| SmallCap Growth Fund | | | 119 | | | | 21 | |
| Stock Fund | | | 240 | | | | 62 | |
| Strategic Income Fund | | | 596 | | | | 36 | |
| Target Retirement 2010 Fund | | | 10 | | | | — | |
| Target Retirement 2020 Fund | | | 30 | | | | 2 | |
| Target Retirement 2030 Fund | | | 36 | | | | 1 | |
358
| | | | | | | | | |
| | | Front-end Load
| | | Contingent Deferred
| |
| | | Sales Charge | | | Sales Charge | |
| |
| Tax-Free California Fund | | $ | 74 | | | $ | 9 | |
| Tax-Free Minnesota Fund | | | 16 | | | | — | |
| Tax-Free National Fund | | | 325 | | | | 12 | |
| Tax-Free New York Fund | | | 9 | | | | 1 | |
| Total Return Bond Fund | | | 2,708 | | | | 139 | |
| U.S. Government Securities Fund | | | 175 | | | | 22 | |
| Value Fund | | | 114 | | | | 5 | |
| Value Opportunities Fund | | | 258 | | | | 27 | |
The Funds have adopted Distribution and Service Plans in accordance with Rule 12b-1 of the Investment Company Act of 1940, as amended, to compensate the Distributor (HIFSCO) for activities intended to result in the sale and distribution of Classes A, B, C, L, R3 and R4 shares and for providing services for shareholders. The Rule 12b-1 plan applicable to Class A shares of the Funds provides for payment of a Rule 12b-1 fee of up to 0.35% of average daily net assets; however, the Board of Directors has currently authorized 12b-1 payments of only up to 0.25%. Some or all of the fee may be used for shareholder servicing expenses with the remainder used for distribution expenses. Some or the entire Rule 12b-1 fee for Class B shares may be remitted to broker-dealers for distribution and/or shareholder account services. Under the Class B Plan, the Fund pays the Distributor 1.00% of the average daily net assets of Class B shares that are outstanding for 8 years or less, 0.25% of which is a fee for service provided to existing shareholders with the remainder used for distribution expenses. After eight years, Class B shares convert to Class A shares. Upon conversion to Class A shares, the Class A plan described above will apply to those shares. Under the Class C Plan, the Fund pays the Distributor 1.00% of the average daily net assets of Class C shares outstanding, 0.25% of which is intended as a fee for services provided to existing shareholders with the remainder used for distribution expenses. For Class C shares, some or the entire fee may be remitted to broker-dealers for distribution and/or shareholder account services. Class L has a distribution fee of 0.25% for each Fund. Class R3 shares have a distribution fee of 0.50% and Class R4 shares have a distribution fee of 0.25%. For Classes R3 and R4 shares, some or the entire fee may be remitted to broker dealers for distribution and/or shareholder account services. The Funds’ 12b-1 fees are accrued daily and paid monthly.
For the six-month period ended April 30, 2008, total sales commissions paid to affiliated brokers/dealers of The Hartford for distributing the Funds’ shares were $2,358. These commissions are in turn paid to sales representatives of the broker/dealers.
| | |
| | f) | Other Related Party Transactions — Certain officers of the Funds are directors and/or officers of HIFSCO, Hartford Investment Management and/or The Hartford or its subsidiaries. For the six-month period ended April 30, 2008, a portion of the Funds’ chief compliance officer’s salary was paid by the Funds in the amount of $21. Hartford Administrative Services Company (“HASCO”), a wholly-owned subsidiary of The Hartford, provides transfer agent services to the Funds. HASCO was compensated $37,597 for providing such services. The Funds accrue these fees daily and pay monthly. |
| |
| | g) | Payments from Affiliate: |
On November 8, 2006, the SEC issued an Order setting forth the terms of a settlement reached with three subsidiaries of The Hartford that resolves the SEC’s Division of Enforcement’s investigation concerning aspects of The Hartford’s variable annuity and mutual fund operations related to directed brokerage and revenue sharing. Under the terms of the settlement, The Hartford paid a total of $15.4 million to The Hartford Mutual Funds in the amounts indicated below. Those amounts were recorded on the books of the Funds on November 8, 2006 and paid on November 22, 2006. The Hartford settled this matter without admitting or denying the findings of the SEC.
| | | | | | | | | | | | | |
| | | Capital Gain
| | | | | | | |
Fund Name | | Reimbursement | | | Income Reimbursement | | | Total Reimbursement | |
| |
| Advisers Fund | | $ | 920 | | | $ | 345 | | | $ | 1,265 | |
| Capital Appreciation Fund | | | 3,768 | | | | 1,413 | | | | 5,181 | |
| Disciplined Equity Fund | | | 212 | | | | 80 | | | | 292 | |
| Dividend and Growth Fund | | | 740 | | | | 278 | | | | 1,018 | |
| Fundamental Growth Fund | | | 140 | | | | 53 | | | | 193 | |
| Global Communications Fund | | | 4 | | | | 2 | | | | 6 | |
| Global Financial Services Fund | | | 4 | | | | 2 | | | | 6 | |
| Global Growth Fund | | | 1,392 | | | | 552 | | | | 1,914 | |
| Global Health Fund | | | 76 | | | | 29 | | | | 105 | |
| Global Technology Fund | | | 16 | | | | 6 | | | | 22 | |
| Growth Fund | | | 112 | | | | 42 | | | | 154 | |
| Growth Opportunities Fund | | | 300 | | | | 113 | | | | 413 | |
| International Capital Appreciation Fund | | | 4 | | | | 2 | | | | 6 | |
| International Opportunities Fund | | | 20 | | | | 8 | | | | 28 | |
| MidCap Fund | | | 1,788 | | | | 671 | | | | 2,459 | |
| MidCap Value Fund | | | 40 | | | | 15 | | | | 55 | |
| Small Company Fund | | | 488 | | | | 183 | | | | 671 | |
| SmallCap Growth Fund | | | 28 | | | | 11 | | | | 39 | |
| Stock Fund | | | 1,140 | | | | 428 | | | | 1,568 | |
359
The Hartford Mutual Funds, Inc. and The Hartford Mutual Funds II, Inc.
Notes to Financial Statements — (continued)
April 30, 2008 (Unaudited)
(000’s Omitted)
| | | | | | | | | | | | | |
| | | Capital Gain
| | | | | | | |
Fund Name | | Reimbursement | | | Income Reimbursement | | | Total Reimbursement | |
| |
| Value Fund | | $ | 8 | | | $ | 3 | | | $ | 11 | |
| Value Opportunities Fund | | | 12 | | | | 4 | | | | 16 | |
On April 20, 2007, MidCap Growth Fund was reimbursed $24 in trading reimbursements relating to the change in portfolio managers of the Fund.
On May 2, 2007 and June 8, 2007, Small Company Fund was reimbursed $909 in trading reimbursements and $228 for incorrect IPO allocations.
The table below shows the impact on total return from the payments from affiliates:
| | | | | | | | | | | | | | | | | | | | | |
| | | | | | | | | | | | Impact from
| | | | |
| | | | | | | | | | | | Payment from
| | | | |
| | | | | | | | | | | | Affiliate for
| | | | |
| | | Impact from
| | | Impact from Payment
| | | Total Return
| | | Transfer Agent
| | | | |
| | | Payment from
| | | from Affiliate for
| | | Excluding
| | | Allocation
| | | Total Return
| |
| | | Affiliate for SEC
| | | Trading
| | | Payments from
| | | Methodology
| | | Excluding Payments
| |
| | | Settlement
| | | Reimbursements
| | | Affiliate
| | | Reimbursements
| | | from Affiliate
| |
| | | for the Year Ended
| | | for the Year Ended
| | | for the Year Ended
| | | for the Year Ended
| | | for the Year Ended
| |
Fund | | October 31, 2007 | | | October 31, 2007 | | | October 31, 2007 | | | October 31, 2004 | | | October 31, 2004 | |
| |
| Advisers Fund Class A | | | 0.07 | % | | | — | % | | | 13.15 | % | | | 0.19 | % | | | 3.74 | % |
| Advisers Fund Class B | | | 0.08 | | | | — | | | | 12.24 | | | | 0.26 | | | | 2.95 | |
| Advisers Fund Class C | | | 0.07 | | | | — | | | | 12.36 | | | | 0.21 | | | | 3.06 | |
| Advisers Fund Class Y | | | 0.07 | | | | — | | | | 13.65 | | | | — | | | | — | |
| Capital Appreciation Class A | | | 0.03 | | | | — | | | | 26.11 | | | | — | | | | — | |
| Capital Appreciation Class B | | | 0.04 | | | | — | | | | 25.10 | | | | — | | | | — | |
| Capital Appreciation Class C | | | 0.04 | | | | — | | | | 25.23 | | | | — | | | | — | |
| Capital Appreciation Class I | | | 0.03 | | | | — | | | | 26.45 | | | | — | | | | — | |
| Capital Appreciation Class Y | | | 0.03 | | | | — | | | | 26.62 | | | | — | | | | — | |
| Disciplined Equity Fund Class A | | | 0.08 | | | | — | | | | 13.78 | | | | — | | | | — | |
| Disciplined Equity Fund Class B | | | 0.08 | | | | — | | | | 13.05 | | | | — | | | | — | |
| Disciplined Equity Fund Class C | | | 0.08 | | | | — | | | | 12.98 | | | | 0.01 | | | | 5.24 | |
| Disciplined Equity Fund Class Y | | | 0.07 | | | | — | | | | 14.37 | | | | — | | | | — | |
| Dividend and Growth Fund Class A | | | 0.03 | | | | — | | | | 16.17 | | | | 0.06 | | | | 12.47 | |
| Dividend and Growth Fund Class B | | | 0.03 | | | | — | | | | 15.19 | | | | — | | | | — | |
| Dividend and Growth Fund Class C | | | 0.03 | | | | — | | | | 15.39 | | | | 0.04 | | | | 11.72 | |
| Dividend and Growth Fund Class I | | | 0.03 | | | | — | | | | 16.64 | | | | — | | | | — | |
| Dividend and Growth Fund Class Y | | | 0.03 | | | | — | | | | 16.65 | | | | — | | | | — | |
| Fundamental Growth Fund Class A | | | 0.28 | | | | — | | | | 26.24 | | | | 0.03 | | | | 2.21 | |
| Fundamental Growth Fund Class B | | | 0.29 | | | | — | | | | 25.34 | | | | — | | | | 1.48 | |
| Fundamental Growth Fund Class C | | | 0.29 | | | | — | | | | 25.32 | | | | 0.06 | | | | 1.53 | |
| Fundamental Growth Fund Class Y | | | 0.28 | | | | — | | | | 26.83 | | | | — | | | | — | |
| Global Communications Fund Class A | | | 0.02 | | | | — | | | | 39.00 | | | | — | | | | — | |
| Global Communications Fund Class B | | | 0.02 | | | | — | | | | 37.99 | | | | — | | | | — | |
| Global Communications Fund Class C | | | 0.02 | | | | — | | | | 37.94 | | | | — | | | | — | |
| Global Communications Fund Class Y | | | 0.02 | | | | — | | | | 39.55 | | | | — | | | | — | |
| Global Financial Services Fund Class A | | | 0.02 | | | | — | | | | 8.40 | | | | — | | | | — | |
| Global Financial Services Fund Class B | | | 0.02 | | | | — | | | | 7.73 | | | | — | | | | — | |
| Global Financial Services Fund Class C | | | 0.02 | | | | — | | | | 7.55 | | | | — | | | | — | |
| Global Financial Services Fund Class Y | | | 0.02 | | | | — | | | | 8.89 | | | | — | | | | — | |
| Global Growth Fund Class A | | | 0.26 | | | | — | | | | 35.50 | | | | — | | | | — | |
| Global Growth Fund Class B | | | 0.27 | | | | — | | | | 34.45 | | | | — | | | | — | |
| Global Growth Fund Class C | | | 0.27 | | | | — | | | | 34.58 | | | | — | | | | — | |
| Global Growth Fund Class Y | | | 0.25 | | | | — | | | | 36.28 | | | | — | | | | — | |
| Global Health Fund Class A | | | 0.01 | | | | — | | | | 9.94 | | | | — | | | | — | |
| Global Health Fund Class B | | | 0.01 | | | | — | | | | 8.90 | | | | — | | | | — | |
| Global Health Fund Class C | | | 0.01 | | | | — | | | | 9.09 | | | | — | | | | — | |
| Global Health Fund Class I | | | 0.01 | | | | — | | | | 10.46 | | | | — | | | | — | |
| Global Health Fund Class Y | | | 0.01 | | | | — | | | | 10.44 | | | | — | | | | — | |
| Global Technology Fund Class A | | | 0.04 | | | | — | | | | 27.46 | | | | — | | | | — | |
| Global Technology Fund Class B | | | 0.04 | | | | — | | | | 26.57 | | | | — | | | | — | |
| Global Technology Fund Class C | | | 0.04 | | | | — | | | | 26.25 | | | | — | | | | — | |
| Global Technology Fund Class Y | | | 0.04 | | | | — | | | | 27.96 | | | | — | | | | — | |
| Growth Fund Class A | | | 0.01 | | | | — | | | | 23.90 | | | | — | | | | — | |
| Growth Fund Class B | | | 0.01 | | | | — | | | | 23.00 | | | | — | | | | — | |
| Growth Fund Class C | | | 0.01 | | | | — | | | | 23.08 | | | | — | | | | — | |
360
| | | | | | | | | | | | | | | | | | | | | |
| | | | | | | | | | | | Impact from
| | | | |
| | | | | | | | | | | | Payment from
| | | | |
| | | | | | | | | | | | Affiliate for
| | | | |
| | | Impact from
| | | Impact from Payment
| | | Total Return
| | | Transfer Agent
| | | | |
| | | Payment from
| | | from Affiliate for
| | | Excluding
| | | Allocation
| | | Total Return
| |
| | | Affiliate for SEC
| | | Trading
| | | Payments from
| | | Methodology
| | | Excluding Payments
| |
| | | Settlement
| | | Reimbursements
| | | Affiliate
| | | Reimbursements
| | | from Affiliate
| |
| | | for the Year Ended
| | | for the Year Ended
| | | for the Year Ended
| | | for the Year Ended
| | | for the Year Ended
| |
Fund | | October 31, 2007 | | | October 31, 2007 | | | October 31, 2007 | | | October 31, 2004 | | | October 31, 2004 | |
| |
| Growth Fund Class I | | | 0.01 | % | | | — | % | | | 24.35 | % | | | — | % | | | — | % |
| Growth Fund Class L | | | 0.01 | | | | — | | | | 24.20 | | | | — | | | | — | |
| Growth Fund Class Y | | | 0.01 | | | | — | | | | 24.50 | | | | — | | | | — | |
| Growth Opportunities Fund Class A | | | 0.03 | | | | — | | | | 40.34 | | | | — | | | | — | |
| Growth Opportunities Fund Class B | | | 0.04 | | | | — | | | | 39.24 | | | | — | | | | — | |
| Growth Opportunities Fund Class C | | | 0.04 | | | | — | | | | 39.35 | | | | — | | | | — | |
| Growth Opportunities Fund Class I | | | 0.03 | | | | — | | | | 40.84 | | | | — | | | | — | |
| Growth Opportunities Fund Class L | | | 0.03 | | | | ��� | | | | 40.72 | | | | — | | | | — | |
| Growth Opportunities Fund Class Y | | | 0.03 | | | | — | | | | 41.02 | | | | — | | | | — | |
| High Yield Class A | | | — | | | | — | | | | — | | | | 0.01 | | | | 9.25 | |
| High Yield Class B | | | — | | | | — | | | | — | | | | — | | | | 8.45 | |
| High Yield Class C | | | — | | | | — | | | | — | | | | 0.10 | | | | 8.44 | |
| International Growth Fund Class A | | | — | | | | — | | | | 39.31 | | | | — | | | | — | |
| International Growth Fund Class B | | | — | | | | — | | | | 38.11 | | | | — | | | | — | |
| International Growth Fund Class C | | | — | | | | — | | | | 38.27 | | | | — | | | | — | |
| International Growth Fund Class I | | | — | | | | — | | | | 39.73 | | | | — | | | | — | |
| International Growth Fund Class Y | | | — | | | | — | | | | 40.01 | | | | — | | | | — | |
| International Opportunities Fund Class A | | | 0.01 | | | | — | | | | 39.14 | | | | — | | | | — | |
| International Opportunities Fund Class B | | | 0.01 | | | | — | | | | 38.16 | | | | — | | | | — | |
| International Opportunities Fund Class C | | | 0.01 | | | | — | | | | 38.16 | | | | — | | | | — | |
| International Opportunities Fund Class Y | | | 0.01 | | | | — | | | | 39.90 | | | | — | | | | — | |
| MidCap Fund Class A | | | 0.08 | | | | — | | | | 25.86 | | | | — | | | | — | |
| MidCap Fund Class B | | | 0.09 | | | | — | | | | 24.87 | | | | — | | | | — | |
| MidCap Fund Class C | | | 0.09 | | | | — | | | | 24.97 | | | | — | | | | — | |
| MidCap Fund Class Y | | | 0.08 | | | | — | | | | 26.40 | | | | — | | | | — | |
| MidCap Value Fund Class A | | | 0.01 | | | | — | | | | 16.71 | | | | — | | | | — | |
| MidCap Value Fund Class B | | | 0.01 | | | | — | | | | 15.85 | | | | — | | | | — | |
| MidCap Value Fund Class C | | | 0.01 | | | | — | | | | 15.93 | | | | — | | | | — | |
| MidCap Value Fund Class Y | | | 0.01 | | | | — | | | | 17.37 | | | | — | | | | — | |
| Small Company Fund Class A | | | 0.16 | | | | 0.22 | | | | 23.41 | | | | — | | | | — | |
| Small Company Fund Class B | | | 0.18 | | | | 0.24 | | | | 22.46 | | | | — | | | | — | |
| Small Company Fund Class C | | | 0.18 | | | | 0.24 | | | | 22.37 | | | | — | | | | — | |
| Small Company Fund Class I | | | 0.16 | | | | 0.22 | | | | 23.81 | | | | — | | | | — | |
| Small Company Fund Class R3 | | | — | | | | 0.20 | | | | 17.44 | | | | — | | | | — | |
| Small Company Fund Class R4 | | | — | | | | 0.20 | | | | 17.80 | | | | — | | | | — | |
| Small Company Fund Class R5 | | | — | | | | 0.20 | | | | 18.07 | | | | — | | | | — | |
| Small Company Fund Class Y | | | 0.16 | | | | 0.20 | | | | 23.99 | | | | — | | | | — | |
| SmallCap Growth Fund Class A | | | 0.01 | | | | — | | | | 7.17 | | | | — | | | | — | |
| SmallCap Growth Fund Class B | | | 0.01 | | | | — | | | | 6.43 | | | | — | | | | — | |
| SmallCap Growth Fund Class C | | | 0.01 | | | | — | | | | 6.33 | | | | — | | | | — | |
| SmallCap Growth Fund Class I | | | 0.01 | | | | — | | | | 7.36 | | | | — | | | | — | |
| SmallCap Growth Fund Class L | | | 0.01 | | | | — | | | | 7.40 | | | | — | | | | — | |
| SmallCap Growth Fund Class Y | | | 0.01 | | | | — | | | | 7.60 | | | | — | | | | — | |
| Stock Fund Class A | | | 0.13 | | | | — | | | | 16.67 | | | | — | | | | — | |
| Stock Fund Class B | | | 0.14 | | | | — | | | | 15.72 | | | | — | | | | — | |
| Stock Fund Class C | | | 0.14 | | | | — | | | | 15.86 | | | | — | | | | — | |
| Stock Fund Class Y | | | 0.12 | | | | — | | | | 17.31 | | | | — | | | | — | |
| Total Return Bond Fund Class A | | | — | | | | — | | | | — | | | | 0.02 | | | | 5.08 | |
| Total Return Bond Fund Class B | | | — | | | | — | | | | — | | | | 0.02 | | | | 4.35 | |
| Total Return Bond Fund Class C | | | — | | | | — | | | | — | | | | 0.19 | | | | 4.57 | |
| Value Fund Class A | | | — | | | | — | | | | 16.60 | | | | — | | | | — | |
| Value Fund Class B | | | — | | | | — | | | | 15.62 | | | | — | | | | — | |
| Value Fund Class C | | | — | | | | — | | | | 15.62 | | | | — | | | | — | |
| Value Fund Class Y | | | — | | | | — | | | | 17.06 | | | | — | | | | — | |
| Value Opportunities Fund Class A | | | 0.01 | | | | — | | | | 9.72 | | | | — | | | | — | |
| Value Opportunities Fund Class B | | | 0.01 | | | | — | | | | 8.89 | | | | — | | | | — | |
361
The Hartford Mutual Funds, Inc. and The Hartford Mutual Funds II, Inc.
Notes to Financial Statements — (continued)
April 30, 2008 (Unaudited)
(000’s Omitted)
| | | | | | | | | | | | | | | | | | | | | |
| | | | | | | | | | | | Impact from
| | | | |
| | | | | | | | | | | | Payment from
| | | | |
| | | | | | | | | | | | Affiliate for
| | | | |
| | | Impact from
| | | Impact from Payment
| | | Total Return
| | | Transfer Agent
| | | | |
| | | Payment from
| | | from Affiliate for
| | | Excluding
| | | Allocation
| | | Total Return
| |
| | | Affiliate for SEC
| | | Trading
| | | Payments from
| | | Methodology
| | | Excluding Payments
| |
| | | Settlement
| | | Reimbursements
| | | Affiliate
| | | Reimbursements
| | | from Affiliate
| |
| | | for the Year Ended
| | | for the Year Ended
| | | for the Year Ended
| | | for the Year Ended
| | | for the Year Ended
| |
Fund | | October 31, 2007 | | | October 31, 2007 | | | October 31, 2007 | | | October 31, 2004 | | | October 31, 2004 | |
| |
| Value Opportunities Fund Class C | | | 0.01 | % | | | — | % | | | 8.90 | % | | | — | % | | | — | % |
| Value Opportunities Fund Class I | | | 0.01 | | | | — | | | | 10.07 | | | | — | | | | — | |
| Value Opportunities Fund Class L | | | 0.01 | | | | — | | | | 9.91 | | | | — | | | | — | |
| Value Opportunities Fund Class Y | | | 0.01 | | | | — | | | | 10.29 | | | | — | | | | — | |
As of April 30, 2008, affiliates of The Hartford had ownership of shares in the Funds as follows:
| | | | | | | | | | | | | | | | | | | | | | | | | | | | | | | | | |
Fund | | Class A | | | Class B | | | Class C | | | Class I | | | Class R3 | | | Class R4 | | | Class R5 | | | Class Y | |
| |
| Advisers Fund | | | — | | | | — | | | | — | | | | N/A | | | | 1 | | | | 1 | | | | 1 | | | | — | |
| Balanced Income Fund | | | 997 | | | | 26 | | | | 26 | | | | N/A | | | | N/A | | | | N/A | | | | N/A | | | | 11 | |
| Checks and Balances Fund | | | — | | | | — | | | | — | | | | 10 | | | | N/A | | | | N/A | | | | N/A | | | | N/A | |
| Conservative Allocation Fund | | | — | | | | — | | | | — | | | | — | | | | 1 | | | | — | | | | — | | | | N/A | |
| Disciplined Equity Fund | | | — | | | | — | | | | — | | | | N/A | | | | 1 | | | | 1 | | | | 1 | | | | — | |
| Equity Income Fund | | | — | | | | — | | | | — | | | | — | | | | 1 | | | | 1 | | | | 1 | | | | — | |
| Global Equity Fund | | | 1790 | | | | 30 | | | | 30 | | | | 30 | | | | 30 | | | | 30 | | | | 30 | | | | 30 | |
| Global Financial Services Fund | | | 712 | | | | — | | | | — | | | | N/A | | | | N/A | | | | N/A | | | | N/A | | | | — | |
| Global Growth Fund | | | — | | | | — | | | | — | | | | N/A | | | | 1 | | | | 1 | | | | 1 | | | | — | |
| Growth Allocation Fund | | | — | | | | — | | | | — | | | | — | | | | 1 | | | | — | | | | — | | | | N/A | |
| Growth Fund | | | — | | | | — | | | | — | | | | — | | | | 1 | | | | — | | | | — | | | | — | |
| High Yield Fund | | | — | | | | — | | | | — | | | | 3 | | | | 1 | | | | 1 | | | | 1 | | | | — | |
| Income Allocation Fund | | | — | | | | — | | | | — | | | | — | | | | 1 | | | | — | | | | 1 | | | | N/A | |
| Inflation Plus Fund | | | — | | | | — | | | | — | | | | — | | | | 1 | | | | 1 | | | | 1 | | | | — | |
| International Growth Fund | | | — | | | | — | | | | — | | | | — | | | | — | | | | 1 | | | | 1 | | | | — | |
| International Opportunities Fund | | | — | | | | — | | | | — | | | | N/A | | | | 1 | | | | 1 | | | | 1 | | | | — | |
| LargeCap Growth Fund | | | 959 | | | | 25 | | | | 25 | | | | N/A | | | | N/A | | | | N/A | | | | N/A | | | | 10 | |
| MidCap Growth Fund | | | 1131 | | | | 30 | | | | 30 | | | | N/A | | | | N/A | | | | N/A | | | | N/A | | | | 22 | |
| Money Market Fund | | | — | | | | — | | | | — | | | | N/A | | | | 11 | | | | — | | | | — | | | | — | |
| Retirement Income Fund | | | 29 | | | | 13 | | | | 13 | | | | N/A | | | | 1 | | | | 1 | | | | 1 | | | | 13 | |
| Select SmallCap Value Fund | | | 1555 | | | | 27 | | | | 27 | | | | N/A | | | | N/A | | | | N/A | | | | N/A | | | | 11 | |
| SmallCap Growth Fund | | | — | | | | — | | | | — | | | | — | | | | * | | | | — | | | | * | | | | — | |
| Stock Fund | | | — | | | | — | | | | — | | | | N/A | | | | * | | | | * | | | | * | | | | — | |
| Strategic Income Fund | | | 1706 | | | | — | | | | — | | | | — | | | | N/A | | | | N/A | | | | N/A | | | | — | |
| Target Retirement 2010 Fund | | | 27 | | | | 15 | | | | 15 | | | | N/A | | | | 1 | | | | 1 | | | | 1 | | | | 15 | |
| Target Retirement 2020 Fund | | | 9 | | | | 1 | | | | 1 | | | | N/A | | | | 1 | | | | 1 | | | | 1 | | | | 1 | |
| Target Retirement 2030 Fund | | | 8 | | | | 4 | | | | 4 | | | | N/A | | | | 1 | | | | 1 | | | | 1 | | | | 4 | |
| Tax-Free California Fund | | | 771 | | | | — | | | | — | | | | N/A | | | | N/A | | | | N/A | | | | N/A | | | | N/A | |
| Tax-Free New York Fund | | | 998 | | | | 120 | | | | 120 | | | | N/A | | | | N/A | | | | N/A | | | | N/A | | | | N/A | |
| Total Return Bond Fund | | | — | | | | — | | | | — | | | | — | | | | 1 | | | | — | | | | — | | | | — | |
| Value Fund | | | — | | | | — | | | | — | | | | 2 | | | | 1 | | | | 1 | | | | 1 | | | | — | |
| Value Opportunities Fund | | | — | | | | — | | | | — | | | | — | | | | — | | | | — | | | | 1 | | | | — | |
| | |
| * | | Due to the presentation of the financial statements in thousands, the number of shares held round to zero. |
| |
| 7. | Investment Transactions: |
For the six-month period ended April 30, 2008, the cost of purchases and sales of securities for Money Market Fund were $3,313,315 and $3,112,528, respectively. For the six-month period ended April 30, 2008, aggregate purchases and sales of investment securities (excluding short-term investments) were as follows:
| | | | | | | | | | | | | | | | | |
| | | Cost of Purchases
| | | Sales Proceeds
| | | Cost of
| | | | |
| | | Excluding
| | | Excluding
| | | Purchases for
| | | Sales Proceeds for
| |
| | | U.S. Government
| | | U.S. Government
| | | U.S. Government
| | | U.S. Government
| |
| | | Obligations | | | Obligations | | | Obligations | | | Obligations | |
| |
| Advisers Fund | | $ | 510,853 | | | $ | 616,996 | | | $ | 6,657 | | | $ | 26,988 | |
| Balanced Allocation Fund | | | 124,563 | | | | 56,616 | | | | — | | | | — | |
362
| | | | | | | | | | | | | | | | | |
| | | Cost of Purchases
| | | Sales Proceeds
| | | Cost of
| | | | |
| | | Excluding
| | | Excluding
| | | Purchases for
| | | Sales Proceeds for
| |
| | | U.S. Government
| | | U.S. Government
| | | U.S. Government
| | | U.S. Government
| |
| | | Obligations | | | Obligations | | | Obligations | | | Obligations | |
| |
| Balanced Income Fund | | $ | 22,147 | | | $ | 10,000 | | | $ | 294 | | | $ | 229 | |
| Capital Appreciation Fund | | | 9,790,222 | | | | 8,139,025 | | | | — | | | | — | |
| Capital Appreciation II Fund | | | 1,234,268 | | | | 959,245 | | | | — | | | | — | |
| Checks and Balances Fund | | | 502,785 | | | | 11,822 | | | | — | | | | — | |
| Conservative Allocation Fund | | | 47,516 | | | | 17,024 | | | | — | | | | — | |
| Disciplined Equity Fund | | | 80,722 | | | | 93,574 | | | | — | | | | — | |
| Dividend and Growth Fund | | | 1,019,694 | | | | 797,361 | | | | — | | | | — | |
| Equity Growth Allocation Fund | | | 49,187 | | | | 26,845 | | | | — | | | | — | |
| Equity Income Fund | | | 232,979 | | | | 210,315 | | | | — | | | | — | |
| Floating Rate Fund | | | 216,759 | | | | 1,531,964 | | | | — | | | | — | |
| Fundamental Growth Fund | | | 32,957 | | | | 35,360 | | | | — | | | | — | |
| Global Communications Fund | | | 22,997 | | | | 20,372 | | | | — | | | | — | |
| Global Equity Fund | | | 21,960 | | | | 2,512 | | | | — | | | | — | |
| Global Financial Services Fund | | | 26,055 | | | | 17,942 | | | | — | | | | — | |
| Global Growth Fund | | | 256,776 | | | | 261,350 | | | | — | | | | — | |
| Global Health Fund | | | 202,969 | | | | 214,917 | | | | — | | | | — | |
| Global Technology Fund | | | 46,557 | | | | 52,823 | | | | — | | | | — | |
| Growth Allocation Fund | | | 94,171 | | | | 70,556 | | | | — | | | | — | |
| Growth Fund | | | 625,519 | | | | 647,749 | | | | — | | | | — | |
| Growth Opportunities Fund | | | 2,619,639 | | | | 1,654,784 | | | | — | | | | — | |
| High Yield Fund | | | 117,396 | | | | 110,301 | | | | — | | | | — | |
| High Yield Municipal Bond Fund | | | 173,638 | | | | 28,302 | | | | — | | | | — | |
| Income Allocation Fund | | | 16,424 | | | | 3,812 | | | | — | | | | — | |
| Income Fund | | | 285,626 | | | | 249,309 | | | | — | | | | — | |
| Inflation Plus Fund | | | 37,703 | | | | 30,684 | | | | 2,082,914 | | | | 1,888,673 | |
| International Growth Fund | | | 891,015 | | | | 844,094 | | | | — | | | | — | |
| International Opportunities Fund | | | 317,471 | | | | 261,894 | | | | — | | | | — | |
| International Small Company Fund | | | 146,573 | | | | 156,385 | | | | — | | | | — | |
| LargeCap Growth Fund | | | 10,031 | | | | 9,364 | | | | — | | | | — | |
| MidCap Fund | | | 1,134,007 | | | | 1,246,981 | | | | — | | | | — | |
| MidCap Growth Fund | | | 42,942 | | | | 26,808 | | | | — | | | | — | |
| MidCap Value Fund | | | 97,223 | | | | 130,437 | | | | — | | | | — | |
| Retirement Income Fund | | | 4,322 | | | | 479 | | | | — | | | | — | |
| Select MidCap Value Fund | | | 67,331 | | | | 77,463 | | | | — | | | | — | |
| Select SmallCap Value Fund | | | 28,268 | | | | 14,083 | | | | — | | | | — | |
| Short Duration Fund | | | 55,302 | | | | 32,882 | | | | 29,219 | | | | 45,849 | |
| Small Company Fund | | | 558,005 | | | | 421,682 | | | | — | | | | — | |
| SmallCap Growth Fund | | | 141,622 | | | | 166,609 | | | | — | | | | — | |
| Stock Fund | | | 376,024 | | | | 452,658 | | | | — | | | | — | |
| Strategic Income Fund | | | 220,630 | | | | 72,027 | | | | 24,306 | | | | 23,825 | |
| Target Retirement 2010 Fund | | | 12,242 | | | | 5,567 | | | | — | | | | — | |
| Target Retirement 2020 Fund | | | 24,470 | | | | 10,962 | | | | — | | | | — | |
| Target Retirement 2030 Fund | | | 15,517 | | | | 5,239 | | | | — | | | | — | |
| Tax-Free California Fund | | | 11,219 | | | | 15,789 | | | | — | | | | — | |
| Tax-Free Minnesota Fund | | | 6,847 | | | | 5,759 | | | | — | | | | — | |
| Tax-Free National Fund | | | 120,149 | | | | 84,735 | | | | — | | | | — | |
| Tax-Free New York Fund | | | 2,888 | | | | 1,865 | | | | — | | | | — | |
| Total Return Bond Fund | | | 1,270,272 | | | | 991,017 | | | | 509,446 | | | | 459,413 | |
| U.S. Government Securities Fund | | | 49,087 | | | | 35,162 | | | | 35,684 | | | | 26,890 | |
| Value Fund | | | 134,144 | | | | 104,784 | | | | — | | | | — | |
| Value Opportunities Fund | | | 71,647 | | | | 89,089 | | | | — | | | | — | |
| |
| 8. | Capital Share Transactions: |
The following information is for the six-month period ended April 30, 2008 and the year ended October 31, 2007:
363
The Hartford Mutual Funds, Inc. and The Hartford Mutual Funds II, Inc.
Notes to Financial Statements — (continued)
April 30, 2008 (Unaudited)
(000’s Omitted)
| | | | | | | | | | | | | | | | | | | | | | | | | | | | | | | | | | | | | | | | | |
| | | | | | Shares Issued for
| | | | | | Shares Issued
| | | Net Increase
| |
| | | Shares Sold | | | Reinvested Dividends | | | Shares Redeemed | | | from Merger | | | (Decrease) of Shares | |
| | | 2008 | | | 2007 | | | 2008 | | | 2007 | | | 2008 | | | 2007 | | | 2008 | | | 2007 | | | 2008 | | | 2007 | |
| |
Advisers Fund: | | | | | | | | | | | | | | | | | | | | | | | | | | | | | | | | | | | | | | | | |
| Class A Shares | | | 2,649 | | | | 6,316 | | | | 7,646 | | | | 1,427 | | | | (7,331 | ) | | | (15,308 | ) | | | — | | | | — | | | | 2,964 | | | | (7,565 | ) |
| | | | | | | | | | | | | | | | | | | | | | | | | | | | | | | | | | | | | | | | | |
| Amount | | $ | 40,282 | | | $ | 111,532 | | | $ | 121,341 | | | $ | 24,851 | | | $ | (112,498 | ) | | $ | (269,518 | ) | | $ | — | | | $ | — | | | $ | 49,125 | | | $ | (133,135 | ) |
| Class B Shares | | | 222 | | | | 505 | | | | 1,679 | | | | 255 | | | | (3,102 | ) | | | (7,864 | ) | | | — | | | | — | | | | (1,201 | ) | | | (7,104 | ) |
| Amount | | $ | 3,378 | | | $ | 8,837 | | | $ | 26,398 | | | $ | 4,349 | | | $ | (46,847 | ) | | $ | (137,250 | ) | | $ | — | | | $ | — | | | $ | (17,071 | ) | | $ | (124,064 | ) |
| Class C Shares | | | 262 | | | | 462 | | | | 1,344 | | | | 185 | | | | (1,457 | ) | | | (2,603 | ) | | | — | | | | — | | | | 149 | | | | (1,956 | ) |
| Amount | | $ | 3,994 | | | $ | 8,160 | | | $ | 21,347 | | | $ | 3,198 | | | $ | (22,192 | ) | | $ | (45,767 | ) | | $ | — | | | $ | — | | | $ | 3,149 | | | $ | (34,409 | ) |
| Class R3 Shares | | | — | | | | 1 | | | | — | | | | — | | | | — | | | | — | | | | — | | | | — | | | | — | | | | 1 | |
| Amount | | $ | 3 | | | $ | 10 | | | $ | 1 | | | $ | — | | | $ | — | | | $ | — | | | $ | — | | | $ | — | | | $ | 4 | | | $ | 10 | |
| Class R4 Shares | | | 11 | | | | 3 | | | | — | | | | — | | | | (1 | ) | | | — | | | | — | | | | — | | | | 10 | | | | 3 | |
| Amount | | $ | 169 | | | $ | 52 | | | $ | 6 | | | $ | — | | | $ | (24 | ) | | $ | — | | | $ | — | | | $ | — | | | $ | 151 | | | $ | 52 | |
| Class R5 Shares | | | — | | | | 1 | | | | — | | | | — | | | | — | | | | — | | | | — | | | | — | | | | — | | | | 1 | |
| Amount | | $ | — | | | $ | 10 | | | $ | 1 | | | $ | — | | | $ | — | | | $ | — | | | $ | — | | | $ | — | | | $ | 1 | | | $ | 10 | |
| Class Y Shares | | | 107 | | | | 54 | | | | 145 | | | | 29 | | | | (233 | ) | | | (65 | ) | | | — | | | | — | | | | 19 | | | | 18 | |
| Amount | | $ | 1,654 | | | $ | 965 | | | $ | 2,334 | | | $ | 517 | | | $ | (3,547 | ) | | $ | (1,165 | ) | | $ | — | | | $ | — | | | $ | 441 | | | $ | 317 | |
| Balanced Allocation Fund: | | | | | | | | | | | | | | | | | | | | | | | | | | | | | | | | | | | | | | | | |
| Class A Shares | | | 8,056 | | | | 14,252 | | | | 3,637 | | | | 2,038 | | | | (5,060 | ) | | | (7,600 | ) | | | — | | | | — | | | | 6,633 | | | | 8,690 | |
| Amount | | $ | 93,426 | | | $ | 175,249 | | | $ | 43,578 | | | $ | 24,479 | | | $ | (58,127 | ) | | $ | (93,540 | ) | | $ | — | | | $ | — | | | $ | 78,877 | | | $ | 106,188 | |
| Class B Shares | | | 1,277 | | | | 2,401 | | | | 749 | | | | 404 | | | | (973 | ) | | | (1,536 | ) | | | — | | | | — | | | | 1,053 | | | | 1,269 | |
| Amount | | $ | 14,687 | | | $ | 29,397 | | | $ | 8,973 | | | $ | 4,818 | | | $ | (11,182 | ) | | $ | (18,872 | ) | | $ | — | | | $ | — | | | $ | 12,478 | | | $ | 15,343 | |
| Class C Shares | | | 3,346 | | | | 5,561 | | | | 1,132 | | | | 568 | | | | (2,222 | ) | | | (3,170 | ) | | | — | | | | — | | | | 2,256 | | | | 2,959 | |
| Amount | | $ | 38,672 | | | $ | 68,155 | | | $ | 13,554 | | | $ | 6,776 | | | $ | (25,417 | ) | | $ | (39,000 | ) | | $ | — | | | $ | — | | | $ | 26,809 | | | $ | 35,931 | |
| Class I Shares | | | 229 | | | | 110 | | | | 5 | | | | 3 | | | | (31 | ) | | | (71 | ) | | | — | | | | — | | | | 203 | | | | 42 | |
| Amount | | $ | 2,607 | | | $ | 1,347 | | | $ | 65 | | | $ | 35 | | | $ | (353 | ) | | $ | (883 | ) | | $ | — | | | $ | — | | | $ | 2,319 | | | $ | 499 | |
| Class R3 Shares | | | 38 | | | | 9 | | | | 1 | | | | — | | | | (3 | ) | | | — | | | | — | | | | — | | | | 36 | | | | 9 | |
| Amount | | $ | 428 | | | $ | 113 | | | $ | 9 | | | $ | 1 | | | $ | (32 | ) | | $ | (4 | ) | | $ | — | | | $ | — | | | $ | 405 | | | $ | 110 | |
| Class R4 Shares | | | 486 | | | | 209 | | | | 21 | | | | 1 | | | | (52 | ) | | | (5 | ) | | | — | | | | — | | | | 455 | | | | 205 | |
| Amount | | $ | 5,550 | | | $ | 2,645 | | | $ | 256 | | | $ | 8 | | | $ | (605 | ) | | $ | (58 | ) | | $ | — | | | $ | — | | | $ | 5,201 | | | $ | 2,595 | |
| Class R5 Shares | | | 279 | | | | 55 | | | | 6 | | | | — | | | | (84 | ) | | | — | | | | — | | | | — | | | | 201 | | | | 55 | |
| Amount | | $ | 3,120 | | | $ | 687 | | | $ | 69 | | | $ | 4 | | | $ | (949 | ) | | $ | — | | | $ | — | | | $ | — | | | $ | 2,240 | | | $ | 691 | |
| Balanced Income Fund | | | | | | | | | | | | | | | | | | | | | | | | | | | | | | | | | | | | | | | | |
| Class A Shares | | | 1,004 | | | | 2,672 | | | | 90 | | | | 71 | | | | (167 | ) | | | (172 | ) | | | — | | | | — | | | | 927 | | | | 2,571 | |
| Amount | | $ | 10,500 | | | $ | 28,774 | | | $ | 940 | | | $ | 766 | | | $ | (1,747 | ) | | $ | (1,851 | ) | | $ | — | | | $ | — | | | $ | 9,693 | | | $ | 27,689 | |
| Class B Shares | | | 68 | | | | 184 | | | | 4 | | | | 3 | | | | (22 | ) | | | (8 | ) | | | — | | | | — | | | | 50 | | | | 179 | |
| Amount | | $ | 710 | | | $ | 1,985 | | | $ | 39 | | | $ | 28 | | | $ | (232 | ) | | $ | (91 | ) | | $ | — | | | $ | — | | | $ | 517 | | | $ | 1,922 | |
| Class C Shares | | | 183 | | | | 367 | | | | 7 | | | | 4 | | | | (49 | ) | | | (22 | ) | | | — | | | | — | | | | 141 | | | | 349 | |
| Amount | | $ | 1,920 | | | $ | 3,957 | | | $ | 73 | | | $ | 41 | | | $ | (510 | ) | | $ | (237 | ) | | $ | — | | | $ | — | | | $ | 1,483 | | | $ | 3,761 | |
| Class R3 Shares | | | — | | | | — | | | | — | | | | — | | | | — | | | | — | | | | — | | | | — | | | | — | | | | — | |
| Amount | | $ | — | | | $ | — | | | $ | — | | | $ | — | | | $ | — | | | $ | — | | | $ | — | | | $ | — | | | $ | — | | | $ | — | |
| Class R4 Shares | | | — | | | | — | | | | — | | | | — | | | | — | | | | — | | | | — | | | | — | | | | — | | | | — | |
| Amount | | $ | — | | | $ | — | | | $ | — | | | $ | — | | | $ | — | | | $ | — | | | $ | — | | | $ | — | | | $ | — | | | $ | — | |
| Class R5 Shares | | | — | | | | — | | | | — | | | | — | | | | — | | | | — | | | | — | | | | — | | | | — | | | | — | |
| Amount | | $ | — | | | $ | — | | | $ | — | | | $ | — | | | $ | — | | | $ | — | | | $ | — | | | $ | — | | | $ | — | | | $ | — | |
| Class Y Shares | | | — | | | | — | | | | 1 | | | | — | | | | — | | | | — | | | | — | | | | — | | | | 1 | | | | — | |
| Amount | | $ | — | | | $ | — | | | $ | 2 | | | $ | 4 | | | $ | — | | | $ | — | | | $ | — | | | $ | — | | | $ | 2 | | | $ | 4 | |
| Capital Appreciation Fund: | | | | | | | | | | | | | | | | | | | | | | | | | | | | | | | | | | | | | | | | |
| Class A Shares | | | 70,010 | | | | 87,303 | | | | 23,779 | | | | 17,873 | | | | (33,172 | ) | | | (42,965 | ) | | | — | | | | — | | | | 60,617 | | | | 62,211 | |
| Amount | | $ | 2,667,924 | | | $ | 3,502,107 | | | $ | 960,182 | | | $ | 659,971 | | | $ | (1,260,166 | ) | | $ | (1,730,535 | ) | | $ | — | | | $ | — | | | $ | 2,367,940 | | | $ | 2,431,543 | |
| Class B Shares | | | 3,431 | | | | 6,777 | | | | 5,082 | | | | 4,371 | | | | (6,641 | ) | | | (9,556 | ) | �� | | — | | | | — | | | | 1,872 | | | | 1,592 | |
| Amount | | $ | 117,642 | | | $ | 243,926 | | | $ | 183,341 | | | $ | 146,176 | | | $ | (224,537 | ) | | $ | (348,719 | ) | | $ | — | | | $ | — | | | $ | 76,446 | | | $ | 41,383 | |
| Class C Shares | | | 18,361 | | | | 29,666 | | | | 8,838 | | | | 6,331 | | | | (8,848 | ) | | | (12,054 | ) | | | — | | | | — | | | | 18,351 | | | | 23,943 | |
| Amount | | $ | 637,357 | | | $ | 1,078,361 | | | $ | 320,714 | | | $ | 212,674 | | | $ | (302,199 | ) | | $ | (440,984 | ) | | $ | — | | | $ | — | | | $ | 655,872 | | | $ | 850,051 | |
| Class I Shares | | | 3,688 | | | | 3,462 | | | | 287 | | | | 17 | | | | (839 | ) | | | (198 | ) | | | — | | | | — | | | | 3,136 | | | | 3,281 | |
| Amount | | $ | 141,355 | | | $ | 140,237 | | | $ | 11,558 | | | $ | 626 | | | $ | (31,844 | ) | | $ | (8,135 | ) | | $ | — | | | $ | — | | | $ | 121,069 | | | $ | 132,728 | |
| Class R3 Shares | | | 11 | | | | 1 | | | | — | | | | — | | | | — | | | | — | | | | — | | | | — | | | | 11 | | | | 1 | |
| Amount | | $ | 454 | | | $ | 34 | | | $ | 3 | | | $ | — | | | $ | (21 | ) | | $ | — | | | $ | — | | | $ | — | | | $ | 436 | | | $ | 34 | |
| Class R4 Shares | | | 839 | | | | 326 | | | | 33 | | | | — | | | | (33 | ) | | | (8 | ) | | | — | | | | — | | | | 839 | | | | 318 | |
| Amount | | $ | 33,982 | | | $ | 15,387 | | | $ | 1,432 | | | $ | — | | | $ | (1,336 | ) | | $ | (390 | ) | | $ | — | | | $ | — | | | $ | 34,078 | | | $ | 14,997 | |
| Class R5 Shares | | | 551 | | | | 24 | | | | 8 | | | | — | | | | (49 | ) | | | — | | | | — | | | | — | | | | 510 | | | | 24 | |
| Amount | | $ | 22,863 | | | $ | 1,141 | | | $ | 353 | | | $ | — | | | $ | (1,928 | ) | | $ | (2 | ) | | $ | — | | | $ | — | | | $ | 21,288 | | | $ | 1,139 | |
| Class Y Shares | | | 8,705 | | | | 11,305 | | | | 1,725 | | | | 1,019 | | | | (1,367 | ) | | | (1,104 | ) | | | — | | | | — | | | | 9,063 | | | | 11,220 | |
| Amount | | $ | 360,277 | | | $ | 487,276 | | | $ | 74,889 | | | $ | 40,269 | | | $ | (56,255 | ) | | $ | (48,276 | ) | | $ | — | | | $ | — | | | $ | 378,911 | | | $ | 479,269 | |
364
| | | | | | | | | | | | | | | | | | | | | | | | | | | | | | | | | | | | | | | | | |
| | | | | | Shares Issued for
| | | | | | Shares Issued
| | | Net Increase
| |
| | | Shares Sold | | | Reinvested Dividends | | | Shares Redeemed | | | from Merger | | | (Decrease) of Shares | |
| | | 2008 | | | 2007 | | | 2008 | | | 2007 | | | 2008 | | | 2007 | | | 2008 | | | 2007 | | | 2008 | | | 2007 | |
| |
Capital Appreciation Fund: — (continued) |
| Capital Appreciation II Fund: | | | | | | | | | | | | | | | | | | | | | | | | | | | | | | | | | | | | | | | | |
| Class A Shares | | | 17,872 | | | | 35,707 | | | | 3,362 | | | | 400 | | | | (8,702 | ) | | | (6,023 | ) | | | — | | | | — | | | | 12,532 | | | | 30,084 | |
| Amount | | $ | 251,497 | | | $ | 527,123 | | | $ | 49,988 | | | $ | 5,193 | | | $ | (120,896 | ) | | $ | (88,458 | ) | | $ | — | | | $ | — | | | $ | 180,589 | | | $ | 443,858 | |
| Class B Shares | | | 1,684 | | | | 4,444 | | | | 475 | | | | 52 | | | | (545 | ) | | | (430 | ) | | | — | | | | — | | | | 1,614 | | | | 4,066 | |
| Amount | | $ | 22,994 | | | $ | 64,283 | | | $ | 6,911 | | | $ | 666 | | | $ | (7,256 | ) | | $ | (6,279 | ) | | $ | — | | | $ | — | | | $ | 22,649 | | | $ | 58,670 | |
| Class C Shares | | | 8,727 | | | | 18,529 | | | | 1,739 | | | | 166 | | | | (2,709 | ) | | | (1,252 | ) | | | — | | | | — | | | | 7,757 | | | | 17,443 | |
| Amount | | $ | 120,847 | | | $ | 269,523 | | | $ | 25,354 | | | $ | 2,128 | | | $ | (35,974 | ) | | $ | (18,308 | ) | | $ | — | | | $ | — | | | $ | 110,227 | | | $ | 253,343 | |
| Class I Shares | | | 4,239 | | | | 6,315 | | | | 326 | | | | 6 | | | | (1,983 | ) | | | (1,643 | ) | | | — | | | | — | | | | 2,582 | | | | 4,678 | |
| Amount | | $ | 59,075 | | | $ | 92,756 | | | $ | 4,865 | | | $ | 77 | | | $ | (27,177 | ) | | $ | (23,510 | ) | | $ | — | | | $ | — | | | $ | 36,763 | | | $ | 69,323 | |
| Class R3 Shares | | | 307 | | | | 40 | | | | 2 | | | | — | | | | (12 | ) | | | (13 | ) | | | — | | | | — | | | | 297 | | | | 27 | |
| Amount | | $ | 4,173 | | | $ | 572 | | | $ | 33 | | | $ | — | | | $ | (164 | ) | | $ | (186 | ) | | $ | — | | | $ | — | | | $ | 4,042 | | | $ | 386 | |
| Class R4 Shares | | | 89 | | | | 1 | | | | — | | | | — | | | | (1 | ) | | | — | | | | — | | | | — | | | | 88 | | | | 1 | |
| Amount | | $ | 1,240 | | | $ | 11 | | | $ | 1 | | | $ | — | | | $ | (11 | ) | | $ | — | | | $ | — | | | $ | — | | | $ | 1,230 | | | $ | 11 | |
| Class R5 Shares | | | 9 | | | | 8 | | | | 1 | | | | — | | | | (2 | ) | | | — | | | | — | | | | — | | | | 8 | | | | 8 | |
| Amount | | $ | 136 | | | $ | 122 | | | $ | 12 | | | $ | — | | | $ | (27 | ) | | $ | (1 | ) | | $ | — | | | $ | — | | | $ | 121 | | | $ | 121 | |
| Class Y Shares | | | 1,150 | | | | — | | | | 1 | | | | — | | | | (32 | ) | | | — | | | | — | | | | — | | | | 1,119 | | | | — | |
| Amount | | $ | 15,976 | | | $ | — | | | $ | 11 | | | $ | 3 | | | $ | (443 | ) | | $ | — | | | $ | — | | | $ | — | | | $ | 15,544 | | | $ | 3 | |
| Checks and Balances Fund: | | | | | | | | | | | | | | | | | | | | | | | | | | | | | | | | | | | | | | | | |
| Class A Shares | | | 35,954 | | | | 16,805 | | | | 410 | | | | 34 | | | | (2,862 | ) | | | (413 | ) | | | — | | | | — | | | | 33,502 | | | | 16,426 | |
| Amount | | $ | 356,040 | | | $ | 170,540 | | | $ | 4,081 | | | $ | 352 | | | $ | (28,206 | ) | | $ | (4,185 | ) | | $ | — | | | $ | — | | | $ | 331,915 | | | $ | 166,707 | |
| Class B Shares | | | 4,774 | | | | 1,922 | | | | 35 | | | | 3 | | | | (242 | ) | | | (42 | ) | | | — | | | | — | | | | 4,567 | | | | 1,883 | |
| Amount | | $ | 47,016 | | | $ | 19,482 | | | $ | 354 | | | $ | 28 | | | $ | (2,366 | ) | | $ | (421 | ) | | $ | — | | | $ | — | | | $ | 45,004 | | | $ | 19,089 | |
| Class C Shares | | | 12,938 | | | | 5,322 | | | | 96 | | | | 7 | | | | (974 | ) | | | (76 | ) | | | — | | | | — | | | | 12,060 | | | | 5,253 | |
| Amount | | $ | 127,956 | | | $ | 54,033 | | | $ | 957 | | | $ | 71 | | | $ | (9,651 | ) | | $ | (776 | ) | | $ | — | | | $ | — | | | $ | 119,262 | | | $ | 53,328 | |
| Class I Shares | | | 89 | | | | — | | | | — | | | | — | | | | — | | | | — | | | | — | | | | — | | | | 89 | | | | — | |
| Amount | | $ | 872 | | | $ | — | | | $ | 1 | | | $ | — | | | $ | — | | | $ | — | | | $ | — | | | $ | — | | | $ | 873 | | | $ | — | |
| Conservative Allocation Fund: | | | | | | | | | | | | | | | | | | | | | | | | | | | | | | | | | | | | | | | | |
| Class A Shares | | | 3,478 | | | | 3,702 | | | | 626 | | | | 503 | | | | (2,192 | ) | | | (2,134 | ) | | | — | | | | — | | | | 1,912 | | | | 2,071 | |
| Amount | | $ | 36,966 | | | $ | 41,554 | | | $ | 6,809 | | | $ | 5,558 | | | $ | (23,355 | ) | | $ | (23,979 | ) | | $ | — | | | $ | — | | | $ | 20,420 | | | $ | 23,133 | |
| Class B Shares | | | 449 | | | | 622 | | | | 121 | | | | 97 | | | | (315 | ) | | | (352 | ) | | | — | | | | — | | | | 255 | | | | 367 | |
| Amount | | $ | 4,771 | | | $ | 6,959 | | | $ | 1,316 | | | $ | 1,066 | | | $ | (3,363 | ) | | $ | (3,940 | ) | | $ | — | | | $ | — | | | $ | 2,724 | | | $ | 4,085 | |
| Class C Shares | | | 1,353 | | | | 3,123 | | | | 206 | | | | 155 | | | | (619 | ) | | | (2,519 | ) | | | — | | | | — | | | | 940 | | | | 759 | |
| Amount | | $ | 14,412 | | | $ | 34,833 | | | $ | 2,248 | | | $ | 1,712 | | | $ | (6,558 | ) | | $ | (28,100 | ) | | $ | — | | | $ | — | | | $ | 10,102 | | | $ | 8,445 | |
| Class I Shares | | | 69 | | | | 349 | | | | 7 | | | | 5 | | | | (146 | ) | | | (226 | ) | | | — | | | | — | | | | (70 | ) | | | 128 | |
| Amount | | $ | 727 | | | $ | 3,864 | | | $ | 81 | | | $ | 50 | | | $ | (1,549 | ) | | $ | (2,542 | ) | | $ | — | | | $ | — | | | $ | (741 | ) | | $ | 1,372 | |
| Class R3 Shares | | | 35 | | | | 2 | | | | — | | | | — | | | | (35 | ) | | | — | | | | — | | | | — | | | | — | | | | 2 | |
| Amount | | $ | 363 | | | $ | 20 | | | $ | 1 | | | $ | — | | | $ | (362 | ) | | $ | (1 | ) | | $ | — | | | $ | — | | | $ | 2 | | | $ | 19 | |
| Class R4 Shares | | | 556 | | | | 39 | | | | 7 | | | | — | | | | (39 | ) | | | (2 | ) | | | — | | | | — | | | | 524 | | | | 37 | |
| Amount | | $ | 5,850 | | | $ | 436 | | | $ | 77 | | | $ | 2 | | | $ | (407 | ) | | $ | (19 | ) | | $ | — | | | $ | — | | | $ | 5,520 | | | $ | 419 | |
| Class R5 Shares | | | 130 | | | | 60 | | | | 4 | | | | — | | | | (14 | ) | | | — | | | | — | | | | — | | | | 120 | | | | 60 | |
| Amount | | $ | 1,367 | | | $ | 684 | | | $ | 41 | | | $ | 2 | | | $ | (154 | ) | | $ | (2 | ) | | $ | — | | | $ | — | | | $ | 1,254 | | | $ | 684 | |
| Disciplined Equity Fund: | | | | | | | | | | | | | | | | | | | | | | | | | | | | | | | | | | | | | | | | |
| Class A Shares | | | 464 | | | | 779 | | | | 18 | | | | 99 | | | | (1,418 | ) | | | (3,352 | ) | | | — | | | | — | | | | (936 | ) | | | (2,474 | ) |
| Amount | | $ | 6,335 | | | $ | 10,991 | | | $ | 259 | | | $ | 1,346 | | | $ | (19,433 | ) | | $ | (47,069 | ) | | $ | — | | | $ | — | | | $ | (12,839 | ) | | $ | (34,732 | ) |
| Class B Shares | | | 39 | | | | 115 | | | | — | | | | 3 | | | | (464 | ) | | | (848 | ) | | | — | | | | — | | | | (425 | ) | | | (730 | ) |
| Amount | | $ | 507 | | | $ | 1,544 | | | $ | — | | | $ | 38 | | | $ | (6,009 | ) | | $ | (11,417 | ) | | $ | — | | | $ | — | | | $ | (5,502 | ) | | $ | (9,835 | ) |
| Class C Shares | | | 38 | | | | 63 | | | | — | | | | 1 | | | | (184 | ) | | | (520 | ) | | | — | | | | — | | | | (146 | ) | | | (456 | ) |
| Amount | | $ | 495 | | | $ | 837 | | | $ | — | | | $ | 17 | | | $ | (2,378 | ) | | $ | (6,922 | ) | | $ | — | | | $ | — | | | $ | (1,883 | ) | | $ | (6,068 | ) |
| Class R3 Shares | | | — | | | | 1 | | | | — | | | | — | | | | — | | | | — | | | | — | | | | — | | | | — | | | | 1 | |
| Amount | | $ | 1 | | | $ | 10 | | | $ | — | | | $ | — | | | $ | — | | | $ | — | | | $ | — | | | $ | — | | | $ | 1 | | | $ | 10 | |
| Class R4 Shares | | | — | | | | 1 | | | | — | | | | — | | | | — | | | | — | | | | — | | | | — | | | | — | | | | 1 | |
| Amount | | $ | — | | | $ | 10 | | | $ | — | | | $ | — | | | $ | — | | | $ | — | | | $ | — | | | $ | — | | | $ | — | | | $ | 10 | |
| Class R5 Shares | | | — | | | | 1 | | | | — | | | | — | | | | — | | | | — | | | | — | | | | — | | | | — | | | | 1 | |
| Amount | | $ | — | | | $ | 10 | | | $ | — | | | $ | — | | | $ | — | | | $ | — | | | $ | — | | | $ | — | | | $ | — | | | $ | 10 | |
| Class Y Shares | | | 337 | | | | 1,306 | | | | 50 | | | | 47 | | | | (281 | ) | | | (6,642 | ) | | | — | | | | — | | | | 106 | | | | (5,289 | ) |
| Amount | | $ | 4,823 | | | $ | 19,108 | | | $ | 754 | | | $ | 659 | | | $ | (3,833 | ) | | $ | (91,136 | ) | | $ | — | | | $ | — | | | $ | 1,744 | | | $ | (71,369 | ) |
| Dividend and Growth Fund: | | | | | | | | | | | | | | | | | | | | | | | | | | | | | | | | | | | | | | | | |
| Class A Shares | | | 13,206 | | | | 24,817 | | | | 9,209 | | | | 9,647 | | | | (10,318 | ) | | | (16,770 | ) | | | — | | | | — | | | | 12,097 | | | | 17,694 | |
| Amount | | $ | 267,248 | | | $ | 541,443 | | | $ | 192,135 | | | $ | 198,393 | | | $ | (208,366 | ) | | $ | (367,180 | ) | | $ | — | | | $ | — | | | $ | 251,017 | | | $ | 372,656 | |
| Class B Shares | | | 917 | | | | 2,462 | | | | 1,056 | | | | 1,193 | | | | (2,280 | ) | | | (3,550 | ) | | | — | | | | — | | | | (307 | ) | | | 105 | |
| Amount | | $ | 18,268 | | | $ | 52,687 | | | $ | 21,728 | | | $ | 23,931 | | | $ | (45,146 | ) | | $ | (76,451 | ) | | $ | — | | | $ | — | | | $ | (5,150 | ) | | $ | 167 | |
| Class C Shares | | | 1,039 | | | | 2,480 | | | | 960 | | | | 1,041 | | | | (1,628 | ) | | | (2,440 | ) | | | — | | | | — | | | | 371 | | | | 1,081 | |
| Amount | | $ | 20,682 | | | $ | 53,014 | | | $ | 19,707 | | | $ | 20,886 | | | $ | (32,334 | ) | | $ | (52,425 | ) | | $ | — | | | $ | — | | | $ | 8,055 | | | $ | 21,475 | |
365
The Hartford Mutual Funds, Inc. and The Hartford Mutual Funds II, Inc.
Notes to Financial Statements — (continued)
April 30, 2008 (Unaudited)
(000’s Omitted)
| | | | | | | | | | | | | | | | | | | | | | | | | | | | | | | | | | | | | | | | | |
| | | | | | Shares Issued for
| | | | | | Shares Issued
| | | Net Increase
| |
| | | Shares Sold | | | Reinvested Dividends | | | Shares Redeemed | | | from Merger | | | (Decrease) of Shares | |
| | | 2008 | | | 2007 | | | 2008 | | | 2007 | | | 2008 | | | 2007 | | | 2008 | | | 2007 | | | 2008 | | | 2007 | |
| |
Dividend and Growth Fund: — (continued) |
| Class I Shares | | | 190 | | | | 95 | | | | 7 | | | | 1 | | | | (20 | ) | | | (14 | ) | | | — | | | | — | | | | 177 | | | | 82 | |
| Amount | | $ | 3,903 | | | $ | 2,092 | | | $ | 141 | | | $ | 13 | | | $ | (409 | ) | | $ | (303 | ) | | $ | — | | | $ | — | | | $ | 3,635 | | | $ | 1,802 | |
| Class R3 Shares | | | 10 | | | | 8 | | | | — | | | | — | | | | (6 | ) | | | — | | | | — | | | | — | | | | 4 | | | | 8 | |
| Amount | | $ | 200 | | | $ | 170 | | | $ | 11 | | | $ | — | | | $ | (122 | ) | | $ | (2 | ) | | $ | — | | | $ | — | | | $ | 89 | | | $ | 168 | |
| Class R4 Shares | | | 258 | | | | 87 | | | | 6 | | | | — | | | | (18 | ) | | | (2 | ) | | | — | | | | — | | | | 246 | | | | 85 | |
| Amount | | $ | 5,171 | | | $ | 2,033 | | | $ | 136 | | | $ | 1 | | | $ | (364 | ) | | $ | (43 | ) | | $ | — | | | $ | — | | | $ | 4,943 | | | $ | 1,991 | |
| Class R5 Shares | | | 7 | | | | 8 | | | | 1 | | | | — | | | | (2 | ) | | | — | | | | — | | | | — | | | | 6 | | | | 8 | |
| Amount | | $ | 140 | | | $ | 193 | | | $ | 12 | | | $ | — | | | $ | (31 | ) | | $ | — | | | $ | — | | | $ | — | | | $ | 121 | | | $ | 193 | |
| Class Y Shares | | | 10,594 | | | | 5,596 | | | | 809 | | | | 459 | | | | (161 | ) | | | (1,299 | ) | | | — | | | | — | | | | 11,242 | | | | 4,756 | |
| Amount | | $ | 217,153 | | | $ | 128,524 | | | $ | 17,064 | | | $ | 9,602 | | | $ | (3,330 | ) | | $ | (27,649 | ) | | $ | — | | | $ | — | | | $ | 230,887 | | | $ | 110,477 | |
| Equity Growth Allocation Fund: | | | | | | | | | | | | | | | | | | | | | | | | | | | | | | | | | | | | | | | | |
| Class A Shares | | | 2,313 | | | | 3,853 | | | | 1,191 | | | | 342 | | | | (1,192 | ) | | | (1,839 | ) | | | — | | | | — | | | | 2,312 | | | | 2,356 | |
| Amount | | $ | 29,982 | | | $ | 53,844 | | | $ | 16,356 | | | $ | 4,488 | | | $ | (15,106 | ) | | $ | (26,095 | ) | | $ | — | | | $ | — | | | $ | 31,232 | | | $ | 32,237 | |
| Class B Shares | | | 393 | | | | 811 | | | | 301 | | | | 83 | | | | (231 | ) | | | (336 | ) | | | — | | | | — | | | | 463 | | | | 558 | |
| Amount | | $ | 4,976 | | | $ | 11,300 | | | $ | 4,107 | | | $ | 1,077 | | | $ | (2,929 | ) | | $ | (4,711 | ) | | $ | — | | | $ | — | | | $ | 6,154 | | | $ | 7,666 | |
| Class C Shares | | | 835 | | | | 1,437 | | | | 432 | | | | 116 | | | | (593 | ) | | | (708 | ) | | | — | | | | — | | | | 674 | | | | 845 | |
| Amount | | $ | 10,588 | | | $ | 19,934 | | | $ | 5,883 | | | $ | 1,505 | | | $ | (7,466 | ) | | $ | (9,897 | ) | | $ | — | | | $ | — | | | $ | 9,005 | | | $ | 11,542 | |
| Class I Shares | | | 34 | | | | 3 | | | | 1 | | | | — | | | | (1 | ) | | | — | | | | — | | | | — | | | | 34 | | | | 3 | |
| Amount | | $ | 440 | | | $ | 48 | | | $ | 8 | | | $ | — | | | $ | (13 | ) | | $ | (5 | ) | | $ | — | | | $ | — | | | $ | 435 | | | $ | 43 | |
| Class R3 Shares | | | 8 | | | | 85 | | | | 6 | | | | — | | | | (8 | ) | | | (24 | ) | | | — | | | | — | | | | 6 | | | | 61 | |
| Amount | | $ | 90 | | | $ | 1,251 | | | $ | 88 | | | $ | — | | | $ | (108 | ) | | $ | (341 | ) | | $ | — | | | $ | — | | | $ | 70 | | | $ | 910 | |
| Class R4 Shares | | | 182 | | | | 31 | | | | 6 | | | | — | | | | (22 | ) | | | (2 | ) | | | — | | | | — | | | | 166 | | | | 29 | |
| Amount | | $ | 2,360 | | | $ | 446 | | | $ | 87 | | | $ | — | | | $ | (275 | ) | | $ | (28 | ) | | $ | — | | | $ | — | | | $ | 2,172 | | | $ | 418 | |
| Class R5 Shares | | | 83 | | | | 5 | | | | 1 | | | | — | | | | (1 | ) | | | — | | | | — | | | | — | | | | 83 | | | | 5 | |
| Amount | | $ | 1,028 | | | $ | 70 | | | $ | 8 | | | $ | — | | | $ | (16 | ) | | $ | — | | | $ | — | | | $ | — | | | $ | 1,020 | | | $ | 70 | |
| Equity Income Fund: | | | | | | | | | | | | | | | | | | | | | | | | | | | | | | | | | | | | | | | | |
| Class A Shares | | | 5,576 | | | | 14,930 | | | | 1,988 | | | | 2,316 | | | | (3,735 | ) | | | (4,996 | ) | | | — | | | | — | | | | 3,829 | | | | 12,250 | |
| Amount | | $ | 75,934 | | | $ | 215,310 | | | $ | 27,684 | | | $ | 32,077 | | | $ | (50,553 | ) | | $ | (72,479 | ) | | $ | — | | | $ | — | | | $ | 53,065 | | | $ | 174,908 | |
| Class B Shares | | | 247 | | | | 844 | | | | 116 | | | | 150 | | | | (414 | ) | | | (618 | ) | | | — | | | | — | | | | (51 | ) | | | 376 | |
| Amount | | $ | 3,371 | | | $ | 12,066 | | | $ | 1,623 | | | $ | 2,058 | | | $ | (5,587 | ) | | $ | (8,972 | ) | | $ | — | | | $ | — | | | $ | (593 | ) | | $ | 5,152 | |
| Class C Shares | | | 227 | | | | 980 | | | | 153 | | | | 208 | | | | (657 | ) | | | (787 | ) | | | — | | | | — | | | | (277 | ) | | | 401 | |
| Amount | | $ | 3,096 | | | $ | 14,015 | | | $ | 2,140 | | | $ | 2,853 | | | $ | (8,881 | ) | | $ | (11,349 | ) | | $ | — | | | $ | — | | | $ | (3,645 | ) | | $ | 5,519 | |
| Class I Shares | | | 12 | | | | 54 | | | | 2 | | | | 1 | | | | (5 | ) | | | (3 | ) | | | — | | | | — | | | | 9 | | | | 52 | |
| Amount | | $ | 157 | | | $ | 770 | | | $ | 34 | | | $ | 17 | | | $ | (69 | ) | | $ | (37 | ) | | $ | — | | | $ | — | | | $ | 122 | | | $ | 750 | |
| Class R3 Shares | | | 1 | | | | 6 | | | | — | | | | — | | | | — | | | | — | | | | — | | | | — | | | | 1 | | | | 6 | |
| Amount | | $ | 15 | | | $ | 93 | | | $ | 3 | | | $ | — | | | $ | (1 | ) | | $ | — | | | $ | — | | | $ | — | | | $ | 17 | | | $ | 93 | |
| Class R4 Shares | | | — | | | | 1 | | | | — | | | | — | | | | — | | | | — | | | | — | | | | — | | | | — | | | | 1 | |
| Amount | | $ | 1 | | | $ | 10 | | | $ | — | | | $ | — | | | $ | — | | | $ | — | | | $ | — | | | $ | — | | | $ | 1 | | | $ | 10 | |
| Class R5 Shares | | | — | | | | 1 | | | | — | | | | — | | | | — | | | | — | | | | — | | | | — | | | | — | | | | 1 | |
| Amount | | $ | — | | | $ | 10 | | | $ | — | | | $ | — | | | $ | — | | | $ | — | | | $ | — | | | $ | — | | | $ | — | | | $ | 10 | |
| Class Y Shares | | | 755 | | | | 8,385 | | | | 359 | | | | 336 | | | | (339 | ) | | | (705 | ) | | | — | | | | — | | | | 775 | | | | 8,016 | |
| Amount | | $ | 10,078 | | | $ | 115,771 | | | $ | 5,021 | | | $ | 4,751 | | | $ | (4,757 | ) | | $ | (10,403 | ) | | $ | — | | | $ | — | | | $ | 10,342 | | | $ | 110,119 | |
| Floating Rate Fund: | | | | | | | | | | | | | | | | | | | | | | | | | | | | | | | | | | | | | | | | |
| Class A Shares | | | 20,034 | | | | 218,998 | | | | 3,048 | | | | 8,343 | | | | (97,387 | ) | | | (171,714 | ) | | | — | | | | — | | | | (74,305 | ) | | | 55,627 | |
| Amount | | $ | 185,769 | | | $ | 2,209,638 | | | $ | 28,158 | | | $ | 83,299 | | | $ | (906,190 | ) | | $ | (1,708,318 | ) | | $ | — | | | $ | — | | | $ | (692,263 | ) | | $ | 584,619 | |
| Class B Shares | | | 578 | | | | 4,398 | | | | 105 | | | | 199 | | | | (1,667 | ) | | | (1,474 | ) | | | — | | | | — | | | | (984 | ) | | | 3,123 | |
| Amount | | $ | 5,331 | | | $ | 44,237 | | | $ | 965 | | | $ | 1,986 | | | $ | (15,334 | ) | | $ | (14,582 | ) | | $ | — | | | $ | — | | | $ | (9,038 | ) | | $ | 31,641 | |
| Class C Shares | | | 12,368 | | | | 150,707 | | | | 2,954 | | | | 5,721 | | | | (61,989 | ) | | | (47,155 | ) | | | — | | | | — | | | | (46,667 | ) | | | 109,273 | |
| Amount | | $ | 114,795 | | | $ | 1,519,091 | | | $ | 27,235 | | | $ | 56,915 | | | $ | (569,994 | ) | | $ | (465,577 | ) | | $ | — | | | $ | — | | | $ | (427,964 | ) | | $ | 1,110,429 | |
| Class I Shares | | | 9,650 | | | | 85,893 | | | | 708 | | | | 1,832 | | | | (25,279 | ) | | | (52,278 | ) | | | — | | | | — | | | | (14,921 | ) | | | 35,447 | |
| Amount | | $ | 90,035 | | | $ | 867,496 | | | $ | 6,546 | | | $ | 18,271 | | | $ | (234,873 | ) | | $ | (519,197 | ) | | $ | — | | | $ | — | | | $ | (138,292 | ) | | $ | 366,570 | |
| Class R3 Shares | | | 28 | | | | 29 | | | | 2 | | | | — | | | | (2 | ) | | | — | | | | — | | | | — | | | | 28 | | | | 29 | |
| Amount | | $ | 263 | | | $ | 286 | | | $ | 13 | | | $ | 4 | | | $ | (14 | ) | | $ | — | | | $ | — | | | $ | — | | | $ | 262 | | | $ | 290 | |
| Class R4 Shares | | | 63 | | | | 1 | | | | 1 | | | | — | | | | (2 | ) | | | — | | | | — | | | | — | | | | 62 | | | | 1 | |
| Amount | | $ | 589 | | | $ | 10 | | | $ | 8 | | | $ | 1 | | | $ | (23 | ) | | $ | — | | | $ | — | | | $ | — | | | $ | 574 | | | $ | 11 | |
| Class R5 Shares | | | — | | | | 26 | | | | 1 | | | | 1 | | | | (1 | ) | | | (6 | ) | | | — | | | | — | | | | — | | | | 21 | |
| Amount | | $ | 5 | | | $ | 264 | | | $ | 6 | | | $ | 6 | | | $ | (10 | ) | | $ | (59 | ) | | $ | — | | | $ | — | | | $ | 1 | | | $ | 211 | |
| Class Y Shares | | | 1,960 | | | | 6,189 | | | | 319 | | | | 492 | | | | (249 | ) | | | (1,007 | ) | | | — | | | | — | | | | 2,030 | | | | 5,674 | |
| Amount | | $ | 17,559 | | | $ | 61,841 | | | $ | 2,933 | | | $ | 4,904 | | | $ | (2,340 | ) | | $ | (10,186 | ) | | $ | — | | | $ | — | | | $ | 18,152 | | | $ | 56,559 | |
| Fundamental Growth Fund: | | | | | | | | | | | | | | | | | | | | | | | | | | | | | | | | | | | | | | | | |
| Class A Shares | | | 285 | | | | 185 | | | | 357 | | | | — | | | | (354 | ) | | | (979 | ) | | | — | | | | — | | | | 288 | | | | (794 | ) |
| Amount | | $ | 3,249 | | | $ | 2,384 | | | $ | 4,175 | | | $ | — | | | $ | (4,030 | ) | | $ | (11,850 | ) | | $ | — | | | $ | — | | | $ | 3,394 | | | $ | (9,466 | ) |
366
| | | | | | | | | | | | | | | | | | | | | | | | | | | | | | | | | | | | | | | | | |
| | | | | | Shares Issued for
| | | | | | Shares Issued
| | | Net Increase
| |
| | | Shares Sold | | | Reinvested Dividends | | | Shares Redeemed | | | from Merger | | | (Decrease) of Shares | |
| | | 2008 | | | 2007 | | | 2008 | | | 2007 | | | 2008 | | | 2007 | | | 2008 | | | 2007 | | | 2008 | | | 2007 | |
| |
Fundamental Growth Fund: — (continued) |
| Class B Shares | | | 37 | | | | 31 | | | | 118 | | | | — | | | | (122 | ) | | | (347 | ) | | | — | | | | — | | | | 33 | | | | (316 | ) |
| Amount | | $ | 400 | | | $ | 366 | | | $ | 1,320 | | | $ | — | | | $ | (1,317 | ) | | $ | (4,095 | ) | | $ | — | | | $ | — | | | $ | 403 | | | $ | (3,729 | ) |
| Class C Shares | | | 115 | | | | 162 | | | | 126 | | | | — | | | | (99 | ) | | | (365 | ) | | | — | | | | — | | | | 142 | | | | (203 | ) |
| Amount | | $ | 1,262 | | | $ | 1,986 | | | $ | 1,404 | | | $ | — | | | $ | (1,067 | ) | | $ | (4,292 | ) | | $ | — | | | $ | — | | | $ | 1,599 | | | $ | (2,306 | ) |
| Class Y Shares | | | 14 | | | | 9 | | | | 4 | | | | — | | | | (10 | ) | | | (25 | ) | | | — | | | | — | | | | 8 | | | | (16 | ) |
| Amount | | $ | 165 | | | $ | 118 | | | $ | 42 | | | $ | — | | | $ | (113 | ) | | $ | (309 | ) | | $ | — | | | $ | — | | | $ | 94 | | | $ | (191 | ) |
| Global Communications Fund: | | | | | | | | | | | | | | | | | | | | | | | | | | | | | | | | | | | | | | | | |
| Class A Shares | | | 888 | | | | 2,012 | | | | 113 | | | | 33 | | | | (641 | ) | | | (1,441 | ) | | | — | | | | — | | | | 360 | | | | 604 | |
| Amount | | $ | 8,688 | | | $ | 18,659 | | | $ | 1,149 | | | $ | 281 | | | $ | (6,066 | ) | | $ | (13,339 | ) | | $ | — | | | $ | — | | | $ | 3,771 | | | $ | 5,601 | |
| Class B Shares | | | 106 | | | | 176 | | | | 21 | | | | 7 | | | | (82 | ) | | | (130 | ) | | | — | | | | — | | | | 45 | | | | 53 | |
| Amount | | $ | 1,003 | | | $ | 1,566 | | | $ | 210 | | | $ | 55 | | | $ | (756 | ) | | $ | (1,165 | ) | | $ | — | | | $ | — | | | $ | 457 | | | $ | 456 | |
| Class C Shares | | | 209 | | | | 535 | | | | 33 | | | | 6 | | | | (209 | ) | | | (183 | ) | | | — | | | | — | | | | 33 | | | | 358 | |
| Amount | | $ | 1,971 | | | $ | 4,912 | | | $ | 322 | | | $ | 53 | | | $ | (1,902 | ) | | $ | (1,651 | ) | | $ | — | | | $ | — | | | $ | 391 | | | $ | 3,314 | |
| Class Y Shares | | | 101 | | | | 76 | | | | 5 | | | | 3 | | | | (104 | ) | | | (110 | ) | | | — | | | | — | | | | 2 | | | | (31 | ) |
| Amount | | $ | 1,086 | | | $ | 711 | | | $ | 52 | | | $ | 23 | | | $ | (995 | ) | | $ | (1,051 | ) | | $ | — | | | $ | — | | | $ | 143 | | | $ | (317 | ) |
| Global Equity Fund: | | | | | | | | | | | | | | | | | | | | | | | | | | | | | | | | | | | | | | | | |
| Class A Shares | | | 1,793 | | | | — | | | | — | | | | — | | | | — | | | | — | | | | — | | | | — | | | | 1,793 | | | | — | |
| Amount | �� | $ | 17,929 | | | $ | — | | | $ | — | | | $ | — | | | $ | — | | | $ | — | | | $ | — | | | $ | — | | | $ | 17,929 | | | $ | — | |
| Class B Shares | | | 30 | | | | — | | | | — | | | | — | | | | — | | | | — | | | | — | | | | — | | | | 30 | | | | — | |
| Amount | | $ | 301 | | | $ | — | | | $ | — | | | $ | — | | | $ | — | | | $ | — | | | $ | — | | | $ | — | | | $ | 301 | | | $ | — | |
| Class C Shares | | | 32 | | | | — | | | | — | | | | — | | | | — | | | | — | | | | — | | | | — | | | | 32 | | | | — | |
| Amount | | $ | 319 | | | $ | — | | | $ | — | | | $ | — | | | $ | — | | | $ | — | | | $ | — | | | $ | — | | | $ | 319 | | | $ | — | |
| Class I Shares | | | 31 | | | | — | | | | — | | | | — | | | | — | | | | — | | | | — | | | | — | | | | 31 | | | | — | |
| Amount | | $ | 312 | | | $ | — | | | $ | — | | | $ | — | | | $ | — | | | $ | — | | | $ | — | | | $ | — | | | $ | 312 | | | $ | — | |
| Class R3 Shares | | | 30 | | | | — | | | | — | | | | — | | | | — | | | | — | | | | — | | | | — | | | | 30 | | | | — | |
| Amount | | $ | 300 | | | $ | — | | | $ | — | | | $ | — | | | $ | — | | | $ | — | | | $ | — | | | $ | — | | | $ | 300 | | | $ | — | |
| Class R4 Shares | | | 30 | | | | — | | | | — | | | | — | | | | — | | | | — | | | | — | | | | — | | | | 30 | | | | — | |
| Amount | | $ | 300 | | | $ | — | | | $ | — | | | $ | — | | | $ | — | | | $ | — | | | $ | — | | | $ | — | | | $ | 300 | | | $ | — | |
| Class R5 Shares | | | 30 | | | | — | | | | — | | | | — | | | | — | | | | — | | | | — | | | | — | | | | 30 | | | | — | |
| Amount | | $ | 300 | | | $ | — | | | $ | — | | | $ | — | | | $ | — | | | $ | — | | | $ | — | | | $ | — | | | $ | 300 | | | $ | — | |
| Class Y Shares | | | 30 | | | | — | | | | — | | | | — | | | | — | | | | — | | | | — | | | | — | | | | 30 | | | | — | |
| Amount | | $ | 300 | | | $ | — | | | $ | — | | | $ | — | | | $ | — | | | $ | — | | | $ | — | | | $ | — | | | $ | 300 | | | $ | — | |
| Global Financial Services Fund: | | | | | | | | | | | | | | | | | | | | | | | | | | | | | | | | | | | | | | | | |
| Class A Shares | | | 1,473 | | | | 890 | | | | 259 | | | | 101 | | | | (933 | ) | | | (791 | ) | | | — | | | | — | | | | 799 | | | | 200 | |
| Amount | | $ | 15,502 | | | $ | 12,151 | | | $ | 2,953 | | | $ | 1,348 | | | $ | (9,224 | ) | | $ | (11,136 | ) | | $ | — | | | $ | — | | | $ | 9,231 | | | $ | 2,363 | |
| Class B Shares | | | 68 | | | | 32 | | | | 37 | | | | 18 | | | | (40 | ) | | | (55 | ) | | | — | | | | — | | | | 65 | | | | (5 | ) |
| Amount | | $ | 677 | | | $ | 445 | | | $ | 417 | | | $ | 232 | | | $ | (423 | ) | | $ | (746 | ) | | $ | — | | | $ | — | | | $ | 671 | | | $ | (69 | ) |
| Class C Shares | | | 261 | | | | 135 | | | | 52 | | | | 19 | | | | (80 | ) | | | (77 | ) | | | — | | | | — | | | | 233 | | | | 77 | |
| Amount | | $ | 2,677 | | | $ | 1,789 | | | $ | 582 | | | $ | 254 | | | $ | (844 | ) | | $ | (1,036 | ) | | $ | — | | | $ | — | | | $ | 2,415 | | | $ | 1,007 | |
| Class Y Shares | | | 51 | | | | 57 | | | | 16 | | | | 5 | | | | (15 | ) | | | (23 | ) | | | — | | | | — | | | | 52 | | | | 39 | |
| Amount | | $ | 520 | | | $ | 792 | | | $ | 189 | | | $ | 67 | | | $ | (154 | ) | | $ | (325 | ) | | $ | — | | | $ | — | | | $ | 555 | | | $ | 534 | |
| Global Growth Fund: | | | | | | | | | | | | | | | | | | | | | | | | | | | | | | | | | | | | | | | | |
| Class A Shares | | | 1,672 | | | | 1,845 | | | | 2,438 | | | | 1,100 | | | | (2,010 | ) | | | (4,813 | ) | | | — | | | | — | | | | 2,100 | | | | (1,868 | ) |
| Amount | | $ | 32,646 | | | $ | 38,457 | | | $ | 50,713 | | | $ | 20,507 | | | $ | (38,931 | ) | | $ | (98,382 | ) | | $ | — | | | $ | — | | | $ | 44,428 | | | $ | (39,418 | ) |
| Class B Shares | | | 130 | | | | 168 | | | | 457 | | | | 223 | | | | (850 | ) | | | (1,104 | ) | | | — | | | | — | | | | (263 | ) | | | (713 | ) |
| Amount | | $ | 2,354 | | | $ | 3,238 | | | $ | 8,763 | | | $ | 3,904 | | | $ | (14,985 | ) | | $ | (21,185 | ) | | $ | — | | | $ | — | | | $ | (3,868 | ) | | $ | (14,043 | ) |
| Class C Shares | | | 137 | | | | 189 | | | | 419 | | | | 190 | | | | (309 | ) | | | (752 | ) | | | — | | | | — | | | | 247 | | | | (373 | ) |
| Amount | | $ | 2,552 | | | $ | 3,679 | | | $ | 8,095 | | | $ | 3,337 | | | $ | (5,600 | ) | | $ | (14,385 | ) | | $ | — | | | $ | — | | | $ | 5,047 | | | $ | (7,369 | ) |
| Class R3 Shares | | | — | | | | 1 | | | | — | | | | — | | | | — | | | | — | | | | — | | | | — | | | | — | | | | 1 | |
| Amount | | $ | 7 | | | $ | 10 | | | $ | 1 | | | $ | — | | | $ | — | | | $ | — | | | $ | — | | | $ | — | | | $ | 8 | | | $ | 10 | |
| Class R4 Shares | | | 26 | | | | 1 | | | | — | | | | — | | | | (26 | ) | | | — | | | | — | | | | — | | | | — | | | | 1 | |
| Amount | | $ | 515 | | | $ | 10 | | | $ | 1 | | | $ | — | | | $ | (500 | ) | | $ | — | | | $ | — | | | $ | — | | | $ | 16 | | | $ | 10 | |
| Class R5 Shares | | | — | | | | 1 | | | | — | | | | — | | | | — | | | | — | | | | — | | | | — | | | | — | | | | 1 | |
| Amount | | $ | 10 | | | $ | 10 | | | $ | 1 | | | $ | — | | | $ | — | | | $ | — | | | $ | — | | | $ | — | | | $ | 11 | | | $ | 10 | |
| Class Y Shares | | | 561 | | | | 1,350 | | | | 907 | | | | 457 | | | | (99 | ) | | | (2,728 | ) | | | — | | | | — | | | | 1,369 | | | | (921 | ) |
| Amount | | $ | 11,224 | | | $ | 27,583 | | | $ | 19,921 | | | $ | 8,887 | | | $ | (2,021 | ) | | $ | (62,533 | ) | | $ | — | | | $ | — | | | $ | 29,124 | | | $ | (26,063 | ) |
| Global Health Fund: | | | | | | | | | | | | | | | | | | | | | | | | | | | | | | | | | | | | | | | | |
| Class A Shares | | | 3,218 | | | | 10,768 | | | | 1,677 | | | | 732 | | | | (4,864 | ) | | | (5,226 | ) | | | — | | | | — | | | | 31 | | | | 6,274 | |
| Amount | | $ | 53,263 | | | $ | 194,696 | | | $ | 28,816 | | | $ | 12,317 | | | $ | (79,517 | ) | | $ | (94,560 | ) | | $ | — | | | $ | — | | | $ | 2,562 | | | $ | 112,453 | |
| Class B Shares | | | 215 | | | | 598 | | | | 351 | | | | 189 | | | | (513 | ) | | | (857 | ) | | | — | | | | — | | | | 53 | | | | (70 | ) |
| Amount | | $ | 3,360 | | | $ | 10,244 | | | $ | 5,622 | | | $ | 3,013 | | | $ | (7,838 | ) | | $ | (14,588 | ) | | $ | — | | | $ | — | | | $ | 1,144 | | | $ | (1,331 | ) |
367
The Hartford Mutual Funds, Inc. and The Hartford Mutual Funds II, Inc.
Notes to Financial Statements — (continued)
April 30, 2008 (Unaudited)
(000’s Omitted)
| | | | | | | | | | | | | | | | | | | | | | | | | | | | | | | | | | | | | | | | | |
| | | | | | Shares Issued for
| | | | | | Shares Issued
| | | Net Increase
| |
| | | Shares Sold | | | Reinvested Dividends | | | Shares Redeemed | | | from Merger | | | (Decrease) of Shares | |
| | | 2008 | | | 2007 | | | 2008 | | | 2007 | | | 2008 | | | 2007 | | | 2008 | | | 2007 | | | 2008 | | | 2007 | |
| |
Global Health Fund: — (continued) |
| Class C Shares | | | 787 | | | | 2,773 | | | | 515 | | | | 214 | | | | (704 | ) | | | (1,031 | ) | | | — | | | | — | | | | 598 | | | | 1,956 | |
| Amount | | $ | 12,279 | | | $ | 47,545 | | | $ | 8,271 | | | $ | 3,401 | | | $ | (10,739 | ) | | $ | (17,574 | ) | | $ | — | | | $ | — | | | $ | 9,811 | | | $ | 33,372 | |
| Class I Shares | | | 773 | | | | 1,129 | | | | 49 | | | | 2 | | | | (532 | ) | | | (383 | ) | | | — | | | | — | | | | 290 | | | | 748 | |
| Amount | | $ | 13,363 | | | $ | 20,456 | | | $ | 851 | | | $ | 27 | | | $ | (8,463 | ) | | $ | (6,861 | ) | | $ | — | | | $ | — | | | $ | 5,751 | | | $ | 13,622 | |
| Class R3 Shares | | | 1 | | | | 6 | | | | 1 | | | | — | | | | (1 | ) | | | — | | | | — | | | | — | | | | 1 | | | | 6 | |
| Amount | | $ | 22 | | | $ | 111 | | | $ | 7 | | | $ | — | | | $ | (13 | ) | | $ | — | | | $ | — | | | $ | — | | | $ | 16 | | | $ | 111 | |
| Class R4 Shares | | | 151 | | | | 25 | | | | 2 | | | | — | | | | (6 | ) | | | — | | | | — | | | | — | | | | 147 | | | | 25 | |
| Amount | | $ | 2,594 | | | $ | 489 | | | $ | 36 | | | $ | — | | | $ | (105 | ) | | $ | (8 | ) | | $ | — | | | $ | — | | | $ | 2,525 | | | $ | 481 | |
| Class R5 Shares | | | 75 | | | | 22 | | | | 1 | | | | — | | | | (12 | ) | | | — | | | | — | | | | — | | | | 64 | | | | 22 | |
| Amount | | $ | 1,331 | | | $ | 439 | | | $ | 26 | | | $ | — | | | $ | (213 | ) | | $ | — | | | $ | — | | | $ | — | | | $ | 1,144 | | | $ | 439 | |
| Class Y Shares | | | 24 | | | | 30 | | | | 777 | | | | 405 | | | | (24 | ) | | | (20 | ) | | | — | | | | — | | | | 777 | | | | 415 | |
| Amount | | $ | 432 | | | $ | 569 | | | $ | 14,028 | | | $ | 7,106 | | | $ | (425 | ) | | $ | (371 | ) | | $ | — | | | $ | — | | | $ | 14,035 | | | $ | 7,304 | |
| Global Technology Fund: | | | | | | | | | | | | | | | | | | | | | | | | | | | | | | | | | | | | | | | | |
| Class A Shares | | | 692 | | | | 2,277 | | | | — | | | | — | | | | (1,503 | ) | | | (1,706 | ) | | | — | | | | — | | | | (811 | ) | | | 571 | |
| Amount | | $ | 4,355 | | | $ | 14,990 | | | $ | — | | | $ | — | | | $ | (9,364 | ) | | $ | (10,548 | ) | | $ | — | | | $ | — | | | $ | (5,009 | ) | | $ | 4,442 | |
| Class B Shares | | | 119 | | | | 255 | | | | — | | | | — | | | | (264 | ) | | | (486 | ) | | | — | | | | — | | | | (145 | ) | | | (231 | ) |
| Amount | | $ | 695 | | | $ | 1,555 | | | $ | — | | | $ | — | | | $ | (1,507 | ) | | $ | (2,890 | ) | | $ | — | | | $ | — | | | $ | (812 | ) | | $ | (1,335 | ) |
| Class C Shares | | | 140 | | | | 568 | | | | — | | | | — | | | | (202 | ) | | | (437 | ) | | | — | | | | — | | | | (62 | ) | | | 131 | |
| Amount | | $ | 815 | | | $ | 3,457 | | | $ | — | | | $ | — | | | $ | (1,134 | ) | | $ | (2,577 | ) | | $ | — | | | $ | — | | | $ | (319 | ) | | $ | 880 | |
| Class Y Shares | | | 82 | | | | 221 | | | | — | | | | — | | | | (168 | ) | | | (52 | ) | | | — | | | | — | | | | (86 | ) | | | 169 | |
| Amount | | $ | 522 | | | $ | 1,436 | | | $ | — | | | $ | — | | | $ | (1,061 | ) | | $ | (326 | ) | | $ | — | | | $ | — | | | $ | (539 | ) | | $ | 1,110 | |
| Growth Allocation Fund: | | | | | | | | | | | | | | | | | | | | | | | | | | | | | | | | | | | | | | | | |
| Class A Shares | | | 4,171 | | | | 9,767 | | | | 3,356 | | | | 1,184 | | | | (3,270 | ) | | | (5,479 | ) | | | — | | | | — | | | | 4,257 | | | | 5,472 | |
| Amount | | $ | 51,407 | | | $ | 128,577 | | | $ | 43,714 | | | $ | 14,829 | | | $ | (40,155 | ) | | $ | (72,798 | ) | | $ | — | | | $ | — | | | $ | 54,966 | | | $ | 70,608 | |
| Class B Shares | | | 1,000 | | | | 2,233 | | | | 883 | | | | 297 | | | | (832 | ) | | | (1,149 | ) | | | — | | | | — | | | | 1,051 | | | | 1,381 | |
| Amount | | $ | 12,295 | | | $ | 29,169 | | | $ | 11,427 | | | $ | 3,694 | | | $ | (10,085 | ) | | $ | (15,130 | ) | | $ | — | | | $ | — | | | $ | 13,637 | | | $ | 17,733 | |
| Class C Shares | | | 2,435 | | | | 4,655 | | | | 1,351 | | | | 452 | | | | (2,196 | ) | | | (2,909 | ) | | | — | | | | — | | | | 1,590 | | | | 2,198 | |
| Amount | | $ | 29,790 | | | $ | 60,997 | | | $ | 17,474 | | | $ | 5,620 | | | $ | (26,558 | ) | | $ | (37,965 | ) | | $ | — | | | $ | — | | | $ | 20,706 | | | $ | 28,652 | |
| Class I Shares | | | 55 | | | | 56 | | | | 6 | | | | — | | | | (10 | ) | | | (2 | ) | | | — | | | | — | | | | 51 | | | | 54 | |
| Amount | | $ | 652 | | | $ | 719 | | | $ | 75 | | | $ | 5 | | | $ | (121 | ) | | $ | (22 | ) | | $ | — | | | $ | — | | | $ | 606 | | | $ | 702 | |
| Class R3 Shares | | | 1 | | | | 4 | | | | — | | | | — | | | | — | | | | — | | | | — | | | | — | | | | 1 | | | | 4 | |
| Amount | | $ | 13 | | | $ | 52 | | | $ | 5 | | | $ | — | | | $ | — | | | $ | (2 | ) | | $ | — | | | $ | — | | | $ | 18 | | | $ | 50 | |
| Class R4 Shares | | | 479 | | | | 22 | | | | 9 | | | | — | | | | (91 | ) | | | — | | | | — | | | | — | | | | 397 | | | | 22 | |
| Amount | | $ | 5,942 | | | $ | 308 | | | $ | 120 | | | $ | — | | | $ | (1,095 | ) | | $ | — | | | $ | — | | | $ | — | | | $ | 4,967 | | | $ | 308 | |
| Class R5 Shares | | | 113 | | | | 54 | | | | 5 | | | | — | | | | (23 | ) | | | — | | | | — | | | | — | | | | 95 | | | | 54 | |
| Amount | | $ | 1,331 | | | $ | 757 | | | $ | 65 | | | $ | — | | | $ | (288 | ) | | $ | — | | | $ | — | | | $ | — | | | $ | 1,108 | | | $ | 757 | |
Growth Fund: | | | | | | | | | | | | | | | | | | | | | | | | | | | | | | | | | | | | | | | | |
| Class A Shares | | | 3,175 | | | | 7,305 | | | | 2,200 | | | | 2,346 | | | | (5,427 | ) | | | (18,446 | ) | | | — | | | | — | | | | (52 | ) | | | (8,795 | ) |
| Amount | | $ | 55,595 | | | $ | 133,123 | | | $ | 40,350 | | | $ | 40,196 | | | $ | (93,042 | ) | | $ | (338,568 | ) | | $ | — | | | $ | — | | | $ | 2,903 | | | $ | (165,249 | ) |
| Class B Shares | | | 111 | | | | 171 | | | | 209 | | | | 216 | | | | (302 | ) | | | (848 | ) | | | — | | | | — | | | | 18 | | | | (461 | ) |
| Amount | | $ | 1,672 | | | $ | 2,712 | | | $ | 3,267 | | | $ | 3,228 | | | $ | (4,473 | ) | | $ | (13,490 | ) | | $ | — | | | $ | — | | | $ | 466 | | | $ | (7,550 | ) |
| Class C Shares | | | 578 | | | | 900 | | | | 383 | | | | 377 | | | | (557 | ) | | | (1,899 | ) | | | — | | | | — | | | | 404 | | | | (622 | ) |
| Amount | | $ | 8,801 | | | $ | 14,420 | | | $ | 6,019 | | | $ | 5,646 | | | $ | (8,259 | ) | | $ | (30,311 | ) | | $ | — | | | $ | — | | | $ | 6,561 | | | $ | (10,245 | ) |
| Class H Shares | | | — | | | | 13 | | | | — | | | | 79 | | | | — | | | | (91 | ) | | | — | | | | (929 | ) | | | — | | | | (928 | ) |
| Amount | | $ | — | | | $ | 206 | | | $ | — | | | $ | 1,195 | | | $ | — | | | $ | (1,416 | ) | | $ | — | | | $ | (30,962 | ) | | $ | — | | | $ | (30,977 | ) |
| Class I Shares | | | 591 | | | | 1,763 | | | | 142 | | | | 69 | | | | (311 | ) | | | (269 | ) | | | — | | | | — | | | | 422 | | | | 1,563 | |
| Amount | | $ | 10,360 | | | $ | 32,846 | | | $ | 2,622 | | | $ | 1,183 | | | $ | (5,381 | ) | | $ | (5,102 | ) | | $ | — | | | $ | — | | | $ | 7,601 | | | $ | 28,927 | |
| Class L Shares | | | 160 | | | | 334 | | | | 1,205 | | | | 1,038 | | | | (1,078 | ) | | | (2,977 | ) | | | — | | | | 1,875 | | | | 287 | | | | 270 | |
| Amount | | $ | 2,839 | | | $ | 6,186 | | | $ | 22,498 | | | $ | 18,026 | | | $ | (19,128 | ) | | $ | (55,354 | ) | | $ | — | | | $ | 65,128 | | | $ | 6,209 | | | $ | 33,986 | |
| Class M Shares | | | — | | | | 19 | | | | — | | | | 83 | | | | — | | | | (87 | ) | | | — | | | | (987 | ) | | | — | | | | (972 | ) |
| Amount | | $ | — | | | $ | 303 | | | $ | — | | | $ | 1,257 | | | $ | — | | | $ | (1,381 | ) | | $ | — | | | $ | (26,545 | ) | | $ | — | | | $ | (26,366 | ) |
| Class N Shares | | | — | | | | 3 | | | | — | | | | 20 | | | | — | | | | (15 | ) | | | — | | | | (241 | ) | | | — | | | | (233 | ) |
| Amount | | $ | — | | | $ | 50 | | | $ | — | | | $ | 299 | | | $ | — | | | $ | (231 | ) | | $ | — | | | $ | (7,621 | ) | | $ | — | | | $ | (7,503 | ) |
| Class R3 Shares | | | — | | | | 1 | | | | — | | | | — | | | | — | | | | — | | | | — | | | | — | | | | — | | | | 1 | |
| Amount | | $ | 3 | | | $ | 14 | | | $ | 1 | | | $ | — | | | $ | — | | | $ | — | | | $ | — | | | $ | — | | | $ | 4 | | | $ | 14 | |
| Class R4 Shares | | | 79 | | | | 13 | | | | 1 | | | | — | | | | (6 | ) | | | — | | | | — | | | | — | | | | 74 | | | | 13 | |
| Amount | | $ | 1,414 | | | $ | 262 | | | $ | 21 | | | $ | — | | | $ | (100 | ) | | $ | — | | | $ | — | | | $ | — | | | $ | 1,335 | | | $ | 262 | |
| Class R5 Shares | | | 2 | | | | 3 | | | | — | | | | — | | | | (1 | ) | | | — | | | | — | | | | — | | | | 1 | | | | 3 | |
| Amount | | $ | 37 | | | $ | 56 | | | $ | 5 | | | $ | — | | | $ | (18 | ) | | $ | — | | | $ | — | | | $ | — | | | $ | 24 | | | $ | 56 | |
| Class Y Shares | | | 1,723 | | | | 600 | | | | 392 | | | | 430 | | | | (302 | ) | | | (3,230 | ) | | | — | | | | — | | | | 1,813 | | | | (2,200 | ) |
| Amount | | $ | 29,962 | | | $ | 11,539 | | | $ | 7,436 | | | $ | 7,557 | | | $ | (5,409 | ) | | $ | (59,737 | ) | | $ | — | | | $ | — | | | $ | 31,989 | | | $ | (40,641 | ) |
368
| | | | | | | | | | | | | | | | | | | | | | | | | | | | | | | | | | | | | | | | | |
| | | | | | Shares Issued for
| | | | | | Shares Issued
| | | Net Increase
| |
| | | Shares Sold | | | Reinvested Dividends | | | Shares Redeemed | | | from Merger | | | (Decrease) of Shares | |
| | | 2008 | | | 2007 | | | 2008 | | | 2007 | | | 2008 | | | 2007 | | | 2008 | | | 2007 | | | 2008 | | | 2007 | |
| |
Growth Fund: — (continued) |
| Growth Opportunities Fund: | | | | | | | | | | | | | | | | | | | | | | | | | | | | | | | | | | | | | | | | |
| Class A Shares | | | 32,832 | | | | 15,381 | | | | 2,211 | | | | 578 | | | | (8,668 | ) | | | (4,396 | ) | | | — | | | | — | | | | 26,375 | | | | 11,563 | |
| Amount | | $ | 958,521 | | | $ | 516,607 | | | $ | 70,296 | | | $ | 15,959 | | | $ | (254,697 | ) | | $ | (143,491 | ) | | $ | — | | | $ | — | | | $ | 774,120 | | | $ | 389,075 | |
| Class B Shares | | | 684 | | | | 556 | | | | 268 | | | | 115 | | | | (232 | ) | | | (255 | ) | | | — | | | | — | | | | 720 | | | | 416 | |
| Amount | | $ | 17,145 | | | $ | 15,785 | | | $ | 6,998 | | | $ | 2,687 | | | $ | (5,690 | ) | | $ | (6,754 | ) | | $ | — | | | $ | — | | | $ | 18,453 | | | $ | 11,718 | |
| Class C Shares | | | 6,591 | | | | 4,662 | | | | 730 | | | | 147 | | | | (1,028 | ) | | | (449 | ) | | | — | | | | — | | | | 6,293 | | | | 4,360 | |
| Amount | | $ | 166,829 | | | $ | 135,776 | | | $ | 19,107 | | | $ | 3,440 | | | $ | (25,567 | ) | | $ | (11,927 | ) | | $ | — | | | $ | — | | | $ | 160,369 | | | $ | 127,289 | |
| Class H Shares | | | — | | | | 20 | | | | — | | | | 116 | | | | — | | | | (111 | ) | | | — | | | | (1,339 | ) | | | — | | | | (1,314 | ) |
| Amount | | $ | — | | | $ | 491 | | | $ | — | | | $ | 2,764 | | | $ | — | | | $ | (2,756 | ) | | $ | — | | | $ | (56,180 | ) | | $ | — | | | $ | (55,681 | ) |
| Class I Shares | | | 3,248 | | | | 1,087 | | | | 140 | | | | — | | | | (465 | ) | | | (31 | ) | | | — | | | | — | | | | 2,923 | | | | 1,056 | |
| Amount | | $ | 97,897 | | | $ | 38,286 | | | $ | 4,469 | | | $ | 6 | | | $ | (13,681 | ) | | $ | (1,089 | ) | | $ | — | | | $ | — | | | $ | 88,685 | | | $ | 37,203 | |
| Class L Shares | | | 189 | | | | 420 | | | | 2,666 | | | | 1,407 | | | | (1,196 | ) | | | (2,762 | ) | | | — | | | | 2,047 | | | | 1,659 | | | | 1,112 | |
| Amount | | $ | 5,693 | | | $ | 13,195 | | | $ | 86,483 | | | $ | 39,412 | | | $ | (36,512 | ) | | $ | (87,707 | ) | | $ | — | | | $ | 96,854 | | | $ | 55,664 | | | $ | 61,754 | |
| Class M Shares | | | — | | | | 17 | | | | — | | | | 73 | | | | — | | | | (59 | ) | | | — | | | | (858 | ) | | | — | | | | (827 | ) |
| Amount | | $ | — | | | $ | 403 | | | $ | — | | | $ | 1,744 | | | $ | — | | | $ | (1,455 | ) | | $ | — | | | $ | (32,158 | ) | | $ | — | | | $ | (31,466 | ) |
| Class N Shares | | | — | | | | 5 | | | | — | | | | 18 | | | | — | | | | (12 | ) | | | — | | | | (219 | ) | | | — | | | | (208 | ) |
| Amount | | $ | — | | | $ | 112 | | | $ | — | | | $ | 434 | | | $ | — | | | $ | (278 | ) | | $ | — | | | $ | (8,516 | ) | | $ | — | | | $ | (8,248 | ) |
| Class R3 Shares | | | 151 | | | | 8 | | | | 1 | | | | — | | | | (6 | ) | | | — | | | | — | | | | — | | | | 146 | | | | 8 | |
| Amount | | $ | 4,549 | | | $ | 284 | | | $ | 36 | | | $ | — | | | $ | (191 | ) | | $ | — | | | $ | — | | | $ | — | | | $ | 4,394 | | | $ | 284 | |
| Class R4 Shares | | | 353 | | | | 87 | | | | 14 | | | | — | | | | (10 | ) | | | — | | | | — | | | | — | | | | 357 | | | | 87 | |
| Amount | | $ | 10,757 | | | $ | 3,230 | | | $ | 457 | | | $ | — | | | $ | (291 | ) | | $ | — | | | $ | — | | | $ | — | | | $ | 10,923 | | | $ | 3,230 | |
| Class R5 Shares | | | 28 | | | | 3 | | | | — | | | | — | | | | (1 | ) | | | (1 | ) | | | — | | | | — | | | | 27 | | | | 2 | |
| Amount | | $ | 835 | | | $ | 90 | | | $ | 10 | | | $ | — | | | $ | (28 | ) | | $ | (23 | ) | | $ | — | | | $ | — | | | $ | 817 | | | $ | 67 | |
| Class Y Shares | | | 1,062 | | | | 1,097 | | | | 428 | | | | 134 | | | | (676 | ) | | | (1,420 | ) | | | — | | | | 1,238 | | | | 814 | | | | 1,049 | |
| Amount | | $ | 32,701 | | | $ | 35,903 | | | $ | 14,116 | | | $ | 3,797 | | | $ | (21,674 | ) | | $ | (43,801 | ) | | $ | — | | | $ | 44,879 | | | $ | 25,143 | | | $ | 40,778 | |
| Class Z Shares | | | — | | | | 5 | | | | — | | | | 79 | | | | — | | | | (41 | ) | | | — | | | | (1,190 | ) | | | — | | | | (1,147 | ) |
| Amount | | $ | — | | | $ | 139 | | | $ | — | | | $ | 2,327 | | | $ | — | | | $ | (1,256 | ) | | $ | — | | | $ | (44,879 | ) | | $ | — | | | $ | (43,669 | ) |
| High Yield Fund: | | | | | | | | | | | | | | | | | | | | | | | | | | | | | | | | | | | | | | | | |
| Class A Shares | | | 5,111 | | | | 6,317 | | | | 660 | | | | 1,394 | | | | (3,946 | ) | | | (10,077 | ) | | | — | | | | — | | | | 1,825 | | | | (2,366 | ) |
| Amount | | $ | 37,652 | | | $ | 50,836 | | | $ | 4,937 | | | $ | 11,191 | | | $ | (29,772 | ) | | $ | (80,889 | ) | | $ | — | | | $ | — | | | $ | 12,817 | | | $ | (18,862 | ) |
| Class B Shares | | | 179 | | | | 586 | | | | 96 | | | | 205 | | | | (612 | ) | | | (1,493 | ) | | | — | | | | — | | | | (337 | ) | | | (702 | ) |
| Amount | | $ | 1,326 | | | $ | 4,737 | | | $ | 721 | | | $ | 1,641 | | | $ | (4,554 | ) | | $ | (11,969 | ) | | $ | — | | | $ | — | | | $ | (2,507 | ) | | $ | (5,591 | ) |
| Class C Shares | | | 1,325 | | | | 963 | | | | 94 | | | | 194 | | | | (959 | ) | | | (1,773 | ) | | | — | | | | — | | | | 460 | | | | (616 | ) |
| Amount | | $ | 9,799 | | | $ | 7,721 | | | $ | 705 | | | $ | 1,556 | | | $ | (7,188 | ) | | $ | (14,255 | ) | | $ | — | | | $ | — | | | $ | 3,316 | | | $ | (4,978 | ) |
| Class I Shares | | | 10 | | | | 19 | | | | — | | | | — | | | | (16 | ) | | | — | | | | — | | | | — | | | | (6 | ) | | | 19 | |
| Amount | | $ | 74 | | | $ | 150 | | | $ | 3 | | | $ | 1 | | | $ | (115 | ) | | $ | — | | | $ | — | | | $ | — | | | $ | (38 | ) | | $ | 151 | |
| Class R3 Shares | | | 1 | | | | 1 | | | | — | | | | — | | | | — | | | | — | | | | — | | | | — | | | | 1 | | | | 1 | |
| Amount | | $ | 2 | | | $ | 10 | | | $ | — | | | $ | 1 | | | $ | — | | | $ | — | | | $ | — | | | $ | — | | | $ | 2 | | | $ | 11 | |
| Class R4 Shares | | | — | | | | 1 | | | | — | | | | — | | | | — | | | | — | | | | — | | | | — | | | | — | | | | 1 | |
| Amount | | $ | — | | | $ | 10 | | | $ | — | | | $ | 1 | | | $ | — | | | $ | — | | | $ | — | | | $ | — | | | $ | — | | | $ | 11 | |
| Class R5 Shares | | | — | | | | 1 | | | | — | | | | — | | | | — | | | | — | | | | — | | | | — | | | | — | | | | 1 | |
| Amount | | $ | — | | | $ | 10 | | | $ | — | | | $ | 1 | | | $ | — | | | $ | — | | | $ | — | | | $ | — | | | $ | — | | | $ | 11 | |
| Class Y Shares | | | 1,194 | | | | 227 | | | | 39 | | | | 38 | | | | (157 | ) | | | (2,724 | ) | | | — | | | | — | | | | 1,076 | | | | (2,459 | ) |
| Amount | | $ | 8,875 | | | $ | 1,843 | | | $ | 288 | | | $ | 306 | | | $ | (1,137 | ) | | $ | (21,753 | ) | | $ | — | | | $ | — | | | $ | 8,026 | | | $ | (19,604 | ) |
| High Yield Municipal Bond Fund: | | | | | | | | | | | | | | | | | | | | | | | | | | | | | | | | | | | | | | | | |
| Class A Shares | | | 11,635 | | | | 5,215 | | | | 108 | | | | 38 | | | | (3,047 | ) | | | (363 | ) | | | — | | | | — | | | | 8,696 | | | | 4,890 | |
| Amount | | $ | 103,714 | | | $ | 50,395 | | | $ | 957 | | | $ | 360 | | | $ | (27,209 | ) | | $ | (3,468 | ) | | $ | — | | | $ | — | | | $ | 77,462 | | | $ | 47,287 | |
| Class B Shares | | | 238 | | | | 149 | | | | 3 | | | | 1 | | | | (41 | ) | | | (9 | ) | | | — | | | | — | | | | 200 | | | | 141 | |
| Amount | | $ | 2,121 | | | $ | 1,445 | | | $ | 24 | | | $ | 10 | | | $ | (366 | ) | | $ | (80 | ) | | $ | — | | | $ | — | | | $ | 1,779 | | | $ | 1,375 | |
| Class C Shares | | | 4,458 | | | | 1,221 | | | | 25 | | | | 5 | | | | (233 | ) | | | (39 | ) | | | — | | | | — | | | | 4,250 | | | | 1,187 | |
| Amount | | $ | 39,669 | | | $ | 11,736 | | | $ | 215 | | | $ | 48 | | | $ | (2,098 | ) | | $ | (381 | ) | | $ | — | | | $ | — | | | $ | 37,786 | | | $ | 11,403 | |
| Class I Shares | | | 4,074 | | | | 802 | | | | 37 | | | | 4 | | | | (341 | ) | | | (79 | ) | | | — | | | | — | | | | 3,770 | | | | 727 | |
| Amount | | $ | 36,057 | | | $ | 7,656 | | | $ | 323 | | | $ | 42 | | | $ | (3,016 | ) | | $ | (744 | ) | | $ | — | | | $ | — | | | $ | 33,364 | | | $ | 6,954 | |
| Income Allocation Fund: | | | | | | | | | | | | | | | | | | | | | | | | | | | | | | | | | | | | | | | | |
| Class A Shares | | | 1,266 | | | | 1,971 | | | | 85 | | | | 130 | | | | (628 | ) | | | (1,187 | ) | | | — | | | | — | | | | 723 | | | | 914 | |
| Amount | | $ | 12,509 | | | $ | 19,522 | | | $ | 832 | | | $ | 1,280 | | | $ | (6,187 | ) | | $ | (11,711 | ) | | $ | — | | | $ | — | | | $ | 7,154 | | | $ | 9,091 | |
| Class B Shares | | | 144 | | | | 140 | | | | 10 | | | | 17 | | | | (85 | ) | | | (132 | ) | | | — | | | | — | | | | 69 | | | | 25 | |
| Amount | | $ | 1,428 | | | $ | 1,388 | | | $ | 98 | | | $ | 164 | | | $ | (840 | ) | | $ | (1,305 | ) | | $ | — | | | $ | — | | | $ | 686 | | | $ | 247 | |
| Class C Shares | | | 643 | | | | 461 | | | | 17 | | | | 25 | | | | (197 | ) | | | (418 | ) | | | — | | | | — | | | | 463 | | | | 68 | |
| Amount | | $ | 6,339 | | | $ | 4,555 | | | $ | 164 | | | $ | 243 | | | $ | (1,942 | ) | | $ | (4,129 | ) | | $ | — | | | $ | — | | | $ | 4,561 | | | $ | 669 | |
| Class I Shares | | | 25 | | | | 114 | | | | 2 | | | | 2 | | | | (57 | ) | | | (3 | ) | | | — | | | | — | | | | (30 | ) | | | 113 | |
| Amount | | $ | 255 | | | $ | 1,120 | | | $ | 20 | | | $ | 22 | | | $ | (565 | ) | | $ | (28 | ) | | $ | — | | | $ | — | | | $ | (290 | ) | | $ | 1,114 | |
369
The Hartford Mutual Funds, Inc. and The Hartford Mutual Funds II, Inc.
Notes to Financial Statements — (continued)
April 30, 2008 (Unaudited)
(000’s Omitted)
| | | | | | | | | | | | | | | | | | | | | | | | | | | | | | | | | | | | | | | | | |
| | | | | | Shares Issued for
| | | | | | Shares Issued
| | | Net Increase
| |
| | | Shares Sold | | | Reinvested Dividends | | | Shares Redeemed | | | from Merger | | | (Decrease) of Shares | |
| | | 2008 | | | 2007 | | | 2008 | | | 2007 | | | 2008 | | | 2007 | | | 2008 | | | 2007 | | | 2008 | | | 2007 | |
| |
Income Allocation Fund: — (continued) |
| Class R3 Shares | | | 1 | | | | 1 | | | | — | | | | — | | | | — | | | | — | | | | — | | | | — | | | | 1 | | | | 1 | |
| Amount | | $ | 6 | | | $ | 10 | | | $ | — | | | $ | — | | | $ | — | | | $ | — | | | $ | — | | | $ | — | | | $ | 6 | | | $ | 10 | |
| Class R4 Shares | | | 73 | | | | 10 | | | | 1 | | | | — | | | | (32 | ) | | | — | | | | — | | | | — | | | | 42 | | | | 10 | |
| Amount | | $ | 727 | | | $ | 94 | | | $ | 10 | | | $ | 1 | | | $ | (318 | ) | | $ | — | | | $ | — | | | $ | — | | | $ | 419 | | | $ | 95 | |
| Class R5 Shares | | | — | | | | 1 | | | | — | | | | — | | | | — | | | | — | | | | — | | | | — | | | | — | | | | 1 | |
| Amount | | $ | 2 | | | $ | 10 | | | $ | — | | | $ | — | | | $ | — | | | $ | — | | | $ | — | | | $ | — | | | $ | 2 | | | $ | 10 | |
| Income Fund: | | | | | | | | | | | | | | | | | | | | | | | | | | | | | | | | | | | | | | | | |
| Class A Shares | | | 2,863 | | | | 7,126 | | | | 184 | | | | 267 | | | | (1,728 | ) | | | (1,318 | ) | | | — | | | | — | | | | 1,319 | | | | 6,075 | |
| Amount | | $ | 28,544 | | | $ | 73,438 | | | $ | 1,831 | | | $ | 2,725 | | | $ | (17,224 | ) | | $ | (13,491 | ) | | $ | — | | | $ | — | | | $ | 13,151 | | | $ | 62,672 | |
| Class B Shares | | | 218 | | | | 461 | | | | 18 | | | | 32 | | | | (205 | ) | | | (221 | ) | | | — | | | | — | | | | 31 | | | | 272 | |
| Amount | | $ | 2,187 | | | $ | 4,737 | | | $ | 181 | | | $ | 323 | | | $ | (2,047 | ) | | $ | (2,257 | ) | | $ | — | | | $ | — | | | $ | 321 | | | $ | 2,803 | |
| Class C Shares | | | 627 | | | | 1,025 | | | | 20 | | | | 34 | | | | (394 | ) | | | (438 | ) | | | — | | | | — | | | | 253 | | | | 621 | |
| Amount | | $ | 6,273 | | | $ | 10,549 | | | $ | 202 | | | $ | 352 | | | $ | (3,940 | ) | | $ | (4,492 | ) | | $ | — | | | $ | — | | | $ | 2,535 | | | $ | 6,409 | |
| Class Y Shares | | | 989 | | | | 14,767 | | | | 596 | | | | 829 | | | | (1,364 | ) | | | (393 | ) | | | — | | | | — | | | | 221 | | | | 15,203 | |
| Amount | | $ | 9,775 | | | $ | 151,487 | | | $ | 5,935 | | | $ | 8,464 | | | $ | (13,488 | ) | | $ | (4,049 | ) | | $ | — | | | $ | — | | | $ | 2,222 | | | $ | 155,902 | |
| Inflation Plus Fund: | | | | | | | | | | | | | | | | | | | | | | | | | | | | | | | | | | | | | | | | |
| Class A Shares | | | 11,344 | | | | 2,991 | | | | 332 | | | | 522 | | | | (4,193 | ) | | | (13,253 | ) | | | — | | | | — | | | | 7,483 | | | | (9,740 | ) |
| Amount | | $ | 128,034 | | | $ | 31,148 | | | $ | 3,734 | | | $ | 5,450 | | | $ | (47,231 | ) | | $ | (137,831 | ) | | $ | — | | | $ | — | | | $ | 84,537 | | | $ | (101,233 | ) |
| Class B Shares | | | 1,028 | | | | 178 | | | | 90 | | | | 167 | | | | (580 | ) | | | (2,739 | ) | | | — | | | | — | | | | 538 | | | | (2,394 | ) |
| Amount | | $ | 11,587 | | | $ | 1,866 | | | $ | 1,008 | | | $ | 1,735 | | | $ | (6,474 | ) | | $ | (28,480 | ) | | $ | — | | | $ | — | | | $ | 6,121 | | | $ | (24,879 | ) |
| Class C Shares | | | 7,169 | | | | 1,160 | | | | 213 | | | | 358 | | | | (2,042 | ) | | | (10,227 | ) | | | — | | | | — | | | | 5,340 | | | | (8,709 | ) |
| Amount | | $ | 80,679 | | | $ | 12,070 | | | $ | 2,383 | | | $ | 3,723 | | | $ | (22,851 | ) | | $ | (106,192 | ) | | $ | — | | | $ | — | | | $ | 60,211 | | | $ | (90,399 | ) |
| Class I Shares | | | 1,058 | | | | 989 | | | | 13 | | | | 4 | | | | (228 | ) | | | (667 | ) | | | — | | | | — | | | | 843 | | | | 326 | |
| Amount | | $ | 11,921 | | | $ | 10,299 | | | $ | 143 | | | $ | 46 | | | $ | (2,572 | ) | | $ | (6,969 | ) | | $ | — | | | $ | — | | | $ | 9,492 | | | $ | 3,376 | |
| Class R3 Shares | | | 8 | | | | 1 | | | | — | | | | — | | | | — | | | | — | | | | — | | | | — | | | | 8 | | | | 1 | |
| Amount | | $ | 87 | | | $ | 10 | | | $ | 1 | | | $ | — | | | $ | — | | | $ | — | | | $ | — | | | $ | — | | | $ | 88 | | | $ | 10 | |
| Class R4 Shares | | | — | | | | 1 | | | | — | | | | — | | | | — | | | | — | | | | — | | | | — | | | | — | | | | 1 | |
| Amount | | $ | — | | | $ | 10 | | | $ | — | | | $ | — | | | $ | — | | | $ | — | | | $ | — | | | $ | — | | | $ | — | | | $ | 10 | |
| Class R5 Shares | | | — | | | | 1 | | | | — | | | | — | | | | — | | | | — | | | | — | | | | — | | | | — | | | | 1 | |
| Amount | | $ | — | | | $ | 10 | | | $ | — | | | $ | — | | | $ | — | | | $ | — | | | $ | — | | | $ | — | | | $ | — | | | $ | 10 | |
| Class Y Shares | | | 2,379 | | | | 6,291 | | | | 373 | | | | 411 | | | | (744 | ) | | | (4,815 | ) | | | — | | | | — | | | | 2,008 | | | | 1,887 | |
| Amount | | $ | 26,653 | | | $ | 66,154 | | | $ | 4,195 | | | $ | 4,301 | | | $ | (8,429 | ) | | $ | (50,148 | ) | | $ | — | | | $ | — | | | $ | 22,419 | | | $ | 20,307 | |
| International Growth Fund: | | | | | | | | | | | | | | | | | | | | | | | | | | | | | | | | | | | | | | | | |
| Class A Shares | | | 4,438 | | | | 10,801 | | | | 3,405 | | | | 1,390 | | | | (3,069 | ) | | | (3,690 | ) | | | — | | | | — | | | | 4,774 | | | | 8,501 | |
| Amount | | $ | 64,663 | | | $ | 165,526 | | | $ | 53,556 | | | $ | 19,326 | | | $ | (43,089 | ) | | $ | (57,196 | ) | | $ | — | | | $ | — | | | $ | 75,130 | | | $ | 127,656 | |
| Class B Shares | | | 340 | | | | 803 | | | | 432 | | | | 221 | | | | (329 | ) | | | (478 | ) | | | — | | | | — | | | | 443 | | | | 546 | |
| Amount | | $ | 4,673 | | | $ | 11,789 | | | $ | 6,448 | | | $ | 2,963 | | | $ | (4,340 | ) | | $ | (7,160 | ) | | $ | — | | | $ | — | | | $ | 6,781 | | | $ | 7,592 | |
| Class C Shares | | | 623 | | | | 1,020 | | | | 539 | | | | 279 | | | | (508 | ) | | | (659 | ) | | | — | | | | — | | | | 654 | | | | 640 | |
| Amount | | $ | 8,734 | | | $ | 15,136 | | | $ | 8,047 | | | $ | 3,729 | | | $ | (6,756 | ) | | $ | (9,831 | ) | | $ | — | | | $ | — | | | $ | 10,025 | | | $ | 9,034 | |
| Class I Shares | | | 34 | | | | 194 | | | | 22 | | | | — | | | | (35 | ) | | | (7 | ) | | | — | | | | — | | | | 21 | | | | 187 | |
| Amount | | $ | 485 | | | $ | 3,137 | | | $ | 345 | | | $ | 2 | | | $ | (479 | ) | | $ | (116 | ) | | $ | — | | | $ | — | | | $ | 351 | | | $ | 3,023 | |
| Class R3 Shares | | | 12 | | | | 1 | | | | — | | | | — | | | | (1 | ) | | | — | | | | — | | | | — | | | | 11 | | | | 1 | |
| Amount | | $ | 175 | | | $ | 12 | | | $ | 2 | | | $ | — | | | $ | (12 | ) | | $ | — | | | $ | — | | | $ | — | | | $ | 165 | | | $ | 12 | |
| Class R4 Shares | | | 1 | | | | 1 | | | | — | | | | — | | | | — | | | | — | | | | — | | | | — | | | | 1 | | | | 1 | |
| Amount | | $ | 20 | | | $ | 10 | | | $ | 1 | | | $ | — | | | $ | — | | | $ | — | | | $ | — | | | $ | — | | | $ | 21 | | | $ | 10 | |
| Class R5 Shares | | | — | | | | 1 | | | | — | | | | — | | | | — | | | | — | | | | — | | | | — | | | | — | | | | 1 | |
| Amount | | $ | — | | | $ | 10 | | | $ | 2 | | | $ | — | | | $ | — | | | $ | — | | | $ | — | | | $ | — | | | $ | 2 | | | $ | 10 | |
| Class Y Shares | | | 1,923 | | | | 3,602 | | | | 588 | | | | 243 | | | | (340 | ) | | | (4,565 | ) | | | — | | | | — | | | | 2,171 | | | | (720 | ) |
| Amount | | $ | 27,460 | | | $ | 63,866 | | | $ | 9,496 | | | $ | 3,442 | | | $ | (4,858 | ) | | $ | (67,208 | ) | | $ | — | | | $ | — | | | $ | 32,098 | | | $ | 100 | |
| International Opportunities Fund: | | | | | | | | | | | | | | | | | | | | | | | | | | | | | | | | | | | | | | | | |
| Class A Shares | | | 3,300 | | | | 3,166 | | | | 1,985 | | | | 296 | | | | (1,362 | ) | | | (2,252 | ) | | | — | | | | — | | | | 3,923 | | | | 1,210 | |
| Amount | | $ | 55,790 | | | $ | 56,961 | | | $ | 35,697 | | | $ | 4,823 | | | $ | (23,002 | ) | | $ | (40,780 | ) | | $ | — | | | $ | — | | | $ | 68,485 | | | $ | 21,004 | |
| Class B Shares | | | 339 | | | | 369 | | | | 345 | | | | 53 | | | | (455 | ) | | | (500 | ) | | | — | | | | — | | | | 229 | | | | (78 | ) |
| Amount | | $ | 5,336 | | | $ | 6,202 | | | $ | 5,720 | | | $ | 803 | | | $ | (7,008 | ) | | $ | (8,448 | ) | | $ | — | | | $ | — | | | $ | 4,048 | | | $ | (1,443 | ) |
| Class C Shares | | | 878 | | | | 427 | | | | 283 | | | | 37 | | | | (234 | ) | | | (307 | ) | | | — | | | | — | | | | 927 | | | | 157 | |
| Amount | | $ | 13,688 | | | $ | 7,230 | | | $ | 4,645 | | | $ | 563 | | | $ | (3,587 | ) | | $ | (5,077 | ) | | $ | — | | | $ | — | | | $ | 14,746 | | | $ | 2,716 | |
| Class R3 Shares | | | 2 | | | | 1 | | | | 1 | | | | — | | | | — | | | | — | | | | — | | | | — | | | | 3 | | | | 1 | |
| Amount | | $ | 34 | | | $ | 22 | | | $ | 4 | | | $ | — | | | $ | — | | | $ | — | | | $ | — | | | $ | — | | | $ | 38 | | | $ | 22 | |
| Class R4 Shares | | | 4 | | | | 1 | | | | — | | | | — | | | | (1 | ) | | | — | | | | — | | | | — | | | | 3 | | | | 1 | |
| Amount | | $ | 51 | | | $ | 10 | | | $ | 2 | | | $ | — | | | $ | (5 | ) | | $ | — | | | $ | — | | | $ | — | | | $ | 48 | | | $ | 10 | |
| Class R5 Shares | | | — | | | | 1 | | | | — | | | | — | | | | — | | | | — | | | | — | | | | — | | | | — | | | | 1 | |
| Amount | | $ | — | | | $ | 10 | | | $ | 2 | | | $ | — | | | $ | — | | | $ | — | | | $ | — | | | $ | — | | | $ | 2 | | | $ | 10 | |
370
| | | | | | | | | | | | | | | | | | | | | | | | | | | | | | | | | | | | | | | | | |
| | | | | | Shares Issued for
| | | | | | Shares Issued
| | | Net Increase
| |
| | | Shares Sold | | | Reinvested Dividends | | | Shares Redeemed | | | from Merger | | | (Decrease) of Shares | |
| | | 2008 | | | 2007 | | | 2008 | | | 2007 | | | 2008 | | | 2007 | | | 2008 | | | 2007 | | | 2008 | | | 2007 | |
| |
International Opportunities Fund: — (continued) |
| Class Y Shares | | | 962 | | | | 3,199 | | | | 1,024 | | | | 172 | | | | (45 | ) | | | (347 | ) | | | — | | | | — | | | | 1,941 | | | | 3,024 | |
| Amount | | $ | 17,301 | | | $ | 53,504 | | | $ | 19,073 | | | $ | 2,916 | | | $ | (796 | ) | | $ | (6,258 | ) | | $ | — | | | $ | — | | | $ | 35,578 | | | $ | 50,162 | |
| International Small Company Fund: | | | | | | | | | | | | | | | | | | | | | | | | | | | | | | | | | | | | | | | | |
| Class A Shares | | | 1,942 | | | | 5,567 | | | | 1,057 | | | | 613 | | | | (2,942 | ) | | | (1,981 | ) | | | — | | | | — | | | | 57 | | | | 4,199 | |
| Amount | | $ | 26,844 | | | $ | 89,909 | | | $ | 15,812 | | | $ | 8,847 | | | $ | (40,390 | ) | | $ | (32,036 | ) | | $ | — | | | $ | — | | | $ | 2,266 | | | $ | 66,720 | |
| Class B Shares | | | 98 | | | | 437 | | | | 150 | | | | 109 | | | | (208 | ) | | | (179 | ) | | | — | | | | — | | | | 40 | | | | 367 | |
| Amount | | $ | 1,358 | | | $ | 6,793 | | | $ | 2,156 | | | $ | 1,512 | | | $ | (2,710 | ) | | $ | (2,811 | ) | | $ | — | | | $ | — | | | $ | 804 | | | $ | 5,494 | |
| Class C Shares | | | 219 | | | | 1,032 | | | | 231 | | | | 162 | | | | (466 | ) | | | (458 | ) | | | — | | | | — | | | | (16 | ) | | | 736 | |
| Amount | | $ | 2,965 | | | $ | 16,059 | | | $ | 3,279 | | | $ | 2,221 | | | $ | (6,069 | ) | | $ | (7,108 | ) | | $ | — | | | $ | — | | | $ | 175 | | | $ | 11,172 | |
| Class I Shares | | | 33 | | | | 10 | | | | 2 | | | | — | | | | (3 | ) | | | — | | | | — | | | | — | | | | 32 | | | | 10 | |
| Amount | | $ | 454 | | | $ | 161 | | | $ | 29 | | | $ | — | | | $ | (34 | ) | | $ | — | | | $ | — | | | $ | — | | | $ | 449 | | | $ | 161 | |
| Class Y Shares | | | 1,297 | | | | 2,568 | | | | 1,072 | | | | 851 | | | | (468 | ) | | | (1,464 | ) | | | — | | | | — | | | | 1,901 | | | | 1,955 | |
| Amount | | $ | 18,111 | | | $ | 39,453 | | | $ | 16,243 | | | $ | 12,445 | | | $ | (6,223 | ) | | $ | (22,682 | ) | | $ | — | | | $ | — | | | $ | 28,131 | | | $ | 29,216 | |
| LargeCap Growth Fund: | | | | | | | | | | | | | | | | | | | | | | | | | | | | | | | | | | | | | | | | |
| Class A Shares | | | 61 | | | | 1,039 | | | | 19 | | | | 1 | | | | (30 | ) | | | (14 | ) | | | — | | | | — | | | | 50 | | | | 1,026 | |
| Amount | | $ | 607 | | | $ | 10,441 | | | $ | 195 | | | $ | 12 | | | $ | (294 | ) | | $ | (148 | ) | | $ | — | | | $ | — | | | $ | 508 | | | $ | 10,305 | |
| Class B Shares | | | 10 | | | | 33 | | | | 1 | | | | — | | | | (2 | ) | | | — | | | | — | | | | — | | | | 9 | | | | 33 | |
| Amount | | $ | 96 | | | $ | 334 | | | $ | 6 | | | $ | — | | | $ | (14 | ) | | $ | (3 | ) | | $ | — | | | $ | — | | | $ | 88 | | | $ | 331 | |
| Class C Shares | | | 31 | | | | 55 | | | | 1 | | | | — | | | | (4 | ) | | | (5 | ) | | | — | | | | — | | | | 28 | | | | 50 | |
| Amount | | $ | 299 | | | $ | 561 | | | $ | 10 | | | $ | — | | | $ | (38 | ) | | $ | (58 | ) | | $ | — | | | $ | — | | | $ | 271 | | | $ | 503 | |
| Class Y Shares | | | — | | | | 10 | | | | — | | | | — | | | | — | | | | — | | | | — | | | | — | | | | — | | | | 10 | |
| Amount | | $ | — | | | $ | 100 | | | $ | 2 | | | $ | — | | | $ | — | | | $ | — | | | $ | — | | | $ | — | | | $ | 2 | | | $ | 100 | |
| MidCap Fund: | | | | | | | | | | | | | | | | | | | | | | | | | | | | | | | | | | | | | | | | |
| Class A Shares | | | 5,571 | | | | 8,999 | | | | 15,211 | | | | 13,077 | | | | (8,246 | ) | | | (12,662 | ) | | | — | | | | — | | | | 12,536 | | | | 9,414 | |
| Amount | | $ | 112,334 | | | $ | 220,455 | | | $ | 326,053 | | | $ | 283,246 | | | $ | (167,329 | ) | | $ | (309,142 | ) | | $ | — | | | $ | — | | | $ | 271,058 | | | $ | 194,559 | |
| Class B Shares | | | 130 | | | | 179 | | | | 3,713 | | | | 3,711 | | | | (3,505 | ) | | | (4,364 | ) | | | — | | | | — | | | | 338 | | | | (474 | ) |
| Amount | | $ | 2,356 | | | $ | 3,829 | | | $ | 70,283 | | | $ | 72,995 | | | $ | (62,859 | ) | | $ | (96,871 | ) | | $ | — | | | $ | — | | | $ | 9,780 | | | $ | (20,047 | ) |
| Class C Shares | | | 204 | | | | 227 | | | | 4,118 | | | | 3,958 | | | | (2,385 | ) | | | (3,794 | ) | | | — | | | | — | | | | 1,937 | | | | 391 | |
| Amount | | $ | 3,742 | | | $ | 4,749 | | | $ | 78,620 | | | $ | 78,338 | | | $ | (43,230 | ) | | $ | (83,792 | ) | | $ | — | | | $ | — | | | $ | 39,132 | | | $ | (705 | ) |
| Class Y Shares | | | 5,380 | | | | 820 | | | | 844 | | | | 1,186 | | | | (1,016 | ) | | | (4,212 | ) | | | — | | | | — | | | | 5,208 | | | | (2,206 | ) |
| Amount | | $ | 115,181 | | | $ | 21,314 | | | $ | 19,579 | | | $ | 27,346 | | | $ | (21,823 | ) | | $ | (111,736 | ) | | $ | — | | | $ | — | | | $ | 112,937 | | | $ | (63,076 | ) |
| MidCap Growth Fund: | | | | | | | | | | | | | | | | | | | | | | | | | | | | | | | | | | | | | | | | |
| Class A Shares | | | 322 | | | | 590 | | | | 248 | | | | 89 | | | | (301 | ) | | | (1,032 | ) | | | 1,423 | | | | — | | | | 1,692 | | | | (353 | ) |
| Amount | | $ | 3,216 | | | $ | 7,136 | | | $ | 2,583 | | | $ | 977 | | | $ | (3,017 | ) | | $ | (12,027 | ) | | $ | 13,927 | | | $ | — | | | $ | 16,709 | | | $ | (3,914 | ) |
| Class B Shares | | | 48 | | | | 88 | | | | 53 | | | | 14 | | | | (68 | ) | | | (75 | ) | | | 62 | | | | — | | | | 95 | | | | 27 | |
| Amount | | $ | 469 | | | $ | 1,049 | | | $ | 542 | | | $ | 150 | | | $ | (651 | ) | | $ | (878 | ) | | $ | 592 | | | $ | — | | | $ | 952 | | | $ | 321 | |
| Class C Shares | | | 70 | | | | 118 | | | | 51 | | | | 14 | | | | (95 | ) | | | (96 | ) | | | 120 | | | | — | | | | 146 | | | | 36 | |
| Amount | | $ | 685 | | | $ | 1,395 | | | $ | 522 | | | $ | 153 | | | $ | (927 | ) | | $ | (1,121 | ) | | $ | 1,147 | | | $ | — | | | $ | 1,427 | | | $ | 427 | |
| Class Y Shares | | | — | | | | 1 | | | | 1 | | | | 55 | | | | — | | | | (2,588 | ) | | | 12 | | | | — | | | | 13 | | | | (2,532 | ) |
| Amount | | $ | — | | | $ | 2 | | | $ | 14 | | | $ | 616 | | | $ | — | | | $ | (29,285 | ) | | $ | 118 | | | $ | — | | | $ | 132 | | | $ | (28,667 | ) |
| MidCap Value Fund: | | | | | | | | | | | | | | | | | | | | | | | | | | | | | | | | | | | | | | | | |
| Class A Shares | | | 202 | | | | 319 | | | | 4,447 | | | | 3,037 | | | | (3,110 | ) | | | (3,261 | ) | | | — | | | | — | | | | 1,539 | | | | 95 | |
| Amount | | $ | 2,106 | | | $ | 4,580 | | | $ | 50,611 | | | $ | 38,842 | | | $ | (32,662 | ) | | $ | (46,879 | ) | | $ | — | | | $ | — | | | $ | 20,055 | | | $ | (3,457 | ) |
| Class B Shares | | | 39 | | | | 57 | | | | 975 | | | | 668 | | | | (715 | ) | | | (847 | ) | | | — | | | | — | | | | 299 | | | | (122 | ) |
| Amount | | $ | 391 | | | $ | 770 | | | $ | 10,316 | | | $ | 8,114 | | | $ | (6,854 | ) | | $ | (11,479 | ) | | $ | — | | | $ | — | | | $ | 3,853 | | | $ | (2,595 | ) |
| Class C Shares | | | 40 | | | | 45 | | | | 979 | | | | 654 | | | | (752 | ) | | | (708 | ) | | | — | | | | — | | | | 267 | | | | (9 | ) |
| Amount | | $ | 414 | | | $ | 582 | | | $ | 10,367 | | | $ | 7,941 | | | $ | (7,230 | ) | | $ | (9,639 | ) | | $ | — | | | $ | — | | | $ | 3,551 | | | $ | (1,116 | ) |
| Class Y Shares | | | 1,102 | | | | 85 | | | | 27 | | | | 155 | | | | (135 | ) | | | (2,186 | ) | | | — | | | | — | | | | 994 | | | | (1,946 | ) |
| Amount | | $ | 12,105 | | | $ | 1,301 | | | $ | 318 | | | $ | 2,054 | | | $ | (1,429 | ) | | $ | (30,826 | ) | | $ | — | | | $ | — | | | $ | 10,994 | | | $ | (27,471 | ) |
| Money Market Fund: | | | | | | | | | | | | | | | | | | | | | | | | | | | | | | | | | | | | | | | | |
| Class A Shares | | | 283,704 | | | | 393,471 | | | | 5,088 | | | | 10,410 | | | | (201,027 | ) | | | (296,601 | ) | | | — | | | | — | | | | 87,765 | | | | 107,280 | |
| Amount | | $ | 283,704 | | | $ | 393,471 | | | $ | 5,088 | | | $ | 10,410 | | | $ | (201,027 | ) | | $ | (296,601 | ) | | $ | — | | | $ | — | | | $ | 87,765 | | | $ | 107,280 | |
| Class B Shares | | | 28,568 | | | | 26,068 | | | | 351 | | | | 892 | | | | (17,768 | ) | | | (25,736 | ) | | | — | | | | — | | | | 11,151 | | | | 1,224 | |
| Amount | | $ | 28,568 | | | $ | 26,068 | | | $ | 351 | | | $ | 892 | | | $ | (17,768 | ) | | $ | (25,736 | ) | | $ | — | | | $ | — | | | $ | 11,151 | | | $ | 1,224 | |
| Class C Shares | | | 122,808 | | | | 105,566 | | | | 915 | | | | 972 | | | | (72,247 | ) | | | (63,960 | ) | | | — | | | | — | | | | 51,476 | | | | 42,578 | |
| Amount | | $ | 122,808 | | | $ | 105,567 | | | $ | 915 | | | $ | 972 | | | $ | (72,247 | ) | | $ | (63,960 | ) | | $ | — | | | $ | — | | | $ | 51,476 | | | $ | 42,579 | |
| Class R3 Shares | | | 19 | | | | 10 | | | | — | | | | — | | | | (15 | ) | | | — | | | | — | | | | — | | | | 4 | | | | 10 | |
| Amount | | $ | 19 | | | $ | 10 | | | $ | — | | | $ | — | | | $ | (15 | ) | | $ | — | | | $ | — | | | $ | — | | | $ | 4 | | | $ | 10 | |
| Class R4 Shares | | | 47,623 | | | | 20,222 | | | | 552 | | | | 81 | | | | (3,030 | ) | | | (3,064 | ) | | | — | | | | — | | | | 45,145 | | | | 17,239 | |
| Amount | | $ | 47,623 | | | $ | 20,222 | | | $ | 552 | | | $ | 81 | | | $ | (3,030 | ) | | $ | (3,064 | ) | | $ | — | | | $ | — | | | $ | 45,145 | | | $ | 17,239 | |
| Class R5 Shares | | | 7,209 | | | | 1,339 | | | | 47 | | | | 5 | | | | (963 | ) | | | (115 | ) | | | — | | | | — | | | | 6,293 | | | | 1,229 | |
| Amount | | $ | 7,209 | | | $ | 1,339 | | | $ | 47 | | | $ | 5 | | | $ | (963 | ) | | $ | (115 | ) | | $ | — | | | $ | — | | | $ | 6,293 | | | $ | 1,229 | |
371
The Hartford Mutual Funds, Inc. and The Hartford Mutual Funds II, Inc.
Notes to Financial Statements — (continued)
April 30, 2008 (Unaudited)
(000’s Omitted)
| | | | | | | | | | | | | | | | | | | | | | | | | | | | | | | | | | | | | | | | | |
| | | | | | Shares Issued for
| | | | | | Shares Issued
| | | Net Increase
| |
| | | Shares Sold | | | Reinvested Dividends | | | Shares Redeemed | | | from Merger | | | (Decrease) of Shares | |
| | | 2008 | | | 2007 | | | 2008 | | | 2007 | | | 2008 | | | 2007 | | | 2008 | | | 2007 | | | 2008 | | | 2007 | |
| |
Money Market Fund: — (continued) |
| Class Y Shares | | | 2,420 | | | | 2,384 | | | | 58 | | | | 175 | | | | (1,435 | ) | | | (13,480 | ) | | | — | | | | — | | | | 1,043 | | | | (10,921 | ) |
| Amount | | $ | 2,420 | | | $ | 2,384 | | | $ | 58 | | | $ | 175 | | | $ | (1,435 | ) | | $ | (13,481 | ) | | $ | — | | | $ | — | | | $ | 1,043 | | | $ | (10,922 | ) |
| Retirement Income Fund: | | | | | | | | | | | | | | | | | | | | | | | | | | | | | | | | | | | | | | | | |
| Class A Shares | | | 107 | | | | 373 | | | | 13 | | | | 5 | | | | (34 | ) | | | (123 | ) | | | — | | | | — | | | | 86 | | | | 255 | |
| Amount | | $ | 1,027 | | | $ | 3,686 | | | $ | 125 | | | $ | 50 | | | $ | (319 | ) | | $ | (1,213 | ) | | $ | — | | | $ | — | | | $ | 833 | | | $ | 2,523 | |
| Class B Shares | | | 14 | | | | 2 | | | | 1 | | | | 1 | | | | (3 | ) | | | — | | | | — | | | | — | | | | 12 | | | | 3 | |
| Amount | | $ | 130 | | | $ | 30 | | | $ | 9 | | | $ | 5 | | | $ | (27 | ) | | $ | (2 | ) | | $ | — | | | $ | — | | | $ | 112 | | | $ | 33 | |
| Class C Shares | | | 85 | | | | 13 | | | | 1 | | | | 1 | | | | (8 | ) | | | (7 | ) | | | — | | | | — | | | | 78 | | | | 7 | |
| Amount | | $ | 812 | | | $ | 140 | | | $ | 14 | | | $ | 5 | | | $ | (79 | ) | | $ | (72 | ) | | $ | — | | | $ | — | | | $ | 747 | | | $ | 73 | |
| Class R3 Shares | | | 8 | | | | 1 | | | | — | | | | — | | | | — | | | | — | | | | — | | | | — | | | | 8 | | | | 1 | |
| Amount | | $ | 77 | | | $ | 10 | | | $ | 1 | | | $ | — | | | $ | — | | | $ | — | | | $ | — | | | $ | — | | | $ | 78 | | | $ | 10 | |
| Class R4 Shares | | | 150 | | | | 2 | | | | 1 | | | | — | | | | (13 | ) | | | — | | | | — | | | | — | | | | 138 | | | | 2 | |
| Amount | | $ | 1,436 | | | $ | 16 | | | $ | 8 | | | $ | — | | | $ | (126 | ) | | $ | — | | | $ | — | | | $ | — | | | $ | 1,318 | | | $ | 16 | |
| Class R5 Shares | | | 89 | | | | 1 | | | | 1 | | | | — | | | | — | | | | — | | | | — | | | | — | | | | 90 | | | | 1 | |
| Amount | | $ | 857 | | | $ | 10 | | | $ | 9 | | | $ | — | | | $ | (1 | ) | | $ | — | | | $ | — | | | $ | — | | | $ | 865 | | | $ | 10 | |
| Class Y Shares | | | — | | | | — | | | | 1 | | | | — | | | | — | | | | — | | | | — | | | | — | | | | 1 | | | | — | |
| Amount | | $ | — | | | $ | — | | | $ | 5 | | | $ | 4 | | | $ | — | | | $ | — | | | $ | — | | | $ | — | | | $ | 5 | | | $ | 4 | |
| Select MidCap Value Fund: | | | | | | | | | | | | | | | | | | | | | | | | | | | | | | | | | | | | | | | | |
| Class A Shares | | | 358 | | | | 1,595 | | | | 369 | | | | 158 | | | | (1,336 | ) | | | (2,392 | ) | | | — | | | | — | | | | (609 | ) | | | (639 | ) |
| Amount | | $ | 3,472 | | | $ | 20,561 | | | $ | 3,806 | | | $ | 1,909 | | | $ | (12,912 | ) | | $ | (29,814 | ) | | $ | — | | | $ | — | | | $ | (5,634 | ) | | $ | (7,344 | ) |
| Class B Shares | | | 34 | | | | 165 | | | | 42 | | | | 14 | | | | (78 | ) | | | (155 | ) | | | — | | | | — | | | | (2 | ) | | | 24 | |
| Amount | | $ | 327 | | | $ | 2,109 | | | $ | 424 | | | $ | 167 | | | $ | (722 | ) | | $ | (1,919 | ) | | $ | — | | | $ | — | | | $ | 29 | | | $ | 357 | |
| Class C Shares | | | 53 | | | | 281 | | | | 80 | | | | 25 | | | | (293 | ) | | | (216 | ) | | | — | | | | — | | | | (160 | ) | | | 90 | |
| Amount | | $ | 495 | | | $ | 3,582 | | | $ | 805 | | | $ | 293 | | | $ | (2,813 | ) | | $ | (2,669 | ) | | $ | — | | | $ | — | | | $ | (1,513 | ) | | $ | 1,206 | |
| Class Y Shares | | | 431 | | | | 4,200 | | | | 573 | | | | 42 | | | | (287 | ) | | | (1,446 | ) | | | — | | | | — | | | | 717 | | | | 2,796 | |
| Amount | | $ | 4,412 | | | $ | 52,162 | | | $ | 5,921 | | | $ | 503 | | | $ | (2,652 | ) | | $ | (17,751 | ) | | $ | — | | | $ | — | | | $ | 7,681 | | | $ | 34,914 | |
| Select SmallCap Value Fund: | | | | | | | | | | | | | | | | | | | | | | | | | | | | | | | | | | | | | | | | |
| Class A Shares | | | 89 | | | | 181 | | | | 127 | | | | 3 | | | | (37 | ) | | | (12 | ) | | | — | | | | — | | | | 179 | | | | 172 | |
| Amount | | $ | 859 | | | $ | 2,135 | | | $ | 1,316 | | | $ | 30 | | | $ | (347 | ) | | $ | (144 | ) | | $ | — | | | $ | — | | | $ | 1,828 | | | $ | 2,021 | |
| Class B Shares | | | 7 | | | | 27 | | | | 4 | | | | — | | | | (6 | ) | | | (5 | ) | | | — | | | | — | | | | 5 | | | | 22 | |
| Amount | | $ | 69 | | | $ | 310 | | | $ | 36 | | | $ | 1 | | | $ | (62 | ) | | $ | (56 | ) | | $ | — | | | $ | — | | | $ | 43 | | | $ | 255 | |
| Class C Shares | | | 15 | | | | 44 | | | | 5 | | | | — | | | | (1 | ) | | | (6 | ) | | | — | | | | — | | | | 19 | | | | 38 | |
| Amount | | $ | 141 | | | $ | 513 | | | $ | 49 | | | $ | 1 | | | $ | (10 | ) | | $ | (66 | ) | | $ | — | | | $ | — | | | $ | 180 | | | $ | 448 | |
| Class Y Shares | | | 1,327 | | | | 7,695 | | | | 663 | | | | 31 | | | | (48 | ) | | | (138 | ) | | | — | | | | — | | | | 1,942 | | | | 7,588 | |
| Amount | | $ | 13,134 | | | $ | 85,148 | | | $ | 6,870 | | | $ | 342 | | | $ | (439 | ) | | $ | (1,610 | ) | | $ | — | | | $ | — | | | $ | 19,565 | | | $ | 83,880 | |
| Short Duration Fund: | | | | | | | | | | | | | | | | | | | | | | | | | | | | | | | | | | | | | | | | |
| Class A Shares | | | 2,734 | | | | 2,489 | | | | 61 | | | | 104 | | | | (2,397 | ) | | | (1,770 | ) | | | — | | | | — | | | | 398 | | | | 823 | |
| Amount | | $ | 26,595 | | | $ | 24,579 | | | $ | 593 | | | $ | 1,030 | | | $ | (23,104 | ) | | $ | (17,474 | ) | | $ | — | | | $ | — | | | $ | 4,084 | | | $ | 8,135 | |
| Class B Shares | | | 148 | | | | 246 | | | | 9 | | | | 20 | | | | (199 | ) | | | (303 | ) | | | — | | | | — | | | | (42 | ) | | | (37 | ) |
| Amount | | $ | 1,437 | | | $ | 2,435 | | | $ | 83 | | | $ | 200 | | | $ | (1,937 | ) | | $ | (2,997 | ) | | $ | — | | | $ | — | | | $ | (417 | ) | | $ | (362 | ) |
| Class C Shares | | | 1,730 | | | | 2,035 | | | | 26 | | | | 43 | | | | (962 | ) | | | (1,259 | ) | | | — | | | | — | | | | 794 | | | | 819 | |
| Amount | | $ | 16,835 | | | $ | 20,088 | | | $ | 251 | | | $ | 425 | | | $ | (9,333 | ) | | $ | (12,408 | ) | | $ | — | | | $ | — | | | $ | 7,753 | | | $ | 8,105 | |
| Class Y Shares | | | 845 | | | | 5,807 | | | | 318 | | | | 688 | | | | (1,058 | ) | | | (2,332 | ) | | | — | | | | — | | | | 105 | | | | 4,163 | |
| Amount | | $ | 8,164 | | | $ | 57,368 | | | $ | 3,078 | | | $ | 6,779 | | | $ | (10,308 | ) | | $ | (23,005 | ) | | $ | — | | | $ | — | | | $ | 934 | | | $ | 41,142 | |
| Small Company Fund: | | | | | | | | | | | | | | | | | | | | | | | | | | | | | | | | | | | | | | | | |
| Class A Shares | | | 5,813 | | | | 5,299 | | | | 1,490 | | | | 808 | | | | (1,669 | ) | | | (2,865 | ) | | | — | | | | — | | | | 5,634 | | | | 3,242 | |
| Amount | | $ | 108,182 | | | $ | 118,201 | | | $ | 30,286 | | | $ | 16,243 | | | $ | (32,137 | ) | | $ | (63,126 | ) | | $ | — | | | $ | — | | | $ | 106,331 | | | $ | 71,318 | |
| Class B Shares | | | 106 | | | | 275 | | | | 317 | | | | 251 | | | | (643 | ) | | | (774 | ) | | | — | | | | — | | | | (220 | ) | | | (248 | ) |
| Amount | | $ | 1,829 | | | $ | 5,581 | | | $ | 5,795 | | | $ | 4,640 | | | $ | (10,894 | ) | | $ | (15,712 | ) | | $ | — | | | $ | — | | | $ | (3,270 | ) | | $ | (5,491 | ) |
| Class C Shares | | | 457 | | | | 724 | | | | 366 | | | | 223 | | | | (369 | ) | | | (483 | ) | | | — | | | | — | | | | 454 | | | | 464 | |
| Amount | | $ | 7,885 | | | $ | 14,764 | | | $ | 6,702 | | | $ | 4,116 | | | $ | (6,318 | ) | | $ | (9,834 | ) | | $ | — | | | $ | — | | | $ | 8,269 | | | $ | 9,046 | |
| Class I Shares | | | 514 | | | | 161 | | | | 20 | | | | — | | | | (34 | ) | | | (6 | ) | | | — | | | | — | | | | 500 | | | | 155 | |
| Amount | | $ | 9,487 | | | $ | 3,715 | | | $ | 406 | | | $ | 8 | | | $ | (636 | ) | | $ | (139 | ) | | $ | — | | | $ | — | | | $ | 9,257 | | | $ | 3,584 | |
| Class R3 Shares | | | 109 | | | | 7 | | | | 1 | | | | — | | | | (19 | ) | | | — | | | | — | | | | — | | | | 91 | | | | 7 | |
| Amount | | $ | 2,161 | | | $ | 176 | | | $ | 20 | | | $ | — | | | $ | (366 | ) | | $ | (9 | ) | | $ | — | | | $ | — | | | $ | 1,815 | | | $ | 167 | |
| Class R4 Shares | | | 448 | | | | 393 | | | | 47 | | | | — | | | | (81 | ) | | | (14 | ) | | | — | | | | — | | | | 414 | | | | 379 | |
| Amount | | $ | 9,040 | | | $ | 9,299 | | | $ | 1,013 | | | $ | — | | | $ | (1,608 | ) | | $ | (336 | ) | | $ | — | | | $ | — | | | $ | 8,445 | | | $ | 8,963 | |
| Class R5 Shares | | | 258 | | | | 23 | | | | 3 | | | | — | | | | (38 | ) | | | — | | | | — | | | | — | | | | 223 | | | | 23 | |
| Amount | | $ | 5,378 | | | $ | 584 | | | $ | 56 | | | $ | — | | | $ | (769 | ) | | $ | — | | | $ | — | | | $ | — | | | $ | 4,665 | | | $ | 584 | |
| Class Y Shares | | | 3,074 | | | | 4,071 | | | | 901 | | | | 395 | | | | (445 | ) | | | (1,786 | ) | | | — | | | | — | | | | 3,530 | | | | 2,680 | |
| Amount | | $ | 62,659 | | | $ | 93,512 | | | $ | 19,626 | | | $ | 8,399 | | | $ | (9,215 | ) | | $ | (40,994 | ) | | $ | — | | | $ | — | | | $ | 73,070 | | | $ | 60,917 | |
372
| | | | �� | | | | | | | | | | | | | | | | | | | | | | | | | | | | | | | | | | | | | |
| | | | | | Shares Issued for
| | | | | | Shares Issued
| | | Net Increase
| |
| | | Shares Sold | | | Reinvested Dividends | | | Shares Redeemed | | | from Merger | | | (Decrease) of Shares | |
| | | 2008 | | | 2007 | | | 2008 | | | 2007 | | | 2008 | | | 2007 | | | 2008 | | | 2007 | | | 2008 | | | 2007 | |
| |
Small Company Fund: — (continued) |
| SmallCap Growth Fund: | | | | | | | | | | | | | | | | | | | | | | | | | | | | | | | | | | | | | | | | |
| Class A Shares | | | 513 | | | | 2,612 | | | | 556 | | | | — | | | | (1,128 | ) | | | (5,087 | ) | | | — | | | | — | | | | (59 | ) | | | (2,475 | ) |
| Amount | | $ | 13,131 | | | $ | 85,441 | | | $ | 15,455 | | | $ | — | | | $ | (29,112 | ) | | $ | (165,947 | ) | | $ | — | | | $ | — | | | $ | (526 | ) | | $ | (80,506 | ) |
| Class B Shares | | | 31 | | | | 52 | | | | 74 | | | | — | | | | (100 | ) | | | (151 | ) | | | — | | | | — | | | | 5 | | | | (99 | ) |
| Amount | | $ | 705 | | | $ | 1,528 | | | $ | 1,809 | | | $ | — | | | $ | (2,301 | ) | | $ | (4,446 | ) | | $ | — | | | $ | — | | | $ | 213 | | | $ | (2,918 | ) |
| Class C Shares | | | 54 | | | | 206 | | | | 99 | | | | — | | | | (210 | ) | | | (266 | ) | | | — | | | | — | | | | (57 | ) | | | (60 | ) |
| Amount | | $ | 1,255 | | | $ | 6,009 | | | $ | 2,399 | | | $ | — | | | $ | (4,848 | ) | | $ | (7,807 | ) | | $ | — | | | $ | — | | | $ | (1,194 | ) | | $ | (1,798 | ) |
| Class H Shares | | | — | | | | 7 | | | | — | | | | — | | | | — | | | | (41 | ) | | | — | | | | (448 | ) | | | — | | | | (482 | ) |
| Amount | | $ | — | | | $ | 203 | | | $ | — | | | $ | — | | | $ | — | | | $ | (1,174 | ) | | $ | — | | | $ | (24,087 | ) | | $ | — | | | $ | (25,058 | ) |
| Class I Shares | | | 36 | | | | 156 | | | | 15 | | | | — | | | | (60 | ) | | | (27 | ) | | | — | | | | — | | | | (9 | ) | | | 129 | |
| Amount | | $ | 945 | | | $ | 5,194 | | | $ | 407 | | | $ | — | | | $ | (1,599 | ) | | $ | (894 | ) | | $ | — | | | $ | — | | | $ | (247 | ) | | $ | 4,300 | |
| Class L Shares | | | 71 | | | | 128 | | | | 480 | | | | — | | | | (414 | ) | | | (827 | ) | | | — | | | | 1,010 | | | | 137 | | | | 311 | |
| Amount | | $ | 1,843 | | | $ | 4,237 | | | $ | 13,446 | | | $ | — | | | $ | (10,775 | ) | | $ | (27,454 | ) | | $ | — | | | $ | 59,181 | | | $ | 4,514 | | | $ | 35,964 | |
| Class M Shares | | | — | | | | 8 | | | | — | | | | — | | | | — | | | | (36 | ) | | | — | | | | (485 | ) | | | — | | | | (513 | ) |
| Amount | | $ | — | | | $ | 245 | | | $ | — | | | $ | — | | | $ | — | | | $ | (1,028 | ) | | $ | — | | | $ | (25,120 | ) | | $ | — | | | $ | (25,903 | ) |
| Class N Shares | | | — | | | | 4 | | | | — | | | �� | — | | | | — | | | | (18 | ) | | | — | | | | (193 | ) | | | — | | | | (207 | ) |
| Amount | | $ | — | | | $ | 108 | | | $ | — | | | $ | — | | | $ | — | | | $ | (513 | ) | | $ | — | | | $ | (9,974 | ) | | $ | — | | | $ | (10,379 | ) |
| Class R3 Shares | | | — | | | | — | | | | — | | | | — | | | | — | | | | — | | | | — | | | | — | | | | — | | | | — | |
| Amount | | $ | 3 | | | $ | 10 | | | $ | 1 | | | $ | — | | | $ | — | | | $ | — | | | $ | — | | | $ | — | | | $ | 4 | | | $ | 10 | |
| Class R4 Shares | | | 56 | | | | 9 | | | | 1 | | | | — | | | | (4 | ) | | | — | | | | — | | | | — | | | | 53 | | | | 9 | |
| Amount | | $ | 1,470 | | | $ | 314 | | | $ | 30 | | | $ | — | | | $ | (113 | ) | | $ | (12 | ) | | $ | — | | | $ | — | | | $ | 1,387 | | | $ | 302 | |
| Class R5 Shares | | | — | | | | — | | | | — | | | | — | | | | — | | | | — | | | | — | | | | — | | | | — | | | | — | |
| Amount | | $ | — | | | $ | 10 | | | $ | 1 | | | $ | — | | | $ | — | | | $ | — | | | $ | — | | | $ | — | | | $ | 1 | | | $ | 10 | |
| Class Y Shares | | | 371 | | | | 1,060 | | | | 161 | | | | — | | | | (101 | ) | | | (3,085 | ) | | | — | | | | — | | | | 431 | | | | (2,025 | ) |
| Amount | | $ | 9,903 | | | $ | 35,926 | | | $ | 4,586 | | | $ | — | | | $ | (2,699 | ) | | $ | (98,932 | ) | | $ | — | | | $ | — | | | $ | 11,790 | | | $ | (63,006 | ) |
| Stock Fund: | | | | | | | | | | | | | | | | | | | | | | | | | | | | | | | | | | | | | | | | |
| Class A Shares | | | 1,635 | | | | 3,048 | | | | 31 | | | | 138 | | | | (3,896 | ) | | | (8,521 | ) | | | — | | | | — | | | | (2,230 | ) | | | (5,335 | ) |
| Amount | | $ | 35,292 | | | $ | 69,797 | | | $ | 705 | | | $ | 3,020 | | | $ | (84,288 | ) | | $ | (194,695 | ) | | $ | — | | | $ | — | | | $ | (48,291 | ) | | $ | (121,878 | ) |
| Class B Shares | | | 103 | | | | 253 | | | | — | | | | — | | | | (1,801 | ) | | | (4,166 | ) | | | — | | | | — | | | | (1,698 | ) | | | (3,913 | ) |
| Amount | | $ | 2,049 | | | $ | 5,345 | | | $ | — | | | $ | — | | | $ | (35,885 | ) | | $ | (88,701 | ) | | $ | — | | | $ | — | | | $ | (33,836 | ) | | $ | (83,356 | ) |
| Class C Shares | | | 103 | | | | 185 | | | | — | | | | — | | | | (743 | ) | | | (1,836 | ) | | | — | | | | — | | | | (640 | ) | | | (1,651 | ) |
| Amount | | $ | 2,093 | | | $ | 3,912 | | | $ | — | | | $ | — | | | $ | (14,930 | ) | | $ | (39,151 | ) | | $ | — | | | $ | — | | | $ | (12,837 | ) | | $ | (35,239 | ) |
| Class R3 Shares | | | — | | | | 2 | | | | — | | | | — | | | | (1 | ) | | | — | | | | — | | | | — | | | | (1 | ) | | | 2 | |
| Amount | | $ | 10 | | | $ | 41 | | | $ | — | | | $ | — | | | $ | (15 | ) | | $ | (1 | ) | | $ | — | | | $ | — | | | $ | (5 | ) | | $ | 40 | |
| Class R4 Shares | | | — | | | | 2 | | | | — | | | | — | | | | — | | | | — | | | | — | | | | — | | | | — | | | | 2 | |
| Amount | | $ | — | | | $ | 40 | | | $ | — | | | $ | — | | | $ | — | | | $ | — | | | $ | — | | | $ | — | | | $ | — | | | $ | 40 | |
| Class R5 Shares | | | — | | | | — | | | | — | | | | — | | | | — | | | | — | | | | — | | | | — | | | | — | | | | — | |
| Amount | | $ | — | | | $ | 10 | | | $ | — | | | $ | — | | | $ | — | | | $ | — | | | $ | — | | | $ | — | | | $ | — | | | $ | 10 | |
| Class Y Shares | | | 633 | | | | 536 | | | | 20 | | | | 45 | | | | (79 | ) | | | (3,706 | ) | | | — | | | | — | | | | 574 | | | | (3,125 | ) |
| Amount | | $ | 14,363 | | | $ | 12,633 | | | $ | 469 | | | $ | 1,030 | | | $ | (1,712 | ) | | $ | (90,965 | ) | | $ | — | | | $ | — | | | $ | 13,120 | | | $ | (77,302 | ) |
| Strategic Income Fund: | | | | | | | | | | | | | | | | | | | | | | | | | | | | | | | | | | | | | | | | |
| Class A Shares | | | 6,676 | | | | 5,219 | | | | 176 | | | | 75 | | | | (1,351 | ) | | | (888 | ) | | | — | | | | — | | | | 5,501 | | | | 4,406 | |
| Amount | | $ | 63,618 | | | $ | 51,016 | | | $ | 1,670 | | | $ | 730 | | | $ | (12,756 | ) | | $ | (8,594 | ) | | $ | — | | | $ | — | | | $ | 52,532 | | | $ | 43,152 | |
| Class B Shares | | | 439 | | | | 271 | | | | 9 | | | | 3 | | | | (114 | ) | | | (3 | ) | | | — | | | | — | | | | 334 | | | | 271 | |
| Amount | | $ | 4,176 | | | $ | 2,640 | | | $ | 86 | | | $ | 28 | | | $ | (1,068 | ) | | $ | (27 | ) | | $ | — | | | $ | — | | | $ | 3,194 | | | $ | 2,641 | |
| Class C Shares | | | 6,342 | | | | 1,767 | | | | 79 | | | | 12 | | | | (745 | ) | | | (9 | ) | | | — | | | | — | | | | 5,676 | | | | 1,770 | |
| Amount | | $ | 60,441 | | | $ | 17,167 | | | $ | 756 | | | $ | 114 | | | $ | (7,035 | ) | | $ | (84 | ) | | $ | — | | | $ | — | | | $ | 54,162 | | | $ | 17,197 | |
| Class I Shares | | | 2,800 | | | | 1,208 | | | | 58 | | | | 10 | | | | (763 | ) | | | (70 | ) | | | — | | | | — | | | | 2,095 | | | | 1,148 | |
| Amount | | $ | 26,632 | | | $ | 11,761 | | | $ | 553 | | | $ | 93 | | | $ | (7,226 | ) | | $ | (679 | ) | | $ | — | | | $ | — | | | $ | 19,959 | | | $ | 11,175 | |
| Class Y Shares | | | 2,174 | | | | 1,086 | | | | 81 | | | | 4 | | | | (132 | ) | | | — | | | | — | | | | — | | | | 2,123 | | | | 1,090 | |
| Amount | | $ | 20,655 | | | $ | 10,596 | | | $ | 775 | | | $ | 40 | | | $ | (1,241 | ) | | $ | — | | | $ | — | | | $ | — | | | $ | 20,189 | | | $ | 10,636 | |
| Target Retirement 2010 Fund: | | | | | | | | | | | | | | | | | | | | | | | | | | | | | | | | | | | | | | | | |
| Class A Shares | | | 432 | | | | 725 | | | | 40 | | | | 12 | | | | (181 | ) | | | (197 | ) | | | — | | | | — | | | | 291 | | | | 540 | |
| Amount | | $ | 4,204 | | | $ | 7,276 | | | $ | 403 | | | $ | 124 | | | $ | (1,754 | ) | | $ | (2,012 | ) | | $ | — | | | $ | — | | | $ | 2,853 | | | $ | 5,388 | |
| Class B Shares | | | 22 | | | | 27 | | | | 3 | | | | 1 | | | | (3 | ) | | | (1 | ) | | | — | | | | — | | | | 22 | | | | 27 | |
| Amount | | $ | 213 | | | $ | 265 | | | $ | 27 | | | $ | 8 | | | $ | (27 | ) | | $ | (10 | ) | | $ | — | | | $ | — | | | $ | 213 | | | $ | 263 | |
| Class C Shares | | | 22 | | | | 22 | | | | 3 | | | | 1 | | | | (25 | ) | | | (2 | ) | | | — | | | | — | | | | — | | | | 21 | |
| Amount | | $ | 214 | | | $ | 220 | | | $ | 28 | | | $ | 11 | | | $ | (250 | ) | | $ | (23 | ) | | $ | — | | | $ | — | | | $ | (8 | ) | | $ | 208 | |
| Class R3 Shares | | | — | | | | 1 | | | | — | | | | — | | | | — | | | | — | | | | — | | | | — | | | | — | | | | 1 | |
| Amount | | $ | — | | | $ | 10 | | | $ | 1 | | | $ | — | | | $ | — | | | $ | — | | | $ | — | | | $ | — | | | $ | 1 | | | $ | 10 | |
| Class R4 Shares | | | 388 | | | | 42 | | | | 4 | | | | — | | | | (73 | ) | | | (1 | ) | | | — | | | | — | | | | 319 | | | | 41 | |
| Amount | | $ | 3,726 | | | $ | 443 | | | $ | 40 | | | $ | — | | | $ | (698 | ) | | $ | (9 | ) | | $ | — | | | $ | — | | | $ | 3,068 | | | $ | 434 | |
373
The Hartford Mutual Funds, Inc. and The Hartford Mutual Funds II, Inc.
Notes to Financial Statements — (continued)
April 30, 2008 (Unaudited)
(000’s Omitted)
| | | | | | | | | | | | | | | | | | | | | | | | | | | | | | | | | | | | | | | | | |
| | | | | | Shares Issued for
| | | | | | Shares Issued
| | | Net Increase
| |
| | | Shares Sold | | | Reinvested Dividends | | | Shares Redeemed | | | from Merger | | | (Decrease) of Shares | |
| | | 2008 | | | 2007 | | | 2008 | | | 2007 | | | 2008 | | | 2007 | | | 2008 | | | 2007 | | | 2008 | | | 2007 | |
| |
Target Retirement 2010 Fund: — (continued) |
| Class R5 Shares | | | 103 | | | | 1 | | | | — | | | | — | | | | (8 | ) | | | — | | | | — | | | | — | | | | 95 | | | | 1 | |
| Amount | | $ | 987 | | | $ | 10 | | | $ | 3 | | | $ | — | | | $ | (73 | ) | | $ | — | | | $ | — | | | $ | — | | | $ | 917 | | | $ | 10 | |
| Class Y Shares | | | — | | | | — | | | | 1 | | | | — | | | | — | | | | — | | | | — | | | | — | | | | 1 | | | | — | |
| Amount | | $ | — | | | $ | — | | | $ | 8 | | | $ | 4 | | | $ | — | | | $ | — | | | $ | — | | | $ | — | | | $ | 8 | | | $ | 4 | |
| Target Retirement 2020 Fund: | | | | | | | | | | | | | | | | | | | | | | | | | | | | | | | | | | | | | | | | |
| Class A Shares | | | 473 | | | | 1,430 | | | | 66 | | | | 16 | | | | (280 | ) | | | (134 | ) | | | — | | | | — | | | | 259 | | | | 1,312 | |
| Amount | | $ | 5,018 | | | $ | 15,731 | | | $ | 721 | | | $ | 174 | | | $ | (2,984 | ) | | $ | (1,495 | ) | | $ | — | | | $ | — | | | $ | 2,755 | | | $ | 14,410 | |
| Class B Shares | | | 34 | | | | 48 | | | | 2 | | | | 1 | | | | (13 | ) | | | (16 | ) | | | — | | | | — | | | | 23 | | | | 33 | |
| Amount | | $ | 347 | | | $ | 538 | | | $ | 27 | | | $ | 6 | | | $ | (135 | ) | | $ | (177 | ) | | $ | — | | | $ | — | | | $ | 239 | | | $ | 367 | |
| Class C Shares | | | 26 | | | | 35 | | | | 2 | | | | 1 | | | | (2 | ) | | | (12 | ) | | | — | | | | — | | | | 26 | | | | 24 | |
| Amount | | $ | 271 | | | $ | 382 | | | $ | 23 | | | $ | 8 | | | $ | (24 | ) | | $ | (141 | ) | | $ | — | | | $ | — | | | $ | 270 | | | $ | 249 | |
| Class R3 Shares | | | — | | | | 1 | | | | — | | | | — | | | | — | | | | — | | | | — | | | | — | | | | — | | | | 1 | |
| Amount | | $ | — | | | $ | 10 | | | $ | — | | | $ | — | | | $ | — | | | $ | — | | | $ | — | | | $ | — | | | $ | — | | | $ | 10 | |
| Class R4 Shares | | | 688 | | | | 97 | | | | 7 | | | | — | | | | (185 | ) | | | — | | | | — | | | | — | | | | 510 | | | | 97 | |
| Amount | | $ | 7,217 | | | $ | 1,093 | | | $ | 79 | | | $ | 2 | | | $ | (1,932 | ) | | $ | — | | | $ | — | | | $ | — | | | $ | 5,364 | | | $ | 1,095 | |
| Class R5 Shares | | | 587 | | | | 1 | | | | 2 | | | | — | | | | (71 | ) | | | — | | | | — | | | | — | | | | 518 | | | | 1 | |
| Amount | | $ | 6,229 | | | $ | 10 | | | $ | 22 | | | $ | — | | | $ | (734 | ) | | $ | — | | | $ | — | | | $ | — | | | $ | 5,517 | | | $ | 10 | |
| Class Y Shares | | | — | | | | — | | | | — | | | | — | | | | — | | | | — | | | | — | | | | — | | | | — | | | | — | |
| Amount | | $ | — | | | $ | — | | | $ | 1 | | | $ | — | | | $ | — | | | $ | — | | | $ | — | | | $ | — | | | $ | 1 | | | $ | — | |
| Target Retirement 2030 Fund: | | | | | | | | | | | | | | | | | | | | | | | | | | | | | | | | | | | | | | | | |
| Class A Shares | | | 371 | | | | 1,347 | | | | 67 | | | | 4 | | | | (101 | ) | | | (151 | ) | | | — | | | | — | | | | 337 | | | | 1,200 | |
| Amount | | $ | 3,609 | | | $ | 13,453 | | | $ | 677 | | | $ | 41 | | | $ | (1,002 | ) | | $ | (1,524 | ) | | $ | — | | | $ | — | | | $ | 3,284 | | | $ | 11,970 | |
| Class B Shares | | | 28 | | | | 29 | | | | 2 | | | | — | | | | (4 | ) | | | (14 | ) | | | — | | | | — | | | | 26 | | | | 15 | |
| Amount | | $ | 266 | | | $ | 288 | | | $ | 22 | | | $ | 3 | | | $ | (34 | ) | | $ | (131 | ) | | $ | — | | | $ | — | | | $ | 254 | | | $ | 160 | |
| Class C Shares | | | 58 | | | | 37 | | | | 2 | | | | — | | | | (2 | ) | | | (9 | ) | | | — | | | | — | | | | 58 | | | | 28 | |
| Amount | | $ | 559 | | | $ | 366 | | | $ | 19 | | | $ | 2 | | | $ | (15 | ) | | $ | (88 | ) | | $ | — | | | $ | — | | | $ | 563 | | | $ | 280 | |
| Class R3 Shares | | | — | | | | 1 | | | | — | | | | — | | | | — | | | | — | | | | — | | | | — | | | | — | | | | 1 | |
| Amount | | $ | — | | | $ | 10 | | | $ | — | | | $ | — | | | $ | — | | | $ | — | | | $ | — | | | $ | — | | | $ | — | | | $ | 10 | |
| Class R4 Shares | | | 584 | | | | 59 | | | | 4 | | | | — | | | | (38 | ) | | | — | | | | — | | | | — | | | | 550 | | | | 59 | |
| Amount | | $ | 5,534 | | | $ | 618 | | | $ | 41 | | | $ | — | | | $ | (351 | ) | | $ | — | | | $ | — | | | $ | — | | | $ | 5,224 | | | $ | 618 | |
| Class R5 Shares | | | 175 | | | | 1 | | | | — | | | | — | | | | (18 | ) | | | — | | | | — | | | | — | | | | 157 | | | | 1 | |
| Amount | | $ | 1,653 | | | $ | 10 | | | $ | 1 | | | $ | — | | | $ | (167 | ) | | $ | — | | | $ | — | | | $ | — | | | $ | 1,487 | | | $ | 10 | |
| Class Y Shares | | | — | | | | — | | | | 1 | | | | — | | | | — | | | | — | | | | — | | | | — | | | | 1 | | | | — | |
| Amount | | $ | — | | | $ | — | | | $ | 2 | | | $ | — | | | $ | — | | | $ | — | | | $ | — | | | $ | — | | | $ | 2 | | | $ | — | |
| Tax-Free California Fund: | | | | | | | | | | | | | | | | | | | | | | | | | | | | | | | | | | | | | | | | |
| Class A Shares | | | 811 | | | | 1,881 | | | | 67 | | | | 96 | | | | (1,220 | ) | | | (622 | ) | | | — | | | | — | | | | (342 | ) | | | 1,355 | |
| Amount | | $ | 7,952 | | | $ | 19,586 | | | $ | 648 | | | $ | 992 | | | $ | (11,860 | ) | | $ | (6,466 | ) | | $ | — | | | $ | — | | | $ | (3,260 | ) | | $ | 14,112 | |
| Class B Shares | | | 25 | | | | 50 | | | | 3 | | | | 4 | | | | (44 | ) | | | (13 | ) | | | — | | | | — | | | | (16 | ) | | | 41 | |
| Amount | | $ | 250 | | | $ | 530 | | | $ | 25 | | | $ | 40 | | | $ | (432 | ) | | $ | (138 | ) | | $ | — | | | $ | — | | | $ | (157 | ) | | $ | 432 | |
| Class C Shares | | | 162 | | | | 338 | | | | 6 | | | | 9 | | | | (155 | ) | | | (166 | ) | | | — | | | | — | | | | 13 | | | | 181 | |
| Amount | | $ | 1,591 | | | $ | 3,532 | | | $ | 59 | | | $ | 89 | | | $ | (1,518 | ) | | $ | (1,725 | ) | | $ | — | | | $ | — | | | $ | 132 | | | $ | 1,896 | |
| Tax-Free Minnesota Fund: | | | | | | | | | | | | | | | | | | | | | | | | | | | | | | | | | | | | | | | | |
| Class A Shares | | | 102 | | | | 459 | | | | 20 | | | | 36 | | | | (66 | ) | | | (159 | ) | | | — | | | | — | | | | 56 | | | | 336 | |
| Amount | | $ | 1,003 | | | $ | 4,663 | | | $ | 194 | | | $ | 360 | | | $ | (647 | ) | | $ | (1,604 | ) | | $ | — | | | $ | — | | | $ | 550 | | | $ | 3,419 | |
| Class B Shares | | | 1 | | | | 5 | | | | 1 | | | | 2 | | | | — | | | | (9 | ) | | | — | | | | — | | | | 2 | | | | (2 | ) |
| Amount | | $ | 7 | | | $ | 60 | | | $ | 9 | | | $ | 21 | | | $ | (3 | ) | | $ | (95 | ) | | $ | — | | | $ | — | | | $ | 13 | | | $ | (14 | ) |
| Class C Shares | | | 56 | | | | 56 | | | | 1 | | | | 2 | | | | (10 | ) | | | (42 | ) | | | — | | | | — | | | | 47 | | | | 16 | |
| Amount | | $ | 541 | | | $ | 578 | | | $ | 9 | | | $ | 17 | | | $ | (97 | ) | | $ | (415 | ) | | $ | — | | | $ | — | | | $ | 453 | | | $ | 180 | |
| Class E Shares | | | — | | | | 10 | | | | — | | | | 29 | | | | — | | | | (58 | ) | | | — | | | | (2,273 | ) | | | — | | | | (2,292 | ) |
| Amount | | $ | — | | | $ | 106 | | | $ | — | | | $ | 302 | | | $ | — | | | $ | (598 | ) | | $ | — | | | $ | (21,805 | ) | | $ | — | | | $ | (21,995 | ) |
| Class H Shares | | | — | | | | — | | | | — | | | | — | | | | — | | | | — | | | | — | | | | (11 | ) | | | — | | | | (11 | ) |
| Amount | | $ | — | | | | — | | | $ | — | | | $ | 2 | | | $ | — | | | $ | (1 | ) | | $ | — | | | $ | (126 | ) | | $ | — | | | $ | (125 | ) |
| Class L Shares | | | 4 | | | | 58 | | | | 5 | | | | 11 | | | | (18 | ) | | | (67 | ) | | | — | | | | 37 | | | | (9 | ) | | | 39 | |
| Amount | | $ | 38 | | | $ | 579 | | | $ | 50 | | | $ | 114 | | | $ | (174 | ) | | $ | (672 | ) | | $ | — | | | $ | 384 | | | $ | (86 | ) | | $ | 405 | |
| Class M Shares | | | — | | | | — | | | | — | | | | — | | | | — | | | | — | | | | — | | | | (12 | ) | | | — | | | | (12 | ) |
| Amount | | $ | — | | | $ | — | | | $ | — | | | $ | 2 | | | $ | — | | | $ | — | | | $ | — | | | $ | (108 | ) | | $ | — | | | $ | (106 | ) |
| Class N Shares | | | — | | | | — | | | | — | | | | — | | | | — | | | | (5 | ) | | | — | | | | (14 | ) | | | — | | | | (19 | ) |
| Amount | | $ | — | | | $ | 2 | | | $ | — | | | $ | 2 | | | $ | — | | | $ | (49 | ) | | $ | — | | | $ | (150 | ) | | $ | — | | | $ | (195 | ) |
| Class Y Shares | | | 1 | | | | 17 | | | | 35 | | | | 53 | | | | (142 | ) | | | (148 | ) | | | — | | | | 2,286 | | | | (106 | ) | | | 2,208 | |
| Amount | | $ | 11 | | | $ | 167 | | | $ | 344 | | | | 533 | | | $ | (1,409 | ) | | $ | (1,487 | ) | | $ | — | | | $ | 21,805 | | | $ | (1,054 | ) | | $ | 21,018 | |
374
| | | | | | | | | | | | | | | | | | | | | | | | | | | | | | | | | | | | | | | | | |
| | | | | | Shares Issued for
| | | | | | Shares Issued
| | | Net Increase
| |
| | | Shares Sold | | | Reinvested Dividends | | | Shares Redeemed | | | from Merger | | | (Decrease) of Shares | |
| | | 2008 | | | 2007 | | | 2008 | | | 2007 | | | 2008 | | | 2007 | | | 2008 | | | 2007 | | | 2008 | | | 2007 | |
| |
Tax-Free Minnesota Fund: — (continued) |
| Tax-Free National Fund: | | | | | | | | | | | | | | | | | | | | | | | | | | | | | | | | | | | | | | | | |
| Class A Shares | | | 4,943 | | | | 6,660 | | | | 192 | | | | 282 | | | | (2,483 | ) | | | (2,669 | ) | | | — | | | | — | | | | 2,652 | | | | 4,273 | |
| Amount | | $ | 52,204 | | | $ | 73,982 | | | $ | 2,003 | | | $ | 3,130 | | | $ | (26,066 | ) | | $ | (29,338 | ) | | $ | — | | | $ | — | | | $ | 28,141 | | | $ | 47,774 | |
| Class B Shares | | | 74 | | | | 194 | | | | 10 | | | | 19 | | | | (94 | ) | | | (179 | ) | | | — | | | | — | | | | (10 | ) | | | 34 | |
| Amount | | $ | 775 | | | $ | 2,161 | | | $ | 101 | | | $ | 213 | | | $ | (980 | ) | | $ | (1,963 | ) | | $ | — | | | $ | — | | | $ | (104 | ) | | $ | 411 | |
| Class C Shares | | | 861 | | | | 1,312 | | | | 33 | | | | 44 | | | | (350 | ) | | | (423 | ) | | | — | | | | — | | | | 544 | | | | 933 | |
| Amount | | $ | 9,065 | | | $ | 14,604 | | | $ | 338 | | | $ | 489 | | | $ | (3,670 | ) | | $ | (4,655 | ) | | $ | — | | | $ | — | | | $ | 5,733 | | | $ | 10,438 | |
| Class E Shares | | | — | | | | 11 | | | | — | | | | 24 | | | | — | | | | (73 | ) | | | — | | | | (2,519 | ) | | | — | | | | (2,557 | ) |
| Amount | | $ | — | | | $ | 122 | | | $ | — | | | $ | 272 | | | $ | — | | | $ | (824 | ) | | $ | — | | | $ | (23,218 | ) | | $ | — | | | $ | (23,648 | ) |
| Class H Shares | | | — | | | | 4 | | | | — | | | | — | | | | — | | | | (6 | ) | | | — | | | | (15 | ) | | | — | | | | (17 | ) |
| Amount | | $ | — | | | | 51 | | | $ | — | | | $ | 1 | | | $ | — | | | $ | (76 | ) | | $ | — | | | $ | (150 | ) | | $ | — | | | $ | (174 | ) |
| Class I Shares | | | 96 | | | | 324 | | | | 8 | | | | 2 | | | | (29 | ) | | | (4 | ) | | | — | | | | — | | | | 75 | | | | 322 | |
| Amount | | $ | 1,024 | | | $ | 3,521 | | | $ | 79 | | | $ | 17 | | | $ | (312 | ) | | $ | (39 | ) | | $ | — | | | $ | — | | | $ | 791 | | | $ | 3,499 | |
| Class L Shares | | | 5 | | | | 37 | | | | 13 | | | | 24 | | | | (64 | ) | | | (92 | ) | | | — | | | | 131 | | | | (46 | ) | | | 100 | |
| Amount | | $ | 64 | | | $ | 422 | | | $ | 135 | | | $ | 271 | | | $ | (676 | ) | | $ | (1,024 | ) | | $ | — | | | $ | 1,415 | | | $ | (477 | ) | | $ | 1,084 | |
| Class M Shares | | | — | | | | — | | | | — | | | | 1 | | | | — | | | | (30 | ) | | | — | | | | (82 | ) | | | — | | | | (111 | ) |
| Amount | | $ | — | | | $ | 1 | | | $ | — | | | $ | 8 | | | $ | — | | | $ | (337 | ) | | $ | — | | | $ | (888 | ) | | $ | — | | | $ | (1,216 | ) |
| Class N Shares | | | — | | | | 1 | | | | — | | | | — | | | | — | | | | — | | | | — | | | | (34 | ) | | | — | | | | (33 | ) |
| Amount | | $ | — | | | | — | | | $ | — | | | $ | 4 | | | $ | — | | | $ | — | | | $ | — | | | $ | (377 | ) | | $ | — | | | $ | (373 | ) |
| Class Y Shares | | | 4 | | | | 28 | | | | 39 | | | | 53 | | | | (292 | ) | | | (183 | ) | | | — | | | | 2,521 | | | | (249 | ) | | | 2,419 | |
| Amount | | $ | 37 | | | $ | 307 | | | $ | 405 | | | | 579 | | | $ | (3,071 | ) | | $ | (2,016 | ) | | $ | — | | | $ | 23,218 | | | $ | (2,629 | ) | | $ | 22,088 | |
| Tax-Free New York Fund: | | | | | | | | | | | | | | | | | | | | | | | | | | | | | | | | | | | | | | | | |
| Class A Shares | | | 76 | | | | 87 | | | | 24 | | | | 47 | | | | (10 | ) | | | (84 | ) | | | — | | | | — | | | | 90 | | | | 50 | |
| Amount | | $ | 767 | | | $ | 902 | | | $ | 233 | | | $ | 489 | | | $ | (100 | ) | | $ | (855 | ) | | $ | — | | | $ | — | | | $ | 900 | | | $ | 536 | |
| Class B Shares | | | 5 | | | | 13 | | | | 3 | | | | 6 | | | | (14 | ) | | | (26 | ) | | | — | | | | — | | | | (6 | ) | | | (7 | ) |
| Amount | | $ | 50 | | | $ | 143 | | | $ | 25 | | | $ | 60 | | | $ | (134 | ) | | $ | (260 | ) | | $ | — | | | $ | — | | | $ | (59 | ) | | $ | (57 | ) |
| Class C Shares | | | 42 | | | | 56 | | | | 4 | | | | 8 | | | | (26 | ) | | | (37 | ) | | | — | | | | — | | | | 20 | | | | 27 | |
| Amount | | $ | 423 | | | $ | 569 | | | $ | 37 | | | $ | 87 | | | $ | (263 | ) | | $ | (375 | ) | | $ | — | | | $ | — | | | $ | 197 | | | $ | 281 | |
| Total Return Bond Fund: | | | | | | | | | | | | | | | | | | | | | | | | | | | | | | | | | | | | | | | | |
| Class A Shares | | | 14,672 | | | | 23,983 | | | | 1,484 | | | | 2,209 | | | | (7,252 | ) | | | (9,885 | ) | | | — | | | | — | | | | 8,904 | | | | 16,307 | |
| Amount | | $ | 154,298 | | | $ | 253,038 | | | $ | 15,608 | | | $ | 23,262 | | | $ | (76,172 | ) | | $ | (104,112 | ) | | $ | — | | | $ | — | | | $ | 93,734 | | | $ | 172,188 | |
| Class B Shares | | | 1,172 | | | | 2,137 | | | | 162 | | | | 277 | | | | (1,009 | ) | | | (2,085 | ) | | | — | | | | — | | | | 325 | | | | 329 | |
| Amount | | $ | 12,253 | | | $ | 22,451 | | | $ | 1,692 | | | $ | 2,903 | | | $ | (10,525 | ) | | $ | (21,873 | ) | | $ | — | | | $ | — | | | $ | 3,420 | | | $ | 3,481 | |
| Class C Shares | | | 3,457 | | | | 2,749 | | | | 161 | | | | 246 | | | | (1,384 | ) | | | (2,035 | ) | | | — | | | | — | | | | 2,234 | | | | 960 | |
| Amount | | $ | 36,505 | | | $ | 29,032 | | | $ | 1,695 | | | $ | 2,593 | | | $ | (14,541 | ) | | $ | (21,486 | ) | | $ | — | | | $ | — | | | $ | 23,659 | | | $ | 10,139 | |
| Class I Shares | | | 545 | | | | 442 | | | | 9 | | | | 8 | | | | (259 | ) | | | (164 | ) | | | — | | | | — | | | | 295 | | | | 286 | |
| Amount | | $ | 5,723 | | | $ | 4,647 | | | $ | 97 | | | $ | 82 | | | $ | (2,709 | ) | | $ | (1,722 | ) | | $ | — | | | $ | — | | | $ | 3,111 | | | $ | 3,007 | |
| Class R3 Shares | | | 2 | | | | 1 | | | | — | | | | — | | | | — | | | | — | | | | — | | | | — | | | | 2 | | | | 1 | |
| Amount | | $ | 25 | | | $ | 10 | | | $ | — | | | $ | — | | | $ | — | | | $ | — | | | $ | — | | | $ | — | | | $ | 25 | | | $ | 10 | |
| Class R4 Shares | | | 668 | | | | 275 | | | | 14 | | | | 1 | | | | (27 | ) | | | (1 | ) | | | — | | | | — | | | | 655 | | | | 275 | |
| Amount | | $ | 7,106 | | | $ | 2,916 | | | $ | 153 | | | $ | 12 | | | $ | (284 | ) | | $ | (11 | ) | | $ | — | | | $ | — | | | $ | 6,975 | | | $ | 2,917 | |
| Class R5 Shares | | | 22 | | | | 13 | | | | 1 | | | | — | | | | (7 | ) | | | — | | | | — | | | | — | | | | 16 | | | | 13 | |
| Amount | | $ | 235 | | | $ | 139 | | | $ | 6 | | | $ | 1 | | | $ | (75 | ) | | $ | — | | | $ | — | | | $ | — | | | $ | 166 | | | $ | 140 | |
| Class Y Shares | | | 16,958 | | | | 14,592 | | | | 1,079 | | | | 1,552 | | | | (1,935 | ) | | | (8,988 | ) | | | — | | | | — | | | | 16,102 | | | | 7,156 | |
| Amount | | $ | 179,507 | | | $ | 155,108 | | | $ | 11,475 | | | $ | 16,519 | | | $ | (20,629 | ) | | $ | (95,635 | ) | | $ | — | | | $ | — | | | $ | 170,353 | | | $ | 75,992 | |
| U.S. Government Securities Fund: | | | | | | | | | | | | | | | | | | | | | | | | | | | | | | | | | | | | | | | | |
| Class A Shares | | | 3,253 | | | | 2,814 | | | | 135 | | | | 218 | | | | (1,812 | ) | | | (1,998 | ) | | | — | | | | — | | | | 1,576 | | | | 1,034 | |
| Amount | | $ | 29,976 | | | $ | 25,715 | | | $ | 1,238 | | | $ | 1,994 | | | $ | (16,614 | ) | | $ | (18,310 | ) | | $ | — | | | $ | — | | | $ | 14,600 | | | $ | 9,399 | |
| Class B Shares | | | 409 | | | | 239 | | | | 27 | | | | 59 | | | | (287 | ) | | | (616 | ) | | | — | | | | — | | | | 149 | | | | (318 | ) |
| Amount | | $ | 3,750 | | | $ | 2,168 | | | $ | 251 | | | $ | 533 | | | $ | (2,619 | ) | | $ | (5,602 | ) | | $ | — | | | $ | — | | | $ | 1,382 | | | $ | (2,901 | ) |
| Class C Shares | | | 1,966 | | | | 941 | | | | 29 | | | | 35 | | | | (896 | ) | | | (426 | ) | | | — | | | | — | | | | 1,099 | | | | 550 | |
| Amount | | $ | 18,063 | | | $ | 8,503 | | | $ | 265 | | | $ | 322 | | | $ | (8,161 | ) | | $ | (3,878 | ) | | $ | — | | | $ | — | | | $ | 10,167 | | | $ | 4,947 | |
| Class E Shares | | | — | | | | 80 | | | | — | | | | 89 | | | | — | | | | (468 | ) | | | — | | | | (9,418 | ) | | | — | | | | (9,717 | ) |
| Amount | | $ | — | | | $ | 732 | | | $ | — | | | $ | 814 | | | $ | — | | | $ | (4,297 | ) | | $ | — | | | $ | (114,541 | ) | | $ | — | | | $ | (117,292 | ) |
| Class H Shares | | | — | | | | 1 | | | | — | | | | 2 | | | | — | | | | (23 | ) | | | — | | | | (189 | ) | | | — | | | | (209 | ) |
| Amount | | $ | — | | | $ | 6 | | | $ | — | | | $ | 16 | | | $ | — | | | $ | (214 | ) | | $ | — | | | $ | (125 | ) | | $ | — | | | $ | (317 | ) |
| Class L Shares | | | 25 | | | | 78 | | | | 66 | | | | 141 | | | | (356 | ) | | | (521 | ) | | | — | | | | 469 | | | | (265 | ) | | | 167 | |
| Amount | | $ | 229 | | | $ | 718 | | | $ | 601 | | | $ | 1,284 | | | $ | (3,277 | ) | | $ | (4,762 | ) | | $ | — | | | $ | 1,569 | | | $ | (2,447 | ) | | $ | (1,191 | ) |
| Class M Shares | | | — | | | | 5 | | | | — | | | | 2 | | | | — | | | | (28 | ) | | | — | | | | (208 | ) | | | — | | | | (229 | ) |
| Amount | | $ | — | | | $ | 51 | | | $ | — | | | $ | 17 | | | $ | — | | | $ | (260 | ) | | $ | — | | | $ | (971 | ) | | $ | — | | | $ | (1,163 | ) |
| Class N Shares | | | — | | | | — | | | | — | | | | 1 | | | | — | | | | (2 | ) | | | — | | | | (74 | ) | | | — | | | | (75 | ) |
| Amount | | $ | — | | | $ | 6 | | | $ | — | | | $ | 6 | | | $ | — | | | $ | (17 | ) | | $ | — | | | $ | (473 | ) | | $ | — | | | $ | (478 | ) |
375
The Hartford Mutual Funds, Inc. and The Hartford Mutual Funds II, Inc.
Notes to Financial Statements — (continued)
April 30, 2008 (Unaudited)
(000’s Omitted)
| | | | | | | | | | | | | | | | | | | | | | | | | | | | | | | | | | | | | | | | | |
| | | | | | Shares Issued for
| | | | | | Shares Issued
| | | Net Increase
| |
| | | Shares Sold | | | Reinvested Dividends | | | Shares Redeemed | | | from Merger | | | (Decrease) of Shares | |
| | | 2008 | | | 2007 | | | 2008 | | | 2007 | | | 2008 | | | 2007 | | | 2008 | | | 2007 | | | 2008 | | | 2007 | |
| |
U.S. Government Securities Fund: — (continued) |
| Class Y Shares | | | 57 | | | | 69 | | | | 161 | | | | 254 | | | | (576 | ) | | | (1,033 | ) | | | — | | | | 9,390 | | | | (358 | ) | | | 8,680 | |
| Amount | | $ | 523 | | | $ | 636 | | | $ | 1,477 | | | $ | 2,314 | | | $ | (5,290 | ) | | $ | (9,414 | ) | | $ | — | | | $ | 114,541 | | | $ | (3,290 | ) | | $ | 108,077 | |
| Value Fund: | | | | | | | | | | | | | | | | | | | | | | | | | | | | | | | | | | | | | | | | |
| Class A Shares | | | 678 | | | | 1,265 | | | | 353 | | | | 396 | | | | (809 | ) | | | (1,515 | ) | | | — | | | | — | | | | 222 | | | | 146 | |
| Amount | | $ | 8,351 | | | $ | 16,816 | | | $ | 4,549 | | | $ | 4,789 | | | $ | (9,845 | ) | | $ | (20,032 | ) | | $ | — | | | $ | — | | | $ | 3,055 | | | $ | 1,573 | |
| Class B Shares | | | 83 | | | | 126 | | | | 45 | | | | 60 | | | | (144 | ) | | | (185 | ) | | | — | | | | — | | | | (16 | ) | | | 1 | |
| Amount | | $ | 993 | | | $ | 1,595 | | | $ | 568 | | | $ | 718 | | | $ | (1,728 | ) | | $ | (2,400 | ) | | $ | — | | | $ | — | | | $ | (167 | ) | | $ | (87 | ) |
| Class C Shares | | | 113 | | | | 168 | | | | 47 | | | | 64 | | | | (91 | ) | | | (256 | ) | | | — | | | | — | | | | 69 | | | | (24 | ) |
| Amount | | $ | 1,377 | | | $ | 2,133 | | | $ | 586 | | | $ | 761 | | | $ | (1,092 | ) | | $ | (3,266 | ) | | $ | — | | | $ | — | | | $ | 871 | | | $ | (372 | ) |
| Class I Shares | | | 19 | | | | 3 | | | | — | | | | — | | | | (3 | ) | | | — | | | | — | | | | — | | | | 16 | | | | 3 | |
| Amount | | $ | 227 | | | $ | 45 | | | $ | 3 | | | $ | — | | | $ | (35 | ) | | $ | — | | | $ | — | | | $ | — | | | $ | 195 | | | $ | 45 | |
| Class R3 Shares | | | — | | | | 1 | | | | — | | | | — | | | | — | | | | — | | | | — | | | | — | | | | — | | | | 1 | |
| Amount | | $ | — | | | $ | 10 | | | $ | 1 | | | $ | — | | | $ | — | | | $ | — | | | $ | — | | | $ | — | | | $ | 1 | | | $ | 10 | |
| Class R4 Shares | | | — | | | | 1 | | | | — | | | | — | | | | — | | | | — | | | | — | | | | — | | | | — | | | | 1 | |
| Amount | | $ | — | | | $ | 10 | | | $ | 1 | | | $ | — | | | $ | — | | | $ | — | | | $ | — | | | $ | — | | | $ | 1 | | | $ | 10 | |
| Class R5 Shares | | | — | | | | 1 | | | | — | | | | — | | | | — | | | | — | | | | — | | | | — | | | | — | | | | 1 | |
| Amount | | $ | — | | | $ | 10 | | | $ | 1 | | | $ | — | | | $ | — | | | $ | — | | | $ | — | | | $ | — | | | $ | 1 | | | $ | 10 | |
| Class Y Shares | | | 2,782 | | | | 15,203 | | | | 1,356 | | | | 884 | | | | (349 | ) | | | (251 | ) | | | — | | | | — | | | | 3,789 | | | | 15,836 | |
| Amount | | $ | 34,258 | | | $ | 190,615 | | | $ | 17,400 | | | $ | 10,742 | | | $ | (4,027 | ) | | $ | (3,221 | ) | | $ | — | | | $ | — | | | $ | 47,631 | | | $ | 198,136 | |
| Value Opportunities Fund: | | | | | | | | | | | | | | | | | | | | | | | | | | | | | | | | | | | | | | | | |
| Class A Shares | | | 1,066 | | | | 3,258 | | | | 1,489 | | | | 585 | | | | (2,407 | ) | | | (1,296 | ) | | | — | | | | — | | | | 148 | | | | 2,547 | |
| Amount | | $ | 14,494 | | | $ | 59,828 | | | $ | 21,647 | | | $ | 9,978 | | | $ | (31,550 | ) | | $ | (23,739 | ) | | $ | — | | | $ | — | | | $ | 4,591 | | | $ | 46,067 | |
| Class B Shares | | | 59 | | | | 334 | | | | 230 | | | | 103 | | | | (320 | ) | | | (276 | ) | | | — | | | | — | | | | (31 | ) | | | 161 | |
| Amount | | $ | 710 | | | $ | 5,628 | | | $ | 3,028 | | | $ | 1,607 | | | $ | (3,756 | ) | | $ | (4,641 | ) | | $ | — | | | $ | — | | | $ | (18 | ) | | $ | 2,594 | |
| Class C Shares | | | 207 | | | | 807 | | | | 332 | | | | 124 | | | | (541 | ) | | | (300 | ) | | | — | | | | — | | | | (2 | ) | | | 631 | |
| Amount | | $ | 2,559 | | | $ | 13,535 | | | $ | 4,356 | | | $ | 1,941 | | | $ | (6,519 | ) | | $ | (5,018 | ) | | $ | — | | | $ | — | | | $ | 396 | | | $ | 10,458 | |
| Class H Shares | | | — | | | | 2 | | | | — | | | | 21 | | | | — | | | | (16 | ) | | | — | | | | (221 | ) | | | — | | | | (214 | ) |
| Amount | | $ | — | | | $ | 44 | | | $ | — | | | $ | 322 | | | $ | — | | | $ | (269 | ) | | $ | — | | | $ | (2,519 | ) | | $ | — | | | $ | (2,422 | ) |
| Class I Shares | | | 82 | | | | 286 | | | | 47 | | | | — | | | | (287 | ) | | | (30 | ) | | | — | | | | — | | | | (158 | ) | | | 256 | |
| Amount | | $ | 1,112 | | | $ | 5,366 | | | $ | 677 | | | $ | 4 | | | $ | (3,472 | ) | | $ | (536 | ) | | $ | — | | | $ | — | | | $ | (1,683 | ) | | $ | 4,834 | |
| Class L Shares | | | 53 | | | | 105 | | | | 421 | | | | 173 | | | | (327 | ) | | | (444 | ) | | | — | | | | 717 | | | | 147 | | | | 551 | |
| Amount | | $ | 699 | | | $ | 1,926 | | | $ | 6,146 | | | $ | 2,949 | | | $ | (4,283 | ) | | $ | (8,186 | ) | | $ | — | | | $ | 9,953 | | | $ | 2,562 | | | $ | 6,642 | |
| Class M Shares | | | — | | | | 6 | | | | — | | | | 40 | | | | — | | | | (34 | ) | | | — | | | | (425 | ) | | | — | | | | (413 | ) |
| Amount | | $ | — | | | $ | 97 | | | $ | — | | | $ | 621 | | | $ | — | | | $ | (550 | ) | | $ | — | | | $ | (5,620 | ) | | $ | — | | | $ | (5,452 | ) |
| Class N Shares | | | — | | | | 1 | | | | — | | | | 12 | | | | — | | | | (7 | ) | | | — | | | | (129 | ) | | | — | | | | (123 | ) |
| Amount | | $ | — | | | $ | 12 | | | $ | — | | | $ | 189 | | | $ | — | | | $ | (110 | ) | | $ | — | | | $ | (1,814 | ) | | $ | — | | | $ | (1,723 | ) |
| Class R3 Shares | | | 83 | | | | 7 | | | | 1 | | | | — | | | | (20 | ) | | | — | | | | — | | | | — | | | | 64 | | | | 7 | |
| Amount | | $ | 1,079 | | | $ | 125 | | | $ | 14 | | | $ | — | | | $ | (258 | ) | | $ | — | | | $ | — | | | $ | — | | | $ | 835 | | | $ | 125 | |
| Class R4 Shares | | | 148 | | | | 40 | | | | 9 | | | | — | | | | (9 | ) | | | (1 | ) | | | — | | | | — | | | | 148 | | | | 39 | |
| Amount | | $ | 2,002 | | | $ | 748 | | | $ | 129 | | | $ | — | | | $ | (120 | ) | | $ | (20 | ) | | $ | — | | | $ | — | | | $ | 2,011 | | | $ | 728 | |
| Class R5 Shares | | | — | | | | 1 | | | | — | | | | — | | | | — | | | | — | | | | — | | | | — | | | | — | | | | 1 | |
| Amount | | $ | — | | | $ | 10 | | | $ | 2 | | | $ | — | | | $ | — | | | $ | — | | | $ | — | | | $ | — | | | $ | 2 | | | $ | 10 | |
| Class Y Shares | | | 610 | | | | 1,422 | | | | 262 | | | | 248 | | | | (71 | ) | | | (5,816 | ) | | | — | | | | — | | | | 801 | | | | (4,146 | ) |
| Amount | | $ | 8,078 | | | $ | 26,945 | | | $ | 3,921 | | | $ | 4,266 | | | $ | (931 | ) | | $ | (103,724 | ) | | $ | — | | | $ | �� | | | $ | 11,068 | | | $ | (72,513 | ) |
The following reflects the conversion of Class B Shares into Class A Shares (reflected as Class A Shares issued and Class B shares redeemed) for the six-month period ended April 30, 2008 and the year ended October 31, 2007:
| | | | | | | | | | | | | | | | | |
| | | For the Six-Month
| | | For the
| |
| | | Period Ended
| | | Year Ended
| |
| | | April 30, 2008 | | | October 31, 2007 | |
Fund | | Shares | | | Dollars | | | Shares | | | Dollars | |
| |
| Advisers Fund — Class B to Class A | | $ | 1,165 | | | $ | 17,622 | | | $ | 3,163 | | | $ | 55,920 | |
| Balanced Allocation Fund — Class B to Class A | | | 92 | | | | 1,061 | | | | 147 | | | | 1,805 | |
| Balanced Income Fund — Class B to Class A | | | 0 | | | | 2 | | | | — | | | | — | |
| Capital Appreciation Fund — Class B to Class A | | | 1,845 | | | | 69,514 | | | | 1,894 | | | | 76,650 | |
| Capital Appreciation II Fund — Class B to Class A | | | 45 | | | | 624 | | | | 49 | | | | 736 | |
| Checks and Balances Fund — Class B to Class A | | | 15 | | | | 148 | | | | 9 | | | | 90 | |
| Conservative Allocation Fund — Class B to Class A | | | 15 | | | | 157 | | | | 22 | | | | 247 | |
| Disciplined Equity Fund — Class B to Class A | | | 138 | | | | 1,880 | | | | 179 | | | | 2,551 | |
| Dividend and Growth Fund — Class B to Class A | | | 358 | | | | 7,180 | | | | 674 | | | | 14,747 | |
376
| | | | | | | | | | | | | | | | | |
| | | For the Six-Month
| | | For the
| |
| | | Period Ended
| | | Year Ended
| |
| | | April 30, 2008 | | | October 31, 2007 | |
Fund | | Shares | | | Dollars | | | Shares | | | Dollars | |
| |
| Equity Growth Allocation Fund — Class B to Class A | | $ | 14 | | | $ | 174 | | | $ | 16 | | | $ | 232 | |
| Equity Income Fund — Class B to Class A | | | 32 | | | | 431 | | | | 67 | | | | 976 | |
| Floating Rate Fund — Class B to Class A | | | 44 | | | | 413 | | | | 65 | | | | 654 | |
| Fundamental Growth Fund — Class B to Class A | | | 1 | | | | 11 | | | | 7 | | | | 89 | |
| Global Communications Fund — Class B to Class A | | | 5 | | | | 45 | | | | 13 | | | | 118 | |
| Global Financial Services Fund — Class B to Class A | | | 3 | | | | 34 | | | | 8 | | | | 110 | |
| Global Growth Fund — Class B to Class A | | | 371 | | | | 7,022 | | | | 241 | | | | 5,041 | |
| Global Health Fund — Class B to Class A | | | 20 | | | | 327 | | | | 49 | | | | 893 | |
| Global Technology Fund — Class B to Class A | | | 19 | | | | 115 | | | | 32 | | | | 206 | |
| Growth Allocation Fund — Class B to Class A | | | 53 | | | | 639 | | | | 95 | | | | 1,276 | |
| Growth Fund — Class B to Class A | | | 23 | | | | 404 | | | | 37 | | | | 676 | |
| Growth Opportunities Fund — Class B to Class A | | | 16 | | | | 487 | | | | 30 | | | | 936 | |
| High Yield Fund — Class B to Class A | | | 140 | | | | 1,044 | | | | 237 | | | | 1,903 | |
| Income Allocation Fund — Class B to Class A | | | 1 | | | | 12 | | | | 11 | | | | 106 | |
| Income Fund — Class B to Class A | | | 20 | | | | 194 | | | | 26 | | | | 269 | |
| Inflation Plus Fund — Class B to Class A | | | 22 | | | | 245 | | | | 36 | | | | 373 | |
| International Growth Fund — Class B to Class A | | | 35 | | | | 478 | | | | 87 | | | | 1,369 | |
| International Opportunities Fund — Class B to Class A | | | 199 | | | | 3,311 | | | | 135 | | | | 2,461 | |
| International Small Company Fund — Class B to Class A | | | 14 | | | | 194 | | | | 31 | | | | 499 | |
| LargeCap Growth Fund — Class B to Class A | | | 0 | | | | 2 | | | | — | | | | 2 | |
| MidCap Fund — Class B to Class A | | | 990 | | | | 19,820 | | | | 923 | | | | 23,153 | |
| MidCap Growth Fund — Class B to Class A | | | 6 | | | | 58 | | | | 10 | | | | 118 | |
| MidCap Value Fund — Class B to Class A | | | 67 | | | | 690 | | | | 86 | | | | 1,236 | |
| Money Market Fund — Class B to Class A | | | 2,149 | | | | 2,149 | | | | 2,423 | | | | 2,423 | |
| Retirement Income Fund — Class B to Class A | | | 0 | | | | 3 | | | | — | | | | — | |
| Select MidCap Value Fund — Class B to Class A | | | 2 | | | | 21 | | | | 6 | | | | 72 | |
| Select SmallCap Value Fund — Class B to Class A | | | 0 | | | | 5 | | | | 1 | | | | 7 | |
| Short Duration Fund — Class B to Class A | | | 28 | | | | 271 | | | | 39 | | | | 389 | |
| Small Company Fund — Class B to Class A | | | 290 | | | | 5,438 | | | | 206 | | | | 4,633 | |
| SmallCap Growth Fund — Class B to Class A | | | 5 | | | | 129 | | | | 11 | | | | 380 | |
| Stock Fund — Class B to Class A | | | 734 | | | | 15,702 | | | | 1,464 | | | | 33,670 | |
| Strategic Income Fund — Class B to Class A | | | 1 | | | | 7 | | | | — | | | | — | |
| Target Retirement 2010 Fund — Class B to Class A | | | 0 | | | | 4 | | | | — | | | | 1 | |
| Target Retirement 2020 Fund — Class B to Class A | | | 0 | | | | 3 | | | | 2 | | | | 26 | |
| Tax-Free Minnesota Fund — Class B to Class A | | | 0 | | | | 2 | | | | — | | | | — | |
| Tax-Free National Fund — Class B to Class A | | | 2 | | | | 22 | | | | 14 | | | | 155 | |
| Total Return Bond Fund — Class B to Class A | | | 162 | | | | 1,690 | | | | 293 | | | | 3,090 | |
| U.S. Government Securities Fund — Class B to Class A | | | 51 | | | | 466 | | | | 89 | | | | 813 | |
| Value Fund — Class B to Class A | | | 14 | | | | 174 | | | | 14 | | | | 179 | |
| Value Opportunities Fund — Class B to Class A | | | 31 | | | | 405 | | | | 42 | | | | 765 | |
The Funds, except for Money Market Fund, participate in a $1 billion committed revolving line of credit facility. The facility is to be used for temporary or emergency purposes. Under the arrangement, the Funds are required to own securities having a market value in excess of 300% of the total bank borrowings. The interest rate on borrowings varies depending on the nature of the loan. The facility also requires a fee to be paid based on the amount of the commitment. During the six-month period ended April 30, 2008, the Funds did not have any borrowings under this facility.
On November 7, 2007, the Board of Directors (the “Board”) of The Hartford Mutual Funds, Inc. (the “Company”) approved an Agreement and Plan of Reorganization that provided for the reorganization of a series of the Company, The Hartford MidCap Growth Fund into The Hartford Select MidCap Growth Fund. The Reorganization did not require shareholder approval and was approved by the Board in order to eliminate the Company’s redundant product offerings. The reorganization took place on February 22, 2008, at which time The Hartford MidCap Growth Fund was merged into The Hartford Select MidCap Growth Fund. The Hartford Select MidCap Growth Fund was renamed The Hartford MidCap Growth Fund.
377
The Hartford Mutual Funds, Inc. and The Hartford Mutual Funds II, Inc.
Notes to Financial Statements — (continued)
April 30, 2008 (Unaudited)
(000’s Omitted)
The merger was accomplished by a tax free exchange as detailed below:
| | | | | | | | | | | | | | | | | | | | | |
Hartford Select MidCap Growth Fund* | | Class A | | | Class B | | | Class C | | | Class Y | | | Total | |
| |
| Net assets of The Hartford MidCap Growth Fund on February 22, 2008 | | $ | 13,927 | | | $ | 592 | | | $ | 1,147 | | | $ | 118 | | | $ | 15,784 | |
| The Hartford MidCap Growth Fund shares exchanged | | | 1,410 | | | | 61 | | | | 118 | | | | 12 | | | | 1,601 | |
| The Hartford Select MidCap Growth Fund shares exchanged | | | 1,423 | | | | 62 | | | | 120 | | | | 12 | | | | 1,617 | |
| Net Assets of The Hartford Select MidCap Growth Fund immediately before the merger | | $ | 19,460 | | | $ | 3,779 | | | $ | 3,996 | | | $ | 102 | | | $ | 27,337 | |
| Net Assets of The Hartford Select MidCap Growth Fund immediately after the merger | | $ | 33,387 | | | $ | 4,371 | | | $ | 5,143 | | | $ | 220 | | | $ | 43,121 | |
The Hartford MidCap Growth Fund had the following unrealized depreciation, accumulated net realized losses and capital stock as of February 22, 2008:
| | | | | | | | | | | | | |
| | | Unrealized
| | Accumulated Net
| | |
Fund | | Depreciation | | Realized Losses | | Capital Stock |
| |
| The Hartford MidCap Growth Fund | | $ | (1,016 | ) | | $ | (28 | ) | | $ | 16,828 | |
| | |
| * | | Following the merger, The Hartford Select MidCap Growth Fund was renamed The Hartford MidCap Growth Fund. |
378
The Hartford Mutual Funds, Inc. and The Hartford Mutual Funds II, Inc.
Financial Highlights
| | | | | | | | | | | | | | | | | | | | | | | | | | | | | | | | | | | | | | | | | | | | | | | | | | | | | | | | | | | | | | | | | | | | | | | | | |
| | | — Selected Per-Share Data (a) — | | — Ratios and Supplemental Data — |
| | | | | | | | | | | | | | | | | | | | | | | | | | | | | Ratio of
| | Ratio of
| | Ratio of
| | | | |
| | | | | | | | | | | | | | | | | | | | | | | | | | | | | Expenses
| | Expenses
| | Expenses
| | | | |
| | | | | | | | | | | | | | | | | | | | | | | | | | | | | to Average
| | to Average
| | to Average
| | | | |
| | | | | | | | | Net
| | | | | | | | | | | | | | | | | | | | Net Assets
| | Net Assets
| | Net Assets
| | | | |
| | | | | | | | | Realized
| | | | | | | | | | | | Net
| | | | | | | | Before
| | After
| | After
| | Ratio of
| | |
| | | | | | | | | and
| | | | | | Distributions
| | | | | | Increase
| | | | | | | | Waivers and
| | Waivers and
| | Waivers and
| | Net
| | |
| | | Net Asset
| | Net
| | Payments
| | Unrealized
| | Total
| | Dividends
| | from
| | | | | | (Decrease)
| | Net Asset
| | | | Net Assets
| | Reimbursements
| | Reimbursements
| | Reimbursements
| | Investment
| | |
| | | Value at
| | Investment
| | from
| | Gain
| | from
| | from Net
| | Realized
| | Distributions
| | | | in Net
| | Value at
| | | | at End of
| | and Including
| | and Including
| | and Excluding
| | Income
| | Portfolio
|
| | | Beginning
| | Income
| | (to)
| | (Loss) on
| | Investment
| | Investment
| | Capital
| | from
| | Total
| | Asset
| | End
| | Total
| | Period
| | Interest
| | Interest
| | Interest
| | to Average
| | Turnover
|
| | | of Period | | (Loss) | | Affiliate | | Investments | | Operations | | Income | | Gains | | Capital | | Distributions | | Value | | of Period | | Return (b) | | (000’s) | | Expense (d) | | Expense (d) | | Expense (d) | | Net Assets | | Rate (c) |
The Hartford Advisors Fund | | | | | | | | | | | | | | | | | | | | | | | | | | | | |
| For the Six-Month Period Ended April 30, 2008 (Unaudited) | | | | | | | | | | | | | | | | | | | | | | | | | | | | |
| Class A | | $ | 18.52 | | | $ | 0.13 | | | $ | — | | | $ | (1.37 | ) | | $ | (1.24 | ) | | $ | (0.13 | ) | | $ | (1.99 | ) | | $ | — | | | $ | (2.12 | ) | | $ | (3.36 | ) | | $ | 15.16 | | | | (7.11 | )%(f) | | $ | 936,121 | | | | 1.17 | %(e) | | | 1.17 | %(e) | | | 1.17 | %(e) | | | 1.73 | %(e) | | | 36 | % |
| Class B | | | 18.34 | | | | 0.07 | | | | — | | | | (1.36 | ) | | | (1.29 | ) | | | (0.06 | ) | | | (1.99 | ) | | | — | | | | (2.05 | ) | | | (3.34 | ) | | | 15.00 | | | | (7.49 | )(f) | | | 184,884 | | | | 2.01 | (e) | | | 2.01 | (e) | | | 2.01 | (e) | | | 0.89 | (e) | | | — | |
| Class C | | | 18.51 | | | | 0.08 | | | | — | | | | (1.37 | ) | | | (1.29 | ) | | | (0.07 | ) | | | (1.99 | ) | | | — | | | | (2.06 | ) | | | (3.35 | ) | | | 15.16 | | | | (7.39 | )(f) | | | 171,612 | | | | 1.86 | (e) | | | 1.86 | (e) | | | 1.86 | (e) | | | 1.04 | (e) | | | — | |
| Class R3 | | | 18.70 | | | | 0.10 | | | | — | | | | (1.38 | ) | | | (1.28 | ) | | | (0.11 | ) | | | (1.99 | ) | | | — | | | | (2.10 | ) | | | (3.38 | ) | | | 15.32 | | | | (7.24 | )(f) | | | 12 | | | | 1.60 | (e) | | | 1.43 | (e) | | | 1.43 | (e) | | | 1.46 | (e) | | | — | |
| Class R4 | | | 18.70 | | | | 0.14 | | | | — | | | | (1.38 | ) | | | (1.24 | ) | | | (0.14 | ) | | | (1.99 | ) | | | — | | | | (2.13 | ) | | | (3.37 | ) | | | 15.33 | | | | (7.03 | )(f) | | | 198 | | | | 1.14 | (e) | | | 1.13 | (e) | | | 1.13 | (e) | | | 1.74 | (e) | | | — | |
| Class R5 | | | 18.71 | | | | 0.16 | | | | — | | | | (1.38 | ) | | | (1.22 | ) | | | (0.16 | ) | | | (1.99 | ) | | | — | | | | (2.15 | ) | | | (3.37 | ) | | | 15.34 | | | | (6.93 | )(f) | | | 10 | | | | 0.80 | (e) | | | 0.80 | (e) | | | 0.80 | (e) | | | 2.09 | (e) | | | — | |
| Class Y | | | 18.71 | | | | 0.17 | | | | — | | | | (1.38 | ) | | | (1.21 | ) | | | (0.17 | ) | | | (1.99 | ) | | | — | | | | (2.16 | ) | | | (3.37 | ) | | | 15.34 | | | | (6.88 | )(f) | | | 16,646 | | | | 0.71 | (e) | | | 0.71 | (e) | | | 0.71 | (e) | | | 2.20 | (e) | | | — | |
| For the Year Ended October 31, 2007 | | | | | | | | | | | | | | | | | | | | | | | | | | | | |
| Class A | | | 16.74 | | | | 0.30 | | | | 0.01 | | | | 1.87 | | | | 2.18 | | | | (0.31 | ) | | | (0.09 | ) | | | — | | | | (0.40 | ) | | | 1.78 | | | | 18.52 | | | | 13.23 | (i) | | | 1,088,361 | | | | 1.15 | | | | 1.10 | | | | 1.10 | | | | 1.67 | | | | 84 | |
| Class B | | | 16.57 | | | | 0.16 | | | | 0.02 | | | | 1.84 | | | | 2.02 | | | | (0.16 | ) | | | (0.09 | ) | | | — | | | | (0.25 | ) | | | 1.77 | | | | 18.34 | | | | 12.32 | (i) | | | 248,020 | | | | 1.96 | | | | 1.91 | | | | 1.91 | | | | 0.85 | | | | — | |
| Class C | | | 16.73 | | | | 0.18 | | | | 0.01 | | | | 1.87 | | | | 2.06 | | | | (0.19 | ) | | | (0.09 | ) | | | — | | | | (0.28 | ) | | | 1.78 | | | | 18.51 | | | | 12.44 | (i) | | | 206,799 | | | | 1.83 | | | | 1.78 | | | | 1.78 | | | | 0.98 | | | | — | |
| Class Y | | | 16.91 | | | | 0.38 | | | | 0.01 | | | | 1.89 | | | | 2.28 | | | | (0.39 | ) | | | (0.09 | ) | | | — | | | | (0.48 | ) | | | 1.80 | | | | 18.71 | | | | 13.73 | (i) | | | 19,948 | | | | 0.69 | | | | 0.64 | | | | 0.64 | | | | 2.13 | | | | — | |
| From (commencement of operations) December 22, 2006, through October 31, 2007 | | | | | | | | | | | | | | | | | | | | | | | | | | | | |
| Class R3 | | | 17.24 | | | | 0.21 | | | | — | | | | 1.44 | | | | 1.65 | | | | (0.19 | ) | | | — | | | | — | | | | (0.19 | ) | | | 1.46 | | | | 18.70 | | | | 9.62 | (f) | | | 11 | | | | 1.45 | (e) | | | 1.40 | (e) | | | 1.40 | (e) | | | 1.38 | (e) | | | — | |
| Class R4 | | | 17.24 | | | | 0.25 | | | | — | | | | 1.44 | | | | 1.69 | | | | (0.23 | ) | | | — | | | | — | | | | (0.23 | ) | | | 1.46 | | | | 18.70 | | | | 9.88 | (f) | | | 53 | | | | 1.11 | (e) | | | 1.06 | (e) | | | 1.06 | (e) | | | 1.68 | (e) | | | — | |
| Class R5 | | | 17.24 | | | | 0.31 | | | | — | | | | 1.43 | | | | 1.74 | | | | (0.27 | ) | | | — | | | | — | | | | (0.27 | ) | | | 1.47 | | | | 18.71 | | | | 10.17 | (f) | | | 11 | | | | 0.85 | (e) | | | 0.80 | (e) | | | 0.80 | (e) | | | 1.98 | (e) | | | — | |
| For the Year Ended October 31, 2006 | | | | | | | | | | | | | | | | | | | | | | | | | | | | |
| Class A | | | 15.34 | | | | 0.31 | | | | — | | | | 1.38 | | | | 1.69 | | | | (0.29 | ) | | | — | | | | — | | | | (0.29 | ) | | | 1.40 | | | | 16.74 | | | | 11.16 | | | | 1,110,324 | | | | 1.17 | | | | 1.12 | | | | 1.12 | | | | 1.86 | | | | 99 | |
| Class B | | | 15.19 | | | | 0.18 | | | | — | | | | 1.37 | | | | 1.55 | | | | (0.17 | ) | | | — | | | | — | | | | (0.17 | ) | | | 1.38 | | | | 16.57 | | | | 10.25 | | | | 341,772 | | | | 1.96 | | | | 1.91 | | | | 1.91 | | | | 1.07 | | | | — | |
| Class C | | | 15.34 | | | | 0.19 | | | | — | | | | 1.38 | | | | 1.57 | | | | (0.18 | ) | | | — | | | | — | | | | (0.18 | ) | | | 1.39 | | | | 16.73 | | | | 10.32 | | | | 219,580 | | | | 1.87 | | | | 1.82 | | | | 1.82 | | | | 1.16 | | | | — | |
| Class Y | | | 15.50 | | | | 0.38 | | | | — | | | | 1.40 | | | | 1.78 | | | | (0.37 | ) | | | — | | | | — | | | | (0.37 | ) | | | 1.41 | | | | 16.91 | | | | 11.63 | | | | 17,710 | | | | 0.71 | | | | 0.66 | | | | 0.66 | | | | 2.32 | | | | — | |
| For the Year Ended October 31, 2005 (h) | | | | | | | | | | | | | | | | | | | | | | | | | | | | |
| Class A | | | 14.57 | | | | 0.26 | | | | — | | | | 0.80 | | | | 1.06 | | | | (0.29 | ) | | | — | | | | — | | | | (0.29 | ) | | | 0.77 | | | | 15.34 | | | | 7.30 | | | | 1,222,944 | | | | 1.21 | | | | 1.19 | | | | 1.19 | | | | 1.73 | | | | 66 | |
| Class B | | | 14.43 | | | | 0.14 | | | | — | | | | 0.79 | | | | 0.93 | | | | (0.17 | ) | | | — | | | | — | | | | (0.17 | ) | | | 0.76 | | | | 15.19 | | | | 6.48 | | | | 437,462 | | | | 1.99 | | | | 1.98 | | | | 1.98 | | | | 0.95 | | | | — | |
| Class C | | | 14.56 | | | | 0.16 | | | | — | | | | 0.80 | | | | 0.96 | | | | (0.18 | ) | | | — | | | | — | | | | (0.18 | ) | | | 0.78 | | | | 15.34 | | | | 6.63 | | | | 253,605 | | | | 1.91 | | | | 1.89 | | | | 1.89 | | | | 1.06 | | | | — | |
| Class Y | | | 14.72 | | | | 0.33 | | | | — | | | | 0.81 | | | | 1.14 | | | | (0.36 | ) | | | — | | | | — | | | | (0.36 | ) | | | 0.78 | | | | 15.50 | | | | 7.78 | | | | 15,342 | | | | 0.75 | | | | 0.74 | | | | 0.74 | | | | 2.13 | | | | — | |
| For the Year Ended October 31, 2004 (h) | | | | | | | | | | | | | | | | | | | | | | | | | | | | |
| Class A | | | 14.19 | | | | 0.15 | | | | 0.03 | | | | 0.38 | | | | 0.56 | | | | (0.18 | ) | | | — | | | | — | | | | (0.18 | ) | | | 0.38 | | | | 14.57 | | | | 3.93 | (i) | | | 1,539,264 | | | | 1.22 | | | | 1.22 | | | | 1.22 | | | | 1.23 | | | | 42 | |
| Class B | | | 14.05 | | | | 0.03 | | | | 0.04 | | | | 0.38 | | | | 0.45 | | | | (0.07 | ) | | | — | | | | — | | | | (0.07 | ) | | | 0.38 | | | | 14.43 | | | | 3.21 | (i) | | | 550,499 | | | | 1.95 | | | | 1.95 | | | | 1.95 | | | | 0.50 | | | | — | |
| Class C | | | 14.18 | | | | 0.03 | | | | 0.06 | | | | 0.37 | | | | 0.46 | | | | (0.08 | ) | | | — | | | | — | | | | (0.08 | ) | | | 0.38 | | | | 14.56 | | | | 3.27 | (i) | | | 355,711 | | | | 1.86 | | | | 1.86 | | | | 1.86 | | | | 0.58 | | | | — | |
| Class Y | | | 14.37 | | | | 0.25 | | | | — | | | | 0.36 | | | | 0.61 | | | | (0.26 | ) | | | — | | | | — | | | | (0.26 | ) | | | 0.35 | | | | 14.72 | | | | 4.22 | | | | 13,587 | | | | 0.74 | | | | 0.74 | | | | 0.74 | | | | 1.71 | | | | — | |
| For the Year Ended October 31, 2003 (h) | | | | | | | | | | | | | | | | | | | | | | | | | | | | |
| Class A | | | 12.67 | | | | 0.19 | | | | — | | | | 1.52 | | | | 1.71 | | | | (0.19 | ) | | | — | | | | — | | | | (0.19 | ) | | | 1.52 | | | | 14.19 | | | | 13.62 | | | | 1,470,569 | | | | 1.40 | | | | 1.39 | | | | 1.39 | | | | 1.44 | | | | 46 | |
| Class B | | | 12.54 | | | | 0.09 | | | | — | | | | 1.51 | | | | 1.60 | | | | (0.09 | ) | | | — | | | | — | | | | (0.09 | ) | | | 1.51 | | | | 14.05 | | | | 12.86 | | | | 593,179 | | | | 2.13 | | | | 2.12 | | | | 2.12 | | | | 0.72 | | | | — | |
| Class C | | | 12.66 | | | | 0.11 | | | | — | | | | 1.52 | | | | 1.63 | | | | (0.11 | ) | | | — | | | | — | | | | (0.11 | ) | | | 1.52 | | | | 14.18 | | | | 12.92 | | | | 421,814 | | | | 2.00 | | | | 2.00 | | | | 2.00 | | | | 0.84 | | | | — | |
| Class Y | | | 12.82 | | | | 0.27 | | | | — | | | | 1.54 | | | | 1.81 | | | | (0.26 | ) | | | — | | | | — | | | | (0.26 | ) | | | 1.55 | | | | 14.37 | | | | 14.28 | | | | 8,714 | | | | 0.81 | | | | 0.81 | | | | 0.81 | | | | 1.98 | | | | — | |
The Hartford Balanced Allocation Fund (g) | | | | | | | | | | | | | | | | | | | | | | | | | | | | |
| For the Six-Month Period Ended April 30, 2008 (Unaudited) | | | | | | | | | | | | | | | | | | | | | | | | | | | | |
| Class A | | | 13.10 | | | | 0.15 | | | | — | | | | (0.81 | ) | | | (0.66 | ) | | | (0.37 | ) | | | (0.58 | ) | | | — | | | | (0.95 | ) | | | (1.61 | ) | | | 11.49 | | | | (5.23 | )(f) | | | 610,092 | | | | 0.53 | (e) | | | 0.53 | (e) | | | 0.53 | (e) | | | 2.43 | (e) | | | 6 | |
| Class B | | | 13.06 | | | | 0.11 | | | | — | | | | (0.81 | ) | | | (0.70 | ) | | | (0.32 | ) | | | (0.58 | ) | | | — | | | | (0.90 | ) | | | (1.60 | ) | | | 11.46 | | | | (5.55 | )(f) | | | 130,964 | | | | 1.35 | (e) | | | 1.35 | (e) | | | 1.35 | (e) | | | 1.68 | (e) | | | — | |
| Class C | | | 13.06 | | | | 0.11 | | | | — | | | | (0.81 | ) | | | (0.70 | ) | | | (0.33 | ) | | | (0.58 | ) | | | — | | | | (0.91 | ) | | | (1.61 | ) | | | 11.45 | | | | (5.61 | )(f) | | | 223,352 | | | | 1.28 | (e) | | | 1.28 | (e) | | | 1.28 | (e) | | | 1.70 | (e) | | | — | |
| Class I | | | 13.09 | | | | 0.25 | | | | — | | | | (0.88 | ) | | | (0.63 | ) | | | (0.39 | ) | | | (0.58 | ) | | | — | | | | (0.97 | ) | | | (1.60 | ) | | | 11.49 | | | | (5.01 | )(f) | | | 3,151 | | | | 0.21 | (e) | | | 0.21 | (e) | | | 0.21 | (e) | | | 1.49 | (e) | | | — | |
| Class R3 | | | 13.08 | | | | 0.25 | | | | — | | | | (0.93 | ) | | | (0.68 | ) | | | (0.36 | ) | | | (0.58 | ) | | | — | | | | (0.94 | ) | | | (1.62 | ) | | | 11.46 | | | | (5.39 | )(f) | | | 513 | | | | 0.94 | (e) | | | 0.94 | (e) | | | 0.94 | (e) | | | 1.12 | (e) | | | — | |
| Class R4 | | | 13.10 | | | | 0.27 | | | | — | | | | (0.93 | ) | | | (0.66 | ) | | | (0.37 | ) | | | (0.58 | ) | | | — | | | | (0.95 | ) | | | (1.61 | ) | | | 11.49 | | | | (5.22 | )(f) | | | 7,579 | | | | 0.59 | (e) | | | 0.59 | (e) | | | 0.59 | (e) | | | 1.96 | (e) | | | — | |
| Class R5 | | | 13.10 | | | | 0.28 | | | | — | | | | (0.91 | ) | | | (0.63 | ) | | | (0.39 | ) | | | (0.58 | ) | | | — | | | | (0.97 | ) | | | (1.60 | ) | | | 11.50 | | | | (5.03 | )(f) | | | 2,941 | | | | 0.29 | (e) | | | 0.29 | (e) | | | 0.29 | (e) | | | 1.86 | (e) | | | — | |
| For the Year Ended October 31, 2007 | | | | | | | | | | | | | | | | | | | | | | | | | | | | |
| Class A | | | 12.01 | | | | 0.27 | | | | — | | | | 1.45 | | | | 1.72 | | | | (0.36 | ) | | | (0.27 | ) | | | — | | | | (0.63 | ) | | | 1.09 | | | | 13.10 | | | | 14.95 | | | | 608,443 | | | | 0.54 | | | | 0.54 | | | | 0.54 | | | | 2.09 | | | | 34 | |
| Class B | | | 11.98 | | | | 0.18 | | | | — | | | | 1.44 | | | | 1.62 | | | | (0.27 | ) | | | (0.27 | ) | | | — | | | | (0.54 | ) | | | 1.08 | | | | 13.06 | | | | 14.03 | | | | 135,541 | | | | 1.36 | | | | 1.33 | | | | 1.33 | | | | 1.34 | | | | — | |
| Class C | | | 11.98 | | | | 0.18 | | | | — | | | | 1.44 | | | | 1.62 | | | | (0.27 | ) | | | (0.27 | ) | | | — | | | | (0.54 | ) | | | 1.08 | | | | 13.06 | | | | 14.07 | | | | 225,155 | | | | 1.29 | | | | 1.29 | | | | 1.29 | | | | 1.35 | | | | — | |
| Class I | | | 12.00 | | | | 0.26 | | | | — | | | | 1.50 | | | | 1.76 | | | | (0.40 | ) | | | (0.27 | ) | | | — | | | | (0.67 | ) | | | 1.09 | | | | 13.09 | | | | 15.35 | | | | 927 | | | | 0.22 | | | | 0.22 | | | | 0.22 | | | | 1.88 | | | | — | |
| From (commencement of operations) December 22, 2006, through October 31, 2007 | | | | | | | | | | | | | | | | | | | | | | | | | | | | |
| Class R3 | | | 11.89 | | | | 0.08 | | | | — | | | | 1.25 | | | | 1.33 | | | | (0.14 | ) | | | — | | | | — | | | | (0.14 | ) | | | 1.19 | | | | 13.08 | | | | 11.29 | (f) | | | 115 | | | | 0.93 | (e) | | | 0.93 | (e) | | | 0.93 | (e) | | | 0.94 | (e) | | | — | |
| Class R4 | | | 11.89 | | | | 0.14 | | | | — | | | | 1.23 | | | | 1.37 | | | | (0.16 | ) | | | — | | | | — | | | | (0.16 | ) | | | 1.21 | | | | 13.10 | | | | 11.61 | (f) | | | 2,679 | | | | 0.66 | (e) | | | 0.66 | (e) | | | 0.66 | (e) | | | 1.23 | (e) | | | — | |
| Class R5 | | | 11.89 | | | | 0.14 | | | | — | | | | 1.25 | | | | 1.39 | | | | (0.18 | ) | | | — | | | | — | | | | (0.18 | ) | | | 1.21 | | | | 13.10 | | | | 11.79 | (f) | | | 725 | | | | 0.36 | (e) | | | 0.36 | (e) | | | 0.36 | (e) | | | 1.54 | (e) | | | — | |
| For the Year Ended October 31, 2006 | | | | | | | | | | | | | | | | | | | | | | | | | | | | |
| Class A | | | 10.95 | | | | 0.18 | | | | — | | | | 1.12 | | | | 1.30 | | | | (0.22 | ) | | | (0.02 | ) | | | — | | | | (0.24 | ) | | | 1.06 | | | | 12.01 | | | | 11.98 | | | | 453,492 | | | | 0.62 | | | | 0.62 | | | | 0.62 | | | | 1.52 | | | | 15 | |
| Class B | | | 10.92 | | | | 0.10 | | | | — | | | | 1.11 | | | | 1.21 | | | | (0.13 | ) | | | (0.02 | ) | | | — | | | | (0.15 | ) | | | 1.06 | | | | 11.98 | | | | 11.22 | | | | 109,117 | | | | 1.44 | | | | 1.36 | | | | 1.36 | | | | 0.82 | | | | — | |
| Class C | | | 10.92 | | | | 0.11 | | | | — | | | | 1.11 | | | | 1.22 | | | | (0.14 | ) | | | (0.02 | ) | | | — | | | | (0.16 | ) | | | 1.06 | | | | 11.98 | | | | 11.24 | | | | 171,073 | | | | 1.38 | | | | 1.36 | | | | 1.36 | | | | 0.78 | | | | — | |
379
The Hartford Mutual Funds, Inc. and The Hartford Mutual Funds II, Inc.
Financial Highlights — (continued)
| | | �� | | | | | | | | | | | | | | | | | | | | | | | | | | | | | | | | | | | | | | | | | | | | | | | | | | | | | | | | | | | | | | | | | | | | | | |
| | | — Selected Per-Share Data (a) — | | — Ratios and Supplemental Data — |
| | | | | | | | | | | | | | | | | | | | | | | | | | | | | Ratio of
| | Ratio of
| | Ratio of
| | | | |
| | | | | | | | | | | | | | | | | | | | | | | | | | | | | Expenses
| | Expenses
| | Expenses
| | | | |
| | | | | | | | | | | | | | | | | | | | | | | | | | | | | to Average
| | to Average
| | to Average
| | | | |
| | | | | | | | | Net
| | | | | | | | | | | | | | | | | | | | Net Assets
| | Net Assets
| | Net Assets
| | | | |
| | | | | | | | | Realized
| | | | | | | | | | | | Net
| | | | | | | | Before
| | After
| | After
| | Ratio of
| | |
| | | | | | | | | and
| | | | | | Distributions
| | | | | | Increase
| | | | | | | | Waivers and
| | Waivers and
| | Waivers and
| | Net
| | |
| | | Net Asset
| | Net
| | Payments
| | Unrealized
| | Total
| | Dividends
| | from
| | | | | | (Decrease)
| | Net Asset
| | | | Net Assets
| | Reimbursements
| | Reimbursements
| | Reimbursements
| | Investment
| | |
| | | Value at
| | Investment
| | from
| | Gain
| | from
| | from Net
| | Realized
| | Distributions
| | | | in Net
| | Value at
| | | | at End of
| | and Including
| | and Including
| | and Excluding
| | Income
| | Portfolio
|
| | | Beginning
| | Income
| | (to)
| | (Loss) on
| | Investment
| | Investment
| | Capital
| | from
| | Total
| | Asset
| | End
| | Total
| | Period
| | Interest
| | Interest
| | Interest
| | to Average
| | Turnover
|
| | | of Period | | (Loss) | | Affiliate | | Investments | | Operations | | Income | | Gains | | Capital | | Distributions | | Value | | of Period | | Return (b) | | (000’s) | | Expense (d) | | Expense (d) | | Expense (d) | | Net Assets | | Rate (c) |
The Hartford Balanced Allocation Fund (g) — (continued) | | | | | | | | | | | | | | | | | | | | | | | | | | | | |
| From (commencement of operations) August 31, 2006, through October 31, 2006 | | | | | | | | | | | | | | | | | | | | | | | | | | | | |
| Class I | | $ | 11.66 | | | $ | 0.05 | | | $ | — | | | $ | 0.34 | | | $ | 0.39 | | | $ | (0.05 | ) | | $ | — | | | $ | — | | | $ | (0.05 | ) | | $ | 0.34 | | | $ | 12.00 | | | | 3.35 | %(f) | | $ | 353 | | | | 0.39 | %(e) | | | 0.39 | %(e) | | | 0.39 | %(e) | | | 1.47 | %(e) | | | — | % |
| For the Year Ended October 31, 2005 | | | | | | | | | | | | | | | | | | | | | | | | | | | | |
| Class A | | | 10.30 | | | | 0.13 | | | | — | | | | 0.64 | | | | 0.77 | | | | (0.12 | ) | | | — | | | | — | | | | (0.12 | ) | | | 0.65 | | | | 10.95 | | | | 7.47 | | | | 262,878 | | | | 0.66 | | | | 0.60 | | | | 0.60 | | | | 1.26 | | | | 2 | |
| Class B | | | 10.28 | | | | 0.06 | | | | — | | | | 0.62 | | | | 0.68 | | | | (0.04 | ) | | | — | | | | — | | | | (0.04 | ) | | | 0.64 | | | | 10.92 | | | | 6.66 | | | | 72,619 | | | | 1.47 | | | | 1.31 | | | | 1.31 | | | | 0.55 | | | | — | |
| Class C | | | 10.28 | | | | 0.06 | | | | — | | | | 0.62 | | | | 0.68 | | | | (0.04 | ) | | | — | | | | — | | | | (0.04 | ) | | | 0.64 | | | | 10.92 | | | | 6.66 | | | | 103,248 | | | | 1.41 | | | | 1.31 | | | | 1.31 | | | | 0.56 | | | | — | |
| From (commencement of operations) May 28, 2004, through October 31, 2004 | | | | | | | | | | | | | | | | | | | | | | | | | | | | |
| Class A | | | 10.00 | | | | 0.02 | | | | — | | | | 0.30 | | | | 0.32 | | | | (0.02 | ) | | | — | | | | — | | | | (0.02 | ) | | | 0.30 | | | | 10.30 | | | | 3.15 | (f) | | | 67,293 | | | | 0.62 | (e) | | | 0.59 | (e) | | | 0.59 | (e) | | | 0.99 | (e) | | | — | |
| Class B | | | 10.00 | | | | 0.01 | | | | — | | | | 0.27 | | | | 0.28 | | | | — | | | | — | | | | — | | | | — | | | | 0.28 | | | | 10.28 | | | | 2.82 | (f) | | | 18,841 | | | | 1.45 | (e) | | | 1.29 | (e) | | | 1.29 | (e) | | | 0.33 | (e) | | | — | |
| Class C | | | 10.00 | | | | — | | | | — | | | | 0.28 | | | | 0.28 | | | | — | | | | — | | | | — | | | | — | | | | 0.28 | | | | 10.28 | | | | 2.82 | (f) | | | 30,414 | | | | 1.38 | (e) | | | 1.29 | (e) | | | 1.29 | (e) | | | 0.30 | (e) | | | — | |
The Hartford Balance Income Fund | | | | | | | | | | | | | | | | | | | | | | | | | | | | |
| For the Six-Month Period Ended April 30, 2008 (Unaudited) | | | | | | | | | | | | | | | | | | | | | | | | | | | | |
| Class A | | | 11.02 | | | | 0.20 | | | | — | | | | (0.56 | ) | | | (0.36 | ) | | | (0.19 | ) | | | (0.04 | ) | | | — | | | | (0.23 | ) | | | (0.59 | ) | | | 10.43 | | | | (3.22 | )(f) | | | 48,021 | | | | 1.20 | (e) | | | 1.20 | (e) | | | 1.20 | (e) | | | 3.96 | (e) | | | 19 | |
| Class B | | | 10.98 | | | | 0.16 | | | | — | | | | (0.56 | ) | | | (0.40 | ) | | | (0.14 | ) | | | (0.04 | ) | | | — | | | | (0.18 | ) | | | (0.58 | ) | | | 10.40 | | | | (3.56 | )(f) | | | 2,680 | | | | 2.06 | (e) | | | 2.00 | (e) | | | 2.00 | (e) | | | 3.16 | (e) | | | — | |
| Class C | | | 10.97 | | | | 0.16 | | | | — | | | | (0.55 | ) | | | (0.39 | ) | | | (0.15 | ) | | | (0.04 | ) | | | — | | | | (0.19 | ) | | | (0.58 | ) | | | 10.39 | | | | (3.53 | )(f) | | | 5,500 | | | | 1.98 | (e) | | | 1.98 | (e) | | | 1.98 | (e) | | | 3.17 | (e) | | | — | |
| Class Y | | | 11.03 | | | | 0.22 | | | | — | | | | (0.56 | ) | | | (0.34 | ) | | | (0.20 | ) | | | (0.04 | ) | | | — | | | | (0.24 | ) | | | (0.58 | ) | | | 10.45 | | | | (3.02 | )(f) | | | 111 | | | | 0.87 | (e) | | | 0.87 | (e) | | | 0.87 | (e) | | | 4.28 | (e) | | | — | |
| For the Year Ended October 31, 2007 | | | | | | | | | | | | | | | | | | | | | | | | | | | | |
| Class A | | | 10.42 | | | | 0.34 | | | | — | | | | 0.59 | | | | 0.93 | | | | (0.33 | ) | | | — | | | | — | | | | (0.33 | ) | | | 0.60 | | | | 11.02 | | | | 9.07 | | | | 40,501 | | | | 1.33 | | | | 1.19 | | | | 1.19 | | | | 3.57 | | | | 27 | |
| Class B | | | 10.41 | | | | 0.26 | | | | — | | | | 0.59 | | | | 0.85 | | | | (0.28 | ) | | | — | | | | — | | | | (0.28 | ) | | | 0.57 | | | | 10.98 | | | | 8.22 | | | | 2,280 | | | | 2.21 | | | | 2.00 | | | | 2.00 | | | | 2.76 | | | | — | |
| Class C | | | 10.41 | | | | 0.26 | | | | — | | | | 0.58 | | | | 0.84 | | | | (0.28 | ) | | | — | | | | — | | | | (0.28 | ) | | | 0.56 | | | | 10.97 | | | | 8.17 | | | | 4,256 | | | | 2.14 | | | | 2.00 | | | | 2.00 | | | | 2.76 | | | | — | |
| Class Y | | | 10.42 | | | | 0.41 | | | | — | | | | 0.56 | | | | 0.97 | | | | (0.36 | ) | | | — | | | | — | | | | (0.36 | ) | | | 0.61 | | | | 11.03 | | | | 9.43 | | | | 115 | | | | 1.04 | | | | 0.90 | | | | 0.90 | | | | 3.86 | | | | — | |
| From (commencement of operations) July 31, 2006, through October 31, 2006 | | | | | | | | | | | | | | | | | | | | | | | | | | | | |
| Class A | | | 10.00 | | | | 0.09 | | | | — | | | | 0.39 | | | | 0.48 | | | | (0.06 | ) | | | — | | | | — | | | | (0.06 | ) | | | 0.42 | | | | 10.42 | | | | 4.78 | (f) | | | 11,513 | | | | 1.58 | (e) | | | 1.26 | (e) | | | 1.26 | (e) | | | 3.48 | (e) | | | 8 | |
| Class B | | | 10.00 | | | | 0.07 | | | | — | | | | 0.38 | | | | 0.45 | | | | (0.04 | ) | | | — | | | | — | | | | (0.04 | ) | | | 0.41 | | | | 10.41 | | | | 4.54 | (f) | | | 304 | | | | 2.34 | (e) | | | 2.00 | (e) | | | 2.00 | (e) | | | 2.73 | (e) | | | — | |
| Class C | | | 10.00 | | | | 0.06 | | | | — | | | | 0.40 | | | | 0.46 | | | | (0.05 | ) | | | — | | | | — | | | | (0.05 | ) | | | 0.41 | | | | 10.41 | | | | 4.56 | (f) | | | 400 | | | | 2.39 | (e) | | | 2.00 | (e) | | | 2.00 | (e) | | | 2.67 | (e) | | | — | |
| Class Y | | | 10.00 | | | | 0.10 | | | | — | | | | 0.38 | | | | 0.48 | | | | (0.06 | ) | | | — | | | | — | | | | (0.06 | ) | | | 0.42 | | | | 10.42 | | | | 4.83 | (f) | | | 105 | | | | 1.31 | (e) | | | 0.90 | (e) | | | 0.90 | (e) | | | 3.86 | (e) | | | — | |
The Hartford Capital Appreciation Fund | | | | | | | | | | | | | | | | | | | | | | | | | | | | |
| For the Six-Month Period Ended April 30, 2008 (Unaudited) (h) | | | | | | | | | | | | | | | | | | | | | | | | | | | | |
| Class A | | | 46.08 | | | | 0.07 | | | | — | | | | (3.51 | ) | | | (3.44 | ) | | | — | | | | (3.73 | ) | | | — | | | | (3.73 | ) | | | (7.17 | ) | | | 38.91 | | | | (7.76 | )(f) | | | 13,914,556 | | | | 1.10 | (e) | | | 1.10 | (e) | | | 1.10 | (e) | | | 0.37 | (e) | | | 42 | |
| Class B | | | 41.59 | | | | (0.08 | ) | | | — | | | | (3.15 | ) | | | (3.23 | ) | | | — | | | | (3.73 | ) | | | — | | | | (3.73 | ) | | | (6.96 | ) | | | 34.63 | | | | (8.13 | )(f) | | | 1,904,860 | | | | 1.91 | (e) | | | 1.91 | (e) | | | 1.91 | (e) | | | (0.46 | )(e) | | | — | |
| Class C | | | 41.82 | | | | (0.06 | ) | | | — | | | | (3.18 | ) | | | (3.24 | ) | | | — | | | | (3.73 | ) | | | — | | | | (3.73 | ) | | | (6.97 | ) | | | 34.85 | | | | (8.11 | )(f) | | | 4,316,181 | | | | 1.83 | (e) | | | 1.83 | (e) | | | 1.83 | (e) | | | (0.37 | )(e) | | | — | |
| Class I | | | 45.90 | | | | 0.13 | | | | — | | | | (3.49 | ) | | | (3.36 | ) | | | — | | | | (3.73 | ) | | | — | | | | (3.73 | ) | | | (7.09 | ) | | | 38.81 | | | | (7.61 | )(f) | | | 254,146 | | | | 0.79 | (e) | | | 0.79 | (e) | | | 0.79 | (e) | | | 0.71 | (e) | | | — | |
| Class R3 | | | 48.91 | | | | 0.01 | | | | — | | | | (3.76 | ) | | | (3.75 | ) | | | — | | | | (3.73 | ) | | | — | | | | (3.73 | ) | | | (7.48 | ) | | | 41.43 | | | | (7.97 | )(f) | | | 479 | | | | 1.60 | (e) | | | 1.58 | (e) | | | 1.58 | (e) | | | 0.05 | (e) | | | — | |
| Class R4 | | | 49.05 | | | | 0.09 | | | | — | | | | (3.76 | ) | | | (3.67 | ) | | | — | | | | (3.73 | ) | | | — | | | | (3.73 | ) | | | (7.40 | ) | | | 41.65 | | | | (7.76 | )(f) | | | 48,193 | | | | 1.11 | (e) | | | 1.11 | (e) | | | 1.11 | (e) | | | 0.44 | (e) | | | — | |
| Class R5 | | | 49.15 | | | | 0.16 | | | | — | | | | (3.78 | ) | | | (3.62 | ) | | | — | | | | (3.73 | ) | | | — | | | | (3.73 | ) | | | (7.35 | ) | | | 41.80 | | | | (7.64 | )(f) | | | 22,325 | | | | 0.82 | (e) | | | 0.82 | (e) | | | 0.82 | (e) | | | 0.77 | (e) | | | — | |
| Class Y | | | 49.23 | | | | 0.16 | | | | — | | | | (3.76 | ) | | | (3.60 | ) | | | — | | | | (3.73 | ) | | | — | | | | (3.73 | ) | | | (7.33 | ) | | | 41.90 | | | | (7.58 | )(f) | | | 1,261,243 | | | | 0.71 | (e) | | | 0.71 | (e) | | | 0.71 | (e) | | | 0.76 | (e) | | | — | |
| For the Year Ended October 31, 2007 (h) | | | | | | | | | | | | | | | | | | | | | | | | | | | | |
| Class A | | | 39.67 | | | | 0.16 | | | | — | | | | 9.42 | | | | 9.58 | | | | (0.13 | ) | | | (3.04 | ) | | | — | | | | (3.17 | ) | | | 6.41 | | | | 46.08 | | | | 26.15 | (i) | | | 13,684,583 | | | | 1.11 | | | | 1.11 | | | | 1.11 | | | | 0.39 | | | | 72 | |
| Class B | | | 36.25 | | | | (0.15 | ) | | | — | | | | 8.53 | | | | 8.38 | | | | — | | | | (3.04 | ) | | | — | | | | (3.04 | ) | | | 5.34 | | | | 41.59 | | | | 25.15 | (i) | | | 2,209,870 | | | | 1.92 | | | | 1.92 | | | | 1.92 | | | | (0.40 | ) | | | — | |
| Class C | | | 36.40 | | | | (0.12 | ) | | | — | | | | 8.58 | | | | 8.46 | | | | — | | | | (3.04 | ) | | | — | | | | (3.04 | ) | | | 5.42 | | | | 41.82 | | | | 25.28 | (i) | | | 4,411,286 | | | | 1.83 | | | | 1.83 | | | | 1.83 | | | | (0.32 | ) | | | — | |
| Class I | | | 39.69 | | | | 0.26 | | | | — | | | | 9.39 | | | | 9.65 | | | | (0.40 | ) | | | (3.04 | ) | | | — | | | | (3.44 | ) | | | 6.21 | | | | 45.90 | | | | 26.49 | (i) | | | 156,616 | | | | 0.79 | | | | 0.79 | | | | 0.79 | | | | 0.65 | | | | — | |
| Class Y | | | 42.19 | | | | 0.34 | | | | — | | | | 10.06 | | | | 10.40 | | | | (0.32 | ) | | | (3.04 | ) | | | — | | | | (3.36 | ) | | | 7.04 | | | | 49.23 | | | | 26.66 | (i) | | | 1,035,754 | | | | 0.72 | | | | 0.72 | | | | 0.72 | | | | 0.78 | | | | — | |
| From (commencement of operations) December 22, 2006, through October 31, 2007 (h) | | | | | | | | | | | | | | | | | | | | | | | | | | | | |
| Class R3 | | | 40.22 | | | | 0.01 | | | | — | | | | 8.68 | | | | 8.69 | | | | — | | | | — | | | | — | | | | — | | | | 8.69 | | | | 48.91 | | | | 21.61 | (f) | | | 41 | | | | 1.47 | (e) | | | 1.47 | (e) | | | 1.47 | (e) | | | 0.04 | (e) | | | — | |
| Class R4 | | | 40.22 | | | | 0.02 | | | | — | | | | 8.81 | | | | 8.83 | | | | — | | | | — | | | | — | | | | — | | | | 8.83 | | | | 49.05 | | | | 21.95 | (f) | | | 15,618 | | | | 1.14 | (e) | | | 1.14 | (e) | | | 1.14 | (e) | | | 0.06 | (e) | | | — | |
| Class R5 | | | 40.22 | | | | 0.08 | | | | — | | | | 8.85 | | | | 8.93 | | | | — | | | | — | | | | — | | | | — | | | | 8.93 | | | | 49.15 | | | | 22.20 | (f) | | | 1,165 | | | | 0.85 | (e) | | | 0.85 | (e) | | | 0.85 | (e) | | | 0.25 | (e) | | | — | |
| For the Year Ended October 31, 2006 | | | | | | | | | | | | | | | | | | | | | | | | | | | | |
| Class A | | | 36.51 | | | | 0.15 | | | | — | | | | 6.43 | | | | 6.58 | | | | — | | | | (3.42 | ) | | | — | | | | (3.42 | ) | | | 3.16 | | | | 39.67 | | | | 19.56 | | | | 9,312,766 | | | | 1.18 | | | | 1.18 | | | | 1.18 | | | | 0.47 | | | | 74 | |
| Class B | | | 33.90 | | | | (0.10 | ) | | | — | | | | 5.87 | | | | 5.77 | | | | — | | | | (3.42 | ) | | | — | | | | (3.42 | ) | | | 2.35 | | | | 36.25 | | | | 18.59 | | | | 1,868,359 | | | | 1.97 | | | | 1.97 | | | | 1.97 | | | | (0.31 | ) | | | — | |
| Class C | | | 34.00 | | | | (0.07 | ) | | | — | | | | 5.89 | | | | 5.82 | | | | — | | | | (3.42 | ) | | | — | | | | (3.42 | ) | | | 2.40 | | | | 36.40 | | | | 18.69 | | | | 2,968,472 | | | | 1.90 | | | | 1.90 | | | | 1.90 | | | | (0.25 | ) | | | — | |
| Class Y | | | 38.47 | | | | 0.30 | | | | — | | | | 6.84 | | | | 7.14 | | | | — | | | | (3.42 | ) | | | — | | | | (3.42 | ) | | | 3.72 | | | | 42.19 | | | | 20.07 | | | | 414,259 | | | | 0.75 | | | | 0.75 | | | | 0.75 | | | | 0.90 | | | | — | |
| From (commencement of operations) August 31, 2006, through October 31, 2006 | | | | | | | | | | | | | | | | | | | | | | | | | | | | |
| Class I | | | 37.53 | | | | — | | | | — | | | | 2.16 | | | | 2.16 | | | | — | | | | — | | | | — | | | | — | | | | 2.16 | | | | 39.69 | | | | 5.76 | (f) | | | 5,193 | | | | 0.88 | (e) | | | 0.88 | (e) | | | 0.88 | (e) | | | 0.17 | (e) | | | — | |
| For the Year Ended October 31, 2005 | | | | | | | | | | | | | | | | | | | | | | | | | | | | |
| Class A | | | 30.80 | | | | 0.09 | | | | — | | | | 5.62 | | | | 5.71 | | | | — | | | | — | | | | — | | | | — | | | | 5.71 | | | | 36.51 | | | | 18.54 | | | | 6,071,891 | | | | 1.26 | | | | 1.26 | | | | 1.26 | | | | 0.31 | | | | 93 | |
| Class B | | | 28.82 | | | | (0.15 | ) | | | — | | | | 5.23 | | | | 5.08 | | | | — | | | | — | | | | — | | | | — | | | | 5.08 | | | | 33.90 | | | | 17.63 | | | | 1,631,199 | | | | 2.03 | | | | 2.03 | | | | 2.03 | | | | (0.45 | ) | | | — | |
| Class C | | | 28.88 | | | | (0.11 | ) | | | — | | | | 5.23 | | | | 5.12 | | | | — | | | | — | | | | — | | | | — | | | | 5.12 | | | | 34.00 | | | | 17.73 | | | | 1,834,562 | | | | 1.94 | | | | 1.94 | | | | 1.94 | | | | (0.37 | ) | | | — | |
| Class Y | | | 32.29 | | | | 0.21 | | | | — | | | | 5.97 | | | | 6.18 | | | | — | | | | — | | | | — | | | | — | | | | 6.18 | | | | 38.47 | | | | 19.14 | | | | 245,163 | | | | 0.78 | | | | 0.78 | | | | 0.78 | | | | 0.76 | | | | — | |
380
| | | | | | | | | | | | | | | | | | | | | | | | | | | | | | | | | | | | | | | | | | | | | | | | | | | | | | | | | | | | | | | | | | | | | | | | | |
| | | — Selected Per-Share Data (a) — | | — Ratios and Supplemental Data — |
| | | | | | | | | | | | | | | | | | | | | | | | | | | | | Ratio of
| | Ratio of
| | Ratio of
| | | | |
| | | | | | | | | | | | | | | | | | | | | | | | | | | | | Expenses
| | Expenses
| | Expenses
| | | | |
| | | | | | | | | | | | | | | | | | | | | | | | | | | | | to Average
| | to Average
| | to Average
| | | | |
| | | | | | | | | Net
| | | | | | | | | | | | | | | | | | | | Net Assets
| | Net Assets
| | Net Assets
| | | | |
| | | | | | | | | Realized
| | | | | | | | | | | | Net
| | | | | | | | Before
| | After
| | After
| | Ratio of
| | |
| | | | | | | | | and
| | | | | | Distributions
| | | | | | Increase
| | | | | | | | Waivers and
| | Waivers and
| | Waivers and
| | Net
| | |
| | | Net Asset
| | Net
| | Payments
| | Unrealized
| | Total
| | Dividends
| | from
| | | | | | (Decrease)
| | Net Asset
| | | | Net Assets
| | Reimbursements
| | Reimbursements
| | Reimbursements
| | Investment
| | |
| | | Value at
| | Investment
| | from
| | Gain
| | from
| | from Net
| | Realized
| | Distributions
| | | | in Net
| | Value at
| | | | at End of
| | and Including
| | and Including
| | and Excluding
| | Income
| | Portfolio
|
| | | Beginning
| | Income
| | (to)
| | (Loss) on
| | Investment
| | Investment
| | Capital
| | from
| | Total
| | Asset
| | End
| | Total
| | Period
| | Interest
| | Interest
| | Interest
| | to Average
| | Turnover
|
| | | of Period | | (Loss) | | Affiliate | | Investments | | Operations | | Income | | Gains | | Capital | | Distributions | | Value | | of Period | | Return (b) | | (000’s) | | Expense (d) | | Expense (d) | | Expense (d) | | Net Assets | | Rate (c) |
The Hartford Capital Appreciation Fund — (continued) | | | | | | | | | | | | | | | | | | | | | | | | | | | | |
| For the Year Ended October 31, 2004 | | | | | | | | | | | | | | | | | | | | | | | | | | | | |
| Class A | | $ | 26.50 | | | $ | (0.01 | ) | | $ | — | | | $ | 4.31 | | | $ | 4.30 | | | $ | — | | | $ | — | | | $ | — | | | $ | — | | | $ | 4.30 | | | $ | 30.80 | | | | 16.23 | % | | $ | 4,203,178 | | | | 1.35 | % | | | 1.35 | % | | | 1.35 | % | | | (0.05 | )% | | | 78 | % |
| Class B | | | 24.97 | | | | (0.21 | ) | | | — | | | | 4.06 | | | | 3.85 | | | | — | | | | — | | | | — | | | | — | | | | 3.85 | | | | 28.82 | | | | 15.42 | | | | 1,432,121 | | | | 2.06 | | | | 2.06 | | | | 2.06 | | | | (0.78 | ) | | | — | |
| Class C | | | 25.00 | | | | (0.18 | ) | | | — | | | | 4.06 | | | | 3.88 | | | | — | | | | — | | | | — | | | | — | | | | 3.88 | | | | 28.88 | | | | 15.52 | | | | 1,348,972 | | | | 1.97 | | | | 1.97 | | | | 1.97 | | | | (0.68 | ) | | | — | |
| Class Y | | | 27.64 | | | | 0.11 | | | | — | | | | 4.54 | | | | 4.65 | | | | — | | | | — | | | | — | | | | — | | | | 4.65 | | | | 32.29 | | | | 16.82 | | | | 116,527 | | | | 0.79 | | | | 0.79 | | | | 0.79 | | | | 0.50 | | | | — | |
| For the Year Ended October 31, 2003 | | | | | | | | | | | | | | | | | | | | | | | | | | | | |
| Class A | | | 20.47 | | | | (0.04 | ) | | | — | | | | 6.07 | | | | 6.03 | | | | — | | | | — | | | | — | | | | — | | | | 6.03 | | | | 26.50 | | | | 29.46 | | | | 2,357,913 | | | | 1.45 | | | | 1.43 | | | | 1.43 | | | | (0.13 | ) | | | 113 | |
| Class B | | | 19.44 | | | | (0.19 | ) | | | — | | | | 5.72 | | | | 5.53 | | | | — | | | | — | | | | — | | | | — | | | | 5.53 | | | | 24.97 | | | | 28.45 | | | | 1,140,154 | | | | 2.17 | | | | 2.17 | | | | 2.17 | | | | (0.87 | ) | | | — | |
| Class C | | | 19.44 | | | | (0.16 | ) | | | — | | | | 5.72 | | | | 5.56 | | | | — | | | | — | | | | — | | | | — | | | | 5.56 | | | | 25.00 | | | | 28.60 | | | | 981,246 | | | | 2.05 | | | | 2.05 | | | | 2.05 | | | | (0.75 | ) | | | — | |
| Class Y | | | 21.23 | | | | 0.08 | | | | — | | | | 6.33 | | | | 6.41 | | | | — | | | | — | | | | — | | | | — | | | | 6.41 | | | | 27.64 | | | | 30.19 | | | | 48,372 | | | | 0.85 | | | | 0.85 | | | | 0.85 | | | | 0.46 | | | | — | |
The Hartford Capital Appreciation II Fund | | | | | | | | | | | | | | | | | | | | | | | | | | | | |
| For the Six-Month Period Ended April 30, 2008 (Unaudited) (h) | | | | | | | | | | | | | | | | | | | | | | | | | | | | |
| Class A | | | 16.95 | | | | 0.02 | | | | — | | | | (2.19 | ) | | | (2.17 | ) | | | — | | | | (1.17 | ) | | | — | | | | (1.17 | ) | | | (3.34 | ) | | | 13.61 | | | | (13.36 | )(f) | | | 829,862 | | | | 1.38 | (e) | | | 1.38 | (e) | | | 1.38 | (e) | | | 0.22 | (e) | | | 70 | |
| Class B | | | 16.62 | | | | (0.04 | ) | | | — | | | | (2.15 | ) | | | (2.19 | ) | | | — | | | | (1.17 | ) | | | — | | | | (1.17 | ) | | | (3.36 | ) | | | 13.26 | | | | (13.78 | )(f) | | | 105,114 | | | | 2.24 | (e) | | | 2.24 | (e) | | | 2.24 | (e) | | | (0.64 | )(e) | | | — | |
| Class C | | | 16.66 | | | | (0.04 | ) | | | — | | | | (2.15 | ) | | | (2.19 | ) | | | — | | | | (1.17 | ) | | | — | | | | (1.17 | ) | | | (3.36 | ) | | | 13.30 | | | | (13.74 | )(f) | | | 435,124 | | | | 2.12 | (e) | | | 2.12 | (e) | | | 2.12 | (e) | | | (0.52 | )(e) | | | — | |
| Class I | | | 17.02 | | | | 0.04 | | | | — | | | | (2.20 | ) | | | (2.16 | ) | | | — | | | | (1.17 | ) | | | — | | | | (1.17 | ) | | | (3.33 | ) | | | 13.69 | | | | (13.24 | )(f) | | | 102,803 | | | | 1.07 | (e) | | | 1.07 | (e) | | | 1.07 | (e) | | | 0.55 | (e) | | | — | |
| Class R3 | | | 17.00 | | | | — | | | | — | | | | (2.21 | ) | | | (2.21 | ) | | | — | | | | (1.17 | ) | | | — | | | | (1.17 | ) | | | (3.38 | ) | | | 13.62 | | | | (13.57 | )(f) | | | 4,410 | | | | 1.74 | (e) | | | 1.74 | (e) | | | 1.74 | (e) | | | (0.05 | )(e) | | | — | |
| Class R4 | | | 17.05 | | | | 0.02 | | | | — | | | | (2.20 | ) | | | (2.18 | ) | | | — | | | | (1.17 | ) | | | — | | | | (1.17 | ) | | | (3.35 | ) | | | 13.70 | | | | (13.34 | )(f) | | | 1,218 | | | | 1.43 | (e) | | | 1.43 | (e) | | | 1.43 | (e) | | | 0.32 | (e) | | | — | |
| Class R5 | | | 17.10 | | | | 0.04 | | | | — | | | | (2.22 | ) | | | (2.18 | ) | | | — | | | | (1.17 | ) | | | — | | | | (1.17 | ) | | | (3.35 | ) | | | 13.75 | | | | (13.30 | )(f) | | | 222 | | | | 1.12 | (e) | | | 1.12 | (e) | | | 1.12 | (e) | | | 0.49 | (e) | | | — | |
| Class Y | | | 17.12 | | | | 0.05 | | | | — | | | | (2.22 | ) | | | (2.17 | ) | | | — | | | | (1.17 | ) | | | — | | | | (1.17 | ) | | | (3.34 | ) | | | 13.78 | | | | (13.22 | )(f) | | | 15,532 | | | | 1.00 | (e) | | | 1.00 | (e) | | | 1.00 | (e) | | | 0.73 | (e) | | | — | |
| For the Year Ended October 31, 2007 | | | | | | | | | | | | | | | | | | | | | | | | | | | | |
| Class A | | | 13.13 | | | | — | | | | — | | | | 4.13 | | | | 4.13 | | | | — | | | | (0.31 | ) | | | — | | | | (0.31 | ) | | | 3.82 | | | | 16.95 | | | | 32.15 | | | | 821,428 | | | | 1.44 | | | | 1.44 | | | | 1.44 | | | | — | | | | 102 | |
| Class B | | | 12.99 | | | | (0.07 | ) | | | — | | | | 4.01 | | | | 3.94 | | | | — | | | | (0.31 | ) | | | — | | | | (0.31 | ) | | | 3.63 | | | | 16.62 | | | | 31.01 | | | | 104,908 | | | | 2.29 | | | | 2.29 | | | | 2.29 | | | | (0.86 | ) | | | — | |
| Class C | | | 13.00 | | | | (0.06 | ) | | | — | | | | 4.03 | | | | 3.97 | | | | — | | | | (0.31 | ) | | | — | | | | (0.31 | ) | | | 3.66 | | | | 16.66 | | | | 31.22 | | | | 415,688 | | | | 2.16 | | | | 2.16 | | | | 2.16 | | | | (0.73 | ) | | | — | |
| Class I | | | 13.14 | | | | 0.02 | | | | — | | | | 4.17 | | | | 4.19 | | | | — | | | | (0.31 | ) | | | — | | | | (0.31 | ) | | | 3.88 | | | | 17.02 | | | | 32.60 | | | | 83,905 | | | | 1.11 | | | | 1.11 | | | | 1.11 | | | | 0.31 | | | | — | |
| Class Y | | | 13.20 | | | | 0.06 | | | | — | | | | 4.17 | | | | 4.23 | | | | — | | | | (0.31 | ) | | | — | | | | (0.31 | ) | | | 3.92 | | | | 17.12 | | | | 32.75 | | | | 158 | | | | 1.02 | | | | 1.02 | | | | 1.02 | | | | 0.44 | | | | — | |
| From (commencement of operations) December 22, 2006, through October 31, 2007 | | | | | | | | | | | | | | | | | | | | | | | | | | | | |
| Class R3 | | | 13.52 | | | | (0.03 | ) | | | — | | | | 3.51 | | | | 3.48 | | | | — | | | | — | | | | — | | | | — | | | | 3.48 | | | | 17.00 | | | | 25.74 | (f) | | | 452 | | | | 1.85 | (e) | | | 1.85 | (e) | | | 1.85 | (e) | | | (0.43 | )(e) | | | — | |
| Class R4 | | | 13.52 | | | | (0.01 | ) | | | — | | | | 3.54 | | | | 3.53 | | | | — | | | | — | | | | — | | | | — | | | | 3.53 | | | | 17.05 | | | | 26.11 | (f) | | | 14 | | | | 1.47 | (e) | | | 1.47 | (e) | | | 1.47 | (e) | | | (0.06 | )(e) | | | — | |
| Class R5 | | | 13.52 | | | | — | | | | — | | | | 3.58 | | | | 3.58 | | | | — | | | | — | | | | — | | | | — | | | | 3.58 | | | | 17.10 | | | | 26.48 | (f) | | | 136 | | | | 1.22 | (e) | | | 1.22 | (e) | | | 1.22 | (e) | | | 0.03 | (e) | | | — | |
| For the Year Ended October 31, 2006 | | | | | | | | | | | | | | | | | | | | | | | | | | | | |
| Class A | | | 11.07 | | | | (0.01 | ) | | | — | | | | 2.22 | | | | 2.21 | | | | — | | | | (0.15 | ) | | | — | | | | (0.15 | ) | | | 2.06 | | | | 13.13 | | | | 20.21 | | | | 241,238 | | | | 1.66 | | | | 1.61 | | | | 1.61 | | | | (0.13 | ) | | | 113 | |
| Class B | | | 11.02 | | | | (0.07 | ) | | | — | | | | 2.19 | | | | 2.12 | | | | — | | | | (0.15 | ) | | | — | | | | (0.15 | ) | | | 1.97 | | | | 12.99 | | | | 19.48 | | | | 29,169 | | | | 2.54 | | | | 2.35 | | | | 2.35 | | | | (0.88 | ) | | | — | |
| Class C | | | 11.04 | | | | (0.06 | ) | | | — | | | | 2.17 | | | | 2.11 | | | | — | | | | (0.15 | ) | | | — | | | | (0.15 | ) | | | 1.96 | | | | 13.00 | | | | 19.35 | | | | 97,678 | | | | 2.37 | | | | 2.33 | | | | 2.33 | | | | (0.86 | ) | | | — | |
| Class Y | | | 11.08 | | | | 0.12 | | | | — | | | | 2.15 | | | | 2.27 | | | | — | | | | (0.15 | ) | | | — | | | | (0.15 | ) | | | 2.12 | | | | 13.20 | | | | 20.74 | | | | 119 | | | | 1.20 | | | | 1.15 | | | | 1.15 | | | | 0.39 | | | | — | |
| From (commencement of operations) August 31, 2006, through October 31, 2006 | | | | | | | | | | | | | | | | | | | | | | | | | | | | |
| Class I | | | 12.51 | | | | — | | | | — | | | | 0.63 | | | | 0.63 | | | | — | | | | — | | | | — | | | | — | | | | 0.63 | | | | 13.14 | | | | 5.04 | (f) | | | 3,316 | | | | 1.46 | (e) | | | 0.80 | (e) | | | 0.80 | (e) | | | 0.45 | (e) | | | — | |
| From (commencement of operations) April 29, 2005, through October 31, 2005 | | | | | | | | | | | | | | | | | | | | | | | | | | | | |
| Class A | | | 10.00 | | | | (0.01 | ) | | | — | | | | 1.08 | | | | 1.07 | | | | — | | | | — | | | | — | | | | — | | | | 1.07 | | | | 11.07 | | | | 10.70 | (f) | | | 56,981 | | | | 1.99 | (e) | | | 1.60 | (e) | | | 1.60 | (e) | | | (0.30 | )(e) | | | 46 | |
| Class B | | | 10.00 | | | | (0.03 | ) | | | — | | | | 1.05 | | | | 1.02 | | | | — | | | | — | | | | — | | | | — | | | | 1.02 | | | | 11.02 | | | | 10.20 | (f) | | | 6,343 | | | | 2.97 | (e) | | | 2.35 | (e) | | | 2.35 | (e) | | | (1.10 | )(e) | | | — | |
| Class C | | | 10.00 | | | | (0.03 | ) | | | — | | | | 1.07 | | | | 1.04 | | | | — | | | | — | | | | — | | | | — | | | | 1.04 | | | | 11.04 | | | | 10.40 | (f) | | | 19,494 | | | | 2.82 | (e) | | | 2.35 | (e) | | | 2.35 | (e) | | | (1.12 | )(e) | | | — | |
| Class Y | | | 10.00 | | | | 0.02 | | | | — | | | | 1.06 | | | | 1.08 | | | | — | | | | — | | | | — | | | | — | | | | 1.08 | | | | 11.08 | | | | 10.80 | (f) | | | 332 | | | | 1.41 | (e) | | | 1.15 | (e) | | | 1.15 | (e) | | | 0.29 | (e) | | | — | |
The Hartford Checks and Balances Fund | | | | | | | | | | | | | | | | | | | | | | | | | | | | |
| For the Six-Month Period Ended April 30, 2008 (Unaudited) | | | | | | | | | | | | | | | | | | | | | | | | | | | | |
| Class A | | | 10.51 | | | | 0.11 | | | | — | | | | (0.51 | ) | | | (0.40 | ) | | | (0.15 | ) | | | — | | | | — | | | | (0.15 | ) | | | (0.55 | ) | | | 9.96 | | | | (3.85 | )(f) | | | 497,493 | | | | 0.40 | (e) | | | 0.40 | (e) | | | 0.40 | (e) | | | 2.01 | (e) | | | 3 | |
| Class B | | | 10.49 | | | | 0.08 | | | | — | | | | (0.51 | ) | | | (0.43 | ) | | | (0.12 | ) | | | — | | | | — | | | | (0.12 | ) | | | (0.55 | ) | | | 9.94 | | | | (4.15 | )(f) | | | 64,090 | | | | 1.22 | (e) | | | 1.22 | (e) | | | 1.22 | (e) | | | 1.12 | (e) | | | — | |
| Class C | | | 10.49 | | | | 0.08 | | | | — | | | | (0.51 | ) | | | (0.43 | ) | | | (0.12 | ) | | | — | | | | — | | | | (0.12 | ) | | | (0.55 | ) | | | 9.94 | | | | (4.13 | )(f) | | | 172,069 | | | | 1.15 | (e) | | | 1.15 | (e) | | | 1.15 | (e) | | | 1.12 | (e) | | | — | |
| From (commencement of operations) February 29, 2008, through April 30, 2008 | | | | | | | | | | | | | | | | | | | | | | | | | | | | |
| Class I | | | 10.00 | | | | 0.04 | | | | — | | | | 9.96 | | | | 10.00 | | | | (0.04 | ) | | | — | | | | — | | | | (0.04 | ) | | | 9.96 | | | | 19.96 | | | | (3.79 | )(f) | | | 887 | | | | 0.17 | (e) | | | 0.17 | (e) | | | 0.17 | (e) | | | 1.49 | (e) | | | — | |
| From (commencement of operations) May 31, 2007, through October 31, 2007 | | | | | | | | | | | | | | | | | | | | | | | | | | | | |
| Class A | | | 10.00 | | | | 0.05 | | | | — | | | | 0.51 | | | | 0.56 | | | | (0.05 | ) | | | — | | | | — | | | | (0.05 | ) | | | 0.51 | | | | 10.51 | | | | 5.56 | (f) | | | 172,572 | | | | 0.43 | (e) | | | 0.43 | (e) | | | 0.43 | (e) | | | 1.77 | (e) | | | — | |
| Class B | | | 10.00 | | | | 0.03 | | | | — | | | | 0.49 | | | | 0.52 | | | | (0.03 | ) | | | — | | | | — | | | | (0.03 | ) | | | 0.49 | | | | 10.49 | | | | 5.24 | (f) | | | 19,750 | | | | 1.26 | (e) | | | 1.25 | (e) | | | 1.25 | (e) | | | 0.96 | (e) | | | — | |
| Class C | | | 10.00 | | | | 0.03 | | | | — | | | | 0.49 | | | | 0.52 | | | | (0.03 | ) | | | — | | | | — | | | | (0.03 | ) | | | 0.49 | | | | 10.49 | | | | 5.23 | (f) | | | 55,105 | | | | 1.18 | (e) | | | 1.18 | (e) | | | 1.18 | (e) | | | 1.02 | (e) | | | — | |
| | | | | | | | | | | | | | | | | | | | | | | | | | | | | | | | | | | | | | | | | | | | | | | | | | | | | | | | | | | | | | | | | | | | | | | | | |
381
The Hartford Mutual Funds, Inc. and The Hartford Mutual Funds II, Inc.
Financial Highlights — (continued)
| | | | | | | | | | | | | | | | | | | | | | | | | | | | | | | | | | | | | | | | | | | | | | | | | | | | | | | | | | | | | | | | | | | | | | | | | |
| | | — Selected Per-Share Data (a) — | | — Ratios and Supplemental Data — |
| | | | | | | | | | | | | | | | | | | | | | | | | | | | | Ratio of
| | Ratio of
| | Ratio of
| | | | |
| | | | | | | | | | | | | | | | | | | | | | | | | | | | | Expenses
| | Expenses
| | Expenses
| | | | |
| | | | | | | | | | | | | | | | | | | | | | | | | | | | | to Average
| | to Average
| | to Average
| | | | |
| | | | | | | | | Net
| | | | | | | | | | | | | | | | | | | | Net Assets
| | Net Assets
| | Net Assets
| | | | |
| | | | | | | | | Realized
| | | | | | | | | | | | Net
| | | | | | | | Before
| | After
| | After
| | Ratio of
| | |
| | | | | | | | | and
| | | | | | Distributions
| | | | | | Increase
| | | | | | | | Waivers and
| | Waivers and
| | Waivers and
| | Net
| | |
| | | Net Asset
| | Net
| | Payments
| | Unrealized
| | Total
| | Dividends
| | from
| | | | | | (Decrease)
| | Net Asset
| | | | Net Assets
| | Reimbursements
| | Reimbursements
| | Reimbursements
| | Investment
| | |
| | | Value at
| | Investment
| | from
| | Gain
| | from
| | from Net
| | Realized
| | Distributions
| | | | in Net
| | Value at
| | | | at End of
| | and Including
| | and Including
| | and Excluding
| | Income
| | Portfolio
|
| | | Beginning
| | Income
| | (to)
| | (Loss) on
| | Investment
| | Investment
| | Capital
| | from
| | Total
| | Asset
| | End
| | Total
| | Period
| | Interest
| | Interest
| | Interest
| | to Average
| | Turnover
|
| | | of Period | | (Loss) | | Affiliate | | Investments | | Operations | | Income | | Gains | | Capital | | Distributions | | Value | | of Period | | Return (b) | | (000’s) | | Expense (d) | | Expense (d) | | Expense (d) | | Net Assets | | Rate (c) |
The Hartford Conservative Allocation Fund (g) | | | | | | | | | | | | | | | | | | | | | | | | | | | | |
| For the Six-Month Period Ended April 30, 2008 (Unaudited) | | | | | | | | | | | | | | | | | | | | | | | | | | | | |
| Class A | | $ | 11.63 | | | $ | 0.17 | | | $ | — | | | $ | (0.53 | ) | | $ | (0.36 | ) | | $ | (0.27 | ) | | $ | (0.40 | ) | | $ | — | | | $ | (0.67 | ) | | $ | (1.03 | ) | | $ | 10.60 | | | | (3.13)%(f) | | | $ | 130,994 | | | | 0.57 | %(e) | | | 0.57 | %(e) | | | 0.57 | %(e) | | | 3.09 | %(e) | | | 8 | % |
| Class B | | | 11.62 | | | | 0.13 | | | | — | | | | (0.52 | ) | | | (0.39 | ) | | | (0.24 | ) | | | (0.40 | ) | | | — | | | | (0.64 | ) | | | (1.03 | ) | | | 10.59 | | | | (3.49 | )(f) | | | 26,305 | | | | 1.39 | (e) | | | 1.33 | (e) | | | 1.33 | (e) | | | 2.36 | (e) | | | — | |
| Class C | | | 11.62 | | | | 0.12 | | | | — | | | | (0.52 | ) | | | (0.40 | ) | | | (0.24 | ) | | | (0.40 | ) | | | — | | | | (0.64 | ) | | | (1.04 | ) | | | 10.58 | | | | (3.56 | )(f) | | | 52,248 | | | | 1.33 | (e) | | | 1.33 | (e) | | | 1.33 | (e) | | | 2.18 | (e) | | | — | |
| Class I | | | 11.61 | | | | 0.16 | | | | — | | | | (0.50 | ) | | | (0.34 | ) | | | (0.29 | ) | | | (0.40 | ) | | | — | | | | (0.69 | ) | | | (1.03 | ) | | | 10.58 | | | | (2.99 | )(f) | | | 623 | | | | 0.28 | (e) | | | 0.28 | (e) | | | 0.28 | (e) | | | 4.33 | (e) | | | — | |
| Class R3 | | | 11.61 | | | | 0.22 | | | | — | | | | (0.60 | ) | | | (0.38 | ) | | | (0.25 | ) | | | (0.40 | ) | | | — | | | | (0.65 | ) | | | (1.03 | ) | | | 10.58 | | | | (3.39 | )(f) | | | 21 | | | | 1.02 | (e) | | | 1.02 | (e) | | | 1.02 | (e) | | | 1.60 | (e) | | | — | |
| Class R4 | | | 11.62 | | | | 0.22 | | | | — | | | | (0.57 | ) | | | (0.35 | ) | | | (0.28 | ) | | | (0.40 | ) | | | — | | | | (0.68 | ) | | | (1.03 | ) | | | 10.59 | | | | (3.10 | )(f) | | | 5,937 | | | | 0.62 | (e) | | | 0.62 | (e) | | | 0.62 | (e) | | | 1.67 | (e) | | | — | |
| Class R5 | | | 11.63 | | | | 0.24 | | | | — | | | | (0.58 | ) | | | (0.34 | ) | | | (0.29 | ) | | | (0.40 | ) | | | — | | | | (0.69 | ) | | | (1.03 | ) | | | 10.60 | | | | (3.03 | )(f) | | | 1,905 | | | | 0.32 | (e) | | | 0.32 | (e) | | | 0.32 | (e) | | | 2.94 | (e) | | | — | |
| For the Year Ended October 31, 2007 | | | | | | | | | | | | | | | | | | | | | | | | | | | | |
| Class A | | | 11.16 | | | | 0.33 | | | | — | | | | 0.81 | | | | 1.14 | | | | (0.38 | ) | | | (0.29 | ) | | | — | | | | (0.67 | ) | | | 0.47 | | | | 11.63 | | | | 10.64 | | | | 121,488 | | | | 0.59 | | | | 0.59 | | | | 0.59 | | | | 2.91 | | | | 40 | |
| Class B | | | 11.16 | | | | 0.25 | | | | — | | | | 0.80 | | | | 1.05 | | | | (0.30 | ) | | | (0.29 | ) | | | — | | | | (0.59 | ) | | | 0.46 | | | | 11.62 | | | | 9.81 | | | | 25,903 | | | | 1.42 | | | | 1.28 | | | | 1.28 | | | | 2.25 | | | | — | |
| Class C | | | 11.15 | | | | 0.25 | | | | — | | | | 0.81 | | | | 1.06 | | | | (0.30 | ) | | | (0.29 | ) | | | — | | | | (0.59 | ) | | | 0.47 | | | | 11.62 | | | | 9.91 | | | | 46,433 | | | | 1.35 | | | | 1.28 | | | | 1.28 | | | | 2.17 | | | | — | |
| Class I | | | 11.16 | | | | 0.38 | | | | — | | | | 0.78 | | | | 1.16 | | | | (0.42 | ) | | | (0.29 | ) | | | — | | | | (0.71 | ) | | | 0.45 | | | | 11.61 | | | | 10.86 | | | | 1,502 | | | | 0.27 | | | | 0.27 | | | | 0.27 | | | | 2.64 | | | | — | |
| From (commencement of operations) December 22, 2006, through October 31, 2007 | | | | | | | | | | | | | | | | | | | | | | | | | | | | |
| Class R3 | | | 10.95 | | | | 0.16 | | | | — | | | | 0.70 | | | | 0.86 | | | | (0.20 | ) | | | — | | | | — | | | | (0.20 | ) | | | 0.66 | | | | 11.61 | | | | 7.93 | (f) | | | 20 | | | | 1.05 | (e) | | | 1.03 | (e) | | | 1.03 | (e) | | | 1.87 | (e) | | | — | |
| Class R4 | | | 10.95 | | | | 0.20 | | | | — | | | | 0.70 | | | | 0.90 | | | | (0.23 | ) | | | — | | | | — | | | | (0.23 | ) | | | 0.67 | | | | 11.62 | | | | 8.25 | (f) | | | 429 | | | | 0.75 | (e) | | | 0.75 | (e) | | | 0.75 | (e) | | | 2.26 | (e) | | | — | |
| Class R5 | | | 10.95 | | | | 0.24 | | | | — | | | | 0.68 | | | | 0.92 | | | | (0.24 | ) | | | — | | | | — | | | | (0.24 | ) | | | 0.68 | | | | 11.63 | | | | 8.53 | (f) | | | 695 | | | | 0.48 | (e) | | | 0.46 | (e) | | | 0.46 | (e) | | | 2.41 | (e) | | | — | |
| For the Year Ended October 31, 2006 | | | | | | | | | | | | | | | | | | | | | | | | | | | | |
| Class A | | | 10.57 | | | | 0.26 | | | | — | | | | 0.76 | | | | 1.02 | | | | (0.31 | ) | | | (0.12 | ) | | | — | | | | (0.43 | ) | | | 0.59 | | | | 11.16 | | | | 9.85 | | | | 93,504 | | | | 0.64 | | | | 0.63 | | | | 0.63 | | | | 2.41 | | | | 29 | |
| Class B | | | 10.56 | | | | 0.19 | | | | — | | | | 0.76 | | | | 0.95 | | | | (0.23 | ) | | | (0.12 | ) | | | — | | | | (0.35 | ) | | | 0.60 | | | | 11.16 | | | | 9.19 | | | | 20,782 | | | | 1.48 | | | | 1.31 | | | | 1.31 | | | | 1.73 | | | | — | |
| Class C | | | 10.56 | | | | 0.19 | | | | — | | | | 0.76 | | | | 0.95 | | | | (0.24 | ) | | | (0.12 | ) | | | — | | | | (0.36 | ) | | | 0.59 | | | | 11.15 | | | | 9.10 | | | | 36,123 | | | | 1.41 | | | | 1.31 | | | | 1.31 | | | | 1.67 | | | | — | |
| From (commencement of operations) August 31, 2006, through October 31, 2006 | | | | | | | | | | | | | | | | | | | | | | | | | | | | |
| Class I | | | 10.94 | | | | 0.07 | | | | — | | | | 0.22 | | | | 0.29 | | | | (0.07 | ) | | | — | | | | — | | | | (0.07 | ) | | | 0.22 | | | | 11.16 | | | | 2.69 | (f) | | | 10 | | | | 0.72 | (e) | | | 0.41 | (e) | | | 0.41 | (e) | | | 2.07 | (e) | | | — | |
| For the Year Ended October 31, 2005 | | | | | | | | | | | | | | | | | | | | | | | | | | | | |
| Class A | | | 10.27 | | | | 0.23 | | | | — | | | | 0.28 | | | | 0.51 | | | | (0.21 | ) | | | — | | | | — | | | | (0.21 | ) | | | 0.30 | | | | 10.57 | | | | 4.96 | | | | 70,533 | | | | 0.63 | | | | 0.60 | | | | 0.60 | | | | 2.25 | | | | 23 | |
| Class B | | | 10.26 | | | | 0.16 | | | | — | | | | 0.28 | | | | 0.44 | | | | (0.14 | ) | | | — | | | | — | | | | (0.14 | ) | | | 0.30 | | | | 10.56 | | | | 4.26 | | | | 14,525 | | | | 1.48 | | | | 1.26 | | | | 1.26 | | | | 1.60 | | | | — | |
| Class C | | | 10.26 | | | | 0.16 | | | | — | | | | 0.28 | | | | 0.44 | | | | (0.14 | ) | | | — | | | | — | | | | (0.14 | ) | | | 0.30 | | | | 10.56 | | | | 4.26 | | | | 27,453 | | | | 1.42 | | | | 1.26 | | | | 1.26 | | | | 1.56 | | | | — | |
| From (commencement of operations) May 28, 2004, through October 31, 2004 | | | | | | | | | | | | | | | | | | | | | | | | | | | | |
| Class A | | | 10.00 | | | | 0.03 | | | | — | | | | 0.27 | | | | 0.30 | | | | (0.03 | ) | | | — | | | | — | | | | (0.03 | ) | | | 0.27 | | | | 10.27 | | | | 2.96 | (f) | | | 33,921 | | | | 0.63 | (e) | | | 0.60 | (e) | | | 0.60 | (e) | | | 1.70 | (e) | | | — | |
| Class B | | | 10.00 | | | | 0.02 | | | | — | | | | 0.25 | | | | 0.27 | | | | (0.01 | ) | | | — | | | | — | | | | (0.01 | ) | | | 0.26 | | | | 10.26 | | | | 2.70 | (f) | | | 4,993 | | | | 1.44 | (e) | | | 1.25 | (e) | | | 1.25 | (e) | | | 1.05 | (e) | | | — | |
| Class C | | | 10.00 | | | | 0.02 | | | | — | | | | 0.25 | | | | 0.27 | | | | (0.01 | ) | | | — | | | | — | | | | (0.01 | ) | | | 0.26 | | | | 10.26 | | | | 2.70 | (f) | | | 10,807 | | | | 1.38 | (e) | | | 1.25 | (e) | | | 1.25 | (e) | | | 1.17 | (e) | | | — | |
The Hartford Disciplined Equity Fund | | | | | | | | | | | | | | | | | | | | | | | | | | | | |
| For the Six-Month Period Ended April 30, 2008 (Unaudited) | | | | | | | | | | | | | | | | | | | | | | | | | | | | |
| Class A | | | 14.91 | | | | 0.02 | | | | — | | | | (1.60 | ) | | | (1.58 | ) | | | (0.02 | ) | | | — | | | | — | | | | (0.02 | ) | | | (1.60 | ) | | | 13.31 | | | | (10.59 | )(f) | | | 145,728 | | | | 1.42 | (e) | | | 1.40 | (e) | | | 1.40 | (e) | | | 0.30 | (e) | | | 26 | |
| Class B | | | 14.16 | | | | (0.03 | ) | | | — | | | | (1.51 | ) | | | (1.54 | ) | | | — | | | | — | | | | — | | | | — | | | | (1.54 | ) | | | 12.62 | | | | (10.88 | )(f) | | | 21,352 | | | | 2.36 | (e) | | | 1.98 | (e) | | | 1.98 | (e) | | | (0.26 | )(e) | | | — | |
| Class C | | | 14.17 | | | | (0.03 | ) | | | — | | | | (1.51 | ) | | | (1.54 | ) | | | — | | | | — | | | | — | | | | — | | | | (1.54 | ) | | | 12.63 | | | | (10.87 | )(f) | | | 21,753 | | | | 2.11 | (e) | | | 2.11 | (e) | | | 2.11 | (e) | | | (0.41 | )(e) | | | — | |
| Class R3 | | | 15.33 | | | | — | | | | — | | | | (1.64 | ) | | | (1.64 | ) | | | — | | | | — | | | | — | | | | — | | | | (1.64 | ) | | | 13.69 | | | | (10.70 | )(f) | | | 11 | | | | 1.79 | (e) | | | 1.65 | (e) | | | 1.65 | (e) | | | 0.03 | (e) | | | — | |
| Class R4 | | | 15.37 | | | | 0.03 | | | | — | | | | (1.64 | ) | | | (1.61 | ) | | | (0.04 | ) | | | — | | | | — | | | | (0.04 | ) | | | (1.65 | ) | | | 13.72 | | | | (10.50 | )(f) | | | 10 | | | | 1.28 | (e) | | | 1.28 | (e) | | | 1.28 | (e) | | | 0.41 | (e) | | | — | |
| Class R5 | | | 15.41 | | | | 0.05 | | | | — | | | | (1.65 | ) | | | (1.60 | ) | | | (0.08 | ) | | | — | | | | — | | | | (0.08 | ) | | | (1.68 | ) | | | 13.73 | | | | (10.41 | )(f) | | | 10 | | | | 0.99 | (e) | | | 0.99 | (e) | | | 0.99 | (e) | | | 0.70 | (e) | | | — | |
| Class Y | | | 15.43 | | | | 0.06 | | | | — | | | | (1.65 | ) | | | (1.59 | ) | | | (0.10 | ) | | | — | | | | — | | | | (0.10 | ) | | | (1.69 | ) | | | 13.74 | | | | (10.34 | )(f) | | | 100,367 | | | | 0.89 | (e) | | | 0.89 | (e) | | | 0.89 | (e) | | | 0.81 | (e) | | | — | |
| For the Year Ended October 31, 2007 | | | | | | | | | | | | | | | | | | | | | | | | | | | | |
| Class A | | | 13.19 | | | | 0.04 | | | | 0.01 | | | | 1.77 | | | | 1.82 | | | | (0.10 | ) | | | — | | | | — | | | | (0.10 | ) | | | 1.72 | | | | 14.91 | | | | 13.87 | (i) | | | 177,170 | | | | 1.40 | | | | 1.40 | | | | 1.40 | | | | 0.32 | | | | 72 | |
| Class B | | | 12.53 | | | | (0.07 | ) | | | 0.01 | | | | 1.70 | | | | 1.64 | | | | (0.01 | ) | | | — | | | | — | | | | (0.01 | ) | | | 1.63 | | | | 14.16 | | | | 13.14 | (i) | | | 29,968 | | | | 2.31 | | | | 2.08 | | | | 2.08 | | | | (0.35 | ) | | | — | |
| Class C | | | 12.54 | | | | (0.07 | ) | | | 0.01 | | | | 1.70 | | | | 1.64 | | | | (0.01 | ) | | | — | | | | — | | | | (0.01 | ) | | | 1.63 | | | | 14.17 | | | | 13.07 | (i) | | | 26,479 | | | | 2.09 | | | | 2.09 | | | | 2.09 | | | | (0.37 | ) | | | — | |
| Class Y | | | 13.58 | | | | 0.19 | | | | 0.01 | | | | 1.75 | | | | 1.95 | | | | (0.10 | ) | | | — | | | | — | | | | (0.10 | ) | | | 1.85 | | | | 15.43 | | | | 14.45 | (i) | | | 111,098 | | | | 0.88 | | | | 0.88 | | | | 0.88 | | | | 0.86 | | | | — | |
| From (commencement of operations) December 22, 2006, through October 31, 2007 | | | | | | | | | | | | | | | | | | | | | | | | | | | | |
| Class R3 | | | 13.89 | | | | — | | | | — | | | | 1.44 | | | | 1.44 | | | | — | | | | — | | | | — | | | | — | | | | 1.44 | | | | 15.33 | | | | 10.37 | (f) | | | 11 | | | | 1.65 | (e) | | | 1.65 | (e) | | | 1.65 | (e) | | | (0.03 | )(e) | | | — | |
| Class R4 | | | 13.89 | | | | 0.03 | | | | — | | | | 1.45 | | | | 1.48 | | | | — | | | | — | | | | — | | | | — | | | | 1.48 | | | | 15.37 | | | | 10.66 | (f) | | | 11 | | | | 1.34 | (e) | | | 1.34 | (e) | | | 1.34 | (e) | | | 0.28 | (e) | | | — | |
| Class R5 | | | 13.89 | | | | 0.07 | | | | — | | | | 1.45 | | | | 1.52 | | | | — | | | | — | | | | — | | | | — | | | | 1.52 | | | | 15.41 | | | | 10.94 | (f) | | | 11 | | | | 1.05 | (e) | | | 1.05 | (e) | | | 1.05 | (e) | | | 0.57 | (e) | | | — | |
| For the Year Ended October 31, 2006 | | | | | | | | | | | | | | | | | | | | | | | | | | | | |
| Class A | | | 11.78 | | | | 0.04 | | | | — | | | | 1.39 | | | | 1.43 | | | | (0.02 | ) | | | — | | | | — | | | | (0.02 | ) | | | 1.41 | | | | 13.19 | | | | 12.13 | | | | 189,375 | | | | 1.40 | | | | 1.40 | | | | 1.40 | | | | 0.39 | | | | 67 | |
| Class B | | | 11.25 | | | | (0.03 | ) | | | — | | | | 1.31 | | | | 1.28 | | | | — | | | | — | | | | — | | | | — | | | | 1.28 | | | | 12.53 | | | | 11.38 | | | | 35,673 | | | | 2.30 | | | | 2.07 | | | | 2.07 | | | | (0.28 | ) | | | — | |
| Class C | | | 11.26 | | | | (0.04 | ) | | | — | | | | 1.32 | | | | 1.28 | | | | — | | | | — | | | | — | | | | — | | | | 1.28 | | | | 12.54 | | | | 11.37 | | | | 29,153 | | | | 2.10 | | | | 2.10 | | | | 2.10 | | | | (0.31 | ) | | | — | |
| Class Y | | | 12.12 | | | | 0.14 | | | | — | | | | 1.40 | | | | 1.54 | | | | (0.08 | ) | | | — | | | | — | | | | (0.08 | ) | | | 1.46 | | | | 13.58 | | | | 12.76 | | | | 169,614 | | | | 0.89 | | | | 0.89 | | | | 0.89 | | | | 0.88 | | | | — | |
| For the Year Ended October 31, 2005 | | | | | | | | | | | | | | | | | | | | | | | | | | | | |
| Class A | | | 10.67 | | | | 0.10 | | | | — | | | | 1.09 | | | | 1.19 | | | | (0.08 | ) | | | — | | | | — | | | | (0.08 | ) | | | 1.11 | | | | 11.78 | | | | 11.19 | | | | 209,721 | | | | 1.41 | | | | 1.40 | | | | 1.40 | | | | 0.81 | | | | 61 | |
| Class B | | | 10.20 | | | | (0.02 | ) | | | — | | | | 1.08 | | | | 1.06 | | | | (0.01 | ) | | | — | | | | — | | | | (0.01 | ) | | | 1.05 | | | | 11.25 | | | | 10.35 | | | | 39,806 | | | | 2.34 | | | | 2.15 | | | | 2.15 | | | | 0.06 | | | | — | |
| Class C | | | 10.22 | | | | (0.02 | ) | | | — | | | | 1.07 | | | | 1.05 | | | | (0.01 | ) | | | — | | | | — | | | | (0.01 | ) | | | 1.04 | | | | 11.26 | | | | 10.29 | | | | 33,690 | | | | 2.11 | | | | 2.11 | | | | 2.11 | | | | 0.12 | | | | — | |
| Class Y | | | 10.99 | | | | 0.15 | | | | — | | | | 1.12 | | | | 1.27 | | | | (0.14 | ) | | | — | | | | — | | | | (0.14 | ) | | | 1.13 | | | | 12.12 | | | | 11.62 | | | | 81,582 | | | | 0.90 | | | | 0.90 | | | | 0.90 | | | | 0.97 | | | | — | |
382
| | | | | | | | | | | | | | | | | | | | | | | | | | | | | | | | | | | | | | | | | | | | | | | | | | | | | | | | | | | | | | | | | | | | | | | | | |
| | | — Selected Per-Share Data (a) — | | — Ratios and Supplemental Data — |
| | | | | | | | | | | | | | | | | | | | | | | | | | | | | Ratio of
| | Ratio of
| | Ratio of
| | | | |
| | | | | | | | | | | | | | | | | | | | | | | | | | | | | Expenses
| | Expenses
| | Expenses
| | | | |
| | | | | | | | | | | | | | | | | | | | | | | | | | | | | to Average
| | to Average
| | to Average
| | | | |
| | | | | | | | | Net
| | | | | | | | | | | | | | | | | | | | Net Assets
| | Net Assets
| | Net Assets
| | | | |
| | | | | | | | | Realized
| | | | | | | | | | | | Net
| | | | | | | | Before
| | After
| | After
| | Ratio of
| | |
| | | | | | | | | and
| | | | | | Distributions
| | | | | | Increase
| | | | | | | | Waivers and
| | Waivers and
| | Waivers and
| | Net
| | |
| | | Net Asset
| | Net
| | Payments
| | Unrealized
| | Total
| | Dividends
| | from
| | | | | | (Decrease)
| | Net Asset
| | | | Net Assets
| | Reimbursements
| | Reimbursements
| | Reimbursements
| | Investment
| | |
| | | Value at
| | Investment
| | from
| | Gain
| | from
| | from Net
| | Realized
| | Distributions
| | | | in Net
| | Value at
| | | | at End of
| | and Including
| | and Including
| | and Excluding
| | Income
| | Portfolio
|
| | | Beginning
| | Income
| | (to)
| | (Loss) on
| | Investment
| | Investment
| | Capital
| | from
| | Total
| | Asset
| | End
| | Total
| | Period
| | Interest
| | Interest
| | Interest
| | to Average
| | Turnover
|
| | | of Period | | (Loss) | | Affiliate | | Investments | | Operations | | Income | | Gains | | Capital | | Distributions | | Value | | of Period | | Return (b) | | (000’s) | | Expense (d) | | Expense (d) | | Expense (d) | | Net Assets | | Rate (c) |
The Hartford Disciplined Equity Fund — (continued) | | | | | | | | | | | | | | | | | | | | | | | | | | | | |
| For the Year Ended October 31, 2004 | | | | | | | | | | | | | | | | | | | | | | | | | | | | |
| Class A | | $ | 10.08 | | | $ | 0.03 | | | $ | — | | | $ | 0.57 | | | $ | 0.60 | | | $ | (0.01 | ) | | $ | — | | | $ | — | | | $ | (0.01 | ) | | $ | 0.59 | | | $ | 10.67 | | | | 5.92 | % | | $ | 241,014 | | | | 1.46 | % | | | 1.45 | % | | | 1.45 | % | | | 0.30 | % | | | 62 | % |
| Class B | | | 9.70 | | | | (0.05 | ) | | | — | | | | 0.55 | | | | 0.50 | | | | — | | | | — | | | | — | | | | — | | | | 0.50 | | | | 10.20 | | | | 5.16 | | | | 44,561 | | | | 2.34 | | | | 2.15 | | | | 2.15 | | | | (0.41 | ) | | | — | |
| Class C | | | 9.71 | | | | (0.05 | ) | | | — | | | | 0.56 | | | | 0.51 | | | | — | | | | — | | | | — | | | | — | | | | 0.51 | | | | 10.22 | | | | 5.25 | (i) | | | 40,965 | | | | 2.10 | | | | 2.10 | | | | 2.10 | | | | (0.36 | ) | | | — | |
| Class Y | | | 10.36 | | | | (0.01 | ) | | | — | | | | 0.69 | | | | 0.68 | | | | (0.05 | ) | | | — | | | | — | | | | (0.05 | ) | | | 0.63 | | | | 10.99 | | | | 6.55 | | | | 19,578 | | | | 0.88 | | | | 0.88 | | | | 0.88 | | | | 0.95 | | | | — | |
| For the Year Ended October 31, 2003 | | | | | | | | | | | | | | | | | | | | | | | | | | | | |
| Class A | | | 8.43 | | | | 0.02 | | | | — | | | | 1.63 | | | | 1.65 | | | | — | | | | — | | | | — | | | | — | | | | 1.65 | | | | 10.08 | | | | 19.57 | | | | 243,842 | | | | 1.56 | | | | 1.45 | | | | 1.45 | | | | 0.24 | | | | 76 | |
| Class B | | | 8.17 | | | | (0.04 | ) | | | — | | | | 1.57 | | | | 1.53 | | | | — | | | | — | | | | — | | | | — | | | | 1.53 | | | | 9.70 | | | | 18.73 | | | | 47,888 | | | | 2.30 | | | | 2.15 | | | | 2.15 | | | | (0.46 | ) | | | — | |
| Class C | | | 8.18 | | | | (0.04 | ) | | | — | | | | 1.57 | | | | 1.53 | | | | — | | | | — | | | | — | | | | — | | | | 1.53 | | | | 9.71 | | | | 18.70 | | | | 46,162 | | | | 2.17 | | | | 2.15 | | | | 2.15 | | | | (0.46 | ) | | | — | |
| Class Y | | | 8.63 | | | | 0.08 | | | | — | | | | 1.65 | | | | 1.73 | | | | — | | | | — | | | | — | | | | — | | | | 1.73 | | | | 10.36 | | | | 20.05 | | | | 622 | | | | 0.98 | | | | 0.98 | | | | 0.98 | | | | 0.70 | | | | — | |
The Hartford Dividend and Growth Fund | | | | | | | | | | | | | | | | | | | | | | | | | | | | |
| For the Six-Month Period Ended April 30, 2008 (Unaudited) | | | | | | | | | | | | | | | | | | | | | | | | | | | | |
| Class A | | | 23.12 | | | | 0.15 | | | | — | | | | (1.61 | ) | | | (1.46 | ) | | | (0.15 | ) | | | (1.24 | ) | | | — | | | | (1.39 | ) | | | (2.85 | ) | | | 20.27 | | | | (6.46 | )(f) | | | 3,082,064 | | | | 1.08 | (e) | | | 1.08 | (e) | | | 1.08 | (e) | | | 1.51 | (e) | | | 20 | |
| Class B | | | 22.76 | | | | 0.06 | | | | — | | | | (1.59 | ) | | | (1.53 | ) | | | (0.06 | ) | | | (1.24 | ) | | | — | | | | (1.30 | ) | | | (2.83 | ) | | | 19.93 | | | | (6.90 | )(f) | | | 340,261 | | | | 1.96 | (e) | | | 1.96 | (e) | | | 1.96 | (e) | | | 0.64 | (e) | | | — | |
| Class C | | | 22.72 | | | | 0.08 | | | | — | | | | (1.60 | ) | | | (1.52 | ) | | | (0.07 | ) | | | (1.24 | ) | | | — | | | | (1.31 | ) | | | (2.83 | ) | | | 19.89 | | | | (6.84 | )(f) | | | 327,313 | | | | 1.83 | (e) | | | 1.83 | (e) | | | 1.83 | (e) | | | 0.76 | (e) | | | — | |
| Class I | | | 23.07 | | | | 0.17 | | | | — | | | | (1.60 | ) | | | (1.43 | ) | | | (0.18 | ) | | | (1.24 | ) | | | — | | | | (1.42 | ) | | | (2.85 | ) | | | 20.22 | | | | (6.32 | )(f) | | | 5,236 | | | | 0.78 | (e) | | | 0.78 | (e) | | | 0.78 | (e) | | | 1.73 | (e) | | | — | |
| Class R3 | | | 23.37 | | | | 0.10 | | | | — | | | | (1.63 | ) | | | (1.53 | ) | | | (0.12 | ) | | | (1.24 | ) | | | — | | | | (1.36 | ) | | | (2.89 | ) | | | 20.48 | | | | (6.70 | )(f) | | | 246 | | | | 1.55 | (e) | | | 1.50 | (e) | | | 1.50 | (e) | | | 1.04 | (e) | | | — | |
| Class R4 | | | 23.39 | | | | 0.15 | | | | — | | | | (1.63 | ) | | | (1.48 | ) | | | (0.16 | ) | | | (1.24 | ) | | | — | | | | (1.40 | ) | | | (2.88 | ) | | | 20.51 | | | | (6.47 | )(f) | | | 6,797 | | | | 1.09 | (e) | | | 1.09 | (e) | | | 1.09 | (e) | | | 1.47 | (e) | | | — | |
| Class R5 | | | 23.41 | | | | 0.16 | | | | — | | | | (1.61 | ) | | | (1.45 | ) | | | (0.18 | ) | | | (1.24 | ) | | | — | | | | (1.42 | ) | | | (2.87 | ) | | | 20.54 | | | | (6.32 | )(f) | | | 295 | | | | 0.79 | (e) | | | 0.79 | (e) | | | 0.79 | (e) | | | 1.75 | (e) | | | — | |
| Class Y | | | 23.41 | | | | 0.18 | | | | — | | | | (1.62 | ) | | | (1.44 | ) | | | (0.19 | ) | | | (1.24 | ) | | | — | | | | (1.43 | ) | | | (2.87 | ) | | | 20.54 | | | | (6.28 | )(f) | | | 454,699 | | | | 0.68 | (e) | | | 0.68 | (e) | | | 0.68 | (e) | | | 1.86 | (e) | | | — | |
| For the Year Ended October 31, 2007 | | | | | | | | | | | | | | | | | | | | | | | | | | | | |
| Class A | | | 21.48 | | | | 0.29 | | | | 0.01 | | | | 2.95 | | | | 3.25 | | | | (0.27 | ) | | | (1.34 | ) | | | — | | | | (1.61 | ) | | | 1.64 | | | | 23.12 | | | | 16.20 | (i) | | | 3,236,757 | | | | 1.09 | | | | 1.09 | | | | 1.09 | | | | 1.35 | | | | 24 | |
| Class B | | | 21.17 | | | | 0.11 | | | | 0.01 | | | | 2.90 | | | | 3.02 | | | | (0.09 | ) | | | (1.34 | ) | | | — | | | | (1.43 | ) | | | 1.59 | | | | 22.76 | | | | 15.22 | (i) | | | 395,552 | | | | 1.95 | | | | 1.95 | | | | 1.95 | | | | 0.50 | | | | — | |
| Class C | | | 21.13 | | | | 0.13 | | | | 0.01 | | | | 2.91 | | | | 3.05 | | | | (0.12 | ) | | | (1.34 | ) | | | — | | | | (1.46 | ) | | | 1.59 | | | | 22.72 | | | | 15.42 | (i) | | | 365,443 | | | | 1.82 | | | | 1.82 | | | | 1.82 | | | | 0.62 | | | | — | |
| Class I | | | 21.46 | | | | 0.36 | | | | — | | | | 2.98 | | | | 3.34 | | | | (0.39 | ) | | | (1.34 | ) | | | — | | | | (1.73 | ) | | | 1.61 | | | | 23.07 | | | | 16.67 | (i) | | | 1,899 | | | | 0.77 | | | | 0.77 | | | | 0.77 | | | | 1.50 | | | | — | |
| Class Y | | | 21.72 | | | | 0.37 | | | | — | | | | 3.02 | | | | 3.39 | | | | (0.36 | ) | | | (1.34 | ) | | | — | | | | (1.70 | ) | | | 1.69 | | | | 23.41 | | | | 16.68 | (i) | | | 255,138 | | | | 0.69 | | | | 0.69 | | | | 0.69 | | | | 1.72 | | | | — | |
| From (commencement of operations) December 22, 2006, through October 31, 2007 | | | | | | | | | | | | | | | | | | | | | | | | | | | | |
| Class R3 | | | 21.14 | | | | 0.15 | | | | — | | | | 2.25 | | | | 2.40 | | | | (0.17 | ) | | | — | | | | — | | | | (0.17 | ) | | | 2.23 | | | | 23.37 | | | | 11.38 | (f) | | | 177 | | | | 1.40 | (e) | | | 1.40 | (e) | | | 1.40 | (e) | | | 0.63 | (e) | | | — | |
| Class R4 | | | 21.14 | | | | 0.21 | | | | — | | | | 2.26 | | | | 2.47 | | | | (0.22 | ) | | | — | | | | — | | | | (0.22 | ) | | | 2.25 | | | | 23.39 | | | | 11.70 | (f) | | | 1,994 | | | | 1.09 | (e) | | | 1.09 | (e) | | | 1.09 | (e) | | | 0.72 | (e) | | | — | |
| Class R5 | | | 21.14 | | | | 0.26 | | | | — | | | | 2.26 | | | | 2.52 | | | | (0.25 | ) | | | — | | | | — | | | | (0.25 | ) | | | 2.27 | | | | 23.41 | | | | 11.99 | (f) | | | 193 | | | | 0.82 | (e) | | | 0.82 | (e) | | | 0.82 | (e) | | | 0.98 | (e) | | | — | |
| For the Year Ended October 31, 2006 (h) | | | | | | | | | | | | | | | | | | | | | | | | | | | | |
| Class A | | | 19.10 | | | | 0.26 | | | | — | | | | 3.14 | | | | 3.40 | | | | (0.26 | ) | | | (0.76 | ) | | | — | | | | (1.02 | ) | | | 2.38 | | | | 21.48 | | | | 18.63 | | | | 2,626,634 | | | | 1.14 | | | | 1.14 | | | | 1.14 | | | | 1.32 | | | | 29 | |
| Class B | | | 18.84 | | | | 0.09 | | | | — | | | | 3.10 | | | | 3.19 | | | | (0.10 | ) | | | (0.76 | ) | | | — | | | | (0.86 | ) | | | 2.33 | | | | 21.17 | | | | 17.63 | | | | 365,678 | | | | 1.99 | | | | 1.99 | | | | 1.99 | | | | 0.48 | | | | — | |
| Class C | | | 18.81 | | | | 0.12 | | | | — | | | | 3.08 | | | | 3.20 | | | | (0.12 | ) | | | (0.76 | ) | | | — | | | | (0.88 | ) | | | 2.32 | | | | 21.13 | | | | 17.75 | | | | 317,139 | | | | 1.87 | | | | 1.87 | | | | 1.87 | | | | 0.60 | | | | — | |
| Class Y | | | 19.30 | | | | 0.35 | | | | — | | | | 3.18 | | | | 3.53 | | | | (0.35 | ) | | | (0.76 | ) | | | — | | | | (1.11 | ) | | | 2.42 | | | | 21.72 | | | | 19.15 | | | | 133,376 | | | | 0.71 | | | | 0.71 | | | | 0.71 | | | | 1.75 | | | | — | |
| From (commencement of operations) August 31, 2006, through October 31, 2006 (h) | | | | | | | | | | | | | | | | | | | | | | | | | | | | |
| Class I | | | 20.48 | | | | 0.03 | | | | — | | | | 1.03 | | | | 1.06 | | | | (0.08 | ) | | | — | | | | — | | | | (0.08 | ) | | | 0.98 | | | | 21.46 | | | | 5.20 | (f) | | | 11 | | | | 1.08 | (e) | | | 0.98 | (e) | | | 0.98 | (e) | | | 0.59 | (e) | | | — | |
| For the Year Ended October 31, 2005 | | | | | | | | | | | | | | | | | | | | | | | | | | | | |
| Class A | | | 17.79 | | | | 0.23 | | | | — | | | | 1.51 | | | | 1.74 | | | | (0.24 | ) | | | (0.19 | ) | | | — | | | | (0.43 | ) | | | 1.31 | | | | 19.10 | | | | 9.87 | | | | 2,109,617 | | | | 1.17 | | | | 1.17 | | | | 1.17 | | | | 1.25 | | | | 26 | |
| Class B | | | 17.56 | | | | 0.08 | | | | — | | | | 1.48 | | | | 1.56 | | | | (0.09 | ) | | | (0.19 | ) | | | — | | | | (0.28 | ) | | | 1.28 | | | | 18.84 | | | | 8.92 | | | | 343,650 | | | | 2.01 | | | | 2.01 | | | | 2.01 | | | | 0.41 | | | | — | |
| Class C | | | 17.53 | | | | 0.10 | | | | — | | | | 1.48 | | | | 1.58 | | | | (0.11 | ) | | | (0.19 | ) | | | — | | | | (0.30 | ) | | | 1.28 | | | | 18.81 | | | | 9.08 | | | | 280,967 | | | | 1.89 | | | | 1.89 | | | | 1.89 | | | | 0.54 | | | | — | |
| Class Y | | | 17.97 | | | | 0.32 | | | | — | | | | 1.53 | | | | 1.85 | | | | (0.33 | ) | | | (0.19 | ) | | | — | | | | (0.52 | ) | | | 1.33 | | | | 19.30 | | | | 10.36 | | | | 114,777 | | | | 0.73 | | | | 0.73 | | | | 0.73 | | | | 1.64 | | | | — | |
| For the Year Ended October 31, 2004 | | | | | | | | | | | | | | | | | | | | | | | | | | | | |
| Class A | | | 15.94 | | | | 0.16 | | | | 0.01 | | | | 1.82 | | | | 1.99 | | | | (0.14 | ) | | | — | | | | — | | | | (0.14 | ) | | | 1.85 | | | | 17.79 | | | | 12.53 | (i) | | | 1,838,567 | | | | 1.23 | | | | 1.23 | | | | 1.23 | | | | 0.96 | | | | 25 | |
| Class B | | | 15.75 | | | | 0.03 | | | | — | | | | 1.80 | | | | 1.83 | | | | (0.02 | ) | | | — | | | | — | | | | (0.02 | ) | | | 1.81 | | | | 17.56 | | | | 11.62 | | | | 319,512 | | | | 2.04 | | | | 2.04 | | | | 2.04 | | | | 0.16 | | | | — | |
| Class C | | | 15.72 | | | | 0.05 | | | | 0.01 | | | | 1.79 | | | | 1.85 | | | | (0.04 | ) | | | — | | | | — | | | | (0.04 | ) | | | 1.81 | | | | 17.53 | | | | 11.76 | (i) | | | 277,706 | | | | 1.90 | | | | 1.90 | | | | 1.90 | | | | 0.29 | | | | — | |
| Class Y | | | 16.11 | | | | 0.24 | | | | — | | | | 1.86 | | | | 2.10 | | | | (0.24 | ) | | | — | | | | — | | | | (0.24 | ) | | | 1.86 | | | | 17.97 | | | | 13.06 | | | | 69,088 | | | | 0.75 | | | | 0.75 | | | | 0.75 | | | | 1.44 | | | | — | |
| For the Year Ended October 31, 2003 | | | | | | | | | | | | | | | | | | | | | | | | | | | | |
| Class A | | | 13.58 | | | | 0.12 | | | | — | | | | 2.37 | | | | 2.49 | | | | (0.13 | )(m) | | | — | | | | — | | | | (0.13 | ) | | | 2.36 | | | | 15.94 | | | | 18.42 | | | | 1,296,982 | | | | 1.41 | | | | 1.40 | | | | 1.40 | | | | 0.88 | | | | 31 | |
| Class B | | | 13.43 | | | | 0.03 | | | | — | | | | 2.32 | | | | 2.35 | | | | (0.03 | )(m) | | | — | | | | — | | | | (0.03 | ) | | | 2.32 | | | | 15.75 | | | | 17.52 | | | | 257,856 | | | | 2.14 | | | | 2.13 | | | | 2.13 | | | | 0.16 | | | | — | |
| Class C | | | 13.40 | | | | 0.04 | | | | — | | | | 2.32 | | | | 2.36 | | | | (0.04 | )(m) | | | — | | | | — | | | | (0.04 | ) | | | 2.32 | | | | 15.72 | | | | 17.67 | | | | 230,348 | | | | 2.02 | | | | 2.02 | | | | 2.02 | | | | 0.27 | | | | — | |
| Class Y | | | 13.73 | | | | 0.19 | | | | — | | | | 2.40 | | | | 2.59 | | | | (0.21 | )(m) | | | — | | | | — | | | | (0.21 | ) | | | 2.38 | | | | 16.11 | | | | 19.03 | | | | 42,107 | | | | 0.81 | | | | 0.81 | | | | 0.81 | | | | 1.44 | | | | — | |
| | | | | | | | | | | | | | | | | | | | | | | | | | | | | | | | | | | | | | | | | | | | | | | | | | | | | | | | | | | | | | | | | | | | | | | | | |
383
The Hartford Mutual Funds, Inc. and The Hartford Mutual Funds II, Inc.
Financial Highlights — (continued)
| | | | | | | | | | | | | | | | | | | | | | | | | | | | | | | | | | | | | | | | | | | | | | | | | | | | | | | | | | | | | | | | | | | | | | | | | |
| | | — Selected Per-Share Data (a) — | | — Ratios and Supplemental Data — |
| | | | | | | | | | | | | | | | | | | | | | | | | | | | | Ratio of
| | Ratio of
| | Ratio of
| | | | |
| | | | | | | | | | | | | | | | | | | | | | | | | | | | | Expenses
| | Expenses
| | Expenses
| | | | |
| | | | | | | | | | | | | | | | | | | | | | | | | | | | | to Average
| | to Average
| | to Average
| | | | |
| | | | | | | | | Net
| | | | | | | | | | | | | | | | | | | | Net Assets
| | Net Assets
| | Net Assets
| | | | |
| | | | | | | | | Realized
| | | | | | | | | | | | Net
| | | | | | | | Before
| | After
| | After
| | Ratio of
| | |
| | | | | | | | | and
| | | | | | Distributions
| | | | | | Increase
| | | | | | | | Waivers and
| | Waivers and
| | Waivers and
| | Net
| | |
| | | Net Asset
| | Net
| | Payments
| | Unrealized
| | Total
| | Dividends
| | from
| | | | | | (Decrease)
| | Net Asset
| | | | Net Assets
| | Reimbursements
| | Reimbursements
| | Reimbursements
| | Investment
| | |
| | | Value at
| | Investment
| | from
| | Gain
| | from
| | from Net
| | Realized
| | Distributions
| | | | in Net
| | Value at
| | | | at End of
| | and Including
| | and Including
| | and Excluding
| | Income
| | Portfolio
|
| | | Beginning
| | Income
| | (to)
| | (Loss) on
| | Investment
| | Investment
| | Capital
| | from
| | Total
| | Asset
| | End
| | Total
| | Period
| | Interest
| | Interest
| | Interest
| | to Average
| | Turnover
|
| | | of Period | | (Loss) | | Affiliate | | Investments | | Operations | | Income | | Gains | | Capital | | Distributions | | Value | | of Period | | Return (b) | | (000’s) | | Expense (d) | | Expense (d) | | Expense (d) | | Net Assets | | Rate (c) |
The Hartford Equity Growth Allocation Fund (g) | | | | | | | | | | | | | | | | | | | | | | | | | | | | |
| For the Six-Month Period Ended April 30, 2008 (Unaudited) | | | | | | | | | | | | | | | | | | | | | | | | | | | | |
| Class A | | $ | 15.55 | | | $ | 0.08 | | | $ | — | | | $ | (1.56 | ) | | $ | (1.48 | ) | | $ | (0.55 | ) | | $ | (0.90 | ) | | $ | — | | | $ | (1.45 | ) | | $ | (2.93 | ) | | $ | 12.62 | | | | (10.07)%(f) | | | $ | 169,933 | | | | 0.67 | %(e) | | | 0.67 | %(e) | | | 0.67 | %(e) | | | 0.56 | %(e) | | | 9 | % |
| Class B | | | 15.40 | | | | 0.02 | | | | — | | | | (1.54 | ) | | | (1.52 | ) | | | (0.46 | ) | | | (0.90 | ) | | | — | | | | (1.36 | ) | | | (2.88 | ) | | | 12.52 | | | | (10.42 | )(f) | | | 44,613 | | | | 1.50 | (e) | | | 1.49 | (e) | | | 1.49 | (e) | | | (0.19 | )(e) | | | — | |
| Class C | | | 15.39 | | | | 0.02 | | | | — | | | | (1.52 | ) | | | (1.50 | ) | | | (0.47 | ) | | | (0.90 | ) | | | — | | | | (1.37 | ) | | | (2.87 | ) | | | 12.52 | | | | (10.34 | )(f) | | | 68,657 | | | | 1.42 | (e) | | | 1.42 | (e) | | | 1.42 | (e) | | | (0.12 | )(e) | | | — | |
| Class I | | | 15.59 | | | | 0.40 | | | | — | | | | (1.85 | ) | | | (1.45 | ) | | | (0.60 | ) | | | (0.90 | ) | | | — | | | | (1.50 | ) | | | (2.95 | ) | | | 12.64 | | | | (9.85 | )(f) | | | 480 | | | | 0.29 | (e) | | | 0.29 | (e) | | | 0.29 | (e) | | | (0.33 | )(e) | | | — | |
| Class R3 | | | 15.52 | | | | 0.09 | | | | — | | | | (1.58 | ) | | | (1.49 | ) | | | (0.55 | ) | | | (0.90 | ) | | | — | | | | (1.45 | ) | | | (2.94 | ) | | | 12.58 | | | | (10.19 | )(f) | | | 842 | | | | 0.95 | (e) | | | 0.95 | (e) | | | 0.95 | (e) | | | 0.47 | (e) | | | — | |
| Class R4 | | | 15.56 | | | | 0.39 | | | | — | | | | (1.86 | ) | | | (1.47 | ) | | | (0.60 | ) | | | (0.90 | ) | | | — | | | | (1.50 | ) | | | (2.97 | ) | | | 12.59 | | | | (10.06 | )(f) | | | 2,452 | | | | 0.64 | (e) | | | 0.64 | (e) | | | 0.64 | (e) | | | (0.11 | )(e) | | | — | |
| Class R5 | | | 15.60 | | | | 0.56 | | | | — | | | | (2.02 | ) | | | (1.46 | ) | | | (0.60 | ) | | | (0.90 | ) | | | — | | | | (1.50 | ) | | | (2.96 | ) | | | 12.64 | | | | (9.92 | )(f) | | | 1,111 | | | | 0.34 | (e) | | | 0.34 | (e) | | | 0.34 | (e) | | | (0.10 | )(e) | | | — | |
| For the Year Ended October 31, 2007 | | | | | | | | | | | | | | | | | | | | | | | | | | | | |
| Class A | | | 13.21 | | | | 0.03 | | | | — | | | | 2.83 | | | | 2.86 | | | | (0.24 | ) | | | (0.28 | ) | | | — | | | | (0.52 | ) | | | 2.34 | | | | 15.55 | | | | 22.39 | | | | 173,379 | | | | 0.69 | | | | 0.69 | | | | 0.69 | | | | (0.06 | ) | | | 37 | |
| Class B | | | 13.10 | | | | (0.07 | ) | | | — | | | | 2.81 | | | | 2.74 | | | | (0.16 | ) | | | (0.28 | ) | | | — | | | | (0.44 | ) | | | 2.30 | | | | 15.40 | | | | 21.58 | | | | 47,743 | | | | 1.52 | | | | 1.37 | | | | 1.37 | | | | (0.72 | ) | | | — | |
| Class C | | | 13.10 | | | | (0.07 | ) | | | — | | | | 2.80 | | | | 2.73 | | | | (0.16 | ) | | | (0.28 | ) | | | — | | | | (0.44 | ) | | | 2.29 | | | | 15.39 | | | | 21.50 | | | | 74,047 | | | | 1.42 | | | | 1.37 | | | | 1.37 | | | | (0.72 | ) | | | — | |
| Class I | | | 13.22 | | | | 0.19 | | | | — | | | | 2.71 | | | | 2.90 | | | | (0.25 | ) | | | (0.28 | ) | | | — | | | | (0.53 | ) | | | 2.37 | | | | 15.59 | | | | 22.75 | | | | 64 | | | | 0.39 | | | | 0.37 | | | | 0.37 | | | | (0.15 | ) | | | — | |
| From (commencement of operations) December 22, 2006, through October 31, 2007 | | | | | | | | | | | | | | | | | | | | | | | | | | | | |
| Class R3 | | | 13.24 | | | | (0.05 | ) | | | — | | | | 2.33 | | | | 2.28 | | | | — | | | | — | | | | — | | | | — | | | | 2.28 | | | | 15.52 | | | | 17.22 | (f) | | | 952 | | | | 0.97 | (e) | | | 0.96 | (e) | | | 0.96 | (e) | | | (0.91 | )(e) | | | — | |
| Class R4 | | | 13.24 | | | | (0.02 | ) | | | — | | | | 2.34 | | | | 2.32 | | | | — | | | | — | | | | — | | | | — | | | | 2.32 | | | | 15.56 | | | | 17.52 | (f) | | | 456 | | | | 0.71 | (e) | | | 0.69 | (e) | | | 0.69 | (e) | | | (0.64 | )(e) | | | — | |
| Class R5 | | | 13.24 | | | | (0.01 | ) | | | — | | | | 2.37 | | | | 2.36 | | | | — | | | | — | | | | — | | | | — | | | | 2.36 | | | | 15.60 | | | | 17.82 | (f) | | | 77 | | | | 0.42 | (e) | | | 0.38 | (e) | | | 0.38 | (e) | | | (0.33 | )(e) | | | — | |
| For the Year Ended October 31, 2006 | | | | | | | | | | | | | | | | | | | | | | | | | | | | |
| Class A | | | 11.46 | | | | 0.02 | | | | — | | | | 1.83 | | | | 1.85 | | | | (0.09 | ) | | | (0.01 | ) | | | — | | | | (0.10 | ) | | | 1.75 | | | | 13.21 | | | | 16.18 | | | | 116,198 | | | | 0.79 | | | | 0.72 | | | | 0.72 | | | | (0.34 | ) | | | 14 | |
| Class B | | | 11.37 | | | | (0.12 | ) | | | — | | | | 1.88 | | | | 1.76 | | | | (0.02 | ) | | | (0.01 | ) | | | — | | | | (0.03 | ) | | | 1.73 | | | | 13.10 | | | | 15.43 | | | | 33,295 | | | | 1.62 | | | | 1.37 | | | | 1.37 | | | | (0.93 | ) | | | — | |
| Class C | | | 11.37 | | | | (0.12 | ) | | | — | | | | 1.88 | | | | 1.76 | | | | (0.02 | ) | | | (0.01 | ) | | | — | | | | (0.03 | ) | | | 1.73 | | | | 13.10 | | | | 15.43 | | | | 51,936 | | | | 1.51 | | | | 1.37 | | | | 1.37 | | | | (0.92 | ) | | | — | |
| From (commencement of operations) August 31, 2006, through October 31, 2006 | | | | | | | | | | | | | | | | | | | | | | | | | | | | |
| Class I | | | 12.59 | | | | (0.01 | ) | | | — | | | | 0.64 | | | | 0.63 | | | | — | | | | — | | | | — | | | | — | | | | 0.63 | | | | 13.22 | | | | 5.00 | (f) | | | 11 | | | | 0.71 | (e) | | | 0.48 | (e) | | | 0.48 | (e) | | | (0.45 | )(e) | | | — | |
| For the Year Ended October 31, 2005 | | | | | | | | | | | | | | | | | | | | | | | | | | | | |
| Class A | | | 10.38 | | | | (0.02 | ) | | | — | | | | 1.12 | | | | 1.10 | | | | (0.02 | ) | | | — | | | | — | | | | (0.02 | ) | | | 1.08 | | | | 11.46 | | | | 10.60 | | | | 58,087 | | | | 0.85 | | | | 0.68 | | | | 0.68 | | | | (0.43 | ) | | | 9 | |
| Class B | | | 10.35 | | | | (0.08 | ) | | | — | | | | 1.10 | | | | 1.02 | | | | — | | | | — | | | | — | | | | — | | | | 1.02 | | | | 11.37 | | | | 9.88 | | | | 20,155 | | | | 1.64 | | | | 1.33 | | | | 1.33 | | | | (1.08 | ) | | | — | |
| Class C | | | 10.35 | | | | (0.07 | ) | | | — | | | | 1.09 | | | | 1.02 | | | | — | | | | — | | | | — | | | | — | | | | 1.02 | | | | 11.37 | | | | 9.88 | | | | 32,718 | | | | 1.53 | | | | 1.34 | | | | 1.34 | | | | (1.08 | ) | | | — | |
| From (commencement of operations) May 28, 2004, through October 31, 2004 | | | | | | | | | | | | | | | | | | | | | | | | | | | | |
| Class A | | | 10.00 | | | | (0.01 | ) | | | — | | | | 0.39 | | | | 0.38 | | | | — | | | | — | | | | — | | | | — | | | | 0.38 | | | | 10.38 | | | | 3.80 | (f) | | | 12,415 | | | | 0.86 | (e) | | | 0.67 | (e) | | | 0.67 | (e) | | | (0.58 | )(e) | | | 3 | |
| Class B | | | 10.00 | | | | (0.02 | ) | | | — | | | | 0.37 | | | | 0.35 | | | | — | | | | — | | | | — | | | | — | | | | 0.35 | | | | 10.35 | | | | 3.50 | (f) | | | 4,532 | | | | 1.69 | (e) | | | 1.32 | (e) | | | 1.32 | (e) | | | (1.23 | )(e) | | | — | |
| Class C | | | 10.00 | | | | (0.02 | ) | | | — | | | | 0.37 | | | | 0.35 | | | | — | | | | — | | | | — | | | | — | | | | 0.35 | | | | 10.35 | | | | 3.50 | (f) | | | 5,424 | | | | 1.59 | (e) | | | 1.32 | (e) | | | 1.32 | (e) | | | (1.23 | )(e) | | | — | |
The Hartford Equity Income Fund | | | | | | | | | | | | | | | | | | | | | | | | | | | | |
| For the Six-Month Period Ended April 30, 2008 (Unaudited) | | | | | | | | | | | | | | | | | | | | | | | | | | | | |
| Class A | | | 15.16 | | | | 0.16 | | | | — | | | | (1.23 | ) | | | (1.07 | ) | | | (0.16 | ) | | | (0.40 | ) | | | — | | | | (0.56 | ) | | | (1.63 | ) | | | 13.53 | | | | (7.19 | )(f) | | | 729,103 | | | | 1.18 | (e) | | | 1.13 | (e) | | | 1.13 | (e) | | | 2.37 | (e) | | | 23 | |
| Class B | | | 15.12 | | | | 0.10 | | | | — | | | | (1.23 | ) | | | (1.13 | ) | | | (0.10 | ) | | | (0.40 | ) | | | — | | | | (0.50 | ) | | | (1.63 | ) | | | 13.49 | | | | (7.62 | )(f) | | | 46,110 | | | | 2.04 | (e) | | | 1.99 | (e) | | | 1.99 | (e) | | | 1.52 | (e) | | | — | |
| Class C | | | 15.14 | | | | 0.11 | | | | — | | | | (1.24 | ) | | | (1.13 | ) | | | (0.10 | ) | | | (0.40 | ) | | | — | | | | (0.50 | ) | | | (1.63 | ) | | | 13.51 | | | | (7.56 | )(f) | | | 61,153 | | | | 1.91 | (e) | | | 1.86 | (e) | | | 1.86 | (e) | | | 1.64 | (e) | | | — | |
| Class I | | | 15.12 | | | | 0.18 | | | | — | | | | (1.22 | ) | | | (1.04 | ) | | | (0.18 | ) | | | (0.40 | ) | | | — | | | | (0.58 | ) | | | (1.62 | ) | | | 13.50 | | | | (7.00 | )(f) | | | 931 | | | | 0.88 | (e) | | | 0.83 | (e) | | | 0.83 | (e) | | | 2.68 | (e) | | | — | |
| Class R3 | | | 15.21 | | | | 0.13 | | | | — | | | | (1.23 | ) | | | (1.10 | ) | | | (0.14 | ) | | | (0.40 | ) | | | — | | | | (0.54 | ) | | | (1.64 | ) | | | 13.57 | | | | (7.34 | )(f) | | | 102 | | | | 1.54 | (e) | | | 1.49 | (e) | | | 1.49 | (e) | | | 2.01 | (e) | | | — | |
| Class R4 | | | 15.22 | | | | 0.16 | | | | — | | | | (1.24 | ) | | | (1.08 | ) | | | (0.16 | ) | | | (0.40 | ) | | | — | | | | (0.56 | ) | | | (1.64 | ) | | | 13.58 | | | | (7.23 | )(f) | | | 10 | | | | 1.17 | (e) | | | 1.12 | (e) | | | 1.12 | (e) | | | 2.37 | (e) | | | — | |
| Class R5 | | | 15.22 | | | | 0.18 | | | | — | | | | (1.23 | ) | | | (1.05 | ) | | | (0.18 | ) | | | (0.40 | ) | | | — | | | | (0.58 | ) | | | (1.63 | ) | | | 13.59 | | | | (7.03 | )(f) | | | 10 | | | | 0.89 | (e) | | | 0.84 | (e) | | | 0.84 | (e) | | | 2.66 | (e) | | | — | |
| Class Y | | | 15.23 | | | | 0.18 | | | | — | | | | (1.24 | ) | | | (1.06 | ) | | | (0.18 | ) | | | (0.40 | ) | | | — | | | | (0.58 | ) | | | (1.64 | ) | | | 13.59 | | | | (7.04 | )(f) | | | 126,816 | | | | 0.79 | (e) | | | 0.74 | (e) | | | 0.74 | (e) | | | 2.76 | (e) | | | — | |
| For the Year Ended October 31, 2007 | | | | | | | | | | | | | | | | | | | | | | | | | | | | |
| Class A | | | 14.00 | | | | 0.27 | | | | — | | | | 1.69 | | | | 1.96 | | | | (0.26 | ) | | | (0.54 | ) | | | — | | | | (0.80 | ) | | | 1.16 | | | | 15.16 | | | | 14.68 | | | | 758,905 | | | | 1.22 | | | | 1.12 | | | | 1.12 | | | | 1.93 | | | | 20 | |
| Class B | | | 13.97 | | | | 0.16 | | | | — | | | | 1.67 | | | | 1.83 | | | | (0.14 | ) | | | (0.54 | ) | | | — | | | | (0.68 | ) | | | 1.15 | | | | 15.12 | | | | 13.69 | | | | 52,424 | | | | 2.07 | | | | 1.97 | | | | 1.97 | | | | 1.09 | | | | — | |
| Class C | | | 13.99 | | | | 0.18 | | | | — | | | | 1.67 | | | | 1.85 | | | | (0.16 | ) | | | (0.54 | ) | | | — | | | | (0.70 | ) | | | 1.15 | | | | 15.14 | | | | 13.80 | | | | 72,690 | | | | 1.94 | | | | 1.84 | | | | 1.84 | | | | 1.23 | | | | — | |
| Class I | | | 13.99 | | | | 0.31 | | | | — | | | | 1.69 | | | | 2.00 | | | | (0.33 | ) | | | (0.54 | ) | | | — | | | | (0.87 | ) | | | 1.13 | | | | 15.12 | | | | 14.96 | | | | 907 | | | | 0.92 | | | | 0.82 | | | | 0.82 | | | | 2.18 | | | | — | |
| Class Y | | | 14.07 | | | | 0.31 | | | | — | | | | 1.72 | | | | 2.03 | | | | (0.33 | ) | | | (0.54 | ) | | | — | | | | (0.87 | ) | | | 1.16 | | | | 15.23 | | | | 15.12 | | | | 130,262 | | | | 0.83 | | | | 0.73 | | | | 0.73 | | | | 2.30 | | | | — | |
| From (commencement of operations) December 22, 2006, through October 31, 2007 | | | | | | | | | | | | | | | | | | | | | | | | | | | | |
| Class R3 | | | 13.97 | | | | 0.17 | | | | — | | | | 1.24 | | | | 1.41 | | | | (0.17 | ) | | | — | | | | — | | | | (0.17 | ) | | | 1.24 | | | | 15.21 | | | | 10.11 | (f) | | | 95 | | | | 1.60 | (e) | | | 1.50 | (e) | | | 1.50 | (e) | | | 1.51 | (e) | | | — | |
| Class R4 | | | 13.97 | | | | 0.23 | | | | — | | | | 1.22 | | | | 1.45 | | | | (0.20 | ) | | | — | | | | — | | | | (0.20 | ) | | | 1.25 | | | | 15.22 | | | | 10.44 | (f) | | | 11 | | | | 1.28 | (e) | | | 1.18 | (e) | | | 1.18 | (e) | | | 1.84 | (e) | | | — | |
| Class R5 | | | 13.97 | | | | 0.27 | | | | — | | | | 1.21 | | | | 1.48 | | | | (0.23 | ) | | | — | | | | — | | | | (0.23 | ) | | | 1.25 | | | | 15.22 | | | | 10.67 | (f) | | | 11 | | | | 0.99 | (e) | | | 0.89 | (e) | | | 0.89 | (e) | | | 2.13 | (e) | | | — | |
| For the Year Ended October 31, 2006 | | | | | | | | | | | | | | | | | | | | | | | | | | | | |
| Class A | | | 12.09 | | | | 0.26 | | | | — | | | | 1.96 | | | | 2.22 | | | | (0.28 | ) | | | (0.03 | ) | | | — | | | | (0.31 | ) | | | 1.91 | | | | 14.00 | | | | 18.70 | | | | 529,664 | | | | 1.30 | | | | 1.00 | | | | 1.00 | | | | 2.02 | | | | 24 | |
| Class B | | | 12.07 | | | | 0.16 | | | | — | | | | 1.94 | | | | 2.10 | | | | (0.17 | ) | | | (0.03 | ) | | | — | | | | (0.20 | ) | | | 1.90 | | | | 13.97 | | | | 17.67 | | | | 43,198 | | | | 2.14 | | | | 1.84 | | | | 1.84 | | | | 1.19 | | | | — | |
| Class C | | | 12.08 | | | | 0.17 | | | | — | | | | 1.96 | | | | 2.13 | | | | (0.19 | ) | | | (0.03 | ) | | | — | | | | (0.22 | ) | | | 1.91 | | | | 13.99 | | | | 17.88 | | | | 61,572 | | | | 2.01 | | | | 1.71 | | | | 1.71 | | | | 1.33 | | | | — | |
| Class Y | | | 12.15 | | | | 0.30 | | | | — | | | | 1.98 | | | | 2.28 | | | | (0.33 | ) | | | (0.03 | ) | | | — | | | | (0.36 | ) | | | 1.92 | | | | 14.07 | | | | 19.18 | | | | 7,593 | | | | 0.88 | | | | 0.58 | | | | 0.58 | | | | 2.26 | | | | — | |
| From (commencement of operations) August 31, 2006, through October 31, 2006 | | | | | | | | | | | | | | | | | | | | | | | | | | | | |
| Class I | | | 13.52 | | | | 0.08 | | | | — | | | | 0.46 | | | | 0.54 | | | | (0.07 | ) | | | — | | | | — | | | | (0.07 | ) | | | 0.47 | | | | 13.99 | | | | 4.05 | (f) | | | 106 | | | | 1.37 | (e) | | | 0.80 | (e) | | | 0.80 | (e) | | | 1.32 | (e) | | | — | |
384
| | | | | | | | | | | | | | | | | | | | | | | | | | | | | | | | | | | | | | | | | | | | | | | | | | | | | | | | | | | | | | | | | | | | | | | | | |
| | | — Selected Per-Share Data (a) — | | — Ratios and Supplemental Data — |
| | | | | | | | | | | | | | | | | | | | | | | | | | | | | Ratio of
| | Ratio of
| | Ratio of
| | | | |
| | | | | | | | | | | | | | | | | | | | | | | | | | | | | Expenses
| | Expenses
| | Expenses
| | | | |
| | | | | | | | | | | | | | | | | | | | | | | | | | | | | to Average
| | to Average
| | to Average
| | | | |
| | | | | | | | | Net
| | | | | | | | | | | | | | | | | | | | Net Assets
| | Net Assets
| | Net Assets
| | | | |
| | | | | | | | | Realized
| | | | | | | | | | | | Net
| | | | | | | | Before
| | After
| | After
| | Ratio of
| | |
| | | | | | | | | and
| | | | | | Distributions
| | | | | | Increase
| | | | | | | | Waivers and
| | Waivers and
| | Waivers and
| | Net
| | |
| | | Net Asset
| | Net
| | Payments
| | Unrealized
| | Total
| | Dividends
| | from
| | | | | | (Decrease)
| | Net Asset
| | | | Net Assets
| | Reimbursements
| | Reimbursements
| | Reimbursements
| | Investment
| | |
| | | Value at
| | Investment
| | from
| | Gain
| | from
| | from Net
| | Realized
| | Distributions
| | | | in Net
| | Value at
| | | | at End of
| | and Including
| | and Including
| | and Excluding
| | Income
| | Portfolio
|
| | | Beginning
| | Income
| | (to)
| | (Loss) on
| | Investment
| | Investment
| | Capital
| | from
| | Total
| | Asset
| | End
| | Total
| | Period
| | Interest
| | Interest
| | Interest
| | to Average
| | Turnover
|
| | | of Period | | (Loss) | | Affiliate | | Investments | | Operations | | Income | | Gains | | Capital | | Distributions | | Value | | of Period | | Return (b) | | (000’s) | | Expense (d) | | Expense (d) | | Expense (d) | | Net Assets | | Rate (c) |
The Hartford Equity Income Fund — (continued) | | | | | | | | | | | | | | | | | | | | | | | | | | | | |
| For the Year Ended October 31, 2005 | | | | | | | | | | | | | | | | | | | | | | | | | | | | |
| Class A | | $ | 11.28 | | | $ | 0.27 | | | $ | — | | | $ | 0.82 | | | $ | 1.09 | | | $ | (0.26 | ) | | $ | (0.02 | ) | | $ | — | | | $ | (0.28 | ) | | $ | 0.81 | | | $ | 12.09 | | | | 9.74 | % | | $ | 379,604 | | | | 1.34 | % | | | 0.51 | % | | | 0.51 | % | | | 2.41 | % | | | 23 | % |
| Class B | | | 11.26 | | | | 0.17 | | | | — | | | | 0.82 | | | | 0.99 | | | | (0.16 | ) | | | (0.02 | ) | | | — | | | | (0.18 | ) | | | 0.81 | | | | 12.07 | | | | 8.84 | | | | 33,989 | | | | 2.18 | | | | 1.38 | | | | 1.38 | | | | 1.53 | | | | — | |
| Class C | | | 11.27 | | | | 0.20 | | | | — | | | | 0.81 | | | | 1.01 | | | | (0.18 | ) | | | (0.02 | ) | | | — | | | | (0.20 | ) | | | 0.81 | | | | 12.08 | | | | 9.00 | | | | 53,435 | | | | 2.03 | | | | 1.23 | | | | 1.23 | | | | 1.70 | | | | — | |
| Class Y | | | 11.33 | | | | 0.32 | | | | — | | | | 0.83 | | | | 1.15 | | | | (0.31 | ) | | | (0.02 | ) | | | — | | | | (0.33 | ) | | | 0.82 | | | | 12.15 | | | | 10.22 | | | | 784 | | | | 0.91 | | | | 0.11 | | | | 0.11 | | | | 2.79 | | | | — | |
| For the Year Ended October 31, 2004 | | | | | | | | | | | | | | | | | | | | | | | | | | | | |
| Class A | | | 10.37 | | | | 0.21 | | | | — | | | | 0.90 | | | | 1.11 | | | | (0.20 | ) | | | — | | | | — | | | | (0.20 | ) | | | 0.91 | | | | 11.28 | | | | 10.82 | | | | 211,826 | | | | 1.40 | | | | 0.56 | | | | 0.56 | | | | 2.26 | | | | 22 | |
| Class B | | | 10.36 | | | | 0.13 | | | | — | | | | 0.89 | | | | 1.02 | | | | (0.12 | ) | | | — | | | | — | | | | (0.12 | ) | | | 0.90 | | | | 11.26 | | | | 9.93 | | | | 18,438 | | | | 2.20 | | | | 1.37 | | | | 1.37 | | | | 1.46 | | | | — | |
| Class C | | | 10.36 | | | | 0.15 | | | | — | | | | 0.89 | | | | 1.04 | | | | (0.13 | ) | | | — | | | | — | | | | (0.13 | ) | | | 0.91 | | | | 11.27 | | | | 10.12 | | | | 44,043 | | | | 2.02 | | | | 1.19 | | | | 1.19 | | | | 1.64 | | | | — | |
| Class Y | | | 10.39 | | | | 0.24 | | | | — | | | | 0.95 | | | | 1.19 | | | | (0.25 | ) | | | — | | | | — | | | | (0.25 | ) | | | 0.94 | | | | 11.33 | | | | 11.53 | | | | 375 | | | | 0.91 | | | | 0.11 | | | | 0.11 | | | | 2.73 | | | | — | |
| From inception August 28, 2003, through October 31, 2003 | | | | | | | | | | | | | | | | | | | | | | | | | | | | |
| Class A | | | 10.00 | | | | 0.02 | | | | — | | | | 0.35 | | | | 0.37 | | | | — | | | | — | | | | — | | | | — | | | | 0.37 | | | | 10.37 | | | | 3.70 | (f) | | | 26,649 | | | | 1.53 | (e) | | | 0.73 | (e) | | | 0.73 | (e) | | | 1.81 | (e) | | | 1 | |
| Class B | | | 10.00 | | | | 0.01 | | | | — | | | | 0.35 | | | | 0.36 | | | | — | | | | — | | | | — | | | | — | | | | 0.36 | | | | 10.36 | | | | 3.60 | (f) | | | 2,421 | | | | 2.27 | (e) | | | 1.47 | (e) | | | 1.47 | (e) | | | 1.10 | (e) | | | — | |
| Class C | | | 10.00 | | | | 0.01 | | | | — | | | | 0.35 | | | | 0.36 | | | | — | | | | — | | | | — | | | | — | | | | 0.36 | | | | 10.36 | | | | 3.60 | (f) | | | 7,639 | | | | 2.15 | (e) | | | 1.35 | (e) | | | 1.35 | (e) | | | 1.23 | (e) | | | — | |
| Class Y | | | 10.00 | | | | 0.04 | | | | — | | | | 0.35 | | | | 0.39 | | | | — | | | | — | | | | — | | | | — | | | | 0.39 | | | | 10.39 | | | | 3.90 | (f) | | | 104 | | | | 0.93 | (e) | | | 0.13 | (e) | | | 0.13 | (e) | | | 2.17 | (e) | | | — | |
The Hartford Floating Rate Fund | | | | | | | | | | | | | | | | | | | | | | | | | | | | |
| For the Six-Month Period Ended April 30, 2008 (Unaudited) | | | | | | | | | | | | | | | | | | | | | | | | | | | | |
| Class A | | | 9.79 | | | | 0.30 | | | | — | | | | (0.69 | ) | | | (0.39 | ) | | | (0.29 | ) | | | — | | | | — | | | | (0.29 | ) | | | (0.68 | ) | | | 9.11 | | | | (3.97 | )(f) | | | 1,181,372 | | | | 0.99 | (e) | | | 0.99 | (e) | | | 0.99 | (e) | | | 6.53 | (e) | | | 6 | |
| Class B | | | 9.79 | | | | 0.26 | | | | — | | | | (0.68 | ) | | | (0.42 | ) | | | (0.26 | ) | | | — | | | | — | | | | (0.26 | ) | | | (0.68 | ) | | | 9.11 | | | | (4.32 | )(f) | | | 57,496 | | | | 1.81 | (e) | | | 1.75 | (e) | | | 1.75 | (e) | | | 5.76 | (e) | | | — | |
| Class C | | | 9.78 | | | | 0.27 | | | | — | | | | (0.68 | ) | | | (0.41 | ) | | | (0.26 | ) | | | — | | | | — | | | | (0.26 | ) | | | (0.67 | ) | | | 9.11 | | | | (4.23 | )(f) | | | 1,316,850 | | | | 1.75 | (e) | | | 1.75 | (e) | | | 1.75 | (e) | | | 5.77 | (e) | | | — | |
| Class I | | | 9.79 | | | | 0.31 | | | | — | | | | (0.68 | ) | | | (0.37 | ) | | | (0.30 | ) | | | — | | | | — | | | | (0.30 | ) | | | (0.67 | ) | | | 9.12 | | | | (3.74 | )(f) | | | 242,808 | | | | 0.73 | (e) | | | 0.73 | (e) | | | 0.73 | (e) | | | 6.80 | (e) | | | — | |
| Class R3 | | | 9.79 | | | | 0.29 | | | | — | | | | (0.68 | ) | | | (0.39 | ) | | | (0.28 | ) | | | — | | | | — | | | | (0.28 | ) | | | (0.67 | ) | | | 9.12 | | | | (3.98 | )(f) | | | 518 | | | | 1.43 | (e) | | | 1.25 | (e) | | | 1.25 | (e) | | | 6.21 | (e) | | | — | |
| Class R4 | | | 9.78 | | | | 0.29 | | | | — | | | | (0.67 | ) | | | (0.38 | ) | | | (0.29 | ) | | | — | | | | — | | | | (0.29 | ) | | | (0.67 | ) | | | 9.11 | | | | (3.87 | )(f) | | | 572 | | | | 1.11 | (e) | | | 1.00 | (e) | | | 1.00 | (e) | | | 6.25 | (e) | | | — | |
| Class R5 | | | 9.81 | | | | 0.31 | | | | — | | | | (0.68 | ) | | | (0.37 | ) | | | (0.30 | ) | | | — | | | | — | | | | (0.30 | ) | | | (0.67 | ) | | | 9.14 | | | | (3.78 | )(f) | | | 192 | | | | 0.85 | (e) | | | 0.85 | (e) | | | 0.85 | (e) | | | 6.64 | (e) | | | — | |
| Class Y | | | 9.78 | | | | 0.31 | | | | — | | | | (0.68 | ) | | | (0.37 | ) | | | (0.30 | ) | | | — | | | | — | | | | (0.30 | ) | | | (0.67 | ) | | | 9.11 | | | | (3.72 | )(f) | | | 116,002 | | | | 0.69 | (e) | | | 0.69 | (e) | | | 0.69 | (e) | | | 6.78 | (e) | | | — | |
| For the Year Ended October 31, 2007 | | | | | | | | | | | | | | | | | | | | | | | | | | | | |
| Class A | | | 10.11 | | | | 0.66 | | | | — | | | | (0.31 | ) | | | 0.35 | | | | (0.67 | ) | | | — | | | | — | | | | (0.67 | ) | | | (0.32 | ) | | | 9.79 | | | | 3.54 | | | | 1,996,644 | | | | 0.96 | | | | 0.96 | | | | 0.96 | | | | 6.61 | | | | 62 | |
| Class B | | | 10.11 | | | | 0.58 | | | | — | | | | (0.31 | ) | | | 0.27 | | | | (0.59 | ) | | | — | | | | — | | | | (0.59 | ) | | | (0.32 | ) | | | 9.79 | | | | 2.72 | | | | 71,403 | | | | 1.80 | | | | 1.75 | | | | 1.75 | | | | 5.84 | | | | — | |
| Class C | | | 10.11 | | | | 0.59 | | | | — | | | | (0.32 | ) | | | 0.27 | | | | (0.60 | ) | | | — | | | | — | | | | (0.60 | ) | | | (0.33 | ) | | | 9.78 | | | | 2.67 | | | | 1,870,911 | | | | 1.74 | | | | 1.74 | | | | 1.74 | | | | 5.86 | | | | — | |
| Class I | | | 10.11 | | | | 0.70 | | | | — | | | | (0.32 | ) | | | 0.38 | | | | (0.70 | ) | | | — | | | | — | | | | (0.70 | ) | | | (0.32 | ) | | | 9.79 | | | | 3.84 | | | | 406,906 | | | | 0.71 | | | | 0.71 | | | | 0.71 | | | | 6.88 | | | | — | |
| Class Y | | | 10.11 | | | | 0.69 | | | | — | | | | (0.32 | ) | | | 0.37 | | | | (0.70 | ) | | | — | | | | — | | | | (0.70 | ) | | | (0.33 | ) | | | 9.78 | | | | 3.73 | | | | 104,762 | | | | 0.68 | | | | 0.68 | | | | 0.68 | | | | 6.92 | | | | — | |
| From (commencement of operations) December 22, 2006, through October 31, 2007 | | | | | | | | | | | | | | | | | | | | | | | | | | | | |
| Class R3 | | | 10.09 | | | | 0.54 | | | | — | | | | (0.31 | ) | | | 0.23 | | | | (0.53 | ) | | | — | | | | — | | | | (0.53 | ) | | | (0.30 | ) | | | 9.79 | | | | 2.31 | (f) | | | 285 | | | | 1.75 | (e) | | | 1.24 | (e) | | | 1.24 | (e) | | | 6.59 | (e) | | | — | |
| Class R4 | | | 10.09 | | | | 0.56 | | | | — | | | | (0.32 | ) | | | 0.24 | | | | (0.55 | ) | | | — | | | | — | | | | (0.55 | ) | | | (0.31 | ) | | | 9.78 | | | | 2.42 | (f) | | | 10 | | | | 1.18 | (e) | | | 1.00 | (e) | | | 1.00 | (e) | | | 6.58 | (e) | | | — | |
| Class R5 | | | 10.09 | | | | 0.58 | | | | — | | | | (0.29 | ) | | | 0.29 | | | | (0.57 | ) | | | — | | | | — | | | | (0.57 | ) | | | (0.28 | ) | | | 9.81 | | | | 2.90 | (f) | | | 205 | | | | 0.86 | (e) | | | 0.85 | (e) | | | 0.85 | (e) | | | 6.81 | (e) | | | — | |
| For the Year Ended October 31, 2006 | | | | | | | | | | | | | | | | | | | | | | | | | | | | |
| Class A | | | 10.09 | | | | 0.62 | | | | — | | | | 0.02 | | | | 0.64 | | | | (0.62 | ) | | | — | | | | — | | | | (0.62 | ) | | | 0.02 | | | | 10.11 | | | | 6.56 | | | | 1,500,394 | | | | 0.98 | | | | 0.50 | | | | 0.50 | | | | 6.71 | | | | 33 | |
| Class B | | | 10.08 | | | | 0.54 | | | | — | | | | 0.03 | | | | 0.57 | | | | (0.54 | ) | | | — | | | | — | | | | (0.54 | ) | | | 0.03 | | | | 10.11 | | | | 5.79 | | | | 42,182 | | | | 1.83 | | | | 1.35 | | | | 1.35 | | | | 5.84 | | | | — | |
| Class C | | | 10.08 | | | | 0.55 | | | | — | | | | 0.03 | | | | 0.58 | | | | (0.55 | ) | | | — | | | | — | | | | (0.55 | ) | | | 0.03 | | | | 10.11 | | | | 5.86 | | | | 828,910 | | | | 1.77 | | | | 1.28 | | | | 1.28 | | | | 5.93 | | | | — | |
| Class Y | | | 10.08 | | | | 0.66 | | | | — | | | | 0.02 | | | | 0.68 | | | | (0.65 | ) | | | — | | | | — | | | | (0.65 | ) | | | 0.03 | | | | 10.11 | | | | 7.00 | | | | 50,896 | | | | 0.65 | | | | 0.15 | | | | 0.15 | | | | 6.89 | | | | — | |
| From (commencement of operations) August 31, 2006, through October 31, 2006 | | | | | | | | | | | | | | | | | | | | | | | | | | | | |
| Class I | | | 10.11 | | | | 0.12 | | | | — | | | | — | | | | 0.12 | | | | (0.12 | ) | | | — | | | | — | | | | (0.12 | ) | | | — | | | | 10.11 | | | | 1.21 | (f) | | | 61,805 | | | | 0.74 | (e) | | | 0.43 | (e) | | | 0.43 | (e) | | | 7.99 | (e) | | | — | |
| From (commencement of operations) April 29, 2005, through October 31, 2005 | | | | | | | | | | | | | | | | | | | | | | | | | | | | |
| Class A | | | 10.00 | | | | 0.22 | | | | — | | | | 0.08 | | | | 0.30 | | | | (0.21 | ) | | | — | | | | — | | | | (0.21 | ) | | | 0.09 | | | | 10.09 | | | | 3.06 | (f) | | | 169,485 | | | | 1.03 | (e) | | | 0.29 | (e) | | | 0.29 | (e) | | | 5.68 | (e) | | | 15 | |
| Class B | | | 10.00 | | | | 0.19 | | | | — | | | | 0.08 | | | | 0.27 | | | | (0.19 | ) | | | — | | | | — | | | | (0.19 | ) | | | 0.08 | | | | 10.08 | | | | 2.66 | (f) | | | 5,659 | | | | 1.89 | (e) | | | 1.04 | (e) | | | 1.04 | (e) | | | 4.91 | (e) | | | — | |
| Class C | | | 10.00 | | | | 0.18 | | | | — | | | | 0.09 | | | | 0.27 | | | | (0.19 | ) | | | — | | | | — | | | | (0.19 | ) | | | 0.08 | | | | 10.08 | | | | 2.67 | (f) | | | 92,710 | | | | 1.79 | (e) | | | 1.02 | (e) | | | 1.02 | (e) | | | 5.03 | (e) | | | — | |
| Class Y | | | 10.00 | | | | 0.23 | | | | — | | | | 0.08 | | | | 0.31 | | | | (0.23 | ) | | | — | | | | — | | | | (0.23 | ) | | | 0.08 | | | | 10.08 | | | | 3.10 | (f) | | | 10,062 | | | | 0.73 | (e) | | | 0.01 | (e) | | | 0.01 | (e) | | | 6.06 | (e) | | | — | |
The Hartford Fundamental Growth Fund | | | | | | | | | | | | | | | | | | | | | | | | | | | | |
| For the Six-Month Period Ended April 30, 2008 (Unaudited) | | | | | | | | | | | | | | | | | | | | | | | | | | | | |
| Class A | | | 13.95 | | | | (0.01 | ) | | | — | | | | (0.81 | ) | | | (0.82 | ) | | | — | | | | (1.52 | ) | | | — | | | | (1.52 | ) | | | (2.34 | ) | | | 11.61 | | | | (5.92 | )(f) | | | 36,503 | | | | 1.48 | (e) | | | 1.45 | (e) | | | 1.45 | (e) | | | (0.15 | )(e) | | | 56 | |
| Class B | | | 13.40 | | | | (0.05 | ) | | | — | | | | (0.78 | ) | | | (0.83 | ) | | | — | | | | (1.52 | ) | | | — | | | | (1.52 | ) | | | (2.35 | ) | | | 11.05 | | | | (6.29 | )(f) | | | 10,518 | | | | 2.30 | (e) | | | 2.20 | (e) | | | 2.20 | (e) | | | (0.90 | )(e) | | | — | |
| Class C | | | 13.41 | | | | (0.05 | ) | | | — | | | | (0.78 | ) | | | (0.83 | ) | | | — | | | | (1.52 | ) | | | — | | | | (1.52 | ) | | | (2.35 | ) | | | 11.06 | | | | (6.28 | )(f) | | | 12,877 | | | | 2.21 | (e) | | | 2.20 | (e) | | | 2.20 | (e) | | | (0.90 | )(e) | | | — | |
| Class Y | | | 14.27 | | | | 0.02 | | | | — | | | | (0.83 | ) | | | (0.81 | ) | | | — | | | | (1.52 | ) | | | — | | | | (1.52 | ) | | | (2.33 | ) | | | 11.94 | | | | (5.70 | )(f) | | | 416 | | | | 1.00 | (e) | | | 1.00 | (e) | | | 1.00 | (e) | | | 0.28 | (e) | | | — | |
| For the Year Ended October 31, 2007 | | | | | | | | | | | | | | | | | | | | | | | | | | | | |
| Class A | | | 11.02 | | | | (0.04 | ) | | | 0.04 | | | | 2.93 | | | | 2.93 | | | | — | | | | — | | | | — | | | | — | | | | 2.93 | | | | 13.95 | | | | 26.59 | (i) | | | 39,831 | | | | 1.50 | | | | 1.47 | | | | 1.47 | | | | (0.30 | ) | | | 159 | |
| Class B | | | 10.66 | | | | (0.14 | ) | | | 0.04 | | | | 2.84 | | | | 2.74 | | | | — | | | | — | | | | — | | | | — | | | | 2.74 | | | | 13.40 | | | | 25.70 | (i) | | | 12,307 | | | | 2.58 | | | | 2.22 | | | | 2.22 | | | | (1.04 | ) | | | — | |
| Class C | | | 10.67 | | | | (0.13 | ) | | | 0.04 | | | | 2.83 | | | | 2.74 | | | | — | | | | — | | | | — | | | | — | | | | 2.74 | | | | 13.41 | | | | 25.68 | (i) | | | 13,703 | | | | 2.22 | | | | 2.20 | | | | 2.20 | | | | (1.04 | ) | | | — | |
| Class Y | | | 11.22 | | | | 0.02 | | | | 0.04 | | | | 2.99 | | | | 3.05 | | | | — | | | | — | | | | — | | | | — | | | | 3.05 | | | | 14.27 | | | | 27.18 | (i) | | | 390 | | | | 1.02 | | | | 1.02 | | | | 1.02 | | | | 0.17 | | | | — | |
385
The Hartford Mutual Funds, Inc. and The Hartford Mutual Funds II, Inc.
Financial Highlights — (continued)
| | | | | | | | | | | | | | | | | | | | | | | | | | | | | | | | | | | | | | | | | | | | | | | | | | | | | | | | | | | | | | | | | | | | | | | | | |
| | | — Selected Per-Share Data (a) — | | — Ratios and Supplemental Data — |
| | | | | | | | | | | | | | | | | | | | | | | | | | | | | Ratio of
| | Ratio of
| | Ratio of
| | | | |
| | | | | | | | | | | | | | | | | | | | | | | | | | | | | Expenses
| | Expenses
| | Expenses
| | | | |
| | | | | | | | | | | | | | | | | | | | | | | | | | | | | to Average
| | to Average
| | to Average
| | | | |
| | | | | | | | | Net
| | | | | | | | | | | | | | | | | | | | Net Assets
| | Net Assets
| | Net Assets
| | | | |
| | | | | | | | | Realized
| | | | | | | | | | | | Net
| | | | | | | | Before
| | After
| | After
| | Ratio of
| | |
| | | | | | | | | and
| | | | | | Distributions
| | | | | | Increase
| | | | | | | | Waivers and
| | Waivers and
| | Waivers and
| | Net
| | |
| | | Net Asset
| | Net
| | Payments
| | Unrealized
| | Total
| | Dividends
| | from
| | | | | | (Decrease)
| | Net Asset
| | | | Net Assets
| | Reimbursements
| | Reimbursements
| | Reimbursements
| | Investment
| | |
| | | Value at
| | Investment
| | from
| | Gain
| | from
| | from Net
| | Realized
| | Distributions
| | | | in Net
| | Value at
| | | | at End of
| | and Including
| | and Including
| | and Excluding
| | Income
| | Portfolio
|
| | | Beginning
| | Income
| | (to)
| | (Loss) on
| | Investment
| | Investment
| | Capital
| | from
| | Total
| | Asset
| | End
| | Total
| | Period
| | Interest
| | Interest
| | Interest
| | to Average
| | Turnover
|
| | | of Period | | (Loss) | | Affiliate | | Investments | | Operations | | Income | | Gains | | Capital | | Distributions | | Value | | of Period | | Return (b) | | (000’s) | | Expense (d) | | Expense (d) | | Expense (d) | | Net Assets | | Rate (c) |
The Hartford Fundamental Growth Fund — (continued) | | | | | | | | | | | | | | | | | | | | | | | | | | | | |
| For the Year Ended October 31, 2006 | | | | | | | | | | | | | | | | | | | | | | | | | | | | |
| Class A | | $ | 10.26 | | | $ | 0.02 | | | $ | — | | | $ | 0.81 | | | $ | 0.83 | | | $ | (0.07 | ) | | $ | — | | | $ | — | | | $ | (0.07 | ) | | $ | 0.76 | | | $ | 11.02 | | | | 8.07 | % | | $ | 40,215 | | | | 1.68 | % | | | 1.50 | % | | | 1.50 | % | | | 0.14 | % | | | 123 | % |
| Class B | | | 9.94 | | | | (0.06 | ) | | | — | | | | 0.78 | | | | 0.72 | | | | — | | | | — | | | | — | | | | — | | | | 0.72 | | | | 10.66 | | | | 7.24 | | | | 13,162 | | | | 2.47 | | | | 2.25 | | | | 2.25 | | | | (0.61 | ) | | | — | |
| Class C | | | 9.94 | | | | (0.07 | ) | | | — | | | | 0.80 | | | | 0.73 | | | | — | | | | — | | | | — | | | | — | | | | 0.73 | | | | 10.67 | | | | 7.34 | | | | 13,065 | | | | 2.39 | | | | 2.25 | | | | 2.25 | | | | (0.61 | ) | | | — | |
| Class Y | | | 10.44 | | | | 0.04 | | | | — | | | | 0.85 | | | | 0.89 | | | | (0.11 | ) | | | — | | | | — | | | | (0.11 | ) | | | 0.78 | | | | 11.22 | | | | 8.57 | | | | 487 | | | | 1.18 | | | | 1.07 | | | | 1.07 | | | | 0.56 | | | | — | |
| For the Year Ended October 31, 2005 | | | | | | | | | | | | | | | | | | | | | | | | | | | | |
| Class A | | | 9.14 | | | | 0.08 | | | | — | | | | 1.04 | | | | 1.12 | | | | — | | | | — | | | | — | | | | — | | | | 1.12 | | | | 10.26 | | | | 12.31 | | | | 50,067 | | | | 1.65 | | | | 1.60 | | | | 1.60 | | | | 0.68 | | | | 112 | |
| Class B | | | 8.92 | | | | (0.01 | ) | | | — | | | | 1.03 | | | | 1.02 | | | | — | | | | — | | | | — | | | | — | | | | 1.02 | | | | 9.94 | | | | 11.44 | | | | 15,156 | | | | 2.45 | | | | 2.35 | | | | 2.35 | | | | (0.09 | ) | | | — | |
| Class C | | | 8.92 | | | | (0.01 | ) | | | — | | | | 1.03 | | | | 1.02 | | | | — | | | | — | | | | — | | | | — | | | | 1.02 | | | | 9.94 | | | | 11.44 | | | | 16,737 | | | | 2.36 | | | | 2.35 | | | | 2.35 | | | | (0.05 | ) | | | — | |
| Class Y | | | 9.28 | | | | 0.13 | | | | — | | | | 1.06 | | | | 1.19 | | | | (0.03 | ) | | | — | | | | — | | | | (0.03 | ) | | | 1.16 | | | | 10.44 | | | | 12.86 | | | | 473 | | | | 1.16 | | | | 1.16 | | | | 1.16 | | | | 1.27 | | | | — | |
| For the Year Ended October 31, 2004 | | | | | | | | | | | | | | | | | | | | | | | | | | | | |
| Class A | | | 8.94 | | | | (0.02 | ) | | | — | | | | 0.22 | | | | 0.20 | | | | — | | | | — | | | | — | | | | — | | | | 0.20 | | | | 9.14 | | | | 2.24 | (i) | | | 67,212 | | | | 1.62 | | | | 1.62 | | | | 1.62 | | | | (0.25 | ) | | | 104 | |
| Class B | | | 8.79 | | | | (0.10 | ) | | | — | | | | 0.23 | | | | 0.13 | | | | — | | | | — | | | | — | | | | — | | | | 0.13 | | | | 8.92 | | | | 1.48 | (i) | | | 18,610 | | | | 2.36 | | | | 2.35 | | | | 2.35 | | | | (0.98 | ) | | | — | |
| Class C | | | 8.78 | | | | (0.08 | ) | | | 0.01 | | | | 0.23 | | | | 0.16 | | | | — | | | | — | | | | — | | | | — | | | | 0.16 | | | | 8.94 | | | | 1.59 | (i) | | | 23,901 | | | | 2.28 | | | | 2.28 | | | | 2.28 | | | | (0.91 | ) | | | — | |
| Class Y | | | 9.04 | | | | 0.03 | | | | — | | | | 0.21 | | | | 0.24 | | | | — | | | | — | | | | — | | | | — | | | | 0.24 | | | | 9.28 | | | | 2.65 | | | | 815 | | | | 1.11 | | | | 1.11 | | | | 1.11 | | | | 0.27 | | | | — | |
| For the Year Ended October 31, 2003 | | | | | | | | | | | | | | | | | | | | | | | | | | | | |
| Class A | | | 7.32 | | | | (0.02 | ) | | | — | | | | 1.64 | | | | 1.62 | | | | — | | | | — | | | | — | | | | — | | | | 1.62 | | | | 8.94 | | | | 22.13 | | | | 70,002 | | | | 1.76 | | | | 1.65 | | | | 1.65 | | | | (0.29 | ) | | | 138 | |
| Class B | | | 7.25 | | | | (0.08 | ) | | | — | | | | 1.62 | | | | 1.54 | | | | — | | | | — | | | | — | | | | — | | | | 1.54 | | | | 8.79 | | | | 21.24 | | | | 21,058 | | | | 2.49 | | | | 2.35 | | | | 2.35 | | | | (1.00 | ) | | | — | |
| Class C | | | 7.24 | | | | (0.08 | ) | | | — | | | | 1.62 | | | | 1.54 | | | | — | | | | — | | | | — | | | | — | | | | 1.54 | | | | 8.78 | | | | 21.27 | | | | 27,158 | | | | 2.36 | | | | 2.35 | | | | 2.35 | | | | (0.99 | ) | | | — | |
| Class Y | | | 7.37 | | | | 0.01 | | | | — | | | | 1.66 | | | | 1.67 | | | | — | | | | — | | | | — | | | | — | | | | 1.67 | | | | 9.04 | | | | 22.66 | | | | 719 | | | | 1.17 | | | | 1.17 | | | | 1.17 | | | | 0.17 | | | | — | |
The Hartford Global Communications Fund | | | | | | | | | | | | | | | | | | | | | | | | | | | | |
| For the Six-Month Period Ended April 30, 2008 (Unaudited) | | | | | | | | | | | | | | | | | | | | | | | | | | | | |
| Class A | | | 10.99 | | | | 0.07 | | | | — | | | | (1.05 | ) | | | (0.98 | ) | | | (0.01 | ) | | | (0.48 | ) | | | — | | | | (0.49 | ) | | | (1.47 | ) | | | 9.52 | | | | (9.22 | )(f) | | | 29,377 | | | | 1.56 | (e) | | | 1.56 | (e) | | | 1.56 | (e) | | | 1.42 | (e) | | | 45 | |
| Class B | | | 10.61 | | | | 0.03 | | | | — | | | | (1.01 | ) | | | (0.98 | ) | | | — | | | | (0.48 | ) | | | — | | | | (0.48 | ) | | | (1.46 | ) | | | 9.15 | | | | (9.56 | )(f) | | | 5,731 | | | | 2.45 | (e) | | | 2.27 | (e) | | | 2.27 | (e) | | | 0.71 | (e) | | | — | |
| Class C | | | 10.59 | | | | 0.03 | | | | — | | | | (1.00 | ) | | | (0.97 | ) | | | — | | | | (0.48 | ) | | | — | | | | (0.48 | ) | | | (1.45 | ) | | | 9.14 | | | | (9.49 | )(f) | | | 9,806 | | | | 2.30 | (e) | | | 2.30 | (e) | | | 2.30 | (e) | | | 0.64 | (e) | | | — | |
| Class Y | | | 11.23 | | | | 0.05 | | | | — | | | | (1.02 | ) | | | (0.97 | ) | | | (0.05 | ) | | | (0.48 | ) | | | — | | | | (0.53 | ) | | | (1.50 | ) | | | 9.73 | | | | (8.95 | )(f) | | | 891 | | | | 1.07 | (e) | | | 1.07 | (e) | | | 1.07 | (e) | | | 1.49 | (e) | | | — | |
| For the Year Ended October 31, 2007 | | | | | | | | | | | | | | | | | | | | | | | | | | | | |
| Class A | | | 8.05 | | | | 0.02 | | | | — | | | | 3.07 | | | | 3.09 | | | | (0.13 | ) | | | (0.02 | ) | | | — | | | | (0.15 | ) | | | 2.94 | | | | 10.99 | | | | 39.03 | (i) | | | 29,950 | | | | 1.61 | | | | 1.60 | | | | 1.60 | | | | 0.30 | | | | 102 | |
| Class B | | | 7.81 | | | | (0.04 | ) | | | — | | | | 2.97 | | | | 2.93 | | | | (0.11 | ) | | | (0.02 | ) | | | — | | | | (0.13 | ) | | | 2.80 | | | | 10.61 | | | | 38.02 | (i) | | | 6,161 | | | | 2.49 | | | | 2.30 | | | | 2.30 | | | | (0.40 | ) | | | — | |
| Class C | | | 7.80 | | | | (0.01 | ) | | | — | | | | 2.93 | | | | 2.92 | | | | (0.11 | ) | | | (0.02 | ) | | | — | | | | (0.13 | ) | | | 2.79 | | | | 10.59 | | | | 37.97 | (i) | | | 11,019 | | | | 2.34 | | | | 2.34 | | | | 2.34 | | | | (0.47 | ) | | | — | |
| Class Y | | | 8.23 | | | | 0.10 | | | | — | | | | 3.10 | | | | 3.20 | | | | (0.18 | ) | | | (0.02 | ) | | | — | | | | (0.20 | ) | | | 3.00 | | | | 11.23 | | | | 39.58 | (i) | | | 1,006 | | | | 1.11 | | | | 1.11 | | | | 1.11 | | | | 0.88 | | | | — | |
| For the Year Ended October 31, 2006 | | | | | | | | | | | | | | | | | | | | | | | | | | | | |
| Class A | | | 7.12 | | | | 0.15 | | | | — | | | | 0.88 | | | | 1.03 | | | | (0.10 | ) | | | — | | | | — | | | | (0.10 | ) | | | 0.93 | | | | 8.05 | | | | 14.60 | | | | 17,091 | | | | 1.89 | | | | 1.15 | | | | 1.15 | | | | 1.83 | | | | 104 | |
| Class B | | | 6.92 | | | | 0.09 | | | | — | | | | 0.87 | | | | 0.96 | | | | (0.07 | ) | | | — | | | | — | | | | (0.07 | ) | | | 0.89 | | | | 7.81 | | | | 13.93 | | | | 4,124 | | | | 2.87 | | | | 1.78 | | | | 1.78 | | | | 1.18 | | | | — | |
| Class C | | | 6.91 | | | | 0.06 | | | | — | | | | 0.88 | | | | 0.94 | | | | (0.05 | ) | | | — | | | | — | | | | (0.05 | ) | | | 0.89 | | | | 7.80 | | | | 13.74 | | | | 5,321 | | | | 2.74 | | | | 1.90 | | | | 1.90 | | | | 1.01 | | | | — | |
| Class Y | | | 7.27 | | | | 0.17 | | | | — | | | | 0.92 | | | | 1.09 | | | | (0.13 | ) | | | — | | | | — | | | | (0.13 | ) | | | 0.96 | | | | 8.23 | | | | 15.14 | | | | 992 | | | | 1.41 | | | | 0.75 | | | | 0.75 | | | | 2.09 | | | | — | |
| For the Year Ended October 31, 2005 | | | | | | | | | | | | | | | | | | | | | | | | | | | | |
| Class A | | | 5.48 | | | | 0.09 | | | | — | | | | 1.60 | | | | 1.69 | | | | (0.05 | ) | | | — | | | | — | | | | (0.05 | ) | | | 1.64 | | | | 7.12 | | | | 31.01 | | | | 15,986 | | | | 2.01 | | | | 1.51 | | | | 1.51 | | | | 1.75 | | | | 45 | |
| Class B | | | 5.34 | | | | 0.05 | | | | — | | | | 1.55 | | | | 1.60 | | | | (0.02 | ) | | | — | | | | — | | | | (0.02 | ) | | | 1.58 | | | | 6.92 | | | | 29.92 | | | | 2,815 | | | | 3.22 | | | | 2.26 | | | | 2.26 | | | | 1.02 | | | | — | |
| Class C | | | 5.33 | | | | 0.05 | | | | — | | | | 1.55 | | | | 1.60 | | | | (0.02 | ) | | | — | | | | — | | | | (0.02 | ) | | | 1.58 | | | | 6.91 | | | | 29.97 | | | | 2,765 | | | | 2.94 | | | | 2.25 | | | | 2.25 | | | | 1.08 | | | | — | |
| Class Y | | | 5.60 | | | | 0.02 | | | | — | | | | 1.73 | | | | 1.75 | | | | (0.08 | ) | | | — | | | | — | | | | (0.08 | ) | | | 1.67 | | | | 7.27 | | | | 31.36 | | | | 638 | | | | 1.36 | | | | 1.06 | | | | 1.06 | | | | 2.10 | | | | — | |
| For the Year Ended October 31, 2004 (h) | | | | | | | | | | | | | | | | | | | | | | | | | | | | |
| Class A | | | 4.67 | | | | 0.06 | | | | — | | | | 0.75 | | | | 0.81 | | | | — | | | | — | | | | — | | | | — | | | | 0.81 | | | | 5.48 | | | | 17.34 | | | | 8,929 | | | | 1.93 | | | | 1.65 | | | | 1.65 | | | | 1.08 | | | | 85 | |
| Class B | | | 4.58 | | | | 0.02 | | | | — | | | | 0.74 | | | | 0.76 | | | | — | | | | — | | | | — | | | | — | | | | 0.76 | | | | 5.34 | | | | 16.59 | | | | 1,482 | | | | 3.32 | | | | 2.35 | | | | 2.35 | | | | 0.37 | | | | — | |
| Class C | | | 4.57 | | | | 0.02 | | | | — | | | | 0.74 | | | | 0.76 | | | | — | | | | — | | | | — | | | | — | | | | 0.76 | | | | 5.33 | | | | 16.63 | | | | 1,306 | | | | 2.97 | | | | 2.35 | | | | 2.35 | | | | 0.43 | | | | — | |
| Class Y | | | 4.74 | | | | 0.09 | | | | — | | | | 0.77 | | | | 0.86 | | | | — | | | | — | | | | — | | | | — | | | | 0.86 | | | | 5.60 | | | | 18.14 | | | | 170 | | | | 1.30 | | | | 1.20 | | | | 1.20 | | | | 1.69 | | | | — | |
| For the Year Ended October 31, 2003 | | | | | | | | | | | | | | | | | | | | | | | | | | | | |
| Class A | | | 3.24 | | | | (0.01 | ) | | | — | | | | 1.44 | | | | 1.43 | | | | — | | | | — | | | | — | | | | — | | | | 1.43 | | | | 4.67 | | | | 44.14 | | | | 6,419 | | | | 1.95 | | | | 1.65 | | | | 1.65 | | | | (0.08 | ) | | | 100 | |
| Class B | | | 3.19 | | | | (0.03 | ) | | | — | | | | 1.42 | | | | 1.39 | | | | — | | | | — | | | | — | | | | — | | | | 1.39 | | | | 4.58 | | | | 43.57 | | | | 1,555 | | | | 2.68 | | | | 2.35 | | | | 2.35 | | | | (0.79 | ) | | | — | |
| Class C | | | 3.19 | | | | (0.03 | ) | | | — | | | | 1.41 | | | | 1.38 | | | | — | | | | — | | | | — | | | | — | | | | 1.38 | | | | 4.57 | | | | 43.26 | | | | 1,305 | | | | 2.55 | | | | 2.35 | | | | 2.35 | | | | (0.77 | ) | | | — | |
| Class Y | | | 3.26 | | | | 0.01 | | | | — | | | | 1.47 | | | | 1.48 | | | | — | | | | — | | | | — | | | | — | | | | 1.48 | | | | 4.74 | | | | 45.40 | | | | 724 | | | | 1.35 | | | | 1.20 | | | | 1.20 | | | | 0.38 | | | | — | |
| | | | | | | | | | | | | | | | | | | | | | | | | | | | | | | | | | | | | | | | | | | | | | | | | | | | | | | | | | | | | | | | | | | | | | | | | |
386
| | | | | | | | | | | | | | | | | | | | | | | | | | | | | | | | | | | | | | | | | | | | | | | | | | | | | | | | | | | | | | | | | | | | | | | | | |
| | | — Selected Per-Share Data (a) — | | — Ratios and Supplemental Data — |
| | | | | | | | | | | | | | | | | | | | | | | | | | | | | Ratio of
| | Ratio of
| | Ratio of
| | | | |
| | | | | | | | | | | | | | | | | | | | | | | | | | | | | Expenses
| | Expenses
| | Expenses
| | | | |
| | | | | | | | | | | | | | | | | | | | | | | | | | | | | to Average
| | to Average
| | to Average
| | | | |
| | | | | | | | | Net
| | | | | | | | | | | | | | | | | | | | Net Assets
| | Net Assets
| | Net Assets
| | | | |
| | | | | | | | | Realized
| | | | | | | | | | | | Net
| | | | | | | | Before
| | After
| | After
| | Ratio of
| | |
| | | | | | | | | and
| | | | | | Distributions
| | | | | | Increase
| | | | | | | | Waivers and
| | Waivers and
| | Waivers and
| | Net
| | |
| | | Net Asset
| | Net
| | Payments
| | Unrealized
| | Total
| | Dividends
| | from
| | | | | | (Decrease)
| | Net Asset
| | | | Net Assets
| | Reimbursements
| | Reimbursements
| | Reimbursements
| | Investment
| | |
| | | Value at
| | Investment
| | from
| | Gain
| | from
| | from Net
| | Realized
| | Distributions
| | | | in Net
| | Value at
| | | | at End of
| | and Including
| | and Including
| | and Excluding
| | Income
| | Portfolio
|
| | | Beginning
| | Income
| | (to)
| | (Loss) on
| | Investment
| | Investment
| | Capital
| | from
| | Total
| | Asset
| | End
| | Total
| | Period
| | Interest
| | Interest
| | Interest
| | to Average
| | Turnover
|
| | | of Period | | (Loss) | | Affiliate | | Investments | | Operations | | Income | | Gains | | Capital | | Distributions | | Value | | of Period | | Return (b) | | (000’s) | | Expense (d) | | Expense (d) | | Expense (d) | | Net Assets | | Rate (c) |
The Hartford Global Equity Fund | | | | | | | | | | | | | | | | | | | | | | | | | | | | |
| From (commencement of operations) February 29, 2008, through April 30, 2008 (Unaudited) (h) | | | | | | | | | | | | | | | | | | | | | | | | | | | | |
| Class A | | $ | 10.00 | | | $ | 0.02 | | | $ | — | | | $ | 0.30 | | | $ | 0.32 | | | $ | — | | | $ | — | | | $ | — | | | $ | — | | | $ | 0.32 | | | $ | 10.32 | | | | 3.20 | %(f) | | $ | 18,504 | | | | 1.64 | %(e) | | | 1.64 | %(e) | | | 1.64 | %(e) | | | 1.19 | %(e) | | | 13 | % |
| Class B | | | 10.00 | | | | 0.01 | | | | — | | | | 0.30 | | | | 0.31 | | | | — | | | | — | | | | — | | | | — | | | | 0.31 | | | | 10.31 | | | | 3.20 | (f) | | | 311 | | | | 2.39 | (e) | | | 2.39 | (e) | | | 2.39 | (e) | | | 0.44 | (e) | | | — | |
| Class C | | | 10.00 | | | | 0.01 | | | | — | | | | 0.30 | | | | 0.31 | | | | — | | | | — | | | | — | | | | — | | | | 0.31 | | | | 10.31 | | | | 3.10 | (f) | | | 329 | | | | 2.39 | (e) | | | 2.39 | (e) | | | 2.39 | (e) | | | 0.44 | (e) | | | — | |
| Class I | | | 10.00 | | | | 0.02 | | | | — | | | | 0.31 | | | | 0.33 | | | | — | | | | — | | | | — | | | | — | | | | 0.33 | | | | 10.33 | | | | 3.10 | (f) | | | 322 | | | | 1.39 | (e) | | | 1.39 | (e) | | | 1.39 | (e) | | | 1.45 | (e) | | | — | |
| Class R3 | | | 10.00 | | | | 0.01 | | | | — | | | | 0.31 | | | | 0.32 | | | | — | | | | — | | | | — | | | | — | | | | 0.32 | | | | 10.32 | | | | 3.30 | (f) | | | 309 | | | | 2.08 | (e) | | | 1.90 | (e) | | | 1.90 | (e) | | | 0.92 | (e) | | | — | |
| Class R4 | | | 10.00 | | | | 0.02 | | | | — | | | | 0.30 | | | | 0.32 | | | | — | | | | — | | | | — | | | | — | | | | 0.32 | | | | 10.32 | | | | 3.30 | (f) | | | 309 | | | | 1.78 | (e) | | | 1.67 | (e) | | | 1.67 | (e) | | | 1.16 | (e) | | | — | |
| Class R5 | | | 10.00 | | | | 0.02 | | | | — | | | | 0.30 | | | | 0.32 | | | | — | | | | — | | | | — | | | | — | | | | 0.32 | | | | 10.32 | | | | 3.20 | (f) | | | 310 | | | | 1.48 | (e) | | | 1.43 | (e) | | | 1.43 | (e) | | | 1.40 | (e) | | | — | |
| Class Y | | | 10.00 | | | | 0.02 | | | | — | | | | 0.31 | | | | 0.33 | | | | — | | | | — | | | | — | | | | — | | | | 0.33 | | | | 10.33 | | | | 3.20 | (f) | | | 310 | | | | 1.38 | (e) | | | 1.32 | (e) | | | 1.32 | (e) | | | 1.50 | (e) | | | — | |
The Hartford Global Financial Services Fund | | | | | | | | | | | | | | | | | | | | | | | | | | | | |
| For the Six-Month Period Ended April 30, 2008 (Unaudited) (h) | | | | | | | | | | | | | | | | | | | | | | | | | | | | |
| Class A | | | 14.16 | | | | 0.10 | | | | — | | | | (2.22 | ) | | | (2.12 | ) | | | (0.14 | ) | | | (1.59 | ) | | | — | | | | (1.73 | ) | | | (3.85 | ) | | | 10.31 | | | | (16.01 | )(f) | | | 26,040 | | | | 1.60 | (e) | | | 1.60 | (e) | | | 1.60 | (e) | | | 1.94 | (e) | | | 56 | |
| Class B | | | 13.87 | | | | 0.08 | | | | — | | | | (2.17 | ) | | | (2.09 | ) | | | (0.05 | ) | | | (1.59 | ) | | | — | | | | (1.64 | ) | | | (3.73 | ) | | | 10.14 | | | | (16.13 | )(f) | | | 3,437 | | | | 2.73 | (e) | | | 2.07 | (e) | | | 2.07 | (e) | | | 1.52 | (e) | | | — | |
| Class C | | | 13.82 | | | | 0.07 | | | | — | | | | (2.16 | ) | | | (2.09 | ) | | | (0.06 | ) | | | (1.59 | ) | | | — | | | | (1.65 | ) | | | (3.74 | ) | | | 10.08 | | | | (16.21 | )(f) | | | 6,115 | | | | 2.45 | (e) | | | 2.35 | (e) | | | 2.35 | (e) | | | 1.30 | (e) | | | — | |
| Class Y | | | 14.35 | | | | 0.13 | | | | — | | | | (2.24 | ) | | | (2.11 | ) | | | (0.19 | ) | | | (1.59 | ) | | | — | | | | (1.78 | ) | | | (3.89 | ) | | | 10.46 | | | | (15.76 | )(f) | | | 1,644 | | | | 1.17 | (e) | | | 1.17 | (e) | | | 1.17 | (e) | | | 2.49 | (e) | | | — | |
| For the Year Ended October 31, 2007 | | | | | | | | | | | | | | | | | | | | | | | | | | | | |
| Class A | | | 14.01 | | | | 0.17 | | | | — | | | | 0.94 | | | | 1.11 | | | | (0.11 | ) | | | (0.85 | ) | | | — | | | | (0.96 | ) | | | 0.15 | | | | 14.16 | | | | 8.42 | (i) | | | 24,420 | | | | 1.61 | | | | 1.60 | | | | 1.60 | | | | 1.31 | | | | 104 | |
| Class B | | | 13.74 | | | | 0.10 | | | | — | | | | 0.90 | | | | 1.00 | | | | (0.02 | ) | | | (0.85 | ) | | | — | | | | (0.87 | ) | | | 0.13 | | | | 13.87 | | | | 7.75 | (i) | | | 3,803 | | | | 2.62 | | | | 2.22 | | | | 2.22 | | | | 0.70 | | | | — | |
| Class C | | | 13.73 | | | | 0.07 | | | | — | | | | 0.91 | | | | 0.98 | | | | (0.04 | ) | | | (0.85 | ) | | | — | | | | (0.89 | ) | | | 0.09 | | | | 13.82 | | | | 7.57 | (i) | | | 5,164 | | | | 2.43 | | | | 2.35 | | | | 2.35 | | | | 0.58 | | | | — | |
| Class Y | | | 14.16 | | | | 0.24 | | | | — | | | | 0.95 | | | | 1.19 | | | | (0.15 | ) | | | (0.85 | ) | | | — | | | | (1.00 | ) | | | 0.19 | | | | 14.35 | | | | 8.91 | (i) | | | 1,506 | | | | 1.14 | | | | 1.14 | | | | 1.14 | | | | 1.85 | | | | — | |
| For the Year Ended October 31, 2006 | | | | | | | | | | | | | | | | | | | | | | | | | | | | |
| Class A | | | 11.60 | | | | 0.12 | | | | — | | | | 2.40 | | | | 2.52 | | | | (0.11 | ) | | | — | | | | — | | | | (0.11 | ) | | | 2.41 | | | | 14.01 | | | | 21.87 | | | | 21,369 | | | | 1.80 | | | | 1.15 | | | | 1.15 | | | | 1.11 | | | | 52 | |
| Class B | | | 11.39 | | | | 0.08 | | | | — | | | | 2.31 | | | | 2.39 | | | | (0.04 | ) | | | — | | | | — | | | | (0.04 | ) | | | 2.35 | | | | 13.74 | | | | 21.06 | | | | 3,828 | | | | 2.81 | | | | 1.78 | | | | 1.78 | | | | 0.49 | | | | — | |
| Class C | | | 11.39 | | | | 0.05 | | | | — | | | | 2.32 | | | | 2.37 | | | | (0.03 | ) | | | — | | | | — | | | | (0.03 | ) | | | 2.34 | | | | 13.73 | | | | 20.88 | | | | 4,082 | | | | 2.65 | | | | 1.90 | | | | 1.90 | | | | 0.35 | | | | — | |
| Class Y | | | 11.73 | | | | 0.19 | | | | — | | | | 2.40 | | | | 2.59 | | | | (0.16 | ) | | | — | | | | — | | | | (0.16 | ) | | | 2.43 | | | | 14.16 | | | | 22.24 | | | | 942 | | | | 1.34 | | | | 0.75 | | | | 0.75 | | | | 1.52 | | | | — | |
| For the Year Ended October 31, 2005 | | | | | | | | | | | | | | | | | | | | | | | | | | | | |
| Class A | | | 10.44 | | | | 0.11 | | | | — | | | | 1.18 | | | | 1.29 | | | | (0.13 | ) | | | — | | | | — | | | | (0.13 | ) | | | 1.16 | | | | 11.60 | | | | 12.39 | | | | 13,958 | | | | 1.88 | | | | 1.51 | | | | 1.51 | | | | 0.91 | | | | 33 | |
| Class B | | | 10.26 | | | | 0.01 | | | | — | | | | 1.18 | | | | 1.19 | | | | (0.06 | ) | | | — | | | | — | | | | (0.06 | ) | | | 1.13 | | | | 11.39 | | | | 11.58 | | | | 3,147 | | | | 2.91 | | | | 2.28 | | | | 2.28 | | | | 0.15 | | | | — | |
| Class C | | | 10.26 | | | | 0.02 | | | | — | | | | 1.17 | | | | 1.19 | | | | (0.06 | ) | | | — | | | | — | | | | (0.06 | ) | | | 1.13 | | | | 11.39 | | | | 11.58 | | | | 2,769 | | | | 2.77 | | | | 2.27 | | | | 2.27 | | | | 0.16 | | | | — | |
| Class Y | | | 10.55 | | | | 0.12 | | | | — | | | | 1.24 | | | | 1.36 | | | | (0.18 | ) | | | — | | | | — | | | | (0.18 | ) | | | 1.18 | | | | 11.73 | | | | 12.91 | | | | 773 | | | | 1.36 | | | | 1.09 | | | | 1.09 | | | | 1.30 | | | | — | |
| For the Year Ended October 31, 2004 (h) | | | | | | | | | | | | | | | | | | | | | | | | | | | | |
| Class A | | | 9.71 | | | | 0.12 | | | | — | | | | 0.69 | | | | 0.81 | | | | (0.08 | ) | | | — | | | | — | | | | (0.08 | ) | | | 0.73 | | | | 10.44 | | | | 8.42 | | | | 12,910 | | | | 1.78 | | | | 1.65 | | | | 1.65 | | | | 1.17 | | | | 85 | |
| Class B | | | 9.55 | | | | 0.05 | | | | — | | | | 0.69 | | | | 0.74 | | | | (0.03 | ) | | | — | | | | — | | | | (0.03 | ) | | | 0.71 | | | | 10.26 | | | | 7.71 | | | | 3,043 | | | | 2.80 | | | | 2.35 | | | | 2.35 | | | | 0.44 | | | | — | |
| Class C | | | 9.55 | | | | 0.05 | | | | — | | | | 0.69 | | | | 0.74 | | | | (0.03 | ) | | | — | | | | — | | | | (0.03 | ) | | | 0.71 | | | | 10.26 | | | | 7.71 | | | | 2,459 | | | | 2.68 | | | | 2.35 | | | | 2.35 | | | | 0.44 | | | | — | |
| Class Y | | | 9.79 | | | | 0.17 | | | | — | | | | 0.71 | | | | 0.88 | | | | (0.12 | ) | | | — | | | | — | | | | (0.12 | ) | | | 0.76 | | | | 10.55 | | | | 9.06 | | | | 642 | | | | 1.27 | | | | 1.20 | | | | 1.20 | | | | 1.54 | | | | — | |
| For the Year Ended October 31, 2003 | | | | | | | | | | | | | | | | | | | | | | | | | | | | |
| Class A | | | 8.03 | | | | 0.07 | | | | — | | | | 1.65 | | | | 1.72 | | | | (0.04 | ) | | | — | | | | — | | | | (0.04 | ) | | | 1.68 | | | | 9.71 | | | | 21.48 | | | | 12,652 | | | | 1.90 | | | | 1.65 | | | | 1.65 | | | | 0.93 | | | | 93 | |
| Class B | | | 7.92 | | | | 0.02 | | | | — | | | | 1.61 | | | | 1.63 | | | | — | | | | — | | | | — | | | | — | | | | 1.63 | | | | 9.55 | | | | 20.58 | | | | 3,681 | | | | 2.62 | | | | 2.35 | | | | 2.35 | | | | 0.22 | | | | — | |
| Class C | | | 7.92 | | | | 0.02 | | | | — | | | | 1.61 | | | | 1.63 | | | | — | | | | — | | | | — | | | | — | | | | 1.63 | | | | 9.55 | | | | 20.58 | | | | 3,197 | | | | 2.50 | | | | 2.35 | | | | 2.35 | | | | 0.23 | | | | — | |
| Class Y | | | 8.10 | | | | 0.13 | | | | — | | | | 1.64 | | | | 1.77 | | | | (0.08 | ) | | | — | | | | — | | | | (0.08 | ) | | | 1.69 | | | | 9.79 | | | | 22.01 | | | | 1,580 | | | | 1.31 | | | | 1.20 | | | | 1.20 | | | | 1.38 | | | | — | |
The Hartford Global Growth Fund | | | | | | | | | | | | | | | | | | | | | | | | | | | | |
| For the Six-Month Period Ended April 30, 2008 (Unaudited) | | | | | | | | | | | | | | | | | | | | | | | | | | | | |
| Class A | | | 24.97 | | | | (0.04 | ) | | | — | | | | (3.00 | ) | | | (3.04 | ) | | | — | | | | (2.66 | ) | | | — | | | | (2.66 | ) | | | (5.70 | ) | | | 19.27 | | | | (12.96 | )(f) | | | 420,545 | | | | 1.46 | (e) | | | 1.46 | (e) | | | 1.46 | (e) | | | (0.39 | )(e) | | | 35 | |
| Class B | | | 23.27 | | | | (0.10 | ) | | | — | | | | (2.77 | ) | | | (2.87 | ) | | | — | | | | (2.66 | ) | | | — | | | | (2.66 | ) | | | (5.53 | ) | | | 17.74 | | | | (13.20 | )(f) | | | 55,508 | | | | 2.38 | (e) | | | 2.04 | (e) | | | 2.04 | (e) | | | (1.00 | )(e) | | | — | |
| Class C | | | 23.40 | | | | (0.10 | ) | | | — | | | | (2.80 | ) | | | (2.90 | ) | | | — | | | | (2.66 | ) | | | — | | | | (2.66 | ) | | | (5.56 | ) | | | 17.84 | | | | (13.26 | )(f) | | | 62,164 | | | | 2.14 | (e) | | | 2.14 | (e) | | | 2.14 | (e) | | | (1.08 | )(e) | | | — | |
| Class R3 | | | 26.02 | | | | (0.05 | ) | | | — | | | | (3.15 | ) | | | (3.20 | ) | | | — | | | | (2.66 | ) | | | — | | | | (2.66 | ) | | | (5.86 | ) | | | 20.16 | | | | (13.06 | )(f) | | | 18 | | | | 1.83 | (e) | | | 1.74 | (e) | | | 1.74 | (e) | | | (0.61 | )(e) | | | — | |
| Class R4 | | | 26.09 | | | | (0.27 | ) | | | — | | | | (2.94 | ) | | | (3.21 | ) | | | — | | | | (2.66 | ) | | | — | | | | (2.66 | ) | | | (5.87 | ) | | | 20.22 | | | | (13.07 | )(f) | | | 11 | | | | 1.49 | (e) | | | 1.43 | (e) | | | 1.43 | (e) | | | (0.70 | )(e) | | | — | |
| Class R5 | | | 26.15 | | | | 0.01 | | | | — | | | | (3.15 | ) | | | (3.14 | ) | | | — | | | | (2.66 | ) | | | — | | | | (2.66 | ) | | | (5.80 | ) | | | 20.35 | | | | (12.73 | )(f) | | | 21 | | | | 1.00 | (e) | | | 1.00 | (e) | | | 1.00 | (e) | | | 0.10 | (e) | | | — | |
| Class Y | | | 26.19 | | | | 0.02 | | | | — | | | | (3.16 | ) | | | (3.14 | ) | | | — | | | | (2.66 | ) | | | — | | | | (2.66 | ) | | | (5.80 | ) | | | 20.39 | | | | (12.71 | )(f) | | | 180,518 | | | | 0.90 | (e) | | | 0.90 | (e) | | | 0.90 | (e) | | | 0.18 | (e) | | | — | |
| For the Year Ended October 31, 2007 | | | | | | | | | | | | | | | | | | | | | | | | | | | | |
| Class A | | | 19.35 | | | | (0.14 | ) | | | 0.05 | | | | 6.69 | | | | 6.60 | | | | — | | | | (0.98 | ) | | | — | | | | (0.98 | ) | | | 5.62 | | | | 24.97 | | | | 35.85 | (i) | | | 492,466 | | | | 1.48 | | | | 1.48 | | | | 1.48 | | | | (0.62 | ) | | | 85 | |
| Class B | | | 18.23 | | | | (0.32 | ) | | | 0.06 | | | | 6.28 | | | | 6.02 | | | | — | | | | (0.98 | ) | | | — | | | | (0.98 | ) | | | 5.04 | | | | 23.27 | | | | 34.81 | (i) | | | 78,931 | | | | 2.40 | | | | 2.19 | | | | 2.19 | | | | (1.33 | ) | | | — | |
| Class C | | | 18.31 | | | | (0.28 | ) | | | 0.05 | | | | 6.30 | | | | 6.07 | | | | — | | | | (0.98 | ) | | | — | | | | (0.98 | ) | | | 5.09 | | | | 23.40 | | | | 34.94 | (i) | | | 75,742 | | | | 2.15 | | | | 2.15 | | | | 2.15 | | | | (1.29 | ) | | | — | |
| Class Y | | | 20.14 | | | | — | | | | 0.06 | | | | 6.97 | | | | 7.03 | | | | — | | | | (0.98 | ) | | | — | | | | (0.98 | ) | | | 6.05 | | | | 26.19 | | | | 36.61 | (i) | | | 195,998 | | | | 0.89 | | | | 0.89 | | | | 0.89 | | | | (0.01 | ) | | | — | |
| From (commencement of operations) December 22, 2006, through October 31, 2007 | | | | | | | | | | | | | | | | | | | | | | | | | | | | |
| Class R3 | | | 20.00 | | | | (0.14 | ) | | | — | | | | 6.16 | | | | 6.02 | | | | — | | | | — | | | | — | | | | — | | | | 6.02 | | | | 26.02 | | | | 30.10 | (f) | | | 13 | | | | 1.65 | (e) | | | 1.65 | (e) | | | 1.65 | (e) | | | (0.78 | )(e) | | | — | |
| Class R4 | | | 20.00 | | | | (0.09 | ) | | | — | | | | 6.18 | | | | 6.09 | | | | — | | | | — | | | | — | | | | — | | | | 6.09 | | | | 26.09 | | | | 30.45 | (f) | | | 13 | | | | 1.34 | (e) | | | 1.34 | (e) | | | 1.34 | (e) | | | (0.47 | )(e) | | | — | |
| Class R5 | | | 20.00 | | | | (0.03 | ) | | | — | | | | 6.18 | | | | 6.15 | | | | — | | | | — | | | | — | | | | — | | | | 6.15 | | | | 26.15 | | | | 30.75 | (f) | | | 13 | | | | 1.05 | (e) | | | 1.05 | (e) | | | 1.05 | (e) | | | (0.17 | )(e) | | | — | |
387
The Hartford Mutual Funds, Inc. and The Hartford Mutual Funds II, Inc.
Financial Highlights — (continued)
| | | | | | | | | | | | | | | | | | | | | | | | | | | | | | | | | | | | | | | | | | | | | | | | | | | | | | | | | | | | | | | | | | | | | | | | | |
| | | — Selected Per-Share Data (a) — | | — Ratios and Supplemental Data — |
| | | | | | | | | | | | | | | | | | | | | | | | | | | | | Ratio of
| | Ratio of
| | Ratio of
| | | | |
| | | | | | | | | | | | | | | | | | | | | | | | | | | | | Expenses
| | Expenses
| | Expenses
| | | | |
| | | | | | | | | | | | | | | | | | | | | | | | | | | | | to Average
| | to Average
| | to Average
| | | | |
| | | | | | | | | Net
| | | | | | | | | | | | | | | | | | | | Net Assets
| | Net Assets
| | Net Assets
| | | | |
| | | | | | | | | Realized
| | | | | | | | | | | | Net
| | | | | | | | Before
| | After
| | After
| | Ratio of
| | |
| | | | | | | | | and
| | | | | | Distributions
| | | | | | Increase
| | | | | | | | Waivers and
| | Waivers and
| | Waivers and
| | Net
| | |
| | | Net Asset
| | Net
| | Payments
| | Unrealized
| | Total
| | Dividends
| | from
| | | | | | (Decrease)
| | Net Asset
| | | | Net Assets
| | Reimbursements
| | Reimbursements
| | Reimbursements
| | Investment
| | |
| | | Value at
| | Investment
| | from
| | Gain
| | from
| | from Net
| | Realized
| | Distributions
| | | | in Net
| | Value at
| | | | at End of
| | and Including
| | and Including
| | and Excluding
| | Income
| | Portfolio
|
| | | Beginning
| | Income
| | (to)
| | (Loss) on
| | Investment
| | Investment
| | Capital
| | from
| | Total
| | Asset
| | End
| | Total
| | Period
| | Interest
| | Interest
| | Interest
| | to Average
| | Turnover
|
| | | of Period | | (Loss) | | Affiliate | | Investments | | Operations | | Income | | Gains | | Capital | | Distributions | | Value | | of Period | | Return (b) | | (000’s) | | Expense (d) | | Expense (d) | | Expense (d) | | Net Assets | | Rate (c) |
The Hartford Global Growth Fund — (continued) | | | | | | | | | | | | | | | | | | | | | | | | | | | | |
| For the Year Ended October 31, 2006 (h) | | | | | | | | | | | | | | | | | | | | | | | | | | | | |
| Class A | | $ | 16.80 | | | $ | (0.05 | ) | | $ | — | | | $ | 2.81 | | | $ | 2.76 | | | $ | (0.02 | ) | | $ | (0.19 | ) | | $ | — | | | $ | (0.21 | ) | | $ | 2.55 | | | $ | 19.35 | | | | 16.58 | % | | $ | 417,840 | | | | 1.53 | % | | | 1.48 | % | | | 1.48 | % | | | (0.25 | )% | | | 125 | % |
| Class B | | | 15.93 | | | | (0.17 | ) | | | — | | | | 2.66 | | | | 2.49 | | | | — | | | | (0.19 | ) | | | — | | | | (0.19 | ) | | | 2.30 | | | | 18.23 | | | | 15.80 | | | | 74,805 | | | | 2.44 | | | | 2.18 | | | | 2.18 | | | | (0.95 | ) | | | — | |
| Class C | | | 16.01 | | | | (0.17 | ) | | | — | | | | 2.66 | | | | 2.49 | | | | — | | | | (0.19 | ) | | | — | | | | (0.19 | ) | | | 2.30 | | | | 18.31 | | | | 15.72 | | | | 66,121 | | | | 2.20 | | | | 2.20 | | | | 2.20 | | | | (0.98 | ) | | | — | |
| Class Y | | | 17.46 | | | | 0.06 | | | | — | | | | 2.91 | | | | 2.97 | | | | (0.10 | ) | | | (0.19 | ) | | | — | | | | (0.29 | ) | | | 2.68 | | | | 20.14 | | | | 17.25 | | | | 169,270 | | | | 0.93 | | | | 0.93 | | | | 0.93 | | | | 0.31 | | | | — | |
| For the Year Ended October 31, 2005 | | | | | | | | | | | | | | | | | | | | | | | | | | | | |
| Class A | | | 16.49 | | | | 0.08 | | | | — | | | | 0.23 | | | | 0.31 | | | | — | | | | — | | | | — | | | | — | | | | 0.31 | | | | 16.80 | | | | 1.88 | | | | 419,648 | | | | 1.58 | | | | 1.48 | | | | 1.48 | | | | 0.41 | | | | 270 | |
| Class B | | | 15.77 | | | | (0.08 | ) | | | — | | | | 0.24 | | | | 0.16 | | | | — | | | | — | | | | — | | | | — | | | | 0.16 | | | | 15.93 | | | | 1.02 | | | | 78,986 | | | | 2.51 | | | | 2.35 | | | | 2.35 | | | | (0.45 | ) | | | — | |
| Class C | | | 15.84 | | | | (0.06 | ) | | | — | | | | 0.23 | | | | 0.17 | | | | — | | | | — | | | | — | | | | — | | | | 0.17 | | | | 16.01 | | | | 1.07 | | | | 71,623 | | | | 2.25 | | | | 2.25 | | | | 2.25 | | | | (0.34 | ) | | | — | |
| Class Y | | | 17.06 | | | | 0.13 | | | | — | | | | 0.27 | | | | 0.40 | | | | — | | | | — | | | | — | | | | — | | | | 0.40 | | | | 17.46 | | | | 2.34 | | | | 83,896 | | | | 0.97 | | | | 0.97 | | | | 0.97 | | | | 0.87 | | | | — | |
| For the Year Ended October 31, 2004 | | | | | | | | | | | | | | | | | | | | | | | | | | | | |
| Class A | | | 13.96 | | | | (0.06 | ) | | | — | | | | 2.59 | | | | 2.53 | | | | — | | | | — | | | | — | | | | — | | | | 2.53 | | | | 16.49 | | | | 18.12 | | | | 466,013 | | | | 1.62 | | | | 1.62 | | | | 1.62 | | | | (0.36 | ) | | | 271 | |
| Class B | | | 13.45 | | | | (0.17 | ) | | | — | | | | 2.49 | | | | 2.32 | | | | — | | | | — | | | | — | | | | — | | | | 2.32 | | | | 15.77 | | | | 17.25 | | | | 90,179 | | | | 2.52 | | | | 2.35 | | | | 2.35 | | | | (1.09 | ) | | | — | |
| Class C | | | 13.49 | | | | (0.15 | ) | | | — | | | | 2.50 | | | | 2.35 | | | | — | | | | — | | | | — | | | | — | | | | 2.35 | | | | 15.84 | | | | 17.42 | | | | 87,518 | | | | 2.24 | | | | 2.24 | | | | 2.24 | | | | (0.98 | ) | | | — | |
| Class Y | | | 14.34 | | | | 0.03 | | | | — | | | | 2.69 | | | | 2.72 | | | | — | | | | — | | | | — | | | | — | | | | 2.72 | | | | 17.06 | | | | 18.97 | | | | 58,791 | | | | 0.93 | | | | 0.93 | | | | 0.93 | | | | 0.31 | | | | — | |
| For the Year Ended October 31, 2003 | | | | | | | | | | | | | | | | | | | | | | | | | | | | |
| Class A | | | 11.21 | | | | (0.03 | ) | | | — | | | | 2.78 | | | | 2.75 | | | | — | | | | — | | | | — | | | | — | | | | 2.75 | | | | 13.96 | | | | 24.53 | | | | 464,610 | | | | 1.62 | | | | 1.61 | | | | 1.61 | | | | (0.29 | ) | | | 320 | |
| Class B | | | 10.88 | | | | (0.12 | ) | | | — | | | | 2.69 | | | | 2.57 | | | | — | | | | — | | | | — | | | | — | | | | 2.57 | | | | 13.45 | | | | 23.62 | | | | 78,923 | | | | 2.36 | | | | 2.35 | | | | 2.35 | | | | (1.01 | ) | | | — | |
| Class C | | | 10.90 | | | | (0.11 | ) | | | — | | | | 2.70 | | | | 2.59 | | | | — | | | | — | | | | — | | | | — | | | | 2.59 | | | | 13.49 | | | | 23.76 | | | | 78,303 | | | | 2.23 | | | | 2.23 | | | | 2.23 | | | | (0.89 | ) | | | — | |
| Class Y | | | 11.45 | | | | 0.03 | | | | — | | | | 2.86 | | | | 2.89 | | | | — | | | | — | | | | — | | | | — | | | | 2.89 | | | | 14.34 | | | | 25.24 | | | | 19,043 | | | | 1.00 | | | | 1.00 | | | | 1.00 | | | | 0.28 | | | | — | |
The Hartford Global Health Fund | | | | | | | | | | | | | | | | | | | | | | | | | | | | |
| For the Six-Month Period Ended April 30, 2008 (Unaudited) | | | | | | | | | | | | | | | | | | | | | | | | | | | | |
| Class A | | | 18.85 | | | | (0.02 | ) | | | — | | | | (1.80 | ) | | | (1.82 | ) | | | — | | | | (1.30 | ) | | | — | | | | (1.30 | ) | | | (3.12 | ) | | | 15.73 | | | | (10.24 | )(f) | | | 425,647 | | | | 1.40 | (e) | | | 1.40 | (e) | | | 1.40 | (e) | | | (0.19 | )(e) | | | 23 | |
| Class B | | | 17.67 | | | | (0.08 | ) | | | — | | | | (1.67 | ) | | | (1.75 | ) | | | — | | | | (1.30 | ) | | | — | | | | (1.30 | ) | | | (3.05 | ) | | | 14.62 | | | | (10.55 | )(f) | | | 69,357 | | | | 2.30 | (e) | | | 2.25 | (e) | | | 2.25 | (e) | | | (1.04 | )(e) | | | — | |
| Class C | | | 17.71 | | | | (0.07 | ) | | | — | | | | (1.69 | ) | | | (1.76 | ) | | | — | | | | (1.30 | ) | | | — | | | | (1.30 | ) | | | (3.06 | ) | | | 14.65 | | | | (10.59 | )(f) | | | 122,218 | | | | 2.14 | (e) | | | 2.14 | (e) | | | 2.14 | (e) | | | (0.92 | )(e) | | | — | |
| Class I | | | 18.96 | | | | 0.02 | | | | — | | | | (1.83 | ) | | | (1.81 | ) | | | — | | | | (1.30 | ) | | | — | | | | (1.30 | ) | | | (3.11 | ) | | | 15.85 | | | | (10.12 | )(f) | | | 17,160 | | | | 1.12 | (e) | | | 1.12 | (e) | | | 1.12 | (e) | | | 0.18 | (e) | | | — | |
| Class R3 | | | 19.59 | | | | (0.04 | ) | | | — | | | | (1.88 | ) | | | (1.92 | ) | | | — | | | | (1.30 | ) | | | — | | | | (1.30 | ) | | | (3.22 | ) | | | 16.37 | | | | (10.37 | )(f) | | | 108 | | | | 2.10 | (e) | | | 1.73 | (e) | | | 1.73 | (e) | | | (0.49 | )(e) | | | — | |
| Class R4 | | | 19.66 | | | | 0.01 | | | | — | | | | (1.90 | ) | | | (1.89 | ) | | | — | | | | (1.30 | ) | | | — | | | | (1.30 | ) | | | (3.19 | ) | | | 16.47 | | | | (10.17 | )(f) | | | 2,838 | | | | 1.36 | (e) | | | 1.36 | (e) | | | 1.36 | (e) | | | 0.23 | (e) | | | — | |
| Class R5 | | | 19.70 | | | | 0.03 | | | | — | | | | (1.88 | ) | | | (1.85 | ) | | | — | | | | (1.30 | ) | | | — | | | | (1.30 | ) | | | (3.15 | ) | | | 16.55 | | | | (9.93 | )(f) | | | 1,431 | | | | 1.06 | (e) | | | 1.06 | (e) | | | 1.06 | (e) | | | 0.44 | (e) | | | — | |
| Class Y | | | 19.74 | | | | 0.02 | | | | — | | | | (1.89 | ) | | | (1.87 | ) | | | — | | | | (1.30 | ) | | | — | | | | (1.30 | ) | | | (3.17 | ) | | | 16.57 | | | | (10.02 | )(f) | | | 191,765 | | | | 0.95 | (e) | | | 0.95 | (e) | | | 0.95 | (e) | | | 0.27 | (e) | | | — | |
| For the Year Ended October 31, 2007 | | | | | | | | | | | | | | | | | | | | | | | | | | | | |
| Class A | | | 17.84 | | | | (0.04 | ) | | | — | | | | 1.73 | | | | 1.69 | | | | — | | | | (0.68 | ) | | | — | | | | (0.68 | ) | | | 1.01 | | | | 18.85 | | | | 9.96 | (i) | | | 509,341 | | | | 1.41 | | | | 1.41 | | | | 1.41 | | | | (0.25 | ) | | | 41 | |
| Class B | | | 16.92 | | | | (0.20 | ) | | | — | | | | 1.63 | | | | 1.43 | | | | — | | | | (0.68 | ) | | | — | | | | (0.68 | ) | | | 0.75 | | | | 17.67 | | | | 8.92 | (i) | | | 82,932 | | | | 2.30 | | | | 2.29 | | | | 2.29 | | | | (1.15 | ) | | | — | |
| Class C | | | 16.93 | | | | (0.15 | ) | | | — | | | | 1.61 | | | | 1.46 | | | | — | | | | (0.68 | ) | | | — | | | | (0.68 | ) | | | 0.78 | | | | 17.71 | | | | 9.11 | (i) | | | 137,101 | | | | 2.15 | | | | 2.15 | | | | 2.15 | | | | (0.99 | ) | | | — | |
| Class I | | | 17.86 | | | | 0.01 | | | | — | | | | 1.77 | | | | 1.78 | | | | — | | | | (0.68 | ) | | | — | | | | (0.68 | ) | | | 1.10 | | | | 18.96 | | | | 10.48 | (i) | | | 15,017 | | | | 1.07 | | | | 1.07 | | | | 1.07 | | | | 0.08 | | | | — | |
| Class Y | | | 18.57 | | | | 0.04 | | | | — | | | | 1.81 | | | | 1.85 | | | | — | | | | (0.68 | ) | | | — | | | | (0.68 | ) | | | 1.17 | | | | 19.74 | | | | 10.45 | (i) | | | 213,110 | | | | 0.95 | | | | 0.95 | | | | 0.95 | | | | 0.20 | | | | — | |
| From (commencement of operations) December 22, 2006, through October 31, 2007 | | | | | | | | | | | | | | | | | | | | | | | | | | | | |
| Class R3 | | | 18.27 | | | | (0.02 | ) | | | — | | | | 1.34 | | | | 1.32 | | | | — | | | | — | | | | — | | | | — | | | | 1.32 | | | | 19.59 | | | | 7.22 | (f) | | | 112 | | | | 1.75 | (e) | | | 1.75 | (e) | | | 1.75 | (e) | | | (0.50 | )(e) | | | — | |
| Class R4 | | | 18.27 | | | | — | | | | — | | | | 1.39 | | | | 1.39 | | | | — | | | | — | | | | — | | | | — | | | | 1.39 | | | | 19.66 | | | | 7.61 | (f) | | | 494 | | | | 1.41 | (e) | | | 1.41 | (e) | | | 1.41 | (e) | | | 0.00 | (e) | | | — | |
| Class R5 | | | 18.27 | | | | — | | | | — | | | | 1.43 | | | | 1.43 | | | | — | | | | — | | | | — | | | | — | | | | 1.43 | | | | 19.70 | | | | 7.83 | (f) | | | 434 | | | | 1.14 | (e) | | | 1.14 | (e) | | | 1.14 | (e) | | | 0.00 | (e) | | | — | |
| For the Year Ended October 31, 2006 | | | | | | | | | | | | | | | | | | | | | | | | | | | | |
| Class A | | | 16.50 | | | | (0.07 | ) | | | — | | | | 2.41 | | | | 2.34 | | | | — | | | | (1.00 | ) | | | — | | | | (1.00 | ) | | | 1.34 | | | | 17.84 | | | | 14.96 | | | | 370,285 | | | | 1.61 | | | | 1.60 | | | | 1.60 | | | | (0.53 | ) | | | 30 | |
| Class B | | | 15.81 | | | | (0.20 | ) | | | — | | | | 2.31 | | | | 2.11 | | | | — | | | | (1.00 | ) | | | — | | | | (1.00 | ) | | | 1.11 | | | | 16.92 | | | | 14.10 | | | | 80,574 | | | | 2.45 | | | | 2.32 | | | | 2.32 | | | | (1.27 | ) | | | — | |
| Class C | | | 15.81 | | | | (0.18 | ) | | | — | | | | 2.30 | | | | 2.12 | | | | — | | | | (1.00 | ) | | | — | | | | (1.00 | ) | | | 1.12 | | | | 16.93 | | | | 14.17 | | | | 97,956 | | | | 2.31 | | | | 2.31 | | | | 2.31 | | | | (1.25 | ) | | | — | |
| Class Y | | | 17.05 | | | | (0.01 | ) | | | — | | | | 2.53 | | | | 2.52 | | | | — | | | | (1.00 | ) | | | — | | | | (1.00 | ) | | | 1.52 | | | | 18.57 | | | | 15.56 | | | | 192,814 | | | | 1.08 | | | | 1.08 | | | | 1.08 | | | | (0.03 | ) | | | — | |
| From (commencement of operations) August 31, 2006, through October 31, 2006 | | | | | | | | | | | | | | | | | | | | | | | | | | | | |
| Class I | | | 17.34 | | | | — | | | | — | | | | 0.52 | | | | 0.52 | | | | — | | | | — | | | | — | | | | — | | | | 0.52 | | | | 17.86 | | | | 3.00 | (f) | | | 785 | | | | 1.26 | (e) | | | 1.15 | (e) | | | 1.15 | (e) | | | (0.20 | )(e) | | | — | |
| For the Year Ended October 31, 2005 | | | | | | | | | | | | | | | | | | | | | | | | | | | | |
| Class A | | | 15.00 | | | | (0.08 | ) | | | — | | | | 2.35 | | | | 2.27 | | | | — | | | | (0.77 | ) | | | — | | | | (0.77 | ) | | | 1.50 | | | | 16.50 | | | | 15.67 | | | | 209,835 | | | | 1.71 | | | | 1.60 | | | | 1.60 | | | | (0.55 | ) | | | 50 | |
| Class B | | | 14.50 | | | | (0.20 | ) | | | — | | | | 2.28 | | | | 2.08 | | | | — | | | | (0.77 | ) | | | — | | | | (0.77 | ) | | | 1.31 | | | | 15.81 | | | | 14.86 | | | | 71,204 | | | | 2.52 | | | | 2.35 | | | | 2.35 | | | | (1.30 | ) | | | — | |
| Class C | | | 14.51 | | | | (0.19 | ) | | | — | | | | 2.26 | | | | 2.07 | | | | — | | | | (0.77 | ) | | | — | | | | (0.77 | ) | | | 1.30 | | | | 15.81 | | | | 14.78 | | | | 72,546 | | | | 2.36 | | | | 2.35 | | | | 2.35 | | | | (1.30 | ) | | | — | |
| Class Y | | | 15.41 | | | | (0.01 | ) | | | — | | | | 2.42 | | | | 2.41 | | | | — | | | | (0.77 | ) | | | — | | | | (0.77 | ) | | | 1.64 | | | | 17.05 | | | | 16.19 | | | | 169,698 | | | | 1.08 | | | | 1.08 | | | | 1.08 | | | | (0.12 | ) | | | — | |
| For the Year Ended October 31, 2004 | | | | | | | | | | | | | | | | | | | | | | | | | | | | |
| Class A | | | 13.80 | | | | (0.10 | ) | | | — | | | | 1.36 | | | | 1.26 | | | | — | | | | (0.06 | ) | | | — | | | | (0.06 | ) | | | 1.20 | | | | 15.00 | | | | 9.21 | | | | 170,672 | | | | 1.81 | | | | 1.65 | | | | 1.65 | | | | (0.68 | ) | | | 41 | |
| Class B | | | 13.43 | | | | (0.20 | ) | | | — | | | | 1.33 | | | | 1.13 | | | | — | | | | (0.06 | ) | | | — | | | | (0.06 | ) | | | 1.07 | | | | 14.50 | | | | 8.49 | | | | 66,035 | | | | 2.55 | | | | 2.35 | | | | 2.35 | | | | (1.38 | ) | | | — | |
| Class C | | | 13.44 | | | | (0.20 | ) | | | — | | | | 1.33 | | | | 1.13 | | | | — | | | | (0.06 | ) | | | — | | | | (0.06 | ) | | | 1.07 | | | | 14.51 | | | | 8.49 | | | | 61,390 | | | | 2.37 | | | | 2.35 | | | | 2.35 | | | | (1.38 | ) | | | — | |
| Class Y | | | 14.09 | | | | (0.02 | ) | | | — | | | | 1.40 | | | | 1.38 | | | | — | | | | (0.06 | ) | | | — | | | | (0.06 | ) | | | 1.32 | | | | 15.41 | | | | 9.88 | | | | 1,299 | | | | 1.12 | | | | 1.12 | | | | 1.12 | | | | (0.14 | ) | | | — | |
388
| | | | | | | | | | | | | | | | | | | | | | | | | | | | | | | | | | | | | | | | | | | | | | | | | | | | | | | | | | | | | | | | | | | | | | | | | |
| | | — Selected Per-Share Data (a) — | | — Ratios and Supplemental Data — |
| | | | | | | | | | | | | | | | | | | | | | | | | | | | | Ratio of
| | Ratio of
| | Ratio of
| | | | |
| | | | | | | | | | | | | | | | | | | | | | | | | | | | | Expenses
| | Expenses
| | Expenses
| | | | |
| | | | | | | | | | | | | | | | | | | | | | | | | | | | | to Average
| | to Average
| | to Average
| | | | |
| | | | | | | | | Net
| | | | | | | | | | | | | | | | | | | | Net Assets
| | Net Assets
| | Net Assets
| | | | |
| | | | | | | | | Realized
| | | | | | | | | | | | Net
| | | | | | | | Before
| | After
| | After
| | Ratio of
| | |
| | | | | | | | | and
| | | | | | Distributions
| | | | | | Increase
| | | | | | | | Waivers and
| | Waivers and
| | Waivers and
| | Net
| | |
| | | Net Asset
| | Net
| | Payments
| | Unrealized
| | Total
| | Dividends
| | from
| | | | | | (Decrease)
| | Net Asset
| | | | Net Assets
| | Reimbursements
| | Reimbursements
| | Reimbursements
| | Investment
| | |
| | | Value at
| | Investment
| | from
| | Gain
| | from
| | from Net
| | Realized
| | Distributions
| | | | in Net
| | Value at
| | | | at End of
| | and Including
| | and Including
| | and Excluding
| | Income
| | Portfolio
|
| | | Beginning
| | Income
| | (to)
| | (Loss) on
| | Investment
| | Investment
| | Capital
| | from
| | Total
| | Asset
| | End
| | Total
| | Period
| | Interest
| | Interest
| | Interest
| | to Average
| | Turnover
|
| | | of Period | | (Loss) | | Affiliate | | Investments | | Operations | | Income | | Gains | | Capital | | Distributions | | Value | | of Period | | Return (b) | | (000’s) | | Expense (d) | | Expense (d) | | Expense (d) | | Net Assets | | Rate (c) |
The Hartford Global Health Fund — (continued) | | | | | | | | | | | | | | | | | | | | | | | | | | | | |
| For the Year Ended October 31, 2003 | | | | | | | | | | | | | | | | | | | | | | | | | | | | |
| Class A | | $ | 11.42 | | | $ | (0.07 | ) | | $ | — | | | $ | 2.75 | | | $ | 2.68 | | | $ | — | | | $ | (0.30 | ) | | $ | — | | | $ | (0.30 | ) | | $ | 2.38 | | | $ | 13.80 | | | | 24.02 | % | | $ | 126,630 | | | | 1.76 | % | | | 1.65 | % | | | 1.65 | % | | | (0.62 | )% | | | 37 | % |
| Class B | | | 11.20 | | | | (0.15 | ) | | | — | | | | 2.68 | | | | 2.53 | | | | — | | | | (0.30 | ) | | | — | | | | (0.30 | ) | | | 2.23 | | | | 13.43 | | | | 23.13 | | | | 56,378 | | | | 2.49 | | | | 2.35 | | | | 2.35 | | | | (1.31 | ) | | | — | |
| Class C | | | 11.21 | | | | (0.15 | ) | | | — | | | | 2.68 | | | | 2.53 | | | | — | | | | (0.30 | ) | | | — | | | | (0.30 | ) | | | 2.23 | | | | 13.44 | | | | 23.11 | | | | 51,606 | | | | 2.36 | | | | 2.35 | | | | 2.35 | | | | (1.31 | ) | | | — | |
| Class Y | | | 11.61 | | | | (0.02 | ) | | | — | | | | 2.80 | | | | 2.78 | | | | — | | | | (0.30 | ) | | | — | | | | (0.30 | ) | | | 2.48 | | | | 14.09 | | | | 24.50 | | | | 1,095 | | | | 1.19 | | | | 1.19 | | | | 1.19 | | | | (0.15 | ) | | | — | |
The Hartford Global Technology Fund | | | | | | | | | | | | | | | | | | | | | | | | | | | | |
| For the Six-Month Period Ended April 30, 2008 (Unaudited) | | | | | | | | | | | | | | | | | | | | | | | | | | | | |
| Class A | | | 7.23 | | | | (0.02 | ) | | | — | | | | (1.06 | ) | | | (1.08 | ) | | | — | | | | — | | | | — | | | | — | | | | (1.08 | ) | | | 6.15 | | | | (14.94 | )(f) | | | 34,769 | | | | 1.81 | (e) | | | 1.44 | (e) | | | 1.44 | (e) | | | (0.64 | )(e) | | | 72 | |
| Class B | | | 6.85 | | | | (0.04 | ) | | | — | | | | (1.00 | ) | | | (1.04 | ) | | | — | | | | — | | | | — | | | | — | | | | (1.04 | ) | | | 5.81 | | | | (15.18 | )(f) | | | 11,496 | | | | 2.75 | (e) | | | 1.99 | (e) | | | 1.99 | (e) | | | (1.20 | )(e) | | | — | |
| Class C | | | 6.82 | | | | (0.04 | ) | | | — | | | | (1.01 | ) | | | (1.05 | ) | | | — | | | | — | | | | — | | | | — | | | | (1.05 | ) | | | 5.77 | | | | (15.40 | )(f) | | | 12,726 | | | | 2.44 | (e) | | | 2.29 | (e) | | | 2.29 | (e) | | | (1.51 | )(e) | | | — | |
| Class Y | | | 7.45 | | | | (0.01 | ) | | | — | | | | (1.10 | ) | | | (1.11 | ) | | | — | | | | — | | | | — | | | | — | | | | (1.11 | ) | | | 6.34 | | | | (14.90 | )(f) | | | 1,764 | | | | 1.08 | (e) | | | 1.08 | (e) | | | 1.08 | (e) | | | (0.30 | )(e) | | | — | |
| For the Year Ended October 31, 2007 | | | | | | | | | | | | | | | | | | | | | | | | | | | | |
| Class A | | | 5.67 | | | | (0.05 | ) | | | — | | | | 1.61 | | | | 1.56 | | | | — | | | | — | | | | — | | | | — | | | | 1.56 | | | | 7.23 | | | | 27.51 | (i) | | | 46,765 | | | | 1.84 | | | | 1.44 | | | | 1.44 | | | | (0.87 | ) | | | 146 | |
| Class B | | | 5.41 | | | | (0.09 | ) | | | — | | | | 1.53 | | | | 1.44 | | | | — | | | | — | | | | — | | | | — | | | | 1.44 | | | | 6.85 | | | | 26.62 | (i) | | | 14,552 | | | | 2.74 | | | | 2.05 | | | | 2.05 | | | | (1.47 | ) | | | — | |
| Class C | | | 5.40 | | | | (0.10 | ) | | | — | | | | 1.52 | | | | 1.42 | | | | — | | | | — | | | | — | | | | — | | | | 1.42 | | | | 6.82 | | | | 26.30 | (i) | | | 15,462 | | | | 2.47 | | | | 2.31 | | | | 2.31 | | | | (1.75 | ) | | | — | |
| Class Y | | | 5.82 | | | | (0.03 | ) | | | — | | | | 1.66 | | | | 1.63 | | | | — | | | | — | | | | — | | | | — | | | | 1.63 | | | | 7.45 | | | | 28.01 | (i) | | | 2,710 | | | | 1.10 | | | | 1.10 | | | | 1.10 | | | | (0.53 | ) | | | — | |
| For the Year Ended October 31, 2006 | | | | | | | | | | | | | | | | | | | | | | | | | | | | |
| Class A | | | 4.97 | | | | (0.04 | ) | | | — | | | | 0.74 | | | | 0.70 | | | | — | | | | — | | | | — | | | | — | | | | 0.70 | | | | 5.67 | | | | 14.08 | | | | 33,424 | | | | 2.10 | | | | 1.36 | | | | 1.36 | | | | (0.78 | ) | | | 144 | |
| Class B | | | 4.77 | | | | (0.08 | ) | | | — | | | | 0.72 | | | | 0.64 | | | | — | | | | — | | | | — | | | | — | | | | 0.64 | | | | 5.41 | | | | 13.42 | | | | 12,729 | | | | 2.96 | | | | 1.99 | | | | 1.99 | | | | (1.41 | ) | | | — | |
| Class C | | | 4.77 | | | | (0.09 | ) | | | — | | | | 0.72 | | | | 0.63 | | | | — | | | | — | | | | — | | | | — | | | | 0.63 | | | | 5.40 | | | | 13.21 | | | | 11,521 | | | | 2.71 | | | | 2.24 | | | | 2.24 | | | | (1.67 | ) | | | — | |
| Class Y | | | 5.09 | | | | (0.03 | ) | | | — | | | | 0.76 | | | | 0.73 | | | | — | | | | — | | | | — | | | | — | | | | 0.73 | | | | 5.82 | | | | 14.34 | | | | 1,137 | | | | 1.26 | | | | 1.20 | | | | 1.20 | | | | (0.62 | ) | | | — | |
| For the Year Ended October 31, 2005 | | | | | | | | | | | | | | | | | | | | | | | | | | | | |
| Class A | | | 4.42 | | | | — | | | | — | | | | 0.55 | | | | 0.55 | | | | — | | | | — | | | | — | | | | — | | | | 0.55 | | | | 4.97 | | | | 12.44 | | | | 27,620 | | | | 2.22 | | | | 1.60 | | | | 1.60 | | | | — | | | | 132 | |
| Class B | | | 4.28 | | | | (0.04 | ) | | | — | | | | 0.53 | | | | 0.49 | | | | — | | | | — | | | | — | | | | — | | | | 0.49 | | | | 4.77 | | | | 11.45 | | | | 12,409 | | | | 3.05 | | | | 2.35 | | | | 2.35 | | | | (0.79 | ) | | | — | |
| Class C | | | 4.28 | | | | (0.04 | ) | | | — | | | | 0.53 | | | | 0.49 | | | | — | | | | — | | | | — | | | | — | | | | 0.49 | | | | 4.77 | | | | 11.45 | | | | 10,712 | | | | 2.75 | | | | 2.35 | | | | 2.35 | | | | (0.65 | ) | | | — | |
| Class Y | | | 4.51 | | | | 0.03 | | | | — | | | | 0.55 | | | | 0.58 | | | | — | | | | — | | | | — | | | | — | | | | 0.58 | | | | 5.09 | | | | 12.86 | | | | 938 | | | | 1.22 | | | | 1.20 | | | | 1.20 | | | | 0.58 | | | | — | |
| For the Year Ended October 31, 2004 | | | | | | | | | | | | | | | | | | | | | | | | | | | | |
| Class A | | | 4.68 | | | | (0.07 | ) | | | — | | | | (0.19 | ) | | | (0.26 | ) | | | — | | | | — | | | | — | | | | — | | | | (0.26 | ) | | | 4.42 | | | | (5.56 | ) | | | 31,418 | | | | 2.14 | | | | 1.65 | | | | 1.65 | | | | (1.37 | ) | | | 165 | |
| Class B | | | 4.56 | | | | (0.10 | ) | | | — | | | | (0.18 | ) | | | (0.28 | ) | | | — | | | | — | | | | — | | | | — | | | | (0.28 | ) | | | 4.28 | | | | (6.14 | ) | | | 12,978 | | | | 2.96 | | | | 2.35 | | | | 2.35 | | | | (2.07 | ) | | | — | |
| Class C | | | 4.56 | | | | (0.11 | ) | | | — | | | | (0.17 | ) | | | (0.28 | ) | | | — | | | | — | | | | — | | | | — | | | | (0.28 | ) | | | 4.28 | | | | (6.14 | ) | | | 13,891 | | | | 2.62 | | | | 2.35 | | | | 2.35 | | | | (2.07 | ) | | | — | |
| Class Y | | | 4.75 | | | | (0.04 | ) | | | — | | | | (0.20 | ) | | | (0.24 | ) | | | — | | | | — | | | | — | | | | — | | | | (0.24 | ) | | | 4.51 | | | | (5.05 | ) | | | 1,186 | | | | 1.15 | | | | 1.15 | | | | 1.15 | | | | (0.85 | ) | | | — | |
| For the Year Ended October 31, 2003 | | | | | | | | | | | | | | | | | | | | | | | | | | | | |
| Class A | | | 2.98 | | | | (0.04 | ) | | | — | | | | 1.74 | | | | 1.70 | | | | — | | | | — | | | | — | | | | — | | | | 1.70 | | | | 4.68 | | | | 57.05 | | | | 32,388 | | | | 1.77 | | | | 1.65 | | | | 1.65 | | | | (1.28 | ) | | | 163 | |
| Class B | | | 2.92 | | | | (0.06 | ) | | | — | | | | 1.70 | | | | 1.64 | | | | — | | | | — | | | | — | | | | — | | | | 1.64 | | | | 4.56 | | | | 56.16 | | | | 13,991 | | | | 2.50 | | | | 2.35 | | | | 2.35 | | | | (1.98 | ) | | | — | |
| Class C | | | 2.92 | | | | (0.06 | ) | | | — | | | | 1.70 | | | | 1.64 | | | | — | | | | — | | | | — | | | | — | | | | 1.64 | | | | 4.56 | | | | 56.16 | | | | 16,513 | | | | 2.37 | | | | 2.35 | | | | 2.35 | | | | (1.99 | ) | | | — | |
| Class Y | | | 3.01 | | | | (0.03 | ) | | | — | | | | 1.77 | | | | 1.74 | | | | — | | | | — | | | | — | | | | — | | | | 1.74 | | | | 4.75 | | | | 57.81 | | | | 886 | | | | 1.18 | | | | 1.18 | | | | 1.18 | | | | (0.82 | ) | | | — | |
The Hartford Growth Allocation Fund (g) | | | | | | | | | | | | | | | | | | | | | | | | | | | | |
| For the Six-Month Period Ended April 30, 2008 (Unaudited) | | | | | | | | | | | | | | | | | | | | | | | | | | | | |
| Class A | | | 14.51 | | | | 0.10 | | | | — | | | | (1.11 | ) | | | (1.01 | ) | | | (0.47 | ) | | | (0.79 | ) | | | — | | | | (1.26 | ) | | | (2.27 | ) | | | 12.24 | | | | (7.27 | )(f) | | | 476,745 | | | | 0.58 | (e) | | | 0.58 | (e) | | | 0.58 | (e) | | | 1.43 | (e) | | | 8 | |
| Class B | | | 14.37 | | | | 0.05 | | | | — | | | | (1.10 | ) | | | (1.05 | ) | | | (0.38 | ) | | | (0.79 | ) | | | — | | | | (1.17 | ) | | | (2.22 | ) | | | 12.15 | | | | (7.62 | )(f) | | | 133,771 | | | | 1.40 | (e) | | | 1.40 | (e) | | | 1.40 | (e) | | | 0.63 | (e) | | | — | |
| Class C | | | 14.37 | | | | 0.05 | | | | — | | | | (1.11 | ) | | | (1.06 | ) | | | (0.38 | ) | | | (0.79 | ) | | | — | | | | (1.17 | ) | | | (2.23 | ) | | | 12.14 | | | | (7.66 | )(f) | | | 221,317 | | | | 1.33 | (e) | | | 1.33 | (e) | | | 1.33 | (e) | | | 0.71 | (e) | | | — | |
| Class I | | | 14.49 | | | | 0.28 | | | | — | | | | (1.26 | ) | | | (0.98 | ) | | | (0.51 | ) | | | (0.79 | ) | | | — | | | | (1.30 | ) | | | (2.28 | ) | | | 12.21 | | | | (7.04 | )(f) | | | 1,296 | | | | 0.22 | (e) | | | 0.22 | (e) | | | 0.22 | (e) | | | 1.46 | (e) | | | — | |
| Class R3 | | | 14.46 | | | | 0.14 | | | | — | | | | (1.18 | ) | | | (1.04 | ) | | | (0.46 | ) | | | (0.79 | ) | | | — | | | | (1.25 | ) | | | (2.29 | ) | | | 12.17 | | | | (7.50 | )(f) | | | 62 | | | | 1.00 | (e) | | | 1.00 | (e) | | | 1.00 | (e) | | | 0.81 | (e) | | | — | |
| Class R4 | | | 14.51 | | | | 0.40 | | | | — | | | | (1.41 | ) | | | (1.01 | ) | | | (0.51 | ) | | | (0.79 | ) | | | — | | | | (1.30 | ) | | | (2.31 | ) | | | 12.20 | | | | (7.29 | )(f) | | | 5,117 | | | | 0.60 | (e) | | | 0.60 | (e) | | | 0.60 | (e) | | | 0.38 | (e) | | | — | |
| Class R5 | | | 14.54 | | | | 0.37 | | | | — | | | | (1.36 | ) | | | (0.99 | ) | | | (0.51 | ) | | | (0.79 | ) | | | — | | | | (1.30 | ) | | | (2.29 | ) | | | 12.25 | | | | (7.10 | )(f) | | | 1,825 | | | | 0.30 | (e) | | | 0.30 | (e) | | | 0.30 | (e) | | | 1.11 | (e) | | | — | |
| For the Year Ended October 31, 2007 | | | | | | | | | | | | | | | | | | | | | | | | | | | | |
| Class A | | | 12.66 | | | | 0.14 | | | | — | | | | 2.23 | | | | 2.37 | | | | (0.24 | ) | | | (0.28 | ) | | | — | | | | (0.52 | ) | | | 1.85 | | | | 14.51 | | | | 19.35 | | | | 503,345 | | | | 0.60 | | | | 0.60 | | | | 0.60 | | | | 0.93 | | | | 39 | |
| Class B | | | 12.57 | | | | 0.04 | | | | — | | | | 2.21 | | | | 2.25 | | | | (0.17 | ) | | | (0.28 | ) | | | — | | | | (0.45 | ) | | | 1.80 | | | | 14.37 | | | | 18.40 | | | | 143,140 | | | | 1.41 | | | | 1.32 | | | | 1.32 | | | | 0.22 | | | | — | |
| Class C | | | 12.57 | | | | 0.05 | | | | — | | | | 2.20 | | | | 2.25 | | | | (0.17 | ) | | | (0.28 | ) | | | — | | | | (0.45 | ) | | | 1.80 | | | | 14.37 | | | | 18.44 | | | | 238,997 | | | | 1.34 | | | | 1.31 | | | | 1.31 | | | | 0.25 | | | | — | |
| Class I | | | 12.67 | | | | 0.26 | | | | — | | | | 2.14 | | | | 2.40 | | | | (0.30 | ) | | | (0.28 | ) | | | — | | | | (0.58 | ) | | | 1.82 | | | | 14.49 | | | | 19.71 | | | | 804 | | | | 0.23 | | | | 0.23 | | | | 0.23 | | | | 0.58 | | | | — | |
| From (commencement of operations) December 22, 2006, through October 31, 2007 | | | | | | | | | | | | | | | | | | | | | | | | | | | | |
| Class R3 | | | 12.59 | | | | (0.02 | ) | | | — | | | | 1.89 | | | | 1.87 | | | | — | | | | — | | | | — | | | | — | | | | 1.87 | | | | 14.46 | | | | 14.85 | (f) | | | 53 | | | | 0.95 | (e) | | | 0.93 | (e) | | | 0.93 | (e) | | | (0.26 | )(e) | | | — | |
| Class R4 | | | 12.59 | | | | — | | | | — | | | | 1.92 | | | | 1.92 | | | | — | | | | — | | | | — | | | | — | | | | 1.92 | | | | 14.51 | | | | 15.25 | (f) | | | 325 | | | | 0.66 | (e) | | | 0.65 | (e) | | | 0.65 | (e) | | | (0.01 | )(e) | | | — | |
| Class R5 | | | 12.59 | | | | — | | | | — | | | | 1.95 | | | | 1.95 | | | | — | | | | — | | | | — | | | | — | | | | 1.95 | | | | 14.54 | | | | 15.49 | (f) | | | 782 | | | | 0.38 | (e) | | | 0.38 | (e) | | | 0.38 | (e) | | | 0.25 | (e) | | | — | |
| For the Year Ended October 31, 2006 | | | | | | | | | | | | | | | | | | | | | | | | | | | | |
| Class A | | | 11.27 | | | | 0.07 | | | | — | | | | 1.46 | | | | 1.53 | | | | (0.13 | ) | | | (0.01 | ) | | | — | | | | (0.14 | ) | | | 1.39 | | | | 12.66 | | | | 13.64 | | | | 370,088 | | | | 0.69 | | | | 0.67 | | | | 0.67 | | | | 0.49 | | | | 13 | |
| Class B | | | 11.19 | | | | 0.03 | | | | — | | | | 1.42 | | | | 1.45 | | | | (0.06 | ) | | | (0.01 | ) | | | — | | | | (0.07 | ) | | | 1.38 | | | | 12.57 | | | | 12.96 | | | | 107,818 | | | | 1.51 | | | | 1.32 | | | | 1.32 | | | | (0.15 | ) | | | — | |
| Class C | | | 11.19 | | | | 0.03 | | | | — | | | | 1.42 | | | | 1.45 | | | | (0.06 | ) | | | (0.01 | ) | | | — | | | | (0.07 | ) | | | 1.38 | | | | 12.57 | | | | 12.96 | | | | 181,434 | | | | 1.44 | | | | 1.32 | | | | 1.32 | | | | (0.16 | ) | | | — | |
| From (commencement of operations) August 31, 2006, through October 31, 2006 | | | | | | | | | | | | | | | | | | | | | | | | | | | | |
| Class I | | | 12.16 | | | | (0.01 | ) | | | — | | | | 0.52 | | | | 0.51 | | | | — | | | | — | | | | — | | | | — | | | | 0.51 | | | | 12.67 | | | | 4.19 | (f) | | | 10 | | | | 0.66 | (e) | | | 0.42 | (e) | | | 0.42 | (e) | | | 0.16 | (e) | | | — | |
389
The Hartford Mutual Funds, Inc. and The Hartford Mutual Funds II, Inc.
Financial Highlights — (continued)
| | | | | | | | | | | | | | | | | | | | | | | | | | | | | | | | | | | | | | | | | | | | | | | | | | | | | | | | | | | | | | | | | | | | | | | | | |
| | | — Selected Per-Share Data (a) — | | — Ratios and Supplemental Data — |
| | | | | | | | | | | | | | | | | | | | | | | | | | | | | Ratio of
| | Ratio of
| | Ratio of
| | | | |
| | | | | | | | | | | | | | | | | | | | | | | | | | | | | Expenses
| | Expenses
| | Expenses
| | | | |
| | | | | | | | | | | | | | | | | | | | | | | | | | | | | to Average
| | to Average
| | to Average
| | | | |
| | | | | | | | | Net
| | | | | | | | | | | | | | | | | | | | Net Assets
| | Net Assets
| | Net Assets
| | | | |
| | | | | | | | | Realized
| | | | | | | | | | | | Net
| | | | | | | | Before
| | After
| | After
| | Ratio of
| | |
| | | | | | | | | and
| | | | | | Distributions
| | | | | | Increase
| | | | | | | | Waivers and
| | Waivers and
| | Waivers and
| | Net
| | |
| | | Net Asset
| | Net
| | Payments
| | Unrealized
| | Total
| | Dividends
| | from
| | | | | | (Decrease)
| | Net Asset
| | | | Net Assets
| | Reimbursements
| | Reimbursements
| | Reimbursements
| | Investment
| | |
| | | Value at
| | Investment
| | from
| | Gain
| | from
| | from Net
| | Realized
| | Distributions
| | | | in Net
| | Value at
| | | | at End of
| | and Including
| | and Including
| | and Excluding
| | Income
| | Portfolio
|
| | | Beginning
| | Income
| | (to)
| | (Loss) on
| | Investment
| | Investment
| | Capital
| | from
| | Total
| | Asset
| | End
| | Total
| | Period
| | Interest
| | Interest
| | Interest
| | to Average
| | Turnover
|
| | | of Period | | (Loss) | | Affiliate | | Investments | | Operations | | Income | | Gains | | Capital | | Distributions | | Value | | of Period | | Return (b) | | (000’s) | | Expense (d) | | Expense (d) | | Expense (d) | | Net Assets | | Rate (c) |
The Hartford Growth Allocation Fund (g) — (continued) | | | | | | | | | | | | | | | | | | | | | | | | | | | | |
| For the Year Ended October 31, 2005 | | | | | | | | | | | | | | | | | | | | | | | | | | | | |
| Class A | | $ | 10.36 | | | $ | 0.05 | | | $ | — | | | $ | 0.89 | | | $ | 0.94 | | | $ | (0.03 | ) | | $ | — | | | $ | — | | | $ | (0.03 | ) | | $ | 0.91 | | | $ | 11.27 | | | | 9.12 | % | | $ | 205,331 | | | | 0.72 | % | | | 0.64 | % | | | 0.64 | % | | | 0.42 | % | | | 1 | % |
| Class B | | | 10.34 | | | | (0.01 | ) | | | — | | | | 0.87 | | | | 0.86 | | | | (0.01 | ) | | | — | | | | — | | | | (0.01 | ) | | | 0.85 | | | | 11.19 | | | | 8.37 | | | | 65,739 | | | | 1.53 | | | | 1.29 | | | | 1.29 | | | | (0.23 | ) | | | — | |
| Class C | | | 10.33 | | | | (0.01 | ) | | | — | | | | 0.88 | | | | 0.87 | | | | (0.01 | ) | | | — | | | | — | | | | (0.01 | ) | | | 0.86 | | | | 11.19 | | | | 8.47 | | | | 100,339 | | | | 1.47 | | | | 1.29 | | | | 1.29 | | | | (0.23 | ) | | | — | |
| From (commencement of operations) May 28, 2004, through October 31, 2004 | | | | | | | | | | | | | | | | | | | | | | | | | | | | |
| Class A | | | 10.00 | | | | — | | | | — | | | | 0.36 | | | | 0.36 | | | | — | | | | — | | | | — | | | | — | | | | 0.36 | | | | 10.36 | | | | 3.60 | (f) | | | 43,279 | | | | 0.72 | (e) | | | 0.63 | (e) | | | 0.63 | (e) | | | 0.13 | (e) | | | — | |
| Class B | | | 10.00 | | | | (0.01 | ) | | | — | | | | 0.35 | | | | 0.34 | | | | — | | | | — | | | | — | | | | — | | | | 0.34 | | | | 10.34 | | | | 3.40 | (f) | | | 14,177 | | | | 1.52 | (e) | | | 1.28 | (e) | | | 1.28 | (e) | | | (0.53 | )(e) | | | — | |
| Class C | | | 10.00 | | | | (0.01 | ) | | | — | | | | 0.34 | | | | 0.33 | | | | — | | | | — | | | | — | | | | — | | | | 0.33 | | | | 10.33 | | | | 3.30 | (f) | | | 21,221 | | | | 1.44 | (e) | | | 1.28 | (e) | | | 1.28 | (e) | | | (0.52 | )(e) | | | — | |
The Hartford Growth Fund | | | | | | | | | | | | | | | | | | | | | | | | | | | | |
| For the Six-Month Period Ended April 30, 2008 (Unaudited) | | | | | | | | | | | | | | | | | | | | | | | | | | | | |
| Class A | | | 21.25 | | | | (0.02 | ) | | | — | | | | (2.20 | ) | | | (2.22 | ) | | | — | | | | (1.58 | ) | | | — | | | | (1.58 | ) | | | (3.80 | ) | | | 17.45 | | | | (10.82 | )(f) | | | 514,317 | | | | 1.27 | (e) | | | 1.27 | (e) | | | 1.27 | (e) | | | (0.27 | )(e) | | | 58 | |
| Class B | | | 18.39 | | | | (0.07 | ) | | | — | | | | (1.90 | ) | | | (1.97 | ) | | | — | | | | (1.58 | ) | | | — | | | | (1.58 | ) | | | (3.55 | ) | | | 14.84 | | | | (11.17 | )(f) | | | 33,658 | | | | 2.22 | (e) | | | 1.95 | (e) | | | 1.95 | (e) | | | (0.95 | )(e) | | | — | |
| Class C | | | 18.45 | | | | (0.07 | ) | | | — | | | | (1.90 | ) | | | (1.97 | ) | | | — | | | | (1.58 | ) | | | — | | | | (1.58 | ) | | | (3.55 | ) | | | 14.90 | | | | (11.13 | )(f) | | | 74,899 | | | | 1.97 | (e) | | | 1.97 | (e) | | | 1.97 | (e) | | | (0.97 | )(e) | | | — | |
| Class I | | | 21.34 | | | | 0.01 | | | | — | | | | (2.21 | ) | | | (2.20 | ) | | | — | | | | (1.58 | ) | | | — | | | | (1.58 | ) | | | (3.78 | ) | | | 17.56 | | | | (10.67 | )(f) | | | 36,717 | | | | 0.90 | (e) | | | 0.90 | (e) | | | 0.90 | (e) | | | 0.10 | (e) | | | — | |
| Class L | | | 21.60 | | | | — | | | | — | | | | (2.24 | ) | | | (2.24 | ) | | | — | | | | (1.58 | ) | | | — | | | | (1.58 | ) | | | (3.82 | ) | | | 17.78 | | | | (10.73 | )(f) | | | 271,389 | | | | 1.05 | (e) | | | 1.04 | (e) | | | 1.04 | (e) | | | (0.04 | )(e) | | | — | |
| Class R3 | | | 21.76 | | | | (0.04 | ) | | | — | | | | (2.27 | ) | | | (2.31 | ) | | | — | | | | (1.58 | ) | | | — | | | | (1.58 | ) | | | (3.89 | ) | | | 17.87 | | | | (10.99 | )(f) | | | 17 | | | | 1.74 | (e) | | | 1.55 | (e) | | | 1.55 | (e) | | | (0.56 | )(e) | | | — | |
| Class R4 | | | 21.82 | | | | (0.01 | ) | | | — | | | | (2.27 | ) | | | (2.28 | ) | | | — | | | | (1.58 | ) | | | — | | | | (1.58 | ) | | | (3.86 | ) | | | 17.96 | | | | (10.81 | )(f) | | | 1,571 | | | | 1.21 | (e) | | | 1.21 | (e) | | | 1.21 | (e) | | | (0.15 | )(e) | | | — | |
| Class R5 | | | 21.87 | | | | 0.01 | | | | — | | | | (2.27 | ) | | | (2.26 | ) | | | — | | | | (1.58 | ) | | | — | | | | (1.58 | ) | | | (3.84 | ) | | | 18.03 | | | | (10.69 | )(f) | | | 73 | | | | 0.94 | (e) | | | 0.94 | (e) | | | 0.94 | (e) | | | 0.08 | (e) | | | — | |
| Class Y | | | 21.90 | | | | 0.02 | | | | — | | | | (2.27 | ) | | | (2.25 | ) | | | — | | | | (1.58 | ) | | | — | | | | (1.58 | ) | | | (3.83 | ) | | | 18.07 | | | | (10.62 | )(f) | | | 117,927 | | | | 0.80 | (e) | | | 0.80 | (e) | | | 0.80 | (e) | | | 0.20 | (e) | | | — | |
| For the Year Ended October 31, 2007 | | | | | | | | | | | | | | | | | | | | | | | | | | | | |
| Class A | | | 18.45 | | | | (0.07 | ) | | | — | | | | 4.17 | | | | 4.10 | | | | — | | | | (1.30 | ) | | | — | | | | (1.30 | ) | | | 2.80 | | | | 21.25 | | | | 23.92 | (i) | | | 627,677 | | | | 1.27 | | | | 1.27 | | | | 1.27 | | | | (0.35 | ) | | | 89 | |
| Class B | | | 16.25 | | | | (0.21 | ) | | | — | | | | 3.65 | | | | 3.44 | | | | — | | | | (1.30 | ) | | | — | | | | (1.30 | ) | | | 2.14 | | | | 18.39 | | | | 23.02 | (i) | | | 41,359 | | | | 2.22 | | | | 2.09 | | | | 2.09 | | | | (1.17 | ) | | | — | |
| Class C | | | 16.29 | | | | (0.19 | ) | | | — | | | | 3.65 | | | | 3.46 | | | | — | | | | (1.30 | ) | | | — | | | | (1.30 | ) | | | 2.16 | | | | 18.45 | | | | 23.10 | (i) | | | 85,303 | | | | 1.98 | | | | 1.98 | | | | 1.98 | | | | (1.06 | ) | | | — | |
| Class I | | | 18.46 | | | | — | | | | — | | | | 4.18 | | | | 4.18 | | | | — | | | | (1.30 | ) | | | — | | | | (1.30 | ) | | | 2.88 | | | | 21.34 | | | | 24.37 | (i) | | | 35,626 | | | | 0.91 | | | | 0.91 | | | | 0.91 | | | | 0.02 | | | | — | |
| Class L(k) | | | 18.69 | | | | (0.05 | ) | | | — | | | | 4.26 | | | | 4.21 | | | | — | | | | (1.30 | ) | | | — | | | | (1.30 | ) | | | 2.91 | | | | 21.60 | | | | 24.22 | (i) | | | 323,581 | | | | 1.06 | | | | 1.05 | | | | 1.05 | | | | (0.27 | ) | | | — | |
| Class Y | | | 18.89 | | | | 0.02 | | | | — | | | | 4.29 | | | | 4.31 | | | | — | | | | (1.30 | ) | | | — | | | | (1.30 | ) | | | 3.01 | | | | 21.90 | | | | 24.52 | (i) | | | 103,251 | | | | 0.81 | | | | 0.81 | | | | 0.81 | | | | 0.10 | | | | — | |
| From (commencement of operations) December 22, 2006, through October 31, 2007 | | | | | | | | | | | | | | | | | | | | | | | | | | | | |
| Class R3 | | | 18.15 | | | | (0.08 | ) | | | — | | | | 3.69 | | | | 3.61 | | | | — | | | | — | | | | — | | | | — | | | | 3.61 | | | | 21.76 | | | | 19.89 | (f) | | | 16 | | | | 1.56 | (e) | | | 1.56 | (e) | | | 1.56 | (e) | | | (0.67 | )(e) | | | — | |
| Class R4 | | | 18.15 | | | | (0.01 | ) | | | — | | | | 3.68 | | | | 3.67 | | | | — | | | | — | | | | — | | | | — | | | | 3.67 | | | | 21.82 | | | | 20.22 | (f) | | | 282 | | | | 1.17 | (e) | | | 1.17 | (e) | | | 1.17 | (e) | | | (0.28 | )(e) | | | — | |
| Class R5 | | | 18.15 | | | | — | | | | — | | | | 3.72 | | | | 3.72 | | | | — | | | | — | | | | — | | | | — | | | | 3.72 | | | | 21.87 | | | | 20.50 | (f) | | | 63 | | | | 0.90 | (e) | | | 0.90 | (e) | | | 0.90 | (e) | | | (0.01 | )(e) | | | — | |
| For the Year Ended October 31, 2006 | | | | | | | | | | | | | | | | | | | | | | | | | | | | |
| Class A | | | 17.32 | | | | (0.07 | ) | | | — | | | | 1.20 | | | | 1.13 | | | | — | | | | — | | | | — | | | | — | | | | 1.13 | | | | 18.45 | | | | 6.52 | | | | 707,000 | | | | 1.34 | | | | 1.33 | | | | 1.33 | | | | (0.38 | ) | | | 92 | |
| Class B | | | 15.38 | | | | (0.20 | ) | | | — | | | | 1.07 | | | | 0.87 | | | | — | | | | — | | | | — | | | | — | | | | 0.87 | | | | 16.25 | | | | 5.66 | | | | 44,064 | | | | 2.22 | | | | 2.09 | | | | 2.09 | | | | (1.14 | ) | | | — | |
| Class C | | | 15.40 | | | | (0.18 | ) | | | — | | | | 1.07 | | | | 0.89 | | | | — | | | | — | | | | — | | | | — | | | | 0.89 | | | | 16.29 | | | | 5.78 | | | | 85,469 | | | | 2.02 | | | | 2.02 | | | | 2.02 | | | | (1.07 | ) | | | — | |
| Class L | | | 17.50 | | | | (0.02 | ) | | | — | | | | 1.21 | | | | 1.19 | | | | — | | | | — | | | | — | | | | — | | | | 1.19 | | | | 18.69 | | | | 6.80 | | | | 274,890 | | | | 1.05 | | | | 1.05 | | | | 1.05 | | | | (0.10 | ) | | | — | |
| Class Y | | | 17.65 | | | | 0.01 | | | | — | | | | 1.23 | | | | 1.24 | | | | — | | | | — | | | | — | | | | — | | | | 1.24 | | | | 18.89 | | | | 7.03 | | | | 130,594 | | | | 0.83 | | | | 0.83 | | | | 0.83 | | | | 0.08 | | | | — | |
| From (commencement of operations) August 31, 2006, through October 31, 2006 | | | | | | | | | | | | | | | | | | | | | | | | | | | | |
| Class I | | | 17.64 | | | | — | | | | — | | | | 0.82 | | | | 0.82 | | | | — | | | | — | | | | — | | | | — | | | | 0.82 | | | | 18.46 | | | | 4.65 | (f) | | | 1,961 | | | | 0.96 | (e) | | | 0.96 | (e) | | | 0.96 | (e) | | | (0.52 | )(e) | | | — | |
| For the Year Ended October 31, 2005 | | | | | | | | | | | | | | | | | | | | | | | | | | | | |
| Class A | | | 16.19 | | | | (0.04 | ) | | | — | | | | 1.17 | | | | 1.13 | | | | — | | | | — | | | | — | | | | — | | | | 1.13 | | | | 17.32 | | | | 6.98 | | | | 635,057 | | | | 1.40 | | | | 1.33 | | | | 1.33 | | | | (0.30 | ) | | | 77 | |
| Class B | | | 14.49 | | | | (0.15 | ) | | | — | | | | 1.04 | | | | 0.89 | | | | — | | | | — | | | | — | | | | — | | | | 0.89 | | | | 15.38 | | | | 6.14 | | | | 46,251 | | | | 2.27 | | | | 2.15 | | | | 2.15 | | | | (1.09 | ) | | | — | |
| Class C | | | 14.50 | | | | (0.13 | ) | | | — | | | | 1.03 | | | | 0.90 | | | | — | | | | — | | | | — | | | | — | | | | 0.90 | | | | 15.40 | | | | 6.21 | | | | 82,481 | | | | 2.05 | | | | 2.05 | | | | 2.05 | | | | (1.01 | ) | | | — | |
| Class L | | | 16.32 | | | | 0.01 | | | | — | | | | 1.17 | | | | 1.18 | | | | — | | | | — | | | | — | | | | — | | | | 1.18 | | | | 17.50 | | | | 7.23 | | | | 295,731 | | | | 1.06 | | | | 1.06 | | | | 1.06 | | | | 0.05 | | | | — | |
| Class Y | | | 16.42 | | | | 0.01 | | | | — | | | | 1.22 | | | | 1.23 | | | | — | | | | — | | | | — | | | | — | | | | 1.23 | | | | 17.65 | | | | 7.49 | | | | 52,992 | | | | 0.85 | | | | 0.85 | | | | 0.85 | | | | 0.10 | | | | — | |
| For the Year Ended October 31, 2004 | | | | | | | | | | | | | | | | | | | | | | | | | | | | |
| Class A | | | 15.19 | | | | (0.08 | ) | | | — | | | | 1.08 | | | | 1.00 | | | | — | | | | — | | | | — | | | | — | | | | 1.00 | | | | 16.19 | | | | 6.58 | | | | 384,160 | | | | 1.55 | | | | 1.45 | | | | 1.45 | | | | (0.84 | ) | | | 66 | |
| Class B | | | 13.70 | | | | (0.15 | ) | | | — | | | | 0.94 | | | | 0.79 | | | | — | | | | — | | | | — | | | | — | | | | 0.79 | | | | 14.49 | | | | 5.77 | | | | 32,440 | | | | 2.33 | | | | 2.15 | | | | 2.15 | | | | (1.54 | ) | | | — | |
| Class C | | | 13.70 | | | | (0.12 | ) | | | — | | | | 0.92 | | | | 0.80 | | | | — | | | | — | | | | — | | | | — | | | | 0.80 | | | | 14.50 | | | | 5.84 | | | | 47,575 | | | | 2.07 | | | | 2.07 | | | | 2.07 | | | | (1.45 | ) | | | — | |
| Class L | | | 15.26 | | | | (0.08 | ) | | | — | | | | 1.14 | | | | 1.06 | | | | — | | | | — | | | | — | | | | — | | | | 1.06 | | | | 16.32 | | | | 6.95 | | | | 310,084 | | | | 1.08 | | | | 1.08 | | | | 1.08 | | | | (0.48 | ) | | | — | |
| Class Y | | | 15.31 | | | | — | | | | — | | | | 1.11 | | | | 1.11 | | | | — | | | | — | | | | — | | | | — | | | | 1.11 | | | | 16.42 | | | | 7.25 | | | | 11,926 | | | | 0.87 | | | | 0.87 | | | | 0.87 | | | | (0.18 | ) | | | — | |
| For the Year Ended October 31, 2003 | | | | | | | | | | | | | | | | | | | | | | | | | | | | |
| Class A | | | 11.90 | | | | (0.03 | ) | | | — | | | | 3.32 | | | | 3.29 | | | | — | | | | — | | | | — | | | | — | | | | 3.29 | | | | 15.19 | | | | 27.65 | | | | 72,186 | | | | 1.52 | | | | 1.45 | | | | 1.45 | | | | (0.65 | ) | | | 129 | |
| Class B | | | 10.80 | | | | (0.07 | ) | | | — | | | | 2.97 | | | | 2.90 | | | | — | | | | — | | | | — | | | | — | | | | 2.90 | | | | 13.70 | | | | 26.85 | | | | 11,552 | | | | 2.26 | | | | 2.12 | | | | 2.12 | | | | (1.35 | ) | | | — | |
| Class C | | | 10.80 | | | | (0.07 | ) | | | — | | | | 2.97 | | | | 2.90 | | | | — | | | | — | | | | — | | | | — | | | | 2.90 | | | | 13.70 | | | | 26.85 | | | | 11,896 | | | | 2.15 | | | | 2.15 | | | | 2.15 | | | | (1.36 | ) | | | — | |
| Class L | | | 11.91 | | | | (0.05 | ) | | | — | | | | 3.40 | | | | 3.35 | | | | — | | | | — | | | | — | | | | — | | | | 3.35 | | | | 15.26 | | | | 28.13 | | | | 316,451 | | | | 1.15 | | | | 1.15 | | | | 1.15 | | | | (0.34 | ) | | | — | |
| Class Y | | | 11.94 | | | | (0.03 | ) | | | — | | | | 3.40 | | | | 3.37 | | | | — | | | | — | | | | — | | | | — | | | | 3.37 | | | | 15.31 | | | | 28.22 | | | | 1 | | | | 0.96 | | | | 0.96 | | | | 0.96 | | | | (0.17 | ) | | | — | |
| | | | | | | | | | | | | | | | | | | | | | | | | | | | | | | | | | | | | | | | | | | | | | | | | | | | | | | | | | | | | | | | | | | | | | | | | |
390
| | | | | | | | | | | | | | | | | | | | | | | | | | | | | | | | | | | | | | | | | | | | | | | | | | | | | | | | | | | | | | | | | | | | | | | | | |
| | | — Selected Per-Share Data (a) — | | — Ratios and Supplemental Data — |
| | | | | | | | | | | | | | | | | | | | | | | | | | | | | Ratio of
| | Ratio of
| | Ratio of
| | | | |
| | | | | | | | | | | | | | | | | | | | | | | | | | | | | Expenses
| | Expenses
| | Expenses
| | | | |
| | | | | | | | | | | | | | | | | | | | | | | | | | | | | to Average
| | to Average
| | to Average
| | | | |
| | | | | | | | | Net
| | | | | | | | | | | | | | | | | | | | Net Assets
| | Net Assets
| | Net Assets
| | | | |
| | | | | | | | | Realized
| | | | | | | | | | | | Net
| | | | | | | | Before
| | After
| | After
| | Ratio of
| | |
| | | | | | | | | and
| | | | | | Distributions
| | | | | | Increase
| | | | | | | | Waivers and
| | Waivers and
| | Waivers and
| | Net
| | |
| | | Net Asset
| | Net
| | Payments
| | Unrealized
| | Total
| | Dividends
| | from
| | | | | | (Decrease)
| | Net Asset
| | | | Net Assets
| | Reimbursements
| | Reimbursements
| | Reimbursements
| | Investment
| | |
| | | Value at
| | Investment
| | from
| | Gain
| | from
| | from Net
| | Realized
| | Distributions
| | | | in Net
| | Value at
| | | | at End of
| | and Including
| | and Including
| | and Excluding
| | Income
| | Portfolio
|
| | | Beginning
| | Income
| | (to)
| | (Loss) on
| | Investment
| | Investment
| | Capital
| | from
| | Total
| | Asset
| | End
| | Total
| | Period
| | Interest
| | Interest
| | Interest
| | to Average
| | Turnover
|
| | | of Period | | (Loss) | | Affiliate | | Investments | | Operations | | Income | | Gains | | Capital | | Distributions | | Value | | of Period | | Return (b) | | (000’s) | | Expense (d) | | Expense (d) | | Expense (d) | | Net Assets | | Rate (c) |
The Hartford Growth Opportunities Fund | | | | | | | | | | | | | | | | | | | | | | | | | | | | |
| For the Six-Month Period Ended April 30, 2008 (Unaudited) | | | | | | | | | | | | | | | | | | | | | | | | | | | | |
| Class A | | $ | 38.24 | | | $ | (0.02 | ) | | $ | — | | | $ | (4.80 | ) | | $ | (4.82 | ) | | $ | — | | | $ | (4.38 | ) | | $ | — | | | $ | (4.38 | ) | | $ | (9.20 | ) | | $ | 29.04 | | | | (13.59)%(f) | | | $ | 1,517,789 | | | | 1.25 | %(e) | | | 1.25 | %(e) | | | 1.25 | %(e) | | | (0.09)%(e) | | | | 73 | % |
| Class B | | | 32.23 | | | | (0.15 | ) | | | — | | | | (3.95 | ) | | | (4.10 | ) | | | — | | | | (4.38 | ) | | | — | | | | (4.38 | ) | | | (8.48 | ) | | | 23.75 | | | | (13.94 | )(f) | | | 58,664 | | | | 2.10 | (e) | | | 2.07 | (e) | | | 2.07 | (e) | | | (0.91 | )(e) | | | — | |
| Class C | | | 32.27 | | | | (0.12 | ) | | | — | | | | (3.95 | ) | | | (4.07 | ) | | | — | | | | (4.38 | ) | | | — | | | | (4.38 | ) | | | (8.45 | ) | | | 23.82 | | | | (13.82 | )(f) | | | 298,399 | | | | 1.91 | (e) | | | 1.91 | (e) | | | 1.91 | (e) | | | (0.75 | )(e) | | | — | |
| Class I | | | 38.39 | | | | 0.07 | | | | — | | | | (4.81 | ) | | | (4.74 | ) | | | (0.08 | ) | | | (4.38 | ) | | | — | | | | (4.46 | ) | | | (9.20 | ) | | | 29.19 | | | | (13.32 | )(f) | | | 116,221 | | | | 0.85 | (e) | | | 0.85 | (e) | | | 0.85 | (e) | | | 0.32 | (e) | | | — | |
| Class L | | | 38.91 | | | | 0.03 | | | | — | | | | (4.90 | ) | | | (4.87 | ) | | | (0.01 | ) | | | (4.38 | ) | | | — | | | | (4.39 | ) | | | (9.26 | ) | | | 29.65 | | | | (13.47 | )(f) | | | 651,081 | | | | 1.01 | (e) | | | 1.00 | (e) | | | 1.00 | (e) | | | 0.16 | (e) | | | — | |
| Class R3 | | | 39.18 | | | | (0.08 | ) | | | — | | | | (4.90 | ) | | | (4.98 | ) | | | — | | | | (4.38 | ) | | | — | | | | (4.38 | ) | | | (9.36 | ) | | | 29.82 | | | | (13.69 | )(f) | | | 4,591 | | | | 1.49 | (e) | | | 1.49 | (e) | | | 1.49 | (e) | | | (0.26 | )(e) | | | — | |
| Class R4 | | | 39.33 | | | | 0.04 | | | | — | | | | (4.98 | ) | | | (4.94 | ) | | | (0.06 | ) | | | (4.38 | ) | | | — | | | | (4.44 | ) | | | (9.38 | ) | | | 29.95 | | | | (13.53 | )(f) | | | 13,301 | | | | 1.17 | (e) | | | 1.17 | (e) | | | 1.17 | (e) | | | 0.01 | (e) | | | — | |
| Class R5 | | | 39.39 | | | | 0.08 | | | | — | | | | (5.00 | ) | | | (4.92 | ) | | | (0.07 | ) | | | (4.38 | ) | | | — | | | | (4.45 | ) | | | (9.37 | ) | | | 30.02 | | | | (13.45 | )(f) | | | 867 | | | | 0.91 | (e) | | | 0.91 | (e) | | | 0.91 | (e) | | | 0.27 | (e) | | | — | |
| Class Y | | | 39.43 | | | | 0.09 | | | | — | | | | (4.99 | ) | | | (4.90 | ) | | | (0.08 | ) | | | (4.38 | ) | | | — | | | | (4.46 | ) | | | (9.36 | ) | | | 30.07 | | | | (13.39 | )(f) | | | 129,796 | | | | 0.77 | (e) | | | 0.77 | (e) | | | 0.77 | (e) | | | 0.40 | (e) | | | — | |
| For the Year Ended October 31, 2007 | | | | | | | | | | | | | | | | | | | | | | | | | | | | |
| Class A | | | 29.33 | | | | (0.03 | ) | | | 0.01 | | | | 11.05 | | | | 11.03 | | | | — | | | | (2.12 | ) | | | — | | | | (2.12 | ) | | | 8.91 | | | | 38.24 | | | | 40.39 | (i) | | | 989,969 | | | | 1.42 | | | | 1.31 | | | | 1.31 | | | | (0.12 | ) | | | 120 | |
| Class B | | | 25.23 | | | | (0.20 | ) | | | 0.01 | | | | 9.31 | | | | 9.12 | | | | — | | | | (2.12 | ) | | | — | | | | (2.12 | ) | | | 7.00 | | | | 32.23 | | | | 39.29 | (i) | | | 56,396 | | | | 2.18 | | | | 2.11 | | | | 2.11 | | | | (0.88 | ) | | | — | |
| Class C | | | 25.24 | | | | (0.10 | ) | | | — | | | | 9.25 | | | | 9.15 | | | | — | | | | (2.12 | ) | | | — | | | | (2.12 | ) | | | 7.03 | | | | 32.27 | | | | 39.40 | (i) | | | 201,274 | | | | 1.98 | | | | 1.98 | | | | 1.98 | | | | (0.82 | ) | | | — | |
| Class I | | | 29.34 | | | | 0.01 | | | | — | | | | 11.16 | | | | 11.17 | | | | — | | | | (2.12 | ) | | | — | | | | (2.12 | ) | | | 9.05 | | | | 38.39 | | | | 40.89 | (i) | | | 40,678 | | | | 0.86 | | | | 0.86 | | | | 0.86 | | | | 0.09 | | | | — | |
| Class L(l) | | | 29.73 | | | | 0.04 | | | | 0.01 | | | | 11.25 | | | | 11.30 | | | | — | | | | (2.12 | ) | | | — | | | | (2.12 | ) | | | 9.18 | | | | 38.91 | | | | 40.77 | (i) | | | 789,757 | | | | 1.05 | | | | 1.04 | | | | 1.04 | | | | 0.12 | | | | — | |
| Class Y(l) | | | 30.04 | | | | 0.15 | | | | 0.01 | | | | 11.35 | | | | 11.51 | | | | — | | | | (2.12 | ) | | | — | | | | (2.12 | ) | | | 9.39 | | | | 39.43 | | | | 41.07 | (i) | | | 138,065 | | | | 0.80 | | | | 0.80 | | | | 0.80 | | | | 0.53 | | | | — | |
| From (commencement of operations) December 22, 2006, through October 31, 2007 | | | | | | | | | | | | | | | | | | | | | | | | | | | | |
| Class R3 | | | 29.39 | | | | (0.08 | ) | | | — | | | | 9.87 | | | | 9.79 | | | | — | | | | — | | | | — | | | | — | | | | 9.79 | | | | 39.18 | | | | 33.31 | (f) | | | 323 | | | | 1.58 | (e) | | | 1.58 | (e) | | | 1.58 | (e) | | | (0.69 | )(e) | | | — | |
| Class R4 | | | 29.39 | | | | (0.01 | ) | | | — | | | | 9.95 | | | | 9.94 | | | | — | | | | — | | | | — | | | | — | | | | 9.94 | | | | 39.33 | | | | 33.82 | (f) | | | 3,402 | | | | 1.23 | (e) | | | 1.23 | (e) | | | 1.23 | (e) | | | (0.18 | )(e) | | | — | |
| Class R5 | | | 29.39 | | | | — | | | | — | | | | 10.00 | | | | 10.00 | | | | — | | | | — | | | | — | | | | — | | | | 10.00 | | | | 39.39 | | | | 34.03 | (f) | | | 81 | | | | 0.92 | (e) | | | 0.92 | (e) | | | 0.92 | (e) | | | 0.01 | (e) | | | — | |
| For the Year Ended October 31, 2006 | | | | | | | | | | | | | | | | | | | | | | | | | | | | |
| Class A | | | 27.84 | | | | (0.07 | ) | | | — | | | | 3.59 | | | | 3.52 | | | | — | | | | (2.03 | ) | | | — | | | | (2.03 | ) | | | 1.49 | | | | 29.33 | | | | 13.35 | | | | 420,220 | | | | 1.60 | | | | 1.20 | | | | 1.20 | | | | (0.31 | ) | | | 131 | |
| Class B | | | 24.42 | | | | (0.25 | ) | | | — | | | | 3.09 | | | | 2.84 | | | | — | | | | (2.03 | ) | | | — | | | | (2.03 | ) | | | 0.81 | | | | 25.23 | | | | 12.36 | | | | 33,670 | | | | 2.26 | | | | 2.08 | | | | 2.08 | | | | (1.18 | ) | | | — | |
| Class C | | | 24.42 | | | | (0.23 | ) | | | — | | | | 3.08 | | | | 2.85 | | | | — | | | | (2.03 | ) | | | — | | | | (2.03 | ) | | | 0.82 | | | | 25.24 | | | | 12.40 | | | | 47,366 | | | | 2.09 | | | | 2.07 | | | | 2.07 | | | | (1.17 | ) | | | — | |
| Class L | | | 28.17 | | | | (0.06 | ) | | | — | | | | 3.65 | | | | 3.59 | | | | — | | | | (2.03 | ) | | | — | | | | (2.03 | ) | | | 1.56 | | | | 29.73 | | | | 13.45 | | | | 570,541 | | | | 1.07 | | | | 1.07 | | | | 1.07 | | | | (0.18 | ) | | | — | |
| Class Y | | | 28.37 | | | | 0.02 | | | | — | | | | 3.68 | | | | 3.70 | | | | — | | | | (2.03 | ) | | | — | | | | (2.03 | ) | | | 1.67 | | | | 30.04 | | | | 13.76 | | | | 73,685 | | | | 0.85 | | | | 0.83 | | | | 0.83 | | | | 0.08 | | | | — | |
| From (commencement of operations) August 31, 2006, through October 31, 2006 | | | | | | | | | | | | | | | | | | | | | | | | | | | | |
| Class I | | | 27.95 | | | | (0.01 | ) | | | — | | | | 1.40 | | | | 1.39 | | | | — | | | | — | | | | — | | | | — | | | | 1.39 | | | | 29.34 | | | | 4.97 | (f) | | | 74 | | | | 1.15 | (e) | | | 1.12 | (e) | | | 1.12 | (e) | | | (0.43 | )(e) | | | — | |
| For the Year Ended October 31, 2005 | | | | | | | | | | | | | | | | | | | | | | | | | | | | |
| Class A | | | 23.49 | | | | (0.06 | ) | | | — | | | | 4.41 | | | | 4.35 | | | | — | | | | — | | | | — | | | | — | | | | 4.35 | | | | 27.84 | | | | 18.52 | | | | 222,682 | | | | 1.54 | | | | 1.36 | | | | 1.36 | | | | (0.45 | ) | | | 156 | |
| Class B | | | 20.77 | | | | (0.25 | ) | | | — | | | | 3.90 | | | | 3.65 | | | | — | | | | — | | | | — | | | | — | | | | 3.65 | | | | 24.42 | | | | 17.57 | | | | 20,002 | | | | 2.39 | | | | 2.15 | | | | 2.15 | | | | (1.27 | ) | | | — | |
| Class C | | | 20.77 | | | | (0.25 | ) | | | — | | | | 3.90 | | | | 3.65 | | | | — | | | | — | | | | — | | | | — | | | | 3.65 | | | | 24.42 | | | | 17.57 | | | | 18,842 | | | | 2.13 | | | | 2.13 | | | | 2.13 | | | | (1.26 | ) | | | — | |
| Class L | | | 23.71 | | | | (0.06 | ) | | | — | | | | 4.52 | | | | 4.46 | | | | — | | | | — | | | | — | | | | — | | | | 4.46 | | | | 28.17 | | | | 18.81 | | | | 556,462 | | | | 1.09 | | | | 1.09 | | | | 1.09 | | | | (0.22 | ) | | | — | |
| Class Y | | | 23.82 | | | | — | | | | — | | | | 4.55 | | | | 4.55 | | | | — | | | | — | | | | — | | | | — | | | | 4.55 | | | | 28.37 | | | | 19.10 | | | | 28,441 | | | | 0.88 | | | | 0.88 | | | | 0.88 | | | | — | | | | — | |
| For the Year Ended October 31, 2004 | | | | | | | | | | | | | | | | | | | | | | | | | | | | |
| Class A | | | 21.25 | | | | (0.17 | ) | | | — | | | | 2.41 | | | | 2.24 | | | | — | | | | — | | | | — | | | | — | | | | 2.24 | | | | 23.49 | | | | 10.54 | | | | 54,652 | | | | 1.52 | | | | 1.45 | | | | 1.45 | | | | (0.94 | ) | | | 130 | |
| Class B | | | 18.91 | | | | (0.26 | ) | | | — | | | | 2.12 | | | | 1.86 | | | | — | | | | — | | | | — | | | | — | | | | 1.86 | | | | 20.77 | | | | 9.84 | | | | 11,518 | | | | 2.45 | | | | 2.14 | | | | 2.14 | | | | (1.64 | ) | | | — | |
| Class C | | | 18.91 | | | | (0.28 | ) | | | — | | | | 2.14 | | | | 1.86 | | | | — | | | | — | | | | — | | | | — | | | | 1.86 | | | | 20.77 | | | | 9.84 | | | | 11,899 | | | | 2.11 | | | | 2.11 | | | | 2.11 | | | | (1.61 | ) | | | — | |
| Class L | | | 21.36 | | | | (0.14 | ) | | | — | | | | 2.49 | | | | 2.35 | | | | — | | | | — | | | | — | | | | — | | | | 2.35 | | | | 23.71 | | | | 11.00 | | | | 518,009 | | | | 1.08 | | | | 1.08 | | | | 1.08 | | | | (0.58 | ) | | | — | |
| Class Y | | | 21.42 | | | | (0.01 | ) | | | — | | | | 2.41 | | | | 2.40 | | | | — | | | | — | | | | — | | | | — | | | | 2.40 | | | | 23.82 | | | | 11.20 | | | | 4,792 | | | | 0.82 | | | | 0.82 | | | | 0.82 | | | | (0.33 | ) | | | — | |
| For the Year Ended October 31, 2003 | | | | | | | | | | | | | | | | | | | | | | | | | | | | |
| Class A | | | 15.31 | | | | (0.07 | ) | | | — | | | | 6.01 | | | | 5.94 | | | | — | | | | — | | | | — | | | | — | | | | 5.94 | | | | 21.25 | | | | 38.80 | | | | 17,149 | | | | 1.49 | | | | 1.45 | | | | 1.45 | | | | (0.88 | ) | | | 158 | |
| Class B | | | 13.71 | | | | (0.12 | ) | | | — | | | | 5.32 | | | | 5.20 | | | | — | | | | — | | | | — | | | | — | | | | 5.20 | | | | 18.91 | | | | 37.93 | | | | 4,470 | | | | 2.22 | | | | 2.15 | | | | 2.15 | | | | (1.58 | ) | | | — | |
| Class C | | | 13.70 | | | | (0.09 | ) | | | — | | | | 5.30 | | | | 5.21 | | | | — | | | | — | | | | — | | | | — | | | | 5.21 | | | | 18.91 | | | | 38.03 | | | | 5,238 | | | | 2.10 | | | | 2.10 | | | | 2.10 | | | | (1.54 | ) | | | — | |
| Class L | | | 15.33 | | | | (0.10 | ) | | | — | | | | 6.13 | | | | 6.03 | | | | — | | | | — | | | | — | | | | — | | | | 6.03 | | | | 21.36 | | | | 39.34 | | | | 517,892 | | | | 1.10 | | | | 1.10 | | | | 1.10 | | | | (0.56 | ) | | | — | |
| Class Y | | | 15.35 | | | | (0.07 | ) | | | — | | | | 6.14 | | | | 6.07 | | | | — | | | | — | | | | — | | | | — | | | | 6.07 | | | | 21.42 | | | | 39.54 | | | | 1 | | | | 0.91 | | | | 0.91 | | | | 0.91 | | | | (0.38 | ) | | | — | |
The Hartford High Yield Fund | | | | | | | | | | | | | | | | | | | | | | | | | | | | |
| For the Six-Month Period Ended April 30, 2008 (Unaudited) | | | | | | | | | | | | | | | | | | | | | | | | | | | | |
| Class A | | | 7.92 | | | | 0.29 | | | | — | | | | (0.46 | ) | | | (0.17 | ) | | | (0.29 | ) | | | — | | | | — | | | | (0.29 | ) | | | (0.46 | ) | | | 7.46 | | | | (2.10 | )(f) | | | 175,082 | | | | 1.31 | (e) | | | 1.15 | (e) | | | 1.15 | (e) | | | 7.81 | (e) | | | 52 | |
| Class B | | | 7.91 | | | | 0.26 | | | | — | | | | (0.47 | ) | | | (0.21 | ) | | | (0.26 | ) | | | — | | | | — | | | | (0.26 | ) | | | (0.47 | ) | | | 7.44 | | | | (2.59 | )(f) | | | 27,233 | | | | 2.14 | (e) | | | 1.89 | (e) | | | 1.89 | (e) | | | 7.07 | (e) | | | — | |
| Class C | | | 7.91 | | | | 0.26 | | | | — | | | | (0.46 | ) | | | (0.20 | ) | | | (0.26 | ) | | | — | | | | — | | | | (0.26 | ) | | | (0.46 | ) | | | 7.45 | | | | (2.47 | )(f) | | | 36,438 | | | | 1.99 | (e) | | | 1.90 | (e) | | | 1.90 | (e) | | | 7.06 | (e) | | | — | |
| Class I | | | 7.93 | | | | 0.30 | | | | — | | | | (0.47 | ) | | | (0.17 | ) | | | (0.30 | ) | | | — | | | | — | | | | (0.30 | ) | | | (0.47 | ) | | | 7.46 | | | | (2.08 | )(f) | | | 98 | | | | 0.83 | (e) | | | 0.83 | (e) | | | 0.83 | (e) | | | 8.08 | (e) | | | — | |
| Class R3 | | | 7.93 | | | | 0.28 | | | | — | | | | (0.47 | ) | | | (0.19 | ) | | | (0.28 | ) | | | — | | | | — | | | | (0.28 | ) | | | (0.47 | ) | | | 7.46 | | | | (2.35 | )(f) | | | 12 | | | | 1.67 | (e) | | | 1.40 | (e) | | | 1.40 | (e) | | | 7.57 | (e) | | | — | |
| Class R4 | | | 7.93 | | | | 0.29 | | | | — | | | | (0.47 | ) | | | (0.18 | ) | | | (0.29 | ) | | | — | | | | — | | | | (0.29 | ) | | | (0.47 | ) | | | 7.46 | | | | (2.20 | )(f) | | | 10 | | | | 1.22 | (e) | | | 1.10 | (e) | | | 1.10 | (e) | | | 7.87 | (e) | | | — | |
| Class R5 | | | 7.93 | | | | 0.30 | | | | — | | | | (0.47 | ) | | | (0.17 | ) | | | (0.30 | ) | | | — | | | | — | | | | (0.30 | ) | | | (0.47 | ) | | | 7.46 | | | | (2.10 | )(f) | | | 10 | | | | 0.93 | (e) | | | 0.90 | (e) | | | 0.90 | (e) | | | 8.07 | (e) | | | — | |
| Class Y | | | 7.93 | | | | 0.30 | | | | — | | | | (0.47 | ) | | | (0.17 | ) | | | (0.30 | ) | | | — | | | | — | | | | (0.30 | ) | | | (0.47 | ) | | | 7.46 | | | | (2.06 | )(f) | | | 12,641 | | | | 0.82 | (e) | | | 0.82 | (e) | | | 0.82 | (e) | | | 8.21 | (e) | | | — | |
391
The Hartford Mutual Funds, Inc. and The Hartford Mutual Funds II, Inc.
Financial Highlights — (continued)
| | | | | | | | | | | | | | | | | | | | | | | | | | | | | | | | | | | | | | | | | | | | | | | | | | | | | | | | | | | | | | | | | | | | | | | | | |
| | | — Selected Per-Share Data (a) — | | — Ratios and Supplemental Data — |
| | | | | | | | | | | | | | | | | | | | | | | | | | | | | Ratio of
| | Ratio of
| | Ratio of
| | | | |
| | | | | | | | | | | | | | | | | | | | | | | | | | | | | Expenses
| | Expenses
| | Expenses
| | | | |
| | | | | | | | | | | | | | | | | | | | | | | | | | | | | to Average
| | to Average
| | to Average
| | | | |
| | | | | | | | | Net
| | | | | | | | | | | | | | | | | | | | Net Assets
| | Net Assets
| | Net Assets
| | | | |
| | | | | | | | | Realized
| | | | | | | | | | | | Net
| | | | | | | | Before
| | After
| | After
| | Ratio of
| | |
| | | | | | | | | and
| | | | | | Distributions
| | | | | | Increase
| | | | | | | | Waivers and
| | Waivers and
| | Waivers and
| | Net
| | |
| | | Net Asset
| | Net
| | Payments
| | Unrealized
| | Total
| | Dividends
| | from
| | | | | | (Decrease)
| | Net Asset
| | | | Net Assets
| | Reimbursements
| | Reimbursements
| | Reimbursements
| | Investment
| | |
| | | Value at
| | Investment
| | from
| | Gain
| | from
| | from Net
| | Realized
| | Distributions
| | | | in Net
| | Value at
| | | | at End of
| | and Including
| | and Including
| | and Excluding
| | Income
| | Portfolio
|
| | | Beginning
| | Income
| | (to)
| | (Loss) on
| | Investment
| | Investment
| | Capital
| | from
| | Total
| | Asset
| | End
| | Total
| | Period
| | Interest
| | Interest
| | Interest
| | to Average
| | Turnover
|
| | | of Period | | (Loss) | | Affiliate | | Investments | | Operations | | Income | | Gains | | Capital | | Distributions | | Value | | of Period | | Return (b) | | (000’s) | | Expense (d) | | Expense (d) | | Expense (d) | | Net Assets | | Rate (c) |
The Hartford High Yield Fund — (continued) | | | | | | | | | | | | | | | | | | | | | | | | | | | | |
| For the Year Ended October 31, 2007 | | | | | | | | | | | | | | | | | | | | | | | | | | | | |
| Class A | | $ | 7.93 | | | $ | 0.58 | | | $ | — | | | $ | (0.01 | ) | | $ | 0.57 | | | $ | (0.58 | ) | | $ | — | | | $ | — | | | $ | (0.58 | ) | | $ | (0.01 | ) | | $ | 7.92 | | | | 7.36 | % | | $ | 171,505 | | | | 1.36 | % | | | 1.15 | % | | | 1.15 | % | | | 7.26 | % | | | 145 | % |
| Class B | | | 7.92 | | | | 0.52 | | | | — | | | | (0.01 | ) | | | 0.51 | | | | (0.52 | ) | | | — | | | | — | | | | (0.52 | ) | | | (0.01 | ) | | | 7.91 | | | | 6.56 | | | | 31,591 | | | | 2.17 | | | | 1.90 | | | | 1.90 | | | | 6.51 | | | | — | |
| Class C | | | 7.92 | | | | 0.53 | | | | — | | | | (0.01 | ) | | | 0.52 | | | | (0.53 | ) | | | — | | | | — | | | | (0.53 | ) | | | (0.01 | ) | | | 7.91 | | | | 6.63 | | | | 35,066 | | | | 2.03 | | | | 1.83 | | | | 1.83 | | | | 6.58 | | | | — | |
| Class Y | | | 7.92 | | | | 0.71 | | | | — | | | | (0.09 | ) | | | 0.62 | | | | (0.61 | ) | | | — | | | | — | | | | (0.61 | ) | | | 0.01 | | | | 7.93 | | | | 7.96 | | | | 4,897 | | | | 0.87 | | | | 0.67 | | | | 0.67 | | | | 7.62 | | | | — | |
| From (commencement of operations) May 31, 2007, through October 31, 2007 | | | | | | | | | | | | | | | | | | | | | | | | | | | | |
| Class I | | | 8.25 | | | | 0.26 | | | | — | | | | (0.33 | ) | | | (0.07 | ) | | | (0.25 | ) | | | — | | | | — | | | | (0.25 | ) | | | (0.32 | ) | | | 7.93 | | | | (0.76 | )(f) | | | 149 | | | | 0.95 | (e) | | | 0.75 | (e) | | | 0.75 | (e) | | | 0.75 | (e) | | | — | |
| From (commencement of operations) December 22, 2006, through October 31, 2007 | | | | | | | | | | | | | | | | | | | | | | | | | | | | |
| Class R3 | | | 8.04 | | | | 0.48 | | | | — | | | | (0.13 | ) | | | 0.35 | | | | (0.46 | ) | | | — | | | | — | | | | (0.46 | ) | | | (0.11 | ) | | | 7.93 | | | | 4.49 | (f) | | | 10 | | | | 1.66 | (e) | | | 1.40 | (e) | | | 1.40 | (e) | | | 1.40 | (e) | | | — | |
| Class R4 | | | 8.04 | | | | 0.50 | | | | — | | | | (0.13 | ) | | | 0.37 | | | | (0.48 | ) | | | — | | | | — | | | | (0.48 | ) | | | (0.11 | ) | | | 7.93 | | | | 4.75 | (f) | | | 10 | | | | 1.34 | (e) | | | 1.10 | (e) | | | 1.10 | (e) | | | 1.10 | (e) | | | — | |
| Class R5 | | | 8.04 | | | | 0.52 | | | | — | | | | (0.13 | ) | | | 0.39 | | | | (0.50 | ) | | | — | | | | — | | | | (0.50 | ) | | | (0.11 | ) | | | 7.93 | | | | 4.96 | (f) | | | 11 | | | | 1.06 | (e) | | | 0.85 | (e) | | | 0.85 | (e) | | | 0.85 | (e) | | | — | |
| For the Year Ended October 31, 2006 | | | | | | | | | | | | | | | | | | | | | | | | | | | | |
| Class A | | | 7.76 | | | | 0.54 | | | | — | | | | 0.18 | | | | 0.72 | | | | (0.55 | ) | | | — | | | | — | | | | (0.55 | ) | | | 0.17 | | | | 7.93 | | | | 9.57 | | | | 190,479 | | | | 1.36 | | | | 1.20 | | | | 1.20 | | | | 6.87 | | | | 147 | |
| Class B | | | 7.74 | | | | 0.48 | | | | — | | | | 0.19 | | | | 0.67 | | | | (0.49 | ) | | | — | | | | — | | | | (0.49 | ) | | | 0.18 | | | | 7.92 | | | | 8.90 | | | | 37,189 | | | | 2.17 | | | | 1.95 | | | | 1.95 | | | | 6.10 | | | | — | |
| Class C | | | 7.75 | | | | 0.49 | | | | — | | | | 0.17 | | | | 0.66 | | | | (0.49 | ) | | | — | | | | — | | | | (0.49 | ) | | | 0.17 | | | | 7.92 | | | | 8.84 | | | | 39,991 | | | | 2.04 | | | | 1.89 | | | | 1.89 | | | | 6.15 | | | | — | |
| Class Y | | | 7.75 | | | | 0.58 | | | | — | | | | 0.17 | | | | 0.75 | | | | (0.58 | ) | | | — | | | | — | | | | (0.58 | ) | | | 0.17 | | | | 7.92 | | | | 10.11 | | | | 24,374 | | | | 0.88 | | | | 0.73 | | | | 0.73 | | | | 7.33 | | | | — | |
| For the Year Ended October 31, 2005 | | | | | | | | | | | | | | | | | | | | | | | | | | | | |
| Class A | | | 8.18 | | | | 0.48 | | | | — | | | | (0.40 | ) | | | 0.08 | | | | (0.50 | ) | | | — | | | | — | | | | (0.50 | ) | | | (0.42 | ) | | | 7.76 | | | | 0.97 | | | | 188,599 | | | | 1.33 | | | | 1.33 | | | | 1.33 | | | | 5.86 | | | | 113 | |
| Class B | | | 8.17 | | | | 0.42 | | | | — | | | | (0.41 | ) | | | 0.01 | | | | (0.44 | ) | | | — | | | | — | | | | (0.44 | ) | | | (0.43 | ) | | | 7.74 | | | | 0.08 | | | | 47,071 | | | | 2.12 | | | | 2.10 | | | | 2.10 | | | | 5.09 | | | | — | |
| Class C | | | 8.17 | | | | 0.42 | | | | — | | | | (0.39 | ) | | | 0.03 | | | | (0.45 | ) | | | — | | | | — | | | | (0.45 | ) | | | (0.42 | ) | | | 7.75 | | | | 0.30 | | | | 50,945 | | | | 2.00 | | | | 2.00 | | | | 2.00 | | | | 5.18 | | | | — | |
| Class Y | | | 8.17 | | | | 0.52 | | | | — | | | | (0.40 | ) | | | 0.12 | | | | (0.54 | ) | | | — | | | | — | | | | (0.54 | ) | | | (0.42 | ) | | | 7.75 | | | | 1.43 | | | | 25,974 | | | | 0.87 | | | | 0.87 | | | | 0.87 | | | | 6.40 | | | | — | |
| For the Year Ended October 31, 2004 (h) | | | | | | | | | | | | | | | | | | | | | | | | | | | | |
| Class A | | | 7.94 | | | | 0.48 | | | | — | | | | 0.23 | | | | 0.71 | | | | (0.47 | ) | | | — | | | | — | | | | (0.47 | ) | | | 0.24 | | | | 8.18 | | | | 9.26 | (i) | | | 247,364 | | | | 1.35 | | | | 1.35 | | | | 1.35 | | | | 6.03 | | | | 86 | |
| Class B | | | 7.93 | | | | 0.43 | | | | — | | | | 0.22 | | | | 0.65 | | | | (0.41 | ) | | | — | | | | — | | | | (0.41 | ) | | | 0.24 | | | | 8.17 | | | | 8.45 | (i) | | | 63,972 | | | | 2.07 | | | | 2.07 | | | | 2.07 | | | | 5.32 | | | | — | |
| Class C | | | 7.93 | | | | 0.43 | | | | 0.01 | | | | 0.22 | | | | 0.66 | | | | (0.42 | ) | | | — | | | | — | | | | (0.42 | ) | | | 0.24 | | | | 8.17 | | | | 8.54 | (i) | | | 71,673 | | | | 1.98 | | | | 1.98 | | | | 1.98 | | | | 5.40 | | | | — | |
| Class Y | | | 7.94 | | | | 0.39 | | | | — | | | | 0.36 | | | | 0.75 | | | | (0.52 | ) | | | — | | | | — | | | | (0.52 | ) | | | 0.23 | | | | 8.17 | | | | 9.72 | | | | 16,410 | | | | 0.84 | | | | 0.84 | | | | 0.84 | | | | 6.13 | | | | — | |
| For the Year Ended October 31, 2003 (h) | | | | | | | | | | | | | | | | | | | | | | | | | | | | |
| Class A | | | 6.73 | | | | 0.60 | | | | — | | | | 1.26 | | | | 1.86 | | | | (0.65 | ) | | | — | | | | — | | | | (0.65 | ) | | | 1.21 | | | | 7.94 | | | | 28.69 | | | | 213,377 | | | | 1.49 | | | | 1.40 | | | | 1.40 | | | | 7.98 | | | | 54 | |
| Class B | | | 6.72 | | | | 0.57 | | | | — | | | | 1.24 | | | | 1.81 | | | | (0.60 | ) | | | — | | | | — | | | | (0.60 | ) | | | 1.21 | | | | 7.93 | | | | 27.83 | | | | 72,293 | | | | 2.23 | | | | 2.10 | | | | 2.10 | | | | 7.39 | | | | — | |
| Class C | | | 6.72 | | | | 0.55 | | | | — | | | | 1.26 | | | | 1.81 | | | | (0.60 | ) | | | — | | | | — | | | | (0.60 | ) | | | 1.21 | | | | 7.93 | | | | 27.84 | | | | 77,968 | | | | 2.10 | | | | 2.10 | | | | 2.10 | | | | 7.31 | | | | — | |
| Class Y | | | 6.73 | | | | 0.65 | | | | — | | | | 1.24 | | | | 1.89 | | | | (0.68 | ) | | | — | | | | — | | | | (0.68 | ) | | | 1.21 | | | | 7.94 | | | | 29.27 | | | | 1 | | | | 1.69 | | | | 0.95 | | | | 0.95 | | | | 8.70 | | | | — | |
The Hartford High Yield Municipal Bond Fund | | | | | | | | | | | | | | | | | | | | | | | | | | | | |
| For the Six-Month Period Ended April 30, 2008 (Unaudited) | | | | | | | | | | | | | | | | | | | | | | | | | | | | |
| Class A | | | 9.46 | | | | 0.25 | | | | — | | | | (0.70 | ) | | | (0.45 | ) | | | (0.25 | ) | | | — | | | | — | | | | (0.25 | ) | | | (0.70 | ) | | | 8.76 | | | | (4.76 | )(f) | | | 119,046 | | | | 0.94 | (e) | | | 0.32 | (e) | | | 0.32 | (e) | | | 5.59 | (e) | | | 27 | |
| Class B | | | 9.46 | | | | 0.21 | | | | — | | | | (0.69 | ) | | | (0.48 | ) | | | (0.22 | ) | | | — | | | | — | | | | (0.22 | ) | | | (0.70 | ) | | | 8.76 | | | | (5.13 | )(f) | | | 2,986 | | | | 1.74 | (e) | | | 1.10 | (e) | | | 1.10 | (e) | | | 4.80 | (e) | | | — | |
| Class C | | | 9.46 | | | | 0.22 | | | | — | | | | (0.69 | ) | | | (0.47 | ) | | | (0.22 | ) | | | — | | | | — | | | | (0.22 | ) | | | (0.69 | ) | | | 8.77 | | | | (5.02 | )(f) | | | 47,656 | | | | 1.71 | (e) | | | 1.10 | (e) | | | 1.10 | (e) | | | 4.85 | (e) | | | — | |
| Class I | | | 9.47 | | | | 0.26 | | | | — | | | | (0.70 | ) | | | (0.44 | ) | | | (0.26 | ) | | | — | | | | — | | | | (0.26 | ) | | | (0.70 | ) | | | 8.77 | | | | (4.64 | )(f) | | | 39,437 | | | | 0.70 | (e) | | | 0.09 | (e) | | | 0.09 | (e) | | | 5.85 | (e) | | | — | |
| From (date shares became available to public) May 31, 2007, through October 31, 2007 (o) | | | | | | | | | | | | | | | | | | | | | | | | | | | | |
| Class A | | | 10.00 | | | | 0.20 | | | | — | | | | (0.54 | ) | | | (0.34 | ) | | | (0.20 | ) | | | — | | | | — | | | | (0.20 | ) | | | (0.54 | ) | | | 9.46 | | | | (3.41 | )(f) | | | 46,261 | | | | 1.03 | (e) | | | 0.25 | (e) | | | 0.25 | (e) | | | 4.83 | (e) | | | 23 | |
| Class B | | | 10.00 | | | | 0.17 | | | | — | | | | (0.54 | ) | | | (0.37 | ) | | | (0.17 | ) | | | — | | | | — | | | | (0.17 | ) | | | (0.54 | ) | | | 9.46 | | | | (3.71 | )(f) | | | 1,333 | | | | 1.82 | (e) | | | 1.00 | (e) | | | 1.00 | (e) | | | 4.05 | (e) | | | — | |
| Class C | | | 10.00 | | | | 0.17 | | | | — | | | | (0.54 | ) | | | (0.37 | ) | | | (0.17 | ) | | | — | | | | — | | | | (0.17 | ) | | | (0.54 | ) | | | 9.46 | | | | (3.71 | )(f) | | | 11,236 | | | | 1.81 | (e) | | | 1.00 | (e) | | | 1.00 | (e) | | | 4.19 | (e) | | | — | |
| Class I | | | 10.00 | | | | 0.21 | | | | — | | | | (0.53 | ) | | | (0.32 | ) | | | (0.21 | ) | | | — | | | | — | | | | (0.21 | ) | | | (0.53 | ) | | | 9.47 | | | | (3.21 | )(f) | | | 6,879 | | | | 0.80 | (e) | | | — | (e) | | | — | (e) | | | 5.22 | (e) | | | — | |
The Hartford Income Allocation Fund (g) | | | | | | | | | | | | | | | | | | | | | | | | | | | | |
| For the Six-Month Period Ended April 30, 2008 (Unaudited) | | | | | | | | | | | | | | | | | | | | | | | | | | | | |
| Class A | | | 9.87 | | | | 0.23 | | | | — | | | | (0.10 | ) | | | 0.13 | | | | (0.23 | ) | | | — | | | | — | | | | (0.23 | ) | | | (0.10 | ) | | | 9.77 | | | | 1.34 | (f) | | | 41,093 | | | | 0.71 | (e) | | | 0.56 | (e) | | | 0.56 | (e) | | | 4.78 | (e) | | | 7 | |
| Class B | | | 9.86 | | | | 0.20 | | | | — | | | | (0.10 | ) | | | 0.10 | | | | (0.19 | ) | | | — | | | | — | | | | (0.19 | ) | | | (0.09 | ) | | | 9.77 | | | | 1.07 | (f) | | | 6,375 | | | | 1.53 | (e) | | | 1.31 | (e) | | | 1.31 | (e) | | | 4.04 | (e) | | | — | |
| Class C | | | 9.86 | | | | 0.19 | | | | — | | | | (0.08 | ) | | | 0.11 | | | | (0.20 | ) | | | — | | | | — | | | | (0.20 | ) | | | (0.09 | ) | | | 9.77 | | | | 1.08 | (f) | | | 13,138 | | | | 1.48 | (e) | | | 1.31 | (e) | | | 1.31 | (e) | | | 4.01 | (e) | | | — | |
| Class I | | | 9.87 | | | | 0.25 | | | | — | | | | (0.10 | ) | | | 0.15 | | | | (0.24 | ) | | | — | | | | — | | | | (0.24 | ) | | | (0.09 | ) | | | 9.78 | | | | 1.57 | (f) | | | 821 | | | | 0.43 | (e) | | | 0.31 | (e) | | | 0.31 | (e) | | | 5.08 | (e) | | | — | |
| Class R3 | | | 9.87 | | | | 0.21 | | | | — | | | | (0.09 | ) | | | 0.12 | | | | (0.21 | ) | | | — | | | | — | | | | (0.21 | ) | | | (0.09 | ) | | | 9.78 | | | | 1.26 | (f) | | | 16 | | | | 1.19 | (e) | | | 0.95 | (e) | | | 0.95 | (e) | | | 4.41 | (e) | | | — | |
| Class R4 | | | 9.86 | | | | 0.23 | | | | — | | | | (0.09 | ) | | | 0.14 | | | | (0.23 | ) | | | — | | | | — | | | | (0.23 | ) | | | (0.09 | ) | | | 9.77 | | | | 1.39 | (f) | | | 507 | | | | 0.76 | (e) | | | 0.65 | (e) | | | 0.65 | (e) | | | 4.61 | (e) | | | — | |
| Class R5 | | | 9.87 | | | | 0.24 | | | | — | | | | (0.09 | ) | | | 0.15 | | | | (0.24 | ) | | | — | | | | — | | | | (0.24 | ) | | | (0.09 | ) | | | 9.78 | | | | 1.56 | (f) | | | 12 | | | | 0.60 | (e) | | | 0.35 | (e) | | | 0.35 | (e) | | | 5.01 | (e) | | | — | |
| For the Year Ended October 31, 2007 | | | | | | | | | | | | | | | | | | | | | | | | | | | | |
| Class A | | | 9.89 | | | | 0.44 | | | | — | | | | (0.02 | ) | | | 0.42 | | | | (0.44 | ) | | | — | | | | — | | | | (0.44 | ) | | | (0.02 | ) | | | 9.87 | | | | 4.37 | | | | 34,347 | | | | 0.78 | | | | 0.57 | | | | 0.57 | | | | 4.59 | | | | 35 | |
| Class B | | | 9.88 | | | | 0.38 | | | | — | | | | (0.03 | ) | | | 0.35 | | | | (0.37 | ) | | | — | | | | — | | | | (0.37 | ) | | | (0.02 | ) | | | 9.86 | | | | 3.64 | | | | 5,754 | | | | 1.58 | | | | 1.27 | | | | 1.27 | | | | 3.83 | | | | — | |
| Class C | | | 9.88 | | | | 0.38 | | | | — | | | | (0.03 | ) | | | 0.35 | | | | (0.37 | ) | | | — | | | | — | | | | (0.37 | ) | | | (0.02 | ) | | | 9.86 | | | | 3.64 | | | | 8,697 | | | | 1.55 | | | | 1.27 | | | | 1.27 | | | | 3.84 | | | | — | |
| Class I | | | 9.89 | | | | 0.44 | | | | — | | | | 0.01 | | | | 0.45 | | | | (0.47 | ) | | | — | | | | — | | | | (0.47 | ) | | | (0.02 | ) | | | 9.87 | | | | 4.66 | | | | 1,122 | | | | 0.49 | | | | 0.32 | | | | 0.32 | | | | 5.12 | | | | — | |
| From (commencement of operations) December 22, 2006, through October 31, 2007 | | | | | | | | | | | | | | | | | | | | | | | | | | | | |
| Class R3 | | | 9.91 | | | | 0.35 | | | | — | | | | (0.04 | ) | | | 0.31 | | | | (0.35 | ) | | | — | | | | — | | | | (0.35 | ) | | | (0.04 | ) | | | 9.87 | | | | 3.20 | (f) | | | 10 | | | | 1.18 | (e) | | | 0.96 | (e) | | | 0.96 | (e) | | | 4.19 | (e) | | | — | |
| Class R4 | | | 9.91 | | | | 0.38 | | | | — | | | | (0.05 | ) | | | 0.33 | | | | (0.38 | ) | | | — | | | | — | | | | (0.38 | ) | | | (0.05 | ) | | | 9.86 | | | | 3.39 | (f) | | | 96 | | | | 0.84 | (e) | | | 0.66 | (e) | | | 0.66 | (e) | | | 4.56 | (e) | | | — | |
| Class R5 | | | 9.91 | | | | 0.41 | | | | — | | | | (0.05 | ) | | | 0.36 | | | | (0.40 | ) | | | — | | | | — | | | | (0.40 | ) | | | (0.04 | ) | | | 9.87 | | | | 3.72 | (f) | | | 10 | | | | 0.58 | (e) | | | 0.36 | (e) | | | 0.36 | (e) | | | 4.79 | (e) | | | — | |
392
| | | | | | | | | | | | | | | | | | | | | | | | | | | | | | | | | | | | | | | | | | | | | | | | | | | | | | | | | | | | | | | | | | | | | | | | | |
| | | — Selected Per-Share Data (a) — | | — Ratios and Supplemental Data — |
| | | | | | | | | | | | | | | | | | | | | | | | | | | | | Ratio of
| | Ratio of
| | Ratio of
| | | | |
| | | | | | | | | | | | | | | | | | | | | | | | | | | | | Expenses
| | Expenses
| | Expenses
| | | | |
| | | | | | | | | | | | | | | | | | | | | | | | | | | | | to Average
| | to Average
| | to Average
| | | | |
| | | | | | | | | Net
| | | | | | | | | | | | | | | | | | | | Net Assets
| | Net Assets
| | Net Assets
| | | | |
| | | | | | | | | Realized
| | | | | | | | | | | | Net
| | | | | | | | Before
| | After
| | After
| | Ratio of
| | |
| | | | | | | | | and
| | | | | | Distributions
| | | | | | Increase
| | | | | | | | Waivers and
| | Waivers and
| | Waivers and
| | Net
| | |
| | | Net Asset
| | Net
| | Payments
| | Unrealized
| | Total
| | Dividends
| | from
| | | | | | (Decrease)
| | Net Asset
| | | | Net Assets
| | Reimbursements
| | Reimbursements
| | Reimbursements
| | Investment
| | |
| | | Value at
| | Investment
| | from
| | Gain
| | from
| | from Net
| | Realized
| | Distributions
| | | | in Net
| | Value at
| | | | at End of
| | and Including
| | and Including
| | and Excluding
| | Income
| | Portfolio
|
| | | Beginning
| | Income
| | (to)
| | (Loss) on
| | Investment
| | Investment
| | Capital
| | from
| | Total
| | Asset
| | End
| | Total
| | Period
| | Interest
| | Interest
| | Interest
| | to Average
| | Turnover
|
| | | of Period | | (Loss) | | Affiliate | | Investments | | Operations | | Income | | Gains | | Capital | | Distributions | | Value | | of Period | | Return (b) | | (000’s) | | Expense (d) | | Expense (d) | | Expense (d) | | Net Assets | | Rate (c) |
The Hartford Income Allocation Fund (g) — (continued) | | | | | | | | | | | | | | | | | | | | | | | | | | | | |
| For the Year Ended October 31, 2006 | | | | | | | | | | | | | | | | | | | | | | | | | | | | |
| Class A | | $ | 9.89 | | | $ | 0.42 | | | $ | — | | | $ | 0.03 | | | $ | 0.45 | | | $ | (0.43 | ) | | $ | (0.02 | ) | | $ | — | | | $ | (0.45 | ) | | $ | — | | | $ | 9.89 | | | | 4.64 | % | | $ | 25,383 | | | | 0.80 | % | | | 0.61 | % | | | 0.61 | % | | | 4.32 | % | | | 38 | % |
| Class B | | | 9.88 | | | | 0.35 | | | | — | | | | 0.03 | | | | 0.38 | | | | (0.36 | ) | | | (0.02 | ) | | | — | | | | (0.38 | ) | | | — | | | | 9.88 | | | | 3.91 | | | | 5,516 | | | | 1.59 | | | | 1.31 | | | | 1.31 | | | | 3.56 | | | | — | |
| Class C | | | 9.88 | | | | 0.35 | | | | — | | | | 0.03 | | | | 0.38 | | | | (0.36 | ) | | | (0.02 | ) | | | — | | | | (0.38 | ) | | | — | | | | 9.88 | | | | 3.91 | | | | 8,042 | | | | 1.53 | | | | 1.31 | | | | 1.31 | | | | 3.53 | | | | — | |
| From (commencement of operations) August 31, 2006, through October 31, 2006 | | | | | | | | | | | | | | | | | | | | | | | | | | | | |
| Class I | | | 9.84 | | | | 0.06 | | | | — | | | | 0.05 | | | | 0.11 | | | | (0.06 | ) | | | — | | | | — | | | | (0.06 | ) | | | 0.05 | | | | 9.89 | | | | 1.17 | (f) | | | 10 | | | | 0.90 | (e) | | | 0.37 | (e) | | | 0.37 | (e) | | | 4.27 | (e) | | | — | |
| For the Year Ended October 31, 2005 | | | | | | | | | | | | | | | | | | | | | | | | | | | | |
| Class A | | | 10.15 | | | | 0.36 | | | | — | | | | (0.26 | ) | | | 0.10 | | | | (0.36 | ) | | | — | | | | — | | | | (0.36 | ) | | | (0.26 | ) | | | 9.89 | | | | 1.01 | | | | 19,445 | | | | 0.76 | | | | 0.56 | | | | 0.56 | | | | 3.75 | | | | 30 | |
| Class B | | | 10.14 | | | | 0.29 | | | | — | | | | (0.26 | ) | | | 0.03 | | | | (0.29 | ) | | | — | | | | — | | | | (0.29 | ) | | | (0.26 | ) | | | 9.88 | | | | 0.29 | | | | 4,778 | | | | 1.56 | | | | 1.26 | | | | 1.26 | | | | 3.09 | | | | — | |
| Class C | | | 10.14 | | | | 0.30 | | | | — | | | | (0.27 | ) | | | 0.03 | | | | (0.29 | ) | | | — | | | | — | | | | (0.29 | ) | | | (0.26 | ) | | | 9.88 | | | | 0.30 | | | | 7,711 | | | | 1.51 | | | | 1.26 | | | | 1.26 | | | | 3.04 | | | | — | |
| From (commencement of operations) May 28, 2004, through October 31, 2004 | | | | | | | | | | | | | | | | | | | | | | | | | | | | |
| Class A | | | 10.00 | | | | 0.09 | | | | — | | | | 0.15 | | | | 0.24 | | | | (0.09 | ) | | | — | | | | — | | | | (0.09 | ) | | | 0.15 | | | | 10.15 | | | | 2.42 | (f) | | | 10,539 | | | | 0.73 | (e) | | | 0.56 | (e) | | | 0.56 | (e) | | | 3.21 | (e) | | | 3 | |
| Class B | | | 10.00 | | | | 0.07 | | | | — | | | | 0.14 | | | | 0.21 | | | | (0.07 | ) | | | — | | | | — | | | | (0.07 | ) | | | 0.14 | | | | 10.14 | | | | 2.08 | (f) | | | 1,690 | | | | 1.63 | (e) | | | 1.26 | (e) | | | 1.26 | (e) | | | 2.56 | (e) | | | — | |
| Class C | | | 10.00 | | | | 0.07 | | | | — | | | | 0.14 | | | | 0.21 | | | | (0.07 | ) | | | — | | | | — | | | | (0.07 | ) | | | 0.14 | | | | 10.14 | | | | 2.08 | (f) | | | 4,880 | | | | 1.48 | (e) | | | 1.26 | (e) | | | 1.26 | (e) | | | 2.59 | (e) | | | — | |
The Hartford Income Fund | | | | | | | | | | | | | | | | | | | | | | | | | | | | |
| For the Six-Month Period Ended April 30, 2008 (Unaudited) | | | | | | | | | | | | | | | | | | | | | | | | | | | | |
| Class A | | | 10.14 | | | | 0.27 | | | | — | | | | (0.27 | ) | | | (0.00 | ) | | | (0.27 | ) | | | — | | | | — | | | | (0.27 | ) | | | (0.27 | ) | | | 9.87 | | | | (0.04 | )(f) | | | 108,449 | | | | 0.98 | (e) | | | 0.95 | (e) | | | 0.95 | (e) | | | 5.53 | (e) | | | 73 | |
| Class B | | | 10.14 | | | | 0.24 | | | | — | | | | (0.28 | ) | | | (0.04 | ) | | | (0.23 | ) | | | — | | | | — | | | | (0.23 | ) | | | (0.27 | ) | | | 9.87 | | | | (0.41 | )(f) | | | 9,889 | | | | 1.88 | (e) | | | 1.70 | (e) | | | 1.70 | (e) | | | 4.78 | (e) | | | — | |
| Class C | | | 10.16 | | | | 0.24 | | | | — | | | | (0.28 | ) | | | (0.04 | ) | | | (0.23 | ) | | | — | | | | — | | | | (0.23 | ) | | | (0.27 | ) | | | 9.89 | | | | (0.41 | )(f) | | | 16,378 | | | | 1.74 | (e) | | | 1.70 | (e) | | | 1.70 | (e) | | | 4.77 | (e) | | | — | |
| Class Y | | | 10.12 | | | | 0.29 | | | | — | | | | (0.28 | ) | | | 0.01 | | | | (0.28 | ) | | | — | | | | — | | | | (0.28 | ) | | | (0.27 | ) | | | 9.85 | | | | 0.12 | (f) | | | 209,913 | | | | 0.62 | (e) | | | 0.62 | (e) | | | 0.62 | (e) | | | 5.86 | (e) | | | — | |
| For the Year Ended October 31, 2007 | | | | | | | | | | | | | | | | | | | | | | | | | | | | |
| Class A | | | 10.33 | | | | 0.57 | | | | — | | | | (0.19 | ) | | | 0.38 | | | | (0.57 | ) | | | — | | | | — | | | | (0.57 | ) | | | (0.19 | ) | | | 10.14 | | | | 3.77 | | | | 98,047 | | | | 1.08 | | | | 0.95 | | | | 0.95 | | | | 5.69 | | | | 147 | |
| Class B | | | 10.33 | | | | 0.50 | | | | — | | | | (0.20 | ) | | | 0.30 | | | | (0.49 | ) | | | — | | | | — | | | | (0.49 | ) | | | (0.19 | ) | | | 10.14 | | | | 3.00 | | | | 9,837 | | | | 1.95 | | | | 1.70 | | | | 1.70 | | | | 4.89 | | | | — | |
| Class C | | | 10.35 | | | | 0.50 | | | | — | | | | (0.19 | ) | | | 0.31 | | | | (0.50 | ) | | | — | | | | — | | | | (0.50 | ) | | | (0.19 | ) | | | 10.16 | | | | 3.01 | | | | 14,263 | | | | 1.82 | | | | 1.70 | | | | 1.70 | | | | 4.89 | | | | — | |
| Class Y | | | 10.32 | | | | 0.60 | | | | — | | | | (0.20 | ) | | | 0.40 | | | | (0.60 | ) | | | — | | | | — | | | | (0.60 | ) | | | (0.20 | ) | | | 10.12 | | | | 3.97 | | | | 213,417 | | | | 0.68 | | | | 0.68 | | | | 0.68 | | | | 5.95 | | | | — | |
| For the Year Ended October 31, 2006 | | | | | | | | | | | | | | | | | | | | | | | | | | | | |
| Class A | | | 10.24 | | | | 0.54 | | | | — | | | | 0.08 | | | | 0.62 | | | | (0.53 | ) | | | — | | | | — | | | | (0.53 | ) | | | 0.09 | | | | 10.33 | | | | 6.24 | | | | 37,168 | | | | 1.21 | | | | 0.95 | | | | 0.95 | | | | 5.35 | | | | 175 | |
| Class B | | | 10.24 | | | | 0.46 | | | | — | | | | 0.08 | | | | 0.54 | | | | (0.45 | ) | | | — | | | | — | | | | (0.45 | ) | | | 0.09 | | | | 10.33 | | | | 5.45 | | | | 7,224 | | | | 2.06 | | | | 1.70 | | | | 1.70 | | | | 4.60 | | | | — | |
| Class C | | | 10.26 | | | | 0.46 | | | | — | | | | 0.08 | | | | 0.54 | | | | (0.45 | ) | | | — | | | | — | | | | (0.45 | ) | | | 0.09 | | | | 10.35 | | | | 5.44 | | | | 8,101 | | | | 1.96 | | | | 1.70 | | | | 1.70 | | | | 4.61 | | | | — | |
| Class Y | | | 10.24 | | | | 0.56 | | | | — | | | | 0.08 | | | | 0.64 | | | | (0.56 | ) | | | — | | | | — | | | | (0.56 | ) | | | 0.08 | | | | 10.32 | | | | 6.41 | | | | 60,690 | | | | 0.78 | | | | 0.70 | | | | 0.70 | | | | 5.63 | | | | — | |
| For the Year Ended October 31, 2005 | | | | | | | | | | | | | | | | | | | | | | | | | | | | |
| Class A | | | 10.72 | | | | 0.51 | | | | — | | | | (0.44 | ) | | | 0.07 | | | | (0.51 | ) | | | (0.04 | ) | | | — | | | | (0.55 | ) | | | (0.48 | ) | | | 10.24 | | | | 0.70 | | | | 28,942 | | | | 1.20 | | | | 0.95 | | | | 0.95 | | | | 4.80 | | | | 188 | |
| Class B | | | 10.72 | | | | 0.43 | | | | — | | | | (0.43 | ) | | | — | | | | (0.44 | ) | | | (0.04 | ) | | | — | | | | (0.48 | ) | | | (0.48 | ) | | | 10.24 | | | | (0.04 | ) | | | 5,973 | | | | 2.06 | | | | 1.70 | | | | 1.70 | | | | 4.05 | | | | — | |
| Class C | | | 10.74 | | | | 0.43 | | | | — | | | | (0.43 | ) | | | — | | | | (0.44 | ) | | | (0.04 | ) | | | — | | | | (0.48 | ) | | | (0.48 | ) | | | 10.26 | | | | (0.03 | ) | | | 5,142 | | | | 1.96 | | | | 1.70 | | | | 1.70 | | | | 4.05 | | | | — | |
| Class Y | | | 10.72 | | | | 0.52 | | | | — | | | | (0.42 | ) | | | 0.10 | | | | (0.54 | ) | | | (0.04 | ) | | | — | | | | (0.58 | ) | | | (0.48 | ) | | | 10.24 | | | | 0.98 | | | | 16,431 | | | | 0.79 | | | | 0.70 | | | | 0.70 | | | | 5.16 | | | | — | |
| For the Year Ended October 31, 2004 | | | | | | | | | | | | | | | | | | | | | | | | | | | | |
| Class A | | | 10.53 | | | | 0.48 | | | | — | | | | 0.22 | | | | 0.70 | | | | (0.51 | ) | | | — | | | | — | | | | (0.51 | ) | | | 0.19 | | | | 10.72 | | | | 6.85 | | | | 29,580 | | | | 1.14 | | | | 1.00 | | | | 1.00 | | | | 4.60 | | | | 167 | |
| Class B | | | 10.53 | | | | 0.42 | | | | — | | | | 0.21 | | | | 0.63 | | | | (0.44 | ) | | | — | | | | — | | | | (0.44 | ) | | | 0.19 | | | | 10.72 | | | | 6.10 | | | | 5,541 | | | | 1.95 | | | | 1.70 | | | | 1.70 | | | | 3.90 | | | | — | |
| Class C | | | 10.55 | | | | 0.41 | | | | — | | | | 0.22 | | | | 0.63 | | | | (0.44 | ) | | | — | | | | — | | | | (0.44 | ) | | | 0.19 | | | | 10.74 | | | | 6.09 | | | | 5,562 | | | | 1.88 | | | | 1.70 | | | | 1.70 | | | | 3.90 | | | | — | |
| From inception November 28, 2003, through October 31, 2004 | | | | | | | | | | | | | | | | | | | | | | | | | | | | |
| Class Y | | | 10.54 | | | | 0.48 | | | | — | | | | 0.20 | | | | 0.68 | | | | (0.50 | ) | | | — | | | | — | | | | (0.50 | ) | | | 0.18 | | | | 10.72 | | | | 6.57 | (f) | | | 10 | | | | 0.73 | (e) | | | 0.70 | (e) | | | 0.70 | (e) | | | 4.89 | (e) | | | — | |
| From inception October 31, 2002, through October 31, 2003 | | | | | | | | | | | | | | | | | | | | | | | | | | | | |
| Class A | | | 10.00 | | | | 0.52 | | | | — | | | | 0.54 | | | | 1.06 | | | | (0.53 | ) | | | — | | | | — | | | | (0.53 | ) | | | 0.53 | | | | 10.53 | | | | 10.79 | (f) | | | 15,836 | | | | 1.54 | (e) | | | 1.00 | (e) | | | 1.00 | (e) | | | 5.06 | (e) | | | 124 | |
| Class B | | | 10.00 | | | | 0.44 | | | | — | | | | 0.54 | | | | 0.98 | | | | (0.45 | ) | | | — | | | | — | | | | (0.45 | ) | | | 0.53 | | | | 10.53 | | | | 10.01 | (f) | | | 4,705 | | | | 2.31 | (e) | | | 1.70 | (e) | | | 1.70 | (e) | | | 4.31 | (e) | | | — | |
| Class C | | | 10.00 | | | | 0.44 | | | | — | | | | 0.56 | | | | 1.00 | | | | (0.45 | ) | | | — | | | | — | | | | (0.45 | ) | | | 0.55 | | | | 10.55 | | | | 10.22 | (f) | | | 5,050 | | | | 2.17 | (e) | | | 1.70 | (e) | | | 1.70 | (e) | | | 4.28 | (e) | | | — | |
The Hartford Inflation Plus Fund | | | | | | | | | | | | | | | | | | | | | | | | | | | | |
| For the Six-Month Period Ended April 30, 2008 (Unaudited) | | | | | | | | | | | | | | | | | | | | | | | | | | | | |
| Class A | | | 10.66 | | | | 0.22 | | | | — | | | | 0.55 | | | | 0.77 | | | | (0.24 | ) | | | — | | | | — | | | | (0.24 | ) | | | 0.53 | | | | 11.19 | | | | 7.26 | (f) | | | 277,495 | | | | 1.01 | (e) | | | 0.91 | (e) | | | 0.85 | (e) | | | 4.03 | (e) | | | 281 | |
| Class B | | | 10.64 | | | | 0.18 | | | | — | | | | 0.55 | | | | 0.73 | | | | (0.20 | ) | | | — | | | | — | | | | (0.20 | ) | | | 0.53 | | | | 11.17 | | | | 6.88 | (f) | | | 77,996 | | | | 1.80 | (e) | | | 1.66 | (e) | | | 1.60 | (e) | | | 3.29 | (e) | | | — | |
| Class C | | | 10.63 | | | | 0.18 | | | | — | | | | 0.55 | | | | 0.73 | | | | (0.20 | ) | | | — | | | | — | | | | (0.20 | ) | | | 0.53 | | | | 11.16 | | | | 6.89 | (f) | | | 226,581 | | | | 1.75 | (e) | | | 1.66 | (e) | | | 1.60 | (e) | | | 3.27 | (e) | | | — | |
| Class I | | | 10.68 | | | | 0.24 | | | | — | | | | 0.56 | | | | 0.80 | | | | (0.26 | ) | | | — | | | | — | | | | (0.26 | ) | | | 0.54 | | | | 11.22 | | | | 7.47 | (f) | | | 13,146 | | | | 0.73 | (e) | | | 0.66 | (e) | | | 0.61 | (e) | | | 4.24 | (e) | | | — | |
| Class R3 | | | 10.67 | | | | 0.19 | | | | — | | | | 0.56 | | | | 0.75 | | | | (0.22 | ) | | | — | | | | — | | | | (0.22 | ) | | | 0.53 | | | | 11.20 | | | | 7.04 | (f) | | | 97 | | | | 1.41 | (e) | | | 1.31 | (e) | | | 1.26 | (e) | | | 3.72 | (e) | | | — | |
| Class R4 | | | 10.67 | | | | 0.22 | | | | — | | | | 0.54 | | | | 0.76 | | | | (0.23 | ) | | | — | | | | — | | | | (0.23 | ) | | | 0.53 | | | | 11.20 | | | | 7.18 | (f) | | | 11 | | | | 1.07 | (e) | | | 1.06 | (e) | | | 1.00 | (e) | | | 3.89 | (e) | | | — | |
| Class R5 | | | 10.68 | | | | 0.23 | | | | — | | | | 0.55 | | | | 0.78 | | | | (0.25 | ) | | | — | | | | — | | | | (0.25 | ) | | | 0.53 | | | | 11.21 | | | | 7.31 | (f) | | | 11 | | | | 0.76 | (e) | | | 0.76 | (e) | | | 0.70 | (e) | | | 4.19 | (e) | | | — | |
| Class Y | | | 10.69 | | | | 0.24 | | | | — | | | | 0.55 | | | | 0.79 | | | | (0.26 | ) | | | — | | | | — | | | | (0.26 | ) | | | 0.53 | | | | 11.22 | | | | 7.39 | (f) | | | 194,833 | | | | 0.66 | (e) | | | 0.66 | (e) | | | 0.60 | (e) | | | 4.28 | (e) | | | — | |
393
The Hartford Mutual Funds, Inc. and The Hartford Mutual Funds II, Inc.
Financial Highlights — (continued)
| | | | | | | | | | | | | | | | | | | | | | | | | | | | | | | | | | | | | | | | | | | | | | | | | | | | | | | | | | | | | | | | | | | | | | | | | |
| | | — Selected Per-Share Data (a) — | | — Ratios and Supplemental Data — |
| | | | | | | | | | | | | | | | | | | | | | | | | | | | | Ratio of
| | Ratio of
| | Ratio of
| | | | |
| | | | | | | | | | | | | | | | | | | | | | | | | | | | | Expenses
| | Expenses
| | Expenses
| | | | |
| | | | | | | | | | | | | | | | | | | | | | | | | | | | | to Average
| | to Average
| | to Average
| | | | |
| | | | | | | | | Net
| | | | | | | | | | | | | | | | | | | | Net Assets
| | Net Assets
| | Net Assets
| | | | |
| | | | | | | | | Realized
| | | | | | | | | | | | Net
| | | | | | | | Before
| | After
| | After
| | Ratio of
| | |
| | | | | | | | | and
| | | | | | Distributions
| | | | | | Increase
| | | | | | | | Waivers and
| | Waivers and
| | Waivers and
| | Net
| | |
| | | Net Asset
| | Net
| | Payments
| | Unrealized
| | Total
| | Dividends
| | from
| | | | | | (Decrease)
| | Net Asset
| | | | Net Assets
| | Reimbursements
| | Reimbursements
| | Reimbursements
| | Investment
| | |
| | | Value at
| | Investment
| | from
| | Gain
| | from
| | from Net
| | Realized
| | Distributions
| | | | in Net
| | Value at
| | | | at End of
| | and Including
| | and Including
| | and Excluding
| | Income
| | Portfolio
|
| | | Beginning
| | Income
| | (to)
| | (Loss) on
| | Investment
| | Investment
| | Capital
| | from
| | Total
| | Asset
| | End
| | Total
| | Period
| | Interest
| | Interest
| | Interest
| | to Average
| | Turnover
|
| | | of Period | | (Loss) | | Affiliate | | Investments | | Operations | | Income | | Gains | | Capital | | Distributions | | Value | | of Period | | Return (b) | | (000’s) | | Expense (d) | | Expense (d) | | Expense (d) | | Net Assets | | Rate (c) |
The Hartford Inflation Plus Fund — (continued) | | | | | | | | | | | | | | | | | | | | | | | | | | | | |
| For the Year Ended October 31, 2007 | | | | | | | | | | | | | | | | | | | | | | | | | | | | |
| Class A | | $ | 10.44 | | | $ | 0.39 | | | $ | — | | | $ | 0.21 | | | $ | 0.60 | | | $ | (0.38 | ) | | $ | — | | | $ | — | | | $ | (0.38 | ) | | $ | 0.22 | | | $ | 10.66 | | | | 5.86 | % | | $ | 184,558 | | | | 1.22 | % | | | 1.03 | % | | | 0.85 | % | | | 3.09 | % | | | 608 | % |
| Class B | | | 10.45 | | | | 0.29 | | | | — | | | | 0.23 | | | | 0.52 | | | | (0.33 | ) | | | — | | | | — | | | | (0.33 | ) | | | 0.19 | | | | 10.64 | | | | 5.05 | | | | 68,593 | | | | 2.01 | | | | 1.78 | | | | 1.60 | | | | 2.51 | | | | — | |
| Class C | | | 10.44 | | | | 0.29 | | | | — | | | | 0.23 | | | | 0.52 | | | | (0.33 | ) | | | — | | | | — | | | | (0.33 | ) | | | 0.19 | | | | 10.63 | | | | 5.05 | | | | 159,067 | | | | 1.97 | | | | 1.78 | | | | 1.60 | | | | 2.31 | | | | — | |
| Class I | | | 10.44 | | | | 0.31 | | | | — | | | | 0.32 | | | | 0.63 | | | | (0.39 | ) | | | — | | | | — | | | | (0.39 | ) | | | 0.24 | | | | 10.68 | | | | 6.22 | | | | 3,501 | | | | 0.71 | | | | 0.61 | | | | 0.58 | | | | 2.85 | | | | — | |
| Class Y | | | 10.45 | | | | 0.38 | | | | — | | | | 0.26 | | | | 0.64 | | | | (0.40 | ) | | | — | | | | — | | | | (0.40 | ) | | | 0.24 | | | | 10.69 | | | | 6.23 | | | | 164,155 | | | | 0.82 | | | | 0.72 | | | | 0.56 | | | | 3.71 | | | | — | |
| From (commencement of operations) December 22, 2006, through October 31, 2007 | | | | | | | | | | | | | | | | | | | | | | | | | | | | |
| Class R3 | | | 10.41 | | | | 0.39 | | | | — | | | | 0.22 | | | | 0.61 | | | | (0.35 | ) | | | — | | | | — | | | | (0.35 | ) | | | 0.26 | | | | 10.67 | | | | 5.98 | (f) | | | 10 | | | | 1.59 | (e) | | | 1.40 | (e) | | | 1.23 | (e) | | | 4.36 | (e) | | | — | |
| Class R4 | | | 10.41 | | | | 0.41 | | | | — | | | | 0.22 | | | | 0.63 | | | | (0.37 | ) | | | — | | | | — | | | | (0.37 | ) | | | 0.26 | | | | 10.67 | | | | 6.15 | (f) | | | 10 | | | | 1.28 | (e) | | | 1.15 | (e) | | | 0.98 | (e) | | | 4.61 | (e) | | | — | |
| Class R5 | | | 10.41 | | | | 0.43 | | | | — | | | | 0.22 | | | | 0.65 | | | | (0.38 | ) | | | — | | | | — | | | | (0.38 | ) | | | 0.27 | | | | 10.68 | | | | 6.42 | (f) | | | 11 | | | | 0.99 | (e) | | | 0.89 | (e) | | | 0.72 | (e) | | | 4.86 | (e) | | | — | |
| For the Year Ended October 31, 2006 | | | | | | | | | | | | | | | | | | | | | | | | | | | | |
| Class A | | | 10.67 | | | | 0.49 | | | | — | | | | (0.26 | ) | | | 0.23 | | | | (0.43 | ) | | | (0.03 | ) | | | — | | | | (0.46 | ) | | | (0.23 | ) | | | 10.44 | | | | 2.29 | | | | 282,362 | | | | 1.02 | | | | 0.95 | | | | 0.95 | | | | 4.50 | | | | 193 | |
| Class B | | | 10.68 | | | | 0.40 | | | | — | | | | (0.25 | ) | | | 0.15 | | | | (0.35 | ) | | | (0.03 | ) | | | — | | | | (0.38 | ) | | | (0.23 | ) | | | 10.45 | | | | 1.51 | | | | 92,340 | | | | 1.82 | | | | 1.70 | | | | 1.70 | | | | 3.76 | | | | — | |
| Class C | | | 10.67 | | | | 0.40 | | | | — | | | | (0.25 | ) | | | 0.15 | | | | (0.35 | ) | | | (0.03 | ) | | | — | | | | (0.38 | ) | | | (0.23 | ) | | | 10.44 | | | | 1.51 | | | | 247,091 | | | | 1.78 | | | | 1.70 | | | | 1.70 | | | | 3.72 | | | | — | |
| Class Y | | | 10.68 | | | | 0.51 | | | | — | | | | (0.25 | ) | | | 0.26 | | | | (0.46 | ) | | | (0.03 | ) | | | — | | | | (0.49 | ) | | | (0.23 | ) | | | 10.45 | | | | 2.58 | | | | 140,796 | | | | 0.68 | | | | 0.68 | | | | 0.68 | | | | 5.05 | | | | — | |
| From (commencement of operations) August 31, 2006, through October 31, 2006 | | | | | | | | | | | | | | | | | | | | | | | | | | | | |
| Class I | | | 10.48 | | | | 0.05 | | | | — | | | | (0.05 | ) | | | (0.00 | ) | | | (0.04 | ) | | | — | | | | — | | | | (0.04 | ) | | | (0.04 | ) | | | 10.44 | | | | 0.04 | (f) | | | 18 | | | | 0.98 | (e) | | | 0.70 | (e) | | | 0.70 | (e) | | | 4.43 | (e) | | | — | |
| For the Year Ended October 31, 2005 | | | | | | | | | | | | | | | | | | | | | | | | | | | | |
| Class A | | | 10.95 | | | | 0.41 | | | | — | | | | (0.18 | ) | | | 0.23 | | | | (0.42 | ) | | | (0.09 | ) | | | — | | | | (0.51 | ) | | | (0.28 | ) | | | 10.67 | | | | 2.10 | | | | 414,778 | | | | 1.00 | | | | 0.95 | | | | 0.95 | | | | 3.88 | | | | 71 | |
| Class B | | | 10.96 | | | | 0.33 | | | | — | | | | (0.18 | ) | | | 0.15 | | | | (0.34 | ) | | | (0.09 | ) | | | — | | | | (0.43 | ) | | | (0.28 | ) | | | 10.68 | | | | 1.33 | | | | 119,302 | | | | 1.81 | | | | 1.70 | | | | 1.70 | | | | 3.09 | | | | — | |
| Class C | | | 10.96 | | | | 0.33 | | | | — | | | | (0.19 | ) | | | 0.14 | | | | (0.34 | ) | | | (0.09 | ) | | | — | | | | (0.43 | ) | | | (0.29 | ) | | | 10.67 | | | | 1.24 | | | | 373,750 | | | | 1.76 | | | | 1.70 | | | | 1.70 | | | | 3.12 | | | | — | |
| Class Y | | | 10.97 | | | | 0.47 | | | | — | | | | (0.22 | ) | | | 0.25 | | | | (0.45 | ) | | | (0.09 | ) | | | — | | | | (0.54 | ) | | | (0.29 | ) | | | 10.68 | | | | 2.29 | | | | 95,947 | | | | 0.68 | | | | 0.68 | | | | 0.68 | | | | 4.42 | | | | — | |
| For the Year Ended October 31, 2004 | | | | | | | | | | | | | | | | | | | | | | | | | | | | |
| Class A | | | 10.63 | | | | 0.30 | | | | — | | | | 0.37 | | | | 0.67 | | | | (0.31 | ) | | | (0.04 | ) | | | — | | | | (0.35 | ) | | | 0.32 | | | | 10.95 | | | | 6.39 | | | | 313,961 | | | | 1.04 | | | | 1.00 | | | | 1.00 | | | | 3.04 | | | | 81 | |
| Class B | | | 10.64 | | | | 0.22 | | | | — | | | | 0.37 | | | | 0.59 | | | | (0.23 | ) | | | (0.04 | ) | | | — | | | | (0.27 | ) | | | 0.32 | | | | 10.96 | | | | 5.65 | | | | 107,964 | | | | 1.81 | | | | 1.70 | | | | 1.70 | | | | 2.21 | | | | — | |
| Class C | | | 10.63 | | | | 0.23 | | | | — | | | | 0.37 | | | | 0.60 | | | | (0.23 | ) | | | (0.04 | ) | | | — | | | | (0.27 | ) | | | 0.33 | | | | 10.96 | | | | 5.74 | | | | 319,990 | | | | 1.76 | | | | 1.70 | | | | 1.70 | | | | 2.33 | | | | — | |
| From inception November 28, 2003, through October 31, 2004 | | | | | | | | | | | | �� | | | | | | | | | | | | | | | | |
| Class Y | | | 10.57 | | | | 0.28 | | | | — | | | | 0.44 | | | | 0.72 | | | | (0.32 | ) | | | — | | | | — | | | | (0.32 | ) | | | 0.40 | | | | 10.97 | | | | 6.89 | (f) | | | 23,045 | | | | 0.65 | (e) | | | 0.65 | (e) | | | 0.65 | (e) | | | 1.55 | (e) | | | — | |
| From inception October 31, 2002, through October 31, 2003 | | | | | | | | | | | | | | | | | | | | | | | | | | | | |
| Class A | | | 10.00 | | | | 0.27 | | | | — | | | | 0.62 | | | | 0.89 | | | | (0.26 | ) | | | — | | | | — | | | | (0.26 | ) | | | 0.63 | | | | 10.63 | | | | 9.02 | (f) | | | 142,992 | | | | 1.34 | (e) | | | 1.00 | (e) | | | 1.00 | (e) | | | 2.63 | (e) | | | 23 | |
| Class B | | | 10.00 | | | | 0.21 | | | | — | | | | 0.63 | | | | 0.84 | | | | (0.20 | ) | | | — | | | | — | | | | (0.20 | ) | | | 0.64 | | | | 10.64 | | | | 8.41 | (f) | | | 67,986 | | | | 2.09 | (e) | | | 1.70 | (e) | | | 1.70 | (e) | | | 1.98 | (e) | | | — | |
| Class C | | | 10.00 | | | | 0.20 | | | | — | | | | 0.63 | | | | 0.83 | | | | (0.20 | ) | | | — | | | | — | | | | (0.20 | ) | | | 0.63 | | | | 10.63 | | | | 8.31 | (f) | | | 160,253 | | | | 1.95 | (e) | | | 1.70 | (e) | | | 1.70 | (e) | | | 1.97 | (e) | | | — | |
The Hartford International Growth Fund | | | | | | | | | | | | | | | | | | | | | | | | | | | | |
| For the Six-Month Period Ended April 30, 2008 (Unaudited) | | | | | | | | | | | | | | | | | | | | | | | | | | | | |
| Class A | | | 18.93 | | | | — | | | | — | | | | (2.91 | ) | | | (2.91 | ) | | | — | | | | (2.41 | ) | | | — | | | | (2.41 | ) | | | (5.32 | ) | | | 13.61 | | | | (17.11 | )(f) | | | 374,895 | | | | 1.45 | (e) | | | 1.45 | (e) | | | 1.45 | (e) | | | 0.05 | (e) | | | 150 | |
| Class B | | | 18.08 | | | | (0.05 | ) | | | — | | | | (2.77 | ) | | | (2.82 | ) | | | — | | | | (2.41 | ) | | | — | | | | (2.41 | ) | | | (5.23 | ) | | | 12.85 | | | | (17.47 | )(f) | | | 42,341 | | | | 2.34 | (e) | | | 2.28 | (e) | | | 2.28 | (e) | | | (0.78 | )(e) | | | — | |
| Class C | | | 18.10 | | | | (0.05 | ) | | | — | | | | (2.77 | ) | | | (2.82 | ) | | | — | | | | (2.41 | ) | | | — | | | | (2.41 | ) | | | (5.23 | ) | | | 12.87 | | | | (17.44 | )(f) | | | 55,340 | | | | 2.18 | (e) | | | 2.18 | (e) | | | 2.18 | (e) | | | (0.69 | )(e) | | | — | |
| Class I | | | 18.79 | | | | 0.03 | | | | — | | | | (2.89 | ) | | | (2.86 | ) | | | — | | | | (2.41 | ) | | | — | | | | (2.41 | ) | | | (5.27 | ) | | | 13.52 | | | | (16.95 | )(f) | | | 2,827 | | | | 1.08 | (e) | | | 1.08 | (e) | | | 1.08 | (e) | | | 0.41 | (e) | | | — | |
| Class R3 | | | 19.24 | | | | 0.01 | | | | — | | | | (3.00 | ) | | | (2.99 | ) | | | — | | | | (2.41 | ) | | | — | | | | (2.41 | ) | | | (5.40 | ) | | | 13.84 | | | | (17.27 | )(f) | | | 171 | | | | 1.87 | (e) | | | 1.87 | (e) | | | 1.87 | (e) | | | 0.31 | (e) | | | — | |
| Class R4 | | | 19.30 | | | | 0.01 | | | | — | | | | (2.99 | ) | | | (2.98 | ) | | | — | | | | (2.41 | ) | | | — | | | | (2.41 | ) | | | (5.39 | ) | | | 13.91 | | | | (17.15 | )(f) | | | 31 | | | | 1.59 | (e) | | | 1.55 | (e) | | | 1.55 | (e) | | | 0.34 | (e) | | | — | |
| Class R5 | | | 19.35 | | | | 0.03 | | | | — | | | | (2.99 | ) | | | (2.96 | ) | | | — | | | | (2.41 | ) | | | — | | | | (2.41 | ) | | | (5.37 | ) | | | 13.98 | | | | (16.98 | )(f) | | | 11 | | | | 1.07 | (e) | | | 1.07 | (e) | | | 1.07 | (e) | | | 0.43 | (e) | | | — | |
| Class Y | | | 19.38 | | | | 0.04 | | | | — | | | | (3.00 | ) | | | (2.96 | ) | | | — | | | | (2.41 | ) | | | — | | | | (2.41 | ) | | | (5.37 | ) | | | 14.01 | | | | (16.95 | )(f) | | | 85,674 | | | | 0.98 | (e) | | | 0.98 | (e) | | | 0.98 | (e) | | | 0.63 | (e) | | | — | |
| For the Year Ended October 31, 2007 (h) | | | | | | | | | | | | | | | | | | | | | | | | | | | | |
| Class A | | | 14.93 | | | | 0.02 | | | | — | | | | 5.35 | | | | 5.37 | | | | (0.01 | ) | | | (1.36 | ) | | | — | | | | (1.37 | ) | | | 4.00 | | | | 18.93 | | | | 39.31 | (i) | | | 431,193 | | | | 1.49 | | | | 1.49 | | | | 1.49 | | | | 0.14 | | | | 242 | |
| Class B | | | 14.42 | | | | (0.11 | ) | | | — | | | | 5.13 | | | | 5.02 | | | | — | | | | (1.36 | ) | | | — | | | | (1.36 | ) | | | 3.66 | | | | 18.08 | | | | 38.11 | (i) | | | 51,577 | | | | 2.36 | | | | 2.33 | | | | 2.33 | | | | (0.73 | ) | | | — | |
| Class C | | | 14.42 | | | | (0.09 | ) | | | — | | | | 5.13 | | | | 5.04 | | | | — | | | | (1.36 | ) | | | — | | | | (1.36 | ) | | | 3.68 | | | | 18.10 | | | | 38.27 | (i) | | | 65,982 | | | | 2.20 | | | | 2.20 | | | | 2.20 | | | | (0.61 | ) | | | — | |
| Class I | | | 14.94 | | | | (0.01 | ) | | | — | | | | 5.40 | | | | 5.39 | | | | (0.18 | ) | | | (1.36 | ) | | | — | | | | (1.54 | ) | | | 3.85 | | | | 18.79 | | | | 39.73 | (i) | | | 3,543 | | | | 1.12 | | | | 1.12 | | | | 1.12 | | | | (0.06 | ) | | | — | |
| Class Y | | | 15.17 | | | | 0.02 | | | | — | | | | 5.55 | | | | 5.57 | | | | — | | | | (1.36 | ) | | | — | | | | (1.36 | ) | | | 4.21 | | | | 19.38 | | | | 40.01 | (i) | | | 76,429 | | | | 1.03 | | | | 1.03 | | | | 1.03 | | | | 0.17 | | | | — | |
| From (commencement of operations) December 22, 2006, through October 31, 2007 (h) | | | | | | | | | | | | | | | | | | | | | | | | | | | | |
| Class R3 | | | 14.79 | | | | (0.02 | ) | | | — | | | | 4.47 | | | | 4.45 | | | | — | | | | — | | | | — | | | | — | | | | 4.45 | | | | 19.24 | | | | 30.09 | (f) | | | 15 | | | | 1.83 | (e) | | | 1.83 | (e) | | | 1.83 | (e) | | | (0.15 | )(e) | | | — | |
| Class R4 | | | 14.79 | | | | 0.03 | | | | — | | | | 4.48 | | | | 4.51 | | | | — | | | | — | | | | — | | | | — | | | | 4.51 | | | | 19.30 | | | | 30.49 | (f) | | | 13 | | | | 1.46 | (e) | | | 1.46 | (e) | | | 1.46 | (e) | | | 0.25 | (e) | | | — | |
| Class R5 | | | 14.79 | | | | 0.07 | | | | — | | | | 4.49 | | | | 4.56 | | | | — | | | | — | | | | — | | | | — | | | | 4.56 | | | | 19.35 | | | | 30.83 | (f) | | | 13 | | | | 1.17 | (e) | | | 1.17 | (e) | | | 1.17 | (e) | | | 0.51 | (e) | | | — | |
| For the Year Ended October 31, 2006 (h) | | | | | | | | | | | | | | | | | | | | | | | | | | | | |
| Class A | | | 12.14 | | | | 0.02 | | | | — | | | | 2.96 | | | | 2.98 | | | | (0.05 | ) | | | (0.14 | ) | | | — | | | | (0.19 | ) | | | 2.79 | | | | 14.93 | | | | 24.85 | | | | 213,186 | | | | 1.70 | | | | 1.60 | | | | 1.60 | | | | 0.12 | | | | 165 | |
| Class B | | | 11.77 | | | | (0.08 | ) | | | — | | | | 2.87 | | | | 2.79 | | | | — | | | | (0.14 | ) | | | — | | | | (0.14 | ) | | | 2.65 | | | | 14.42 | | | | 23.95 | | | | 33,252 | | | | 2.56 | | | | 2.30 | | | | 2.30 | | | | (0.59 | ) | | | — | |
| Class C | | | 11.77 | | | | (0.09 | ) | | | — | | | | 2.88 | | | | 2.79 | | | | — | | | | (0.14 | ) | | | — | | | | (0.14 | ) | | | 2.65 | | | | 14.42 | | | | 23.95 | | | | 43,336 | | | | 2.40 | | | | 2.35 | | | | 2.35 | | | | (0.65 | ) | | | — | |
| Class Y | | | 12.33 | | | | 0.06 | | | | — | | | | 3.02 | | | | 3.08 | | | | (0.10 | ) | | | (0.14 | ) | | | — | | | | (0.24 | ) | | | 2.84 | | | | 15.17 | | | | 25.38 | | | | 70,777 | | | | 1.16 | | | | 1.16 | | | | 1.16 | | | | 0.42 | | | | — | |
| From (commencement of operations) August 31, 2006, through October 31, 2006 (h) | | | | | | | | | | | | | | | | | | | | | | | | | | | | |
| Class I | | | 14.34 | | | | (0.02 | ) | | | — | | | | 0.62 | | | | 0.60 | | | | — | | | | — | | | | — | | | | — | | | | 0.60 | | | | 14.94 | | | | 4.18 | (f) | | | 10 | | | | 1.53 | (e) | | | 1.36 | (e) | | | 1.36 | (e) | | | (0.49 | )(e) | | | — | |
394
| | | | | | | | | | | | | | | | | | | | | | | | | | | | | | | | | | | | | | | | | | | | | | | | | | | | | | | | | | | | | | | | | | | | | | | | | |
| | | — Selected Per-Share Data (a) — | | — Ratios and Supplemental Data — |
| | | | | | | | | | | | | | | | | | | | | | | | | | | | | Ratio of
| | Ratio of
| | Ratio of
| | | | |
| | | | | | | | | | | | | | | | | | | | | | | | | | | | | Expenses
| | Expenses
| | Expenses
| | | | |
| | | | | | | | | | | | | | | | | | | | | | | | | | | | | to Average
| | to Average
| | to Average
| | | | |
| | | | | | | | | Net
| | | | | | | | | | | | | | | | | | | | Net Assets
| | Net Assets
| | Net Assets
| | | | |
| | | | | | | | | Realized
| | | | | | | | | | | | Net
| | | | | | | | Before
| | After
| | After
| | Ratio of
| | |
| | | | | | | | | and
| | | | | | Distributions
| | | | | | Increase
| | | | | | | | Waivers and
| | Waivers and
| | Waivers and
| | Net
| | |
| | | Net Asset
| | Net
| | Payments
| | Unrealized
| | Total
| | Dividends
| | from
| | | | | | (Decrease)
| | Net Asset
| | | | Net Assets
| | Reimbursements
| | Reimbursements
| | Reimbursements
| | Investment
| | |
| | | Value at
| | Investment
| | from
| | Gain
| | from
| | from Net
| | Realized
| | Distributions
| | | | in Net
| | Value at
| | | | at End of
| | and Including
| | and Including
| | and Excluding
| | Income
| | Portfolio
|
| | | Beginning
| | Income
| | (to)
| | (Loss) on
| | Investment
| | Investment
| | Capital
| | from
| | Total
| | Asset
| | End
| | Total
| | Period
| | Interest
| | Interest
| | Interest
| | to Average
| | Turnover
|
| | | of Period | | (Loss) | | Affiliate | | Investments | | Operations | | Income | | Gains | | Capital | | Distributions | | Value | | of Period | | Return (b) | | (000’s) | | Expense (d) | | Expense (d) | | Expense (d) | | Net Assets | | Rate (c) |
The Hartford International Growth Fund — (continued) | | | | | | | | | | | | | | | | | | | | | | | | | | | | |
| For the Year Ended October 31, 2005 | | | | | | | | | | | | | | | | | | | | | | | | | | | | |
| Class A | | $ | 11.59 | | | $ | 0.07 | | | $ | — | | | $ | 0.48 | | | $ | 0.55 | | | $ | — | | | $ | — | | | $ | — | | | $ | — | | | $ | 0.55 | | | $ | 12.14 | | | | 4.74 | % | | $ | 131,430 | | | | 1.77 | % | | | 1.60 | % | | | 1.60 | % | | | 0.66 | % | | | 183 | % |
| Class B | | | 11.32 | | | | (0.01 | ) | | | — | | | | 0.46 | | | | 0.45 | | | | — | | | | — | | | | — | | | | — | | | | 0.45 | | | | 11.77 | | | | 3.98 | | | | 22,304 | | | | 2.66 | | | | 2.35 | | | | 2.35 | | | | (0.09 | ) | | | — | |
| Class C | | | 11.32 | | | | (0.01 | ) | | | — | | | | 0.46 | | | | 0.45 | | | | — | | | | — | | | | — | | | | — | | | | 0.45 | | | | 11.77 | | | | 3.98 | | | | 29,486 | | | | 2.49 | | | | 2.35 | | | | 2.35 | | | | (0.07 | ) | | | — | |
| Class Y | | | 11.72 | | | | 0.08 | | | | — | | | | 0.53 | | | | 0.61 | | | | — | | | | — | | | | — | | | | — | | | | 0.61 | | | | 12.33 | | | | 5.20 | | | | 74,651 | | | | 1.22 | | | | 1.20 | | | | 1.20 | | | | 0.98 | | | | — | |
| For the Year Ended October 31, 2004 (h) | | | | | | | | | | | | | | | | | | | | | | | | | | | | |
| Class A | | | 9.62 | | | | (0.01 | ) | | | — | | | | 2.03 | | | | 2.02 | | | | — | | | | (0.05 | ) | | | — | | | | (0.05 | ) | | | 1.97 | | | | 11.59 | | | | 21.14 | | | | 50,051 | | | | 1.91 | | | | 1.65 | | | | 1.65 | | | | (0.10 | ) | | | 200 | |
| Class B | | | 9.46 | | | | (0.08 | ) | | | — | | | | 1.99 | | | | 1.91 | | | | — | | | | (0.05 | ) | | | — | | | | (0.05 | ) | | | 1.86 | | | | 11.32 | | | | 20.33 | | | | 8,968 | | | | 2.83 | | | | 2.35 | | | | 2.35 | | | | (0.80 | ) | | | — | |
| Class C | | | 9.46 | | | | (0.08 | ) | | | — | | | | 1.99 | | | | 1.91 | | | | — | | | | (0.05 | ) | | | — | | | | (0.05 | ) | | | 1.86 | | | | 11.32 | | | | 20.33 | | | | 12,906 | | | | 2.63 | | | | 2.35 | | | | 2.35 | | | | (0.79 | ) | | | — | |
| Class Y | | | 9.69 | | | | (0.01 | ) | | | — | | | | 2.09 | | | | 2.08 | | | | — | | | | (0.05 | ) | | | — | | | | (0.05 | ) | | | 2.03 | | | | 11.72 | | | | 21.61 | | | | 28,775 | | | | 1.31 | | | | 1.20 | | | | 1.20 | | | | (0.09 | ) | | | — | |
| For the Year Ended October 31, 2003 | | | | | | | | | | | | | | | | | | | | | | | | | | | | |
| Class A | | | 6.93 | | | | (0.02 | ) | | | — | | | | 2.72 | | | | 2.70 | | | | (0.01 | ) | | | — | | | | — | | | | (0.01 | ) | | | 2.69 | | | | 9.62 | | | | 38.95 | | | | 11,362 | | | | 2.36 | | | | 1.65 | | | | 1.65 | | | | (0.35 | ) | | | 281 | |
| Class B | | | 6.86 | | | | (0.04 | ) | | | — | | | | 2.64 | | | | 2.60 | | | | — | | | | — | | | | — | | | | — | | | | 2.60 | | | | 9.46 | | | | 37.90 | | | | 2,148 | | | | 3.08 | | | | 2.35 | | | | 2.35 | | | | (1.04 | ) | | | — | |
| Class C | | | 6.86 | | | | (0.04 | ) | | | — | | | | 2.64 | | | | 2.60 | | | | — | | | | — | | | | — | | | | — | | | | 2.60 | | | | 9.46 | | | | 37.90 | | | | 2,285 | | | | 2.95 | | | | 2.35 | | | | 2.35 | | | | (1.01 | ) | | | — | |
| Class Y | | | 6.98 | | | | 0.01 | | | | — | | | | 2.74 | | | | 2.75 | | | | (0.04 | ) | | | — | | | | — | | | | (0.04 | ) | | | 2.71 | | | | 9.69 | | | | 39.57 | | | | 292 | | | | 1.80 | | | | 1.20 | | | | 1.20 | | | | 0.16 | | | | — | |
The Hartford International Opportunities Fund | | | | | | | | | | | | | | | | | | | | | | | | | | | | |
| For the Six-Month Period Ended April 30, 2008 (Unaudited) (h) | | | | | | | | | | | | | | | | | | | | | | | | | | | | |
| Class A | | | 21.79 | | | | 0.04 | | | | — | | | | (1.60 | ) | | | (1.56 | ) | | | (0.06 | ) | | | (3.20 | ) | | | — | | | | (3.26 | ) | | | (4.82 | ) | | | 16.97 | | | | (7.94 | )(f) | | | 254,454 | | | | 1.44 | (e) | | | 1.44 | (e) | | | 1.44 | (e) | | | 0.47 | (e) | | | 62 | |
| Class B | | | 20.34 | | | | (0.03 | ) | | | — | | | | (1.47 | ) | | | (1.50 | ) | | | — | | | | (3.20 | ) | | | — | | | | (3.20 | ) | | | (4.70 | ) | | | 15.64 | | | | (8.25 | )(f) | | | 32,448 | | | | 2.41 | (e) | | | 2.16 | (e) | | | 2.16 | (e) | | | (0.31 | )(e) | | | — | |
| Class C | | | 20.16 | | | | (0.02 | ) | | | — | | | | (1.46 | ) | | | (1.48 | ) | | | — | | | | (3.20 | ) | | | — | | | | (3.20 | ) | | | (4.68 | ) | | | 15.48 | | | | (8.23 | )(f) | | | 38,199 | | | | 2.17 | (e) | | | 2.17 | (e) | | | 2.17 | (e) | | | (0.22 | )(e) | | | — | |
| Class R3 | | | 22.33 | | | | 0.04 | | | | — | | | | (1.67 | ) | | | (1.63 | ) | | | (0.03 | ) | | | (3.20 | ) | | | — | | | | (3.23 | ) | | | (4.86 | ) | | | 17.47 | | | | (8.08 | )(f) | | | 61 | | | | 1.92 | (e) | | | 1.78 | (e) | | | 1.78 | (e) | | | 0.45 | (e) | | | — | |
| Class R4 | | | 22.39 | | | | 0.12 | | | | — | | | | (1.69 | ) | | | (1.57 | ) | | | (0.07 | ) | | | (3.20 | ) | | | — | | | | (3.27 | ) | | | (4.84 | ) | | | 17.55 | | | | (7.76 | )(f) | | | 78 | | | | 1.39 | (e) | | | 1.39 | (e) | | | 1.39 | (e) | | | 1.41 | (e) | | | — | |
| Class R5 | | | 22.45 | | | | 0.07 | | | | — | | | | (1.64 | ) | | | (1.57 | ) | | | (0.12 | ) | | | (3.20 | ) | | | — | | | | (3.32 | ) | | | (4.89 | ) | | | 17.56 | | | | (7.75 | )(f) | | | 12 | | | | 1.04 | (e) | | | 1.04 | (e) | | | 1.04 | (e) | | | 0.83 | (e) | | | — | |
| Class Y | | | 22.48 | | | | 0.09 | | | | — | | | | (1.66 | ) | | | (1.57 | ) | | | (0.14 | ) | | | (3.20 | ) | | | — | | | | (3.34 | ) | | | (4.91 | ) | | | 17.57 | | | | (7.71 | )(f) | | | 133,593 | | | | 0.93 | (e) | | | 0.93 | (e) | | | 0.93 | (e) | | | 0.96 | (e) | | | — | |
| For the Year Ended October 31, 2007 | | | | | | | | | | | | | | | | | | | | | | | | | | | | |
| Class A | | | 16.13 | | | | 0.05 | | | | — | | | | 6.10 | | | | 6.15 | | | | (0.06 | ) | | | (0.43 | ) | | | — | | | | (0.49 | ) | | | 5.66 | | | | 21.79 | | | | 39.15 | (i) | | | 241,239 | | | | 1.49 | | | | 1.49 | | | | 1.49 | | | | 0.31 | | | | 147 | |
| Class B | | | 15.14 | | | | (0.07 | ) | | | — | | | | 5.70 | | | | 5.63 | | | | — | | | | (0.43 | ) | | | — | | | | (0.43 | ) | | | 5.20 | | | | 20.34 | | | | 38.17 | (i) | | | 37,545 | | | | 2.46 | | | | 2.18 | | | | 2.18 | | | | (0.39 | ) | | | — | |
| Class C | | | 15.01 | | | | (0.07 | ) | | | — | | | | 5.65 | | | | 5.58 | | | | — | | | | (0.43 | ) | | | — | | | | (0.43 | ) | | | 5.15 | | | | 20.16 | | | | 38.17 | (i) | | | 31,076 | | | | 2.21 | | | | 2.21 | | | | 2.21 | | | | (0.42 | ) | | | — | |
| Class Y | | | 16.67 | | | | 0.05 | | | | — | | | | 6.39 | | | | 6.44 | | | | (0.20 | ) | | | (0.43 | ) | | | — | | | | (0.63 | ) | | | 5.81 | | | | 22.48 | | | | 39.91 | (i) | | | 127,314 | | | | 0.95 | | | | 0.95 | | | | 0.95 | | | | 0.84 | | | | — | |
| From (commencement of operations) December 22, 2006, through October 31, 2007 | | | | | | | | | | | | | | | | | | | | | | | | | | | | |
| Class R3 | | | 17.07 | | | | 0.06 | | | | — | | | | 5.20 | | | | 5.26 | | | | — | | | | — | | | | — | | | | — | | | | 5.26 | | | | 22.33 | | | | 30.81 | (f) | | | 28 | | | | 1.71 | (e) | | | 1.71 | (e) | | | 1.71 | (e) | | | 0.40 | (e) | | | — | |
| Class R4 | | | 17.07 | | | | 0.09 | | | | — | | | | 5.23 | | | | 5.32 | | | | — | | | | — | | | | — | | | | — | | | | 5.32 | | | | 22.39 | | | | 31.17 | (f) | | | 13 | | | | 1.41 | (e) | | | 1.41 | (e) | | | 1.41 | (e) | | | 0.53 | (e) | | | — | |
| Class R5 | | | 17.07 | | | | 0.13 | | | | — | | | | 5.25 | | | | 5.38 | | | | — | | | | — | | | | — | | | | — | | | | 5.38 | | | | 22.45 | | | | 31.52 | (f) | | | 13 | | | | 1.11 | (e) | | | 1.11 | (e) | | | 1.11 | (e) | | | 0.83 | (e) | | | — | |
| For the Year Ended October 31, 2006 (h) | | | | | | | | | | | | | | | | | | | | | | | | | | | | |
| Class A | | | 13.13 | | | | 0.13 | | | | — | | | | 2.92 | | | | 3.05 | | | | (0.05 | ) | | | — | | | | — | | | | (0.05 | ) | | | 3.00 | | | | 16.13 | | | | 23.25 | | | | 159,087 | | | | 1.61 | | | | 1.57 | | | | 1.57 | | | | 0.84 | | | | 102 | |
| Class B | | | 12.35 | | | | 0.03 | | | | — | | | | 2.76 | | | | 2.79 | | | | — | | | | — | | | | — | | | | — | | | | 2.79 | | | | 15.14 | | | | 22.59 | | | | 29,125 | | | | 2.56 | | | | 2.15 | | | | 2.15 | | | | 0.24 | | | | — | |
| Class C | | | 12.27 | | | | 0.01 | | | | — | | | | 2.73 | | | | 2.74 | | | | — | | | | — | | | | — | | | | — | | | | 2.74 | | | | 15.01 | | | | 22.33 | | | | 20,782 | | | | 2.33 | | | | 2.33 | | | | 2.33 | | | | 0.06 | | | | — | |
| Class Y | | | 13.55 | | | | 0.25 | | | | — | | | | 2.98 | | | | 3.23 | | | | (0.11 | ) | | | — | | | | — | | | | (0.11 | ) | | | 3.12 | | | | 16.67 | | | | 24.00 | | | | 43,994 | | | | 1.02 | | | | 1.02 | | | | 1.02 | | | | 1.56 | | | | — | |
| For the Year Ended October 31, 2005 | | | | | | | | | | | | | | | | | | | | | | | | | | | | |
| Class A | | | 11.22 | | | | 0.05 | | | | — | | | | 1.86 | | | | 1.91 | | | | — | | | | — | | | | — | | | | — | | | | 1.91 | | | | 13.13 | | | | 17.02 | | | | 102,393 | | | | 1.72 | | | | 1.57 | | | | 1.57 | | | | 0.42 | | | | 119 | |
| Class B | | | 10.64 | | | | (0.04 | ) | | | — | | | | 1.75 | | | | 1.71 | | | | — | | | | — | | | | — | | | | — | | | | 1.71 | | | | 12.35 | | | | 16.07 | | | | 23,940 | | | | 2.68 | | | | 2.35 | | | | 2.35 | | | | (0.36 | ) | | | — | |
| Class C | | | 10.57 | | | | (0.04 | ) | | | — | | | | 1.74 | | | | 1.70 | | | | — | | | | — | | | | — | | | | — | | | | 1.70 | | | | 12.27 | | | | 16.08 | | | | 16,896 | | | | 2.42 | | | | 2.35 | | | | 2.35 | | | | (0.37 | ) | | | — | |
| Class Y | | | 11.53 | | | | 0.12 | | | | — | | | | 1.90 | | | | 2.02 | | | | — | | | | — | | | | — | | | | — | | | | 2.02 | | | | 13.55 | | | | 17.52 | | | | 5,612 | | | | 1.05 | | | | 1.05 | | | | 1.05 | | | | 0.94 | | | | — | |
| For the Year Ended October 31, 2004 | | | | | | | | | | | | | | | | | | | | | | | | | | | | |
| Class A | | | 9.66 | | | | 0.03 | | | | — | | | | 1.54 | | | | 1.57 | | | | (0.01 | ) | | | — | | | | — | | | | (0.01 | ) | | | 1.56 | | | | 11.22 | | | | 16.20 | | | | 87,348 | | | | 1.83 | | | | 1.65 | | | | 1.65 | | | | 0.33 | | | | 143 | |
| Class B | | | 9.22 | | | | (0.05 | ) | | | — | | | | 1.47 | | | | 1.42 | | | | — | | | | — | | | | — | | | | — | | | | 1.42 | | | | 10.64 | | | | 15.40 | | | | 23,301 | | | | 2.77 | | | | 2.35 | | | | 2.35 | | | | (0.39 | ) | | | — | |
| Class C | | | 9.16 | | | | (0.05 | ) | | | — | | | | 1.46 | | | | 1.41 | | | | — | | | | — | | | | — | | | | — | | | | 1.41 | | | | 10.57 | | | | 15.39 | | | | 15,749 | | | | 2.48 | | | | 2.35 | | | | 2.35 | | | | (0.38 | ) | | | — | |
| Class Y | | | 9.91 | | | | 0.11 | | | | — | | | | 1.56 | | | | 1.67 | | | | (0.05 | ) | | | — | | | | — | | | | (0.05 | ) | | | 1.62 | | | | 11.53 | | | | 16.87 | | | | 4,288 | | | | 1.09 | | | | 1.08 | | | | 1.08 | | | | 0.82 | | | | — | |
| For the Year Ended October 31, 2003 | | | | | | | | | | | | | | | | | | | | | | | | | | | | |
| Class A | | | 8.03 | | | | 0.02 | | | | — | | | | 1.61 | | | | 1.63 | | | | — | | | | — | | | | — | | | | — | | | | 1.63 | | | | 9.66 | | | | 20.30 | | | | 69,153 | | | | 1.72 | | | | 1.65 | | | | 1.65 | | | | 0.25 | | | | 138 | |
| Class B | | | 7.71 | | | | (0.04 | ) | | | — | | | | 1.55 | | | | 1.51 | | | | — | | | | — | | | | — | | | | — | | | | 1.51 | | | | 9.22 | | | | 19.58 | | | | 20,459 | | | | 2.45 | | | | 2.35 | | | | 2.35 | | | | (0.46 | ) | | | — | |
| Class C | | | 7.67 | | | | (0.04 | ) | | | — | | | | 1.53 | | | | 1.49 | | | | — | | | | — | | | | — | | | | — | | | | 1.49 | | | | 9.16 | | | | 19.43 | | | | 14,790 | | | | 2.35 | | | | 2.35 | | | | 2.35 | | | | (0.45 | ) | | | — | |
| Class Y | | | 8.19 | | | | 0.06 | | | | — | | | | 1.66 | | | | 1.72 | | | | — | | | | — | | | | — | | | | — | | | | 1.72 | | | | 9.91 | | | | 21.00 | | | | 6,058 | | | | 1.13 | | | | 1.13 | | | | 1.13 | | | | 0.77 | | | | — | |
The Hartford International Small Company Fund | | | | | | | | | | | | | | | | | | | | | | | | | | | | |
| For the Six-Month Period Ended April 30, 2008 (Unaudited) | | | | | | | | | | | | | | | | | | | | | | | | | | | | |
| Class A | | | 17.99 | | | | 0.04 | | | | — | | | | (2.04 | ) | | | (2.00 | ) | | | (0.16 | ) | | | (1.95 | ) | | | — | | | | (2.11 | ) | | | (4.11 | ) | | | 13.88 | | | | (11.83)(f) | | | | 119,053 | | | | 1.48 | (e) | | | 1.48 | (e) | | | 1.48 | (e) | | | 0.71 | (e) | | | 51 | |
| Class B | | | 17.35 | | | | — | | | | — | | | | (1.97 | ) | | | (1.97 | ) | | | (0.06 | ) | | | (1.95 | ) | | | — | | | | (2.01 | ) | | | (3.98 | ) | | | 13.37 | | | | (12.15 | )(f) | | | 15,619 | | | | 2.47 | (e) | | | 2.19 | (e) | | | 2.19 | (e) | | | 0.00 | (e) | | | — | |
| Class C | | | 17.16 | | | | (0.01 | ) | | | — | | | | (1.93 | ) | | | (1.94 | ) | | | (0.07 | ) | | | (1.95 | ) | | | — | | | | (2.02 | ) | | | (3.96 | ) | | | 13.20 | | | | (12.13 | )(f) | | | 25,188 | | | | 2.23 | (e) | | | 2.23 | (e) | | | 2.23 | (e) | | | (0.06 | )(e) | | | — | |
| Class I | | | 17.10 | | | | 0.16 | | | | — | | | | (1.22 | ) | | | (1.06 | ) | | | (0.22 | ) | | | (1.95 | ) | | | — | | | | (2.17 | ) | | | (3.23 | ) | | | 13.87 | | | | (11.67 | )(f) | | | 583 | | | | 1.15 | (e) | | | 1.15 | (e) | | | 1.15 | (e) | | | 1.54 | (e) | | | — | |
| Class Y | | | 18.26 | | | | 0.05 | | | | — | | | | (2.04 | ) | | | (1.99 | ) | | | (0.23 | ) | | | (1.95 | ) | | | — | | | | (2.18 | ) | | | (4.17 | ) | | | 14.09 | | | | (11.60 | )(f) | | | 128,944 | | | | 1.00 | (e) | | | 1.00 | (e) | | | 1.00 | (e) | | | 1.28 | (e) | | | — | |
395
The Hartford Mutual Funds, Inc. and The Hartford Mutual Funds II, Inc.
Financial Highlights — (continued)
| | | | | | | | | | | | | | | | | | | | | | | | | | | | | | | | | | | | | | | | | | | | | | | | | | | | | | | | | | | | | | | | | | | | | | | | | |
| | | — Selected Per-Share Data (a) — | | — Ratios and Supplemental Data — |
| | | | | | | | | | | | | | | | | | | | | | | | | | | | | Ratio of
| | Ratio of
| | Ratio of
| | | | |
| | | | | | | | | | | | | | | | | | | | | | | | | | | | | Expenses
| | Expenses
| | Expenses
| | | | |
| | | | | | | | | | | | | | | | | | | | | | | | | | | | | to Average
| | to Average
| | to Average
| | | | |
| | | | | | | | | Net
| | | | | | | | | | | | | | | | | | | | Net Assets
| | Net Assets
| | Net Assets
| | | | |
| | | | | | | | | Realized
| | | | | | | | | | | | Net
| | | | | | | | Before
| | After
| | After
| | Ratio of
| | |
| | | | | | | | | and
| | | | | | Distributions
| | | | | | Increase
| | | | | | | | Waivers and
| | Waivers and
| | Waivers and
| | Net
| | |
| | | Net Asset
| | Net
| | Payments
| | Unrealized
| | Total
| | Dividends
| | from
| | | | | | (Decrease)
| | Net Asset
| | | | Net Assets
| | Reimbursements
| | Reimbursements
| | Reimbursements
| | Investment
| | |
| | | Value at
| | Investment
| | from
| | Gain
| | from
| | from Net
| | Realized
| | Distributions
| | | | in Net
| | Value at
| | | | at End of
| | and Including
| | and Including
| | and Excluding
| | Income
| | Portfolio
|
| | | Beginning
| | Income
| | (to)
| | (Loss) on
| | Investment
| | Investment
| | Capital
| | from
| | Total
| | Asset
| | End
| | Total
| | Period
| | Interest
| | Interest
| | Interest
| | to Average
| | Turnover
|
| | | of Period | | (Loss) | | Affiliate | | Investments | | Operations | | Income | | Gains | | Capital | | Distributions | | Value | | of Period | | Return (b) | | (000’s) | | Expense (d) | | Expense (d) | | Expense (d) | | Net Assets | | Rate (c) |
The Hartford International Small Company Fund — (continued) | | | | | | | | | | | | | | | | | | | | | | | | | | | | |
| For the Year Ended October 31, 2007 | | | | | | | | | | | | | | | | | | | | | | | | | | | | |
| Class A | | $ | 16.19 | | | $ | 0.03 | | | $ | — | | | $ | 3.92 | | | $ | 3.95 | | | $ | (0.15 | ) | | $ | (2.00 | ) | | $ | — | | | $ | (2.15 | ) | | $ | 1.80 | | | $ | 17.99 | | | | 27.90 | % | | $ | 153,290 | | | | 1.49 | % | | | 1.49 | % | | | 1.49 | % | | | 0.33 | % | | | 96 | % |
| Class B | | | 15.72 | | | | (0.05 | ) | | | — | | | | 3.76 | | | | 3.71 | | | | (0.08 | ) | | | (2.00 | ) | | | — | | | | (2.08 | ) | | | 1.63 | | | | 17.35 | | | | 26.97 | | | | 19,562 | | | | 2.44 | | | | 2.26 | | | | 2.26 | | | | (0.47 | ) | | | — | |
| Class C | | | 15.55 | | | | (0.02 | ) | | | — | | | | 3.69 | | | | 3.67 | | | | (0.06 | ) | | | (2.00 | ) | | | — | | | | (2.06 | ) | | | 1.61 | | | | 17.16 | | | | 26.98 | | | | 33,033 | | | | 2.23 | | | | 2.23 | | | | 2.23 | | | | (0.43 | ) | | | — | |
| Class Y | | | 16.37 | | | | 0.02 | | | | — | | | | 4.06 | | | | 4.08 | | | | (0.19 | ) | | | (2.00 | ) | | | — | | | | (2.19 | ) | | | 1.89 | | | | 18.26 | | | | 28.48 | | | | 132,411 | | | | 1.01 | | | | 1.01 | | | | 1.01 | | | | 0.75 | | | | — | |
| From (commencement of operations) May 31, 2007, through October 31, 2007 | | | | | | | | | | | | | | | | | | | | | | | | | | | | |
| Class I | | | 17.10 | | | | 0.02 | | | | — | | | | 0.90 | | | | 0.92 | | | | — | | | | — | | | | — | | | | — | | | | 0.92 | | | | 18.02 | | | | 5.38 | (f) | | | 174 | | | | 1.19 | (e) | | | 1.19 | (e) | | | 1.19 | (e) | | | 0.77 | (e) | | | — | |
| For the Year Ended October 31, 2006 (h) | | | | | | | | | | | | | | | | | | | | | | | | | | | | |
| Class A | | | 14.27 | | | | 0.08 | | | | — | | | | 3.62 | | | | 3.70 | | | | (0.25 | ) | | | (1.53 | ) | | | — | | | | (1.78 | ) | | | 1.92 | | | | 16.19 | | | | 29.36 | | | | 69,998 | | | | 1.74 | | | | 1.60 | | | | 1.60 | | | | 0.56 | | | | 107 | |
| Class B | | | 13.91 | | | | (0.01 | ) | | | — | | | | 3.51 | | | | 3.50 | | | | (0.16 | ) | | | (1.53 | ) | | | — | | | | (1.69 | ) | | | 1.81 | | | | 15.72 | | | | 28.51 | | | | 11,960 | | | | 2.66 | | | | 2.24 | | | | 2.24 | | | | (0.08 | ) | | | — | |
| Class C | | | 13.78 | | | | (0.03 | ) | | | — | | | | 3.48 | | | | 3.45 | | | | (0.15 | ) | | | (1.53 | ) | | | — | | | | (1.68 | ) | | | 1.77 | | | | 15.55 | | | | 28.35 | | | | 18,486 | | | | 2.43 | | | | 2.35 | | | | 2.35 | | | | (0.22 | ) | | | — | |
| Class Y | | | 14.41 | | | | 0.15 | | | | — | | | | 3.64 | | | | 3.79 | | | | (0.30 | ) | | | (1.53 | ) | | | — | | | | (1.83 | ) | | | 1.96 | | | | 16.37 | | | | 29.89 | | | | 86,707 | | | | 1.20 | | | | 1.20 | | | | 1.20 | | | | 0.97 | | | | — | |
| For the Year Ended October 31, 2005 | | | | | | | | | | | | | | | | | | | | | | | | | | | | |
| Class A | | | 13.44 | | | | 0.06 | | | | — | | | | 2.25 | | | | 2.31 | | | | — | | | | (1.48 | ) | | | — | | | | (1.48 | ) | | | 0.83 | | | | 14.27 | | | | 18.90 | | | | 34,896 | | | | 1.82 | | | | 1.60 | | | | 1.60 | | | | 0.71 | | | | 112 | |
| Class B | | | 13.23 | | | | — | | | | — | | | | 2.16 | | | | 2.16 | | | | — | | | | (1.48 | ) | | | — | | | | (1.48 | ) | | | 0.68 | | | | 13.91 | | | | 17.96 | | | | 6,101 | | | | 2.78 | | | | 2.35 | | | | 2.35 | | | | (0.02 | ) | | | — | |
| Class C | | | 13.12 | | | | (0.01 | ) | | | — | | | | 2.15 | | | | 2.14 | | | | — | | | | (1.48 | ) | | | — | | | | (1.48 | ) | | | 0.66 | | | | 13.78 | | | | 17.96 | | | | 12,614 | | | | 2.46 | | | | 2.35 | | | | 2.35 | | | | (0.06 | ) | | | — | |
| Class Y | | | 13.54 | | | | 0.12 | | | | — | | | | 2.27 | | | | 2.39 | | | | (0.04 | ) | | | (1.48 | ) | | | — | | | | (1.52 | ) | | | 0.87 | | | | 14.41 | | | | 19.40 | | | | 65,828 | | | | 1.28 | | | | 1.20 | | | | 1.20 | | | | 1.13 | | | | — | |
| For the Year Ended October 31, 2004 | | | | | | | | | | | | | | | | | | | | | | | | | | | | |
| Class A | | | 12.93 | | | | 0.07 | | | | — | | | | 1.31 | | | | 1.38 | | | | — | | | | (0.87 | ) | | | — | | | | (0.87 | ) | | | 0.51 | | | | 13.44 | | | | 11.39 | | | | 23,934 | | | | 1.99 | | | | 1.65 | | | | 1.65 | | | | 0.90 | | | | 119 | |
| Class B | | | 12.82 | | | | 0.02 | | | | — | | | | 1.26 | | | | 1.28 | | | | — | | | | (0.87 | ) | | | — | | | | (0.87 | ) | | | 0.41 | | | | 13.23 | | | | 10.62 | | | | 3,726 | | | | 2.89 | | | | 2.35 | | | | 2.35 | | | | 0.15 | | | | — | |
| Class C | | | 12.72 | | | | 0.03 | | | | — | | | | 1.24 | | | | 1.27 | | | | — | | | | (0.87 | ) | | | — | | | | (0.87 | ) | | | 0.40 | | | | 13.12 | | | | 10.63 | | | | 10,072 | | | | 2.60 | | | | 2.35 | | | | 2.35 | | | | 0.27 | | | | — | |
| Class Y | | | 13.02 | | | | 0.14 | | | | — | | | | 1.30 | | | | 1.44 | | | | (0.05 | ) | | | (0.87 | ) | | | — | | | | (0.92 | ) | | | 0.52 | | | | 13.54 | | | | 11.80 | | | | 42,449 | | | | 1.41 | | | | 1.20 | | | | 1.20 | | | | 1.26 | | | | — | |
| For the Year Ended October 31, 2003 (h) | | | | | | | | | | | | | | | | | | | | | | | | | | | | |
| Class A | | | 8.37 | | | | 0.07 | | | | — | | | | 4.51 | | | | 4.58 | | | | (0.02 | ) | | | — | | | | — | | | | (0.02 | ) | | | 4.56 | | | | 12.93 | | | | 54.76 | | | | 12,320 | | | | 2.36 | | | | 1.65 | | | | 1.65 | | | | 0.72 | | | | 166 | |
| Class B | | | 8.34 | | | | 0.01 | | | | — | | | | 4.47 | | | | 4.48 | | | | — | | | | — | | | | — | | | | — | | | | 4.48 | | | | 12.82 | | | | 53.72 | | | | 2,237 | | | | 3.09 | | | | 2.35 | | | | 2.35 | | | | 0.03 | | | | — | |
| Class C | | | 8.28 | | | | 0.01 | | | | — | | | | 4.43 | | | | 4.44 | | | | — | | | | — | | | | — | | | | — | | | | 4.44 | | | | 12.72 | | | | 53.62 | | | | 3,004 | | | | 2.96 | | | | 2.35 | | | | 2.35 | | | | (0.03 | ) | | | — | |
| Class Y | | | 8.43 | | | | 0.09 | | | | — | | | | 4.56 | | | | 4.65 | | | | (0.06 | ) | | | — | | | | — | | | | (0.06 | ) | | | 4.59 | | | | 13.02 | | | | 55.47 | | | | 25,154 | | | | 1.64 | | | | 1.20 | | | | 1.20 | | | | 0.93 | | | | — | |
The Hartford LargeCap Growth Fund | | | | | | | | | | | | | | | | | | | | | | | | | | | | |
| For the Six-Month Period Ended April 30, 2008 (Unaudited) | | | | | | | | | | | | | | | | | | | | | | | | | | | | |
| Class A | | | 11.07 | | | | (0.01 | ) | | | — | | | | (1.43 | ) | | | (1.44 | ) | | | — | | | | (0.19 | ) | | | — | | | | (0.19 | ) | | | (1.63 | ) | | | 9.44 | | | | (13.15 | )(f) | | | 10,146 | | | | 1.56 | (e) | | | 1.25 | (e) | | | 1.25 | (e) | | | (0.18 | )(e) | | | 82 | |
| Class B | | | 10.99 | | | | (0.04 | ) | | | — | | | | (1.43 | ) | | | (1.47 | ) | | | — | | | | (0.19 | ) | | | — | | | | (0.19 | ) | | | (1.66 | ) | | | 9.33 | | | | (13.52 | )(f) | | | 393 | | | | 2.49 | (e) | | | 2.00 | (e) | | | 2.00 | (e) | | | (0.94 | )(e) | | | — | |
| Class C | | | 10.99 | | | | (0.03 | ) | | | — | | | | (1.43 | ) | | | (1.46 | ) | | | — | | | | (0.19 | ) | | | — | | | | (0.19 | ) | | | (1.65 | ) | | | 9.34 | | | | (13.43 | )(f) | | | 730 | | | | 2.46 | (e) | | | 2.00 | (e) | | | 2.00 | (e) | | | (0.94 | )(e) | | | — | |
| Class Y | | | 11.09 | | | | 0.01 | | | | — | | | | (1.43 | ) | | | (1.42 | ) | | | — | | | | (0.19 | ) | | | — | | | | (0.19 | ) | | | (1.61 | ) | | | 9.48 | | | | (12.94 | )(f) | | | 97 | | | | 1.27 | (e) | | | 0.85 | (e) | | | 0.85 | (e) | | | 0.22 | (e) | | | — | |
| From (commencement of operations) November 30, 2006, through October 31, 2007 | | | | | | | | | | | | | | | | | | | | | | | | | | | | |
| Class A | | | 10.00 | | | | (0.01 | ) | | | — | | | | 1.09 | | | | 1.08 | | | | (0.01 | ) | | | — | | | | — | | | | (0.01 | ) | | | 1.07 | | | | 11.07 | | | | 10.84 | (f) | | | 11,349 | | | | 1.54 | (e) | | | 1.11 | (e) | | | 1.11 | (e) | | | (0.08 | )(e) | | | 129 | |
| Class B | | | 10.00 | | | | (0.08 | ) | | | — | | | | 1.08 | | | | 1.00 | | | | (0.01 | ) | | | — | | | | — | | | | (0.01 | ) | | | 0.99 | | | | 10.99 | | | | 9.97 | (f) | | | 360 | | | | 2.40 | (e) | | | 1.96 | (e) | | | 1.96 | (e) | | | (0.93 | )(e) | | | — | |
| Class C | | | 10.00 | | | | (0.07 | ) | | | — | | | | 1.07 | | | | 1.00 | | | | (0.01 | ) | | | — | | | | — | | | | (0.01 | ) | | | 0.99 | | | | 10.99 | | | | 9.97 | (f) | | | 545 | | | | 2.37 | (e) | | | 1.93 | (e) | | | 1.93 | (e) | | | (0.94 | )(e) | | | — | |
| Class Y | | | 10.00 | | | | 0.02 | | | | — | | | | 1.09 | | | | 1.11 | | | | (0.02 | ) | | | — | | | | — | | | | (0.02 | ) | | | 1.09 | | | | 11.09 | | | | 11.08 | (f) | | | 111 | | | | 1.28 | (e) | | | 0.85 | (e) | | | 0.85 | (e) | | | 0.20 | (e) | | | — | |
The Hartford MidCap Fund | | | | | | | | | | | | | | | | | | | | | | | | | | | | |
| For the Six-Month Period Ended April 30, 2008 (Unaudited) (h) | | | | | | | | | | | | | | | | | | | | | | | | | | | | |
| Class A | | | 26.89 | | | | (0.02 | ) | | | — | | | | (1.77 | ) | | | (1.79 | ) | | | (0.11 | ) | | | (3.96 | ) | | | — | | | | (4.07 | ) | | | (5.86 | ) | | | 21.03 | | | | (6.86 | )(f) | | | 1,988,190 | | | | 1.23 | (e) | | | 1.23 | (e) | | | 1.23 | (e) | | | (0.16 | )(e) | | | 39 | |
| Class B | | | 24.23 | | | | (0.09 | ) | | | — | | | | (1.59 | ) | | | (1.68 | ) | | | — | | | | (3.96 | ) | | | — | | | | (3.96 | ) | | | (5.64 | ) | | | 18.59 | | | | (7.22 | )(f) | | | 355,403 | | | | 2.00 | (e) | | | 2.00 | (e) | | | 2.00 | (e) | | | (0.93 | )(e) | | | — | |
| Class C | | | 24.40 | | | | (0.08 | ) | | | — | | | | (1.61 | ) | | | (1.69 | ) | | | — | | | | (3.96 | ) | | | — | | | | (3.96 | ) | | | (5.65 | ) | | | 18.75 | | | | (7.21 | )(f) | | | 442,509 | | | | 1.92 | (e) | | | 1.92 | (e) | | | 1.92 | (e) | | | (0.84 | )(e) | | | — | |
| Class Y | | | 28.74 | | | | 0.03 | | | | — | | | | (1.89 | ) | | | (1.86 | ) | | | (0.20 | ) | | | (3.96 | ) | | | — | | | | (4.16 | ) | | | (6.02 | ) | | | 22.72 | | | | (6.63 | )(f) | | | 224,979 | | | | 0.80 | (e) | | | 0.80 | (e) | | | 0.80 | (e) | | | 0.27 | (e) | | | — | |
| For the Year Ended October 31, 2007 | | | | | | | | | | | | | | | | | | | | | | | | | | | | |
| Class A | | | 25.31 | | | | 0.05 | | | | 0.02 | | | | 5.53 | | | | 5.60 | | | | — | | | | (4.02 | ) | | | — | | | | (4.02 | ) | | | 1.58 | | | | 26.89 | | | | 25.96 | (i) | | | 2,205,026 | | | | 1.22 | | | | 1.22 | | | | 1.22 | | | | 0.20 | | | | 76 | |
| Class B | | | 23.35 | | | | (0.13 | ) | | | 0.02 | | | | 5.01 | | | | 4.90 | | | | — | | | | (4.02 | ) | | | — | | | | (4.02 | ) | | | 0.88 | | | | 24.23 | | | | 24.98 | (i) | | | 454,927 | | | | 1.99 | | | | 1.99 | | | | 1.99 | | | | (0.52 | ) | | | — | |
| Class C | | | 23.47 | | | | (0.11 | ) | | | 0.02 | | | | 5.04 | | | | 4.95 | | | | — | | | | (4.02 | ) | | | — | | | | (4.02 | ) | | | 0.93 | | | | 24.40 | | | | 25.08 | (i) | | | 528,342 | | | | 1.91 | | | | 1.91 | | | | 1.91 | | | | (0.44 | ) | | | — | |
| Class Y | | | 26.68 | | | | 0.28 | | | | 0.03 | | | | 5.77 | | | | 6.08 | | | | — | | | | (4.02 | ) | | | — | | | | (4.02 | ) | | | 2.06 | | | | 28.74 | | | | 26.50 | (i) | | | 134,914 | | | | 0.79 | | | | 0.79 | | | | 0.79 | | | | 0.73 | | | | — | |
| For the Year Ended October 31, 2006 | | | | | | | | | | | | | | | | | | | | | | | | | | | | |
| Class A | | | 26.32 | | | | (0.03 | ) | | | — | | | | 3.44 | | | | 3.41 | | | | — | | | | (4.42 | ) | | | — | | | | (4.42 | ) | | | (1.01 | ) | | | 25.31 | | | | 14.84 | | | | 1,837,361 | | | | 1.27 | | | | 1.27 | | | | 1.27 | | | | (0.13 | ) | | | 84 | |
| Class B | | | 24.77 | | | | (0.22 | ) | | | — | | | | 3.22 | | | | 3.00 | | | | — | | | | (4.42 | ) | | | — | | | | (4.42 | ) | | | (1.42 | ) | | | 23.35 | | | | 13.97 | | | | 449,488 | | | | 2.04 | | | | 2.04 | | | | 2.04 | | | | (0.90 | ) | | | — | |
| Class C | | | 24.86 | | | | (0.20 | ) | | | — | | | | 3.23 | | | | 3.03 | | | | — | | | | (4.42 | ) | | | — | | | | (4.42 | ) | | | (1.39 | ) | | | 23.47 | | | | 14.06 | | | | 499,039 | | | | 1.96 | | | | 1.96 | | | | 1.96 | | | | (0.82 | ) | | | — | |
| Class Y | | | 27.42 | | | | 0.08 | | | | — | | | | 3.60 | | | | 3.68 | | | | — | | | | (4.42 | ) | | | — | | | | (4.42 | ) | | | (0.74 | ) | | | 26.68 | | | | 15.31 | | | | 184,149 | | | | 0.81 | | | | 0.81 | | | | 0.81 | | | | 0.33 | | | | — | |
| For the Year Ended October 31, 2005 | | | | | | | | | | | | | | | | | | | | | | | | | | | | |
| Class A | | | 22.61 | | | | (0.05 | ) | | | — | | | | 4.24 | | | | 4.19 | | | | — | | | | (0.48 | ) | | | — | | | | (0.48 | ) | | | 3.71 | | | | 26.32 | | | | 18.85 | | | | 1,677,327 | | | | 1.30 | | | | 1.30 | | | | 1.30 | | | | (0.20 | ) | | | 74 | |
| Class B | | | 21.47 | | | | (0.24 | ) | | | — | | | | 4.02 | | | | 3.78 | | | | — | | | | (0.48 | ) | | | — | | | | (0.48 | ) | | | 3.30 | | | | 24.77 | | | | 17.92 | | | | 464,175 | | | | 2.08 | | | | 2.08 | | | | 2.08 | | | | (0.98 | ) | | | — | |
| Class C | | | 21.52 | | | | (0.22 | ) | | | — | | | | 4.04 | | | | 3.82 | | | | — | | | | (0.48 | ) | | | — | | | | (0.48 | ) | | | 3.34 | | | | 24.86 | | | | 18.07 | | | | 499,502 | | | | 1.99 | | | | 1.99 | | | | 1.99 | | | | (0.89 | ) | | | — | |
| Class Y | | | 23.43 | | | | 0.07 | | | | — | | | | 4.40 | | | | 4.47 | | | | — | | | | (0.48 | ) | | | — | | | | (0.48 | ) | | | 3.99 | | | | 27.42 | | | | 19.40 | | | | 139,273 | | | | 0.83 | | | | 0.83 | | | | 0.83 | | | | 0.26 | | | | — | |
396
| | | | | | | | | | | | | | | | | | | | | | | | | | | | | | | | | | | | | | | | | | | | | | | | | | | | | | | | | | | | | | | | | | | | | | | | | |
| | | — Selected Per-Share Data (a) — | | — Ratios and Supplemental Data — |
| | | | | | | | | | | | | | | | | | | | | | | | | | | | | Ratio of
| | Ratio of
| | Ratio of
| | | | |
| | | | | | | | | | | | | | | | | | | | | | | | | | | | | Expenses
| | Expenses
| | Expenses
| | | | |
| | | | | | | | | | | | | | | | | | | | | | | | | | | | | to Average
| | to Average
| | to Average
| | | | |
| | | | | | | | | Net
| | | | | | | | | | | | | | | | | | | | Net Assets
| | Net Assets
| | Net Assets
| | | | |
| | | | | | | | | Realized
| | | | | | | | | | | | Net
| | | | | | | | Before
| | After
| | After
| | Ratio of
| | |
| | | | | | | | | and
| | | | | | Distributions
| | | | | | Increase
| | | | | | | | Waivers and
| | Waivers and
| | Waivers and
| | Net
| | |
| | | Net Asset
| | Net
| | Payments
| | Unrealized
| | Total
| | Dividends
| | from
| | | | | | (Decrease)
| | Net Asset
| | | | Net Assets
| | Reimbursements
| | Reimbursements
| | Reimbursements
| | Investment
| | |
| | | Value at
| | Investment
| | from
| | Gain
| | from
| | from Net
| | Realized
| | Distributions
| | | | in Net
| | Value at
| | | | at End of
| | and Including
| | and Including
| | and Excluding
| | Income
| | Portfolio
|
| | | Beginning
| | Income
| | (to)
| | (Loss) on
| | Investment
| | Investment
| | Capital
| | from
| | Total
| | Asset
| | End
| | Total
| | Period
| | Interest
| | Interest
| | Interest
| | to Average
| | Turnover
|
| | | of Period | | (Loss) | | Affiliate | | Investments | | Operations | | Income | | Gains | | Capital | | Distributions | | Value | | of Period | | Return (b) | | (000’s) | | Expense (d) | | Expense (d) | | Expense (d) | | Net Assets | | Rate (c) |
The Hartford MidCap Fund — (continued) | | | | | | | | | | | | | | | | | | | | | | | | | | | | |
| For the Year Ended October 31, 2004 | | | | | | | | | | | | | | | | | | | | | | | | | | | | |
| Class A | | $ | 20.58 | | | $ | (0.09 | ) | | $ | — | | | $ | 2.12 | | | $ | 2.03 | | | $ | — | | | $ | — | | | $ | — | | | $ | — | | | $ | 2.03 | | | $ | 22.61 | | | | 9.86 | % | | $ | 1,544,968 | | | | 1.37 | % | | | 1.37 | % | | | 1.37 | % | | | (0.41 | )% | | | 52 | % |
| Class B | | | 19.68 | | | | (0.25 | ) | | | — | | | | 2.04 | | | | 1.79 | | | | — | | | | — | | | | — | | | | — | | | | 1.79 | | | | 21.47 | | | | 9.10 | | | | 438,658 | | | | 2.11 | | | | 2.11 | | | | 2.11 | | | | (1.15 | ) | | | — | |
| Class C | | | 19.71 | | | | (0.23 | ) | | | — | | | | 2.04 | | | | 1.81 | | | | — | | | | — | | | | — | | | | — | | | | 1.81 | | | | 21.52 | | | | 9.18 | | | | 484,268 | | | | 2.02 | | | | 2.02 | | | | 2.02 | | | | (1.06 | ) | | | — | |
| Class Y | | | 21.21 | | | | 0.02 | | | | — | | | | 2.20 | | | | 2.22 | | | | — | | | | — | | | | — | | | | — | | | | 2.22 | | | | 23.43 | | | | 10.47 | | | | 104,534 | | | | 0.85 | | | | 0.85 | | | | 0.85 | | | | 0.11 | | | | — | |
| For the Year Ended October 31, 2003 | | | | | | | | | | | | | | | | | | | | | | | | | | | | |
| Class A | | | 15.50 | | | | (0.08 | ) | | | — | | | | 5.16 | | | | 5.08 | | | | — | | | | — | | | | — | | | | — | | | | 5.08 | | | | 20.58 | | | | 32.77 | | | | 1,413,021 | | | | 1.50 | | | | 1.48 | | | | 1.48 | | | | (0.58 | ) | | | 70 | |
| Class B | | | 14.93 | | | | (0.20 | ) | | | — | | | | 4.95 | | | | 4.75 | | | | — | | | | — | | | | — | | | | — | | | | 4.75 | | | | 19.68 | | | | 31.82 | | | | 424,959 | | | | 2.23 | | | | 2.20 | | | | 2.20 | | | | (1.30 | ) | | | — | |
| Class C | | | 14.94 | | | | (0.18 | ) | | | — | | | | 4.95 | | | | 4.77 | | | | — | | | | — | | | | — | | | | — | | | | 4.77 | | | | 19.71 | | | | 31.93 | | | | 477,891 | | | | 2.10 | | | | 2.10 | | | | 2.10 | | | | (1.21 | ) | | | — | |
| Class Y | | | 15.88 | | | | — | | | | — | | | | 5.33 | | | | 5.33 | | | | — | | | | — | | | | — | | | | — | | | | 5.33 | | | | 21.21 | | | | 33.56 | | | | 83,996 | | | | 0.90 | | | | 0.90 | | | | 0.90 | | | | (0.01 | ) | | | — | |
The Hartford MidCap Growth Fund (formerly known as The Hartford Select MidCap Growth Fund) | | | | | | | | | | | | | | | | | | | | | | | | | | | | |
| For the Six-Month Period Ended April 30, 2008 (Unaudited) | | | | | | | | | | | | | | | | | | | | | | | | | | | | |
| Class A | | | 12.73 | | | | — | | | | — | | | | (1.43 | ) | | | (1.43 | ) | | | — | | | | (1.58 | ) | | | — | | | | (1.58 | ) | | | (3.01 | ) | | | 9.72 | | | | (12.09 | )(f) | | | 33,283 | | | | 1.50 | (e) | | | 1.34 | (e) | | | 1.34 | (e) | | | 0.05 | (e) | | | 96 | |
| Class B | | | 12.50 | | | | (0.04 | ) | | | — | | | | (1.39 | ) | | | (1.43 | ) | | | — | | | | (1.58 | ) | | | — | | | | (1.58 | ) | | | (3.01 | ) | | | 9.49 | | | | (12.34 | )(f) | | | 4,328 | | | | 2.50 | (e) | | | 1.85 | (e) | | | 1.85 | (e) | | | (0.86 | )(e) | | | — | |
| Class C | | | 12.46 | | | | (0.05 | ) | | | — | | | | (1.39 | ) | | | (1.44 | ) | | | — | | | | (1.58 | ) | | | — | | | | (1.58 | ) | | | (3.02 | ) | | | 9.44 | | | | (12.47 | )(f) | | | 4,996 | | | | 2.33 | (e) | | | 2.00 | (e) | | | 2.00 | (e) | | | (1.21 | )(e) | | | — | |
| Class Y | | | 12.88 | | | | 0.03 | | | | — | | | | (1.47 | ) | | | (1.44 | ) | | | — | | | | (1.58 | ) | | | — | | | | (1.58 | ) | | | (3.02 | ) | | | 9.86 | | | | (12.02 | )(f) | | | 219 | | | | 0.96 | (e) | | | 0.95 | (e) | | | 0.95 | (e) | | | 0.95 | (e) | | | — | |
| For the Year Ended October 31, 2007 | | | | | | | | | | | | | | | | | | | | | | | | | | | | |
| Class A | | | 11.28 | | | | (0.05 | ) | | | — | | | | 1.98 | | | | 1.93 | | | | — | | | | (0.48 | ) | | | — | | | | (0.48 | ) | | | 1.45 | | | | 12.73 | | | | 17.76 | | | | 22,074 | | | | 1.60 | | | | 1.37 | | | | 1.37 | | | | (0.43 | ) | | | 186 | |
| Class B | | | 11.14 | | | | (0.11 | ) | | | — | | | | 1.95 | | | | 1.84 | | | | — | | | | (0.48 | ) | | | — | | | | (0.48 | ) | | | 1.36 | | | | 12.50 | | | | 17.15 | | | | 4,509 | | | | 2.55 | | | | 1.96 | | | | 1.96 | | | | (1.01 | ) | | | — | |
| Class C | | | 11.13 | | | | (0.13 | ) | | | — | | | | 1.94 | | | | 1.81 | | | | — | | | | (0.48 | ) | | | — | | | | (0.48 | ) | | | 1.33 | | | | 12.46 | | | | 16.89 | | | | 4,772 | | | | 2.40 | | | | 2.12 | | | | 2.12 | | | | (1.17 | ) | | | — | |
| Class Y | | | 11.36 | | | | (0.57 | ) | | | — | | | | 2.57 | | | | 2.00 | | | | — | | | | (0.48 | ) | | | — | | | | (0.48 | ) | | | 1.52 | | | | 12.88 | | | | 18.28 | | | | 115 | | | | 1.11 | | | | 1.03 | | | | 1.03 | | | | (0.44 | ) | | | — | |
| For the Year Ended October 31, 2006 | | | | | | | | | | | | | | | | | | | | | | | | | | | | |
| Class A | | | 10.14 | | | | (0.08 | ) | | | — | | | | 1.32 | | | | 1.24 | | | | — | | | | (0.10 | ) | | | — | | | | (0.10 | ) | | | 1.14 | | | | 11.28 | | | | 12.31 | | | | 23,542 | | | | 1.69 | | | | 1.50 | | | | 1.50 | | | | (0.85 | ) | | | 99 | |
| Class B | | | 10.08 | | | | (0.15 | ) | | | — | | | | 1.31 | | | | 1.16 | | | | — | | | | (0.10 | ) | | | — | | | | (0.10 | ) | | | 1.06 | | | | 11.14 | | | | 11.58 | | | | 3,725 | | | | 2.67 | | | | 2.11 | | | | 2.11 | | | | (1.46 | ) | | | — | |
| Class C | | | 10.08 | | | | (0.15 | ) | | | — | | | | 1.30 | | | | 1.15 | | | | — | | | | (0.10 | ) | | | — | | | | (0.10 | ) | | | 1.05 | | | | 11.13 | | | | 11.48 | | | | 3,861 | | | | 2.52 | | | | 2.26 | | | | 2.26 | | | | (1.60 | ) | | | — | |
| Class Y | | | 10.17 | | | | (0.04 | ) | | | — | | | | 1.33 | | | | 1.29 | | | | — | | | | (0.10 | ) | | | — | | | | (0.10 | ) | | | 1.19 | | | | 11.36 | | | | 12.77 | | | | 28,868 | | | | 1.13 | | | | 1.11 | | | | 1.11 | | | | (0.45 | ) | | | — | |
| From (commencement of operations) January 1, 2005, through October 31, 2005 | | | | | | | | | | | | | | | | | | | | | | | | | | | | |
| Class A | | | 10.06 | | | | (0.06 | ) | | | — | | | | 0.14 | | | | 0.08 | | | | — | | | | — | | | | — | | | | — | | | | 0.08 | | | | 10.14 | | | | 0.80 | (f) | | | 14,995 | | | | 2.22 | (e) | | | 1.50 | (e) | | | 1.50 | (e) | | | (0.95 | )(e) | | | 97 | |
| Class B | | | 10.06 | | | | (0.09 | ) | | | — | | | | 0.11 | | | | 0.02 | | | | — | | | | — | | | | — | | | | — | | | | 0.02 | | | | 10.08 | | | | 0.20 | (f) | | | 2,354 | | | | 3.35 | (e) | | | 2.25 | (e) | | | 2.25 | (e) | | | (1.70 | )(e) | | | — | |
| Class C | | | 10.06 | | | | (0.09 | ) | | | — | | | | 0.11 | | | | 0.02 | | | | — | | | | — | | | | — | | | | — | | | | 0.02 | | | | 10.08 | | | | 0.20 | (f) | | | 1,741 | | | | 3.26 | (e) | | | 2.25 | (e) | | | 2.25 | (e) | | | (1.70 | )(e) | | | — | |
| Class Y | | | 10.06 | | | | (0.05 | ) | | | — | | | | 0.16 | | | | 0.11 | | | | — | | | | — | | | | — | | | | — | | | | 0.11 | | | | 10.17 | | | | 1.09 | (f) | | | 210 | | | | 1.66 | (e) | | | 1.10 | (e) | | | 1.10 | (e) | | | (0.55 | )(e) | | | — | |
The Hartford MidCap Value Fund | | | | | | | | | | | | | | | | | | | | | | | | | | | | |
| For the Six-Month Period Ended April 30, 2008 (Unaudited) | | | | | | | | | | | | | | | | | | | | | | | | | | | | |
| Class A | | | 14.80 | | | | 0.01 | | | | — | | | | (2.33 | ) | | | (2.32 | ) | | | — | | | | (2.48 | ) | | | — | | | | (2.48 | ) | | | (4.80 | ) | | | 10.00 | | | | (17.70 | )(f) | | | 225,688 | | | | 1.43 | (e) | | | 1.40 | (e) | | | 1.40 | (e) | | | 0.10 | (e) | | | 27 | |
| Class B | | | 13.95 | | | | (0.03 | ) | | | — | | | | (2.17 | ) | | | (2.20 | ) | | | — | | | | (2.48 | ) | | | — | | | | (2.48 | ) | | | (4.68 | ) | | | 9.27 | | | | (17.96 | )(f) | | | 43,270 | | | | 2.30 | (e) | | | 2.10 | (e) | | | 2.10 | (e) | | | (0.61 | )(e) | | | — | |
| Class C | | | 13.96 | | | | (0.03 | ) | | | — | | | | (2.18 | ) | | | (2.21 | ) | | | — | | | | (2.48 | ) | | | — | | | | (2.48 | ) | | | (4.69 | ) | | | 9.27 | | | | (18.04 | )(f) | | | 44,531 | | | | 2.14 | (e) | | | 2.14 | (e) | | | 2.14 | (e) | | | (0.64 | )(e) | | | — | |
| Class Y | | | 15.39 | | | | 0.01 | | | | — | | | | (2.42 | ) | | | (2.41 | ) | | | — | | | | (2.48 | ) | | | — | | | | (2.48 | ) | | | (4.89 | ) | | | 10.50 | | | | (17.58 | )(f) | | | 11,773 | | | | 0.94 | (e) | | | 0.94 | (e) | | | 0.94 | (e) | | | 0.49 | (e) | | | — | |
| For the Year Ended October 31, 2007 | | | | | | | | | | | | | | | | | | | | | | | | | | | | |
| Class A | | | 14.57 | | | | — | | | | — | | | | 2.14 | | | | 2.14 | | | | — | | | | (1.91 | ) | | | — | | | | (1.91 | ) | | | 0.23 | | | | 14.80 | | | | 16.72 | (i) | | | 311,227 | | | | 1.39 | | | | 1.39 | | | | 1.39 | | | | 0.00 | | | | 46 | |
| Class B | | | 13.93 | | | | (0.11 | ) | | | — | | | | 2.04 | | | | 1.93 | | | | — | | | | (1.91 | ) | | | — | | | | (1.91 | ) | | | 0.02 | | | | 13.95 | | | | 15.86 | (i) | | | 60,957 | | | | 2.23 | | | | 2.15 | | | | 2.15 | | | | (0.75 | ) | | | — | |
| Class C | | | 13.93 | | | | (0.10 | ) | | | — | | | | 2.04 | | | | 1.94 | | | | — | | | | (1.91 | ) | | | — | | | | (1.91 | ) | | | 0.03 | | | | 13.96 | | | | 15.94 | (i) | | | 63,292 | | | | 2.10 | | | | 2.10 | | | | 2.10 | | | | (0.70 | ) | | | — | |
| Class Y | | | 15.00 | | | | 0.14 | | | | 0.02 | | | | 2.14 | | | | 2.30 | | | | — | | | | (1.91 | ) | | | — | | | | (1.91 | ) | | | 0.39 | | | | 15.39 | | | | 17.38 | (i) | | | 1,961 | | | | 0.89 | | | | 0.89 | | | | 0.89 | | | | 0.70 | | | | — | |
| For the Year Ended October 31, 2006 | | | | | | | | | | | | | | | | | | | | | | | | | | | | |
| Class A | | | 13.29 | | | | 0.01 | | | | — | | | | 2.59 | | | | 2.60 | | | | — | | | | (1.32 | ) | | | — | | | | (1.32 | ) | | | 1.28 | | | | 14.57 | | | | 21.37 | | | | 305,002 | | | | 1.45 | | | | 1.40 | | | | 1.40 | | | | 0.06 | | | | 40 | |
| Class B | | | 12.85 | | | | (0.10 | ) | | | — | | | | 2.50 | | | | 2.40 | | | | — | | | | (1.32 | ) | | | — | | | | (1.32 | ) | | | 1.08 | | | | 13.93 | | | | 20.46 | | | | 62,580 | | | | 2.28 | | | | 2.15 | | | | 2.15 | | | | (0.69 | ) | | | — | |
| Class C | | | 12.85 | | | | (0.10 | ) | | | — | | | | 2.50 | | | | 2.40 | | | | — | | | | (1.32 | ) | | | — | | | | (1.32 | ) | | | 1.08 | | | | 13.93 | | | | 20.45 | | | | 63,302 | | | | 2.16 | | | | 2.15 | | | | 2.15 | | | | (0.69 | ) | | | — | |
| Class Y | | | 13.59 | | | | 0.08 | | | | — | | | | 2.65 | | | | 2.73 | | | | — | | | | (1.32 | ) | | | — | | | | (1.32 | ) | | | 1.41 | | | | 15.00 | | | | 21.90 | | | | 31,100 | | | | 0.94 | | | | 0.94 | | | | 0.94 | | | | 0.48 | | | | — | |
| For the Year Ended October 31, 2005 | | | | | | | | | | | | | | | | | | | | | | | | | | | | |
| Class A | | | 12.89 | | | | (0.04 | ) | | | — | | | | 1.41 | | | | 1.37 | | | | — | | | | (0.97 | ) | | | — | | | | (0.97 | ) | | | 0.40 | | | | 13.29 | | | | 11.31 | | | | 280,662 | | | | 1.49 | | | | 1.40 | | | | 1.40 | | | | (0.31 | ) | | | 49 | |
| Class B | | | 12.59 | | | | (0.14 | ) | | | — | | | | 1.37 | | | | 1.23 | | | | — | | | | (0.97 | ) | | | — | | | | (0.97 | ) | | | 0.26 | | | | 12.85 | | | | 10.40 | | | | 59,350 | | | | 2.33 | | | | 2.15 | | | | 2.15 | | | | (1.06 | ) | | | — | |
| Class C | | | 12.59 | | | | (0.15 | ) | | | — | | | | 1.38 | | | | 1.23 | | | | — | | | | (0.97 | ) | | | — | | | | (0.97 | ) | | | 0.26 | | | | 12.85 | | | | 10.40 | | | | 61,194 | | | | 2.19 | | | | 2.15 | | | | 2.15 | | | | (1.06 | ) | | | — | |
| Class Y | | | 13.11 | | | | 0.01 | | | | — | | | | 1.44 | | | | 1.45 | | | | — | | | | (0.97 | ) | | | — | | | | (0.97 | ) | | | 0.48 | | | | 13.59 | | | | 11.76 | | | | 39,965 | | | | 0.96 | | | | 0.96 | | | | 0.96 | | | | 0.13 | | | | — | |
| For the Year Ended October 31, 2004 | | | | | | | | | | | | | | | | | | | | | | | | | | | | |
| Class A | | | 11.32 | | | | (0.04 | ) | | | — | | | | 1.61 | | | | 1.57 | | | | — | | | | — | | | | — | | | | — | | | | 1.57 | | | | 12.89 | | | | 13.87 | | | | 280,173 | | | | 1.56 | | | | 1.45 | | | | 1.45 | | | | (0.03 | ) | | | 46 | |
| Class B | | | 11.12 | | | | (0.13 | ) | | | — | | | | 1.60 | | | | 1.47 | | | | — | | | | — | | | | — | | | | — | | | | 1.47 | | | | 12.59 | | | | 13.22 | | | | 60,558 | | | | 2.36 | | | | 2.15 | | | | 2.15 | | | | (1.04 | ) | | | — | |
| Class C | | | 11.13 | | | | (0.13 | ) | | | — | | | | 1.59 | | | | 1.46 | | | | — | | | | — | | | | — | | | | — | | | | 1.46 | | | | 12.59 | | | | 13.12 | | | | 67,132 | | | | 2.20 | | | | 2.15 | | | | 2.15 | | | | (1.04 | ) | | | — | |
| Class Y | | | 11.46 | | | | (0.01 | ) | | | — | | | | 1.66 | | | | 1.65 | | | | — | | | | — | | | | — | | | | — | | | | 1.65 | | | | 13.11 | | | | 14.40 | | | | 2,474 | | | | 0.90 | | | | 0.90 | | | | 0.90 | | | | (0.12 | ) | | | — | |
397
The Hartford Mutual Funds, Inc. and The Hartford Mutual Funds II, Inc.
Financial Highlights — (continued)
| | | | | | | | | | | | | | | | | | | | | | | | | | | | | | | | | | | | | | | | | | | | | | | | | | | | | | | | | | | | | | | | | | | | | | | | | |
| | | — Selected Per-Share Data (a) — | | — Ratios and Supplemental Data — |
| | | | | | | | | | | | | | | | | | | | | | | | | | | | | Ratio of
| | Ratio of
| | Ratio of
| | | | |
| | | | | | | | | | | | | | | | | | | | | | | | | | | | | Expenses
| | Expenses
| | Expenses
| | | | |
| | | | | | | | | | | | | | | | | | | | | | | | | | | | | to Average
| | to Average
| | to Average
| | | | |
| | | | | | | | | Net
| | | | | | | | | | | | | | | | | | | | Net Assets
| | Net Assets
| | Net Assets
| | | | |
| | | | | | | | | Realized
| | | | | | | | | | | | Net
| | | | | | | | Before
| | After
| | After
| | Ratio of
| | |
| | | | | | | | | and
| | | | | | Distributions
| | | | | | Increase
| | | | | | | | Waivers and
| | Waivers and
| | Waivers and
| | Net
| | |
| | | Net Asset
| | Net
| | Payments
| | Unrealized
| | Total
| | Dividends
| | from
| | | | | | (Decrease)
| | Net Asset
| | | | Net Assets
| | Reimbursements
| | Reimbursements
| | Reimbursements
| | Investment
| | |
| | | Value at
| | Investment
| | from
| | Gain
| | from
| | from Net
| | Realized
| | Distributions
| | | | in Net
| | Value at
| | | | at End of
| | and Including
| | and Including
| | and Excluding
| | Income
| | Portfolio
|
| | | Beginning
| | Income
| | (to)
| | (Loss) on
| | Investment
| | Investment
| | Capital
| | from
| | Total
| | Asset
| | End
| | Total
| | Period
| | Interest
| | Interest
| | Interest
| | to Average
| | Turnover
|
| | | of Period | | (Loss) | | Affiliate | | Investments | | Operations | | Income | | Gains | | Capital | | Distributions | | Value | | of Period | | Return (b) | | (000’s) | | Expense (d) | | Expense (d) | | Expense (d) | | Net Assets | | Rate (c) |
The Hartford MidCap Value Fund — (continued) | | | | | | | | | | | | | | | | | | | | | | | | | | | | |
| For the Year Ended October 31, 2003 (h) | | | | | | | | | | | | | | | | | | | | | | | | | | | | |
| Class A | | $ | 8.34 | | | $ | (0.03 | ) | | $ | — | | | $ | 3.01 | | | $ | 2.98 | | | $ | — | | | $ | — | | | $ | — | | | $ | — | | | $ | 2.98 | | | $ | 11.32 | | | | 35.73 | % | | $ | 155,614 | | | | 1.60 | % | | | 1.45 | % | | | 1.45 | % | | | (0.35 | )% | | | 56 | % |
| Class B | | | 8.25 | | | | (0.09 | ) | | | — | | | | 2.96 | | | | 2.87 | | | | — | | | | — | | | | — | | | | — | | | | 2.87 | | | | 11.12 | | | | 34.79 | | | | 42,407 | | | | 2.33 | | | | 2.15 | | | | 2.15 | | | | (1.05 | ) | | | — | |
| Class C | | | 8.25 | | | | (0.09 | ) | | | — | | | | 2.97 | | | | 2.88 | | | | — | | | | — | | | | — | | | | — | | | | 2.88 | | | | 11.13 | | | | 34.91 | | | | 49,566 | | | | 2.20 | | | | 2.15 | | | | 2.15 | | | | (1.05 | ) | | | — | |
| Class Y | | | 8.39 | | | | 0.02 | | | | — | | | | 3.05 | | | | 3.07 | | | | — | | | | — | | | | — | | | | — | | | | 3.07 | | | | 11.46 | | | | 36.59 | | | | 29 | | | | 1.03 | | | | 1.00 | | | | 1.00 | | | | 0.16 | | | | — | |
The Hartford Money Market Fund | | | | | | | | | | | | | | | | | | | | | | | | | | | | |
| For the Six-Month Period Ended April 30, 2008 (Unaudited) | | | | | | | | | | | | | | | | | | | | | | | | | | | | |
| Class A | | | 1.00 | | | | 0.02 | | | | — | | | | — | | | | 0.02 | | | | (0.02 | ) | | | — | | | | — | | | | (0.02 | ) | | | — | | | | 1.00 | | | | 1.54 | (f) | | | 402,637 | | | | 0.98 | (e) | | | 0.90 | (e) | | | 0.90 | (e) | | | 3.08 | (e) | | | N/A | |
| Class B | | | 1.00 | | | | 0.01 | | | | — | | | | — | | | | 0.01 | | | | (0.01 | ) | | | — | | | | — | | | | (0.01 | ) | | | — | | | | 1.00 | | | | 1.17 | (f) | | | 40,370 | | | | 1.71 | (e) | | | 1.65 | (e) | | | 1.65 | (e) | | | 2.28 | (e) | | | — | |
| Class C | | | 1.00 | | | | 0.01 | | | | — | | | | — | | | | 0.01 | | | | (0.01 | ) | | | — | | | | — | | | | (0.01 | ) | | | — | | | | 1.00 | | | | 1.21 | (f) | | | 111,051 | | | | 1.56 | (e) | | | 1.56 | (e) | | | 1.56 | (e) | | | 2.30 | (e) | | | — | |
| Class R3 | | | 1.00 | | | | 0.01 | | | | — | | | | — | | | | 0.01 | | | | (0.01 | ) | | | — | | | | — | | | | (0.01 | ) | | | — | | | | 1.00 | | | | 1.43 | (f) | | | 14 | | | | 1.35 | (e) | | | 1.15 | (e) | | | 1.15 | (e) | | | 2.83 | (e) | | | — | |
| Class R4 | | | 1.00 | | | | 0.02 | | | | — | | | | — | | | | 0.02 | | | | (0.02 | ) | | | — | | | | — | | | | (0.02 | ) | | | — | | | | 1.00 | | | | 1.57 | (f) | | | 62,384 | | | | 0.91 | (e) | | | 0.85 | (e) | | | 0.85 | (e) | | | 2.91 | (e) | | | — | |
| Class R5 | | | 1.00 | | | | 0.02 | | | | — | | | | — | | | | 0.02 | | | | (0.02 | ) | | | — | | | | — | | | | (0.02 | ) | | | — | | | | 1.00 | | | | 1.69 | (f) | | | 7,522 | | | | 0.61 | (e) | | | 0.61 | (e) | | | 0.61 | (e) | | | 2.89 | (e) | | | — | |
| Class Y | | | 1.00 | | | | 0.02 | | | | — | | | | — | | | | 0.02 | | | | (0.02 | ) | | | — | | | | — | | | | (0.02 | ) | | | — | | | | 1.00 | | | | 1.74 | (f) | | | 3,750 | | | | 0.51 | (e) | | | 0.51 | (e) | | | 0.51 | (e) | | | 3.49 | (e) | | | — | |
| For the Year Ended October 31, 2007 | | | | | | | | | | | | | | | | | | | | | | | | | | | | |
| Class A | | | 1.00 | | | | 0.04 | | | | — | | | | — | | | | 0.04 | | | | (0.04 | ) | | | — | | | | — | | | | (0.04 | ) | | | — | | | | 1.00 | | | | 4.49 | | | | 314,872 | | | | 1.13 | | | | 0.95 | | | | 0.95 | | | | 4.40 | | | | N/A | |
| Class B | | | 1.00 | | | | 0.04 | | | | — | | | | — | | | | 0.04 | | | | (0.04 | ) | | | — | | | | — | | | | (0.04 | ) | | | — | | | | 1.00 | | | | 3.71 | | | | 29,219 | | | | 1.82 | | | | 1.70 | | | | 1.70 | | | | 3.65 | | | | — | |
| Class C | | | 1.00 | | | | 0.04 | | | | — | | | | — | | | | 0.04 | | | | (0.04 | ) | | | — | | | | — | | | | (0.04 | ) | | | — | | | | 1.00 | | | | 3.72 | | | | 59,575 | | | | 1.72 | | | | 1.69 | | | | 1.69 | | | | 3.66 | | | | — | |
| Class Y | | | 1.00 | | | | 0.05 | | | | — | | | | — | | | | 0.05 | | | | (0.05 | ) | | | — | | | | — | | | | (0.05 | ) | | | — | | | | 1.00 | | | | 4.90 | | | | 2,707 | | | | 0.58 | | | | 0.55 | | | | 0.55 | | | | 4.77 | | | | — | |
| From (commencement of operations) December 22, 2006, through October 31, 2007 | | | | | | | | | | | | | | | | | | | | | | | | | | | | |
| Class R3 | | | 1.00 | | | | 0.04 | | | | — | | | | — | | | | 0.04 | | | | (0.04 | ) | | | — | | | | — | | | | (0.04 | ) | | | — | | | | 1.00 | | | | 3.63 | (f) | | | 10 | | | | 1.36 | (e) | | | 1.20 | (e) | | | 1.20 | (e) | | | 4.16 | (e) | | | — | |
| Class R4 | | | 1.00 | | | | 0.04 | | | | — | | | | — | | | | 0.04 | | | | (0.04 | ) | | | — | | | | — | | | | (0.04 | ) | | | — | | | | 1.00 | | | | 3.95 | (f) | | | 17,239 | | | | 1.01 | (e) | | | 0.90 | (e) | | | 0.90 | (e) | | | 4.49 | (e) | | | — | |
| Class R5 | | | 1.00 | | | | 0.04 | | | | — | | | | — | | | | 0.04 | | | | (0.04 | ) | | | — | | | | — | | | | (0.04 | ) | | | — | | | | 1.00 | | | | 4.18 | (f) | | | 1,229 | | | | 0.72 | (e) | | | 0.60 | (e) | | | 0.60 | (e) | | | 4.79 | (e) | | | — | |
| For the Year Ended October 31, 2006 | | | | | | | | | | | | | | | | | | | | | | | | | | | | |
| Class A | | | 1.00 | | | | 0.04 | | | | — | | | | — | | | | 0.04 | | | | (0.04 | ) | | | — | | | | — | | | | (0.04 | ) | | | — | | | | 1.00 | | | | 4.00 | | | | 207,592 | | | | 1.14 | | | | 0.95 | | | | 0.95 | | | | 3.95 | | | | N/A | |
| Class B | | | 1.00 | | | | 0.03 | | | | — | | | | — | | | | 0.03 | | | | (0.03 | ) | | | — | | | | — | | | | (0.03 | ) | | | — | | | | 1.00 | | | | 3.22 | | | | 27,995 | | | | 1.79 | | | | 1.70 | | | | 1.70 | | | | 3.18 | | | | — | |
| Class C | | | 1.00 | | | | 0.03 | | | | — | | | | — | | | | 0.03 | | | | (0.03 | ) | | | — | | | | — | | | | (0.03 | ) | | | — | | | | 1.00 | | | | 3.22 | | | | 16,997 | | | | 1.76 | | | | 1.70 | | | | 1.70 | | | | 3.20 | | | | — | |
| Class Y | | | 1.00 | | | | 0.04 | | | | — | | | | — | | | | 0.04 | | | | (0.04 | ) | | | — | | | | — | | | | (0.04 | ) | | | — | | | | 1.00 | | | | 4.34 | | | | 13,628 | | | | 0.61 | | | | 0.55 | | | | 0.55 | | | | 4.29 | | | | — | |
| For the Year Ended October 31, 2005 | | | | | | | | | | | | | | | | | | | | | | | | | | | | |
| Class A | | | 1.00 | | | | 0.02 | | | | — | | | | — | | | | 0.02 | | | | (0.02 | ) | | | — | | | | — | | | | (0.02 | ) | | | — | | | | 1.00 | | | | 1.99 | | | | 182,308 | | | | 1.22 | | | | 0.95 | | | | 0.95 | | | | 1.96 | | | | N/A | |
| Class B | | | 1.00 | | | | 0.01 | | | | — | | | | — | | | | 0.01 | | | | (0.01 | ) | | | — | | | | — | | | | (0.01 | ) | | | — | | | | 1.00 | | | | 1.23 | | | | 30,716 | | | | 1.88 | | | | 1.70 | | | | 1.70 | | | | 1.16 | | | | — | |
| Class C | | | 1.00 | | | | 0.01 | | | | — | | | | — | | | | 0.01 | | | | (0.01 | ) | | | — | | | | — | | | | (0.01 | ) | | | — | | | | 1.00 | | | | 1.23 | | | | 18,790 | | | | 1.80 | | | | 1.70 | | | | 1.70 | | | | 1.19 | | | | — | |
| Class Y | | | 1.00 | | | | 0.02 | | | | — | | | | — | | | | 0.02 | | | | (0.02 | ) | | | — | | | | — | | | | (0.02 | ) | | | — | | | | 1.00 | | | | 2.40 | | | | 16,114 | | | | 0.61 | | | | 0.55 | | | | 0.55 | | | | 2.47 | | | | — | |
| For the Year Ended October 31, 2004 | | | | | | | | | | | | | | | | | | | | | | | | | | | | |
| Class A | | | 1.00 | | | | 0.0030 | | | | — | | | | — | | | | 0.0030 | | | | (0.0030 | ) | | | — | | | | — | | | | (0.0030 | ) | | | — | | | | 1.00 | | | | 0.28 | | | | 205,442 | | | | 1.22 | | | | 1.00 | | | | 1.00 | | | | 0.27 | | | | N/A | |
| Class B | | | 1.00 | | | | 0.0001 | | | | — | | | | — | | | | 0.0001 | | | | (0.0001 | ) | | | — | | | | — | | | | (0.0001 | ) | | | — | | | | 1.00 | | | | 0.01 | | | | 45,836 | | | | 1.82 | | | | 1.25 | | | | 1.25 | | | | 0.01 | | | | — | |
| Class C | | | 1.00 | | | | 0.0001 | | | | — | | | | — | | | | 0.0001 | | | | (0.0001 | ) | | | — | | | | — | | | | (0.0001 | ) | | | — | | | | 1.00 | | | | 0.01 | | | | 26,626 | | | | 1.77 | | | | 1.27 | | | | 1.27 | | | | 0.01 | | | | — | |
| Class Y | | | 1.00 | | | | 0.0070 | | | | — | | | | — | | | | 0.0070 | | | | (0.0070 | ) | | | — | | | | — | | | | (0.0070 | ) | | | — | | | | 1.00 | | | | 0.72 | | | | 9,698 | | | | 0.56 | | | | 0.55 | | | | 0.55 | | | | 0.96 | | | | — | |
| For the Year Ended October 31, 2003 | | | | | | | | | | | | | | | | | | | | | | | | | | | | |
| Class A | | | 1.00 | | | | 0.003 | | | | — | | | | — | | | | 0.003 | | | | (0.003 | ) | | | — | | | | — | | | | (0.003 | ) | | | — | | | | 1.00 | | | | 0.32 | | | | 246,199 | | | | 1.28 | | | | 1.00 | | | | 1.00 | | | | 0.33 | | | | N/A | |
| Class B | | | 1.00 | | | | — | | | | — | | | | — | | | | — | | | | — | | | | — | | | | — | | | | — | | | | — | | | | 1.00 | | | | — | | | | 67,732 | | | | 2.01 | | | | 1.33 | (n) | | | 1.33 | (n) | | | 0.01 | | | | — | |
| Class C | | | 1.00 | | | | — | | | | — | | | | — | | | | — | | | | — | | | | — | | | | — | | | | — | | | | — | | | | 1.00 | | | | — | | | | 29,955 | | | | 1.89 | | | | 1.36 | (n) | | | 1.36 | (n) | | | 0.01 | | | | — | |
| Class Y | | | 1.00 | | | | 0.008 | | | | — | | | | — | | | | 0.008 | | | | (0.008 | ) | | | — | | | | — | | | | (0.008 | ) | | | — | | | | 1.00 | | | | 0.78 | | | | 1,162 | | | | 0.68 | | | | 0.55 | | | | 0.55 | | | | 0.84 | | | | — | |
The Hartford Retirement Income Fund (g) | | | | | | | | | | | | | | | | | | | | | | | | | | | | |
| For the Six-Month Period Ended April 30, 2008 (Unaudited) (h) | | | | | | | | | | | | | | | | | | | | | | | | | | | | |
| Class A | | | 10.09 | | | | 0.18 | | | | — | | | | (0.35 | ) | | | (0.17 | ) | | | (0.25 | ) | | | (0.14 | ) | | | — | | | | (0.39 | ) | | | (0.56 | ) | | | 9.53 | | | | (1.66 | )(f) | | | 3,670 | | | | 2.16 | | | | 0.49 | (e) | | | 0.49 | (e) | | | 3.87 | (e) | | | 9 | |
| Class B | | | 10.10 | | | | 0.15 | | | | — | | | | (0.35 | ) | | | (0.20 | ) | | | (0.22 | ) | | | (0.14 | ) | | | — | | | | (0.36 | ) | | | (0.56 | ) | | | 9.54 | | | | (2.02 | )(f) | | | 315 | | | | 2.98 | | | | 1.24 | (e) | | | 1.24 | (e) | | | 3.15 | (e) | | | — | |
| Class C | | | 10.11 | | | | 0.10 | | | | — | | | | (0.30 | ) | | | (0.20 | ) | | | (0.22 | ) | | | (0.14 | ) | | | — | | | | (0.36 | ) | | | (0.56 | ) | | | 9.55 | | | | (1.98 | )(f) | | | 977 | | | | 2.82 | | | | 1.25 | (e) | | | 1.25 | (e) | | | 2.07 | (e) | | | — | |
| Class R3 | | | 10.10 | | | | 0.10 | | | | — | | | | (0.30 | ) | | | (0.20 | ) | | | (0.23 | ) | | | (0.14 | ) | | | — | | | | (0.37 | ) | | | (0.57 | ) | | | 9.53 | | | | (1.93 | )(f) | | | 88 | | | | 2.35 | | | | 0.89 | (e) | | | 0.89 | (e) | | | 2.11 | (e) | | | — | |
| Class R4 | | | 10.10 | | | | 0.11 | | | | — | | | | (0.28 | ) | | | (0.17 | ) | | | (0.25 | ) | | | (0.14 | ) | | | — | | | | (0.39 | ) | | | (0.56 | ) | | | 9.54 | | | | (1.69 | )(f) | | | 1,340 | | | | 1.82 | | | | 0.60 | (e) | | | 0.60 | (e) | | | 2.14 | (e) | | | — | |
| Class R5 | | | 10.10 | | | | 0.11 | | | | — | | | | (0.26 | ) | | | (0.15 | ) | | | (0.26 | ) | | | (0.14 | ) | | | — | | | | (0.40 | ) | | | (0.55 | ) | | | 9.55 | | | | (1.45 | )(f) | | | 869 | | | | 1.66 | | | | 0.29 | (e) | | | 0.29 | (e) | | | 2.38 | (e) | | | — | |
| Class Y | | | 10.10 | | | | 0.21 | | | | — | | | | (0.36 | ) | | | (0.15 | ) | | | (0.27 | ) | | | (0.14 | ) | | | — | | | | (0.41 | ) | | | (0.56 | ) | | | 9.54 | | | | (1.50 | )(f) | | | 122 | | | | 1.90 | | | | 0.13 | (e) | | | 0.13 | (e) | | | 4.48 | (e) | | | — | |
| For the Year Ended October 31, 2007 | | | | | | | | | | | | | | | | | | | | | | | | | | | | |
| Class A | | | 9.59 | | | | 0.33 | | | | — | | | | 0.51 | | | | 0.84 | | | | (0.34 | ) | | | — | | | | — | | | | (0.34 | ) | | | 0.50 | | | | 10.09 | | | | 8.92 | | | | 3,016 | | | | 4.00 | | | | 0.48 | | | | 0.48 | | | | 3.12 | | | | 78 | |
| Class B | | | 9.59 | | | | 0.25 | | | | — | | | | 0.53 | | | | 0.78 | | | | (0.27 | ) | | | — | | | | — | | | | (0.27 | ) | | | 0.51 | | | | 10.10 | | | | 8.21 | | | | 216 | | | | 6.16 | | | | 1.23 | | | | 1.23 | | | | 2.55 | | | | — | |
| Class C | | | 9.61 | | | | 0.26 | | | | — | | | | 0.51 | | | | 0.77 | | | | (0.27 | ) | | | — | | | | — | | | | (0.27 | ) | | | 0.50 | | | | 10.11 | | | | 8.09 | | | | 244 | | | | 6.20 | | | | 1.23 | | | | 1.23 | | | | 2.61 | | | | — | |
| Class Y | | | 9.60 | | | | 0.36 | | | | — | | | | 0.51 | | | | 0.87 | | | | (0.37 | ) | | | — | | | | — | | | | (0.37 | ) | | | 0.50 | | | | 10.10 | | | | 9.22 | | | | 124 | | | | 5.16 | | | | 0.18 | | | | 0.18 | | | | 3.64 | | | | — | |
398
| | | | | | | | | | | | | | | | | | | | | | | | | | | | | | | | | | | | | | | | | | | | | | | | | | | | | | | | | | | | | | | | | | | | | | | | | |
| | | — Selected Per-Share Data (a) — | | — Ratios and Supplemental Data — |
| | | | | | | | | | | | | | | | | | | | | | | | | | | | | Ratio of
| | Ratio of
| | Ratio of
| | | | |
| | | | | | | | | | | | | | | | | | | | | | | | | | | | | Expenses
| | Expenses
| | Expenses
| | | | |
| | | | | | | | | | | | | | | | | | | | | | | | | | | | | to Average
| | to Average
| | to Average
| | | | |
| | | | | | | | | Net
| | | | | | | | | | | | | | | | | | | | Net Assets
| | Net Assets
| | Net Assets
| | | | |
| | | | | | | | | Realized
| | | | | | | | | | | | Net
| | | | | | | | Before
| | After
| | After
| | Ratio of
| | |
| | | | | | | | | and
| | | | | | Distributions
| | | | | | Increase
| | | | | | | | Waivers and
| | Waivers and
| | Waivers and
| | Net
| | |
| | | Net Asset
| | Net
| | Payments
| | Unrealized
| | Total
| | Dividends
| | from
| | | | | | (Decrease)
| | Net Asset
| | | | Net Assets
| | Reimbursements
| | Reimbursements
| | Reimbursements
| | Investment
| | |
| | | Value at
| | Investment
| | from
| | Gain
| | from
| | from Net
| | Realized
| | Distributions
| | | | in Net
| | Value at
| | | | at End of
| | and Including
| | and Including
| | and Excluding
| | Income
| | Portfolio
|
| | | Beginning
| | Income
| | (to)
| | (Loss) on
| | Investment
| | Investment
| | Capital
| | from
| | Total
| | Asset
| | End
| | Total
| | Period
| | Interest
| | Interest
| | Interest
| | to Average
| | Turnover
|
| | | of Period | | (Loss) | | Affiliate | | Investments | | Operations | | Income | | Gains | | Capital | | Distributions | | Value | | of Period | | Return (b) | | (000’s) | | Expense (d) | | Expense (d) | | Expense (d) | | Net Assets | | Rate (c) |
The Hartford Retirement Income Fund (g) — (continued) | | | | | | | | | | | | | | | | | | | | | | | | | | | | |
| From (commencement of operations) December 22, 2006, through October 31, 2007 | | | | | | | | | | | | | | | | | | | | | | | | | | | | |
| Class R3 | | $ | 9.66 | | | $ | 0.20 | | | $ | — | | | $ | 0.45 | | | $ | 0.65 | | | $ | (0.21 | ) | | $ | — | | | $ | — | | | $ | (0.21 | ) | | $ | 0.44 | | | $ | 10.10 | | | | 6.76 | %(f) | | $ | 11 | | | | 5.27 | % | | | 0.88 | %(e) | | | 0.88 | %(e) | | | 2.35 | %(e) | | | — | % |
| Class R4 | | | 9.66 | | | | 0.22 | | | | — | | | | 0.45 | | | | 0.67 | | | | (0.23 | ) | | | — | | | | — | | | | (0.23 | ) | | | 0.44 | | | | 10.10 | | | | 7.00 | (f) | | | 16 | | | | 4.85 | | | | 0.59 | (e) | | | 0.59 | (e) | | | 2.66 | (e) | | | — | |
| Class R5 | | | 9.66 | | | | 0.25 | | | | — | | | | 0.44 | | | | 0.69 | | | | (0.25 | ) | | | — | | | | — | | | | (0.25 | ) | | | 0.44 | | | | 10.10 | | | | 7.27 | (f) | | | 11 | | | | 4.65 | | | | 0.27 | (e) | | | 0.27 | (e) | | | 2.95 | (e) | | | — | |
| For the Year Ended October 31, 2006 | | | | | | | | | | | | | | | | | | | | | | | | | | | | |
| Class A | | | 9.87 | | | | 0.62 | | | | — | | | | (0.15 | ) | | | 0.47 | | | | (0.75 | ) | | | — | | | | — | | | | (0.75 | ) | | | (0.28 | ) | | | 9.59 | | | | 5.03 | | | | 420 | | | | 18.36 | | | | 0.54 | | | | 0.54 | | | | 2.54 | | | | 37 | |
| Class B | | | 9.87 | | | | 0.63 | | | | — | | | | (0.24 | ) | | | 0.39 | | | | (0.67 | ) | | | — | | | | — | | | | (0.67 | ) | | | (0.28 | ) | | | 9.59 | | | | 4.21 | | | | 173 | | | | 16.36 | | | | 1.30 | | | | 1.30 | | | | 1.89 | | | | — | |
| Class C | | | 9.87 | | | | 0.63 | | | | — | | | | (0.22 | ) | | | 0.41 | | | | (0.67 | ) | | | — | | | | — | | | | (0.67 | ) | | | (0.26 | ) | | | 9.61 | | | | 4.42 | | | | 161 | | | | 15.65 | | | | 1.30 | | | | 1.30 | | | | 1.88 | | | | — | |
| Class Y | | | 9.86 | | | | 0.71 | | | | — | | | | (0.19 | ) | | | 0.52 | | | | (0.78 | ) | | | — | | | | — | | | | (0.78 | ) | | | (0.26 | ) | | | 9.60 | | | | 5.55 | | | | 114 | | | | 15.43 | | | | 0.24 | | | | 0.24 | | | | 2.96 | | | | — | |
| From (commencement of operations) September 30, 2005, through October 31, 2005) | | | | | | | | | | | | | | | | | | | | | | | | | | | | |
| Class A | | | 10.00 | | | | 0.02 | | | | — | | | | (0.14 | ) | | | (0.12 | ) | | | (0.01 | ) | | | — | | | | — | | | | (0.01 | ) | | | (0.13 | ) | | | 9.87 | | | | (1.22 | )(f) | | | 47 | | | | 0.63 | (e) | | | 0.53 | (e) | | | 0.53 | (e) | | | 4.08 | (e) | | | 83 | |
| Class B | | | 10.00 | | | | 0.01 | | | | — | | | | (0.14 | ) | | | (0.13 | ) | | | — | | | | — | | | | — | | | | — | | | | (0.13 | ) | | | 9.87 | | | | (1.29 | )(f) | | | 10 | | | | 1.36 | (e) | | | 1.26 | (e) | | | 1.26 | (e) | | | 1.76 | (e) | | | — | |
| Class C | | | 10.00 | | | | 0.01 | | | | — | | | | (0.14 | ) | | | (0.13 | ) | | | — | | | | — | | | | — | | | | — | | | | (0.13 | ) | | | 9.87 | | | | (1.29 | )(f) | | | 10 | | | | 1.36 | (e) | | | 1.26 | (e) | | | 1.26 | (e) | | | 1.76 | (e) | | | — | |
| Class Y | | | 10.00 | | | | 0.01 | | | | — | | | | (0.14 | ) | | | (0.13 | ) | | | (0.01 | ) | | | — | | | | — | | | | (0.01 | ) | | | (0.14 | ) | | | 9.86 | | | | (1.30 | )(f) | | | 10 | | | | 0.28 | (e) | | | 0.28 | (e) | | | 0.28 | (e) | | | 2.75 | (e) | | | — | |
The Hartford Select MidCap Value Fund | | | | | | | | | | | | | | | | | | | | | | | | | | | | |
| For the Six-Month Period Ended April 30, 2008 (Unaudited) | | | | | | | | | | | | | | | | | | | | | | | | | | | | |
| Class A | | | 12.17 | | | | 0.05 | | | | — | | | | (1.41 | ) | | | (1.36 | ) | | | (0.01 | ) | | | (1.23 | ) | | | — | | | | (1.24 | ) | | | (2.60 | ) | | | 9.57 | | | | (11.86 | )(f) | | | 25,021 | | | | 1.43 | (e) | | | 1.30 | (e) | | | 1.30 | (e) | | | 0.87 | (e) | | | 75 | |
| Class B | | | 11.96 | | | | 0.02 | | | | — | | | | (1.38 | ) | | | (1.36 | ) | | | — | | | | (1.23 | ) | | | — | | | | (1.23 | ) | | | (2.59 | ) | | | 9.37 | | | | (12.10 | )(f) | | | 3,366 | | | | 2.43 | (e) | | | 1.81 | (e) | | | 1.81 | (e) | | | 0.34 | (e) | | | — | |
| Class C | | | 11.95 | | | | — | | | | — | | | | (1.37 | ) | | | (1.37 | ) | | | — | | | | (1.23 | ) | | | — | | | | (1.23 | ) | | | (2.60 | ) | | | 9.35 | | | | (12.20 | )(f) | | | 4,994 | | | | 2.20 | (e) | | | 2.02 | (e) | | | 2.02 | (e) | | | 0.15 | (e) | | | — | |
| Class Y | | | 12.21 | | | | 0.06 | | | | — | | | | (1.40 | ) | | | (1.34 | ) | | | (0.06 | ) | | | (1.23 | ) | | | — | | | | (1.29 | ) | | | (2.63 | ) | | | 9.58 | | | | (11.66 | )(f) | | | 49,123 | | | | 0.87 | (e) | | | 0.87 | (e) | | | 0.87 | (e) | | | 1.26 | (e) | | | — | |
| For the Year Ended October 31, 2007 | | | | | | | | | | | | | | | | | | | | | | | | | | | | |
| Class A | | | 12.41 | | | | 0.05 | | | | — | | | | 0.21 | | | | 0.26 | | | | — | | | | (0.50 | ) | | | — | | | | (0.50 | ) | | | (0.24 | ) | | | 12.17 | | | | 2.16 | | | | 39,238 | | | | 1.42 | | | | 1.33 | | | | 1.33 | | | | 0.38 | | | | 209 | |
| Class B | | | 12.28 | | | | (0.04 | ) | | | — | | | | 0.22 | | | | 0.18 | | | | — | | | | (0.50 | ) | | | — | | | | (0.50 | ) | | | (0.32 | ) | | | 11.96 | | | | 1.51 | | | | 4,322 | | | | 2.35 | | | | 2.01 | | | | 2.01 | | | | (0.29 | ) | | | — | |
| Class C | | | 12.28 | | | | (0.04 | ) | | | — | | | | 0.21 | | | | 0.17 | | | | — | | | | (0.50 | ) | | | — | | | | (0.50 | ) | | | (0.33 | ) | | | 11.95 | | | | 1.42 | | | | 8,300 | | | | 2.17 | | | | 2.07 | | | | 2.07 | | | | (0.36 | ) | | | — | |
| Class Y | | | 12.40 | | | | 0.03 | | | | — | | | | 0.28 | | | | 0.31 | | | | — | | | | (0.50 | ) | | | — | | | | (0.50 | ) | | | (0.19 | ) | | | 12.21 | | | | 2.58 | | | | 53,873 | | | | 0.84 | | | | 0.83 | | | | 0.83 | | | | 0.83 | | | | — | |
| For the Year Ended October 31, 2006 | | | | | | | | | | | | | | | | | | | | | | | | | | | | |
| Class A | | | 10.79 | | | | — | | | | — | | | | 1.87 | | | | 1.87 | | | | (0.01 | ) | | | (0.24 | ) | | | — | | | | (0.25 | ) | | | 1.62 | | | | 12.41 | | | | 17.66 | | | | 47,937 | | | | 1.69 | | | | 1.55 | | | | 1.55 | | | | (0.10 | ) | | | 63 | |
| Class B | | | 10.75 | | | | (0.10 | ) | | | — | | | | 1.87 | | | | 1.77 | | | | — | | | | (0.24 | ) | | | — | | | | (0.24 | ) | | | 1.53 | | | | 12.28 | | | | 16.79 | | | | 4,137 | | | | 2.67 | | | | 2.30 | | | | 2.30 | | | | (0.84 | ) | | | — | |
| Class C | | | 10.75 | | | | (0.09 | ) | | | — | | | | 1.86 | | | | 1.77 | | | | — | | | | (0.24 | ) | | | — | | | | (0.24 | ) | | | 1.53 | | | | 12.28 | | | | 16.79 | | | | 7,417 | | | | 2.53 | | | | 2.30 | | | | 2.30 | | | | (0.84 | ) | | | — | |
| Class Y | | | 10.81 | | | | 0.07 | | | | — | | | | 1.81 | | | | 1.88 | | | | (0.05 | ) | | | (0.24 | ) | | | — | | | | (0.29 | ) | | | 1.59 | | | | 12.40 | | | | 17.79 | | | | 20,025 | | | | 1.33 | | | | 1.15 | | | | 1.15 | | | | 0.26 | | | | — | |
| From (commencement of operations) April 29, 2005, through October 31, 2005 | | | | | | | | | | | | | | | | | | | | | | | | | | | | |
| Class A | | | 10.00 | | | | — | | | | — | | | | 0.79 | | | | 0.79 | | | | — | | | | — | | | | — | | | | — | | | | 0.79 | | | | 10.79 | | | | 7.90 | (f) | | | 22,423 | | | | 1.67 | (e) | | | 1.55 | (e) | | | 1.55 | (e) | | | (0.08 | )(e) | | | 30 | |
| Class B | | | 10.00 | | | | (0.03 | ) | | | — | | | | 0.78 | | | | 0.75 | | | | — | | | | — | | | | — | | | | — | | | | 0.75 | | | | 10.75 | | | | 7.50 | (f) | | | 1,714 | | | | 2.64 | (e) | | | 2.30 | (e) | | | 2.30 | (e) | | | (0.92 | )(e) | | | — | |
| Class C | | | 10.00 | | | | (0.03 | ) | | | — | | | | 0.78 | | | | 0.75 | | | | — | | | | — | | | | — | | | | — | | | | 0.75 | | | | 10.75 | | | | 7.50 | (f) | | | 2,885 | | | | 2.53 | (e) | | | 2.30 | (e) | | | 2.30 | (e) | | | (0.96 | )(e) | | | — | |
| Class Y | | | 10.00 | | | | 0.02 | | | | — | | | | 0.79 | | | | 0.81 | | | | — | | | | — | | | | — | | | | — | | | | 0.81 | | | | 10.81 | | | | 8.10 | (f) | | | 541 | | | | 1.36 | (e) | | | 1.15 | (e) | | | 1.15 | (e) | | | 0.37 | (e) | | | — | |
The Hartford Select SmallCap Value Fund | | | | | | | | | | | | | | | | | | | | | | | | | | | | |
| For the Six-Month Period Ended April 30, 2008 (Unaudited) | | | | | | | | | | | | | | | | | | | | | | | | | | | | |
| Class A | | | 11.79 | | | | 0.04 | | | | — | | | | (1.79 | ) | | | (1.75 | ) | | | (0.06 | ) | | | (0.75 | ) | | | — | | | | (0.81 | ) | | | (2.56 | ) | | | 9.23 | | | | (15.60 | )(f) | | | 16,611 | | | | 1.40 | (e) | | | 1.40 | (e) | | | 1.40 | (e) | | | 0.90 | (e) | | | 14 | |
| Class B | | | 11.65 | | | | — | | | | — | | | | (1.77 | ) | | | (1.77 | ) | | | — | | | | (0.75 | ) | | | — | | | | (0.75 | ) | | | (2.52 | ) | | | 9.13 | | | | (15.94 | )(f) | | | 498 | | | | 2.48 | (e) | | | 2.27 | (e) | | | 2.27 | (e) | | | 0.03 | (e) | | | — | |
| Class C | | | 11.66 | | | | — | | | | — | | | | (1.77 | ) | | | (1.77 | ) | | | — | | | | (0.75 | ) | | | — | | | | (0.75 | ) | | | (2.52 | ) | | | 9.14 | | | | (15.92 | )(f) | | | 756 | | | | 2.49 | (e) | | | 2.26 | (e) | | | 2.26 | (e) | | | 0.04 | (e) | | | — | |
| Class Y | | | 11.80 | | | | 0.05 | | | | — | | | | (1.78 | ) | | | (1.73 | ) | | | (0.09 | ) | | | (0.75 | ) | | | — | | | | (0.84 | ) | | | (2.57 | ) | | | 9.23 | | | | (15.43 | )(f) | | | 89,217 | | | | 1.09 | (e) | | | 1.09 | (e) | | | 1.09 | (e) | | | 1.20 | (e) | | | — | |
| For the Year Ended October 31, 2007 | | | | | | | | | | | | | | | | | | | | | | | | | | | | |
| Class A | | | 10.96 | | | | 0.07 | | | | — | | | | 0.78 | | | | 0.85 | | | | — | | | | (0.02 | ) | | | — | | | | (0.02 | ) | | | 0.83 | | | | 11.79 | | | | 7.78 | | | | 19,106 | | | | 1.40 | | | | 1.40 | | | | 1.40 | | | | 0.67 | | | | 58 | |
| Class B | | | 10.93 | | | | (0.02 | ) | | | — | | | | 0.76 | | | | 0.74 | | | | — | | | | (0.02 | ) | | | — | | | | (0.02 | ) | | | 0.72 | | | | 11.65 | | | | 6.79 | | | | 587 | | | | 2.38 | | | | 2.36 | | | | 2.36 | | | | (0.25 | ) | | | — | |
| Class C | | | 10.93 | | | | (0.02 | ) | | | — | | | | 0.77 | | | | 0.75 | | | | — | | | | (0.02 | ) | | | — | | | | (0.02 | ) | | | 0.73 | | | | 11.66 | | | | 6.88 | | | | 749 | | | | 2.33 | | | | 2.33 | | | | 2.33 | | | | (0.27 | ) | | | — | |
| Class Y | | | 10.97 | | | | 0.10 | | | | — | | | | 0.78 | | | | 0.88 | | | | (0.03 | ) | | | (0.02 | ) | | | — | | | | (0.05 | ) | | | 0.83 | | | | 11.80 | | | | 8.09 | | | | 91,189 | | | | 1.13 | | | | 1.13 | | | | 1.13 | | | | 0.97 | | | | — | |
| From (commencement of operations) July 31, 2006, through October 31, 2006 (h) | | | | | | | | | | | | | | | | | | | | | | | | | | | | |
| Class A | | | 10.00 | | | | 0.02 | | | | — | | | | 0.94 | | | | 0.96 | | | | — | | | | — | | | | — | | | | — | | | | 0.96 | | | | 10.96 | | | | 9.60 | (f) | | | 15,872 | | | | 1.73 | (e) | | | 1.60 | (e) | | | 1.60 | (e) | | | 0.78 | (e) | | | 10 | |
| Class B | | | 10.00 | | | | — | | | | — | | | | 0.93 | | | | 0.93 | | | | — | | | | — | | | | — | | | | — | | | | 0.93 | | | | 10.93 | | | | 9.30 | (f) | | | 308 | | | | 2.53 | (e) | | | 2.35 | (e) | | | 2.35 | (e) | | | 0.03 | (e) | | | — | |
| Class C | | | 10.00 | | | | — | | | | — | | | | 0.93 | | | | 0.93 | | | | — | | | | — | | | | — | | | | — | | | | 0.93 | | | | 10.93 | | | | 9.30 | (f) | | | 280 | | | | 2.51 | (e) | | | 2.35 | (e) | | | 2.35 | (e) | | | 0.03 | (e) | | | — | |
| Class Y | | | 10.00 | | | | 0.01 | | | | — | | | | 0.96 | | | | 0.97 | | | | — | | | | — | | | | — | | | | — | | | | 0.97 | | | | 10.97 | | | | 9.70 | (f) | | | 1,538 | | | | 1.71 | (e) | | | 1.20 | (e) | | | 1.20 | (e) | | | 0.79 | (e) | | | — | |
The Hartford Short Duration Fund | | | | | | | | | | | | | | | | | | | | | | | | | | | | |
| For the Six-Month Period Ended April 30, 2008 (Unaudited) | | | | | | | | | | | | | | | | | | | | | | | | | | | | |
| Class A | | | 9.82 | | | | 0.20 | | | | — | | | | (0.27 | ) | | | (0.07 | ) | | | (0.20 | ) | | | — | | | | — | | | | (0.20 | ) | | | (0.27 | ) | | | 9.55 | | | | (0.71 | )(f) | | | 37,470 | | | | 0.94 | (e) | | | 0.90 | (e) | | | 0.90 | (e) | | | 4.11 | (e) | | | 41 | |
| Class B | | | 9.82 | | | | 0.17 | | | | — | | | | (0.27 | ) | | | (0.10 | ) | | | (0.17 | ) | | | — | | | | — | | | | (0.17 | ) | | | (0.27 | ) | | | 9.55 | | | | (1.08 | )(f) | | | 5,768 | | | | 1.83 | (e) | | | 1.65 | (e) | | | 1.65 | (e) | | | 3.41 | (e) | | | — | |
| Class C | | | 9.82 | | | | 0.17 | | | | — | | | | (0.26 | ) | | | (0.09 | ) | | | (0.17 | ) | | | — | | | | — | | | | (0.17 | ) | | | (0.26 | ) | | | 9.56 | | | | (0.98 | )(f) | | | 29,297 | | | | 1.68 | (e) | | | 1.65 | (e) | | | 1.65 | (e) | | | 3.35 | (e) | | | — | |
| Class Y | | | 9.81 | | | | 0.22 | | | | — | | | | (0.27 | ) | | | (0.05 | ) | | | (0.22 | ) | | | — | | | | — | | | | (0.22 | ) | | | (0.27 | ) | | | 9.54 | | | | (0.56 | )(f) | | | 139,375 | | | | 0.58 | (e) | | | 0.58 | (e) | | | 0.58 | (e) | | | 4.48 | (e) | | | — | |
399
The Hartford Mutual Funds, Inc. and The Hartford Mutual Funds II, Inc.
Financial Highlights — (continued)
| | | | | | | | | | | | | | | | | | | | | | | | | | | | | | | | | | | | | | | | | | | | | | | | | | | | | | | | | | | | | | | | | | | | | | | | | |
| | | — Selected Per-Share Data (a) — | | — Ratios and Supplemental Data — |
| | | | | | | | | | | | | | | | | | | | | | | | | | | | | Ratio of
| | Ratio of
| | Ratio of
| | | | |
| | | | | | | | | | | | | | | | | | | | | | | | | | | | | Expenses
| | Expenses
| | Expenses
| | | | |
| | | | | | | | | | | | | | | | | | | | | | | | | | | | | to Average
| | to Average
| | to Average
| | | | |
| | | | | | | | | Net
| | | | | | | | | | | | | | | | | | | | Net Assets
| | Net Assets
| | Net Assets
| | | | |
| | | | | | | | | Realized
| | | | | | | | | | | | Net
| | | | | | | | Before
| | After
| | After
| | Ratio of
| | |
| | | | | | | | | and
| | | | | | Distributions
| | | | | | Increase
| | | | | | | | Waivers and
| | Waivers and
| | Waivers and
| | Net
| | |
| | | Net Asset
| | Net
| | Payments
| | Unrealized
| | Total
| | Dividends
| | from
| | | | | | (Decrease)
| | Net Asset
| | | | Net Assets
| | Reimbursements
| | Reimbursements
| | Reimbursements
| | Investment
| | |
| | | Value at
| | Investment
| | from
| | Gain
| | from
| | from Net
| | Realized
| | Distributions
| | | | in Net
| | Value at
| | | | at End of
| | and Including
| | and Including
| | and Excluding
| | Income
| | Portfolio
|
| | | Beginning
| | Income
| | (to)
| | (Loss) on
| | Investment
| | Investment
| | Capital
| | from
| | Total
| | Asset
| | End
| | Total
| | Period
| | Interest
| | Interest
| | Interest
| | to Average
| | Turnover
|
| | | of Period | | (Loss) | | Affiliate | | Investments | | Operations | | Income | | Gains | | Capital | | Distributions | | Value | | of Period | | Return (b) | | (000’s) | | Expense (d) | | Expense (d) | | Expense (d) | | Net Assets | | Rate (c) |
The Hartford Short Duration Fund — (continued) | | | | | | | | | | | | | | | | | | | | | | | | | | | | |
| For the Year Ended October 31, 2007 | | | | | | | | | | | | | | | | | | | | | | | | | | | | |
| Class A | | $ | 9.89 | | | $ | 0.44 | | | $ | — | | | $ | (0.07 | ) | | $ | 0.37 | | | $ | (0.44 | ) | | $ | — | | | $ | — | | | $ | (0.44 | ) | | $ | (0.07 | ) | | $ | 9.82 | | | | 3.80 | % | | $ | 34,606 | | | | 1.04 | % | | | 0.90 | % | | | 0.90 | % | | | 4.49 | % | | | 68 | % |
| Class B | | | 9.90 | | | | 0.37 | | | | — | | | | (0.09 | ) | | | 0.28 | | | | (0.36 | ) | | | — | | | | — | | | | (0.36 | ) | | | (0.08 | ) | | | 9.82 | | | | 2.91 | | | | 6,349 | | | | 1.90 | | | | 1.65 | | | | 1.65 | | | | 3.73 | | | | — | |
| Class C | | | 9.90 | | | | 0.37 | | | | — | | | | (0.09 | ) | | | 0.28 | | | | (0.36 | ) | | | — | | | | — | | | | (0.36 | ) | | | (0.08 | ) | | | 9.82 | | | | 2.91 | | | | 22,322 | | | | 1.77 | | | | 1.65 | | | | 1.65 | | | | 3.74 | | | | — | |
| Class Y | | | 9.88 | | | | 0.47 | | | | — | | | | (0.08 | ) | | | 0.39 | | | | (0.46 | ) | | | — | | | | — | | | | (0.46 | ) | | | (0.07 | ) | | | 9.81 | | | | 4.08 | | | | 142,224 | | | | 0.64 | | | | 0.64 | | | | 0.64 | | | | 4.75 | | | | — | |
| For the Year Ended October 31, 2006 | | | | | | | | | | | | | | | | | | | | | | | | | | | | |
| Class A | | | 9.85 | | | | 0.35 | | | | — | | | | 0.04 | | | | 0.39 | | | | (0.35 | ) | | | — | | | | — | | | | (0.35 | ) | | | 0.04 | | | | 9.89 | | | | 4.02 | | | | 26,726 | | | | 1.10 | | | | 0.90 | | | | 0.90 | | | | 3.53 | | | | 119 | |
| Class B | | | 9.85 | | | | 0.27 | | | | — | | | | 0.05 | | | | 0.32 | | | | (0.27 | ) | | | — | | | | — | | | | (0.27 | ) | | | 0.05 | | | | 9.90 | | | | 3.33 | | | | 6,760 | | | | 1.92 | | | | 1.65 | | | | 1.65 | | | | 2.77 | | | | — | |
| Class C | | | 9.85 | | | | 0.27 | | | | — | | | | 0.05 | | | | 0.32 | | | | (0.27 | ) | | | — | | | | — | | | | (0.27 | ) | | | 0.05 | | | | 9.90 | | | | 3.33 | | | | 14,382 | | | | 1.83 | | | | 1.65 | | | | 1.65 | | | | 2.76 | | | | — | |
| Class Y | | | 9.84 | | | | 0.37 | | | | — | | | | 0.04 | | | | 0.41 | | | | (0.37 | ) | | | — | | | | — | | | | (0.37 | ) | | | 0.04 | | | | 9.88 | | | | 4.28 | | | | 102,198 | | | | 0.68 | | | | 0.65 | | | | 0.65 | | | | 3.78 | | | | — | |
| For the Year Ended October 31, 2005 | | | | | | | | | | | | | | | | | | | | | | | | | | | | |
| Class A | | | 10.08 | | | | 0.33 | | | | — | | | | (0.24 | ) | | | 0.09 | | | | (0.32 | ) | | | — | | | | — | | | | (0.32 | ) | | | (0.23 | ) | | | 9.85 | | | | 0.92 | | | | 29,212 | | | | 1.05 | | | | 0.90 | | | | 0.90 | | | | 3.23 | | | | 123 | |
| Class B | | | 10.08 | | | | 0.25 | | | | — | | | | (0.23 | ) | | | 0.02 | | | | (0.25 | ) | | | — | | | | — | | | | (0.25 | ) | | | (0.23 | ) | | | 9.85 | | | | 0.17 | | | | 8,814 | | | | 1.89 | | | | 1.65 | | | | 1.65 | | | | 2.47 | | | | — | |
| Class C | | | 10.08 | | | | 0.25 | | | | — | | | | (0.23 | ) | | | 0.02 | | | | (0.25 | ) | | | — | | | | — | | | | (0.25 | ) | | | (0.23 | ) | | | 9.85 | | | | 0.17 | | | | 22,973 | | | | 1.78 | | | | 1.65 | | | | 1.65 | | | | 2.47 | | | | — | |
| Class Y | | | 10.07 | | | | 0.35 | | | | — | | | | (0.23 | ) | | | 0.12 | | | | (0.35 | ) | | | — | | | | — | | | | (0.35 | ) | | | (0.23 | ) | | | 9.84 | | | | 1.18 | | | | 82,439 | | | | 0.67 | | | | 0.65 | | | | 0.65 | | | | 3.53 | | | | — | |
| For the Year Ended October 31, 2004 | | | | | | | | | | | | | | | | | | | | | | | | | | | | |
| Class A | | | 10.14 | | | | 0.30 | | | | — | | | | (0.06 | ) | | | 0.24 | | | | (0.30 | ) | | | — | | | | — | | | | (0.30 | ) | | | (0.06 | ) | | | 10.08 | | | | 2.40 | | | | 39,148 | | | | 1.06 | | | | 0.95 | | | | 0.95 | | | | 2.95 | | | | 108 | |
| Class B | | | 10.14 | | | | 0.23 | | | | — | | | | (0.06 | ) | | | 0.17 | | | | (0.23 | ) | | | — | | | | — | | | | (0.23 | ) | | | (0.06 | ) | | | 10.08 | | | | 1.68 | | | | 12,267 | | | | 1.84 | | | | 1.65 | | | | 1.65 | | | | 2.26 | | | | — | |
| Class C | | | 10.14 | | | | 0.23 | | | | — | | | | (0.06 | ) | | | 0.17 | | | | (0.23 | ) | | | — | | | | — | | | | (0.23 | ) | | | (0.06 | ) | | | 10.08 | | | | 1.68 | | | | 34,949 | | | | 1.76 | | | | 1.65 | | | | 1.65 | | | | 2.26 | | | | — | |
| From inception November 28, 2003, through October 31, 2004 | | | | | | | | | | | | | | | | | | | | | | | | | | | | |
| Class Y | | | 10.11 | | | | 0.30 | | | | — | | | | (0.04 | ) | | | 0.26 | | | | (0.30 | ) | | | — | | | | — | | | | (0.30 | ) | | | (0.04 | ) | | | 10.07 | | | | 2.62 | (f) | | | 31,429 | | | | 0.61 | (e) | | | 0.60 | (e) | | | 0.60 | (e) | | | 3.03 | (e) | | | — | |
| From inception October 31, 2002, through October 31, 2003 | | | | | | | | | | | | | | | | | | | | | | | | | | | | |
| Class A | | | 10.00 | | | | 0.30 | | | | — | | | | 0.14 | | | | 0.44 | | | | (0.30 | ) | | | — | | | | — | | | | (0.30 | ) | | | 0.14 | | | | 10.14 | | | | 4.48 | (f) | | | 32,753 | | | | 1.34 | (e) | | | 0.95 | (e) | | | 0.95 | (e) | | | 3.14 | (e) | | | 113 | |
| Class B | | | 10.00 | | | | 0.23 | | | | — | | | | 0.14 | | | | 0.37 | | | | (0.23 | ) | | | — | | | | — | | | | (0.23 | ) | | | 0.14 | | | | 10.14 | | | | 3.77 | (f) | | | 10,206 | | | | 2.09 | (e) | | | 1.65 | (e) | | | 1.65 | (e) | | | 2.46 | (e) | | | — | |
| Class C | | | 10.00 | | | | 0.23 | | | | — | | | | 0.14 | | | | 0.37 | | | | (0.23 | ) | | | — | | | | — | | | | (0.23 | ) | | | 0.14 | | | | 10.14 | | | | 3.77 | (f) | | | 30,660 | | | | 1.96 | (e) | | | 1.65 | (e) | | | 1.65 | (e) | | | 2.44 | (e) | | | — | |
The Hartford Small Company Fund | | | | | | | | | | | | | | | | | | | | | | | | | | | | |
| For the Six-Month Period Ended April 30, 2008 (Unaudited) | | | | | | | | | | | | | | | | | | | | | | | | | | | | |
| Class A | | | 24.46 | | | | (0.03 | ) | | | — | | | | (3.08 | ) | | | (3.11 | ) | | | — | | | | (2.63 | ) | | | — | | | | (2.63 | ) | | | (5.74 | ) | | | 18.72 | | | | (13.58 | )(f) | | | 334,888 | | | | 1.38 | (e) | | | 1.38 | (e) | | | 1.38 | (e) | | | (0.33 | )(e) | | | 73 | |
| Class B | | | 22.30 | | | | (0.10 | ) | | | — | | | | (2.77 | ) | | | (2.87 | ) | | | — | | | | (2.63 | ) | | | — | | | | (2.63 | ) | | | (5.50 | ) | | | 16.80 | | | | (13.85 | )(f) | | | 35,898 | | | | 2.29 | (e) | | | 2.05 | (e) | | | 2.05 | (e) | | | (0.99 | )(e) | | | — | |
| Class C | | | 22.32 | | | | (0.09 | ) | | | — | | | | (2.80 | ) | | | (2.89 | ) | | | — | | | | (2.63 | ) | | | — | | | | (2.63 | ) | | | (5.52 | ) | | | 16.80 | | | | (13.93 | )(f) | | | 55,543 | | | | 2.14 | (e) | | | 2.14 | (e) | | | 2.14 | (e) | | | (1.08 | )(e) | | | — | |
| Class I | | | 24.55 | | | | — | | | | — | | | | (3.09 | ) | | | (3.09 | ) | | | — | | | | (2.63 | ) | | | — | | | | (2.63 | ) | | | (5.72 | ) | | | 18.83 | | | | (13.43 | )(f) | | | 12,382 | | | | 1.06 | (e) | | | 1.06 | (e) | | | 1.06 | (e) | | | 0.06 | (e) | | | — | |
| Class R3 | | | 25.83 | | | | (0.03 | ) | | | — | | | | (3.29 | ) | | | (3.32 | ) | | | — | | | | (2.63 | ) | | | — | | | | (2.63 | ) | | | (5.95 | ) | | | 19.88 | | | | (13.68 | )(f) | | | 1,948 | | | | 1.65 | (e) | | | 1.65 | (e) | | | 1.65 | (e) | | | (0.62 | )(e) | | | — | |
| Class R4 | | | 25.91 | | | | (0.02 | ) | | | — | | | | (3.28 | ) | | | (3.30 | ) | | | — | | | | (2.63 | ) | | | — | | | | (2.63 | ) | | | (5.93 | ) | | | 19.98 | | | | (13.55 | )(f) | | | 15,839 | | | | 1.29 | (e) | | | 1.29 | (e) | | | 1.29 | (e) | | | (0.21 | )(e) | | | — | |
| Class R5 | | | 25.97 | | | | — | | | | — | | | | (3.28 | ) | | | (3.28 | ) | | | — | | | | (2.63 | ) | | | — | | | | (2.63 | ) | | | (5.91 | ) | | | 20.06 | | | | (13.43 | )(f) | | | 4,934 | | | | 0.99 | (e) | | | 0.99 | (e) | | | 0.99 | (e) | | | 0.06 | (e) | | | — | |
| Class Y | | | 26.00 | | | | 0.02 | | | | — | | | | (3.29 | ) | | | (3.27 | ) | | | — | | | | (2.63 | ) | | | — | | | | (2.63 | ) | | | (5.90 | ) | | | 20.10 | | | | (13.37 | )(f) | | | 221,024 | | | | 0.89 | (e) | | | 0.89 | (e) | | | 0.89 | (e) | | | 0.18 | (e) | | | — | |
| For the Year Ended October 31, 2007 | | | | | | | | | | | | | | | | | | | | | | | | | | | | |
| Class A | | | 21.58 | | | | (0.09 | ) | | | 0.07 | | | | 4.77 | | | | 4.75 | | | | — | | | | (1.87 | ) | | | — | | | | (1.87 | ) | | | 2.88 | | | | 24.46 | | | | 23.88 | (i) | | | 299,819 | | | | 1.41 | | | | 1.40 | | | | 1.40 | | | | (0.44 | ) | | | 186 | |
| Class B | | | 19.97 | | | | (0.26 | ) | | | 0.10 | | | | 4.36 | | | | 4.20 | | | | — | | | | (1.87 | ) | | | — | | | | (1.87 | ) | | | 2.33 | | | | 22.30 | | | | 22.97 | (i) | | | 52,549 | | | | 2.28 | | | | 2.12 | | | | 2.12 | | | | (1.16 | ) | | | — | |
| Class C | | | 20.00 | | | | (0.23 | ) | | | 0.08 | | | | 4.34 | | | | 4.19 | | | | — | | | | (1.87 | ) | | | — | | | | (1.87 | ) | | | 2.32 | | | | 22.32 | | | | 22.88 | (i) | | | 63,650 | | | | 2.15 | | | | 2.15 | | | | 2.15 | | | | (1.19 | ) | | | — | |
| Class I | | | 21.59 | | | | (0.01 | ) | | | — | | | | 4.84 | | | | 4.83 | | | | — | | | | (1.87 | ) | | | — | | | | (1.87 | ) | | | 2.96 | | | | 24.55 | | | | 24.28 | (i) | | | 3,886 | | | | 1.12 | | | | 1.12 | | | | 1.12 | | | | (0.16 | ) | | | — | |
| Class Y | | | 22.73 | | | | 0.02 | | | | 0.06 | | | | 5.06 | | | | 5.14 | | | | — | | | | (1.87 | ) | | | — | | | | (1.87 | ) | | | 3.27 | | | | 26.00 | | | | 24.44 | (i) | | | 194,096 | | | | 0.91 | | | | 0.91 | | | | 0.91 | | | | 0.09 | | | | — | |
| From (commencement of operations) December 22, 2006, through October 31, 2007 | | | | | | | | | | | | | | | | | | | | | | | | | | | | |
| Class R3 | | | 21.95 | | | | (0.07 | ) | | | — | | | | 3.95 | | | | 3.88 | | | | — | | | | — | | | | — | | | | — | | | | 3.88 | | | | 25.83 | | | | 17.68 | (f) | | | 181 | | | | 1.84 | (e) | | | 1.65 | (e) | | | 1.65 | (e) | | | (0.69 | )(e) | | | — | |
| Class R4 | | | 21.95 | | | | (0.03 | ) | | | — | | | | 3.99 | | | | 3.96 | | | | — | | | | — | | | | — | | | | — | | | | 3.96 | | | | 25.91 | | | | 18.04 | (f) | | | 9,809 | | | | 1.34 | (e) | | | 1.34 | (e) | | | 1.34 | (e) | | | (0.54 | )(e) | | | — | |
| Class R5 | | | 21.95 | | | | (0.01 | ) | | | — | | | | 4.03 | | | | 4.02 | | | | — | | | | — | | | | — | | | | — | | | | 4.02 | | | | 25.97 | | | | 18.31 | (f) | | | 588 | | | | 1.07 | (e) | | | 1.05 | (e) | | | 1.05 | (e) | | | (0.38 | )(e) | | | — | |
| For the Year Ended October 31, 2006 | | | | | | | | | | | | | | | | | | | | | | | | | | | | |
| Class A | | | 18.45 | | | | (0.18 | ) | | | — | | | | 3.31 | | | | 3.13 | | | | — | | | | — | | | | — | | | | — | | | | 3.13 | | | | 21.58 | | | | 16.96 | | | | 194,656 | | | | 1.48 | | | | 1.40 | | | | 1.40 | | | | (0.87 | ) | | | 170 | |
| Class B | | | 17.20 | | | | (0.36 | ) | | | — | | | | 3.13 | | | | 2.77 | | | | — | | | | — | | | | — | | | | — | | | | 2.77 | | | | 19.97 | | | | 16.10 | | | | 52,036 | | | | 2.32 | | | | 2.15 | | | | 2.15 | | | | (1.62 | ) | | | — | |
| Class C | | | 17.22 | | | | (0.32 | ) | | | — | | | | 3.10 | | | | 2.78 | | | | — | | | | — | | | | — | | | | — | | | | 2.78 | | | | 20.00 | | | | 16.14 | | | | 47,744 | | | | 2.23 | | | | 2.15 | | | | 2.15 | | | | (1.62 | ) | | | — | |
| Class Y | | | 19.33 | | | | (0.06 | ) | | | — | | | | 3.46 | | | | 3.40 | | | | — | | | | — | | | | — | | | | — | | | | 3.40 | | | | 22.73 | | | | 17.59 | | | | 108,770 | | | | 0.95 | | | | 0.95 | | | | 0.95 | | | | (0.39 | ) | | | — | |
| From (commencement of operations) August 31, 2006, through October 31, 2006 | | | | | | | | | | | | | | | | | | | | | | | | | | | | |
| Class I | | | 20.70 | | | | (0.01 | ) | | | — | | | | 0.90 | | | | 0.89 | | | | — | | | | — | | | | — | | | | — | | | | 0.89 | | | | 21.59 | | | | 4.30 | (f) | | | 69 | | | | 1.38 | (e) | | | 1.15 | (e) | | | 1.15 | (e) | | | (0.58 | )(e) | | | — | |
| For the Year Ended October 31, 2005 | | | | | | | | | | | | | | | | | | | | | | | | | | | | |
| Class A | | | 15.09 | | | | (0.16 | ) | | | — | | | | 3.52 | | | | 3.36 | | | | — | | | | — | | | | — | | | | — | | | | 3.36 | | | | 18.45 | | | | 22.27 | | | | 159,577 | | | | 1.57 | | | | 1.40 | | | | 1.40 | | | | (0.88 | ) | | | 104 | |
| Class B | | | 14.17 | | | | (0.29 | ) | | | — | | | | 3.32 | | | | 3.03 | | | | — | | | | — | | | | — | | | | — | | | | 3.03 | | | | 17.20 | | | | 21.38 | | | | 56,664 | | | | 2.39 | | | | 2.15 | | | | 2.15 | | | | (1.63 | ) | | | — | |
| Class C | | | 14.19 | | | | (0.29 | ) | | | — | | | | 3.32 | | | | 3.03 | | | | — | | | | — | | | | — | | | | — | | | | 3.03 | | | | 17.22 | | | | 21.35 | | | | 44,564 | | | | 2.30 | | | | 2.15 | | | | 2.15 | | | | (1.63 | ) | | | — | |
| Class Y | | | 15.74 | | | | (0.07 | ) | | | — | | | | 3.66 | | | | 3.59 | | | | — | | | | — | | | | — | | | | — | | | | 3.59 | | | | 19.33 | | | | 22.81 | | | | 43,274 | | | | 0.97 | | | | 0.97 | | | | 0.97 | | | | (0.43 | ) | | | — | |
400
| | | | | | | | | | | | | | | | | | | | | | | | | | | | | | | | | | | | | | | | | | | | | | | | | | | | | | | | | | | | | | | | | | | | | | | | | |
| | | — Selected Per-Share Data (a) — | | — Ratios and Supplemental Data — |
| | | | | | | | | | | | | | | | | | | | | | | | | | | | | Ratio of
| | Ratio of
| | Ratio of
| | | | |
| | | | | | | | | | | | | | | | | | | | | | | | | | | | | Expenses
| | Expenses
| | Expenses
| | | | |
| | | | | | | | | | | | | | | | | | | | | | | | | | | | | to Average
| | to Average
| | to Average
| | | | |
| | | | | | | | | Net
| | | | | | | | | | | | | | | | | | | | Net Assets
| | Net Assets
| | Net Assets
| | | | |
| | | | | | | | | Realized
| | | | | | | | | | | | Net
| | | | | | | | Before
| | After
| | After
| | Ratio of
| | |
| | | | | | | | | and
| | | | | | Distributions
| | | | | | Increase
| | | | | | | | Waivers and
| | Waivers and
| | Waivers and
| | Net
| | |
| | | Net Asset
| | Net
| | Payments
| | Unrealized
| | Total
| | Dividends
| | from
| | | | | | (Decrease)
| | Net Asset
| | | | Net Assets
| | Reimbursements
| | Reimbursements
| | Reimbursements
| | Investment
| | |
| | | Value at
| | Investment
| | from
| | Gain
| | from
| | from Net
| | Realized
| | Distributions
| | | | in Net
| | Value at
| | | | at End of
| | and Including
| | and Including
| | and Excluding
| | Income
| | Portfolio
|
| | | Beginning
| | Income
| | (to)
| | (Loss) on
| | Investment
| | Investment
| | Capital
| | from
| | Total
| | Asset
| | End
| | Total
| | Period
| | Interest
| | Interest
| | Interest
| | to Average
| | Turnover
|
| | | of Period | | (Loss) | | Affiliate | | Investments | | Operations | | Income | | Gains | | Capital | | Distributions | | Value | | of Period | | Return (b) | | (000’s) | | Expense (d) | | Expense (d) | | Expense (d) | | Net Assets | | Rate (c) |
The Hartford Small Company Fund — (continued) | | | | | | | | | | | | | | | | | | | | | | | | | | | | |
| For the Year Ended October 31, 2004 | | | | | | | | | | | | | | | | | | | | | | | | | | | | |
| Class A | | $ | 14.28 | | | $ | (0.18 | ) | | $ | — | | | $ | 0.99 | | | $ | 0.81 | | | $ | — | | | $ | — | | | $ | — | | | $ | — | | | $ | 0.81 | | | $ | 15.09 | | | | 5.67 | % | | $ | 156,278 | | | | 1.62 | % | | | 1.45 | % | | | 1.45 | % | | | (1.15 | )% | | | 142 | % |
| Class B | | | 13.51 | | | | (0.27 | ) | | | — | | | | 0.93 | | | | 0.66 | | | | — | | | | — | | | | — | | | | — | | | | 0.66 | | | | 14.17 | | | | 4.88 | | | | 58,438 | | | | 2.40 | | | | 2.15 | | | | 2.15 | | | | (1.85 | ) | | | — | |
| Class C | | | 13.52 | | | | (0.28 | ) | | | — | | | | 0.95 | | | | 0.67 | | | | — | | | | — | | | | — | | | | — | | | | 0.67 | | | | 14.19 | | | | 4.96 | | | | 49,327 | | | | 2.30 | | | | 2.15 | | | | 2.15 | | | | (1.85 | ) | | | — | |
| Class Y | | | 14.83 | | | | (0.06 | ) | | | — | | | | 0.97 | | | | 0.91 | | | | — | | | | — | | | | — | | | | — | | | | 0.91 | | | | 15.74 | | | | 6.14 | | | | 15,731 | | | | 0.99 | | | | 0.99 | | | | 0.99 | | | | (0.71 | ) | | | — | |
| For the Year Ended October 31, 2003 | | | | | | | | | | | | | | | | | | | | | | | | | | | | |
| Class A | | | 9.93 | | | | (0.13 | ) | | | — | | | | 4.48 | | | | 4.35 | | | | — | | | | — | | | | — | | | | — | | | | 4.35 | | | | 14.28 | | | | 43.81 | | | | 141,327 | | | | 1.63 | | | | 1.45 | | | | 1.45 | | | | (1.19 | ) | | | 179 | |
| Class B | | | 9.46 | | | | (0.20 | ) | | | — | | | | 4.25 | | | | 4.05 | | | | — | | | | — | | | | — | | | | — | | | | 4.05 | | | | 13.51 | | | | 42.81 | | | | 58,286 | | | | 2.36 | | | | 2.15 | | | | 2.15 | | | | (1.89 | ) | | | — | |
| Class C | | | 9.47 | | | | (0.20 | ) | | | — | | | | 4.25 | | | | 4.05 | | | | — | | | | — | | | | — | | | | — | | | | 4.05 | | | | 13.52 | | | | 42.77 | | | | 52,010 | | | | 2.23 | | | | 2.15 | | | | 2.15 | | | | (1.88 | ) | | | — | |
| Class Y | | | 10.27 | | | | (0.09 | ) | | | — | | | | 4.65 | | | | 4.56 | | | | — | | | | — | | | | — | | | | — | | | | 4.56 | | | | 14.83 | | | | 44.40 | | | | 14,472 | | | | 1.05 | | | | 1.00 | | | | 1.00 | | | | (0.73 | ) | | | — | |
The Hartford SmallCap Growth Fund | | | | | | | | | | | | | | | | | | | | | | | | | | | | |
| For the Six-Month Period Ended April 30, 2008 (Unaudited) | | | | | | | | | | | | | | | | | | | | | | | | | | | | |
| Class A | | | 33.57 | | | | (0.03 | ) | | | — | | | | (4.48 | ) | | | (4.51 | ) | | | — | | | | (3.35 | ) | | | — | | | | (3.35 | ) | | | (7.86 | ) | | | 25.71 | | | | (14.18 | )(f) | | | 122,645 | | | | 1.60 | (e) | | | 1.26 | (e) | | | 1.26 | (e) | | | (0.20 | )(e) | | | 43 | |
| Class B | | | 29.93 | | | | (0.09 | ) | | | — | | | | (3.96 | ) | | | (4.05 | ) | | | — | | | | (3.35 | ) | | | — | | | | (3.35 | ) | | | (7.40 | ) | | | 22.53 | | | | (14.39 | )(f) | | | 13,184 | | | | 2.51 | (e) | | | 1.85 | (e) | | | 1.85 | (e) | | | (0.78 | )(e) | | | — | |
| Class C | | | 29.85 | | | | (0.13 | ) | | | — | | | | (3.95 | ) | | | (4.08 | ) | | | — | | | | (3.35 | ) | | | — | | | | (3.35 | ) | | | (7.43 | ) | | | 22.42 | | | | (14.55 | )(f) | | | 16,593 | | | | 2.25 | (e) | | | 2.11 | (e) | | | 2.11 | (e) | | | (1.05 | )(e) | | | — | |
| Class I | | | 33.64 | | | | (0.01 | ) | | | — | | | | (4.49 | ) | | | (4.50 | ) | | | — | | | | (3.35 | ) | | | — | | | | (3.35 | ) | | | (7.85 | ) | | | 25.79 | | | | (14.11 | )(f) | | | 3,305 | | | | 1.18 | (e) | | | 1.16 | (e) | | | 1.16 | (e) | | | (0.09 | )(e) | | | — | |
| Class L | | | 33.78 | | | | (0.01 | ) | | | — | | | | (4.51 | ) | | | (4.52 | ) | | | — | | | | (3.35 | ) | | | — | | | | (3.35 | ) | | | (7.87 | ) | | | 25.91 | | | | (14.11 | )(f) | | | 109,182 | | | | 1.15 | (e) | | | 1.14 | (e) | | | 1.14 | (e) | | | (0.07 | )(e) | | | — | |
| Class R3 | | | 34.16 | | | | (0.04 | ) | | | — | | | | (4.56 | ) | | | (4.60 | ) | | | — | | | | (3.35 | ) | | | — | | | | (3.35 | ) | | | (7.95 | ) | | | 26.21 | | | | (14.20 | )(f) | | | 12 | | | | 2.08 | (e) | | | 1.42 | (e) | | | 1.42 | (e) | | | (0.36 | )(e) | | | — | |
| Class R4 | | | 34.26 | | | | (0.01 | ) | | | — | | | | (4.60 | ) | | | (4.61 | ) | | | — | | | | (3.35 | ) | | | — | | | | (3.35 | ) | | | (7.96 | ) | | | 26.30 | | | | (14.19 | )(f) | | | 1,641 | | | | 1.29 | (e) | | | 1.28 | (e) | | | 1.28 | (e) | | | (0.27 | )(e) | | | — | |
| Class R5 | | | 34.34 | | | | 0.01 | | | | — | | | | (4.59 | ) | | | (4.58 | ) | | | — | | | | (3.35 | ) | | | — | | | | (3.35 | ) | | | (7.93 | ) | | | 26.41 | | | | (14.06 | )(f) | | | 9 | | | | 1.02 | (e) | | | 1.02 | (e) | | | 1.02 | (e) | | | 0.04 | (e) | | | — | |
| Class Y | | | 34.38 | | | | 0.02 | | | | — | | | | (4.59 | ) | | | (4.57 | ) | | | — | | | | (3.35 | ) | | | — | | | | (3.35 | ) | | | (7.92 | ) | | | 26.46 | | | | (14.00 | )(f) | | | 47,164 | | | | 0.90 | (e) | | | 0.90 | (e) | | | 0.90 | (e) | | | 0.16 | (e) | | | — | |
| For the Year Ended October 31, 2007 | | | | | | | | | | | | | | | | | | | | | | | | | | | | |
| Class A | | | 31.32 | | | | (0.13 | ) | | | — | | | | 2.38 | | | | 2.25 | | | | — | | | | — | | | | — | | | | — | | | | 2.25 | | | | 33.57 | | | | 7.18 | (i) | | | 162,102 | | | | 1.62 | | | | 1.31 | | | | 1.31 | | | | (0.26 | ) | | | 105 | |
| Class B | | | 28.12 | | | | (0.31 | ) | | | — | | | | 2.12 | | | | 1.81 | | | | — | | | | — | | | | — | | | | — | | | | 1.81 | | | | 29.93 | | | | 6.44 | (i) | | | 17,352 | | | | 2.42 | | | | 2.00 | | | | 2.00 | | | | (0.95 | ) | | | — | |
| Class C | | | 28.07 | | | | (0.35 | ) | | | — | | | | 2.13 | | | | 1.78 | | | | — | | | | — | | | | — | | | | — | | | | 1.78 | | | | 29.85 | | | | 6.34 | (i) | | | 23,778 | | | | 2.21 | | | | 2.15 | | | | 2.15 | | | | (1.10 | ) | | | — | |
| Class I | | | 31.33 | | | | (0.03 | ) | | | — | | | | 2.34 | | | | 2.31 | | | | — | | | | — | | | | — | | | | — | | | | 2.31 | | | | 33.64 | | | | 7.37 | (i) | | | 4,614 | | | | 1.21 | | | | 1.15 | | | | 1.15 | | | | (0.17 | ) | | | — | |
| Class L(k) | | | 31.45 | | | | (0.13 | ) | | | — | | | | 2.46 | | | | 2.33 | | | | — | | | | — | | | | — | | | | — | | | | 2.33 | | | | 33.78 | | | | 7.41 | (i) | | | 137,702 | | | | 1.17 | | | | 1.15 | | | | 1.15 | | | | (0.37 | ) | | | — | |
| Class Y | | | 31.95 | | | | 0.02 | | | | — | | | | 2.41 | | | | 2.43 | | | | — | | | | — | | | | — | | | | — | | | | 2.43 | | | | 34.38 | | | | 7.61 | (i) | | | 46,466 | | | | 0.93 | | | | 0.93 | | | | 0.93 | | | | 0.12 | | | | — | |
| From (commencement of operations) December 22, 2006, through October 31, 2007 | | | | | | | | | | | | | | | | | | | | | | | | | | | | |
| Class R3 | | | 32.34 | | | | (0.19 | ) | | | — | | | | 2.01 | | | | 1.82 | | | | — | | | | — | | | | — | | | | — | | | | 1.82 | | | | 34.16 | | | | 5.63 | (f) | | | 11 | | | | 1.69 | (e) | | | 1.65 | (e) | | | 1.65 | (e) | | | (0.65 | )(e) | | | — | |
| Class R4 | | | 32.34 | | | | (0.02 | ) | | | — | | | | 1.94 | | | | 1.92 | | | | — | | | | — | | | | — | | | | — | | | | 1.92 | | | | 34.26 | | | | 5.94 | (f) | | | 309 | | | | 1.40 | (e) | | | 1.36 | (e) | | | 1.36 | (e) | | | (0.43 | )(e) | | | — | |
| Class R5 | | | 32.34 | | | | (0.01 | ) | | | — | | | | 2.01 | | | | 2.00 | | | | — | | | | — | | | | — | | | | — | | | | 2.00 | | | | 34.34 | | | | 6.18 | (f) | | | 11 | | | | 1.09 | (e) | | | 1.05 | (e) | | | 1.05 | (e) | | | (0.05 | )(e) | | | — | |
| For the Year Ended October 31, 2006 | | | | | | | | | | | | | | | | | | | | | | | | | | | | |
| Class A | | | 28.30 | | | | (0.06 | ) | | | — | | | | 3.08 | | | | 3.02 | | | | — | | | | — | | | | — | | | | — | | | | 3.02 | | | | 31.32 | | | | 10.67 | | | | 228,776 | | | | 1.56 | | | | 1.36 | | | | 1.36 | | | | (0.30 | ) | | | 86 | |
| Class B | | | 25.57 | | | | (0.26 | ) | | | — | | | | 2.81 | | | | 2.55 | | | | — | | | | — | | | | — | | | | — | | | | 2.55 | | | | 28.12 | | | | 9.97 | | | | 19,078 | | | | 2.39 | | | | 2.02 | | | | 2.02 | | | | (0.95 | ) | | | — | |
| Class C | | | 25.56 | | | | (0.27 | ) | | | — | | | | 2.78 | | | | 2.51 | | | | — | | | | — | | | | — | | | | — | | | | 2.51 | | | | 28.07 | | | | 9.82 | | | | 24,070 | | | | 2.25 | | | | 2.15 | | | | 2.15 | | | | (1.08 | ) | | | — | |
| Class L | | | 28.36 | | | | (0.02 | ) | | | — | | | | 3.11 | | | | 3.09 | | | | — | | | | — | | | | — | | | | — | | | | 3.09 | | | | 31.45 | | | | 10.90 | | | | 118,452 | | | | 1.15 | | | | 1.15 | | | | 1.15 | | | | (0.08 | ) | | | — | |
| Class Y | | | 28.74 | | | | 0.04 | | | | — | | | | 3.17 | | | | 3.21 | | | | — | | | | — | | | | — | | | | — | | | | 3.21 | | | | 31.95 | | | | 11.17 | | | | 107,906 | | | | 0.92 | | | | 0.92 | | | | 0.92 | | | | 0.15 | | | | — | |
| From (commencement of operations) August 31, 2006, through October 31, 2006 | | | | | | | | | | | | | | | | | | | | | | | | | | | | |
| Class I | | | 28.90 | | | | (0.01 | ) | | | — | | | | 2.44 | | | | 2.43 | | | | — | | | | — | | | | — | | | | — | | | | 2.43 | | | | 31.33 | | | | 8.41 | (f) | | | 239 | | | | 1.28 | (e) | | | 1.16 | (e) | | | 1.16 | (e) | | | (0.43 | )(e) | | | — | |
| For the Year Ended October 31, 2005 | | | | | | | | | | | | | | | | | | | | | | | | | | | | |
| Class A | | | 24.60 | | | | (0.15 | ) | | | — | | | | 3.85 | | | | 3.70 | | | | — | | | | — | | | | — | | | | — | | | | 3.70 | | | | 28.30 | | | | 15.04 | | | | 66,403 | | | | 1.62 | | | | 1.40 | | | | 1.40 | | | | (0.65 | ) | | | 81 | |
| Class B | | | 22.39 | | | | (0.32 | ) | | | — | | | | 3.50 | | | | 3.18 | | | | — | | | | — | | | | — | | | | — | | | | 3.18 | | | | 25.57 | | | | 14.20 | | | | 16,230 | | | | 2.51 | | | | 2.15 | | | | 2.15 | | | | (1.40 | ) | | | — | |
| Class C | | | 22.39 | | | | (0.28 | ) | | | — | | | | 3.45 | | | | 3.17 | | | | — | | | | — | | | | — | | | | — | | | | 3.17 | | | | 25.56 | | | | 14.16 | | | | 15,668 | | | | 2.33 | | | | 2.15 | | | | 2.15 | | | | (1.40 | ) | | | — | |
| Class L | | | 24.60 | | | | (0.13 | ) | | | — | | | | 3.89 | | | | 3.76 | | | | — | | | | — | | | | — | | | | — | | | | 3.76 | | | | 28.36 | | | | 15.28 | | | | 119,114 | | | | 1.21 | | | | 1.21 | | | | 1.21 | | | | (0.46 | ) | | | — | |
| Class Y | | | 24.88 | | | | (0.04 | ) | | | — | | | | 3.90 | | | | 3.86 | | | | — | | | | — | | | | — | | | | — | | | | 3.86 | | | | 28.74 | | | | 15.52 | | | | 55,933 | | | | 0.98 | | | | 0.98 | | | | 0.98 | | | | (0.23 | ) | | | — | |
| For the Year Ended October 31, 2004 | | | | | | | | | | | | | | | | | | | | | | | | | | | | |
| Class A | | | 22.91 | | | | (0.15 | ) | | | — | | | | 1.84 | | | | 1.69 | | | | — | | | | — | | | | — | | | | — | | | | 1.69 | | | | 24.60 | | | | 7.38 | | | | 42,962 | | | | 1.77 | | | | 1.45 | | | | 1.45 | | | | (0.81 | ) | | | 102 | |
| Class B | | | 20.99 | | | | (0.28 | ) | | | — | | | | 1.68 | | | | 1.40 | | | | — | | | | — | | | | — | | | | — | | | | 1.40 | | | | 22.39 | | | | 6.67 | | | | 11,930 | | | | 2.59 | | | | 2.15 | | | | 2.15 | | | | (1.51 | ) | | | — | |
| Class C | | | 20.99 | | | | (0.27 | ) | | | — | | | | 1.67 | | | | 1.40 | | | | — | | | | — | | | | — | | | | — | | | | 1.40 | | | | 22.39 | | | | 6.67 | | | | 10,140 | | | | 2.38 | | | | 2.15 | | | | 2.15 | | | | (1.51 | ) | | | — | |
| Class L | | | 22.90 | | | | (0.19 | ) | | | — | | | | 1.89 | | | | 1.70 | | | | — | | | | — | | | | — | | | | — | | | | 1.70 | | | | 24.60 | | | | 7.42 | | | | 114,266 | | | | 1.43 | | | | 1.43 | | | | 1.43 | | | | (0.79 | ) | | | — | |
| Class Y | | | 23.06 | | | | (0.02 | ) | | | — | | | | 1.84 | | | | 1.82 | | | | — | | | | — | | | | — | | | | — | | | | 1.82 | | | | 24.88 | | | | 7.89 | | | | 5,788 | | | | 1.03 | | | | 1.03 | | | | 1.03 | | | | (0.47 | ) | | | — | |
| For the Year Ended October 31, 2003 | | | | | | | | | | | | | | | | | | | | | | | | | | | | |
| Class A | | | 15.57 | | | | (0.09 | ) | | | — | | | | 7.43 | | | | 7.34 | | | | — | | | | — | | | | — | | | | — | | | | 7.34 | | | | 22.91 | | | | 47.14 | | | | 17,544 | | | | 1.61 | | | | 1.45 | | | | 1.45 | | | | (0.83 | ) | | | 122 | |
| Class B | | | 14.36 | | | | (0.15 | ) | | | — | | | | 6.78 | | | | 6.63 | | | | — | | | | — | | | | — | | | | — | | | | 6.63 | | | | 20.99 | | | | 46.17 | | | | 6,571 | | | | 2.31 | | | | 2.15 | | | | 2.15 | | | | (1.53 | ) | | | — | |
| Class C | | | 14.35 | | | | (0.16 | ) | | | — | | | | 6.80 | | | | 6.64 | | | | — | | | | — | | | | — | | | | — | | | | 6.64 | | | | 20.99 | | | | 46.27 | | | | 5,076 | | | | 2.22 | | | | 2.15 | | | | 2.15 | | | | (1.53 | ) | | | — | |
| Class L | | | 15.56 | | | | (0.15 | ) | | | — | | | | 7.49 | | | | 7.34 | | | | — | | | | — | | | | — | | | | — | | | | 7.34 | | | | 22.90 | | | | 47.17 | | | | 112,621 | | | | 1.50 | | | | 1.45 | | | | 1.45 | | | | (0.80 | ) | | | — | |
| Class Y | | | 15.61 | | | | (0.08 | ) | | | — | | | | 7.53 | | | | 7.45 | | | | — | | | | — | | | | — | | | | — | | | | 7.45 | | | | 23.06 | | | | 47.72 | | | | 1 | | | | 1.11 | | | | 1.10 | | | | 1.10 | | | | (0.46 | ) | | | — | |
| | | | | | | | | | | | | | | | | | | | | | | | | | | | | | | | | | | | | | | | | | | | | | | | | | | | | | | | | | | | | | | | | | | | | | | | | |
401
The Hartford Mutual Funds, Inc. and The Hartford Mutual Funds II, Inc.
Financial Highlights — (continued)
| | | | | | | | | | | | | | | | | | | | | | | | | | | | | | | | | | | | | | | | | | | | | | | | | | | | | | | | | | | | | | | | | | | | | | | | | |
| | | — Selected Per-Share Data (a) — | | — Ratios and Supplemental Data — |
| | | | | | | | | | | | | | | | | | | | | | | | | | | | | Ratio of
| | Ratio of
| | Ratio of
| | | | |
| | | | | | | | | | | | | | | | | | | | | | | | | | | | | Expenses
| | Expenses
| | Expenses
| | | | |
| | | | | | | | | | | | | | | | | | | | | | | | | | | | | to Average
| | to Average
| | to Average
| | | | |
| | | | | | | | | Net
| | | | | | | | | | | | | | | | | | | | Net Assets
| | Net Assets
| | Net Assets
| | | | |
| | | | | | | | | Realized
| | | | | | | | | | | | Net
| | | | | | | | Before
| | After
| | After
| | Ratio of
| | |
| | | | | | | | | and
| | | | | | Distributions
| | | | | | Increase
| | | | | | | | Waivers and
| | Waivers and
| | Waivers and
| | Net
| | |
| | | Net Asset
| | Net
| | Payments
| | Unrealized
| | Total
| | Dividends
| | from
| | | | | | (Decrease)
| | Net Asset
| | | | Net Assets
| | Reimbursements
| | Reimbursements
| | Reimbursements
| | Investment
| | |
| | | Value at
| | Investment
| | from
| | Gain
| | from
| | from Net
| | Realized
| | Distributions
| | | | in Net
| | Value at
| | | | at End of
| | and Including
| | and Including
| | and Excluding
| | Income
| | Portfolio
|
| | | Beginning
| | Income
| | (to)
| | (Loss) on
| | Investment
| | Investment
| | Capital
| | from
| | Total
| | Asset
| | End
| | Total
| | Period
| | Interest
| | Interest
| | Interest
| | to Average
| | Turnover
|
| | | of Period | | (Loss) | | Affiliate | | Investments | | Operations | | Income | | Gains | | Capital | | Distributions | | Value | | of Period | | Return (b) | | (000’s) | | Expense (d) | | Expense (d) | | Expense (d) | | Net Assets | | Rate (c) |
The Hartford Stock Fund | | | | | | | | | | | | | | | | | | | | | | | | | | | | |
| For the Six-Month Period Ended April 30, 2008 (Unaudited) (h) | | | | | | | | | | | | | | | | | | | | | | | | | | | | |
| Class A | | $ | 24.47 | | | $ | 0.05 | | | $ | — | | | $ | (3.02 | ) | | $ | (2.97 | ) | | $ | (0.03 | ) | | $ | — | | | $ | — | | | $ | (0.03 | ) | | $ | (3.00 | ) | | $ | 21.47 | | | | (12.16 | )%(f) | | $ | 536,296 | | | | 1.40 | %(e) | | | 1.22 | %(e) | | | 1.22 | %(e) | | | 0.43 | %(e) | | | 41 | % |
| Class B | | | 22.69 | | | | (0.05 | ) | | | — | | | | (2.80 | ) | | | (2.85 | ) | | | — | | | | — | | | | — | | | | — | | | | (2.85 | ) | | | 19.84 | | | | (12.56 | )(f) | | | 115,234 | | | | 2.25 | (e) | | | 2.13 | (e) | | | 2.13 | (e) | | | (0.48 | )(e) | | | — | |
| Class C | | | 22.89 | | | | (0.04 | ) | | | — | | | | (2.83 | ) | | | (2.87 | ) | | | — | | | | — | | | | — | | | | — | | | | (2.87 | ) | | | 20.02 | | | | (12.54 | )(f) | | | 118,068 | | | | 2.05 | (e) | | | 2.05 | (e) | | | 2.05 | (e) | | | (0.40 | )(e) | | | — | |
| Class R3 | | | 25.40 | | | | 0.01 | | | | — | | | | (3.13 | ) | | | (3.12 | ) | | | (0.08 | ) | | | — | | | | — | | | | (0.08 | ) | | | (3.20 | ) | | | 22.20 | | | | (12.31 | )(f) | | | 30 | | | | 1.65 | (e) | | | 1.50 | (e) | | | 1.50 | (e) | | | 0.12 | (e) | | | — | |
| Class R4 | | | 25.47 | | | | 0.05 | | | | — | | | | (3.15 | ) | | | (3.10 | ) | | | (0.05 | ) | | | — | | | | — | | | | (0.05 | ) | | | (3.15 | ) | | | 22.32 | | | | (12.18 | )(f) | | | 39 | | | | 1.26 | (e) | | | 1.20 | (e) | | | 1.20 | (e) | | | 0.45 | (e) | | | — | |
| Class R5 | | | 25.53 | | | | 0.09 | | | | — | | | | (3.16 | ) | | | (3.07 | ) | | | (0.12 | ) | | | — | | | | — | | | | (0.12 | ) | | | (3.19 | ) | | | 22.34 | | | | (12.04 | )(f) | | | 10 | | | | 0.93 | (e) | | | 0.90 | (e) | | | 0.90 | (e) | | | 0.76 | (e) | | | — | |
| Class Y | | | 25.56 | | | | 0.09 | | | | — | | | | (3.14 | ) | | | (3.05 | ) | | | (0.16 | ) | | | — | | | | — | | | | (0.16 | ) | | | (3.21 | ) | | | 22.35 | | | | (11.98 | )(f) | | | 77,125 | | | | 0.81 | (e) | | | 0.81 | (e) | | | 0.81 | (e) | | | 0.84 | (e) | | | — | |
| For the Year Ended October 31, 2007 | | | | | | | | | | | | | | | | | | | | | | | | | | | | |
| Class A | | | 21.04 | | | | 0.07 | | | | 0.03 | | | | 3.43 | | | | 3.53 | | | | (0.10 | ) | | | — | | | | — | | | | (0.10 | ) | | | 3.43 | | | | 24.47 | | | | 16.82 | (i) | | | 665,897 | | | | 1.37 | | | | 1.28 | | | | 1.28 | | | | 0.26 | | | | 96 | |
| Class B | | | 19.58 | | | | (0.19 | ) | | | 0.04 | | | | 3.26 | | | | 3.11 | | | | — | | | | — | | | | — | | | | — | | | | 3.11 | | | | 22.69 | | | | 15.88 | (i) | | | 170,341 | | | | 2.20 | | | | 2.11 | | | | 2.11 | | | | (0.57 | ) | | | — | |
| Class C | | | 19.73 | | | | (0.12 | ) | | | 0.03 | | | | 3.25 | | | | 3.16 | | | | — | | | | — | | | | — | | | | — | | | | 3.16 | | | | 22.89 | | | | 16.02 | (i) | | | 149,640 | | | | 2.03 | | | | 1.98 | | | | 1.98 | | | | (0.44 | ) | | | — | |
| Class Y | | | 21.95 | | | | 0.43 | | | | 0.06 | | | | 3.32 | | | | 3.81 | | | | (0.20 | ) | | | — | | | | — | | | | (0.20 | ) | | | 3.61 | | | | 25.56 | | | | 17.45 | (i) | | | 73,535 | | | | 0.81 | | | | 0.76 | | | | 0.76 | | | | 0.82 | | | | — | |
| From (commencement of operations) December 22, 2006, through October 31, 2007 | | | | | | | | | | | | | | | | | | | | | | | | | | | | |
| Class R3 | | | 22.66 | | | | (0.01 | ) | | | — | | | | 2.75 | | | | 2.74 | | | | — | | | | — | | | | — | | | | — | | | | 2.74 | | | | 25.40 | | | | 12.09 | (f) | | | 42 | | | | 1.56 | (e) | | | 1.51 | (e) | | | 1.51 | (e) | | | (0.18 | )(e) | | | — | |
| Class R4 | | | 22.66 | | | | 0.06 | | | | — | | | | 2.75 | | | | 2.81 | | | | — | | | | — | | | | — | | | | — | | | | 2.81 | | | | 25.47 | | | | 12.40 | (f) | | | 44 | | | | 1.25 | (e) | | | 1.20 | (e) | | | 1.20 | (e) | | | 0.29 | (e) | | | — | |
| Class R5 | | | 22.66 | | | | 0.12 | | | | — | | | | 2.75 | | | | 2.87 | | | | — | | | | — | | | | — | | | | — | | | | 2.87 | | | | 25.53 | | | | 12.67 | (f) | | | 11 | | | | 0.97 | (e) | | | 0.92 | (e) | | | 0.92 | (e) | | | 0.57 | (e) | | | — | |
| For the Year Ended October 31, 2006 (h) | | | | | | | | | | | | | | | | | | | | | | | | | | | | |
| Class A | | | 18.39 | | | | 0.11 | | | | — | | | | 2.58 | | | | 2.69 | | | | (0.04 | ) | | | — | | | | — | | | | (0.04 | ) | | | 2.65 | | | | 21.04 | | | | 14.65 | | | | 684,726 | | | | 1.41 | | | | 1.28 | | | | 1.28 | | | | 0.53 | | | | 110 | |
| Class B | | | 17.23 | | | | (0.05 | ) | | | — | | | | 2.40 | | | | 2.35 | | | | — | | | | — | | | | — | | | | — | | | | 2.35 | | | | 19.58 | | | | 13.64 | | | | 223,639 | | | | 2.23 | | | | 2.12 | | | | 2.12 | | | | (0.30 | ) | | | — | |
| Class C | | | 17.35 | | | | (0.04 | ) | | | — | | | | 2.42 | | | | 2.38 | | | | — | | | | — | | | | — | | | | — | | | | 2.38 | | | | 19.73 | | | | 13.72 | | | | 161,554 | | | | 2.08 | | | | 2.03 | | | | 2.03 | | | | (0.21 | ) | | | — | |
| Class Y | | | 19.18 | | | | 0.21 | | | | — | | | | 2.70 | | | | 2.91 | | | | (0.14 | ) | | | — | | | | — | | | | (0.14 | ) | | | 2.77 | | | | 21.95 | | | | 15.21 | | | | 131,759 | | | | 0.83 | | | | 0.78 | | | | 0.78 | | | | 1.03 | | | | — | |
| For the Year Ended October 31, 2005 | | | | | | | | | | | | | | | | | | | | | | | | | | | | |
| Class A | | | 16.76 | | | | 0.16 | | | | — | | | | 1.57 | | | | 1.73 | | | | (0.10 | ) | | | — | | | | — | | | | (0.10 | ) | | | 1.63 | | | | 18.39 | | | | 10.36 | | | | 727,492 | | | | 1.42 | | | | 1.33 | | | | 1.33 | | | | 0.89 | | | | 62 | |
| Class B | | | 15.76 | | | | — | | | | — | | | | 1.47 | | | | 1.47 | | | | — | | | | — | | | | — | | | | — | | | | 1.47 | | | | 17.23 | | | | 9.33 | | | | 278,445 | | | | 2.23 | | | | 2.23 | | | | 2.23 | | | | (0.02 | ) | | | — | |
| Class C | | | 15.84 | | | | 0.04 | | | | — | | | | 1.47 | | | | 1.51 | | | | — | | | | — | | | | — | | | | — | | | | 1.51 | | | | 17.35 | | | | 9.53 | | | | 182,587 | | | | 2.09 | | | | 2.09 | | | | 2.09 | | | | 0.17 | | | | — | |
| Class Y | | | 17.49 | | | | 0.24 | | | | — | | | | 1.66 | | | | 1.90 | | | | (0.21 | ) | | | — | | | | — | | | | (0.21 | ) | | | 1.69 | | | | 19.18 | | | | 10.91 | | | | 107,578 | | | | 0.83 | | | | 0.83 | | | | 0.83 | | | | 1.24 | | | | — | |
| For the Year Ended October 31, 2004 | | | | | | | | | | | | | | | | | | | | | | | | | | | | |
| Class A | | | 16.21 | | | | 0.03 | | | | — | | | | 0.52 | | | | 0.55 | | | | — | | | | — | | | | — | | | | — | | | | 0.55 | | | | 16.76 | | | | 3.39 | | | | 952,606 | | | | 1.42 | | | | 1.42 | | | | 1.42 | | | | 0.18 | | | | 29 | |
| Class B | | | 15.35 | | | | (0.10 | ) | | | — | | | | 0.51 | | | | 0.41 | | | | — | | | | — | | | | — | | | | — | | | | 0.41 | | | | 15.76 | | | | 2.67 | | | | 343,148 | | | | 2.18 | | | | 2.18 | | | | 2.18 | | | | (0.59 | ) | | | — | |
| Class C | | | 15.41 | | | | (0.08 | ) | | | — | | | | 0.51 | | | | 0.43 | | | | — | | | | — | | | | — | | | | — | | | | 0.43 | | | | 15.84 | | | | 2.79 | | | | 256,271 | | | | 2.03 | | | | 2.03 | | | | 2.03 | | | | (0.44 | ) | | | — | |
| Class Y | | | 16.81 | | | | 0.10 | | | | — | | | | 0.58 | | | | 0.68 | | | | — | | | | — | | | | — | | | | — | | | | 0.68 | | | | 17.49 | | | | 4.04 | | | | 80,932 | | | | 0.80 | | | | 0.80 | | | | 0.80 | | | | 0.80 | | | | — | |
| For the Year Ended October 31, 2003 | | | | | | | | | | | | | | | | | | | | | | | | | | | | |
| Class A | | | 13.73 | | | | 0.04 | | | | — | | | | 2.44 | | | | 2.48 | | | | — | | | | — | | | | — | | | | — | | | | 2.48 | | | | 16.21 | | | | 18.06 | | | | 976,663 | | | | 1.47 | | | | 1.45 | | | | 1.45 | | | | 0.26 | | | | 37 | |
| Class B | | | 13.10 | | | | (0.07 | ) | | | — | | | | 2.32 | | | | 2.25 | | | | — | | | | — | | | | — | | | | — | | | | 2.25 | | | | 15.35 | | | | 17.18 | | | | 376,437 | | | | 2.20 | | | | 2.18 | | | | 2.18 | | | | (0.47 | ) | | | — | |
| Class C | | | 13.13 | | | | (0.05 | ) | | | — | | | | 2.33 | | | | 2.28 | | | | — | | | | — | | | | — | | | | — | | | | 2.28 | | | | 15.41 | | | | 17.36 | | | | 311,874 | | | | 2.07 | | | | 2.07 | | | | 2.07 | | | | (0.36 | ) | | | — | |
| Class Y | | | 14.15 | | | | 0.12 | | | | — | | | | 2.54 | | | | 2.66 | | | | — | | | | — | | | | — | | | | — | | | | 2.66 | | | | 16.81 | | | | 18.80 | | | | 42,894 | | | | 0.88 | | | | 0.88 | | | | 0.88 | | | | 0.84 | | | | — | |
The Hartford Strategic Income Fund | | | | | | | | | | | | | | | | | | | | | | | | | | | | |
| For the Six-Month Period Ended April 30, 2008 (Unaudited) (h) | | | | | | | | | | | | | | | | | | | | | | | | | | | | |
| Class A | | | 9.75 | | | | 0.34 | | | | — | | | | (0.26 | ) | | | 0.08 | | | | (0.34 | ) | | | — | | | | — | | | | (0.34 | ) | | | (0.26 | ) | | | 9.49 | | | | 0.88 | (f) | | | 94,062 | | | | 0.96 | (e) | | | 0.41 | (e) | | | 0.41 | (e) | | | 7.18 | (e) | | | 57 | |
| Class B | | | 9.75 | | | | 0.31 | | | | — | | | | (0.25 | ) | | | 0.06 | | | | (0.31 | ) | | | — | | | | — | | | | (0.31 | ) | | | (0.25 | ) | | | 9.50 | | | | 0.60 | (f) | | | 5,749 | | | | 1.77 | (e) | | | 1.19 | (e) | | | 1.19 | (e) | | | 6.40 | (e) | | | — | |
| Class C | | | 9.76 | | | | 0.31 | | | | — | | | | (0.25 | ) | | | 0.06 | | | | (0.31 | ) | | | — | | | | — | | | | (0.31 | ) | | | (0.25 | ) | | | 9.51 | | | | 0.61 | (f) | | | 70,815 | | | | 1.72 | (e) | | | 1.17 | (e) | | | 1.17 | (e) | | | 6.43 | (e) | | | — | |
| Class I | | | 9.77 | | | | 0.35 | | | | — | | | | (0.25 | ) | | | 0.10 | | | | (0.35 | ) | | | — | | | | — | | | | (0.35 | ) | | | (0.25 | ) | | | 9.52 | | | | 1.11 | (f) | | | 30,857 | | | | 0.72 | (e) | | | 0.17 | (e) | | | 0.17 | (e) | | | 7.43 | (e) | | | — | |
| Class Y | | | 9.76 | | | | 0.36 | | | | — | | | | (0.26 | ) | | | 0.10 | | | | (0.36 | ) | | | — | | | | — | | | | (0.36 | ) | | | (0.26 | ) | | | 9.50 | | | | 1.02 | (f) | | | 30,517 | | | | 0.65 | (e) | | | 0.10 | (e) | | | 0.10 | (e) | | | 7.50 | (e) | | | — | |
| From (date shares became available to public) May 31, 2007, through October 31, 2007 (o) | | | | | | | | | | | | | | | | | | | | | | | | | | | | |
| Class A | | | 9.90 | | | | 0.29 | | | | — | | | | (0.14 | ) | | | 0.15 | | | | (0.30 | ) | | | — | | | | — | | | | (0.30 | ) | | | (0.15 | ) | | | 9.75 | | | | 1.53 | (f) | | | 42,949 | | | | 1.01 | (e) | | | 0.46 | (e) | | | 0.46 | (e) | | | 7.15 | (e) | | | 40 | |
| Class B | | | 9.90 | | | | 0.26 | | | | — | | | | (0.15 | ) | | | 0.11 | | | | (0.26 | ) | | | — | | | | — | | | | (0.26 | ) | | | (0.15 | ) | | | 9.75 | | | | 1.21 | (f) | | | 2,644 | | | | 1.80 | (e) | | | 1.25 | (e) | | | 1.25 | (e) | | | 6.42 | (e) | | | — | |
| Class C | | | 9.90 | | | | 0.27 | | | | — | | | | (0.15 | ) | | | 0.12 | | | | (0.26 | ) | | | — | | | | — | | | | (0.26 | ) | | | (0.14 | ) | | | 9.76 | | | | 1.31 | (f) | | | 17,275 | | | | 1.81 | (e) | | | 1.26 | (e) | | | 1.26 | (e) | | | 6.47 | (e) | | | — | |
| Class I | | | 9.90 | | | | 0.31 | | | | — | | | | (0.13 | ) | | | 0.18 | | | | (0.31 | ) | | | — | | | | — | | | | (0.31 | ) | | | (0.13 | ) | | | 9.77 | | | | 1.84 | (f) | | | 11,212 | | | | 0.82 | (e) | | | 0.27 | (e) | | | 0.27 | (e) | | | 7.49 | (e) | | | — | |
| From (commencement of operations) August 31, 2007, through October 31, 2007 | | | | | | | | | | | | | | | | | | | | | | | | | | | | |
| Class Y | | | 9.57 | | | | 0.12 | | | | — | | | | 0.19 | | | | 0.31 | | | | (0.12 | ) | | | — | | | | — | | | | (0.12 | ) | | | 0.19 | | | | 9.76 | | | | 3.28 | (f) | | | 10,631 | | | | 0.80 | (e) | | | 0.25 | (e) | | | 0.25 | (e) | | | 7.73 | (e) | | | — | |
The Hartford Target Retirement 2010 Fund (g) | | | | | | | | | | | | | | | | | | | | | | | | | | | | |
| For the Six-Month Period Ended April 30, 2008 (Unaudited) (h) | | | | | | | | | | | | | | | | | | | | | | | | | | | | |
| Class A | | | 10.66 | | | | 0.15 | | | | — | | | | (0.45 | ) | | | (0.30 | ) | | | (0.31 | ) | | | (0.21 | ) | | | — | | | | (0.52 | ) | | | (0.82 | ) | | | 9.84 | | | | (2.79 | )(f) | | | 9,831 | | | | 1.19 | (e) | | | 0.51 | (e) | | | 0.51 | (e) | | | 2.98 | (e) | | | 48 | |
| Class B | | | 10.64 | | | | 0.09 | | | | — | | | | (0.41 | ) | | | (0.32 | ) | | | (0.28 | ) | | | (0.21 | ) | | | — | | | | (0.49 | ) | | | (0.81 | ) | | | 9.83 | | | | (3.05 | )(f) | | | 705 | | | | 2.05 | (e) | | | 1.26 | (e) | | | 1.26 | (e) | | | 1.86 | (e) | | | — | |
| Class C | | | 10.64 | | | | 0.13 | | | | — | | | | (0.46 | ) | | | (0.33 | ) | | | (0.27 | ) | | | (0.21 | ) | | | — | | | | (0.48 | ) | | | (0.81 | ) | | | 9.83 | | | | (3.16 | )(f) | | | 686 | | | | 2.06 | (e) | | | 1.25 | (e) | | | 1.25 | (e) | | | 2.65 | (e) | | | — | |
| Class R3 | | | 10.66 | | | | 0.14 | | | | — | | | | (0.46 | ) | | | (0.32 | ) | | | (0.29 | ) | | | (0.21 | ) | | | — | | | | (0.50 | ) | | | (0.82 | ) | | | 9.84 | | | | (2.99 | )(f) | | | 11 | | | | 1.65 | (e) | | | 0.90 | (e) | | | 0.90 | (e) | | | 2.83 | (e) | | | — | |
| Class R4 | | | 10.66 | | | | 0.06 | | | | — | | | | (0.36 | ) | | | (0.30 | ) | | | (0.31 | ) | | | (0.21 | ) | | | — | | | | (0.52 | ) | | | (0.82 | ) | | | 9.84 | | | | (2.78 | )(f) | | | 3,540 | | | | 1.24 | (e) | | | 0.61 | (e) | | | 0.61 | (e) | | | 1.24 | (e) | | | — | |
| Class R5 | | | 10.67 | | | | 0.05 | | | | — | | | | (0.34 | ) | | | (0.29 | ) | | | (0.33 | ) | | | (0.21 | ) | | | — | | | | (0.54 | ) | | | (0.83 | ) | | | 9.84 | | | | (2.77 | )(f) | | | 941 | | | | 0.89 | (e) | | | 0.32 | (e) | | | 0.32 | (e) | | | 1.07 | (e) | | | — | |
| Class Y | | | 10.66 | | | | 0.18 | | | | — | | | | (0.45 | ) | | | (0.27 | ) | | | (0.33 | ) | | | (0.21 | ) | | | — | | | | (0.54 | ) | | | (0.81 | ) | | | 9.85 | | | | (2.54 | )(f) | | | 149 | | | | 0.93 | (e) | | | 0.15 | (e) | | | 0.15 | (e) | | | 3.58 | (e) | | | — | |
402
| | | | | | | | | | | | | | | | | | | | | | | | | | | | | | | | | | | | | | | | | | | | | | | | | | | | | | | | | | | | | | | | | | | | | | | | | |
| | | — Selected Per-Share Data (a) — | | — Ratios and Supplemental Data — |
| | | | | | | | | | | | | | | | | | | | | | | | | | | | | Ratio of
| | Ratio of
| | Ratio of
| | | | |
| | | | | | | | | | | | | | | | | | | | | | | | | | | | | Expenses
| | Expenses
| | Expenses
| | | | |
| | | | | | | | | | | | | | | | | | | | | | | | | | | | | to Average
| | to Average
| | to Average
| | | | |
| | | | | | | | | Net
| | | | | | | | | | | | | | | | | | | | Net Assets
| | Net Assets
| | Net Assets
| | | | |
| | | | | | | | | Realized
| | | | | | | | | | | | Net
| | | | | | | | Before
| | After
| | After
| | Ratio of
| | |
| | | | | | | | | and
| | | | | | Distributions
| | | | | | Increase
| | | | | | | | Waivers and
| | Waivers and
| | Waivers and
| | Net
| | |
| | | Net Asset
| | Net
| | Payments
| | Unrealized
| | Total
| | Dividends
| | from
| | | | | | (Decrease)
| | Net Asset
| | | | Net Assets
| | Reimbursements
| | Reimbursements
| | Reimbursements
| | Investment
| | |
| | | Value at
| | Investment
| | from
| | Gain
| | from
| | from Net
| | Realized
| | Distributions
| | | | in Net
| | Value at
| | | | at End of
| | and Including
| | and Including
| | and Excluding
| | Income
| | Portfolio
|
| | | Beginning
| | Income
| | (to)
| | (Loss) on
| | Investment
| | Investment
| | Capital
| | from
| | Total
| | Asset
| | End
| | Total
| | Period
| | Interest
| | Interest
| | Interest
| | to Average
| | Turnover
|
| | | of Period | | (Loss) | | Affiliate | | Investments | | Operations | | Income | | Gains | | Capital | | Distributions | | Value | | of Period | | Return (b) | | (000’s) | | Expense (d) | | Expense (d) | | Expense (d) | | Net Assets | | Rate (c) |
The Hartford Target Retirement 2010 Fund (g) — (continued) | | | | | | | | | | | | | | | | | | | | | | | | | | | | |
| For the Year Ended October 31, 2007 | | | | | | | | | | | | | | | | | | | | | | | | | | | | |
| Class A | | $ | 9.65 | | | $ | 0.28 | | | $ | — | | | $ | 1.01 | | | $ | 1.29 | | | $ | (0.28 | ) | | $ | — | | | $ | — | | | $ | (0.28 | ) | | $ | 1.01 | | | $ | 10.66 | | | | 13.55 | % | | $ | 7,547 | | | | 1.78 | % | | | 0.50 | % | | | 0.50 | % | | | 2.46 | % | | | 56 | % |
| Class B | | | 9.65 | | | | 0.21 | | | | — | | | | 0.99 | | | | 1.20 | | | | (0.21 | ) | | | — | | | | — | | | | (0.21 | ) | | | 0.99 | | | | 10.64 | | | | 12.61 | | | | 533 | | | | 2.74 | | | | 1.25 | | | | 1.25 | | | | 1.91 | | | | — | |
| Class C | | | 9.64 | | | | 0.21 | | | | — | | | | 1.00 | | | | 1.21 | | | | (0.21 | ) | | | — | | | | — | | | | (0.21 | ) | | | 1.00 | | | | 10.64 | | | | 12.68 | | | | 743 | | | | 2.79 | | | | 1.25 | | | | 1.25 | | | | 2.08 | | | | — | |
| Class Y | | | 9.65 | | | | 0.32 | | | | — | | | | 0.99 | | | | 1.31 | | | | (0.30 | ) | | | — | | | | — | | | | (0.30 | ) | | | 1.01 | | | | 10.66 | | | | 13.83 | | | | 153 | | | | 1.79 | | | | 0.20 | | | | 0.20 | | | | 3.21 | | | | — | |
| From (commencement of operations) December 22, 2006, through October 31, 2007 | | | | | | | | | | | | | | | | | | | | | | | | | | | | |
| Class R3 | | | 9.76 | | | | 0.14 | | | | — | | | | 0.89 | | | | 1.03 | | | | (0.13 | ) | | | — | | | | — | | | | (0.13 | ) | | | 0.90 | | | | 10.66 | | | | 10.56 | (f) | | | 11 | | | | 2.32 | (e) | | | 0.90 | (e) | | | 0.90 | (e) | | | 1.62 | (e) | | | — | |
| Class R4 | | | 9.76 | | | | 0.16 | | | | — | | | | 0.89 | | | | 1.05 | | | | (0.15 | ) | | | — | | | | — | | | | (0.15 | ) | | | 0.90 | | | | 10.66 | | | | 10.88 | (f) | | | 442 | | | | 1.76 | (e) | | | 0.60 | (e) | | | 0.60 | (e) | | | 2.03 | (e) | | | — | |
| Class R5 | | | 9.76 | | | | 0.19 | | | | — | | | | 0.89 | | | | 1.08 | | | | (0.17 | ) | | | — | | | | — | | | | (0.17 | ) | | | 0.91 | | | | 10.67 | | | | 11.15 | (f) | | | 11 | | | | 1.72 | (e) | | | 0.30 | (e) | | | 0.30 | (e) | | | 2.23 | (e) | | | — | |
| For the Year Ended October 31, 2006 | | | | | | | | | | | | | | | | | | | | | | | | | | | | |
| Class A | | | 9.82 | | | | 0.47 | | | | — | | | | 0.22 | | | | 0.69 | | | | (0.50 | ) | | | — | | | | (0.36 | ) | | | (0.86 | ) | | | (0.17 | ) | | | 9.65 | | | | 7.43 | | | | 1,618 | | | | 7.64 | | | | 0.54 | | | | 0.54 | | | | 2.01 | | | | 10 | |
| Class B | | | 9.82 | | | | 0.34 | | | | — | | | | 0.27 | | | | 0.61 | | | | (0.42 | ) | | | — | | | | (0.36 | ) | | | (0.78 | ) | | | (0.17 | ) | | | 9.65 | | | | 6.58 | | | | 226 | | | | 10.93 | | | | 1.29 | | | | 1.29 | | | | 1.24 | | | | — | |
| Class C | | | 9.82 | | | | 0.40 | | | | — | | | | 0.21 | | | | 0.61 | | | | (0.43 | ) | | | — | | | | (0.36 | ) | | | (0.79 | ) | | | (0.18 | ) | | | 9.64 | | | | 6.53 | | | | 475 | | | | 10.92 | | | | 1.30 | | | | 1.30 | | | | 1.63 | | | | — | |
| Class Y | | | 9.83 | | | | 0.50 | | | | — | | | | 0.21 | | | | 0.71 | | | | (0.53 | ) | | | — | | | | (0.36 | ) | | | (0.89 | ) | | | (0.18 | ) | | | 9.65 | | | | 7.62 | | | | 135 | | | | 9.70 | | | | 0.23 | | | | 0.23 | | | | 2.31 | | | | — | |
| From (commencement of operations) September 30, 2005, through October 31, 2005 | | | | | | | | | | | | | | | | | | | | | | | | | | | | |
| Class A | | | 10.00 | | | | 0.02 | | | | — | | | | (0.20 | ) | | | (0.18 | ) | | | — | | | | — | | | | — | | | | — | | | | (0.18 | ) | | | 9.82 | | | | (1.80 | )(f) | | | 11 | | | | 0.65 | (e) | | | 0.49 | (e) | | | 0.49 | (e) | | | 2.53 | (e) | | | 12 | |
| Class B | | | 10.00 | | | | 0.01 | | | | — | | | | (0.19 | ) | | | (0.18 | ) | | | — | | | | — | | | | — | | | | — | | | | (0.18 | ) | | | 9.82 | | | | (1.80 | )(f) | | | 10 | | | | 1.41 | (e) | | | 1.26 | (e) | | | 1.26 | (e) | | | 1.61 | (e) | | | — | |
| Class C | | | 10.00 | | | | 0.01 | | | | — | | | | (0.19 | ) | | | (0.18 | ) | | | — | | | | — | | | | — | | | | — | | | | (0.18 | ) | | | 9.82 | | | | (1.80 | )(f) | | | 10 | | | | 1.41 | (e) | | | 1.27 | (e) | | | 1.27 | (e) | | | 1.60 | (e) | | | — | |
| Class Y | | | 10.00 | | | | 0.02 | | | | — | | | | (0.19 | ) | | | (0.17 | ) | | | — | | | | — | | | | — | | | | — | | | | (0.17 | ) | | | 9.83 | | | | (1.70 | )(f) | | | 10 | | | | 0.32 | (e) | | | 0.21 | (e) | | | 0.21 | (e) | | | 2.65 | (e) | | | — | |
The Hartford Target Retirement 2020 Fund (g) | | | | | | | | | | | | | | | | | | | | | | | | | | | | |
| For the Six-Month Period Ended April 30, 2008 (Unaudited) (h) | | | | | | | | | | | | | | | | | | | | | | | | | | | | |
| Class A | | | 11.68 | | | | 0.14 | | | | — | | | | (0.73 | ) | | | (0.59 | ) | | | (0.36 | ) | | | (0.09 | ) | | | — | | | | (0.45 | ) | | | (1.04 | ) | | | 10.64 | | | | (5.10 | )(f) | | | 18,892 | | | | 0.82 | (e) | | | 0.52 | (e) | | | 0.52 | (e) | | | 2.58 | (e) | | | 43 | |
| Class B | | | 11.68 | | | | 0.08 | | | | — | | | | (0.71 | ) | | | (0.63 | ) | | | (0.32 | ) | | | (0.09 | ) | | | — | | | | (0.41 | ) | | | (1.04 | ) | | | 10.64 | | | | (5.44 | )(f) | | | 889 | | | | 1.80 | (e) | | | 1.25 | (e) | | | 1.25 | (e) | | | 1.57 | (e) | | | — | |
| Class C | | | 11.67 | | | | 0.09 | | | | — | | | | (0.72 | ) | | | (0.63 | ) | | | (0.32 | ) | | | (0.09 | ) | | | — | | | | (0.41 | ) | | | (1.04 | ) | | | 10.63 | | | | (5.45 | )(f) | | | 867 | | | | 1.73 | (e) | | | 1.27 | (e) | | | 1.27 | (e) | | | 1.62 | (e) | | | — | |
| Class R3 | | | 11.67 | | | | 0.12 | | | | — | | | | (0.72 | ) | | | (0.60 | ) | | | (0.34 | ) | | | (0.09 | ) | | | — | | | | (0.43 | ) | | | (1.03 | ) | | | 10.64 | | | | (5.21 | )(f) | | | 11 | | | | 1.23 | (e) | | | 0.91 | (e) | | | 0.91 | (e) | | | 2.29 | (e) | | | — | |
| Class R4 | | | 11.67 | | | | 0.07 | | | | — | | | | (0.66 | ) | | | (0.59 | ) | | | (0.36 | ) | | | (0.09 | ) | | | — | | | | (0.45 | ) | | | (1.04 | ) | | | 10.63 | | | | (5.12 | )(f) | | | 6,456 | | | | 0.89 | (e) | | | 0.62 | (e) | | | 0.62 | (e) | | | 1.33 | (e) | | | — | |
| Class R5 | | | 11.68 | | | | 0.03 | | | | — | | | | (0.61 | ) | | | (0.58 | ) | | | (0.37 | ) | | | (0.09 | ) | | | — | | | | (0.46 | ) | | | (1.04 | ) | | | 10.64 | | | | (5.00 | )(f) | | | 5,520 | | | | 0.57 | (e) | | | 0.32 | (e) | | | 0.32 | (e) | | | 0.49 | (e) | | | — | |
| Class Y | | | 11.68 | | | | 0.16 | | | | — | | | | (0.72 | ) | | | (0.56 | ) | | | (0.38 | ) | | | (0.09 | ) | | | — | | | | (0.47 | ) | | | (1.03 | ) | | | 10.65 | | | | (4.86 | )(f) | | | 12 | | | | 0.51 | (e) | | | 0.16 | (e) | | | 0.16 | (e) | | | 3.03 | (e) | | | — | |
| For the Year Ended October 31, 2007 | | | | | | | | | | | | | | | | | | | | | | | | | | | | |
| Class A | | | 10.43 | | | | 0.24 | | | | — | | | | 1.29 | | | | 1.53 | | | | (0.24 | ) | | | (0.04 | ) | | | — | | | | (0.28 | ) | | | 1.25 | | | | 11.68 | | | | 14.95 | | | | 17,710 | | | | 1.25 | | | | 0.51 | | | | 0.51 | | | | 1.64 | | | | 16 | |
| Class B | | | 10.42 | | | | 0.18 | | | | — | | | | 1.27 | | | | 1.45 | | | | (0.15 | ) | | | (0.04 | ) | | | — | | | | (0.19 | ) | | | 1.26 | | | | 11.68 | | | | 14.09 | | | | 717 | | | | 2.41 | | | | 1.26 | | | | 1.26 | | | | 1.38 | | | | — | |
| Class C | | | 10.42 | | | | 0.17 | | | | — | | | | 1.28 | | | | 1.45 | | | | (0.16 | ) | | | (0.04 | ) | | | — | | | | (0.20 | ) | | | 1.25 | | | | 11.67 | | | | 14.10 | | | | 649 | | | | 2.33 | | | | 1.26 | | | | 1.26 | | | | 1.47 | | | | — | |
| Class Y | | | 10.43 | | | | 0.30 | | | | — | | | | 1.25 | | | | 1.55 | | | | (0.26 | ) | | | (0.04 | ) | | | — | | | | (0.30 | ) | | | 1.25 | | | | 11.68 | | | | 15.20 | | | | 12 | | | | 1.29 | | | | 0.21 | | | | 0.21 | | | | 2.71 | | | | — | |
| From (commencement of operations) December 22, 2006, through October 31, 2007 | | | | | | | | | | | | | | | | | | | | | | | | | | | | |
| Class R3 | | | 10.55 | | | | 0.08 | | | | — | | | | 1.11 | | | | 1.19 | | | | (0.07 | ) | | | — | | | | — | | | | (0.07 | ) | | | 1.12 | | | | 11.67 | | | | 11.32 | (f) | | | 11 | | | | 1.83 | (e) | | | 0.91 | (e) | | | 0.91 | (e) | | | 0.86 | (e) | | | — | |
| Class R4 | | | 10.55 | | | | 0.10 | | | | — | | | | 1.12 | | | | 1.22 | | | | (0.10 | ) | | | — | | | | — | | | | (0.10 | ) | | | 1.12 | | | | 11.67 | | | | 11.64 | (f) | | | 1,129 | | | | 1.13 | (e) | | | 0.61 | (e) | | | 0.61 | (e) | | | 1.23 | (e) | | | — | |
| Class R5 | | | 10.55 | | | | 0.14 | | | | — | | | | 1.11 | | | | 1.25 | | | | (0.12 | ) | | | — | | | | — | | | | (0.12 | ) | | | 1.13 | | | | 11.68 | | | | 11.91 | (f) | | | 11 | | | | 1.22 | (e) | | | 0.31 | (e) | | | 0.31 | (e) | | | 1.46 | (e) | | | — | |
| For the Year Ended October 31, 2006 (h) | | | | | | | | | | | | | | | | | | | | | | | | | | | | |
| Class A | | | 9.79 | | | | 0.13 | | | | — | | | | 0.86 | | | | 0.99 | | | | (0.35 | ) | | | — | | | | — | | | | (0.35 | ) | | | 0.64 | | | | 10.43 | | | | 10.37 | | | | 2,125 | | | | 10.15 | | | | 0.53 | | | | 0.53 | | | | 1.35 | | | | 19 | |
| Class B | | | 9.78 | | | | 0.04 | | | | — | | | | 0.88 | | | | 0.92 | | | | (0.28 | ) | | | — | | | | — | | | | (0.28 | ) | | | 0.64 | | | | 10.42 | | | | 9.56 | | | | 291 | | | | 9.51 | | | | 1.29 | | | | 1.29 | | | | 0.39 | | | | — | |
| Class C | | | 9.78 | | | | 0.04 | | | | — | | | | 0.88 | | | | 0.92 | | | | (0.28 | ) | | | — | | | | — | | | | (0.28 | ) | | | 0.64 | | | | 10.42 | | | | 9.58 | | | | 337 | | | | 9.87 | | | | 1.30 | | | | 1.30 | | | | 0.41 | | | | — | |
| Class Y | | | 9.79 | | | | 0.27 | | | | — | | | | 0.75 | | | | 1.02 | | | | (0.38 | ) | | | — | | | | — | | | | (0.38 | ) | | | 0.64 | | | | 10.43 | | | | 10.70 | | | | 11 | | | | 10.87 | | | | 0.22 | | | | 0.22 | | | | 2.73 | | | | — | |
| From (commencement of operations) September 30, 2005, through October 31, 2005 | | | | | | | | | | | | | | | | | | | | | | | | | | | | |
| Class A | | | 10.00 | | | | 0.01 | | | | — | | | | (0.22 | ) | | | (0.21 | ) | | | — | | | | — | | | | — | | | | — | | | | (0.21 | ) | | | 9.79 | | | | (2.10 | )(f) | | | 144 | | | | 0.66 | (e) | | | 0.51 | (e) | | | 0.51 | (e) | | | 2.77 | (e) | | | 28 | |
| Class B | | | 10.00 | | | | 0.01 | | | | — | | | | (0.23 | ) | | | (0.22 | ) | | | — | | | | — | | | | — | | | | — | | | | (0.22 | ) | | | 9.78 | | | | (2.20 | )(f) | | | 10 | | | | 1.37 | (e) | | | 1.25 | (e) | | | 1.25 | (e) | | | 0.86 | (e) | | | — | |
| Class C | | | 10.00 | | | | 0.01 | | | | — | | | | (0.23 | ) | | | (0.22 | ) | | | — | | | | — | | | | — | | | | — | | | | (0.22 | ) | | | 9.78 | | | | (2.20 | )(f) | | | 10 | | | | 1.37 | (e) | | | 1.26 | (e) | | | 1.26 | (e) | | | 0.85 | (e) | | | — | |
| Class Y | | | 10.00 | | | | 0.01 | | | | — | | | | (0.22 | ) | | | (0.21 | ) | | | — | | | | — | | | | — | | | | — | | | | (0.21 | ) | | | 9.79 | | | | (2.10 | )(f) | | | 10 | | | | 0.29 | (e) | | | 0.20 | (e) | | | 0.20 | (e) | | | 1.91 | (e) | | | — | |
The Hartford Target Retirement 2030 Fund (g) | | | | | | | | | | | | | | | | | | | | | | | | | | | | |
| For the Six-Month Period Ended April 30, 2008 (Unaudited) (h) | | | | | | | | | | | | | | | | | | | | | | | | | | | | |
| Class A | | | 10.92 | | | | 0.08 | | | | — | | | | (0.81 | ) | | | (0.73 | ) | | | (0.37 | ) | | | (0.10 | ) | | | — | | | | (0.47 | ) | | | (1.20 | ) | | | 9.72 | | | | (6.85 | )(f) | | | 16,865 | | | | 0.94 | (e) | | | 0.54 | (e) | | | 0.54 | (e) | | | 1.70 | (e) | | | 26 | |
| Class B | | | 10.90 | | | | 0.04 | | | | — | | | | (0.79 | ) | | | (0.75 | ) | | | (0.32 | ) | | | (0.10 | ) | | | — | | | | (0.42 | ) | | | (1.17 | ) | | | 9.73 | | | | (7.04 | )(f) | | | 719 | | | | 2.14 | (e) | | | 1.06 | (e) | | | 1.06 | (e) | | | 0.90 | (e) | | | — | |
| Class C | | | 10.89 | | | | 0.02 | | | | — | | | | (0.78 | ) | | | (0.76 | ) | | | (0.32 | ) | | | (0.10 | ) | | | — | | | | (0.42 | ) | | | (1.18 | ) | | | 9.71 | | | | (7.15 | )(f) | | | 927 | | | | 1.93 | (e) | | | 1.24 | (e) | | | 1.24 | (e) | | | 0.47 | (e) | | | — | |
| Class R3 | | | 10.88 | | | | 0.07 | | | | — | | | | (0.82 | ) | | | (0.75 | ) | | | (0.32 | ) | | | (0.10 | ) | | | — | | | | (0.42 | ) | | | (1.17 | ) | | | 9.71 | | | | (7.03 | )(f) | | | 11 | | | | 1.33 | (e) | | | 0.94 | (e) | | | 0.94 | (e) | | | 1.36 | (e) | | | — | |
| Class R4 | | | 10.91 | | | | 0.01 | | | | — | | | | (0.75 | ) | | | (0.74 | ) | | | (0.38 | ) | | | (0.10 | ) | | | — | | | | (0.48 | ) | | | (1.22 | ) | | | 9.69 | | | | (6.92 | )(f) | | | 5,900 | | | | 0.98 | (e) | | | 0.65 | (e) | | | 0.65 | (e) | | | 0.11 | (e) | | | — | |
| Class R5 | | | 10.93 | | | | — | | | | — | | | | (0.74 | ) | | | (0.74 | ) | | | (0.38 | ) | | | (0.10 | ) | | | — | | | | (0.48 | ) | | | (1.22 | ) | | | 9.71 | | | | (6.92 | )(f) | | | 1,536 | | | | 0.66 | (e) | | | 0.35 | (e) | | | 0.35 | (e) | | | 0.02 | (e) | | | — | |
| Class Y | | | 10.95 | | | | 0.10 | | | | — | | | | (0.81 | ) | | | (0.71 | ) | | | (0.39 | ) | | | (0.10 | ) | | | — | | | | (0.49 | ) | | | (1.20 | ) | | | 9.75 | | | | (6.63 | )(f) | | | 35 | | | | 0.62 | (e) | | | 0.19 | (e) | | | 0.19 | (e) | | | 2.11 | (e) | | | — | |
403
The Hartford Mutual Funds, Inc. and The Hartford Mutual Funds II, Inc.
Financial Highlights — (continued)
| | | | | | | | | | | | | | | | | | | | | | | | | | | | | | | | | | | | | | | | | | | | | | | | | | | | | | | | | | | | | | | | | | | | | | | | | |
| | | — Selected Per-Share Data (a) — | | — Ratios and Supplemental Data — |
| | | | | | | | | | | | | | | | | | | | | | | | | | | | | Ratio of
| | Ratio of
| | Ratio of
| | | | |
| | | | | | | | | | | | | | | | | | | | | | | | | | | | | Expenses
| | Expenses
| | Expenses
| | | | |
| | | | | | | | | | | | | | | | | | | | | | | | | | | | | to Average
| | to Average
| | to Average
| | | | |
| | | | | | | | | Net
| | | | | | | | | | | | | | | | | | | | Net Assets
| | Net Assets
| | Net Assets
| | | | |
| | | | | | | | | Realized
| | | | | | | | | | | | Net
| | | | | | | | Before
| | After
| | After
| | Ratio of
| | |
| | | | | | | | | and
| | | | | | Distributions
| | | | | | Increase
| | | | | | | | Waivers and
| | Waivers and
| | Waivers and
| | Net
| | |
| | | Net Asset
| | Net
| | Payments
| | Unrealized
| | Total
| | Dividends
| | from
| | | | | | (Decrease)
| | Net Asset
| | | | Net Assets
| | Reimbursements
| | Reimbursements
| | Reimbursements
| | Investment
| | |
| | | Value at
| | Investment
| | from
| | Gain
| | from
| | from Net
| | Realized
| | Distributions
| | | | in Net
| | Value at
| | | | at End of
| | and Including
| | and Including
| | and Excluding
| | Income
| | Portfolio
|
| | | Beginning
| | Income
| | (to)
| | (Loss) on
| | Investment
| | Investment
| | Capital
| | from
| | Total
| | Asset
| | End
| | Total
| | Period
| | Interest
| | Interest
| | Interest
| | to Average
| | Turnover
|
| | | of Period | | (Loss) | | Affiliate | | Investments | | Operations | | Income | | Gains | | Capital | | Distributions | | Value | | of Period | | Return (b) | | (000’s) | | Expense (d) | | Expense (d) | | Expense (d) | | Net Assets | | Rate (c) |
The Hartford Target Retirement 2030 Fund (g) — (continued) | | | | | | | | | | | | | | | | | | | | | | | | | | | | |
| For the Year Ended October 31, 2007 | | | | | | | | | | | | | | | | | | | | | | | | | | | | |
| Class A | | $ | 9.36 | | | $ | 0.15 | | | $ | — | | | $ | 1.55 | | | $ | 1.70 | | | $ | (0.13 | ) | | $ | (0.01 | ) | | $ | — | | | $ | (0.14 | ) | | $ | 1.56 | | | $ | 10.92 | | | | 18.34 | % | | $ | 15,260 | | | | 1.44 | % | | | 0.54 | % | | | 0.54 | % | | | 0.75 | % | | | 23 | % |
| Class B | | | 9.36 | | | | 0.08 | | | | — | | | | 1.55 | | | | 1.63 | | | | (0.08 | ) | | | (0.01 | ) | | | — | | | | (0.09 | ) | | | 1.54 | | | | 10.90 | | | | 17.53 | | | | 522 | | | | 2.85 | | | | 1.17 | | | | 1.17 | | | | 0.83 | | | | — | |
| Class C | | | 9.37 | | | | 0.07 | | | | — | | | | 1.55 | | | | 1.62 | | | | (0.09 | ) | | | (0.01 | ) | | | — | | | | (0.10 | ) | | | 1.52 | | | | 10.89 | | | | 17.44 | | | | 405 | | | | 2.55 | | | | 1.26 | | | | 1.26 | | | | 0.21 | | | | — | |
| Class Y | | | 9.36 | | | | 0.19 | | | | — | | | | 1.54 | | | | 1.73 | | | | (0.13 | ) | | | (0.01 | ) | | | — | | | | (0.14 | ) | | | 1.59 | | | | 10.95 | | | | 18.60 | | | | 38 | | | | 1.42 | | | | 0.24 | | | | 0.24 | | | | 1.90 | | | | — | |
| From (commencement of operations) December 22, 2006, through October 31, 2007 | | | | | | | | | | | | | | | | | | | | | | | | | | | | |
| Class R3 | | | 9.53 | | | | (0.01 | ) | | | — | | | | 1.36 | | | | 1.35 | | | | — | | | | — | | | | — | | | | — | | | | 1.35 | | | | 10.88 | | | | 14.17 | (f) | | | 11 | | | | 1.94 | (e) | | | 0.94 | (e) | | | 0.94 | (e) | | | (0.06 | )(e) | | | — | |
| Class R4 | | | 9.53 | | | | — | | | | — | | | | 1.38 | | | | 1.38 | | | | — | | | | — | | | | — | | | | — | | | | 1.38 | | | | 10.91 | | | | 14.48 | (f) | | | 640 | | | | 1.42 | (e) | | | 0.64 | (e) | | | 0.64 | (e) | | | 0.29 | (e) | | | — | |
| Class R5 | | | 9.53 | | | | 0.05 | | | | — | | | | 1.35 | | | | 1.40 | | | | — | | | | — | | | | — | | | | — | | | | 1.40 | | | | 10.93 | | | | 14.69 | (f) | | | 11 | | | | 1.34 | (e) | | | 0.34 | (e) | | | 0.34 | (e) | | | 0.54 | (e) | | | — | |
| For the Year Ended October 31, 2006 (h) | | | | | | | | | | | | | | | | | | | | | | | | | | | | |
| Class A | | | 9.75 | | | | 0.03 | | | | — | | | | 0.87 | | | | 0.90 | | | | (0.49 | ) | | | — | | | | (0.80 | ) | | | (1.29 | ) | | | (0.39 | ) | | | 9.36 | | | | 10.00 | | | | 1,857 | | | | 13.00 | | | | 0.53 | | | | 0.53 | | | | 0.37 | | | | 19 | |
| Class B | | | 9.74 | | | | (0.02 | ) | | | — | | | | 0.86 | | | | 0.84 | | | | (0.42 | ) | | | — | | | | (0.80 | ) | | | (1.22 | ) | | | (0.38 | ) | | | 9.36 | | | | 9.22 | | | | 305 | | | | 15.15 | | | | 1.24 | | | | 1.24 | | | | (0.28 | ) | | | — | |
| Class C | | | 9.74 | | | | — | | | | — | | | | 0.85 | | | | 0.85 | | | | (0.42 | ) | | | — | | | | (0.80 | ) | | | (1.22 | ) | | | (0.37 | ) | | | 9.37 | | | | 9.35 | | | | 81 | | | | 19.26 | | | | 1.10 | | | | 1.10 | | | | (0.00 | ) | | | — | |
| Class Y | | | 9.75 | | | | 0.10 | | | | — | | | | 0.84 | | | | 0.94 | | | | (0.53 | ) | | | — | | | | (0.80 | ) | | | (1.33 | ) | | | (0.39 | ) | | | 9.36 | | | | 10.40 | | | | 32 | | | | 22.78 | | | | 0.21 | | | | 0.21 | | | | 1.10 | | | | — | |
| From (commencement of operations) September 30, 2005, through October 31, 2005 | | | | | | | | | | | | | | | | | | | | | | | | | | | | |
| Class A | | | 10.00 | | | | 0.01 | | | | — | | | | (0.26 | ) | | | (0.25 | ) | | | — | | | | — | | | | — | | | | — | | | | (0.25 | ) | | | 9.75 | | | | (2.50 | )(f) | | | 10 | | | | 0.69 | (e) | | | 0.48 | (e) | | | 0.48 | (e) | | | 0.76 | (e) | | | 14 | |
| Class B | | | 10.00 | | | | — | | | | — | | | | (0.26 | ) | | | (0.26 | ) | | | — | | | | — | | | | — | | | | — | | | | (0.26 | ) | | | 9.74 | | | | (2.60 | )(f) | | | 10 | | | | 1.39 | (e) | | | 1.24 | (e) | | | 1.24 | (e) | | | — | (e) | | | — | |
| Class C | | | 10.00 | | | | — | | | | — | | | | (0.26 | ) | | | (0.26 | ) | | | — | | | | — | | | | — | | | | — | | | | (0.26 | ) | | | 9.74 | | | | (2.60 | )(f) | | | 9 | | | | 1.39 | (e) | | | 1.24 | (e) | | | 1.24 | (e) | | | — | (e) | | | — | |
| Class Y | | | 10.00 | | | | 0.01 | | | | — | | | | (0.26 | ) | | | (0.25 | ) | | | — | | | | — | | | | — | | | | — | | | | (0.25 | ) | | | 9.75 | | | | (2.50 | )(f) | | | 10 | | | | 0.34 | (e) | | | 0.19 | (e) | | | 0.19 | (e) | | | 1.05 | (e) | | | — | |
The Hartford Tax-Free California Fund | | | | | | | | | | | | | | | | | | | | | | | | | | | | |
| For the Six-Month Period Ended April 30, 2008 (Unaudited) | | | | | | | | | | | | | | | | | | | | | | | | | | | | |
| Class A | | | 10.16 | | | | 0.22 | | | | — | | | | (0.59 | ) | | | (0.37 | ) | | | (0.22 | ) | | | — | | | | — | | | | (0.22 | ) | | | (0.59 | ) | | | 9.57 | | | | (3.65 | )(f) | | | 32,172 | | | | 0.90 | (e) | | | 0.85 | (e) | | | 0.85 | (e) | | | 4.46 | (e) | | | 27 | |
| Class B | | | 10.15 | | | | 0.18 | | | | — | | | | (0.60 | ) | | | (0.42 | ) | | | (0.18 | ) | | | — | | | | — | | | | (0.18 | ) | | | (0.60 | ) | | | 9.55 | | | | (4.11 | )(f) | | | 1,662 | | | | 1.69 | (e) | | | 1.60 | (e) | | | 1.60 | (e) | | | 3.70 | (e) | | | — | |
| Class C | | | 10.17 | | | | 0.18 | | | | — | | | | (0.59 | ) | | | (0.41 | ) | | | (0.18 | ) | | | — | | | | — | | | | (0.18 | ) | | | (0.59 | ) | | | 9.58 | | | | (4.01 | )(f) | | | 4,969 | | | | 1.68 | (e) | | | 1.60 | (e) | | | 1.60 | (e) | | | 3.71 | (e) | | | — | |
| For the Year Ended October 31, 2007 | | | | | | | | | | | | | | | | | | | | | | | | | | | | |
| Class A | | | 10.55 | | | | 0.41 | | | | — | | | | (0.39 | ) | | | 0.02 | | | | (0.41 | ) | | | — | | | | — | | | | (0.41 | ) | | | (0.39 | ) | | | 10.16 | | | | 0.16 | | | | 37,646 | | | | 0.92 | | | | 0.85 | | | | 0.85 | | | | 3.96 | | | | 35 | |
| Class B | | | 10.54 | | | | 0.33 | | | | — | | | | (0.39 | ) | | | (0.06 | ) | | | (0.33 | ) | | | — | | | | — | | | | (0.33 | ) | | | (0.39 | ) | | | 10.15 | | | | (0.58 | ) | | | 1,932 | | | | 1.70 | | | | 1.60 | | | | 1.60 | | | | 3.20 | | | | — | |
| Class C | | | 10.56 | | | | 0.33 | | | | — | | | | (0.39 | ) | | | (0.06 | ) | | | (0.33 | ) | | | — | | | | — | | | | (0.33 | ) | | | (0.39 | ) | | | 10.17 | | | | (0.58 | ) | | | 5,153 | | | | 1.70 | | | | 1.60 | | | | 1.60 | | | | 3.21 | | | | — | |
| For the Year Ended October 31, 2006 | | | | | | | | | | | | | | | | | | | | | | | | | | | | |
| Class A | | | 10.32 | | | | 0.38 | | | | — | | | | 0.24 | | | | 0.62 | | | | (0.38 | ) | | | (0.01 | ) | | | — | | | | (0.39 | ) | | | 0.23 | | | | 10.55 | | | | 6.13 | | | | 24,796 | | | | 0.99 | | | | 0.90 | | | | 0.90 | | | | 3.71 | | | | 2 | |
| Class B | | | 10.31 | | | | 0.30 | | | | — | | | | 0.24 | | | | 0.54 | | | | (0.30 | ) | | | (0.01 | ) | | | — | | | | (0.31 | ) | | | 0.23 | | | | 10.54 | | | | 5.34 | | | | 1,571 | | | | 1.77 | | | | 1.65 | | | | 1.65 | | | | 2.96 | | | | — | |
| Class C | | | 10.33 | | | | 0.30 | | | | — | | | | 0.24 | | | | 0.54 | | | | (0.30 | ) | | | (0.01 | ) | | | — | | | | (0.31 | ) | | | 0.23 | | | | 10.56 | | | | 5.33 | | | | 3,435 | | | | 1.78 | | | | 1.65 | | | | 1.65 | | | | 2.95 | | | | — | |
| For the Year Ended October 31, 2005 | | | | | | | | | | | | | | | | | | | | | | | | | | | | |
| Class A | | | 10.32 | | | | 0.38 | | | | — | | | | — | | | | 0.38 | | | | (0.38 | ) | | | — | | | | — | | | | (0.38 | ) | | | — | | | | 10.32 | | | | 3.69 | | | | 15,601 | | | | 1.02 | | | | 0.90 | | | | 0.90 | | | | 3.64 | | | | 31 | |
| Class B | | | 10.31 | | | | 0.29 | | | | — | | | | 0.01 | | | | 0.30 | | | | (0.30 | ) | | | — | | | | — | | | | (0.30 | ) | | | — | | | | 10.31 | | | | 2.92 | | | | 1,305 | | | | 1.80 | | | | 1.65 | | | | 1.65 | | | | 2.90 | | | | — | |
| Class C | | | 10.33 | | | | 0.29 | | | | — | | | | 0.01 | | | | 0.30 | | | | (0.30 | ) | | | — | | | | — | | | | (0.30 | ) | | | — | | | | 10.33 | | | | 2.91 | | | | 1,937 | | | | 1.80 | | | | 1.65 | | | | 1.65 | | | | 2.90 | | | | — | |
| For the Year Ended October 31, 2004 | | | | | | | | | | | | | | | | | | | | | | | | | | | | |
| Class A | | | 9.93 | | | | 0.38 | | | | — | | | | 0.41 | | | | 0.79 | | | | (0.40 | ) | | | — | | | | — | | | | (0.40 | ) | | | 0.39 | | | | 10.32 | | | | 8.15 | | | | 14,846 | | | | 1.03 | | | | 0.95 | | | | 0.95 | | | | 3.85 | | | | 41 | |
| Class B | | | 9.92 | | | | 0.34 | | | | — | | | | 0.38 | | | | 0.72 | | | | (0.33 | ) | | | — | | | | — | | | | (0.33 | ) | | | 0.39 | | | | 10.31 | | | | 7.40 | | | | 1,017 | | | | 1.84 | | | | 1.65 | | | | 1.65 | | | | 3.12 | | | | — | |
| Class C | | | 9.93 | | | | 0.32 | | | | — | | | | 0.41 | | | | 0.73 | | | | (0.33 | ) | | | — | | | | — | | | | (0.33 | ) | | | 0.40 | | | | 10.33 | | | | 7.49 | | | | 1,448 | | | | 1.85 | | | | 1.65 | | | | 1.65 | | | | 3.06 | | | | — | |
| From inception October 31, 2002, through October 31, 2003 | | | | | | | | | | | | | | | | | | | | | | | | | | | | |
| Class A | | | 10.00 | | | | 0.37 | | | | — | | | | (0.07 | ) | | | 0.30 | | | | (0.37 | ) | | | — | | | | — | | | | (0.37 | ) | | | (0.07 | ) | | | 9.93 | | | | 3.06 | (f) | | | 10,799 | | | | 1.57 | (e) | | | 0.95 | (e) | | | 0.95 | (e) | | | 3.73 | (e) | | | 64 | |
| Class B | | | 10.00 | | | | 0.30 | | | | — | | | | (0.08 | ) | | | 0.22 | | | | (0.30 | ) | | | — | | | | — | | | | (0.30 | ) | | | (0.08 | ) | | | 9.92 | | | | 2.23 | (f) | | | 1,827 | | | | 2.32 | (e) | | | 1.65 | (e) | | | 1.65 | (e) | | | 3.07 | (e) | | | — | |
| Class C | | | 10.00 | | | | 0.30 | | | | — | | | | (0.07 | ) | | | 0.23 | | | | (0.30 | ) | | | — | | | | — | | | | (0.30 | ) | | | (0.07 | ) | | | 9.93 | | | | 2.34 | (f) | | | 1,230 | | | | 2.18 | (e) | | | 1.65 | (e) | | | 1.65 | (e) | | | 3.02 | (e) | | | — | |
The Hartford Tax-Free Minnesota Fund | | | | | | | | | | | | | | | | | | | | | | | | | | | | |
| For the Six-Month Period Ended April 30, 2008 (Unaudited) | | | | | | | | | | | | | | | | | | | | | | | | | | | | |
| Class A | | | 9.94 | | | | 0.21 | | | | — | | | | (0.21 | ) | | | 0.00 | | | | (0.21 | ) | | | — | | | | — | | | | (0.21 | ) | | | (0.21 | ) | | | 9.73 | | | | (0.00 | )(f) | | | 10,256 | | | | 1.00 | (e) | | | 0.85 | (e) | | | 0.85 | (e) | | | 4.28 | (e) | | | 17 | |
| Class B | | | 9.96 | | | | 0.17 | | | | — | | | | (0.22 | ) | | | (0.05 | ) | | | (0.17 | ) | | | — | | | | — | | | | (0.17 | ) | | | (0.22 | ) | | | 9.74 | | | | (0.47 | )(f) | | | 756 | | | | 1.77 | (e) | | | 1.60 | (e) | | | 1.60 | (e) | | | 3.52 | (e) | | | — | |
| Class C | | | 9.96 | | | | 0.17 | | | | — | | | | (0.21 | ) | | | (0.04 | ) | | | (0.17 | ) | | | — | | | | — | | | | (0.17 | ) | | | (0.21 | ) | | | 9.75 | | | | (0.37 | )(f) | | | 1,002 | | | | 1.76 | (e) | | | 1.60 | (e) | | | 1.60 | (e) | | | 3.56 | (e) | | | — | |
| Class L | | | 9.98 | | | | 0.21 | | | | — | | | | (0.22 | ) | | | (0.01 | ) | | | (0.21 | ) | | | — | | | | — | | | | (0.21 | ) | | | (0.22 | ) | | | 9.76 | | | | (0.13 | )(f) | | | 2,786 | | | | 0.93 | (e) | | | 0.90 | (e) | | | 0.90 | (e) | | | 4.22 | (e) | | | — | |
| Class Y | | | 9.94 | | | | 0.22 | | | | — | | | | (0.21 | ) | | | 0.01 | | | | (0.22 | ) | | | — | | | | — | | | | (0.22 | ) | | | (0.21 | ) | | | 9.73 | | | | 0.08 | (f) | | | 20,457 | | | | 0.69 | (e) | | | 0.69 | (e) | | | 0.69 | (e) | | | 4.43 | (e) | | | — | |
| For the Year Ended October 31, 2007 | | | | | | | | | | | | | | | | | | | | | | | | | | | | |
| Class A | | | 10.33 | | | | 0.41 | | | | — | | | | (0.33 | ) | | | 0.08 | | | | (0.41 | ) | | | (0.06 | ) | | | — | | | | (0.47 | ) | | | (0.39 | ) | | | 9.94 | | | | 0.80 | | | | 9,923 | | | | 1.19 | | | | 0.85 | | | | 0.85 | | | | 4.06 | | | | 18 | |
| Class B | | | 10.35 | | | | 0.33 | | | | — | | | | (0.32 | ) | | | 0.01 | | | | (0.34 | ) | | | (0.06 | ) | | | — | | | | (0.40 | ) | | | (0.39 | ) | | | 9.96 | | | | 0.05 | | | | 759 | | | | 1.96 | | | | 1.60 | | | | 1.60 | | | | 3.30 | | | | — | |
| Class C | | | 10.37 | | | | 0.33 | | | | — | | | | (0.34 | ) | | | (0.01 | ) | | | (0.34 | ) | | | (0.06 | ) | | | — | | | | (0.40 | ) | | | (0.41 | ) | | | 9.96 | | | | (0.09 | ) | | | 561 | | | | 1.92 | | | | 1.60 | | | | 1.60 | | | | 3.32 | | | | — | |
| Class L(j) | | | 10.37 | | | | 0.43 | | | | — | | | | (0.35 | ) | | | 0.08 | | | | (0.41 | ) | | | (0.06 | ) | | | — | | | | (0.47 | ) | | | (0.39 | ) | | | 9.98 | | | | 0.75 | | | | 2,933 | | | | 1.11 | | | | 0.90 | | | | 0.90 | | | | 4.29 | | | | — | |
| Class Y(j) | | | 10.34 | | | | 0.42 | | | | — | | | | (0.33 | ) | | | 0.09 | | | | (0.43 | ) | | | (0.06 | ) | | | — | | | | (0.49 | ) | | | (0.40 | ) | | | 9.94 | | | | 0.84 | | | | 21,965 | | | | 0.86 | | | | 0.71 | | | | 0.71 | | | | 4.35 | | | | — | |
404
| | | | | | | | | | | | | | | | | | | | | | | | | | | | | | | | | | | | | | | | | | | | | | | | | | | | | | | | | | | | | | | | | | | | | | | | | |
| | | — Selected Per-Share Data (a) — | | — Ratios and Supplemental Data — |
| | | | | | | | | | | | | | | | | | | | | | | | | | | | | Ratio of
| | Ratio of
| | Ratio of
| | | | |
| | | | | | | | | | | | | | | | | | | | | | | | | | | | | Expenses
| | Expenses
| | Expenses
| | | | |
| | | | | | | | | | | | | | | | | | | | | | | | | | | | | to Average
| | to Average
| | to Average
| | | | |
| | | | | | | | | Net
| | | | | | | | | | | | | | | | | | | | Net Assets
| | Net Assets
| | Net Assets
| | | | |
| | | | | | | | | Realized
| | | | | | | | | | | | Net
| | | | | | | | Before
| | After
| | After
| | Ratio of
| | |
| | | | | | | | | and
| | | | | | Distributions
| | | | | | Increase
| | | | | | | | Waivers and
| | Waivers and
| | Waivers and
| | Net
| | |
| | | Net Asset
| | Net
| | Payments
| | Unrealized
| | Total
| | Dividends
| | from
| | | | | | (Decrease)
| | Net Asset
| | | | Net Assets
| | Reimbursements
| | Reimbursements
| | Reimbursements
| | Investment
| | |
| | | Value at
| | Investment
| | from
| | Gain
| | from
| | from Net
| | Realized
| | Distributions
| | | | in Net
| | Value at
| | | | at End of
| | and Including
| | and Including
| | and Excluding
| | Income
| | Portfolio
|
| | | Beginning
| | Income
| | (to)
| | (Loss) on
| | Investment
| | Investment
| | Capital
| | from
| | Total
| | Asset
| | End
| | Total
| | Period
| | Interest
| | Interest
| | Interest
| | to Average
| | Turnover
|
| | | of Period | | (Loss) | | Affiliate | | Investments | | Operations | | Income | | Gains | | Capital | | Distributions | | Value | | of Period | | Return (b) | | (000’s) | | Expense (d) | | Expense (d) | | Expense (d) | | Net Assets | | Rate (c) |
The Hartford Tax-Free Minnesota Fund — (continued) | | | | | | | | | | | | | | | | | | | | | | | | | | | | |
| For the Year Ended October 31, 2006 | | | | | | | | | | | | | | | | | | | | | | | | | | | | |
| Class A | | $ | 10.22 | | | $ | 0.41 | | | $ | — | | | $ | 0.13 | | | $ | 0.54 | | | $ | (0.41 | ) | | $ | (0.02 | ) | | $ | — | | | $ | (0.43 | ) | | $ | 0.11 | | | $ | 10.33 | | | | 5.35 | % | | $ | 6,846 | | | | 1.23 | % | | | 0.85 | % | | | 0.85 | % | | | 3.97 | % | | | 16 | % |
| Class B | | | 10.23 | | | | 0.33 | | | | — | | | | 0.14 | | | | 0.47 | | | | (0.33 | ) | | | (0.02 | ) | | | — | | | | (0.35 | ) | | | 0.12 | | | | 10.35 | | | | 4.65 | | | | 804 | | | | 1.98 | | | | 1.57 | | | | 1.57 | | | | 3.25 | | | | — | |
| Class C | | | 10.25 | | | | 0.33 | | | | — | | | | 0.14 | | | | 0.47 | | | | (0.33 | ) | | | (0.02 | ) | | | — | | | | (0.35 | ) | | | 0.12 | | | | 10.37 | | | | 4.65 | | | | 411 | | | | 1.96 | | | | 1.57 | | | | 1.57 | | | | 3.25 | | | | — | |
| Class L | | | 10.25 | | | | 0.40 | | | | — | | | | 0.14 | | | | 0.54 | | | | (0.40 | ) | | | (0.02 | ) | | | — | | | | (0.42 | ) | | | 0.12 | | | | 10.37 | | | | 5.38 | | | | 2,648 | | | | 1.11 | | | | 0.87 | | | | 0.87 | | | | 3.95 | | | | — | |
| Class Y | | | 10.22 | | | | 0.41 | | | | — | | | | 0.14 | | | | 0.55 | | | | (0.41 | ) | | | (0.02 | ) | | | — | | | | (0.43 | ) | | | 0.12 | | | | 10.34 | | | | 5.44 | | | | 11 | | | | 0.88 | | | | 0.83 | | | | 0.83 | | | | 3.99 | | | | — | |
| For the Year Ended October 31, 2005 (h) | | | | | | | | | | | | | | | | | | | | | | | | | | | | |
| Class A | | | 10.44 | | | | 0.39 | | | | — | | | | (0.22 | ) | | | 0.17 | | | | (0.39 | ) | | | — | | | | — | | | | (0.39 | ) | | | (0.22 | ) | | | 10.22 | | | | 1.66 | | | | 5,547 | | | | 1.26 | | | | 0.85 | | | | 0.85 | | | | 3.76 | | | | 10 | |
| Class B | | | 10.45 | | | | 0.31 | | | | — | | | | (0.21 | ) | | | 0.10 | | | | (0.32 | ) | | | — | | | | — | | | | (0.32 | ) | | | (0.22 | ) | | | 10.23 | | | | 0.91 | | | | 814 | | | | 2.02 | | | | 1.60 | | | | 1.60 | | | | 3.01 | | | | — | |
| Class C | | | 10.46 | | | | 0.32 | | | | — | | | | (0.21 | ) | | | 0.11 | | | | (0.32 | ) | | | — | | | | — | | | | (0.32 | ) | | | (0.21 | ) | | | 10.25 | | | | 1.01 | | | | 418 | | | | 2.03 | | | | 1.60 | | | | 1.60 | | | | 3.02 | | | | — | |
| Class L | | | 10.47 | | | | 0.39 | | | | — | | | | (0.22 | ) | | | 0.17 | | | | (0.39 | ) | | | — | | | | — | | | | (0.39 | ) | | | (0.22 | ) | | | 10.25 | | | | 1.62 | | | | 2,890 | | | | 1.12 | | | | 0.90 | | | | 0.90 | | | | 3.70 | | | | — | |
| Class Y | | | 10.44 | | | | 0.40 | | | | — | | | | (0.23 | ) | | | 0.17 | | | | (0.39 | ) | | | — | | | | — | | | | (0.39 | ) | | | (0.22 | ) | | | 10.22 | | | | 1.66 | | | | 10 | | | | 0.90 | | | | 0.90 | | | | 0.90 | | | | 3.83 | | | | — | |
| For the Year Ended October 31, 2004 | | | | | | | | | | | | | | | | | | | | | | | | | | | | |
| Class A | | | 10.46 | | | | 0.41 | | | | — | | | | 0.24 | | | | 0.65 | | | | (0.40 | ) | | | (0.27 | ) | | | — | | | | (0.67 | ) | | | (0.02 | ) | | | 10.44 | | | | 6.37 | | | | 4,286 | | | | 1.27 | | | | 0.98 | | | | 0.98 | | | | 3.87 | | | | 13 | |
| Class B | | | 10.46 | | | | 0.33 | | | | — | | | | 0.25 | | | | 0.58 | | | | (0.32 | ) | | | (0.27 | ) | | | — | | | | (0.59 | ) | | | (0.01 | ) | | | 10.45 | | | | 5.71 | | | | 645 | | | | 1.99 | | | | 1.68 | | | | 1.68 | | | | 3.16 | | | | — | |
| Class C | | | 10.48 | | | | 0.33 | | | | — | | | | 0.24 | | | | 0.57 | | | | (0.32 | ) | | | (0.27 | ) | | | — | | | | (0.59 | ) | | | (0.02 | ) | | | 10.46 | | | | 5.60 | | | | 321 | | | | 1.98 | | | | 1.69 | | | | 1.69 | | | | 3.15 | | | | — | |
| Class L | | | 10.49 | | | | 0.41 | | | | — | | | | 0.24 | | | | 0.65 | | | | (0.40 | ) | | | (0.27 | ) | | | — | | | | (0.67 | ) | | | (0.02 | ) | | | 10.47 | | | | 6.41 | | | | 2,765 | | | | 1.07 | | | | 0.96 | | | | 0.96 | | | | 3.88 | | | | — | |
| Class Y | | | 10.47 | | | | 0.43 | | | | — | | | | 0.24 | | | | 0.67 | | | | (0.43 | ) | | | (0.27 | ) | | | — | | | | (0.70 | ) | | | (0.03 | ) | | | 10.44 | | | | 6.58 | | | | 1 | | | | 0.85 | | | | 0.85 | | | | 0.85 | | | | 4.07 | | | | — | |
| For the Year Ended October 31, 2003 (h) | | | | | | | | | | | | | | | | | | | | | | | | | | | | |
| Class A | | | 10.46 | | | | 0.38 | | | | — | | | | 0.05 | | | | 0.43 | | | | (0.38 | ) | | | (0.05 | ) | | | — | | | | (0.43 | ) | | | — | | | | 10.46 | | | | 4.23 | | | | 3,242 | | | | 1.50 | | | | 1.15 | | | | 1.15 | | | | 3.58 | | | | 17 | |
| Class B | | | 10.47 | | | | 0.31 | | | | — | | | | 0.04 | | | | 0.35 | | | | (0.31 | ) | | | (0.05 | ) | | | — | | | | (0.36 | ) | | | (0.01 | ) | | | 10.46 | | | | 3.42 | | | | 532 | | | | 2.21 | | | | 1.85 | | | | 1.85 | | | | 2.88 | | | | — | |
| Class C | | | 10.48 | | | | 0.31 | | | | — | | | | 0.05 | | | | 0.36 | | | | (0.31 | ) | | | (0.05 | ) | | | — | | | | (0.36 | ) | | | — | | | | 10.48 | | | | 3.51 | | | | 414 | | | | 2.09 | | | | 1.85 | | | | 1.85 | | | | 2.88 | | | | — | |
| Class L | | | 10.49 | | | | 0.39 | | | | — | | | | 0.05 | | | | 0.44 | | | | (0.39 | ) | | | (0.05 | ) | | | — | | | | (0.44 | ) | | | — | | | | 10.49 | | | | 4.34 | | | | 2,922 | | | | 1.07 | | | | 1.05 | | | | 1.05 | | | | 3.67 | | | | — | |
| Class Y | | | 10.49 | | | | 0.40 | | | | — | | | | 0.06 | | | | 0.46 | | | | (0.43 | ) | | | (0.05 | ) | | | — | | | | (0.48 | ) | | | (0.02 | ) | | | 10.47 | | | | 4.50 | | | | 1 | | | | 0.91 | | | | 0.80 | | | | 0.80 | | | | 3.82 | | | | — | |
The Hartford Tax-Free National Fund | | | | | | | | | | | | | | | | | | | | | | | | | | | | |
| For the Six-Month Period Ended April 30, 2008 (Unaudited) | | | | | | | | | | | | | | | | | | | | | | | | | | | | |
| Class A | | | 10.88 | | | | 0.24 | | | | — | | | | (0.57 | ) | | | (0.33 | ) | | | (0.24 | ) | | | — | | | | — | | | | (0.24 | ) | | | (0.57 | ) | | | 10.31 | | | | (3.01 | )(f) | | | 136,790 | | | | 0.93 | (e) | | | 0.85 | (e) | | �� | 0.85 | (e) | | | 4.64 | (e) | | | 46 | |
| Class B | | | 10.80 | | | | 0.20 | | | | — | | | | (0.56 | ) | | | (0.36 | ) | | | (0.20 | ) | | | — | | | | — | | | | (0.20 | ) | | | (0.56 | ) | | | 10.24 | | | | (3.30 | )(f) | | | 6,381 | | | | 1.75 | (e) | | | 1.60 | (e) | | | 1.60 | (e) | | | 3.88 | (e) | | | — | |
| Class C | | | 10.83 | | | | 0.20 | | | | — | | | | (0.56 | ) | | | (0.36 | ) | | | (0.20 | ) | | | — | | | | — | | | | (0.20 | ) | | | (0.56 | ) | | | 10.27 | | | | (3.29 | )(f) | | | 26,871 | | | | 1.69 | (e) | | | 1.60 | (e) | | | 1.60 | (e) | | | 3.89 | (e) | | | — | |
| Class I | | | 10.90 | | | | 0.26 | | | | — | | | | (0.57 | ) | | | (0.31 | ) | | | (0.26 | ) | | | — | | | | — | | | | (0.26 | ) | | | (0.57 | ) | | | 10.33 | | | | (2.88 | )(f) | | | 4,103 | | | | 0.65 | (e) | | | 0.60 | (e) | | | 0.60 | (e) | | | 4.89 | (e) | | | — | |
| Class L | | | 10.85 | | | | 0.24 | | | | — | | | | (0.56 | ) | | | (0.32 | ) | | | (0.25 | ) | | | — | | | | — | | | | (0.25 | ) | | | (0.57 | ) | | | 10.28 | | | | (2.99 | )(f) | | | 7,478 | | | | 0.90 | (e) | | | 0.80 | (e) | | | 0.80 | (e) | | | 4.67 | (e) | | | — | |
| Class Y | | | 10.86 | | | | 0.26 | | | | — | | | | (0.57 | ) | | | (0.31 | ) | | | (0.26 | ) | | | — | | | | — | | | | (0.26 | ) | | | (0.57 | ) | | | 10.29 | | | | (2.89 | )(f) | | | 22,335 | | | | 0.65 | (e) | | | 0.60 | (e) | | | 0.60 | (e) | | | 4.86 | (e) | | | — | |
| For the Year Ended October 31, 2007 | | | | | | | | | | | | | | | | | | | | | | | | | | | | |
| Class A | | | 11.34 | | | | 0.47 | | | | — | | | | (0.44 | ) | | | 0.03 | | | | (0.46 | ) | | | (0.03 | ) | | | — | | | | (0.49 | ) | | | (0.46 | ) | | | 10.88 | | | | 0.30 | | | | 115,459 | | | | 1.15 | | | | 0.85 | | | | 0.85 | | | | 4.20 | | | | 43 | |
| Class B | | | 11.26 | | | | 0.38 | | | | — | | | | (0.43 | ) | | | (0.05 | ) | | | (0.38 | ) | | | (0.03 | ) | | | — | | | | (0.41 | ) | | | (0.46 | ) | | | 10.80 | | | | (0.45 | ) | | | 6,839 | | | | 1.95 | | | | 1.60 | | | | 1.60 | | | | 3.43 | | | | — | |
| Class C | | | 11.29 | | | | 0.38 | | | | — | | | | (0.43 | ) | | | (0.05 | ) | | | (0.38 | ) | | | (0.03 | ) | | | — | | | | (0.41 | ) | | | (0.46 | ) | | | 10.83 | | | | (0.45 | ) | | | 22,467 | | | | 1.90 | | | | 1.60 | | | | 1.60 | | | | 3.45 | | | | — | |
| Class L(j) | | | 11.31 | | | | 0.48 | | | | — | | | | (0.45 | ) | | | 0.03 | | | | (0.46 | ) | | | (0.03 | ) | | | — | | | | (0.49 | ) | | | (0.46 | ) | | | 10.85 | | | | 0.28 | | | | 8,380 | | | | 1.10 | | | | 0.86 | | | | 0.86 | | | | 4.31 | | | | — | |
| Class Y(j) | | | 11.32 | | | | 0.51 | | | | — | | | | (0.46 | ) | | | 0.05 | | | | (0.48 | ) | | | (0.03 | ) | | | — | | | | (0.51 | ) | | | (0.46 | ) | | | 10.86 | | | | 0.48 | | | | 26,275 | | | | 0.85 | | | | 0.65 | | | | 0.65 | | | | 4.78 | | | | — | |
| From (commencement of operations) May 31, 2007, through October 31, 2007 | | | | | | | | | | | | | | | | | | | | | | | | | | | | |
| Class I | | | 11.17 | | | | 0.21 | | | | — | | | | (0.27 | ) | | | (0.06 | ) | | | (0.21 | ) | | | — | | | | — | | | | (0.21 | ) | | | (0.27 | ) | | | 10.90 | | | | (0.54 | )(f) | | | 3,505 | | | | 0.87 | (e) | | | 0.60 | (e) | | | 0.60 | (e) | | | 4.81 | (e) | | | — | |
| For the Year Ended October 31, 2006 | | | | | | | | | | | | | | | | | | | | | | | | | | | | |
| Class A | | | 11.13 | | | | 0.45 | | | | — | | | | 0.29 | | | | 0.74 | | | | (0.45 | ) | | | (0.08 | ) | | | — | | | | (0.53 | ) | | | 0.21 | | | | 11.34 | | | | 6.82 | | | | 71,876 | | | | 1.22 | | | | 1.00 | | | | 1.00 | | | | 4.06 | | | | 14 | |
| Class B | | | 11.06 | | | | 0.37 | | | | — | | | | 0.28 | | | | 0.65 | | | | (0.37 | ) | | | (0.08 | ) | | | — | | | | (0.45 | ) | | | 0.20 | | | | 11.26 | | | | 5.97 | | | | 6,746 | | | | 2.00 | | | | 1.75 | | | | 1.75 | | | | 3.31 | | | | — | |
| Class C | | | 11.09 | | | | 0.37 | | | | — | | | | 0.28 | | | | 0.65 | | | | (0.37 | ) | | | (0.08 | ) | | | — | | | | (0.45 | ) | | | 0.20 | | | | 11.29 | | | | 5.95 | | | | 12,889 | | | | 1.97 | | | | 1.75 | | | | 1.75 | | | | 3.31 | | | | — | |
| Class L | | | 11.10 | | | | 0.44 | | | | — | | | | 0.29 | | | | 0.73 | | | | (0.44 | ) | | | (0.08 | ) | | | — | | | | (0.52 | ) | | | 0.21 | | | | 11.31 | | | | 6.77 | | | | 7,606 | | | | 1.14 | | | | 1.05 | | | | 1.05 | | | | 4.01 | | | | — | |
| Class Y | | | 11.11 | | | | 0.46 | | | | — | | | | 0.29 | | | | 0.75 | | | | (0.46 | ) | | | (0.08 | ) | | | — | | | | (0.54 | ) | | | 0.21 | | | | 11.32 | | | | 6.91 | | | | 11 | | | | 0.91 | | | | 0.89 | | | | 0.89 | | | | 4.17 | | | | — | |
| For the Year Ended October 31, 2005 (h) | | | | | | | | | | | | | | | | | | | | | | | | | | | | |
| Class A | | | 11.22 | | | | 0.43 | | | | — | | | | (0.09 | ) | | | 0.34 | | | | (0.43 | ) | | | — | | | | — | | | | (0.43 | ) | | | (0.09 | ) | | | 11.13 | | | | 3.10 | | | | 46,163 | | | | 1.26 | | | | 1.00 | | | | 1.00 | | | | 3.88 | | | | 22 | |
| Class B | | | 11.15 | | | | 0.35 | | | | — | | | | (0.09 | ) | | | 0.26 | | | | (0.35 | ) | | | — | | | | — | | | | (0.35 | ) | | | (0.09 | ) | | | 11.06 | | | | 2.36 | | | | 6,889 | | | | 2.03 | | | | 1.75 | | | | 1.75 | | | | 3.13 | | | | — | |
| Class C | | | 11.18 | | | | 0.35 | | | | — | | | | (0.09 | ) | | | 0.26 | | | | (0.35 | ) | | | — | | | | — | | | | (0.35 | ) | | | (0.09 | ) | | | 11.09 | | | | 2.35 | | | | 8,496 | | | | 1.99 | | | | 1.75 | | | | 1.75 | | | | 3.13 | | | | — | |
| Class L | | | 11.19 | | | | 0.43 | | | | — | | | | (0.09 | ) | | | 0.34 | | | | (0.43 | ) | | | — | | | | — | | | | (0.43 | ) | | | (0.09 | ) | | | 11.10 | | | | 3.06 | | | | 7,958 | | | | 1.16 | | | | 1.05 | | | | 1.05 | | | | 3.83 | | | | — | |
| Class Y | | | 11.20 | | | | 0.45 | | | | — | | | | (0.10 | ) | | | 0.35 | | | | (0.44 | ) | | | — | | | | — | | | | (0.44 | ) | | | (0.09 | ) | | | 11.11 | | | | 3.20 | | | | 10 | | | | 0.95 | | | | 0.95 | | | | 0.95 | | | | 4.04 | | | | — | |
| For the Year Ended October 31, 2004 | | | | | | | | | | | | | | | | | | | | | | | | | | | | |
| Class A | | | 11.07 | | | | 0.45 | | | | — | | | | 0.32 | | | | 0.77 | | | | (0.45 | ) | | | (0.17 | ) | | | — | | | | (0.62 | ) | | | 0.15 | | | | 11.22 | | | | 7.10 | | | | 35,210 | | | | 1.30 | | | | 1.08 | | | | 1.08 | | | | 4.04 | | | | 18 | |
| Class B | | | 11.00 | | | | 0.37 | | | | — | | | | 0.32 | | | | 0.69 | | | | (0.37 | ) | | | (0.17 | ) | | | — | | | | (0.54 | ) | | | 0.15 | | | | 11.15 | | | | 6.39 | | | | 6,236 | | | | 2.01 | | | | 1.78 | | | | 1.78 | | | | 3.32 | | | | — | |
| Class C | | | 11.02 | | | | 0.37 | | | | — | | | | 0.33 | | | | 0.70 | | | | (0.37 | ) | | | (0.17 | ) | | | — | | | | (0.54 | ) | | | 0.16 | | | | 11.18 | | | | 6.47 | | | | 8,357 | | | | 1.98 | | | | 1.78 | | | | 1.78 | | | | 3.33 | | | | — | |
| Class L | | | 11.04 | | | | 0.44 | | | | — | | | | 0.33 | | | | 0.77 | | | | (0.45 | ) | | | (0.17 | ) | | | — | | | | (0.62 | ) | | | 0.15 | | | | 11.19 | | | | 7.12 | | | | 7,687 | | | | 1.15 | | | | 1.08 | | | | 1.08 | | | | 4.02 | | | | — | |
| Class Y | | | 11.06 | | | | 0.47 | | | | — | | | | 0.32 | | | | 0.79 | | | | (0.48 | ) | | | (0.17 | ) | | | — | | | | (0.65 | ) | | | 0.14 | | | | 11.20 | | | | 7.36 | | | | 1 | | | | 0.91 | | | | 0.91 | | | | 0.91 | | | | 4.23 | | | | — | |
405
The Hartford Mutual Funds, Inc. and The Hartford Mutual Funds II, Inc.
Financial Highlights — (continued)
| | | | | | | | | | | | | | | | | | | | | | | | | | | | | | | | | | | | | | | | | | | | | | | | | | | | | | | | | | | | | | | | | | | | | | | | | |
| | | — Selected Per-Share Data (a) — | | — Ratios and Supplemental Data — |
| | | | | | | | | | | | | | | | | | | | | | | | | | | | | Ratio of
| | Ratio of
| | Ratio of
| | | | |
| | | | | | | | | | | | | | | | | | | | | | | | | | | | | Expenses
| | Expenses
| | Expenses
| | | | |
| | | | | | | | | | | | | | | | | | | | | | | | | | | | | to Average
| | to Average
| | to Average
| | | | |
| | | | | | | | | Net
| | | | | | | | | | | | | | | | | | | | Net Assets
| | Net Assets
| | Net Assets
| | | | |
| | | | | | | | | Realized
| | | | | | | | | | | | Net
| | | | | | | | Before
| | After
| | After
| | Ratio of
| | |
| | | | | | | | | and
| | | | | | Distributions
| | | | | | Increase
| | | | | | | | Waivers and
| | Waivers and
| | Waivers and
| | Net
| | |
| | | Net Asset
| | Net
| | Payments
| | Unrealized
| | Total
| | Dividends
| | from
| | | | | | (Decrease)
| | Net Asset
| | | | Net Assets
| | Reimbursements
| | Reimbursements
| | Reimbursements
| | Investment
| | |
| | | Value at
| | Investment
| | from
| | Gain
| | from
| | from Net
| | Realized
| | Distributions
| | | | in Net
| | Value at
| | | | at End of
| | and Including
| | and Including
| | and Excluding
| | Income
| | Portfolio
|
| | | Beginning
| | Income
| | (to)
| | (Loss) on
| | Investment
| | Investment
| | Capital
| | from
| | Total
| | Asset
| | End
| | Total
| | Period
| | Interest
| | Interest
| | Interest
| | to Average
| | Turnover
|
| | | of Period | | (Loss) | | Affiliate | | Investments | | Operations | | Income | | Gains | | Capital | | Distributions | | Value | | of Period | | Return (b) | | (000’s) | | Expense (d) | | Expense (d) | | Expense (d) | | Net Assets | | Rate (c) |
The Hartford Tax-Free National Fund — (continued) | | | | | | | | | | | | | | | | | | | | | | | | | | | | |
| For the Year Ended October 31, 2003 | | | | | | | | | | | | | | | | | | | | | | | | | | | | |
| Class A | | $ | 11.28 | | | $ | 0.41 | | | $ | — | | | $ | 0.04 | | | $ | 0.45 | | | $ | (0.41 | ) | | $ | (0.25 | ) | | $ | — | | | $ | (0.66 | ) | | $ | (0.21 | ) | | $ | 11.07 | | | | 4.18 | % | | $ | 21,457 | | | | 1.61 | % | | | 1.15 | % | | | 1.15 | % | | | 3.75 | % | | | 35 | % |
| Class B | | | 11.21 | | | | 0.33 | | | | — | | | | 0.04 | | | | 0.37 | | | | (0.33 | ) | | | (0.25 | ) | | | — | | | | (0.58 | ) | | | (0.21 | ) | | | 11.00 | | | | 3.43 | | | | 6,598 | | | | 2.33 | | | | 1.85 | | | | 1.85 | | | | 3.05 | | | | — | |
| Class C | | | 11.23 | | | | 0.33 | | | | — | | | | 0.04 | | | | 0.37 | | | | (0.33 | ) | | | (0.25 | ) | | | — | | | | (0.58 | ) | | | (0.21 | ) | | | 11.02 | | | | 3.42 | | | | 7,588 | | | | 2.21 | | | | 1.85 | | | | 1.85 | | | | 3.06 | | | | — | |
| Class L | | | 11.25 | | | | 0.42 | | | | — | | | | 0.04 | | | | 0.46 | | | | (0.42 | ) | | | (0.25 | ) | | | — | | | | (0.67 | ) | | | (0.21 | ) | | | 11.04 | | | | 4.24 | | | | 7,454 | | | | 1.18 | | | | 1.10 | | | | 1.10 | | | | 3.76 | | | | — | |
| Class Y | | | 11.28 | | | | 0.45 | | | | — | | | | 0.04 | | | | 0.49 | | | | (0.46 | ) | | | (0.25 | ) | | | — | | | | (0.71 | ) | | | (0.22 | ) | | | 11.06 | | | | 4.53 | | | | 1 | | | | 1.17 | | | | 0.85 | | | | 0.85 | | | | 4.06 | | | | — | |
The Hartford Tax-Free New York Fund | | | | | | | | | | | | | | | | | | | | | | | | | | | | |
| For the Six-Month Period Ended April 30, 2008 (Unaudited) | | | | | | | | | | | | | | | | | | | | | | | | | | | | |
| Class A | | | 10.14 | | | | 0.20 | | | | — | | | | (0.27 | ) | | | (0.07 | ) | | | (0.21 | ) | | | — | | | | — | | | | (0.21 | ) | | | (0.28 | ) | | | 9.86 | | | | (0.71 | )(f) | | | 11,853 | | | | 0.97 | (e) | | | 0.85 | (e) | | | 0.85 | (e) | | | 4.13 | (e) | | | 12 | |
| Class B | | | 10.14 | | | | 0.17 | | | | — | | | | (0.28 | ) | | | (0.11 | ) | | | (0.17 | ) | | | — | | | | — | | | | (0.17 | ) | | | (0.28 | ) | | | 9.86 | | | | (1.08 | )(f) | | | 1,569 | | | | 1.74 | (e) | | | 1.60 | (e) | | | 1.60 | (e) | | | 3.37 | (e) | | | — | |
| Class C | | | 10.14 | | | | 0.17 | | | | — | | | | (0.28 | ) | | | (0.11 | ) | | | (0.17 | ) | | | — | | | | — | | | | (0.17 | ) | | | (0.28 | ) | | | 9.86 | | | | (1.08 | )(f) | | | 2,791 | | | | 1.73 | (e) | | | 1.60 | (e) | | | 1.60 | (e) | | | 3.38 | (e) | | | — | |
| For the Year Ended October 31, 2007 | | | | | | | | | | | | | | | | | | | | | | | | | | | | |
| Class A | | | 10.53 | | | | 0.40 | | | | — | | | | (0.33 | ) | | | 0.07 | | | | (0.40 | ) | | | (0.06 | ) | | | — | | | | (0.46 | ) | | | (0.39 | ) | | | 10.14 | | | | 0.65 | | | | 11,276 | | | | 0.97 | | | | 0.85 | | | | 0.85 | | | | 3.90 | | | | 18 | |
| Class B | | | 10.53 | | | | 0.32 | | | | — | | | | (0.33 | ) | | | (0.01 | ) | | | (0.32 | ) | | | (0.06 | ) | | | — | | | | (0.38 | ) | | | (0.39 | ) | | | 10.14 | | | | (0.10 | ) | | | 1,677 | | | | 1.74 | | | | 1.60 | | | | 1.60 | | | | 3.14 | | | | — | |
| Class C | | | 10.53 | | | | 0.32 | | | | — | | | | (0.33 | ) | | | (0.01 | ) | | | (0.32 | ) | | | (0.06 | ) | | | — | | | | (0.38 | ) | | | (0.39 | ) | | | 10.14 | | | | (0.09 | ) | | | 2,669 | | | | 1.73 | | | | 1.60 | | | | 1.60 | | | | 3.15 | | | | — | |
| For the Year Ended October 31, 2006 | | | | | | | | | | | | | | | | | | | | | | | | | | | | |
| Class A | | | 10.32 | | | | 0.39 | | | | — | | | | 0.23 | | | | 0.62 | | | | (0.39 | ) | | | (0.02 | ) | | | — | | | | (0.41 | ) | | | 0.21 | | | | 10.53 | | | | 6.21 | | | | 11,182 | | | | 1.03 | | | | 0.85 | | | | 0.85 | | | | 3.78 | | | | 25 | |
| Class B | | | 10.32 | | | | 0.31 | | | | — | | | | 0.24 | | | | 0.55 | | | | (0.32 | ) | | | (0.02 | ) | | | — | | | | (0.34 | ) | | | 0.21 | | | | 10.53 | | | | 5.41 | | | | 1,808 | | | | 1.79 | | | | 1.60 | | | | 1.60 | | | | 3.03 | | | | — | |
| Class C | | | 10.32 | | | | 0.32 | | | | — | | | | 0.23 | | | | 0.55 | | | | (0.32 | ) | | | (0.02 | ) | | | — | | | | (0.34 | ) | | | 0.21 | | | | 10.53 | | | | 5.41 | | | | 2,492 | | | | 1.78 | | | | 1.60 | | | | 1.60 | | | | 3.03 | | | | — | |
| For the Year Ended October 31, 2005 | | | | | | | | | | | | | | | | | | | | | | | | | | | | |
| Class A | | | 10.42 | | | | 0.36 | | | | — | | | | (0.08 | ) | | | 0.28 | | | | (0.36 | ) | | | (0.02 | ) | | | — | | | | (0.38 | ) | | | (0.10 | ) | | | 10.32 | | | | 2.66 | | | | 11,202 | | | | 1.03 | | | | 0.85 | | | | 0.85 | | | | 3.45 | | | | 23 | |
| Class B | | | 10.42 | | | | 0.28 | | | | — | | | | (0.08 | ) | | | 0.20 | | | | (0.28 | ) | | | (0.02 | ) | | | — | | | | (0.30 | ) | | | (0.10 | ) | | | 10.32 | | | | 1.90 | | | | 1,794 | | | | 1.80 | | | | 1.60 | | | | 1.60 | | | | 2.70 | | | | — | |
| Class C | | | 10.42 | | | | 0.28 | | | | — | | | | (0.08 | ) | | | 0.20 | | | | (0.28 | ) | | | (0.02 | ) | | | — | | | | (0.30 | ) | | | (0.10 | ) | | | 10.32 | | | | 1.90 | | | | 2,677 | | | | 1.79 | | | | 1.60 | | | | 1.60 | | | | 2.70 | | | | — | |
| For the Year Ended October 31, 2004 | | | | | | | | | | | | | | | | | | | | | | | | | | | | |
| Class A | | | 10.15 | | | | 0.37 | | | | — | | | | 0.37 | | | | 0.74 | | | | (0.39 | ) | | | (0.08 | ) | | | — | | | | (0.47 | ) | | | 0.27 | | | | 10.42 | | | | 7.52 | | | | 10,541 | | | | 1.04 | | | | 0.91 | | | | 0.91 | | | | 3.66 | | | | 24 | |
| Class B | | | 10.15 | | | | 0.30 | | | | — | | | | 0.37 | | | | 0.67 | | | | (0.32 | ) | | | (0.08 | ) | | | — | | | | (0.40 | ) | | | 0.27 | | | | 10.42 | | | | 6.76 | | | | 1,568 | | | | 1.74 | | | | 1.61 | | | | 1.61 | | | | 2.96 | | | | — | |
| Class C | | | 10.15 | | | | 0.30 | | | | — | | | | 0.37 | | | | 0.67 | | | | (0.32 | ) | | | (0.08 | ) | | | — | | | | (0.40 | ) | | | 0.27 | | | | 10.42 | | | | 6.76 | | | | 1,973 | | | | 1.75 | | | | 1.62 | | | | 1.62 | | | | 2.95 | | | | — | |
| From inception October 31, 2002, through October 31, 2003 | | | | | | | | | | | | | | | | | | | | | | | | | | | | |
| Class A | | | 10.00 | | | | 0.34 | | | | — | | | | 0.16 | | | | 0.50 | | | | (0.35 | ) | | | — | | | | — | | | | (0.35 | ) | | | 0.15 | | | | 10.15 | | | | 5.03 | (f) | | | 8,602 | | | | 1.63 | (e) | | | 0.95 | (e) | | | 0.95 | (e) | | | 3.34 | (e) | | | 54 | |
| Class B | | | 10.00 | | | | 0.27 | | | | — | | | | 0.16 | | | | 0.43 | | | | (0.28 | ) | | | — | | | | — | | | | (0.28 | ) | | | 0.15 | | | | 10.15 | | | | 4.30 | (f) | | | 1,051 | | | | 2.38 | (e) | | | 1.65 | (e) | | | 1.65 | (e) | | | 2.64 | (e) | | | — | |
| Class C | | | 10.00 | | | | 0.27 | | | | — | | | | 0.16 | | | | 0.43 | | | | (0.28 | ) | | | — | | | | — | | | | (0.28 | ) | | | 0.15 | | | | 10.15 | | | | 4.30 | (f) | | | 1,393 | | | | 2.26 | (e) | | | 1.65 | (e) | | | 1.65 | (e) | | | 2.67 | (e) | | | — | |
The Hartford Total Return Bond Fund | | | | | | | | | | | | | | | | | | | | | | | | | | | | |
| For the Six-Month Period Ended April 30, 2008 (Unaudited) | | | | | | | | | | | | | | | | | | | | | | | | | | | | |
| Class A | | | 10.52 | | | | 0.24 | | | | — | | | | (0.05 | ) | | | 0.19 | | | | (0.27 | ) | | | — | | | | — | | | | (0.27 | ) | | | (0.08 | ) | | | 10.44 | | | | 1.80 | (f) | | | 689,624 | | | | 1.02 | (e) | | | 1.00 | (e) | | | 1.00 | (e) | | | 4.68 | (e) | | | 92 | |
| Class B | | | 10.47 | | | | 0.21 | | | | — | | | | (0.07 | ) | | | 0.14 | | | | (0.23 | ) | | | — | | | | — | | | | (0.23 | ) | | | (0.09 | ) | | | 10.38 | | | | 1.35 | (f) | | | 85,093 | | | | 1.93 | (e) | | | 1.71 | (e) | | | 1.71 | (e) | | | 3.97 | (e) | | | — | |
| Class C | | | 10.54 | | | | 0.21 | | | | — | | | | (0.06 | ) | | | 0.15 | | | | (0.23 | ) | | | — | | | | — | | | | (0.23 | ) | | | (0.08 | ) | | | 10.46 | | | | 1.42 | (f) | | | 107,505 | | | | 1.74 | (e) | | | 1.74 | (e) | | | 1.74 | (e) | | | 3.94 | (e) | | | — | |
| Class I | | | 10.52 | | | | 0.26 | | | | — | | | | (0.06 | ) | | | 0.20 | | | | (0.28 | ) | | | — | | | | — | | | | (0.28 | ) | | | (0.08 | ) | | | 10.44 | | | | 1.93 | (f) | | | 6,105 | | | | 0.68 | (e) | | | 0.68 | (e) | | | 0.68 | (e) | | | 5.02 | (e) | | | — | |
| Class R3 | | | 10.64 | | | | 0.23 | | | | — | | | | (0.06 | ) | | | 0.17 | | | | (0.25 | ) | | | — | | | | — | | | | (0.25 | ) | | | (0.08 | ) | | | 10.56 | | | | 1.63 | (f) | | | 35 | | | | 1.54 | (e) | | | 1.22 | (e) | | | 1.22 | (e) | | | 4.47 | (e) | | | — | |
| Class R4 | | | 10.65 | | | | 0.26 | | | | — | | | | (0.07 | ) | | | 0.19 | | | | (0.27 | ) | | | — | | | | — | | | | (0.27 | ) | | | (0.08 | ) | | | 10.57 | | | | 1.77 | (f) | | | 9,835 | | | | 0.99 | (e) | | | 0.99 | (e) | | | 0.99 | (e) | | | 4.70 | (e) | | | — | |
| Class R5 | | | 10.64 | | | | 0.27 | | | | — | | | | (0.06 | ) | | | 0.21 | | | | (0.28 | ) | | | — | | | | — | | | | (0.28 | ) | | | (0.07 | ) | | | 10.57 | | | | 2.01 | (f) | | | 302 | | | | 0.70 | (e) | | | 0.70 | (e) | | | 0.70 | (e) | | | 5.00 | (e) | | | — | |
| Class Y | | | 10.64 | | | | 0.26 | | | | — | | | | (0.05 | ) | | | 0.21 | | | | (0.29 | ) | | | — | | | | — | | | | (0.29 | ) | | | (0.08 | ) | | | 10.56 | | | | 1.97 | (f) | | | 526,972 | | | | 0.59 | (e) | | | 0.59 | (e) | | | 0.59 | (e) | | | 5.09 | (e) | | | — | |
| For the Year Ended October 31, 2007 | | | | | | | | | | | | | | | | | | | | | | | | | | | | |
| Class A | | | 10.59 | | | | 0.49 | | | | — | | | | (0.06 | ) | | | 0.43 | | | | (0.50 | ) | | | — | | | | — | | | | (0.50 | ) | | | (0.07 | ) | | | 10.52 | | | | 4.11 | | | | 601,301 | | | | 1.07 | | | | 1.00 | | | | 1.00 | | | | 4.71 | | | | 268 | |
| Class B | | | 10.54 | | | | 0.41 | | | | — | | | | (0.06 | ) | | | 0.35 | | | | (0.42 | ) | | | — | | | | — | | | | (0.42 | ) | | | (0.07 | ) | | | 10.47 | | | | 3.36 | | | | 82,376 | | | | 1.96 | | | | 1.75 | | | | 1.75 | | | | 3.95 | | | | — | |
| Class C | | | 10.61 | | | | 0.42 | | | | — | | | | (0.07 | ) | | | 0.35 | | | | (0.42 | ) | | | — | | | | — | | | | (0.42 | ) | | | (0.07 | ) | | | 10.54 | | | | 3.33 | | | | 84,793 | | | | 1.78 | | | | 1.75 | | | | 1.75 | | | | 3.95 | | | | — | |
| Class I | | | 10.60 | | | | 0.53 | | | | — | | | | (0.07 | ) | | | 0.46 | | | | (0.54 | ) | | | — | | | | — | | | | (0.54 | ) | | | (0.08 | ) | | | 10.52 | | | | 4.42 | | | | 3,050 | | | | 0.72 | | | | 0.72 | | | | 0.72 | | | | 5.04 | | | | — | |
| Class Y | | | 10.71 | | | | 0.54 | | | | — | | | | (0.07 | ) | | | 0.47 | | | | (0.54 | ) | | | — | | | | — | | | | (0.54 | ) | | | (0.07 | ) | | | 10.64 | | | | 4.46 | | | | 359,523 | | | | 0.61 | | | | 0.61 | | | | 0.61 | | | | 5.09 | | | | — | |
| From (commencement of operations) December 22, 2006, through October 31, 2007 | | | | | | | | | | | | | | | | | | | | | | | | | | | | |
| Class R3 | | | 10.76 | | | | 0.41 | | | | — | | | | (0.14 | ) | | | 0.27 | | | | (0.39 | ) | | | — | | | | — | | | | (0.39 | ) | | | (0.12 | ) | | | 10.64 | | | | 2.59 | (f) | | | 10 | | | | 1.38 | (e) | | | 1.25 | (e) | | | 1.25 | (e) | | | 4.47 | (e) | | | — | |
| Class R4 | | | 10.76 | | | | 0.42 | | | | — | | | | (0.12 | ) | | | 0.30 | | | | (0.41 | ) | | | — | | | | — | | | | (0.41 | ) | | | (0.11 | ) | | | 10.65 | | | | 2.90 | (f) | | | 2,928 | | | | 1.09 | (e) | | | 1.00 | (e) | | | 1.00 | (e) | | | 4.95 | (e) | | | — | |
| Class R5 | | | 10.76 | | | | 0.43 | | | | — | | | | (0.12 | ) | | | 0.31 | | | | (0.43 | ) | | | — | | | | — | | | | (0.43 | ) | | | (0.12 | ) | | | 10.64 | | | | 2.97 | (f) | | | 141 | | | | 0.79 | (e) | | | 0.79 | (e) | | | 0.79 | (e) | | | 5.09 | (e) | | | — | |
| For the Year Ended October 31, 2006 | | | | | | | | | | | | | | | | | | | | | | | | | | | | |
| Class A | | | 10.62 | | | | 0.41 | | | | — | | | | 0.04 | | | | 0.45 | | | | (0.42 | ) | | | (0.06 | ) | | | — | | | | (0.48 | ) | | | (0.03 | ) | | | 10.59 | | | | 4.35 | | | | 432,703 | | | | 1.20 | | | | 1.20 | | | | 1.20 | | | | 3.98 | | | | 456 | |
| Class B | | | 10.57 | | | | 0.33 | | | | — | | | | 0.04 | | | | 0.37 | | | | (0.34 | ) | | | (0.06 | ) | | | — | | | | (0.40 | ) | | | (0.03 | ) | | | 10.54 | | | | 3.56 | | | | 79,506 | | | | 2.02 | | | | 1.95 | | | | 1.95 | | | | 3.20 | | | | — | |
| Class C | | | 10.64 | | | | 0.34 | | | | — | | | | 0.03 | | | | 0.37 | | | | (0.34 | ) | | | (0.06 | ) | | | — | | | | (0.40 | ) | | | (0.03 | ) | | | 10.61 | | | | 3.63 | | | | 75,194 | | | | 1.87 | | | | 1.87 | | | | 1.87 | | | | 3.29 | | | | — | |
| Class Y | | | 10.73 | | | | 0.47 | | | | — | | | | 0.04 | | | | 0.51 | | | | (0.47 | ) | | | (0.06 | ) | | | — | | | | (0.53 | ) | | | (0.02 | ) | | | 10.71 | | | | 4.89 | | | | 285,255 | | | | 0.70 | | | | 0.70 | | | | 0.70 | | | | 4.48 | | | | — | |
| From (commencement of operations) August 31, 2006, through October 31, 2006 | | | | | | | | | | | | | | | | | | | | | | | | | | | | |
| Class I | | | 10.51 | | | | 0.08 | | | | — | | | | 0.09 | | | | 0.17 | | | | (0.08 | ) | | | — | | | | — | | | | (0.08 | ) | | | 0.09 | | | | 10.60 | | | | 1.58 | (f) | | | 38 | | | | 1.01 | (e) | | | 0.91 | (e) | | | 0.91 | (e) | | | 4.78 | (e) | | | — | |
406
| | | | | | | | | | | | | | | | | | | | | | | | | | | | | | | | | | | | | | | | | | | | | | | | | | | | | | | | | | | | | | | | | | | | | | | | | |
| | | — Selected Per-Share Data (a) — | | — Ratios and Supplemental Data — |
| | | | | | | | | | | | | | | | | | | | | | | | | | | | | Ratio of
| | Ratio of
| | Ratio of
| | | | |
| | | | | | | | | | | | | | | | | | | | | | | | | | | | | Expenses
| | Expenses
| | Expenses
| | | | |
| | | | | | | | | | | | | | | | | | | | | | | | | | | | | to Average
| | to Average
| | to Average
| | | | |
| | | | | | | | | Net
| | | | | | | | | | | | | | | | | | | | Net Assets
| | Net Assets
| | Net Assets
| | | | |
| | | | | | | | | Realized
| | | | | | | | | | | | Net
| | | | | | | | Before
| | After
| | After
| | Ratio of
| | |
| | | | | | | | | and
| | | | | | Distributions
| | | | | | Increase
| | | | | | | | Waivers and
| | Waivers and
| | Waivers and
| | Net
| | |
| | | Net Asset
| | Net
| | Payments
| | Unrealized
| | Total
| | Dividends
| | from
| | | | | | (Decrease)
| | Net Asset
| | | | Net Assets
| | Reimbursements
| | Reimbursements
| | Reimbursements
| | Investment
| | |
| | | Value at
| | Investment
| | from
| | Gain
| | from
| | from Net
| | Realized
| | Distributions
| | | | in Net
| | Value at
| | | | at End of
| | and Including
| | and Including
| | and Excluding
| | Income
| | Portfolio
|
| | | Beginning
| | Income
| | (to)
| | (Loss) on
| | Investment
| | Investment
| | Capital
| | from
| | Total
| | Asset
| | End
| | Total
| | Period
| | Interest
| | Interest
| | Interest
| | to Average
| | Turnover
|
| | | of Period | | (Loss) | | Affiliate | | Investments | | Operations | | Income | | Gains | | Capital | | Distributions | | Value | | of Period | | Return (b) | | (000’s) | | Expense (d) | | Expense (d) | | Expense (d) | | Net Assets | | Rate (c) |
The Hartford Total Return Bond Fund — (continued) | | | | | | | | | | | | | | | | | | | | | | | | | | | | |
| For the Year Ended October 31, 2005 | | | | | | | | | | | | | | | | | | | | | | | | | | | | |
| Class A | | $ | 10.95 | | | $ | 0.35 | | | $ | — | | | $ | (0.24 | ) | | $ | 0.11 | | | $ | (0.40 | ) | | $ | (0.04 | ) | | $ | — | | | $ | (0.44 | ) | | $ | (0.33 | ) | | $ | 10.62 | | | | 1.00 | % | | $ | 311,557 | | | | 1.24 | % | | | 1.20 | % | | | 1.20 | % | | | 3.24 | % | | | 195 | % |
| Class B | | | 10.90 | | | | 0.27 | | | | — | | | | (0.24 | ) | | | 0.03 | | | | (0.32 | ) | | | (0.04 | ) | | | — | | | | (0.36 | ) | | | (0.33 | ) | | | 10.57 | | | | 0.25 | | | | 81,028 | | | | 2.00 | | | | 1.95 | | | | 1.95 | | | | 2.49 | | | | — | |
| Class C | | | 10.97 | | | | 0.29 | | | | — | | | | (0.25 | ) | | | 0.04 | | | | (0.33 | ) | | | (0.04 | ) | | | — | | | | (0.37 | ) | | | (0.33 | ) | | | 10.64 | | | | 0.34 | | | | 74,039 | | | | 1.87 | | | | 1.87 | | | | 1.87 | | | | 2.56 | | | | — | |
| Class Y | | | 11.06 | | | | 0.40 | | | | — | | | | (0.24 | ) | | | 0.16 | | | | (0.45 | ) | | | (0.04 | ) | | | — | | | | (0.49 | ) | | | (0.33 | ) | | | 10.73 | | | | 1.45 | | | | 188,156 | | | | 0.73 | | | | 0.73 | | | | 0.73 | | | | 3.73 | | | | — | |
| For the Year Ended October 31, 2004 | | | | | | | | | | | | | | | | | | | | | | | | | | | | |
| Class A | | | 11.14 | | | | 0.32 | | | | — | | | | 0.21 | | | | 0.53 | | | | (0.35 | ) | | | (0.37 | ) | | | — | | | | (0.72 | ) | | | (0.19 | ) | | | 10.95 | | | | 5.10 | (i) | | | 298,903 | | | | 1.27 | | | | 1.25 | | | | 1.25 | | | | 2.98 | | | | 171 | |
| Class B | | | 11.09 | | | | 0.24 | | | | — | | | | 0.22 | | | | 0.46 | | | | (0.28 | ) | | | (0.37 | ) | | | — | | | | (0.65 | ) | | | (0.19 | ) | | | 10.90 | | | | 4.37 | (i) | | | 91,861 | | | | 1.97 | | | | 1.95 | | | | 1.95 | | | | 2.28 | | | | — | |
| Class C | | | 11.12 | | | | 0.26 | | | | 0.01 | | | | 0.23 | | | | 0.50 | | | | (0.28 | ) | | | (0.37 | ) | | | — | | | | (0.65 | ) | | | (0.15 | ) | | | 10.97 | | | | 4.76 | (i) | | | 89,504 | | | | 1.86 | | | | 1.86 | | | | 1.86 | | | | 2.37 | | | | — | |
| Class Y | | | 11.24 | | | | 0.39 | | | | — | | | | 0.21 | | | | 0.60 | | | | (0.41 | ) | | | (0.37 | ) | | | — | | | | (0.78 | ) | | | (0.18 | ) | | | 11.06 | | | | 5.64 | | | | 101,360 | | | | 0.74 | | | | 0.74 | | | | 0.74 | | | | 3.48 | | | | — | |
| For the Year Ended October 31, 2003 | | | | | | | | | | | | | | | | | | | | | | | | | | | | |
| Class A | | | 10.78 | | | | 0.49 | | | | — | | | | 0.48 | | | | 0.97 | | | | (0.50 | ) | | | (0.11 | ) | | | — | | | | (0.61 | ) | | | 0.36 | | | | 11.14 | | | | 9.16 | | | | 268,655 | | | | 1.40 | | | | 1.25 | | | | 1.25 | | | | 3.39 | | | | 199 | |
| Class B | | | 10.73 | | | | 0.42 | | | | — | | | | 0.47 | | | | 0.89 | | | | (0.42 | ) | | | (0.11 | ) | | | — | | | | (0.53 | ) | | | 0.36 | | | | 11.09 | | | | 8.44 | | | | 106,077 | | | | 2.13 | | | | 1.95 | | | | 1.95 | | | | 2.70 | | | | — | |
| Class C | | | 10.77 | | | | 0.42 | | | | — | | | | 0.46 | | | | 0.88 | | | | (0.42 | ) | | | (0.11 | ) | | | — | | | | (0.53 | ) | | | 0.35 | | | | 11.12 | | | | 8.31 | | | | 110,214 | | | | 2.01 | | | | 1.95 | | | | 1.95 | | | | 2.71 | | | | — | |
| Class Y | | | 10.87 | | | | 0.53 | | | | — | | | | 0.50 | | | | 1.03 | | | | (0.55 | ) | | | (0.11 | ) | | | — | | | | (0.66 | ) | | | 0.37 | | | | 11.24 | | | | 9.68 | | | | 60,125 | | | | 0.81 | | | | 0.80 | | | | 0.80 | | | | 3.82 | | | | — | |
The Hartford U.S. Government Securities Fund | | | | | | | | | | | | | | | | | | | | | | | | | | | | |
| For the Six-Month Period Ended April 30, 2008 (Unaudited) | | | | | | | | | | | | | | | | | | | | | | | | | | | | |
| Class A | | | 9.06 | | | | 0.22 | | | | — | | | | (0.02 | ) | | | 0.20 | | | | (0.21 | ) | | | — | | | | — | | | | (0.21 | ) | | | (0.01 | ) | | | 9.05 | | | | 2.21 | (f) | | | 68,578 | | | | 1.11 | (e) | | | 1.00 | (e) | | | 1.00 | (e) | | | 4.75 | (e) | | | 32 | |
| Class B | | | 9.02 | | | | 0.19 | | | | — | | | | (0.03 | ) | | | 0.16 | | | | (0.18 | ) | | | — | | | | — | | | | (0.18 | ) | | | (0.02 | ) | | | 9.00 | | | | 1.79 | (f) | | | 15,153 | | | | 2.03 | (e) | | | 1.65 | (e) | | | 1.65 | (e) | | | 4.10 | (e) | | | — | |
| Class C | | | 9.02 | | | | 0.18 | | | | — | | | | (0.02 | ) | | | 0.16 | | | | (0.18 | ) | | | — | | | | — | | | | (0.18 | ) | | | (0.02 | ) | | | 9.00 | | | | 1.73 | (f) | | | 24,353 | | | | 1.78 | (e) | | | 1.75 | (e) | | | 1.75 | (e) | | | 4.00 | (e) | | | — | |
| Class L | | | 9.05 | | | | 0.22 | | | | — | | | | (0.01 | ) | | | 0.21 | | | | (0.22 | ) | | | — | | | | — | | | | (0.22 | ) | | | (0.01 | ) | | | 9.04 | | | | 2.29 | (f) | | | 29,226 | | | | 0.89 | (e) | | | 0.88 | (e) | | | 0.88 | (e) | | | 4.88 | (e) | | | — | |
| Class Y | | | 9.08 | | | | 0.23 | | | | — | | | | (0.02 | ) | | | 0.21 | | | | (0.23 | ) | | | — | | | | — | | | | (0.23 | ) | | | (0.02 | ) | | | 9.06 | | | | 2.28 | (f) | | | 75,509 | | | | 0.65 | (e) | | | 0.65 | (e) | | | 0.65 | (e) | | | 5.11 | (e) | | | — | |
| For the Year Ended October 31, 2007 | | | | | | | | | | | | | | | | | | | | | | | | | | | | |
| Class A | | | 9.23 | | | | 0.44 | | | | — | | | | (0.17 | ) | | | 0.27 | | | | (0.44 | ) | | | — | | | | — | | | | (0.44 | ) | | | (0.17 | ) | | | 9.06 | | | | 3.00 | | | | 54,414 | | | | 1.20 | | | | 1.00 | | | | 1.00 | | | | 4.85 | | | | 68 | |
| Class B | | | 9.18 | | | | 0.38 | | | | — | | | | (0.17 | ) | | | 0.21 | | | | (0.37 | ) | | | — | | | | — | | | | (0.37 | ) | | | (0.16 | ) | | | 9.02 | | | | 2.38 | | | | 13,837 | | | | 2.07 | | | | 1.71 | | | | 1.71 | | | | 4.14 | | | | — | |
| Class C | | | 9.18 | | | | 0.37 | | | | — | | | | (0.16 | ) | | | 0.21 | | | | (0.37 | ) | | | — | | | | — | | | | (0.37 | ) | | | (0.16 | ) | | | 9.02 | | | | 2.35 | | | | 14,488 | | | | 1.87 | | | | 1.75 | | | | 1.75 | | | | 4.10 | | | | — | |
| Class L(j) | | | 9.22 | | | | 0.46 | | | | — | | | | (0.18 | ) | | | 0.28 | | | | (0.45 | ) | | | — | | | | — | | | | (0.45 | ) | | | (0.17 | ) | | | 9.05 | | | | 3.08 | | | | 31,681 | | | | 0.93 | | | | 0.91 | | | | 0.91 | | | | 5.02 | | | | — | |
| Class Y(j) | | | 9.20 | | | | 0.46 | | | | — | | | | (0.13 | ) | | | 0.33 | | | | (0.45 | ) | | | — | | | | — | | | | (0.45 | ) | | | (0.12 | ) | | | 9.08 | | | | 3.72 | | | | 78,906 | | | | 0.68 | | | | 0.68 | | | | 0.68 | | | | 5.65 | | | | — | |
| For the Year Ended October 31, 2006 (h) | | | | | | | | | | | | | | | | | | | | | | | | | | | | |
| Class A | | | 9.32 | | | | 0.42 | | | | — | | | | (0.08 | ) | | | 0.34 | | | | (0.43 | ) | | | — | | | | — | | | | (0.43 | ) | | | (0.09 | ) | | | 9.23 | | | | 3.77 | | | | 45,851 | | | | 1.39 | | | | 1.15 | | | | 1.15 | | | | 4.60 | | | | 158 | |
| Class B | | | 9.27 | | | | 0.35 | | | | — | | | | (0.08 | ) | | | 0.27 | | | | (0.36 | ) | | | — | | | | — | | | | (0.36 | ) | | | (0.09 | ) | | | 9.18 | | | | 3.01 | | | | 17,011 | | | | 2.20 | | | | 1.91 | | | | 1.91 | | | | 3.84 | | | | — | |
| Class C | | | 9.27 | | | | 0.35 | | | | — | | | | (0.08 | ) | | | 0.27 | | | | (0.36 | ) | | | — | | | | — | | | | (0.36 | ) | | | (0.09 | ) | | | 9.18 | | | | 3.01 | | | | 9,698 | | | | 2.08 | | | | 1.90 | | | | 1.90 | | | | 3.86 | | | | — | |
| Class L | | | 9.31 | | | | 0.43 | | | | — | | | | (0.08 | ) | | | 0.35 | | | | (0.44 | ) | | | — | | | | — | | | | (0.44 | ) | | | (0.09 | ) | | | 9.22 | | | | 3.86 | | | | 30,712 | | | | 1.08 | | | | 1.08 | | | | 1.08 | | | | 4.67 | | | | — | |
| Class Y | | | 9.32 | | | | 0.41 | | | | — | | | | (0.07 | ) | | | 0.34 | | | | (0.46 | ) | | | — | | | | — | | | | (0.46 | ) | | | (0.12 | ) | | | 9.20 | | | | 3.75 | | | | 101 | | | | 0.85 | | | | 0.83 | | | | 0.83 | | | | 4.86 | | | | — | |
| For the Year Ended October 31, 2005 | | | | | | | | | | | | | | | | | | | | | | | | | | | | |
| Class A | | | 9.65 | | | | 0.40 | | | | — | | | | (0.32 | ) | | | 0.08 | | | | (0.41 | ) | | | — | | | | — | | | | (0.41 | ) | | | (0.33 | ) | | | 9.32 | | | | 0.79 | | | | 47,252 | | | | 1.38 | | | | 1.15 | | | | 1.15 | | | | 4.17 | | | | 108 | |
| Class B | | | 9.62 | | | | 0.32 | | | | — | | | | (0.34 | ) | | | (0.02 | ) | | | (0.33 | ) | | | — | | | | — | | | | (0.33 | ) | | | (0.35 | ) | | | 9.27 | | | | (0.17 | ) | | | 21,268 | | | | 2.17 | | | | 1.90 | | | | 1.90 | | | | 3.41 | | | | — | |
| Class C | | | 9.61 | | | | 0.32 | | | | — | | | | (0.33 | ) | | | (0.01 | ) | | | (0.33 | ) | | | — | | | | — | | | | (0.33 | ) | | | (0.34 | ) | | | 9.27 | | | | (0.07 | ) | | | 9,631 | | | | 2.05 | | | | 1.90 | | | | 1.90 | | | | 3.41 | | | | — | |
| Class L | | | 9.65 | | | | 0.41 | | | | — | | | | (0.34 | ) | | | 0.07 | | | | (0.41 | ) | | | — | | | | — | | | | (0.41 | ) | | | (0.34 | ) | | | 9.31 | | | | 0.77 | | | | 34,880 | | | | 1.08 | | | | 1.08 | | | | 1.08 | | | | 4.24 | | | | — | |
| Class Y | | | 9.66 | | | | 0.41 | | | | — | | | | (0.31 | ) | | | 0.10 | | | | (0.44 | ) | | | — | | | | — | | | | (0.44 | ) | | | (0.34 | ) | | | 9.32 | | | | 1.04 | | | | 9,244 | | | | 0.86 | | | | 0.86 | | | | 0.86 | | | | 4.52 | | | | — | |
| For the Year Ended October 31, 2004 | | | | | | | | | | | | | | | | | | | | | | | | | | | | |
| Class A | | | 9.67 | | | | 0.40 | | | | — | | | | (0.01 | ) | | | 0.39 | | | | (0.41 | ) | | | — | | | | — | | | | (0.41 | ) | | | (0.02 | ) | | | 9.65 | | | | 4.08 | | | | 53,401 | | | | 1.38 | | | | 1.20 | | | | 1.20 | | | | 4.09 | | | | 110 | |
| Class B | | | 9.64 | | | | 0.32 | | | | — | | | | — | | | | 0.32 | | | | (0.34 | ) | | | — | | | | — | | | | (0.34 | ) | | | (0.02 | ) | | | 9.62 | | | | 3.37 | | | | 26,218 | | | | 2.11 | | | | 1.90 | | | | 1.90 | | | | 3.39 | | | | — | |
| Class C | | | 9.63 | | | | 0.32 | | | | — | | | | — | | | | 0.32 | | | | (0.34 | ) | | | — | | | | — | | | | (0.34 | ) | | | (0.02 | ) | | | 9.61 | | | | 3.37 | | | | 13,926 | | | | 2.00 | | | | 1.90 | | | | 1.90 | | | | 3.38 | | | | — | |
| Class L | | | 9.67 | | | | 0.41 | | | | — | | | | (0.01 | ) | | | 0.40 | | | | (0.42 | ) | | | — | | | | — | | | | (0.42 | ) | | | (0.02 | ) | | | 9.65 | | | | 4.24 | | | | 38,613 | | | | 1.04 | | | | 1.04 | | | | 1.04 | | | | 4.26 | | | | — | |
| Class Y | | | 9.68 | | | | 0.44 | | | | — | | | | (0.02 | ) | | | 0.42 | | | | (0.44 | ) | | | — | | | | — | | | | (0.44 | ) | | | (0.02 | ) | | | 9.66 | | | | 4.48 | | | | 1 | | | | 0.83 | | | | 0.83 | | | | 0.83 | | | | 4.51 | | | | — | |
| For the Year Ended October 31, 2003 | | | | | | | | | | | | | | | | | | | | | | | | | | | | |
| Class A | | | 9.88 | | | | 0.41 | | | | — | | | | (0.21 | ) | | | 0.20 | | | | (0.41 | ) | | | — | | | | — | | | | (0.41 | ) | | | (0.21 | ) | | | 9.67 | | | | 2.06 | | | | 65,337 | | | | 1.48 | | | | 1.20 | | | | 1.20 | | | | 4.11 | | | | 108 | |
| Class B | | | 9.84 | | | | 0.33 | | | | — | | | | (0.19 | ) | | | 0.14 | | | | (0.34 | ) | | | — | | | | — | | | | (0.34 | ) | | | (0.20 | ) | | | 9.64 | | | | 1.45 | | | | 38,210 | | | | 2.21 | | | | 1.90 | | | | 1.90 | | | | 3.41 | | | | — | |
| Class C | | | 9.84 | | | | 0.33 | | | | — | | | | (0.20 | ) | | | 0.13 | | | | (0.34 | ) | | | — | | | | — | | | | (0.34 | ) | | | (0.21 | ) | | | 9.63 | | | | 1.34 | | | | 26,626 | | | | 2.07 | | | | 1.90 | | | | 1.90 | | | | 3.43 | | | | — | |
| Class L | | | 9.87 | | | | 0.42 | | | | — | | | | (0.19 | ) | | | 0.23 | | | | (0.43 | ) | | | — | | | | — | | | | (0.43 | ) | | | (0.20 | ) | | | 9.67 | | | | 2.32 | | | | 43,202 | | | | 1.06 | | | | 1.06 | | | | 1.06 | | | | 4.24 | | | | — | |
| Class Y | | | 9.89 | | | | 0.45 | | | | — | | | | (0.20 | ) | | | 0.25 | | | | (0.46 | ) | | | — | | | | — | | | | (0.46 | ) | | | (0.21 | ) | | | 9.68 | | | | 2.51 | | | | 1 | | | | 0.87 | | | | 0.80 | | | | 0.80 | | | | 4.50 | | | | — | |
| | | | | | | | | | | | | | | | | | | | | | | | | | | | | | | | | | | | | | | | | | | | | | | | | | | | | | | | | | | | | | | | | | | | | | | | | |
407
The Hartford Mutual Funds, Inc. and The Hartford Mutual Funds II, Inc.
Financial Highlights — (continued)
| | | | | | | | | | | | | | | | | | | | | | | | | | | | | | | | | | | | | | | | | | | | | | | | | | | | | | | | | | | | | | | | | | | | | | | | | |
| | | — Selected Per-Share Data (a) — | | — Ratios and Supplemental Data — |
| | | | | | | | | | | | | | | | | | | | | | | | | | | | | Ratio of
| | Ratio of
| | Ratio of
| | | | |
| | | | | | | | | | | | | | | | | | | | | | | | | | | | | Expenses
| | Expenses
| | Expenses
| | | | |
| | | | | | | | | | | | | | | | | | | | | | | | | | | | | to Average
| | to Average
| | to Average
| | | | |
| | | | | | | | | Net
| | | | | | | | | | | | | | | | | | | | Net Assets
| | Net Assets
| | Net Assets
| | | | |
| | | | | | | | | Realized
| | | | | | | | | | | | Net
| | | | | | | | Before
| | After
| | After
| | Ratio of
| | |
| | | | | | | | | and
| | | | | | Distributions
| | | | | | Increase
| | | | | | | | Waivers and
| | Waivers and
| | Waivers and
| | Net
| | |
| | | Net Asset
| | Net
| | Payments
| | Unrealized
| | Total
| | Dividends
| | from
| | | | | | (Decrease)
| | Net Asset
| | | | Net Assets
| | Reimbursements
| | Reimbursements
| | Reimbursements
| | Investment
| | |
| | | Value at
| | Investment
| | from
| | Gain
| | from
| | from Net
| | Realized
| | Distributions
| | | | in Net
| | Value at
| | | | at End of
| | and Including
| | and Including
| | and Excluding
| | Income
| | Portfolio
|
| | | Beginning
| | Income
| | (to)
| | (Loss) on
| | Investment
| | Investment
| | Capital
| | from
| | Total
| | Asset
| | End
| | Total
| | Period
| | Interest
| | Interest
| | Interest
| | to Average
| | Turnover
|
| | | of Period | | (Loss) | | Affiliate | | Investments | | Operations | | Income | | Gains | | Capital | | Distributions | | Value | | of Period | | Return (b) | | (000’s) | | Expense (d) | | Expense (d) | | Expense (d) | | Net Assets | | Rate (c) |
The Hartford Value Fund | | | | | | | | | | | | | | | | | | | | | | | | | | | | |
| For the Six-Month Period Ended April 30, 2008 (Unaudited) (h) | | | | | | | | | | | | | | | | | | | | | | | | | | | | |
| Class A | | $ | 14.13 | | | $ | 0.08 | | | $ | — | | | $ | (1.01 | ) | | $ | (0.93 | ) | | $ | (0.10 | ) | | $ | (0.64 | ) | | $ | — | | | $ | (0.74 | ) | | $ | (1.67 | ) | | $ | 12.46 | | | | (6.72 | )%(f) | | $ | 81,298 | | | | 1.30 | %(e) | | | 1.30 | %(e) | | | 1.30 | %(e) | | | 1.30 | %(e) | | | 26 | % |
| Class B | | | 13.78 | | | | 0.03 | | | | — | | | | (0.99 | ) | | | (0.96 | ) | | | — | | | | (0.64 | ) | | | — | | | | (0.64 | ) | | | (1.60 | ) | | | 12.18 | | | | (7.13 | )(f) | | | 11,277 | | | | 2.23 | (e) | | | 2.09 | (e) | | | 2.09 | (e) | | | 0.51 | (e) | | | — | |
| Class C | | | 13.78 | | | | 0.03 | | | | — | | | | (0.98 | ) | | | (0.95 | ) | | | — | | | | (0.64 | ) | | | — | | | | (0.64 | ) | | | (1.59 | ) | | | 12.19 | | | | (7.04 | )(f) | | | 12,970 | | | | 2.07 | (e) | | | 2.07 | (e) | | | 2.07 | (e) | | | 0.52 | (e) | | | — | |
| Class I | | | 14.15 | | | | 0.07 | | | | — | | | | (0.96 | ) | | | (0.89 | ) | | | (0.16 | ) | | | (0.64 | ) | | | — | | | | (0.80 | ) | | | (1.69 | ) | | | 12.46 | | | | (6.47 | )(f) | | | 241 | | | | 0.93 | (e) | | | 0.93 | (e) | | | 0.93 | (e) | | | 1.31 | (e) | | | — | |
| Class R3 | | | 14.00 | | | | 0.06 | | | | — | | | | (0.99 | ) | | | (0.93 | ) | | | (0.07 | ) | | | (0.64 | ) | | | — | | | | (0.71 | ) | | | (1.64 | ) | | | 12.36 | | | | (6.83 | )(f) | | | 10 | | | | 1.57 | (e) | | | 1.57 | (e) | | | 1.57 | (e) | | | 1.03 | (e) | | | — | |
| Class R4 | | | 14.03 | | | | 0.08 | | | | — | | | | (0.99 | ) | | | (0.91 | ) | | | (0.10 | ) | | | (0.64 | ) | | | — | | | | (0.74 | ) | | | (1.65 | ) | | | 12.38 | | | | (6.60 | )(f) | | | 10 | | | | 1.26 | (e) | | | 1.26 | (e) | | | 1.26 | (e) | | | 1.34 | (e) | | | — | |
| Class R5 | | | 14.07 | | | | 0.10 | | | | — | | | | (1.00 | ) | | | (0.90 | ) | | | (0.14 | ) | | | (0.64 | ) | | | — | | | | (0.78 | ) | | | (1.68 | ) | | | 12.39 | | | | (6.54 | )(f) | | | 11 | | | | 0.97 | (e) | | | 0.97 | (e) | | | 0.97 | (e) | | | 1.63 | (e) | | | — | |
| Class Y | | | 14.09 | | | | 0.11 | | | | — | | | | (1.00 | ) | | | (0.89 | ) | | | (0.16 | ) | | | (0.64 | ) | | | — | | | | (0.80 | ) | | | (1.69 | ) | | | 12.40 | | | | (6.47 | )(f) | | | 312,540 | | | | 0.87 | (e) | | | 0.87 | (e) | | | 0.87 | (e) | | | 1.73 | (e) | | | — | |
| For the Year Ended October 31, 2007 | | | | | | | | | | | | | | | | | | | | | | | | | | | | |
| Class A | | | 12.91 | | | | 0.12 | | | | — | | | | 1.89 | | | | 2.01 | | | | — | | | | (0.79 | ) | | | — | | | | (0.79 | ) | | | 1.22 | | | | 14.13 | | | | 16.61 | (i) | | | 89,023 | | | | 1.32 | | | | 1.32 | | | | 1.32 | | | | 0.89 | | | | 32 | |
| Class B | | | 12.71 | | | | 0.01 | | | | — | | | | 1.85 | | | | 1.86 | | | | — | | | | (0.79 | ) | | | — | | | | (0.79 | ) | | | 1.07 | | | | 13.78 | | | | 15.63 | (i) | | | 12,976 | | | | 2.23 | | | | 2.15 | | | | 2.15 | | | | 0.07 | | | | — | |
| Class C | | | 12.71 | | | | 0.02 | | | | — | | | | 1.84 | | | | 1.86 | | | | — | | | | (0.79 | ) | | | — | | | | (0.79 | ) | | | 1.07 | | | | 13.78 | | | | 15.63 | (i) | | | 13,710 | | | | 2.09 | | | | 2.09 | | | | 2.09 | | | | 0.13 | | | | — | |
| Class Y | | | 12.91 | | | | 0.09 | | | | — | | | | 1.97 | | | | 2.06 | | | | (0.09 | ) | | | (0.79 | ) | | | — | | | | (0.88 | ) | | | 1.18 | | | | 14.09 | | | | 17.07 | (i) | | | 301,813 | | | | 0.89 | | | | 0.89 | | | | 0.89 | | | | 1.30 | | | | — | |
| From (commencement of operations) December 22, 2006, through October 31, 2007 | | | | | | | | | | | | | | | | | | | | | | | | | | | | |
| Class R3 | | | 12.51 | | | | 0.05 | | | | — | | | | 1.44 | | | | 1.49 | | | | — | | | | — | | | | — | | | | — | | | | 1.49 | | | | 14.00 | | | | 11.91 | (f) | | | 11 | | | | 1.65 | (e) | | | 1.65 | (e) | | | 1.65 | (e) | | | 0.47 | (e) | | | — | |
| Class R4 | | | 12.51 | | | | 0.09 | | | | — | | | | 1.43 | | | | 1.52 | | | | — | | | | — | | | | — | | | | — | | | | 1.52 | | | | 14.03 | | | | 12.15 | (f) | | | 11 | | | | 1.35 | (e) | | | 1.35 | (e) | | | 1.35 | (e) | | | 0.78 | (e) | | | — | |
| Class R5 | | | 12.51 | | | | 0.12 | | | | — | | | | 1.44 | | | | 1.56 | | | | — | | | | — | | | | — | | | | — | | | | 1.56 | | | | 14.07 | | | | 12.47 | (f) | | | 11 | | | | 1.05 | (e) | | | 1.05 | (e) | | | 1.05 | (e) | | | 1.07 | (e) | | | — | |
| From (commencement of operations) May 31, 2007, through October 31, 2007 | | | | | | | | | | | | | | | | | | | | | | | | | | | | |
| Class I | | | 13.85 | | | | 0.03 | | | | — | | | | 0.27 | | | | 0.30 | | | | — | | | | — | | | | — | | | | — | | | | 0.30 | | | | 14.15 | | | | 2.17 | (f) | | | 46 | | | | 1.00 | (e) | | | 1.00 | (e) | | | 1.00 | (e) | | | 1.00 | (e) | | | — | |
| For the Year Ended October 31, 2006 | | | | | | | | | | | | | | | | | | | | | | | | | | | | |
| Class A | | | 10.79 | | | | 0.09 | | | | — | | | | 2.11 | | | | 2.20 | | | | (0.08 | ) | | | — | | | | — | | | | (0.08 | ) | | | 2.12 | | | | 12.91 | | | | 20.52 | | | | 79,476 | | | | 1.38 | | | | 1.38 | | | | 1.38 | | | | 0.89 | | | | 50 | |
| Class B | | | 10.62 | | | | 0.01 | | | | — | | | | 2.08 | | | | 2.09 | | | | — | | | | — | | | | — | | | | — | | | | 2.09 | | | | 12.71 | | | | 19.68 | | | | 11,957 | | | | 2.29 | | | | 2.13 | | | | 2.13 | | | | 0.15 | | | | — | |
| Class C | | | 10.62 | | | | 0.01 | | | | — | | | | 2.08 | | | | 2.09 | | | | — | | | | — | | | | — | | | | — | | | | 2.09 | | | | 12.71 | | | | 19.68 | | | | 12,943 | | | | 2.15 | | | | 2.15 | | | | 2.15 | | | | 0.12 | | | | — | |
| Class Y | | | 10.79 | | | | 0.15 | | | | — | | | | 2.10 | | | | 2.25 | | | | (0.13 | ) | | | — | | | | — | | | | (0.13 | ) | | | 2.12 | | | | 12.91 | | | | 21.07 | | | | 72,054 | | | | 0.92 | | | | 0.92 | | | | 0.92 | | | | 1.36 | | | | — | |
| For the Year Ended October 31, 2005 | | | | | | | | | | | | | | | | | | | | | | | | | | | | |
| Class A | | | 9.71 | | | | 0.08 | | | | — | | | | 1.04 | | | | 1.12 | | | | (0.04 | ) | | | — | | | | — | | | | (0.04 | ) | | | 1.08 | | | | 10.79 | | | | 11.50 | | | | 63,417 | | | | 1.41 | | | | 1.40 | | | | 1.40 | | | | 0.76 | | | | 29 | |
| Class B | | | 9.60 | | | | — | | | | — | | | | 1.02 | | | | 1.02 | | | | — | | | | — | | | | — | | | | — | | | | 1.02 | | | | 10.62 | | | | 10.62 | | | | 10,091 | | | | 2.34 | | | | 2.15 | | | | 2.15 | | | | 0.01 | | | | — | |
| Class C | | | 9.60 | | | | — | | | | — | | | | 1.02 | | | | 1.02 | | | | — | | | | — | | | | — | | | | — | | | | 1.02 | | | | 10.62 | | | | 10.62 | | | | 10,238 | | | | 2.19 | | | | 2.15 | | | | 2.15 | | | | 0.02 | | | | — | |
| Class Y | | | 9.71 | | | | 0.12 | | | | — | | | | 1.05 | | | | 1.17 | | | | (0.09 | ) | | | — | | | | — | | | | (0.09 | ) | | | 1.08 | | | | 10.79 | | | | 12.06 | | | | 60,218 | | | | 0.93 | | | | 0.93 | | | | 0.93 | | | | 1.19 | | | | — | |
| For the Year Ended October 31, 2004 (h) | | | | | | | | | | | | | | | | | | | | | | | | | | | | |
| Class A | | | 8.92 | | | | 0.07 | | | | — | | | | 0.79 | | | | 0.86 | | | | (0.07 | ) | | | — | | | | — | | | | (0.07 | ) | | | 0.79 | | | | 9.71 | | | | 9.70 | | | | 56,845 | | | | 1.46 | | | | 1.45 | | | | 1.45 | | | | 0.76 | | | | 34 | |
| Class B | | | 8.83 | | | | 0.01 | | | | — | | | | 0.78 | | | | 0.79 | | | | (0.02 | ) | | | — | | | | — | | | | (0.02 | ) | | | 0.77 | | | | 9.60 | | | | 8.91 | | | | 8,948 | | | | 2.36 | | | | 2.15 | | | | 2.15 | | | | 0.06 | | | | — | |
| Class C | | | 8.83 | | | | 0.01 | | | | — | | | | 0.78 | | | | 0.79 | | | | (0.02 | ) | | | — | | | | — | | | | (0.02 | ) | | | 0.77 | | | | 9.60 | | | | 8.91 | | | | 10,838 | | | | 2.17 | | | | 2.15 | | | | 2.15 | | | | 0.06 | | | | — | |
| Class Y | | | 8.95 | | | | 0.10 | | | | — | | | | 0.77 | | | | 0.87 | | | | (0.11 | ) | | | — | | | | — | | | | (0.11 | ) | | | 0.76 | | | | 9.71 | | | | 9.76 | | | | 21,373 | | | | 0.91 | | | | 0.91 | | | | 0.91 | | | | 1.32 | | | | — | |
| For the Year Ended October 31, 2003 (h) | | | | | | | | | | | | | | | | | | | | | | | | | | | | |
| Class A | | | 7.59 | | | | 0.08 | | | | — | | | | 1.31 | | | | 1.39 | | | | (0.06 | ) | | | — | | | | — | | | | (0.06 | ) | | | 1.33 | | | | 8.92 | | | | 18.43 | | | | 42,101 | | | | 1.57 | | | | 1.45 | | | | 1.45 | | | | 1.02 | | | | 35 | |
| Class B | | | 7.51 | | | | 0.03 | | | | — | | | | 1.29 | | | | 1.32 | | | | — | | | | — | | | | — | | | | — | | | | 1.32 | | | | 8.83 | | | | 17.58 | | | | 7,305 | | | | 2.30 | | | | 2.15 | | | | 2.15 | | | | 0.32 | | | | — | |
| Class C | | | 7.51 | | | | 0.03 | | | | — | | | | 1.29 | | | | 1.32 | | | | — | | | | — | | | | — | | | | — | | | | 1.32 | | | | 8.83 | | | | 17.58 | | | | 10,231 | | | | 2.18 | | | | 2.15 | | | | 2.15 | | | | 0.32 | | | | — | |
| Class Y | | | 7.64 | | | | 0.16 | | | | — | | | | 1.25 | | | | 1.41 | | | | (0.10 | ) | | | — | | | | — | | | | (0.10 | ) | | | 1.31 | | | | 8.95 | | | | 18.66 | | | | 27 | | | | 1.00 | | | | 1.00 | | | | 1.00 | | | | 1.46 | | | | — | |
The Hartford Value Opportunities Fund | | | | | | | | | | | | | | | | | | | | | | | | | | | | |
| For the Six-Month Period Ended April 30, 2008 (Unaudited) | | | | | | | | | | | | | | | | | | | | | | | | | | | | |
| Class A | | | 18.24 | | | | 0.04 | | | | — | | | | (3.09 | ) | | | (3.05 | ) | | | (0.05 | ) | | | (2.59 | ) | | | — | | | | (2.64 | ) | | | (5.69 | ) | | | 12.55 | | | | (18.70 | )(f) | | | 110,327 | | | | 1.47 | (e) | | | 1.40 | (e) | | | 1.40 | (e) | | | 0.70 | (e) | | | 31 | |
| Class B | | | 16.75 | | | | 0.01 | | | | — | | | | (2.82 | ) | | | (2.81 | ) | | | — | | | | (2.59 | ) | | | — | | | | (2.59 | ) | | | (5.40 | ) | | | 11.35 | | | | (18.92 | )(f) | | | 13,730 | | | | 2.42 | (e) | | | 2.00 | (e) | | | 2.00 | (e) | | | 0.10 | (e) | | | — | |
| Class C | | | 16.71 | | | | — | | | | — | | | | (2.81 | ) | | | (2.81 | ) | | | — | | | | (2.59 | ) | | | — | | | | (2.59 | ) | | | (5.40 | ) | | | 11.31 | | | | (18.97 | )(f) | | | 22,120 | | | | 2.18 | (e) | | | 2.15 | (e) | | | 2.15 | (e) | | | (0.05 | )(e) | | | — | |
| Class I | | | 18.13 | | | | 0.05 | | | | — | | | | (3.06 | ) | | | (3.01 | ) | | | (0.10 | ) | | | (2.59 | ) | | | — | | | | (2.69 | ) | | | (5.70 | ) | | | 12.43 | | | | (18.60 | )(f) | | | 1,234 | | | | 1.35 | (e) | | | 1.10 | (e) | | | 1.10 | (e) | | | 1.13 | (e) | | | — | |
| Class L | | | 18.31 | | | | 0.05 | | | | — | | | | (3.11 | ) | | | (3.06 | ) | | | (0.07 | ) | | | (2.59 | ) | | | — | | | | (2.66 | ) | | | (5.72 | ) | | | 12.59 | | | | (18.64 | )(f) | | | 31,482 | | | | 1.21 | (e) | | | 1.20 | (e) | | | 1.20 | (e) | | | 0.90 | (e) | | | — | |
| Class R3 | | | 18.56 | | | | 0.08 | | | | — | | | | (3.21 | ) | | | (3.13 | ) | | | (0.10 | ) | | | (2.59 | ) | | | — | | | | (2.69 | ) | | | (5.82 | ) | | | 12.74 | | | | (18.84 | )(f) | | | 910 | | | | 1.72 | (e) | | | 1.66 | (e) | | | 1.66 | (e) | | | 0.42 | (e) | | | — | |
| Class R4 | | | 18.61 | | | | 0.09 | | | | — | | | | (3.20 | ) | | | (3.11 | ) | | | (0.10 | ) | | | (2.59 | ) | | | — | | | | (2.69 | ) | | | (5.80 | ) | | | 12.81 | | | | (18.67 | )(f) | | | 2,395 | | | | 1.38 | (e) | | | 1.36 | (e) | | | 1.36 | (e) | | | 0.83 | (e) | | | — | |
| Class R5 | | | 18.66 | | | | 0.05 | | | | — | | | | (3.16 | ) | | | (3.11 | ) | | | (0.10 | ) | | | (2.59 | ) | | | — | | | | (2.69 | ) | | | (5.80 | ) | | | 12.86 | | | | (18.60 | )(f) | | | 9 | | | | 1.09 | (e) | | | 1.05 | (e) | | | 1.05 | (e) | | | 1.05 | (e) | | | — | |
| Class Y | | | 18.73 | | | | 0.06 | | | | — | | | | (3.17 | ) | | | (3.11 | ) | | | (0.11 | ) | | | (2.59 | ) | | | — | | | | (2.70 | ) | | | (5.81 | ) | | | 12.92 | | | | (18.52 | )(f) | | | 28,724 | | | | 0.97 | (e) | | | 0.97 | (e) | | | 0.97 | (e) | | | 1.11 | (e) | | | — | |
| For the Year Ended October 31, 2007 | | | | | | | | | | | | | | | | | | | | | | | | | | | | |
| Class A | | | 18.26 | | | | 0.08 | | | | — | | | | 1.56 | | | | 1.64 | | | | (0.14 | ) | | | (1.52 | ) | | | — | | | | (1.66 | ) | | | (0.02 | ) | | | 18.24 | | | | 9.73 | (i) | | | 157,671 | | | | 1.48 | | | | 1.40 | | | | 1.40 | | | | 0.48 | | | | 77 | |
| Class B | | | 16.92 | | | | (0.04 | ) | | | — | | | | 1.43 | | | | 1.39 | | | | (0.04 | ) | | | (1.52 | ) | | | — | | | | (1.56 | ) | | | (0.17 | ) | | | 16.75 | | | | 8.90 | (i) | | | 20,792 | | | | 2.38 | | | | 2.13 | | | | 2.13 | | | | (0.25 | ) | | | — | |
| Class C | | | 16.92 | | | | (0.01 | ) | | | — | | | | 1.40 | | | | 1.39 | | | | (0.08 | ) | | | (1.52 | ) | | | — | | | | (1.60 | ) | | | (0.21 | ) | | | 16.71 | | | | 8.91 | (i) | | | 32,738 | | | | 2.19 | | | | 2.15 | | | | 2.15 | | | | (0.28 | ) | | | — | |
| Class I | | | 18.27 | | | | 0.34 | | | | — | | | | 1.36 | | | | 1.70 | | | | (0.32 | ) | | | (1.52 | ) | | | — | | | | (1.84 | ) | | | (0.14 | ) | | | 18.13 | | | | 10.08 | (i) | | | 4,659 | | | | 1.22 | | | | 1.15 | | | | 1.15 | | | | 0.61 | | | | — | |
| Class L(k) | | | 18.29 | | | | 0.09 | | | | — | | | | 1.59 | | | | 1.68 | | | | (0.14 | ) | | | (1.52 | ) | | | — | | | | (1.66 | ) | | | 0.02 | | | | 18.31 | | | | 9.92 | (i) | | | 43,102 | | | | 1.26 | | | | 1.25 | | | | 1.25 | | | | 0.50 | | | | — | |
| Class Y | | | 18.48 | | | | 0.51 | | | | — | | | | 1.26 | | | | 1.77 | | | | — | | | | (1.52 | ) | | | — | | | | (1.52 | ) | | | 0.25 | | | | 18.73 | | | | 10.30 | (i) | | | 26,645 | | | | 0.94 | | | | 0.94 | | | | 0.94 | | | | 1.19 | | | | — | |
408
| | | | | | | | | | | | | | | | | | | | | | | | | | | | | | | | | | | | | | | | | | | | | | | | | | | | | | | | | | | | | | | | | | | | | | | | | |
| | | — Selected Per-Share Data (a) — | | — Ratios and Supplemental Data — |
| | | | | | | | | | | | | | | | | | | | | | | | | | | | | Ratio of
| | Ratio of
| | Ratio of
| | | | |
| | | | | | | | | | | | | | | | | | | | | | | | | | | | | Expenses
| | Expenses
| | Expenses
| | | | |
| | | | | | | | | | | | | | | | | | | | | | | | | | | | | to Average
| | to Average
| | to Average
| | | | |
| | | | | | | | | Net
| | | | | | | | | | | | �� | | | | | | | | Net Assets
| | Net Assets
| | Net Assets
| | | | |
| | | | | | | | | Realized
| | | | | | | | | | | | Net
| | | | | | | | Before
| | After
| | After
| | Ratio of
| | |
| | | | | | | | | and
| | | | | | Distributions
| | | | | | Increase
| | | | | | | | Waivers and
| | Waivers and
| | Waivers and
| | Net
| | |
| | | Net Asset
| | Net
| | Payments
| | Unrealized
| | Total
| | Dividends
| | from
| | | | | | (Decrease)
| | Net Asset
| | | | Net Assets
| | Reimbursements
| | Reimbursements
| | Reimbursements
| | Investment
| | |
| | | Value at
| | Investment
| | from
| | Gain
| | from
| | from Net
| | Realized
| | Distributions
| | | | in Net
| | Value at
| | | | at End of
| | and Including
| | and Including
| | and Excluding
| | Income
| | Portfolio
|
| | | Beginning
| | Income
| | (to)
| | (Loss) on
| | Investment
| | Investment
| | Capital
| | from
| | Total
| | Asset
| | End
| | Total
| | Period
| | Interest
| | Interest
| | Interest
| | to Average
| | Turnover
|
| | | of Period | | (Loss) | | Affiliate | | Investments | | Operations | | Income | | Gains | | Capital | | Distributions | | Value | | of Period | | Return (b) | | (000’s) | | Expense (d) | | Expense (d) | | Expense (d) | | Net Assets | | Rate (c) |
The Hartford Value Opportunities Fund — (continued) | | | | | | | | | | | | | | | | | | | | | | | | | | | | |
| From (commencement of operations) December 22, 2006, through October 31, 2007 | | | | | | | | | | | | | | | | | | | | | | | | | | | | |
| Class R3 | | $ | 17.74 | | | $ | — | | | $ | — | | | $ | 0.82 | | | $ | 0.82 | | | $ | — | | | $ | — | | | $ | — | | | $ | — | | | $ | 0.82 | | | $ | 18.56 | | | | 4.62 | %(f) | | $ | 124 | | | | 1.78 | %(e) | | | 1.65 | %(e) | | | 1.65 | %(e) | | | 0.03 | %(e) | | | — | % |
| Class R4 | | | 17.74 | | | | — | | | | — | | | | 0.87 | | | | 0.87 | | | | — | | | | — | | | | — | | | | — | | | | 0.87 | | | | 18.61 | | | | 4.90 | (f) | | | 732 | | | | 1.40 | (e) | | | 1.35 | (e) | | | 1.35 | (e) | | | (0.01 | )(e) | | | — | |
| Class R5 | | | 17.74 | | | | 0.12 | | | | — | | | | 0.80 | | | | 0.92 | | | | — | | | | — | | | | — | | | | — | | | | 0.92 | | | | 18.66 | | | | 5.19 | (f) | | | 11 | | | | 1.17 | (e) | | | 1.05 | (e) | | | 1.05 | (e) | | | 0.75 | (e) | | | — | |
| For the Year Ended October 31, 2006 (h) | | | | | | | | | | | | | | | | | | | | | | | | | | | | |
| Class A | | | 15.56 | | | | 0.09 | | | | — | | | | 3.11 | | | | 3.20 | | | | — | | | | (0.50 | ) | | | — | | | | (0.50 | ) | | | 2.70 | | | | 18.26 | | | | 21.12 | | | | 111,324 | | | | 1.52 | | | | 1.40 | | | | 1.40 | | | | 0.51 | | | | 57 | |
| Class B | | | 14.56 | | | | (0.03 | ) | | | — | | | | 2.89 | | | | 2.86 | | | | — | | | | (0.50 | ) | | | — | | | | (0.50 | ) | | | 2.36 | �� | | | 16.92 | | | | 20.21 | | | | 18,271 | | | | 2.38 | | | | 2.12 | | | | 2.12 | | | | (0.20 | ) | | | — | |
| Class C | | | 14.56 | | | | (0.04 | ) | | | — | | | | 2.90 | | | | 2.86 | | | | — | | | | (0.50 | ) | | | — | | | | (0.50 | ) | | | 2.36 | | | | 16.92 | | | | 20.20 | | | | 22,466 | | | | 2.22 | | | | 2.15 | | | | 2.15 | | | | (0.24 | ) | | | — | |
| Class L | | | 15.58 | | | | 0.12 | | | | — | | | | 3.11 | | | | 3.23 | | | | (0.02 | ) | | | (0.50 | ) | | | — | | | | (0.52 | ) | | | 2.71 | | | | 18.29 | | | | 21.31 | | | | 32,983 | | | | 1.23 | | | | 1.23 | | | | 1.23 | | | | 0.68 | | | | — | |
| Class Y | | | 15.74 | | | | 0.15 | | | | — | | | | 3.15 | | | | 3.30 | | | | (0.06 | ) | | | (0.50 | ) | | | — | | | | (0.56 | ) | | | 2.74 | | | | 18.48 | | | | 21.55 | | | | 102,915 | | | | 1.00 | | | | 1.00 | | | | 1.00 | | | | 0.90 | | | | — | |
| From (commencement of operations) August 31, 2006, through October 31, 2006 (h) | | | | | | | | | | | | | | | | | | | | | | | | | | | | |
| Class I | | | 17.12 | | | | 0.01 | | | | — | | | | 1.14 | | | | 1.15 | | | | — | | | | — | | | | — | | | | — | | | | 1.15 | | | | 18.27 | | | | 6.72 | (f) | | | 12 | | | | 1.38 | (e) | | | 1.15 | (e) | | | 1.15 | (e) | | | 0.12 | (e) | | | — | |
| For the Year Ended October 31, 2005 | | | | | | | | | | | | | | | | | | | | | | | | | | | | |
| Class A | | | 14.06 | | | | 0.03 | | | | — | | | | 1.47 | | | | 1.50 | | | | — | | | | — | | | | — | | | | — | | | | 1.50 | | | | 15.56 | | | | 10.67 | | | | 66,368 | | | | 1.62 | | | | 1.40 | | | | 1.40 | | | | 0.27 | | | | 38 | |
| Class B | | | 13.24 | | | | (0.05 | ) | | | — | | | | 1.37 | | | | 1.32 | | | | — | | | | — | | | | — | | | | — | | | | 1.32 | | | | 14.56 | | | | 9.97 | | | | 13,560 | | | | 2.51 | | | | 2.15 | | | | 2.15 | | | | (0.47 | ) | | | — | |
| Class C | | | 13.25 | | | | (0.05 | ) | | | — | | | | 1.36 | | | | 1.31 | | | | — | | | | — | | | | — | | | | — | | | | 1.31 | | | | 14.56 | | | | 9.89 | | | | 13,258 | | | | 2.33 | | | | 2.15 | | | | 2.15 | | | | (0.47 | ) | | | — | |
| Class L | | | 14.06 | | | | 0.07 | | | | — | | | | 1.45 | | | | 1.52 | | | | — | | | | — | | | | — | | | | — | | | | 1.52 | | | | 15.58 | | | | 10.81 | | | | 27,674 | | | | 1.30 | | | | 1.30 | | | | 1.30 | | | | 0.45 | | | | — | |
| Class Y | | | 14.17 | | | | 0.05 | | | | — | | | | 1.52 | | | | 1.57 | | | | — | | | | — | | | | — | | | | — | | | | 1.57 | | | | 15.74 | | | | 11.08 | | | | 95,974 | | | | 1.07 | | | | 1.07 | | | | 1.07 | | | | 0.55 | | | | — | |
| For the Year Ended October 31, 2004 | | | | | | | | | | | | | | | | | | | | | | | | | | | | |
| Class A | | | 12.15 | | | | 0.01 | | | | — | | | | 1.90 | | | | 1.91 | | | | — | | | | — | | | | — | | | | — | | | | 1.91 | | | | 14.06 | | | | 15.72 | | | | 24,601 | | | | 1.82 | | | | 1.45 | | | | 1.45 | | | | 0.08 | | | | 52 | |
| Class B | | | 11.53 | | | | (0.06 | ) | | | — | | | | 1.77 | | | | 1.71 | | | | — | | | | — | | | | — | | | | — | | | | 1.71 | | | | 13.24 | | | | 14.83 | | | | 5,709 | | | | 2.70 | | | | 2.15 | | | | 2.15 | | | | (0.64 | ) | | | — | |
| Class C | | | 11.53 | | | | (0.06 | ) | | | — | | | | 1.78 | | | | 1.72 | | | | — | | | | — | | | | — | | | | — | | | | 1.72 | | | | 13.25 | | | | 14.92 | | | | 5,627 | | | | 2.47 | | | | 2.15 | | | | 2.15 | | | | (0.64 | ) | | | — | |
| Class L | | | 12.15 | | | | — | | | | — | | | | 1.91 | | | | 1.91 | | | | — | | | | — | | | | — | | | | — | | | | 1.91 | | | | 14.06 | | | | 15.72 | | | | 25,687 | | | | 1.42 | | | | 1.42 | | | | 1.42 | | | | 0.04 | | | | — | |
| Class Y | | | 12.22 | | | | 0.01 | | | | — | | | | 1.94 | | | | 1.95 | | | | — | | | | — | | | | — | | | | — | | | | 1.95 | | | | 14.17 | | | | 15.96 | | | | 10,101 | | | | 1.16 | | | | 1.16 | | | | 1.16 | | | | 0.34 | | | | — | |
| For the Year Ended October 31, 2003 | | | | | | | | | | | | | | | | | | | | | | | | | | | | |
| Class A | | | 9.26 | | | | (0.01 | ) | | | — | | | | 2.90 | | | | 2.89 | | | | — | | | | — | | | | — | | | | — | | | | 2.89 | | | | 12.15 | | | | 31.21 | | | | 5,917 | | | | 1.92 | | | | 1.45 | | | | 1.45 | | | | (0.10 | ) | | | 57 | |
| Class B | | | 8.84 | | | | (0.04 | ) | | | — | | | | 2.73 | | | | 2.69 | | | | — | | | | — | | | | — | | | | — | | | | 2.69 | | | | 11.53 | | | | 30.43 | | | | 1,932 | | | | 2.63 | | | | 2.15 | | | | 2.15 | | | | (0.80 | ) | | | — | |
| Class C | | | 8.85 | | | | (0.04 | ) | | | — | | | | 2.72 | | | | 2.68 | | | | — | | | | — | | | | — | | | | — | | | | 2.68 | | | | 11.53 | | | | 30.28 | | | | 1,613 | | | | 2.51 | | | | 2.15 | | | | 2.15 | | | | (0.81 | ) | | | — | |
| Class L | | | 9.26 | | | | (0.01 | ) | | | — | | | | 2.90 | | | | 2.89 | | | | — | | | | — | | | | — | | | | — | | | | 2.89 | | | | 12.15 | | | | 31.21 | | | | 22,701 | | | | 1.51 | | | | 1.45 | | | | 1.45 | | | | (0.11 | ) | | | — | |
| Class Y | | | 9.30 | | | | 0.01 | | | | — | | | | 2.91 | | | | 2.92 | | | | — | | | | — | | | | — | | | | — | | | | 2.92 | | | | 12.22 | | | | 31.40 | | | | 1 | | | | 1.33 | | | | 1.25 | | | | 1.25 | | | | 0.08 | | | | — | |
| | |
| (a) | | Information presented relates to a share of capital stock outstanding throughout the indicated period. |
| (b) | | Assumes initial investment at net asset value at the beginning of each period, reinvestment of all distributions, the complete redemption of the investment at net asset value at the end of each period and no sales charge. Total return would be reduced if sales charges were taken into account. |
| (c) | | Portfolio turnover rate is calculated on the basis of the Fund as a whole without distinguishing between the classes of shares issued. |
| (d) | | Ratios do not include fees paid indirectly. (See Note 5(d) for impact on ratios) |
| (e) | | Annualized. |
| (f) | | Not annualized. |
| (g) | | Expense ratios do not include expenses of the underlying funds. |
| (h) | | Per share amounts have been calculated using average shares outstanding method. |
| (i) | | Total return without the inclusion of the Payments from (to) Affiliate, as noted on the Statement of Operations, can be found in Note 5 (g). |
| (j) | | Classes H, M and N were merged into Class L and Class E was merged into Class Y on February 9, 2007. Please refer to Note 8 in the Notes to Financial Statements for further details. |
| (k) | | Classes H, M and N were merged into Class L on February 9, 2007. Please refer to Note 8 in the Notes to Financial Statements for further details. |
| (l) | | Classes H, M and N were merged into Class L and Class Z was merged into Class Y on February 9, 2007. Please refer to Note 8 in the Notes to Financial Statements for further details. |
| (m) | | Includes a tax return of capital of less than $0.01. |
| (n) | | Expense ratio includes a practical waiver of 12b-1 fees. |
409
The Hartford Mutual Funds, Inc. and The Hartford Mutual Funds II, Inc.
Financial Highlights — (continued)
| | |
| (o) | | Information presented below represents the calculation of financial highlights from the commencement of Fund. |
| | | | | | | | | | | | | | | | | | | | | | | | | | | | | | | | | | | | | | | | | | | | | | | | | | | | | | | | | | | | | | | | | | | | | | | | | |
| | | | | | | | | | | | | | | | | | | | | | | | | | | | | Ratio of
| | | | | | | | |
| | | | | | | | | | | | | | | | | | | | | | | | | | | | | Expenses
| | Expenses
| | Expenses
| | | | |
| | | | | | | | | | | | | | | | | | | | | | | | | | | | | to Average
| | to Average
| | to Average
| | | | |
| | | | | | | | | Net
| | | | | | | | | | | | | | | | | | | | Net Assets
| | Net Assets
| | Net Assets
| | | | |
| | | | | | | | | Realized
| | | | | | | | | | | | Net
| | | | | | | | Before
| | After
| | After
| | | | |
| | | | | | | | | and
| | | | | | Distributions
| | | | | | Increase
| | | | | | | | Waivers and
| | Waivers and
| | Waivers and
| | Net
| | |
| | | Net Asset
| | Net
| | Payments
| | Unrealized
| | Total
| | Dividends
| | from
| | | | | | (Decrease)
| | Net Asset
| | | | Net Assets
| | Reimbursements
| | Reimbursements
| | Reimbursements
| | Investment
| | |
| | | Value at
| | Investment
| | from
| | Gain
| | from
| | from Net
| | Realized
| | Distributions
| | | | in Net
| | Value at
| | | | at End of
| | and Including
| | and Including
| | and Excluding
| | Income
| | Portfolio
|
| | | Beginning
| | Income
| | (to)
| | (Loss) on
| | Investment
| | Investment
| | Capital
| | from
| | Total
| | Asset
| | End
| | Total
| | Period
| | Interest
| | Interest
| | Interest
| | to Average
| | Turnover
|
| | | of Period | | (Loss) | | Affiliate | | Investments | | Operations | | Income | | Gains | | Capital | | Distributions | | Value | | of Period | | Return (b) | | (000’s) | | Expense (d) | | Expense (d) | | Expense (d) | | Net Assets | | Rate (c) |
The Hartford High Yield Municipal Bond Fund | | | | | | | | | | | | | | | | | | | | | | | | | | | | |
| From (commencement of operations) May 1, 2007, through October 31, 2007 | | | | | | | | | | | | | | | | | | | | | | | | | | | | |
| Class A | | $ | 10.00 | | | $ | 0.20 | | | $ | — | | | $ | (0.54 | ) | | $ | (0.34 | ) | | $ | (0.20 | ) | | $ | — | | | $ | — | | | $ | (0.20 | ) | | $ | (0.54 | ) | | $ | 9.46 | | | | (3.41 | )(f) | | $ | 46,261 | | | | 0.96 | %(e) | | | 0.23 | %(e) | | | 0.23 | %(e) | | | 4.72 | %(e) | | | 23 | % |
| Class B | | | 10.00 | | | | 0.17 | | | | — | | | | (0.54 | ) | | | (0.37 | ) | | | (0.17 | ) | | | — | | | | — | | | | (0.17 | ) | | | (0.54 | ) | | | 9.46 | | | | (3.71 | )(f) | | | 1,333 | | | | 1.70 | (e) | | | 0.93 | (e) | | | 0.93 | (e) | | | 4.00 | (e) | | | — | |
| Class C | | | 10.00 | | | | 0.17 | | | | — | | | | (0.54 | ) | | | (0.37 | ) | | | (0.17 | ) | | | — | | | | — | | | | (0.17 | ) | | | (0.54 | ) | | | 9.46 | | | | (3.71 | )(f) | | | 11,236 | | | | 1.74 | (e) | | | 0.98 | (e) | | | 0.98 | (e) | | | 4.12 | (e) | | | — | |
| Class I | | | 10.00 | | | | 0.21 | | | | — | | | | (0.53 | ) | | | (0.32 | ) | | | (0.21 | ) | | | — | | | | — | | | | (0.21 | ) | | | (0.53 | ) | | | 9.47 | | | | (3.21 | )(f) | | | 6,879 | | | | 0.76 | (e) | | | — | (e) | | | — | (e) | | | 5.11 | (e) | | | — | |
The Hartford Strategic Income Fund | | | | | | | | | | | | | | | | | | | | | | | | | | | | |
| From (commencement of operations) May 15, 2007, through October 31, 2007 | | | | | | | | | | | | | | | | | | | | | | | | | | | | |
| Class A | | | 10.00 | | | | 0.31 | | | | — | | | | (0.26 | ) | | | 0.05 | | | | (0.30 | ) | | | — | | | | — | | | | (0.30 | ) | | | (0.25 | ) | | | 9.75 | | | | 0.52 | (i) | | | 42,949 | | | | 0.96 | (e) | | | 0.44 | (e) | | | 0.44 | (e) | | | 7.10 | (e) | | | 42 | |
| Class B | | | 10.00 | | | | 0.27 | | | | — | | | | (0.26 | ) | | | 0.01 | | | | (0.26 | ) | | | — | | | | — | | | | (0.26 | ) | | | (0.25 | ) | | | 9.75 | | | | 0.20 | (i) | | | 2,644 | | | | 1.71 | (e) | | | 1.19 | (e) | | | 1.19 | (e) | | | 6.38 | (e) | | | — | |
| Class C | | | 10.00 | | | | 0.27 | | | | — | | | | (0.25 | ) | | | 0.02 | | | | (0.26 | ) | | | — | | | | — | | | | (0.26 | ) | | | (0.24 | ) | | | 9.76 | | | | 0.30 | (i) | | | 17,275 | | | | 1.75 | (e) | | | 1.23 | (e) | | | 1.23 | (e) | | | 6.38 | (e) | | | — | |
| Class I | | | 10.00 | | | | 0.31 | | | | — | | | | (0.23 | ) | | | 0.08 | | | | (0.31 | ) | | | — | | | | — | | | | (0.31 | ) | | | (0.23 | ) | | | 9.77 | | | | 0.82 | (i) | | | 11,212 | | | | 0.78 | (e) | | | 0.26 | (e) | | | 0.26 | (e) | | | 7.35 | (e) | | | — | |
410
The Hartford Mutual Funds, Inc. and The Hartford Mutual Funds II, Inc.
Directors and Officers (Unaudited)
The Board of Directors appoints officers who are responsible for the day-to-day operations of the Funds and who execute policies formulated by the Directors. Each director serves until his or her death, resignation, or retirement or until the next annual meeting of shareholders is held or until his or her successor is elected and qualifies.
Directors and officers who are employed by or who have a financial interest in The Hartford are considered “interested” persons of the Funds pursuant to the Investment Company Act of 1940, as amended. Each officer and three of the Fund’s directors, as noted in the chart below, are “interested” persons of the Funds. Each director serves as a director for The Hartford Mutual Funds, Inc., The Hartford Mutual Funds II, Inc., The Hartford Income Shares Fund, Inc., Hartford Series Fund, Inc., and Hartford HLS Series Fund II, Inc., which collectively consist of 101 funds. Correspondence may be sent to directors and officers c/o Hartford Mutual Funds, P.O. Box 2999, Hartford, Connecticut, 06104-2999, except that correspondence to Ms. Fagely, Ms. Fleege, and Ms. Settimi may be sent to 500 Bielenberg Drive, Woodbury, Minnesota 55125.
The table below sets forth, for each director and officer, his or her name, age, current position with the Funds and date first elected or appointed to The Hartford Mutual Funds, Inc. (“MF”) and The Hartford Mutual Funds II, Inc. (“MF2”), principal occupation, and, for directors, other directorships held. The Funds’ statement of additional information contains further information on the directors and is available free of charge by calling 1-888-843-7824 or writing to Hartford Mutual Funds, P.O. Box 64387, St. Paul, MN 55164-0387.
Information on the aggregate remuneration paid to the directors by each Fund can be found in the Statement of Operations herein. The Funds do not pay salaries or compensation to any of their officers or directors who are employed by The Hartford.
Non-Interested Directors
Lynn S. Birdsong (age 61) Director since 2003, Co-Chairman of the Investment Committee
Since 1981, Mr. Birdsong has been a partner in Birdsong Company, an advertising specialty firm. Since 2003, Mr. Birdsong has been an independent director of The Japan Fund. From 2003 to March 2005, Mr. Birdsong was an independent director of the Atlantic Whitehall Funds. From 1979 to 2002, Mr. Birdsong was a managing director of Zurich Scudder Investments, an investment management firm. During his employment with Scudder, Mr. Birdsong was an interested director of The Japan Fund.
Robert M. Gavin, Jr. (age 67) Director since 2002 (MF) and 1986 (MF2), Chairman of the Board since 2004
Dr. Gavin is an educational consultant. Prior to September 1, 2001, he was President of Cranbrook Education Community and prior to July 1996, he was President of Macalester College, St. Paul, Minnesota.
Duane E. Hill (age 62) Director since 2001 (MF) and 2002 (MF2), Chairman of the Nominating Committee
Mr. Hill is a Partner of TSG Ventures L.P., a private equity investment company. Mr. Hill is a former partner of TSG Capital Group, a private equity investment firm that serves as sponsor and lead investor in leveraged buyouts of middle market companies.
Sandra S. Jaffee (age 66) Director since 2005
Ms. Jaffee is Chief Executive Officer of Fortent (formerly Searchspace Group), a leading provider of compliance/regulatory technology to financial institutions. Ms. Jaffee served as an Entrepreneur in Residence with Warburg Pincus, a private equity firm, from August 2004 to August 2005. From September 1995 to July 2004, Ms. Jaffee served as Executive Vice President at Citigroup, where she was President and Chief Executive Officer of Citibank’s Global Securities Services (1995-2003).
William P. Johnston (age 63) Director since 2005, Chairman of the Compliance Committee
In June 2006, Mr. Johnston was appointed as Senior Advisor to The Carlyle Group, a global private equity investment firm. In May 2006, Mr. Johnston was elected to the Supervisory Board of Fresenius Medical Care AG & Co. KGaA, after its acquisition of Renal Care Group, Inc. in March 2006. Mr. Johnston joined Renal Care Group, Inc. in November 2002 as a member of the Board of Directors and served as Chairman of the Board from March 2003 through March 2006. From September 1987 to December 2002, Mr. Johnston was with Equitable Securities Corporation (and its successors, SunTrust Equitable Securities and SunTrust Robinson Humphrey) serving in various investment banking and managerial positions, including Managing Director and Head of Investment Banking, Chief Executive Officer and Vice Chairman.
Phillip O. Peterson (age 63) Director since 2002 (MF) and 2000 (MF2), Chairman of the Audit Committee
Mr. Peterson is a mutual fund industry consultant. He was a partner of KPMG LLP (an accounting firm) until July 1999. Mr. Peterson joined William Blair Funds in February 2007 as a member of the Board of Trustees. From January 2004 to April 2005, Mr. Peterson served as Independent President of the Strong Mutual Funds.
Lemma W. Senbet (age 61) Director since 2005
Dr. Senbet is the William E. Mayer Chair Professor of Finance at the University of Maryland, Robert H. Smith School of Business. He was chair of the Finance Department during 1998-2006. Previously he was an endowed professor of finance at the University of Wisconsin-Madison. Also, he was director of the Fortis Funds from March 2000-July 2002. Dr. Senbet served the finance profession in various capacities, including as director of the American Finance Association and President of the Western Finance Association. In 2006, Dr. Senbet was inducted Fellow of Financial Management Association International for his career-long distinguished scholarship and professional service.
Interested Directors and Officers
Thomas M. Marra (age 49) Director since 2002
Mr. Marra has served as President and Chief Operating Officer of The Hartford Financial Services Group, Inc. (“The Hartford”) since 2007. He is also a member of the Board of Directors of The Hartford and currently serves as a Director of Hartford Life, Inc. (“HL, Inc.”). Mr. Marra served as COO of HL, Inc. from 2000 to 2008 and as President of HL, Inc. from 2002 to 2008.
411
The Hartford Mutual Funds, Inc. and The Hartford Mutual Funds II, Inc.
Directors and Officers (Unaudited) — (continued)
Lowndes A. Smith (age 68) Director since 2002, Co-Chairman of the Investment Committee
Mr. Smith served as Vice Chairman of The Hartford from February 1997 to January 2002, as President and Chief Executive Officer of HL, Inc. from February 1997 to January 2002, and as President and Chief Operating Officer of The Hartford Life Insurance Companies from January 1989 to January 2002.
David M. Znamierowski (age 47) Director since 1999 (MF) and 2005 (MF2)
Mr. Znamierowski currently serves as Director and President of Hartford Investment Management Company (“Hartford Investment Management”), as Chief Investment Officer and Executive Vice President for The Hartford and HL, Inc., as Director, Chief Investment Officer and Executive Vice President of Hartford Life Insurance Company (“Hartford Life”) and as Chief Investment Officer for Hartford Administrative Services Company (“HASCO”).
Other Officers
Robert M. Arena, Jr. (age 39) Vice President since 2006
Mr. Arena serves as Executive Vice President of Hartford Life and heads its Retail Products Group in the Individual Markets Group segment. Additionally, Mr. Arena is Director and Senior Vice President of HASCO, Manager and Senior Vice President/Business Line Principal of Hartford Investment Financial Services, LLC (“HIFSCO”) and Manager and Senior Vice President of HL Investment Advisors, LLC (“HL Advisors”). Prior to joining The Hartford in 2004, he was Senior Vice President in charge of Product Management for American Scandia/Prudential in the individual annuities division. Mr. Arena joined American Skandia in 1996.
Tamara L. Fagely (age 49) Vice President, Treasurer, and Controller since 1993
Ms. Fagely has been a Vice President of HASCO since 1998 and Chief Financial Officer since 2006. Currently Ms. Fagely is a Vice President of Hartford Life. She served as Assistant Vice President of Hartford Life from December 2001 through March 2005. In addition she is Controller and Chief Financial Officer of HIFSCO.
Susan Fleege (age 48) AML Compliance Officer since 2005
Ms. Fleege has served as Chief Compliance Officer for HASCO since 2005 and for Hartford Investor Services Company, LLC, (“HISC”) since 2006. Prior to joining Hartford Life in 2005, Ms. Fleege was Counsel for Ameriprise Financial Corporation from 2000 to 2005.
Thomas D. Jones, III (age 43) Vice President and Chief Compliance Officer since 2006
Mr. Jones serves as Chief Compliance Officer for the Hartford Mutual Funds and Vice President and Director of Securities Compliance for The Hartford. He is also Vice President of HIFSCO, HL Advisors, and Hartford Life. Mr. Jones joined The Hartford in 2006 from SEI Investments, where he served as Chief Compliance Officer for its mutual funds and investment advisers. Prior to joining SEI, Mr. Jones was First Vice President and Compliance Director for Merrill Lynch Investment Managers (Americas) (“MLIM”), where he worked from 1992-2004. At MLIM, Mr. Jones was responsible for the compliance oversight of various investment products, including mutual funds, wrap accounts, institutional accounts and alternative investments.
Edward P. Macdonald (age 40) Vice President, Secretary and Chief Legal Officer since 2005
Mr. Macdonald serves as Assistant General Counsel and Assistant Vice President of The Hartford and Chief Legal Officer and Vice President of HIFSCO. He also serves as Vice President of HASCO, Assistant Vice President of Hartford Life, and Chief Legal Officer, Secretary and Vice President of HL Advisors. Prior to joining The Hartford in 2005, Mr. Macdonald was Chief Counsel, Investment Management for Prudential Financial (formerly American Skandia Investment Services, Inc.). He joined Prudential in April 1999.
Vernon J. Meyer (age 44) Vice President since 2006
Mr. Meyer serves as Senior Vice President of Hartford Life and Director of its Investment Advisory Group in the Individual Markets Group segment. He also serves as Senior Vice President of HIFSCO and HL Advisors. Prior to joining The Hartford in 2004, Mr. Meyer was with MassMutual which he joined in 1987.
Denise A. Settimi (age 47) Vice President since 2005
Ms. Settimi currently serves as Chief Operating Officer and Assistant Vice President of HASCO. She is also Assistant Vice President of HIFSCO and Hartford Life. Previously, Ms. Settimi was with American Express Financial Advisors, where she was Director of Retirement Plan Services from 1997 to 2003.
John C. Walters (age 46) President since 2007
Mr. Walters currently serves as President, Chief Executive Officer and Director of HL, Inc. Mr. Walters previously served as President of the U.S. Wealth Management Division and as Co-Chief Operating Officer of HL, Inc. and as Executive Vice President and Director of its Investment Products Division. Mr. Walters also serves as Chairman of the Board, Chief Executive Officer, President and Director of Hartford Life and Executive Vice President of The Hartford. In addition, Mr. Walters is the Chief Executive Officer, Manager and President of HIFSCO and HL Advisors.
HOW TO OBTAIN A COPY OF THE FUNDS’ PROXY VOTING POLICIES AND VOTING RECORDS
A description of the policies and procedures that the Funds use to determine how to vote proxies relating to portfolio securities and a record of how the Funds voted any proxies for the twelve-month period ended June 30, 2007 is available (1) without charge, upon request, by calling 888-843-7824 and (2) on the Securities and Exchange Commission’s website at http://www.sec.gov.
QUARTERLY PORTFOLIO HOLDINGS INFORMATION
The Funds file a complete schedule of portfolio holdings with the Commission for the first and third quarters of each fiscal year on Form N-Q. The Funds’ Forms N-Q are available (1) without charge, upon request, by calling 888-843-7824 and (2) on the Securities and Exchange Commission’s website at http://www.sec.gov. The Forms N-Q may be reviewed and copied at the Commission’s Public Reference Room in Washington, DC. Information on the operation of the Public Reference Room may be obtained by calling 1-800-SEC-0330.
412
The Hartford Mutual Funds, Inc. and The Hartford Mutual Funds II, Inc.
Expense Example
Your Fund’s Expenses
As a shareholder of the Fund, you incur two types of costs: (1) transaction costs, including sales charges (loads) on purchase payments and contingent deferred sales charges (CDSC) (2) ongoing costs including management fees; distribution fees; and other fund expenses. This example is intended to help you understand your ongoing costs(in dollars) of investing in the Fund and to compare these costs with the ongoing costs of investing in other mutual funds.
The example is based on an investment of $1,000 invested at the beginning of the period and held for the period of October 31, 2007 through April 30, 2008.
Actual Expenses
The first line of the table below provides information about actual account values and actual expenses. You may use the information in this line, together with the amount you invested, to estimate the expenses that you paid over the period. Simply divide your account value by $1,000 (for example, an $8,600 account value divided by $1,000 = 8.6, then multiply the result by the number in the first line under the heading entitled “Expenses Paid During Period” to estimate the expenses you paid on your account during this period.
Hypothetical Example for Comparison Purposes
The second line of the table below provides information about hypothetical account values and hypothetical expenses based on the Fund’s actual expense ratio and an assumed rate of return of 5% per year before expenses, which is not the Fund’s actual return. The hypothetical account values and expenses may not be used to estimate the actual ending account balance or expenses you paid for the period. You may use this information to compare the ongoing costs of investing in the Fund and other funds. To do so, compare this 5% hypothetical example with the 5% hypothetical examples that appear in the shareholder reports of the other funds.
Please note that the expenses shown in the table are meant to highlight your ongoing costs only and do not reflect any transactional costs, such as sales charges (loads) and CDSC. Therefore, the second line of the table is useful in comparing ongoing costs only, and will not help you determine the relative total costs of owning different funds. In addition, if these transactional costs were included, your costs would be higher.
Expenses are equal to the Fund’s annualized expense ratios multiplied by average account value over the period, multiplied by 182/366 (to reflect the one-half year period).
| | | | | | | | | | | | | | | | | | | | | | | | | | | | | | | | | | | | | | |
| | | Actual return | | | | Hypothetical (5% return before expenses) | | | | | | | | | | |
| | | | | | | | | Expenses paid
| | | | | | | | | | Expenses paid
| | | | | | | | | | |
| | | Beginning
| | | Ending
| | | during the period
| | | | Beginning
| | | Ending
| | | during the period
| | | | | | Days
| | | | |
| | | Account
| | | Account
| | | October 31, 2007
| | | | Account
| | | Account
| | | October 31, 2007
| | | Annualized
| | | in the
| | | Days
| |
| | | Value
| | | Value
| | | through
| | | | Value
| | | Value
| | | through
| | | expense
| | | current
| | | in the
| |
| | | October 31, 2007 | | | April 30, 2008 | | | April 30, 2008 | | | | October 31, 2007 | | | April 30, 2008 | | | April 30, 2008 | | | ratio | | | 1/2 year | | | full year | |
The Hartford Advisers Fund | | | | | | | | | | | | | | | | | | | | | | | | | |
| Class A | | $ | 1,000.00 | | | $ | 928.90 | | | $ | 5.61 | | | | $ | 1,000.00 | | | $ | 1,019.05 | | | $ | 5.87 | | | | 1.17 | % | | | 182 | | | | 366 | |
| Class B | | $ | 1,000.00 | | | $ | 925.10 | | | $ | 9.62 | | | | $ | 1,000.00 | | | $ | 1,014.87 | | | $ | 10.07 | | | | 2.01 | % | | | 182 | | | | 366 | |
| Class C | | $ | 1,000.00 | | | $ | 926.10 | | | $ | 8.91 | | | | $ | 1,000.00 | | | $ | 1,015.61 | | | $ | 9.32 | | | | 1.86 | % | | | 182 | | | | 366 | |
| Class R3 | | $ | 1,000.00 | | | $ | 927.60 | | | $ | 6.85 | | | | $ | 1,000.00 | | | $ | 1,017.75 | | | $ | 7.17 | | | | 1.43 | % | | | 182 | | | | 366 | |
| Class R4 | | $ | 1,000.00 | | | $ | 929.70 | | | $ | 5.42 | | | | $ | 1,000.00 | | | $ | 1,019.24 | | | $ | 5.67 | | | | 1.13 | % | | | 182 | | | | 366 | |
| Class R5 | | $ | 1,000.00 | | | $ | 930.70 | | | $ | 3.84 | | | | $ | 1,000.00 | | | $ | 1,020.89 | | | $ | 4.02 | | | | 0.80 | % | | | 182 | | | | 366 | |
| Class Y | | $ | 1,000.00 | | | $ | 931.20 | | | $ | 3.41 | | | | $ | 1,000.00 | | | $ | 1,021.33 | | | $ | 3.57 | | | | 0.71 | % | | | 182 | | | | 366 | |
The Hartford Balanced Allocation Fund | | | | | | | | | | | | | | | | | | | | | | | | | |
| Class A | | $ | 1,000.00 | | | $ | 947.70 | | | $ | 2.57 | | | | $ | 1,000.00 | | | $ | 1,022.23 | | | $ | 2.66 | | | | 0.53 | % | | | 182 | | | | 366 | |
| Class B | | $ | 1,000.00 | | | $ | 944.50 | | | $ | 6.53 | | | | $ | 1,000.00 | | | $ | 1,018.15 | | | $ | 6.77 | | | | 1.35 | % | | | 182 | | | | 366 | |
| Class C | | $ | 1,000.00 | | | $ | 943.90 | | | $ | 6.19 | | | | $ | 1,000.00 | | | $ | 1,018.50 | | | $ | 6.42 | | | | 1.28 | % | | | 182 | | | | 366 | |
| Class I | | $ | 1,000.00 | | | $ | 949.90 | | | $ | 1.02 | | | | $ | 1,000.00 | | | $ | 1,023.82 | | | $ | 1.06 | | | | 0.21 | % | | | 182 | | | | 366 | |
| Class R3 | | $ | 1,000.00 | | | $ | 946.10 | | | $ | 4.55 | | | | $ | 1,000.00 | | | $ | 1,020.19 | | | $ | 4.72 | | | | 0.94 | % | | | 182 | | | | 366 | |
| Class R4 | | $ | 1,000.00 | | | $ | 947.80 | | | $ | 2.86 | | | | $ | 1,000.00 | | | $ | 1,021.93 | | | $ | 2.97 | | | | 0.59 | % | | | 182 | | | | 366 | |
| Class R5 | | $ | 1,000.00 | | | $ | 949.70 | | | $ | 1.41 | | | | $ | 1,000.00 | | | $ | 1,023.42 | | | $ | 1.46 | | | | 0.29 | % | | | 182 | | | | 366 | |
The Hartford Balanced Income Fund | | | | | | | | | | | | | | | | | | | | | | | | | |
| Class A | | $ | 1,000.00 | | | $ | 967.80 | | | $ | 5.87 | | | | $ | 1,000.00 | | | $ | 1,018.90 | | | $ | 6.02 | | | | 1.20 | % | | | 182 | | | | 366 | |
| Class B | | $ | 1,000.00 | | | $ | 964.40 | | | $ | 9.77 | | | | $ | 1,000.00 | | | $ | 1,014.92 | | | $ | 10.02 | | | | 2.00 | % | | | 182 | | | | 366 | |
| Class C | | $ | 1,000.00 | | | $ | 964.70 | | | $ | 9.67 | | | | $ | 1,000.00 | | | $ | 1,015.02 | | | $ | 9.92 | | | | 1.98 | % | | | 182 | | | | 366 | |
| Class Y | | $ | 1,000.00 | | | $ | 969.80 | | | $ | 4.26 | | | | $ | 1,000.00 | | | $ | 1,020.54 | | | $ | 4.37 | | | | 0.87 | % | | | 182 | | | | 366 | |
413
The Hartford Mutual Funds, Inc. and The Hartford Mutual Funds II, Inc.
Expense Example — (continued)
| | | | | | | | | | | | | | | | | | | | | | | | | | | | | | | | | | | | | | |
| | | Actual return | | | | Hypothetical (5% return before expenses) | | | | | | | | | | |
| | | | | | | | | Expenses paid
| | | | | | | | | | Expenses paid
| | | | | | | | | | |
| | | Beginning
| | | Ending
| | | during the period
| | | | Beginning
| | | Ending
| | | during the period
| | | | | | Days
| | | | |
| | | Account
| | | Account
| | | October 31, 2007
| | | | Account
| | | Account
| | | October 31, 2007
| | | Annualized
| | | in the
| | | Days
| |
| | | Value
| | | Value
| | | through
| | | | Value
| | | Value
| | | through
| | | expense
| | | current
| | | in the
| |
| | | October 31, 2007 | | | April 30, 2008 | | | April 30, 2008 | | | | October 31, 2007 | | | April 30, 2008 | | | April 30, 2008 | | | ratio | | | 1/2 year | | | full year | |
The Hartford Capital Appreciation Fund | | | | | | | | | | | | | | | | | | | | | | | | | |
| Class A | | $ | 1,000.00 | | | $ | 922.35 | | | $ | 5.28 | | | | $ | 1,000.00 | | | $ | 1,019.37 | | | $ | 5.55 | | | | 1.10 | % | | | 182 | | | | 366 | |
| Class B | | $ | 1,000.00 | | | $ | 918.68 | | | $ | 9.11 | | | | $ | 1,000.00 | | | $ | 1,015.37 | | | $ | 9.57 | | | | 1.91 | % | | | 182 | | | | 366 | |
| Class C | | $ | 1,000.00 | | | $ | 918.93 | | | $ | 8.73 | | | | $ | 1,000.00 | | | $ | 1,015.76 | | | $ | 9.17 | | | | 1.83 | % | | | 182 | | | | 366 | |
| Class I | | $ | 1,000.00 | | | $ | 923.90 | | | $ | 3.78 | | | | $ | 1,000.00 | | | $ | 1,020.93 | | | $ | 3.97 | | | | 0.79 | % | | | 182 | | | | 366 | |
| Class R3 | | $ | 1,000.00 | | | $ | 920.35 | | | $ | 7.54 | | | | $ | 1,000.00 | | | $ | 1,017.01 | | | $ | 7.92 | | | | 1.58 | % | | | 182 | | | | 366 | |
| Class R4 | | $ | 1,000.00 | | | $ | 922.37 | | | $ | 5.31 | | | | $ | 1,000.00 | | | $ | 1,019.34 | | | $ | 5.57 | | | | 1.11 | % | | | 182 | | | | 366 | |
| Class R5 | | $ | 1,000.00 | | | $ | 923.64 | | | $ | 3.92 | | | | $ | 1,000.00 | | | $ | 1,020.79 | | | $ | 4.12 | | | | 0.82 | % | | | 182 | | | | 366 | |
| Class Y | | $ | 1,000.00 | | | $ | 924.19 | | | $ | 3.42 | | | | $ | 1,000.00 | | | $ | 1,021.31 | | | $ | 3.59 | | | | 0.71 | % | | | 182 | | | | 366 | |
The Hartford Capital Appreciation II Fund | | | | | | | | | | | | | | | | | | | | | | | | | |
| Class A | | $ | 1,000.00 | | | $ | 866.36 | | | $ | 6.40 | | | | $ | 1,000.00 | | | $ | 1,018.00 | | | $ | 6.92 | | | | 1.38 | % | | | 182 | | | | 366 | |
| Class B | | $ | 1,000.00 | | | $ | 862.23 | | | $ | 10.37 | | | | $ | 1,000.00 | | | $ | 1,013.72 | | | $ | 11.22 | | | | 2.24 | % | | | 182 | | | | 366 | |
| Class C | | $ | 1,000.00 | | | $ | 862.62 | | | $ | 9.82 | | | | $ | 1,000.00 | | | $ | 1,014.32 | | | $ | 10.62 | | | | 2.12 | % | | | 182 | | | | 366 | |
| Class I | | $ | 1,000.00 | | | $ | 867.62 | | | $ | 4.97 | | | | $ | 1,000.00 | | | $ | 1,019.54 | | | $ | 5.37 | | | | 1.07 | % | | | 182 | | | | 366 | |
| Class R3 | | $ | 1,000.00 | | | $ | 864.28 | | | $ | 8.07 | | | | $ | 1,000.00 | | | $ | 1,016.21 | | | $ | 8.72 | | | | 1.74 | % | | | 182 | | | | 366 | |
| Class R4 | | $ | 1,000.00 | | | $ | 866.60 | | | $ | 6.64 | | | | $ | 1,000.00 | | | $ | 1,017.75 | | | $ | 7.17 | | | | 1.43 | % | | | 182 | | | | 366 | |
| Class R5 | | $ | 1,000.00 | | | $ | 867.01 | | | $ | 5.20 | | | | $ | 1,000.00 | | | $ | 1,019.29 | | | $ | 5.62 | | | | 1.12 | % | | | 182 | | | | 366 | |
| Class Y | | $ | 1,000.00 | | | $ | 867.80 | | | $ | 4.64 | | | | $ | 1,000.00 | | | $ | 1,019.89 | | | $ | 5.02 | | | | 1.00 | % | | | 182 | | | | 366 | |
The Hartford Checks and Balances Fund | | | | | | | | | | | | | | | | | | | | | | | | | |
| Class A | | $ | 1,000.00 | | | $ | 961.51 | | | $ | 1.95 | | | | $ | 1,000.00 | | | $ | 1,022.87 | | | $ | 2.01 | | | | 0.40 | % | | | 182 | | | | 366 | |
| Class B | | $ | 1,000.00 | | | $ | 958.50 | | | $ | 5.94 | | | | $ | 1,000.00 | | | $ | 1,018.80 | | | $ | 6.12 | | | | 1.22 | % | | | 182 | | | | 366 | |
| Class C | | $ | 1,000.00 | | | $ | 958.74 | | | $ | 5.60 | | | | $ | 1,000.00 | | | $ | 1,019.14 | | | $ | 5.77 | | | | 1.15 | % | | | 182 | | | | 366 | |
| Class I | | $ | 1,000.00 | | | $ | 962.13 | | | $ | 0.28 | | | | $ | 1,000.00 | | | $ | 1,008.05 | | | $ | 0.28 | | | | 0.17 | % | | | 61 | | | | 366 | |
The Hartford Conservative Allocation Fund | | | | | | | | | | | | | | | | | | | | | | | | | |
| Class A | | $ | 1,000.00 | | | $ | 968.65 | | | $ | 2.79 | | | | $ | 1,000.00 | | | $ | 1,022.03 | | | $ | 2.87 | | | | 0.57 | % | | | 182 | | | | 366 | |
| Class B | | $ | 1,000.00 | | | $ | 965.12 | | | $ | 6.50 | | | | $ | 1,000.00 | | | $ | 1,018.25 | | | $ | 6.67 | | | | 1.33 | % | | | 182 | | | | 366 | |
| Class C | | $ | 1,000.00 | | | $ | 964.42 | | | $ | 6.50 | | | | $ | 1,000.00 | | | $ | 1,018.25 | | | $ | 6.67 | | | | 1.33 | % | | | 182 | | | | 366 | |
| Class I | | $ | 1,000.00 | | | $ | 970.07 | | | $ | 1.37 | | | | $ | 1,000.00 | | | $ | 1,023.47 | | | $ | 1.41 | | | | 0.28 | % | | | 182 | | | | 366 | |
| Class R3 | | $ | 1,000.00 | | | $ | 966.06 | | | $ | 4.99 | | | | $ | 1,000.00 | | | $ | 1,019.79 | | | $ | 5.12 | | | | 1.02 | % | | | 182 | | | | 366 | |
| Class R4 | | $ | 1,000.00 | | | $ | 968.96 | | | $ | 3.04 | | | | $ | 1,000.00 | | | $ | 1,021.78 | | | $ | 3.12 | | | | 0.62 | % | | | 182 | | | | 366 | |
| Class R5 | | $ | 1,000.00 | | | $ | 969.75 | | | $ | 1.57 | | | | $ | 1,000.00 | | | $ | 1,023.27 | | | $ | 1.61 | | | | 0.32 | % | | | 182 | | | | 366 | |
The Hartford Disciplined Equity Fund | | | | | | | | | | | | | | | | | | | | | | | | | |
| Class A | | $ | 1,000.00 | | | $ | 894.10 | | | $ | 6.59 | | | | $ | 1,000.00 | | | $ | 1,017.90 | | | $ | 7.02 | | | | 1.40 | % | | | 182 | | | | 366 | |
| Class B | | $ | 1,000.00 | | | $ | 891.24 | | | $ | 9.31 | | | | $ | 1,000.00 | | | $ | 1,015.02 | | | $ | 9.92 | | | | 1.98 | % | | | 182 | | | | 366 | |
| Class C | | $ | 1,000.00 | | | $ | 891.32 | | | $ | 9.92 | | | | $ | 1,000.00 | | | $ | 1,014.37 | | | $ | 10.57 | | | | 2.11 | % | | | 182 | | | | 366 | |
| Class R3 | | $ | 1,000.00 | | | $ | 893.02 | | | $ | 7.77 | | | | $ | 1,000.00 | | | $ | 1,016.66 | | | $ | 8.27 | | | | 1.65 | % | | | 182 | | | | 366 | |
| Class R4 | | $ | 1,000.00 | | | $ | 895.04 | | | $ | 6.03 | | | | $ | 1,000.00 | | | $ | 1,018.50 | | | $ | 6.42 | | | | 1.28 | % | | | 182 | | | | 366 | |
| Class R5 | | $ | 1,000.00 | | | $ | 895.92 | | | $ | 4.67 | | | | $ | 1,000.00 | | | $ | 1,019.94 | | | $ | 4.97 | | | | 0.99 | % | | | 182 | | | | 366 | |
| Class Y | | $ | 1,000.00 | | | $ | 896.64 | | | $ | 4.20 | | | | $ | 1,000.00 | | | $ | 1,020.44 | | | $ | 4.47 | | | | 0.89 | % | | | 182 | | | | 366 | |
The Hartford Dividend and Growth Fund | | | | | | | | | | | | | | | | | | | | | | | | | |
| Class A | | $ | 1,000.00 | | | $ | 935.43 | | | $ | 5.19 | | | | $ | 1,000.00 | | | $ | 1,019.51 | | | $ | 5.41 | | | | 1.08 | % | | | 182 | | | | 366 | |
| Class B | | $ | 1,000.00 | | | $ | 931.04 | | | $ | 9.41 | | | | $ | 1,000.00 | | | $ | 1,015.12 | | | $ | 9.82 | | | | 1.96 | % | | | 182 | | | | 366 | |
| Class C | | $ | 1,000.00 | | | $ | 931.60 | | | $ | 8.79 | | | | $ | 1,000.00 | | | $ | 1,015.76 | | | $ | 9.17 | | | | 1.83 | % | | | 182 | | | | 366 | |
| Class I | | $ | 1,000.00 | | | $ | 936.76 | | | $ | 3.76 | | | | $ | 1,000.00 | | | $ | 1,020.98 | | | $ | 3.92 | | | | 0.78 | % | | | 182 | | | | 366 | |
| Class R3 | | $ | 1,000.00 | | | $ | 932.95 | | | $ | 7.21 | | | | $ | 1,000.00 | | | $ | 1,017.40 | | | $ | 7.52 | | | | 1.50 | % | | | 182 | | | | 366 | |
| Class R4 | | $ | 1,000.00 | | | $ | 935.34 | | | $ | 5.23 | | | | $ | 1,000.00 | | | $ | 1,019.46 | | | $ | 5.46 | | | | 1.09 | % | | | 182 | | | | 366 | |
| Class R5 | | $ | 1,000.00 | | | $ | 936.84 | | | $ | 3.80 | | | | $ | 1,000.00 | | | $ | 1,020.93 | | | $ | 3.97 | | | | 0.79 | % | | | 182 | | | | 366 | |
| Class Y | | $ | 1,000.00 | | | $ | 937.19 | | | $ | 3.28 | | | | $ | 1,000.00 | | | $ | 1,021.48 | | | $ | 3.42 | | | | 0.68 | % | | | 182 | | | | 366 | |
The Hartford Equity Growth Allocation Fund | | | | | | | | | | | | | | | | | | | | | | | | | |
| Class A | | $ | 1,000.00 | | | $ | 899.32 | | | $ | 3.16 | | | | $ | 1,000.00 | | | $ | 1,021.53 | | | $ | 3.37 | | | | 0.67 | % | | | 182 | | | | 366 | |
| Class B | | $ | 1,000.00 | | | $ | 895.83 | | | $ | 7.02 | | | | $ | 1,000.00 | | | $ | 1,017.45 | | | $ | 7.47 | | | | 1.49 | % | | | 182 | | | | 366 | |
| Class C | | $ | 1,000.00 | | | $ | 896.57 | | | $ | 6.70 | | | | $ | 1,000.00 | | | $ | 1,017.80 | | | $ | 7.12 | | | | 1.42 | % | | | 182 | | | | 366 | |
| Class I | | $ | 1,000.00 | | | $ | 901.51 | | | $ | 1.37 | | | | $ | 1,000.00 | | | $ | 1,023.42 | | | $ | 1.46 | | | | 0.29 | % | | | 182 | | | | 366 | |
| Class R3 | | $ | 1,000.00 | | | $ | 898.15 | | | $ | 4.48 | | | | $ | 1,000.00 | | | $ | 1,020.14 | | | $ | 4.77 | | | | 0.95 | % | | | 182 | | | | 366 | |
| Class R4 | | $ | 1,000.00 | | | $ | 899.36 | | | $ | 3.02 | | | | $ | 1,000.00 | | | $ | 1,021.68 | | | $ | 3.22 | | | | 0.64 | % | | | 182 | | | | 366 | |
| Class R5 | | $ | 1,000.00 | | | $ | 900.77 | | | $ | 1.61 | | | | $ | 1,000.00 | | | $ | 1,023.17 | | | $ | 1.71 | | | | 0.34 | % | | | 182 | | | | 366 | |
414
| | | | | | | | | | | | | | | | | | | | | | | | | | | | | | | | | | | | | | |
| | | Actual return | | | | Hypothetical (5% return before expenses) | | | | | | | | | | |
| | | | | | | | | Expenses paid
| | | | | | | | | | Expenses paid
| | | | | | | | | | |
| | | Beginning
| | | Ending
| | | during the period
| | | | Beginning
| | | Ending
| | | during the period
| | | | | | Days
| | | | |
| | | Account
| | | Account
| | | October 31, 2007
| | | | Account
| | | Account
| | | October 31, 2007
| | | Annualized
| | | in the
| | | Days
| |
| | | Value
| | | Value
| | | through
| | | | Value
| | | Value
| | | through
| | | expense
| | | current
| | | in the
| |
| | | October 31, 2007 | | | April 30, 2008 | | | April 30, 2008 | | | | October 31, 2007 | | | April 30, 2008 | | | April 30, 2008 | | | ratio | | | 1/2 year | | | full year | |
The Hartford Equity Income Fund | | | | | | | | | | | | | | | | | | | | | | | | | |
| Class A | | $ | 1,000.00 | | | $ | 928.11 | | | $ | 5.42 | | | | $ | 1,000.00 | | | $ | 1,019.24 | | | $ | 5.67 | | | | 1.13 | % | | | 182 | | | | 366 | |
| Class B | | $ | 1,000.00 | | | $ | 923.82 | | | $ | 9.52 | | | | $ | 1,000.00 | | | $ | 1,014.97 | | | $ | 9.97 | | | | 1.99 | % | | | 182 | | | | 366 | |
| Class C | | $ | 1,000.00 | | | $ | 924.42 | | | $ | 8.90 | | | | $ | 1,000.00 | | | $ | 1,015.61 | | | $ | 9.32 | | | | 1.86 | % | | | 182 | | | | 366 | |
| Class I | | $ | 1,000.00 | | | $ | 930.00 | | | $ | 3.98 | | | | $ | 1,000.00 | | | $ | 1,020.74 | | | $ | 4.17 | | | | 0.83 | % | | | 182 | | | | 366 | |
| Class R3 | | $ | 1,000.00 | | | $ | 926.59 | | | $ | 7.14 | | | | $ | 1,000.00 | | | $ | 1,017.45 | | | $ | 7.47 | | | | 1.49 | % | | | 182 | | | | 366 | |
| Class R4 | | $ | 1,000.00 | | | $ | 927.69 | | | $ | 5.37 | | | | $ | 1,000.00 | | | $ | 1,019.29 | | | $ | 5.62 | | | | 1.12 | % | | | 182 | | | | 366 | |
| Class R5 | | $ | 1,000.00 | | | $ | 929.72 | | | $ | 4.03 | | | | $ | 1,000.00 | | | $ | 1,020.69 | | | $ | 4.22 | | | | 0.84 | % | | | 182 | | | | 366 | |
| Class Y | | $ | 1,000.00 | | | $ | 929.55 | | | $ | 3.55 | | | | $ | 1,000.00 | | | $ | 1,021.18 | | | $ | 3.72 | | | | 0.74 | % | | | 182 | | | | 366 | |
The Hartford Floating Rate Fund | | | | | | | | | | | | | | | | | | | | | | | | | |
| Class A | | $ | 1,000.00 | | | $ | 960.33 | | | $ | 4.81 | | | | $ | 1,000.00 | | | $ | 1,019.95 | | | $ | 4.96 | | | | 0.99 | % | | | 182 | | | | 366 | |
| Class B | | $ | 1,000.00 | | | $ | 956.81 | | | $ | 8.51 | | | | $ | 1,000.00 | | | $ | 1,016.16 | | | $ | 8.77 | | | | 1.75 | % | | | 182 | | | | 366 | |
| Class C | | $ | 1,000.00 | | | $ | 957.65 | | | $ | 8.52 | | | | $ | 1,000.00 | | | $ | 1,016.16 | | | $ | 8.77 | | | | 1.75 | % | | | 182 | | | | 366 | |
| Class I | | $ | 1,000.00 | | | $ | 962.61 | | | $ | 3.54 | | | | $ | 1,000.00 | | | $ | 1,021.25 | | | $ | 3.65 | | | | 0.73 | % | | | 182 | | | | 366 | |
| Class R3 | | $ | 1,000.00 | | | $ | 960.23 | | | $ | 6.04 | | | | $ | 1,000.00 | | | $ | 1,018.70 | | | $ | 6.22 | | | | 1.24 | % | | | 182 | | | | 366 | |
| Class R4 | | $ | 1,000.00 | | | $ | 961.30 | | | $ | 4.88 | | | | $ | 1,000.00 | | | $ | 1,019.89 | | | $ | 5.02 | | | | 1.00 | % | | | 182 | | | | 366 | |
| Class R5 | | $ | 1,000.00 | | | $ | 962.19 | | | $ | 4.15 | | | | $ | 1,000.00 | | | $ | 1,020.64 | | | $ | 4.27 | | | | 0.85 | % | | | 182 | | | | 366 | |
| Class Y | | $ | 1,000.00 | | | $ | 962.80 | | | $ | 3.37 | | | | $ | 1,000.00 | | | $ | 1,021.43 | | | $ | 3.47 | | | | 0.69 | % | | | 182 | | | | 366 | |
The Hartford Fundamental Growth Fund | | | | | | | | | | | | | | | | | | | | | | | | | |
| Class A | | $ | 1,000.00 | | | $ | 940.76 | | | $ | 7.00 | | | | $ | 1,000.00 | | | $ | 1,017.65 | | | $ | 7.28 | | | | 1.45 | % | | | 182 | | | | 366 | |
| Class B | | $ | 1,000.00 | | | $ | 937.14 | | | $ | 10.59 | | | | $ | 1,000.00 | | | $ | 1,013.93 | | | $ | 11.01 | | | | 2.20 | % | | | 182 | | | | 366 | |
| Class C | | $ | 1,000.00 | | | $ | 937.19 | | | $ | 10.60 | | | | $ | 1,000.00 | | | $ | 1,013.92 | | | $ | 11.02 | | | | 2.20 | % | | | 182 | | | | 366 | |
| Class Y | | $ | 1,000.00 | | | $ | 942.98 | | | $ | 4.83 | | | | $ | 1,000.00 | | | $ | 1,019.89 | | | $ | 5.02 | | | | 1.00 | % | | | 182 | | | | 366 | |
The Hartford Global Communications Fund | | | | | | | | | | | | | | | | | | | | | | | | | |
| Class A | | $ | 1,000.00 | | | $ | 907.77 | | | $ | 7.40 | | | | $ | 1,000.00 | | | $ | 1,017.11 | | | $ | 7.82 | | | | 1.56 | % | | | 182 | | | | 366 | |
| Class B | | $ | 1,000.00 | | | $ | 904.38 | | | $ | 10.75 | | | | $ | 1,000.00 | | | $ | 1,013.58 | | | $ | 11.36 | | | | 2.27 | % | | | 182 | | | | 366 | |
| Class C | | $ | 1,000.00 | | | $ | 905.14 | | | $ | 10.89 | | | | $ | 1,000.00 | | | $ | 1,013.43 | | | $ | 11.51 | | | | 2.30 | % | | | 182 | | | | 366 | |
| Class Y | | $ | 1,000.00 | | | $ | 910.55 | | | $ | 5.10 | | | | $ | 1,000.00 | | | $ | 1,019.53 | | | $ | 5.39 | | | | 1.07 | % | | | 182 | | | | 366 | |
The Hartford Global Equity Fund | | | | | | | | | | | | | | | | | | | | | | | | | |
| Class A | | $ | 1,000.00 | | | $ | 1,032.00 | | | $ | 2.78 | | | | $ | 1,000.00 | | | $ | 1,005.60 | | | $ | 2.74 | | | | 1.64 | % | | | 61 | | | | 366 | |
| Class B | | $ | 1,000.00 | | | $ | 1,031.00 | | | $ | 4.05 | | | | $ | 1,000.00 | | | $ | 1,004.35 | | | $ | 3.99 | | | | 2.39 | % | | | 61 | | | | 366 | |
| Class C | | $ | 1,000.00 | | | $ | 1,031.00 | | | $ | 4.05 | | | | $ | 1,000.00 | | | $ | 1,004.35 | | | $ | 3.99 | | | | 2.39 | % | | | 61 | | | | 366 | |
| Class I | | $ | 1,000.00 | | | $ | 1,033.00 | | | $ | 2.35 | | | | $ | 1,000.00 | | | $ | 1,006.02 | | | $ | 2.32 | | | | 1.39 | % | | | 61 | | | | 366 | |
| Class R3 | | $ | 1,000.00 | | | $ | 1,032.00 | | | $ | 3.22 | | | | $ | 1,000.00 | | | $ | 1,005.17 | | | $ | 3.17 | | | | 1.90 | % | | | 61 | | | | 366 | |
| Class R4 | | $ | 1,000.00 | | | $ | 1,032.00 | | | $ | 2.83 | | | | $ | 1,000.00 | | | $ | 1,005.55 | | | $ | 2.79 | | | | 1.67 | % | | | 61 | | | | 366 | |
| Class R5 | | $ | 1,000.00 | | | $ | 1,032.00 | | | $ | 2.42 | | | | $ | 1,000.00 | | | $ | 1,005.95 | | | $ | 2.39 | | | | 1.43 | % | | | 61 | | | | 366 | |
| Class Y | | $ | 1,000.00 | | | $ | 1,033.00 | | | $ | 2.24 | | | | $ | 1,000.00 | | | $ | 1,006.13 | | | $ | 2.21 | | | | 1.32 | % | | | 61 | | | | 366 | |
The Hartford Global Financial Services Fund | | | | | | | | | | | | | | | | | | | | | | | | | |
| Class A | | $ | 1,000.00 | | | $ | 839.92 | | | $ | 7.32 | | | | $ | 1,000.00 | | | $ | 1,016.91 | | | $ | 8.02 | | | | 1.60 | % | | | 182 | | | | 366 | |
| Class B | | $ | 1,000.00 | | | $ | 838.70 | | | $ | 9.46 | | | | $ | 1,000.00 | | | $ | 1,014.57 | | | $ | 10.37 | | | | 2.07 | % | | | 182 | | | | 366 | |
| Class C | | $ | 1,000.00 | | | $ | 837.90 | | | $ | 10.74 | | | | $ | 1,000.00 | | | $ | 1,013.18 | | | $ | 11.76 | | | | 2.35 | % | | | 182 | | | | 366 | |
| Class Y | | $ | 1,000.00 | | | $ | 842.42 | | | $ | 5.36 | | | | $ | 1,000.00 | | | $ | 1,019.05 | | | $ | 5.87 | | | | 1.17 | % | | | 182 | | | | 366 | |
The Hartford Global Growth Fund | | | | | | | | | | | | | | | | | | | | | | | | | |
| Class A | | $ | 1,000.00 | | | $ | 870.43 | | | $ | 6.79 | | | | $ | 1,000.00 | | | $ | 1,017.60 | | | $ | 7.32 | | | | 1.46 | % | | | 182 | | | | 366 | |
| Class B | | $ | 1,000.00 | | | $ | 867.99 | | | $ | 9.47 | | | | $ | 1,000.00 | | | $ | 1,014.72 | | | $ | 10.22 | | | | 2.04 | % | | | 182 | | | | 366 | |
| Class C | | $ | 1,000.00 | | | $ | 867.37 | | | $ | 9.94 | | | | $ | 1,000.00 | | | $ | 1,014.22 | | | $ | 10.72 | | | | 2.14 | % | | | 182 | | | | 366 | |
| Class R3 | | $ | 1,000.00 | | | $ | 869.38 | | | $ | 8.09 | | | | $ | 1,000.00 | | | $ | 1,016.21 | | | $ | 8.72 | | | | 1.74 | % | | | 182 | | | | 366 | |
| Class R4 | | $ | 1,000.00 | | | $ | 869.33 | | | $ | 6.65 | | | | $ | 1,000.00 | | | $ | 1,017.75 | | | $ | 7.17 | | | | 1.43 | % | | | 182 | | | | 366 | |
| Class R5 | | $ | 1,000.00 | | | $ | 872.65 | | | $ | 4.64 | | | | $ | 1,000.00 | | | $ | 1,019.91 | | | $ | 5.01 | | | | 1.00 | % | | | 182 | | | | 366 | |
| Class Y | | $ | 1,000.00 | | | $ | 872.86 | | | $ | 4.19 | | | | $ | 1,000.00 | | | $ | 1,020.39 | | | $ | 4.52 | | | | 0.90 | % | | | 182 | | | | 366 | |
The Hartford Global Health Fund | | | | | | | | | | | | | | | | | | | | | | | | | |
| Class A | | $ | 1,000.00 | | | $ | 897.60 | | | $ | 6.62 | | | | $ | 1,000.00 | | | $ | 1,017.89 | | | $ | 7.04 | | | | 1.40 | % | | | 182 | | | | 366 | |
| Class B | | $ | 1,000.00 | | | $ | 894.50 | | | $ | 10.60 | | | | $ | 1,000.00 | | | $ | 1,013.67 | | | $ | 11.27 | | | | 2.25 | % | | | 182 | | | | 366 | |
| Class C | | $ | 1,000.00 | | | $ | 894.15 | | | $ | 10.10 | | | | $ | 1,000.00 | | | $ | 1,014.20 | | | $ | 10.74 | | | | 2.14 | % | | | 182 | | | | 366 | |
| Class I | | $ | 1,000.00 | | | $ | 898.80 | | | $ | 5.29 | | | | $ | 1,000.00 | | | $ | 1,019.29 | | | $ | 5.62 | | | | 1.12 | % | | | 182 | | | | 366 | |
| Class R3 | | $ | 1,000.00 | | | $ | 896.26 | | | $ | 8.16 | | | | $ | 1,000.00 | | | $ | 1,016.26 | | | $ | 8.67 | | | | 1.73 | % | | | 182 | | | | 366 | |
| Class R4 | | $ | 1,000.00 | | | $ | 898.29 | | | $ | 6.42 | | | | $ | 1,000.00 | | | $ | 1,018.10 | | | $ | 6.82 | | | | 1.36 | % | | | 182 | | | | 366 | |
| Class R5 | | $ | 1,000.00 | | | $ | 900.68 | | | $ | 5.01 | | | | $ | 1,000.00 | | | $ | 1,019.59 | | | $ | 5.32 | | | | 1.06 | % | | | 182 | | | | 366 | |
| Class Y | | $ | 1,000.00 | | | $ | 899.81 | | | $ | 4.49 | | | | $ | 1,000.00 | | | $ | 1,020.14 | | | $ | 4.77 | | | | 0.95 | % | | | 182 | | | | 366 | |
415
The Hartford Mutual Funds, Inc. and The Hartford Mutual Funds II, Inc.
Expense Example — (continued)
| | | | | | | | | | | | | | | | | | | | | | | | | | | | | | | | | | | | | | |
| | | Actual return | | | | Hypothetical (5% return before expenses) | | | | | | | | | | |
| | | | | | | | | Expenses paid
| | | | | | | | | | Expenses paid
| | | | | | | | | | |
| | | Beginning
| | | Ending
| | | during the period
| | | | Beginning
| | | Ending
| | | during the period
| | | | | | Days
| | | | |
| | | Account
| | | Account
| | | October 31, 2007
| | | | Account
| | | Account
| | | October 31, 2007
| | | Annualized
| | | in the
| | | Days
| |
| | | Value
| | | Value
| | | through
| | | | Value
| | | Value
| | | through
| | | expense
| | | current
| | | in the
| |
| | | October 31, 2007 | | | April 30, 2008 | | | April 30, 2008 | | | | October 31, 2007 | | | April 30, 2008 | | | April 30, 2008 | | | ratio | | | 1/2 year | | | full year | |
The Hartford Global Technology Fund | | | | | | | | | | | | | | | | | | | | | | | | | |
| Class A | | $ | 1,000.00 | | | $ | 850.62 | | | $ | 6.63 | | | | $ | 1,000.00 | | | $ | 1,017.70 | | | $ | 7.22 | | | | 1.44 | % | | | 182 | | | | 366 | |
| Class B | | $ | 1,000.00 | | | $ | 848.18 | | | $ | 9.14 | | | | $ | 1,000.00 | | | $ | 1,014.97 | | | $ | 9.97 | | | | 1.99 | % | | | 182 | | | | 366 | |
| Class C | | $ | 1,000.00 | | | $ | 846.04 | | | $ | 10.51 | | | | $ | 1,000.00 | | | $ | 1,013.48 | | | $ | 11.46 | | | | 2.29 | % | | | 182 | | | | 366 | |
| Class Y | | $ | 1,000.00 | | | $ | 851.01 | | | $ | 4.97 | | | | $ | 1,000.00 | | | $ | 1,019.49 | | | $ | 5.42 | | | | 1.08 | % | | | 182 | | | | 366 | |
The Hartford Growth Allocation Fund | | | | | | | | | | | | | | | | | | | | | | | | | |
| Class A | | $ | 1,000.00 | | | $ | 927.26 | | | $ | 2.78 | | | | $ | 1,000.00 | | | $ | 1,021.98 | | | $ | 2.92 | | | | 0.58 | % | | | 182 | | | | 366 | |
| Class B | | $ | 1,000.00 | | | $ | 923.79 | | | $ | 6.70 | | | | $ | 1,000.00 | | | $ | 1,017.90 | | | $ | 7.02 | | | | 1.40 | % | | | 182 | | | | 366 | |
| Class C | | $ | 1,000.00 | | | $ | 923.40 | | | $ | 6.36 | | | | $ | 1,000.00 | | | $ | 1,018.25 | | | $ | 6.67 | | | | 1.33 | % | | | 182 | | | | 366 | |
| Class I | | $ | 1,000.00 | | | $ | 929.58 | | | $ | 1.06 | | | | $ | 1,000.00 | | | $ | 1,023.77 | | | $ | 1.11 | | | | 0.22 | % | | | 182 | | | | 366 | |
| Class R3 | | $ | 1,000.00 | | | $ | 924.99 | | | $ | 4.79 | | | | $ | 1,000.00 | | | $ | 1,019.89 | | | $ | 5.02 | | | | 1.00 | % | | | 182 | | | | 366 | |
| Class R4 | | $ | 1,000.00 | | | $ | 927.12 | | | $ | 2.87 | | | | $ | 1,000.00 | | | $ | 1,021.88 | | | $ | 3.02 | | | | 0.60 | % | | | 182 | | | | 366 | |
| Class R5 | | $ | 1,000.00 | | | $ | 929.01 | | | $ | 1.44 | | | | $ | 1,000.00 | | | $ | 1,023.37 | | | $ | 1.51 | | | | 0.30 | % | | | 182 | | | | 366 | |
The Hartford Growth Fund | | | | | | | | | | | | | | | | | | | | | | | | | |
| Class A | | $ | 1,000.00 | | | $ | 891.79 | | | $ | 5.97 | | | | $ | 1,000.00 | | | $ | 1,018.55 | | | $ | 6.37 | | | | 1.27 | % | | | 182 | | | | 366 | |
| Class B | | $ | 1,000.00 | | | $ | 888.33 | | | $ | 9.16 | | | | $ | 1,000.00 | | | $ | 1,015.17 | | | $ | 9.77 | | | | 1.95 | % | | | 182 | | | | 366 | |
| Class C | | $ | 1,000.00 | | | $ | 888.66 | | | $ | 9.25 | | | | $ | 1,000.00 | | | $ | 1,015.07 | | | $ | 9.87 | | | | 1.97 | % | | | 182 | | | | 366 | |
| Class I | | $ | 1,000.00 | | | $ | 893.28 | | | $ | 4.24 | | | | $ | 1,000.00 | | | $ | 1,020.39 | | | $ | 4.52 | | | | 0.90 | % | | | 182 | | | | 366 | |
| Class L | | $ | 1,000.00 | | | $ | 892.68 | | | $ | 4.89 | | | | $ | 1,000.00 | | | $ | 1,019.69 | | | $ | 5.22 | | | | 1.04 | % | | | 182 | | | | 366 | |
| Class R3 | | $ | 1,000.00 | | | $ | 890.09 | | | $ | 7.29 | | | | $ | 1,000.00 | | | $ | 1,017.15 | | | $ | 7.78 | | | | 1.55 | % | | | 182 | | | | 366 | |
| Class R4 | | $ | 1,000.00 | | | $ | 891.93 | | | $ | 5.69 | | | | $ | 1,000.00 | | | $ | 1,018.85 | | | $ | 6.07 | | | | 1.21 | % | | | 182 | | | | 366 | |
| Class R5 | | $ | 1,000.00 | | | $ | 893.14 | | | $ | 4.42 | | | | $ | 1,000.00 | | | $ | 1,020.19 | | | $ | 4.72 | | | | 0.94 | % | | | 182 | | | | 366 | |
| Class Y | | $ | 1,000.00 | | | $ | 893.78 | | | $ | 3.77 | | | | $ | 1,000.00 | | | $ | 1,020.89 | | | $ | 4.02 | | | | 0.80 | % | | | 182 | | | | 366 | |
The Hartford Growth Opportunities Fund | | | | | | | | | | | | | | | | | | | | | | | | | |
| Class A | | $ | 1,000.00 | | | $ | 864.07 | | | $ | 5.79 | | | | $ | 1,000.00 | | | $ | 1,018.65 | | | $ | 6.27 | | | | 1.25 | % | | | 182 | | | | 366 | |
| Class B | | $ | 1,000.00 | | | $ | 860.58 | | | $ | 9.58 | | | | $ | 1,000.00 | | | $ | 1,014.57 | | | $ | 10.37 | | | | 2.07 | % | | | 182 | | | | 366 | |
| Class C | | $ | 1,000.00 | | | $ | 861.81 | | | $ | 8.84 | | | | $ | 1,000.00 | | | $ | 1,015.37 | | | $ | 9.57 | | | | 1.91 | % | | | 182 | | | | 366 | |
| Class I | | $ | 1,000.00 | | | $ | 866.78 | | | $ | 3.97 | | | | $ | 1,000.00 | | | $ | 1,020.62 | | | $ | 4.29 | | | | 0.85 | % | | | 182 | | | | 366 | |
| Class L | | $ | 1,000.00 | | | $ | 865.26 | | | $ | 4.64 | | | | $ | 1,000.00 | | | $ | 1,019.89 | | | $ | 5.02 | | | | 1.00 | % | | | 182 | | | | 366 | |
| Class R3 | | $ | 1,000.00 | | | $ | 863.14 | | | $ | 6.90 | | | | $ | 1,000.00 | | | $ | 1,017.45 | | | $ | 7.47 | | | | 1.49 | % | | | 182 | | | | 366 | |
| Class R4 | | $ | 1,000.00 | | | $ | 864.67 | | | $ | 5.42 | | | | $ | 1,000.00 | | | $ | 1,019.05 | | | $ | 5.87 | | | | 1.17 | % | | | 182 | | | | 366 | |
| Class R5 | | $ | 1,000.00 | | | $ | 865.50 | | | $ | 4.22 | | | | $ | 1,000.00 | | | $ | 1,020.34 | | | $ | 4.57 | | | | 0.91 | % | | | 182 | | | | 366 | |
| Class Y | | $ | 1,000.00 | | | $ | 866.14 | | | $ | 3.57 | | | | $ | 1,000.00 | | | $ | 1,021.03 | | | $ | 3.87 | | | | 0.77 | % | | | 182 | | | | 366 | |
The Hartford High Yield Fund | | | | | | | | | | | | | | | | | | | | | | | | | |
| Class A | | $ | 1,000.00 | | | $ | 978.97 | | | $ | 5.66 | | | | $ | 1,000.00 | | | $ | 1,019.14 | | | $ | 5.77 | | | | 1.15 | % | | | 182 | | | | 366 | |
| Class B | | $ | 1,000.00 | | | $ | 974.06 | | | $ | 9.28 | | | | $ | 1,000.00 | | | $ | 1,015.47 | | | $ | 9.47 | | | | 1.89 | % | | | 182 | | | | 366 | |
| Class C | | $ | 1,000.00 | | | $ | 975.31 | | | $ | 9.33 | | | | $ | 1,000.00 | | | $ | 1,015.42 | | | $ | 9.52 | | | | 1.90 | % | | | 182 | | | | 366 | |
| Class I | | $ | 1,000.00 | | | $ | 979.25 | | | $ | 3.43 | | | | $ | 1,000.00 | | | $ | 1,017.43 | | | $ | 3.50 | | | | 0.83 | % | | | 153 | | | | 366 | |
| Class R3 | | $ | 1,000.00 | | | $ | 976.49 | | | $ | 6.88 | | | | $ | 1,000.00 | | | $ | 1,017.90 | | | $ | 7.02 | | | | 1.40 | % | | | 182 | | | | 366 | |
| Class R4 | | $ | 1,000.00 | | | $ | 978.00 | | | $ | 5.41 | | | | $ | 1,000.00 | | | $ | 1,019.39 | | | $ | 5.52 | | | | 1.10 | % | | | 182 | | | | 366 | |
| Class R5 | | $ | 1,000.00 | | | $ | 979.02 | | | $ | 4.43 | | | | $ | 1,000.00 | | | $ | 1,020.39 | | | $ | 4.52 | | | | 0.90 | % | | | 182 | | | | 366 | |
| Class Y | | $ | 1,000.00 | | | $ | 979.36 | | | $ | 4.04 | | | | $ | 1,000.00 | | | $ | 1,020.79 | | | $ | 4.12 | | | | 0.82 | % | | | 182 | | | | 366 | |
The Hartford High Yield Municipal Bond Fund | | | | | | | | | | | | | | | | | | | | | | | | | |
| Class A | | $ | 1,000.00 | | | $ | 952.35 | | | $ | 1.55 | | | | $ | 1,000.00 | | | $ | 1,023.27 | | | $ | 1.61 | | | | 0.32 | % | | | 182 | | | | 366 | |
| Class B | | $ | 1,000.00 | | | $ | 948.70 | | | $ | 5.33 | | | | $ | 1,000.00 | | | $ | 1,019.39 | | | $ | 5.52 | | | | 1.10 | % | | | 182 | | | | 366 | |
| Class C | | $ | 1,000.00 | | | $ | 949.79 | | | $ | 5.33 | | | | $ | 1,000.00 | | | $ | 1,019.39 | | | $ | 5.52 | | | | 1.10 | % | | | 182 | | | | 366 | |
| Class I | | $ | 1,000.00 | | | $ | 953.61 | | | $ | 0.44 | | | | $ | 1,000.00 | | | $ | 1,024.42 | | | $ | 0.45 | | | | 0.09 | % | | | 182 | | | | 366 | |
The Hartford Income Allocation Fund | | | | | | | | | | | | | | | | | | | | | | | | | |
| Class A | | $ | 1,000.00 | | | $ | 1,013.41 | | | $ | 2.80 | | | | $ | 1,000.00 | | | $ | 1,022.08 | | | $ | 2.82 | | | | 0.56 | % | | | 182 | | | | 366 | |
| Class B | | $ | 1,000.00 | | | $ | 1,010.68 | | | $ | 6.55 | | | | $ | 1,000.00 | | | $ | 1,018.35 | | | $ | 6.57 | | | | 1.31 | % | | | 182 | | | | 366 | |
| Class C | | $ | 1,000.00 | | | $ | 1,010.76 | | | $ | 6.55 | | | | $ | 1,000.00 | | | $ | 1,018.35 | | | $ | 6.57 | | | | 1.31 | % | | | 182 | | | | 366 | |
| Class I | | $ | 1,000.00 | | | $ | 1,015.69 | | | $ | 1.55 | | | | $ | 1,000.00 | | | $ | 1,023.32 | | | $ | 1.56 | | | | 0.31 | % | | | 182 | | | | 366 | |
| Class R3 | | $ | 1,000.00 | | | $ | 1,012.58 | | | $ | 4.75 | | | | $ | 1,000.00 | | | $ | 1,020.14 | | | $ | 4.77 | | | | 0.95 | % | | | 182 | | | | 366 | |
| Class R4 | | $ | 1,000.00 | | | $ | 1,013.94 | | | $ | 3.25 | | | | $ | 1,000.00 | | | $ | 1,021.63 | | | $ | 3.27 | | | | 0.65 | % | | | 182 | | | | 366 | |
| Class R5 | | $ | 1,000.00 | | | $ | 1,015.56 | | | $ | 1.75 | | | | $ | 1,000.00 | | | $ | 1,023.12 | | | $ | 1.76 | | | | 0.35 | % | | | 182 | | | | 366 | |
The Hartford Income Fund | | | | | | | | | | | | | | | | | | | | | | | | | |
| Class A | | $ | 1,000.00 | | | $ | 999.64 | | | $ | 4.72 | | | | $ | 1,000.00 | | | $ | 1,020.15 | | | $ | 4.76 | | | | 0.95 | % | | | 182 | | | | 366 | |
| Class B | | $ | 1,000.00 | | | $ | 995.91 | | | $ | 8.43 | | | | $ | 1,000.00 | | | $ | 1,016.41 | | | $ | 8.52 | | | | 1.70 | % | | | 182 | | | | 366 | |
| Class C | | $ | 1,000.00 | | | $ | 995.92 | | | $ | 8.44 | | | | $ | 1,000.00 | | | $ | 1,016.41 | | | $ | 8.52 | | | | 1.70 | % | | | 182 | | | | 366 | |
| Class Y | | $ | 1,000.00 | | | $ | 1,001.18 | | | $ | 3.08 | | | | $ | 1,000.00 | | | $ | 1,021.78 | | | $ | 3.12 | | | | 0.62 | % | | | 182 | | | | 366 | |
416
| | | | | | | | | | | | | | | | | | | | | | | | | | | | | | | | | | | | | | |
| | | Actual return | | | | Hypothetical (5% return before expenses) | | | | | | | | | | |
| | | | | | | | | Expenses paid
| | | | | | | | | | Expenses paid
| | | | | | | | | | |
| | | Beginning
| | | Ending
| | | during the period
| | | | Beginning
| | | Ending
| | | during the period
| | | | | | Days
| | | | |
| | | Account
| | | Account
| | | October 31, 2007
| | | | Account
| | | Account
| | | October 31, 2007
| | | Annualized
| | | in the
| | | Days
| |
| | | Value
| | | Value
| | | through
| | | | Value
| | | Value
| | | through
| | | expense
| | | current
| | | in the
| |
| | | October 31, 2007 | | | April 30, 2008 | | | April 30, 2008 | | | | October 31, 2007 | | | April 30, 2008 | | | April 30, 2008 | | | ratio | | | 1/2 year | | | full year | |
The Hartford Inflation Plus Fund | | | | | | | | | | | | | | | | | | | | | | | | | |
| Class A | | $ | 1,000.00 | | | $ | 1,072.60 | | | $ | 4.38 | | | | $ | 1,000.00 | | | $ | 1,020.64 | | | $ | 4.27 | | | | 0.85 | % | | | 182 | | | | 366 | |
| Class B | | $ | 1,000.00 | | | $ | 1,068.81 | | | $ | 8.23 | | | | $ | 1,000.00 | | | $ | 1,016.91 | | | $ | 8.02 | | | | 1.60 | % | | | 182 | | | | 366 | |
| Class C | | $ | 1,000.00 | | | $ | 1,068.86 | | | $ | 8.23 | | | | $ | 1,000.00 | | | $ | 1,016.91 | | | $ | 8.02 | | | | 1.60 | % | | | 182 | | | | 366 | |
| Class I | | $ | 1,000.00 | | | $ | 1,074.73 | | | $ | 3.15 | | | | $ | 1,000.00 | | | $ | 1,021.83 | | | $ | 3.07 | | | | 0.61 | % | | | 182 | | | | 366 | |
| Class R3 | | $ | 1,000.00 | | | $ | 1,070.45 | | | $ | 6.49 | | | | $ | 1,000.00 | | | $ | 1,018.60 | | | $ | 6.32 | | | | 1.26 | % | | | 182 | | | | 366 | |
| Class R4 | | $ | 1,000.00 | | | $ | 1,071.76 | | | $ | 5.17 | | | | $ | 1,000.00 | | | $ | 1,019.88 | | | $ | 5.04 | | | | 1.00 | % | | | 182 | | | | 366 | |
| Class R5 | | $ | 1,000.00 | | | $ | 1,073.07 | | | $ | 3.61 | | | | $ | 1,000.00 | | | $ | 1,021.38 | | | $ | 3.52 | | | | 0.70 | % | | | 182 | | | | 366 | |
| Class Y | | $ | 1,000.00 | | | $ | 1,073.92 | | | $ | 3.09 | | | | $ | 1,000.00 | | | $ | 1,021.88 | | | $ | 3.02 | | | | 0.60 | % | | | 182 | | | | 366 | |
The Hartford International Growth Fund | | | | | | | | | | | | | | | | | | | | | | | | | |
| Class A | | $ | 1,000.00 | | | $ | 828.93 | | | $ | 6.59 | | | | $ | 1,000.00 | | | $ | 1,017.65 | | | $ | 7.27 | | | | 1.45 | % | | | 182 | | | | 366 | |
| Class B | | $ | 1,000.00 | | | $ | 825.34 | | | $ | 10.35 | | | | $ | 1,000.00 | | | $ | 1,013.53 | | | $ | 11.41 | | | | 2.28 | % | | | 182 | | | | 366 | |
| Class C | | $ | 1,000.00 | | | $ | 825.63 | | | $ | 9.90 | | | | $ | 1,000.00 | | | $ | 1,014.02 | | | $ | 10.92 | | | | 2.18 | % | | | 182 | | | | 366 | |
| Class I | | $ | 1,000.00 | | | $ | 830.50 | | | $ | 4.92 | | | | $ | 1,000.00 | | | $ | 1,019.49 | | | $ | 5.42 | | | | 1.08 | % | | | 182 | | | | 366 | |
| Class R3 | | $ | 1,000.00 | | | $ | 827.30 | | | $ | 8.50 | | | | $ | 1,000.00 | | | $ | 1,015.56 | | | $ | 9.37 | | | | 1.87 | % | | | 182 | | | | 366 | |
| Class R4 | | $ | 1,000.00 | | | $ | 828.50 | | | $ | 7.05 | | | | $ | 1,000.00 | | | $ | 1,017.16 | | | $ | 7.77 | | | | 1.55 | % | | | 182 | | | | 366 | |
| Class R5 | | $ | 1,000.00 | | | $ | 830.25 | | | $ | 4.87 | | | | $ | 1,000.00 | | | $ | 1,019.54 | | | $ | 5.37 | | | | 1.07 | % | | | 182 | | | | 366 | |
| Class Y | | $ | 1,000.00 | | | $ | 830.54 | | | $ | 4.46 | | | | $ | 1,000.00 | | | $ | 1,019.99 | | | $ | 4.92 | | | | 0.98 | % | | | 182 | | | | 366 | |
The Hartford International Opportunities Fund | | | | | | | | | | | | | | | | | | | | | | | | | |
| Class A | | $ | 1,000.00 | | | $ | 920.58 | | | $ | 6.88 | | | | $ | 1,000.00 | | | $ | 1,017.70 | | | $ | 7.22 | | | | 1.44 | % | | | 182 | | | | 366 | |
| Class B | | $ | 1,000.00 | | | $ | 917.49 | | | $ | 10.30 | | | | $ | 1,000.00 | | | $ | 1,014.12 | | | $ | 10.82 | | | | 2.16 | % | | | 182 | | | | 366 | |
| Class C | | $ | 1,000.00 | | | $ | 917.75 | | | $ | 10.35 | | | | $ | 1,000.00 | | | $ | 1,014.07 | | | $ | 10.87 | | | | 2.17 | % | | | 182 | | | | 366 | |
| Class R3 | | $ | 1,000.00 | | | $ | 919.18 | | | $ | 8.49 | | | | $ | 1,000.00 | | | $ | 1,016.01 | | | $ | 8.92 | | | | 1.78 | % | | | 182 | | | | 366 | |
| Class R4 | | $ | 1,000.00 | | | $ | 922.38 | | | $ | 6.64 | | | | $ | 1,000.00 | | | $ | 1,017.95 | | | $ | 6.97 | | | | 1.39 | % | | | 182 | | | | 366 | |
| Class R5 | | $ | 1,000.00 | | | $ | 922.48 | | | $ | 4.96 | | | | $ | 1,000.00 | | | $ | 1,019.70 | | | $ | 5.21 | | | | 1.04 | % | | | 182 | | | | 366 | |
| Class Y | | $ | 1,000.00 | | | $ | 922.86 | | | $ | 4.45 | | | | $ | 1,000.00 | | | $ | 1,020.24 | | | $ | 4.67 | | | | 0.93 | % | | | 182 | | | | 366 | |
The Hartford International Small Company Fund | | | | | | | | | | | | | | | | | | | | | | | | | |
| Class A | | $ | 1,000.00 | | | $ | 881.74 | | | $ | 6.92 | | | | $ | 1,000.00 | | | $ | 1,017.50 | | | $ | 7.42 | | | | 1.48 | % | | | 182 | | | | 366 | |
| Class B | | $ | 1,000.00 | | | $ | 878.49 | | | $ | 10.23 | | | | $ | 1,000.00 | | | $ | 1,013.97 | | | $ | 10.97 | | | | 2.19 | % | | | 182 | | | | 366 | |
| Class C | | $ | 1,000.00 | | | $ | 878.73 | | | $ | 10.42 | | | | $ | 1,000.00 | | | $ | 1,013.77 | | | $ | 11.17 | | | | 2.23 | % | | | 182 | | | | 366 | |
| Class I | | $ | 1,000.00 | | | $ | 883.28 | | | $ | 4.53 | | | | $ | 1,000.00 | | | $ | 1,016.09 | | | $ | 4.85 | | | | 1.15 | % | | | 153 | | | | 366 | |
| Class Y | | $ | 1,000.00 | | | $ | 883.96 | | | $ | 4.68 | | | | $ | 1,000.00 | | | $ | 1,019.89 | | | $ | 5.02 | | | | 1.00 | % | | | 182 | | | | 366 | |
The Hartford LargeCap Growth Fund | | | | | | | | | | | | | | | | | | | | | | | | | |
| Class A | | $ | 1,000.00 | | | $ | 868.50 | | | $ | 5.81 | | | | $ | 1,000.00 | | | $ | 1,018.65 | | | $ | 6.27 | | | | 1.25 | % | | | 182 | | | | 366 | |
| Class B | | $ | 1,000.00 | | | $ | 864.76 | | | $ | 9.27 | | | | $ | 1,000.00 | | | $ | 1,014.92 | | | $ | 10.02 | | | | 2.00 | % | | | 182 | | | | 366 | |
| Class C | | $ | 1,000.00 | | | $ | 865.67 | | | $ | 9.28 | | | | $ | 1,000.00 | | | $ | 1,014.92 | | | $ | 10.02 | | | | 2.00 | % | | | 182 | | | | 366 | |
| Class Y | | $ | 1,000.00 | | | $ | 870.57 | | | $ | 3.95 | | | | $ | 1,000.00 | | | $ | 1,020.64 | | | $ | 4.27 | | | | 0.85 | % | | | 182 | | | | 366 | |
The Hartford MidCap Fund | | | | | | | | | | | | | | | | | | | | | | | | | |
| Class A | | $ | 1,000.00 | | | $ | 931.43 | | | $ | 5.91 | | | | $ | 1,000.00 | | | $ | 1,018.75 | | | $ | 6.17 | | | | 1.23 | % | | | 182 | | | | 366 | |
| Class B | | $ | 1,000.00 | | | $ | 927.81 | | | $ | 9.59 | | | | $ | 1,000.00 | | | $ | 1,014.92 | | | $ | 10.02 | | | | 2.00 | % | | | 182 | | | | 366 | |
| Class C | | $ | 1,000.00 | | | $ | 927.93 | | | $ | 9.20 | | | | $ | 1,000.00 | | | $ | 1,015.32 | | | $ | 9.62 | | | | 1.92 | % | | | 182 | | | | 366 | |
| Class Y | | $ | 1,000.00 | | | $ | 933.67 | | | $ | 3.85 | | | | $ | 1,000.00 | | | $ | 1,020.89 | | | $ | 4.02 | | | | 0.80 | % | | | 182 | | | | 366 | |
The Hartford MidCap Growth Fund | | | | | | | | | | | | | | | | | | | | | | | | | |
| Class A | | $ | 1,000.00 | | | $ | 879.06 | | | $ | 6.26 | | | | $ | 1,000.00 | | | $ | 1,018.20 | | | $ | 6.72 | | | | 1.34 | % | | | 182 | | | | 366 | |
| Class B | | $ | 1,000.00 | | | $ | 876.64 | | | $ | 8.63 | | | | $ | 1,000.00 | | | $ | 1,015.66 | | | $ | 9.27 | | | | 1.85 | % | | | 182 | | | | 366 | |
| Class C | | $ | 1,000.00 | | | $ | 875.28 | | | $ | 9.33 | | | | $ | 1,000.00 | | | $ | 1,014.92 | | | $ | 10.02 | | | | 2.00 | % | | | 182 | | | | 366 | |
| Class Y | | $ | 1,000.00 | | | $ | 879.80 | | | $ | 4.44 | | | | $ | 1,000.00 | | | $ | 1,020.14 | | | $ | 4.77 | | | | 0.95 | % | | | 182 | | | | 366 | |
The Hartford MidCap Value Fund | | | | | | | | | | | | | | | | | | | | | | | | | |
| Class A | | $ | 1,000.00 | | | $ | 822.99 | | | $ | 6.35 | | | | $ | 1,000.00 | | | $ | 1,017.90 | | | $ | 7.02 | | | | 1.40 | % | | | 182 | | | | 366 | |
| Class B | | $ | 1,000.00 | | | $ | 820.35 | | | $ | 9.50 | | | | $ | 1,000.00 | | | $ | 1,014.42 | | | $ | 10.52 | | | | 2.10 | % | | | 182 | | | | 366 | |
| Class C | | $ | 1,000.00 | | | $ | 819.62 | | | $ | 9.68 | | | | $ | 1,000.00 | | | $ | 1,014.22 | | | $ | 10.72 | | | | 2.14 | % | | | 182 | | | | 366 | |
| Class Y | | $ | 1,000.00 | | | $ | 824.16 | | | $ | 4.26 | | | | $ | 1,000.00 | | | $ | 1,020.19 | | | $ | 4.72 | | | | 0.94 | % | | | 182 | | | | 366 | |
The Hartford Money Market Fund | | | | | | | | | | | | | | | | | | | | | | | | | |
| Class A | | $ | 1,000.00 | | | $ | 1,015.44 | | | $ | 4.51 | | | | $ | 1,000.00 | | | $ | 1,020.39 | | | $ | 4.52 | | | | 0.90 | % | | | 182 | | | | 366 | |
| Class B | | $ | 1,000.00 | | | $ | 1,011.67 | | | $ | 8.25 | | | | $ | 1,000.00 | | | $ | 1,016.66 | | | $ | 8.27 | | | | 1.65 | % | | | 182 | | | | 366 | |
| Class C | | $ | 1,000.00 | | | $ | 1,012.09 | | | $ | 7.80 | | | | $ | 1,000.00 | | | $ | 1,017.11 | | | $ | 7.82 | | | | 1.56 | % | | | 182 | | | | 366 | |
| Class R3 | | $ | 1,000.00 | | | $ | 1,014.30 | | | $ | 5.76 | | | | $ | 1,000.00 | | | $ | 1,019.14 | | | $ | 5.77 | | | | 1.15 | % | | | 182 | | | | 366 | |
| Class R4 | | $ | 1,000.00 | | | $ | 1,015.73 | | | $ | 4.26 | | | | $ | 1,000.00 | | | $ | 1,020.64 | | | $ | 4.27 | | | | 0.85 | % | | | 182 | | | | 366 | |
| Class R5 | | $ | 1,000.00 | | | $ | 1,016.89 | | | $ | 3.06 | | | | $ | 1,000.00 | | | $ | 1,021.83 | | | $ | 3.07 | | | | 0.61 | % | | | 182 | | | | 366 | |
| Class Y | | $ | 1,000.00 | | | $ | 1,017.37 | | | $ | 2.56 | | | | $ | 1,000.00 | | | $ | 1,022.33 | | | $ | 2.56 | | | | 0.51 | % | | | 182 | | | | 366 | |
417
The Hartford Mutual Funds, Inc. and The Hartford Mutual Funds II, Inc.
Expense Example — (continued)
| | | | | | | | | | | | | | | | | | | | | | | | | | | | | | | | | | | | | | |
| | | Actual return | | | | Hypothetical (5% return before expenses) | | | | | | | | | | |
| | | | | | | | | Expenses paid
| | | | | | | | | | Expenses paid
| | | | | | | | | | |
| | | Beginning
| | | Ending
| | | during the period
| | | | Beginning
| | | Ending
| | | during the period
| | | | | | Days
| | | | |
| | | Account
| | | Account
| | | October 31, 2007
| | | | Account
| | | Account
| | | October 31, 2007
| | | Annualized
| | | in the
| | | Days
| |
| | | Value
| | | Value
| | | through
| | | | Value
| | | Value
| | | through
| | | expense
| | | current
| | | in the
| |
| | | October 31, 2007 | | | April 30, 2008 | | | April 30, 2008 | | | | October 31, 2007 | | | April 30, 2008 | | | April 30, 2008 | | | ratio | | | 1/2 year | | | full year | |
The Hartford Retirement Income Fund | | | | | | | | | | | | | | | | | | | | | | | | | |
| Class A | | $ | 1,000.00 | | | $ | 983.37 | | | $ | 2.42 | | | | $ | 1,000.00 | | | $ | 1,022.43 | | | $ | 2.46 | | | | 0.49 | % | | | 182 | | | | 366 | |
| Class B | | $ | 1,000.00 | | | $ | 979.81 | | | $ | 6.10 | | | | $ | 1,000.00 | | | $ | 1,018.70 | | | $ | 6.22 | | | | 1.24 | % | | | 182 | | | | 366 | |
| Class C | | $ | 1,000.00 | | | $ | 980.16 | | | $ | 6.15 | | | | $ | 1,000.00 | | | $ | 1,018.65 | | | $ | 6.27 | | | | 1.25 | % | | | 182 | | | | 366 | |
| Class R3 | | $ | 1,000.00 | | | $ | 980.68 | | | $ | 4.38 | | | | $ | 1,000.00 | | | $ | 1,020.44 | | | $ | 4.47 | | | | 0.89 | % | | | 182 | | | | 366 | |
| Class R4 | | $ | 1,000.00 | | | $ | 983.12 | | | $ | 2.96 | | | | $ | 1,000.00 | | | $ | 1,021.88 | | | $ | 3.02 | | | | 0.60 | % | | | 182 | | | | 366 | |
| Class R5 | | $ | 1,000.00 | | | $ | 985.45 | | | $ | 1.43 | | | | $ | 1,000.00 | | | $ | 1,023.42 | | | $ | 1.46 | | | | 0.29 | % | | | 182 | | | | 366 | |
| Class Y | | $ | 1,000.00 | | | $ | 985.04 | | | $ | 0.64 | | | | $ | 1,000.00 | | | $ | 1,024.22 | | | $ | 0.65 | | | | 0.13 | % | | | 182 | | | | 366 | |
The Hartford Select MidCap Value Fund | | | | | | | | | | | | | | | | | | | | | | | | | |
| Class A | | $ | 1,000.00 | | | $ | 881.36 | | | $ | 6.08 | | | | $ | 1,000.00 | | | $ | 1,018.40 | | | $ | 6.52 | | | | 1.30 | % | | | 182 | | | | 366 | |
| Class B | | $ | 1,000.00 | | | $ | 879.01 | | | $ | 8.46 | | | | $ | 1,000.00 | | | $ | 1,015.86 | | | $ | 9.07 | | | | 1.81 | % | | | 182 | | | | 366 | |
| Class C | | $ | 1,000.00 | | | $ | 877.96 | | | $ | 9.43 | | | | $ | 1,000.00 | | | $ | 1,014.82 | | | $ | 10.12 | | | | 2.02 | % | | | 182 | | | | 366 | |
| Class Y | | $ | 1,000.00 | | | $ | 883.40 | | | $ | 4.07 | | | | $ | 1,000.00 | | | $ | 1,020.54 | | | $ | 4.37 | | | | 0.87 | % | | | 182 | | | | 366 | |
The Hartford Select SmallCap Value Fund | | | | | | | | | | | | | | | | | | | | | | | | | |
| Class A | | $ | 1,000.00 | | | $ | 844.04 | | | $ | 6.42 | | | | $ | 1,000.00 | | | $ | 1,017.90 | | | $ | 7.02 | | | | 1.40 | % | | | 182 | | | | 366 | |
| Class B | | $ | 1,000.00 | | | $ | 840.62 | | | $ | 10.39 | | | | $ | 1,000.00 | | | $ | 1,013.58 | | | $ | 11.36 | | | | 2.27 | % | | | 182 | | | | 366 | |
| Class C | | $ | 1,000.00 | | | $ | 840.77 | | | $ | 10.34 | | | | $ | 1,000.00 | | | $ | 1,013.63 | | | $ | 11.31 | | | | 2.26 | % | | | 182 | | | | 366 | |
| Class Y | | $ | 1,000.00 | | | $ | 845.66 | | | $ | 5.00 | | | | $ | 1,000.00 | | | $ | 1,019.44 | | | $ | 5.47 | | | | 1.09 | % | | | 182 | | | | 366 | |
The Hartford Short Duration Fund | | | | | | | | | | | | | | | | | | | | | | | | | |
| Class A | | $ | 1,000.00 | | | $ | 992.87 | | | $ | 4.46 | | | | $ | 1,000.00 | | | $ | 1,020.39 | | | $ | 4.52 | | | | 0.90 | % | | | 182 | | | | 366 | |
| Class B | | $ | 1,000.00 | | | $ | 989.17 | | | $ | 8.16 | | | | $ | 1,000.00 | | | $ | 1,016.66 | | | $ | 8.27 | | | | 1.65 | % | | | 182 | | | | 366 | |
| Class C | | $ | 1,000.00 | | | $ | 990.19 | | | $ | 8.16 | | | | $ | 1,000.00 | | | $ | 1,016.67 | | | $ | 8.27 | | | | 1.65 | % | | | 182 | | | | 366 | |
| Class Y | | $ | 1,000.00 | | | $ | 994.40 | | | $ | 2.88 | | | | $ | 1,000.00 | | | $ | 1,021.98 | | | $ | 2.92 | | | | 0.58 | % | | | 182 | | | | 366 | |
The Hartford Small Company Fund | | | | | | | | | | | | | | | | | | | | | | | | | |
| Class A | | $ | 1,000.00 | | | $ | 864.24 | | | $ | 6.40 | | | | $ | 1,000.00 | | | $ | 1,018.00 | | | $ | 6.92 | | | | 1.38 | % | | | 182 | | | | 366 | |
| Class B | | $ | 1,000.00 | | | $ | 861.53 | | | $ | 9.49 | | | | $ | 1,000.00 | | | $ | 1,014.67 | | | $ | 10.27 | | | | 2.05 | % | | | 182 | | | | 366 | |
| Class C | | $ | 1,000.00 | | | $ | 860.70 | | | $ | 9.90 | | | | $ | 1,000.00 | | | $ | 1,014.22 | | | $ | 10.72 | | | | 2.14 | % | | | 182 | | | | 366 | |
| Class I | | $ | 1,000.00 | | | $ | 865.70 | | | $ | 4.92 | | | | $ | 1,000.00 | | | $ | 1,019.59 | | | $ | 5.32 | | | | 1.06 | % | | | 182 | | | | 366 | |
| Class R3 | | $ | 1,000.00 | | | $ | 863.18 | | | $ | 7.64 | | | | $ | 1,000.00 | | | $ | 1,016.66 | | | $ | 8.27 | | | | 1.65 | % | | | 182 | | | | 366 | |
| Class R4 | | $ | 1,000.00 | | | $ | 864.54 | | | $ | 5.98 | | | | $ | 1,000.00 | | | $ | 1,018.45 | | | $ | 6.47 | | | | 1.29 | % | | | 182 | | | | 366 | |
| Class R5 | | $ | 1,000.00 | | | $ | 865.74 | | | $ | 4.59 | | | | $ | 1,000.00 | | | $ | 1,019.94 | | | $ | 4.97 | | | | 0.99 | % | | | 182 | | | | 366 | |
| Class Y | | $ | 1,000.00 | | | $ | 866.34 | | | $ | 4.13 | | | | $ | 1,000.00 | | | $ | 1,020.44 | | | $ | 4.47 | | | | 0.89 | % | | | 182 | | | | 366 | |
The Hartford SmallCap Growth Fund | | | | | | | | | | | | | | | | | | | | | | | | | |
| Class A | | $ | 1,000.00 | | | $ | 858.22 | | | $ | 5.82 | | | | $ | 1,000.00 | | | $ | 1,018.60 | | | $ | 6.32 | | | | 1.26 | % | | | 182 | | | | 366 | |
| Class B | | $ | 1,000.00 | | | $ | 856.10 | | | $ | 8.54 | | | | $ | 1,000.00 | | | $ | 1,015.66 | | | $ | 9.27 | | | | 1.85 | % | | | 182 | | | | 366 | |
| Class C | | $ | 1,000.00 | | | $ | 854.55 | | | $ | 9.73 | | | | $ | 1,000.00 | | | $ | 1,014.37 | | | $ | 10.57 | | | | 2.11 | % | | | 182 | | | | 366 | |
| Class I | | $ | 1,000.00 | | | $ | 858.87 | | | $ | 5.36 | | | | $ | 1,000.00 | | | $ | 1,019.10 | | | $ | 5.82 | | | | 1.16 | % | | | 182 | | | | 366 | |
| Class L | | $ | 1,000.00 | | | $ | 858.86 | | | $ | 5.27 | | | | $ | 1,000.00 | | | $ | 1,019.19 | | | $ | 5.72 | | | | 1.14 | % | | | 182 | | | | 366 | |
| Class R3 | | $ | 1,000.00 | | | $ | 857.97 | | | $ | 6.56 | | | | $ | 1,000.00 | | | $ | 1,017.80 | | | $ | 7.12 | | | | 1.42 | % | | | 182 | | | | 366 | |
| Class R4 | | $ | 1,000.00 | | | $ | 858.15 | | | $ | 5.91 | | | | $ | 1,000.00 | | | $ | 1,018.50 | | | $ | 6.42 | | | | 1.28 | % | | | 182 | | | | 366 | |
| Class R5 | | $ | 1,000.00 | | | $ | 859.44 | | | $ | 4.72 | | | | $ | 1,000.00 | | | $ | 1,019.79 | | | $ | 5.12 | | | | 1.02 | % | | | 182 | | | | 366 | |
| Class Y | | $ | 1,000.00 | | | $ | 859.98 | | | $ | 4.16 | | | | $ | 1,000.00 | | | $ | 1,020.39 | | | $ | 4.52 | | | | 0.90 | % | | | 182 | | | | 366 | |
The Hartford Stock Fund | | | | | | | | | | | | | | | | | | | | | | | | | |
| Class A | | $ | 1,000.00 | | | $ | 878.45 | | | $ | 5.70 | | | | $ | 1,000.00 | | | $ | 1,018.80 | | | $ | 6.12 | | | | 1.22 | % | | | 182 | | | | 366 | |
| Class B | | $ | 1,000.00 | | | $ | 874.39 | | | $ | 9.93 | | | | $ | 1,000.00 | | | $ | 1,014.27 | | | $ | 10.67 | | | | 2.13 | % | | | 182 | | | | 366 | |
| Class C | | $ | 1,000.00 | | | $ | 874.62 | | | $ | 9.55 | | | | $ | 1,000.00 | | | $ | 1,014.67 | | | $ | 10.27 | | | | 2.05 | % | | | 182 | | | | 366 | |
| Class R3 | | $ | 1,000.00 | | | $ | 876.90 | | | $ | 7.00 | | | | $ | 1,000.00 | | | $ | 1,017.40 | | | $ | 7.52 | | | | 1.50 | % | | | 182 | | | | 366 | |
| Class R4 | | $ | 1,000.00 | | | $ | 878.18 | | | $ | 5.60 | | | | $ | 1,000.00 | | | $ | 1,018.90 | | | $ | 6.02 | | | | 1.20 | % | | | 182 | | | | 366 | |
| Class R5 | | $ | 1,000.00 | | | $ | 879.56 | | | $ | 4.21 | | | | $ | 1,000.00 | | | $ | 1,020.39 | | | $ | 4.52 | | | | 0.90 | % | | | 182 | | | | 366 | |
| Class Y | | $ | 1,000.00 | | | $ | 880.17 | | | $ | 3.79 | | | | $ | 1,000.00 | | | $ | 1,020.84 | | | $ | 4.07 | | | | 0.81 | % | | | 182 | | | | 366 | |
The Hartford Strategic Income Fund | | | | | | | | | | | | | | | | | | | | | | | | | |
| Class A | | $ | 1,000.00 | | | $ | 1,008.84 | | | $ | 2.05 | | | | $ | 1,000.00 | | | $ | 1,022.82 | | | $ | 2.06 | | | | 0.41 | % | | | 182 | | | | 366 | |
| Class B | | $ | 1,000.00 | | | $ | 1,006.03 | | | $ | 5.94 | | | | $ | 1,000.00 | | | $ | 1,018.95 | | | $ | 5.97 | | | | 1.19 | % | | | 182 | | | | 366 | |
| Class C | | $ | 1,000.00 | | | $ | 1,006.08 | | | $ | 5.84 | | | | $ | 1,000.00 | | | $ | 1,019.05 | | | $ | 5.87 | | | | 1.17 | % | | | 182 | | | | 366 | |
| Class I | | $ | 1,000.00 | | | $ | 1,011.11 | | | $ | 0.85 | | | | $ | 1,000.00 | | | $ | 1,024.02 | | | $ | 0.86 | | | | 0.17 | % | | | 182 | | | | 366 | |
| Class Y | | $ | 1,000.00 | | | $ | 1,010.23 | | | $ | 0.50 | | | | $ | 1,000.00 | | | $ | 1,024.37 | | | $ | 0.50 | | | | 0.10 | % | | | 182 | | | | 366 | |
418
| | | | | | | | | | | | | | | | | | | | | | | | | | | | | | | | | | | | | | |
| | | Actual return | | | | Hypothetical (5% return before expenses) | | | | | | | | | | |
| | | | | | | | | Expenses paid
| | | | | | | | | | Expenses paid
| | | | | | | | | | |
| | | Beginning
| | | Ending
| | | during the period
| | | | Beginning
| | | Ending
| | | during the period
| | | | | | Days
| | | | |
| | | Account
| | | Account
| | | October 31, 2007
| | | | Account
| | | Account
| | | October 31, 2007
| | | Annualized
| | | in the
| | | Days
| |
| | | Value
| | | Value
| | | through
| | | | Value
| | | Value
| | | through
| | | expense
| | | current
| | | in the
| |
| | | October 31, 2007 | | | April 30, 2008 | | | April 30, 2008 | | | | October 31, 2007 | | | April 30, 2008 | | | April 30, 2008 | | | ratio | | | 1/2 year | | | full year | |
The Hartford Target Retirement 2010 Fund | | | | | | | | | | | | | | | | | | | | | | | | | |
| Class A | | $ | 1,000.00 | | | $ | 972.11 | | | $ | 2.50 | | | | $ | 1,000.00 | | | $ | 1,022.33 | | | $ | 2.56 | | | | 0.51 | % | | | 182 | | | | 366 | |
| Class B | | $ | 1,000.00 | | | $ | 969.51 | | | $ | 6.17 | | | | $ | 1,000.00 | | | $ | 1,018.60 | | | $ | 6.32 | | | | 1.26 | % | | | 182 | | | | 366 | |
| Class C | | $ | 1,000.00 | | | $ | 968.37 | | | $ | 6.12 | | | | $ | 1,000.00 | | | $ | 1,018.65 | | | $ | 6.27 | | | | 1.25 | % | | | 182 | | | | 366 | |
| Class R3 | | $ | 1,000.00 | | | $ | 970.14 | | | $ | 4.41 | | | | $ | 1,000.00 | | | $ | 1,020.39 | | | $ | 4.52 | | | | 0.90 | % | | | 182 | | | | 366 | |
| Class R4 | | $ | 1,000.00 | | | $ | 972.16 | | | $ | 2.99 | | | | $ | 1,000.00 | | | $ | 1,021.83 | | | $ | 3.07 | | | | 0.61 | % | | | 182 | | | | 366 | |
| Class R5 | | $ | 1,000.00 | | | $ | 972.26 | | | $ | 1.57 | | | | $ | 1,000.00 | | | $ | 1,023.27 | | | $ | 1.61 | | | | 0.32 | % | | | 182 | | | | 366 | |
| Class Y | | $ | 1,000.00 | | | $ | 974.62 | | | $ | 0.74 | | | | $ | 1,000.00 | | | $ | 1,024.12 | | | $ | 0.75 | | | | 0.15 | % | | | 182 | | | | 366 | |
The Hartford Target Retirement 2020 Fund | | | | | | | | | | | | | | | | | | | | | | | | | |
| Class A | | $ | 1,000.00 | | | $ | 949.00 | | | $ | 2.52 | | | | $ | 1,000.00 | | | $ | 1,022.28 | | | $ | 2.62 | | | | 0.52 | % | | | 182 | | | | 366 | |
| Class B | | $ | 1,000.00 | | | $ | 945.60 | | | $ | 6.05 | | | | $ | 1,000.00 | | | $ | 1,018.65 | | | $ | 6.27 | | | | 1.25 | % | | | 182 | | | | 366 | |
| Class C | | $ | 1,000.00 | | | $ | 945.50 | | | $ | 6.15 | | | | $ | 1,000.00 | | | $ | 1,018.55 | | | $ | 6.38 | | | | 1.27 | % | | | 182 | | | | 366 | |
| Class R3 | | $ | 1,000.00 | | | $ | 947.89 | | | $ | 4.41 | | | | $ | 1,000.00 | | | $ | 1,020.34 | | | $ | 4.57 | | | | 0.91 | % | | | 182 | | | | 366 | |
| Class R4 | | $ | 1,000.00 | | | $ | 948.81 | | | $ | 3.00 | | | | $ | 1,000.00 | | | $ | 1,021.78 | | | $ | 3.12 | | | | 0.62 | % | | | 182 | | | | 366 | |
| Class R5 | | $ | 1,000.00 | | | $ | 949.97 | | | $ | 1.55 | | | | $ | 1,000.00 | | | $ | 1,023.27 | | | $ | 1.61 | | | | 0.32 | % | | | 182 | | | | 366 | |
| Class Y | | $ | 1,000.00 | | | $ | 951.44 | | | $ | 0.78 | | | | $ | 1,000.00 | | | $ | 1,024.07 | | | $ | 0.81 | | | | 0.16 | % | | | 182 | | | | 366 | |
The Hartford Target Retirement 2030 Fund | | | | | | | | | | | | | | | | | | | | | | | | | |
| Class A | | $ | 1,000.00 | | | $ | 931.51 | | | $ | 2.64 | | | | $ | 1,000.00 | | | $ | 1,022.13 | | | $ | 2.77 | | | | 0.55 | % | | | 182 | | | | 366 | |
| Class B | | $ | 1,000.00 | | | $ | 929.58 | | | $ | 5.61 | | | | $ | 1,000.00 | | | $ | 1,019.05 | | | $ | 5.87 | | | | 1.17 | % | | | 182 | | | | 366 | |
| Class C | | $ | 1,000.00 | | | $ | 928.53 | | | $ | 6.04 | | | | $ | 1,000.00 | | | $ | 1,018.60 | | | $ | 6.32 | | | | 1.26 | % | | | 182 | | | | 366 | |
| Class R3 | | $ | 1,000.00 | | | $ | 929.74 | | | $ | 4.56 | | | | $ | 1,000.00 | | | $ | 1,020.14 | | | $ | 4.77 | | | | 0.95 | % | | | 182 | | | | 366 | |
| Class R4 | | $ | 1,000.00 | | | $ | 930.84 | | | $ | 3.12 | | | | $ | 1,000.00 | | | $ | 1,021.63 | | | $ | 3.27 | | | | 0.65 | % | | | 182 | | | | 366 | |
| Class R5 | | $ | 1,000.00 | | | $ | 930.80 | | | $ | 1.68 | | | | $ | 1,000.00 | | | $ | 1,023.12 | | | $ | 1.76 | | | | 0.35 | % | | | 182 | | | | 366 | |
| Class Y | | $ | 1,000.00 | | | $ | 933.70 | | | $ | 12.02 | | | | $ | 1,000.00 | | | $ | 1,012.43 | | | $ | 12.51 | | | | 2.50 | % | | | 182 | | | | 366 | |
The Hartford Tax-Free California Fund | | | | | | | | | | | | | | | | | | | | | | | | | |
| Class A | | $ | 1,000.00 | | | $ | 963.53 | | | $ | 4.15 | | | | $ | 1,000.00 | | | $ | 1,020.64 | | | $ | 4.27 | | | | 0.85 | % | | | 182 | | | | 366 | |
| Class B | | $ | 1,000.00 | | | $ | 958.87 | | | $ | 7.79 | | | | $ | 1,000.00 | | | $ | 1,016.91 | | | $ | 8.02 | | | | 1.60 | % | | | 182 | | | | 366 | |
| Class C | | $ | 1,000.00 | | | $ | 959.92 | | | $ | 7.79 | | | | $ | 1,000.00 | | | $ | 1,016.92 | | | $ | 8.01 | | | | 1.60 | % | | | 182 | | | | 366 | |
The Hartford Tax-Free Minnesota Fund | | | | | | | | | | | | | | | | | | | | | | | | | |
| Class A | | $ | 1,000.00 | | | $ | 999.99 | | | $ | 4.23 | | | | $ | 1,000.00 | | | $ | 1,020.64 | | | $ | 4.27 | | | | 0.85 | % | | | 182 | | | | 366 | |
| Class B | | $ | 1,000.00 | | | $ | 995.25 | | | $ | 7.94 | | | | $ | 1,000.00 | | | $ | 1,016.91 | | | $ | 8.02 | | | | 1.60 | % | | | 182 | | | | 366 | |
| Class C | | $ | 1,000.00 | | | $ | 996.26 | | | $ | 7.92 | | | | $ | 1,000.00 | | | $ | 1,016.92 | | | $ | 8.01 | | | | 1.60 | % | | | 182 | | | | 366 | |
| Class L | | $ | 1,000.00 | | | $ | 998.73 | | | $ | 4.47 | | | | $ | 1,000.00 | | | $ | 1,020.39 | | | $ | 4.52 | | | | 0.90 | % | | | 182 | | | | 366 | |
| Class Y | | $ | 1,000.00 | | | $ | 1,000.82 | | | $ | 3.43 | | | | $ | 1,000.00 | | | $ | 1,021.43 | | | $ | 3.47 | | | | 0.69 | % | | | 182 | | | | 366 | |
The Hartford Tax-Free National Fund | | | | | | | | | | | | | | | | | | | | | | | | | |
| Class A | | $ | 1,000.00 | | | $ | 969.90 | | | $ | 4.16 | | | | $ | 1,000.00 | | | $ | 1,020.64 | | | $ | 4.27 | | | | 0.85 | % | | | 182 | | | | 366 | |
| Class B | | $ | 1,000.00 | | | $ | 966.98 | | | $ | 7.82 | | | | $ | 1,000.00 | | | $ | 1,016.91 | | | $ | 8.02 | | | | 1.60 | % | | | 182 | | | | 366 | |
| Class C | | $ | 1,000.00 | | | $ | 967.06 | | | $ | 7.82 | | | | $ | 1,000.00 | | | $ | 1,016.91 | | | $ | 8.02 | | | | 1.60 | % | | | 182 | | | | 366 | |
| Class I | | $ | 1,000.00 | | | $ | 971.18 | | | $ | 2.94 | | | | $ | 1,000.00 | | | $ | 1,021.88 | | | $ | 3.02 | | | | 0.60 | % | | | 182 | | | | 366 | |
| Class L | | $ | 1,000.00 | | | $ | 970.07 | | | $ | 3.92 | | | | $ | 1,000.00 | | | $ | 1,020.89 | | | $ | 4.02 | | | | 0.80 | % | | | 182 | | | | 366 | |
| Class Y | | $ | 1,000.00 | | | $ | 971.07 | | | $ | 2.94 | | | | $ | 1,000.00 | | | $ | 1,021.88 | | | $ | 3.02 | | | | 0.60 | % | | | 182 | | | | 366 | |
The Hartford Tax-Free New York Fund | | | | | | | | | | | | | | | | | | | | | | | | | |
| Class A | | $ | 1,000.00 | | | $ | 992.88 | | | $ | 4.21 | | | | $ | 1,000.00 | | | $ | 1,020.64 | | | $ | 4.27 | | | | 0.85 | % | | | 182 | | | | 366 | |
| Class B | | $ | 1,000.00 | | | $ | 989.16 | | | $ | 7.91 | | | | $ | 1,000.00 | | | $ | 1,016.91 | | | $ | 8.02 | | | | 1.60 | % | | | 182 | | | | 366 | |
| Class C | | $ | 1,000.00 | | | $ | 989.16 | | | $ | 7.91 | | | | $ | 1,000.00 | | | $ | 1,016.91 | | | $ | 8.02 | | | | 1.60 | % | | | 182 | | | | 366 | |
The Hartford Total Return Bond Fund | | | | | | | | | | | | | | | | | | | | | | | | | |
| Class A | | $ | 1,000.00 | | | $ | 1,017.95 | | | $ | 5.02 | | | | $ | 1,000.00 | | | $ | 1,019.89 | | | $ | 5.02 | | | | 1.00 | % | | | 182 | | | | 366 | |
| Class B | | $ | 1,000.00 | | | $ | 1,013.50 | | | $ | 8.56 | | | | $ | 1,000.00 | | | $ | 1,016.36 | | | $ | 8.57 | | | | 1.71 | % | | | 182 | | | | 366 | |
| Class C | | $ | 1,000.00 | | | $ | 1,014.17 | | | $ | 8.71 | | | | $ | 1,000.00 | | | $ | 1,016.21 | | | $ | 8.72 | | | | 1.74 | % | | | 182 | | | | 366 | |
| Class I | | $ | 1,000.00 | | | $ | 1,019.32 | | | $ | 3.41 | | | | $ | 1,000.00 | | | $ | 1,021.48 | | | $ | 3.42 | | | | 0.68 | % | | | 182 | | | | 366 | |
| Class R3 | | $ | 1,000.00 | | | $ | 1,016.31 | | | $ | 6.12 | | | | $ | 1,000.00 | | | $ | 1,018.80 | | | $ | 6.12 | | | | 1.22 | % | | | 182 | | | | 366 | |
| Class R4 | | $ | 1,000.00 | | | $ | 1,017.73 | | | $ | 4.97 | | | | $ | 1,000.00 | | | $ | 1,019.94 | | | $ | 4.97 | | | | 0.99 | % | | | 182 | | | | 366 | |
| Class R5 | | $ | 1,000.00 | | | $ | 1,020.15 | | | $ | 3.52 | | | | $ | 1,000.00 | | | $ | 1,021.38 | | | $ | 3.52 | | | | 0.70 | % | | | 182 | | | | 366 | |
| Class Y | | $ | 1,000.00 | | | $ | 1,019.70 | | | $ | 2.96 | | | | $ | 1,000.00 | | | $ | 1,021.93 | | | $ | 2.97 | | | | 0.59 | % | | | 182 | | | | 366 | |
The Hartford U.S. Government Securities Fund | | | | | | | | | | | | | | | | | | | | | | | | | |
| Class A | | $ | 1,000.00 | | | $ | 1,022.13 | | | $ | 5.03 | | | | $ | 1,000.00 | | | $ | 1,019.89 | | | $ | 5.02 | | | | 1.00 | % | | | 182 | | | | 366 | |
| Class B | | $ | 1,000.00 | | | $ | 1,017.91 | | | $ | 8.28 | | | | $ | 1,000.00 | | | $ | 1,016.66 | | | $ | 8.27 | | | | 1.65 | % | | | 182 | | | | 366 | |
| Class C | | $ | 1,000.00 | | | $ | 1,017.29 | | | $ | 8.78 | | | | $ | 1,000.00 | | | $ | 1,016.16 | | | $ | 8.78 | | | | 1.75 | % | | | 182 | | | | 366 | |
| Class L | | $ | 1,000.00 | | | $ | 1,022.85 | | | $ | 4.43 | | | | $ | 1,000.00 | | | $ | 1,020.49 | | | $ | 4.42 | | | | 0.88 | % | | | 182 | | | | 366 | |
| Class Y | | $ | 1,000.00 | | | $ | 1,022.83 | | | $ | 3.27 | | | | $ | 1,000.00 | | | $ | 1,021.63 | | | $ | 3.27 | | | | 0.65 | % | | | 182 | | | | 366 | |
419
The Hartford Mutual Funds, Inc. and The Hartford Mutual Funds II, Inc.
Expense Example — (continued)
| | | | | | | | | | | | | | | | | | | | | | | | | | | | | | | | | | | | | | |
| | | Actual return | | | | Hypothetical (5% return before expenses) | | | | | | | | | | |
| | | | | | | | | Expenses paid
| | | | | | | | | | Expenses paid
| | | | | | | | | | |
| | | Beginning
| | | Ending
| | | during the period
| | | | Beginning
| | | Ending
| | | during the period
| | | | | | Days
| | | | |
| | | Account
| | | Account
| | | October 31, 2007
| | | | Account
| | | Account
| | | October 31, 2007
| | | Annualized
| | | in the
| | | Days
| |
| | | Value
| | | Value
| | | through
| | | | Value
| | | Value
| | | through
| | | expense
| | | current
| | | in the
| |
| | | October 31, 2007 | | | April 30, 2008 | | | April 30, 2008 | | | | October 31, 2007 | | | April 30, 2008 | | | April 30, 2008 | | | ratio | | | 1/2 year | | | full year | |
The Hartford Value Fund | | | | | | | | | | | | | | | | | | | | | | | | | |
| Class A | | $ | 1,000.00 | | | $ | 932.82 | | | $ | 6.25 | | | | $ | 1,000.00 | | | $ | 1,018.40 | | | $ | 6.52 | | | | 1.30 | % | | | 182 | | | | 366 | |
| Class B | | $ | 1,000.00 | | | $ | 928.72 | | | $ | 10.02 | | | | $ | 1,000.00 | | | $ | 1,014.47 | | | $ | 10.47 | | | | 2.09 | % | | | 182 | | | | 366 | |
| Class C | | $ | 1,000.00 | | | $ | 929.62 | | | $ | 9.93 | | | | $ | 1,000.00 | | | $ | 1,014.57 | | | $ | 10.37 | | | | 2.07 | % | | | 182 | | | | 366 | |
| Class I | | $ | 1,000.00 | | | $ | 935.29 | | | $ | 3.76 | | | | $ | 1,000.00 | | | $ | 1,017.01 | | | $ | 3.92 | | | | 0.93 | % | | | 153 | | | | 366 | |
| Class R3 | | $ | 1,000.00 | | | $ | 931.69 | | | $ | 7.54 | | | | $ | 1,000.00 | | | $ | 1,017.06 | | | $ | 7.87 | | | | 1.57 | % | | | 182 | | | | 366 | |
| Class R4 | | $ | 1,000.00 | | | $ | 933.96 | | | $ | 6.06 | | | | $ | 1,000.00 | | | $ | 1,018.60 | | | $ | 6.32 | | | | 1.26 | % | | | 182 | | | | 366 | |
| Class R5 | | $ | 1,000.00 | | | $ | 934.61 | | | $ | 4.67 | | | | $ | 1,000.00 | | | $ | 1,020.04 | | | $ | 4.87 | | | | 0.97 | % | | | 182 | | | | 366 | |
| Class Y | | $ | 1,000.00 | | | $ | 935.27 | | | $ | 4.19 | | | | $ | 1,000.00 | | | $ | 1,020.54 | | | $ | 4.37 | | | | 0.87 | % | | | 182 | | | | 366 | |
The Hartford Value Opportunities Fund | | | | | | | | | | | | | | | | | | | | | | | | | |
| Class A | | $ | 1,000.00 | | | $ | 813.03 | | | $ | 6.31 | | | | $ | 1,000.00 | | | $ | 1,017.90 | | | $ | 7.03 | | | | 1.40 | % | | | 182 | | | | 366 | |
| Class B | | $ | 1,000.00 | | | $ | 810.79 | | | $ | 9.00 | | | | $ | 1,000.00 | | | $ | 1,014.92 | | | $ | 10.02 | | | | 2.00 | % | | | 182 | | | | 366 | |
| Class C | | $ | 1,000.00 | | | $ | 810.28 | | | $ | 9.69 | | | | $ | 1,000.00 | | | $ | 1,014.16 | | | $ | 10.78 | | | | 2.15 | % | | | 182 | | | | 366 | |
| Class I | | $ | 1,000.00 | | | $ | 814.01 | | | $ | 4.96 | | | | $ | 1,000.00 | | | $ | 1,019.39 | | | $ | 5.52 | | | | 1.10 | % | | | 182 | | | | 366 | |
| Class L | | $ | 1,000.00 | | | $ | 813.55 | | | $ | 5.41 | | | | $ | 1,000.00 | | | $ | 1,018.90 | | | $ | 6.02 | | | | 1.20 | % | | | 182 | | | | 366 | |
| Class R3 | | $ | 1,000.00 | | | $ | 811.61 | | | $ | 7.48 | | | | $ | 1,000.00 | | | $ | 1,016.61 | | | $ | 8.32 | | | | 1.66 | % | | | 182 | | | | 366 | |
| Class R4 | | $ | 1,000.00 | | | $ | 813.28 | | | $ | 6.13 | | | | $ | 1,000.00 | | | $ | 1,018.10 | | | $ | 6.82 | | | | 1.36 | % | | | 182 | | | | 366 | |
| Class R5 | | $ | 1,000.00 | | | $ | 814.04 | | | $ | 4.74 | | | | $ | 1,000.00 | | | $ | 1,019.64 | | | $ | 5.27 | | | | 1.05 | % | | | 182 | | | | 366 | |
| Class Y | | $ | 1,000.00 | | | $ | 814.82 | | | $ | 4.38 | | | | $ | 1,000.00 | | | $ | 1,020.04 | | | $ | 4.87 | | | | 0.97 | % | | | 182 | | | | 366 | |
| | | | | | | | | | | | | | | | | | | | | | | | | | | | | | | | | | | | | | |
420
The Hartford Mutual Funds, Inc. and The Hartford Mutual Funds II, Inc.
Approval of Investment Management And Investment Sub-Advisory Agreements
Hartford Global Equity Fund
At a meeting held on November 7, 2007, the Board of Directors (the “Board”), including each of the Independent Directors, unanimously voted to approve the investment management agreement between Hartford Global Equity Fund (the “Fund”) and Hartford Investment Financial Services, LLC (“HIFSCO”), and the investment sub-advisory agreement between HIFSCO and the Fund’s sub-adviser, Wellington Management Company, LLP (“Wellington Management”) (collectively, the “Agreements”). In advance of the November meeting, the Board requested, received, and reviewed written responses from HIFSCO and Wellington Management to questions posed to them on behalf of the Independent Directors and supporting materials related to those questions and responses (the “Adviser Materials”). In addition, the Board’s Investment Committee received in-person presentations from representatives of HIFSCO and Wellington Management regarding the Fund and the proposed investment strategy.
The Board determined that the Agreements were fair and reasonable and in the best interests of the Fund and its shareholders. The Board considered the following categories of material factors, among others, relating to the Agreements.
Nature, Extent and Quality of Services
The Board considered information and data concerning the nature, extent and quality of the services to be provided to the Fund by HIFSCO and Wellington Management. The Board considered, among other things, the terms of the Agreements, the range of services to be provided, and HIFSCO’s and Wellington Management’s organizational structure, systems and personnel. The Board considered HIFSCO’s and Wellington Management’s reputation, and the Board’s past experience with Wellington Management as sub-adviser for other Hartford-sponsored funds.
The Board also considered the representation from HIFSCO that the written compliance policies and procedures of HIFSCO and Wellington Management are reasonably designed to prevent violations of the federal securities laws. In addition, the Board considered HIFSCO’s representation that the addition of the Fund would not cause material changes in the current compliance programs.
With respect to the day-to-day portfolio management services to be provided by Wellington Management, the Investment Committee met with Mark Mandel, a member of the proposed portfolio team. The Board considered Wellington Management’s investment philosophy and process (and adherence to that philosophy and process), and its investment research capabilities and resources, performance record, and experience. The Board recognized that HIFSCO would be responsible for the overall management of the Fund and providing investment advisory services in connection with selecting, monitoring and supervising the Fund’s sub-adviser, and that HIFSCO had recommended to the Board that Wellington Management be appointed as the sub-adviser to the Fund.
In considering this information, the Board evaluated not only the information presented to the Board and the Investment Committee in connection with its consideration of the Agreements, but also the Board’s experience through past interactions with HIFSCO and Wellington Management. Based on these considerations, the Board concluded that it was satisfied with the nature, extent and quality of the services to be provided to the Fund by HIFSCO and Wellington Management.
Performance of Wellington Management
The Board considered the investment performance of Wellington Management and its portfolio management team. As Wellington Management did not have a performance track record with respect to an investment strategy substantially similar to the strategy of the Fund, HIFSCO and Wellington Management presented hypothetical historical investment performance results with respect to the investment strategy that would be used to manage the Fund. This information included a report showing hypothetical historical investment performance results with respect to the investment strategy versus the performance of an appropriate benchmark. HIFSCO and Wellington Management also provided additional information about the broad range of the portfolio management team’s investment experience and their investment philosophy and process.
Based on these considerations, the Board concluded that while there could be no guarantee of future results, the Board was satisfied that HIFSCO and Wellington Management have the capability of providing satisfactory investment performance for the Fund.
Costs of the Services and Profitability of HIFSCO and Wellington Management
The Board reviewed information regarding HIFSCO’s costs to provide investment management and related services to the Fund and the profitability to them from managing the Fund. The Board considered the proposed advisory and sub-advisory fee schedules and considered information about the profitability to HIFSCO and its affiliates from all services to be provided to the Fund and all aspects of their relationships with the Fund. In evaluating HIFSCO’s profitability, the Board considered HIFSCO’s representation that the level of profitability was fair and appropriate based on the nature and quality of the services provided to shareholders. In evaluating Wellington’s profitability, the Board considered primarily HIFSCO’s representation that HIFSCO had negotiated the sub-advisory fee schedule at arm’s length. The Board also noted that the future profitability of the Fund to HIFSCO and Wellington Management would depend on the growth of assets under management. The Board concluded that the profits anticipated to be realized by HIFSCO, its affiliates and Wellington Management from their relationships with the Fund would not be excessive.
Comparison of Fees and Services Provided by HIFSCO and Wellington Management
The Board considered comparative information with respect to the investment management fees to be paid by the Fund to HIFSCO and its affiliates and the sub-advisory fee that HIFSCO would pay Wellington Management. In this regard, the Board received information from HIFSCO and Wellington Management relating to the management fees, sub-advisory fees, and total operating expenses for the Fund. The Board also reviewed information comparing the Fund’s management fees and total operating expenses to those of a peer universe of funds identified by Lipper Inc., an independent provider of investment company data (“Lipper”). In considering the reasonableness of the Fund’s fees and total expense ratios, the Board considered that according to the information provided by Lipper, the proposed management fee for the Fund is slightly above the Lipper average, but below median fees for its peer group from the $100 million to $500 million asset levels. Based on these considerations, the Board concluded that the Fund’s management fee and sub-advisory fee, in conjunction with the information about quality of services, profitability, and other matters discussed, supports the conclusion that these fees are reasonable.
421
The Hartford Mutual Funds, Inc. and The Hartford Mutual Funds II, Inc.
Approval Of Investment Management And Investment Sub-Advisory Agreements (Unaudited) — (continued)
Economies of Scale
The Board considered the extent to which economies of scale would be realized as the Fund grows and whether fee levels reflect these economies of scale for the benefit of Fund investors. The Board reviewed the breakpoints in HIFSCO’s management fee schedule. The Board considered HIFSCO’s representations that the Fund could be expected to achieve some economies of scale as assets in the Fund grow. The Board also considered the breakpoints in the Fund’s sub-advisory fee schedule and how any benefits from economies of scale would be realized by the various parties. The Board reviewed relevant information included in the Adviser Materials regarding comparative breakpoint information for other funds in the Fund’s peer group. Based on these considerations, the Board concluded that it was satisfied with the extent to which economies of scale would be shared for the benefit of the Fund’s investors. The Board noted, however, that it would review future growth in Fund assets and the appropriateness of the breakpoints as part of its future annual review of the Agreements.
Other Benefits
The Board considered other benefits to HIFSCO from its relationship with the Fund. The Board considered information in the Adviser Materials about HIFSCO affiliates that will provide services to the Fund and their anticipated benefits from their relationships with the Fund. The Board also considered that the following companies, which are affiliates of HIFSCO, provide services to the Fund and receive compensation from the Fund:
• HIFSCO serves as the Fund’s principal underwriter and receives 12b-1 fees from the Fund.
| |
| • | Hartford Life Insurance Company provides fund accounting and administration services to the Fund and receives a fee from the Fund for these services. |
| |
| • | Hartford Administrative Services Company, the Fund’s transfer agent, receives transfer agency compensation from the Fund. |
Based upon its review of these various factors, among others, the Board concluded that it is in the best interests of the Fund and its shareholders for the Board to approve the Agreements. In reaching this decision, the Board did not assign relative weights to the factors discussed above or deem any one or group of them to be controlling in and of themselves. In connection with their deliberations, the Independent Directors met separately in executive session with independent legal counsel to review the relevant materials and consider their responsibilities under relevant laws and regulations.
422
The Hartford Global Enhanced Dividend Fund
Schedule of Investments
April 30, 2008 (Unaudited)
(000’s Omitted)
| | | | | | | | | | | | | |
| | | | | | | | | Market
| |
Shares | | | | | | | | Value (W) | |
| LONG POSITIONS — 141.8% |
| COMMON STOCK — 137.7% |
| | | | | Basic Materials — 7.9% |
| | 4 | | | Dow Chemical Co. # | | $ | 150 | |
| | 2 | | | Fording Canadian Coal Trust # | | | 138 | |
| | 3 | | | Highveld Steel & Vanadium Corp., Ltd. ADR (D)# | | | 71 | |
| | 1 | | | MeadWestvaco Corp. # | | | 23 | |
| | — | | | Nucor Corp. # | | | 34 | |
| | 3 | | | Packaging Corp. of America # | | | 66 | |
| | 1 | | | RPM International, Inc. # | | | 29 | |
| | 2 | | | Southern Copper Corp. # | | | 185 | |
| | 3 | | | Wausau Paper Corp. # | | | 22 | |
| | 1 | | | Worthington Industries, Inc. # | | | 26 | |
| | 6 | | | Xerium Technologies, Inc. # | | | 9 | |
| | | | | | | | | |
| | | | | | | | | | | | 753 | |
| | | | | | | | | | | | | |
| | | | | Capital Goods — 2.3% |
| | 2 | | | Briggs & Stratton Corp. # | | | 36 | |
| | 6 | | | Compass Diversified Holdings # | | | 74 | |
| | 5 | | | Steelcase, Inc. # | | | 53 | |
| | 3 | | | Tomkins plc ADR # | | | 36 | |
| | 1 | | | Toro Co. # | | | 22 | |
| | | | | | | | | |
| | | | | | | | | | | | 221 | |
| | | | | | | | | | | | | |
| | | | | Consumer Cyclical — 11.2% |
| | 2 | | | Altria Group, Inc. # | | | 48 | |
| | 1 | | | Asbury Automotive Group # | | | 18 | |
| | — | | | Blue Square-Israel Ltd. ADR # | | | 1 | |
| | 1 | | | Cherokee, Inc. # | | | 25 | |
| | 1 | | | D.R. Horton, Inc. # | | | 9 | |
| | — | | | Genuine Parts Co. # | | | 19 | |
| | 1 | | | Grupo Aeroportuario del Pacifico S.A. de CV ADR # | | | 46 | |
| | 3 | | | Honda Motor Co., Ltd. ADR # | | | 101 | |
| | — | | | KB Home # | | | 8 | |
| | — | | | Kimball International, Inc. # | | | 2 | |
| | 8 | | | Leggett & Platt, Inc. # | | | 127 | |
| | 1 | | | Lennar Corp. # | | | 10 | |
| | 9 | | | Masco Corp. # | | | 157 | |
| | 1 | | | McDonald’s Corp. # | | | 50 | |
| | — | | | Mitsui & Co., Ltd. ADR # | | | 49 | |
| | 4 | | | Nissan Motor Co., Ltd. ADR # | | | 74 | |
| | 2 | | | Phillip Morris International, Inc. (D)# | | | 123 | |
| | 2 | | | Supervalu, Inc. # | | | 81 | |
| | 5 | | | Tuesday Morning Corp. # | | | 29 | |
| | 2 | | | Watsco, Inc. # | | | 96 | |
| | | | | | | | | |
| | | | | | | | | | | | 1,073 | |
| | | | | | | | | | | | | |
| | | | | Consumer Staples — 8.2% |
| | 2 | | | H.J. Heinz Co. # | | | 98 | |
| | 3 | | | Imperial Sugar Co. # | | | 54 | |
| | 2 | | | Kraft Foods, Inc. # | | | 69 | |
| | 2 | | | Lance, Inc. # | | | 50 | |
| | 4 | | | Reddy Ice Holdings, Inc. # | | | 54 | |
| | 2 | | | Reynolds American, Inc. # | | | 95 | |
| | 8 | | | Unilever N.V. NY Shares # | | | 271 | |
| | 1 | | | UST, Inc. # | | | 70 | |
| | 1 | | | Vector Group Ltd. # | | | 22 | |
| | | | | | | | | |
| | | | | | | | | | | | 783 | |
| | | | | �� | | | | | | | | |
| | | | | Energy — 15.7% |
| | 1 | | | AGL Resources, Inc. # | | | 44 | |
| | 5 | | | BP plc ADR # | | | 365 | |
| | 4 | | | Enerplus Resources Fund | | | 184 | |
| | — | | | Huaneng Power International, Inc. ADR Series N # | | | 9 | |
| | 2 | | | Nicor, Inc. # | | | 53 | |
| | 6 | | | Precision Drilling Trust # | | | 139 | |
| | 2 | | | Royal Dutch Shell plc ADR # | | | 188 | |
| | 1 | | | Sasol Ltd. ADR # | | | 65 | |
| | 1 | | | StatoilHydro ASA ADR | | | 48 | |
| | 1 | | | Superior Energy Services, Inc. (D)# | | | 55 | |
| | 4 | | | Total S.A. ADR # | | | 328 | |
| | 1 | | | Vectren Corp. # | | | 27 | |
| | | | | | | | | |
| | | | | | | | | | | | 1,505 | |
| | | | | | | | | | | | | |
| | | | | Finance — 38.8% |
| | — | | | ABN Amro Holding N.V. ADR # | | | 26 | |
| | 2 | | | Advanta Corp. Class B # | | | 17 | |
| | 3 | | | Aegon N.V. ARS ADR # | | | 44 | |
| | 11 | | | Alesco Financial, Inc. # | | | 37 | |
| | 7 | | | Allianz SE # | | | 143 | |
| | 3 | | | Allied Capital Corp. # | | | 61 | |
| | 2 | | | Allied Irish Banks plc ADR # | | | 75 | |
| | — | | | Allstate Corp. # | | | 20 | |
| | 4 | | | American Capital Strategies Ltd. # | | | 122 | |
| | 1 | | | Ameris Bancorp # | | | 10 | |
| | 4 | | | Anthracite Capital, Inc. # | | | 27 | |
| | 3 | | | Apollo Investment Corp. # | | | 44 | |
| | 2 | | | Ares Capital Corp. # | | | 24 | |
| | 4 | | | Arthur J. Gallagher & Co. # | | | 97 | |
| | 11 | | | Ashford Hospitality # | | | 63 | |
| | — | | | Astoria Financial Corp. # | | | 9 | |
| | 2 | | | Axa ADR # | | | 84 | |
| | 5 | | | Banco Bilboa Vizcaya S.A. ADR | | | 107 | |
| | 1 | | | Banco de Chile ADR # | | | 60 | |
| | 2 | | | Banco Latinoamericano de Exportaciones S.A. ADR Class E | | | 29 | |
| | 1 | | | Banco Santander Chili S.A. ADR | | | 41 | |
| | 8 | | | Banco Santander S.A. ADR # | | | 177 | |
| | 1 | | | Bank of America Corp. # | | | 42 | |
| | 2 | | | Barclays Bank plc ADR # | | | 55 | |
| | 1 | | | BB&T Corp. # | | | 18 | |
| | 1 | | | Brandywine Realty Trust # | | | 18 | |
| | 2 | | | BRT Realty Trust # | | | 24 | |
| | 1 | | | Canadian Imperial Bank of Commerce # | | | 40 | |
| | 1 | | | CapitalSource, Inc. # | | | 19 | |
| | — | | | CBL & Associates Properties # | | | 5 | |
| | 5 | | | Centerline Holding Co. # | | | 17 | |
| | 1 | | | Central Pacific Financial Corp. # | | | 9 | |
| | 1 | | | Cincinnati Financial Corp. # | | | 28 | |
| | 1 | | | Citizens Republic Bancorp, Inc. # | | | 12 | |
| | 1 | | | City Bank Lynnwood Wash # | | | 16 | |
| | 1 | | | Colonial BancGroup, Inc. # | | | 10 | |
| | — | | | Comerica, Inc. | | | 17 | |
| | 1 | | | Commerce Group, Inc. # | | | 32 | |
| | 1 | | | Corpbanca S.A. ADR # | | | 35 | |
| | 2 | | | Crystal River Capital, Inc. # | | | 13 | |
| | 4 | | | Felcor Lodging Trust, Inc. # | | | 44 | |
| | 5 | | | Fidelity National Financial, Inc. # | | | 79 | |
| | 1 | | | Fifth Third Bankcorp # | | | 19 | |
The accompanying notes are an integral part of these financial statements.
1
The Hartford Global Enhanced Dividend Fund
Schedule of Investments — (continued)
April 30, 2008 (Unaudited)
(000’s Omitted)
| | | | | | | | | | | | | |
| | | | | | | | | Market
| |
Shares | | | | | | | | Value (W) | |
LONG POSITIONS — (continued)
COMMON STOCK — (continued) |
| | | | | | | | | | | | | |
| | | | | Finance — (continued) |
| | 1 | | | First Commonwealth Financial Corp. # | | $ | 10 | |
| | — | | | First Financial Holdings # | | | 10 | |
| | 1 | | | First Niagara Financial Group, Inc. # | | | 11 | |
| | 1 | | | First Place Financial | | | 8 | |
| | — | | | FirstMerit Corp. # | | | 9 | |
| | 1 | | | FNB Corp. # | | | 10 | |
| | — | | | Fulton Finance Corp. # | | | 5 | |
| | 2 | | | Gladstone Capital Corp. # | | | 35 | |
| | 3 | | | GMH Communities Trust # | | | 24 | |
| | 2 | | | Gramercy Capital Corp. # | | | 38 | |
| | 10 | | | HRPT Properties Trust # | | | 69 | |
| | 2 | | | Huntington Bancshares, Inc. # | | | 17 | |
| | 2 | | | Independent Bank Corp. (Michigan) # | | | 15 | |
| | 3 | | | ING Groep N.V. ADR # | | | 118 | |
| | — | | | Inland Real Estate Corp. # | | | 6 | |
| | 1 | | | Irwin Financial Corp. # | | | 7 | |
| | 6 | | | iStar Financial, Inc. # | | | 113 | |
| | 2 | | | JER Investors Trust, Inc. # | | | 18 | |
| | 1 | | | JP Morgan Chase & Co. # | | | 47 | |
| | 1 | | | Keycorp # | | | 13 | |
| | 1 | | | Lexington Realty Trust # | | | 19 | |
| | 7 | | | MCG Capital Corp. # | | | 50 | |
| | 1 | | | Mercury General Corp. # | | | 50 | |
| | 11 | | | Mizuho Financial Group, Inc. ADR # | | | 114 | |
| | 2 | | | National Bank of Greece S.A. ADR # | | | 25 | |
| | 1 | | | National City Corp. | | | 7 | |
| | 2 | | | New York Community Bancorp, Inc. | | | 30 | |
| | 3 | | | Northstar Realty Finance Corp. # | | | 29 | |
| | — | | | Old National Bankcorp # | | | 5 | |
| | 2 | | | Old Republic International Corp. # | | | 24 | |
| | 4 | | | Onebeacon Insurance Group Ltd. # | | | 86 | |
| | — | | | Park National Corp. # | | | 11 | |
| | 3 | | | Patriot Capital Funding, Inc. # | | | 29 | |
| | — | | | Penn Real Estate Investment Trust # | | | 9 | |
| | 2 | | | Popular, Inc. # | | | 23 | |
| | 3 | | | Prospect Capital Corp. # | | | 40 | |
| | 1 | | | Provident Bankshares Corp. # | | | 13 | |
| | 1 | | | QC Holdings, Inc. # | | | 10 | |
| | 3 | | | RAIT Financial Trust # | | | 25 | |
| | 1 | | | Regions Financial Corp. # | | | 29 | |
| | 3 | | | Resource Capital Corp. # | | | 23 | |
| | 5 | | | Royal Bancshares of Pennsylvania, Inc. Class A # | | | 54 | |
| | 1 | | | Royal Bank of Canada # | | | 63 | |
| | — | | | S&T Bancorp, Inc. # | | | 11 | |
| | 2 | | | Seacoast Banking Corp. # | | | 19 | |
| | 1 | | | Synovus Financial Corp. # | | | 9 | |
| | 9 | | | TICC Capital Corp. # | | | 69 | |
| | 1 | | | The Toronto-Dominion Bank # | | | 70 | |
| | 1 | | | Unitrin, Inc. # | | | 52 | |
| | 2 | | | Wachovia Corp. # | | | 62 | |
| | 1 | | | Wells Fargo & Co. # | | | 36 | |
| | 1 | | | Westpac Banking Corp. ADR # | | | 96 | |
| | 2 | | | Zenith National Insurance Corp. # | | | 68 | |
| | | | | | | | | |
| | | | | | | | | | | | 3,712 | |
| | | | | | | | | | | | | |
| | | | | Health Care — 9.9% |
| | 7 | | | Biovail Corp. # | | | 82 | |
| | 1 | | | Bright Horizons Family Solutions, Inc. (D)# | | | 52 | |
| | 4 | | | Bristol-Myers Squibb Co. # | | | 86 | |
| | 1 | | | Eli Lilly & Co. # | | | 26 | |
| | 4 | | | GlaxoSmithKline plc ADR # | | | 181 | |
| | 3 | | | LCA-Vision, Inc. # | | | 31 | |
| | 2 | | | Novartis AG ADR # | | | 95 | |
| | 13 | | | Pfizer, Inc. # | | | 269 | |
| | 3 | | | Sanofi-Aventis S.A. ADR # | | | 127 | |
| | | | | | | | | |
| | | | | | | | | | | | 949 | |
| | | | | | | | | | | | | |
| | | | | Services — 7.7% |
| | 4 | | | Computer Programs and Systems, Inc. # | | | 71 | |
| | 6 | | | Entercom Communications Corp. # | | | 59 | |
| | 5 | | | Gannett Co., Inc. # | | | 131 | |
| | 1 | | | Idearc, Inc. # | | | 4 | |
| | 4 | | | Pacer International, Inc. # | | | 65 | |
| | 3 | | | Paychex, Inc. # | | | 100 | |
| | 2 | | | Quality Systems # | | | 50 | |
| | 5 | | | Regal Entertainment Group # | | | 93 | |
| | 10 | | | Sinclair Broadcast Group, Inc. Class A # | | | 87 | |
| | 4 | | | World Wrestling Entertainment, Inc. # | | | 78 | |
| | | | | | | | | |
| | | | | | | | | | | | 738 | |
| | | | | | | | | | | | | |
| | | | | Technology — 20.0% |
| | 1 | | | Advantest Corp. ADR # | | | 38 | |
| | 2 | | | Alaska Communication Systems Holdings, Inc. # | | | 22 | |
| | 4 | | | BT Group plc ADR # | | | 196 | |
| | 4 | | | Canon, Inc. ADR # | | | 190 | |
| | 7 | | | Citizens Communications Co. # | | | 70 | |
| | 2 | | | Consolidated Communications Holdings, Inc. # | | | 22 | |
| | 2 | | | Deluxe Corp. # | | | 51 | |
| | 5 | | | Deutsche Telekom AG ADR | | | 83 | |
| | 1 | | | Embarq Corp. # | | | 61 | |
| | 3 | | | France Telecom S.A. ADR # | | | 87 | |
| | 5 | | | Gatehouse Media, Inc. # | | | 26 | |
| | 8 | | | General Electric Co. # | | | 268 | |
| | 1 | | | Iowa Telecommunications Services, Inc. # | | | 24 | |
| | 3 | | | LSI Industries, Inc. # | | | 29 | |
| | 2 | | | Microchip Technology, Inc. # | | | 85 | |
| | 2 | | | Nippon Telegraph & Telephone Corp. ADR # | | | 47 | |
| | 1 | | | Portugal Telecom S.A. ADR # | | | 15 | |
| | 2 | | | SK Telecom Co., Ltd. ADR # | | | 48 | |
| | 4 | | | Telecom Italia S.p.A. ADR # | | | 88 | |
| | 5 | | | Telefonaktiebolaget LM Ericsson ADR # | | | 124 | |
| | 8 | | | United Online, Inc. # | | | 90 | |
| | 4 | | | USA Mobility, Inc. # | | | 29 | |
| | 6 | | | Vodafone Group plc ADR # | | | 196 | |
| | 2 | | | Windstream Corp. # | | | 24 | |
| | | | | | | | | |
| | | | | | | | | | | | 1,913 | |
| | | | | | | | | | | | | |
| | | | | Transportation — 5.0% |
| | — | | | Arlington Tankers Ltd. # | | | 11 | |
| | 3 | | | Double Hull Tankers, Inc. # | | | 32 | |
| | 3 | | | Eagle Bulk Shipping, Inc. # | | | 93 | |
| | 3 | | | Frontline Ltd. ADR # | | | 147 | |
| | 2 | | | General Maritime Corp. # | | | 54 | |
| | 3 | | | Golar Ltd. # | | | 53 | |
| | 1 | | | Knightsbridge Tankers Ltd. ADR # | | | 27 | |
The accompanying notes are an integral part of these financial statements.
2
| | | | | | | | | | | | | |
| | | | | | | | | Market
| |
Shares | | | | | | | | Value (W) | |
LONG POSITIONS — (continued)
COMMON STOCK — (continued) |
| | | | | | | | | | | | | |
| | | | | Transportation — (continued) |
| | 4 | | | Lan Airlines S.A. ADR # | | $ | 57 | |
| | | | | | | | | |
| | | | | | | | | | | | 474 | |
| | | | | | | | | | | | | |
| | | | | Utilities — 11.0% |
| | 1 | | | Ameren Corp. # | | | 23 | |
| | 2 | | | Consolidated Edison Co. of NY # | | | 96 | |
| | 1 | | | DTE Energy Co. # | | | 40 | |
| | 11 | | | Duke Energy Corp. # | | | 192 | |
| | — | | | Enel S.p.A. ADR (H) | | | 23 | |
| | 1 | | | Energy East Corp. | | | 24 | |
| | 2 | | | Eni S.p.A. # | | | 143 | |
| | 1 | | | NiSource, Inc. # | | | 24 | |
| | 3 | | | Pinnacle West Capital Corp. # | | | 91 | |
| | 2 | | | Progress Energy, Inc. # | | | 91 | |
| | 1 | | | SCANA Corp. | | | 24 | |
| | 5 | | | Southern Co. # | | | 201 | |
| | 2 | | | Spectra Energy Corp. # | | | 48 | |
| | 2 | | | TECO Energy, Inc. # | | | 26 | |
| | | | | | | | | |
| | | | | | | | | | | | 1,046 | |
| | | | | | | | | | | | | |
| | | | | Total common stock
(cost $13,720) | | $ | 13,167 | |
| | | | | | | | | | | | | |
| | | | | | | | | | | | | |
Principal
| | | | | | | | | |
| Amount | | | | | | | | | |
| |
| SHORT-TERM INVESTMENTS — 4.1% |
| | | | | Investment Pools and Funds — 4.1% |
| $ | 398 | | | State Street Bank U.S. Government Money Market | | $ | 398 | |
| | | | | | | | | |
| | | | | Total short-term investments
(cost $398) | | $ | 398 | |
| | | | | | | | | |
| | | | | Total long positions
(cost $14,118) (C) | | | 141.8 | % | | $ | 13,565 | |
| | | | | Securities sold short
(proceeds $4,025) | | | (40.1 | )% | | | (3,838 | ) |
| | | | | Other assets and liabilities | | | (1.7 | )% | | | (163 | ) |
| | | | | | | | | | | | | |
| | | | | Total net assets | | | 100.0 | % | | $ | 9,564 | |
| | | | | | | | | | | | | |
Shares | | | | | | | | | |
| SECURITIES SOLD SHORT — 40.1% |
| COMMON STOCK — 40.1% |
| | | | | Basic Materials — 3.8% |
| | 2 | | | Anglo American plc ADR | | $ | 78 | |
| | 2 | | | Armstrong World Industries, Inc. | | | 61 | |
| | — | | | Cleveland-Cliffs, Inc. | | | 38 | |
| | 7 | | | Domtar Corp. (D) | | | 44 | |
| | — | | | Foster (L.B.) Co. Class A (D) | | | 6 | |
| | — | | | Haynes International, Inc. (D) | | | 30 | |
| | 1 | | | NCI Building Systems, Inc. (D) | | | 26 | |
| | 1 | | | Potlatch Corp. | | | 26 | |
| | 6 | | | Smurfit-Stone Container Corp. (D) | | | 33 | |
| | 1 | | | Titanium Metals Corp. | | | 23 | |
| | | | | | | | | |
| | | | | | | | | | | | 365 | |
| | | | | | | | | | | | | |
| | | | | Capital Goods — 0.8% |
| | — | | | AGCO Corp. (D) | | | 23 | |
| | 1 | | | Flow International Corp. (D) | | | 11 | |
| | — | | | Hurco Cos. (D) | | | 12 | |
| | — | | | Kadant, Inc. (D) | | | 9 | |
| | — | | | Tecumseh Products Co. Class A (D) | | | 13 | |
| | 1 | | | Trimas Corp. (D) | | | 7 | |
| | | | | | | | | |
| | | | | | | | | | | | 75 | |
| | | | | | | | | | | | | |
| | | | | Consumer Cyclical — 3.8% |
| | 1 | | | 99 Cents Only Stores (D) | | | 12 | |
| | 1 | | | Cheesecake Factory, Inc. (D) | | | 12 | |
| | 2 | | | Chiquita Brands International, Inc. (D) | | | 44 | |
| | — | | | Core-Mark Holding Co., Inc. (D) | | | 11 | |
| | 1 | | | ESCO Technologies, Inc. (D) | | | 25 | |
| | 7 | | | Ford Motor Co. (D) | | | 55 | |
| | 1 | | | Great Atlantic & Pacific Tea Co., Inc. (D) | | | 22 | |
| | 1 | | | Interline Brands, Inc. (D) | | | 12 | |
| | 2 | | | Liquidity Services, Inc. (D) | | | 17 | |
| | 1 | | | Nuco2, Inc. (D) | | | 15 | |
| | 1 | | | Pantry, Inc. (D) | | | 9 | |
| | 1 | | | Rush Enterprises, Inc. (D) | | | 21 | |
| | 1 | | | Starbucks Corp. (D) | | | 17 | |
| | 1 | | | Texas Roadhouse, Inc. (D) | | | 12 | |
| | 1 | | | Toll Brothers, Inc. (D) | | | 29 | |
| | — | | | Walter Industries | | | 27 | |
| | 1 | | | Winn-Dixie Stores, Inc. (D) | | | 24 | |
| | | | | | | | | |
| | | | | | | | | | | | 364 | |
| | | | | | | | | | | | | |
| | | | | Consumer Staples — 1.6% |
| | 2 | | | Dean Foods Co. (D) | | | 43 | |
| | 1 | | | M & F Worldwide Corp. (D) | | | 25 | |
| | — | | | Seaboard Corp. | | | 34 | |
| | 2 | | | Smithfield Foods, Inc. (D) | | | 51 | |
| | | | | | | | | |
| | | | | | | | | | | | 153 | |
| | | | | | | | | | | | | |
| | | | | Energy — 3.7% |
| | — | | | ATP Oil & Gas Corp. (D) | | | 4 | |
| | — | | | Bill Barrett Corp. (D) | | | 6 | |
| | — | | | Continental Resources, Inc. (D) | | | 18 | |
| | — | | | Denbury Resources, Inc. (D) | | | 11 | |
| | — | | | Helix Energy Solutions Group, Inc. (D) | | | 10 | |
| | 1 | | | Nabors Industries Ltd. (D) | | | 54 | |
| | — | | | Newfield Exploration Co. (D) | | | 12 | |
| | 1 | | | Petrohawk Energy Corp. (D) | | | 15 | |
| | — | | | Plains Exploration & Production Co. (D) | | | 12 | |
| | — | | | Quicksilver Resources, Inc. (D) | | | 14 | |
| | — | | | Southwestern Energy Co. (D) | | | 15 | |
| | 1 | | | Suncor Energy, Inc. | | | 68 | |
| | — | | | Ultra Petroleum Corp. (D) | | | 11 | |
| | 1 | | | Unit Corp. (D) | | | 42 | |
| | 2 | | | Williams Cos., Inc. | | | 61 | |
| | | | | | | | | |
| | | | | | | | | | | | 353 | |
| | | | | | | | | | | | | |
| | | | | Finance — 4.9% |
| | — | | | Alexander’s, Inc. (D) | | | 11 | |
| | 1 | | | Ameriprise Financial, Inc. | | | 52 | |
| | 7 | | | Anworth Mortgage Asset Corp. | | | 47 | |
| | 1 | | | Dollar Financial Corp. (D) | | | 18 | |
| | 1 | | | Guaranty Financial Group, Inc. (D) | | | 5 | |
| | 4 | | | Newstar Financial, Inc. (D) | | | 23 | |
| | 12 | | | Nexcen Brands, Inc. (D) | | | 36 | |
| | 1 | | | Northern Trust Corp. | | | 47 | |
| | — | | | Pinnacle Financial Partners, Inc. (D) | | | 11 | |
The accompanying notes are an integral part of these financial statements.
3
The Hartford Global Enhanced Dividend Fund
Schedule of Investments — (continued)
April 30, 2008 (Unaudited)
(000’s Omitted)
| | | | | | | | | | | | | |
| | | | | | | | | Market
| |
Shares | | | | | | | | Value (W) | |
| | | | | | | | | | | | | |
SECURITIES SOLD SHORT — (continued)
COMMON STOCK — (continued) |
| | | | | | | | | | | | | |
| | | | | Finance — (continued) |
| | 1 | | | PMA Capital Corp. Class A (D) | | $ | 11 | |
| | 1 | | | Rayonier, Inc. | | | 48 | |
| | 1 | | | Signature Bank (D) | | | 14 | |
| | 1 | | | State Street Corp. | | | 46 | |
| | — | | | SVB Financial Group (D) | | | 19 | |
| | 1 | | | Texas Capital Bankshares, Inc. (D) | | | 10 | |
| | 2 | | | TFS Financial Corp. | | | 20 | |
| | — | | | Wesco Financial Corp. | | | 52 | |
| | | | | | | | | |
| | | | | | | | | | | | 470 | |
| | | | | | | | | | | | | |
| | | | | Health Care — 3.8% |
| | 3 | | | Akorn, Inc. (D) | | | 14 | |
| | 3 | | | Alexza Pharmaceuticals, Inc. (D) | | | 22 | |
| | 2 | | | Auxilium Pharmaceuticals, Inc. (D) | | | 46 | |
| | 2 | | | BioMimetic Therapeutics, Inc. (D) | | | 22 | |
| | — | | | Caraco Pharmaceutical Laboratories Ltd. (D) | | | 1 | |
| | 1 | | | Community Health Systems, Inc. (D) | | | 44 | |
| | 10 | | | Discovery Laboratories, Inc. (D) | | | 27 | |
| | 5 | | | DURECT Corp. (D) | | | 21 | |
| | 2 | | | KV Pharmaceutical Co. (D) | | | 42 | |
| | 1 | | | Map Pharmaceuticals, Inc. (D) | | | 14 | |
| | 1 | | | Obagi Medical Products, Inc. (D) | | | 11 | |
| | 12 | | | Santarus, Inc. (D) | | | 31 | |
| | 1 | | | Sucampo Pharmaceuticals (D) | | | 14 | |
| | 7 | | | SuperGen, Inc. (D) | | | 19 | |
| | 1 | | | Xenoport, Inc. (D) | | | 37 | |
| | | | | | | | | |
| | | | | | | | | | | | 365 | |
| | | | | | | | | | | | | |
| | | | | Services — 5.1% |
| | 6 | | | ABX Holdings, Inc. (D) | | | 15 | |
| | — | | | Cerner Corp. (D) | | | 12 | |
| | 1 | | | CKX, Inc. (D) | | | 7 | |
| | 1 | | | Computer Sciences Corp. (D) | | | 38 | |
| | 3 | | | Corinthian Colleges, Inc. (D) | | | 34 | |
| | 2 | | | Discovery Holding Co. (D) | | | 44 | |
| | — | | | Eclipsys Corp. (D) | | | 9 | |
| | 6 | | | Emmis Communications Corp. Class A (D) | | | 20 | |
| | 1 | | | Getty Images, Inc. (D) | | | 33 | |
| | 2 | | | Greenfield Online, Inc. (D) | | | 21 | |
| | 1 | | | Hub Group, Inc. (D) | | | 32 | |
| | 2 | | | Iron Mountain, Inc. (D) | | | 41 | |
| | 2 | | | Lakes Entertainment, Inc. (D) | | | 9 | |
| | 3 | | | Lions Gate Entertainment Corp. (D) | | | 31 | |
| | 1 | | | Live Nation, Inc. (D) | | | 10 | |
| | 5 | | | LivePerson, Inc. (D) | | | 15 | |
| | 1 | | | LodgeNet Interactive Corp. (D) | | | 4 | |
| | 1 | | | Playboy Enterprises Class B (D) | | | 12 | |
| | 3 | | | Sunopta, Inc. (D) | | | 18 | |
| | 1 | | | TETRA Technologies, Inc. (D) | | | 18 | |
| | 2 | | | Valassis Communications, Inc. (D) | | | 21 | |
| | — | | | Viacom, Inc. Class B (D) | | | 9 | |
| | 3 | | | XM Satellite Radio Holdings, Inc. Class A (D) | | | 30 | |
| | | | | | | | | |
| | | | | | | | | | | | 483 | |
| | | | | | | | | | | | | |
| | | | | Technology — 9.1% |
| | 1 | | | Akamai Technologies, Inc. (D) | | | 30 | |
| | 1 | | | American Tower Corp. Class A (D) | | | 53 | |
| | 1 | | | Audiovox Corp. Class A (D) | | | 11 | |
| | 4 | | | Borland Software Corp. (D) | | | 7 | |
| | 1 | | | Cbeyond, Inc. (D) | | | 29 | |
| | 11 | | | Cincinnati Bell, Inc. (D) | | | 49 | |
| | 2 | | | Crown Castle International Corp. (D) | | | 63 | |
| | 4 | | | Earthlink, Inc. (D) | | | 35 | |
| | — | | | Enersys (D) | | | 4 | |
| | — | | | Equinix, Inc. (D) | | | 28 | |
| | 2 | | | FalconStor Software, Inc. (D) | | | 13 | |
| | 6 | | | General Communication, Inc. Class A (D) | | | 40 | |
| | 1 | | | Harman International Industries, Inc. | | | 33 | |
| | 2 | | | Infospace, Inc. | | | 19 | |
| | 2 | | | Internet Capital (D) | | | 22 | |
| | — | | | JA Solar Holdings Co., Ltd. ADR (D) | | | 11 | |
| | 2 | | | JDS Uniphase Corp. (D) | | | 31 | |
| | 1 | | | Leap Wireless International, Inc. (D) | | | 27 | |
| | 2 | | | MetroPCS Communications, Inc. (D) | | | 35 | |
| | 6 | | | Micron Technology, Inc. (D) | | | 50 | |
| | 1 | | | NII Holdings, Inc. Class B (D) | | | 52 | |
| | 6 | | | Nortel Networks Corp. (D) | | | 53 | |
| | 6 | | | Openwave Systems, Inc. | | | 13 | |
| | — | | | Polypore International Inc. (D) | | | 6 | |
| | — | | | Powell Industries, Inc. (D) | | | 5 | |
| | 4 | | | RealNetworks, Inc. (D) | | | 26 | |
| | 1 | | | Red Hat, Inc. (D) | | | 27 | |
| | 1 | | | SAVVIS, Inc. (D) | | | 10 | |
| | 5 | | | Tellabs, Inc. (D) | | | 26 | |
| | 3 | | | TiVo, Inc. (D) | | | 26 | |
| | 2 | | | Trizetto Group, Inc. (D) | | | 37 | |
| | | | | | | | | |
| | | | | | | | | | | | 871 | |
| | | | | | | | | | | | | |
| | | | | Transportation — 1.8% |
| | 2 | | | AirTran Holdings, Inc. (D) | | | 5 | |
| | 1 | | | Alaska Air Group, Inc. (D) | | | 11 | |
| | 1 | | | American Commercial Lines, Inc. (D) | | | 19 | |
| | 2 | | | AMR Corp. (D) | | | 13 | |
| | — | | | Bristow Group, Inc. (D) | | | 9 | |
| | 1 | | | Delta Air Lines, Inc. (D) | | | 11 | |
| | — | | | Hornbeck Offshore Services, Inc. (D) | | | 21 | |
| | 1 | | | Northwest Airlines Corp. (D) | | | 12 | |
| | 1 | | | TBS International Ltd. Class A (D) | | | 36 | |
| | 1 | | | Teekay Shipping Corp. | | | 37 | |
| | | | | | | | | |
| | | | | | | | | | | | 174 | |
| | | | | | | | | | | | | |
| | | | | Utilities — 1.7% |
| | 1 | | | AES Corp. (D) | | | 9 | |
| | 12 | | | Aquila, Inc. (D) | | | 44 | |
| | 1 | | | El Paso Electric Co. (D) | | | 24 | |
| | 2 | | | MDU Resources Group, Inc. | | | 43 | |
| | — | | | Suntech Power Holdings Co., Ltd. ADR (D) | | | 7 | |
| | 1 | | | Veolia Environment ADR | | | 38 | |
| | | | | | | | | |
| | | | | | | | | | | | 165 | |
| | | | | | | | | | | | | |
| | | | | Total securities sold short
(proceeds $4,025) | | | 40.10 | % | | $ | 3,838 | |
| | | | | | | | | | | | | |
| |
| Note: | Percentage of investments as shown is the ratio of the total market value to total net assets. Market value of long position investments in foreign securities represents 56.04% of total net assets at April 30, 2008. Foreign securities that are principally traded on certain foreign markets are adjusted daily pursuant to a third party pricing service methodology approved by the Board of Directors in order to reflect an adjustment for factors occurring after the close of the foreign market but before the close of the New York Stock Exchange. |
The accompanying notes are an integral part of these financial statements.
4
| | |
| (C) | | At April 30, 2008, the cost of securities for federal income tax purposes was $14,118 and the aggregate gross unrealized appreciation and depreciation based on that cost were: |
| | | | | |
| Unrealized Appreciation | | $ | 586 | |
| Unrealized Depreciation | | | (1,139 | ) |
| | | | | |
| Net Unrealized Depreciation | | $ | (553 | ) |
| | | | | |
| | |
| ‡ | | All or a portion of this security is held in a segregated account to cover the Fund’s short position. |
| |
| (D) | | Currently non-income producing. |
| |
| (H) | | The following securities are considered illiquid. Illiquid securities are often purchased in private placement transactions, are not registered under the Securities Act of 1933 and may have contractual restrictions on resale. A security may also be considered illiquid if the security lacks a readily available market or if its valuation has not changed for a certain period of time. |
| | | | | | | | | | | |
Period
| | | | | | |
Acquired | | Shares/Par | | Security | | Cost Basis |
| 03/2008 | | | — | | | Enel S.p.A. ADR | | $ | 23 | |
| | |
| | The aggregate value of these securities at April 30, 2008 was $23 which represents 0.24% of total net assets. |
| |
| (W) | | See Note 2b of accompanying Notes to Financial Statements regarding valuation of securities. |
Diversification by Country — Long Positions
as of April 30, 2008
| | | | | |
| | | Percentage of
| |
Country | | Net Assets | |
| |
| Australia | | | 1.0 | % |
| |
| |
| Canada | | | 7.5 | |
| |
| |
| Chile | | | 2.0 | |
| |
| |
| China | | | 0.1 | |
| |
| |
| France | | | 6.5 | |
| |
| |
| Germany | | | 2.4 | |
| |
| |
| Greece | | | 0.3 | |
| |
| |
| Ireland | | | 0.8 | |
| |
| |
| Italy | | | 2.6 | |
| |
| |
| Japan | | | 6.4 | |
| |
| |
| Mexico | | | 0.5 | |
| |
| |
| Netherlands | | | 4.8 | |
| |
| |
| Norway | | | 0.8 | |
| |
| |
| Panama | | | 0.3 | |
| |
| |
| Portugal | | | 0.2 | |
| |
| |
| South Africa | | | 1.4 | |
| |
| |
| South Korea | | | 0.5 | |
| |
| |
| Spain | | | 3.0 | |
| |
| |
| Sweden | | | 1.3 | |
| |
| |
| Switzerland | | | 1.0 | |
| |
| |
| United Kingdom | | | 12.7 | |
| |
| |
| United States | | | 81.6 | |
| |
| |
| Short Positions | | | (40.1 | ) |
| |
| |
| Short-Term Investments | | | 4.1 | |
| |
| |
| Other Assets and Liabilities | | | (1.7 | ) |
| |
| |
Total | | | 100.0 | % |
| |
| |
Diversification by Country — Securities Sold Short
as of April 30, 2008
| | | | | |
| | | Percentage of
| |
Country | | Net Assets | |
| |
| Canada | | | 2.2 | |
| |
| |
| China | | | 0.2 | |
| |
| |
| France | | | 0.4 | |
| |
| |
| United Kingdom | | | 0.8 | |
| |
| |
| United States | | | 36.5 | |
| |
| |
Total | | | 40.1 | % |
| |
| |
The accompanying notes are an integral part of these financial statements.
5
The Hartford Global Enhanced Dividend Fund
Statement of Assets and Liabilities
April 30, 2008 (Unaudited)
(000’s Omitted)
| | | | | |
| | | Global Enhanced
| |
| | | Dividend
| |
| | | Fund (a) | |
Assets: | | | | |
| Investments in securities, at value (cost $14,118) | | $ | 13,565 | |
| Cash | | | 3 | |
| Dividend and interest receivable | | | 42 | |
| Other assets | | | 4 | |
| | | | | |
| Total assets | | | 13,614 | |
| | | | | |
| | | | | |
Liabilities: | | | | |
| Payables: | | | | |
| Investment securities purchased | | | 205 | |
| Investment advisory and management fees (Note 5) | | | 2 | |
| Dividends and interest on short positions | | | 2 | |
| Securities sold short, at value (proceeds $4,025) | | | 3,838 | |
| Accrued expenses | | | 3 | |
| | | | | |
| Total liabilities | | | 4,050 | |
| | | | | |
| Net assets | | $ | 9,564 | |
| | | | | |
| | | | | |
Summary of Net Assets: | | | | |
Capital stock and paid-in-capital | | $ | 10,324 | |
| Accumulated undistributed net investment income | | | 57 | |
| Accumulated net realized loss on investments | | | (451 | ) |
| Unrealized depreciation of investments | | | (366 | ) |
| | | | | |
| Net assets | | $ | 9,564 | |
| | | | | |
| Shares authorized | | | 850,000 | |
| | | | | |
| Par value | | | 0.001 | |
| | | | | |
| | | | | |
Class A: Net asset value per share/Maximum offering price per share | | $ | 9.39/$9.94 | |
| | | | | |
| Shares outstanding | | | 805 | |
| | | | | |
| Net assets | | $ | 7,557 | |
| | | | | |
Class B: Net asset value per share | | $ | 9.38 | |
| | | | | |
| Shares outstanding | | | 31 | |
| | | | | |
| Net assets | | $ | 286 | |
| | | | | |
Class C: Net asset value per share | | $ | 9.38 | |
| | | | | |
| Shares outstanding | | | 31 | |
| | | | | |
| Net assets | | $ | 286 | |
| | | | | |
Class I: Net asset value per share | | $ | 9.39 | |
| | | | | |
| Shares outstanding | | | 31 | |
| | | | | |
| Net assets | | $ | 287 | |
| | | | | |
Class R3: Net asset value per share | | $ | 9.38 | |
| | | | | |
| Shares outstanding | | | 31 | |
| | | | | |
| Net assets | | $ | 287 | |
| | | | | |
Class R4: Net asset value per share | | $ | 9.39 | |
| | | | | |
| Shares outstanding | | | 31 | |
| | | | | |
| Net assets | | $ | 287 | |
| | | | | |
Class R5: Net asset value per share | | $ | 9.39 | |
| | | | | |
| Shares outstanding | | | 31 | |
| | | | | |
| Net assets | | $ | 287 | |
| | | | | |
Class Y: Net asset value per share | | $ | 9.39 | |
| | | | | |
| Shares outstanding | | | 31 | |
| | | | | |
| Net assets | | $ | 287 | |
| | | | | |
| |
| (a) | Commenced operations on November 28, 2007. |
The accompanying notes are an integral part of these financial statements.
6
The Hartford Global Enhanced Dividend Fund
Statement of Operations
For the Period November 28, 2007 to April 30, 2008 (Unaudited)
(000’s Omitted)
| | | | | |
| | | Global Enhanced
| |
| | | Dividend Fund (a) | |
Investment Income: | | | | |
| Dividends | | $ | 426 | |
| Interest | | | 8 | |
| Less: Foreign tax withheld | | | (27 | ) |
| | | | | |
| Total investment income, net | | | 407 | |
| | | | | |
| | | | | |
Expenses: | | | | |
| Investment management and advisory fees | | | 40 | |
| Distribution fees | | | | |
| Class A | | | 8 | |
| Class B | | | 1 | |
| Class C | | | 1 | |
| Class R3 | | | 1 | |
| Accounting services | | | 1 | |
| Dividend expense | | | 2 | |
| Other expenses | | | 12 | |
| | | | | |
| Total expenses (before waivers) | | | 66 | |
| Expense waivers | | | (40 | ) |
| | | | | |
| Total waivers and fees paid indirectly | | | (40 | ) |
| | | | | |
| Total expenses, net | | | 26 | |
| | | | | |
| Net investment income | | | 381 | |
| | | | | |
Net Realized Loss on Investments: | | | | |
| Net realized loss on investments | | | (570 | ) |
| Net realized gain on securities sold short | | | 119 | |
| | | | | |
Net Realized Loss on Investments: | | | (451 | ) |
| | | | | |
Net Changes in Unrealized Depreciation of Investments: | | | | |
| Net unrealized depreciation of investments | | | (553 | ) |
| Net unrealized appreciation on securities sold short | | | 187 | |
| | | | | |
Net Changes in Unrealized Depreciation of Investments: | | | (366 | ) |
| | | | | |
Net Loss on Investments: | | | (817 | ) |
| | | | | |
Net Decrease in Net Assets Resulting from Operations | | $ | (436 | ) |
| | | | | |
(a) Commenced operations on November 28, 2007.
The accompanying notes are an integral part of these financial statements.
7
The Hartford Global Enhanced Dividend Fund
Statement of Changes in Net Assets
(000’s Omitted)
| | | | | |
| | | For the Period
| |
| | | November 28,
| |
| | | 2007** through
| |
| | | April 30, 2008
| |
| | | (Unaudited) | |
Operations: | | | | |
| Net investment income | | $ | 381 | |
| Net realized loss on investments | | | (451 | ) |
| Net unrealized depreciation of investments | | | (366 | ) |
| | | | | |
| Net decrease in net assets resulting from operations | | | (436 | ) |
| | | | | |
| | | | | |
Distributions to Shareholders: | | | | |
| From net investment income | | | | |
| Class A | | | (257 | ) |
| Class B | | | (9 | ) |
| Class C | | | (9 | ) |
| Class I | | | (10 | ) |
| Class R3 | | | (9 | ) |
| Class R4 | | | (10 | ) |
| Class R5 | | | (10 | ) |
| Class Y | | | (10 | ) |
| | | | | |
| Total distributions | | | (324 | ) |
| | | | | |
| | | | | |
Capital Share Transactions: | | | | |
| Class A | | | 8,157 | |
| Class B | | | 309 | |
| Class C | | | 309 | |
| Class I | | | 310 | |
| Class R3 | | | 309 | |
| Class R4 | | | 310 | |
| Class R5 | | | 310 | |
| Class Y | | | 310 | |
| | | | | |
| Net increase from capital share transactions | | | 10,324 | |
| | | | | |
| Net increase in net assets | | | 9,564 | |
Net Assets: | | | | |
| Beginning of period | | | — | |
| | | | | |
| End of period | | $ | 9,564 | |
| | | | | |
| Accumulated undistributed net investment income | | $ | 57 | |
| | | | | |
** Commencement of operations.
The accompanying notes are an integral part of these financial statements.
8
The Hartford Global Enhanced Dividend Fund
Notes to Financial Statements
April 30, 2008 (Unaudited)
(000’s Omitted)
This Fund is not offered to the public as of April 30, 2008.
The Hartford Mutual Funds, Inc. (the “Company”) is an open-end management investment company comprised of forty-eight portfolios. The Hartford Global Enhanced Dividend Fund (Global Enhanced Dividend Fund) is the only fund included in these financial statements.
The Company is organized under the laws of the State of Maryland and is registered with the Securities and Exchange Commission (“SEC”) under the Investment Company Act of 1940, as amended (“1940 Act”), as a diversified open-end management investment company.
Class A shares are sold with a front-end sales charge of up to 5.50%. Class B shares are sold with a contingent deferred sales charge which is assessed on the lesser of the net asset value (“NAV”) of the shares at the time of redemption or the original purchase price, and declines from up to 5.00% to zero depending on the period of time the shares are held. Class C shares are sold with a contingent deferred sales charge of up to 1.00%. Class I shares are sold without sales charges to certain eligible investors through advisory fee-based wrap programs. Classes R3, R4, R5 shares, which are offered to employer-sponsored retirement plans, and Y shares, which are sold to certain eligible institutional investors are sold without a sales charge. All classes of shares have identical voting, redemption, dividend, liquidation and other rights and the same terms and conditions, except that each class may have different expenses, which may affect performance, and except that Class B shares automatically converts to Class A shares after 8 years.
| |
| 2. | Significant Accounting Policies: |
The following is a summary of significant accounting policies of the Fund, which are in accordance with U.S. Generally Accepted Accounting Principles (“GAAP”) in the investment company industry:
| | |
| | a) | Security Transactions and Investment Income — Security transactions are recorded on the trade date (the date the order to buy or sell is executed). Security gains and losses are determined on the basis of identified cost. |
Trade date for senior floating rate interests purchased in the primary market is considered the date on which the loan allocations are determined. Trade date for senior floating rate interests purchased in the secondary market is the date on which the transaction is entered into.
Dividend income is accrued as of the ex-dividend date, except that certain dividends for foreign securities where the ex-dividend date may have passed are recorded as soon as the Fund is informed of the dividend in the exercise of reasonable diligence. Interest income, including amortization of premium and accretion of discounts, is accrued on a daily basis.
| | |
| | b) | Security Valuation — The Fund generally uses market prices in valuing portfolio securities. If market quotations are not readily available or are deemed unreliable, the Fund will use the fair value of the security as determined in good faith under policies and procedures established by and under the supervision of the Fund’s Board of Directors. Market prices may be deemed unreliable, for example, if a security is thinly traded or if an event has occurred after the close of the exchange on which a portfolio security is principally traded but before the close of the New York Stock Exchange (the “Exchange”) (normally 4:00 p.m. Eastern Time, referred to as the “Valuation Time”) that is expected to affect the value of the portfolio security. The circumstances in which the Fund may use fair value pricing include, among others: (i) the occurrence of events that are significant to a particular issuer, such as mergers, restructuring or defaults; (ii) the occurrence of events that are significant to an entire market, such as natural disasters in a particular region or governmental actions; (iii) trading restrictions on securities; (iv) thinly traded securities and (v) market events such as trading halts and early market closings. In addition, with respect to the valuation of securities principally traded on foreign markets, the Fund uses a fair value pricing service approved by its Board of Directors which employs quantitative models to adjust for “stale” prices caused by the movement of other markets and other factors occurring after the close of the foreign markets but before the close of the Exchange. Securities that are principally traded on foreign markets may trade on days that are not business days of the Fund. Because the NAV of the Fund’s shares is determined only on business days of the Fund, the value of the portfolio securities of the Fund that invests in foreign securities may change on days when a shareholder will not be able to purchase or redeem shares of the Fund. Fair value pricing is subjective in nature and the use of fair value pricing by the Fund may cause the NAV of its respective shares to differ significantly from the NAV that would have been calculated using market prices at the close of the exchange on which a portfolio security is principally traded but before the close of the Exchange. There can be no assurance that the Fund could obtain the fair value assigned to a security if the Fund were to sell the security at approximately the time at which the Fund determines its NAV per share. |
Debt securities (other than short-term obligations and senior floating rate interests) held by the Fund are valued on the basis of valuations furnished by an unaffiliated pricing service which determines valuations for normal institutional size trading units of debt securities. Senior floating rate interests generally trade in over-the-counter (“OTC”) markets and are priced through an unaffiliated pricing service utilizing independent market quotations from loan dealers or financial institutions. Securities for which prices are not available from an independent pricing service, but where an active market exists, are valued using market quotations obtained from one or more dealers that make markets in the securities or from a widely-used quotation system in accordance with procedures established by the Fund’s Board of Directors. Generally, the Fund may use fair valuation in regards to debt securities when the Fund holds defaulted or distressed securities or securities in a company in which reorganization is pending. Short-term investments with a maturity of more than 60 days when purchased are valued based on market quotations until the remaining days to maturity become less than 61 days.
Exchange traded equity securities held, both long and short, shall be valued at the last reported sale price on the exchange or market on which the security is primarily traded (the “Primary Market”) at the Valuation Time. If the security did not trade on the Primary Market, it may be valued at the Valuation Time at the last reported sale price on another exchange where it trades. The value of an equity security not traded on any exchange but traded on the Nasdaq Stock Market, Inc. (“Nasdaq”) or another OTC market shall be valued at the last reported sale price or official closing price on the exchange or market on which the security is traded as of the Valuation Time. If it is not possible to determine the last reported sale price or official closing price on the relevant exchange or market at the Valuation Time, the value of the security shall be taken to be the most recent bid quotation on such exchange or market at the Valuation Time.
9
The Hartford Global Enhanced Dividend Fund
Notes to Financial Statements — (continued)
April 30, 2008 (Unaudited)
(000’s Omitted)
Securities of foreign issuers and non-dollar securities are translated from the local currency into U.S. dollars using prevailing exchange rates.
Options contracts on securities, currencies, indexes, futures contracts, commodities and other instruments shall be valued at their most recent sales price at the Valuation Time on the Primary Market on which the instrument is traded. If the instrument did not trade on the Primary Market, it may be valued at the most recent sales price at the Valuation Time on another exchange or market where it did trade.
Futures contracts shall be valued at the final settlement price reported by an exchange on which they are principally traded. If there were no trades as of the valuation day, then the contract shall be valued at the closing bid price as of the Valuation Time.
Financial instruments for which prices are not available from an independent pricing service, but where an active market exists, are valued using market quotations obtained from one or more dealers that make markets in securities or from a widely-used quotation system in accordance with procedures established by the Fund’s Board of Directors.
A forward currency contract shall be valued based on the price of the underlying currency at the prevailing interpolated exchange rate, which is a combination of the spot currency rate and the forward currency rate. Spot currency rates and forward currency rates are obtained from an independent pricing service on a daily basis not more than one hour before the Valuation Time. In the event that the applicable pricing service cannot provide the spot currency rates and forward currency rates in a timely fashion, such rates may be obtained from a widely-used quotation system in accordance with procedures established by the Fund’s Board of Directors.
Swaps and other derivative or contractual type instruments shall be valued using market prices if such instruments trade on an exchange or market. If such instruments do not trade on an exchange or market, such instruments shall be valued at a price at which the counterparty to such contract would repurchase the instrument. In the event that the counterparty cannot provide a price, such valuation may be determined in accordance with procedures established by the Fund’s Board of Directors.
Investments in open-end mutual funds are valued at the respective NAV of each open-end mutual fund on the valuation date.
| | |
| | c) | Foreign Currency Transactions — The accounting records of the Fund is maintained in U.S. dollars. All assets and liabilities initially expressed in foreign currencies are converted into U.S. dollars at the prevailing exchange rates. Purchases and sales of investment securities, dividend and interest income and certain expenses are translated at the rates of exchange prevailing on the respective dates of such transactions. |
The Fund does not isolate that portion of portfolio security valuation resulting from fluctuations in the foreign currency exchange rates on portfolio securities from the fluctuations arising from changes in the market prices of securities held. Such fluctuations are included with the net realized and unrealized gain or loss on investments in the accompanying financial statements.
Net realized foreign exchange gains or losses arise from sales of foreign currencies and the difference between asset and liability amounts initially stated in foreign currencies and the U.S. dollar value of the amounts actually received or paid. Net unrealized foreign exchange gains or losses arise from changes in the value of other assets and liabilities at the end of the reporting period, resulting from changes in the exchange rates.
| | |
| | d) | Securities Lending — The Fund may lend its securities to certain qualified brokers who pay the Fund negotiated lender fees. The loans are fully collateralized at all times with cash and/or U. S. Government Securities and/or repurchase agreements. The cash collateral is then invested in short-term money market instruments. The repurchase agreements are fully collateralized by U.S. Government Securities. The adequacy of the collateral for securities on loan is monitored on a daily basis. For instances where the market value of collateral falls below the market value of the securities out on loan, such collateral is supplemented on the following day. |
While securities are on loan, the Fund is subject to: the following risks: 1) that the borrower may default on the loan and that the collateral could be inadequate in the event the borrower defaults, 2) that the earnings on the collateral invested may not be sufficient to pay fees incurred in connection with the loan, 3) that the principal value of the collateral invested may decline and may not be sufficient to pay back the borrower for the amount of the collateral posted, 4) that the borrower may use the loaned securities to cover a short sale which may place downward pressure on the market prices of the loaned securities, 5) that return of loaned securities could be delayed and could interfere with portfolio management decisions and 6) that any efforts to recall the securities for purposes of voting may not be effective.
As of April 30, 2008, there were no securities on loan.
| | |
| | e) | Joint Trading Account — Pursuant to an exemptive order issued by the SEC, the Fund may transfer uninvested cash balances into a joint trading account managed by Hartford Investment Management Company (“Hartford Investment Management”). These balances may be invested in one or more repurchase agreements and/or short-term money market instruments. |
| |
| | f) | Repurchase Agreements — A repurchase agreement is an agreement by which the seller of a security agrees to repurchase the security sold at a mutually agreed upon time and price. At the time the Fund enters into a repurchase agreement, the value of the underlying collateral security(ies), including accrued interest, will be equal to or exceed the value of the repurchase agreement. Securities that serve to collateralize the repurchase agreement are held by the Fund’s custodian in book entry or physical form in the custodial account of the Fund or in a third party custodial account. Repurchase agreements are valued at cost plus accrued interest. As of April 30, 2008, there were no outstanding repurchase agreements. |
| |
| | g) | Reverse Repurchase Agreements — The Fund may also enter into reverse repurchase agreements. Reverse repurchase agreements involve sales by a Fund of portfolio assets concurrently with an agreement by a Fund to repurchase the same assets at a later date at a fixed price. Reverse repurchase agreements carry the risk that the market value of the securities which a Fund is obligated to repurchase may decline below the repurchase price. A reverse repurchase agreement is viewed as a collateralized borrowing by a Fund. Borrowing magnifies the potential for gain or loss on the portfolio securities of a Fund and, therefore, increases the possibility of fluctuation in a Fund’s NAV. Reverse purchase agreements are valued at proceeds plus accrued interest. As of April 30, 2008, there were no outstanding reverse repurchase agreements. |
10
| | |
| | h) | Forward Foreign Currency Contracts — The Fund may enter into forward foreign currency contracts to hedge against adverse fluctuations in exchange rates between currencies. |
Forward foreign currency contracts involve elements of market risk in excess of the amount reflected in the Statement of Assets and Liabilities. In addition, risks may arise upon entering into these contracts from the potential inability of the counterparties to meet the terms of the contracts and from unanticipated movements in the value of the foreign currencies relative to the U.S. dollar. As of April 30, 2008, there were no open forward foreign currency contracts.
| | |
| | i) | Indexed Securities — The Fund may invest in indexed securities whose values are linked to changes in interest rates, indices, or other underlying instruments. The Fund uses these securities to increase or decrease its exposure to different underlying instruments and to gain exposure to markets that might be difficult to invest in using conventional securities. Indexed securities may be more volatile than their underlying instruments, but any loss is limited to the amount of the original investment and there may be a limit to the potential appreciation of the investment. The Fund had no investments in indexed securities, as of April 30, 2008. |
| |
| | j) | Fund Share Valuation and Dividend Distributions to Shareholders — Orders for the Fund’s shares are executed in accordance with the investment instructions of the shareholders. The NAV of the Fund’s shares is determined as of the close of each business day of the Exchange. The NAV per share is determined separately for each class of the Fund by dividing the Fund’s net assets attributable to that class by the number of shares of the class outstanding. Orders for the purchase of a Fund’s shares prior to the close of the Exchange on any day on which the Exchange is open for business are priced at the per-share NAV determined as of the close of the Exchange. Orders after the close of the Exchange, or on a day on which the Exchange and/or the Fund is not open for business, are priced at the next determined per-share NAV. |
The Fund intends to distribute substantially all of its net investment income and net realized capital gains to shareholders no less frequently than once a year. Normally, dividends from net investment income of the Fund are declared and paid quarterly. Unless shareholders specify otherwise, all dividends and distributions will be automatically reinvested in additional full or fractional shares of the Fund.
Distributions from net investment income, realized capital gains and capital are determined in accordance with federal income tax regulations, which may differ from U.S. GAAP with respect to character and timing. These differences include excise tax regulations. Permanent book and federal income tax basis differences relating to shareholder distributions will result in reclassifications to certain of the Fund’s capital accounts.
| | |
| | k) | Illiquid and Restricted Securities — The Fund is permitted to invest up to 15% of its net assets in illiquid securities. “Illiquid Securities” are those that may not be sold or disposed of in the ordinary course of business within seven days, at approximately the price used to determine the Fund’s NAV per share. The Fund may not be able to sell illiquid securities or other investments when its sub-adviser considers it desirable to do so or may have to sell such securities or investments at a price that is lower than the price that could be obtained if the securities or investments were more liquid. A sale of illiquid securities or other investments may require more time and may result in higher dealer discounts and other selling expenses than does the sale of those that are liquid. Illiquid securities and investments also may be more difficult to value, due to the unavailability of reliable market quotations for such securities or investments, and investment in them may have an adverse impact on NAV. The Fund may also purchase certain restricted securities, commonly known as Rule 144A securities, that can be resold to institutions and which may be determined to be liquid pursuant to policies and guidelines established by the Fund’s Board of Directors. |
| |
| | l) | Securities Purchased on a When-Issued or Delayed-Delivery Basis — Delivery and payment for securities that have been purchased by the Fund on a forward commitment or when-issued or delayed-delivery basis take place beyond the customary settlement period. During this period, such securities are subject to market fluctuations, and the Fund identifies securities segregated in its records with value at least equal to the amount of the commitment. As of April 30, 2008, the Fund had no when-issued or forward commitments. |
| |
| | m) | Credit Risk — Credit risk depends largely on the perceived financial health of bond issuers. In general, lower rated bonds have higher credit risk. High yield bond prices can fall on bad news about the economy, an industry or a company. The share price, yield and total return of a Fund which holds securities with higher credit risk may fluctuate more than with less aggressive bond funds. |
| |
| | n) | Senior Floating Rate Interests — The Fund as shown in the Schedule of Investments, may invest in senior floating rate interests. Senior floating rate interests hold the most senior position in the capital structure of a business entity (the “Borrower”), are typically secured by specific collateral and have a claim on the assets and/or stock of the Borrower that is senior to that held by subordinated debtholders and stockholders of the Borrower. Senior floating rate interests are typically structured and administered by a financial institution that acts as the agent of the lenders participating in the senior floating rate interest. Senior floating rate interests are typically rated below-investment-grade, which suggests they are more likely to default and generally pay higher interest rates than investment-grade loans. A default could lead to non-payment of income which would result in a reduction of income to the Fund and there can be no assurance that the liquidation of any collateral would satisfy the Borrower’s obligation in the event of non-payment of scheduled interest or principal payments, or that such collateral could be readily liquidated. |
| |
| | o) | Prepayment Risks — Most senior floating rate interests and certain debt securities allow for prepayment of principal without penalty. Senior floating rate interests and securities subject to prepayment risk generally offer less potential for gains when interest rates decline, and may offer a greater potential for loss when interest rates rise. In addition, with respect to securities, rising interest rates may cause prepayments to occur at a slower than expected rate, thereby effectively lengthening the maturity of the security and making the security more sensitive to interest rate changes. Prepayment risk is a major risk of mortgage-backed securities and certain asset-backed securities. Accordingly, the potential for the value of a senior floating rate interests or security to increase in response to interest rate declines is limited. For certain asset-backed securities, the actual maturity may be less than the stated maturity shown in the Schedule of Investments. As a result, the timing of income recognition relating to these securities may vary based upon the actual maturity. Senior floating rate interests or debt securities purchased to replace a prepaid loan or a debt security may have lower yields than the yield on the prepaid loan or debt security. |
11
The Hartford Global Enhanced Dividend Fund
Notes to Financial Statements — (continued)
April 30, 2008 (Unaudited)
(000’s Omitted)
Senior floating rate interests generally are subject to mandatory and/or optional prepayment. Because of these mandatory prepayment conditions and because there may be significant economic incentives for the Borrower to repay, prepayments of senior floating rate interests may occur. As a result, the actual remaining maturity of senior floating rate interests held may be substantially less than the stated maturities shown in the Schedule of Investments.
| | |
| | p) | Use of Estimates — The preparation of financial statements in conformity with U.S. GAAP requires management to make estimates and assumptions that affect the reported amounts of assets and liabilities as of the date of the financial statements and the reported amounts of income and expenses during the period. Operating results in the future could vary from the amounts derived from management’s estimates. |
| |
| | q) | Swaps — The Fund may enter into event linked swaps, including credit default swaps. The credit default swap market allows the Fund to manage credit risk through buying and selling credit protection on a specific issuer, an index, or a basket of issuers. A “buyer” of credit protection agrees to pay a counterparty to assume the credit risk of an issuer upon the occurrence of certain events. The “seller” of the protection receives periodic payments and agrees to assume the credit risk of an issuer upon the occurrence of certain events. A “seller’s” exposure is limited to the total notional amount of the credit default swap contract. A Fund will generally not buy protection on issuers that are not currently held by such Fund. |
The Fund may enter into interest rate swaps. In a typical interest rate swap, one party agrees to make regular payments equal to a floating interest rate multiplied by a “notional principal amount,” in return for payments equal to a fixed rate multiplied by the same amount, for a specific period of time. If a swap agreement provides for payments in different currencies, the parties might agree to exchange the notional principal amount as well. Swaps may also depend on other prices or rates, such as the value of an index or mortgage prepayment rates.
As of April 30, 2008, there were no outstanding swaps.
| | |
| | r) | Financial Accounting Standards Board Financial Accounting Standards No. 157 — In September 2006, FASB issued Statement on Financial Accounting Standards No. 157, “Fair Value Measurements” (“FAS 157”). This standard clarifies the definition of fair value for financial reporting, establishes a framework for measuring fair value and requires additional disclosures about the use of fair value measurements. FAS 157 is effective for the Fund’s financial statements issued for fiscal years after November 15, 2007, and interim periods within those fiscal years. The Fund will adopt FAS 157 when the full registrant implements the standard on January 31, 2009. As of April 30, 2008, the Fund did not believe the adoption of FAS 157 will impact the amounts reported in the financial statements, however, additional disclosures will be required about the inputs used to develop the measurements of fair value and the effect of certain measurements reported in the Statements of Operations for a fiscal period. |
| |
| | s) | Financial Accounting Standards Board Financial Accounting Standards No. 161 — In March 2008, FASB released Statement of Financial Accounting Standards No. 161, “Disclosures about Derivative Instruments and Hedging Activities” (“FAS 161”). FAS 161 requires companies to disclose information detailing the objectives and strategies for using derivative instruments, the level of derivative activity entered into by the company and any credit risk-related contingent features of the agreements. The application of FAS 161 is required for fiscal years beginning after November 15, 2008 and interim periods within those fiscal years. At this time, management is evaluating the implications of FAS 161 and its impact on the financial statements has not yet been determined. |
| |
| | t) | Securities Sold Short — As part of its principal investment strategy, the Fund will enter into short sales. In a short sale, the Fund sells a borrowed security (typically from a broker or other institution). The Fund may not always be able to borrow the security at a particular time or at an acceptable price. Thus, there is a risk that the fund may be unable to implement its investment strategy due to the lack of available stocks or for other reasons. After selling the borrowed security, the Fund is obligated to “cover” the short sale by purchasing the security and returning the security to the lender. If a security sold short increases in price, the Fund may have to cover its short position at a higher price than the short sale price, resulting in a loss. Because the Fund’s loss on a short sale arises from increases in the value of the security sold short, such loss is theoretically unlimited. In certain cases, purchasing a security to cover a short position can itself cause the price of the security to rise further, thereby exacerbating the loss. |
Short sales also involve other costs. The Fund must normally repay to the lender an amount equal to any dividends or interest that accrues while the loan is outstanding. In addition, to borrow the security, the Fund may be required to pay a premium. The Fund also will incur transaction costs in effecting short sales. The amount of any ultimate gain for the Fund resulting from a short sale will be decreased, and the amount of any ultimate loss will be increased, by the amount of premiums, dividends, interest or expenses the Fund may be required to pay in connection with the short sale. Until the Fund replaces a borrowed security, it is required to maintain a segregated account of cash or liquid assets to cover the Fund’s short position. Securities held in a segregated account can not be sold while the position they are covering is outstanding, unless they are replaced with similar securities. Additionally, the Fund must maintain a sufficient liquid asset (less any additional collateral held by the broker) to cover the short sale obligation. This may limit the Fund’s investment flexibility, as well as its ability to meet redemption or other current obligations.
Dividends declared on short positions existing on the record date are recorded on the ex-dividend date as an expense on the Statement of Operations.
Indemnifications: Under the Company’s organizational documents, the Company shall indemnify its officers and directors to the full extent required or permitted under Maryland Corporate Law and the federal securities law. In addition, the Company, on behalf of the Fund, may enter contracts that contain a variety of indemnifications. The Company’s maximum exposure under these arrangements is unknown. However, the Company has not had prior claims or losses pursuant to these contracts and expects the risk of loss to be remote.
Futures and Options Transactions — The Fund may invest in futures and options contracts in order to gain exposure to or protect against changes in the market. A futures contract is an agreement between two parties to buy and sell a security at a set price on a future date. When the Fund enters into such futures contracts, it is required to deposit with a futures commission merchant an amount of “initial margin” of cash, commercial paper or U.S. Treasury Bills. Subsequent payments, called maintenance margin, to and from the broker, are made on a daily basis as the price of the underlying security fluctuates, making the long and short positions in the futures contract more or less valuable (i.e., mark-to-market), which results in an unrealized gain or loss to the Fund.
12
At any time prior to the expiration of the futures contract, the Fund may close the position by taking an opposite position, which would effectively terminate the position in the futures contract. A final determination of maintenance margin is then made, additional cash is required to be paid by or released to the Fund and the Fund realizes a gain or loss.
The use of futures contracts involve elements of market risk, which may exceed the amounts recognized in the Statement of Assets and Liabilities. Changes in the value of the futures contracts may decrease the effectiveness of the Fund’s strategies and potentially result in loss. The Fund had no outstanding futures contracts as of April 30, 2008.
The premium paid by the Fund for the purchase of a call or put option is included in the Fund’s Statement of Assets and Liabilities as an investment and subsequently “marked-to-market” through net unrealized appreciation (depreciation) of options to reflect the current market value of the option as of the end of the reporting period.
The Fund may write covered options. “Covered” means that so long as the Fund is obligated as the writer of an option, it will own either the underlying securities or currency or an option to purchase or sell the same underlying securities or currency having an expiration date of the covered option and an exercise price equal to or less than the exercise price of the covered option, or will establish or maintain with its custodian for the term of the option a “segregated account” consisting of cash or other liquid securities having a value equal to or greater than the fluctuating market value of the option securities or currencies. The Fund receives a premium for writing a call or put option, which is recorded on the Fund’s Statement of Assets and Liabilities and subsequently “market-to-market” through net unrealized appreciation (depreciation) of options. There is a risk of loss from a change in the value of such options, which may exceed the related premiums received. The Fund had no transactions involving written option contracts for the period ended April 30, 2008.
| | |
| | a) | Federal Income Taxes — For federal income tax purposes, the Fund intends to continue to qualify as a regulated investment company under Subchapter M of the Internal Revenue Code (“IRC”) by distributing substantially all of its taxable net investment income and net realized capital gains to its shareholders and otherwise complying with the requirements of regulated investment companies. Accordingly, no provision for federal income or excise taxes has been made in the accompanying financial statements. Distributions from short-term capital gains are treated as ordinary income distribution for federal income tax purposes. |
| |
| | b) | Financial Accounting Standards Board Interpretation No. 48 — On July 13, 2006, the Financial Accounting Standards Board (FASB) released FASB Interpretation No. 48 “Accounting for Uncertainty in Income Taxes” (“FIN 48”). FIN 48 provides guidance for how uncertain tax positions should be recognized, measured, presented and disclosed in the financial statements. |
At this time, management is evaluating the implications of FIN 48. Its impact in the Fund’s financial statements has not yet been determined.
| | |
| | a) | Investment Management and Advisory Agreements — Hartford Investment Financial Services, LLC (“HIFSCO”) serves as investment manager to the Fund pursuant to an Investment Advisory Agreement for The Hartford Mutual Funds, Inc. As investment manager, HIFSCO has overall investment supervisory responsibility for the Fund. In addition, HIFSCO provides administrative personnel, services, equipment and facilities and office space for proper operation of the Fund. HIFSCO has contracted with Hartford Investment Management for the provision of day to day investment management services for the Fund. The Fund pays a fee to HIFSCO, a portion of which may be used to compensate Hartford Investment Management. |
The schedule below reflects the rates of compensation paid to HIFSCO for investment advisory services rendered from commencement of the Fund on November 28, 2007 through April 30, 2008; the rates are accrued daily and paid monthly:
Global Enhanced Dividend Fund
| | | | | |
Average Daily Net Assets | | Annual Fee | |
| |
| On first $500 million | | | 1.00 | % |
| On next $500 million | | | 0.95 | % |
| Over $1 billion | | | 0.90 | % |
HIFSCO has voluntarily agreed to waive 100% of the management fees for the Fund’s first year of operations.
| | |
| | b) | Accounting Services Agreement — Pursuant to the Fund Accounting Agreement between Hartford Life Insurance Company (“HLIC”) and the Fund, HLIC provides accounting services to the Fund and receives monthly compensation as shown below on the Fund’s average daily net assets. The Fund’s accounting services fees are accrued daily and paid monthly. |
Global Enhanced Dividend Fund
| | | | | |
Average Daily Net Assets | | Annual Fee | |
| |
| On first $5 billion | | | 0.018 | % |
| On next $5 billion | | | 0.016 | % |
| Over $10 billion | | | 0.014 | % |
13
The Hartford Global Enhanced Dividend Fund
Notes to Financial Statements — (continued)
April 30, 2008 (Unaudited)
(000’s Omitted)
| | |
| | c) | Operating Expenses — Allocable expenses incurred by the Fund are allocated to the Fund in proportion to the average daily net assets of the Fund, except where allocation of certain expenses is more fairly made directly to the Fund or to specific classes within the Fund. During the period ended April 30, 2008, HIFSCO has voluntarily limited the total operating expenses of the Class A, B, C, I, R3, R4, R5 and Y shares of the Fund, exclusive of taxes, interest, brokerage commissions, certain distribution expenses and extraordinary expenses as follows: |
| | | | | | | | | | | | | | | | | | | | | | | | | | | | | | | | | |
Fund | | Class A | | Class B | | Class C | | Class I | | Class R3 | | Class R4 | | Class R5 | | Class Y |
| |
| Global Enhanced Dividend Fund | | | 1.60% | | | | 2.35% | | | | 2.35% | | | | 1.35% | | | | 1.85% | | | | 1.60% | | | | 1.35% | | | | 1.25% | |
| | |
| | d) | Fees Paid Indirectly — The Fund has entered into an agreement with State Street Global Advisors, LLC and Frank Russell Securities, Inc. to partially recapture non-discounted trade commissions. Such rebates are used to pay a portion of the Fund’s expenses. In addition, the Fund’s custodian bank has also agreed to reduce its fees when the Fund maintains cash on deposit in the non-interest-bearing custody account. For the period November 28, 2007 to April 30, 2008, the Fund’s fees paid indirectly was less than $1, which rounds to zero and had no effect on the ratio of expenses to average net assets in the accompanying financial highlights. |
| |
| | e) | Distribution and Service Plan for Class A, B and C Shares — HIFSCO is the principal underwriter and distributor of the Fund. HIFSCO is engaged in distribution activities, which include marketing and distribution of shares through broker-dealers, financing distribution costs and maintaining financial books and records. For the period November 28, 2007 to April 30, 2008, the Fund had no revenue from distribution and service plans. |
The Fund has adopted Distribution and Service Plans in accordance with Rule 12b-1 of the Investment Company Act of 1940, as amended, to compensate the Distributor (HIFSCO) for activities intended to result in the sale and distribution of Classes A, B, C, R3 and R4 shares and for providing services for shareholders. The Rule 12b-1 plan applicable to Class A shares of the Fund provides for payment of a Rule 12b-1 fee of up to 0.35% of average daily net assets; however, the Board of Directors has currently authorized 12b-1 payments of only up to 0.25%. Some or all of the fee may be used for shareholder servicing expenses with the remainder used for distribution expenses. Some or the entire Rule 12b-1 fee for Class B shares may be remitted to broker-dealers for distribution and/or shareholder account services. Under the Class B Plan, the Fund pays the Distributor 1.00% of the average daily net assets of Class B shares that are outstanding for 8 years or less, 0.25% of which is a fee for service provided to existing shareholders with the remainder used for distribution expenses. After eight years, Class B shares convert to Class A shares. Upon conversion to Class A shares, the Class A plan described above will apply to those shares. Under the Class C Plan, the Fund pays the Distributor 1.00% of the average daily net assets of Class C shares outstanding, 0.25% of which is intended as a fee for services provided to existing shareholders with the remainder used for distribution expenses. For Class C shares, some or the entire fee may be remitted to broker-dealers for distribution and/or shareholder account services. Class R3 shares have a distribution fee of 0.50% and Class R4 shares have a distribution fee of 0.25%. For Classes R3 and R4 shares, some or the entire fee may be remitted to broker dealers for distribution and/or shareholder account services. The Fund’s 12b-1 fees are accrued daily and paid monthly.
For the period November 28, 2007 to April 30, 2008, the Fund had no sales commissions paid to affiliated brokers/dealers of The Hartford Financial Services Group, Inc. (“The Hartford”) for distributing the Fund.
| | |
| | f) | Other Related Party Transactions — Certain officers of the Fund are directors and/or officers of HIFSCO, Hartford Investment Management and/or The Hartford or its subsidiaries. For the period November 28, 2007 to April 30, 2008, a portion of the Fund’s chief compliance officer’s salary was paid by the Fund in an amount less than $1, which rounds to zero. The Fund accrues these fees daily and pays monthly. |
As of April 30, 2008, affiliates of The Hartford had ownership of shares in the Fund as follows:
| | | | | | | | | | | | | | | | | | | | | | | | | | | | | | | | | |
Fund | | Class A | | Class B | | Class C | | Class I | | Class R3 | | Class R4 | | Class R5 | | Class Y |
| |
| Global Enhanced Dividend Fund | | | 7,558 | | | | 286 | | | | 286 | | | | 287 | | | | 286 | | | | 287 | | | | 287 | | | | 287 | |
| |
| 7. | Investment Transactions: |
For the period ended April 30, 2008, aggregate purchases and sales of investment securities (excluding short-term investments) were as follows:
Purchases and sales of investment securities (excluding short sale transactions and short-term investments) aggregated $20,779 and $6,489, respectively. Purchases to cover securities sold short and securities sold short aggregated $1,665 and $5,809, respectively.
14
| |
| 8. | Capital Share Transactions: |
The following information is for the period ended April 30, 2008
| | | | | | | | | | | | | | | |
| | | | | | | Shares Issued for
| | Net Increase
|
| | | | | Shares Sold | | Reinvested Dividends | | (Decrease) of Shares |
| | | | | 2008 | | 2008 | | 2008 |
| |
| | | | | | | | | | | | | | | |
Global Enhanced Dividend Fund: |
| Class A | | Shares | | | 790 | | | | 15 | | | | 805 | |
| | | Amount | | $ | 7,900 | | | $ | 257 | | | $ | 8,157 | |
| Class B | | Shares | | | 30 | | | | 1 | | | | 31 | |
| | | Amount | | $ | 300 | | | $ | 9 | | | $ | 309 | |
| Class C | | Shares | | | 30 | | | | 1 | | | | 31 | |
| | | Amount | | $ | 300 | | | $ | 9 | | | $ | 309 | |
| Class I | | Shares | | | 30 | | | | 1 | | | | 31 | |
| | | Amount | | $ | 300 | | | $ | 10 | | | $ | 310 | |
| Class R3 | | Shares | | | 30 | | | | 1 | | | | 31 | |
| | | Amount | | $ | 300 | | | $ | 9 | | | $ | 309 | |
| Class R4 | | Shares | | | 30 | | | | 1 | | | | 31 | |
| | | Amount | | $ | 300 | | | $ | 10 | | | $ | 310 | |
| Class R5 | | Shares | | | 30 | | | | 1 | | | | 31 | |
| | | Amount | | $ | 300 | | | $ | 10 | | | $ | 310 | |
| Class Y | | Shares | | | 30 | | | | 1 | | | | 31 | |
| | | Amount | | $ | 300 | | | $ | 10 | | | $ | 310 | |
15
The Hartford Global Enhanced Dividend Fund
Financial Highlights
| | | | | | | | | | | | | | | | | | | | | | | | | | | | | | | | | | | | | | | | | | | | | | | | | | | | | | | | | | | | | | | | | | | | | | | | | |
| | | — Selected Per-Share Data(a) — | | — Ratios and Supplemental Data — |
| | | | | | | | | | | | | | | | | | | | | | | | | | | | | | | Ratio of
| | Ratio of
| | | | |
| | | | | | | | | | | | | | | | | | | | | | | | | | | | | Ratio of
| | Expenses
| | Expenses
| | | | |
| | | | | | | | | | | | | | | | | | | | | | | | | | | | | Expenses
| | to Average
| | to Average
| | | | |
| | | | | | | | | | | | | | | | | | | | | | | | | | | | | to Average
| | Net Assets
| | Net Assets
| | | | |
| | | | | | | | | Net
| | | | | | | | | | | | | | | | | | | | Net Assets
| | After
| | After
| | | | |
| | | | | | | | | Realized
| | | | | | | | | | | | Net
| | | | | | | | Before
| | Waivers and
| | Waivers and
| | Ratio of
| | |
| | | | | | | | | and
| | | | | | Distributions
| | | | | | Increase
| | | | | | | | Waivers and
| | Reimbursements
| | Reimbursements
| | Net
| | |
| | | Net Asset
| | Net
| | | | Unrealized
| | Total
| | Dividends
| | from
| | | | | | (Decrease)
| | Net Asset
| | | | Net Assets
| | Reimbursements
| | and Including
| | and Excluding
| | Investment
| | |
| | | Value at
| | Investment
| | Payments
| | Gain
| | from
| | from Net
| | Realized
| | Distributions
| | | | in Net
| | Value at
| | | | at End of
| | and Including
| | Dividend and
| | Dividend and
| | Income
| | Portfolio
|
| | | Beginning
| | Income
| | from (to)
| | (Loss) on
| | Investment
| | Investment
| | Capital
| | from
| | Total
| | Asset
| | End
| | Total
| | Period
| | Dividend
| | Short Position
| | Short Position
| | to Average
| | Turnover
|
| | | of Period | | (Loss) | | Affiliate | | Investments | | Operations | | Income | | Gains | | Capital | | Distributions | | Value | | of Period | | Return(b) | | (000’s) | | Expense(d) | | Expense(d) | | Expense(d) | | Net Assets(g) | | Rate(c) |
The Hartford Global Enhanced Dividend Fund | | | | | | | | | | | | | | | | | | | | | | | | | | | | |
| From (commencement of operations) November 28, 2007, through April 30, 2008 (Unaudited) | | | | | | | | | | | | | | | | | | | | | | | | | | | | |
| Class A | | $ | 10.00 | | | $ | 0.38 | | | $ | — | | | $ | (0.66 | ) | | $ | (0.28 | ) | | $ | (0.33 | ) | | $ | — | | | $ | — | | | $ | (0.33 | ) | | $ | (0.61 | ) | | $ | 9.39 | | | | (4 | .33)%(f) | | $ | 7,557 | | | | 1.58%(e) | | | | 0.58%(e) | | | | 0.35%(e) | | | | 9.67%(e) | | | | 51 | % |
| Class B | | | 10.00 | | | | 0.35 | | | | — | | | | (0.67 | ) | | | (0.32 | ) | | | (0.30 | ) | | | — | | | | — | | | | (0.30 | ) | | | (0.62 | ) | | | 9.38 | | | | (4 | .61)(f) | | | 286 | | | | 2.34(e | ) | | | 1.34(e | ) | | | 1.10 | (e) | | | 8.92(e | ) | | | — | |
| Class C | | | 10.00 | | | | 0.35 | | | | — | | | | (0.67 | ) | | | (0.32 | ) | | | (0.30 | ) | | | — | | | | — | | | | (0.30 | ) | | | (0.62 | ) | | | 9.38 | | | | (4 | .61)(f) | | | 286 | | | | 2.34(e | ) | | | 1.34(e | ) | | | 1.10 | (e) | | | 8.92(e | ) | | | — | |
| Class I | | | 10.00 | | | | 0.39 | | | | — | | | | (0.67 | ) | | | (0.28 | ) | | | (0.33 | ) | | | — | | | | — | | | | (0.33 | ) | | | (0.61 | ) | | | 9.39 | | | | (4 | .27)(f) | | | 287 | | | | 1.33(e | ) | | | 0.33(e | ) | | | 0.09 | (e) | | | 9.92(e | ) | | | — | |
| Class R3 | | | 10.00 | | | | 0.36 | | | | — | | | | (0.67 | ) | | | (0.31 | ) | | | (0.31 | ) | | | — | | | | — | | | | (0.31 | ) | | | (0.62 | ) | | | 9.38 | | | | (4 | .53)(f) | | | 287 | | | | 2.03(e | ) | | | 1.03(e | ) | | | 0.79 | (e) | | | 9.23(e | ) | | | — | |
| Class R4 | | | 10.00 | | | | 0.38 | | | | — | | | | (0.67 | ) | | | (0.29 | ) | | | (0.32 | ) | | | — | | | | — | | | | (0.32 | ) | | | (0.61 | ) | | | 9.39 | | | | (4 | .36)(f) | | | 287 | | | | 1.73(e | ) | | | 0.73(e | ) | | | 0.49 | (e) | | | 9.53(e | ) | | | — | |
| Class R5 | | | 10.00 | | | | 0.39 | | | | — | | | | (0.67 | ) | | | (0.28 | ) | | | (0.33 | ) | | | — | | | | — | | | | (0.33 | ) | | | (0.61 | ) | | | 9.39 | | | | (4 | .29)(f) | | | 287 | | | | 1.43(e | ) | | | 0.43(e | ) | | | 0.19 | (e) | | | 9.83(e | ) | | | — | |
| Class Y | | | 10.00 | | | | 0.39 | | | | — | | | | (0.67 | ) | | | (0.28 | ) | | | (0.33 | ) | | | — | | | | — | | | | (0.33 | ) | | | (0.61 | ) | | | 9.39 | | | | (4 | .27)(f) | | | 287 | | | | 1.33(e | ) | | | 0.33(e | ) | | | 0.09 | (e) | | | 9.92(e | ) | | | — | |
| | |
| (a) | | Information presented relates to a share of capital share outstanding throughout the indicated period. |
| (b) | | Assumes initial investment at net asset value at the beginning of each period, reinvestment of all distributions, the complete redemption of the investment at net asset value at the end of each period and no sales charge. |
| | Total return would be reduced if sales charges were taken into account. |
| (c) | | Portfolio turnover rate is calculated on the basis of the Fund as a whole without distinguishing between the classes of shares issued. |
| (d) | | Ratios do not include fees paid indirectly. (See Note 5(d) for impact on ratios) |
| (e) | | Annualized. |
| (f) | | Not annualized. |
| (g) | | The Ratio of Net Investment Income to Average Net Assets is annualized based on dividends received and expenses incurred by the Fund for the period November 28, 2007 through April 30, 2008. The full year may differ due to the volatility of dividend earnings. |
16
The Hartford Global Enhanced Dividend Fund
Directors and Officers (Unaudited)
The Board of Directors appoints officers who are responsible for the day-to-day operations of the Fund and who execute policies formulated by the Directors. Each director serves until his or her death, resignation, or retirement or until the next annual meeting of shareholders is held or until his or her successor is elected and qualifies.
Directors and officers who are employed by or who have a financial interest in The Hartford are considered “interested” persons of the Fund pursuant to the Investment Company Act of 1940, as amended. Each officer and three of the Fund’s directors, as noted in the chart below, are “interested” persons of the Fund. Each director serves as a director for The Hartford Mutual Funds, Inc., The Hartford Mutual Funds II, Inc., The Hartford Income Shares Fund, Inc., Hartford Series Fund, Inc., and Hartford HLS Series Fund II, Inc., which collectively consist of 101 funds. Correspondence may be sent to directors and officers c/o Hartford Mutual Funds, P.O. Box 2999, Hartford, Connecticut, 06104-2999, except that correspondence to Ms. Fagely, Ms. Fleege, and Ms. Settimi may be sent to 500 Bielenberg Drive, Woodbury, Minnesota 55125.
The table below sets forth, for each director and officer, his or her name, age, current position with the Funds and date first elected or appointed to The Hartford Mutual Funds, Inc. (“MF”) and The Hartford Mutual Funds II, Inc. (“MF2”), principal occupation, and, for directors, other directorships held. The Funds’ statement of additional information contains further information on the directors and is available free of charge by calling 1-888-843-7824 or writing to Hartford Mutual Funds, P.O. Box 64387, St. Paul, MN 55164-0387.
Information on the aggregate remuneration paid to the directors by the Fund can be found in the Statement of Operations herein. The Fund does not pay salaries or compensation to any of its officers or directors who are employed by The Hartford.
Non-Interested Directors
Lynn S. Birdsong (age 61) Director since 2003, Co-Chairman of the Investment Committee
Since 1981, Mr. Birdsong has been a partner in Birdsong Company, an advertising specialty firm. Since 2003, Mr. Birdsong has been an independent director of The Japan Fund. From 2003 to March 2005, Mr. Birdsong was an independent director of the Atlantic Whitehall Funds. From 1979 to 2002, Mr. Birdsong was a managing director of Zurich Scudder Investments, an investment management firm. During his employment with Scudder, Mr. Birdsong was an interested director of The Japan Fund.
Robert M. Gavin, Jr. (age 67) Director since 2002 (MF) and 1986 (MF2), Chairman of the Board since 2004
Dr. Gavin is an educational consultant. Prior to September 1, 2001, he was President of Cranbrook Education Community and prior to July 1996, he was President of Macalester College, St. Paul, Minnesota.
Duane E. Hill (age 62) Director since 2001 (MF) and 2002 (MF2), Chairman of the Nominating Committee
Mr. Hill is a Partner of TSG Ventures L.P., a private equity investment company. Mr. Hill is a former partner of TSG Capital Group, a private equity investment firm that serves as sponsor and lead investor in leveraged buyouts of middle market companies.
Sandra S. Jaffee (age 66) Director since 2005
Ms. Jaffee is Chief Executive Officer of Fortent (formerly Searchspace Group), a leading provider of compliance/regulatory technology to financial institutions. Ms. Jaffee served as an Entrepreneur in Residence with Warburg Pincus, a private equity firm, from August 2004 to August 2005. From September 1995 to July 2004, Ms. Jaffee served as Executive Vice President at Citigroup, where she was President and Chief Executive Officer of Citibank’s Global Securities Services (1995-2003).
William P. Johnston (age 63) Director since 2005, Chairman of the Compliance Committee
In June 2006, Mr. Johnston was appointed as Senior Advisor to The Carlyle Group, a global private equity investment firm. In May 2006, Mr. Johnston was elected to the Supervisory Board of Fresenius Medical Care AG & Co. KGaA, after its acquisition of Renal Care Group, Inc. in March 2006. Mr. Johnston joined Renal Care Group, Inc. in November 2002 as a member of the Board of Directors and served as Chairman of the Board from March 2003 through March 2006. From September 1987 to December 2002, Mr. Johnston was with Equitable Securities Corporation (and its successors, SunTrust Equitable Securities and SunTrust Robinson Humphrey) serving in various investment banking and managerial positions, including Managing Director and Head of Investment Banking, Chief Executive Officer and Vice Chairman.
Phillip O. Peterson (age 63) Director since 2002 (MF) and 2000 (MF2), Chairman of the Audit Committee
Mr. Peterson is a mutual fund industry consultant. He was a partner of KPMG LLP (an accounting firm) until July 1999. Mr. Peterson joined William Blair Funds in February 2007 as a member of the Board of Trustees. From January 2004 to April 2005, Mr. Peterson served as Independent President of the Strong Mutual Funds.
Lemma W. Senbet (age 61) Director since 2005
Dr. Senbet is the William E. Mayer Chair Professor of Finance at the University of Maryland, Robert H. Smith School of Business. He was chair of the Finance Department during 1998-2006. Previously he was an endowed professor of finance at the University of Wisconsin-Madison. Also, he was director of the Fortis Funds from March 2000-July 2002. Dr. Senbet served the finance profession in various capacities, including as director of the American Finance Association and President of the Western Finance Association. In 2006, Dr. Senbet was inducted Fellow of Financial Management Association International for his career-long distinguished scholarship and professional service.
17
The Hartford Global Enhanced Dividend Fund
Directors and Officers (Unaudited) — (continued)
Interested Directors and Officers
Thomas M. Marra (age 49) Director since 2002
Mr. Marra has served as President and Chief Operating Officer of The Hartford Financial Services Group, Inc. (“The Hartford”) since 2007. He is also a member of the Board of Directors of The Hartford and currently serves as a Director of Hartford Life, Inc. (“HL, Inc.”). Mr. Marra served as COO of HL, Inc. from 2000 to 2008 and as President of HL, Inc. from 2002 to 2008.
Lowndes A. Smith (age 68) Director since 2002, Co-Chairman of the Investment Committee
Mr. Smith served as Vice Chairman of The Hartford from February 1997 to January 2002, as President and Chief Executive Officer of HL, Inc. from February 1997 to January 2002, and as President and Chief Operating Officer of The Hartford Life Insurance Companies from January 1989 to January 2002.
David M. Znamierowski (age 47) Director since 1999 (MF) and 2005 (MF2)
Mr. Znamierowski currently serves as Director and President of Hartford Investment Management Company (“Hartford Investment Management”), as Chief Investment Officer and Executive Vice President for The Hartford and HL, Inc., as Director, Chief Investment Officer and Executive Vice President of Hartford Life Insurance Company (“Hartford Life”) and as Chief Investment Officer for Hartford Administrative Services Company (“HASCO”).
Other Officers
Robert M. Arena, Jr. (age 39) Vice President since 2006
Mr. Arena serves as Executive Vice President of Hartford Life and heads its Retail Products Group in the Individual Markets Group segment. Additionally, Mr. Arena is Director and Senior Vice President of HASCO, Manager and Senior Vice President/Business Line Principal of Hartford Investment Financial Services, LLC (“HIFSCO”) and Manager and Senior Vice President of HL Investment Advisors, LLC (“HL Advisors”). Prior to joining The Hartford in 2004, he was Senior Vice President in charge of Product Management for American Scandia/Prudential in the individual annuities division. Mr. Arena joined American Skandia in 1996.
Tamara L. Fagely (age 49) Vice President, Treasurer, and Controller since 1993
Ms. Fagely has been a Vice President of HASCO since 1998 and Chief Financial Officer since 2006. Currently Ms. Fagely is a Vice President of Hartford Life. She served as Assistant Vice President of Hartford Life from December 2001 through March 2005. In addition she is Controller and Chief Financial Officer of HIFSCO.
Susan Fleege (age 48) AML Compliance Officer since 2005
Ms. Fleege has served as Chief Compliance Officer for HASCO since 2005 and for Hartford Investor Services Company, LLC, (“HISC”) since 2006. Prior to joining Hartford Life in 2005, Ms. Fleege was Counsel for Ameriprise Financial Corporation from 2000 to 2005.
Thomas D. Jones, III (age 43) Vice President and Chief Compliance Officer since 2006
Mr. Jones serves as Chief Compliance Officer for the Hartford Mutual Funds and Vice President and Director of Securities Compliance for The Hartford. He is also Vice President of HIFSCO, HL Advisors, and Hartford Life. Mr. Jones joined The Hartford in 2006 from SEI Investments, where he served as Chief Compliance Officer for its mutual funds and investment advisers. Prior to joining SEI, Mr. Jones was First Vice President and Compliance Director for Merrill Lynch Investment Managers (Americas) (“MLIM”), where he worked from 1992-2004. At MLIM, Mr. Jones was responsible for the compliance oversight of various investment products, including mutual funds, wrap accounts, institutional accounts and alternative investments.
Edward P. Macdonald (age 40) Vice President, Secretary and Chief Legal Officer since 2005
Mr. Macdonald serves as Assistant General Counsel and Assistant Vice President of The Hartford and Chief Legal Officer and Vice President of HIFSCO. He also serves as Vice President of HASCO, Assistant Vice President of Hartford Life, and Chief Legal Officer, Secretary and Vice President of HL Advisors. Prior to joining The Hartford in 2005, Mr. Macdonald was Chief Counsel, Investment Management for Prudential Financial (formerly American Skandia Investment Services, Inc.). He joined Prudential in April 1999.
Vernon J. Meyer (age 44) Vice President since 2006
Mr. Meyer serves as Senior Vice President of Hartford Life and Director of its Investment Advisory Group in the Individual Market Group segment. He also serves as Senior Vice President of HIFSCO and HL Advisors. Prior to joining The Hartford in 2004, Mr. Meyer was with MassMutual which he joined in 1987.
Denise A. Settimi (age 47) Vice President since 2005
Ms. Settimi currently serves as Chief Operating Officer and Assistant Vice President of HASCO. She is also Assistant Vice President of HIFSCO and Hartford Life. Previously, Ms. Settimi was with American Express Financial Advisors, where she was Director of Retirement Plan Services from 1997 to 2003.
John C. Walters (age 46) President since 2007
Mr. Walters currently serves as President, Chief Executive Officer and Director of HL, Inc. Mr. Walters previously served as President of the U.S. Wealth Management Division and as Co-Chief Operating Officer of HL, Inc. and as Executive Vice President and Director of its Investment Products Division. Mr. Walters also serves as Chairman of the Board, Chief Executive Officer, President and Director of Hartford Life and Executive Vice President of The Hartford. In addition, Mr. Walters is the Chief Executive Officer, Manager and President of HIFSCO and HL Advisors.
18
The Hartford Global Enhanced Dividend Fund
Expense Example
Your Fund’s Expenses
As a shareholder of the Fund, you incur two types of costs: (1) transaction costs, including sales charges (loads) on purchase payments and contingent deferred sales charges (CDSC) (2) ongoing costs including management fees; distribution fees; and other fund expenses. This example is intended to help you understand your ongoing costs(in dollars) of investing in the Fund and to compare these costs with the ongoing costs of investing in other mutual funds.
The example is based on an investment of $1,000 invested at the beginning of the period and held for the period of November 28, 2007 through April 30, 2008.
Actual Expenses
The first line of the table below provides information about actual account values and actual expenses. You may use the information in this line, together with the amount you invested, to estimate the expenses that you paid over the period. Simply divide your account value by $1,000 (for example, an $8,600 account value divided by $1,000 = 8.6, then multiply the result by the number in the first line under the heading entitled “Expenses Paid During Period” to estimate the expenses you paid on your account during this period.
Hypothetical Example for Comparison Purposes
The second line of the table below provides information about hypothetical account values and hypothetical expenses based on the Fund’s actual expense ratio and an assumed rate of return of 5% per year before expenses, which is not the Fund’s actual return. The hypothetical account values and expenses may not be used to estimate the actual ending account balance or expenses you paid for the period. You may use this information to compare the ongoing costs of investing in the Fund and other funds. To do so, compare this 5% hypothetical example with the 5% hypothetical examples that appear in the shareholder reports of the other funds.
Please note that the expenses shown in the table are meant to highlight your ongoing costs only and do not reflect any transactional costs, such as sales charges (loads) and CDSC. Therefore, the second line of the table is useful in comparing ongoing costs only, and will not help you determine the relative total costs of owning different funds. In addition, if these transactional costs were included, your costs would be higher.
Expenses are equal to the Fund’s annualized expense ratios multiplied by average account value over the period, multiplied by 153/366 (to reflect the one-half year period).
| | | | | | | | | | | | | | | | | | | | | | | | | | | | | | | | | | | | | | |
| | | Actual return | | | Hypothetical (5% return before expenses) | | | | | | |
| | | | | | | Expenses paid
| | | | | | | Expenses paid
| | | | | | |
| | | Beginning
| | Ending
| | during the period
| | | Beginning
| | Ending
| | during the period
| | | | Days
| | |
| | | Account
| | Account
| | November 28, 2007
| | | Account
| | Account
| | November 28, 2007
| | Annualized
| | in the
| | Days
|
| | | Value
| | Value
| | through
| | | Value
| | Value
| | through
| | expense
| | current
| | in the
|
| | | November 28, 2007 | | April 30, 2008 | | April 30, 2008 | | | November 28, 2007 | | April 30, 2008 | | April 30, 2008 | | ratio | | 1/2 year | | full year |
The Hartford Global Enhanced Dividend Fund | | | | | | | | | | | | | | | | | | | | | | | | | |
| 1582 Class A | | $ | 1,000.00 | | | $ | 956.70 | | | $ | 2.37 | | | | $ | 1,000.00 | | | $ | 1,018.48 | | | $ | 2.45 | | | | 0.58 | % | | | 153 | | | | 366 | |
| 1583 Class B | | $ | 1,000.00 | | | $ | 953.90 | | | $ | 5.47 | | | | $ | 1,000.00 | | | $ | 1,015.30 | | | $ | 5.64 | | | | 1.34 | % | | | 153 | | | | 366 | |
| 1584 Class C | | $ | 1,000.00 | | | $ | 953.90 | | | $ | 5.47 | | | | $ | 1,000.00 | | | $ | 1,015.30 | | | $ | 5.64 | | | | 1.34 | % | | | 153 | | | | 366 | |
| 1586 Class I | | $ | 1,000.00 | | | $ | 957.30 | | | $ | 1.35 | | | | $ | 1,000.00 | | | $ | 1,019.52 | | | $ | 1.39 | | | | 0.33 | % | | | 153 | | | | 366 | |
| 1587 Class R3 | | $ | 1,000.00 | | | $ | 954.70 | | | $ | 4.21 | | | | $ | 1,000.00 | | | $ | 1,016.60 | | | $ | 4.34 | | | | 1.03 | % | | | 153 | | | | 366 | |
| 1588 Class R4 | | $ | 1,000.00 | | | $ | 956.40 | | | $ | 2.99 | | | | $ | 1,000.00 | | | $ | 1,017.85 | | | $ | 3.08 | | | | 0.73 | % | | | 153 | | | | 366 | |
| 1589 Class R5 | | $ | 1,000.00 | | | $ | 957.10 | | | $ | 1.76 | | | | $ | 1,000.00 | | | $ | 1,019.10 | | | $ | 1.81 | | | | 0.43 | % | | | 153 | | | | 366 | |
| 1585 Class Y | | $ | 1,000.00 | | | $ | 957.30 | | | $ | 1.35 | | | | $ | 1,000.00 | | | $ | 1,019.52 | | | $ | 1.39 | | | | 0.33 | % | | | 153 | | | | 366 | |
| | | | | | | | | | | | | | | | | | | | | | | | | | | | | | | | | | | | | | |
19
The Hartford Global Enhanced Dividend Fund
Approval Of Investment Management And Investment Sub-Advisory Agreements
The Hartford Global Enhanced Dividend Fund
At a meeting held on September 11-12, 2007, the Board of Directors, including each of the Independent Directors, unanimously voted to approve the investment management agreement between The Hartford Global Enhanced Dividend Fund (the “Fund”) and Hartford Investment Financial Services, LLC (“HIFSCO”), and the investment sub-advisory agreement between HIFSCO and the Fund’s sub-adviser, Hartford Investment Management Company (“Hartford Investment Management”) (collectively, the “Agreements”). The Board also received in-person presentations at its August 7-8, 2007 meeting from HIFSCO and Hartford Investment Management and the proposed portfolio manager for the Fund, Paul Bukowski, regarding the capabilities of Hartford Investment Management’s multi-discipline equity management team and the associated benefits to the Fund and its shareholders. The Board’s Investment Committee also received an in-person presentation from the portfolio manager about the team’s capabilities and the associated benefits to shareholders at its meeting on June 19, 2007. In advance of the September meeting, the Board reviewed written responses from HIFSCO and Hartford Investment Management to questions posed to them on behalf of the Independent Directors and supporting materials relating to those questions and responses (the “Adviser Materials”).
In determining to approve the Agreements, the Board concluded that the Agreements were fair and reasonable and in the best interests of the Fund and its shareholders. The Board considered the following categories of material factors, among others, relating to the agreements.
Nature, Extent and Quality of Services
The Board considered information and data concerning the nature, extent, and quality of the services to be provided to the Fund by HIFSCO and Hartford Investment Management. The Board considered, among other things, the terms of the Agreements, the range of services to be provided, and HIFSCO’s and Hartford Investment Management’s organizational structure, systems and personnel. The Board considered HIFSCO’s and Hartford Investment Management’s reputation and overall financial strength, noting the Board’s past experience with Hartford Investment Management as sub-adviser for other Hartford-sponsored funds. The Board also considered Hartford Investment Management’s efforts and progress in building its active equity management capability.
The Board and the Investment Committee met with Paul Bukowski, the proposed portfolio manager for the Fund. The Board considered HIFSCO’s representations and judgment that, although Mr. Bukowski’s team has not previously managed an enhanced dividend fund using the proposed quantitative strategy, Mr. Bukowski’s prior experience with a long/short mandate, and the Board’s past experience with Hartford Investment Management’s multi-discipline equity management team’s management of other Hartford-sponsored funds, demonstrate his and the team’s ability to manage assets in the enhanced dividend mandate. The Board also requested and reviewed information concerning the Fund’s investment strategy, mechanics and risks. In this regard, the Board considered Hartford Investment Management’s processes designed to mitigate investment risks.
The Board also requested and evaluated information concerning Hartford Investment Management’s regulatory and compliance environment. The Board focused on regulatory and compliance matters particular to the management of the Fund’s long/short equity strategy. In this regard, the Board’s Compliance Committee received an in-person presentation from Hartford Investment Management’s Chief Compliance Officer at its meeting on August 7, 2007. The Committee received information concerning Hartford Investment Management’s compliance policies and procedures with respect to the Fund’s long/short equity strategy and potential conflicts of interest with respect to other accounts managed by Hartford Investment Management. The Board considered Hartford Investment Management’s implementation of policies and procedures designed to mitigate potential conflicts of interests with respect to the Fund.
With respect to the day-to-day portfolio management services to be provided by Hartford Investment Management, the Board considered the quality of Hartford Investment Management’s investment personnel; its investment philosophy and process (and adherence to that philosophy and process); and its investment research capabilities and resources, performance record, and trade execution capabilities and experience. The Board recognized that HIFSCO is responsible for the overall management of the Fund, provides investment advisory services in connection with selecting, monitoring and supervising the Fund’s sub-advisers, and had recommended to the Board that Hartford Investment Management be appointed as a sub-adviser to the Fund.
In considering this information, the Board evaluated not only the information presented to the Board, the Investment Committee and the Compliance Committee in connection with its consideration of the Agreements, but also the Board’s experience through past interactions with HIFSCO and Hartford Investment Management. Based on these considerations, the Board concluded that it was satisfied with the nature, extent and quality of the services to be provided to the Fund by HIFSCO and Hartford Investment Management.
Performance of HIFSCO and the Sub-Adviser
The Board considered the investment performance of Hartford Investment Management and its portfolio management team. As Hartford Investment Management did not have a performance track record with respect to an investment strategy substantially similar to the strategy of the Fund, HIFSCO and Hartford Investment Management presented hypothetical historic investment performance results with respect to the investment strategy that will be used to manage the proposed Fund. This information included a report from HIFSCO showing hypothetical historic investment performance results with respect to the investment strategy versus the performance of an appropriate benchmark. In addition HIFSCO and Hartford Investment Management presented the six-month performance record of a large-cap long/short separate account strategy managed by the Hartford Investment Management’s multi-discipline equity management team versus an appropriate benchmark. In this regard, the Board noted that although the investment objective the large-cap long/short separate account strategy is different from the Fund, HIFSCO and Hartford Investment Management presented this performance information to demonstrate the multi-discipline equity management team’s ability to manage a portfolio that includes long and short equity positions. HIFSCO and Hartford Investment Management also provided additional information about the broad range of the portfolio management team’s investment experience and about their investment philosophy and process.
Based on these considerations, the Board concluded that, while there could be no guarantee of future results, the Board was satisfied that HIFSCO and Hartford Investment Management have the capability of providing satisfactory investment performance for the Fund.
Costs of Services and Profitability of HIFSCO and the Sub-Advisor
The Board reviewed information regarding HIFSCO’s and Hartford Investment Management’s costs to provide investment management and related services to the Fund and the profitability to them from managing the Fund. The Board considered information related to both HIFSCO and Hartford Investment Management, because it was proposed that Hartford Investment Management be reimbursed for its costs rather than receive a set fee, with the result that any profitability from managing the Fund would be realized only with respect to HIFSCO. In evaluating HIFSCO’s profitability, the Board considered that initially
20
HIFSCO will provide to the Fund in the form of caps on operating expenses of the Fund, and that future profitability to HIFSCO and Hartford Investment Management would depend on the growth of assets under management. Based on these considerations, the Board concluded that the profits anticipated to be realized by HIFSCO, Hartford Investment Management and their affiliates from their relationships with the Fund would not be excessive.
Comparison of Fees and Services Provided by HIFSCO and the Sub-Adviser
The Board considered comparative information with respect to the investment management fees to be paid by the Fund to HIFSCO and its affiliates. In this regard, the Board received information from HIFSCO and Hartford Investment Management relating to the management fees, sub-advisory fees, non-traditional expenses such as dividend and interest expenses, and total operating expenses for the Fund. HIFSCO also referenced information comparing the Fund’s management fees and total operating expenses relative to those of a peer universe of funds identified by Lipper. In considering the reasonableness of the Fund’s fees and total expense ratios, the Board particularly considered that according to the information provided by Lipper, the proposed management fees for the Fund would be below the average fee of its peer group at all asset levels. Based on these considerations, the Board concluded that the Fund’s management fee and sub-advisory fees, in conjunction with the information about quality of services, profitability, and other matters discussed, supports the conclusion that these fees are reasonable.
Economies of Scale
The Board considered the extent to which economies of scale would be realized as each Fund grows and whether fee levels reflect these economies of scale for the benefit of the Fund’s investors. The Board reviewed the breakpoints in HIFSCO’s management fee schedule. The Board considered HIFSCO’s representations that the Fund could be expected to achieve some economies of scale as assets in the Fund grow. The Board reviewed relevant information included in the Adviser Materials providing comparative breakpoint information for other funds in the Fund’s peer group. Based on these considerations, the Board concluded that it was satisfied with the extent to which economies of scale would be shared for the benefit of the Fund’s investors. The Board noted, however, that it would review future growth in Fund assets and the appropriateness of breakpoints as part of its future annual review of the Agreements.
Other Benefits
The Board considered other benefits to HIFSCO and Hartford Investment Management from their relationships with the Fund. The Board considered information in the Adviser Materials about HIFSCO affiliates that will provide services to the Fund and their anticipated benefits from their relationships with the Fund. The Board also considered that the following companies, which are affiliates of HIFSCO and Hartford Investment Management, provide services to the Fund and receive compensation from the Fund:
| |
| • | HIFSCO serves as the Fund’s principal underwriter and receives 12b-1 fees from the Fund. |
| |
| • | Hartford Life Insurance Company provides fund accounting and administration services to the Fund and receives a fee from the Fund for these services. |
| |
| • | Hartford Administrative Services Company, the Fund’s transfer agent, receives transfer agency compensation from the Fund. |
Based upon its review of these various factors, among others, the Board approved the Agreements. In reaching this decision, the Board also considered HIFSCO’s representation that Fund shares would be launched first with investments by HIFSCO or an affiliate and that Fund shares would not be offered to public shareholders until the Board reviews the initial operation of the Fund and approves the sale of Fund shares to public shareholders. In reaching this decision, the Board did not assign relative weights to the factors discussed above or deem any one or group of them to be controlling in and of themselves. In connection with their deliberations, the Independent Directors met separately in executive session with independent legal counsel to review the relevant materials and consider their responsibilities under relevant laws and regulations.
21
Item 2. Code of Ethics.
Not applicable to this semi-annual filing.
Item 3. Audit Committee Financial Expert.
Not applicable to this semi-annual filing.
Item 4. Principal Accountant Fees and Services.
Not applicable to this semi-annual filing.
Item 5. Audit Committee of Listed Registrants.
Not applicable to this semi-annual filing.
Item 6. Schedule of Investments
The Schedule of Investments is included as part of the semi-annual report filed under Item 1 of this form.
Item 7. Disclosure of Proxy Voting Policies and Procedures for Closed-End Management Investment Companies.
Not applicable.
Item 8. Portfolio Managers of Closed-End Management Investment Companies.
Not applicable.
Item 9. Purchases of Equity Securities by Closed-End Management Investment Company and Affiliated Purchasers.
Not applicable.
Item 10. Submission of Matters to a Vote of Security Holders
There have been no material changes to the procedures by which shareholders may recommend nominees to the registrant’s board of directors since registrant last provided disclosure in response to this requirement.
Item 11. Controls and Procedures.
| | (a) | | Based on an evaluation of the Registrant’s Disclosure Controls and Procedures as of a date within 90 days of the filing date of this report, the Disclosure Controls and Procedures are effectively designed to ensure that |
| | | | information required to be disclosed by the Registrant is recorded, processed, summarized and reported by the date of this report, including ensuring that information required to be disclosed in the report is accumulated and communicated to the Registrant’s management, including the Registrant’s officers, as appropriate, to allow timely decisions regarding required disclosure. |
| | (b) | | There was no change in the Registrant’s internal control over financial reporting that occurred during the Registrant’s last fiscal half year that has materially affected, or is reasonably likely to materially affect, the registrant’s internal control over financial reporting. |
Item 12. Exhibits.
| 11(a)(2) | | Section 302 certifications of the principal executive officer and principal financial officer of Registrant. |
| |
| | (b) Section 906 certification. |
SIGNATURES
Pursuant to the requirements of the Securities Exchange Act of 1934 and the Investment Company Act of 1940, the registrant has duly caused this report to be signed on its behalf by the undersigned, thereunto duly authorized.
| | | | | |
| | THE HARTFORD MUTUAL FUNDS, INC.
| |
| Date: June 16, 2008 | By: | /s/ John C. Walters | |
| | | John C. Walters | |
| | | Its: President | |
| |
Pursuant to the requirements of the Securities Exchange Act of 1934 and the Investment Company Act of 1940, this report has been signed below by the following persons on behalf of the registrant and in the capacities and on the dates indicated.
| | | | | |
| | | |
| Date: June 16, 2008 | By: | /s/ John C. Walters | |
| | | John C. Walters | |
| | | Its: President | |
| |
| | | |
| Date: June 16, 2008 | By: | /s/ Tamara L. Fagely | |
| | | Tamara L. Fagely | |
| | | Its: Vice President, Controller and Treasurer | |
EXHIBIT LIST
| | | | | | | |
| 99.CERT | | 11(a)(2) | Certifications |
| | | | | | | |
| | | | | | (i) Section 302 certification of principal executive officer |
| | | | | | | |
| | | | | | (ii) Section 302 certification of principal financial officer |
| | | | | | | |
| 99.906CERT | | 11(b) | Section 906 certification of principal executive officer and principal financial officer |