UNITED STATES
SECURITIES AND EXCHANGE COMMISSION
Washington, D. C. 20549
FORM 10-K
(Mark One)
| x | ANNUAL REPORT PURSUANT TO SECTION 13 OR 15(d) OF THE SECURITIES EXCHANGE ACT OF 1934 |
For the fiscal year ended December 31, 2013
OR
| ¨ | TRANSITION REPORT PURSUANT TO SECTION 13 OR 15(d) OF THE SECURITIES EXCHANGE ACT OF 1934 |
Commission file number 1-12147
DELTIC TIMBER CORPORATION
(Exact name of registrant as specified in its charter)
| | |
| Delaware | | 71-0795870 |
(State or other jurisdiction of incorporation or organization) | | (I.R.S. Employer Identification Number) |
| |
| 210 East Elm Street, P. O. Box 7200, El Dorado, Arkansas | | 71731-7200 |
| (Address of principal executive offices) | | (Zip Code) |
Registrant’s telephone number, including area code: (870) 881-9400
Securities registered pursuant to Section 12(b) of the Act:
| | |
Title of each class | | Name of each exchange on which registered |
| Common Stock, $.01 Par Value | | New York Stock Exchange, Inc. |
| Series A Participating Cumulative | | New York Stock Exchange, Inc. |
| Preferred Stock Purchase Rights | | |
Securities registered pursuant to Section 12(g) of the Act: None
Indicate by check mark if the registrant is a well-known seasoned issuer, as defined in Rule 405 of the Securities Act. Yes ¨ No x
Indicate by check mark if the registrant is not required to file reports pursuant to Section 13 or 15(d) of the Act. Yes ¨ No x
Indicate by check mark whether the registrant (1) has filed all reports required to be filed by Section 13 or 15(d) of the Securities Exchange Act of 1934 during the preceding 12 months (or for such shorter period that the registrant was required to file such reports), and (2) has been subject to such filing requirements for the past 90 days. Yes x No ¨
Indicate by check mark whether the registrant has submitted electronically and posted on its corporate Website, if any, every Interactive Date File required to be submitted and posted pursuant to Rule 405 of Regulation S-T (§232.405 of this chapter) during the preceding 12 months (or for such shorter period that the registrant was required to submit and post such files). Yes x No ¨
Indicate by check mark if disclosure of delinquent filers pursuant to Item 405 of Regulation S-K (§229.405 of this chapter) is not contained herein, and will not be contained, to the best of registrant’s knowledge, in definitive proxy or information statements incorporated by reference in Part III of this Form 10-K or any amendment to this Form 10-K. x
Indicate by check mark whether the registrant is a large accelerated filer, an accelerated filer, a non-accelerated filer, or a smaller reporting company. See the definitions of “large accelerated filer,” “accelerated filer” and “smaller reporting company” in Rule 12b-2 of the Exchange Act.
| | | | | | |
| Large accelerated filer | | ¨ | | Accelerated filer | | x |
| | | |
| Non-accelerated filer | | ¨ (Do not check if a small reporting company) | | Smaller reporting company | | ¨ |
Indicate by check mark if the registrant is a shell company (as defined in Rule 12b-2 of the Act). Yes ¨ No x
The aggregate market value of the Common Stock held by non-affiliates of the registrant, based on the closing price of the Common Stock on the New York Stock Exchange as of June 30, 2013, was $284,565,813. For purposes of this computation, all officers, directors, and 5% beneficial owners of the registrant (as indicated in Item 12) are deemed to be affiliates. Such determination should not be deemed an admission that such directors, officers, or 5% beneficial owners are, in fact, affiliates of the registrant.
Number of shares of Common Stock, $.01 Par Value, outstanding at February 13, 2014, was 12,679,270.
Documents incorporated by reference:
The Registrant’s definitive Proxy Statement relating to the Annual Meeting of Stockholders on April 24, 2014.
TABLE OF CONTENTS - 2013 FORM 10-K REPORT
2
PART I
Item 1. Business
Introduction
Deltic Timber Corporation (“Deltic” or the “Company”) is a vertically integrated natural resources company engaged primarily in the growing and harvesting of timber and the manufacturing and marketing of lumber and medium density fiberboard (“MDF”). Deltic owns approximately 458,600 acres of timberland, mainly in Arkansas and north Louisiana, stocked principally with Southern Pine, known in the industry as a type of “softwood.” The Company operates two lumber sawmills and one MDF plant, all located in Arkansas near the Company’s timberlands. In addition to its timber, lumber, and MDF operations, the Company is engaged in real estate development in central Arkansas.
The Company is organized into four segments: (1) Woodlands, which manages all aspects of the Company’s timberlands, including harvesting and sale of timber, timberland sales and acquisitions, oil and gas revenues, and leasing of hunting land; (2) Manufacturing, which consists of Deltic’s two sawmills that manufacture a variety of softwood lumber products and the Del-Tin Fiber plant that produces MDF; (3) Real Estate, which includes the Company’s three active real estate developments and a related country club operation; and (4) Corporate, which consists of executive management and the staff functions of accounting, legal, information systems, human resources, purchasing, treasury, and income tax that provide support services to the operating business units. The Company currently does not allocate the cost of maintaining these support functions to its operating units. Information concerning net sales, operating income, and identifiable assets attributable to each of the Company’s business segments is set forth in Part II of this report in Item 7, “Management’s Discussion and Analysis,” and Item 8, “Financial Statements and Supplementary Data,” Note 22, “Business Segments,” to the consolidated financial statements. Deltic is a calendar-year company for both financial and income tax reporting.
Forest Products Industry
Deltic is primarily a forest and wood products producer operating in a commodity-based business environment, with a major diversification in real estate development. This environment is affected by a number of factors, including general economic conditions, U.S. employment levels, interest rates, credit availability and associated costs, lumber and building product imports and exports, foreign exchange rates, housing starts, unsold new and existing home inventories, residential and commercial real estate foreclosures, residential and commercial repair and remodeling, residential and commercial construction, industry capacity and production levels, the availability of raw materials, utility costs, fuel cost, and weather conditions. The recovery of the U.S. housing market that began to gain momentum in 2012 continued in 2013, as evidenced by an 18 percent increase in the number of total housing starts from 2012 to 2013. As a result, demand and pricing levels for softwood lumber products improved in 2013 and 2012, and is forecast by some industry analysts to continue in 2014; however, the historically volatile nature of the building product markets will continue to affect future demand and prices. Meanwhile, sawtimber prices have generally been more stable and typically experience a lag in timing of price changes when compared to lumber markets, thus 2013 stumpage prices were still at historically low levels. The main items influencing pine sawtimber prices in Deltic’s operating area are demand from local mills and weather conditions.
The southern U.S., in which all the Company’s operations are located, is a major timber and lumber producing region. There are an estimated 215 million acres of forestland in the region, of which approximately 39 percent is currently growing softwood. Unlike other major timber-producing areas in North America, most of this acreage is privately held. The estimated breakdown of ownership of timberland in the southern U.S. is 88 percent private, 6 percent national forest, and 6 percent other public. Although there can be no assurance, management anticipates that the southern U.S. timber resource will be subject to strong demand for the foreseeable future and also believes that the South will have a strategic advantage over other U.S. timber-producing regions due to regulations, geography, and other factors.
3
Woodlands
The Company owns approximately 458,600 acres of timberland, primarily in Arkansas and north Louisiana. Management considers these timberlands to be Deltic’s most valuable asset and the harvest of Company owned stumpage to be a stable source of income. The Company’s timberlands consist primarily of Southern Pine forests. The Company follows Sustainable Forest Initiative (“SFI”) Standards, which is a system of values, objectives, and performance measures that promote sustainable forest management in North America through 14 core principles, including measures to protect water quality, biodiversity, wildlife habitat, species at risk, and forests with exceptional conservation value. The timberlands are actively managed to maximize their long-term value and increased productivity through responsible harvest plans, a commitment to reforestation, careful road construction, and other best management practices. The timber harvested from Company timberlands is either converted to lumber in the Company’s sawmills or sold in the domestic market. The Woodlands’ stumpage that is supplied to the Company’s sawmills is transferred at prices that approximate market in the sawmills’ operating area. Deltic’s strategy for growth includes the acquisition of additional timberland suitable for growing pine sawtimber in its current operating regions. This timberland management strategy also includes the identification of non-strategic timberland acres and higher and better use lands for possible sale. Timberland ownership also provides ancillary value through oil and gas lease rentals and royalties and recreational hunting land leases.
The approximate breakdown of the Company’s timberland acreage at year-end 2013 consisted of the following:
| | | | |
| | | Acres | |
Pine plantation | | | 276,900 | |
Pine forest | | | 122,100 | |
Hardwood forest | | | 6,700 | |
Other | | | 52,900 | |
| | | | |
Total | | | 458,600 | |
| | | | |
The Company’s timberlands are well diversified by age class. Pine plantations are primarily less than 30 years old, with the majority ranging in age from 5 to 25 years. The timberland classified as pine forest is primarily managed on an all-aged basis and contains mature timber that is ready to be harvested over the next several years and includes streamside-management zones. At the approximate age of 20 years, pine plantations begin transitioning from pine pulpwood to pine sawtimber.
Timber Inventory. The Company’s estimated pine sawtimber inventory is calculated for each tract by utilizing growth formulas based on representative sample tracts and tree counts for various diameter classifications. The calculation of pine inventory is subject to periodic adjustments based on sample cruises and actual volumes harvested. The hardwood inventory shown in the following table is an approximation; therefore, the physical quantity of such timber may vary significantly from this approximation.
4
Estimated inventory of standing timber as of December 31, 2013, consisted of the following:
| | | | |
| | | Estimated
Volume
(Tons) | |
Pine timber | | | | |
Sawtimber | | | 13,038,000 | |
Pulpwood | | | 4,906,000 | |
| |
Hardwood timber | | | | |
Sawtimber | | | 1,296,000 | |
Pulpwood | | | 789,000 | |
The Company’s annual harvest of pine sawtimber over the last several years has been used primarily by the sawmills of the Manufacturing segment, but at times it may be sold to third parties. Products that can be manufactured from this resource include dimension lumber, boards, timbers, and decking, which are used mainly in residential construction. Deltic’s hardwood sawtimber is sold to third parties and is primarily used in the production of railroad ties, flooring, and pallets. Logs with a diameter of less than nine inches are considered to be pulpwood. Harvests of both pine and hardwood pulpwood are sold to third parties for use primarily in the manufacture of paper products.
Timber Growth. Timber growth rate is an important variable for forest products companies since it ultimately determines how much timber can be harvested on a sustainable basis. A higher growth rate permits larger annual harvests as replacement timber regenerates. Growth rates vary depending on species, location, age, and forestry management practices. The growth rate, net of mortality, for Deltic’s Southern Pine timber averages five to six percent of standing inventory per annum. The Company considers a 30 to 35 year rotation optimal for most pine plantations.
Timberland Management. Forestry practices vary by geographic region and depend on factors such as soil productivity, weather, terrain, and the species, size, age, and stocking of timber. The Company actively manages its timberlands based on these factors and other relevant information to increase productivity and maximize the long-term value of its timber assets. In general, the Company’s timberland management involves select harvesting and thinning operations, reforestation, cull timber removal programs, and the introduction of genetically improved seedlings.
Deltic developed and currently operates its own seed orchard. Seeds from the orchard are grown by third parties to produce genetically improved seedlings for planting. These seedlings are developed through selective cross-pollination to produce trees with preferred characteristics, such as higher growth rates, fewer limbs, straighter trunks, and greater resistance to disease. However, this process does not involve genetic engineering. The seedlings are used when a site is completely replanted, as in the case of a final harvest of a mature stand. Primarily using seedlings grown from seeds produced at the orchard facility, the Company planted 17,800 acres in 2013, 17,100 acres in 2012, and 18,600 acres in 2011. In addition, the Company also replants part or all of any recently planted pine plantation acreage where there has been a high mortality rate. The Company meets or exceeds, in all material respects, the reforestation recommendations of the Arkansas Forestry Commission’s Best Management Practices. In addition, the Company has been certified under the SFI program with regards to its timberland management practices.
The Company’s silviculture program is designed to control undesirable, competitive vegetation in its forests and to increase pine growth rates and reproduction. Deltic treated about 11,900 acres, 13,300 acres, and 13,000 acres, under this program in 2013, 2012, and 2011, respectively. In addition, the Company actively utilizes commercial thinning practices. Commercial thinning operations consist of the selective removal of trees within a stand, usually a plantation, to improve overall timber productivity and value by enhancing the growth of the remaining trees while generating revenues from the harvest.
5
Harvest Plans. Management views the timberlands as assets with substantial inherent value beyond supplying its sawmills. The Company intends to continue to manage the timberlands on a sustainable-yield basis that permits regeneration of the timberlands over time and has no plans to harvest timber on an ongoing basis at levels that would diminish its timber inventory. In 2013, the Company harvested 605,361 tons of pine sawtimber from its timberlands. Under the current plan, Deltic intends to harvest approximately 615,000 tons of pine sawtimber in 2014. The Company’s harvest plans are generally designed to project multi-year harvest schedules and are updated at least annually. Harvest plans are reviewed on a monthly basis to monitor performance and to make any necessary modifications to the plans in response to changing forestry conditions, market conditions, contractual obligations, regulatory limitations, weather conditions, and other relevant factors. Harvest plans can be affected by the projections of demand, price, availability of timber from other sources, and other factors that may be outside of the Company’s control; therefore, actual harvesting levels may vary. Management believes that the Company’s harvest plans are sufficiently flexible to permit modification in response to fluctuations in the markets for logs and lumber.
Access. Substantially all of the timberlands are accessible by a system of low impact and low maintenance roads. Deltic generally uses third-party contractors to conduct construction and maintenance of these roads. In addition, the Company regularly exchanges access easements and cooperates with other area forest products companies, private landowners, and the U.S. Forest Service.
Wildlife Management. Deltic actively leases Company lands for recreational hunting purposes. As such, it monitors wildlife resources on Company property. The Company complies with the U.S. Endangered Species Act and strives to provide, maintain, and/or enhance habitats for all species with special biological or ecological concerns. The Company leased the hunting rights on approximately 448,000, 444,000, and 436,000 acres in 2013, 2012, and 2011, respectively. For the years ended 2013, 2012, and 2011, the Company had hunting lease revenues totaling $2,401,000, $2,288,000, and $2,155,000, respectively.
Client-Land Management. In addition to managing its own timberlands, Deltic also manages timberlands owned by others under management contracts with one-year renewable terms. This program provided harvest planning, silvicultural improvements, and maintenance work for approximately 75,600 acres in 2013.
Timberland Acquisitions.The Company has an ongoing program to acquire additional timberland suited for growing pine sawtimber in its current operating area. These acquisitions are designed to enable the Company to expand its timber inventory which will allow the Company to increase the annual harvest and could be used to maintain or increase the volume of logs supplied to its sawmills from its own timberlands when economically feasible.
Timberlands considered for purchase are evaluated based on the proximity to mills, site index, timber stocking, and growth potential and may include tracts that range from cutover to full-stocked. Approximately 164,000 acres of strategically located pine timberlands have been added since the inception of the program. Individual land purchases have ranged in size from 3 acres to 21,700 acres. The Company intends to continue to focus its acquisition program on timberlands in its current geographic area. Unlike other timber-producing areas of North America, most of the timberland in the southern U.S. is privately held, making it potentially available for acquisition. There can be no assurance that timber properties suitable for acquisition will be identified by the Company or that, once identified, such properties will ultimately be acquired by the Company.
Land Sales. In 1999, the Company initiated a program to identify for possible sale non-strategic timberlands and higher and better use lands. Approximately 44,800 acres of non-strategic timberlands have been sold since 1999.
Oil and Gas Revenues. Timberland ownership also provides ancillary value through oil and gas lease rentals and royalties. The Company receives oil and gas lease rental revenues when it agrees to grant certain mineral rights to third parties for periods that generally range from three to five years. Once production begins on leased mineral acres, oil and gas royalty income payments are received. Deltic earned oil and gas lease rental revenues of $1,666,000, $2,217,000, and $2,471,000 in 2013, 2012, and 2011, respectively, on related leased acres of 25,700, 33,200, and 42,300, respectively. For the years ended 2013, 2012, and 2011, the Company recorded revenues of $3,991,000, $3,336,000, and $4,443,000, respectively from oil and gas royalties. Severance taxes deducted from oil and gas royalty revenues were $551,000, $638,000, and $534,000, in 2013, 2012, and 2011, respectively. The total of all net oil and gas operating income as a percentage of the Woodlands operating income was 30 percent, 27 percent, and 31 percent in 2013, 2012, and 2011, respectively.
6
Manufacturing
Deltic owns and operates two sawmills and one MDF plant. The Company’s sawmills are located at Ola in central Arkansas (the “Ola Mill”) and at Waldo in south Arkansas (the “Waldo Mill”). Each mill is strategically located near significant portions of the Company’s timberlands, which provide a stable source of raw material stumpage for use in the manufacture of dimension lumber, boards, and timbers. These lumber products are sold primarily to wholesale distributors, lumber treaters, large retailers, industrial accounts, and truss manufacturers in the South and Midwest and are used mainly in residential construction, roof trusses, remanufactured products, and laminated beams. The mills employ modern technology in order to improve efficiency, reduce labor costs, maximize utilization of the timber resource, and maintain high quality standards of production with safety being one of the highest priorities. Logs processed into lumber are obtained from the Company’s timberlands and from public and private landowners. The Company selects logs for processing in its mills based on size, grade, and the prevailing market price. The Ola Mill is equipped for maximum utilization of smaller diameter logs, while the Waldo Mill can process both smaller and larger diameter logs.
Combined annual permitted capacity of the two mills at December 31, 2013, was 390 million board feet (“MMBF”). The Company’s lumber output decreased to 259 MMBF in 2013 compared to 271 MMBF in 2012, as production was reduced to match market demand. Adapting production levels to demand, improving mill efficiencies, and controlling manufacturing costs, remain a key strategy for managing the current cycle of the lumber market.
Deltic’s MDF plant is located at El Dorado, Arkansas, near the Waldo Mill, and it manufactures and markets MDF under the trade name of Solidium. Construction of the plant was completed, and initial production began, in 1998. Deltic formerly owned 50 percent of this plant as a joint venture and has owned 100 percent of the plant since April 1, 2013. The plant’s annual production capacity is 150 million square feet (“MMSF”), on a 3/4-inch basis, of MDF. The plant’s production of MDF was 113 MMSF in 2013, 120 MMSF in 2012, and 116 MMSF in 2011.
MDF is used primarily in furniture, kitchen cabinets, laminate flooring, store fixtures, door parts, and molding and is sold mostly to wholesalers, retailers, and manufacturers. MDF is manufactured from sawmill residuals such as chips, shavings, and sawdust which are combined with an adhesive bond and are joined together under heat and pressure. Although the technology has existed for decades, continued improvements in the manufacture of MDF have increased both the quality and market acceptance of the product. MDF, with its real wood appearance and the ability to be finely milled and to accept a variety of finishes, competes primarily with lumber.
The MDF plant provides an additional outlet for wood chip production from the Waldo Mill. The Company expects to continue to transfer a significant portion of its Waldo Mill’s residual wood shavings and chip production to the MDF plant. During 2013, 2012, and 2011, Deltic sold approximately $3,520,000, $3,652,000, and $3,654,000, respectively of these lumber manufacturing by-products to the MDF plant.
Capital Projects. Deltic has invested capital in its sawmills in recent years in order to increase production capacity and efficiency, decrease costs, improve safety, and expand the product mix. Major capital projects completed at the Ola Mill over the past several years include: (1) a gang saw control upgrade to improve operating efficiencies; (2) safety improvements, including upgrades to the planer blow system; (3) installation of a new log bucking deck to improve log recovery and increase throughput capacity; (4) trimmer and edger computer optimization upgrades to improve lumber recovery and quality; and (5) a machine stress rated (“MSR”) lumber machine.
At the Waldo Mill, major capital projects completed over the past several years include: (1) rebuilding of lumber drying kilns and boilers to improve quality and efficiency; (2) various safety improvements, including upgrades to the planer blow system; (3) an upgrade to the edger computer optimizer to improve lumber recovery and quality; (4) an upgrade to the sawmill trimmer fence unit to improve lumber recovery; and (5) replacement of an MSR lumber grading machine.
7
At the MDF plant, major capital projects completed in 2013, since the Company acquired 100 percent of the plant’s ownership, include: (1) a chain guide system and (2) refurbishment of the recuperator in the heat energy system.
Raw Materials. In 2013, the Company’s two sawmills processed 1,083,240 tons of logs, either harvested from its timberlands or purchased from private landowners and the U.S. Forest Service. Practically all of the Woodlands segment’s harvest of pine sawtimber was transferred to the mills and provided 57 percent of the sawmills’ total raw material requirements.
Various factors, including environmental and endangered species concerns, have limited, and will likely continue to limit, the amount of timber offered for sale by the U.S. Forest Service. Because of this reduced availability of federal timber for harvesting, the Company believes that its supply of timber from its timberlands is a significant competitive advantage. Deltic has historically supplied a significant portion of the timber processed in the sawmills from its timberlands.
In order to operate its sawmills economically, the Company relies on purchases of timber from third parties to supplement timber harvests from its own timberlands. The Company has an active timber procurement function for each of its sawmills. As of December 31, 2013, the Company had under contract 241,358 tons of timber on land owned by other parties, including the U.S. Forest Service, which is expected to be harvested over the next five years. During 2013, the Company harvested third-party stumpage and purchased logs from third parties totaling 468,066 tons. Of this volume, purchases from the U.S. Forest Service represented eight percent. The balance of such purchased volume was acquired from private lands.
Due to the closure or curtailment of several mills which were in close proximity to the Company’s mills, there has been a higher availability of privately owned pine timber at lower stumpage prices due to the decreased demand. There is a substantial amount of other private timber acreage in proximity to each of Deltic’s sawmills; therefore, the sources of private timber are many and diverse. The key factors in a landowner’s determination of whether to sell timber to the Company are price, the Company’s relationships with logging contractors, and the ability of the Company to demonstrate the quality of its logging practices to landowners. Typically, a landowner will be more likely to sell timber to a forest products company whose own land has been responsibly managed and harvested.
The MDF plant uses wood chips and shavings from Deltic’s Waldo Mill as well as from other area lumber producers. The plant used 272,159 tons of fiber in 2013, of which 90,426 tons or 33 percent was provided by the Waldo Mill. Other raw materials used by the plant include resins and wax. The sources, availability, and pricing of these materials are considered reliable.
Residual Wood Products. The Company pursues waste minimization practices at both of its sawmills and seeks to sell all marketable byproducts. Wood chips and shavings are usually sold to paper mills, plywood mills, or transferred to the MDF plant, and bark is frequently sold for use as fuel. Bark, sawdust, shavings, and wood chips that cannot be sold are used as “hog fuel” to fire the boilers that heat the drying kilns. The Company expects to continue to use a significant portion of its Waldo Mill’s residual wood shavings and chip production at the MDF plant.
Transportation. Each mill facility and the MDF plant have the capability to ship lumber and MDF products by truck or rail.
Cyclical Market. While the cyclicality of the lumber market may occasionally require the interruption or reduction of operations at one or both of the Company’s sawmills and MDF plant, suspension of manufacturing activities is unusual. Management is not currently anticipating any interruption of operations at any of Deltic’s manufacturing facilities, but no assurance can be given that market conditions or other factors will not render such an action economically advisable in the future.
8
Real Estate
The Company’s real estate operations were initiated to add value to former timberland strategically located in the growth corridor of west Little Rock, Arkansas. Development activities began in 1985 with the construction of Chenal Ridge, the initial, 85-lot neighborhood in Chenal Valley on the western edge of the Little Rock city limits. Since that time, the Company has been developing the remainder of Chenal Valley, a premier upscale planned community with approximately 4,900 acres of residential and commercial properties centered around two championship golf courses designed by Robert Trent Jones, Jr. The property has been developed in stages, and real estate sales to-date have consisted primarily of residential lots sold to builders or individuals and commercial tracts sold to area businesses or developers. All developed acreage in Chenal Valley has been annexed by the City of Little Rock. In addition to and outside of Chenal Valley, Deltic created Chenal Downs, a 400-acre equestrian development with controlled access, featuring secluded, five-acre lots and is located just outside the Little Rock city limits. Red Oak Ridge, Deltic’s first development outside the Little Rock area, is located in Hot Springs, Arkansas and is an 800-acre upscale community being developed for residential, resort, or retirement living and likewise has been annexed by that city.
Residential Development. Residential lots were first offered for sale in Chenal Valley during the second half of 1986 with closings beginning in 1987. As of December 31, 2013, 2,821 lots have been developed in 35 neighborhoods, and 2,672 lots have been sold, with about 2,512 residences constructed or under construction. When fully developed, Chenal Valley could include approximately 4,900 single-family residences. However, the actual number of residences in Chenal Valley will depend on final land usages and lot densities. The Company has developed lots in a wide variety of market segments. Lot size has ranged from 0.2 acres to 2.25 acres, and the lot sales price over the life of the development has ranged from $25,000 per lot to over $335,000 per lot.
The first phase of Chenal Downs was opened in December 1997, followed by a second phase in November 2000. By the end of 2013, 65 of the 76 developed lots were sold. Lot prices in Chenal Downs range from $89,000 to approximately $187,000. In Red Oak Ridge, the first two neighborhoods were offered for sale in 1998, with a third neighborhood offered in late 2005. Many of these lots overlook one of two private lakes. These neighborhoods offer a choice of either estate-sized home sites, or garden-home sized lots. As of the end of 2013, 93 of the 135 lots offered have been sold, with prices ranging from $30,000 per lot to $195,000 per lot.
Commercial Development. Commercial activity to-date has consisted of the sale of approximately 391 acres, including 27 acres in 2011, while there were no commercial acreage sales in 2013 or 2012. Commercial property sales to-date have consisted of retail store locations, an office building constructed by the Company on a nine-acre site, multi-family residence sites, convenience store locations, a bank office building site, a site for a 38-acre open-air shopping center, a 37-acre site for a medical center, and outparcels surrounding a retail center constructed and owned by the Company. Under current development plans, Chenal Valley will include approximately 815 acres of commercial property when fully developed.
In 1998 construction was completed on the initial section of Rahling Road, a major connector street to Chenal Parkway, and it provided greater access to Chenal Valley’s commercial acreage. Located at the center of this commercial property is a Company-owned 35,000-square-foot retail center. The retail center was completed in early 2000 and offers retail and office space for lease. The center is surrounded by 16 outparcels, ranging in size from 0.2 to 1.8 acres. To-date, 11 of these outparcels have been sold. In addition, St. Vincent Hospital opened its Chenal-based medical center in 2011. This, along with the success of the shopping center known as “The Promenade at Chenal” in attracting internationally branded retailers, continues to stimulate interest in the Company’s nearby available commercial property.
No commercial acreage is included in Chenal Downs, and a small amount of commercial property is planned for Red Oak Ridge. The Company will begin to develop and offer commercial sites in Red Oak Ridge as population density increases.
Infrastructure. Infrastructure and other improvements to support the development and sale of residential and commercial property are funded directly by the Company or through real property improvement districts. Such properties are developed only when sufficient demand exists and substantially all infrastructure is completed. Future infrastructure investments are primarily for the development and sale of additional property.
9
Development Amenities. In connection with its Chenal Valley development, the Company developed Chenal Country Club, consisting of the earlier-described golf courses, a clubhouse, and related facilities for use by club members. Since its original construction, Deltic has undertaken substantial remodeling and expansion of the clubhouse to fulfill membership needs. In addition, the Company has built three community parks within the Chenal Valley development for the benefit of the residents of the developed residential areas.
Chenal Downs has been developed around an equestrian center, consisting of stables and a training facility, and also includes bridle trails throughout the development. Red Oak Ridge’s primary amenities currently consist of two lakes and a community park constructed by the Company.
Home Construction. Historically, the Company’s focus with regards to residential real estate development has been on lot development only. However, Deltic has constructed a limited number of speculative homes within its Red Oak Ridge development located in Hot Springs, Arkansas. At December 31, 2013, Deltic had five homes available for sale.
Future Development. A number of factors have added significant value to the undeveloped portion of Chenal Valley. Such factors include: (1) the overall success of Chenal Valley as a residential development and its image as one of the premier developments in central Arkansas; (2) the continued westward growth of Little Rock; (3) the Company’s investment in infrastructure in the area; and (4) the established residential base which is now large enough to support commercial development. Management expects the undeveloped portion of Chenal Valley to provide growth and development opportunities in the future.
Chenal Downs has been fully developed, but development of Red Oak Ridge is in the early stages, currently consisting of the first three of several planned neighborhoods, the initial infrastructure placement and two man-made lakes that serve as the core amenity.
Continued development in the Highway 10 growth corridor of west Little Rock has significantly affected land values in the area and is expected to create real estate development opportunities for the Company’s approximately 57,000 mostly contiguous acres of timberland located two miles west of Chenal Valley.
Undeveloped Acreage. The success of Chenal Valley has increased the value of the Company’s undeveloped real estate surrounding and within the development though there were no sales of undeveloped real estate in the most recent three-year period.
Products and Competition
The Company’s principal products are timber, timberland, softwood lumber products (primarily finished lumber), MDF, residual wood products, hunting land leases, oil and gas lease rentals and royalties, and real estate.
Timber. Timber harvested from the timberlands is utilized by the Company’s sawmills or sold to third parties. The Company’s timber sales to third parties accounted for approximately two percent of consolidated net sales in 2013, and four percent in both 2012 and 2011. The Company competes in the domestic timber market with numerous private industrial and non-industrial land and timber owners. Competitive factors with respect to the domestic timber market generally include price, species and grade, proximity to wood manufacturing facilities, and accessibility.
Land Sales. Timberland sold by the Company to third parties consists of both non-strategic timberland, including hardwood bottomland suitable for recreational use, and lands with potential for higher and better use and amounted to one percent of consolidated net sales in 2013, two percent in 2012, and three percent in 2011.
10
Lumber and MDF Products. The Company’s sawmills produce a wide variety of products, including dimension lumber, boards, and timbers. Lumber is sold primarily to wholesaler distributors, lumber treaters, and truss manufacturers in the South and Midwest and is used in residential construction, roof trusses, and laminated beams. During 2013, 2012, and 2011, lumber sales as a percentage of consolidated net sales were approximately 50 percent, 60 percent, and 53 percent, respectively. MDF is sold primarily to wholesaler distributors, retailers, and manufacturers, in the United States and is used in residential remodeling, and the manufacturing of flooring, cabinets, molding, furniture, and store fixtures. Deltic began reporting MDF sales effective April 1, 2013 when it acquired 100 percent of the Del-Tin Fiber plant, formerly a joint venture reported as an equity method investment. For the nine months ended December 31, 2013, MDF sales as a percentage of consolidated net sales were 23 percent.
The forest products market is highly competitive with respect to price and quality of products. In particular, competition in the commodity-grade lumber and MDF markets in which the Company competes is primarily based on price and availability. Deltic competes with other publicly held forest products companies operating in the U.S., many of which have significantly greater financial resources than the Company, as well as privately held lumber producers. The Company also competes with producers in Canada and overseas.
Deltic’s management expects the Company’s products to experience additional increased competition from engineered wood products and other substitute products. However, due to the geographic location of Deltic’s timberlands and its high-quality timber, the Company’s active timber management program, strategically located and efficient sawmill operations, and highly motivated workforce, Deltic has been able to compete effectively.
Residual Wood Products. The Company’s sawmills produce wood chips, shavings, sawdust, and bark as by-products of the conversion process. During 2013, 2012, and 2011, third-party sales of these residual products accounted for 6 percent, 11 percent, and 12 percent, respectively, of Deltic’s consolidated net sales. Wood chips are the primary source of residual sales and are typically used at the MDF plant or sold to paper mills. In 2013, Deltic’s sawmills produced 340,290 tons of wood chips. The Company expects to continue to use a significant portion of its wood chip production in the manufacture of MDF.
Hunting Land Leases.Deltic leases hunting rights for its Woodlands to individuals and groups with its main competitors being other landowners. Per-acre price and location are the primary factors in leasing woodland hunting rights. Hunting lease revenues accounted for one percent of consolidated net sales in 2013 and two percent in 2012 and 2011.
Oil and Gas. The Company has approximately 34,600 net mineral acres of Company-owned land either currently under lease or held by production. Once production begins, oil and gas royalty payments are received. Oil and gas lease rental payments are recognized as income over the term of the lease, and oil and gas royalty payments are recognized as income when received. Oil and gas lease rental income accounted for one percent in 2013 and two percent of consolidated net sales in 2012 and 2011. Oil and gas royalty revenue accounted for two percent, two percent, and four percent of consolidated net sales in 2013, 2012, and 2011, respectively. Oil and gas royalty income is dependent upon the number of producing wells, volume extracted, and market prices, none of which are controlled by the Company.
Real Estate. The Company develops and markets residential lots and commercial sites and also sells undeveloped acreage. Residential lots are sold to homebuilders and individuals, while commercial sites are sold to developers and businesses. Deltic generally provides the supporting infrastructure as part of the development. Other landowners or developers are Deltic’s competitors in its real estate markets and are seeking the same customer base, with each competitor marketing the benefits of its site locations, related infrastructure or amenities. During 2013, 2012, and 2011, the sales of residential lots and commercial sites as a percentage of consolidated net sales were three percent, two percent, and four percent, respectively. The sale of commercial property can have a significant impact on the Company’s sales but is unpredictable and sporadic.
11
Seasonality
The Company’s operating segments are subject to variances in financial results due to several seasonal factors. Increased housing starts and home remodeling projects during the spring usually push up lumber prices. Forestry operations generally incur silvicultural treatment expenses in the third quarter because they are applied during the fall season in order to achieve maximum effectiveness.
Environmental Matters
The Company is subject to extensive and changing federal, state, and local environmental laws and regulations relating to the protection of human health and the environment, including laws relating to air and water quality, greenhouse gas emissions, the use of herbicides on timberlands, regulation of “wetlands,” and the protection of endangered species. Environmental legislation and regulations, and the interpretation and enforcement thereof, are expected to become increasingly stringent. The Company has made, and will continue to make, expenditures to comply with such requirements in the ordinary course of its operations. Historically, these expenditures have not been material, and the Company expects that this will continue to be the case. Liability under certain environmental regulations may be imposed without regard to fault or the legality of the original actions and may be joint and several with other responsible parties. As a result, in addition to ongoing compliance costs, the Company may be subject to liability for activities undertaken on its properties prior to its ownership or operation and for activities by third parties, including tenants. The Company is not involved with any such sites at this time. The Company leases the rights to drill for oil and gas on some of its lands to third parties. Pursuant to these leases, the lessee is to indemnify the Company from environmental liability relating to the lessee’s operations. Based on its present knowledge, including the fact the Company is not currently aware of any facts that indicate the Company will be required to incur any material costs relating to environmental matters. Under currently applicable laws and regulations, the Company believes environmental matters are not likely to have a material adverse effect on the Company’s financial condition, results of operations, or liquidity.
The federal Endangered Species Act (“the Act”) protects species threatened with possible extinction and restricts timber harvesting activities on private and federal lands. Certain of the Company’s timberlands are subject to such restrictions due to the presence on the lands of the red-cockaded woodpecker, a species protected under the Act. The yellowcheek darter was recently listed as endangered and is found in the Little Red River basin in Arkansas where considerable acreage is owned by Deltic. Although at this time there are no current restrictions, there can be no assurance that the presence of these species or the discovery of other protected species will not subject the Company to future harvesting restrictions. However, based on the Company’s knowledge of its timberlands, the Company does not believe that its ability to harvest its timberlands will be materially adversely affected by the protection of endangered species.
Congress has been considering certain climate control legislation for some time. Due to uncertainties with any proposed legislation, it is difficult to make an assessment of the impact of such legislation upon the Company’s operations until such time as such legislation has been passed, codified, and the appropriate regulation promulgated. The Company will continue to monitor the legislative process and any possible future legislation or regulatory actions and their effects upon its operations.
12
Access to SEC Filings
The Company maintains an internet website at www.deltic.com. The Company makes available free of charge under the Investor Relations section of its website its annual report on Form 10-K, quarterly reports on Form 10-Q, current reports on Form 8-K, and all amendments to any of those reports, and other filings as soon as reasonably practicable after providing such reports to the Securities and Exchange Commission.
Employees
As of January 31, 2014, the Company had 537 employees.
13
Cyclicality of Forest Products Industry
The Company’s results of operations are, and will continue to be, affected by the cyclical nature of the forest products industry. Prices and demand for logs and manufactured wood products have been, and in the future can be expected to be, subject to cyclical fluctuations. The demand for logs and lumber is primarily affected by the level of new residential construction activity. This activity is subject to fluctuations due to changes in economic conditions, availability and cost of financing for developers, mortgage interest rates, new and existing housing inventory levels, foreclosure rates, population growth, weather conditions, and other factors. Decreases in the level of residential construction activity usually will be reflected in reduced demand for logs and lumber resulting in lower prices for the Company’s products and lower revenues, profits, and cash flows. In addition to housing starts, demand for wood products is also significantly affected by repair and remodeling activities and industrial uses, demand for which has historically been less cyclical. Furthermore, changes in industry supply of timber affect prices. Although the Company believes sales of timber by United States government agencies will remain at relatively low levels for the foreseeable future, any reversal of policy that substantially increases such sales could significantly reduce prices for logs and lumber, which could have a material adverse effect on the Company. Furthermore, increased imports from foreign countries could reduce the prices the Company receives for its products. Meanwhile, possible reductions of Canadian imports due to mountain pine beetle infestation could increase prices the Company receives for its products.
Limitations on the Company’s Ability to Harvest Timber
Revenues from the Company’s future operations will depend to a significant extent on its ability to harvest timber pursuant to its harvest plans from its 458,600 acres of timberlands (the “Timberlands”). Harvesting of the Timberlands may be affected by various natural factors, including damage by fire, insect infestation, disease, prolonged drought, severe weather conditions, ice storms, higher than normal amounts of rainfall, and other causes. The effects of these natural factors may be particularly damaging to young timber. To the extent possible, the Company implements measures to limit the risk of damage from such natural causes. The Company is a participant with state agencies and other timberland owners in cooperative fire fighting and fire surveillance programs. In addition, the Timberlands’ extensive system of access roads, firelines, and the physical separation of various tracts provide some protection against fire damage. Nonetheless, one or more major fires on the Timberlands could adversely affect Deltic’s operating results. The Timberlands may also be affected by insect infestation, particularly by the southern pine beetle, and by disease. Additionally, the Timberlands may be affected by severe weather conditions, especially ice storms, tornados, and heavy winds. Although damage from such natural causes usually is localized and affects only a limited percentage of the timber, there can be no assurance that any damage affecting the Timberlands will, in fact, be so limited. As is typical in the forest products industry, the Company does not maintain insurance coverage with respect to damage to the Timberlands. The Company does, however, maintain insurance for loss of logs due to fire and other occurrences following their receipt at the Company’s sawmills.
Operation of Sawmills
The Company’s sawmills are located at Ola in central Arkansas and Waldo in southern Arkansas. The operations of the sawmills are dependent on various factors, and there can be no assurance that the Company will be able to continue such operations at current levels of production or that suspension of such operations may not be required in the future. One such factor is the ability of the Company to procure sufficient logs at suitable prices. The Company obtains logs for its sawmills from the Timberlands, other private sources, and federal lands. As previously discussed, prices for logs are cyclical and affected primarily by demand for lumber and other products produced from logs. Another such factor is the ability of the Company to find an outlet for the large volume of residual wood products that result from the milling process. The Company currently markets such products to third parties for the production of paper and other uses. In addition, the Company uses a significant portion of its residual wood chips at its MDF plant. The continued operation of the sawmills is subject generally to the risk of business interruption in the event of a fire or other natural disaster, regulatory actions, or other causes. Deltic mitigates this risk through the procurement of casualty and business interruption insurance. On January 30, 2013, the Board of Review of the American Lumber Standard Committee approved new
14
design values for all sizes and grades of visually graded Southern Pine dimension lumber. The new design values became effective on June 1, 2013. Using machine stress rated (“MSR”) machines and visual lumber graders, the Company is capable of providing several product options to its customers. One such option is MSR lumber. The Company anticipates no material impact to its lumber business from these design value changes.
MDF Plant
The Del-Tin Fiber plant manufactures and markets MDF and is located near El Dorado, Arkansas. Construction of the plant was completed, and initial production began, in 1998 and Deltic became the sole owner on April 1, 2013. Previously Del-Tin Fiber was a joint venture owned 50 percent by Deltic and treated as an equity investment. Demand for MDF is subject to many of the same factors as other wood products such as housing starts, furniture production, residential improvements, import fluctuations, and industry capacity. The industry is also facing higher costs resulting from compliance with California Air Resources Board (“CARB”) regulations. Additionally, the MDF plant operations are subject to risk of business interruptions due to fire or other natural disasters, regulatory actions, or other causes. Casualty and business interruption insurance is used to mitigate this risk.
Competition
The forest products industry is highly competitive in terms of price and quality. The products of the Company are subject to increasing competition from a variety of non-wood and engineered wood products. In addition, the Company is subject to a potential increase in competition from lumber products and logs imported from foreign sources. Any significant increase in competitive pressures from substitute products or other domestic or foreign suppliers could have a material adverse effect on the Company.
Federal and State Environmental Regulations
The Company is subject to extensive and changing federal, state, and local environmental laws and regulations relating to the protection of human health and the environment, the provisions and enforcement of which are expected to become more stringent in the future. The Company has made and will continue to make non-material expenditures to comply with such provisions. Based on currently available information, the Company believes environmental regulation will not materially adversely affect the Company, but there can be no assurances that environmental regulation will not have a material adverse effect on the financial condition, results of operations, or liquidity of the Company in the future. In December 2012, the Environmental Protection Agency issued new Major Source Boiler Maximum Achievable Control Technology, “Boiler MACT,” rules that are effective in early 2016. The Company is in the process of reviewing the rules as they apply to the mill facilities and is unable at this time to estimate the cost of compliance with these new rules. Climate control legislation being considered by Congress or potentially more restrictive guidelines issued by governmental regulatory agencies are examples of changes that, if approved, could increase compliance costs as well as direct manufacturing expenses.
Geographic Concentration and Risk Associated with Real Estate Development
The Company’s real estate development projects are located in central Arkansas, specifically, in and west of Little Rock, Arkansas and in Hot Springs, Arkansas. Accordingly, the Company’s real estate operations are particularly vulnerable to any economic downturns or other adverse events that may occur in this region and to competition from nearby residential housing developments. The Company’s results of operations may be affected by the cyclicality of the homebuilding and real estate industries generally. Factors include changes in population growth, general and local economic conditions, such as employment levels, consumer confidence and income, housing demand, new and existing housing inventory levels, availability and cost of financing, mortgage interest rates and foreclosures, and changes in government regulation regarding the environment, zoning, real estate taxes, and other local government fees. In addition, the tightening of credit and economic recession could delay or deter commercial real estate activity and may affect the Company’s operating results.
15
General Economic Conditions
The ongoing recovery of the housing industry combined with a steady improvement in the general economy could provide a positive impact to the operating results for the Company. Similarly, a deterioration of the global credit markets could adversely affect the Company’s access to capital. Deltic’s customers’ and suppliers’ ability to obtain financing could negatively affect the Company’s business if their ability to operate or fund transactions is impaired.
Reliance on Key Personnel
The Company believes that its continued success will depend in large part on its ability to attract and retain highly skilled and qualified personnel. The Company offers management incentives in a manner that are directly linked to the Company’s performance, which the Company believes will facilitate the attraction, retention, and motivation of highly skilled and qualified personnel. In this regard, the Company has taken steps to retain its key personnel, including the provision of competitive employee benefit programs. Although the Company will seek to employ qualified individuals, in the event that officers or other key employees of the Company cease to be associated with the Company, there can be no assurance that such individuals could be engaged by the Company.
Dividend Policy
Payment of dividends is the means by which Deltic Timber Corporation makes distributions to its shareholders of the profits and cash flows generated by the Company’s business operations. These dividends are declared by the Company’s Board of Directors on a quarterly basis. The Company’s dividend strategy is to grow the amount of the dividend over time, at a rate of increase that is believed to be sustainable. The timing and amount of future increases are based on the estimated trend for future earnings and cash flows, taking into account other potential uses of the Company’s capital resources including, but not limited to, acquisition opportunities, capital expenditures for existing operations, debt repayments, and repurchases of the Company’s common stock.
Anti-Takeover Effects of Certain Statutory, Charter, Bylaw and Contractual Provisions
Several provisions of the Company’s Certificate of Incorporation and Bylaws and of the Delaware General Corporation Law could discourage potential acquisition proposals and could deter or delay unsolicited changes in control of the Company, including provisions creating a classified Board of Directors, limiting the stockholders’ powers to remove directors, and prohibiting the taking of action by written consent in lieu of a stockholders’ meeting. The preferred stock purchase rights attached to the Company’s common stock could have similar anti-takeover effects. In addition, the Company’s Board has the authority, without further action by the stockholders, to fix the rights and preferences of and to issue preferred stock. The issuance of preferred stock could adversely affect the voting power of the owners of the Company’s common stock, including the loss of voting control to others. Transactions subject to these restrictions will include, among other things, the liquidation of the Company; the merger, consolidation, or other combination or affiliation of the Company with another company; discontinuance of or material change in the conduct of a material portion of its businesses independently and with its own employees; redemption or other reacquisition of the Company’s common stock; and the sale, distribution, or other disposition of assets of the Company out of the ordinary course of business.
These provisions and others that could be adopted in the future could discourage unsolicited acquisition proposals or delay or prevent changes in control or management of the Company, including transactions in which stockholders might otherwise receive a premium for their shares over then-current market prices. In addition, these provisions could limit the ability of stockholders to approve transactions that they may deem to be in their best interests.
Information Systems
Secure information technology systems are relied upon to provide the ability to effectively manage the business data, communications, order entry and fulfillment, and other business processes of the Company. These information technology systems and those used by the Company’s third party providers may be vulnerable to damage or interruption by circumstances beyond the Company’s control,
16
including fire, natural disasters, system failures, cyber attacks, and viruses. Deltic has made an assessment of the controls involving the information systems and the related cybersecurity issues and has concluded that the failure of the information technology systems to perform adequately may cause temporary data processing or communication inefficiencies but would not have a materially adverse effect on Deltic’s business or operations.
Oil and Gas Leasing and Royalty Revenue
Deltic receives mineral revenues in the form of oil and gas lease rentals and oil and gas royalties. These properties are operated by other companies, and Deltic has no control over the operation or future development of such properties, including compliance with environmental, safety, and other regulations. Oil and natural gas prices, which are volatile, impact the amounts received in royalty revenues and amounts for selling and renewing mineral leases. Therefore, Deltic’s cash flows and results of operation are to a degree dependent on oil and natural gas prices and cannot be predicted or controlled.
| Item 1B. | Unresolved Staff Comments |
None.
The Company’s properties, primarily located in Arkansas and north Louisiana, consist principally of fee timber and timberlands, sawmill property, a medium density fiberboard plant, and residential and commercial real estate held for development and sale. As of December 31, 2013, the Company’s timber and timberlands, sawmills, MDF plant, and investment in real estate held for development and sale consisted of the following:
| | | | |
Timberland acres by state: | | | | |
Arkansas | | | 451,395 | |
Louisiana | | | 7,025 | |
Texas | | | 152 | |
Sawmill locations and permitted annual capacity in million board feet: | | | | |
Ola, Arkansas | | | 165 | |
Waldo, Arkansas | | | 225 | |
MDF plant location and permitted annual capacity in million square feet based on 3/4-inch panel thickness: | | | | |
El Dorado, Arkansas | | | 150 | |
Real Estate properties in acres: | | | | |
Little Rock, Arkansas | | | 5,696 | |
Hot Springs, Arkansas | | | 791 | |
Real Estate sales office building in Little Rock, Arkansas | | | | |
(For further information on the location and type of the Company’s properties, see the descriptions of the Company’s operations in Item 1.)
17
From time to time, the Company is involved in litigation incidental to its business. Currently, there are no material legal proceedings.
| Item 4. | Mine Safety Disclosures |
Not applicable.
18
Executive Officers of the Registrant
The age (at January 1, 2014), present corporate office, and length of service in office of each of the Company’s executive officers and persons chosen to become officers are reported in the following listing. Executive officers are elected annually but may be removed from office at any time by the Board of Directors.
Ray C. Dillon - Age 58; President and Chief Executive Officer and a director of the Company, effective July 1, 2003. Prior to joining the Company, Mr. Dillon was employed at Gaylord Container Corporation, where from April 2000 through December 2002, he was Executive Vice President, and preceding his election as Executive Vice President, he was Vice President, Primary Product Operations from April 1997.
Kenneth D. Mann - Age 54; Vice President, Treasurer, and Chief Financial Officer, effective May 1, 2007. From September 2004 to April 2007, Mr. Mann was Controller for the Company. From September 2002, to September 2004, Mr. Mann was Manager of Corporate Governance and Investor Relations. From January 1997 to September 2002, Mr. Mann was Assistant Controller.
Jim F. Andrews, Jr. - Age 49; Vice President, General Counsel, and Secretary, effective October 15, 2010. From July 2001 to October 2010, Mr. Andrews served as in-house legal counsel for the Company.
Kent L. Streeter - Age 53; Vice President of Operations, effective November 16, 2003. Prior to joining the Company, Mr. Streeter was Operations Manager of a large paper mill located in the Southeastern United States from January 1997, which has been owned since April 2002, by Temple-Inland, Inc. and prior to that by Gaylord Container Corporation.
David V. Meghreblian - Age 55; Vice President of Real Estate, effective November 16, 2003. From May 2000 to November 2003, Mr. Meghreblian was Vice President of Operations for the Company. From November 1996 to April 2000, Mr. Meghreblian was General Manager of Planning and Investor Relations for Deltic. Prior to such time, Mr. Meghreblian was General Manager of Project Development, a position he held beginning in November 1995.
Byrom L. Walker - Age 52; Controller, effective May 1, 2007. From March 2006 to May 2007, Mr. Walker was Manager of Financial Reporting for Deltic. Prior to joining the Company, Mr. Walker was Corporate Controller for Teris, LLC, a division of Suez S.A., a position he held from 2004.
19
PART II
| Item 5. | Market for Registrant’s Common Equity, Related Stockholder Matters, and Issuer Purchases of Equity Securities |
Common stock of Deltic Timber Corporation is traded on the New York Stock Exchange under the symbol “DEL”. The following table sets forth the high and low prices, along with the quarterly dividends paid, for each of the quarters indicated:
| | | | | | | | | | | | |
| | | Sales Price | | | Dividend per | |
| | | High | | | Low | | | Common Share | |
2013 | | | | | | | | | | | | |
First Quarter | | $ | 73.97 | | | | 68.48 | | | | .100 | |
Second Quarter | | $ | 68.64 | | | | 57.29 | | | | .100 | |
Third Quarter | | $ | 67.77 | | | | 57.70 | | | | .100 | |
Fourth Quarter | | $ | 71.50 | | | | 59.75 | | | | .100 | |
| | | |
2012 | | | | | | | | | | | | |
First Quarter | | $ | 72.02 | | | | 59.91 | | | | .075 | |
Second Quarter | | $ | 64.49 | | | | 53.47 | | | | .075 | |
Third Quarter | | $ | 69.22 | | | | 58.37 | | | | .075 | |
Fourth Quarter | | $ | 71.50 | | | | 59.75 | | | | .075 | |
Common stock dividends were declared to be paid for each quarter during 2013 and 2011. As of December 31, 2013, there were approximately 829 stockholders of record of Deltic’s common stock.
In December 2000, the Company’s Board of Directors authorized a stock repurchase plan of up to $10 million of Deltic common stock. On December 13, 2007, Deltic announced an expansion of its repurchase program by $25 million. There is no stated expiration date regarding this authorization. There were purchases of 36,180 shares under the program in 2013. Information pertaining to this plan for the fourth quarter of 2013 is presented in the table below.
| | | | | | | | | | | | | | | | |
Period | | Total
Number
of Shares
Purchased | | | Average
Price
Paid
Per
Share | | | Total
Number of
Shares
Purchased
as Part
of Publicly
Announced
Plans or
Programs | | | Maximum
Approximate
Dollar Value
of Shares that
May Yet Be
Purchased
Under the
Plans or
Programs | |
October 1 through October 31, 2013 | | | — | | | | — | | | | — | | | $ | 18,230,681 | |
| | | | |
November 1 through November 30, 2013 | | | — | | | | — | | | | — | | | $ | 18,230,681 | |
| | | | |
December 1 through December 31, 2013 | | | — | | | | — | | | | — | | | $ | 18,230,681 | |
Information regarding securities authorized for issuance under equity compensation plans required by this item is contained in Item 12 of this Form 10-K and is incorporated herein by reference.
20
| Item 5. | Market for Registrant’s Common Equity, Related Stockholder Matters, and Issuer Purchases of Equity Securities (cont.) |
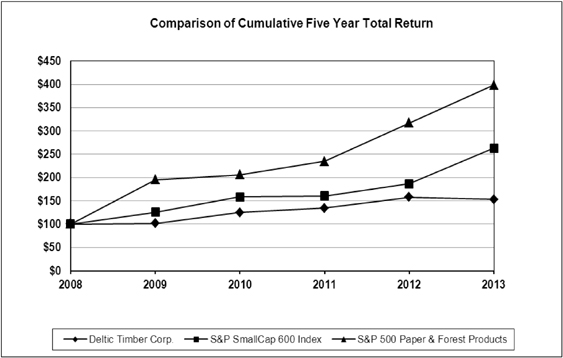
The graphed stock performance represents the cumulative total return for the Company’s common stock compared to issuers with similar capitalization and to peer industry issuers for the period December 31, 2007, through December 31, 2013. The calculated returns assume an investment of $100 on December 31, 2007, and that all dividends were reinvested.
21
| Item 6. | Selected Financial Data |
The following table presents certain selected consolidated financial data for each of the years in the five-year period ended December 31, 2013.
| | | | | | | | | | | | | | | | | | | | |
| (Thousands of dollars, except per share amounts) | | 2013 | | | 2012 | | | 2011 | | | 2010 | | | 2009 | |
Results of Operations for the Year | | | | | | | | | | | | | | | | | | | | |
| | | | | |
Net sales | | $ | 199,702 | | | | 140,908 | | | | 121,847 | | | | 141,623 | | | | 112,012 | |
Operating income | | $ | 35,663 | | | | 17,132 | | | | 7,459 | | | | 17,909 | | | | 5,870 | |
Net income | | $ | 26,192 | | | | 9,235 | | | | 2,659 | | | | 12,397 | | | | 3,688 | |
Comprehensive income/(loss) | | $ | 37,616 | | | | 4,861 | | | | (4,344 | ) | | | 14,880 | | | | 5,386 | |
Earnings per common share | | | | | | | | | | | | | | | | | | | | |
Basic | | $ | 2.06 | | | | .73 | | | | .21 | | | | .99 | | | | .30 | |
Assuming dilution | | $ | 2.05 | | | | .73 | | | | .21 | | | | .99 | | | | .30 | |
Cash dividends declared percommon share | | $ | .40 | | | | .30 | | | | .30 | | | | .30 | | | | .30 | |
Net cash provided/(required) by | | | | | | | | | | | | | | | | | | | | |
Operating activities | | $ | 42,142 | | | | 24,082 | | | | 14,639 | | | | 28,898 | | | | 16,914 | |
Investing activities | | $ | (33,792 | ) | | | (16,835 | ) | | | (11,112 | ) | | | (864 | ) | | | (25,772 | ) |
Financing activities | | $ | (9,589 | ) | | | (4,925 | ) | | | (4,067 | ) | | | (28,986 | ) | | | 11,228 | |
Percentage return on | | | | | | | | | | | | | | | | | | | | |
Average stockholders’ equity | | | 10.6 | | | | 4.0 | | | | 1.2 | | | | 5.6 | | | | 1.8 | |
Average borrowed and invested capital | | | 9.2 | | | | 4.6 | | | | 2.3 | | | | 5.3 | | | | 2.5 | |
Average total assets | | | 6.6 | | | | 2.7 | | | | .8 | | | | 3.5 | | | | 1.1 | |
| | | | | |
Capital Expenditures for the Year | | | | | | | | | | | | | | | | | | | | |
| | | | | |
Woodlands | | $ | 12,755 | | | | 18,553 | | | | 7,817 | | | | 6,144 | | | | 25,075 | |
Manufacturing | | $ | 16,532 | | | | 2,478 | | | | 3,570 | | | | 5,330 | | | | 3,006 | |
Real Estate | | $ | 4,267 | | | | 2,996 | | | | 4,223 | | | | 3,859 | | | | 4,464 | |
Corporate | | $ | 14 | | | | 7 | | | | 87 | | | | 235 | | | | 160 | |
| | | | | | | | | | | | | | | | | | | | |
| | | | | |
| | $ | 33,568 | | | | 24,034 | | | | 15,697 | | | | 15,568 | | | | 32,705 | |
| | | | | | | | | | | | | | | | | | | | |
| | | | | |
Financial Condition at Year-End | | | | | | | | | | | | | | | | | | | | |
| | | | | |
Working capital | | $ | 5,484 | | | | 5,566 | | | | 3,618 | | | | 2,520 | | | | 5,414 | |
Current ratio | | | 1.25 to 1 | | | | 1.43 to 1 | | | | 1.28 to 1 | | | | 1.16 to 1 | | | | 1.41 to 1 | |
Total assets | | $ | 411,344 | | | | 353,209 | | | | 341,870 | | | | 343,273 | | | | 352,203 | |
Long-term debt | | $ | 90,000 | | | | 63,000 | | | | 64,000 | | | | 65,611 | | | | 91,222 | |
Stockholders’ equity | | $ | 266,272 | | | | 232,230 | | | | 227,123 | | | | 230,011 | | | | 216,299 | |
Long-term debt to stockholders’ equity ratio | | | .338 to 1 | | | | .271 to 1 | | | | .282 to 1 | | | | .285 to 1 | | | | .422 to 1 | |
22
| Item 7. | Management’s Discussion and Analysis of Financial Condition and Results of Operations |
Executive Overview
Deltic Timber Corporation (“Deltic” or the “Company”) is a vertically integrated natural resources company operating in a commodity-based business environment and is engaged in the growing and harvesting of timber, as well as the manufacturing and marketing of lumber and medium density fiberboard (“MDF”) with a major diversification in real estate development. The Company owns approximately 458,600 acres of timberland, mainly in Arkansas and north Louisiana. Deltic has two sawmills and one MDF plant. One of the sawmills is located in central Arkansas at Ola (the “Ola Mill”), the other sawmill is located in south Arkansas at Waldo (the “Waldo Mill”), near its MDF plant (“Del-Tin Fiber”) at El Dorado, Arkansas. The Company has three real estate developments that are located in central Arkansas.
The Company is organized into four segments: (1) Woodlands, which manages all aspects of the timberlands which includes harvesting and sale of timber, timberland sales and acquisitions, oil and gas leases and royalties, and hunting land leases; (2) Manufacturing, which consists of Deltic’s two sawmills that manufacture a variety of softwood lumber products, and the Del-Tin Fiber plant that produces MDF; (3) Real Estate, which includes the Company’s real estate developments and a related country club operation; and (4) Corporate, which consists of executive management, accounting, information systems, human resources, purchasing, treasury, income tax, and legal staff functions that provide support services to the operating business units. The Company currently does not allocate the cost of maintaining these support functions to its operating units. Deltic is a calendar-year company for both financial and income tax reporting.
The forest and wood products business is affected by a number of factors, including general economic conditions, U.S. employment levels, interest rates, credit availability and associated costs, lumber and building product imports, foreign exchange rates, housing starts, new and existing home inventories, residential and commercial real estate foreclosures, residential and commercial repair and remodeling, commercial construction, industry capacity and production levels, the availability of raw materials, utility costs, fuel costs, and weather conditions. The recovery of the U.S. housing market, as well as new home construction activity, shows signs of sustainability as the supply and pricing of houses react to a growing demand and declining inventory of existing homes for sale. To help maintain this current momentum, the labor market will need to continue to experience improvement, while home financing has to be available and affordable. Given its relative size and the nature of most commodity markets, the Company has little or no influence over the market’s pricing levels for its wood products. Deltic will continue to manage its vertical integration strategy to achieve the maximum performance from the Company’s diverse asset base by seeking opportunities to increase the Company’s timberland base, investing in capital projects in its manufacturing facilities to improve productivity, and managing operating hours to meet market demand, while controlling costs and expenses to the extent possible.
Significant accomplishments for the Company’s operating segments during the year of 2013 include: (1) the Woodlands segment’s harvest of approximately 605,000 tons of pine sawtimber and the sale of approximately 1,700 acres of non-strategic hardwood bottomland; (2) the acquisition of approximately 7,000 acres of strategic pine-growing timberland; (3) the acquisition of the other 50 percent ownership of Del-Tin Fiber; (4) the Manufacturing segment’s achievement of record levels for operating income, cash flow, and hourly productivity rates; and (5) the Real Estate segment’s 30 percent increase in residential lot sales activity at a higher average per-lot sales price.
The Woodlands segment is the Company’s core operating segment and the foundation for its vertical integration model. It reported operating income of $16.8 million, a nine percent decrease from 2012 results, primarily due to decreased revenues from a reduced pine pulpwood harvest. The pine sawtimber harvest volume for 2013 was 605,000 tons compared to 607,000 tons in 2012, while the average pine sawtimber sales price remained flat at $22 per ton. The 2013 pine pulpwood harvest volume was 340,000 tons, a 28 percent decrease from 2012, due to the mix of products growing on specific tracts harvested. The average pine pulpwood sales price for both years was $8 per ton. The Company continues to manage the harvest level of its forests on a sustainable-yield basis.
23
Over the long-term, there has been some correlation between pine lumber prices and pine sawtimber prices, but in the short-term, the geographical size differential between the pine lumber and pine sawtimber markets can result in the two acting independently of each other. Pine sawtimber markets operate within local areas, with sales being mainly to sawmills. These mills are subject to a relatively fixed level of raw material requirements that is driven by the facilities’ required production levels. These production levels, combined with the weather within a specific region, can influence the price of pine sawtimber. Changes in pricing levels within the lumber market typically do not have an immediate effect on the existing demand for raw materials in the short-term; therefore, the resulting impact on pine sawtimber prices will usually lag in timing and will be less volatile than that of the market for pine lumber. This trend would also be true in the short-term during times of a depressed lumber market. Ultimately, the Company’s ability to sell pine sawtimber at acceptable prices in the future will be dependent upon the size or existence of markets for manufactured lumber and other wood products.
Timberland designated as higher and better use consists of tracts with market values that exceed the land’s worth as a pine timber-growing platform. Deltic’s approximately 57,000-acre timberland holdings in the expanding westward growth corridor of Little Rock, Arkansas, are an example of such land. Non-strategic timberland acres are composed of tracts of hardwood bottomland that are unsuitable for growing pine timber, tracts of pine timberland that are too small to allow efficient timber management, tracts geographically isolated from other Company fee lands, or any other acreage not deemed strategic to Deltic’s operations or growth. The Company sold approximately 1,700 acres of non-strategic recreational-use hardwood bottomland in 2013. These proceeds, along with cash flow generated by operations, were used to purchase approximately 7,000 acres of strategic pine-producing timberland during the year.
In addition to timber sales, the Company receives other benefits from land ownership that are reported as income in the Woodlands segment. These include revenues from hunting leases, oil and gas lease rentals and royalties, and land easements payments. The segment reported hunting lease income of $2.4 million in 2013 and $2.3 million in 2012. Total oil and gas revenues, consisting of lease rentals and net royalties, were $5.1 million in 2013, compared to $4.9 million in 2012. The Company has under lease or held by production approximately 17,900 net mineral acres in the Fayetteville Shale Play, an unconventional natural gas reservoir being developed in the state of Arkansas. During 2013, the Company received net royalty payments of $2.9 million from gas produced from wells in which the Company has a royalty interest in the Fayetteville Shale Play, compared to $2.3 million in 2012. The increase was due primarily to higher natural gas prices but was partially offset by a decrease in the volume of gas produced by natural gas wells in which the Company has a royalty interest. The Company’s total net oil and gas royalty income, inclusive of the Fayetteville Shale Play, was $3.4 million in 2013 and $2.7 million in 2012. Total income from oil and gas lease rentals was $1.7 million in 2013 and $2.2 million in 2012 as the original lease period on some acreage ended, and many of those former lease properties are now held by producing wells. The ultimate benefit to Deltic from oil and gas leases remains speculative and unknown to the Company and is contingent on the successful completion of producing wells on Company lands and the prices received for crude oil and natural gas.
The Manufacturing segment reported operating income of $38.5 million in 2013, an increase of $20.4 million from 2012, due mainly to improved prices received for lumber sold and the consolidation of the results of the Del-Tin Fiber plant since April 1, 2013, partially offset by a reduced lumber sales volume. With approximately one million housing starts in 2013, the pricing received for both lumber and MDF improved year-over-year, as producers of Southern Pine lumber exercised discipline in overall production capacity. Many economic indicators predict that housing starts will continue to grow throughout 2014. With this improvement, some lumber producers are poised to increase production with the U.S. housing market recovery, and if the level of consumption does not outpace production, future prices could be impacted. As with any commodity market, the Company expects the historical volatility of lumber and MDF prices to continue in the future, and management will continue to respond timely by adjusting production levels to match market demand. Since commodity-based markets rarely benefit from real price growth, after inflation, Deltic focuses on improving production efficiencies and the cost structure for its lumber mills and its MDF plant, as evidenced by the continued year-over-year improved hourly productivity rates in its manufacturing operations.
24
The Real Estate segment reported an operating loss of $1.4 million in 2013, an improvement of $.7 million from results in 2012, due primarily to increases in both the number of residential lots sold and average sales price per lot due to the mix of lots sold.
At December 31, 2013, there were 22 residential lots under contract to sell in Chenal Valley, and the number of developed, while uncommitted, residential lots in Chenal Valley, Chenal Downs, and Red Oak Ridge were 127, 11, and 42, respectively. The Company continues to focus on the long-term financial returns from the total build-out of the Chenal Valley and Red Oak Ridge developments as the housing market continues its steady progress toward recovery.
A tabular summary of Deltic’s residential real estate activity is as follows:
| | | | | | | | | | | | | | | | | | | | | | |
Residential Lots | | Lots Sold in 2013 | | | Lots Sold Since Inception | | | Unsold Developed Lots | | | Future Lots to Develop | | | Estimated Total Lots | |
| | | | | | | |
Development | | Market | | | | | |
Chenal Valley | | Little Rock | | | 65 | | | | 2,672 | | | | 149 | | | | 2,079 | | | | 4,900 | |
Chenal Downs | | Little Rock | | | — | | | | 65 | | | | 11 | | | | — | | | | 76 | |
Red Oak Ridge | | Hot Springs | | | — | | | | 93 | | | | 42 | | | | 1,015 | | | | 1,150 | |
Acquired lots | | Various | | | — | | | | 6 | | | | 6 | | | | — | | | | — | |
| | | | | | | | | | | | | | | | | | | | | | |
| | | | | 65 | | | | 2,836 | | | | 208 | | | | 3,094 | | | | 6,126 | |
| | | | | | | | | | | | | | | | | | | | | | |
There were no sales of commercial real estate within the boundaries of the Chenal Valley development in 2013 or 2012. While there were no sales of commercial acreage in either year, the Company’s commercial real estate acreage continues to receive interest from prospective buyers. Property located near the key intersection of Chenal Parkway and Rahling Road in the Chenal Valley Development are areas of future expected activity. Future trends for commercial real estate sales are difficult to predict, and prices are influenced by multiple factors, which include intended use of the site, property location, and acres available. There is no commercial acreage included in the Chenal Downs development. Red Oak Ridge, the Company’s Hot Springs area development, will include a small amount of commercial acreage to be determined by the actual land usages. The Company will begin to develop and offer commercial sites as this development’s population density increases.
A tabular summary of Deltic’s commercial real estate activity is as follows:
| | | | | | | | | | | | | | | | | | |
Commercial Acres | | Acres Sold in 2013 | | | Acres Sold Since Inception | | | Acres Remaining | | | Estimated Total Acres | |
| | | | | | |
Development | | Market | | | | |
Chenal Valley | | Little Rock | | | — | | | | 391 | | | | 424 | | | | 815 | |
| | | | | | | | | | | | | | | | | | |
Deltic’s real estate activities primarily involve residential lots and commercial acreage; however, the Company has constructed a small number of speculative homes in the Red Oak Ridge development to serve as a catalyst for increasing lot sales activity. This activity has been reviewed for potential triggering events that would require impairment testing, as appropriate. However, management is of the opinion that no such event has occurred.
25
A tabular summary of Deltic’s speculative home activity is as follows:
| | | | | | | | | | | | | | | | | | |
Development | | Market | | Homes
Sold in
2013 | | | Homes
Constructed
Since
Inception | | | Homes Sold
Since
Inception | | | Homes
Unsold | |
Red Oak Ridge | | Hot Springs | | | — | | | | 15 | | | | 10 | | | | 5 | |
| | | | | | | | | | | | | | | | | | |
Equity in earnings of Del-Tin Fiber represents Deltic’s share of the earnings of the joint venture in the first quarter of 2013 prior to its acquisition of the remaining 50 percent ownership from its joint venture partner and was $1.1 million. The step acquisition of Del-Tin Fiber in 2013 resulted in a gain of $3.2 million recognized on the previously held investment and was reported in other income. Additionally, Deltic recorded a bargain purchase gain of $3.4 million related to the acquisition, which reflects the excess of the fair value of the net assets over the purchase price that was paid for those assets. The results of Del-Tin Fiber’s operations have been included in the consolidated financial statements subsequent to the acquisition date and were included in the Company’s Manufacturing segment. For additional information, refer to Note 4 to the consolidated financial statements.
Significant Events
On April 1, 2013, Deltic purchased the remaining 50 percent interest in Del-Tin Fiber from International Paper (through its subsidiary TIN, Inc.) for $20 million consisting of a cash payment and the assumption of debt guarantees. For additional information, refer to Note 4 to the consolidated financial statements.
On May 2, 2013, the Company amended and restated its unsecured and committed revolving credit facility. Pursuant to the amendment and restatement of the Revolving Credit Agreement, the amount of the aggregate revolving credit commitments was increased from $297.5 million to $340 million, the term of the agreement was extended to May 1, 2018, and the pricing of the applicable margins and commitment fees percentages were amended. The funds available through this agreement will enable Deltic to take full advantage of growth opportunities as they present themselves.
26
Results of Operations
In the following tables, Deltic’s net sales and results of operations are presented for the three years ended December 31, 2013, 2012 and 2011. Explanations of significant variances and additional analyses for the Company’s consolidated and segmental operations follow the tables.
| | | | | | | | | | | | |
| | | Years Ended December 31, | |
| (Millions of dollars, except per share amounts) | | 2013 | | | 2012 | | | 2011 | |
Net sales | | | | | | | | | | | | |
Woodlands | | $ | 33.8 | | | | 37.3 | | | | 40.2 | |
Manufacturing | | | 168.0 | | | | 105.9 | | | | 83.9 | |
Real Estate | | | 11.7 | | | | 11.0 | | | | 12.3 | |
Eliminations | | | (13.8 | ) | | | (13.3 | ) | | | (14.6 | ) |
| | | | | | | | | | | | |
Net sales | | $ | 199.7 | | | | 140.9 | | | | 121.8 | |
| | | | | | | | | | | | |
| | | |
Operating income | | | | | | | | | | | | |
Woodlands | | $ | 16.8 | | | | 18.4 | | | | 20.4 | |
Manufacturing | | | 38.5 | | | | 18.1 | | | | 1.0 | |
Real Estate | | | (1.4 | ) | | | (2.1 | ) | | | — | |
Corporate | | | (18.0 | ) | | | (17.4 | ) | | | (14.3 | ) |
Eliminations | | | (.2 | ) | | | .1 | | | | .4 | |
| | | | | | | | | | | | |
Operating income | | | 35.7 | | | | 17.1 | | | | 7.5 | |
| | | |
Equity in earnings of Del-Tin Fiber | | | 1.1 | | | | 1.0 | | | | .3 | |
Interest and other debt expense,net of capitalized interest | | | (4.6 | ) | | | (4.1 | ) | | | (4.0 | ) |
Gain on bargain purchase | | | 3.4 | | | | — | | | | — | |
Other income | | | 3.2 | | | | — | | | | — | |
Income taxes | | | (12.6 | ) | | | (4.8 | ) | | | (1.1 | ) |
| | | | | | | | | | | | |
Net income | | $ | 26.2 | | | | 9.2 | | | | 2.7 | |
| | | | | | | | | | | | |
| | | |
Earnings per common share | | | | | | | | | | | | |
Basic | | $ | 2.06 | | | | .73 | | | | .21 | |
Assuming dilution | | $ | 2.05 | | | | .73 | | | | .21 | |
Consolidated
Net income for 2013 was $26.2 million, $17 million more than in 2012, primarily due to increased operating income from the Company’s Manufacturing operating segment and gains of $6.6 million recognized as a result of the acquisition of Del-Tin Fiber. Net income for 2012 of $9.2 million was $6.5 million more than in 2011, due to increased operating income from the Manufacturing operating segment and equity in earnings of Del-Tin Fiber, partially offset by lower operating results from the Woodlands and Real Estate segments and higher Corporate general and administrative expenses.
Operating income for 2013 of $35.7 million increased $18.6 million when compared to 2012. The Woodlands segment decreased $1.6 million due to lower revenues resulting from a decreased pine pulpwood harvest. The Manufacturing segment’s operating income increased $20.4 million over 2012, due to a higher average sales price for lumber sold and the inclusion of Del-Tin Fiber results in the segment operations subsequent to the April 1, 2013 acquisition, partially offset by a lower lumber sales volume. The Real Estate segment’s operating results improved by $.7 million due to the gross margin from increased sales of residential lots. Corporate operating expense increased $.6 million due to higher general and administrative expenses, primarily professional fees.
27
Operating income for 2012 increased $9.6 million when compared to 2011. The Woodlands segment decreased $2 million due to a lower per-ton average sales price for the pine sawtimber harvested, fewer acres of hardwood bottomland sold, and lower revenues from oil and gas royalties, partially offset by increased revenues from pine pulpwood harvested and a lower cost of fee timber harvested. The Manufacturing segment’s operating income increased $17.1 million due to increased sales volume and a higher average sales price per MBF of lumber sold. The Real Estate segment’s operating income decreased $2.1 million primarily due to no sales of commercial acreage in 2012, partially offset by an increase in the number of residential lots sold when compared to 2011. Corporate operating expense increased by $3.1 million due to higher general and administrative expenses, primarily resulting from employee pension and post-retirement benefit obligations and incentive plan expense.
Woodlands
Selected financial and statistical data for the Woodlands segment is shown in the following table.
| | | | | | | | | | | | |
| | | 2013 | | | 2012 | | | 2011 | |
Net sales (millions of dollars) | | | | | | | | | | | | |
Pine sawtimber | | $ | 13.4 | | | | 13.1 | | | | 14.2 | |
Pine pulpwood | | | 2.8 | | | | 4.0 | | | | 3.7 | |
Hardwood sawtimber | | | .3 | | | | .3 | | | | .3 | |
Hardwood pulpwood | | | .6 | | | | .9 | | | | .8 | |
Oil and gas lease rentals | | | 1.7 | | | | 2.2 | | | | 2.5 | |
Oil and gas royalties | | | 4.0 | | | | 3.3 | | | | 4.4 | |
Hunting leases | | | 2.4 | | | | 2.3 | | | | 2.2 | |
| | | |
Sales volume (thousands of tons) | | | | | | | | | | | | |
Pine sawtimber | | | 605 | | | | 607 | | | | 606 | |
Pine pulpwood | | | 340 | | | | 475 | | | | 449 | |
Hardwood sawtimber | | | 6 | | | | 9 | | | | 10 | |
Hardwood pulpwood | | | 56 | | | | 72 | | | | 113 | |
| | | |
Sales price (per ton) | | | | | | | | | | | | |
Pine sawtimber | | $ | 22 | | | | 22 | | | | 23 | |
Pine pulpwood | | | 8 | | | | 8 | | | | 8 | |
Hardwood sawtimber | | | 45 | | | | 38 | | | | 30 | |
Hardwood pulpwood | | | 12 | | | | 12 | | | | 7 | |
| | | |
Timberland | | | | | | | | | | | | |
Net sales (millions of dollars) | | $ | 2.6 | | | | 2.8 | | | | 4.1 | |
Sales volume (acres) | | | 1,677 | | | | 1,776 | | | | 2,726 | |
Sales price (per acre) | | $ | 1,500 | | | | 1,600 | | | | 1,500 | |
Woodlands segment net sales in 2013 decreased $3.5 million, or nine percent, when compared to 2012. The pine pulpwood harvest volume was 28 percent lower than the prior year due to composition of the specific tracts of timberland being harvested. Revenue from oil and gas royalty payments was higher because of an increase in the average price received for natural gas produced, partially offset by lower gas production volumes. Oil and gas lease rentals were lower due to the expiration of the original lease period on some net mineral acreage, while most of those acres are being held by production and not subject to lease renewal fees. Revenue for hauling stumpage to other mills was $2 million lower in 2013 than in 2012.
Total net sales for the Woodlands segment decreased $2.9 million, or seven percent, in 2012 when compared to 2011. The per-ton sales price for pine sawtimber decreased four percent to $22, while the harvest volume remained essentially the same as the prior year. The pine pulpwood harvest volume
28
was higher by six percent, while the average per-ton sales price of $8 was the same for both years. Oil and gas royalty revenues decreased $1.1 million due to lower natural gas pricing, while production volume increased 21 percent due to production from additional wells drilled. Revenues from timberland sales decreased $1.3 million due to fewer acres being sold in 2012.
Operating income for the Woodlands segment for 2013 decreased $1.6 million, or nine percent, from 2012, due to the items affecting net sales, combined with higher replanting costs in 2013 and lower cost of hauling stumpage to other mills.
Operating income for the Woodlands segment for 2012 decreased $2 million, or ten percent, from 2011, due to the items affecting net sales, partially offset by lower cost of timberland sold due to fewer acres sold and lower cost of fee timber harvested.
Manufacturing
Selected financial and statistical data for the Manufacturing segment is shown in the following table.
| | | | | | | | | | | | |
| | | 2013 | | | 2012 | | | 2011 | |
Net sales (millions of dollars) | | | | | | | | | | | | |
Lumber | | $ | 100.2 | | | | 84.4 | | | | 64.5 | |
Residual by-products | | | 12.6 | | | | 16.1 | | | | 14.5 | |
Medium density fiberboard (“MDF”)1 | | | 45.6 | | | | N/A | | | | N/A | |
| | | |
Lumber | | | | | | | | | | | | |
Finished production (MMBF) | | | 259 | | | | 271 | | | | 249 | |
Sales volume (MMBF) | | | 261 | | | | 273 | | | | 254 | |
Sales price (per MBF) | | $ | 384 | | | | 309 | | | | 254 | |
| | | |
MDF (3/4 inch basis) | | | | | | | | | | | | |
Finished production (MMSF) | | | 61.3 | | | | N/A | | | | N/A | |
Sales volume (MMSF) | | | 56.0 | | | | N/A | | | | N/A | |
Sales price (per MSF) | | $ | 583 | | | | N/A | | | | N/A | |
| 1 | Information presented for 2013 represents the totals for Del-Tin Fiber after April 1, 2013, the date of acquisition, and are included in the consolidated financial statements. Prior to the acquisition, Del-Tin Fiber was treated as an equity method investment. |
The Manufacturing segment’s net sales in 2013 increased $62.1 million, or 59 percent, when compared to 2012. Additional revenues from the inclusion of Del-Tin Fiber in the Manufacturing segment since April 1, 2013, were $47.8 million, mainly consisting of MDF sales along with the related freight revenue. Sales revenues from lumber sales increased $15.8 million due to a higher average sales price for lumber sold. The average lumber sales price in 2013 increased $75 per MBF, or 24 percent, from the average 2012 sales price, while the sales volume for 2013 was 4 percent lower than in 2012, as the Company reduced production to match market demand. The average sales price for MDF in 2013 increased $55 per MSF, or 11 percent, from 2012, while sales volume decreased 12.4 MMSF, or 10 percent, from the prior year volume as operating hours were adjusted to match the plant’s production to market demand.
Net sales in 2012 increased $22 million, or 26 percent, when compared to 2011. The increase was due to a 7 percent higher lumber sales volume combined with a $55, or 22 percent, higher sales price per MBF of lumber sold. The increased sales volume was due to increased market demand and the Company’s ability to meet that demand with production increases due to improved operating efficiencies and an increase in hours operated.
29
Operating income increased $20.4 million in 2013, with approximately $16.4 million of the increase due to the increase in the average lumber price, $3.1 million attributed to the inclusion of Del-Tin Fiber results in the Manufacturing segment since April 1, 2013, and $.9 million to a gain on involuntary conversion.
Operating income for the Manufacturing segment for 2012 increased $17.1 million from 2011 due to increased lumber sales volume and a higher average lumber sales price, combined with lower per-unit manufacturing costs.
As a result of the acquisition of Del-Tin Fiber selected information below has been included for comparative purposes which represents full year results for Del-Tin Fiber for the years presented.
| | | | | | | | | | | | |
| | | 2013 | | | 2012 | | | 2011 | |
MDF (3/4 inch basis)1 | | | | | | | | | | | | |
Net Sales | | $ | 69.2 | | | | 70.2 | | | | 64.3 | |
Finished production (MMSF) | | | 112.8 | | | | 119.9 | | | | 116.3 | |
Sales volume (MMSF) | | | 107.7 | | | | 120.1 | | | | 116.3 | |
Sales price (per MSF) | | $ | 578 | | | | 523 | | | | 493 | |
| 1 | Information presented for 2013 and prior years represents the totals for the Del-Tin Fiber joint venture of which the first three months and all of the prior years was previously presented as information for an equity investment. |
Real Estate
Selected financial and statistical data for the Real Estate segment is shown in the following table.
| | | | | | | | | | | | |
| | | 2013 | | | 2012 | | | 2011 | |
Net sales (millions of dollars) | | | | | | | | | | | | |
Residential lots | | $ | 4.9 | | | | 3.5 | | | | 2.0 | |
Commercial acres | | | — | | | | — | | | | 3.2 | |
Speculative homes | | | — | | | | .5 | | | | — | |
Chenal Country Club | | | 6.4 | | | | 6.7 | | | | 6.8 | |
| | | |
Sales volume | | | | | | | | | | | | |
Residential lots | | | 65 | | | | 50 | | | | 31 | |
Commercial acres | | | — | | | | — | | | | 27 | |
Speculative homes | | | — | | | | 1 | | | | — | |
| | | |
Average sales price (thousands of dollars) | | | | | | | | | | | | |
Residential lots | | $ | 76 | | | | 70 | | | | 63 | |
Commercial acres | | | — | | | | — | | | | 117 | |
Speculative homes | | | — | | | | 491 | | | | — | |
Net sales for the Real Estate segment in 2013 increased $.7 million from the prior year due to revenues from increased residential lot sales, partially offset by lower revenues at Chenal Country Club.
30
The Real Estate segment’s net sales for 2012 decreased $1.3 million, or 11 percent, from 2011 due to no sales of commercial acreage in 2012, partially offset by sales of 19 more residential lots in 2012 than in 2011 and the sale of a speculative home in 2012.
The 2013 operating loss was $.7 million less than in 2012 due to the increase in the number of residential lots sold combined with a higher gross profit margin per lot sold during 2013.
The 2012 changes in the Real Estate segment’s operating income were primarily due to the same factors impacting net sales, combined with an increased cost of real estate sold, due to the additional lots sold, and an increased cost of sales at Chenal Country Club.
Corporate
The $.6 million increase in operating expense for Corporate functions in 2013, when compared to 2012, was due to higher general and administrative expenses, primarily professional fees, including fees that were related to the acquisition of the additional 50 percent interest in Del-Tin Fiber, and employee incentive plan expenses resulting from the improved financial results for the year.
The $3.1 million increase in operating expense for Corporate functions in 2012, when compared to 2011, was due to higher general and administrative expenses, primarily employee incentive plan expenses resulting from the improved financial results for the year, and higher pension and postretirement benefits obligations.
Eliminations
Intersegment sales of timber from Deltic’s Woodlands segment to the Manufacturing segment were $13.8 million in 2013, $13.3 million in 2012, and $14.6 million in 2011. The $1.3 million decrease during 2012 was due primarily to a lower per-ton average price for logs transferred to Company sawmills.
Equity in Del-Tin Fiber
For the year ended December 31, 2013, equity in earnings of Del-Tin Fiber recorded by the Company was $1.1 million compared to $1 million in 2012, and $.3 million in 2011. The equity in earnings for 2013 reflects only the results for the three months ended March 31, 2013 because on April 1, 2013, Deltic completed the acquisition of the remaining ownership interest of Del-Tin Fiber and subsequently reported the results of Del-Tin Fiber as a consolidated subsidiary as part of the Manufacturing segment. For additional information refer to Note 4 to the consolidated financial statements.
Interest Expense
Interest expense for 2013 increased $.5 million from 2012 due primarily to the inclusion of Del-Tin Fiber’s bond obligation and related interest expense into Deltic’s consolidated financial statements effective April 1, 2013. Interest expense for 2012 was essentially unchanged from 2011 amounts.
Income Taxes
The effective income tax rate was 33 percent, 34 percent, and 30 percent in 2013, 2012, and 2011, respectively. The decrease in effective income tax rate for 2013, when compared to 2012, was due to the tax effect of the gain on bargain purchase, which was properly reported as a reduction in the gain rather than an increase in income tax expense, and to greater permanent tax benefits in the current year.
The increase in the effective tax rate for 2012, when compared to 2011, was due primarily to the reduced effect of permanent tax benefits caused by the increased pretax income.
31
Liquidity and Capital Resources
Cash Flows and Capital Expenditures
Net cash provided by operating activities totaled $42.1 million for the year ended December 31, 2013, which compares to $24.1 million for 2012 and $14.6 million for 2011. Changes in operating working capital other than cash and cash equivalents provided cash in 2013 of $5.9 million and $2.5 million in 2012, while requiring cash of $.9 million in 2011. The Company’s accompanying Consolidated Statements of Cash Flows and Note 18 of the Consolidated Financial Statements identify other differences between income and cash provided by operating activities for each reported year.
Total capital expenditures, by segment, for the years ended December 31, 2013, 2012, and 2011, are presented in the following table.
| | | | | | | | | | | | |
| (Millions of dollars) | | 2013 | | | 2012 | | | 2011 | |
Woodlands, including non-cash land exchanges | | $ | 12.8 | | | | 18.6 | | | | 7.8 | |
Manufacturing | | | 16.5 | | | | 2.5 | | | | 3.6 | |
Real Estate, including development expenditures | | | 4.3 | | | | 3.0 | | | | 4.2 | |
Corporate | | | — | | | | — | | | | .1 | |
| | | | | | | | | | | | |
Total capital expenditures | | | 33.6 | | | | 24.1 | | | | 15.7 | |
Non-cash land exchanges and accrued liabilities | | | (1.3 | ) | | | (.1 | ) | | | (.1 | ) |
| | | | | | | | | | | | |
Total capital expenditures requiring cash | | $ | 32.3 | | | | 24.0 | | | | 15.6 | |
| | | | | | | | | | | | |
Woodlands capital expenditures included timberland acquisitions of approximately 7,000 acres at a cost of $8.9 million in 2013, 10,000 acres at a cost of $14.5 million in 2012, and 2,000 acres at a cost of $3.3 million in 2011. Reforestation site preparation and planting required $3.5 million in 2013, $3.9 million in 2012, and $4.4 million in 2011, and were the result of expansion of the Company’s planting program due to final harvests of mature stands necessitating regeneration and to recent acquisitions of timberland.
Manufacturing capital expenditures during 2013 included approximately $7 million at the Ola sawmill, $6.8 million at the Waldo sawmill, and $2.7 million at the Del-Tin Fiber plant. The Ola expenditures consisted of $2.3 million to replace lumber sheds destroyed in December 2012, $.9 million for conversion to a continuous-feed kiln, $.7 million for loaders and forklifts, $.6 million for hardsurfacing, and $2.5 million for various system upgrades and replacements. Waldo capital expenditures included $2.7 million for a new automatic grading system, $.9 million to begin conversion to a continuous-feed kiln, and $3.2 for various system upgrades and replacements. Capital expenditures at Del-Tin Fiber were $1.3 million for the chain guide system, $1 million to refurbish the recuperator in the plant’s heat energy system, and $.4 million for replacement of various plant machines.
The majority of capital expenditures at the Ola Mill during 2012 were maintenance related and included $.8 million for various machinery upgrades and replacements, $.3 million for truck scales, $.2 million to complete the MSR lumber machine installation, and $.1 million for a planer sorter. Capital expenditures at the Waldo Mill included $.2 million for a debarker replacement, $.2 million for kiln upgrades, and $.7 million for various machinery upgrades and replacements.
The majority of capital expenditures at the Ola Mill during 2011 were maintenance related and included $.8 million for various machinery upgrades and replacements, $.4 million for an MSR machine, and $.1 million for new forklifts. Capital expenditures at the Waldo Mill included $.9 million for boiler upgrades, $.3 million for forklifts, $.2 million for kiln upgrades and carts, $.2 million for a new fence unit at the trimmer, and $.4 million for various machinery upgrades and replacements.
32
Capital expenditures for Real Estate operations related to the cost of residential lot development totaled $2.4 million in 2013, $1 million in 2012, and $.2 million in 2011. Capital expenditures for commercial development totaled $.2 million in 2012 and $.8 million in 2011. There was $.1 million in land acquisition costs in 2013 but no land-acquisition expenditures in either 2012 or 2011. Infrastructure-related projects required $1.4 million in 2013, $1 million in 2012, and $1.6 million in 2011. Expenditures for course maintenance equipment totaled $.3 million in 2013 and $.2 million in both 2012 and 2011. The Company expended $.1 million in 2013 and $.5 million in both 2012 and 2011 on clubhouse renovations at Chenal Country Club. Golf course renovations totaled $.7 million in 2011.
Deltic had commitments of $4.1 million for capital projects in progress at December 31, 2013. The Manufacturing segment had committed $4 million. The Real Estate segment had committed $.1 million.
The net change in purchased stumpage inventory required cash of $1.5 million in 2013, provided cash of $1.2 million in 2012, and required cash of $.8 million in 2011. Advances to Del-Tin Fiber by the Company while it was an equity method investee amounted to $1 million, $2.2 million, and $1.8 million, in 2013, 2012, and 2011, respectively. The Company received cash repayments from Del-Tin Fiber of $.8 million in 2013 prior to the April 1, 2013 acquisition, $4 million in 2012, and $3.3 million in 2011. Funds held by trustees to be used to acquire timberland designated as “replacement property” as required for income tax-deferred exchanges decreased $.6 million in 2012, and increased $.6 million in 2011. Initiation fees received from members joining Chenal Country Club are accounted for as a reduction in cost basis of the club rather than net sales and amounted to $.3 million in 2013, $.4 million in 2012, and $.3 million in 2011.
During 2013, the Company borrowed $12 million and repaid $14 million under its revolving credit facility for a net repayment of $2 million. During 2012, Deltic borrowed $18 million under its revolving credit facility, repaid $19 million on the revolver, and paid the final installment of $1.1 million to Modern Woodmen of America for a net debt reduction of $2.1 million. During 2011, Deltic borrowed $15.5 million under its revolving credit facility and repaid $17.1 million of debt.
Deltic used $2.2 million in cash provided by operations to fund purchases of 36,180 shares of its stock in 2013. Cash required to pay common stock dividends totaled $5 million in 2013 and $3.8 million in 2012 and 2011. Proceeds from stock option exercises amounted to $.8 million, $1.2 million, and $2.5 million, in 2013, 2012, and 2011, respectively. Tax benefits from exercises of stock-based compensation were $.4 million in 2013, $.6 million in 2012, and $.7 million in 2011. The Company incurred $.8 million in fees to facilitate an amendment and extension of its unsecured and committed revolving credit facility in 2013, while there were no such costs in 2012 and $1.1 million in 2011. Costs of $.7 million in 2013, 2012, and 2011, were paid for commitment fees related to Deltic’s revolving credit facility.
Financial Condition
Working capital at year-end totaled $5.5 million in 2013 and $5.6 million in 2012. Deltic’s working capital ratio at December 31, 2013, was 1.25 to 1 compared to 1.43 to 1 at the end of 2012. Cash and cash equivalents at the end of 2013 were $4.4 million compared to $5.6 million at the end of 2012. The total indebtedness of the Company at December 31, 2013 was $90 million, which included the $29 million bond debt of Del-Tin Fiber, compared to $63 million total debt at December 31, 2012. Deltic’s long-term debt to stockholders’ equity ratio was .338 to 1 at December 31, 2013, compared to .271 to 1 at the end of 2012.
33
Liquidity
The primary sources of the Company’s liquidity are internally generated funds, access to outside financing, and working capital. The Company’s current strategy for growth continues to emphasize its timberland acquisition program, expanding lumber production as market conditions allow, and developing residential and commercial properties at Chenal Valley and Red Oak Ridge. The Company’s capital expenditures budget for the year 2014 provides for expenditures totaling $44.9 million. Capital and other expenditures are under constant review, and these budgeted amounts may be adjusted to reflect changes in the Company’s estimated cash flows from operations, borrowings, or repayments under credit facilities, or general economic conditions.
To facilitate these growth plans, the Company has an agreement with a group of banks which provides an unsecured and committed revolving credit facility. As of December 31, 2013, this facility totaled $340 million, with $319 million available, and includes an option to request an increase of $50 million in revolving commitments. The facility will mature May 1, 2018. The credit agreement contains restrictive covenants, including limitations on the incurrence of debt and requirements to maintain certain financial ratios. (For additional information about the Company’s current financing arrangements, refer to Note 9 to the consolidated financial statements.)
The table below sets forth the most restrictive ratio requirements of the covenants in the credit facility and Senior Notes Payable and the status with respect to these covenants as of December 31, 2013 and 2012.
| | | | | | | | | | | | |
| | | Covenants
Requirements | | | Actual Ratios at
Dec. 31, 2013 | | | Actual Ratios at
Dec. 31, 2012 | |
Leverage ratio should be less than:1 | | | .60 to 1 | | | | .254 to 1 | | | | .253 to 1 | |
| | | |
Total outstanding debt as a percentage of total debt allowed based on the minimum timber market value covenant:2 | | | — | 2 | | | 48.24 | % | | | 44.15 | % |
| | | |
Fixed charge coverage ratio should be greater than:3 | | | 2.50 to 1 | | | | 10.04 to 1 | | | | 5.39 to 1 | |
| 1 | The leverage ratio is calculated as total debt divided by total capital. Total debt includes indebtedness for borrowed money, secured liabilities, obligations in respect of letters of credit, and guarantees. Total capital is the sum of total debt and net worth. Net worth is calculated as total assets minus total liabilities, as reflected on the balance sheet. This covenant is applied at the end of each quarter. The revolving credit facility requirement is for the leverage ratio to be less than .65 to 1. |
| 2 | Timber market value must be greater than 200 percent of total debt (as defined in (1) above). The timber market value is calculated by multiplying the average price received for sales of timber for the preceding four quarters by the current quarter’s ending inventory of timber. This covenant is applied at the end of the quarter on a rolling four-quarter basis. The revolving credit facility requirement is for the timber market value to be greater than 175 percent of total debt (as defined in (1) above). |
| 3 | The fixed charge coverage ratio is calculated as EBITDA (earnings before interest, taxes, depreciation, depletion, and amortization) increased by non-cash compensation expense and other non-cash expenses and decreased by dividends paid and income tax paid, divided by the sum of interest expense and scheduled principal payments made on debt during the period. This covenant is applied at the end of the quarter on a rolling four-quarter basis. This covenant only applies to the Senior Notes Payable. |
34
Based on management’s current operating projections, the Company believes it will remain in compliance with the debt covenants and have sufficient liquidity to finance operations and pay all obligations. However, depending on market conditions and in the event of economic deterioration, the Company could request amendments, waivers for the covenants, or obtain refinancing in future periods. There can be no assurance that the Company will be able to obtain amendments or waivers or negotiate agreeable refinancing terms should it become needed.
In December 2000, the Company’s Board of Directors authorized a stock repurchase program of up to $10 million of Deltic common stock. In December 2007, the Company’s Board of Directors expanded the program by $25 million. As of December 31, 2013, the Company had expended $16.8 million under this program, with the purchase of 406,694 shares at an average cost of $41.23 per share; of which 36,180 shares were purchased at an average cost of $61.22 per share in 2013, while there were no shares purchased in 2012 or 2011. In its two previous repurchase programs, Deltic purchased 479,601 shares at an average cost of $20.89 and 419,542 shares at a $24.68 per share average cost, respectively.
Off-Balance Sheet Arrangements, Contractual Obligations, and Commitments
The Company has both funded and unfunded noncontributory defined benefit retirement plans that cover the eligible employees of Deltic Timber excluding employees of the subsidiaries. The plans provide defined benefits based on years of service and final average salary. Deltic also has other postretirement benefit plans covering eligible employees except for employees of the subsidiaries. These plans consist of a health care plan, which is contributory with participants’ contributions adjusted as needed, and a noncontributory life insurance plan. With regards to all of the Company’s employee and retiree benefit plans, Deltic is unaware of any trends, demands, commitments, events, or uncertainties that will result in, or that are reasonably likely to result in, the Company’s liquidity increasing or decreasing in any material way, or which would cause the 2013 reported plan information not to be necessarily indicative of future operating performance or future financial condition. (For information about material assumptions underlying the accounting for these plans and other components of the plans, refer to Note 16 to the consolidated financial statements.)
As of December 31, 2013, the Company is not involved in any unconsolidated special-purpose entity transactions.
35
Tabular summaries of the Company’s contractual cash payment obligations, estimated obligations, and other commercial commitment expirations, by period, are presented in the following tables.
| | | | | | | | | | | | | | | | | | | | |
| (Millions of dollars) | | Total | | | During
2014 | | | 2015
to 2016 | | | 2017
to 2018 | | | After
2018 | |
Contractual cash payment obligations | | | | | | | | | | | | | | | | | | | | |
Real estate development committed capital costs | | $ | 10.9 | | | | 8.2 | | | | 1.8 | | | | .9 | | | | — | |
Manufacturing committed capital costs | | | 4.0 | | | | 4.0 | | | | — | | | | — | | | | — | |
Long-term debt | | | 90.0 | | | | — | | | | 40.0 | | | | 21.0 | | | | 29.0 | |
Interest on debt1 | | | 9.9 | | | | 2.9 | | | | 5.6 | | | | .6 | | | | .8 | |
Qualified retirement plan2 | | | 1.2 | | | | 1.2 | | | | — | | | | — | | | | — | |
Nonqualified retirement plan3 | | | 2.8 | | | | .2 | | | | .5 | | | | .5 | | | | 1.6 | |
Other postretirement benefits4 | | | 5.0 | | | | .3 | | | | .8 | | | | .9 | | | | 3.0 | |
Other liabilities | | | 4.0 | | | | 2.7 | | | | 1.3 | | | | — | | | | — | |
Unrecognized tax benefits | | | 1.2 | | | | 1.2 | | | | — | | | | — | | | | — | |
| | | | | | | | | | | | | | | | | | | | |
| | $ | 129.0 | | | | 20.7 | | | | 50.0 | | | | 23.9 | | | | 34.4 | |
| | | | | | | | | | | | | | | | | | | | |
Other commercial commitment expirations | | | | | | | | | | | | | | | | | | | | |
Timber cutting agreements | | $ | 1.7 | | | | 1.7 | | | | — | | | | — | | | | — | |
Letters of credit | | | .6 | | | | — | | | | .4 | | | | .2 | | | | — | |
| | | | | | | | | | | | | | | | | | | | |
| | $ | 2.3 | | | | 1.7 | | | | .4 | | | | .2 | | | | — | |
| | | | | | | | | | | | | | | | | | | | |
| 1 | Interest commitments are estimated using the Company’s current interest rates for the respective debt agreements over their remaining terms to expiration. |
| 2 | The Company’s qualified pension plan payments are based on estimated minimum required contributions for year one as provided by the Company’s consulting actuary. Deltic is not able to reliably estimate the required contributions beyond year one. Benefits paid by the qualified pension plan are paid through a trust. Estimated payments from the trust to retirees are not included in this table. |
| 3 | The Company’s supplemental retirement plan payments are based on expected future benefit payments as disclosed in Note 16, “Employee Benefit Retirement Plans” in the notes to consolidated financial statements for years one through ten. Deltic cannot reliably estimate the payments beyond year ten as they are not provided by the Company’s actuary and are subject to a variety of factors. |
| 4 | Included in other postretirement benefits are payments under the Company’s other postretirement benefit plan based on expected future benefit payments as disclosed in Note 16, “Employee Benefit Retirement Plans” in the notes to consolidated financial statements for years one through ten. Deltic cannot reliably estimate the payments beyond year ten as they are not provided by the Company’s consulting actuary and are subject to a variety of factors. |
Outlook
Deltic’s management believes that cash provided from its operations, the remaining amount available under its credit facility, and its ability to access the credit markets will be sufficient to meet its expected cash needs and planned expenditures, including those of the Company’s continued timberland acquisition and stock repurchase programs, and capital expenditures, for the foreseeable future.
36
The preceding discussion of the Company’s liquidity and capital resources contains “forward-looking statements” which were made in reliance upon the safe harbor provisions of the Private Securities Litigation Reform Act of 1995. Such statements reflect the Company’s current expectations and involve risks and uncertainties. Actual results could differ materially from those included in such forward-looking statements.
Other Matters
Impact of Inflation —General inflation has not had a significant effect on the Company’s operating results during the three years ended December 31, 2013. The Company’s timber operations are more significantly impacted by the forces of supply and demand in the southern United States than by changes in inflation. Lumber manufacturing operations are affected by the supply of lumber available in the North American market and by the demand for lumber by both the North American and foreign export markets. Sales of real estate are affected by changes in the general economy, employment levels, new and existing housing inventories, lending restrictions, and long-term interest rates, specifically as such may manifest themselves in the central Arkansas region.
Market Risk— Market risk represents the potential loss resulting from adverse changes in the value of financial instruments, either derivative or non-derivative, caused by fluctuations in interest rates, foreign exchange rates, commodity prices, and equity security prices. The Company handles market risks in accordance with its established policies; however, Deltic does not enter into derivatives or other financial instruments for trading or speculative purposes. The Company does consider, on occasion, the need to enter into financial instruments to manage and reduce the impact of changes in interest rates; however, the Company entered into no such instruments during the three-year period ended December 31, 2013. Deltic held various financial instruments at December 31, 2013 and 2012, consisting of financial assets and liabilities reported in the Company’s Consolidated Balance Sheets and off-balance sheet exposures resulting from contractual debt guarantees and letters of credit issued for the benefit of Deltic, primarily in connection with its purchased stumpage procurement and real estate operations. (For additional information regarding these financial instruments, refer to the previous tabular summary of the Company’s other commercial commitment expirations and to Note 13 to the consolidated financial statements.)
Interest Rate Risk —The Company is subject to interest rate risk from the utilization of financial instruments, such as term debt and other borrowings. The fair market value of long-term, fixed-interest rate debt is subject to interest rate risk. Generally, the fair value of fixed-interest rate debt will increase as interest rates fall and will decrease as interest rates rise. Conversely, for floating rate debt, interest rate changes generally do not affect the instruments’ fair value but do impact future earnings and cash flows, assuming other factors are held constant. The estimated fair values of the Company’s long-term debt, including current maturities, and letters of credit at December 31, 2013 were $94.5 million and $.6 million, respectively. A one percentage-point increase in prevailing interest rates would result in decreases in the estimated fair value of long-term debt by $1.3 million, while the fair value of contractual guarantees and the Company’s letters of credit would be unchanged. Fair values were determined using the current rates at which the Company could enter into comparable financial instruments with similar remaining maturities.
Foreign-Exchange Rate Risk —The Company currently has no exposure to foreign-exchange rate risk because all of its financial instruments are denominated in U.S. dollars.
Commodity Price Risk —The Company has no financial instruments subject to commodity price risk.
Equity Security Price Risk —None of the Company’s financial instruments have potential exposure to equity security price risk.
37
The preceding discussion of the Company’s estimated fair value of its financial instruments and the sensitivity analyses resulting from hypothetical changes in interest rates are “forward-looking statements” within the meaning of the Private Securities Litigation Reform Act of 1995. Such statements reflect the Company’s current expectations and involve uncertainties. These forward-looking market risk disclosures are selective in nature and only address the potential impact from financial instruments. They do not include other potential effects which could impact Deltic’s business as a result of changes in interest rates, foreign-exchange rates, commodity prices, or equity security prices.
Critical Accounting Policies and Estimates
The Company has identified six of its current accounting policies as being, in management’s view, critical to the portrayal of the Company’s financial condition and results of operations. Additionally, five of these policies require significant assumptions and/or estimates on the part of management as it pertains to certain factors inherent in the policies. The Company’s senior management has discussed the development and selection of its critical accounting policies and estimates with the Company’s Audit Committee. Deltic has not made any material changes to its critical accounting estimates in the last three years. These policies, along with explanations of the key assumptions and/or estimates considered by management, are described below. (For a listing of all significant accounting policies of the Company, refer to Note 1 to the consolidated financial statements.)
| | 1) | Investment in Real Estate Held for Development and Sale — Real estate held for development and sale includes direct costs of land, land development, and indirect costs, including amenities. Indirect and amenity costs are allocated to individual lots or acreage sold based on relative sales value. Direct costs are allocated to the specific neighborhood or commercial real estate tract, while indirect costs for the Company’s three development areas – Chenal Valley, Chenal Downs, and Red Oak Ridge – are allocated to neighborhoods over the entire respective development area based on relative retail values. Management makes the determination of future indirect development costs and the potential future retail value and in so doing considers, among other factors, the cost projections for its development plans provided by independent professional engineering consultants and retail values as provided by independent appraisers. |
The key factors involved in determining the Investment in Real Estate Held for Development and Sale are: (1) the treatment of the clubhouse and golf courses at Chenal Country Club, the amenity around which the Chenal Valley development is centered, as an amenity rather than an operating fixed asset and (2) the management estimates required to estimate the future indirect development costs and sales values of the areas of Chenal Valley yet to be developed. Due to accounting for Chenal Country Club as an amenity, the cost of the clubhouse and golf course, including the estimated cost of planned future improvements, is charged against income as real estate is sold rather than depreciating this cost. This amenity treatment also records the initiation fees received from members joining the club as a reduction in the cost basis of the club rather than as net sales. In addition, the Company’s model for allocating the indirect cost to be expensed against each piece of real estate sold requires management to estimate the future indirect costs to be incurred for the entire development, primarily infrastructure costs and future improvements at Chenal Country Club (net of estimated future initiation fees to be received), as well as the potential market value of each tract of undeveloped property within the Chenal Valley development.
Deltic’s investment in real estate held for development and sale primarily consists of residential lots, commercial tracts, and undeveloped acreage marketed to others for further development. Deltic periodically evaluates its holdings for indications of conditions that would lead to an impairment analysis as required by accounting for subsequent measurement of property, plant, and equipment. Our investment in real estate is mainly comprised of former legacy timberland and thus has a low cost basis. Margins on Deltic’s residential real estate average 45 percent, while commercial real estate margins are 83 percent. The central Arkansas area, where Deltic’s developments are located, has one of the more stable housing markets in the country; therefore, Deltic has not and does not plan to reduce the current pricing structure for its real estate. Based on these factors, the Company does not foresee impairment losses in its real estate held for development or sale.
38
| | 2) | Timber and Timberlands — Timber and timberlands, which include timberland, fee timber, purchased stumpage inventory, and logging facilities, are stated at cost less cost of fee timber harvested and accumulated depreciation of logging facilities and include no estimated future reforestation cost. The cost of timber consists of fee timber acquired and reforestation costs, which include site preparation, seedlings, and reforestation labor. The cost of fee timber harvested is based on the volume of timber harvested in relation to the estimated volume of timber recoverable. Logging facilities, which consist primarily of roads constructed and other land improvements, are depreciated using the straight-line method over a ten-year estimated life. The Company estimates its fee timber inventory using statistical information and data obtained from physical measurements and other information-gathering techniques. Fee timber carrying costs, commercial thinning, silviculture, and timberland management costs are expensed as incurred. |
The Company classifies its timberlands and fee timber as either strategic or non-strategic. Strategic timberlands, including pine forest and pine plantations, are prime pine sawtimber growing platforms located within or immediately adjacent to the Company sawmills’ operating regions. Deltic manages these acres using modern silviculture methods to achieve optimal volume and quality of its pine sawtimber. The Company harvests sawtimber and pulpwood in accordance with its harvest plans and generally converts sawtimber into lumber in its own sawmills and sells pulpwood in the market. Upon harvest, strategic timberlands are reforested. The Company’s timberland acquisition program is focused on the acquisition of timberland in its current operating regions. The Company considers the acquisition and the occasional sale of strategic timberlands as investing activities. The Company has legacy hardwood and other acreage which either cannot be harvested for conversion in Company sawmills, reforested as pine plantations, managed efficiently using modern silviculture methods due to the size of the tract or proximity to other Deltic fee timberlands, or all three. These timberlands have been identified as non-strategic and/or higher and better use timberlands and are expected to be sold over time. The Woodlands segment manages an annual program to sell a portion of these non-strategic timberlands and/or harvest hardwoods for the sale to third parties. The Company considers this program as an operating activity of its Woodlands segment.
In order to acquire and sell assets, primarily timberlands, in a tax efficient manner, the Company enters into like-kind exchange (“LKE”) tax-deferred transactions. The Company generally enters into forward transactions, in which property is sold and the proceeds are reinvested by acquiring similar property, and reverse transactions, in which property is acquired and similar property is subsequently sold. A qualified LKE intermediary is used to facilitate LKE transactions. Proceeds from forward LKE transactions are held by the intermediary and are classified as restricted cash because the funds must be reinvested in similar properties. If the acquisition of suitable LKE properties is not completed within 180 days of the sale of the company-owned property, the proceeds are distributed to Deltic by the intermediary and are reclassified as available cash and applicable income taxes are determined. Amounts deposited with a third party towards the potential future purchase of property are included in other investments and non-current receivables in the consolidated balance sheets and as an investing activity shown as funds held by trustee in the consolidated statements of cash flow. At December 31, 2011, $.6 million of land proceeds was deposited with a LKE intermediary, and there were no funds at December 31, 2013 or 2012. An exchange accommodation titleholder, a type of variable interest entity, is used to facilitate reverse like-kind exchanges. The acquired assets are held by the exchange accommodation titleholder until the exchange transactions are complete. If the Company determines that it is the primary beneficiary of the exchange accommodation titleholder, Deltic includes the assets held by the exchange accommodation titleholder in timber and timberlands assets on the consolidated balance sheets and recognizes any income or expense attributed to the property in the consolidated income statements.
39
The key components of the Timber and Timberlands policy are: (1) management’s decision to maintain separate timber cost pools for each legal entity within the Deltic consolidated group and (2) the required estimation of timber inventory volume, by species, for each of these companies in order to calculate the cost of fee timber harvested per ton. Management has elected to maintain a separate cost pool for the timber owned by each company, thus resulting in a different cost per ton for fee timber harvested for each. The mix of harvest by company for any period can significantly affect the amount of cost of fee timber harvested expense reported. Per-ton costs for 2013 ranged from $4.76 to $25.87 per ton for pine sawtimber. Had the Company opted to use a composite depletion rate, cost of pine sawtimber harvested would have been $.4 million more in 2013, $.5 million more in 2012, and $.2 million more in 2011, ($.3 million, $.3 million, and $.1 million, respectively, net of applicable income taxes) than as reported due to the mix of harvest by company during the year. In determining these rates, management must estimate the volume of timber existing on its timberlands. To estimate these fee timber inventories, the Company relies on its experienced forestry personnel and their use of statistical information and data obtained by actual physical measurements and other information-gathering techniques. The recognized cost of fee timber harvested is impacted by the accuracy of this volume estimation. (For additional information about the Company’s timber and timberlands, refer to Note 5 to the consolidated financial statements.)
Assets used in the Woodlands segment shall be tested for recoverability whenever events or changes in circumstances indicate that its carrying amount may not be recoverable. The recoverability test is based on undiscounted future cash flows over the expected life of the asset. Impairment recognition and measurement would occur at the lowest level for which we have identifiable cash flows. At December 31, 2013, the composite basis in fee timber was $7 per ton assuming no future growth. Gross margin on pine sawtimber for 2013, when the average sales price was $22 per ton, was 75 percent. A harvest cycle (which ranges between 20 and 35 years) would be used to evaluate the recoverability of our timber and timberlands. Due to the long life and low basis, the Company does not expect to incur impairment loss in the future for its timber and timberland assets.
| | 3) | Property, Plant, and Equipment — Property, plant, and equipment are stated at cost less accumulated depreciation. Depreciation of buildings, equipment, and other depreciable assets is primarily determined using the straight-line method. Expenditures that substantially improve and/or increase the useful life of facilities or equipment are capitalized. Maintenance and repair costs are expensed as incurred. Gains and losses on disposals or retirements are included in income as they occur. |
Property, plant, and equipment assets are evaluated for possible impairment on a specific asset basis or in groups of similar assets, as applicable, whenever events or changes in circumstances indicate that the carrying amount of an asset may not be recoverable. Recoverability of assets to be held and used is measured by a comparison of the carrying amount of an asset to estimated undiscounted future net cash flows to be generated by the asset. If the carrying amount of an asset exceeds its estimated future cash flows, an impairment loss is recognized for the amount by which the carrying amount of the asset exceeds the fair value of the asset. Assets to be disposed of are reported at the lower of the carrying amount or fair value less costs to sell, and depreciation ceases.
Management also evaluates any asset or group of assets for which potential impairment might exist and has determined that there are none requiring an impairment write-down. This process requires management’s estimate of future cash flows generated by each asset or group of assets. For any instance where this evaluation process might indicate impairment exists, the appropriate asset’s carrying value would be written down to fair value, and the amount of the write-down would be charged against the results of continuing operations. (For additional information about the Company’s property, plant, and equipment, refer to Note 6 to the consolidated financial statements.)
40
| | 4) | Share-Based Compensation —The Company uses fair value recognition provisions for share-based payment transactions. Under the fair value recognition provisions, share-based compensation cost is estimated at the grant date based on the fair value of the award and is recognized as expense over the requisite service period of the award. For the valuation of stock options, Deltic uses a binomial model to estimate fair value. The fair value of restricted stock awards is determined by reference to the fair market value of the Company’s common stock on the date of grant. For restricted stock performance units, the Monte Carlo simulation is used to estimate fair value. The Company recognizes compensation cost on a straight-line basis over the requisite service period. |
Deltic issues restricted stock performance units whose vesting is contingent upon meeting certain financial performance goals based upon the Company’s total stockholder return compared to the total return of a Paper and Forest Products Index (“the Index”) selected by the Compensation Committee and calculated by Standard and Poor’s. Determining the appropriate amount to expense is based on likelihood of achievement of the stated goals and requires judgment, including forecasting future financial results. This estimate may be revised periodically due to changes in awards. The cumulative impact of any revision is reflected in the period of change.
The expected option term is based on the term of the option, historical exercise, and expiration experience. The Company uses historical volatility over the ten-year trading life of its stock to determine weighted expected volatility assumptions. The expected dividend yield is based on the Company’s average dividend yield from 2009 to 2012. Risk-free interest rates are based on historical rates and forward-looking factors. The pre-vesting forfeiture rate is based on historical rates and forward-looking factors.
Assumptions for the 2013, 2012, and 2011 valuation of stock options and restricted stock performance units consisted of the following:
| | | | | | | | | | | | |
| | | 2013 | | | 2012 | | | 2011 | |
Weighted expected volatility | | | 37.78 | % | | | 38.78 | % | | | 36.70 | % |
Dividend yield | | | .58 | % | | | .61 | % | | | .62 | % |
Expected term of options (in years) | | | 6.27 | | | | 6.27 | | | | 6.27 | |
Risk-free interest rate – stock options | | | 1.98 | % | | | 2.00 | % | | | 3.79 | % |
Risk-free interest rate – restricted stock performance units | | | .60 | % | | | .60 | % | | | 2.09 | % |
| | 5) | Revenue Recognition — The Company recognizes revenue when the following criteria are met: (1) persuasive evidence of an agreement exists, (2) delivery has occurred or services have been rendered, (3) the price to the buyer is fixed and determinable, and (4) collectibility is reasonably assured. Delivery is not considered to have occurred until the customer takes title and assumes the risks and rewards of ownership. Revenue from the sale of lumber, MDF, and wood by-products is recorded at the time of shipment due to terms of such sale being designated free on board (“f.o.b.”) shipping point. Revenue from consignment sales is recorded when the customer assumes ownership of the product. Revenue from the sale of timber-cutting rights to third parties is recorded when legal title passes to the purchaser, which is generally upon delivery of a legally executed timber deed and receipt of payment for the timber. Revenue from intersegment timber sales is recorded when the timber is harvested. Such intersegment sales, which are made at prices which generally approximate market, are eliminated in the consolidated financial statements. Revenue from timberland and real estate sales is recorded at the time the purchaser executes the real estate closing documents and |
41
| | makes payment to the title company handling the closing. When oil and gas lease rental agreements are signed and the amounts are received, they are recorded as either short-term or long-term deferred revenue, and the revenue is recognized on a straight-line basis over the term of the lease. The Company’s share of gross oil and gas royalties is recorded as revenue when received, and any related severance tax or other deductions are included in operating expenses. |
| | 6) | Income Taxes — The Company uses the asset and liability method of accounting for income taxes. Under this method, the provision for income taxes includes amounts currently payable and amounts deferred as tax assets and liabilities, based on differences between financial statement carrying amounts and the tax bases of existing assets and liabilities, and is measured using the enacted tax rates that are expected to be in effect when the differences reverse. Deferred tax assets may be reduced by a valuation allowance when it is established that it is more-likely-than-not that some portion or all of the deferred tax assets will not be realized. The effect on deferred tax assets and liabilities of a change in tax law is recognized in income in the period that includes the enactment date. |
The key management decisions related to income taxes are: (1) the determination of current taxability of transactions, (2) the election to capitalize or expense costs incurred, (3) the decision regarding the appropriate depreciation method for income tax purposes (these three factors ultimately affect the Company’s cash flows for income taxes paid and determine the differences between the financial statement carrying amounts and tax bases of existing assets and liabilities), and (4) management’s estimation of the appropriateness of valuation allowances to reduce any deferred tax assets that exist. Deltic’s management periodically evaluates the Company’s ability to realize future benefits of deferred tax assets by reviewing the expected turnaround of deferred tax liabilities and the amount of future taxable income and by evaluating tax planning strategies that could possibly be implemented to realize deferred tax assets. The Company maintains liabilities for unrecognized tax benefits for various uncertain tax positions taken in its tax return. These liabilities are estimated based on judgment of the probable outcome of the uncertain tax positions and are adjusted periodically based on changing facts and circumstances. Changes to the liabilities for unrecognized tax benefits could materially affect operating results in the period of change.
Related-Party Transactions
The Company provides a portion of the Del-Tin Fiber plant’s fiber and wood supply at market prices. Subsequent to the April 1, 2013 acquisition of Del-Tin Fiber, these sales were eliminated within the Manufacturing segment. During the first quarter of 2013, and the calendar years of 2012 and 2011, Deltic sold Del-Tin Fiber approximately $.9 million, $3.7 million, and $3.7 million each year, respectively, of these residual by-products.
Effect of Recently Issued Authoritative Accounting Guidance
(For information regarding the effect of recently issued authoritative accounting guidance, refer to the related section in Note 1 to the consolidated financial statements.)
42
Environmental Matters
Deltic is committed to protecting the environment and has certain standards with which it must comply based on federal, state, and local laws for the protection of the environment. Costs of compliance through 2013 have not been material, and the Company’s management currently has no reason to believe that such costs will become material for the foreseeable future.
Contingencies
The Company is involved in litigation incidental to its business from time to time. Currently, there are no material legal proceedings outstanding.
Outlook
Pine sawtimber harvested from Deltic’s fee lands in 2014 is projected to be 575,000 to 625,000 tons. Finished lumber production and resulting sales volumes are projected at 270 to 290 million board feet, and MDF production and sales volumes are estimated to be 110 to 130 million square feet for 2014. Actual lumber and MDF sales volumes are subject to market conditions. Deltic anticipates that closings for residential lots will be 60 to 80 lots for the year of 2014.
Certain statements contained in this report that are not historical in nature constitute “forward-looking statements” within the meaning of the Private Securities Litigation Reform Act of 1995. Words such as “expects,” “anticipates,” “intends,” “plans,” “estimates,” or variations of such words and similar expressions are intended to identify such forward-looking statements. These statements reflect the Company’s current expectations and involve certain risks and uncertainties, including those disclosed elsewhere in this report. Therefore, actual results could differ materially from those included in such forward-looking statements.
| Item 7A. | Quantitative and Qualitative Disclosures About Market Risk |
Information with respect to quantitative and qualitative disclosures about market risk of the Company is set forth under the caption “Other Matters - Market Risk” in Item 7 of Part II of this report.
43
| Item 8. | Financial Statements and Supplementary Data |
DELTIC TIMBER CORPORATION
AND SUBSIDIARIES
Consolidated Balance Sheets
December 31, 2013 and 2012
(Thousands of dollars)
| | | | | | | | |
| | | 2013 | | | 2012 | |
Assets | | | | | | | | |
Current assets | | | | | | | | |
Cash and cash equivalents | | $ | 4,374 | | | | 5,613 | |
Trade accounts receivable – net | | | 7,331 | | | | 5,277 | |
Inventories | | | 12,439 | | | | 4,894 | |
Prepaid expenses and other current assets | | | 3,155 | | | | 2,808 | |
| | | | | | | | |
Total current assets | | | 27,299 | | | | 18,592 | |
| | |
Investment in real estate held for development and sale | | | 57,953 | | | | 57,088 | |
Investment in Del-Tin Fiber | | | — | | | | 6,293 | |
Timber and timberlands – net | | | 248,833 | | | | 240,215 | |
Property, plant, and equipment – net | | | 75,259 | | | | 26,668 | |
Deferred charges and other assets | | | 2,000 | | | | 4,353 | |
| | | | | | | | |
| | |
Total assets | | $ | 411,344 | | | | 353,209 | |
| | | | | | | | |
| | |
Liabilities and Stockholders’ Equity | | | | | | | | |
Current liabilities | | | | | | | | |
Trade accounts payable | | $ | 8,198 | | | | 1,981 | |
Accrued taxes other than income taxes | | | 2,210 | | | | 1,951 | |
Income taxes payable | | | 1,077 | | | | — | |
Deferred revenues and other accrued liabilities | | | 10,330 | | | | 9,094 | |
| | | | | | | | |
Total current liabilities | | | 21,815 | | | | 13,026 | |
| | |
Long-term debt | | | 90,000 | | | | 63,000 | |
Deferred tax liabilities – net | | | 7,514 | | | | 471 | |
Other noncurrent liabilities | | | 25,743 | | | | 44,482 | |
Commitments and contingencies | | | — | | | | — | |
Stockholders’ equity | | | | | | | | |
Cumulative preferred stock - $.01 par, authorized 20,000,000 shares, none issued | | | — | | | | — | |
Common stock - $.01 par, authorized 50,000,000 shares, 12,813,879 shares issued | | | 128 | | | | 128 | |
Capital in excess of par value | | | 84,796 | | | | 82,597 | |
Retained earnings | | | 189,720 | | | | 168,608 | |
Treasury stock | | | (5,693 | ) | | | (5,000 | ) |
Accumulated other comprehensive loss | | | (2,679 | ) | | | (14,103 | ) |
| | | | | | | | |
Total stockholders’ equity | | | 266,272 | | | | 232,230 | |
| | | | | | | | |
| | |
Total liabilities and stockholders’ equity | | $ | 411,344 | | | | 353,209 | |
| | | | | | | | |
See accompanying notes to consolidated financial statements.
44
DELTIC TIMBER CORPORATION
AND SUBSIDIARIES
Consolidated Statements of Income
For the Years Ended December 31, 2013, 2012, and 2011
(Thousands of dollars, except per share amounts)
| | | | | | | | | | | | |
| | | 2013 | | | 2012 | | | 2011 | |
Net sales | | $ | 199,702 | | | | 140,908 | | | | 121,847 | |
| | | | | | | | | | | | |
Costs and expenses | | | | | | | | | | | | |
Cost of sales | | | 130,752 | | | | 94,706 | | | | 87,325 | |
Depreciation, amortization, and cost of fee timber harvested | | | 15,131 | | | | 10,642 | | | | 11,806 | |
General and administrative expenses | | | 19,037 | | | | 18,428 | | | | 15,257 | |
| | | | | | | | | | | | |
| | | |
Total costs and expenses | | | 164,920 | | | | 123,776 | | | | 114,388 | |
| | | |
Gain on involuntary conversion | | | 881 | | | | — | | | | — | |
| | | | | | | | | | | | |
| | | |
Operating income | | | 35,663 | | | | 17,132 | | | | 7,459 | |
Equity in earnings of Del-Tin Fiber | | | 1,084 | | | | 959 | | | | 318 | |
Interest income | | | 13 | | | | 17 | | | | 38 | |
Interest and other debt expense, net of capitalized interest | | | (4,578 | ) | | | (4,092 | ) | | | (4,029 | ) |
Gain on bargain purchase | | | 3,413 | | | | — | | | | — | |
Other income | | | 3,229 | | | | 20 | | | | 3 | |
| | | | | | | | | | | | |
Income before income taxes | | | 38,824 | | | | 14,036 | | | | 3,789 | |
| | | |
Income taxes | | | (12,632 | ) | | | (4,801 | ) | | | (1,130 | ) |
| | | | | | | | | | | | |
| | | |
Net income | | $ | 26,192 | | | | 9,235 | | | | 2,659 | |
| | | | | | | | | | | | |
| | | |
Earnings per common share | | | | | | | | | | | | |
Basic | | $ | 2.06 | | | | .73 | | | | .21 | |
Assuming dilution | | | 2.05 | | | | .73 | | | | .21 | |
| | | |
Dividends declared per common share | | $ | .40 | | | | .30 | | | | .30 | |
| | | |
Weighted average common shares outstanding (thousands) | | | | | | | | | | | | |
Basic | | | 12,566 | | | | 12,525 | | | | 12,450 | |
Assuming dilution | | | 12,624 | | | | 12,588 | | | | 12,552 | |
See accompanying notes to consolidated financial statements.
45
DELTIC TIMBER CORPORATION
AND SUBSIDIARIES
Consolidated Statements of Comprehensive Income/(Loss)
For the Years Ended December 31, 2013, 2012, and 2011
(Thousands of dollars)
| | | | | | | | | | | | |
| | | 2013 | | | 2012 | | | 2011 | |
Net income | | $ | 26,192 | | | | 9,235 | | | | 2,659 | |
| | | | | | | | | | | | |
| | | |
Other comprehensive income/(loss) | | | | | | | | | | | | |
Items related to employee benefit plans: | | | | | | | | | | | | |
Net gain/(loss) arising during period (net of tax) | | | 10,973 | | | | (5,131 | ) | | | (6,980 | ) |
Reclassification adjustment for gains/(losses) included in net income (net of tax)1: | | | | | | | | | | | | |
Amortization of prior service credit | | | 4 | | | | 4 | | | | 4 | |
Amortization of actuarial losses | | | 568 | | | | 874 | | | | 94 | |
Amortization of plan amendment | | | (121 | ) | | | (121 | ) | | | (121 | ) |
| | | | | | | | | | | | |
Net change in other comprehensive income/(loss) | | | 11,424 | | | | (4,374 | ) | | | (7,003 | ) |
| | | | | | | | | | | | |
| | | |
Comprehensive income/(loss) | | $ | 37,616 | | | | 4,861 | | | | (4,344 | ) |
| | | | | | | | | | | | |
| 1 | The amortizations out of comprehensive income for 2012 and 2011 have been revised to conform to the 2013 presentation. |
See accompanying notes to consolidated financial statements.
46
DELTIC TIMBER CORPORATION
AND SUBSIDIARIES
Consolidated Statements of Cash Flows
For the Years Ended December 31, 2013, 2012, and 2011
(Thousands of dollars)
| | | | | | | | | | | | |
| | | 2013 | | | 2012 | | | 2011 | |
Operating activities | | | | | | | | | | | | |
Net income | | $ | 26,192 | | | | 9,235 | | | | 2,659 | |
Adjustments to reconcile net income to net cash provided by operating activities | | | | | | | | | | | | |
Depreciation, amortization, and cost of fee timber harvested | | | 15,131 | | | | 10,642 | | | | 11,806 | |
Stock-based compensation expense | | | 2,797 | | | | 2,298 | | | | 2,067 | |
Deferred income taxes | | | 241 | | | | (649 | ) | | | 1,109 | |
Real estate development expenditures | | | (3,982 | ) | | | (2,822 | ) | | | (3,540 | ) |
Real estate costs recovered upon sale | | | 2,711 | | | | 2,342 | | | | 1,694 | |
Timberland costs recovered upon sale | | | 827 | | | | 832 | | | | 1,256 | |
Equity in earnings of Del-Tin Fiber | | | (1,084 | ) | | | (959 | ) | | | (318 | ) |
Gain on previously held equity interest | | | (3,165 | ) | | | — | | | | — | |
Gain on bargain purchase | | | (3,413 | ) | | | — | | | | — | |
Net increase in liabilities for pension and other postretirement benefits | | | 1,931 | | | | 1,990 | | | | 136 | |
Decrease/(increase) in operating working capital other than cash and cash equivalents | | | 5,883 | | | | 2,455 | | | | (920 | ) |
Other changes in assets and liabilities | | | (1,927 | ) | | | (1,282 | ) | | | (1,310 | ) |
| | | | | | | | | | | | |
Net cash provided by operating activities | | | 42,142 | | | | 24,082 | | | | 14,639 | |
| | | | | | | | | | | | |
| | | |
Investing activities | | | | | | | | | | | | |
Capital expenditures requiring cash, excluding real estate development | | | (28,315 | ) | | | (21,134 | ) | | | (12,014 | ) |
Business acquisition, net of cash acquired | | | (5,170 | ) | | | — | | | | — | |
Net change in purchased stumpage inventory | | | (1,486 | ) | | | 1,159 | | | | (764 | ) |
Advances to Del-Tin Fiber | | | (1,025 | ) | | | (2,190 | ) | | | (1,822 | ) |
Repayments from Del-Tin Fiber | | | 781 | | | | 3,970 | | | | 3,275 | |
Net change in funds held by trustee | | | 7 | | | | 560 | | | | (568 | ) |
Other – net | | | 1,416 | | | | 800 | | | | 781 | |
| | | | | | | | | | | | |
Net cash required by investing activities | | | (33,792 | ) | | | (16,835 | ) | | | (11,112 | ) |
| | | | | | | | | | | | |
| | | |
Financing activities | | | | | | | | | | | | |
Proceeds from borrowings | | | 12,000 | | | | 18,000 | | | | 15,500 | |
Repayments of notes payable and long-term debt | | | (14,000 | ) | | | (20,111 | ) | | | (17,111 | ) |
Treasury stock purchases | | | (2,224 | ) | | | (19 | ) | | | (55 | ) |
Common stock dividends paid | | | (5,080 | ) | | | (3,797 | ) | | | (3,775 | ) |
Proceeds from stock option exercises | | | 760 | | | | 1,157 | | | | 2,463 | |
Excess tax benefits from stock-based compensation expense | | | 408 | | | | 590 | | | | 698 | |
Other – net | | | (688 | ) | | | (745 | ) | | | (693 | ) |
Deferred financing costs | | | (765 | ) | | | — | | | | (1,094 | ) |
| | | | | | | | | | | | |
Net cash required by financing activities | | | (9,589 | ) | | | (4,925 | ) | | | (4,067 | ) |
| | | | | | | | | | | | |
| | | |
Net increase/(decrease) in cash and cash equivalents | | | (1,239 | ) | | | 2,322 | | | | (540 | ) |
Cash and cash equivalents at January 1 | | | 5,613 | | | | 3,291 | | | | 3,831 | |
| | | | | | | | | | | | |
| | | |
Cash and cash equivalents at December 31 | | $ | 4,374 | | | | 5,613 | | | | 3,291 | |
| | | | | | | | | | | | |
See accompanying notes to consolidated financial statements.
47
DELTIC TIMBER CORPORATION
AND SUBSIDIARIES
Consolidated Statements of Stockholders’ Equity
For the Years Ended December 31, 2013, 2012, and 2011
(Thousands of dollars)
| | | | | | | | | | | | |
| | | 2013 | | | 2012 | | | 2011 | |
Cumulative preferred stock - $.01 par, authorized 20,000,000 shares, no shares issued at end of each year | | $ | — | | | | — | | | | — | |
| | | | | | | | | | | | |
| | | |
Common stock - $.01 par, authorized 50,000,000 shares, 12,813,879 shares issued at end of each year | | | 128 | | | | 128 | | | | 128 | |
| | | | | | | | | | | | |
| | | |
Capital in excess of par value | | | | | | | | | | | | |
Balance at beginning of year | | | 82,597 | | | | 80,842 | | | | 79,081 | |
Exercise of stock options | | | 123 | | | | 181 | | | | 347 | |
Stock-based compensation expense | | | 2,797 | | | | 2,298 | | | | 2,067 | |
Restricted stock awards | | | (935 | ) | | | (1,393 | ) | | | (1,456 | ) |
Tax effect on stock awards | | | 173 | | | | 607 | | | | 756 | |
Restricted stock forfeitures | | | 41 | | | | 62 | | | | 47 | |
| | | | | | | | | | | | |
Balance at end of year | | | 84,796 | | | | 82,597 | | | | 80,842 | |
| | | | | | | | | | | | |
| | | |
Retained earnings | | | | | | | | | | | | |
Balance at beginning of year | | | 168,608 | | | | 163,170 | | | | 164,286 | |
Net income | | | 26,192 | | | | 9,235 | | | | 2,659 | |
Common stock dividends declared | | | (5,080 | ) | | | (3,797 | ) | | | (3,775 | ) |
| | | | | | | | | | | | |
Balance at end of year | | | 189,720 | | | | 168,608 | | | | 163,170 | |
| | | | | | | | | | | | |
| | | |
Treasury stock | | | | | | | | | | | | |
Balance at beginning of year – 141,974; 208,296; and 308,846 shares, respectively | | | (5,000 | ) | | | (7,288 | ) | | | (10,758 | ) |
Shares purchased – 36,314; 267; and 869 shares, respectively | | | (2,224 | ) | | | (19 | ) | | | (55 | ) |
Forfeited restricted stock – 570; 905; and 877 shares, respectively | | | (41 | ) | | | (62 | ) | | | (47 | ) |
Shares issued for incentive plans – 44,249; 67,494; and 102,296 shares, respectively | | | 1,572 | | | | 2,369 | | | | 3,572 | |
| | | | | | | | | | | | |
Balance at end of year – 134,609; 141,974; and 208,296 shares, respectively, at cost | | | (5,693 | ) | | | (5,000 | ) | | | (7,288 | ) |
| | | | | | | | | | | | |
| | | |
Accumulated other comprehensive loss | | | | | | | | | | | | |
Balance at beginning of year | | | (14,103 | ) | | | (9,729 | ) | | | (2,726 | ) |
Net change in other comprehensive income/(loss), net of income taxes | | | 11,424 | | | | (4,374 | ) | | | (7,003 | ) |
| | | | | | | | | | | | |
Balance at end of year | | | (2,679 | ) | | | (14,103 | ) | | | (9,729 | ) |
| | | | | | | | | | | | |
| | | |
Total stockholders’ equity | | $ | 266,272 | | | | 232,230 | | | | 227,123 | |
| | | | | | | | | | | | |
| | | |
Dividends declared per common share | | $ | .40 | | | | .30 | | | | .30 | |
See accompanying notes to consolidated financial statements.
48
DELTIC TIMBER CORPORATION
AND SUBSIDIARIES
Notes to Consolidated Financial Statements
December 31, 2013
Note 1 – Significant Accounting Policies
Description of Business — Deltic Timber Corporation (“Deltic” or the “Company”) is a natural resources company engaged primarily in the growing and harvesting of timber and the manufacture and marketing of lumber and medium density fiberboard (“MDF”). Deltic owns approximately 458,600 acres of timberland, primarily in Arkansas and north Louisiana. The Company’s sawmill operations are located at Ola in central Arkansas and at Waldo in south Arkansas, and the MDF plant is located near El Dorado, Arkansas. In addition to its timber, lumber, and MDF operations, the Company is engaged in real estate development in central Arkansas.
Business Environment— The Company is primarily a wood products producer operating in a commodity-based business environment with a major diversification in real estate development. This environment is affected by a number of factors including general economic conditions, interest rates, credit availability, building product imports, foreign exchange rates, housing starts, new and existing housing inventory, foreclosures, residential repair and remodeling, commercial construction and repair, industry capacity and production levels, the availability of contractors for logging, hauling, and shipping, the availability of raw materials, natural gas pricing, costs of fuel, and weather conditions.
Principles of Consolidation — The consolidated financial statements of Deltic Timber Corporation include the accounts of Deltic, all majority-owned subsidiaries, and any variable interest entities of which it is the primary beneficiary. Equity investments and joint ventures are accounted for under the equity method if it is determined that the Company does not have control of the entity. Significant intercompany transactions and accounts have been eliminated.
Business Combination — The Company accounts for business combinations using the acquisition method. The assets acquired and liabilities assumed are measured at fair value on the acquisition date using appropriate valuation methods. The operations of the acquisitions are included in the consolidated financial statements from the date of acquisition. (For additional information, see Note 4 – Business Combinations.)
Use of Estimates — In the preparation of the Company’s financial statements in conformity with accounting principles generally accepted in the United States of America, management has made a number of estimates and assumptions related to the reporting of assets and liabilities and the disclosure of contingent assets and liabilities. Actual results may differ from those estimates.
Cash Equivalents — Cash equivalents include investments that have a maturity of three months or less from the date of purchase.
Accounts Receivable and Allowance for Doubtful Accounts — The Company records trade accounts receivable at net realizable value. This value includes an appropriate allowance for estimated uncollectible accounts to reflect any loss anticipated on the trade accounts receivable balances and charged to the provision for doubtful accounts. The allowance is based upon review of specific receivables outstanding and considers factors such as current overall economic conditions, industry-specific economic conditions, historical customer performance, and anticipated customer performance. In the consolidated statements of income, bad debt expense is included in cost of sales. Charges to bad debt expense were $158,000, $133,000, and $63,000 in 2013, 2012, and 2011, respectively. At December 31, 2013 and 2012, the balance in the allowance account was $172,000 and $127,000, respectively.
49
DELTIC TIMBER CORPORATION
AND SUBSIDIARIES
Notes to Consolidated Financial Statements
December 31, 2013
Note 1 – Significant Accounting Policies (cont.)
Inventories — Inventories of logs, wood fiber, lumber, MDF, and supplies are stated at the lower of cost or market within Deltic’s operating areas, primarily using the average cost method. Log costs include harvest and transportation cost as appropriate. Lumber and MDF costs include materials, labor, and production overhead. (For additional information, see Note 2 – Inventories.)
Investment in Del-Tin Fiber— On April 1, 2013, the Company acquired the remaining 50 percent membership interest of Del-Tin Fiber L.L.C., which had been accounted for as an equity method investment and is now included as a wholly-owned consolidated subsidiary. (For additional information, see Note 4 – Business Combinations.)
Investment in Real Estate Held for Development and Sale — Real estate held for development and sale includes direct costs of land and land development and indirect cost, including amenities. Indirect and amenity costs are allocated to individual lots or acreage sold based on relative retail sales value. Direct costs are allocated to a specific neighborhood or commercial real estate tract, while indirect costs for the Company’s three developments – Chenal Valley, Chenal Downs, and Red Oak Ridge – are allocated to neighborhoods over the entire respective development area based on relative retail sales values.
Timber and Timberlands — Timber and timberlands, which includes timberland, fee timber, purchased stumpage inventory, and logging facilities, are stated at cost, less the cost of fee timber harvested and accumulated depreciation of logging facilities, and include no estimated future reforestation cost. The cost of timber consists of fee timber acquired and reforestation costs, which includes site preparation, seedlings, and labor. The cost of fee timber harvested is based on the volume of timber harvested in relation to the estimated volume of timber recoverable. Logging facilities, which consist primarily of roads constructed and other land improvements, are depreciated using the straight-line method over a ten-year estimated life. The Company estimates its fee timber inventory using statistical information and data obtained from physical measurements and other information gathering techniques. Fee timber carrying costs, commercial thinning, silviculture, and timberland management costs are expensed as incurred.
The Company classifies its timberlands and fee timber as either strategic or non-strategic. Strategic timberland, including pine forest and pine plantations, is prime pine sawtimber growing platforms located within or immediately adjacent to the Company sawmills’ operating regions. Deltic manages these acres using modern silviculture methods to achieve optimal volume and quality of its pine sawtimber. The Company harvests sawtimber and pulpwood in accordance with its harvest plans and generally converts sawtimber into lumber in its own sawmills and sells pulpwood in the market. Upon harvest, strategic timberlands are reforested. The Company’s timberland acquisition program is focused on the acquisition of pine-growing timberland in its current operating regions. The Company considers the acquisition and the occasional sale of strategic timberlands as investing activities. The Company has legacy hardwood and other acreage which cannot be harvested for conversion in Company sawmills, reforested as pine plantations, or managed efficiently using modern silviculture methods either due to the size of the tract or lack of proximity to other Deltic fee timberlands. These timberlands have been identified as non-strategic and/or higher and better use timberlands and are expected to be sold over time. The Company considers these sales to be an operating activity of its Woodlands segment.
50
DELTIC TIMBER CORPORATION
AND SUBSIDIARIES
Notes to Consolidated Financial Statements
December 31, 2013
Note 1 – Significant Accounting Policies (cont.)
In order to acquire and sell assets, primarily timberlands, in a tax efficient manner, the Company enters into tax-deferred, like-kind exchange (“LKE”) transactions when possible. The Company generally enters into forward transactions, in which property is sold and the proceeds are reinvested by acquiring similar property, and reverse transactions, in which property is acquired and similar property is subsequently sold. A qualified LKE intermediary is used to facilitate LKE transactions. Proceeds from forward LKE transactions are held by the intermediary and are classified as restricted cash because the funds must be reinvested in similar properties. If the acquisition of suitable LKE properties is not completed within 180 days of the sale of the company-owned property, the proceeds are distributed to Deltic by the intermediary and are reclassified as available cash, and applicable income taxes are determined. Amounts deposited with a third party towards the potential future purchase of property are included in deferred charges and other assets in the consolidated balance sheets and as an investing activity as changes in funds held by trustee in the consolidated statements of cash flows. At December 31, 2013, the Company had no proceeds from land sales deposited with an LKE intermediary and had $7,000 deposited at December 31, 2012. An exchange accommodation titleholder, a type of variable interest entity, is used to facilitate reverse like-kind exchanges. The acquired assets are held by the exchange accommodation titleholder until the exchange transactions are complete. If the Company determines that it is the primary beneficiary of the exchange accommodation titleholder, Deltic includes the assets held by the exchange accommodation titleholder in timber and timberlands assets on the consolidated balance sheets and recognizes any income or expense attributed to the property in the consolidated income statements.
Property, Plant, and Equipment — Property, plant, and equipment assets are stated at cost less accumulated depreciation. Depreciation of buildings, equipment, and other depreciable assets is calculated primarily using the straight-line method. Expenditures that substantially improve and/or increase the useful life of facilities or equipment are capitalized. Maintenance and repair costs are expensed as incurred. Gains and losses on disposals or retirements are recognized in the period they occur.
Property, plant, and equipment assets are evaluated for possible impairment on a specific asset basis or in groups of similar assets, as applicable, whenever events or changes in circumstances indicate that the carrying amount of an asset may not be recoverable. Recoverability of assets to be held and used is measured by a comparison of the carrying amount of an asset to estimated undiscounted future net cash flows to be generated by the asset. If the carrying amount of an asset exceeds its estimated future cash flows, an impairment loss is recognized for the amount by which the carrying amount of the asset exceeds the fair value of the asset. Assets to be disposed of are reported at the lower of the carrying amount or fair value less costs to sell, and depreciation ceases.
Revenue Recognition — The Company recognizes revenue when the following criteria are met: (1) persuasive evidence of an agreement exists, (2) delivery has occurred or services have been rendered, (3) the price to the buyer is fixed and determinable, and (4) collectability is reasonably assured. Delivery is not considered to have occurred until the customer takes title and assumes the risks and rewards of ownership. Revenue from the sale of lumber, MDF, and wood by-products is recorded at the time of shipment due to terms of such sale being designated free on board (“f.o.b.”) shipping point. Revenue from consignment sales are recorded when the customer assumes ownership of the product. Revenue from the sale of timber-cutting rights to third parties is recorded when legal title passes to the purchaser, which is generally upon delivery of a legally executed timber deed and receipt of payment for the timber. Revenue from intersegment timber sales is recorded when the timber is harvested; such intersegment sales, which are made at prices which generally approximate market within Deltic’s operating area, are eliminated in the consolidated financial statements.
51
DELTIC TIMBER CORPORATION
AND SUBSIDIARIES
Notes to Consolidated Financial Statements
December 31, 2013
Note 1 – Significant Accounting Policies (cont.)
Revenue from the leasing of land for hunting purposes is deferred when received and subsequently recognized over the one-year lease term, which begins September 1 of each year. At December 31, 2013 and 2012, the Company had deferred hunting lease revenue totaling $1,684,000 and $1,562,000, respectively, reflected in the consolidated balance sheets in deferred revenues and other accrued liabilities. Revenue from mineral lease rental payments is deferred when received and recognized ratably over the lease term. At December 31, 2013 and 2012, the Company had deferred mineral lease revenue of $2,085,000 and $3,721,000, respectively, of which $649,000 and $2,064,000 is included in other noncurrent liabilities for 2013 and 2012, respectively, and $1,436,000 and $1,657,000 is included in other current liabilities, respectively. Mineral royalty payments are recognized when received. Revenue from sales of timberland and real estate is recorded when the sale is closed and legal title is transferred and the buyer’s initial and continuing investment is adequate, which is generally at the time the purchaser executes the real estate closing documents and makes payment to the title company handling the closing.
Income Taxes — The Company uses the asset and liability method of accounting for income taxes. Under this method, the provision for income taxes includes amounts currently payable and amounts deferred as tax assets and liabilities, based on differences between the financial statement carrying amounts and the tax bases of existing assets and liabilities, and is measured using the enacted tax rates that are expected to be in effect when the differences reverse. Deferred tax assets are reduced by a valuation allowance, which is established when it is more-likely-than-not that some portion or all of the deferred tax assets will not be realized. The effect on deferred tax assets and liabilities of a change in tax law is recognized in income in the period that includes the enactment date. The Company continuously reviews state and federal tax returns for uncertain tax provisions. Tax benefits are recorded if it is more-likely-than-not that the positions will be sustained upon examination by the taxing authorities, and liabilities are recorded if it is deemed less likely that the position taken would prevail. These liabilities are adjusted in the period in which it is determined that the issue is settled with the relevant taxing authority, the expiration of statute of limitation for a tax year in question, a change in tax laws, or other facts become known.
Property Taxes — Property taxes applicable to the Company’s assets are estimated and accrued in the period of assessment. At December 31, 2013 and 2012, the Company had accrued property tax expense totaling $1,798,000 and $1,783,000, respectively, reflected in the consolidated balance sheets in accrued taxes other than income taxes.
Share-Based Compensation — The Company applies a fair value-based measurement method in accounting for share-based payment transactions with employees, recognizing the cost as the services are performed. (For additional information, see Note 17 – Incentive Plans.)
Pensions and Other Postretirement Benefits — The Company sponsors both qualified and nonqualified, noncontributory, defined benefit retirement plans that cover all eligible employees, excluding employees of the subsidiaries. Benefits are based on years of service and final career-average-pay formulas as defined by the plans. The qualified plan is funded to accumulate sufficient assets to provide for accrued benefits. The nonqualified plan, a supplemental executive plan, is not funded; payments to retirees due under this plan are made on a monthly basis.
The Company also sponsors a defined benefit health care plan and a life insurance benefit plan for all eligible retired employees, excluding employees of the subsidiaries. The Company measures the costs of its obligations for these plans based on its health care cost trends and actuarial assumptions, including discount rates, mortality rates, assumed rates of return, compensation increases, and turnover rates. The Company reviews its assumptions on an annual basis and makes modifications
52
DELTIC TIMBER CORPORATION
AND SUBSIDIARIES
Notes to Consolidated Financial Statements
December 31, 2013
Note 1 – Significant Accounting Policies (cont.)
to the assumptions based on current rates and trends when it is appropriate to do so. The effect of modifications to those assumptions is recorded in accumulated other comprehensive income/(loss) and amortized to net periodic cost over future periods using the corridor method. The Company believes that the assumptions utilized in recording its obligations under its plans are reasonable based on its experience and market conditions.
Net periodic costs are recognized as employees render the services necessary to earn these post retirement benefits. (For additional information, see Note 16 – Employee and Retiree Benefit Plans.)
Advertising Costs — Advertising costs, primarily related to marketing efforts for the Company’s real estate developments, are expensed as incurred. These costs amounted to $716,000 in 2013, $732,000 in 2012, and $768,000 in 2011, and are reflected in the consolidated statements of income.
Capitalized Interest — The Company capitalizes interest for qualifying assets during construction by applying the Company’s capitalization rate to the average amount of accumulated expenditures for the asset during the period. Interest is most often capitalized as an indirect cost for real estate development in the Company’s real estate operations. (For additional information, see Note 18 – Supplemental Cash Flows Disclosures.)
Capital Expenditures — Capital expenditures include additions to investment in real estate held for development and sale; timber and timberlands; and property, plant, and equipment.
Net Change in Purchased Stumpage Inventory — Purchased stumpage inventory consists of timber-cutting rights purchased from third parties specifically for use in the Company’s sawmills. Depending on the timing of acquisition and usage of this acquired stumpage inventory, the net change in this inventory can either be a source or use of cash in the Company’s consolidated statements of cash flows.
Earnings per Common Share — Basic earnings per share is computed using the two-class method and is based on earnings available to common shareholders less accrued preferred dividends, if any, and the weighted average number of common shares outstanding. The diluted earnings per share amounts are computed based on earnings available to common shareholders and the weighted average number of common shares outstanding, including shares assumed to be issued under the Company’s stock incentive plans using the treasury-stock method, unless anti-dilutive. (For a reconciliation of amounts used in per share computations, see Note 19 – Earnings per Share.)
Shipping and Handling Costs — Shipping and handling costs, such as freight to our customers’ destinations, are included in cost of sales in the Company’s consolidated statements of income. These costs, when included in the amount invoiced to customers, are also recognized in net sales.
Off-Balance Sheet Arrangements— The Company evaluates its transactions to determine if any variable interest entities exist. If it is determined that Deltic is the primary beneficiary of a variable interest entity, that entity is consolidated into Deltic’s financial statements.
53
DELTIC TIMBER CORPORATION
AND SUBSIDIARIES
Notes to Consolidated Financial Statements
December 31, 2013
Note 1 – Significant Accounting Policies (cont.)
Effect of Recently Issued Authoritative Accounting Guidance — Financial Accounting Standards Update No. 2013-02, “Reporting of Amounts Reclassified Out of Accumulated Other Comprehensive Income (Topic 220),” became effective for the Company on January 1, 2013. The amendment of this update requires an entity to provide information about the amounts reclassified out of accumulated other comprehensive income by component including the respective line item of net income when reclassed in its entirety. (For additional information, refer to Note 15 – Other Comprehensive Income Disclosures.)
Subsequent Events —The Company has evaluated subsequent events through the date the financial statements were issued.
Note 2 – Inventories
Inventories at December 31 consisted of the following:
| | | | | | | | |
(Thousands of dollars) | | 2013 | | | 2012 | |
Raw materials - Logs | | $ | 1,612 | | | | 1,341 | |
- Del-Tin – wood fiber | | | 440 | | | | — | |
Finished goods - Lumber | | | 4,145 | | | | 3,231 | |
- Medium density fiberboard | | | 3,110 | | | | — | |
- Medium density fiberboard consigned to others | | | 708 | | | | — | |
Supplies | | | 2,424 | | | | 322 | |
| | | | | | | | |
| | $ | 12,439 | | | | 4,894 | |
| | | | | | | | |
The Company utilizes the lower of cost or market basis for determining inventory-carrying values. Lumber and MDF inventory amounts at December 31, 2013 and 2012, are stated at lower of cost or net realizable value.
Note 3 – Prepaid Expenses and Other Current Assets
Prepaid expenses and other current assets at December 31 consisted of the following:
| | | | | | | | |
| (Thousands of dollars) | | 2013 | | | 2012 | |
Short-term deferred tax assets | | $ | 1,901 | | | | 2,074 | |
Refundable income taxes | | | 109 | | | | 123 | |
Prepaid expenses | | | 692 | | | | 88 | |
Other current assets | | | 453 | | | | 523 | |
| | | | | | | | |
| | $ | 3,155 | | | | 2,808 | |
| | | | | | | | |
54
DELTIC TIMBER CORPORATION
AND SUBSIDIARIES
Notes to Consolidated Financial Statements
December 31, 2013
Note 4 – Business Combinations
On April 1, 2013, the Company acquired the remaining 50 percent membership interest of Del-Tin Fiber L.L.C. (“Del-Tin Fiber”) for an agreed-upon amount of approximately $20,000,000, which was considered to be comprised of a cash payment of $5,170,000 and the value of 50 percent of the long-term debt. Del-Tin Fiber was an existing joint venture that operates a medium density fiberboard (“MDF”) manufacturing facility in El Dorado, Arkansas. This facility has a rated annual production capacity of 150,000,000 square feet, on a 3/4-inch basis. The acquisition resulted in Deltic obtaining a controlling financial interest in Del-Tin Fiber due to the Company’s 100 percent ownership of the membership interest of Del-Tin Fiber. As a result, Deltic began treating Del-Tin Fiber as a consolidated subsidiary of the Company as of the acquisition date. With this consolidation, on April 1, 2013, Deltic’s Consolidated Balance Sheet included the $29,000,000 of long-term debt of Del-Tin Fiber, which represents the L.L.C.’s recorded liability for the outstanding industrial bonds due 2027. This acquisition was consistent with Deltic’s strategy of growth through acquisitions and vertical integration, since Del-Tin Fiber uses residual by-products generated by Deltic’s sawmill operations as the raw material in its manufacturing process.
Prior to this acquisition the Company owned 50 percent of the membership interest of Del-Tin Fiber and reported it as an equity method investment. In accordance with ASC 805, Deltic accounted for the acquisition as a business combination achieved in stages. Thus, the Company remeasured the carrying amount of its previously held investment in the joint venture to current fair value and recorded a $3,165,000 pretax remeasurement gain, determined by the amount by which the acquisition-date fair value of this investment, of $10,786,000, exceeded its previous carrying amount of $7,621,000. This gain was included in Other Income in the Company’s Consolidated Statements of Income for the year ended December 31, 2013.
The acquisition date fair value of the Company’s existing 50 percent equity interest in Del-Tin Fiber was derived by applying the ownership percentage to the fair value of the net assets of Del-Tin Fiber. It was determined that no discounting was required, since prior to the acquisition, there was equally shared control of the joint venture by the owning members without specific benefit identified that related to the existence of control. In addition, Deltic continues to operate the existing facility to produce MDF.
The fair value of assets acquired and liabilities assumed was determined using a combination of various methodologies, as appropriate, depending on the asset type and classification. Current assets and liabilities were valued at book value since carrying value approximated fair value. Property, plant, and equipment assets were valued under various methodologies, including the market approach using comparable sales for real estate and the cost approach discounted for obsolescence for plant and equipment. Intangible assets were valued using the discounted income approach and using a discount rate of 15 percent. Long-term debt was valued at book value since it approximated fair value. There was no tax-deductible goodwill as a result of the Del-Tin Fiber acquisition.
The total cost of the acquisition has been allocated to the assets acquired and the liabilities assumed based upon their estimated fair values at the date of the acquisition and is presented in the next table.
55
DELTIC TIMBER CORPORATION
AND SUBSIDIARIES
Notes to Consolidated Financial Statements
December 31, 2013
Note 4 – Business Combinations (cont.)
The purchase price allocated to the net tangible and intangible assets acquired and liabilities assumed based on their fair values as of the acquisition date and the calculation of the gain on bargain purchase were as follows:
| | | | |
| (Thousands of dollars) | | | |
Accounts receivable | | $ | 4,229 | |
Inventories | | | 4,805 | |
Other current assets | | | 360 | |
Property, plant, and equipment | | | 40,960 | |
Intangible assets1 | | | 1,700 | |
Other assets | | | 171 | |
Current liabilities | | | (1,653 | ) |
Deferred tax liabilities | | | (2,203 | ) |
Long-term liabilities | | | (29,000 | ) |
| | | | |
Net assets acquired | | | 19,369 | |
Cash paid | | | (5,170 | ) |
Fair value of previously held investment in Del-Tin Fiber | | | (10,786 | ) |
| | | | |
Gain on bargain purchase | | $ | 3,413 | |
| | | | |
| | 1 | The acquired intangible assets consist of internally developed software which is being amortized over three years. |
The purchase price allocation resulted in the recognition of a gain on bargain purchase of approximately $3,413,000, which was included in the Consolidated Statements of Income for the year ended December 31, 2013. The gain on bargain purchase was the result of the fair value of the identifiable net assets acquired exceeding the purchase price paid for the acquisition. The seller, Deltic’s former joint venture partner, was motivated to sell its half of Del-Tin Fiber in order to facilitate the sale of its remaining building products business to a major building products company that had no interest in owning a membership interest in a joint venture. This sale was part of the former joint venture partner’s stated plan to divest itself of its building product assets by the end of the year 2013.
Transaction costs related to the acquisition of Del-Tin Fiber were insignificant and were expensed as incurred. The cash paid to the seller at the closing of the acquisition was funded by cash on hand.
The results of Del-Tin Fiber’s operations have been included in the consolidated financial statements subsequent to the acquisition date and were included in the Company’s Manufacturing segment. Subsequent to the acquisition date, for the year ended December 31, 2013, the Company included net sales of approximately $47,812,000, from Del-Tin Fiber in its Consolidated Statements of Income. Deltic’s operating income for the year ended December 31, 2013, included $3,068,000 from Del-Tin Fiber operations.
56
DELTIC TIMBER CORPORATION
AND SUBSIDIARIES
Notes to Consolidated Financial Statements
December 31, 2013
Note 4 – Business Combinations (cont.)
The following unaudited supplemental pro forma financial information for the years ended December 31, 2013 and 2012 represents the results of operations of Deltic Timber Corporation as if the Del-Tin Fiber acquisition had occurred on January 1, 2012. This information is based on historical results of operations, adjusted for certain acquisition accounting adjustments and does not purport to represent Deltic Timber’s actual results of operation as if the acquisition transaction described above would have occurred as of January 1, 2012, nor is it necessarily indicative of future results.
| | | | | | | | |
| | | Twelve Months Ended
December 31, | |
| (Thousands of dollars, except per share amounts) | | 2013 | | | 2012 | |
Net sales | | $ | 217,268 | | | $ | 207,446 | |
Net income | | | 21,193 | | | | 8,846 | |
Basic earnings per common share | | | 1.69 | | | | .71 | |
Diluted earnings per common share | | | 1.68 | | | | .70 | |
Note 5 – Timber and Timberlands
Timber and timberlands at December 31 consisted of the following:
| | | | | | | | |
| (Thousands of dollars) | | 2013 | | | 2012 | |
Purchased stumpage inventory | | $ | 2,388 | | | | 902 | |
Timberlands | | | 102,609 | | | | 99,159 | |
Fee timber | | | 253,768 | | | | 246,105 | |
Logging facilities | | | 2,628 | | | | 2,601 | |
| | | | | | | | |
| | | 361,393 | | | | 348,767 | |
Less accumulated cost of fee timber harvested and facilities depreciation | | | (113,056 | ) | | | (108,873 | ) |
| | | | | | | | |
Strategic timber and timberlands | | | 248,337 | | | | 239,894 | |
Non-strategic timber and timberlands | | | 496 | | | | 321 | |
| | | | | | | | |
| | $ | 248,833 | | | | 240,215 | |
| | | | | | | | |
In 1999, the Company initiated a program to identify and sell non-strategic timberlands and to use the sales proceeds to purchase pine timberlands that are strategic to its operations. In 2008, Deltic identified approximately 10,000 acres of non-strategic timberlands that existed within its timberland base to be sold. Other non-strategic acreage exists within the Company’s land base, but Deltic has not completely identified the number of acres that fit within this category. As the Company identifies these acres and determines they are either smaller tracts of pine timberland that cannot be strategically managed or tracts of hardwood bottomland that cannot be converted into pine growing acreage, they will be sold. As of December 31, 2013 and 2012, approximately 1,000 acres and 700 acres, respectively were available for sale. Included in the Woodlands operating income are gains from sales of non-strategic timberland of $1,715,000, $1,910,000, and $2,797,000 in 2013, 2012, and 2011, respectively. Occasionally Deltic engages in land-for-land exchanges that are recorded as sales due to the nature of the land involved. No gains were recognized from non-monetary land exchanges in 2013 or 2012, but gains of $47,000 were recognized in 2011.
57
DELTIC TIMBER CORPORATION
AND SUBSIDIARIES
Notes to Consolidated Financial Statements
December 31, 2013
Note 5 – Timber and Timberlands (cont.)
Cost of fee timber harvested amounted to $4,494,000, $4,497,000, and $4,963,000 in 2013, 2012, and 2011, respectively. Depreciation of logging facilities was $92,000, $94,000, and $93,000 for the years 2013, 2012, and 2011, respectively.
Note 6 – Property, Plant, and Equipment
Property, plant, and equipment at December 31 consisted of the following:
| | | | | | | | | | |
| (Thousands of dollars) | | Range of
Useful Lives | | 2013 | | | 2012 | |
Land | | N/A | | $ | 947 | | | | 357 | |
Land improvements | | 10-20 years | | | 8,835 | | | | 6,322 | |
Buildings and structures | | 10-20 years | | | 22,599 | | | | 13,985 | |
Machinery and equipment | | 3-15 years | | | 145,741 | | | | 99,867 | |
| | | | | | | | | | |
| | | | | 178,122 | | | | 120,531 | |
Less accumulated depreciation | | | | | (102,863 | ) | | | (93,863 | ) |
| | | | | | | | | | |
| | | | $ | 75,259 | | | | 26,668 | |
| | | | | | | | | | |
Depreciation of property, plant, and equipment charged to operations was $10,544,000, $6,051,000, and $6,749,000 in 2013, 2012, and 2011, respectively. Gains/(losses) on disposals or retirements of assets included in operating income were $362,000, $(128,000), and $36,000 in 2013, 2012, and 2011, respectively.
Note 7 – Deferred Revenues and Other Accrued Liabilities
Deferred revenues and other accrued liabilities at December 31 consisted of the following:
| | | | | | | | |
| (Thousands of dollars) | | 2013 | | | 2012 | |
Deferred revenues – current | | $ | 3,697 | | | | 3,794 | |
Vacation accrual | | | 1,290 | | | | 971 | |
Deferred compensation | | | 3,442 | | | | 2,720 | |
All other current liabilities | | | 1,901 | | | | 1,609 | |
| | | | | | | | |
| | $ | 10,330 | | | | 9,094 | |
| | | | | | | | |
58
DELTIC TIMBER CORPORATION
AND SUBSIDIARIES
Notes to Consolidated Financial Statements
December 31, 2013
Note 8 – Other Noncurrent Liabilities
Other noncurrent liabilities at December 31 consisted of the following:
| | | | | | | | |
| (Thousands of dollars) | | 2013 | | | 2012 | |
Accumulated postretirement benefit obligation | | $ | 10,391 | | | | 12,132 | |
Excess retirement plan | | | 4,457 | | | | 9,063 | |
Accrued pension liability | | | 6,383 | | | | 17,254 | |
Deferred revenue – long-term portion | | | 649 | | | | 2,064 | |
Uncertain tax positions liability | | | 1,185 | | | | 1,325 | |
All other noncurrent payables | | | 2,678 | | | | 2,644 | |
| | | | | | | | |
| | $ | 25,743 | | | | 44,482 | |
| | | | | | | | |
Note 9 – Credit Facilities
The Company has an agreement with SunTrust Bank together with other banks, which provides an unsecured and committed revolving credit facility totaling $340,000,000 and includes an option to request an increase in the amount of aggregate revolving commitments by $50,000,000. The most recent amendment of this credit facility occurred on May 2, 2013, and expires on May 1, 2018. To facilitate the amendment, $765,000 in fees were incurred and are being amortized as additional interest over the term of the agreement, together with the remaining unamortized prior costs of $617,000. At December 31, 2013 and 2012, $21,000,000 and $23,000,000, respectively, were outstanding and included in long-term debt. As of December 31, 2013 and 2012, $319,000,000 and $274,500,000, respectively, were available in excess of all borrowings outstanding under or supported by the respective facilities. Borrowings under the current agreement bear interest at a base rate or an adjusted Eurodollar rate plus an applicable margin, depending upon the type of loan the Company executes. The applicable margin component of the interest rate varies with the type of loan and the Company’s total debt to capital ratio. The agreement contains certain restrictive financial covenants, including a leverage ratio of no greater than .65 to 1.0, minimum timber market value greater than 175 percent of outstanding total senior indebtedness, and limitations on the incurrence of debt. Fees associated with the current revolving credit facility include a commitment fee of .20 to ..35 percent per annum on the unused portion of the committed amount.
The Company may also borrow up to $1,000,000 under a short-term credit facility with BancorpSouth. The agreement expires December 31, 2014, with annual renewal. The amount available to the Company under this facility is reduced by any borrowings by the Company. As of December 31, 2013 and 2012, Deltic had no borrowings outstanding under this line of credit, resulting in $1,000,000 available to the Company. Borrowings bear interest based upon the New York Prime rate. Deltic also has an agreement with BancorpSouth to provide letters of credit. New letters of credit are requested by the Company and are approved and issued by BancorpSouth on a case-by-case basis. Outstanding letters of credit as of December 31, 2013 and 2012 were $554,000 and $719,000, respectively.
59
DELTIC TIMBER CORPORATION
AND SUBSIDIARIES
Notes to Consolidated Financial Statements
December 31, 2013
Note 10 – Indebtedness
The Company’s indebtedness at December 31 consisted of the following:
| | | | | | | | |
| (Thousands of dollars) | | 2013 | | | 2012 | |
Notes payable, 1.54%*, due 2018 (See Note 9 – Credit Facilities) | | $ | 21,000 | | | | 23,000 | |
Senior notes payable, 6.10%, due 2016 | | | 40,000 | | | | 40,000 | |
Union County, Arkansas Taxable Industrial Revenue Bonds, .31%, due 2027 | | | 29,000 | | | | — | |
| | | | | | | | |
Long-term debt | | $ | 90,000 | | | | 63,000 | |
| | | | | | | | |
| | * | Weighted average interest rate at December 31, 2013. |
The Company has private placement debt outstanding of $40,000,000 of Series A Senior Notes (“Notes”) with Pacific Coast Farm Credit, a division of American AgCredit, due and payable December 18, 2016. The interest rate for the Notes has been 6.10 percent since December 18, 2008, and will remain at that rate for the remainder of the term of the Notes. No installment payments are required, but the terms allow for prepayments at the option of the Company. The agreement contains certain restrictive financial covenants, including a minimum consolidated net worth of the sum of $175,567,000, plus 50 percent of net income accrued during each quarter thereafter commencing after December 31, 2006, plus 100 percent of the net proceeds from any public or private offering of common or preferred stock of the Company, a maximum funded debt to capitalization ratio of .6 to 1, a fixed charge coverage ratio of not less than 2.5 to 1, and a requirement to maintain a timber market value greater than 200 percent of outstanding total senior indebtedness. Some covenant requirements of the Senior Notes are the same as for the revolving credit facility, some are more restrictive, and some apply only to the Senior Notes.
With consolidation of Del-Tin Fiber into the Company’s financial statements on April 1, 2013, Deltic’s long-term debt includes $29,000,000 in Union County, Arkansas Taxable Industrial Revenue Bonds (Del-Tin Fiber project) 1998 Series due October 1, 2027, (the “Bonds”). The Bonds were issued by Union County, Arkansas in the amount of $60,000,000, in December 1998 to finance completion of the construction of the MDF plant as well as the acquisition, construction, and improvement of certain sewage and solid waste disposal facilities related to the MDF plant. On September 1, 2004, $31,000,000 of the Bonds were retired. Neither the State of Arkansas, nor Union County, Arkansas has any liability under the Bonds. Del-Tin Fiber and Union County contemporaneously entered into a lease agreement (the “Lease Agreement”) that obligated Del-Tin Fiber to make lease payments in an amount necessary to fund the debt service on the Bonds. The Bonds were payable solely from the proceeds of the letters of credit issued to support the respective Bonds and from Company payments under the Loan Agreement and the Lease Agreement with Union County, Arkansas. The Company has unconditionally guaranteed the payment of all amounts owing under the Bonds to the bondholders. The Company’s indebtedness has been presented in these financial statements as though the Company was directly liable for the Bonds. If the Bonds are not remarketed as allowed under the agreement, the letter of credit and the commitment of the lenders are available to support repayment. Prior to the April 1, 2013 acquisition of Del-Tin Fiber, Deltic was a guarantor of one-half of the letter of credit supporting the bonds. These Bonds bear interest at a variable rate determined weekly by the remarketing agent of the Bonds. Interest is due on the first business day of the month, and all unpaid interest and all principal is due on October 1, 2027. The average interest rate on the Bonds was .38 percent in 2013, .70 percent in 2012, and .87 percent in 2011.
60
DELTIC TIMBER CORPORATION
AND SUBSIDIARIES
Notes to Consolidated Financial Statements
December 31, 2013
Note 10 – Indebtedness (cont.)
As of December 31, 2013, the scheduled maturities of long-term debt for the next five years are none in 2014 and 2015, $40,000,000 in 2016, none in 2017, and $21,000,000 in 2018. (For additional information regarding financial instruments, see Note 9 – Credit Facilities and Note 13 – Fair Value of Financial Instruments.)
The table below sets forth the most restrictive ratio requirements of the covenants for the credit facility and Senior Notes Payable and the status with respect to these covenants as of December 31, 2013 and 2012.
| | | | | | | | | | | | |
| | | Covenants | | | Actual Ratios at | | | Actual Ratios at | |
| | | Requirements | | | Dec. 31, 2013 | | | Dec. 31, 2012 | |
Leverage ratio should be less than:1 | | | .60 to 1 | | | | .254 to 1 | | | | .253 to 1 | |
| | | |
Total outstanding debt as a percentage of total debt allowed based on the minimum timber market value covenant:2 | | | — | 2 | | | 48.24 | % | | | 44.15 | % |
| | | |
Fixed charge coverage ratio should be greater than:3 | | | 2.50 to 1 | | | | 10.04 to 1 | | | | 5.39 to 1 | |
| 1 | The leverage ratio is calculated as total debt divided by total capital. Total debt includes indebtedness for borrowed money, secured liabilities, obligations in respect of letters of credit, and guarantees. Total capital is the sum of total debt and net worth. Net worth is calculated as total assets minus total liabilities, as reflected on the balance sheet. This covenant is applied at the end of each quarter. The revolving credit facility requirement is for the leverage ratio to be less than .65 to 1. |
| 2 | Timber market value must be greater than 200 percent of total debt (as defined in (1) above.) The timber market value is calculated by multiplying the average price received for sales of timber for the preceding four quarters by the current quarter’s ending inventory of timber. This covenant is applied at the end of the quarter on a rolling four-quarter basis. The revolving credit facility requirement is for the timber market value to be greater than 175 percent of total debt (as defined in (1) above.) |
| 3 | The fixed charge coverage ratio is calculated as EBITDA (earnings before interest, taxes, depreciation, depletion, and amortization) increased by non-cash compensation expense and other non-cash expenses and decreased by dividends paid and income tax paid, divided by the sum of interest expense and scheduled principal payments made on debt during the period. This covenant is applied at the end of the quarter on a rolling four-quarter basis. This covenant only applies to the Senior Notes Payable. |
Based on management’s current operating projections, the Company believes it will remain in compliance with the debt covenants and have sufficient liquidity to finance operations and pay all obligations. However, depending on market conditions and the return of economic uncertainties, in future periods the Company could request amendments, or waivers for covenants, or obtain refinancing in future periods. There can be no assurance that the Company will be able to obtain amendments or waivers or negotiate agreeable refinancing terms should it become necessary.
61
DELTIC TIMBER CORPORATION
AND SUBSIDIARIES
Notes to Consolidated Financial Statements
December 31, 2013
Note 11 – Income Taxes
The components of income tax expense/(benefit) related to income from operations for the years ended December 31, 2013, 2012, and 2011 are as follows:
| | | | | | | | | | | | |
| (Thousands of dollars) | | 2013 | | | 2012 | | | 2011 | |
Federal | | | | | | | | | | | | |
Current | | $ | 10,237 | | | | 4,743 | | | | 930 | |
Deferred | | | 138 | | | | (685 | ) | | | 1 | |
| | | | | | | | | | | | |
| | | 10,375 | | | | 4,058 | | | | 931 | |
| | | | | | | | | | | | |
State | | | | | | | | | | | | |
Current | | | 2,154 | | | | 707 | | | | (909 | ) |
Deferred | | | 103 | | | | 36 | | | | 1,108 | |
| | | | | | | | | | | | |
| | | 2,257 | | | | 743 | | | | 199 | |
| | | | | | | | | | | | |
Total income tax expense | | $ | 12,632 | | | | 4,801 | | | | 1,130 | |
| | | | | | | | | | | | |
The following table provides a reconciliation of the Company’s income tax expense at the statutory U.S. federal rate of 35 percent to the actual income tax expense for the years ended December 31, 2013, 2012, and 2011.
| | | | | | | | | | | | |
| (Thousands of dollars) | | 2013 | | | 2012 | | | 2011 | |
U.S. Federal income tax using statutory tax rate | | $ | 13,588 | | | | 4,913 | | | | 1,326 | |
State tax, net of federal tax benefit | | | 1,458 | | | | 446 | | | | 160 | |
Permanent differences | | | (1,219 | ) | | | (558 | ) | | | (306 | ) |
Tax effects resulting from: | | | | | | | | | | | | |
Gain on bargain purchase | | | (1,195 | ) | | | — | | | | — | |
Other | | | — | | | | — | | | | (50 | ) |
| | | | | | | | | | | | |
Income tax provision as reported | | $ | 12,632 | | | | 4,801 | | | | 1,130 | |
| | | | | | | | | | | | |
The Company’s deferred tax assets and deferred tax liabilities at December 31, 2013 and 2012, consisted of the following:
| | | | | | | | |
| (Thousands of dollars) | | 2013 | | | 2012 | |
Deferred tax assets | | | | | | | | |
Investment in real estate held for development and sale | | $ | 16,914 | | | | 16,560 | |
Postretirement and other employee benefits | | | 13,435 | | | | 19,652 | |
Other deferred tax assets | | | 2,360 | | | | 2,942 | |
| | | | | | | | |
Total deferred tax assets | | | 32,709 | | | | 39,154 | |
| | | | | | | | |
| | |
Deferred tax liabilities | | | | | | | | |
Investment in Del-Tin Fiber | | | — | | | | (5,246 | ) |
Timber and timberlands | | | (26,158 | ) | | | (25,520 | ) |
Property, plant, and equipment | | | (11,838 | ) | | | (3,797 | ) |
Other deferred tax liabilities | | | (326 | ) | | | (151 | ) |
| | | | | | | | |
Total deferred tax liabilities | | | (38,322 | ) | | | (34,714 | ) |
| | | | | | | | |
| | |
Net deferred tax assets/(liabilities) | | $ | (5,613 | ) | | | 4,440 | |
| | | | | | | | |
62
DELTIC TIMBER CORPORATION
AND SUBSIDIARIES
Notes to Consolidated Financial Statements
December 31, 2013
Note 11 – Income Taxes (cont.)
The deferred tax assets and liabilities are classified in the accompanying consolidated balance sheets as follows:
| | | | | | | | |
| (Thousands of dollars) | | 2013 | | | 2012 | |
Current tax assets | | $ | 1,901 | | | | 2,074 | |
Long-term tax assets | | | — | | | | 2,837 | |
Long-term tax liabilities | | | (7,514 | ) | | | (471 | ) |
| | | | | | | | |
Net deferred tax assets/(liabilities) | | $ | (5,613 | ) | | | 4,440 | |
| | | | | | | | |
In assessing the realizability of deferred tax assets, Deltic’s management considers whether it is more-likely-than-not that some portion or all of the Company’s total deferred tax assets will not be realized. The ultimate realization of these deferred tax assets is dependent upon the generation of future taxable income during the periods in which those temporary differences become deductible. Management considers the scheduled reversal of deferred tax liabilities, projected future taxable income, and tax planning strategies in making this assessment. Based on the level of historical taxable income and projections for future taxable income over the periods in which the temporary differences are anticipated to reverse, management believes it is more-likely-than-not that the Company will realize the benefits of its deferred tax assets at December 31, 2013, as reductions of future taxable income or by utilizing available tax planning strategies. However, the amount of the net deferred tax assets considered realizable could be adjusted in the future if estimates of taxable income are revised.
Unrecognized tax benefits represent potential future obligations to taxing authorities if uncertain tax positions the Company has taken, primarily on previously filed state income tax returns, are not sustained. Liabilities established for unrecognized tax benefits may not be combined with deferred tax assets or liabilities.
A reconciliation of the beginning and ending amount of unrecognized tax benefits (excluding both interest and any related federal benefits) is as follows:
| | | | | | | | |
| (Thousands of dollars) | | 2013 | | | 2012 | |
Balance at January 1 | | $ | 1,331 | | | | 1,774 | |
Lapse of statute | | | (146 | ) | | | (443 | ) |
| | | | | | | | |
Balance at December 31 | | $ | 1,185 | | | $ | 1,331 | |
| | | | | | | | |
If the Company were to prevail on all unrecognized tax benefits recorded on the balance sheet, approximately $776,000, as of December 31, 2013, would benefit the effective tax rate. The Company’s policy is to recognize interest expense related to unrecognized tax benefits in interest expense and penalties in other expenses. During 2013, the Company recognized $121,000 in interest expense for these items. The Company had approximately $621,000 and $451,000 accrued in deferred revenue and other accrued liabilities for interest and penalties at December 31, 2013 and 2012, respectively. The Company anticipates the entire balance of unrecognized tax benefits and accrued liabilities for interest and penalties could potentially be reversed within the next twelve months. The Company is no longer subject to federal and state income tax examination by tax authorities for years before 2010.
63
DELTIC TIMBER CORPORATION
AND SUBSIDIARIES
Notes to Consolidated Financial Statements
December 31, 2013
Note 12 – Stockholders Rights Plan
The Company has a Stockholders Rights Plan (“Rights Plan”), which provides for each eligible common shareholder to receive a dividend of one preferred stock purchase right (“Right”) for each outstanding share of the Company’s common stock held. On October 19, 2006, the Company’s Board of Directors amended the Rights Plan to, among other items, extend its term to December 31, 2016, and to increase the exercise price of the rights to $200 per share. The Rights will detach from the common stock and become exercisable: (1) following a specified period of time after the date of the first public announcement that a person or group of affiliated or associated persons (“Acquiring Person”), has become the beneficial owner of 15 percent or more of the Company’s common stock or (2) following a specified amount of time of the commencement of a tender or exchange offer by any Acquiring Person, which would, if consummated, result in such persons becoming the beneficial owner of 15 percent or more of the Company’s common stock. In either case, the detachment of the Rights from the common stock is subject to extension by a majority of the directors of the Company. The Rights have certain anti-takeover effects and will cause substantial dilution to any Acquiring Person that attempts to acquire the Company without conditioning the offer on a substantial number of Rights being acquired. Other terms of the Rights are set forth in, and the foregoing description is qualified in its entirety by, the Rights Agreement between the Company and Harris N.A. (formerly known as Harris Trust and Savings Bank), as Rights Agent.
Note 13 – Fair Value of Financial Instruments
Fair value measurement accounting establishes a fair value hierarchy based on the quality of inputs used to measure fair value, with Level 1 being the highest quality and Level 3 being the lowest quality. Level 1 inputs are quoted prices in active markets on identical assets or liabilities. Level 2 inputs are observable inputs other than quoted prices included in Level 1. Level 3 inputs are unobservable inputs which reflect assumptions about pricing by market participants.
Information pertaining to the fair value of the pension plan assets is found in Note 16 – Employee and Retiree Benefit Plans.
The following is a description of the valuation methodologies used for liabilities measured at fair value.
Nonqualified Employee Savings Plan — Consists of mutual funds, which are valued at the net asset value of shares held by the plan at year-end, at quoted market prices.
64
DELTIC TIMBER CORPORATION
AND SUBSIDIARIES
Notes to Consolidated Financial Statements
December 31, 2013
Note 13 – Fair Value of Financial Instruments (cont.)
The fair value measurements for the Company’s financial liabilities accounted for at fair value on a recurring basis at December 31, 2013 are presented in the following table:
| | | | | | | | | | | | | | | | |
| | | | | | Fair Value Measurements at Reporting Date Using | |
| | | December 31, | | | Quoted Prices in
Active Markets for
Identical
Liabilities Inputs | | | Significant
Observable
Inputs | | | Significant
Unobservable
Inputs | |
| (Thousands of dollars) | | 2013 | | | Level 1 | | | Level 2 | | | Level 3 | |
Liabilities | | | | | | | | | | | | | | | | |
Nonqualified employee savings plan | | $ | 1,353 | | | | 1,353 | | | | — | | | | — | |
Long-term Debt, Including Current Maturities — The fair value is estimated by discounting the scheduled debt payment streams to present value based on market rates for which the Company’s debt could be refinanced.
The following table presents the carrying amounts and estimated fair values of financial instruments held by the Company at December 31, 2013 and 2012. The fair value of a financial instrument is the amount at which the instrument could be exchanged in a current transaction between willing parties. The table excludes financial instruments included in current assets and liabilities, except current maturities of long-term debt, all of which have fair values approximating carrying values.
| | | | | | | | | | | | | | | | |
| | | 2013 | | | 2012 | |
| (Thousands of dollars) | | Carrying
Amount | | | Estimated
Fair Value | | | Carrying
Amount | | | Estimated
Fair Value | |
Financial liabilities | | | | | | | | | | | | | | | | |
Long-term debt, including current liabilities | | $ | 90,000 | | | | 94,534 | | | | 63,000 | | | | 68,029 | |
Note 14 – Concentration of Credit Risks
Financial instruments, which potentially subject the Company to credit risk, are trade accounts receivable. These receivables normally arise from the sale of wood products, MDF, and real estate. Concentration of credit with respect to these trade accounts receivable is limited due to the large number of customers comprising the Company’s customer base. No single recurring customer accounted for a significant amount of the Company’s sales of wood products or real estate in 2013, 2012, or 2011. At December 31, 2013 and 2012, there was no significant accounts receivable from a single customer. The Company performs ongoing credit evaluations of its customers and generally does not require collateral to support accounts receivable.
65
DELTIC TIMBER CORPORATION
AND SUBSIDIARIES
Notes to Consolidated Financial Statements
December 31, 2013
Note 15 – Other Comprehensive Income Disclosures
The following tables detail the changes in accumulated other comprehensive loss (“AOCL”) by component for the twelve months ended December 31, 2013 and 2012:
Changes in Accumulated Other Comprehensive Loss by Component (Net of Tax)
| | | | | | | | | | | | | | | | |
| (Thousands of dollars) | | Defined
Benefit
Funded
Retirement
Plan | | | Defined
Benefit
Unfunded
Retirement
Plan | | | Post
Retirement
Benefit
Plan | | | Total | |
AOCL at January 1, 2013 | | $ | (9,553 | ) | | | (3,380 | ) | | | (1,170 | ) | | | (14,103 | ) |
Amounts reclassified from AOCL | | | 529 | | | | 38 | | | | (116 | ) | | | 451 | |
Net gain arising during period | | | 6,614 | | | | 2,860 | | | | 1,499 | | | | 10,973 | |
| | | | | | | | | | | | | | | | |
Net current period other comprehensive income | | | 7,143 | | | | 2,898 | | | | 1,383 | | | | 11,424 | |
| | | | | | | | | | | | | | | | |
AOCL at December 31, 2013 | | $ | (2,410 | ) | | | (482 | ) | | | 213 | | | | (2,679 | ) |
| | | | | | | | | | | | | | | | |
| | | | |
| (Thousands of dollars) | | Defined
Benefit
Funded
Retirement
Plan | | | Defined
Benefit
Unfunded
Retirement
Plan | | | Post
Retirement
Benefit
Plan | | | Total | |
AOCL at January 1, 2012 | | $ | (8,124 | ) | | | (855 | ) | | | (750 | ) | | | (9,729 | ) |
Amounts reclassified from AOCL | | | 608 | | | | 226 | | | | (77 | ) | | | 757 | |
Net loss arising during period | | | (2,037 | ) | | | (2,751 | ) | | | (343 | ) | | | (5,131 | ) |
| | | | | | | | | | | | | | | | |
Net current period other comprehensive loss | | | (1,429 | ) | | | (2,525 | ) | | | (420 | ) | | | (4,374 | ) |
| | | | | | | | | | | | | | | | |
AOCL at December 31, 2012 | | $ | (9,553 | ) | | | (3,380 | ) | | | (1,170 | ) | | | (14,103 | ) |
| | | | | | | | | | | | | | | | |
| | | | |
| (Thousands of dollars) | | Defined
Benefit
Funded
Retirement
Plan | | | Defined
Benefit
Unfunded
Retirement
Plan | | | Post
Retirement
Benefit
Plan | | | Total | |
AOCL at January 1, 2011 | | $ | (2,638 | ) | | | (304 | ) | | | 216 | | | | (2,726 | ) |
Amounts reclassified from AOCL | | | 94 | | | | 4 | | | | (121 | ) | | | (23 | ) |
Net loss arising during period | | | (5,580 | ) | | | (555 | ) | | | (845 | ) | | | (6,980 | ) |
| | | | | | | | | | | | | | | | |
Net current period other comprehensive loss | | | (5,486 | ) | | | (551 | ) | | | (966 | ) | | | (7,003 | ) |
| | | | | | | | | | | | | | | | |
AOCL at December 31, 2011 | | $ | (8,124 | ) | | | (855 | ) | | | (750 | ) | | | (9,729 | ) |
| | | | | | | | | | | | | | | | |
66
DELTIC TIMBER CORPORATION
AND SUBSIDIARIES
Notes to Consolidated Financial Statements
December 31, 2013
Note 15 – Other Comprehensive Income Disclosures (cont.)
Reclassification Out of Accumulated Other Comprehensive Loss
Details about AOCL Components
| | | | | | | | | | | | | | | | |
| | | For the Year Ended December 31, 2013 | |
| (Thousands of dollars) | | Defined
Benefit
Funded
Retirement
Plan | | | Defined
Benefit
Unfunded
Retirement
Plan | | | Post
Retirement
Benefit
Plan | | | Total | |
Amortization of prior service costs | | $ | 18 | | | | (11 | ) | | | — | | | | 7 | |
Amortization of actuarial losses | | | 852 | | | | 74 | | | | 8 | | | | 934 | |
Amortization of plan amendment | | | — | | | | — | | | | (199 | ) | | | (199 | ) |
| | | | | | | | | | | | | | | | |
Total before tax | | | 870 | | | | 63 | | | | (191 | ) | | | 742 | |
Income tax benefit/(expense) | | | (341 | ) | | | (25 | ) | | | 75 | | | | (291 | ) |
| | | | | | | | | | | | | | | | |
Total reclassifications – net of tax | | $ | 529 | | | | 38 | | | | (116 | ) | | | 451 | |
| | | | | | | | | | | | | | | | |
Amounts in parentheses indicate expenses. These items are included in the computation of net periodic retirement and postretirement costs. See Note 16 – Employee and Retiree Benefit Plans.
| | | | | | | | | | | | | | | | |
| | | For the Year Ended December 31, 2012 | |
| (Thousands of dollars) | | Defined
Benefit
Funded
Retirement
Plan | | | Defined
Benefit
Unfunded
Retirement
Plan | | | Post
Retirement
Benefit
Plan | | | Total | |
Amortization of prior service costs | | $ | 18 | | | | (11 | ) | | | — | | | | 7 | |
Amortization of actuarial losses | | | 982 | | | | 383 | | | | 73 | | | | 1,438 | |
Amortization of plan amendment | | | — | | | | — | | | | (199 | ) | | | (199 | ) |
| | | | | | | | | | | | | | | | |
Total before tax | | | 1,000 | | | | 372 | | | | (126 | ) | | | 1,246 | |
Income tax benefit/(expense) | | | (392 | ) | | | (146 | ) | | | 49 | | | | (489 | ) |
| | | | | | | | | | | | | | | | |
Total reclassifications – net of tax | | $ | 608 | | | | 226 | | | | (77 | ) | | | 757 | |
| | | | | | | | | | | | | | | | |
Amounts in parentheses indicate expenses. These items are included in the computation of net periodic retirement and postretirement costs. See Note 16 – Employee and Retiree Benefit Plans.
67
DELTIC TIMBER CORPORATION
AND SUBSIDIARIES
Notes to Consolidated Financial Statements
December 31, 2013
Note 15 – Other Comprehensive Income Disclosures (cont.)
Reclassification Out of Accumulated Other Comprehensive Loss (cont.)
| | | | | | | | | | | | | | | | |
| | | For the Year Ended December 31, 2011 | |
| (Thousands of dollars) | | Defined
Benefit
Funded
Retirement
Plan | | | Defined
Benefit
Unfunded
Retirement
Plan | | | Post
Retirement
Benefit
Plan | | | Total | |
Amortization of prior service costs | | $ | 18 | | | | (11 | ) | | | — | | | | 7 | |
Amortization of actuarial losses | | | 137 | | | | 18 | | | | — | | | | 155 | |
Amortization of plan amendment | | | — | | | | — | | | | (199 | ) | | | (199 | ) |
| | | | | | | | | | | | | | | | |
Total before tax | | | 155 | | | | 7 | | | | (199 | ) | | | (37 | ) |
Income tax benefit/(expense) | | | (61 | ) | | | (3 | ) | | | 78 | | | | 14 | |
| | | | | | | | | | | | | | | | |
Total reclassifications – net of tax | | $ | 94 | | | | 4 | | | | (121 | ) | | | (23 | ) |
| | | | | | | | | | | | | | | | |
Amounts in parentheses indicate expenses. These items are included in the computation of net periodic retirement and postretirement costs. See Note 16 – Employee and Retiree Benefit Plans.
Tax Effects by Component
| | | | | | | | | | | | |
| | | For the Year Ended December 31, 2013 | |
| (Thousands of dollars) | | Before
Tax
Amount | | | Tax
(Expense)
or Benefit | | | Net of
Tax
Amount | |
Gains/(losses) arising during the period | | $ | 18,054 | | | | (7,081 | ) | | | 10,973 | |
Amortization of prior service costs | | | 7 | | | | (3 | ) | | | 4 | |
Amortization of actuarial losses/(gains) | | | 934 | | | | (366 | ) | | | 568 | |
Amortization of plan amendment | | | (199 | ) | | | 78 | | | | (121 | ) |
| | | | | | | | | | | | |
| | $ | 18,796 | | | | (7,372 | ) | | | 11,424 | |
| | | | | | | | | | | | |
| | | | | | | | | | | | |
| | | For the Year Ended December 31, 2012 | |
| (Thousands of dollars) | | Before
Tax
Amount | | | Tax
(Expense)
or Benefit | | | Net of
Tax
Amount | |
Gains/(losses) arising during the period | | $ | (8,442 | ) | | | 3,311 | | | | (5,131 | ) |
Amortization of prior service costs | | | 7 | | | | (3 | ) | | | 4 | |
Amortization of actuarial losses/(gains) | | | 1,438 | | | | (564 | ) | | | 874 | |
Amortization of plan amendment | | | (199 | ) | | | 78 | | | | (121 | ) |
| | | | | | | | | | | | |
| | $ | (7,196 | ) | | | 2,822 | | | | (4,374 | ) |
| | | | | | | | | | | | |
68
DELTIC TIMBER CORPORATION
AND SUBSIDIARIES
Notes to Consolidated Financial Statements
December 31, 2013
Note 15 – Other Comprehensive Income Disclosures (cont.)
Tax Effects by Component (cont.)
| | | | | | | | | | | | |
| | | For the Year Ended December 31, 2011 | |
| (Thousands of dollars) | | Before
Tax
Amount | | | Tax
(Expense)
or Benefit | | | Net of
Tax
Amount | |
Gains/(losses) arising during the period | | $ | (11,485 | ) | | | 4,505 | | | | (6,980 | ) |
Amortization of prior service costs | | $ | 7 | | | | (3 | ) | | | 4 | |
Amortization of actuarial losses/(gains) | | | 155 | | | | (61 | ) | | | 94 | |
Amortization of plan amendment | | | (199 | ) | | | 78 | | | | (121 | ) |
| | | | | | | | | | | | |
| | $ | (11,522 | ) | | | 4,519 | | | | (7,003 | ) |
| | | | | | | | | | | | |
Note 16 – Employee and Retiree Benefit Plans
The Company has a funded, qualified defined benefit retirement plan (“Retirement Plan”) that covers each employee of Deltic Timber Corporation, excluding employees of the subsidiaries, who completes 1,000 hours of service for a twelve-month period, once employment has commenced, and continues to meet both the 1,000 hours requirement and the employment requirement for each twelve-month period. An unfunded, nonqualified supplemental executive retirement plan is maintained for certain current and former employees. All contributions to both plans are made by the Company. The plans provide defined benefits based on years of benefit service and average monthly compensation as defined by the Company’s Retirement Plan. The Company determines the vested benefit obligation on the actuarial present value based on the employee’s expected date of retirement. The Company also sponsors a plan for retired employees, excluding employees of the subsidiaries, that provides comprehensive healthcare benefits (supplementing Medicare benefits for those eligible) and life insurance benefits. Costs are accrued for this plan during the service lives of covered employees. Retirees contribute a portion of the self-funded cost of healthcare benefits and the Company contributes the remainder. The Company pays premiums for life insurance coverage arranged through an insurance company. The health care plan is funded on a pay-as-you-go basis. The Company retains the right to modify or terminate the benefits and/or cost-sharing provisions.
69
DELTIC TIMBER CORPORATION
AND SUBSIDIARIES
Notes to Consolidated Financial Statements
December 31, 2013
Note 16 – Employee and Retiree Benefit Plans (cont.)
The following table sets forth the plans’ benefit obligations, fair value of plan assets, and funded status at December 31, 2013 and 2012.
| | | | | | | | | | | | | | | | | | | | | | | | |
| | | Funded | | | Unfunded | | | | |
| | | Qualified | | | Nonqualified | | | Other | |
| | | Retirement | | | Retirement | | | Postretirement | |
| | | Plan | | | Plan | | | Plans | |
| (Thousands of dollars) | | 2013 | | | 2012 | | | 2013 | | | 2012 | | | 2013 | | | 2012 | |
Change in benefit obligation | | | | | | | | | | | | | | | | | | | | |
Benefit obligation at beginning of period | | $ | 42,716 | | | | 36,736 | | | | 9,299 | | | | 4,294 | | | | 12,542 | | | | 11,297 | |
Service cost | | | 1,549 | | | | 1,630 | | | | 143 | | | | 364 | | | | 450 | | | | 455 | |
Interest cost | | | 1,557 | | | | 1,622 | | | | 192 | | | | 354 | | | | 431 | | | | 467 | |
Participant contributions | | | — | | | | — | | | | — | | | | — | | | | 88 | | | | 93 | |
Actuarial (gain)/loss | | | (7,672 | ) | | | 3,853 | | | | (4,705 | ) | | | 4,526 | | | | (2,466 | ) | | | 566 | |
Benefits paid | | | (1,140 | ) | | | (1,125 | ) | | | (239 | ) | | | (239 | ) | | | (289 | ) | | | (336 | ) |
| | | | | | | | | | | | | | | | | | | | | | | | |
Benefit obligation at end of period | | $ | 37,010 | | | | 42,716 | | | | 4,690 | | | | 9,299 | | | | 10,756 | | | | 12,542 | |
| | | | | | | | | | | | | | | | | | | | | | | | |
| | | | | |
Change in plan assets | | | | | | | | | | | | | | | | | | | | |
Fair value of plan assets at beginning of period | | $ | 25,463 | | | | 22,293 | | | | — | | | | — | | | | — | | | | — | |
Actual return on plan assets | | | 5,237 | | | | 2,322 | | | | — | | | | — | | | | — | | | | — | |
Employer contributions | | | 1,200 | | | | 2,100 | | | | 239 | | | | 239 | | | | 201 | | | | 243 | |
Participant contributions | | | — | | | | — | | | | — | | | | — | | | | 88 | | | | 93 | |
Benefits paid | | | (1,140 | ) | | | (1,125 | ) | | | (239 | ) | | | (239 | ) | | | (289 | ) | | | (336 | ) |
Expenses | | | (133 | ) | | | (127 | ) | | | — | | | | — | | | | — | | | | — | |
| | | | | | | | | | | | | | | | | | | | | | | | |
Fair value of plan assets at end of period | | $ | 30,627 | | | | 25,463 | | | | — | | | | — | | | | — | | | | — | |
| | | | | | | | | | | | | | | | | | | | | | | | |
| | | | | | |
Funded status of plans | | $ | (6,383 | ) | | | (17,253 | ) | | | (4,690 | ) | | | (9,299 | ) | | | (10,756 | ) | | | (12,542 | ) |
| | | | | | | | | | | | | | | | | | | | | | | | |
| | | | | |
Amounts recognized in the balance sheet | | | | | | | | | | | | | | | | | | | | |
Current liability | | $ | — | | | | — | | | | (233 | ) | | | (236 | ) | | | (365 | ) | | | (410 | ) |
Noncurrent liability | | $ | (6,383 | ) | | | (17,253 | ) | | | (4,457 | ) | | | (9,063 | ) | | | (10,391 | ) | | | (12,132 | ) |
Deferred income taxes – net | | $ | 2,504 | | | | 6,587 | | | | 1,840 | | | | 3,313 | | | | 4,219 | | | | 4,702 | |
Accumulated other comprehensive (income)/loss | | $ | 2,410 | | | | 9,553 | | | | 482 | | | | 3,380 | | | | (213 | ) | | | 1,170 | |
| | | | | |
Amounts recognized in accumulated other comprehensive loss | | | | | | | | | | | | | | | | | | | | |
Net unrecognized (gain)/loss | | $ | 3,942 | | | | 15,677 | | | | 799 | | | | 5,579 | | | | (124 | ) | | | 2,350 | |
Unrecognized prior service cost/(credit) | | | 21 | | | | 40 | | | | (7 | ) | | | (18 | ) | | | (245 | ) | | | (444 | ) |
Tax effects | | | (1,553 | ) | | | (6,164 | ) | | | (310 | ) | | | (2,181 | ) | | | 156 | | | | (736 | ) |
| | | | | | | | | | | | | | | | | | | | | | | | |
| | $ | 2,410 | | | | 9,553 | | | | 482 | | | | 3,380 | | | | (213 | ) | | | 1,170 | |
| | | | | | | | | | | | | | | | | | | | | | | | |
70
DELTIC TIMBER CORPORATION
AND SUBSIDIARIES
Notes to Consolidated Financial Statements
December 31, 2013
Note 16 – Employee and Retiree Benefit Plans (cont.)
| | | | | | | | | | | | | | | | | | | | | | | | |
| | | Funded
Qualified
Retirement
Plan | | | Unfunded
Nonqualified
Retirement
Plan | | | Other
Postretirement
Plans | |
| (Thousands of dollars) | | 2013 | | | 2012 | | | 2013 | | | 2012 | | | 2013 | | | 2012 | |
Assumptions used in measurement of benefit obligations | | | | | | | | | | | | | | | | | | | | | | | | |
Weighted average discount rate | | | 4.84 | % | | | 3.94 | % | | | 4.84 | % | | | 3.94 | % | | | 4.85 | % | | | 3.90 | % |
Rate of compensation increase | | | 4.00 | % | | | 4.00 | % | | | 4.00 | % | | | 4.00 | % | | | N/A | | | | N/A | |
Accumulated benefit obligations at year end | | $ | 32,272 | | | | 35,885 | | | | 4,660 | | | | 6,160 | | | | N/A | | | | N/A | |
| | | | | | | | | | | | | | | | | | | | | | | | |
Components of net periodic retirement expense and other postretirement benefits expense consisted of the following:
| | | | | | | | | | | | |
| (Thousands of dollars) | | 2013 | | | 2012 | | | 2011 | |
Funded qualified retirement plan | | | | | | | | | | | | |
Service cost | | $ | 1,549 | | | | 1,630 | | | | 1,026 | |
Interest cost | | | 1,557 | | | | 1,622 | | | | 1,471 | |
Expected return on plan assets | | | (1,894 | ) | | | (1,692 | ) | | | (1,657 | ) |
Amortization of prior service cost | | | 18 | | | | 18 | | | | 18 | |
Amortization of actuarial loss | | | 852 | | | | 982 | | | | 137 | |
| | | | | | | | | | | | |
Net periodic benefit cost | | $ | 2,082 | | | | 2,560 | | | | 995 | |
| | | | | | | | | | | | |
| | | |
Unfunded nonqualified retirement plan | | | | | | | | | | | | |
Service cost | | $ | 143 | | | | 364 | | | | 67 | |
Interest cost | | | 193 | | | | 355 | | | | 177 | |
Amortization of prior service credit | | | (11 | ) | | | (11 | ) | | | (11 | ) |
Amortization of actuarial loss | | | 74 | | | | 383 | | | | 18 | |
| | | | | | | | | | | | |
Net periodic benefit cost | | $ | 399 | | | | 1,091 | | | | 251 | |
| | | | | | | | | | | | |
| | | |
Other postretirement benefits | | | | | | | | | | | | |
Service cost | | $ | 450 | | | | 455 | | | | 350 | |
Interest cost | | | 431 | | | | 467 | | | | 451 | |
Amortization of prior service credit | | | (199 | ) | | | (199 | ) | | | (199 | ) |
Amortization of actuarial loss | | | 8 | | | | 73 | | | | — | |
| | | | | | | | | | | | |
Net periodic benefit cost | | $ | 690 | | | | 796 | | | | 602 | |
| | | | | | | | | | | | |
71
DELTIC TIMBER CORPORATION
AND SUBSIDIARIES
Notes to Consolidated Financial Statements
December 31, 2013
Note 16 – Employee and Retiree Benefit Plans (cont.)
| | | | | | | | | | | | |
| (Thousands of dollars) | | 2013 | | | 2012 | | | 2011 | |
Assumptions used to determine net periodic benefit cost – pension plans | | | | | | | | |
Weighted average discount rate | | | 3.94 | % | | | 4.34 | % | | | 5.45 | % |
Expected long-term rate of return on plan assets | | | 7.50 | % | | | 7.50 | % | | | 7.50 | % |
Rate of compensation increase | | | 4.00 | % | | | 4.00 | % | | | 4.00 | % |
Assumptions used to determine net periodic benefit cost – other postretirement plan | | | | | | | | |
Weighted average discount rate | | | 3.90 | % | | | 4.30 | % | | | 5.35 | % |
Other changes in plan assets and benefit obligations recognized in other comprehensive (income)/loss | | | | | | | | |
Net unrecognized loss/(gain) | | $ | (18,054 | ) | | | 8,442 | | | | 11,485 | |
Amortization of prior service credit | | | (7 | ) | | | (7 | ) | | | (7 | ) |
Amortization of actuarial losses | | | (934 | ) | | | (1,438 | ) | | | (155 | ) |
Amortization of plan amendment | | | 199 | | | | 199 | | | | 199 | |
Tax effect of changes | | | 7,372 | | | | (2,822 | ) | | | (4,519 | ) |
| | | | | | | | | | | | |
Total recognized in other comprehensive (income)/loss | | $ | (11,424 | ) | | | 4,374 | | | | 7,003 | |
| | | | | | | | | | | | |
| | | | | | | | | | | | |
| (Thousands of dollars) | | Funded
Qualified
Retirement
Plan | | | Unfunded
Non-
qualified
Retirement
Plan | | | Other
Post-
retirement
Plan | |
Estimated benefit payments by year | | | | | | | | | | | | |
2014 | | $ | 1,277 | | | | 233 | | | | 365 | |
2015 | | | 1,339 | | | | 265 | | | | 366 | |
2016 | | | 1,398 | | | | 260 | | | | 379 | |
2017 | | | 1,494 | | | | 255 | | | | 422 | |
2018 | | | 1,609 | | | | 250 | | | | 466 | |
2019 - 2023 | | | 10,604 | | | | 1,562 | | | | 3,042 | |
The estimated net loss and net prior service cost for the defined benefit and supplemental retirement pension plans that will be amortized from accumulated other comprehensive income into net periodic benefit cost over the next fiscal year are $54,000 and $10,000, respectively. The plan amendment for the other defined benefit postretirement plans that will be amortized from accumulated other comprehensive income into net periodic benefit cost over the next fiscal year is $199,000.
The amount of projected expense of the qualified retirement plan is expected to be $1,207,000 for 2014. The Company expects to make contributions during 2014 of approximately $1,500,000 to the qualified retirement plan, $233,000 to fund benefits paid from its nonqualified retirement plan, and approximately $365,000 to fund postretirement benefit plans.
72
DELTIC TIMBER CORPORATION
AND SUBSIDIARIES
Notes to Consolidated Financial Statements
December 31, 2013
Note 16 – Employee and Retiree Benefit Plans (cont.)
The discount rate assumption used by the Company to measure benefit obligations and net periodic expenses is based on the estimated interest rate at which the benefit obligations of its plans can be settled. For 2013 and 2012, the Company used a discount rate durational study of Other Postretirement Employee Benefit (“OPEB”) liabilities to determine an appropriate discount rate.
To develop the expected long-term rate of return on asset assumption, the Company considered the rates of return of assets the Company’s pension plan invested in and compared them to the historical rates of return on investments in similar assets. Further, these returns were compared to plans of other companies which had similar investment philosophies. After a review of the rate of inflation and its impact, management made the selection of the 7.50 percent assumption.
In determining the benefit obligation for health care at December 31, 2013, health care inflation cost was assumed to increase at an annual rate of five percent in 2013. Assumed health care cost trend rates have a significant effect on the amounts reported for the health care plan. A one percentage-point increase in the assumed health care cost trend rate would increase the aggregate service and interest cost components of periodic benefit cost for 2013 by $169,000 and the benefit obligation by $1,704,000, while a one percentage-point decrease in the assumed rate would decrease the 2013 cost components by $133,000 and the benefit obligation by $1,362,000.
Funded Plan — The assets of the defined benefit plan, the “Plan”, are contained in a trust, sponsored by Deltic, and administered by a trustee appointed by the Company’s Pension Investment and Employees Benefits Committee.
The investment policy of the Plan is to achieve growth with the preservation of principal. To achieve the goal of growth of plan assets (excluding contributions and withdrawals) at a rate that exceeds inflation, a balanced portfolio consisting of equities, fixed income, alternative investments, and cash equivalents is maintained. The components of the portfolio should be securities that have readily available prices and can be sold easily without significantly impacting the price of the securities, with an exception for professionally managed hedge funds. The minimum and maximum asset allocation levels, in total are equities, 45 to 70 percent, fixed income, 25 to 55 percent, alternative investments, zero to 15 percent, and up to 5 percent in cash equivalents. Further, the total equity minimum and maximum allocation levels at market, for large cap equity is 40 to 60 percent, mid and small cap equity is 5 to 15 percent, and international equity is zero to 25 percent, with international emerging not to exceed 40 percent of international equities allocation.
Not more than 2.5 percent of the market value of Plan assets may be held in the securities of any single issuer with the exception of the U.S. government or its agencies. As of December 31, 2013, less than two percent of the total market value of the Plan assets was invested in collateralized mortgage obligations and asset-backed security issues.
73
DELTIC TIMBER CORPORATION
AND SUBSIDIARIES
Notes to Consolidated Financial Statements
December 31, 2013
Note 16 – Employee and Retiree Benefit Plans (cont.)
The following types of securities are permitted in the Plan.
| | | | |
| Equities | | – | | Common stocks, preferred stocks, convertible preferred stocks, convertible bonds, American depository receipts, proprietary funds, mutual funds, and exchange-traded funds. |
| | | | |
| | |
| Fixed income | | – | | U.S. government securities, corporate debt obligations, U.S. government agency securities, and mortgage-backed security issues, international bonds, and asset-backed securities. |
| | | | |
| | |
| Cash equivalents | | – | | U.S. government securities. |
| | | | |
| | |
| Alternative investments, hedge funds | | – | | Qualified fund of funds limited partnership shares or fund of funds in a mutual fund wrapper. |
Fair Value Measurement — Following is a description of the valuation methodologies used for retirement plan assets measured at fair value.
Common stock, preferred securities, and exchange-traded funds:Valued at the closing price reported on the active market on which the individual securities are traded.
Mutual funds:Valued at the net asset value (“NAV”) of shares held by the Plan at year-end, at quoted market prices.
Alternative investment funds: Valued by company or industry source.
U.S. treasuries and government agency securities: Valued using quoted prices for similar assets in active markets.
Corporate debt obligations and U.S. government and agency securities:Valued using pricing models that utilize trade, bid, and other market information; or benchmark curves, benchmarking of like securities, sector groupings, and matrix pricing.
Money market funds:Valued at par, which approximates fair value.
The methods described above may produce a fair value calculation that may not be indicative of net realizable value or reflective of future fair values. Furthermore, while the Plan believes its valuation methods are appropriate and consistent with other market participants, the use of different methodologies or assumptions to determine the fair value of certain financial instruments could result in a different fair value measurement at the reporting date.
Fair value measurement accounting establishes a fair value hierarchy based on the quality of inputs used to measure fair value, with Level 1 being the highest quality and Level 3 being the lowest quality. Level 1 inputs are quoted prices in active markets on identical assets or liabilities. Level 2 inputs are observable inputs other than quoted prices included in Level 1. Level 3 inputs are unobservable inputs which reflect assumptions about pricing by market participants.
74
DELTIC TIMBER CORPORATION
AND SUBSIDIARIES
Notes to Consolidated Financial Statements
December 31, 2013
Note 16 – Employee and Retiree Benefit Plans (cont.)
The following table sets forth by level within the fair value hierarchy, the Plan’s investments at fair value as of December 31, 2013.
| | | | | | | | | | | | | | | | | | | | |
| | | Fair Value Measurements at Reporting Date Using | |
| (Thousands of dollars) | | Percent
of
Total | | | Total
Carrying
Value at
Dec. 31,
2013 | | | Level 1 | | | Level 2 | | | Level 3 | |
Plan Investments | | | | | | | | | | | | | | | | | | | | |
Cash and cash equivalents | | | 3.2 | | | $ | 984 | | | | 984 | | | | — | | | | — | |
Other | | | .2 | | | | 54 | | | | 54 | | | | — | | | | — | |
Equity securities by sector: | | | | | | | | | | | | | | | | | | | | |
Energy | | | .4 | | | | 111 | | | | 111 | | | | — | | | | — | |
Materials and industrials | | | 2.6 | | | | 784 | | | | 784 | | | | — | | | | — | |
Consumer | | | 4.7 | | | | 1,435 | | | | 1,435 | | | | — | | | | — | |
Health care | | | 2.5 | | | | 771 | | | | 771 | | | | — | | | | — | |
Financials | | | .8 | | | | 259 | | | | 259 | | | | — | | | | — | |
Information tech | | | 4.6 | | | | 1.409 | | | | 1,409 | | | | — | | | | — | |
Foreign stocks | | | 1.0 | | | | 302 | | | | 302 | | | | — | | | | — | |
U.S. Govt. and agency securities | | | 12.3 | | | | 3,775 | | | | 1,633 | | | | 2,142 | | | | — | |
Corporate debt obligations | | | 10.7 | | | | 3,287 | | | | — | | | | 3,287 | | | | — | |
Mutual funds: | | | | | | | | | | | | | | | | | | | | |
Dividends and growth | | | 29.5 | | | | 9,042 | | | | 9,042 | | | | — | | | | — | |
International and emerging markets | | | 5.9 | | | | 1,798 | | | | 1,798 | | | | — | | | | — | |
Exchange-traded funds | | | 14.8 | | | | 4,539 | | | | 4,539 | | | | — | | | | — | |
Alternative investment funds | | | 6.8 | | | | 2,077 | | | | — | | | | — | | | | 2,077 | |
| | | | | | | | | | | | | | | | | | | | |
Total plan investments at fair value | | | 100.0 | | | $ | 30,627 | | | | 23,121 | | | | 5,429 | | | | 2,077 | |
| | | | | | | | | | | | | | | | | | | | |
Percent of fair value hierarchy | | | | | | | 100 | | | | 75.5 | | | | 17.7 | | | | 6.8 | |
| | | | | | | | | | | | | | | | | | | | |
The following table sets forth the activity in the Level 3 investments for the year ended December 31, 2013.
| | | | |
| | | Fair Value Measurements
Using Significant
Unobservable Inputs
(Level 3) | |
| (Thousands of dollars) | | Alternative Investments
Funds | |
Beginning balance at December 31, 2012 | | $ | — | |
Actual return on plan assets: | | | | |
Relating to assets still held at the reporting date | | | 77 | |
Purchases, sales, and settlements | | | 2,000 | |
| | | | |
Ending balance at December 31, 2013 | | $ | 2,077 | |
| | | | |
75
DELTIC TIMBER CORPORATION
AND SUBSIDIARIES
Notes to Consolidated Financial Statements
December 31, 2013
Note 16 – Employee and Retiree Benefit Plans (cont.)
The following table sets forth by level within the fair value hierarchy, the Plan’s investments at fair value as of December 31, 2012.
| | | | | | | | | | | | | | | | | | | | |
| | | Fair Value Measurements at Reporting Date Using | |
| (Thousands of dollars) | | Percent
of
Total | | | Total
Carrying
Value at
Dec. 31,
2012 | | | Level 1 | | | Level 2 | | | Level 3 | |
Plan Investments | | | | | | | | | | | | | | | | | | | | |
Cash and cash equivalents | | | 6.3 | | | $ | 1,602 | | | | 1,602 | | | | — | | | | — | |
Other | | | .2 | | | | 55 | | | | 55 | | | | — | | | | — | |
Equity securities by sector: | | | | | | | | | | | | | | | | | | | | |
Energy | | | 1.2 | | | | 293 | | | | 293 | | | | — | | | | — | |
Materials and industrials | | | 4.1 | | | | 1,054 | | | | 1,054 | | | | — | | | | — | |
Consumer | | | 7.7 | | | | 1,964 | | | | 1,964 | | | | — | | | | — | |
Health care | | | 3.5 | | | | 886 | | | | 886 | | | | — | | | | — | |
Financials | | | .7 | | | | 183 | | | | 183 | | | | — | | | | — | |
Information tech | | | 9.2 | | | | 2,339 | | | | 2,339 | | | | — | | | | — | |
Foreign stocks | | | 1.6 | | | | 415 | | | | 415 | | | | — | | | | — | |
U.S. Govt. and agency securities | | | 18.0 | | | | 4,568 | | | | 2,369 | | | | 2,199 | | | | — | |
Corporate debt obligations | | | 13.1 | | | | 3,332 | | | | — | | | | 3,332 | | | | — | |
Mutual funds: | | | | | | | | | | | | | | | | | | | | |
Dividends and growth | | | 26.0 | | | | 6,610 | | | | 6,610 | | | | — | | | | — | |
International and emerging markets | | | 3.7 | | | | 954 | | | | 954 | | | | — | | | | — | |
Exchange-traded funds | | | 4.7 | | | | 1,208 | | | | 1,208 | | | | — | | | | — | |
| | | | | | | | | | | | | | | | | | | | |
Total plan investments at fair value | | | 100.0 | | | $ | 25,463 | | | | 19,932 | | | | 5,531 | | | | — | |
| | | | | | | | | | | | | | | | | | | | |
Percent of fair value hierarchy | | | | | | | 100 | | | | 78.3 | | | | 21.7 | | | | — | |
| | | | | | | | | | | | | | | | | | | | |
Thrift Plan — Employees of the Company may participate in its thrift plan by allotting up to a specific percentage of their base pay. The Company matches contributions at a stated percentage of each employee’s allotment. Company contributions to this plan were $792,000 in 2013, $584,000 in 2012, and $598,000 in 2011.
Note 17 – Incentive Plans
Stock Incentive Plan
On April 26, 2012, the Company’s shareholders approved an amendment to extend the Deltic Timber Corporation 2002 Stock Incentive Plan (“the 2002 Plan”) for ten years to April 26, 2022 and change the maximum number of shares which may be awarded in any calendar year as restricted stock and restricted stock units or other stock-based awards to 75,000 shares. The 2002 Plan replaced the 1996 Stock Incentive Plan (“the 1996 Plan”), which was terminated. The 2002 Plan permits annual awards of shares of the Company’s common stock to executives, other key employees, and nonemployee directors. Under the plan, the Executive Compensation Committee (“the Committee”) is authorized to grant: (1) stock options; (2) restricted stock and restricted stock units; (3) performance units; and (4)
76
DELTIC TIMBER CORPORATION
AND SUBSIDIARIES
Notes to Consolidated Financial Statements
December 31, 2013
Note 17 – Incentive Plans (cont.)
other stock-based awards, including stock appreciation rights and rights to dividends and dividend equivalents. The number of shares originally registered for issuance under the 2002 Plan was 1,800,000 shares. Additional shares may be issued if an adjustment is determined necessary by the committee as the result of dividend or other distribution, recapitalization, stock split, reverse stock split, reorganization, merger, consolidation, split-up, spin-off, combination, repurchase or exchange of common stock, or other corporate transaction in order to prevent dilution or enlargement of benefits or potential benefits intended to be made available. At December 31, 2013, 900,181 of these 1,800,000 shares were available for award under the 2002 Plan. No participant in the 2002 Plan may receive options and stock appreciation rights in any calendar year that relates to more than 50,000 shares, and the maximum number of shares, which may be awarded as restricted stock and restricted stock units or other stock-based awards are 75,000 shares. The Company has a policy of issuing treasury stock to satisfy all share-based incentive plans.
Under the fair value recognition provisions for share-based payments, share-based compensation cost is estimated at the grant date based on the fair value of the award and is recognized as expense over the requisite service period of the award. The fair value of stock options granted is determined using a binomial model. The fair value of restricted stock awards is determined by reference to the fair market value of the Company’s common stock on the date of grant. Restricted stock performance units are valued using a Monte Carlo simulation model. Compensation cost is recognized on a straight-line basis over the requisite service period. The benefits of tax deductions in excess of recognized compensation cost is to be reported as a financing cash flow.
Deltic issues restricted stock performance units whose vesting is contingent upon meeting certain financial performance goals based upon the Company’s total stockholder return compared to the total return of a Paper and Forest Products Index selected by the Committee and calculated by Standard and Poor’s. Determining the appropriate amount to expense is based on likelihood of achievement of the stated goals and requires judgment, including forecasting future financial results.
The expected option term is based on the term of the option and historical exercise and expiration experience. The Company uses historical volatility over a ten-year trading life to determine weighted expected volatility assumptions. The expected dividend yield is based on the Company’s average dividend yield from 2009 to 2012. Risk-free interest rates are based on historical rates and forward-looking factors. The pre-vesting forfeiture rate is based on historical rates and forward-looking factors.
Assumptions for the 2013, 2012, and 2011 valuation of stock options and restricted stock performance units consisted of the following:
| | | | | | | | | | | | |
| | | 2013 | | | 2012 | | | 2011 | |
Expected term of options (in years) | | | 6.27 | | | | 6.27 | | | | 6.27 | |
Weighted expected volatility | | | 37.78 | % | | | 38.78 | % | | | 36.70 | % |
Dividend yield | | | .58 | % | | | .61 | % | | | .62 | % |
Risk-free interest rate - performance restricted shares | | | .60 | % | | | .60 | % | | | 2.09 | % |
Risk-free interest rate - stock options | | | 1.98 | % | | | 2.00 | % | | | 3.79 | % |
Stock price as of valuation date | | $ | 71.35 | | | | 67.67 | | | | 63.54 | |
Restricted performance share valuation | | $ | 87.74 | | | | 90.61 | | | | 85.56 | |
Grant date fair value - stock options | | $ | 26.20 | | | | 24.92 | | | | 20.89 | |
77
DELTIC TIMBER CORPORATION
AND SUBSIDIARIES
Notes to Consolidated Financial Statements
December 31, 2013
Note 17 – Incentive Plans (cont.)
The consolidated statements of income for the years ended December 31, 2013, 2012, and 2011 included $2,797,000, $2,298,000, and $2,067,000, respectively, of stock-based compensation expense reflected in general and administrative expenses. The potential income tax benefit derived from all share-based payment arrangements with employees was $409,000, $607,000, and $759,000 for the years ended December 31, 2013, 2012, and 2011, respectively.
Stock Options — For each option granted under the 2002 Plan, the Committee fixes the option price at not less than fair market value on the date of the grant and the option term, not to exceed ten years from date of grant. Options granted after 1998 have been issued with terms of ten years and are nonqualified. For all options granted since 2003, one-fourth vest after each one-year period over the subsequent four years from issuance. The resulting fixed stock-based compensation cost was recognized over the vesting period for these options. All outstanding options have an option price not less than the market value on the grant date, with a range in option prices of $32.57 to $71.35 per share.
A summary of stock options as of December 31, 2013, and changes during the year ended are presented below:
| | | | | | | | | | | | | | | | |
| | | Shares | | | Weighted
Average
Exercise
Price | | | Weighted
Average
Remaining
Contractual
Term (Years) | | | Aggregate
Intrinsic
Value
$(000) | |
Outstanding at January 1, 2013 | | | 125,920 | | | $ | 54.92 | | | | | | | | | |
Granted | | | 24,058 | | | | 71.35 | | | | | | | | | |
Exercised | | | (17,979 | ) | | | 42.26 | | | | | | | | | |
Forfeited/expired | | | (543 | ) | | | 60.10 | | | | | | | | | |
| | | | | | | | | | | | | | | | |
Outstanding at December 31, 2013 | | | 131,456 | | | $ | 59.64 | | | | 6.4 | | | $ | 1,174 | |
| | | | | | | | | | | | | | | | |
Exercisable at December 31, 2013 | | | 67,626 | | | $ | 53.90 | | | | 4.8 | | | $ | 949 | |
| | | | | | | | | | | | | | | | |
The intrinsic value of options exercised during the years ended December 31, 2013, 2012, and 2011 was $513,000, $682,000, and $1,626,000, respectively. At December 31, 2013, there was $993,000 of unrecognized compensation cost related to nonvested stock options. The weighted average period remaining to vest is 1.5 years.
78
DELTIC TIMBER CORPORATION
AND SUBSIDIARIES
Notes to Consolidated Financial Statements
December 31, 2013
Note 17 – Incentive Plans (cont.)
Additional information about stock options outstanding at December 31, 2013, consisted of the following:
| | | | | | | | | | | | | | | | | | | | |
| | | Options Outstanding | | | Options Exercisable | |
Range of Exercise Prices | | Number
of
Options | | | Average
Life in
Years | | | Average
Exercise
Price | | | Number
of
Options | | | Average
Exercise
Price | |
| $31.00—$35.00 | | | 4,751 | | | | 4.7 | | | $ | 34.25 | | | | 4,751 | | | $ | 34.25 | |
| $41.00—$45.00 | | | 17,274 | | | | 6.0 | | | $ | 44.83 | | | | 10,309 | | | $ | 44.82 | |
| $51.00—$55.00 | | | 32,863 | | | | 2.8 | | | $ | 53.00 | | | | 32,863 | | | $ | 53.00 | |
| $56.00—$65.00 | | | 26,371 | | | | 7.1 | | | $ | 63.54 | | | | 13,194 | | | $ | 63.54 | |
| $66.00—$75.00 | | | 50,197 | | | | 8.6 | | | $ | 69.43 | | | | 6,509 | | | $ | 67.67 | |
| | | | | | | | | | | | | | | | | | | | |
| | | 131,456 | | | | | | | | | | | | 67,626 | | | | | |
| | | | | | | | | | | | | | | | | | | | |
Restricted Stock and Restricted Stock Units — The Committee may grant restricted stock and restricted stock units to selected employees, with conditions to vesting for each grant established by the Committee. During the vesting period, the grantee may vote and receive dividends on the shares, but shares are subject to transfer restrictions and are all, or partially, forfeited if a grantee terminates, depending on the reason. Restricted stock and restricted stock units granted since 2003 have vested after four years, and the stock-based compensation is recognized on a straight-line basis over the requisite service period for the entire award.
A summary of nonvested restricted stock as of December 31, 2013, and changes during the year then-ended are presented below:
| | | | | | | | |
| | | Shares | | | Weighted
Average
Grant-Date
Fair Value | |
Nonvested at January 1, 2013 | | | 76,352 | | | $ | 52.09 | |
| | |
Granted | | | 23,735 | | | | 71.35 | |
Vested | | | (20,229 | ) | | | 34.41 | |
Forfeited | | | (267 | ) | | | 58.22 | |
| | | | | | | | |
| | |
Nonvested at December 31, 2013 | | | 79,591 | | | $ | 62.31 | |
| | | | | | | | |
As of December 31, 2013, there was $2,292,000 of unrecognized compensation cost related to nonvested restricted stock. That cost is expected to be recognized over a weighted-average period of 1.7 years.
79
DELTIC TIMBER CORPORATION
AND SUBSIDIARIES
Notes to Consolidated Financial Statements
December 31, 2013
Note 17 – Incentive Plans (cont.)
Performance Units — Performance units granted under the 2002 Plan may be denominated in cash, common shares, other securities, other awards allowed under the 2002 Plan, or other property and shall confer on the holder thereof rights valued as determined by the Committee and payable to, or exercisable by, the holder, in whole or in part, upon achievement of such performance goals during such performance periods as the Committee shall establish. Subject to the terms of the 2002 Plan, the performance goals to be achieved during any performance period, the length of any performance period, the amount of any performance unit granted, and any payment or transfer to be made pursuant to any performance unit shall be determined by the Committee. During 2013, 2012, and 2011, the Company issued performance units in the form of restricted stock with specified performance requirements. During the vesting period, the grantee may vote and receive dividends on the shares, but shares are subject to transfer restrictions and are all, or partially, forfeited if a grantee terminates, depending on the reason. Performance units granted since 2003 have vested after four years, and the stock-based compensation is recognized on a straight-line basis over the requisite service period for the entire award.
A summary of nonvested restricted stock performance units as of December 31, 2013, and changes during the year then-ended are presented below:
| | | | | | | | |
| | | Shares | | | Weighted
Average
Grant-Date
Fair Value | |
Nonvested at January 1, 2013 | | | 50,393 | | | $ | 68.30 | |
| | |
Granted | | | 16,427 | | | | 87.74 | |
Vested | | | (13,892 | ) | | | 43.48 | |
Forfeited | | | (303 | ) | | | 77.57 | |
| | | | | | | | |
| | |
Nonvested at December 31, 2013 | | | 52,625 | | | $ | 80.87 | |
| | | | | | | | |
As of December 31, 2013, there was $1,963,000 of unrecognized compensation cost related to nonvested restricted stock performance units. That cost is expected to be recognized over a weighted-average period of 1.7 years.
Other Stock-based Awards — The Committee may also grant other awards, including but not limited to, stock appreciation rights and rights to dividends and dividend equivalents that are denominated, or payable in, valued in whole or in part by reference to, or otherwise based on or related to shares of the Company’s common stock, including securities convertible in its common stock, as deemed by the Committee to be consistent with the purpose of the 2002 Plan. No such other stock-based awards have been granted.
80
DELTIC TIMBER CORPORATION
AND SUBSIDIARIES
Notes to Consolidated Financial Statements
December 31, 2013
Note 17 – Incentive Plans (cont.)
Cash Incentive Compensation Plan
The Company has an incentive compensation plan that provides for annual cash awards to officers and key employees based on actual results for a year compared to objectives established at the beginning of that year by the Executive Compensation Committee, which administers the Plan. The Company recorded expenses for cash incentive awards of $2,549,000, $2,014,000, and $71,000, in 2013, 2012, and 2011, respectively. The Company had accrued provisions for cash incentive awards totaling $2,631,000 and $1,973,000 at December 31, 2013 and 2012, respectively, reflected in the consolidated balance sheets in deferred revenues and other accrued liabilities.
Note 18 – Supplemental Cash Flows Disclosures
Additional information concerning cash flows at December 31 consisted of the following:
| | | | | | | | | | | | |
| (Thousands of dollars) | | 2013 | | | 2012 | | | 2011 | |
Income taxes paid in cash | | $ | 11,042 | | | | 4,227 | | | | 762 | |
Interest paid | | | 3,547 | | | | 3,571 | | | | 3,607 | |
Interest capitalized | | | (53 | ) | | | (36 | ) | | | (82 | ) |
Non-cash investing and financing activities excluded from the statement of cash flows include:
| | | | | | | | | | | | |
| (Thousands of dollars) | | 2013 | | | 2012 | | | 2011 | |
Issuance of restricted stock | | $ | 935 | | | | 1,393 | | | | 1,456 | |
Land exchanges | | | — | | | | — | | | | 87 | |
(Increases)/decreases in operating working capital other than cash and cash equivalents, for each of the three years ended December 31 consisted of the following:
| | | | | | | | | | | | |
| (Thousands of dollars) | | 2013 | | | 2012 | | | 2011 | |
Trade accounts receivable | | $ | 2,178 | | | | (457 | ) | | | (216 | ) |
Other receivables | | | (6 | ) | | | (12 | ) | | | 97 | |
Inventories | | | (2,740 | ) | | | (541 | ) | | | 1,708 | |
Prepaid expenses and other current assets | | | (184 | ) | | | 963 | | | | (235 | ) |
Trade accounts payable | | | 3,701 | | | | 35 | | | | (585 | ) |
Accrued taxes other than income taxes | | | 216 | | | | (19 | ) | | | (15 | ) |
Deferred revenues and other accrued liabilities | | | 2,718 | | | | 2,486 | | | | (1,674 | ) |
| | | | | | | | | | | | |
| | $ | 5,883 | | | | 2,455 | | | | (920 | ) |
| | | | | | | | | | | | |
Cash flows provided by other operating activities included a decrease in deferred long-term mineral lease rental revenue of $1,635,000 in 2013, $1,767,000 in 2012, and $538,000 in 2011. Total cash payments received were $30,000 in 2013, $450,000 in 2012, and $1,932,000 in 2011. These payments will be recognized over the term of the lease.
81
DELTIC TIMBER CORPORATION
AND SUBSIDIARIES
Notes to Consolidated Financial Statements
December 31, 2013
Note 19 – Earnings per Share
The amounts used in computing earnings per share and the effect on income and weighted average number of shares outstanding of dilutive potential common stock consisted of the following:
| | | | | | | | | | | | |
| (Thousands of dollars, except per share amounts) | | 2013 | | | 2012 | | | 2011 | |
Net earnings allocated to common stock | | $ | 25,924 | | | | 9,144 | | | | 2,644 | |
Net earnings allocated to participating securities | | | 268 | | | | 91 | | | | 15 | |
| | | | | | | | | | | | |
Net income allocated to common stock and participating securities | | $ | 26,192 | | | | 9,235 | | | | 2,659 | |
| | | | | | | | | | | | |
| | | |
Weighted average number of common shares used in basic EPS | | | 12,566 | | | | 12,525 | | | | 12,450 | |
Effect of dilutive stock awards | | | 58 | | | | 63 | | | | 102 | |
| | | | | | | | | | | | |
Weighted average number of common shares and dilutive potential common stock used in EPS assuming dilution | | | 12,624 | | | | 12,588 | | | | 12,552 | |
| | | | | | | | | | | | |
| | | |
Earnings per common share | | | | | | | | | | | | |
Basic | | $ | 2.06 | | | | .73 | | | | .21 | |
Assuming dilution | | $ | 2.05 | | | | .73 | | | | .21 | |
Diluted earnings per common share is computed using the weighted-average number of shares determined for the basic earnings per common share computation plus the dilutive effect of common stock equivalents using the treasury stock method.
The following table provides information about potentially dilutive securities that were outstanding but were not included in the computation of diluted earnings per share because they were anti-dilutive or, in the case of the restricted performance shares, did not meet the metrics established for awarding:
| | | | | | | | | | | | |
| | | 2013 | | | 2012 | | | 2011 | |
Options | | | 50,197 | | | | 26,459 | | | | 26,993 | |
Restricted performance shares | | | 52,625 | | | | 29,831 | | | | 14,013 | |
82
DELTIC TIMBER CORPORATION
AND SUBSIDIARIES
Notes to Consolidated Financial Statements
December 31, 2013
Note 20 – Commitments and Contingencies
Commitments — Commitments for capital expenditures at December 31, 2013, were approximately $3,978,000 for property, plant, and equipment; and $94,000 for investment in real estate held for development and sale and amenities.
The Company is also involved in litigation incidental to its business from time to time. Currently, there are no other material legal proceedings outstanding.
Note 21 – Gain on Involuntary Conversion
In December of 2012, four lumber storage sheds at the Company’s Ola Mill were destroyed due to an accumulation of snow and ice on their roofs. Insurance policies covered the replacement cost of these sheds, subject to deductibles. The Company received a total of $881,000 in payments from the insurance company for the year ended December 31, 2013. These payments were reported in operating income as a gain on involuntary conversion in the Consolidated Statements of Income and were used to fund capital expenditures to replace the storage sheds.
Note 22 – Business Segments
The Company’s four reporting segments consist of Deltic’s three operating business units and its corporate function. Each reporting entity has a separate management team and infrastructure that offers different products and/or services.
Woodlands operations manage the Company’s Southern Pine timberlands located primarily in Arkansas and northern Louisiana and derive revenue from the harvest of timber from the timberlands in accordance with its harvest plans, and either sells timber to third parties in the domestic market or to the Company’s sawmills for conversion into lumber. In addition, this segment may, from time to time, identify and sell a portion of its timberland holdings that are either non-strategic to future timberland management activities or that have appreciated, due primarily to location, to a level that exceeds its value as a timber-growing asset. This segment also generates revenue from oil and gas royalties and the leasing of hunting, oil and gas, and other rights on its timberlands.
The Manufacturing segment consists of Deltic’s two sawmills which convert timber into lumber and Del-Tin Fiber, a plant which converts sawmill residuals and an adhesive bond into MDF. The sawmills purchase timber from third parties or the Company’s Woodlands segment. The MDF plant purchases sawmill residuals from third parties and from the Company’s sawmills. The mills produce a variety of products, including dimension lumber, boards, and timbers, while the MDF plant produces several different grades of MDF. These products are sold primarily to wholesale distributors, large retailers, lumber treaters, industrial accounts, and truss manufacturers in the South and Midwest and are used in residential construction, roof trusses, remanufactured products, laminated beams, cabinets, flooring, and door parts.
83
DELTIC TIMBER CORPORATION
AND SUBSIDIARIES
Notes to Consolidated Financial Statements
December 31, 2013
Note 22 – Business Segments (cont.)
The Real Estate operations, which include three real estate developments, add value to former legacy timberland by developing it into upscale, planned residential and commercial developments. These developments, which are generally centered on a core amenity, are being developed in stages. Historically, real estate sales have consisted primarily of residential lots sold to builders or individuals, commercial site sales, and sales of undeveloped acreage. In addition, this segment currently leases retail and office space to third parties in a retail center constructed by the Company, and held for sale, in one of its developments. This segment also manages: (1) a real estate brokerage subsidiary which generates commission revenue by reselling existing homes and (2) a country club operation, Chenal Country Club, Inc., around which the Company’s Chenal Valley development is centered. This club operation derives its revenues from membership services, food and beverage sales, and membership dues.
Corporate operations consist primarily of senior management, accounting, information systems, human resources, purchasing, treasury, income tax, and legal staff functions that provide support services to the operating business units. The Company currently does not allocate the cost of maintaining these support functions to its operating units.
The accounting policies of the reportable segments are the same as those described in Note 1 – Significant Accounting Policies. The Company evaluates the performance of its segments based on operating income before results of: any equity method investee; interest income and expense; other non-operating income or expense; and income taxes. Intersegment revenues consist primarily of timber sales from the Woodlands segment to the sawmills operations (part of the Manufacturing segment) and are transferred at rates that approximate market for the respective operating area.
84
DELTIC TIMBER CORPORATION
AND SUBSIDIARIES
Notes to Consolidated Financial Statements
December 31, 2013
Note 22 – Business Segments (cont.)
Information about the Company’s business segments consisted of the following:
| | | | | | | | | | | | |
| (Thousands of dollars) | | 2013 | | | 2012 | | | 2011 | |
Net sales | | | | | | | | | | | | |
Woodlands | | $ | 33,834 | | | | 37,285 | | | | 40,240 | |
Manufacturing2 | | | 167,955 | | | | 105,956 | | | | 83,889 | |
Real Estate | | | 11,734 | | | | 10,992 | | | | 12,358 | |
Eliminations1 | | | (13,821 | ) | | | (13,325 | ) | | | (14,640 | ) |
| | | | | | | | | | | | |
| | $ | 199,702 | | | | 140,908 | | | | 121,847 | |
| | | | | | | | | | | | |
Income before income taxes | | | | | | | | | | | | |
Operating income/(loss) | | | | | | | | | | | | |
Woodlands | | $ | 16,749 | | | | 18,374 | | | | 20,416 | |
Manufacturing2 | | | 38,496 | | | | 18,083 | | | | 1,011 | |
Real Estate | | | (1,430 | ) | | | (2,099 | ) | | | (75 | ) |
Corporate | | | (17,994 | ) | | | (17,394 | ) | | | (14,293 | ) |
Eliminations | | | (158 | ) | | | 168 | | | | 400 | |
| | | | | | | | | | | | |
Operating income | | | 35,663 | | | | 17,132 | | | | 7,459 | |
Equity in earnings of Del-Tin Fiber2 | | | 1,084 | | | | 959 | | | | 318 | |
Interest income | | | 13 | | | | 17 | | | | 38 | |
Interest and other debt expense, net of capitalized interest | | | (4,578 | ) | | | (4,092 | ) | | | (4,029 | ) |
Gain on bargain purchase | | | 3,413 | | | | — | | | | — | |
Other income | | | 3,229 | | | | 20 | | | | 3 | |
| | | | | | | | | | | | |
| | $ | 38,824 | | | | 14,036 | | | | 3,789 | |
| | | | | | | | | | | | |
Total assets at year-end | | | | | | | | | | | | |
Woodlands | | $ | 247,156 | | | | 240,026 | | | | 227,102 | |
Manufacturing2 | | | 85,837 | | | | 30,136 | | | | 33,801 | |
Real Estate | | | 59,549 | | | | 58,783 | | | | 59,304 | |
Corporate3,4 | | | 18,802 | | | | 24,264 | | | | 21,663 | |
| | | | | | | | | | | | |
| | $ | 411,344 | | | | 353,209 | | | | 341,870 | |
| | | | | | | | | | | | |
Depreciation, amortization, and cost of fee timber harvested | | | | | | | | | | | | |
Woodlands | | $ | 4,785 | | | | 4,786 | | | | 5,291 | |
Manufacturing2 | | | 9,910 | | | | 5,378 | | | | 5,999 | |
Real Estate | | | 343 | | | | 374 | | | | 427 | |
Corporate | | | 93 | | | | 104 | | | | 89 | |
| | | | | | | | | | | | |
| | $ | 15,131 | | | | 10,642 | | | | 11,806 | |
| | | | | | | | | | | | |
Capital expenditures | | | | | | | | | | | | |
Woodlands | | $ | 12,755 | | | | 18,553 | | | | 7,817 | |
Manufacturing2 | | | 16,532 | | | | 2,478 | | | | 3,570 | |
Real Estate | | | 4,267 | | | | 2,996 | | | | 4,223 | |
Corporate | | | 14 | | | | 7 | | | | 87 | |
| | | | | | | | | | | | |
| | $ | 33,568 | | | | 24,034 | | | | 15,697 | |
| | | | | | | | | | | | |
85
DELTIC TIMBER CORPORATION
AND SUBSIDIARIES
Notes to Consolidated Financial Statements
December 31, 2013
Note 22 – Business Segments (cont.)
| | 1 | Primarily intersegment sales of timber from Woodlands to Manufacturing. |
| | 2 | Del-Tin Fiber became a consolidated subsidiary, reported in the Manufacturing segment, upon acquisition of a controlling interest of its ownership effective April 1, 2013. |
| | 3 | Includes investment in Del-Tin Fiber, an equity method investee, of $6,293,000 and $7,113,000 at December 31, 2012, and 2011, respectively. (For additional information, see Note 4 – Business Combination.) |
| | 4 | Includes balance of timberland sale proceeds held by trustee, and there were none as of December 31, 2013, $7,000 as of December 31, 2012, and $567,000 in 2011. |
Note 23 – Financial Results by Quarter (Unaudited)
(Thousands of dollars, except per share amounts)
| | | | | | | | | | | | | | | | | | | | |
| | | 2013 | |
| | | First | | | Second | | | Third | | | Fourth | | | | |
| | | Quarter | | | Quarter | | | Quarter | | | Quarter | | | Year | |
Net sales | | $ | 41,563 | | | | 53,247 | | | | 56,520 | | | | 48,372 | | | | 199,702 | |
Gross profit | | | 15,384 | | | | 14,648 | | | | 14,810 | | | | 8,977 | | | | 53,819 | |
Operating income | | | 10,548 | | | | 10,991 | | | | 9,599 | | | | 4,525 | | | | 35,663 | |
Net income1 | | | 6,774 | | | | 11,268 | | | | 5,813 | | | | 2,337 | | | | 26,192 | |
Earnings per common share | | | | | | | | | | | | | | | | | | | | |
Basic | | $ | .53 | | | | .89 | | | | .46 | | | | .18 | | | | 2.06 | |
Assuming dilution | | | .53 | | | | .88 | | | | .46 | | | | .18 | | | | 2.05 | |
Dividends paid per common share2 | | $ | .10 | | | | .10 | | | | .10 | | | | .10 | | | | .40 | |
| |
| | | 2012 | |
| | | First | | | Second | | | Third | | | Fourth | | | | |
| | | Quarter | | | Quarter | | | Quarter | | | Quarter | | | Year | |
Net sales | | $ | 30,639 | | | | 37,105 | | | | 36,499 | | | | 36,665 | | | | 140,908 | |
Gross profit | | | 5,730 | | | | 10,205 | | | | 10,237 | | | | 9,388 | | | | 35,560 | |
Operating income | | | 1,134 | | | | 6,259 | | | | 5,104 | | | | 4,635 | | | | 17,132 | |
Net income | | | 97 | | | | 3,516 | | | | 3,218 | | | | 2,404 | | | | 9,235 | |
Earnings per common share | | | | | | | | | | | | | | | | | | | | |
Basic | | $ | .01 | | | | .28 | | | | .25 | | | | .19 | | | | .73 | |
Assuming dilution | | | .01 | | | | .28 | | | | .25 | | | | .19 | | | | .73 | |
Dividends paid per common share2 | | $ | .075 | | | | .075 | | | | .075 | | | | .075 | | | | .30 | |
86
DELTIC TIMBER CORPORATION
AND SUBSIDIARIES
Notes to Consolidated Financial Statements
December 31, 2013
Note 23 – Financial Results by Quarter (Unaudited) (cont.)
(Thousands of dollars, except per share amounts)
| | | | | | | | | | | | | | | | | | | | |
| | | 2011 | |
| | | First | | | Second | | | Third | | | Fourth | | | | |
| | | Quarter | | | Quarter | | | Quarter | | | Quarter | | | Year | |
Net sales | | $ | 29,395 | | | | 32,268 | | | | 31,371 | | | | 28,813 | | | | 121,847 | |
Gross profit | | | 4,896 | | | | 6,856 | | | | 5,847 | | | | 5,117 | | | | 22,716 | |
Operating income | | | 550 | | | | 3,587 | | | | 2,116 | | | | 1,206 | | | | 7,459 | |
Net income/(loss) | | | 92 | | | | 2,055 | | | | 720 | | | | (208 | ) | | | 2,659 | |
Earnings per common share | | | | | | | | | | | | | | | | | | | | |
Basic | | $ | .01 | | | | .16 | | | | .06 | | | | (.02 | ) | | | .21 | |
Assuming dilution | | | .01 | | | | .16 | | | | .06 | | | | (.02 | ) | | | .21 | |
Dividends paid per common share2 | | $ | .075 | | | | .075 | | | | .075 | | | | .075 | | | | .30 | |
| 1 | Del-Tin Fiber, formerly an equity investment, became a consolidated subsidiary effective April 1, 2013. Net income for the second quarter of 2013 includes a gain on bargain purchase of $3,285,000 and a gain on previously held equity investment of $3,165,000. The fourth quarter includes additional bargain gain recognized of $128,000, for a total of $3,413,000 for the year. (For additional information, see Note 4 – Business Combinations.) |
| 2 | Payment of dividends is the means by which Deltic Timber Corporation makes distributions to its shareholders of profits and cash flows generated by the Company’s business operations. These dividends are declared by the Company’s Board of Directors on a quarterly basis. The Company’s dividend strategy is to grow the amount of the dividend over time, at a rate of increase that is believed to be sustainable. The timing and amount of future increases are based on the estimated trend for future earnings and cash flow, taking into account other potential uses of the Company’s capital resources including, but not limited to, acquisition opportunities, capital expenditures for existing operations, debt repayments, and repurchases of the Company’s common stock. |
87
MANAGEMENT’S RESPONSIBILITY FOR FINANCIAL STATEMENTS
The Shareholders
Deltic Timber Corporation:
The management of Deltic Timber Corporation has prepared and is responsible for the Company’s consolidated financial statements. The statements are prepared in conformity with accounting principles generally accepted in the United States of America, appropriate in the circumstances. In preparing the financial statements, management has, when necessary, made judgments and estimates with consideration given to materiality.
The Company’s consolidated financial statements have been audited by KPMG LLP, an independent registered public accounting firm, who have expressed their opinion with respect to the fairness of the consolidated financial statements in conformity with U.S. generally accepted accounting principles. Their audit was conducted in accordance with the standards of the Public Company Accounting Oversight Board (United States). The Audit Committee of the Board of Directors (“the Audit Committee”) appoints the independent auditors; ratification of the appointment is solicited annually from the shareholders.
The Audit Committee is composed of directors who are not officers or employees of the Company and who have been determined by the Company’s Board of Directors to meet applicable independence standards under the Securities Exchange Act of 1934. The Audit Committee meets periodically with KPMG LLP, the Company’s internal auditor, and representatives of management to review the Company’s internal controls, the quality of its financial reporting, the scope and results of audits, and the independence of the external auditors. The Company’s internal auditor and KPMG LLP have unrestricted access to the Audit Committee, without management’s presence, to discuss audit findings and other financial matters.
| | | | | | |
/s/ Ray C. Dillon | | | | /s/ Kenneth D. Mann | | |
| Ray C. Dillon | | | | Kenneth D. Mann | | |
| President and Chief Executive Officer | | | | Vice President and Chief Financial Officer | | |
| March 5, 2014 | | | | March 5, 2014 | | |
88
MANAGEMENT’S REPORT ON INTERNAL CONTROL OVER FINANCIAL REPORTING
The Shareholders
Deltic Timber Corporation:
The management of Deltic Timber Corporation is responsible for establishing and maintaining adequate internal control over financial reporting, and for performing an assessment of the effectiveness of internal control over financial reporting as of December 31, 2013. Internal control over financial reporting is a process designed to provide reasonable assurance regarding the reliability of financial reporting and the preparation of financial statements for external purposes in accordance with generally accepted accounting principles. The Company’s system of internal control over financial reporting includes those policies and procedures that (1) pertain to the maintenance of records that, in reasonable detail, accurately and fairly reflect the transactions and dispositions of the assets of the Company; (2) provide reasonable assurance that transactions are recorded as necessary to permit preparation of financial statements in accordance with generally accepted accounting principles, and the receipts and expenditures of the Company are being made only in accordance with authorizations of management and directors of the Company; and (3) provide reasonable assurance regarding prevention or timely detection of unauthorized acquisition, use, or disposition of the Company’s assets that could have a material effect on the financial statements.
Deltic’s management performed an assessment of the effectiveness of the Company’s internal control over financial reporting as of December 31, 2013, based upon criteria inInternal Control – Integrated Framework (1992) issued by the Committee of Sponsoring Organizations of the Treadway Commission (“COSO”). Based on its assessment, management determined that the Company’s internal control over financial reporting was effective as of December 31, 2013, based on the criteria inInternal Control – Integrated Framework (1992) issued by COSO.
| | | | | | |
/s/ Ray C. Dillon | | | | /s/ Kenneth D. Mann | | |
| Ray C. Dillon | | | | Kenneth D. Mann | | |
| President and Chief Executive Officer | | | | Vice President and Chief Financial Officer | | |
| March 5, 2014 | | | | March 5, 2014 | | |
89
REPORT OF INDEPENDENT REGISTERED PUBLIC ACCOUNTING FIRM
The Board of Directors and Stockholders
Deltic Timber Corporation:
We have audited the accompanying consolidated balance sheets of Deltic Timber Corporation and Subsidiaries (the Company) as of December 31, 2013 and 2012, and the related consolidated statements of income, comprehensive income/(loss), cash flows, and stockholders’ equity for each of the years in the three-year period ended December 31, 2013. These consolidated financial statements are the responsibility of the Company’s management. Our responsibility is to express an opinion on these consolidated financial statements based on our audits.
We conducted our audits in accordance with the standards of the Public Company Accounting Oversight Board (United States). Those standards require that we plan and perform the audit to obtain reasonable assurance about whether the financial statements are free of material misstatement. An audit includes examining, on a test basis, evidence supporting the amounts and disclosures in the financial statements. An audit also includes assessing the accounting principles used and significant estimates made by management, as well as evaluating the overall financial statement presentation. We believe that our audits provide a reasonable basis for our opinion.
In our opinion, the consolidated financial statements referred to above present fairly, in all material respects, the financial position of the Company as of December 31, 2013 and 2012, and the results of their operations and their cash flows for each of the years in the three-year period ended December 31, 2013, in conformity with U.S. generally accepted accounting principles.
We also have audited, in accordance with the standards of the Public Company Accounting Oversight Board (United States), the Company’s internal control over financial reporting as of December 31, 2013, based on criteria established inInternal Control – Integrated Framework (1992) issued by the Committee of Sponsoring Organizations of the Treadway Commission (COSO), and our report dated March 5, 2014 expressed an unqualified opinion on the effectiveness of the Company’s internal control over financial reporting.
|
| /s/ KPMG LLP |
|
Shreveport, Louisiana March 5, 2014 |
90
REPORT OF INDEPENDENT REGISTERED PUBLIC ACCOUNTING FIRM
The Board of Directors and Stockholders
Deltic Timber Corporation:
We have audited Deltic Timber Corporation’s (the Company) internal control over financial reporting as of December 31, 2013 based on criteria established inInternal Control — Integrated Framework (1992) issued by the Committee of Sponsoring Organizations of the Treadway Commission (COSO). The Company’s management is responsible for maintaining effective internal control over financial reporting and for its assessment of the effectiveness of internal control over financial reporting included in the accompanyingManagement’s Report on Internal Control Over Financial Reporting. Our responsibility is to express an opinion on the Company’s internal control over financial reporting based on our audit.
We conducted our audit in accordance with the standards of the Public Company Accounting Oversight Board (United States). Those standards require that we plan and perform the audit to obtain reasonable assurance about whether effective internal control over financial reporting was maintained in all material respects. Our audit included obtaining an understanding of internal control over financial reporting, assessing the risk that a material weakness exists, and testing and evaluating the design and operating effectiveness of internal control based on the assessed risk. Our audit also included performing such other procedures as we considered necessary in the circumstances. We believe that our audit provides a reasonable basis for our opinion.
A company’s internal control over financial reporting is a process designed to provide reasonable assurance regarding the reliability of financial reporting and the preparation of financial statements for external purposes in accordance with generally accepted accounting principles. A company’s internal control over financial reporting includes those policies and procedures that (1) pertain to the maintenance of records that, in reasonable detail, accurately and fairly reflect the transactions and dispositions of the assets of the company; (2) provide reasonable assurance that transactions are recorded as necessary to permit preparation of financial statements in accordance with generally accepted accounting principles, and that receipts and expenditures of the company are being made only in accordance with authorizations of management and directors of the company; and (3) provide reasonable assurance regarding prevention or timely detection of unauthorized acquisition, use, or disposition of the company’s assets that could have a material effect on the financial statements.
Because of its inherent limitations, internal control over financial reporting may not prevent or detect misstatements. Also, projections of any evaluation of effectiveness to future periods are subject to the risk that controls may become inadequate because of changes in conditions, or that the degree of compliance with the policies or procedures may deteriorate.
In our opinion, Deltic Timber Corporation maintained, in all material respects, effective internal control over financial reporting as of December 31, 2013, based on criteria established inInternal Control — Integrated Framework (1992) issued by the Committee of Sponsoring Organizations of the Treadway Commission.
We also have audited, in accordance with the standards of the Public Company Accounting Oversight Board (United States), the consolidated balance sheets of Deltic Timber Corporation and Subsidiaries as of December 31, 2013 and 2012 and the related consolidated statements of income, comprehensive income/(loss), cash flows, and stockholders’ equity for each of the years in the three-year period ended December 31, 2013, and our report dated March 5, 2014 expressed an unqualified opinion on those consolidated financial statements.
|
| /s/ KPMG LLP |
|
Shreveport, Louisiana March 5, 2014 |
91
| Item 9. | Changes in and Disagreements with Accountants on Accounting and Financial Disclosure |
None.
| Item 9A. | Controls and Procedures |
Evaluation of Disclosure Controls and Procedures
Deltic Timber Corporation (“Deltic” or “the Company”) has established disclosure controls and procedures to ensure that material information relating to the Company, including its consolidated subsidiaries, is made known to the officers who certify the Company’s financial reports and to other members of senior management and the Board of Directors.
Based on their evaluation as of December 31, 2013, the Chief Executive Officer and Chief Financial Officer of the Company have concluded that the Company’s disclosure controls and procedures (as defined in Rules 13a-15(e) and 15d-15(e) under the Securities Exchange Act of 1934) are effective to ensure that the information required to be disclosed by the Company in the reports that it files or submits under the Securities Exchange Act of 1934 is recorded, processed, summarized, and reported within the time periods specified in SEC rules and forms, and this information was accumulated and communicated to the Company’s management, including the Chief Executive Officer and Chief Financial Officer, as appropriate to allow timely decisions regarding required disclosures.
Management’s Report on Internal Control Over Financial Reporting
The Company’s management is responsible for establishing and maintaining effective internal control over financial reporting, as such term is defined in Exchange Act Rules 13a-15(f). Under the supervision and with the participation of management, including the principal executive officer and principal financial officer, Deltic conducted an evaluation of the effectiveness of our internal control over financial reporting based on the framework inInternal Control – Integrated Framework (1992) issued by the Committee of Sponsoring Organizations of the Treadway Commission. Based on evaluation under the framework inInternal Control – Integrated Framework (1992), management concluded that internal control over financial reporting was effective as of December 31, 2013. The effectiveness of the Company’s internal control over financial reporting as of December 31, 2013, has been audited by KPMG, LLP, an independent registered public accounting firm, as stated in their report which appears in the Company’s 2013 Annual Report to Shareholders which is included in this Form 10-K.
Changes in Internal Control Over Financial Reporting
Deltic’s management, with the Chief Executive Officer and Chief Financial Officer, have evaluated any changes in the Company’s internal control over financial reporting that occurred during the Company’s most recent fiscal quarter (the Company’s fourth quarter in the case of an annual report) and have concluded that there was no change to Deltic’s internal control over financial reporting that has materially affected, or is reasonably likely to materially affect, Deltic’s internal control over financial reporting.
| Item 9B. | Other Information |
None.
92
PART III
| Item 10. | Directors, Executive Officers, and Corporate Governance |
The sections entitled “Nominees For Election as Directors,” “Directors Whose Term of Office Continue,” and “Committees of the Board of Directors” appearing in the Registrant’s proxy statement for the annual meeting of shareholders to be held on April 24, 2014, will set forth certain information with respect to the directors of the registrant, including directors who serve on the Company’s Audit Committee and who have been designated an Audit Committee financial expert, and is incorporated herein by reference. Certain information with respect to persons who are or may be deemed to be executive officers of the Registrant is set forth under the caption “Executive Officers of the Registrant” in Part I of this report.
The sections entitled “Procedures for Stockholder Nominations and Proposals” and “Corporate Governance” appearing in the Registrant’s proxy statement for the annual meeting of stockholders to be held April 24, 2014, will set forth certain information respectively in regards to applicable procedures for stockholders to submit director nominations and proposals and the Company’s Code of Business Conduct and Ethics and is incorporated herein by reference.
| Item 11. | Executive Compensation |
Information required by this Item will be contained in the Registrant’s proxy statement for the annual meeting of stockholders to be held on April 24, 2014, to be filed not later than 120 days following the end of the Registrant’s fiscal year ended December 31, 2013, which will set forth certain information with respect to executive compensation of the Registrant and is incorporated herein by reference.
93
| Item 12. | Security Ownership of Certain Beneficial Owners and Management and Related Stockholder Matters |
Information required by this Item will be contained in the Registrant’s proxy statement for the annual meeting of stockholders to be held on April 24, 2014, to be filed not later than 120 days following the end of the Registrant’s fiscal year ended December 31, 2013, which will set forth certain information with respect to security ownership of certain beneficial owners and management of the Registrant and is incorporated herein by reference.
The following table sets forth information as of December 31, 2013, with respect to Deltic common stock issuable under the Company’s compensation plans.
| | | | | | | | | | | | |
Plan Category | | Number of
securities to
be issued upon
exercise of
outstanding options,
warrants and rights
(a) | | | Weighted-average
exercise price
of outstanding
options,
warrants, and rights
(b) | | | Number of securities
remaining available for
future issuance under
equity compensation
plans (excluding
securities reflected in
column
(a) (c) | |
Equity compensation plans approved by security holders | | | 131,456 | | | $ | 59.64 | | | | 900,181 | |
Equity compensation plans not approved by security holders | | | — | | | | — | | | | — | |
| | | | | | | | | | | | |
| | | |
| | | 131,456 | | | $ | 59.64 | | | | 900,181 | |
| | | | | | | | | | | | |
| Item 13. | Certain Relationships and Related Transactions, and Director Independence |
Information required by this Item will be contained in the Registrant’s proxy statement for the annual meeting of stockholders to be held on April 24, 2014, to be filed not later than 120 days following the end of the Registrant’s fiscal year ended December 31, 2013, which will set forth certain information with respect to certain relationships and related transactions of the Registrant and is incorporated herein by reference.
| Item 14. | Principal Accountant Fees and Services |
Information required by this Item will be contained in the Registrant’s proxy statement for the annual meeting to be held on April 24, 2014, to be filed not later than 120 days following the end of the Registrant’s fiscal year ended December 31, 2013, which will set forth certain information with respect to principal accountant fees and services and is incorporated herein by reference.
94
PART IV
| Item 15. | Exhibits and Financial Statement Schedules |
| | a. | Financial Statements, Schedules and Exhibits. |
| | 1. | Consolidated Financial Statements. |
Consolidated Balance Sheets—December 31, 2013 and 2012.
Consolidated Statements of Income for the Years Ended December 31, 2013, 2012, and 2011.
Consolidated Statements of Comprehensive Income/(Loss) for the Years Ended December 31, 2013, 2012, and 2011.
Consolidated Statements of Cash Flows for the Years Ended December 31, 2013, 2012, and 2011.
Consolidated Statements of Stockholders’ Equity for the Years Ended December 31, 2013, 2012, and 2011.
Notes to Consolidated Financial Statements, including Consolidated Quarterly Income Information (unaudited).
Report of Independent Registered Public Accounting Firm on Consolidated Financial Statements.
Report of Independent Registered Public Accounting Firm on Internal Control Over Financial Reporting.
| | 2. | Financial Statement Schedules. |
Other Financial statement schedules are omitted because either they are not applicable or the required information is included in the consolidated financial statements or notes thereto.
95
Index to Exhibits
| | |
Exhibit
Designation | | Nature of Exhibit |
| |
| 3 | | Articles of Incorporation and Bylaws. |
| |
| 3.1 | | Amended and Restated Certificate of Incorporation of Deltic Timber Corporation as of December 17, 1996 (incorporated by reference to Exhibit 3.1 to Registrant’s Annual Report on Form 10-K for the year ended December 31, 1996.) |
| |
| 3.2 | | Amended and Restated Bylaws of Deltic Timber Corporation (incorporated by reference to Exhibit 3.2 to Registrant’s Annual Report on Form 10-K for the year ended December 31, 1996.) |
| |
| 4 | | Instruments Defining the Rights of Security Holders. |
| |
| 4.1 | | Rights Agreement dated as of December 11, 1996, between Deltic Timber Corporation and Harris Trust and Savings Bank, as Rights Agent (incorporated by reference to Exhibit 4 to Registrant’s Annual Report on Form 10-K for the year ended December 31, 1996). |
| |
| 4.2 | | Amendment No. 1 to Rights Agreement dated as of October 15, 1998, between Deltic Timber Corporation and Harris Trust and Savings Bank, as Rights Agent (incorporated by reference to Exhibit 4.2 to Registrant’s Registration of Securities Report on Form 10/A dated November 11, 1998.) |
| |
| 4.3 | | Amendment No. 2 to Rights Agreement dated as of October 19, 2006, between Deltic Timber Corporation and Harris N.A. as Rights Agent (incorporated by reference to Exhibit 4.3 to Registrant’s Registration of Securities Report on Form 10/A dated October 19, 2006.) |
| |
| 10 | | Material contracts. |
| |
| 10.1 | | Deltic Timber Corporation 2002 Stock Incentive Plan (incorporated by reference to the Exhibit 10.1 to Registrant’s Current Report on Form 8-K dated October 18, 2006.) |
| |
| 10.2 | | Distribution Agreement (incorporated by reference to Exhibit 10.2 to Registrant’s Annual Report on Form 10-K for the year ended December 31, 1996.) |
| |
| 10.3 | | Tax Sharing Agreement (incorporated by reference to Exhibit 10.3 to Registrant’s Annual Report on Form 10-K for the year ended December 31, 1996.) |
| |
| 10.4 | | Credit facility dated December 19, 1996 (incorporated by reference to Exhibit 10.4 to Registrant’s Quarterly Report on Form 10-Q for the quarter ended September 30, 1997.) |
| |
| 10.5 | | Certificate of Designation of the Cumulative Redeemable Preferred Stock, 7.54% Series ($.01 Par Value), of Deltic Timber Corporation (incorporated by reference to Exhibit 10.5 to Registrant’s Annual Report on Form 10-K for the year ended December 31, 1997.) |
96
| | |
| |
| 10.7 | | Note Purchase Agreement dated December 18, 1998 (incorporated by reference to Exhibit 10.7 to Registrant’s Annual Report on Form 10-K for the year ended December 31, 1998). |
| |
| 10.8 | | Selective Sections of Del-Tin Fiber LLC’s Project Credit Agreement dated November 23, 1998 (incorporated by reference to Exhibit 10.8 to Registrant’s Annual Report on Form 10-K for the year ended December 31, 1998). |
| |
| 10.9 | | Revolving Credit Agreement dated June 20, 2001 (incorporated by reference to Exhibit 10.9 to Registrant’s Quarterly Report on Form 10-Q for the quarter ended June 30, 2001.) |
| |
| 10.10 | | Note Purchase Agreement dated December 20, 2002, (incorporated by reference to Exhibit 10.10 to Registrant’s Annual Report on Form 10-K for the year ended December 31, 2002). |
| |
| 10.11 | | First Amended and Restated Revolving Credit Agreement dated September 30, 2003 (incorporated by reference to Exhibit 10.11 to Registrant’s Quarterly Report on Form 10-Q for the quarter ended September 30, 2003). |
| |
| 10.12 | | Guarantee Agreement between Deltic Timber Corporation and SunTrust Bank related to the Del-Tin Fiber Credit Agreement dated August 26, 2004 (incorporated by reference to Exhibit 10.12 to Registrant’s Annual Report on Form 10-K for the year ended December 31, 2004). |
| |
| 10.13 | | Annual Incentive Compensation Plan (incorporated by reference to Exhibit 10.13 to Registrant’s Current Report on Form 8-K dated October 18, 2006.) |
| |
| 10.14 | | Non Qualified Stock Option Form (incorporated by reference to Exhibit 10.14 to Registrant’s Current Report on Form 8-K dated October 18, 2006.) |
| |
| 10.15 | | Restricted Stock Award Agreement and Stock Power (incorporated by reference to Exhibit 10.15 to Registrant’s Current Report on Form 8-K dated October 18, 2006.) |
| |
| 10.16 | | Performance Based Restricted Stock Award Agreement and Stock Power (incorporated by reference to Exhibit 10.16 to Registrant’s Current Report on Form 8-K dated October 18, 2006.) |
| |
| 10.17 | | Change-in-Control and Involuntary Severance Agreement with CEO (incorporated by reference to Exhibit 10.17 to Registrant’s Current Report on Form 8-K dated October 18, 2006.) |
| |
| 10.18 | | Change-in-Control Agreement with CEO Direct Reports (incorporated by reference to Exhibit 10.18 to Registrant’s Current Report on Form 8-K dated October 18, 2006.) |
| |
| 10.19 | | Revolving Credit Agreement dated September 9, 2005 (incorporated by reference to Exhibit 10.19 to Registrant’s Quarterly Report on Form 10-Q for the quarter ended September 30, 2005.) |
| |
| 10.20 | | Deltic Timber Corporation Supplemental Executive Retirement Plan (incorporated by reference to Exhibit 10.20 to the Registrant’s Current Report on Form 8-K dated October 18, 2006.) |
97
| | |
| |
| 10.21 | | Amended and Restated Note Purchase Agreement dated March 30, 2007 (incorporated by reference to Exhibit 10.7 to Registrant’s Quarterly Report on Form 10-Q for the quarter ended March 31, 2007). |
| |
| 10.22 | | First Amendment to the Revolving Credit Agreement dated August 7, 2007 (incorporated by reference to Exhibit 10.21 to Registrant’s Quarterly Report on Form 10-Q for the quarter ended September 30, 2007.) |
| |
| 10.23 | | Termination of a Material Definitive Agreement (incorporated by reference to Exhibit 10.23 to Registrant’s Current Report on Form 8-K dated October 30, 2008.) |
| |
| 10.24 | | Second Amendment to the Revolving Credit Agreement dated September 9, 2005 (incorporated by reference to Exhibit 10.24 to Registrant’s Current Report on Form 8-K dated February 4, 2011.) |
| |
| 10.25 | | Membership Interest Purchase Agreement dated February 13, 2013, between Deltic Timber Corporation and TIN, Inc., (incorporated by reference to Exhibit 10.25 to Registrant’s Quarterly Report on Form 10-Q for the quarter ended March 31, 2013). |
| |
| 10.26 | | Amended and Restated Revolving Credit Agreement dated May 2, 2013, (incorporated by reference to Exhibit 10.26 to Registrant’s Current Report on Form 8-K dated May 2, 2013). |
| |
| 21 | | Subsidiaries of the Registrant, included elsewhere herein. |
| |
| 23 | | Consents of Independent Registered Public Accounting Firm. |
| |
| 23.1 | | Consent of Independent Registered Public Accounting Firm related to reports on consolidated financial statements and internal control over financial reporting of Deltic Timber Corporation, included elsewhere herein. |
| |
| 31.1 | | Chief Executive Officer Certification Required by Section 302 of the Sarbanes-Oxley Act of 2002. |
| |
| 31.2 | | Chief Financial Officer Certification Required by Section 302 of the Sarbanes-Oxley Act of 2002. |
| |
| 32 | | Certification Required by Section 906 of the Sarbanes-Oxley Act of 2002. |
| |
| 101 | | Interactive Data: The following financial information from Deltic Timber Corporation’s Annual Report on Form 10-K for the fiscal year ended December 31, 2013, formatted in Extensible Business Reporting Language: (1) the Consolidated Balance Sheets; (2) the Consolidated Statements of Income; (3) the Consolidated Statements of Comprehensive Income/(Loss); (4) the Consolidated Statements of Cash Flows; (5) the Consolidated Statements of Stockholders’ Equity; and (6) the Notes to Consolidated Financial Statements. |
Exhibits other than those listed above have been omitted since they either are not required or are not applicable.
98
SIGNATURES
Pursuant to the requirements of Section 13 or 15(d) of the Securities Exchange Act of 1934, the registrant has duly caused this report to be signed on its behalf by the undersigned, thereunto duly authorized.
| | | | | | | | |
| DELTIC TIMBER CORPORATION | | | | |
| | | | |
| By: | | /s/ Ray C. Dillon | | | | Date: | | March 5, 2014 |
| | Ray C. Dillon, President | | | | | | |
Pursuant to the requirements of the Securities Exchange Act of 1934, this report has been signed below on March 5, 2014 by the following persons on behalf of the registrant and in the capacities indicated.
| | |
/s/ Robert C. Nolan | | /s/ Ray C. Dillon |
| Robert C. Nolan, Chairman and Director | | Ray C. Dillon, President and Chief |
| | Executive Officer and Director |
| | (Principal Executive Officer) |
| |
/s/ Randolph C. Coley | | /s/ David L. Lemmon |
| Randolph C. Coley, Director | | David L. Lemmon, Director |
| |
/s/ Christoph Keller, III | | /s/ R. Hunter Pierson, Jr. |
| Christoph Keller, III, Director | | R. Hunter Pierson, Jr., Director |
| |
/s/ R. Madison Murphy | | /s/ Robert B. Tudor |
| R. Madison Murphy, Director | | Robert B. Tudor, Director |
| |
/s/ J. Thurston Roach | | /s/ Kenneth D. Mann |
| J. Thurston Roach, Director | | Kenneth D. Mann, Vice President, |
| | Treasurer and Chief Financial Officer |
| | (Principal Financial Officer) |
| |
/s/ Byrom L. Walker | | |
| Byrom L. Walker, Controller | | |
| (Principal Accounting Officer) | | |
99