UNITED STATES
SECURITIES AND EXCHANGE COMMISSION
WASHINGTON, DC 20549
FORM 10-K
(Mark One)
| x | ANNUAL REPORT PURSUANT TO SECTION 13 OR 15(d) OF THE SECURITIES EXCHANGE ACT OF 1934 |
For The Fiscal Year Ended December 31, 2010
OR
| ¨ | TRANSITION REPORT PURSUANT TO SECTION 13 OR 15(d) OF THE SECURITIES EXCHANGE ACT OF 1934 |
For the transition period from to
Commission File Number 000-21771
West Corporation
(Exact name of registrant as specified in its charter)
| | |
| DELAWARE | | 47-0777362 |
| (State or other jurisdiction of incorporation or organization) | | (IRS Employer Identification No.) |
| |
| 11808 Miracle Hills Drive, Omaha, Nebraska | | 68154 |
| (Address of principal executive offices) | | (Zip Code) |
Registrant’s telephone number, including area code: (402) 963-1200
Securities registered pursuant to Section 12(b) of the Act: None.
Securities registered pursuant to Section 12(g) of the Act: None.
Indicate by check mark if the registrant is a well-known seasoned issuer, as defined in Rule 405 of the Securities Act. Yes ¨ No þ
Indicate by check mark if the registrant is not required to file reports pursuant to Section 13 or 15(d) of the Act. Yes þ No ¨
Indicate by check mark whether the registrant: (1) has filed all reports required to be filed by Section 13 or 15(d) of the Securities Exchange Act of 1934 during the preceding 12 months (or for such shorter period that the registrant was required to file such reports), and (2) has been subject to such filing requirements for the past 90 days. Yes ¨ No þ
Indicate by check mark whether the registrant has submitted electronically and posted on its corporate Web site, if any, every Interactive Data File required to be submitted and posted pursuant to Rule 405 of Regulation S-T (§232.405 of this chapter) during the preceding 12 months (or for such shorter period that the registrant was required to submit and post such files). Yes ¨ No ¨
Indicate by check mark if disclosure of delinquent filers pursuant to Item 405 of Regulation S-K is not contained herein, and will not be contained, to the best of registrant’s knowledge, in definitive proxy or information statements incorporated by reference in Part III of this Form 10-K or any amendment to this Form 10-K. þ
Indicate by check mark whether the registrant is a large accelerated filer, an accelerated filer, a non-accelerated filer, or a smaller reporting company. See definitions of “large accelerated filer,” “accelerated filer” and “smaller reporting company” in Rule 12b-2 of the Act.
Large accelerated filer ¨ Accelerated filer ¨ Non-accelerated filer þ Smaller reporting company ¨
Indicate by check mark whether the registrant is a shell company (as defined in Rule 12b-2 of the Exchange Act). Yes ¨ No þ
At February 14, 2011, 88,016,724.4624 shares of the registrant’s Class A common stock and 9,995,145.5578 shares of the registrant’s Class L common stock were outstanding.
TABLE OF CONTENTS
FORWARD LOOKING STATEMENTS
This report contains forward-looking statements. These forward-looking statements include estimates regarding:
| | • | | the impact of changes in government regulation and related litigation; |
| | • | | the impact of pending litigation; |
| | • | | the impact of integrating or completing mergers or strategic acquisitions; |
| | • | | the adequacy of our available capital for future capital requirements; |
| | • | | our future contractual obligations; |
| | • | | our capital expenditures; |
| | • | | the cost and reliability of voice and data services; |
| | • | | the cost of labor and turnover rates; |
| | • | | the impact of changes in interest rates; |
| | • | | substantial indebtedness incurred in connection with the 2006 recapitalization and acquisitions; and |
| | • | | the impact of foreign currency fluctuations. |
as well as other statements regarding our future operations, financial condition and prospects, and business strategies.
Forward-looking statements can be identified by the use of words such as “may,” “should,” “expects,” “plans,” “anticipates,” “believes,” “estimates,” “predicts,” “intends,” “continue,” or the negative of such terms, or other comparable terminology. Forward-looking statements also include the assumptions underlying or relating to any of the foregoing statements. Our actual results could differ materially from those anticipated in these forward-looking statements as a result of various factors, including the risks discussed in “Management’s Discussion and Analysis of Financial Condition and Results of Operations” and elsewhere in this report.
All forward-looking statements included in this report are based on information available to us on the date hereof. We assume no obligation to update any forward-looking statements.
PART I.
Overview
We are a leading provider of technology-driven, voice and data solutions. We offer our clients a broad range of communications and network infrastructure solutions that help them manage or support critical communications. The scale and processing capacity of our proprietary technology platforms, combined with our world-class expertise and processes in managing telephony and human capital, enable us to provide our clients with premium outsourced communications solutions. Our automated service and conferencing solutions are designed to improve our clients’ cost structure and provide reliable, high-quality services. Our solutions also help deliver mission-critical services, such as public safety and emergency communications. We serve Fortune 1000 companies and other clients in a variety of industries, including telecommunications, banking, retail, financial services, technology and healthcare, and have sales and operations in the United States, Canada, Europe, the Middle East, Asia Pacific and Latin America.
1
Since our founding in 1986, we have invested significantly to expand our technology platforms and develop our operational processes to meet the complex communication needs of our clients. We have evolved into a predominantly automated processor of voice and data transactions and a provider of network infrastructure solutions. In 2010, we grew revenue by 0.5% over 2009 to $2,388.2 million and generated $654.7 million in adjusted EBITDA, or 27.4% margins, $60.3 million in net income and $312.8 million in cash flows from operating activities. See “Selected Consolidated Financial Data.”
Investing in technology and developing specialized expertise in the industries we serve are critical components to our strategy of enhancing our services and delivering operational excellence. In 2010, we managed approximately 24.0 billion telephony minutes and over 115 million conference calls, facilitated over 240 million 9-1-1 calls, and delivered over 720 million notification calls and data messages. With approximately 608,000 telephony ports to handle conference calls, alerts and notifications and customer service, we believe our platforms provide scale and flexibility to handle greater transaction volume than our competitors, offer superior service and develop new offerings. These ports include approximately 256,000 Internet Protocol (“IP”) ports, which we believe provide us with the only large-scale proprietary IP-based global conferencing platform deployed and in use today. Our technology-driven platforms allow us to provide a broad range of complementary automated and agent-based service offerings to our diverse client base.
Corporate Information
We are a Delaware corporation that was founded in 1986. On October 24, 2006, we completed a recapitalization (the “recapitalization”) of the company in a transaction sponsored by an investor group led by Thomas H. Lee Partners, L.P. and Quadrangle Group LLC (the “Sponsors”) pursuant to the Agreement and Plan of Merger, dated as of May 31, 2006, between us and Omaha Acquisition Corp., a Delaware corporation formed by the Sponsors for the purpose of our recapitalization. Pursuant to the recapitalization, Omaha Acquisition Corp. was merged with and into West Corporation, with West Corporation continuing as the surviving corporation, and our publicly traded securities were cancelled in exchange for cash.
We financed the recapitalization with equity contributions from the Sponsors and the rollover of a portion of our equity interests held by Gary and Mary West, the founders of West, and certain members of management, along with a senior secured term loan facility, a senior secured revolving credit facility and the private placement of senior notes and senior subordinated notes.
Our principal executive offices are located at 11808 Miracle Hills Drive, Omaha, Nebraska 68154 and our telephone number at that address is (402) 963-1200. Our website address iswww.west.comwhere our Annual Report on Form 10-K, Quarterly Reports on Form 10-Q, Current Reports on Form 8-K and all amendments to those reports are available without charge, as soon as reasonably practicable following the time they are filed with or furnished to the SEC. None of the information on our website or any other website identified herein is part of this report. All website addresses in this report are intended to be inactive textual references only.
2
Our Services
We believe we have built our reputation as a best-in-class service provider over the past 24 years by delivering differentiated, high-quality solutions for our clients. Our portfolio of technology-driven, voice and data solutions includes:
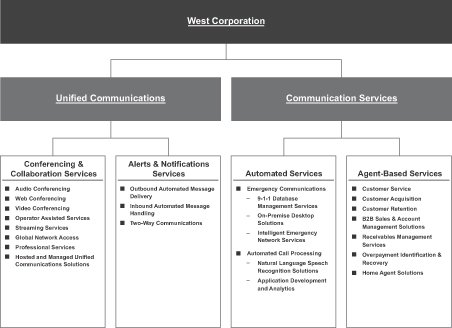
Unified Communications
—Conferencing & Collaboration Services.Operating under the InterCall brand, we are the largest conferencing services provider in the world based on conferencing revenue, according to Wainhouse Research, and managed over 115 million conference calls in 2010. We provide our clients with an integrated global suite of meeting replacement services. These include on-demand automated conferencing services, operator-assisted services for complex audio conferences or large events, web conferencing services that allow clients to make presentations and share applications and documents over the Internet, video conferencing applications that allow clients to experience real-time video presentations and conferences and streaming services to connect remote employees and host virtual events. We also provide consulting, project management and implementation of hosted and managed unified communications solutions.
—Alerts & Notifications Services.Our solutions leverage our proprietary technology platforms to allow clients to manage and deliver automated personalized communications quickly and through multiple delivery channels (voice, text messaging, email and fax). For example, we deliver patient notifications, appointment reminders and prescription refill reminders on behalf of our healthcare clients (medical and dental practices, hospitals and pharmacies), provide travelers with flight arrival and departure updates on behalf of our transportation clients and transmit emergency evacuation notices on behalf of municipalities. Our platform also enables two-way communication which allows recipients of a message to respond with relevant information to our clients.
3
Communication Services
—Automated Services
—Emergency Communications Services.We believe we are the largest provider of emergency communications infrastructure systems and services, based on our own estimates of the number of 9-1-1 calls that we and other participants in the industry facilitated. Our solutions are critical in facilitating public safety agencies’ ability to coordinate responses to emergency events. We provide the network database solution that routes emergency calls to the appropriate 9-1-1 centers and allows the appropriate first responders (police, fire and ambulance) to be assigned to those calls. Our clients generally enter into long-term contracts and fund their obligations through monthly charges on users’ local telephone bills. We also provide fully-integrated desktop communications technology solutions to public safety agencies that enable enhanced 9-1-1 call handling.
In 2010, we introduced the Intrado A9-1-1SM Alliance Member Program, a managed services program designed to upgrade the capabilities of 9-1-1 centers by delivering expanded information and new life-saving services across the U.S. The Alliance program creates an open marketplace for companies to significantly improve 9-1-1 by integrating their solutions with Intrado using industry approved open standard interfaces.
—Automated Call Processing.Over the last 21 years we believe we have developed a best-in-class suite of automated voice and data solutions. Our solutions allow our clients to effectively communicate with their customers through inbound and outbound interactive voice response (IVR) applications using natural language speech recognition, automated voice prompts and network-based call routing services. In addition to these front-end customer service applications, we also provide analyses that help our clients improve their automated communications strategy. Our automated services technology platforms serve as the backbone of our telephony management capabilities and our scale and operational flexibility have helped us launch and grow other key services, such as conferencing, alerts and notifications and West at Home.
—Agent-Based Services.We provide our clients with large-scale, agent-based services, including inbound customer care, customer acquisition and retention, business-to-business sales and account management, overpayment identification and recovery services, and collection of receivables on behalf of our clients. We have a flexible model with both on-shore and off-shore capabilities to fit our clients’ needs. We believe that we are known in the industry as a premium provider of these services, and we seek opportunities with clients for whom our services can add value while maintaining attractive margins for us. Our West at Home agent service is a remote call handling model that uses employees who work out of their homes. This service has a distinct advantage over traditional facility-based call center solutions by attracting higher quality agents. This model helps enhance our cost structure and significantly reduces our capital requirements.
Market Opportunity
Over the past 24 years, we have focused on leveraging our strengths in voice and data markets to serve the increasingly complex communications needs of our target client base. The global customer care business process outsourcing (“BPO”) market was estimated to be approximately $62 billion in 2010 with a projected compound annual growth rate (“CAGR”) through 2013 of approximately 7% according to IDC. In this market, we target opportunities where we can operate with a sustained competitive advantage and drive the highest levels of profitability. We have built on our position in this market by investing in emerging service delivery models with attractive end-market growth characteristics, such as West at Home customer care, that provide a higher quality of service to our clients. We believe we are one of the largest providers of this home-based model, having invested in this market early as client adoption began to accelerate.
Our investment strategy has evolved over the years as we have targeted new and complementary markets that not only leverage our depth of expertise in voice and data solutions but also deliver value through less labor intensive areas such as conferencing and collaboration, emergency communications and alerts and notifications services. Consistent with this strategy, we entered the conferencing and collaboration services market with our
4
acquisition of InterCall in 2003. Through organic growth and multiple strategic acquisitions, we have built on our initial success with our InterCall brand to become the leading global provider of conferencing services since 2008 based on revenue, according to Wainhouse Research.
The market for global unified communications services, which includes hosted audio, web and video conferencing as well as hosted and managed unified communication services, was $7.2 billion in 2010 and is expected to grow at a CAGR of 20% through 2014 according to Wainhouse Research. According to Tern Systems, the market for automated message delivery in the U.S. was over $850 million in 2010, and is expected to grow at an annual growth rate of 20% through 2015. We believe this growth is being driven by a number of factors, including increased globalization of business activity, focus on lower costs, increased adoption of conferencing and collaboration services and increasing awareness of the need for rapid communication during emergencies. By leveraging our global sales team and diversified client base, we intend to continue targeting higher growth, underserved markets.
The emergency communications infrastructure services market represents a complementary opportunity that allows us to diversify into end-markets that are less susceptible to downturns in the economy. According to Compass Intelligence, approximately $3.8 billion of government-sponsored funds are estimated to be available for 9-1-1 software, hardware and systems expenditures in 2010 and such funds are expected to grow at a 5.4% CAGR through 2014.
Business Evolution Since the Recapitalization
Over the past several years, we have expanded our capabilities and repositioned our business to meet the growing needs of our clients, addressing attractive new markets with strong demand characteristics and growth profiles. Our evolution during this time frame has resulted in a meaningful shift of our business mix towards a higher growth, higher margin automated processing model. As we continue to increase the level of automated services we provide, we intend to pursue opportunities in markets where we have industry expertise and where clients place a premium on the quality of service provided. Since 2005, we have invested approximately $1.7 billion in strategic acquisitions of value-added service providers, including approximately $850 million since our recapitalization in 2006. We have increased our penetration into higher growth international conferencing markets, strengthened our alerts and notifications services business and established a leadership position in emergency communication infrastructure management services. We have also meaningfully reoriented our business to address the emergence of unified communication products, a fast-growing demand trend. The following summaries further highlight the steps we have taken to improve our business:
—Evolved into a Predominantly Automated Solutions Business.We have continued our evolution into a diversified and automated technology-driven service provider. Our revenue from automated services businesses grew from 37% of total revenue in 2005 to 67.8% in 2010, and our operating income from automated services businesses grew from 53% of total operating income to 95% over the same period.
—Expanded Emergency Communications Services.In early 2006, we acquired Intrado and, in 2008, we acquired HBF Communications and Positron Public Safety Systems to become, we believe, the largest provider of 9-1-1 and emergency communications infrastructure services to telecommunications service providers, government agencies and public safety organizations, based on our own estimates of the number of 9-1-1 calls that we and other participants in the industry facilitated. To complement these acquisitions, we have steadily increased our presence in this market through substantial investments in proprietary systems to develop IP-based emergency communications services capabilities. This business is characterized by long-term client contracts.
—Expanded Conferencing Presence.Through both organic growth and acquisitions, we have been successful in expanding the reach of our conferencing services both domestically and internationally. Our conferencing services volume has grown from approximately 21 million calls in 2006 to over 115 million calls in
5
2010. In addition, we increased our worldwide presence in this market by acquiring Genesys, a global conferencing services provider, in May 2008 and we are now the largest conferencing services provider in the world based on conferencing revenue according to Wainhouse Research.
—Strengthened Alerts and Notifications Business.In 2007, we increased our presence in the high growth, high margin alerts and notifications business through the acquisitions of CenterPost Communications (now known as West Notifications Group Inc.) (“WNG”) and TeleVox Software, Incorporated (“TeleVox”). We now provide automated communication solutions across more industries, including financial services, communications, transportation and pharmacy. TeleVox delivers patient notifications to a diverse base of clients in the medical and dental markets as well as certain other commercial clients such as regional utilities and credit unions.
Our Competitive Strengths
We have developed operational and market expertise to serve the needs of clients who place a premium on the services we provide. We believe the following strengths have helped us to establish a leading competitive position in the markets we serve.
—Proven Business Model Built Over Decades.We have built a strong and stable business model that has delivered a 30.5% revenue CAGR since our inception in 1986. We have helped our clients communicate more effectively with their customers by processing billions of minutes of their voice and data transactions over the past 24 years. As a result of our longstanding history in our markets and significant investment in our businesses, we have accumulated substantial operating and management experience through various economic cycles. As demand for outsourced solutions grows with greater adoption of our technologies and services and the global trend towards business process outsourcing, we believe our long history of delivering results for our clients combined with our scale provide us with a significant competitive advantage.
—Broad Portfolio of Product Offerings with Attractive Value Proposition.Our technology-driven platforms combined with our operational expertise and processes allow us to provide a broad range of complementary automated and agent-based service offerings that help establish deep relationships with our clients. Our ability to efficiently and cost-effectively process high volume, complex transactions for our clients facilitates their critical communications and helps improve their cost structure.
—Scalable Operating Model.We have developed integrated proprietary platforms that we believe form one of the largest multi-carrier, multi-protocol secure managed networks. By allowing us to focus our research and development efforts on new services for multiple transaction types, our highly scalable operating model enables us to enhance our value proposition to clients and achieve greater efficiencies and returns from our infrastructure and invested capital. We also benefit from our ability to use our infrastructure and human capital across our business lines providing for the most efficient and opportunistic use of resources. We believe our shared operating model provides us with highly flexible and capital-efficient operations, which have been a critical factor in driving our performance and financial results.
—Strong, Recurring Client Relationships and Transactions.Many leading corporations look to us to manage their most important communications, voice and data transactions. We help our clients maximize the value of their customer relationships and derive greater value from each transaction that we process. The nature of our deep strategic and operational partnerships with our clients has allowed us to build long-lasting relationships with clients who operate in a broad range of industries, including telecommunications, banking, retail, financial services, technology and healthcare. Our top ten clients in 2010 have an average tenure of over ten years. In 2010, our 100 largest clients represented approximately 57% of our revenue. In addition, our clients often buy multiple services from us, with approximately 46% of our revenue in 2010 coming from clients purchasing multiple service offerings.
6
—Large-Scale, Technology-Driven Platforms.We leverage our strengths in technology, telephony and human capital management to process voice and data transactions for our clients. In 2010, for example, we managed and processed approximately 24.0 billion telephony minutes across our platforms, more than 115 million conference calls, more than 240 million 9-1-1 calls, and delivered over 720 million notification calls and data messages. In addition, with approximately 608,000 telephony ports to handle conference calls, alerts and notifications and customer service, our platforms provide scale and flexibility to handle greater transaction volume than our competitors, offer superior service and develop new offerings. These ports include approximately 256,000 IP ports, which we believe provide us with the only large-scale proprietary IP-based global conferencing platform deployed and in use today.
—Experienced Management Team.Our senior leadership has an average tenure of approximately 12 years with us and has delivered strong results through various market cycles, both as a public and as a private company. As a group, this team has created a culture of superior client service and has been able to achieve a 12.7% revenue CAGR over the past ten years. We also have established a long track record of successfully acquiring and integrating companies to drive growth and margin expansion.
Our Growth Strategy
Our strategy is to identify growing markets where we can deploy our existing assets and expertise to strengthen our competitive position. Our strategy is supported by our commitment to superior client service, operational excellence and technological and market leadership. Key aspects of our strategy include the following:
Drive Revenue and Profit Opportunities
—Expand Relationships with Existing Clients. We are focused on deepening and expanding relationships with our existing clients by delivering value in the form of reduced costs, improved customer relationships and enhanced revenue opportunities. Approximately 46% of our revenue in 2010 came from clients purchasing multiple service offerings from us. As we demonstrate the value that our services provide, often starting with a discrete service, we are frequently able to expand the size and scope of our client relationships.
—Develop New Client Relationships.In addition to expanding and enhancing our existing relationships, we will pursue new client opportunities. We will continue to focus on building long-term client relationships across a wide range of industries and geographies to further diversify our revenue base. We target clients in industries in which we have expertise or other competitive advantages and an ability to deliver a wide range of solutions that have a meaningful impact on their business. For example, our acquisition of Genesys in 2008 combined with our expertise in conferencing and collaboration services has allowed us to penetrate substantial new international markets. By continuing to add long-term client relationships in large and growing markets, we believe we enhance the stability and growth potential of our revenue base.
Enhance Utilization of Deployed Assets
—Continue to Enhance Leading Technology Capabilities.We believe our service offerings are enhanced by our superior technology capabilities and track record of innovation. We have been issued approximately 130 patents and have approximately 220 pending patent applications for technology and processes that we have developed. Many of our advances in technology and new uses for our platforms have been achieved in close partnership with our clients, and we will continue to target technology-driven solutions that enable our clients to realize significant benefits. In addition to strengthening our client relationships, we believe our focus on technology facilitates our ongoing evolution towards a diversified, predominantly automated and technology-driven operating model.
—Continue to Deliver Operational Excellence.We intend to continue to increase productivity and performance for our clients by leveraging our expertise in technology and telephony to efficiently process voice and data transactions. Our ability to provide improvements in processes is an important aspect of our value
7
proposition to clients, and we will continue to leverage our proprietary technology infrastructure and shared services platform to manage higher value transactions and achieve cost savings for our clients and ourselves. In addition, we intend to continue to focus our efforts and expenditures in areas that we believe provide the greatest opportunity for profit enhancement.
Pursue Attractive Markets and Services
—Target Growth Opportunities.We will continue to seek opportunities to expand our capabilities across industries and service offerings. We expect this will occur through a combination of organic growth, as well as strategic partnerships, alliances and acquisitions to expand into new service offerings as well as into new industries. Since 2005, we have invested approximately $1.7 billion in strategic acquisitions. We believe there are acquisition candidates that will enable us to expand our capabilities and markets and intend to continue to evaluate acquisitions in a disciplined manner and pursue those that provide attractive opportunities to enhance our growth and profitability.
Products and Services
Unified Communications
Service Offerings
— Conferencing and Collaboration.
Operating under the InterCall brand, we are the largest conferencing services provider in the world based on conferencing revenue, according to Wainhouse Research, and managed over 115 million conference calls in 2010. We provide our clients with an integrated global suite of meeting replacement services. These include on-demand automated conferencing services, operator-assisted services for complex audio conferences or large events, web conferencing services that allow clients to make presentations and share applications and documents over the Internet, video conferencing applications that allow clients to experience real-time video presentations and conferences and streaming services to connect remote employees and host virtual events. The conferencing and collaborations business provides six primary services globally:
| | • | | Reservationless Servicesare on-demand automated conferencing services that allow clients to initiate an audio conference at anytime, without the need to make a reservation or rely on an operator. |
| | • | | Operator-Assisted Servicesare pre-scheduled conferences for complex or highly important events. Operator-assisted services are customized to a client’s needs and provide a wide range of scalable features and enhancements, including the ability to record, broadcast, schedule and administer meetings. |
| | • | | Web Conferencing Servicesallow clients to make presentations and share applications and documents over the Internet. These services are offered through our proprietary product, InterCall Unified Meeting, as well as through the resale of Cisco, Microsoft Adobe and IBM products. Web conferencing services are customized to each client’s individual needs and offer the ability to reach a wide audience. |
| | • | | Video Conferencing Servicesallow clients to experience real-time video presentations and conferences. These services are offered through our proprietary products, InterCall Video Conferencing and InterCall Video Managed Services, and can be used for a wide variety of events, including training seminars, sales presentations, product launches and financial reporting calls. |
| | • | | Streaming Services allow clients to connect remote employees and bolster collaboration as well as hosting virtual events such as e-learning, online training and promotional programs. We enhanced our presence in this market with the acquisition of Stream57, LLC on December 31, 2009. |
| | • | | Professional Services offer clients consulting, project management and implementation of hosted and managed unified communications solutions. We expanded our professional services capabilities with the acquisition of the SKT Business Communication Solutions division of the Southern Kansas Telephone Company, Inc. on April 1, 2010. |
8
— Alerts and Notifications.
Our solutions leverage our proprietary technology platforms to allow clients to manage and deliver automated personalized communications quickly and through multiple delivery channels (voice, text messaging, email and fax). For example, we deliver patient notifications, appointment reminders and prescription refill reminders on behalf of our healthcare clients (medical and dental practices, hospitals and pharmacies), provide travelers with flight arrival and departure updates on behalf of our transportation clients and transmit emergency evacuation notices on behalf of municipalities. Our platform also enables two-way communication which allows recipients of a message to respond with relevant information to our clients.
— Professional Services.
We offer expert consulting, design, integration, and implementation of voice, video, messaging, and collaboration systems and services. Specific capabilities and expertise include business value/process assessments, messaging and collaboration applications, training and adoption services, LAN/WAN, virtualization and IP telephony and legacy voice integration, including Session Initiation Protocol based technologies. We greatly enhanced our professional services capabilities in 2010 with the acquisition of SKT Business Communications Solutions.
— Hosted and Managed Unified Communications Services.
Hosted services are offered as partner-hosted or cloud-based in our datacenter and delivered in either multi-tenant or a single-tenant dedicated fashion, both of which are available with or without telephony services. Managed services can be provided from the cloud or on-premise and include 24/7 monitoring, professional services and on-going support. Among other benefits, these hosted and managed Unified Communications solutions reduce the risk of downtime, remove the burden from our customers’ IT staff, and provide a predictable monthly communications spend. These services can be delivered in hosted, managed or hybrid models.
Sales and Marketing
— Conferencing and Collaboration.
For conferencing and collaboration, we maintain a sales force of approximately 800 personnel that are trained to understand and respond to our clients’ needs. We generally pay commissions to sales professionals on both new sales and incremental revenue generated from existing clients.
We manage these sales and marketing efforts through five dedicated channels:
| | • | | National Accounts:Our national accounts meeting consultants sell our services to large, multi-national companies. |
| | • | | Direct Sales:Our direct sales meeting consultants sell our services to mid-market and large enterprises not covered by National Accounts. |
| | • | | International Sales:Our international meeting consultants sell our services internationally. |
| | • | | Internet:We sell our conferencing services on the Internet through InterCall.com and the trade name ConferenceCall.com. We acquire clients using Internet-based search engines to identify potential purchasers of conferencing services through placement of paid advertisements on search pages of major Internet search engine sites. The strength of this marketing program lies in its ability to automatically monitor ad placement on all of the major search engines and ensure optimal positioning on each of these search sites. |
| | • | | Wholesale Sales:We have relationships with traditional resellers, local exchange carriers, interexchange carriers and systems integrators to sell our conferencing services. |
9
— Alerts and Notifications.
For alerts and notifications, we maintain a dedicated sales force of approximately 70 personnel, most of whom are focused on the healthcare, dental and commercial industries. We have a sales strategy that is supported by generating leads from industry trade shows and e-marketing initiatives.
Competition
— Conferencing and Collaboration.The conferencing and collaboration services market is highly competitive. The principal competitive factors in conferencing and collaboration services include, among others, range of service offerings, global capabilities, price and quality of service. Our principal competitors in the conferencing and collaboration industry include AT&T, Verizon, Premiere Global Services, BT Conferencing, NTT, Cisco Systems, Microsoft, IBM and other premise-based solution providers.
— Alerts and Notifications. The alerts and notifications services market is highly competitive and fragmented, characterized by a large number of vertically focused competitors addressing specific industries, including healthcare, travel, education, credit collection and government. The principal competitive factors in alerts and notifications include, among others, industry-specific knowledge and service focus, reliability, scalability, ease of use and price. Competitors in this industry include Varolii, SoundBite Communications, Silverlink Communications and, in the medical and dental markets, PhoneTree, Sesame Communications and Inphonite. We also face competition for clients who implement in-house solutions.
Communication Services
Service Offerings
We believe we are one of the largest providers of outsourced communications services in the United States and we were named the 2010 North American Contact Center Outsourcing Company of the Year by Frost & Sullivan. We provide our clients with a comprehensive portfolio of integrated voice-oriented services through the following channels:
— Automated Services.
| | • | | Emergency Communications Services:We believe we are the largest provider of emergency communications infrastructure systems and services, based on our own estimates of the number of 9-1-1 calls that we and other participants in the industry facilitated. Our solutions are critical in facilitating public safety agencies’ ability to coordinate responses to emergency events. We provide the network database solution that routes emergency calls to the appropriate 9-1-1 centers and allows the appropriate first responders (police, fire and ambulance) to be assigned to those calls. Our clients generally enter into long-term contracts and fund their obligations through monthly charges on users’ local access bills. We also provide fully-integrated desktop communications technology solutions to public safety agencies that enable enhanced 9-1-1 call handling. |
| | • | | Automated Customer Service:Over the last 21 years we believe we have developed a best-in-class suite of automated voice-oriented solutions. Our solutions allow our clients to effectively communicate with their customers through inbound and outbound interactive voice response applications using natural language speech recognition, automated voice prompts and network-based call routing services. In addition to these front-end customer service applications, we also provide analyses that help our clients improve their automated communications strategy. Our automated services technology platforms serve as the backbone of our telephony management capabilities and our scale and operational flexibility have helped us launch and grow other key services, such as conferencing, alerts and notifications and West at Home. |
— Agent-Based Services.We provide our clients with large-scale, agent-based services, including inbound customer care, customer acquisition and retention, business-to-business sales and account management,
10
overpayment identification and recovery services, and receivables management solutions. We have a flexible model with both on-shore and off-shore capabilities to fit our clients’ needs. We believe that we are known in the industry as a premium provider of these services, and we seek opportunities with clients for whom our services can add value while maintaining attractive margins for us. We provide four primary types of services:
| | • | | Customer Service:We provide clients with customized services that are handled by trained agents. In addition to traditional customer care and sales services, we offer our West at Home agent service, a remote call handling model that uses employees who work out of their homes. This service has a distinct advantage over traditional facility-based call center solutions by attracting higher quality agents. This model helps to enhance our cost structure and significantly reduce our capital requirements. |
| | • | | Business-to-Business Services:We provide dedicated outsourced sales and account management services for some of the nation’s leading companies. These services help our clients drive incremental sales, increase market share and strengthen relationships with their customers. Examples of these services include sales, account management, sales support, order management and lead generation. |
| | • | | Overpayment Identification and Recovery:Overpayment identification and recovery includes health insurance claims overpayment identification and the recovery of identified overpaid amounts. Proprietary technology, data modeling and business processes are utilized to identify overpayments and return those funds to our clients. |
| | • | | Receivables Management:Receivables management involves collecting receivables on behalf of our clients. We are focused on specific industries, such as healthcare, financial services, government, utilities and telecommunications. Our recovery strategy is primarily determined by the age of receivables and the extent of previous collection efforts. |
Sales and Marketing
Generally, our Communications Services segment targets growth-oriented clients and selectively pursues those with whom we have the greatest opportunity for long-term success. We maintain approximately 150 sales and marketing personnel dedicated to our Communication Services segment. Their goals are to both maximize our current client relationships and expand our existing client base. To accomplish these goals, we attempt to sell additional services to existing clients and to develop new client relationships. We generally pay commissions to sales professionals on both new sales and incremental revenue generated from existing clients.
Competition
— Emergency Communications.The market for wireline and wireless emergency communications solutions is competitive. The principal competitive factors in wireline and wireless emergency communications are the effectiveness of existing infrastructure, scalability, reliability, ease of use, price, technical features, scope of product offerings, customer service and support, ease of technical migration, useful life of new technology and wireless support. Competitors in the incumbent local exchange carrier and competitive local exchange carrier markets generally include internally developed solutions, and competitors in the wireless market include TeleCommunications Systems. Competition in the public safety desktop market is driven by features functionality, ease of use, price, reliability, upgradability, capital replacement and upgrade policies and customer service and support. Competitors in this market include PlantCML, EmergiTech and 911-Inc.
— Automated Customer Service.The principal competitive factors in the automated customer service market are scalability, flexibility, reliability, speed of implementing client applications and price of services. Competitors in this market are primarily premise-based services.
— Agent-Based Services.The principal competitive factors in the agent-based customer service market include, among others, quality of service, range of service offerings, flexibility and speed of implementing
11
customized solutions to meet clients’ needs, capacity, industry-specific experience, technological expertise and price. In the agent-based customer services market, many clients retain multiple communication services providers, which exposes us to continuous competition in order to remain a preferred vendor. Competitors in the agent-based customer services industry include Convergys, TeleTech, Sykes, NCO, GC Services, Infosys Technologies Limited and Aegis. We also compete with the in-house operations of many of our existing and potential clients.
Our Clients
Our clients vary by business. We have a large and diverse client base for our conferencing and collaboration services, ranging from small businesses to Fortune 100 clients, and operating in a wide range of industries, including telecommunications, banking, retail, financial services, technology and healthcare. Our alerts and notifications business serves a large number of clients, who generally operate in specific industries such as medical and dental or transportation. Traditionally, our emergency communications clients have been incumbent local exchange carriers and competitive local exchange carriers. Our automated customer service and agent-based service businesses serve larger enterprise clients operating in a wide range of industries.
Although we serve many clients, we derive a significant portion of our revenue from relatively few clients. In 2010, our 100 largest clients represented approximately 57% of our revenue, with one client, AT&T, representing approximately 11% of our revenue.
Our Personnel
As of December 31, 2010, we had approximately 33,400 total employees, of which approximately 28,800 were employed in the Communication Services segment (including approximately 8,800 home-based, generally part-time employees), 3,900 were employed in the Unified Communications segment and approximately 700 were employed in corporate support functions. Of the total employees, approximately 7,600 were employed in management, staff and administrative positions, and approximately 4,900 were international employees. Employees of our subsidiaries in France are represented by a local works council. Employees in France and certain other countries are also covered by the terms of industry-specific national collective agreements. Our employees are not represented by any labor organization in the United States. We believe that our relations with our employees and the labor organizations identified above are good.
Our Technology and Systems Development
Technology is critical to our business and we believe the scale and flexibility of our platform is a competitive strength. Our software and hardware systems, as well as our network infrastructure, are designed to offer high-quality, integrated solutions. We have made significant investments in reliable hardware systems and integrated commercially available software when appropriate. We currently have approximately 608,000 telephony ports to handle conference calls, alerts and notifications and customer service. These ports include approximately 256,000 IP ports, which we believe provide us with the only large-scale proprietary IP-based global conferencing platform deployed and in use today. Our technological platforms are designed to handle greater transaction volume than our competitors. Because our technology is client focused, we often rely on proprietary software systems developed internally to customize our services. As of December 31, 2010, we employed a staff of approximately 2,100 professionals in our information technologies department.
We recognize the importance of providing uninterrupted service for our clients. We have invested significant resources to develop, install and maintain facilities and systems that are designed to be highly reliable. Our facilities and systems are designed to maximize system availability and minimize the possibility of a service disruption.
We have network operations centers that operate 24 hours a day, seven days a week and use both internal and external systems to effectively operate our equipment, people and sites. We interface directly with
12
telecommunications providers and have the ability to manage capacity in real time. Our network operations centers monitor the status of elements of our network on a real-time basis. All functions of our network operations centers have the ability to be managed at backup centers.
We rely on a combination of copyright, patent, trademark and trade secret laws, as well as on confidentiality procedures and non-compete agreements, to establish and protect our proprietary rights in each of our segments. We currently own approximately 130 registered patents and approximately 200 registered trademarks including several patents and trademarks that we obtained as part of our past acquisitions. Certain of our patents expired in 2010 and others will expire in 2012. We do not expect these patent expirations to have a material adverse effect on the business. Trademarks continue as long as we actively use the mark. We have approximately 220 pending patent applications pertaining to technology relating to intelligent upselling, transaction processing, call center and agent management, data collection, reporting and verification, conferencing and credit card processing. New patents that are issued have a life of 20 years from the date the patent application is initially filed. We believe the existence of these patents and trademarks, along with our ongoing processes to add additional patents and trademarks to our portfolio, may be a barrier to entry for specific products and services we provide and may also be used for defensive purposes in certain litigation.
Our International Operations
In 2010, revenue attributed to foreign countries exceeded 10% of our consolidated revenue and long-lived assets attributed to foreign countries were approximately 9% of our total consolidated long-lived assets.
Our Unified Communications segment operates out of facilities in the United States and approximately 23 foreign jurisdictions in North America, Europe and Asia.
Our Communication Services segment operates facilities in the United States, Canada, the Philippines, Mexico and Jamaica.
For additional information regarding our domestic and international revenues, see “Management’s Discussion and Analysis of Financial Condition and Results of Operations” and the Financial Statements included herewith.
Government Regulation
Privacy
The Unified Communications and Communications Services segments provide services to healthcare clients that, as providers of healthcare services, are considered “covered entities” under the Health Insurance Portability and Accountability Act of 1996 (“HIPAA”). As covered entities, our clients must comply with standards for privacy, transaction and code sets, and data security. Under HIPAA, we are sometimes considered a “business associate,” which requires that we protect the security and privacy of “protected health information” provided to us by our clients. We have implemented HIPAA and Health Information Technology for Economic and Clinical Health Act (“HITECH”) compliance training and awareness programs for our healthcare services employees. We also have undertaken an ongoing process to test data security at all relevant levels. In addition, we have reviewed physical security at all healthcare operation centers and have implemented systems to control access to all work areas.
In addition to healthcare information, our databases contain personal data of our clients’ customers, including credit card and other personal information. Most states as well as the European Union have enacted general privacy legislation requiring notification to consumers in the event of a security breach in or at our systems if the consumers’ personal information may have been compromised as a result of the breach. We have implemented processes and procedures to reduce the risk of security breaches, and have prepared plans to comply with these notification rules should a breach occur.
13
Telecommunications
Our wholly-owned subsidiary, Intrado Inc. and certain of its affiliates (collectively, “Intrado”), are subject to various regulations as a result of their status as a regulated competitive local exchange carrier, and/or an emergency services provider, and/or an inter-exchange carrier, including state utility commissions regulations and Federal Communications Commission (the “FCC”) regulations adopted under the Telecommunications Act of 1996, as amended. Also, under the New and Emerging Technologies 911 Improvement Act of 2008 (NET911 Act, P.L. 11-283, 47 U.S.C. 609) and its attendant FCC regulations (WC Docket No. 08-171, Report and Order dated Oct 21, 2008), Intrado is required to provide access to VoIP (voiceover Internet Protocol) telephony providers certain 9-1-1 and Enhanced, or E9-1-1, elements. Telecommunications providers are also responsible for providing subscriber records to emergency service providers under the Wireless Communications and Public Safety Act of 1999 (P.L. 106-81, 47 U.S.C. 615) and are subject to various federal and state regulations on wireless carriers that provide 9-1-1 or E9-1-1, services, including, but not limited to, regulations imposed by the FCC in C.C. Docket No. 94-102.
The market in which Intrado operates may also be influenced by legislation, regulation, and judicial or administrative determinations which seek to promote a national broadband plan, a nationwide public safety network, next generation services, and/or competition in local telephone markets, including 9-1-1 service as a part of local exchange service, or seek to modify the Universal Service Fee program.
Federal laws regulating the provision of traditional telecommunications services may adversely impact our conferencing business. Historically, we have treated our conferencing business as a provider of unregulated information services, and we have not submitted to FCC regulation or other regulations applicable to providers of traditional telecommunications services. On June 30, 2008 the FCC ordered that stand-alone providers of audio bridging services have a direct Universal Service Fund (“USF”) contribution obligation. The FCC ordered that conferencing providers begin to submit the appropriate forms to the Universal Service Administrative Company (“USAC”) beginning August 1, 2008. The FCC order specifically stated the order would not apply retroactively.
Any changes to these legal requirements, including those caused by the adoption of new laws and regulations or by legal challenges, could have a material adverse effect upon the market for our services and products. In particular, additional delays in implementation of the regulatory requirements imposed by the FCC on VoIP services could have a material adverse effect on our business, financial condition and results of operations.
Debt Collection and Credit Reporting
The receivable management business is regulated both at the federal and state level. The Federal Trade Commission (“FTC”) has the authority to investigate consumer complaints against debt collectors and to recommend enforcement actions and seek monetary penalties. In addition, a new Consumer Financial Protection Bureau (“CFPB”) was formed as part of the recently enacted Dodd-Frank Financial Reform Act. The CFPB has authority to regulate and bring enforcement actions against various types of financial service businesses including collection agencies. Despite the creation of this new agency, none of the enforcement authority was taken from the FTC, meaning that these two government agencies will have dual enforcement authority over the debt collection industry. Unlike the FTC, however, the CFPB has initiated rulemaking authority and new regulations impacting the collection business are likely on the horizon. The Federal Fair Debt Collection Practices Act (“FDCPA”) establishes specific guidelines and procedures that debt collectors must follow in communicating with consumer debtors, including:
| | • | | time, place and manner of communications; |
| | • | | prohibition of harassment or abuse by debt collectors; |
| | • | | restrictions on communications with third parties and specific procedures to be followed when communicating with third parties to obtain a consumer debtor’s location information; |
14
| | • | | notice and disclosure requirements; and |
| | • | | prohibition of unfair or misleading representations by debt collectors. |
Our collection business is also subject to the Fair Credit Reporting Act (“FCRA”), which regulates the consumer credit reporting. Under the FCRA, liability may be imposed on furnishers of data to credit reporting agencies to the extent that adverse credit information reported is false or inaccurate. In addition, the Telephone Consumer Protection Act (“TCPA”) which was originally intended to regulate the telemarketing industry contains certain provisions that also impact the collection industry. Most significantly, the TCPA prohibits the use of automated dialers to call cellular telephones without consent of the consumer and the potential liability for violations of this provision is substantial.
At the state level, most states require that debt collectors be licensed or registered, hold a certificate of authority and/or be bonded. To qualify for such a license or registration, the debt collector may be required to satisfy minimum capital requirements. Due in part to the 2006 recapitalization, we and our debt collection subsidiary have been required to make special arrangements with state regulators to obtain licensure. Failure to comply with license requirements may subject the debt collector to penalties and/or fines. In addition, state licensing authorities, as well as state consumer protection agencies in many cases, have the authority to investigate debtor complaints against debt collectors and to recommend enforcement actions and seek monetary penalties against debt collectors for violations of state or federal laws.
In addition to complying with the foregoing federal and state laws, West’s debt collection operations recently entered into a Stipulated Order as part of a settlement agreement that was negotiated with the FTC staff after a lengthy investigation. That Order, once approved by the Commission and the U.S. District Court for the Northern District of Georgia, Atlanta Division, will require us to comply with the FDCPA and the Federal Trade Commission Act, which will not require any procedural changes; however, violations of either law will subject the Company to a contempt action brought by the FTC in addition to the civil penalties available to private litigants. Further, the Order requires that all current employees and any new employee hired over the next five years be provided with a copy of the Order and a short statement regarding their compliance obligations. The Company is also required to maintain certain types of information and data that is subject to audit and inspection by the FTC over periods ranging from three to six years. Finally, the Company is required to include a new disclosure on all written communications to consumers that directs them to call a toll free number if they have a complaint regarding the manner in which their account was handled.
Teleservices
Teleservices sales practices are regulated at both the federal and state level. The TCPA, enacted in 1991, authorized and directed the FCC to regulate the telemarketing industry. The FCC set forth rules to implement the TCPA. These rules, which have been amended over time, currently place restrictions on the methods and timing of telemarketing sales calls as well as certain calling practices utilized in the accounts receivable management business, including:
| | • | | restrictions on calls placed by automatic dialing and announcing devices; |
| | • | | limitations on the use of predictive dialers for outbound calls; |
| | • | | institution of a National “Do-Not-Call” Registry in conjunction with the FTC; |
| | • | | guidelines on maintaining an internal “Do-Not-Call” list and honoring “Do-Not-Call” requests; |
| | • | | requirements for transmitting caller identification information; and |
| | • | | restrictions on facsimile advertising. |
The Federal Telemarketing Consumer Fraud and Abuse Act of 1994 authorized the FTC to issue regulations designed to prevent deceptive and abusive telemarketing acts and practices. The FTC’s Telemarketing Sales Rule
15
(“TSR”) became effective in January 1996 and has been amended over time. The TSR applies to most outbound telemarketing calls to consumers and portions of some inbound telemarketing calls. The TSR generally:
| | • | | prohibits a variety of deceptive, unfair or abusive practices in telemarketing sales; |
| | • | | subjects a portion of inbound calls to additional disclosure requirements; |
| | • | | prohibits the disclosure or receipt, for consideration, of unencrypted consumer account numbers for use in telemarketing; |
| | • | | mandates additional disclosure statements relating to certain products or services, and certain types of offers, especially those involving negative option features; |
| | • | | establishes additional authorization requirements for payment methods that do not have consumer protections comparable to those available under the Electronic Funds Transfer Act or the Truth in Lending Act, or for telemarketing transactions involving pre-acquired account information and free-to-pay conversion offers; |
| | • | | institutes a National “Do-Not-Call” Registry; |
| | • | | provides guidelines on maintaining an internal “Do-Not-Call” list and honoring “Do-Not-Call” requests; |
| | • | | limits the use of predictive dialers for outbound calls; and |
| | • | | restricts the use of pre-recorded message telemarketing calls. |
In addition to the federal regulations, there are numerous state statutes and regulations governing telemarketing activities. These include restrictions on the methods and timing of telemarketing calls as well as disclosures required to be made during telemarketing calls and individual state “Do-Not-Call” registries. Some states also require that telemarketers register in the state before conducting telemarketing business in the state. Such registration can be time consuming and costly. Many states have an exemption for companies which have securities that are listed on a national securities exchange. As a result of the recapitalization in 2006, our securities are no longer listed on a national securities exchange, and we are therefore unable to avail ourselves of the exemption from state telemarketer registration requirements. In addition, employees who are involved in certain industry-specific sales activity, such as activity regarding insurance or mortgage loans, are required to be licensed by various state commissions or regulatory bodies and to comply with regulations enacted by those bodies.
The industries that we serve are also subject to varying degrees of government regulation, including laws and regulations, relating to contracting with the government and data security. We are subject to some of the laws and regulations associated with government contracting as a result of our contracts with our clients and also as a result of contracting directly with the United States government and its agencies.
With respect to marketing scripts, we rely on our clients and their advisors to develop the scripts to be used by us in making consumer solicitation, on behalf of our clients. We generally require our clients to indemnify us against claims and expenses arising with respect to the scripts and products which they provide to us.
We specifically train our marketing representatives to handle calls in an approved manner. While we believe we are in compliance in all material respects with all federal and state telemarketing regulations, compliance with all such requirements is costly and time consuming. In addition, notwithstanding our compliance efforts, any failure on our part to comply with the registration and other legal requirements applicable to companies engaged in telemarketing activities could have an adverse impact on our business. We could become subject to litigation by private parties and governmental bodies, alleging a violation of applicable laws or regulations, which could result in damages, regulatory fines, penalties and possible other relief under such laws and regulations and the accompanying costs and uncertainties of such litigation and enforcement actions.
We discuss the risks associated with governmental regulation in Item 1A. “Risk Factors.”
16
We may not be able to compete successfully in our highly competitive industries, which could adversely affect our business, results of operations and financial condition.
We face significant competition in many of the markets in which we do business and expect that this competition will intensify. The principal competitive factors in our business are range of service offerings, global capabilities and price and quality of services. In addition, we believe there has been an industry trend to move agent-based operations toward offshore sites. This movement could result in excess capacity in the United States, where most of our current capacity exists. The trend toward international expansion by foreign and domestic competitors and continuous technological changes may erode profits by bringing new competitors into our markets and reducing prices. Our competitors’ products, services and pricing practices, as well as the timing and circumstances of the entry of additional competitors into our markets, could adversely affect our business, results of operations and financial condition.
Our Unified Communications segment faces technological advances and consolidation, which have contributed to pricing pressures. Competition in the web and video conferencing services arenas continues to increase as new vendors enter the marketplace and offer a broader range of conferencing solutions through new technologies, including, without limitation, Voice over Internet Protocol, on-premise solutions, private branch exchange (“PBX”) solutions, unified communications solutions and equipment and handset solutions.
Our Communication Services segment’s agent-based business and growth depend in large part on the industry trend toward outsourcing. This trend may not continue, or may continue at a slower pace, as organizations may elect to perform these services themselves. In addition, our Communication Services segment faces risks from technological advances that we may not be able to successfully address. We compete with third-party collection agencies, other financial service companies and credit originators. Some of these companies have substantially greater personnel and financial resources than we do. In addition, companies with greater financial resources than we have may elect in the future to enter the consumer debt collection business.
There are services in each of our business segments that are experiencing pricing declines. If we are unable to offset pricing declines through increased transaction volume and greater efficiency, our business, results of operations and financial condition could be adversely affected.
Increases in the cost of voice and data services or significant interruptions in these services could adversely affect our business, results of operations and financial condition.
We depend on voice and data services provided by various telecommunications providers. Because of this dependence, any change to the telecommunications market that would disrupt these services or limit our ability to obtain services at favorable rates could adversely affect our business, results of operations and financial condition. While we have entered into long-term contracts with many of our telecommunications providers, there is no obligation for these vendors to renew their contracts with us or to offer the same or lower rates in the future. In addition, these contracts are subject to termination or modification for various reasons outside of our control. An adverse change in the pricing of voice and data services that we are unable to recover through price increases of our services, or any significant interruption in voice or data services, could adversely affect our business, results of operations and financial condition.
Our business depends on our ability to keep pace with our clients’ needs for rapid technological change and systems availability.
Technology is a critical component of our business. We have invested in sophisticated and specialized computer and telephone technology and we anticipate that it will be necessary for us to continue to select, invest in and develop new and enhanced technology on a timely basis in the future in order to remain competitive. Our
17
future success depends in part on our ability to continue to develop technology solutions that keep pace with evolving industry standards and changing client demands. Introduction of new methods and technologies brings corresponding risks associated with effecting change to a complex operating environment and, in the case of adding third party services, results in a dependency on an outside technology provider.
A large portion of our revenue is generated from a limited number of clients, and the loss of one or more key clients would result in the loss of revenue.
Our 100 largest clients represented approximately 57% of our total revenue for the year ended December 31, 2010 with one client, AT&T, accounting for approximately 11% of our total revenue. Subject to advance notice requirements and a specified wind down of purchases, AT&T may terminate certain of its contracts with us with or without cause at any time. If we fail to retain a significant amount of business from AT&T or any of our other significant clients, our business, results of operations and financial condition could be adversely affected. We serve clients and industries that have experienced a significant level of consolidation in recent years. Additional consolidation could occur in which our clients could be acquired by companies that do not use our services. The loss of any significant client would result in a decrease in our revenue and could adversely affect our business, results of operations and financial condition.
Global economic conditions could adversely affect our business, results of operations and financial condition, primarily through disrupting our clients’ businesses.
The uncertain and changing global economic conditions, including disruption of financial markets, could adversely affect our business, results of operations and financial condition, primarily through disrupting our clients’ businesses. Higher rates of unemployment and lower levels of business generally adversely affect the level of demand for certain of our services. In addition, continuation or worsening of general market conditions in the United States economy or other national economies important to our businesses may adversely affect our clients’ level of spending, ability to obtain financing for purchases and ability to make timely payments to us for our services, which could require us to increase our allowance for doubtful accounts, negatively impact our days sales outstanding and adversely affect our results of operations.
Our contracts generally are not exclusive and typically do not provide for revenue commitments.
Contracts for many of our services generally enable our clients to unilaterally terminate the contract or reduce transaction volumes upon written notice and without penalty, in many cases based on our failure to attain certain service performance levels. The terms of these contracts are often also subject to renegotiation at any time. In addition, most of our contracts are not exclusive and do not ensure that we will generate a minimum level of revenue. Many of our clients also retain multiple service providers with whom we must compete. As a result, the profitability of each client program may fluctuate, sometimes significantly, throughout the various stages of a program.
Pending and future litigation may divert management’s time and attention and result in substantial costs of defense, damages or settlement, which could adversely affect our business, results of operations and financial condition.
We face uncertainties related to pending and potential litigation. We may not ultimately prevail or otherwise be able to satisfactorily resolve this litigation. In addition, other material suits by individuals or certified classes, claims, or investigations relating to our business may arise in the future. Furthermore, we generally indemnify our clients against third-party claims asserting intellectual property violations, which may result in litigation. Regardless of the outcome of any of these lawsuits or any future actions, claims or investigations relating to the same or any other subject matter, we may incur substantial defense costs and these actions may cause a diversion of management’s time and attention. Also, we may be required to alter our business practices or pay substantial
18
damages or settlement costs as a result of these proceedings, which could adversely affect our business, results of operations and financial condition. Finally, certain of the outcomes of such litigation may directly affect our business model, and thus our profitability.
We are subject to extensive regulation, which could limit or restrict our activities and impose financial requirements or limitations on the conduct of our business.
The United States Congress, the FCC and the states and foreign jurisdictions where we provide services have promulgated and enacted rules and laws that govern personal privacy, the provision of telecommunication services, telephone solicitations, the collection of consumer debt, the provision of emergency communication services and data privacy. As a result, we may be subject to proceedings alleging violation of these rules and laws in the future. Additional rules and laws may require us to modify our operations or service offerings in order to meet our clients’ service requirements effectively, and these regulations may limit our activities or significantly increase the cost of regulatory compliance.
There are numerous state statutes and regulations governing telemarketing activities that do or may apply to us. For example, some states place restrictions on the methods and timing of telemarketing calls and require that certain mandatory disclosures be made during the course of a telemarketing call. Some states also require that telemarketers register in the state before conducting telemarketing business in the state. Such registration can be time consuming and costly. We specifically train our marketing representatives to handle calls in an approved manner. While we believe we are in compliance in all material respects with all federal and state telemarketing regulations, compliance with all such requirements is costly and time consuming. In addition, notwithstanding our compliance efforts, any failure on our part to comply with the registration and other legal requirements applicable to companies engaged in telemarketing activities could have an adverse impact on our business. We could become subject to litigation by private parties and governmental bodies alleging a violation of applicable laws or regulations, which could result in damages, regulatory fines, penalties and possible other relief under such laws and regulations and the accompanying costs and uncertainties of such litigation and enforcement actions.
Security and privacy breaches of the systems we use to protect personal data could adversely affect our business, results of operations and financial condition.
Our databases contain personal data of our clients’ customers, including credit card and healthcare information. Any security or privacy breach of these databases could expose us to liability, increase our expenses relating to the resolution of these breaches and deter our clients from selecting our services. Migration by our emergency communications business to IP-based communication increases this risk. Our data security procedures may not effectively counter evolving security risks, address the security and privacy concerns of existing or potential clients or be compliant with federal, state, and local laws and regulations in all respects. For our international operations, we are obligated to implement processes and procedures to comply with local data privacy regulations. Any failures in our security and privacy measures could adversely affect our business, financial condition and results of operations.
Our technology and services may infringe upon the intellectual property rights of others. Intellectual property infringement claims would be time consuming and expensive to defend and may result in limitations on our ability to use the intellectual property subject to these claims.
Third parties have asserted in the past and may assert claims against us in the future alleging that we are violating or infringing upon their intellectual property rights. Any claims and any resulting litigation could subject us to significant liability for damages. An adverse determination in any litigation of this type could require us to design around a third party’s patent, license alternative technology from another party or reduce or modify our product and service offerings. In addition, litigation is time-consuming and expensive to defend and could result in the diversion of our time and resources. Any claims from third parties may also result in limitations on our ability to use the intellectual property subject to these claims.
19
We may not be able to adequately protect our proprietary information or technology.
Our success depends in part upon our proprietary information and technology. We rely on a combination of copyright, patent, trademark and trade secret laws, as well as on confidentiality procedures and non-compete agreements, to establish and protect our proprietary rights in each of our segments. Third parties may infringe or misappropriate our patents, trademarks, trade names, trade secrets or other intellectual property rights, which could adversely affect our business, results of operations and financial condition, and litigation may be necessary to enforce our intellectual property rights, protect our trade secrets or determine the validity and scope of the proprietary rights of others. The steps we have taken to deter misappropriation of our proprietary information and technology or client data may be insufficient to protect us, and we may be unable to prevent infringement of our intellectual property rights or misappropriation of our proprietary information. Any infringement or misappropriation could harm any competitive advantage we currently derive or may derive from our proprietary rights. In addition, because we operate in many foreign jurisdictions, we may not be able to protect our intellectual property in the foreign jurisdictions in which we operate.
Our data and operation centers are exposed to service interruption, which could adversely affect our business, results of operations and financial condition.
Our outsourcing operations depend on our ability to protect our data and operation centers against damage that may be caused by fire, natural disasters, pandemics, power failure, telecommunications failures, computer viruses, trojan horses, other malware, failures of our software, acts of sabotage or terrorism, riots and other emergencies. In addition, for some of our services, we are dependent on outside vendors and suppliers who may be similarly affected. In the past, natural disasters such as hurricanes have caused significant employee dislocation and turnover in the areas impacted. If we experience temporary or permanent employee dislocation or interruption at one or more of our data or operation centers through casualty, operating malfunction, data loss, system failure or other events, we may be unable to provide the services we are contractually obligated to deliver. As a result, we may experience a reduction in revenue or be required to pay contractual damages to some clients or allow some clients to terminate or renegotiate their contracts. Failure of our infrastructure due to the occurrence of a single event may have a disproportionately large impact on our business results. Any interruptions of this type could result in a prolonged interruption in our ability to provide our services to our clients, and our business interruption and property insurance may not adequately compensate us for any losses we may incur. These interruptions could adversely affect our business, results of operations and financial condition.
Our future success depends on our ability to retain key personnel. Our inability to continue to attract and retain a sufficient number of qualified employees could adversely affect our business, results of operations and financial condition.
Our future success depends on the experience and continuing efforts and abilities of our management team and on the management teams of our operating subsidiaries. The loss of the services of one or more of these key employees could adversely affect our business, results of operations and financial condition. A large portion of our operations also require specially trained employees. From time to time, we must recruit and train qualified personnel at an accelerated rate in order to keep pace with our clients’ demands and our resulting need for specially trained employees. If we are unable to continue to hire, train and retain a sufficient labor force of qualified employees, our business, results of operations and financial condition could be adversely affected.
Increases in labor costs and turnover rates could adversely affect our business, results of operations and financial condition.
Portions of our Communication Services segment’s agent-based services are very labor intensive and experience high personnel turnover. Significant increases in the employee turnover rate could increase recruiting and training costs and decrease operating effectiveness and productivity. Moreover, many of our employees are hired on a part-time basis, and a significant portion of our costs consists of wages to hourly workers. In July
20
2009, the federal minimum wage rate increased to $7.25 per hour. Further increases in the minimum wage or labor regulation could increase our labor costs. The introduction of any federal or state requirements relating to mandatory minimum health insurance coverage for employees could also increase our labor costs. Increases in our labor costs, costs of employee benefits or employment taxes could adversely affect our business, results of operations and financial condition.
Because we have operations in countries outside of the United States, we may be subject to political, economic and other conditions affecting these countries that could result in increased operating expenses and regulation.
We operate or rely upon businesses in numerous countries outside the United States. We may expand further into additional countries and regions. There are risks inherent in conducting business internationally, including the following:
| | • | | difficulties in staffing and managing international operations; |
| | • | | accounting (including managing internal control over financial reporting in our non-U.S. subsidiaries), tax and legal complexities arising from international operations; |
| | • | | burdensome regulatory requirements and unexpected changes in these requirements, including data protection requirements; |
| | • | | data privacy laws that may apply to the transmission of our clients’ and employees’ data to the U.S.; |
| | • | | localization of our services, including translation into foreign languages and associated expenses; |
| | • | | longer accounts receivable payment cycles and collection difficulties; |
| | • | | political and economic instability; |
| | • | | fluctuations in currency exchange rates; |
| | • | | potential difficulties in transferring funds generated overseas to the U.S. in a tax efficient manner; |
| | • | | seasonal reductions in business activity during the summer months in Europe and other parts of the world; |
| | • | | differences between the rules and procedures associated with handling emergency communications in the United States and those related to IP emergency communications originated outside of the United States; and |
| | • | | potentially adverse tax consequences. |
If we cannot manage our international operations successfully, our business, results of operations and financial condition could be adversely affected.
Changes in foreign exchange rates may adversely affect our revenue and net income attributed to foreign subsidiaries.
We conduct business in countries outside of the United States. Revenue and expense from our foreign operations are typically denominated in local currencies, thereby creating exposure to changes in exchange rates. Revenue and profit generated by our international operations will increase or decrease compared to prior periods as a result of changes in foreign currency exchange rates. Adverse changes to foreign exchange rates could decrease the value of revenue we receive from our international operations and have a material adverse impact on our business. Generally, we do not attempt to hedge our foreign currency transactions.
21
If we are unable to complete future acquisitions, our business strategy and earnings may be negatively affected.
Our ability to identify and take advantage of attractive acquisitions or other business development opportunities is an important component in implementing our overall business strategy. We may be unable to identify, finance or complete acquisitions or to do so at attractive valuations. Given the current illiquid capital markets, we may not be able to borrow sufficient additional funds, which may adversely affect our acquisition strategy.
If we are unable to integrate or achieve the objectives of our recent and future acquisitions, our overall business may suffer.
Our business strategy depends on successfully integrating the assets, operations and corporate functions of businesses we have acquired and any additional businesses we may acquire in the future. The acquisition of additional businesses involves integration risks, including:
| | • | | the diversion of management’s time and attention away from operating our business to acquisition and integration challenges; |
| | • | | the unanticipated loss of key employees of the acquired businesses; |
| | • | | the potential need to implement or remediate controls, procedures and policies appropriate for a larger company at businesses that prior to the acquisition lacked these controls, procedures and policies; |
| | • | | the need to integrate accounting, information management, human resources, contract and intellectual property management and other administrative systems at each business to permit effective management; and |
| | • | | our entry into markets or geographic areas where we may have limited or no experience. |
We may be unable to effectively or efficiently integrate businesses we have acquired or may acquire in the future without encountering the difficulties described above. Failure to integrate these businesses effectively could adversely affect our business, results of operations and financial condition.
In addition to this integration risk, our business, results of operations and financial condition could be adversely affected if we are unable to achieve the planned objectives of an acquisition. The inability to achieve our planned objectives could result from:
| | • | | the financial underperformance of these acquisitions; |
| | • | | the loss of key clients of the acquired business, which may drive financial underperformance; and |
| | • | | the occurrence of unanticipated liabilities or contingencies for which we are unable to receive indemnification from the prior owner of the business. |
Potential future impairments of our substantial goodwill, intangible assets, or other long-lived assets could adversely affect our business, results of operations and financial condition.
As of December 31, 2010, we had goodwill and intangible assets, net of accumulated amortization, of approximately $1.6 billion and $299.7 million, respectively. Management is required to exercise significant judgment in identifying and assessing whether impairment indicators exist, or if events or changes in circumstances have occurred, including market conditions, operating results, competition and general economic conditions.During 2010, the Company identified impairment indicators in one of our reporting units, our traditional direct response business (marketed as “West Direct”). As a result of these impairment indicators and the results of impairment tests performed using the discounted cash flows model, goodwill with a carrying value of $37.7 million was written down to the fair value of zero. The impairment charge primarily resulted from the decline in revenue in 2010 and continued general decline in the direct response business. These events caused us
22
to revise downward our projected future cash flows for this reporting unit. The impairment charge was recorded in SG&A and is non-deductible for tax purposes. Any changes in key assumptions about the business units and their prospects or changes in market conditions or other externalities could result in an impairment charge, and such a charge could have a material adverse effect on our business, results of operations and financial condition. Our receivables management reporting unit, which has approximately $225.6 million ofgoodwill, is our reporting unit with the least amount of cushion between its fair value and carrying value. See “Management’s Discussion and Analysis of Financial Condition and Results of Operations—Critical Accounting Policies—Goodwill and Intangible Assets.”
Our ability to recover consumer receivables on behalf of our clients may be limited under federal and state laws, which could limit our ability to recover on consumer receivables regardless of any act or omission on our part.
Federal and state consumer protection, privacy and related laws and regulations extensively regulate the relationship between debt collectors and debtors. Federal and state laws may limit our ability to recover on our client’s consumer receivables regardless of any act or omission on our part. In addition, we recently entered into a Stipulated Order as part of a settlement agreement with the Federal Trade Commission that would impose duties upon us beyond those of current Federal and state laws. For example, for a period of 5 years from the date of entry of the Order, we must include a special disclosure on all written communications sent to consumers in connection with the collection of debts. The disclosure advises the consumer of certain rights they have under the FDCPA, provides a phone number and address at West to which the consumer can direct a complaint, and also provides contact information for the FTC if the consumer wishes to file a complaint with the Commission. In addition, for a period of 5 years, we must provide a special notice to all employees that advises the individual of certain requirements under the FDCPA including notice that individual collectors can be liable for violations of the Act. Each employee must sign an acknowledgement that he or she has received and read the notice and we must maintain copies of the acknowledgements to verify our compliance. Additional consumer protection and privacy protection laws may be enacted that would impose additional or more stringent requirements on the enforcement of and collection on consumer receivables. In addition, federal and state governments are considering, and may consider in the future, other legislative proposals that would further regulate the collection of consumer receivables. Any failure to comply with any current or future laws applicable to us could limit our ability to collect on our clients’ charged-off consumer receivable portfolios, which could adversely affect our business, results of operations and financial condition.
We may not be able to generate sufficient cash to service all of our indebtedness and fund our other liquidity needs, and we may be forced to take other actions, which may not be successful, to satisfy our obligations under our indebtedness.
At December 31, 2010, our aggregate long-term indebtedness was $3,533.6 million. In 2010, our consolidated interest expense was approximately $252.7 million. Our ability to make scheduled payments or to refinance our debt obligations and to fund our other liquidity needs depends on our financial and operating performance, which is subject to prevailing economic and competitive conditions and to certain financial, business and other factors beyond our control. We cannot make assurances that we will maintain a level of cash flows from operating activities sufficient to permit us to pay the principal, premium, if any, and interest on our indebtedness and to fund our other liquidity needs.
If our cash flows and capital resources are insufficient to fund our debt service obligations and keep us in compliance with the covenants under our senior secured credit facilities or to fund our other liquidity needs, we may be forced to reduce or delay capital expenditures, sell assets or operations, seek additional capital or restructure or refinance our indebtedness. We cannot ensure that we would be able to take any of these actions, that these actions would be successful and permit us to meet our scheduled debt service obligations or that these actions would be permitted under the terms of our existing or future debt agreements, including our senior secured credit facilities or the indentures that govern our outstanding notes. Our senior secured credit facilities
23
documentation and the indentures that govern the notes restrict our ability to dispose of assets and use the proceeds from the disposition. As a result, we may not be able to consummate those dispositions or use the proceeds to meet our debt service or other obligations, and any proceeds that are available may not be adequate to meet any debt service or other obligations then due.
If we cannot make scheduled payments on our debt, we will be in default and, as a result:
| | • | | our debt holders could declare all outstanding principal and interest to be due and payable; |
| | • | | the lenders under our senior secured credit facilities could terminate their commitments to lend us money and foreclose against the assets securing our borrowings; and |
| | • | | we could be forced into bankruptcy or liquidation. |
Our current or future indebtedness could impair our financial condition and reduce the funds available to us for other purposes, and our failure to comply with the covenants contained in our senior secured credit facilities documentation or the indentures that govern our outstanding notes could result in an event of default that could adversely affect our results of operations.
Our current or future indebtedness could adversely affect our business, results of operations or financial condition, including the following:
| | • | | our ability to obtain additional financing in the future for working capital, capital expenditures, acquisitions, product development, general corporate purposes or other purposes may be impaired; |
| | • | | a significant portion of our cash flow from operations may be dedicated to the payment of interest and principal on our indebtedness, which will reduce the funds available to us for our operations, capital expenditures, future business opportunities or other purposes; |
| | • | | the debt service requirements of our other indebtedness could make it more difficult for us to satisfy our financial obligations; |
| | • | | because we may be more leveraged than some of our competitors, our debt may place us at a competitive disadvantage; |
| | • | | our leverage will increase our vulnerability to economic downturns and limit our ability to withstand adverse events in our business by limiting our financial alternatives; and |
| | • | | our ability to capitalize on significant business opportunities and to plan for, or respond to, competition and changes in our business may be limited. |
Our debt agreements contain, and any agreements to refinance our debt likely will contain, financial and restrictive covenants that limit our ability to incur additional debt, including to finance future operations or other capital needs, and to engage in other activities that we may believe are in our long-term best interests, including to dispose of or acquire assets. Our failure to comply with these covenants may result in an event of default, which, if not cured or waived, could accelerate the maturity of our indebtedness or result in modifications to our credit terms. If our indebtedness is accelerated, we may not have sufficient cash resources to satisfy our debt obligations and we may not be able to continue our operations as planned.
We had a negative net worth as of December 31, 2010, which may make it more difficult and costly for us to obtain financing in the future and may otherwise negatively impact our business.
As of December 31, 2010, we had a negative net worth of $2,543.5 million. Our negative net worth primarily resulted from the incurrence of indebtedness to finance our recapitalization in 2006. As a result of our negative net worth, we may face greater difficulty and expense in obtaining future financing than we would face if we had a greater net worth, which may limit our ability to meet our needs for liquidity or otherwise compete effectively in the marketplace.
24
Despite our current indebtedness levels and the restrictive covenants set forth in agreements governing our indebtedness, we and our subsidiaries may still incur significant additional indebtedness, including secured indebtedness. Incurring additional indebtedness could increase the risks associated with our substantial indebtedness.
Subject to the restrictions in our debt agreements, we and certain of our subsidiaries may incur significant additional indebtedness, including additional secured indebtedness. Although the terms of our debt agreements contain restrictions on the incurrence of additional indebtedness, these restrictions are subject to a number of qualifications and exceptions, and additional indebtedness incurred in compliance with these restrictions could be significant. As of December 31, 2010, under the terms of our debt agreements, we would be permitted to incur up to approximately $831.4 million of additional tranches of term loans or increases to the revolving credit facility. If new debt is added to our and our subsidiaries’ current debt levels, the related risks that we face could increase.
| ITEM 1B. | UNRESOLVED STAFF COMMENTS |
None.
We own our corporate headquarters facility in Omaha, Nebraska. We also own two other facilities in Omaha, Nebraska used for administrative activities. Our principal operating locations are noted below.
| | | | | | | | |
Operating Segment | | Owned / Leased | | Principal Activities | | Number of States
in Which
Properties are
Located | | Number of Foreign
Countries in
Which Properties
are Located |
Unified Communications | | Owned | | Administration | | 2 | | — |
| | | | |
Unified Communications | | Owned | | Production | | 1 | | — |
| | | | |
Unified Communications | | Leased | | Administration /
Sales | | 17 | | 20 |
| | | | |
Unified Communications | | Leased | | Production | | 2 | | 2 |
| | | | |
Communication Services | | Owned | | Administration | | 1 | | — |
| | | | |
Communication Services | | Owned | | Production | | 3 | | — |
| | | | |
Communication Services | | Leased | | Administration | | 9 | | 1 |
| | | | |
Communication Services | | Leased | | Production | | 21 | | 4 |
Unified Communications has locations in Australia, Belgium, Canada, China, Denmark, Finland, France, Germany, Hong Kong, India, Italy, Japan, Malaysia, Mexico, Netherlands, New Zealand, Singapore, Spain, Sweden and the United Kingdom. Communication Services locations in foreign countries include Canada, Jamaica, Mexico, Australia and the Philippines.
We believe that our facilities are adequate for our current requirements and that additional space will be available as required. See Note 6 of the Notes to Consolidated Financial Statements included elsewhere in this report for information regarding our lease obligations.
In the ordinary course of business, we and certain of our subsidiaries are defendants in various litigation matters and are subject to claims from our clients for indemnification, some of which may involve claims for damages that are substantial in amount. We do not believe the disposition of claims currently pending will have a material adverse effect on our financial position, results of operations or cash flows.
25
PART II
| ITEM 5. | MARKET FOR REGISTRANT’S COMMON EQUITY, RELATED STOCKHOLDER MATTERS AND ISSUER PURCHASES OF EQUITY SECURITIES |
Our outstanding common stock is privately held, and there is no established public trading market for our common stock. As of February 14, 2011, there were 73 holders of record of our Class A and/or Class L common stock.
We are subject to certain restrictions regarding the payment of cash dividends to our shareholders under our credit agreement and indentures. No cash dividends have been declared with respect to our Class A common stock or our Class L common stock during the years ended December 31, 2010 or 2009.
Stock option activity and restricted stock grants under our Executive Incentive Plan for the years ended December 31, 2010, 2009 and 2008 are set forth in Note 14 to the Consolidated Financial Statements included elsewhere in this report. During 2010, 106,277 Class A shares were purchased by the Company.
During the year ended December 31, 2010, we granted 2,500 shares of restricted Class A common stock for a fair value of $9.04 per share. During the year ended December 31, 2010, we granted employee stock options to purchase an aggregate of 235,000 shares of our Class A common stock with an exercise price of $9.04 per share. An aggregate of 78,400 shares have been issued upon the exercise of stock options for an aggregate consideration of $156,424 during the same period. An aggregate of 65,024 shares of Class A common stock and 8,128 shares of Class L common stock were issued upon the exercise of 8,128 equity strips during the year ended December 31, 2010 for an aggregate consideration of $268,224. In addition, an aggregate of 70,569 shares of Class A common stock and 8,821 shares of Class L common stock were issued upon distribution from the Deferred Compensation Plan during the same period. The shares of common stock issued upon exercise of options were issued pursuant to written compensatory plans or arrangements in reliance on the exemptions provided by either Section 4(2) of the Securities Act or Rule 701 promulgated under Section 3(b) of the Securities Act.
26
| ITEM 6. | SELECTED CONSOLIDATED FINANCIAL DATA |
The following table sets forth, for the periods presented and at the dates indicated, our selected historical consolidated financial data. The selected consolidated historical operations statement and balance sheet data have been derived from our historical consolidated financial statements. Our consolidated financial statements as of December 31, 2010 and 2009 and for the years ended December 31, 2010, 2009 and 2008, which have been audited by Deloitte & Touche LLP, an independent registered public accounting firm, are included elsewhere in this annual report. The information is qualified in its entirety by the detailed information included elsewhere in this annual report and should be read in conjunction with “Management’s Discussion and Analysis of Financial Condition and Results of Operations, “Business” and the “Consolidated Financial Statements and Notes” thereto included elsewhere in this annual report.
| | | | | | | | | | | | | | | | | | | | |
| | | Year ended December 31, | |
| | | 2010 | | | 2009 | | | 2008 | | | 2007 | | | 2006 | |
| | | (amounts in thousands) | |
Operations Statement Data: | | | | | | | | | | | | | | | | | | | | |
Revenue | | $ | 2,388,211 | | | $ | 2,375,748 | | | $ | 2,247,434 | | | $ | 2,099,492 | | | $ | 1,856,038 | |
Cost of services | | | 1,057,008 | | | | 1,067,777 | | | | 1,015,028 | | | | 912,389 | | | | 818,522 | |
Selling, general and administrative expenses (“SG&A”) | | | 911,022 | | | | 907,358 | | | | 881,586 | | | | 840,532 | | | | 800,301 | |
| | | | | | | | | | | | | | | | | | | | |
Operating income | | | 420,181 | | | | 400,613 | | | | 350,820 | | | | 346,571 | | | | 237,215 | |
Interest expense | | | (252,724 | ) | | | (254,103 | ) | | | (313,019 | ) | | | (332,372 | ) | | | (94,804 | ) |
Refinancing expense | | | (52,804 | ) | | | — | | | | — | | | | — | | | | — | |
Other income (expense) | | | 6,127 | | | | 1,326 | | | | (8,621 | ) | | | 13,396 | | | | 8,144 | |
| | | | | | | | | | | | | | | | | | | | |
Income before income tax expense | | | 120,780 | | | | 147,836 | | | | 29,180 | | | | 27,595 | | | | 150,555 | |
Income tax expense | | | 60,476 | | | | 56,862 | | | | 11,731 | | | | 6,814 | | | | 65,505 | |
| | | | | | | | | | | | | | | | | | | | |
Net income | | | 60,304 | | | | 90,974 | | | | 17,449 | | | | 20,781 | | | | 85,050 | |
Less net income (loss)—noncontrolling interest | | | — | | | | 2,745 | | | | (2,058 | ) | | | 15,399 | | | | 16,287 | |
| | | | | | | | | | | | | | | | | | | | |
Net income—West Corporation | | $ | 60,304 | | | $ | 88,229 | | | $ | 19,507 | | | $ | 5,382 | | | $ | 68,763 | |
| | | | | | | | | | | | | | | | | | | | |
Earnings (loss) per common share: | | | | | | | | | | | | | | | | | | | | |
Basic Class L shares | | $ | 17.07 | | | $ | 17.45 | | | $ | 12.78 | | | $ | 11.08 | | | $ | 2.05 | |
Diluted Class L shares | | $ | 16.37 | | | $ | 16.67 | | | $ | 12.24 | | | $ | 10.68 | | | $ | 1.98 | |
Basic Class A shares | | $ | (1.25 | ) | | $ | (0.98 | ) | | $ | (1.23 | ) | | $ | (1.20 | ) | | $ | 0.66 | |
Diluted Class A shares | | $ | (1.25 | ) | | $ | (0.98 | ) | | $ | (1.23 | ) | | $ | (1.20 | ) | | $ | 0.64 | |
| |
Selected Operating Data: | | | (amounts in thousands) | |
Net cash flows from operating activities | | $ | 312,829 | | | $ | 272,857 | | | $ | 287,381 | | | $ | 263,897 | | | $ | 215,739 | |
Net cash flows used in investing activities | | $ | (137,896 | ) | | $ | (112,615 | ) | | $ | (597,539 | ) | | $ | (454,946 | ) | | $ | (812,253 | ) |
Net cash flows (used in) from financing activities | | $ | (133,651 | ) | | $ | (271,844 | ) | | $ | 341,971 | | | $ | 118,106 | | | $ | 780,742 | |
Operating margin (1) | | | 17.6 | % | | | 16.9 | % | | | 15.6 | % | | | 16.5 | % | | | 12.8 | % |
Net income margin (2) | | | 2.5 | % | | | 3.7 | % | | | 0.9 | % | | | 0.3 | % | | | 3.7 | % |
| (1) | Operating margin represents operating income as a percentage of revenue. |
| (2) | Net income margin represents net income—West Corporation as a percentage of revenue. |
27
| | | | | | | | | | | | | | | | | | | | |
| | | As of December 31, | |
| | | 2010 | | | 2009 | | | 2008 | | | 2007 | | | 2006 | |
| | | (amounts in thousands) | |
Balance Sheet Data: | | | | |
Working capital | | $ | 213,465 | | | $ | 175,007 | | | $ | 211,410 | | | $ | 187,795 | | | $ | 128,570 | |
Property and equipment, net | | | 341,366 | | | | 333,267 | | | | 320,152 | | | | 298,645 | | | | 294,707 | |
Total assets | | | 3,005,250 | | | | 3,045,262 | | | | 3,314,789 | | | | 2,846,490 | | | | 2,535,856 | |
Total debt | | | 3,533,566 | | | | 3,633,928 | | | | 3,946,127 | | | | 3,596,691 | | | | 3,287,246 | |
Class L common stock | | | 1,504,445 | | | | 1,332,721 | | | | 1,158,159 | | | | 1,029,782 | | | | 903,656 | |
Stockholders’ deficit | | | (2,543,500 | ) | | | (2,424,465 | ) | | | (2,360,747 | ) | | | (2,227,198 | ) | | | (2,117,255 | ) |
| | | | | |
Other Financial Data: | | | | | | | | | | | | | | | | | | | | |
Capital Expenditures | | $ | 122,049 | | | $ | 122,668 | | | $ | 108,765 | | | $ | 103,647 | | | $ | 113,895 | |
Ratio of earnings to fixed
charges (3) | | | 1.5x | | | | 1.5x | | | | 1.1x | | | | 1.1x | | | | 2.4x | |
Debt (4) | | $ | 3,533,566 | | | $ | 3,633,243 | | | $ | 3,857,650 | | | $ | 3,476,380 | | | $ | 3,200,000 | |
| (3) | For purposes of calculating the ratio of earnings to fixed charges, earnings consist of income before income taxes and noncontrolling interest plus fixed charges. Fixed charges include interest expense, amortization of debt issuance costs, and the portion of rental expense representative of the interest factor. |
| (4) | Debt excludes portfolio notes payable. |
| ITEM 7. | MANAGEMENT’S DISCUSSION AND ANALYSIS OF FINANCIAL CONDITION AND RESULTS OF OPERATIONS |
Business Overview
We are a leading provider of technology-driven, voice and data solutions. We offer our clients a broad range of communications and network infrastructure solutions that help them manage or support critical communications. The scale and processing capacity of our proprietary technology platforms, combined with our world-class expertise and processes in managing telephony and human capital, enable us to provide our clients with premium outsourced communications solutions. Our automated service and conferencing solutions are designed to improve our clients’ cost structure and provide reliable, high-quality services. Our solutions also help deliver mission-critical services, such as public safety and emergency communications. We serve Fortune 1000 companies and other clients in a variety of industries, including telecommunications, banking, retail, financial services, technology and healthcare, and have sales and operations in the United States, Canada, Europe, the Middle East, Asia Pacific and Latin America.
Since our founding in 1986, we have invested significantly to expand our technology platforms and develop our operational processes to meet the complex communication needs of our clients. We have evolved into a predominantly automated processor of voice and data transactions and a provider of network infrastructure solutions. In 2010, we grew revenue by 0.5% over 2009 to $2,388.2 million and generated $654.7 million in adjusted EBITDA, or 27.4% margins, $60.3 million in net income and $312.8 million in cash flows from operating activities. See “Selected Consolidated Financial Data.”
Investing in technology and developing specialized expertise in the industries we serve are critical components to our strategy of enhancing our services and delivering operational excellence. In 2010, we managed approximately 24.0 billion telephony minutes and over 115 million conference calls, facilitated over 240 million 9-1-1 calls, and delivered over 720 million notification calls and data messages. With approximately 608,000 telephony ports to handle conference calls, alerts and notifications and customer service, we believe our platforms provide scale and flexibility to handle greater transaction volume than our competitors, offer superior service and develop new offerings. These ports include approximately 256,000 Internet Protocol (“IP”) ports, which we believe provide us with the only large-scale proprietary IP-based global conferencing platform deployed and in use today. Our technology-driven platforms allow us to provide a broad range of complementary automated and agent-based service offerings to our diverse client base.
28
Financial Operations Overview
Revenue
In our Unified Communications segment, our conferencing and collaboration services are generally billed on a per participant minute or per seat basis and our alerts and notifications services are generally billed on a per message or per minute basis. Billing rates for these services vary depending on participant geographic location, type of service (such as audio, video or web conferencing) and type of message (such as voice, text, email or fax). We also charge clients for additional features, such as conference call recording or transcription services. Since we entered the conferencing services business, the average rate per minute that we charge has declined while total minutes sold has increased. This is consistent with industry trends. We expect this trend to continue for the foreseeable future.
In our Communication Services segment, our emergency communications solutions are generally billed per month based on the number of billing telephone numbers or cell towers covered under each client contract. We also bill monthly for our premise-based database solution. In addition, we bill for sales, installation and maintenance of our communication equipment technology solutions. Our automated and agent-based customer service solutions are generally billed on a per minute or per hour basis. We are generally paid on a contingent fee basis for our receivables management and overpayment identification and recovery services as well as for certain other agent-based services.
Cost of Services
The principal component of cost of services for our Unified Communications segment is our variable telephone expense. Significant components of our cost of services in this segment also include labor expense, primarily related to commissions for our sales force. Because the services we provide in this segment are largely automated, labor expense is less significant than the labor expense we experience in our Communication Services segment.
The principal component of cost of services for our Communication Services segment is labor expense. Labor expense included in costs of services primarily reflects compensation for the agents providing our agent-based services, but also includes compensation for personnel dedicated to emergency communications database management, manufacturing and development of our premise-based public safety solution as well as collection expenses, such as costs of letters and postage, incurred in connection with our receivables management. We generally pay commissions to sales professionals on both new sales and incremental revenue generated from existing clients. Significant components of our cost of services in this segment also include variable telephone expense.
Selling, General and Administrative Expenses
The principal component of our selling, general and administrative expenses (“SG&A”) is salary and benefits for our sales force, client support staff, technology and development personnel, senior management and other personnel involved in business support functions. SG&A also includes certain fixed telephone costs as well as other expenses that support the ongoing operation of our business, such as facilities costs, certain service contract costs, equipment depreciation and maintenance, and amortization of finite-lived intangible assets.
Key Drivers Affecting Our Results of Operations
Factors Related to Our Indebtedness. In connection with our recapitalization in 2006, we incurred a significant amount of additional indebtedness. Accordingly, our interest expense has increased significantly over the period since the recapitalization. During 2009 and 2010, in order to improve our debt maturity profile, we extended the maturity for $1.5 billion of our existing term loans from October 24, 2013 to July 15, 2016, repaid
29
$500.0 million of our term loans due October 24, 2013 with the proceeds of a new $500.0 million 8 5/8% senior notes offering with a maturity date of October 1, 2018 and refinanced $650.0 million of senior notes due October 2014 with the proceeds of a new $650.0 million 7 7/8% senior notes offering with a maturity date of January 15, 2019.
Evolution to Automated Technologies.As we have continued our evolution into a diversified and automated technology-driven service provider, our revenue from automated services businesses has grown from 37% of total revenue in 2005 to 67.8% in 2010 and our operating income from automated services businesses has grown from 53% of total operating income to 95% over the same period.
Acquisition Activities. Identifying and successfully integrating acquisitions of value-added service providers has been a key component of our growth strategy. We will continue to seek opportunities to expand our capabilities across industries and service offerings. We expect this will occur through a combination of organic growth, as well as strategic partnerships, alliances and acquisitions to expand into new service offerings as well as into new industries. Since 2005, we have invested approximately $1.7 billion in strategic acquisitions. We believe there are acquisition candidates that will enable us to expand our capabilities and markets and intend to continue to evaluate acquisitions in a disciplined manner and pursue those that provide attractive opportunities to enhance our growth and profitability.
Overview of 2010 Results
The following overview highlights the areas we believe are important in understanding our results of operations for the year ended December 31, 2010. This summary is not intended as a substitute for the detail provided elsewhere in this annual report, our consolidated financial statements or our condensed consolidated financial statements and notes thereto included elsewhere in this annual report.
| | • | | During September 2010, we identified impairment indicators in one of our reporting units, our traditional direct response business (marketed as “West Direct”). As a result of these impairment indicators and the impairment tests performed, a non-cash charge of $37.7 million, which represents the balance of goodwill for the reporting unit, was recorded. This impairment charge is not deductible for income tax purposes. The impairment primarily resulted from the decline in revenue in 2010 and continued general decline in the direct response business. |
| | • | | On October 5, 2010, we amended and restated our credit agreement, which modified our senior secured credit facilities in several respects, including: extending the maturity of approximately $158 million of our $250 million senior secured revolving credit facility (and securing approximately $43 million of additional senior secured revolving credit facility commitments for the extended term) from October 2012 to January 2016 with the interest rate margins of such extended maturity revolving credit loans increasing by 1.00 percent; extending the maturity of $500 million of our senior secured term loan facility from October 2013 to July 2016, with the interest rate margins of such extended senior secured term loans increasing by 1.875 percent; increasing the interest rate margins of approximately $984.6 million of our senior secured term loan facility due July 2016 by 0.375 percent to match the interest rate margins for the newly extended senior secured term loans; and modifying the step-down schedule in the current financial covenants and certain covenant baskets. On October 5, 2010, we issued $500.0 million 8 5/8% Senior Notes due 2018, and used the gross proceeds of the notes issuance to repay $500.0 million of our senior secured term loan facility due 2013. Accelerated amortization of debt acquisition costs, recorded as refinancing expense, for this amendment and restatement was $6.8 million. |
| | • | | On November 24, 2010, we issued $650.0 million 7 7/8% senior notes due 2019, and used the gross proceeds to repurchase our $650 million 9.5% senior notes due 2014. Accelerated amortization of debt acquisition costs, recorded as refinancing expense was $12.6 million. Redemption premiums and other costs, also recorded as refinancing expense, were $33.4 million. |
30
| | • | | Total revenue increased $12.5 million, or 0.5%, in 2010, as compared to total revenue in 2009. This increase included revenue from acquired or sold entities of $19.3 million and organic growth within the Unified Communications segment of $70.4 million, partially offset by declining call volumes resulting in reduced revenue of $83.8 million in our agent-based services. The Communication Services segment recorded impairment charges of $25.5 million to establish a valuation allowance against the carrying value of portfolio receivables in 2009. No valuation allowance was required or recorded in 2010. |
| | • | | Operating income increased $19.6 million, or 4.9%, in 2010 compared to operating income in 2009. |
| | • | | Our Adjusted EBITDA increased to $654.7 million in 2010, compared to $647.9 million in 2009, an increase of 1.0%. |
| | • | | In December 2010, we sold the balance of our investment in receivable portfolios for $6.6 million and no longer participate in purchased receivables collection. |
For further information regarding the computation of Adjusted EBITDA in accordance with the terms of our credit facilities, see “—Liquidity and Capital Resources—Debt Covenants” below.
The following table sets forth our Consolidated Statement of Operations Data as a percentage of revenue for the periods indicated:
| | | | | | | | | | | | |
| | | Year ended December 31, | |
| | | 2010 | | | 2009 | | | 2008 | |
Revenue | | | 100.0 | % | | | 100.0 | % | | | 100.0 | % |
Cost of services | | | 44.3 | | | | 44.9 | | | | 45.2 | |
Selling, general and administrative expenses (“SG&A”): | | | 38.1 | | | | 38.2 | | | | 39.2 | |
| | | | | | | | | | | | |
Operating income | | | 17.6 | | | | 16.9 | | | | 15.6 | |
Interest expense | | | 10.6 | | | | 10.7 | | | | 13.9 | |
Refinancing expense | | | 2.2 | | | | — | | | | — | |
Other income (expense) | | | 0.3 | | | | — | | | | (0.4 | ) |
| | | | | | | | | | | | |
Income before income tax expense and noncontrolling interest | | | 5.1 | | | | 6.2 | | | | 1.3 | |
Income tax expense | | | 2.6 | | | | 2.4 | | | | 0.5 | |
| | | | | | | | | | | | |
Net income | | | 2.5 | | | | 3.8 | | | | 0.8 | |
Less net income (loss)—noncontrolling interest | | | — | | | | 0.1 | | | | (0.1 | ) |
| | | | | | | | | | | | |
Net Income—West Corporation | | | 2.5 | % | | | 3.7 | % | | | 0.9 | % |
| | | | | | | | | | | | |
Years Ended December 31, 2010 and 2009
Revenue: Total revenue in 2010 increased $12.5 million, or 0.5%, to $2,388.2 million from $2,375.7 million in 2009. This increase included net revenue of $19.3 million from entities acquired or sold, $31.7 million for acquired entities, less $12.4 million for an entity sold. Acquisitions made in 2010 were of Stream57 assets, SKT, Holly, TuVox and Specialty Pharmacy Network. These acquisitions closed on December 31, 2009, April 1, 2010, June 1, 2010, July 21, 2010 and November 9, 2010, respectively. Revenue from agent-based services decreased $83.8 million in 2010, including a $5.5 million reduction in purchased paper revenue compared to 2009. During 2009, the Communication Services segment recorded impairment charges of $25.5 million to establish a valuation allowance against the carrying value of portfolio receivables. During 2010, no valuation allowance was required or recorded.
During the years ended December 31, 2010 and 2009, our largest 100 clients represented approximately 57% and 56% of total revenue, respectively. The aggregate revenue from our largest client, AT&T, as a percentage of our total revenue in 2010 and 2009 was approximately 11% and 12%, respectively. No other client accounted for more than 10% of our total revenue in 2010 or 2009.
31
Revenue by business segment:
| | | | | | | | | | | | | | | | | | | | | | | | |
| | | For the year ended December 31, | |
| | | 2010 | | | % of Total
Revenue | | | 2009 | | | % of Total
Revenue | | | Change | | | % Change | |
Revenue in thousands: | | | | | | | | | | | | | | | | | | | | | | | | |
Unified Communications | | $ | 1,220,216 | | | | 51.1 | % | | $ | 1,126,544 | | | | 47.4 | % | | $ | 93,672 | | | | 8.3 | % |
Communication Services | | | 1,173,945 | | | | 49.2 | % | | | 1,254,547 | | | | 52.8 | % | | | (80,602 | ) | | | -6.4 | % |
Intersegment eliminations | | | (5,950 | ) | | | -0.3 | % | | | (5,343 | ) | | | -0.2 | % | | | (607 | ) | | | 11.4 | % |
| | | | | | | | | | | | | | | | | | | | | | | | |
Total | | $ | 2,388,211 | | | | 100.0 | % | | $ | 2,375,748 | | | | 100.0 | % | | $ | 12,463 | | | | 0.5 | % |
| | | | | | | | | | | | | | | | | | | | | | | | |
Unified Communications revenue in 2010 increased $93.7 million, or 8.3%, to $1,220.2 million from $1,126.5 million in 2009. The increase in revenue included $23.3 million from the acquisition of Stream57 assets and SKT. The remaining $70.4 million increase was attributable to organic growth. Since we entered the conferencing services business, the average rate per minute that we charge has declined while total minutes sold has increased. This is consistent with industry trends which we expect to continue for the foreseeable future. During 2010, revenue in the Asia Pacific (“APAC”) and Europe, Middle East and Africa (“EMEA”) regions grew to $383.5 million, an increase of 14.3% over 2009.
Communication Services revenue in 2010 decreased $80.6 million, or 6.4%, to $1,173.9 million from $1,254.5 million in 2009. The decrease in revenue in 2010 is primarily the result of decreased revenue from our agent-based services including the reduction in revenue from purchased paper operations resulting from our decision in 2009 to discontinue portfolio receivable purchases. Our 2010 revenues were reduced by $12.4 million as a result of the sale of our Public Safety CAD business in December of 2009. Revenue from agent-based services decreased $83.8 million, including a $5.5 million reduction in purchase paper revenue compared to 2009.
Cost of Services: Cost of services consists of direct labor, telephone expense and other costs directly related to providing services to clients. Cost of services in 2010 decreased $10.8 million, or 1.0%, to $1,057.0 million from $1,067.8 million in 2009. Cost of services from entities acquired or sold was $0.5 million. As a percentage of revenue, cost of services decreased to 44.2% for 2010 from 44.9% in 2009.
Cost of Services by business segment:
| | | | | | | | | | | | | | | | | | | | | | | | |
| | | For the year ended December 31, | |
| | | 2010 | | | % of Revenue | | | 2009 | | | % of Revenue | | | Change | | | % Change | |
Cost of services in thousands: | | | | | | | | | | | | | | | | | | | | | | | | |
Unified Communications | | $ | 492,263 | | | | 40.3 | % | | $ | 422,189 | | | | 37.5 | % | | $ | 70,074 | | | | 16.6 | % |
Communication Services | | | 569,110 | | | | 48.5 | % | | | 649,195 | | | | 51.7 | % | | | (80,085 | ) | | | -12.3 | % |
Intersegment eliminations | | | (4,365 | ) | | | NM | | | | (3,607 | ) | | | NM | | | | (758 | ) | | | 21.0 | % |
| | | | | | | | | | | | | | | | | | | | | | | | |
Total | | $ | 1,057,008 | | | | 44.3 | % | | $ | 1,067,777 | | | | 44.9 | % | | $ | (10,769 | ) | | | -1.0 | % |
| | | | | | | | | | | | | | | | | | | | | | | | |
NM—Not Meaningful
Unified Communications cost of services in 2010 increased $70.1 million, or 16.6%, to $492.3 million from $422.2 million in 2009. Cost of services from acquired entities increased cost of services by $12.1 million. The remaining increase is primarily driven by increased service volume. As a percentage of this segment’s revenue, Unified Communications cost of services increased to 40.3% in 2010 from 37.5% in 2009, primarily due to changes in the product and geographic mix.
32
Communication Services cost of services in 2010 decreased $80.1 million, or 12.3%, to $569.1 million from $649.2 million in 2009. The decrease is primarily driven by decreased service volume. As a percentage of revenue, Communication Services cost of services decreased to 48.5% in 2010 from 51.7% in 2009. The impact of the valuation allowance on Communication Services cost of services as a percentage of revenue in 2009 was 100 basis points.
Selling, General and Administrative Expenses:SG&A expenses in 2010 increased $3.7 million, or 0.4%, to $911.0 million from $907.4 million for 2009. The increase included $17.8 million of additional expense from acquired entities. During 2010, the Company identified impairment indicators in one of our reporting units, our traditional direct response business (marketed as “West Direct”). As a result of these impairment indicators and the results of impairment tests performed using the discounted cash flows model, goodwill with a carrying value of $37.7 million was written down to the fair value of zero. The impairment primarily resulted from the decline in revenue in 2010 and continued general decline in the direct response business. These events caused us to revise downward our projected future cash flows for this reporting unit. As a percentage of revenue, SG&A expenses decreased to 38.1% in 2010 from 38.2% in 2009. Without the impairment, SG&A expense was 36.5% of revenue in 2010.
Selling, general and administrative expenses by business segment:
| | | | | | | | | | | | | | | | | | | | | | | | |
| | | For the year ended December 31, | |
| | | 2010 | | | % of
Revenue | | | 2009 | | | % of
Revenue | | | Change | | | %
Change | |
SG&A in thousands: | | | | | | | | | | | | | | | | | | | | | | | | |
Unified Communications | | $ | 407,543 | | | | 33.4 | % | | $ | 408,258 | | | | 36.2 | % | | $ | (715 | ) | | | -0.2 | % |
Communication Services | | | 505,064 | | | | 43.0 | % | | | 500,835 | | | | 39.9 | % | | | 4,229 | | | | 0.8 | % |
Intersegment eliminations | | | (1,585 | ) | | | NM | | | | (1,735 | ) | | | NM | | | | 150 | | | | NM | |
| | | | | | | | | | | | | | | | | | | | | | | | |
Total | | $ | 911,022 | | | | 38.1 | % | | $ | 907,358 | | | | 38.2 | % | | $ | 3,664 | | | | 0.4 | % |
| | | | | | | | | | | | | | | | | | | | | | | | |
NM—Not meaningful
Unified Communications SG&A expenses in 2010 decreased $0.7 million, or 0.2%, to $407.5 million from $408.3 million in 2009. SG&A expenses for the segment in 2010 included $11.4 million from acquisitions. As a percentage of this segment’s revenue, Unified Communications SG&A expenses in 2010 decreased to 33.4% from 36.2% in 2009.
Communication Services SG&A expenses in 2010 increased $4.2 million, or 0.8%, to $505.1 million from $500.8 million in 2009. SG&A expenses for the segment in 2010 included $37.7 million goodwill impairment charge and $6.4 million from acquisitions. As a percentage of this segment’s revenue, Communication Services SG&A expenses increased to 43.0% in 2010 from 39.9% in 2009. The impact of the impairment charge on Communication Services SG&A as a percentage of revenue was 320 basis points for 2010. The impact of the valuation allowance on SG&A expenses as a percentage of revenue in 2009 was 80 basis points.
Operating Income: Operating income in 2010 increased by $19.6 million, or 4.9%, to $420.2 million from $400.6 million in 2009. As a percentage of revenue, operating income increased to 17.6% in 2010 from 16.9% in 2009.
33
Operating income by business segment:
| | | | | | | | | | | | | | | | | | | | | | | | |
| | | For the year ended December 31, | |
| | | 2010 | | | % of
Revenue | | | 2009 | | | % of
Revenue | | | Change | | | %
Change | |
Operating income in thousands: | | | | | | | | | | | | | | | | | | | | | | | | |
Unified Communications | | $ | 320,411 | | | | 26.3 | % | | $ | 296,096 | | | | 26.3 | % | | $ | 24,315 | | | | 8.2 | % |
Communication Services | | | 99,770 | | | | 8.5 | % | | | 104,517 | | | | 8.3 | % | | | (4,747 | ) | | | -4.5 | % |
| | | | | | | | | | | | | | | | | | | | | | | | |
Total | | $ | 420,181 | | | | 17.6 | % | | $ | 400,613 | | | | 16.9 | % | | $ | 19,568 | | | | 4.9 | % |
| | | | | | | | | | | | | | | | | | | | | | | | |
Unified Communications operating income in 2010 increased $24.3 million, or 8.2%, to $320.4 million from $296.1 million in 2009. As a percentage of this segment’s revenue, Unified Communications operating income was 26.3% in both 2010 and 2009.
Communication Services operating income in 2010 decreased $4.7 million, or 4.5%, to $99.8 million from $104.5 million in 2009. As a percentage of revenue, Communication Services operating income increased to 8.5% in 2010 from 8.3% in 2009. The impact of the impairment charge on Communication Services operating income as a percentage of revenue was 320 basis points in 2010. The impact of the valuation allowance on operating income as a percentage of revenue in 2009 was 190 basis points.
Other Income (Expense):Other income (expense) includes interest expense from short-term and long-term borrowings under credit facilities, refinancing expenses, the aggregate gain (loss) on debt transactions denominated in currencies other than the functional currency, sub-lease rental income and interest income. Other expense in 2010 was $299.4 million compared to $252.8 million in 2009. Interest expense in 2010 was $252.7 million compared to $254.1 million in 2009. Refinancing expense of $52.8 million includes $33.4 million for the redemption call premium and related costs of redeeming the 9.5% Senior Notes due 2014 (the “2014 Senior Notes”) and $19.4 million for accelerated debt amortization costs on the amended and extended Senior Secured Term Loan Facility. Proceeds from the issuance of $500.0 million aggregate principal amount of 8 5/8% Senior Notes due 2018 (the “2018 Senior Notes”) were utilized to partially pay the Senior Secured Term Loan Facility due 2013. Proceeds from the issuance of $650.0 million aggregate principal amount of 7 7/8% Senior Notes due 2019 (the “2019 Senior Notes”) were utilized to finance the repurchasing of the Company’s outstanding $650 million aggregate principal amount of 2014 Senior Notes.
During 2010 and 2009, interest expense was reduced by $3.7 million and $6.4 million, respectively, due to an interest rate swap agreement no longer qualifying as a hedging instrument for accounting purposes.
Noncontrolling interest income (loss):We did not incur any non-controlling interest income or loss in 2010 compared to income attributable to non-controlling interest of $2.7 million in 2009. In December 2010, we sold the balance of the investment in receivable portfolios and no longer participate in purchased receivables collection. As a result of this sale, none of our subsidiaries has noncontrolling interest ownership structures. During the fourth quarter of 2009, a settlement was reached in litigation among two of our formerly majority-owned subsidiaries and one of our former portfolio receivable lenders which held non-controlling interests in such subsidiaries. As a result of this 2009 settlement, we purchased the non-controlling interest of one of the former majority-owned subsidiaries and we abandoned our interest in the other majority-owned subsidiary.
Net Income—West Corporation:Our net income in 2010 decreased $27.9 million, or 31.7%, to $60.3 million from $88.2 million in 2009. The decrease in net income was due to the factors discussed above for revenue, cost of services, SG&A expense and other income (expense). Net income includes a provision for income tax expense at an effective rate (income tax expense divided by income before income tax and noncontrolling interest) of approximately 50.1% for 2010, compared to an effective tax rate of approximately 38.4% in 2009. The effective tax rate was higher in 2010 when compared to 2009 due primarily to the goodwill impairment charge taken in 2010, which was not deductible for income tax purposes.
34
Earnings (Loss) per common share:Earnings per common L share—basic for 2010 decreased $0.38, to $17.07, from $17.45 in 2009. Earnings per common L share—diluted for 2010 decreased $0.30, to $16.37, from $16.67 in 2009. The decrease in earnings per share was primarily the result of decreased net income attributable to Class L common shares. Loss per common A share—basic and diluted for 2010 increased $0.27, to ($1.25), from ($0.98) for 2009. The increase in (loss) per share was primarily the result of a decrease in net income attributable to the Class A common shares due to our decreased earnings in 2010.
Years Ended December 31, 2009 and 2008
Revenue: Total revenue in 2009 increased $128.3 million, or 5.7%, to $2,375.7 million from $2,247.4 million in 2008. This increase included $165.0 million of revenue from the acquisitions of HBF, Genesys and Positron. These acquisitions closed on April 1, 2008, May 22, 2008 and November 21, 2008, respectively. During 2009, decreased call volumes in our agent-based services, which we believe are attributable to the sluggish economy, resulted in reduced revenue of $133.5 million. During 2009, the Communication Services segment recorded impairment charges of $25.5 million to establish a valuation allowance against the carrying value of portfolio receivables. During 2008, the Communication Services segment recorded impairment charges of $76.4 million.
During each of the years ended December 31, 2009 and 2008, our largest 100 clients represented approximately 56% of total revenue. The aggregate revenue from our largest client, AT&T, as a percentage of our total revenue in 2009 and 2008 was approximately 12% and 13%, respectively. No other client accounted for more than 10% of our total revenue in 2009 or 2008.
Revenue by business segment:
| | | | | | | | | | | | | | | | | | | | | | | | |
| | | For the year ended December 31, | |
| | | 2009 | | | % of Total
Revenue | | | 2008 | | | % of Total
Revenue | | | Change | | | % Change | |
Revenue in thousands: | | | | | | | | | | | | | | | | | | | | | | | | |
Unified Communications | | $ | 1,126,544 | | | | 47.4 | % | | $ | 995,161 | | | | 44.3 | % | | $ | 131,383 | | | | 13.2 | % |
Communication Services | | | 1,254,547 | | | | 52.8 | % | | | 1,258,182 | | | | 56.0 | % | | | (3,635 | ) | | | -0.3 | % |
Intersegment eliminations | | | (5,343 | ) | | | -0.2 | % | | | (5,909 | ) | | | -0.3 | % | | | 566 | | | | -9.6 | % |
| | | | | | | | | | | | | | | | | | | | | | | | |
Total | | $ | 2,375,748 | | | | 100.0 | % | | $ | 2,247,434 | | | | 100.0 | % | | $ | 128,314 | | | | 5.7 | % |
| | | | | | | | | | | | | | | | | | | | | | | | |
Unified Communications revenue in 2009 increased $131.4 million, or 13.2%, to $1,126.5 million from $995.2 million in 2008. The increase in revenue included $95.2 million from the acquisition of Genesys which was completed in May 2008. The remaining $36.2 million increase was attributable to organic growth. Since we entered the conferencing services business, the average rate per minute that we charge has declined while total minutes sold has increased. This is consistent with industry trends which we expect to continue for the foreseeable future.
Communication Services revenue in 2009 decreased $3.6 million, or 0.3%, to $1,254.5 million from $1,258.2 million in 2008. The decrease in revenue for 2009 is primarily the result of decreased call volumes in our agent-based services, which reduced revenue by $133.5 million. During 2009, the Communication Services segment recorded impairment charges of $25.5 million to establish a valuation allowance against the carrying value of portfolio receivables. During 2008, the Communication Services segment recorded impairment charges of $76.4 million. Partially offsetting the decrease in revenue was revenue of $69.8 million from acquired entities.
Cost of Services: Cost of services consists of direct labor, telephone expense and other costs directly related to providing services to clients. Cost of services in 2009 increased $52.7 million, or 5.2%, to $1,067.8 million from $1,015.0 million in 2008. The acquisitions of HBF, Genesys and Positron increased cost of services by $80.5 million. As a percentage of revenue, cost of services decreased to 44.9% for 2009 from 45.2% in 2008.
35
Cost of Services by business segment:
| | | | | | | | | | | | | | | | | | | | | | | | |
| | | For the year ended December 31, | |
| | | 2009 | | | % of Revenue | | | 2008 | | | % of Revenue | | | Change | | | % Change | |
Cost of services in thousands: | | | | | | | | | | | | | | | | | | | | | | | | |
Unified Communications | | $ | 422,189 | | | | 37.5 | % | | $ | 351,359 | | | | 35.3 | % | | $ | 70,830 | | | | 20.2 | % |
Communication Services | | | 649,195 | | | | 51.7 | % | | | 665,571 | | | | 52.9 | % | | | (16,376 | ) | | | -2.5 | % |
Intersegment eliminations | | | (3,607 | ) | | | NM | | | | (1,902 | ) | | | NM | | | | (1,705 | ) | | | 89.6 | % |
| | | | | | | | | | | | | | | | | | | | | | | | |
Total | | $ | 1,067,777 | | | | 44.9 | % | | $ | 1,015,028 | | | | 45.2 | % | | $ | 52,749 | | | | 5.2 | % |
| | | | | | | | | | | | | | | | | | | | | | | | |
NM—Not Meaningful
Unified Communications cost of services in 2009 increased $70.8 million, or 20.2%, to $422.2 million from $351.4 million in 2008. The acquisition of Genesys increased cost of services by $25.0 million. The remaining increase is primarily driven by increased service volume. As a percentage of this segment’s revenue, Unified Communications cost of services increased to 37.5% in 2009 from 35.3% in 2008.
Communication Services cost of services in 2009 decreased $16.4 million, or 2.5%, to $649.2 million from $665.6 million in 2008. The decrease in cost of services in 2009 was partially offset by increased costs of $55.5 million from the operations resulting from our acquisitions of HBF and Positron. The remaining decrease is primarily driven by decreased service volume. As a percentage of revenue, Communication Services cost of services decreased to 51.7% in 2009 from 52.9% in 2008. The impact of the valuation allowance on Communication Services cost of services as a percentage of revenue in 2009 and 2008 was 100 basis points and 300 basis points, respectively.
Selling, General and Administrative Expenses:SG&A expenses in 2009 increased $25.8 million, or 2.9%, to $907.4 million from $881.6 million for 2008. The increase included $49.2 million from the acquisitions of HBF, Genesys and Positron. As a percentage of revenue, SG&A expenses decreased to 38.2% in 2009 from 39.2% in 2008. In 2009, in accordance with ASC 710-35Accounting for Deferred Compensation Arrangements Where Amounts Earned Are Held in a Rabbi Trust and Invested, (“ASC 710-35”) we recorded a $3.9 million increase in SG&A with a corresponding increase in other income and expense. ASC 710-35 requires that the deferred compensation obligation be classified as a liability and adjusted with the corresponding charge (or credit) to compensation cost, to reflect changes in the fair value of the amount owed to employees.
Selling, general and administrative expenses by business segment:
| | | | | | | | | | | | | | | | | | | | | | | | |
| | | For the year ended December 31, | |
| | | 2009 | | | % of Revenue | | | 2008 | | | % of Revenue | | | Change | | | % Change | |
SG&A in thousands: | | | | | | | | | | | | | | | | | | | | | | | | |
Unified Communications | | $ | 408,258 | | | | 36.2 | % | | $ | 386,950 | | | | 38.9 | % | | $ | 21,308 | | | | 5.5 | % |
Communication Services | | | 500,835 | | | | 39.9 | % | | | 498,643 | | | | 39.6 | % | | | 2,192 | | | | 0.4 | % |
Intersegment eliminations | | | (1,735 | ) | | | NM | | | | (4,007 | ) | | | NM | | | | 2,272 | | | | NM | |
| | | | | | | | | | | | | | | | | | | | | | | | |
Total | | $ | 907,358 | | | | 38.2 | % | | $ | 881,586 | | | | 39.2 | % | | $ | 25,772 | | | | 2.9 | % |
| | | | | | | | | | | | | | | | | | | | | | | | |
NM—Not meaningful
Unified Communications SG&A expenses in 2009 increased $21.3 million, or 5.5%, to $408.3 million from $387.0 million in 2008. SG&A expenses included $30.8 million from the acquisition of Genesys. As a percentage of this segment’s revenue, Unified Communications SG&A expenses in 2009 decreased to 36.2% from 38.9% in 2008. The Unified Communications segment has effectively reduced SG&A expenses through realized synergies from acquisitions.
36
Communication Services SG&A expenses in 2009 increased $2.2 million, or 0.4%, to $500.8 million from $498.6 million in 2008. The acquisitions of HBF and Positron increased SG&A expenses by $18.5 million. As a percentage of this segment’s revenue, Communication Services SG&A expenses increased to 39.9% in 2009 from 39.6% in 2008. The impact of the valuation allowance on SG&A expenses as a percentage of revenue in 2009 and 2008 was 80 basis points and 220 basis points, respectively.
Operating Income: Operating income in 2009 increased by $49.8 million, or 14.2%, to $400.6 million from $350.8 million in 2008. As a percentage of revenue, operating income increased to 16.9% in 2009 from 15.6% in 2008.
Operating income by business segment:
| | | | | | | | | | | | | | | | | | | | | | | | |
| | | For the year ended December 31, | |
| | | 2009 | | | % of
Revenue | | | 2008 | | | % of
Revenue | | | Change | | | %
Change | |
Operating income in thousands: | | | | | | | | | | | | | | | | | | | | | | | | |
Unified Communications | | $ | 296,096 | | | | 26.3 | % | | $ | 256,853 | | | | 25.8 | % | | $ | 39,243 | | | | 15.3 | % |
Communication Services | | | 104,517 | | | | 8.3 | % | | | 93,967 | | | | 7.5 | % | | | 10,550 | | | | 11.2 | % |
| | | | | | | | | | | | | | | | | | | | | | | | |
Total | | $ | 400,613 | | | | 16.9 | % | | $ | 350,820 | | | | 15.6 | % | | $ | 49,793 | | | | 14.2 | % |
| | | | | | | | | | | | | | | | | | | | | | | | |
Unified Communications operating income in 2009 increased $39.2 million, or 15.3%, to $296.1 million from $256.9 million in 2008. As a percentage of this segment’s revenue, Unified Communications operating income increased to 26.3% in 2009 from 25.8% in 2008.
Communication Services operating income in 2009 increased $10.5 million, or 11.2%, to $104.5 million from $94.0 million in 2008. The increase in operating income in 2009 was driven primarily by lower valuation allowances taken in 2009, $25.5 million compared to $76.4 million in 2008. This increase was partially offset by a reduction in agent-based services operating income of $51.9 million. As a percentage of revenue, Communication Services operating income increased to 8.3% in 2009 from 7.5% in 2008. The impact of the valuation allowance on operating income as a percentage of revenue in 2009 and 2008 was 190 basis points and 530 basis points, respectively.
Other Income (Expense):Other income (expense) includes interest expense from short-term and long-term borrowings under credit facilities and portfolio notes payable, the aggregate gain (loss) on debt transactions denominated in currencies other than the functional currency, sub-lease rental income and interest income. Other expense in 2009 was $252.8 million compared to $321.6 million in 2008. Interest expense in 2009 was $254.1million compared to $313.0 million in 2008. The decrease in interest expense was primarily due to lower effective interest rates, partially offset by increased average outstanding debt in 2009. Interest expense during 2009 included a reduction of $3.3 million for the decline in the fair value liability of the interest rate swap hedges, which were determined to be ineffective and therefore did not qualify for hedge accounting treatment. This compares to a $3.2 million increase in interest expense in 2008 for the increase in the fair value liability of the interest rate swap hedges. Interest expense was further reduced during 2009 by $6.4 million for hedges that did not qualify for hedge accounting treatment. This compares to a $14.5 million increase to interest expense in 2008 for hedges that did not qualify for hedge accounting treatment.
Noncontrolling interest income (loss):At December 31, 2009, one of the subsidiaries comprising our receivable management business was not wholly owned by us. This majority-owned subsidiary was not party to or guarantor of our senior secured term loan facility, our senior secured revolving credit facility, our senior notes or our senior subordinated notes. Accordingly, interest expense associated with the foregoing debt instruments is not attributed to this subsidiary or similar subsidiaries that were not wholly owned by us during 2009. The only interest expense attributed to these majority-owned subsidiaries is the portion of the interest expense that is
37
accrued on our portfolio notes payable facilities which corresponds with our ownership percentage of such subsidiary. We had income attributable to noncontrolling interest of $2.7 million in 2009 compared to loss attributable to noncontrolling interest of ($2.1) million in 2008. The portfolio receivable impairments recorded in 2008 primarily caused the loss attributable to the non-controlling interest in 2008.
Net Income—West Corporation:Our net income in 2009 improved $68.7 million, or 352.3%, to $88.2 million from $19.5 million in 2008. The increase in net income was due to the factors discussed above for revenue, cost of services, SG&A expense and other income (expense). Net income includes a provision for income tax expense at an effective rate (income tax expense divided by income before income tax and noncontrolling interest) of approximately 38.4% for 2009, compared to an effective tax rate of approximately 40.2% in 2008.
Earnings (Loss) per common share:Earnings per common L share—basic for 2009 improved $4.67, to $17.45, from $12.78 in 2008. Earnings per common L share—diluted for 2009 improved $4.43, to $16.67, from $12.24 in 2008. The improvement in earnings per share was primarily the result of increased net income attributable to Class L common shares. Loss per common A share—basic and diluted for 2009 decreased $0.25, to ($0.98), from ($1.23) for 2008. The decrease in (loss) per share was primarily the result of an increase in net income attributable to the Class A common shares due to our increased earnings in 2009.
Liquidity and Capital Resources
We have historically financed our operations and capital expenditures primarily through cash flows from operations supplemented by borrowings under our bank credit facilities and until recently, specialized credit facilities established for the purchase of receivable portfolios.
On October 2, 2009, we filed a Registration Statement on Form S-1 (Registration No. 333-162292) under the Securities Act of 1933 and amendments to the Registration Statement on November 6, 2009, December 1, 2009, December 16, 2009 and February 16, 2010 pursuant to which we proposed to offer up to $500.0 million of our common stock (“Proposed Offering”). We expect to use a part of the net proceeds from the Proposed Offering received by us to repay or repurchase indebtedness. We also expect to use a part of the net proceeds from this offering to fund the amounts payable upon the termination of the management agreement entered into in connection with the consummation of our recapitalization in 2006 between us and the Sponsors. We may also use a portion of the net proceeds received by us for working capital and other general corporate purposes. Given current market conditions, the timing of our initial public offering is uncertain.
On October 5, 2010, we issued $500.0 million aggregate principal amount of senior unsecured notes due 2018. Proceeds of the notes were used to pay off a portion of our senior secured term loan facility.
On October 5, 2010, we amended and restated our credit agreement, which modified our senior secured credit facilities in several respects, including providing for the following:
| | • | | Extending the maturity of approximately $158 million of our $250 million senior secured revolving credit facility (and securing approximately $43 million of additional senior secured revolving credit facility commitments for the extended term) from October 2012 to January 2016 with the interest rate margins of such extended maturity revolving credit loans increasing by 1.00 percent; |
| | • | | Extending the maturity of $500 million of our senior secured term loan facility from October 2013 to July 2016 with the interest rate margins of such extended senior secured term loan facility increasing by 1.875 percent; |
| | • | | Increasing the interest rate margins of approximately $985 million of our senior secured term loans due July 2016 by 0.375 percent to match interest rate margins for the newly extended senior secured term loans; and |
38
| | • | | Modifying the step-down schedule in the current financial covenants and certain covenant baskets. |
On November 24, 2010, we issued $650.0 million aggregate principal amount of 7 7/8% senior notes due 2019, and used the gross proceeds to repurchase our $650 million aggregate principal amount of 9 1/2% senior notes due 2014.
These changes modify our capital structure by extending the weighted average maturity of funded debt from 4.5 years to 6.1 years. We expect that these changes may provide greater flexibility for future growth plans.
Our current and anticipated uses of our cash, cash equivalents and marketable securities are to fund operating expenses, acquisitions, capital expenditures, interest payments, tax payments and the repayment of principal on debt.
Year Ended December 31, 2010 compared to 2009
The following table summarizes our cash flows by category for the periods presented (in thousands):
| | | | | | | | | | | | | | | | |
| | | For the Years Ended December 31, | |
| | | 2010 | | | 2009 | | | Change | | | %
Change | |
Cash flows from operating activities | | $ | 312,829 | | | $ | 272,857 | | | $ | 39,972 | | | | 14.6 | % |
Cash flows from (used in) investing activities | | $ | (137,896 | ) | | $ | (112,615 | ) | | $ | (25,281 | ) | | | -22.4 | % |
Cash flows from (used in) financing activities | | $ | (133,651 | ) | | $ | (271,844 | ) | | $ | 138,193 | | | | -50.8 | % |
Net cash flows from operating activities in 2010 increased $40.0 million, or 14.6%, to $312.8 million compared to net cash flows from operating activities of $272.9 million in 2009. The increase in net cash flows from operating activities is primarily due to improvements in operating income and working capital utilization.
Days sales outstanding (“DSO”), a key performance indicator that we utilize to monitor the accounts receivable average collection period and assess overall collection risk, was 56 days at December 31, 2010. Throughout 2010, DSO ranged from 56 to 62 days. At December 31, 2009, DSO was 54 days and ranged from 54 to 59 days during 2009.
Net cash flows used in investing activities in 2010 increased $25.3 million, or 22.4%, to $137.9 million compared to net cash flows used in investing activities of $112.6 million in 2009. The increase in net cash flows used in investing activities was due to a reduction in collections applied to principal of portfolio receivables of $23.6 million in 2010 compared to 2009. In 2010, $33.5 million was invested for acquisitions compared to $31.7 million in 2009. We invested $118.2 million in capital expenditures during 2010 compared to $118.5 million invested in 2009.
Net cash flows used in financing activities in 2010 decreased $138.2 million or 50.8%, to $133.7 million compared to net cash flows used in financing activities of $271.8 million for 2009. Repayments on portfolio notes payable in 2010 were $34.0 million less than in 2009. In 2010, we paid off the remaining balances of the portfolio notes payable. Net payments on long-term obligations in 2010 were $127.4 million less than in 2009. During 2010, net payments under the senior secured revolving credit facility were $72.9 million compared to $201.7 million in 2009. At December 31, 2010, there was no outstanding balance on the senior secured revolving credit facility.
Given our current levels of cash on hand, anticipated cash flow from operations and available borrowing capacity, we believe we have sufficient liquidity to conduct our normal operations and pursue our business strategy in the ordinary course.
39
Year Ended December 31, 2009 compared to 2008
The following table summarizes our cash flows by category for the periods presented (in thousands):
| | | | | | | | | | | | | | | | |
| | | For the Years Ended December 31, | |
| | | 2009 | | | 2008 | | | Change | | | %
Change | |
Cash flows from operating activities | | $ | 272,857 | | | $ | 287,381 | | | $ | (14,524 | ) | | | -5.1 | % |
Cash flows from (used in) investing activities | | $ | (112,615 | ) | | $ | (597,539 | ) | | $ | 484,924 | | | | 81.2 | % |
Cash flows from (used in) financing activities | | $ | (271,844 | ) | | $ | 341,971 | | | $ | (613,815 | ) | | | -179.5 | % |
Net cash flows from operating activities in 2009 decreased $14.5 million, or 5.1%, to $272.9 million compared to net cash flows from operating activities of $287.4 million in 2008. The decrease in net cash flows from operating activities is primarily due to reductions in accrued payroll and interest due to the timing of the year-end payroll cycle and interest payment dates. This decrease in cash flows from operating activities was partially offset by increased operating income.
Days sales outstanding (“DSO”), a key performance indicator that we utilize to monitor the accounts receivable average collection period and assess overall collection risk, was 54 days at December 31, 2009. Throughout 2009, DSO ranged from 54 to 59 days. At December 31, 2008, DSO was 54 days and ranged from 52 to 58 days during 2008.
Net cash flows used in investing activities in 2009 decreased $484.9 million, or 81.2%, to $112.6 million compared to net cash flows used in investing activities of $597.5 million in 2008. The decrease in net cash flows used in investing activities was due to reduced acquisition activity in 2009 compared to 2008. In 2009, $31.7 million was invested for acquisitions compared to $493.6 million in 2008. We invested $118.5 million in capital expenditures during 2009 compared to $105.4 million invested in 2008. Investing activities in 2009 and 2008 included the net purchase of receivable portfolios for $1.7 million and $45.4 million, respectively. Investing activities in 2009 also included cash proceeds applied to amortization of receivable portfolios of $39.1 million compared $46.4 million in 2008.
Net cash flows used in financing activities in 2009 increased $613.8 million or 179.5%, compared to net cash flows from financing activities of $342.0 million for 2008. During 2009, $201.7 million was paid on the senior secured revolving credit facility and the multicurrency revolving credit facility. During 2008, net proceeds from the term loan add-on of the senior secured credit facility, senior secured revolving credit facility and the multicurrency revolving credit facility were $417.2 million and were used to finance the Genesys and Positron acquisitions.
Senior Secured Term Loan Facility and Senior Secured Revolving Credit Facility
The senior secured term loan facility and senior secured revolving credit facility bear interest at variable rates. During 2010, we and certain of our domestic subsidiaries, as borrowers and/or guarantors, Wells Fargo Bank, National Association (“Wells Fargo”), as administrative agent, and the various lenders party thereto modified our senior secured credit facilities, including as described above, by entering into a Restatement Agreement (the “Restatement Agreement”), amending and restating the Credit Agreement, dated as of October 24, 2006, by and among us, Wells Fargo, as successor administrative agent and the various lenders party thereto, as lenders, (as so amended and restated, the “Restated Credit Agreement”).
After giving effect to the prepayment of amortization payments payable in respect of the term loans due 2013, the amended and restated senior secured term loan facility requires annual principal payments of approximately $15.4 million, paid quarterly (a portion of which was prepaid for the December 31, 2010 payment
40
date), with balloon payments at maturity dates of October 24, 2013 and July 15, 2016 of approximately $450.2 million and $1,398.5 million, respectively. Pricing of the amended and restated senior secured term loan facility, due 2013, is based on the Company’s corporate debt rating and the grid ranges from 2.125% to 2.75% for LIBOR rate loans (LIBOR plus 2.375% at December 31, 2010), and from 1.125% to 1.75% for base rate loans (Base Rate plus 1.375% at December 31, 2010). The interest rate margins for the amended and restated senior secured term loans due 2016 are based on the Company’s corporate debt rating based on a grid, which ranges from 4.00% to 4.625% for LIBOR rate loans (LIBOR plus 4.25% at December 31, 2010), and from 3.00% to 3.625% for base rate loans (Base Rate plus 3.25% at December 31, 2010). The effective annual interest rates, inclusive of debt amortization costs, on the senior secured term loan facility for 2010 and 2009 were 5.21% and 5.25%, respectively.
The original maturity senior secured revolving credit facility pricing is based on the Company’s total leverage ratio and the grid ranges from 1.75% to 2.50% for LIBOR rate loans (LIBOR plus 2.0% at December 31, 2010), and the margin ranges from 0.75% to 1.50% for base rate loans (Base Rate plus 1.0% at December 31, 2010). The Company is required to pay each non-defaulting lender a commitment fee of 0.50% in respect of any unused commitments under the original maturity senior secured revolving credit facility. The commitment fee in respect of unused commitments under the original maturity senior secured revolving credit facility is subject to adjustment based upon our total leverage ratio. The average daily outstanding balance of the original maturity senior secured revolving credit facility during 2010 and 2009 was $13.1 million and $169.9 million, respectively. The highest balance outstanding on the original maturity senior secured revolving credit facility during 2010 and 2009 was $80.9 million and $224.0 million, respectively.
The extended maturity senior secured revolving credit facility pricing is based on the Company’s total leverage ratio and the grid ranges from 2.75% to 3.50% for LIBOR rate loans (LIBOR plus 3.0% at December 31, 2010), and the margin ranges from 1.75% to 2.50% for base rate loans (Base Rate plus 2.0% at December 31, 2010). The Company is required to pay each non-defaulting lender a commitment fee of 0.50% in respect of any unused commitments under the extended maturity senior secured revolving credit facility. The commitment fee in respect of unused commitments under the extended maturity senior secured revolving credit facility is subject to adjustment based upon our total leverage ratio. There have been no borrowings under the extended maturity senior secured revolving credit facility since its inception on October 5, 2010.
Subsequent to December 31, 2010, the Company may request additional tranches of term loans or increases to the revolving credit facility in an aggregate amount not to exceed $831.4 million, including the aggregate amount of $600.4 million of principal payments previously made in respect of the term loan facility. Availability of such additional tranches of term loans or increases to the revolving credit facility is subject to the absence of any default and pro forma compliance with financial covenants and, among other things, the receipt of commitments by existing or additional financial institutions.
In 2008, we entered into three three-year interest rate swap agreements (cash flow hedges) to convert variable long-term debt to fixed rate debt. These swaps were for an aggregate notional value of $600.0 million with interest rates ranging from 3.38% to 3.532% and expire in August 2011. In 2010, we entered into three three-year interest rate swap agreements (cash flow hedges) to convert variable long-term debt to fixed rate debt. These swaps were for an additional aggregate notional value of $500.0 million with interest rates ranging from 1.685% to 1.6975% and expire in June 2013. During 2009, we entered into three eighteen month forward starting interest rate swaps for a total notional value of $500.0 million. These forward starting interest rate swaps commenced during the third quarter of 2010. The fixed interest rate on these forward starting interest rate swaps ranges from 2.56% to 2.60% and expire in January 2012. At December 31, 2010, the notional amount of debt outstanding under interest rate swap agreements was $1,600.0 million of the outstanding $1,933.6 million senior secured term loan facility hedged at rates from 1.685% to 3.532%.
41
Multicurrency revolving credit facility
InterCall Conferencing Services Limited (“ICSL”), a foreign subsidiary of InterCall, maintained a $75.0 million multicurrency revolving credit facility. The credit facility was secured by substantially all of the assets of ICSL, and was not guaranteed by West or any of its domestic subsidiaries. On November 17, 2010, we provided notice to the lenders of our intent to cancel the facility effective November 22, 2010.
2016 Senior Subordinated Notes
The Company’s $450.0 million aggregate principal amount of 11% senior subordinated notes due 2016 (the “2016 Senior Subordinated Notes”) bear interest that is payable semiannually.
At any time prior to October 15, 2011, the Company may redeem all or a part of the 2016 Senior Subordinated Notes at a redemption price equal to 100% of the principal amount of such notes redeemed plus the applicable premium and accrued and unpaid interest to the date of redemption, subject to the rights of holders of 2016 Senior Subordinated Notes on the relevant record date to receive interest due on the relevant interest payment date.
On and after October 15, 2011, the Company may redeem the 2016 Senior Subordinated Notes in whole or in part at the redemption prices (expressed as percentages of principal amount of the senior subordinated notes to be redeemed) set forth below plus accrued and unpaid interest thereon to the applicable date of redemption, subject to the right of holders of 2016 Senior Subordinated Notes of record on the relevant record date to receive interest due on the relevant interest payment date, if redeemed during the twelve-month period beginning on October 15 of each of the years indicated below:
| | | | |
Year | | Percentage | |
2011 | | | 105.500 | |
2012 | | | 103.667 | |
2013 | | | 101.833 | |
2014 and thereafter | | | 100.000 | |
2018 Senior Notes
On October 5, 2010, we issued $500 million aggregate principal amount of 8 5/8% senior notes that mature on October 1, 2018 (the “2018 Senior Notes”).
At any time prior to October 1, 2014, we may redeem all or a part of the 2018 Senior Notes at a redemption price equal to 100% of the principal amount of 2018 Senior Notes redeemed plus the applicable premium (as defined in the indenture governing the 2018 Senior Notes) as of, and accrued and unpaid interest and all additional interest then owing pursuant to the registration rights agreement executed in connection with the 2018 Senior Notes, if any, to the date of redemption, subject to the rights of holders of 2018 Senior Notes on the relevant record date to receive interest due on the relevant interest payment date.
On and after October 1, 2014, we may redeem the 2018 Senior Notes in whole or in part at the redemption prices (expressed as percentages of principal amount of the 2018 Senior Notes to be redeemed) set forth below plus accrued and unpaid interest thereon and all additional interest then owing pursuant to the registration rights agreement executed in connection with the 2018 Senior Notes, if any, to the applicable date of redemption, subject to the right of holders of 2018 Senior Notes of record on the relevant record date to receive interest due on the relevant interest payment date, if redeemed during the twelve-month period beginning on October 1 of each of the years indicated below:
| | | | |
Year | | Percentage | |
2014 | | | 104.313 | |
2015 | | | 102.156 | |
2016 and thereafter | | | 100.000 | |
42
At any time (which may be more than once) before October 1, 2013, we can choose to redeem up to 35% of the outstanding notes with money that we raise in one or more equity offerings, as long as: we pay 108.625% of the face amount of the notes, plus accrued and unpaid interest; we redeem the notes within 90 days after completing the equity offering; and at least 65% of the aggregate principal amount of the applicable series of notes issued remains outstanding afterwards.
2019 Senior Notes
On November 24, 2010, we issued $650.0 million aggregate principal amount of 7 7/8% senior notes that mature January 15, 2019 (the “2019 Senior Notes”).
At any time prior to November 15, 2013, we may redeem all or a part of the 2019 Senior Notes at a redemption price equal to 100% of the principal amount of 2019 Senior Notes redeemed plus the applicable premium (as defined in the indenture governing the 2019 Senior Notes) as of, and accrued and unpaid interest and all additional interest then owing pursuant to the registration rights agreement executed in connection with the 2019 Senior Notes, if any, to the date of redemption, subject to the rights of holders of 2019 Senior Notes on the relevant record date to receive interest due on the relevant interest payment date.
On and after November 15, 2014, we may redeem the 2019 Senior Notes in whole or in part at the redemption prices (expressed as percentages of principal amount of the 2019 Senior Notes to be redeemed) set forth below plus accrued and unpaid interest thereon and all additional interest then owing pursuant to the registration rights agreement executed in connection with the 2019 Senior Notes, if any, to the applicable date of redemption, subject to the right of holders of 2019 Senior Notes of record on the relevant record date to receive interest due on the relevant interest payment date, if redeemed during the twelve-month period beginning on November 15 of each of the years indicated below:
| | | | |
Year | | Percentage | |
2014 | | | 103.938 | |
2015 | | | 101.969 | |
2016 and thereafter | | | 100.000 | |
At any time (which may be more than once) before November 15, 2013, we can choose to redeem up to 35% of the outstanding notes with money that we raise in one or more equity offerings, as long as: we pay 107.875% of the face amount of the notes, plus accrued and unpaid interest; we redeem the notes within 90 days after completing the equity offering; and at least 65% of the aggregate principal amount of the applicable series of notes issued remains outstanding afterwards.
The Company and its subsidiaries, affiliates or significant shareholders may from time to time, in their sole discretion, purchase, repay, redeem or retire any of the Company’s outstanding debt or equity securities (including any publicly issued debt or equity securities), in privately negotiated or open market transactions, by tender offer or otherwise.
Asset Securitization
During 2009, West Receivables LLC, a wholly-owned, bankruptcy-remote direct subsidiary of West Receivables Holdings LLC, entered into a three year $125.0 million revolving trade accounts receivable financing facility with Wachovia Bank, National Association. Under the facility, West Receivables Holdings LLC sells or contributes trade accounts receivables to West Receivables LLC, which sells undivided interests in the purchased or contributed accounts receivables for cash to one or more financial institutions. The availability of the funding is subject to the level of eligible receivables after deducting certain concentration limits and reserves. The current facility is subject to renewal in August 2012. The proceeds of the facility are available for
43
general corporate purposes. West Receivables LLC and West Receivables Holdings LLC are consolidated in our condensed consolidated financial statements included elsewhere in this report. At December 31, 2010 and December 31, 2009, the facility was undrawn. The highest balance outstanding during 2010 was $20.0 million.
The asset securitization facility contains various customary affirmative and negative covenants and also contains customary default and termination provisions, which provide for acceleration of amounts owed under the program upon the occurrence of certain specified events, including, but not limited to, failure to pay yield and other amounts due, defaults on certain indebtedness, certain judgments, changes in control, certain events negatively affecting the overall credit quality of collateralized accounts receivable, bankruptcy and insolvency events and failure to meet financial tests requiring maintenance of certain leverage and coverage ratios, similar to those under our senior secured credit facility.
Debt Covenants
Senior Secured Term Loan Facility and Senior Secured Revolving Credit Facility – We are required to comply on a quarterly basis with a maximum total leverage ratio covenant and a minimum interest coverage ratio covenant. The total leverage ratio of consolidated total debt to Consolidated EBITDA (as defined by our Restated Credit Agreement) may not exceed 5.75 to 1.0 at December 31, 2010 and the interest coverage ratio of Consolidated EBITDA (as defined in the Restated Credit Agreement) to the sum of consolidated interest expense must exceed 2.0 to 1.0 at December 31, 2010. Both ratios are measured on a rolling four-quarter basis. We were in compliance with these financial covenants at December 31, 2010. The total leverage ratio will become more restrictive over time (adjusted periodically until the maximum leverage ratio reaches 5.00 to 1.0 in the fourth quarter of 2012). We believe that for the foreseeable future we will continue to be in compliance with our financial covenants. The senior secured credit facilities also contain various negative covenants, including limitations on indebtedness, liens, mergers and consolidations, asset sales, dividends and distributions or repurchases of our capital stock, investments, loans and advances, capital expenditures, payment of other debt, including the senior subordinated notes, transactions with affiliates, amendments to material agreements governing our subordinated indebtedness, including the senior subordinated notes and changes in our lines of business.
The senior secured credit facilities include certain customary representations and warranties, affirmative covenants, and events of default, including payment defaults, breaches of representations and warranties, covenant defaults, cross-defaults to certain indebtedness, certain events of bankruptcy, certain events under ERISA, material judgments, the invalidity of material provisions of the documentation with respect to the senior secured credit facilities, the failure of collateral under the security documents for the senior secured credit facilities, the failure of the senior secured credit facilities to be senior debt under the subordination provisions of certain of the Company’s subordinated debt and a change of control of the Company. If an event of default occurs, the lenders under the senior secured credit facilities will be entitled to take certain actions, including the acceleration of all amounts due under the senior secured credit facilities and all actions permitted to be taken by a secured creditor.
2016 Senior Subordinated Notes, 2018 Senior Notes and 2019 Senior Notes—The 2016 Senior Subordinated Notes, the 2018 Senior Notes and the 2019 Senior Notes indentures contain covenants limiting, among other things, our ability and the ability of our restricted subsidiaries to: incur additional debt or issue certain preferred shares, pay dividends on or make distributions in respect of our capital stock or make other restricted payments, make certain investments, sell certain assets, create liens on certain assets to secure debt, consolidate, merge, sell, or otherwise dispose of all or substantially all of our assets, enter into certain transactions with our affiliates and designate our subsidiaries as unrestricted subsidiaries.
Our failure to comply with these debt covenants may result in an event of default which, if not cured or waived, could accelerate the maturity of our indebtedness. If our indebtedness is accelerated, we may not have sufficient cash resources to satisfy our debt obligations and we may not be able to continue our operations as
44
planned. If our cash flows and capital resources are insufficient to fund our debt service obligations and keep us in compliance with the covenants under our senior secured credit facilities or to fund our other liquidity needs, we may be forced to reduce or delay capital expenditures, sell assets or operations, seek additional capital or restructure or refinance our indebtedness including the notes. We cannot ensure that we would be able to take any of these actions, that these actions would be successful and would permit us to meet our scheduled debt service obligations or that these actions would be permitted under the terms of our existing or future debt agreements, including our senior secured credit facilities and the indentures that govern the notes. Our senior secured credit facilities documentation and the indentures that govern the notes restrict our ability to dispose of assets and use the proceeds from the disposition. As a result, we may not be able to consummate those dispositions or use the proceeds to meet our debt service or other obligations, and any proceeds that are available may not be adequate to meet any debt service or other obligations then due.
If we cannot make scheduled payments on our debt, we will be in default, and as a result:
| | • | | our debt holders could declare all outstanding principal and interest to be due and payable; |
| | • | | the lenders under our new senior secured credit facilities could terminate their commitments to lend us money and foreclose against the assets securing our borrowings; and |
| | • | | we could be forced into bankruptcy or liquidation. |
Credit Ratings
At December 31, 2010, our credit ratings and outlook were as follows:
| | | | | | | | | | | | | | | | | | | | |
| | | Corporate
Rating /Outlook | | | Senior
Secured
Term Loans | | | Senior
Secured
Revolver | | | Senior
Unsecured
Notes | | | Senior
Subordinated
Notes | |
Moody’s (1) | | | B2 /Stable | | | | Ba3 | | | | Ba3 | | | | B3 | | | | Caa1 | |
Standard & Poor’s (2) | | | B+/Stable | | | | BB- | | | | BB- | | | | B | | | | B- | |
| (1) | Ratings were raised following the refinancing on October 5, 2010 on the Senior Secured Term Loans, Senior Secured Revolver and Senior Unsecured Notes from B1, B1 and Caa1, respectively. The ratings on the Senior Subordinated Notes and Corporate Rating were confirmed on September 15, 2010. |
| (2) | The rating was raised on the Senior Unsecured Notes from B- and was confirmed for the Senior Secured Term Loans, Senior Secured Revolver, Senior Subordinated Notes and the Corporate Rating on September 15, 2010. |
We will monitor and weigh our operating performance with any potential acquisition activities. Additional acquisitions of size would likely require us to secure additional funding sources. We have no reason to believe for the foreseeable future there will be an event to cause downgrades based on the positions of our rating agencies.
Adjusted EBITDA—The common definition of EBITDA is “Earnings Before Interest Expense, Taxes, Depreciation and Amortization.” In evaluating liquidity, we use “Adjusted EBITDA”, which we define as earnings before interest expense, share-based compensation, taxes, depreciation and amortization, noncontrolling interest, non-recurring litigation settlement costs, impairments and other non-cash reserves, transaction costs and after acquisition synergies and excluding unrestricted subsidiaries. EBITDA and Adjusted EBITDA are not measures of financial performance or liquidity under GAAP. Although we use Adjusted EBITDA as a measure of our liquidity, the use of Adjusted EBITDA is limited because it does not include certain material costs, such as depreciation, amortization and interest, necessary to operate our business and includes adjustments for synergies that have not been realized. In addition, as disclosed below, certain adjustments included in our calculation of Adjusted EBITDA are based on management’s estimates and do not reflect actual results. For example, post-acquisition synergies included in Adjusted EBITDA are determined in accordance with our senior credit facilities, which provide for an adjustment to EBITDA, subject to certain specified limitations, for reasonably
45
identifiable and factually supportable cost savings projected by us in good faith to be realized as a result of actions taken following an acquisition. EBITDA and Adjusted EBITDA should not be considered in isolation or as a substitute for net income, cash flow from operations or other income or cash flow data prepared in accordance with GAAP. Adjusted EBITDA, as presented, may not be comparable to similarly titled measures of other companies. Adjusted EBITDA is presented here as we understand investors use it as one measure of our historical ability to service debt and compliance with covenants in our senior credit facilities. Set forth below is a reconciliation of EBITDA and Adjusted EBITDA to cash flow from operations.
| | | | | | | | | | | | | | | | | | | | |
| | | For the year ended December 31, | |
| (amounts in thousands) | | 2010 | | | 2009 | | | 2008 | | | 2007 | | | 2006 | |
Cash flows from operating activities | | $ | 312,829 | | | $ | 272,857 | | | $ | 287,381 | | | $ | 263,897 | | | $ | 215,739 | |
Income tax expense | | | 60,476 | | | | 56,862 | | | | 11,731 | | | | 6,814 | | | | 65,505 | |
Deferred income tax (expense) benefit | | | (20,837 | ) | | | (28,274 | ) | | | 26,446 | | | | 8,917 | | | | (9,300 | ) |
Interest expense | | | 252,724 | | | | 254,103 | | | | 313,019 | | | | 332,372 | | | | 94,804 | |
Refinancing expenses | | | 52,804 | | | | — | | | | — | | | | — | | | | — | |
Allowance for impairment of purchased accounts receivable | | | — | | | | (25,464 | ) | | | (76,405 | ) | | | — | | | | — | |
Provision for share based compensation | | | (4,233 | ) | | | (3,840 | ) | | | (1,404 | ) | | | (1,276 | ) | | | (28,738 | ) |
Amortization of debt acquisition costs | | | (35,263 | ) | | | (16,416 | ) | | | (15,802 | ) | | | (14,671 | ) | | | (3,411 | ) |
Other | | | (652 | ) | | | (375 | ) | | | (107 | ) | | | 195 | | | | (876 | ) |
Excess tax benefit from stock options exercised | | | 897 | | | | 1,709 | | | | — | | | | — | | | | 50,794 | |
Changes in operating assets and liabilities, net of business acquisitions | | | 15,569 | | | | 79,124 | | | | (19,173 | ) | | | (53,461 | ) | | | (2,180 | ) |
| | | | | | | | | | | | | | | | | | | | |
EBITDA | | | 634,314 | | | | 590,286 | | | | 525,686 | | | | 542,787 | | | | 382,337 | |
| | | | | | | | | | | | | | | | | | | | |
Provision for share based compensation (a) | | | 4,233 | | | | 3,840 | | | | 1,404 | | | | 1,276 | | | | 28,738 | |
Acquisition synergies and transaction costs (b) | | | 5,035 | | | | 18,003 | | | | 20,985 | | | | 22,006 | | | | 89,562 | |
Non-cash portfolio impairments (c) | | | — | | | | 25,464 | | | | 76,405 | | | | 1,004 | | | | — | |
Site closures and other impairments (d) | | | 6,365 | | | | 6,976 | | | | 2,644 | | | | 1,309 | | | | — | |
Non-cash foreign currency loss (gain) (e) | | | 1,199 | | | | (229 | ) | | | 6,427 | | | | — | | | | — | |
Litigation settlement costs (f) | | | 3,504 | | | | 3,601 | | | | — | | | | 15,741 | | | | — | |
Synthetic lease interest (g) | | | — | | | | — | | | | — | | | | — | | | | 1,305 | |
| | | | | | | | | | | | | | | | | | | | |
Adjusted EBITDA | | $ | 654,650 | | | $ | 647,941 | | | $ | 633,551 | | | $ | 584,123 | | | $ | 501,942 | |
| | | | | | | | | | | | | | | | | | | | |
Adjusted EBITDA Margin (h) | | | 27.4 | % | | | 27.3 | % | | | 28.2 | % | | | 27.8 | % | | | 27.0 | % |
| | | | | |
Leverage Ratio Covenant and Interest Coverage Ratio Covenant: | | | | | | | | | | | | | | | | | | | | |
Total debt (i) | | $ | 3,436,761 | | | $ | 3,577,291 | | | $ | 3,706,982 | | | $ | 3,345,615 | | | | NM | |
Ratio of total debt to Adjusted EBITDA (j) | | | 5.3x | | | | 5.5x | | | | 5.4x | | | | 5.6x | | | | NM | |
Cash interest expense (k) | | $ | 237,965 | | | $ | 243,401 | | | $ | 280,702 | | | $ | 285,450 | | | | NM | |
Ratio of Adjusted EBITDA to cash interest expense (l) | | | 2.8x | | | | 2.7x | | | | 2.4x | | | | 2.1x | | | | NM | |
| (a) | Represents total share based compensation expense determined at fair value, excluding share based compensation expense related to deferred compensation-notional shares of $1.0 and $0.5 million in 2008 and 2007, respectively, as amounts were determined to be not significant. |
| (b) | Represents, for each period presented, unrealized synergies for acquisitions, consisting primarily of headcount reductions and telephony-related savings, direct acquisition expenses, transaction costs incurred with the recapitalization and the exclusion of the negative EBITDA in one acquired entity, which was an unrestricted subsidiary under the indentures governing our outstanding senior and senior subordinated notes. Amounts shown are permitted to be added to “EBITDA” for purposes of calculating our compliance with certain covenants under our credit facility and the indentures governing our outstanding notes. |
46
| (c) | Represents non-cash portfolio receivable allowances. |
| (d) | Represents site closures and other asset impairments. |
| (e) | Represents the unrealized loss (gain) on foreign denominated debt and the loss on transactions with affiliates denominated in foreign currencies. |
| (f) | Litigation settlements, net of estimated insurance proceeds, and related legal costs. |
| (g) | Represents interest incurred on a synthetic building lease, which was purchased in September 2006. |
| (h) | Adjusted EBITDA margin represents Adjusted EBITDA as a percentage of revenue. |
| (i) | Total debt excludes portfolio notes payable, but includes other indebtedness of capital lease obligations, performance bonds and letters of credit and is reduced by cash and cash equivalents. |
| (j) | Total debt excludes portfolio notes payable, but includes other indebtedness of capital lease obligations, performance bonds and letters of credit and is reduced by cash and cash equivalents. For purposes of calculating our Ratio of Total Debt to Adjusted EBITDA, Adjusted EBITDA includes pro forma adjustments for acquired entities of $0.7 million in 2010, $2.0 million in 2009, $49.1 million in 2008 and $9.1 million in 2007 as is permitted in the debt covenants. |
| (k) | Cash interest expense, as defined in our credit facility covenants, represents interest expense paid less amortization of capitalized financing costs and non-cash loss on hedge agreements expensed as interest under the senior secured term loan facility, senior secured revolving credit facility, senior notes and senior subordinated notes. |
| (l) | The ratio of Adjusted EBITDA to cash interest expense is calculated using trailing twelve month cash interest expense. |
NM—Not meaningful as our current debt covenants became effective October 24, 2006.
Receivables Management Asset Portfolio Notes Payable Facilities.
During 2010, we did not purchase any portfolio receivables compared to $1.7 million in 2009 and $45.4 million in 2008. In December 2010, we sold the balance of the investment in receivable portfolios for $6.6 million and no longer participate in purchased receivables collection.
During the fourth quarter of 2009, a settlement was reached in theCFSC Capital Corp. XXXIV and CVI GVF Finco, LLC v. West Receivable Services Inc. et al. litigation. As a result of the settlement, we purchased CFSC Capital Corp. XXXIV’s interest in WAP I. We also abandoned our interest in WAP II. All related lawsuits, claims and counterclaims between the parties were dismissed with prejudice and on the merits under the terms of the settlement. As a result of the settlement, the portfolio non-recourse notes payable of $49.1 million at October 2, 2009 were extinguished as we were legally released from our obligation. Also as a result of the settlement, portfolio notes receivable, noncontrolling interest, cash and accrued expenses decreased by $48.7 million, $2.2 million, $3.5 million and $0.9 million, respectively. During 2009 we also disposed of health care portfolio notes receivable of $7.5 million and the associated non-recourse notes payable of $7.5 million.
Contractual Obligations
As described in “Financial Statements and Supplementary Data,” we have contractual obligations that may affect our financial condition. However, based on management’s assessment of the underlying provisions and circumstances of our material contractual obligations, there is no known trend, demand, commitment, event or uncertainty that is reasonably likely to occur which would have a material effect on our financial condition or results of operations.
47
The following table summarizes our contractual obligations at December 31, 2010 (amounts in thousands):
| | | | | | | | | | | | | | | | | | | | |
| | | Payment due by period | |
Contractual Obligations | | Total | | | Less than
1 year | | | 1 - 3 years | | | 4 - 5 years | | | After 5 years | |
Senior Secured Term Loan Facility, due 2013 | | $ | 450,210 | | | $ | — | | | $ | 450,210 | | | $ | — | | | $ | — | |
Senior Secured Term Loan Facility, due 2016 | | | 1,483,356 | | | | 15,425 | | | | 30,850 | | | | 30,850 | | | | 1,406,231 | |
11% Senior Subordinated Notes, due 2016 | | | 450,000 | | | | — | | | | — | | | | — | | | | 450,000 | |
8 5/8% Senior Notes, due 2018 | | | 500,000 | | | | — | | | | — | | | | — | | | | 500,000 | |
7 7/8% Senior Notes, due 2019 | | | 650,000 | | | | — | | | | — | | | | — | | | | 650,000 | |
Interest payments on fixed rate debt | | | 1,058,274 | | | | 133,069 | | | | 287,626 | | | | 287,626 | | | | 349,953 | |
Estimated interest payments on variable rate debt (1) | | | 548,614 | | | | 116,322 | | | | 196,774 | | | | 184,959 | | | | 50,559 | |
Operating leases | | | 129,132 | | | | 34,014 | | | | 41,920 | | | | 22,029 | | | | 31,169 | |
Capital lease obligations | | | 989 | | | | 924 | | | | 65 | | | | — | | | | — | |
Contractual minimums under telephony agreements (2) | | | 253,900 | | | | 136,700 | | | | 117,200 | | | | — | | | | — | |
Purchase obligations (3) | | | 42,382 | | | | 36,821 | | | | 4,592 | | | | 969 | | | | — | |
Interest rate swaps | | | 31,848 | | | | 26,123 | | | | 5,725 | | | | — | | | | — | |
| | | | | | | | | | | | | | | | | | | | |
Total contractual cash obligations | | $ | 5,598,705 | | | $ | 499,398 | | | $ | 1,134,962 | | | $ | 526,433 | | | $ | 3,437,912 | |
| | | | | | | | | | | | | | | | | | | | |
| (1) | Interest rate assumptions based on January 5, 2011 LIBOR U.S. dollar swap rate curves and LIBOR Euro and GBP swap rate curves for the next five years. |
| (2) | Based on projected telephony minutes through 2012. The contractual minimum is usage based and could vary based on actual usage. |
| (3) | Represents future obligations for capital and expense projects that are in progress or are committed. |
The table above excludes amounts to be paid for taxes and long-term obligations under our Nonqualified Executive Retirement Savings Plan and Nonqualified Executive Deferred Compensation Plan. The table also excludes amounts to be paid for income tax contingencies because the timing thereof is highly uncertain. At December 31, 2010, we have accrued $19.4 million, including interest and penalties for uncertain tax positions.
Upon completion of the Proposed Offering, the contract for management services with the affiliates of Thomas H. Lee Partners, L.P. and Quadrangle Group LLC would be terminated. The early termination of this agreement will require a payment of an amount equal to the net present value (using a discount rate equal to the then prevailing yield on the U.S. Treasury Securities of like maturity) of the $4.0 million annual management fee that would have been payable under the management services agreement from the date of completion of the offering until the seventh anniversary of such offering, such fee to be due and payable at the closing of the offering.
Capital Expenditures
Our operations continue to require significant capital expenditures for technology, capacity expansion and upgrades. Capital expenditures were $122.0 million for the year ended December 31, 2010, and were funded through cash from operations and the use of our various credit facilities. Capital expenditures were $122.7 million for the year ended December 31, 2009. Capital expenditures for the year ended December 31, 2010 consisted primarily of computer and telephone equipment and software purchases. We currently estimate our capital expenditures for 2011 to be approximately $120.0 million to $130.0 million primarily for capacity expansion and upgrades at existing facilities.
Our senior secured term loan facility discussed above includes covenants which allow us the flexibility to issue additional indebtedness that is pari passu with or subordinated to our debt under our existing credit facilities
48
in an aggregate principal amount not to exceed $831.4 million including the aggregate amount of principal payments made in respect of the senior secured term loan, incur capital lease indebtedness, finance acquisitions, construction, repair, replacement or improvement of fixed or capital assets, incur accounts receivable securitization indebtedness and non-recourse indebtedness; provided we are in pro forma compliance with our total leverage ratio and interest coverage ratio financial covenants. We or any of our affiliates may be required to guarantee any existing or additional credit facilities.
Off—Balance Sheet Arrangements
We utilize standby letters of credit to support primarily workers’ compensation policy requirements and certain operating leases. Performance obligations of Intrado and Positron are supported by performance bonds and letters of credit. These obligations will expire at various dates through September 2012 and are renewed as required. The outstanding commitment on these obligations at December 31, 2010 was $23.3 million.
Inflation
We do not believe that inflation has had a material effect on our results of operations. However, there can be no assurance that our business will not be affected by inflation in the future.
Critical Accounting Policies
The preparation of financial statements in accordance with accounting principles generally accepted in the United States requires the use of estimates and assumptions on the part of management. The estimates and assumptions used by management are based on our historical experiences combined with management’s understanding of current facts and circumstances. Certain of our accounting policies are considered critical as they are both important to the portrayal of our financial condition and results of operations and require significant or complex judgment on the part of management. We believe the following represent our critical accounting policies as contemplated by the Securities and Exchange Commission Financial Reporting Release No. 60,“Cautionary Advice Regarding Disclosure About Critical Accounting Policies.”
Revenue Recognition.In our Unified Communications segment, our conferencing and collaboration services are generally billed and revenue recognized on a per participant minute basis or per seat basis and our alerts and notifications services are generally billed, and revenue recognized, on a per message or per minute basis. License fees charged for certain web services are recognized over the term of the license. Our Communication Services segment recognizes revenue for automated and agent-based services in the month that services are performed and services are generally billed based on call duration, hours of input, number of calls or a contingent basis. Emergency communications services revenue within the Communication Services segment is generated primarily from monthly fees based on the number of billing telephone numbers and cell towers covered under contract. In addition, product sales and installations are generally recognized upon completion of the installation and client acceptance of a fully functional system or, for contracts that are completed in stages and include contract-specified milestones representative of fair value, upon achieving such contract milestones. As it relates to installation sales, as of January 1, 2010, the Company adopted new revenue recognition guidance for contracts signed after December 31, 2009, whereby revenue, and associated expense, is recognized when multiple elements are completed rather than recognizing 100% of revenue and expense upon contract completion. For contracts entered into prior to January 1, 2010, revenue associated with advance payments are deferred until the system installations are completed or specified milestones are attained. Costs incurred on uncompleted contracts are accumulated and recorded as deferred costs until the system installations are completed or specified milestones are attained. This guidance was adopted prospectively and specifically for the product sales and installation for the emergency communications services revenue. Contracts for annual recurring services such as support and maintenance agreements are generally billed in advance and are recognized as revenue ratable (on a monthly basis) over the contractual periods. Nonrefundable up-front fees and related costs are recognized ratably over the term of the contract or the expected life of the client relationship, whichever is longer.
49
Revenue for contingent collection services and overpayment identification and recovery services is recognized in the month collection payments are received based upon a percentage of cash collected or other agreed upon contractual parameters. In December 2010, we sold the balance of the investment in receivable portfolios and no longer participate in purchased receivable collection. Prior to the sale, we used either the level-yield method or the cost recovery method to recognize revenue on these purchased receivable portfolios.
Allowance for Doubtful Accounts.Our allowance for doubtful accounts represents reserves for receivables which reduce accounts receivable to amounts expected to be collected. Management uses significant judgment in estimating uncollectible amounts. In estimating uncollectible amounts, management considers factors such as overall economic conditions, industry-specific economic conditions, historical client performance and anticipated client performance. While management believes our processes effectively address our exposure to doubtful accounts, changes in the economy, industry or specific client conditions may require adjustments to the allowance for doubtful accounts.
Goodwill and Intangible Assets.Goodwill and intangible assets, net of accumulated amortization, at December 31, 2010 were $1,629.4 million and $299.7 million, respectively. Management is required to exercise significant judgment in valuing the acquisitions in connection with the initial purchase price allocation and the ongoing evaluation of goodwill and other intangible assets for impairment. The purchase price allocation process requires estimates and judgments as to certain expectations and business strategies. If the actual results differ from the assumptions and judgments made, the amounts recorded in the consolidated financial statements could result in a possible impairment of the intangible assets and goodwill or require acceleration in amortization expense. We test goodwill for impairment at the reporting unit level (operating segment or one level below an operating segment) on an annual basis in the fourth quarter or more frequently if we believe indicators of impairment exist. Goodwill of a reporting unit is tested for impairment between annual tests if an event occurs or circumstances change that would more-likely-than-not reduce the fair value of a reporting unit below its carrying amount. During 2010, the Company identified impairment indicators in one of our reporting units, our traditional direct response business (marketed as “West Direct”). As a result of these impairment indicators and the results of impairment tests performed using the discounted cash flows model, goodwill with a carrying value of $37.7 million was written down to the fair value of zero. The impairment charge primarily resulted from the decline in revenue in 2010 and continued general decline in the direct response business. These events caused us to revise downward our projected future cash flows for this reporting unit. The impairment charge was recorded in SG&A and is non-deductible for tax purposes. At December 31, 2010, our reporting units were one level below our operating segments. The performance of the impairment test involves a two-step process. The first step of the goodwill impairment test involves comparing the fair values of the applicable reporting units with their aggregate carrying values, including goodwill. We determine the fair value of our reporting units using the discounted cash flow methodology. The discounted cash flow methodology requires us to make key assumptions such as projected future cash flows, growth rates, terminal value and a weighted average cost of capital. If the carrying amount of a reporting unit exceeds the reporting unit’s fair value, we perform the second step of the goodwill impairment test to determine the amount of impairment loss. The second step of the goodwill impairment test involves comparing the implied fair value of the affected reporting unit’s goodwill with the carrying value of that goodwill. We were not required to perform a second step analysis for the year ended December 31, 2010 as the fair value exceeded the carrying value for each of our reporting units in step one. Our receivables management reporting unit which has approximately $225.6 million of goodwill is our reporting unit with the least amount of cushion between its fair value and carrying value; however, in light of the expected performance of the receivables management reporting unit, we do not believe this reporting unit is at risk of failing the first step of the impairment test. The percentage by which this reporting unit’s fair value exceeded the carrying value as of the most recent step one test was 211%. Currently, we do not believe any reporting units are at risk of failing the step one test in the foreseeable future, but if events and circumstances change resulting in significant changes in operations which result in lower actual operating income compared to projected operating income, we will test our reporting unit for impairment prior to our annual impairment test.
Our indefinite-lived intangible assets consist of trade names and their values are assessed separately from goodwill in connection with our annual impairment testing. This assessment is made using the relief-from-
50
royalty method, under which the value of a trade name is determined based on a royalty that could be charged to a third party for using the trade name in question. The royalty, which is based on a reasonable rate applied against forecasted sales, is tax-effected and discounted to present value. The most significant assumptions in this evaluation include estimated future sales, the royalty rate and the after-tax discount rate.
Our finite-lived intangible assets are amortized over their estimated useful lives. Our finite-lived intangible assets are tested for recoverability whenever events or changes in circumstances such as reductions in demand or significant economic slowdowns are present on intangible assets used in operations that may indicate the carrying amount is not recoverable. Reviews are performed to determine whether the carrying value of an asset is recoverable, based on comparisons to undiscounted expected future cash flows. If this comparison indicates that the carrying value is not recoverable, the impaired asset is written down to fair value.
Income Taxes.We recognize current tax liabilities and assets based on an estimate of taxes payable or refundable in the current year for each of the jurisdictions in which we transact business. As part of the determination of our current tax liability, we exercise considerable judgment in evaluating positions we have taken in our tax returns. We have established reserves for probable tax exposures. These reserves, included in long-term tax liabilities, represent our estimate of amounts expected to be paid, which we adjust over time as more information becomes available. We also recognize deferred tax assets and liabilities for the estimated future tax effects attributable to temporary differences (e.g., book depreciation versus tax depreciation). The calculation of current and deferred tax assets and liabilities requires management to apply significant judgment relating to the application of complex tax laws, changes in tax laws or related interpretations, uncertainties related to the outcomes of tax audits and changes in our operations or other facts and circumstances. We must continually monitor changes in these factors. Changes in such factors may result in changes to management estimates and could require us to adjust our tax assets and liabilities and record additional income tax expense or benefits. Our repatriation policy is to look at our foreign earnings on a jurisdictional basis. We have historically determined that the undistributed earnings of our foreign subsidiaries will be repatriated to the United States and accordingly, we have provided a deferred tax liability on such foreign source income. In 2010, we reorganized certain foreign subsidiaries to simplify our business structure, and evaluated our liquidity requirements in the United States and the capital requirements of our foreign subsidiaries. We have determined at December 31, 2010 that a portion of our foreign earnings are indefinitely reinvested, and therefore deferred income taxes have not been provided on such foreign subsidiary earnings.
Recently Issued Accounting Pronouncements
In December 2010, the Financial Accounting Standards Board (“FASB”) issued guidance requiring an entity, such as the Company, with reporting units that have carrying amounts that are zero or negative to assess whether it is more likely than not that the reporting units’ goodwill is impaired. The Company will be required to perform step two of the goodwill impairment test if there are any adverse qualitative factors indicating that an impairment may exist for their reporting units with a zero or negative carrying value. This guidance will be effective beginning with the Company’s first quarter 2011 interim period.
| ITEM 7A. | QUANTITATIVE AND QUALITATIVE DISCLOSURES ABOUT MARKET RISK |
Market Risk Management
Market risk is the potential loss arising from adverse changes in market rates and prices, such as interest rates, foreign currency exchange rates and changes in the market value of investments. The effects of inflation on our variable interest rate debt is discussed below in “Interest Rate Risk.”
Interest Rate Risk
As of December 31, 2010, we had $1,933.6 million outstanding under our senior secured term loan facility, $450.0 million outstanding under our 2016 Senior Subordinated Notes, $500.0 million outstanding under our 2018 Senior Notes and $650.0 million outstanding under our 2019 Senior Notes.
51
Long-term obligations at variable interest rates subject to interest rate risk and the impact of a 50 basis point change in the variable interest rate, in thousands, at December 31, 2010 consist of the following:
| | | | | | | | |
| | | Outstanding
at variable
interest rates | | | Annual
Impact of a 0.5%
change in the
variable interest rate | |
| | |
| | |
| | |
Senior Secured Term Loan Facility (1) | | $ | 333,566 | | | $ | 1,667.8 | |
| | | | | | | | |
Variable rate debt | | $ | 333,566 | | | $ | 1,667.8 | |
| | | | | | | | |
| (1) | Net of $1,600.0 million interest rate swaps |
Foreign Currency Risk
Our Unified Communications segment conducts business in countries outside of the United States. Revenue and expenses from these foreign operations are typically denominated in local currency, thereby creating exposure to changes in exchange rates. Generally, we do not hedge the foreign currency transactions. Changes in exchange rates may positively or negatively affect our revenue and net income attributed to these subsidiaries. Based on our level of operating activities in foreign operations during 2010 and 2009, a five percent change in the value of the U.S. dollar relative to the Euro and British Pound Sterling would have positively or negatively affected our net operating income by approximately one percent.
On December 31, 2010 and 2009, the Communication Services segment had no material revenue outside the United States. Our facilities in Canada, Jamaica, Mexico and the Philippines operate under revenue contracts denominated in U.S. dollars. These contact centers receive calls only from customers in North America under contracts denominated in U.S. dollars.
For the years ended December 31, 2010, 2009 and 2008, revenue from non-U.S. countries was approximately 16%, 14% and 11%, respectively, of consolidated revenue. During these periods, no individual foreign country accounted for greater than 10% of revenue. At December 31, 2010 and 2009, long-lived assets from non-U.S. countries were approximately 10% of consolidated long-lived assets in each year. We have generally not entered into forward exchange or option contracts for transactions denominated in foreign currency to hedge against foreign currency risk. We are exposed to translation risk because our foreign operations are in local currency and must be translated into U.S. dollars. As currency exchange rates fluctuate, translation of our Statements of Operations of non-U.S. businesses into U.S. dollars affects the comparability of revenue, expenses, and operating income between periods.
Investment Risk
In 2008, we entered into three three-year interest rate swap agreements (cash flow hedges) to convert variable long-term debt to fixed rate debt. These swaps were for an aggregate notional value of $600.0 million with interest rates ranging from 3.38% to 3.532% and expire in August 2011. In 2010, we entered into three three-year interest rate swap agreements (cash flow hedges) to convert variable long-term debt to fixed rate debt. These swaps were for an additional aggregate notional value of $500.0 million with interest rates ranging from 1.685% to 1.6975% and expire in June 2013. During 2009, we entered into three eighteen month forward starting interest rate swaps for a total notional value of $500.0 million. These forward starting interest rate swaps commenced during the third quarter of 2010. The fixed interest rate on these forward starting interest rate swaps ranges from 2.56% to 2.60% and expire in January 2012. At December 31, 2010, the notional amount of debt outstanding under interest rate swap agreements was $1,600.0 million of the outstanding $1,933.6 million senior secured term loan facility hedged at rates from 1.685% to 3.532%.
52
| ITEM 8. | FINANCIAL STATEMENTS AND SUPPLEMENTARY DATA |
The information called for by this Item 8 is incorporated from our Consolidated Financial Statements and Notes thereto set forth on pages F-1 through F-51.
| ITEM 9. | CHANGES IN AND DISAGREEMENTS WITH ACCOUNTANTS ON ACCOUNTING AND FINANCIAL DISCLOSURE |
None.
| ITEM 9A. | CONTROLS AND PROCEDURES |
Conclusion Regarding the Effectiveness of Disclosure Controls and Procedures
The Company’s principal executive officer and principal financial officer have evaluated the Company’s disclosure controls and procedures as of December 31, 2010, and have concluded that these controls and procedures are effective to ensure that information required to be disclosed by the Company in the reports that it files or submits under the Securities Exchange Act of 1934 (15 U.S.C. § 78a et seq) is recorded, processed, summarized, and reported within the time periods specified in the Securities and Exchange Commission’s rules and forms and that information required to be disclosed by the Company in the reports that it files or submits is accumulated and communicated to management, including the principal executive officer and the principal financial officer, as appropriate to allow timely decisions regarding required disclosure.
Changes in Internal Control Over Financial Reporting
There have been no changes to our internal control over financial reporting during the last quarter that have materially affected or are reasonably likely to materially affect our internal control over financial reporting. No corrective actions were required or taken.
Management’s Report on Internal Control Over Financial Reporting
Our management is responsible for establishing and maintaining adequate internal control over financial reporting as such term is defined in Exchange Act Rule 13a-15(f). Under the supervision and with the participation of management, including our principal executive officer and principal financial officer, we conducted an evaluation of the effectiveness of our internal control over financial reporting based on the framework inInternal Control—Integrated Framework issued by the Committee of Sponsoring Organizations of the Treadway Commission. Based on our evaluation under the framework inInternal Control—Integrated Framework,our management concluded that our internal control over financial reporting was effective as of December 31, 2010.
The effectiveness of our internal control over financial reporting as of December 31, 2010 has been audited by an independent registered public accounting firm, as stated in their report which is included herein.
53
REPORT OF INDEPENDENT REGISTERED PUBLIC ACCOUNTING FIRM
To the Board of Directors of
West Corporation
Omaha, Nebraska
We have audited the internal control over financial reporting of West Corporation and subsidiaries (the “Company”) as of December 31, 2010, based on criteria established inInternal Control—Integrated Framework issued by the Committee of Sponsoring Organizations of the Treadway Commission. The Company’s management is responsible for maintaining effective internal control over financial reporting and for its assessment of the effectiveness of internal control over financial reporting, included in the accompanyingManagement’s Report on Internal Control Over Financial Reporting. Our responsibility is to express an opinion on the Company’s internal control over financial reporting based on our audit.
We conducted our audit in accordance with the standards of the Public Company Accounting Oversight Board (United States). Those standards require that we plan and perform the audit to obtain reasonable assurance about whether effective internal control over financial reporting was maintained in all material respects. Our audit included obtaining an understanding of internal control over financial reporting, assessing the risk that a material weakness exists, testing and evaluating the design and operating effectiveness of internal control based on the assessed risk, and performing such other procedures as we considered necessary in the circumstances. We believe that our audit provides a reasonable basis for our opinion.
A company’s internal control over financial reporting is a process designed by, or under the supervision of, the company’s principal executive and principal financial officers, or persons performing similar functions, and effected by the company’s board of directors, management, and other personnel to provide reasonable assurance regarding the reliability of financial reporting and the preparation of financial statements for external purposes in accordance with generally accepted accounting principles. A company’s internal control over financial reporting includes those policies and procedures that (1) pertain to the maintenance of records that, in reasonable detail, accurately and fairly reflect the transactions and dispositions of the assets of the company; (2) provide reasonable assurance that transactions are recorded as necessary to permit preparation of financial statements in accordance with generally accepted accounting principles, and that receipts and expenditures of the company are being made only in accordance with authorizations of management and directors of the company; and (3) provide reasonable assurance regarding prevention or timely detection of unauthorized acquisition, use, or disposition of the company’s assets that could have a material effect on the financial statements.
Because of the inherent limitations of internal control over financial reporting, including the possibility of collusion or improper management override of controls, material misstatements due to error or fraud may not be prevented or detected on a timely basis. Also, projections of any evaluation of the effectiveness of the internal control over financial reporting to future periods are subject to the risk that the controls may become inadequate because of changes in conditions, or that the degree of compliance with the policies or procedures may deteriorate.
In our opinion, the Company maintained, in all material respects, effective internal control over financial reporting as of December 31, 2010, based on the criteria established inInternal Control—Integrated Framework issued by the Committee of Sponsoring Organizations of the Treadway Commission.
We have also audited, in accordance with the standards of the Public Company Accounting Oversight Board (United States), the consolidated financial statements and financial statement schedule as of and for the year ended December 31, 2010, of the Company and our report dated February 23, 2011 expressed an unqualified opinion on those financial statements and financial statement schedule.
/s/ Deloitte & Touche LLP
Omaha, Nebraska
February 23, 2011
54
| ITEM 9B. | OTHER INFORMATION |
Employment Agreements
On February 21, 2011, we amended the employment agreements with each of Thomas B. Barker, Nancee R. Berger, Paul M. Mendlik, Todd B. Strubbe and Steven M. Stangl, to replace the Exhibit A to each such agreement related to 2010 compensation with a new Exhibit A related to 2011 compensation. Each of Mr. Barker, Ms. Berger, Mr. Mendlik, Mr. Strubbe and Mr. Stangl is referred to herein as an “Executive.”
The Exhibit A to each of the applicable employment agreements establishes for each Executive base compensation and bonus compensation for 2011. Each Executive’s current base compensation and the method by which each Executive’s bonus compensation for 2011 is calculated are as follows:
Thomas Barker. Mr. Barker’s base compensation is $900,000. He is also eligible to receive a performance bonus based on consolidated EBITDA for West in 2011. Mr. Barker’s 2011 bonus shall be earned in three tranches. Tranche 1 will be earned at a rate of $1,577 for each million dollars of consolidated EBITDA up to the amount of 2010 consolidated EBITDA. The maximum bonus under Tranche 1 is $1,000,000. Tranche 2 will be earned at a rate of $28,022 for each million of consolidated EBITDA in excess of our 2010 consolidated EBITDA up to $670 million of consolidated EBITDA. The maximum bonus under Tranche 2 is $1,000,000. Tranche 3 will be earned at a rate of $47,170 for each million of consolidated EBITDA in excess of $670 million dollars of consolidated EBITDA. There is no maximum amount that may be earned under Tranche 3. The bonus calculation is set forth in tabular format below.
| | | | | | | | |
| | | Consolidated EBITDA | | | Bonus / Million of
Consolidated EBITDA | |
Tranche 1 | | | $0 - $634.3 million | | | | $1,577 | |
Tranche 2 | | | $634.4 - $670 million | | | | $28,022 | |
Tranche 3 | | | $670.1 million or greater | | | | $47,170 | |
At the discretion of the Company’s Compensation Committee, Mr. Barker may receive an additional bonus based on the Company’s and his individual performance.
Nancee Berger. Ms. Berger’s base compensation is $600,000. She is also eligible to receive a performance bonus based on consolidated EBITDA for West in 2011. Ms. Berger’s 2011 bonus shall be earned in three tranches. Tranche 1 will be earned at a rate of $1,104 for each million dollars of consolidated EBITDA up to the amount of 2010 consolidated EBITDA. The maximum bonus under Tranche 1 is $700,000. Tranche 2 will be earned at a rate of $19,616 for each million of consolidated EBITDA in excess of our 2010 consolidated EBITDA up to $670 million of consolidated EBITDA. The maximum bonus under Tranche 2 is $700,000. Tranche 3 will be earned at a rate of $33,019 for each million of consolidated EBITDA in excess of $670 million dollars of consolidated EBITDA. There is no maximum amount that may be earned under Tranche 3. The bonus calculation is set forth in tabular format below.
| | | | | | | | |
| | | Consolidated EBITDA | | | Bonus / Million of
Consolidated EBITDA | |
Tranche 1 | | | $0 - $634.3 million | | | | $1,104 | |
Tranche 2 | | | $634.4 - $670 million | | | | $19,616 | |
Tranche 3 | | | Greater than $670 million | | | | $33,019 | |
At the discretion of the Company’s Compensation Committee, Ms. Berger may receive an additional bonus based on the Company’s and her individual performance.
Todd Strubbe. Mr. Strubbe’s base compensation is $500,000. He is also eligible to receive a performance bonus based on the Unified Communications segment Net Operating Income before Corporate Allocations and Before Amortization (“Compensation UC NOI”), at the rates outlined below.
| | | | |
Compensation UC NOI | | Rate | |
$0—$411,622,000 | | | 0.0972 | % |
Over $411,622,000 | | | 1.0 | % |
55
In addition, if West Corporation achieves its 2011 publicly stated EBITDA guidance, Mr. Strubbe will be eligible to receive an additional one-time bonus of $100,000. This bonus is not to be combined or netted together with any other bonus.
At the discretion of the Compensation Committee, Mr. Strubbe may receive an additional bonus based on the Company’s and his individual performance.
Steven Stangl. Mr. Stangl’s base compensation is $500,000. He is also eligible to receive a bonus based on achieving the Communication Services segment net operating Income before Corporate Allocations and Before Amortization (“NOI Bonus”), at the rates outlined below.
| | | | |
NOI Bonus | | Rate | |
$0—$191,987,000 | | | 0.156 | % |
Over $191,987,000 | | | 2.00 | % |
Effective January 1, 2011, Mr. Stangl will also be eligible to receive a bonus of up to $300,000 based on achieving the Communication Services segment revenue of $1,232,844,000 (“Revenue Bonus”), as outlined below.
| | | | |
Revenue Achieved | | Bonus Percentage | |
98% + | | | 100 | % |
95 to 97.99% | | | 80 | % |
90 to 94.99% | | | 50 | % |
89.99% and below | | | 0 | % |
In addition, if West Corporation achieves its 2011 publicly stated EBITDA guidance, Mr. Stangl will be eligible to receive an additional one-time bonus of $100,000. However, in the event West Corporation fails to achieve the 2011 publicly stated EBITDA guidance and the Communication Services segment achieves 98% or more of the 2011 budgeted revenue and 98% of budgeted net operating income before corporate allocations and before amortization, Mr. Stangl will be eligible to receive fifty percent of this $100,000 bonus. This bonus is not to be combined or netted together with any other bonus.
At the discretion of the Compensation Committee, Mr. Stangl may receive an additional bonus based on the Company’s and his individual performance.
Paul Mendlik. Mr. Mendlik’s base compensation is $450,000. He is also eligible to receive a performance bonus based on consolidated EBITDA for West in 2011. Mr. Mendlik’s 2011 bonus shall be earned in three tranches. Tranche 1 will be earned at a rate of $355 for each million dollars of consolidated EBITDA up to the amount of 2010 consolidated EBITDA. The maximum bonus under Tranche 1 is $225,000. Tranche 2 will be earned at a rate of $6,305 for each million of consolidated EBITDA in excess of our 2010 consolidated EBITDA up to $670 million of consolidated EBITDA. The maximum bonus under Tranche 2 is $225,000. Tranche 3 will be earned at a rate of $10,613 for each million of consolidated EBITDA in excess of $670 million dollars of consolidated EBITDA. There is no maximum amount that may be earned under Tranche 3. The bonus calculation is set forth in tabular format below.
| | | | | | | | |
| | | Consolidated EBITDA | | | Bonus / Million of
Consolidated EBITDA | |
Tranche 1 | | | $0 - $634.3 million | | | | $355 | |
Tranche 2 | | | $634.4 - $670 million | | | | $6,305 | |
Tranche 3 | | | $670.1 million or greater | | | | $10,613 | |
At the discretion of the Company’s Compensation Committee, Mr. Mendlik may receive an additional bonus based on the Company’s and his individual performance.
56
In the event that at the end of the year, or upon the Executive’s termination if earlier, the aggregate amount of the bonus which has been advanced to an Executive exceeds the amount of bonus that otherwise would have been payable for 2011 (in the absence of advances) based on the performance during 2011 (or, in the case of termination, based on the performance during 2011 and the projection for performance for the balance of 2011 as of the termination date), then the amount of such excess may, in the discretion of the compensation committee, either (i) result in a “loss carry forward” which shall be applied to the quarterly or year-to-date calculation of bonus payable in subsequent periods, or (ii) be required to be paid back to West, upon request.
Unless otherwise indicated above, all compensation objectives are based upon West’s or the Unified Communications or Communication Services segments’ operations and do not include results derived from mergers, acquisitions, joint ventures or stock buy backs unless approved by the Compensation Committee.
Departure and Election of a Director
On February 21, 2011 the stockholders of the Company, by unanimous written consent, elected Steven G. Felsher to the board of directors. Mr. Felsher’s background can be found in Item 10 below. Mr. Felsher replaces Mr. Steiner who resigned effective February 21, 2011. On February 22, 2011 by unanimous written consent of the Board of Directors, Mr. Felsher was nominated to the Audit Committee. Mr. Felsher replaces Mr. Steiner on the Audit Committee. It was determined that Mr. Felsher’s experiences as a CFO of a publicly traded company would provide valuable insight to the Company as a board member and member of the audit committee.
57
PART III
| ITEM 10. | DIRECTORS, EXECUTIVE OFFICERS AND CORPORATE GOVERNANCE |
Board of Directors
Our board of directors is composed of four outside directors and our Chief Executive Officer. Each director is elected to a term of three years. The following table sets forth information regarding the directors:
| | | | | | |
Name | | Age | | | Position |
Thomas B. Barker | | | 56 | | | Chairman of the Board, Chief Executive Officer and Director |
Anthony J. DiNovi | | | 48 | | | Director |
Steven G. Felsher | | | 61 | | | Director |
Soren L. Oberg | | | 40 | | | Director |
Jeff T. Swenson | | | 35 | | | Director |
The following biographies describe the business experience of each director:
Thomas B. Barkeris the Chairman of the Board and Chief Executive Officer of West Corporation. Mr. Barker joined West Corporation in 1991 as Executive Vice President of West Interactive Corporation. He was promoted to President and Chief Operating Officer of West Corporation in March 1995. He was promoted to President and Chief Executive Officer of the Company in September of 1998 and served as our President until January 2004. Mr. Barker has been a director of the Company since 1997 and Chairman of the Board since March 2008. Mr. Barker is the only director who is also a manager of the Company. Mr. Barker provides insight from his 20 year tenure at West, including 13 years as Chief Executive Officer. His many years of experience running the Company provides an in-depth understanding of the Company’s history and complexity and adds a valuable perspective for Board decision making.
Anthony J. DiNovi is a Co-President of Thomas H. Lee Partners, L.P. Mr. DiNovi joined Thomas H. Lee Partners in 1988. Mr. DiNovi is a director of Dunkin’ Brands, Inc. and several private corporations. In addition, Mr. DiNovi was formerly a director of Michael Foods, Inc., US LEC Corp., American Media Operations, Inc., Vertis, Inc. and Nortek, Inc. Mr. DiNovi has been director of the Company since 2006 and was Chairman of the Board from October 2006 until March 2008. Mr. DiNovi brings to the Board significant experience having served as a director of several large public corporations and as an executive of a financial services company. Mr. DiNovi has substantial experience with complex capital structures and related issues, and with assisting companies in multiple industries with strategic allocation of capital resources.
Steven G. Felsheris a Senior Advisor at Quadrangle Group LLC. Prior to joining Quadrangle Group LLC in January of 2011, Mr. Felsher was until 2007 the Vice Chairman and Chief Financial Officer-Worldwide of Grey Global Group Inc., a publicly-traded, global marketing services company, and was responsible for its integration into WPP Group plc following WPP Group’s acquisition of Grey in March 2005. Mr. Felsher joined Grey in 1979 as a Vice President, became Senior Vice President in 1986, and Chief Financial Officer in 1989. He headed Grey’s Legal Affairs department from 1979 to 1989. Mr. Felsher brings to the Board his experience as a senior executive with particular skills in finance, administration, governance, and other aspects of public and private company management. Mr Felsher joined the Board in 2011.
Soren L. Oberg is a Managing Director of Thomas H. Lee Partners, L.P. Mr. Oberg worked at Thomas H. Lee Partners from 1993 to 1996 and rejoined in 1998. From 1992 to 1993, Mr. Oberg worked at Morgan Stanley & Co. Incorporated in the Merchant Banking Division. Mr. Oberg is a director of Ceridian Corporation, Grupo Corporativo Ono, S.A., and Systems Maintenance Services, Inc. Mr. Oberg formerly was a director of American Media Operations, Inc. from 2003 to 2009 and Vertis, Inc. from 1999 to 2008. Mr. Oberg has been a director of the Company since 2006. Mr. Oberg has substantial experience in investment banking and financial services, and has served as a director of numerous private companies. He is familiar with and has designed highly complex capital structures.
58
Jeff T. Swenson is a Director of Thomas H. Lee Partners, L.P. Mr. Swenson joined Thomas H. Lee Partners in 2004 after attending graduate business school. From 2000 to 2002, Mr. Swenson worked in the private equity group at Bain Capital, LLC. From 1998 to 2000, Mr. Swenson worked at Bain & Company. Mr. Swenson has been a director of the Company since 2006. Mr. Swenson brings to the Board significant experience as an executive of a financial services company. Mr. Swenson’s financial markets experience and insight have helped guide West’s capital structure decisions.
In addition to the individual attributes of each of the directors described above, the Company highly values the collective experience and qualifications of the directors. We believe that the collective experiences, viewpoints and perspectives of our directors results in a Board with the commitment and energy to advance the interests of our stockholders.
The members of the board of directors are not separately compensated for their services as directors, other than reimbursement for out-of-pocket expenses incurred in connection with rendering such services.
Executive Officers Of The Registrant
Our executive officers at December 31, 2010 were as follows:
| | | | | | |
Name | | Age | | | Position |
Thomas B. Barker | | | 56 | | | Chairman of the Board and Chief Executive Officer |
Nancee R. Berger | | | 50 | | | President and Chief Operating Officer |
Mark V. Lavin | | | 52 | | | Chief Administrative Officer |
Paul M. Mendlik | | | 57 | | | Chief Financial Officer and Treasurer |
David C. Mussman | | | 50 | | | Executive Vice President, Secretary and General Counsel |
Steven M. Stangl | | | 52 | | | President—Communication Services |
Todd Strubbe | | | 47 | | | President—Unified Communications |
David J. Treinen | | | 53 | | | Executive Vice President—Corporate Development and Planning |
Thomas B. Barkeris the Chairman of the Board and Chief Executive Officer of West Corporation. Mr. Barker joined West Corporation in 1991 as Executive Vice President of West Interactive Corporation. He was promoted to President and Chief Operating Officer of West Corporation in March 1995. He was promoted to President and Chief Executive Officer of the Company in September of 1998 and served as our President until January 2004. Mr. Barker has been a director of the Company since 1997 and Chairman of the Board since March 2008.
Nancee R. Berger joined West Interactive Corporation in 1989 as Manager of Client Services. Ms. Berger was promoted to Vice President of West Interactive Corporation in May 1994. She was promoted to Executive Vice President of West Interactive Corporation in March 1995 and to President of West Interactive Corporation in October 1996. She was promoted to Chief Operating Officer in September 1998 and to President and Chief Operating Officer in January 2004.
Mark V. Lavinjoined us in 1996 as Executive Vice President—West Telemarketing Corporation, and in September 1998, Mr. Lavin was promoted to President—West Telemarketing Corporation. In January 2008, Mr. Lavin was named Chief Administrative Officer.
Paul M. Mendlik joined us in 2002 as Chief Financial Officer & Treasurer. Prior to joining us, he was a partner in the accounting firm of Deloitte & Touche LLP from 1984 to 2002.
David C. Mussmanjoined West Corporation in January 1999 as Vice President and General Counsel and was promoted to Executive Vice President in 2001. Prior to joining us, he was a partner at the law firm of Erickson & Sederstrom. In 2006, Mr. Mussman became Secretary of the Company.
59
Steven M. Stangljoined West Interactive Corporation in 1993 as Controller. In 1998, Mr. Stangl was promoted to President of West Interactive Corporation. In January 2004, Mr. Stangl was promoted to President, Communication Services.
Todd B. Strubberejoined us in September 2009 as President—Unified Communications. He had previously held the positions of President of West Direct, Inc. and President of West Interactive Corporation between July 2001 and August 2006. Mr. Strubbe served as President, First Data Debit Services in 2006 and 2007. He founded and was Managing Partner of Arbor Capital, LLC during 2008 and 2009. Prior to joining us in 2001, he was President and Chief Operating Officer of CompuBank, N.A. He was with First Data Corporation from 1995 to 2000 as Managing Director, Systems Architecture and Product Development and Vice President of Corporate Planning and Development. Prior to joining First Data, Mr. Strubbe was with McKinsey & Company, Inc.
David J. Treinen joined us in 2007 as Executive Vice President, Corporate Development and Planning. Prior to joining West Corporation, he served as Executive Vice President, Corporate Development and Strategy for First Data Corporation from September 2006 until September 2007. Prior to that assignment Mr. Treinen held a number of responsibilities with First Data Corporation including Senior Vice President from February 2006 to August 2006, President of First Data Government Solutions from April 2004 to January 2006 and Managing Director of eONE Global, a First Data Corporation subsidiary, from November 2000 through March 2004.
CORPORATE GOVERNANCE
Code of Ethics
We have adopted a code of ethical conduct for directors and all employees of West. Our Code of Ethical Business Conduct is located in the “Financial Information” section of our website at www.west.com. To the extent permitted, we intend to post on our web site any amendments to, or waivers from, our Code of Ethical Business Conduct.
Audit Committee
The purpose of the audit committee is set forth in the audit committee charter. The committee’s primary duties and responsibilities are to:
| | • | | Appoint, compensate, retain and oversee the work of any registered public accounting firm engaged for the purpose of preparing or issuing an audit report or performing other audit, review or attest services and review and appraise the audit efforts of the Company’s independent accountants; |
| | • | | Establish procedures for (i) the receipt, retention and treatment of complaints regarding accounting, internal accounting controls or auditing matters and (ii) confidential, anonymous submissions by our employees of concerns regarding questionable accounting or auditing matters; |
| | • | | Engage independent counsel and other advisers, as necessary; |
| | • | | Determine funding of various services provided by accountants or advisers retained by the committee; |
| | • | | Review our financial reporting processes and internal controls; |
| | • | | Review and approve related-party transactions or recommend related-party transactions for review by independent members of our board of directors; and |
| | • | | Provide an open avenue of communication among the independent accountants, financial and senior management and the board. |
The members of the audit committee are Mr. Jeff T. Swenson, Mr. Soren L. Oberg and Mr. Steven G. Felsher. Because the board of directors has been unable to conclude definitively at this time that any member of
60
its audit committee is an “audit committee financial expert” as defined in Item 407(d)(5) of Regulation S-K, the board of directors has determined that it currently does not have an audit committee financial expert serving on its audit committee. Nonetheless, the board is satisfied that all members of the Company’s audit committee have sufficient expertise and business and financial experience necessary to perform their duties as members of the audit committee effectively.
Compensation Committee
The purpose of the compensation committee is to discharge the responsibilities of our board of directors relating to compensation of our directors and executive officers. The compensation committee reviews and recommends to our board of directors compensation plans, policies and programs and approves specific compensation levels for all executive officers. The current members of the compensation committee are Mr. Thomas B. Barker and Mr. Anthony J. DiNovi.
With respect to compensation matters for each named executive officer other than Mr. Barker, Mr. Barker solicits information and recommendations on each executive’s duties, responsibilities, business goals, objectives and upcoming challenges of the businesses from Mr. Mendlik, the Chief Financial Officer (“CFO”), and Ms. Berger, the President and Chief Operating Officer (“COO”). Mr. Barker provides Mr. DiNovi his recommendation of compensation for each named executive officer. After reviewing and discussing Mr. Barker’s recommendations for each named executive officer Mr. DiNovi and Mr. Barker establish the compensation of the management team generally and Mr. DiNovi establishes Mr. Barker’s compensation independently.
| ITEM 11. | EXECUTIVE COMPENSATION |
COMPENSATION DISCUSSION AND ANALYSIS
Objectives
The objectives of our executive compensation plans are to recruit, retain and motivate the most talented individuals available to meet or exceed our business objectives.
Our compensation plans are designed to reward executives for achievement of objective financial goals related to the executives’ scope of responsibility that, in the aggregate, comprise our business objectives. The objective financial goals vary between reporting segments and among departments within those segments as well as among different corporate functions. The purpose of our compensation plans is to tailor executive compensation to the particular objective financial goals that the individual can most control as well as those goals that, if achieved, will have the greatest positive impact on our business objectives.
The compensation committee, which in 2010 consisted of Mr. Barker and Mr. DiNovi, determines the annual cash salary and bonuses of executives based upon recommendations from Mr. Barker. During several telephonic meetings of the compensation committee, Mr. Barker, the CEO, presented his evaluation of each executive and recommended the 2010 annual cash salary and bonuses for each executive, excluding himself. In making his recommendations, Mr. Barker solicited information and recommendations on each executive’s duties, responsibilities, business goals, objectives and upcoming challenges of the business from Mr. Mendlik, the CFO, and Ms. Berger, the President and COO. As part of the discussions during the telephonic compensation committee meetings, the compensation committee considered, among other factors, our ability to replace the executive in the event of the executive’s departure, the executive’s responsibilities, the size of the organization (including number of employees, revenue and profitability under the executive’s control), the amount received by others in relatively similar positions within the company, title and the period of time since the executive’s base salary was last changed. Mr. DiNovi also discussed the compensation committee’s recommendations with Mr. Steiner, a member of our board in 2010. Following the discussion with Mr. Steiner, the compensation committee approved final annual base salary and bonus recommendations at the compensation committee’s December 17, 2009 meeting. These recommendations were consistent with Mr. Barker’s recommendations, with changes based on the discussions between Mr. DiNovi and Mr. Barker.
61
Compensation Elements
Short-Term
We primarily rely upon cash compensation to achieve quarterly objective financial goals. We believe that a market-competitive annual salary, supplemented with performance-based cash bonuses, provides the basis for recruiting and retaining talented individuals who have the ability and motivation to achieve our objective financial goals. Each executive receives a portion of his or her projected annual cash bonus quarterly if we meet or exceed the objective financial goals for the quarter. The methodology for determining bonuses is set forth in the medium-term section of this report.
Executive performance is not considered in determining annual salary. Rather, annual salary is designed to provide adequate compensation to recruit and retain talented individuals that have the ability and desire to achieve the objective financial goals that ultimately determine medium and long-term compensation.
Recommendations for each executive officer’s base salary and target bonus are provided to the compensation committee by our CEO annually, as described above under “—Compensation Discussion and Analysis—Objectives.” Factors considered by Mr. Barker in making such recommendations include:
| | • | | A review of the scope of responsibilities of the executive compared to what was required of him or her in the previous year; |
| | • | | Assignment of financial and operational targets related to specific business objectives; |
| | • | | The qualitative analysis and recommendations of the CFO and COO; and |
| | • | | Time since base salary was last changed. |
After Mr. Barker reviews the goals and objectives for the executives for the upcoming year, the expected duties, expected contribution of the relevant business unit to our profitability, the recommendations of the CFO and COO and the time since the last change in base salary, he recommends a targeted compensation amount to Mr. DiNovi. These recommendations are discussed with Mr. DiNovi and are approved at the compensation committee’s telephonic meetings. Mr. DiNovi considers Mr. Barker’s compensation independently. Mr. DiNovi did not undertake a formal benchmarking process to evaluate Mr. Barker’s 2010 compensation. Generally, no more than half of an executive’s targeted compensation consists of base salary. The percentage of compensation derived from base salary generally declines as the executive’s position or responsibilities within our company grow.
Our goal is to reward the achievement of objective financial goals and assumption of additional responsibilities. The compensation committee makes a qualitative analysis of these items as well as the potential impact the success or failure of the executive with respect to these items will have on us. We also recognize that many of our executives have opportunities for alternative employment and aim to establish salary and bonus packages that are competitive with such alternatives. In determining the differences among the executives’ compensation in 2010, the committee relied on Mr. Barker’s qualitative analysis of the factors described above.
Medium-Term
We primarily rely upon cash bonuses, paid quarterly and annually based upon annual objective financial goals, to compensate employees for medium-term performance. We have designed our cash bonuses to represent a significant portion of the targeted total annual cash compensation of our named executive officers. We pay performance-based bonuses only upon the achievement of pre-determined objective financial goals. Historically, the more senior the executive position in West, the greater percent of that executive’s compensation consists of bonuses versus salary.
To timely reward executives, we pay a portion of the projected annual cash bonuses on a quarterly basis provided the pre-determined objective financial goals were met for that quarter and the annual objectives are
62
projected to be met. For corporate based plans, we retain 25% of the quarterly bonuses, and pay such holdback in February of the following year provided the annual objective financial goals are met. In the event the annual objective financial goals are not met, we retain the option to offset any pro-rata quarterly portion of the bonus that was paid in anticipation of meeting the annual objective financial goals against future earned bonuses.
The compensation committee approves our objective financial goals and then approves compensation packages with performance-based financial measurements that the compensation committee believes will adequately motivate the executives to meet those goals. Performance-based financial measurements used by us include, but are not limited to, adjusted net income, pre tax net income, net income, net operating income, Adjusted EBITDA as described herein, revenue, expenses and days sales outstanding. For 2010, the objective financial measurement approved by the compensation committee for the named executive officers was Compensation EBITDA. Compensation EBITDA, for purposes of bonus calculations in 2010, was defined as EBITDA less the after tax interest expense of acquisitions made in 2010. Further, the compensation committee approved the inclusion of the post-acquisition EBITDA results of SKT, Holly and TuVox in determining whether the financial measurements had been satisfied.
Barker
In 2010, Mr. Barker earned a performance bonus based on consolidated Compensation EBITDA growth for us. Compensation EBITDA for each quarter was compared to the same quarter in 2009. Each one million dollar increase of 2010 Compensation EBITDA (adjusted for bonus calculation purposes) over 2009 Compensation EBITDA of $590,286,489 resulted in a $21,060 bonus. In the event 2010 Compensation EBITDA had exceeded $690,000,000 for the year, Mr. Barker would have received $26,325 for every $1,000,000 of Compensation EBITDA above that threshold. 2010 Compensation EBITDA for bonus purposes was calculated by starting with the EBITDA and adjusting downward for the after tax effect of interest expense associated with the 2010 acquisitions. The sum of these adjustments was $565,591 resulting in Compensation EBITDA for bonus purposes of $633,748,503. Mr. Barker’s 2010 bonus calculation was ($633,748,503—$590,286,489)/1,000,000 x $21,060 = $915,310. Mr. Barker received a special bonus of $514,998 equal to the estimated tax liability of Mr. Barker on the distribution of shares of Company common stock valued at $1,287,495 from the Company’s Non-Qualified Deferred Compensation Plan.
Berger
In 2010, Ms. Berger earned a performance bonus based on consolidated Compensation EBITDA growth for us. Compensation EBITDA for each quarter was compared to the same quarter in 2009. Each one million dollar increase of 2010 Compensation EBITDA (adjusted for bonus calculation purposes) over 2009 Compensation EBITDA of $590,286,489 resulted in a $14,040 bonus. In the event 2010 Compensation EBITDA had exceeded $690,000,000 for the year, Ms. Berger would have received $17,550 for every $1,000,000 of Adjusted EBITDA above that threshold. Ms. Berger’s 2010 bonus calculation is identical to Mr. Barker’s calculation, except the bonus per one million dollars of growth was $14,040, resulting in a 2010 bonus calculation for Ms. Berger of $610,207.
Strubbe
In 2010, Mr. Strubbe’s bonus calculation was composed of two components. Under the first component Mr. Strubbe could have earned a bonus of 0.095% applied to the net operating income before corporate allocations and before amortization for the Unified Communications segment up to $422,000,000. If net operating income before corporate allocations and before amortization for the Unified Communications segment exceeded $422,000,000 a bonus rate of 1.0% would be applied to the excess. The second component was based on West Corporation’s achievement of a minimum 2010 EBITDA objective originally established when the Company provided its guidance in February 2010. That guidance indicated EBITDA of $675 million to $705 million. 2010 EBITDA was $634.3 million, therefore, the second component of Mr. Strubbe’s performance
63
bonus resulted in a zero payout. The 2010 net operating income before corporate allocations and before amortization by the Unified Communications segment was $374,737,528. This resulted in a $356,001 bonus ($374,737,528 x 0.095%) for meeting the first component objective.
Stangl
In 2010, Mr. Stangl’s bonus calculation was composed of two components. Under the first component Mr. Stangl could have earned a bonus of 0.21% applied to the net operating income before corporate allocations and before amortization for the Communication Services segment up to $210,000,000. If net operating income before corporate allocations and before amortization for the Communication Services segment exceeded $210,000,000, a bonus rate of 2.0% would be applied to the excess. The second component was based on West Corporation’s achievement of a minimum 2010 EBITDA objective originally established when the Company provided its guidance in February 2010. That guidance indicated EBITDA of $675 million to $705 million. 2010 EBITDA was $634.3 million, therefore, the second component of Mr. Stangl’s performance bonus resulted in a zero payout. The 2010 net operating income before corporate allocations and before amortization by the Communication Services segment was $184,731,275. This resulted in a $387,936 bonus ($184,731,275 x 0.21%) for meeting the first component objective.
Mendlik
In 2010, Mr. Mendlik earned a performance bonus based on consolidated Compensation EBITDA growth. Compensation EBITDA for each quarter was compared to the same quarter in 2009. Each one million dollar increase of 2010 Compensation EBITDA (adjusted for bonus calculation purposes) over 2009 Compensation EBITDA of $590,286,489 resulted in a $5,516 bonus. In the event 2010 Compensation EBITDA had exceeded $690,000,000 for the year, Mr. Mendlik would have received $6,895 for every $1,000,000 of Compensation EBITDA above that threshold. Mr. Mendlik’s 2010 bonus calculation is identical to Mr. Barker’s and Ms. Berger’s calculation, except the bonus per one million dollars of growth was $5,516, resulting in a 2010 bonus calculation for Mr. Mendlik of $239,736.
Periodically executives earn discretionary bonuses to recognize results or significant efforts that may not be reflected in the financial measurements set forth above. We believe that these discretionary bonuses are necessary when important company events require significant time and effort by the executive in addition to the time and effort needed for meeting our target financial objectives.
Long-Term
We primarily rely upon equity-based plans to recruit talented individuals and to motivate them to meet or exceed our long-term business objectives.
Equity Based Compensation Plans
Following our recapitalization on October 24, 2006, the board of directors adopted the West Corporation 2006 Executive Incentive Plan. At the time of our recapitalization in 2006, we allocated approximately 8% of the outstanding common stock for restricted stock grants and 3% of the outstanding common stock for option grants.
Recapitalization Grants
Following the recapitalization, we granted restricted stock grants to our senior executives rather than options. Our decision to make a greater use of restricted stock as a long-term compensation mechanism was based in part on the ability of executives to file so-called “Section 83(b) elections” in connection with each restricted stock grant. A Section 83(b) election allows each executive to pay federal income taxes on the value of the restricted stock grant at the time he or she receives that grant, rather than paying taxes on the value of the grant when the grant vests. The election also allows the executive to begin the holding period for capital gains treatment at the time of grant rather than at the time of vesting.
64
The vesting of the 2006 restricted stock grants is based upon both the passage of time and performance-based conditions. We believe that our long-term objectives are to create enterprise value and monetize that value in an exit event. We also believe that the vesting of a portion of the restricted stock grants should be based upon the passage of time as a mechanism to encourage executives to remain a part of the organization. Without limiting the foregoing, the plan administrator may at any time accelerate the vesting or exercisability of an award, regardless of any adverse or potentially adverse tax consequences resulting from such acceleration.
As of December 31, 2010, the vesting of all outstanding restricted stock grants under our restricted stock program was divided into three tranches. The first tranche of 33.33% of each grant vests ratably over a five-year period of time from the grant date. The purpose of this form of vesting is to retain talented executives for an extended period of time. The remaining 66.67% of the restricted stock grants vest based upon performance criteria tied to an exit event for the new controlling shareholders who were the primary investors of equity in the Company at the time of the recapitalization (“Sponsors”). Under the restricted stock award agreements, an exit event is defined as a transaction which results in the sale of at least 80% of our stock held by the Sponsors for cash or other marketable securities. The performance criteria for the remaining 66.67% of the restricted stock grant are as follows:
| | • | | Tranche 2 shares, which are equal to 22.22% of each grant, shall become 100% vested upon an exit event of the Sponsors if, after giving effect to any vesting of the Tranche 2 shares on the exit event, the Sponsors’ total return is greater than 200% and the Sponsors’ internal rate of return exceeds 15%. |
| | • | | Tranche 3 shares, which equal 44.45% of each grant, will be eligible to vest upon an exit event if, after giving effect to any vesting of the Tranche 2 shares and/or Tranche 3 shares on the exit event, the Sponsors’ total return is more than 200% and their internal rate of return exceeds 15%, with the amount of Tranche 3 shares vesting ratably, using a straight line method, upon the exit event depending on the amount by which the Sponsors’ total return exceeds 200%, based on the following conditions: |
| | • | | 100% vest, if, after giving effect to any vesting of the Tranche 2 shares and/or the Tranche 3 shares on an exit event, the total return is equal to or greater than 300%; |
| | • | | 0% vest, if, after giving effect to any vesting of the Tranche 2 shares and/or the Tranche 3 shares on an exit event, the total return is 200% or less; and |
| | • | | if, after giving effect to any vesting of the Tranche 2 shares and/or the Tranche 3 shares on an exit event, the total return is greater than 200% and less than 300%, then the Tranche 3 shares shall vest by a percentage between 0% and 100% determined on a straight line basis as the total return increases from 200% to 300%. |
This vesting schedule was adopted to align the interests of executive management with the Sponsors. The purpose of the vesting schedule was to create incentives for reaching specified returns at the time of an exit event.
On May 4, 2009, as authorized by the board, we entered into an amended and restated restricted stock award and special bonus agreement with Mr. Barker, related to the award of 1,650,000 shares of restricted Class A Common Stock originally made on December 1, 2006. As with the original agreement, the vesting of the restricted stock grant is divided into three tranches, with the Tranche 1, of 33.33% of such grant, vesting ratably over a five-year period of time commencing with the date of original grant, provided that vesting shall be accelerated in the event of an initial public offering or change of control. Under the amended agreement, the remaining 66.67% of the restricted stock grant vests based upon performance criteria tied to an exit event for the Sponsors, a sale of our company and period of employment. The vesting criteria are as follows:
| | • | | Tranche 2 shares, which are equal to 22.22% of Mr. Barker’s grant, will become 100% vested upon an exit event of the Sponsors or sale of our company if, after giving effect to any vesting of the Tranche 2 shares on the exit event or sale of our company, the Sponsors’ total return is greater than 200% and the Sponsors’ internal rate of return exceeds 15%. |
65
| | • | | Tranche 3 shares, which are equal to 44.45% of Mr. Barker’s grant, shall become 50% vested upon the earliest to occur of an exit event of the Sponsors, a sale of our company and December 1, 2011, and shall become vested with respect to the other 50% of the Tranche 3 shares upon an exit event of the Sponsors or sale of our company if, after giving effect to any vesting of the Tranche 2 and Tranche 3 shares on the exit event or sale of our company, the Sponsors’ total return is greater than 200% and the Sponsors’ internal rate of return exceeds 15%. |
A sale of our company is defined in the amended agreement as a sale of our assets accounting for 80% or more of our consolidated EBITDA or a sale or other disposition of 80% of the shares held by the Sponsors for consideration other than cash or marketable securities. In addition, all of Mr. Barker’s Tranche 2 and Tranche 3 shares vest upon an initial public offering of the Company.
Annual Grants
The Company continues to believe that the long-term business objectives of the Company and its shareholders are best achieved through the use of equity-based grants. Because there is no current public market for the Company’s equity, and thus no public price, the grants, if any, will generally be made on an annual basis with a grant or exercise price based on fair market valuation of our equity determined by an independent appraisal. The compensation committee determines the size of restricted stock grants under the 2006 Plan based upon the CEO’s determination of the overall value of the executive to the Company, including the following factors: 1) the executive’s expected impact on the Company’s financial objectives; 2) recommendations of other members of senior management; 3) the Company’s ability to replace the executive in the event of the executive’s departure; 4) the size of the organization including number of employees, revenue and income under the executive’s control; 5) the amount received by others in relatively similar positions within the Company; and 6) title. The Company has not based, and does not expect to base, future grants on the value of prior grants. There were no grants to the named executive officers in 2010.
Other Long-Term Benefit Plans
We also provide a Nonqualified Deferred Compensation Plan, which we refer to as our Deferred Compensation Plan, to certain of our senior level executives. Eligible executives are allowed to defer annually their bonus and up to 50% of salary not to exceed $500,000, in each case, attributable to services performed in the following plan year. The plan provides that the deferrals are credited with notional earnings based on notional shares of various mutual funds or notional equity interests in our company, at the election of the executive. If the executive chooses notional equity interests in our company as the investment alternative we match a portion of the executive’s deferrals. For 2010, the matching contribution was 50%. Matching contributions to the plan vest ratably over a five-year period beginning on January 1, 2007 or, if later, the date the executive first participates in the plan. The vested portion of the participant’s account under the plan will be paid on the date specified by the participant which can be no earlier than five years following the plan year of deferral or, if earlier, the date the participant separates from service with us. Deferrals credited with earnings based on notional equity interests are paid through the issuance of our shares. Recipients of the shares have no equity or contractual put right with respect to the shares until distributed to them in accordance with the plan. We believe this plan further aligns the interests of executive management and the long term goals of equity holders by providing an ongoing plan that allows executives to increase their equity interest in us.
We also provide a 401(k) plan and a deferred compensation “top hat” plan pursuant to sections 201(2) and 301(a)(3) of ERISA, which we refer to as our Executive Retirement Savings Plan. We match contributions up to 14% of income or the statutory limit, whichever is less. We believe that such plans provide a mechanism for the long-term financial planning of our employees. We have chosen not to include our equity in either plan or to base our matching contributions on individual performance.
66
Other
We provide discretionary perquisites from time to time for purpose of motivating employees, creating goodwill with employees and rewarding employees for achievements that may not be measurable financial objectives. We do not believe perquisites should be a significant element of our compensation program.
We provide health and benefits plans and reimburse employees for approved business related expenses.
COMPENSATION COMMITTEE REPORT
The information contained in this report shall not be deemed to be “soliciting material” or “filed” or incorporated by reference in future filings with the SEC, or subject to the liabilities of Section 18 of the Securities Exchange Act of 1934, except to the extent that the Company specifically incorporates it by reference into a document filed under the Securities Act of 1933 or the Securities Exchange Act of 1934.
The compensation committee of the board of directors of West Corporation oversees West Corporation’s compensation program on behalf of the board. In fulfilling its oversight responsibilities, the compensation committee reviewed and discussed with management the Compensation Discussion and Analysis set forth in this Annual Report on Form 10-K.
In reliance on the review and discussions referred to above, the compensation committee recommended to the board that the Compensation Discussion and Analysis be included in the Company’s Annual Report on Form 10-K for the fiscal year ended December 31, 2010, which will be filed with the Securities and Exchange Commission.
COMPENSATION COMMITTEE
Thomas B. Barker
Anthony J. DiNovi
67
Summary Compensation
The following table shows compensation information for 2010, 2009 and 2008 for the named executive officers, as applicable.
2010 Summary Compensation Table
| | | | | | | | | | | | | | | | | | | | | | | | | | | | |
Name and Principal Position (a) | | Year
(b) | | | Salary
($) (c) | | | Bonus
($) (d) | | | Stock
Awards (1)
($) (e) | | | Non-Equity
Incentive Plan
Compensation (2)
($) (f) | | | All Other
Compensation
(3) ($) (g) | | | Total ($)
(h) | |
Thomas B. Barker | | | 2010 | | | | 900,000 | | | | — | | | | — | | | | 915,310 | | | | 781,313 | | | | 2,596,623 | |
Chief Executive Officer | | | 2009 | | | | 900,000 | | | | — | | | | — | | | | 1,373,281 | | | | 297,110 | | | | 2,570,391 | |
and Director | | | 2008 | | | | 897,500 | | | | — | | | | — | | | | 1,291,800 | | | | 255,438 | | | | 2,444,738 | |
| | | | | | | |
Nancee R. Berger | | | 2010 | | | | 600,000 | | | | — | | | | — | | | | 610,207 | | | | 181,355 | | | | 1,391,562 | |
President and Chief | | | 2009 | | | | 600,000 | | | | — | | | | — | | | | 915,682 | | | | 419,180 | | | | 1,934,862 | |
Operating Officer | | | 2008 | | | | 598,077 | | | | — | | | | — | | | | 738,135 | | | | 129,706 | | | | 1,465,918 | |
| | | | | | | |
Todd B. Strubbe | | | 2010 | | | | 500,000 | | | | — | | | | — | | | | 356,001 | | | | 59,060 | | | | 915,061 | |
President Unified Communications | | | 2009 | | | | 125,000 | | | | 100,000 | | | | 1,205,213 | | | | — | | | | 2,142,591 | | | | 3,572,804 | |
| | | | | | | |
Steven M. Stangl | | | 2010 | | | | 450,000 | | | | — | | | | — | | | | 387,936 | | | | 61,242 | | | | 899,178 | |
President Communication Services | | | 2009 | | | | 450,000 | | | | — | | | | — | | | | 467,367 | | | | 124,564 | | | | 1,041,931 | |
| | | 2008 | | | | 446,538 | | | | — | | | | — | | | | 414,555 | | | | 142,231 | | | | 1,003,324 | |
| | | | | | | |
Paul M. Mendlik | | | 2010 | | | | 450,000 | | | | — | | | | — | | | | 239,736 | | | | 93,573 | | | | 783,309 | |
Chief Financial Officer and Treasurer | | | 2009 | | | | 450,000 | | | | 93,951 | | | | — | | | | 359,715 | | | | 282,384 | | | | 1,186,050 | |
| | | 2008 | | | | 448,077 | | | | — | | | | — | | | | 332,148 | | | | 229,153 | | | | 1,009,378 | |
| (1) | The amount in this column constitutes a 2009 restricted stock award under our 2006 Executive Incentive Plan. The amount is the aggregate grant date fair value of Tranche 1 of the awards computed in accordance with Financial Accounting Standards Board Accounting Standards Codification Topic 718,Compensation— Stock Compensation (“ASC Topic 718”). In accordance with ASC Topic 718, the grant date fair value for the Tranche 2 and Tranche 3 shares is reported as zero until the occurrence of an exit event and satisfaction of the required performance criteria is considered probable. If the performance criteria of Tranches 2 and 3 were achieved then, assuming satisfaction of the maximum performance achievement levels for those tranches, the grant date fair value of Tranches 2 and 3 of Mr. Strubbe’s 2009 restricted stock grant was $2,410,787 in addition to the $1,205,213 value of Tranche 1. See note 14 of the notes to the consolidated financial statements included in this report for a discussion of the relevant assumptions used in calculating this amount pursuant to ASC Topic 718. |
| (2) | The amounts in this column constitute performance-based payments earned under employment agreements approved by the compensation committee prior to the beginning of each fiscal year. Please see the “Compensation Discussion and Analysis” for further information regarding these performance based payments. |
| (3) | Amounts included in this column are set forth by category below in the 2010 “All Other Compensation Table”. |
68
2010 All Other Compensation Table
| | | | | | | | | | | | | | | | |
Name (a) | | Tax
Reimbursements
(1)
(b) | | | Insurance
Premiums
($) (2)
(c) | | | Company
Contributions
to Retirement
Plans
($) (3)
(d) | | | Total ($)
(e) | |
| | | | |
Thomas B. Barker | | | 514,998 | | | | 8,065 | | | | 258,250 | | | | 781,313 | |
Nancee R. Berger | | | — | | | | 6,985 | | | | 174,370 | | | | 181,355 | |
Todd B. Strubbe | | | — | | | | 810 | | | | 58,250 | | | | 59,060 | |
Steven M. Stangl | | | — | | | | 1,242 | | | | 60,000 | | | | 61,242 | |
Paul M. Mendlik | | | — | | | | 2,322 | | | | 91,251 | | | | 93,573 | |
| (1) | Mr. Barker was paid a special bonus in the amount necessary to pay federal and state income taxes associated with a distribution from the Deferred Compensation Plan. |
| (2) | Includes premiums paid by us for group term life insurance for each of our named executive officers. In addition, this column includes Company paid medical and dental premiums for Mr. Barker and Ms. Berger. |
| (3) | Includes the employer match on the Executive Deferred Compensation Plan, Qualified Retirement Savings Plan and Non-qualified Deferred Compensation Plan. |
2010 Grants of Plan-Based Awards
The following table shows awards made to our named executive officers in 2010.
| | | | | | | | |
| | | Estimated Possible
Payouts Under
Non-Equity Incentive
Plan Awards (1) | |
Name (a) | | Target
($) (b) | | | Maximum
($) (c) | |
Thomas B. Barker | | | 2,100,000 | | | | N/A | |
Nancee R. Berger | | | 1,400,000 | | | | N/A | |
Todd B. Strubbe | | | 500,000 | | | | N/A | |
Steven M. Stangl | | | 550,000 | | | | N/A | |
Paul M. Mendlik | | | 550,000 | | | | N/A | |
| (1) | The employment agreements for each named executive officer provide for performance-based payments if certain financial measures are achieved. These performance measures, which were approved by the compensation committee, include potential targets. The performance-based payment incentives for the named executive officers did not provide for a maximum amount which could be earned and are noted in the table above as N/A (not applicable). Amounts actually earned under the employment agreements are reflected in column (f) to the Summary Compensation Table. Please see the “Compensation Discussion and Analysis” section for further information regarding these performance measures and payouts. |
Employment Agreements
During 2010, all of the named executive officers were employed pursuant to agreements with us. Each employment agreement sets forth, among other things, the named executive officer’s minimum base salary, non-equity incentive compensation opportunities and entitlement to participate in our benefit plans. The employment agreements are updated annually to reflect salary and bonus objectives for the applicable year.
69
Salary and Bonus
The 2010 base salaries for the named executive officers established by the compensation committee on February 11, 2010 were: Mr. Barker, Chief Executive Officer, $900,000; Ms. Berger, President and Chief Operating Officer, $600,000; Mr. Strubbe, President—Unified Communications $500,000; Mr. Stangl, President—Communication Services, $450,000 and Mr. Mendlik, Chief Financial Officer and Treasurer, $450,000.
We have designed our non-equity incentive compensation to represent a significant portion of targeted total annual cash compensation of named executive officers. We pay performance-based bonuses only upon the achievement of pre-determined objective financial goals. The objective financial goals are tailored to the business objectives of the business unit or units managed by the named executive officer. The 2010 objective financial measurement was Compensation EBITDA for Mr. Barker, Ms. Berger and Mr. Mendlik. Mr. Strubbe’s 2010 objective financial measurements were Unified Communications net operating income before corporate allocations and amortization and the achievement of a minimum EBITDA by West Corporation. Mr. Stangl’s 2010 objective financial measurements were Communication Services net operating income before corporate allocations and amortization and the achievement of a minimum EBITDA by West Corporation. Please see the “Compensation Discussion and Analysis” for a discussion of the specific incentive-based targets for each of the named executive officers.
Term and Termination
The term of each Employment Agreement commenced on January 1, 2009, except Mr. Strubbe’s which commenced on September 28, 2009, and continues indefinitely until terminated pursuant to its terms. Each Employment Agreement terminates immediately upon the death of the executive and may otherwise be terminated voluntarily by either party at any time.
In the event that an employment agreement is terminated, the executive is entitled to severance payments determined by the nature of the termination. If we terminate an employment agreement for Cause (as described below), the executive is entitled only to the obligations already accrued under his or her employment agreement (any such obligations are referred to as “accrued obligations”). An executive who dies is entitled to the accrued obligations and the earned bonus for the year in which his or her death occurs. If an executive terminates his or her employment agreement without Good Reason (as described below), the executive is entitled to receive any accrued obligations and, if the executive is providing consulting services, a multiple of his or her base salary payable in equal installments for the consulting period beginning on the date of the termination. If we terminate an employment agreement without Cause or if an executive terminates his or her employment agreement for Good Reason, the executive is entitled to receive any accrued obligations and a multiple of that executive’s base compensation payable in equal installments for the one or two-year period beginning on the date of the termination and, if the executive is providing consulting services to us, an amount equal to the projected annual bonus payable to that executive as of the date of the termination, payable in equal installments for the one or two-year period beginning on the date of the termination. For purposes of determining the severance benefits under the employment agreement, the severance multiple is equal to one for Mr. Strubbe and two for all of the other named executive officers. In any case where our obligation to make severance payments to an executive is conditioned on that executive’s provision of consulting services to us, that obligation terminates immediately in the event that the executive ceases to provide such consulting services within the two-year period beginning on the date of the termination.
Under the employment agreements, “cause” shall be deemed to exist if there is a determination that the executive has engaged in significant objective acts or omissions constituting dishonesty, willful misconduct, or gross negligence relating to our business. The employment agreements define “good reason” as the occurrence of one of the following events without the consent of the executive:
| | • | | both (i) a reduction in any material respect in the executive’s position(s), duties or responsibilities with the company, and (ii) an adverse material change in the executive’s reporting responsibilities, titles or |
70
| | offices with the company, other than, for purposes of clauses (i) and (ii), a reduction or adverse change attributable to the fact that the company is no longer a privately-held company; |
| | • | | a reduction of 20 percent (20%) or more in the executive’s rate of annual base salary other than a reduction made after the company determines such reduction is a reasonably necessary step or component to address potential breaches or violations of any debt covenants; or |
| | • | | any requirement of the company that the executive be based more than 50 miles from the facility where the executive is based as of the date of the employment agreement. |
Consulting Services
If we terminate an employment agreement without Cause or if an executive terminates his or her employment agreement with or without Good Reason, we will retain the executive as a consultant for a period of one or two years (as described above) from the date of the termination. During the consulting period, the executive will receive compensation from us as described above and will remain covered under all medical, dental, vision, flexible spending account and executive assistance plans or programs available to our actively employed executives. The executive may terminate his or her consulting obligations to us at any time during the consulting period. In the event that an executive chooses to engage in other employment, the consulting period and the parties’ respective obligations are immediately terminated.
Restrictive Covenants
Pursuant to each employment agreement, each executive is subject to restrictive covenants related to the protection of confidential information, non-competition, inventions and discoveries, and the diversion of our employees. An executive’s breach of any of the restrictive covenants contained in an employment agreement entitles us to injunctive relief and the return of any severance payments (excluding accrued obligations) in addition to any other remedies to which we may be entitled.
Restricted Stock and Stock Option Awards
In 2010, no named executive officers received grants of restricted stock or stock options.
We do not have specific targets or objectives with respect to the amount of salary and bonus in proportion to total compensation. Generally, the most senior executives and highest paid executives earn a larger percentage of total compensation through performance-based bonuses and equity-based compensation.
71
Outstanding Equity Awards
The following table shows all outstanding equity awards held by the named executive officers as of December 31, 2010.
2010 Outstanding Equity Awards At Fiscal Year-End Table
| | | | | | | | | | | | | | | | | | | | | | | | | | | | |
| | | Option Awards | | | Stock Awards | |
Name (a) | | Number of
Securities
Underlying
Unexercised
Options (#)
Exercisable
(1) (b) | | | Option
Exercise
Price
($) (e) | | | Option
Expiration
Date (d) | | | Number of
Shares or
Units of
Stock That
Have Not
Vested (#)
(2) (e) | | | Market
Value of
Shares or
Units of
Stock That
Have Not
Vested (4)
($) (f) | | | Equity
Incentive
Plan
Awards:
Number
of
Unearned
Shares,
Units or
Other
Rights
That
Have Not
Vested
(#) (3) (g) | | | Equity
Incentive
Plan
Awards:
Market or
Payout
Value of
Unearned
Shares,
Units or
Other
Rights
That Have
Not Vested
($) (4) (h) | |
Thomas B. Barker | | | 2,229 | | | | 33.00 | | | | 1/2/2012 | | | | 238,350.5 | | | | 2,526,515 | | | | 733,343 | | | | 7,773,436 | |
| | | 1,597.5 | | | | 33.00 | | | | 4/2/2012 | | | | | | | | | | | | | | | | | |
| | | 2,482 | | | | 33.00 | | | | 7/1/2012 | | | | | | | | | | | | | | | | | |
| | | 3,046.5 | | | | 28.23 | | | | 10/1/2012 | | | | | | | | | | | | | | | | | |
| | | 7,862 | | | | 38.15 | | | | 4/1/2013 | | | | | | | | | | | | | | | | | |
| | | 45,143.5 | | | | 33.00 | | | | 4/1/2013 | | | | | | | | | | | | | | | | | |
| | | 4,400.5 | | | | 33.00 | | | | 7/1/2013 | | | | | | | | | | | | | | | | | |
| | | 4,865 | | | | 33.00 | | | | 10/1/2013 | | | | | | | | | | | | | | | | | |
| | | 3,382 | | | | 33.00 | | | | 1/2/2014 | | | | | | | | | | | | | | | | | |
| | | 3,192.5 | | | | 33.00 | | | | 4/1/2014 | | | | | | | | | | | | | | | | | |
| | | 2,963.5 | | | | 33.00 | | | | 7/1/2014 | | | | | | | | | | | | | | | | | |
| | | 2,568 | | | | 33.00 | | | | 10/1/2014 | | | | | | | | | | | | | | | | | |
| | | 1,017 | | | | 33.00 | | | | 1/3/2015 | | | | | | | | | | | | | | | | | |
| | | | | | | | | | | | | | | | | | | | | | | | | | | | |
| | | 84,749 | | | | | | | | | | | | | | | | | | | | | | | | | |
Nancee R. Berger | | | 7,041 | | | | 33.00 | | | | 7/1/2013 | | | | 49,995 | | | | 529,947 | | | | 500,025 | | | | 5,300,265 | |
| | | 7,784 | | | | 33.00 | | | | 10/1/2013 | | | | | | | | | | | | | | | | | |
| | | 7,862 | | | | 38.15 | | | | 4/1/2013 | | | | | | | | | | | | | | | | | |
| | | 5,411 | | | | 33.00 | | | | 1/2/2014 | | | | | | | | | | | | | | | | | |
| | | 5,108 | | | | 33.00 | | | | 4/1/2014 | | | | | | | | | | | | | | | | | |
| | | 4,741 | | | | 33.00 | | | | 7/1/2014 | | | | | | | | | | | | | | | | | |
| | | 4,108 | | | | 33.00 | | | | 10/1/2014 | | | | | | | | | | | | | | | | | |
| | | 1,627 | | | | 33.00 | | | | 1/3/2015 | | | | | | | | | | | | | | | | | |
| | | | | | | | | | | | | | | | | | | | | | | | | | | | |
| | | 43,682 | | | | | | | | | | | | | | | | | | | | | | | | | |
Todd B. Strubbe | | | — | | | | — | | | | | | | | 106,656 | | | | 1,130,554 | | | | 266,680 | | | | 2,826,808 | |
Steven M. Stangl | | | 319 | | | $ | 33.00 | | | | 4/2/2012 | | | | 33,330 | | | | 353,298 | | | | 333,350 | | | | 3,533,510 | |
| | | 496 | | | $ | 33.00 | | | | 7/1/2012 | | | | | | | | | | | | | | | | | |
| | | 1,606 | | | $ | 33.00 | | | | 4/1/2013 | | | | | | | | | | | | | | | | | |
| | | 1,173 | | | $ | 33.00 | | | | 7/1/2013 | | | | | | | | | | | | | | | | | |
| | | 1,297 | | | $ | 33.00 | | | | 10/1/2013 | | | | | | | | | | | | | | | | | |
| | | 1,277 | | | $ | 33.00 | | | | 4/1/2014 | | | | | | | | | | | | | | | | | |
| | | 2,235 | | | $ | 33.00 | | | | 4/1/2014 | | | | | | | | | | | | | | | | | |
| | | 1,185 | | | $ | 33.00 | | | | 7/1/2014 | | | | | | | | | | | | | | | | | |
| | | 2,074 | | | $ | 33.00 | | | | 7/1/2014 | | | | | | | | | | | | | | | | | |
| | | 1,027 | | | $ | 33.00 | | | | 10/1/2014 | | | | | | | | | | | | | | | | | |
| | | 1,797 | | | $ | 33.00 | | | | 10/1/2014 | | | | | | | | | | | | | | | | | |
| | | | | | | | | | | | | | | | | | | | | | | | | | | | |
| | | 14,486 | | | | | | | | | | | | | | | | | | | | | | | | | |
Paul M. Mendlik | | | — | | | | — | | | | | | | | 33,330 | | | | 353,298 | | | | 333,350 | | | | 3,533,510 | |
72
| (1) | These options represent retained, or “rollover”, options. These rollover options are equity strips comprised of one Class L share and eight Class A shares. In connection with our 2006 recapitalization, certain executive officers elected to convert certain vested options in the Company into fully-vested options in the surviving corporation. No share-based compensation was recorded for these retained options, as these options were fully vested prior to the consummation of the recapitalization (which triggered the “rollover event”). |
| (2) | These amounts represent restricted stock awards granted on December 1, 2006 for Mr. Barker, Ms. Berger, Mr. Mendlik and Mr. Stangl and on December 30, 2009 for Mr. Strubbe. These awards vest ratably over a five-year period commencing on the date of grant. |
| (3) | These amounts represent restricted stock grants that vest based upon performance criteria tied to an exit event of the majority shareholders. In accordance with ASC Topic 718, these performance-based awards are not recognized as expense by the Company until the occurrence of an exit event and satisfaction of the required performance criteria is probable. Please see “Compensation Discussion and Analysis” for a discussion of the performance criteria. |
| (4) | Subsequent to the recapitalization, our common stock is no longer publicly traded and therefore the market value of $10.60 per share was based on the results of an independent appraisal performed as of October 31, 2010 by Corporate Valuation Advisors, Inc. |
Option Exercises and Stock Vested
The following table shows for each named executive officer all option awards transferred and all stock awards transferred or that vested during 2010.
| | | | | | | | | | | | | | | | |
| | | Option Awards | | | Stock Awards | |
Name (a) | | Number of
Shares transferred
(#)
(b) | | | Value Realized on
transfer
($)(1)
(c) | | | Number of
Shares Acquired
on Transfer
or Vesting
(#)
(d) | | | Value Realized
on Transfer
or Vesting
($)(2)
(e) | |
Thomas B. Barker | | | 76,887 | | | | 12,614,005 | | | | 348,340 | | | | 3,692,401 | |
Nancee R. Berger | | | — | | | | — | | | | 49,995 | | | | 529,947 | |
Todd B. Strubbe | | | — | | | | — | | | | 26,664 | | | | 282,638 | |
Steven M. Stangl | | | — | | | | — | | | | 33,330 | | | | 353,298 | |
Paul M. Mendlik | | | — | | | | — | | | | 33,330 | | | | 353,298 | |
| (1) | Subsequent to the recapitalization, our common stock is no longer publicly traded and therefore the market value of $196.87 per Equity Strip was based on the results of an independent appraisal of October 31, 2010 by Corporate Valuation Advisors and used to value these Equity Strips comprised of eight shares of Class A Common Stock and one share of Class L Common Stock. |
| (2) | Subsequent to the recapitalization, our common stock is no longer publicly traded and therefore the market value of $10.60 per share was based on the results of an independent appraisal performed as of October 31, 2010 by Corporate Valuation Advisors and used to value these restricted shares of Class A Common Stock. |
73
Nonqualified Deferred Compensation Table
The following table shows certain information regarding our Deferred Compensation Plan and Executive Retirement Savings Plan.
2010 Nonqualified Deferred Compensation Table
| | | | | | | | | | | | | | | | | | | | |
Name (a) | | Executive
Contributions in
Last Fiscal Year (1)
($)
(b) | | | Registrant
Contributions in
Last Fiscal Year (2)
($)
(c) | | | Aggregate Earnings
in Last Fiscal Year (3)
($)
(d) | | | Aggregate
withdrawals/
distributions(4)
($)
(e) | | | Aggregate Balance
at Last
Fiscal Year End (5)
($)
(f) | |
Thomas B. Barker | | | | | | | | | | | | | | | | | | | | |
Deferred Compensation Plan | | | 500,000 | | | | 250,000 | | | | 1,370,196 | | | | 1,287,495 | | | | 8,105,484 | |
Executive Retirement Savings Plan | | | 9,150 | | | | 4,575 | | | | 25,697 | | | | — | | | | 174,720 | |
Nancee R. Berger | | | | | | | | | | | | | | | | | | | | |
Deferred Compensation Plan | | | 332,239 | | | | 166,120 | | | | 767,114 | | | | — | | | | 4,537,910 | |
Executive Retirement Savings Plan | | | 9,150 | | | | 4,575 | | | | 25,571 | | | | — | | | | 199,897 | |
Todd B. Strubbe | | | | | | | | | | | | | | | | | | | | |
Deferred Compensation Plan | | | 100,000 | | | | 50,000 | | | | 30,515 | | | | — | | | | 180,515 | |
Executive Retirement Savings Plan | | | 9,150 | | | | 4,575 | | | | 1,749 | | | | — | | | | 15,474 | |
Steven M. Stangl | | | | | | | | | | | | | | | | | | | | |
Deferred Compensation Plan | | | 103,500 | | | | 51,750 | | | | 352,010 | | | | — | | | | 2,082,341 | |
Executive Retirement Savings Plan | | | 9,150 | | | | 4,575 | | | | 28,082 | | | | — | | | | 193,932 | |
Paul M. Mendlik | | | | | | | | | | | | | | | | | | | | |
Deferred Compensation Plan | | | 168,938 | | | | 84,469 | | | | 903,609 | | | | — | | | | 5,372,578 | |
Executive Retirement Savings Plan | | | 6,155 | | | | 3,020 | | | | 9,495 | | | | — | | | | 60,759 | |
| (1) | Amounts in this column are also included in columns (c) and (f) of the 2010 Summary Compensation Table included in this report. |
| (2) | Amounts in this column are also included in column (g) of the 2010 Summary Compensation Table included in this report. |
| (3) | The aggregate earnings represent the market value change of these plans during 2010. None of the earnings are included in the 2010 Summary Compensation Table included in this report. |
| (4) | Mr. Barker’s withdrawal was made pursuant to Mr. Barker’s deferral election under the plan. |
| (5) | Amounts in this column include both vested and unvested balances. Amounts reported in this column which were previously reported as compensation to the named executive officer in the Summary Compensation Table for previous years were: Mr. Barker $4,584,488; Ms. Berger $4,013,812; Mr. Strubbe $100,000; Mr. Stangl $1,494,169 and Mr. Mendlik $4,871,263. These aggregate amounts do not include withdrawals taken from the Deferred Compensation Plan in 2010 of $1,287,495 for Mr. Barker and in 2007 of $2,009,826 and $3,415,041 for Ms. Berger and Mr. Mendlik, respectively. |
74
Non-Qualified Retirement Plans
Pursuant to the terms of the Deferred Compensation Plan, eligible management, non-employee directors and highly compensated employees who are approved for participation by the board may elect to defer a portion of their compensation and have such deferred compensation notionally invested in the same mutual fund investments made available to participants in the 401(k) plan or in notional equity interests in our company. Open enrollment for eligible participants to participate in the Deferred Compensation Plan is held annually. Upon enrollment, the participant’s participation and deferral percentage is fixed for the upcoming calendar year. Participants may select from selected mutual funds or equity interests for notional investment of their deferred compensation. Administration of the Deferred Compensation Plan is performed by an outside provider, Wells Fargo Institutional Trust Services. Executives are allowed to defer their bonus and up to 50% of salary, not to exceed $500,000, in each case, attributable to services performed in the following plan year. We match a percentage of any amounts notionally invested in equity interests which was 50% in 2010. Such matched amounts are subject to 20% vesting each year. All matching contributions are 100% vested five years after the later of January 1, 2007 or, if later, the date the executive first participates in the Deferred Compensation Plan. All matching contributions become 100% vested if: (i) the participant dies or becomes disabled or is terminated without cause; (ii) a change of control occurs; or (iii) the Deferred Compensation Plan terminates. For purposes of the Deferred Compensation Plan, a change of control occurs if during any period of two consecutive years or less: (i) individuals who at the beginning of such period constitute the entire board shall cease for any reason, subject to certain exceptions, to constitute a majority thereof; (ii) our stockholders approve any merger or consolidation as a result of which our common stock shall be changed, converted or exchanged (other than a merger with a wholly-owned subsidiary of ours) or our liquidation or any sale or disposition of 50% or more of our assets or earning power; or (iii) our stockholders approve any merger or consolidation to which we are a party as a result of which the persons who were our stockholders immediately prior to the effective date of the merger or consolidation shall have beneficial ownership of less than 50% of the combined voting power of the surviving corporation. The Deferred Compensation Plan and any earnings thereon are held separate and apart from our other funds, but remain subject to claims by our general creditors. Earnings in the Deferred Compensation Plan are based on the change in market value of the plan investments during a given period. The vested portion of the participant’s account under the plan will be paid on the date specified by the participant which can be no earlier than five years following the year of deferral or, if earlier, the date the participant separates from service with us. Deferrals invested in notional equity interests are paid through the issuance of our shares. Recipients of the equity interests upon such distribution have no equity or contractual put right with respect to the issued equity interests.
Participation in the Executive Retirement Savings Plan is voluntary and is restricted to highly compensated individuals as defined by the Internal Revenue Service. Open enrollment to participate in the Executive Retirement Savings Plan is held annually. Upon enrollment, the participant’s participation and deferral percentage is fixed for the upcoming calendar year. Participants may select from selected mutual funds for investment of their deferred compensation. Participants may change their investment selection as often as they choose. Administration of the Executive Retirement Savings Plan is performed by an outside provider, Wells Fargo Institutional Trust Services. We will match 50% of employee contributions, limited to the same maximums and vesting terms as those of the 401(k) plan. Earnings in the Executive Retirement Savings Plan are based on the change in market value of the plan investments (mutual funds) during a given period. We maintain a grantor trust under the Executive Retirement Savings Plan. The principal of the trust and any earnings thereon are held separate and apart from our other funds and are used exclusively for the uses and purposes of plan participants, but remain subject to claims from our general creditors.
75
2010 returns for the investment funds in the Executive Retirement Savings Plan were:
| | | | | | | | | | |
Fund | | 2010 return | | | Fund | | 2010 return | |
| Wells Fargo Advantage Ultra Short Term | | | 3.90 | % | | Wells Fargo Advantage Capital Growth | | | 17.42 | % |
| PIMCO Total Return A | | | 8.36 | % | | Goldman Sachs Mid Cap Value A | | | 24.85 | % |
| MFS Total Return A | | | 10.37 | % | | Victory Special Value A | | | 20.32 | % |
| MFS Value A | | | 11.68 | % | | Invesco Mid Cap Core Equity A | | | 12.52 | % |
| Wells Fargo Advantage Index | | | 14.82 | % | | Baron Small Cap | | | 23.47 | % |
| Davis New York Venture A | | | 12.11 | % | | American New Perspective | | | 12.73 | % |
| Fidelity Growth Opportunity | | | 24.09 | % | | American Funds Euro Pacific Growth | | | 9.72 | % |
| Janus Growth and Income | | | 8.63 | % | | | | | | |
Potential Payments Upon Termination or Change of Control
As described under “Employment Agreements,” each of the named executive officers are subject to an employment agreement that provides severance payments upon certain terminations. Please see “Employment Agreements” above for a description of terms of the employment agreements.
The following table sets forth the payments and benefits that each named executive officer would have been entitled to upon certain termination events or a change of control as of December 31, 2010.
2010 Potential Payments and Benefits Upon Termination or Change in Control Table
| | | | | | | | | | | | |
Name (a) | | Benefits (1)
($)
(b) | | | Potential
Cash Severance
Payment (2)
($)
(c) | | | Accelerated
Vesting
Upon
Change in
Control or
Initial Public
Offering (3)
($)
(d) | |
Thomas B. Barker | | | 40,260 | | | | 2,050,832 | | | | 10,610,284 | |
Nancee R. Berger | | | 38,100 | | | | 1,367,221 | | | | 832,474 | |
Todd B. Strubbe | | | 12,403 | | | | 653,205 | | | | 1,190,726 | |
Steven M. Stangl | | | 26,615 | | | | 1,067,370 | | | | 492,121 | |
Paul M. Mendlik | | | 23,296 | | | | 965,697 | | | | 617,205 | |
| (1) | Benefits include payments of medical, accident, disability and life insurance premiums for a specified period of time. These benefits are payable only in the case of a qualifying termination as set forth in (2) below. |
| (2) | In accordance with the executive’s employment agreement, (i) in the event of the executive’s voluntary termination of employment without Good Reason, the executive would be entitled to receive his or her base salary as payment for services as a consultant during the consulting period following termination of employment; and (ii) in the event of the executive’s termination of employment without Cause or voluntary termination of employment for Good Reason, the executive would be entitled to receive his or her base salary for the severance period following termination of employment and a further payment for those executives providing consulting services, equal to such executive’s projected annual bonus. The severance period is one year for Mr. Strubbe and two years for all of the other named executive officers. |
| (3) | Subsequent to the recapitalization, our common stock is no longer traded and, therefore, the market value of $10.60 per share was based on the results of an independent appraisal performed as of October 31, 2010 by Corporate Valuation Advisors, Inc. The amounts in column (d) are the result of multiplying the respective restricted shares that would vest, upon a qualifying termination. Mr. Barker’s Restricted Stock Agreement provides that all three restricted stock tranches vest upon an initial public offering. Unless the performance |
76
| | criteria are met for tranches 2 and 3, the other named executives only vest in tranche 1 upon a change of control. In addition, this column includes the unvested portion of the Company’s match in the Deferred Compensation Plan, which will vest upon termination without cause or a change of control. |
Risk Management and Compensation
The compensation committee has designed the Company’s compensation structure with the intent to attract and retain executives who have the ability and desire to grow the Company profitably. The compensation committee believes that incentive compensation should encourage risk within parameters that are appropriate for the long-term profitable growth of our businesses.
Each year the compensation committee reviews each compensation element, including the factors for determining executive bonuses for the upcoming year as well as the bonus targets and payout ranges. The compensation committee has structured its compensation program so that executive performance is not considered in determining annual salary. Rather, annual salary is designed to provide adequate compensation to recruit and retain talented individuals who have the ability and desire to achieve the objective financial goals that ultimately determine medium and long-term compensation.
The compensation committee believes that certain factors mitigate the potential risks posed by the Company’s medium and long-term compensation elements. For example, bonuses are earned upon the profitable growth (EBITDA or Adjusted EBITDA) over the prior year. This performance metric focuses the executives on the profitable growth of the Company. In addition, the Company has designed its internal control system to provide reasonable assurance regarding the reliability of the Company’s accounting records and financial reporting system. The Company’s performance metrics for the annual cash bonus program are subject to the scrutiny of our internal control system. The Company also engages in a comprehensive budgeting process which requires multi-level approvals with respect to various expenditures, including capital expenditures and the addition of new personnel. The compensation committee believes that the Company’s budgeting process as well as the various internal controls implemented by the Company limit the actions that employees can take without proper review and evaluation of the potential risks to the Company of such actions. With respect to the Company’s annual cash bonus program, the Company retains 25% of quarterly bonuses, and pays such holdback in February of the following year provided that the annual objective financial goals are met.
With regard to equity-based compensation, vesting is primarily tied to long-term performance and partially tied to vesting over time. These vesting provisions were selected to align the interests of recipients of equity-based awards with those of our investors. Finally, the compensation committee believes that the illiquidity of the Company’s equity mitigates the potential risk of the performance-based portion of the Company’s equity-based compensation. The compensation committee believes that each of these factors mitigates any risks posed by the Company’s compensation program.
Non-employee Director Compensation
None of our non-employee directors receive a director fee or stock option grants but will be reimbursed for all reasonable expenses incurred in connection with their attendance at board meetings.
Compensation Committee Interlocks and Insider Participation
Mr. Anthony J. DiNovi, a member of our compensation committee, is Co-President of Thomas H. Lee Partners, L.P. Affiliates of Thomas H. Lee Partners, L.P. provide management and advisory services pursuant to a management agreement entered into in connection with the consummation of our recapitalization. The aggregate fees for services are approximately $3.3 million annually. Thomas H. Lee Partners, L.P. also received reimbursement for travel and other out-of pocket expenses in the aggregate amount of approximately $0.1 million in 2010.
77
| ITEM 12. | SECURITY OWNERSHIP OF CERTAIN BENEFICIAL OWNERS AND MANAGEMENT AND RELATED STOCKHOLDER MATTERS |
Equity Compensation Plan Information
| | | | | | | | | | | | |
Plan category | | Number of securities
to be issued upon exercise
of outstanding options,
warrants and rights
(a) | | | Weighted-average
exercise price of
outstanding options,
warrants and rights
($)
(b) | | | Number of securities
remaining available for
future issuance under equity
compensation plans
(excluding securities reflected
in column (a)
(c) | |
Equity compensation plans approved by security holders | | | — | | | | — | | | | — | |
Equity compensation plans not approved by security holders | | | | | | | | | | | | |
Stock options granted under the 2006 Executive Incentive Plan | | | 2,544,000 | | | | 3.00 | | | | 333,447 | |
Executive Management Rollover Options | | | 287,326 | | | | 33.45 | | | | 17 | |
Nonqualified Deferred Compensation Plan (1) | | | 199,125 | | | | 196.87 | | | | N/A | |
| | | | | | | | | | | | |
Total | | | 3,030,451 | | | | N/A | | | | 333,464 | |
| | | | | | | | | | | | |
N/A—Not Applicable
| (1) | Pursuant to the terms of the Restated Nonqualified Deferred Compensation Plan, eligible management, non-employee directors or highly compensated employees who are approved for participation by the board may elect to defer their bonus and up to 50% of their salary, not to exceed $500,000, in each case, attributable to services performed in the following plan year, and have such deferred compensation notionally invested in the same investments made available to participants of the 401(k) plan or in notional Equity Strips. We match a percentage (50% in 2010) of any amounts notionally invested in our Equity Strips, where matched amounts are subject to a five-year vesting schedule with 20% vesting each year the individual is in the Plan. At December 31, 2010, the notionally granted Equity Strips under the Restated Nonqualified Deferred Compensation Plan, including both vested and unvested Equity Strips, was 199,125. Based on the results of an independent appraisal performed as of October 31, 2010 by Corporate Valuation Advisors, Inc., the fair value for an Equity Strip was $196.87. The Restated Nonqualified Deferred Compensation Plan does not limit the number of shares that may be granted. Rather, the Plan limits the amount of the annual contributions. See note 14 to the Consolidated Financial Statements included elsewhere in this report. |
78
Security Ownership
The following table summarizes the beneficial ownership of our common stock as of February 14, 2011 for:
| | • | | each person who we know beneficially owns more than 5% of our common stock; |
| | • | | each executive officer whose name appears on the Summary Compensation Table; and |
| | • | | all directors and executive officers as a group. |
| | | | | | | | |
Name and Address of Beneficial Owners (1) | | Amount
Beneficially
Owned | | | Percent of Respective
Class of Common Shares | |
Class A Shares | | | | | | | | |
Gary L. West (2) | | | 10,375,805 | | | | 11.8 | % |
Mary E. West (2) | | | 9,625,805 | | | | 10.9 | % |
Quadrangle Group Funds (3) | | | 10,000,000 | | | | 11.4 | % |
Thomas H. Lee Funds (4) | | | 48,060,000 | | | | 54.6 | % |
Thomas B. Barker (5) | | | 2,057,688 | | | | 2.3 | % |
Anthony J. DiNovi | | | * | | | | * | |
Soren L. Oberg | | | * | | | | * | |
Steven G. Felsher | | | * | | | | * | |
Jeff T. Swenson | | | * | | | | * | |
Nancee R. Berger (6) | | | 1,099,456 | | | | 1.2 | % |
David J. Treinen (7) | | | 440,000 | | | | * | |
Todd B. Strubbe | | | 400,000 | | | | * | |
Paul M. Mendlik (8) | | | 671,962 | | | | * | |
All executive officers as a group (8 persons) (9) | | | 6,153,442 | | | | 6.9 | % |
| | |
Class L Shares | | | | | | | | |
Gary L. West (2) | | | 1,250,101 | | | | 12.5 | % |
Mary E. West (2) | | | 1,250,101 | | | | 12.5 | % |
Quadrangle Group Funds (3) | | | 1,250,000 | | | | 12.5 | % |
Thomas H. Lee Funds (4) | | | 6,007,500 | | | | 60.1 | % |
Thomas B. Barker (5) | | | 108,252 | | | | 1.1 | % |
Anthony J. DiNovi | | | * | | | | * | |
Soren L. Oberg | | | * | | | | * | |
Steven G. Felsher | | | * | | | | * | |
Jeff T. Swenson | | | * | | | | * | |
David J. Treinen (7) | | | 5,000 | | | | * | |
Nancee R. Berger (6) | | | 43,682 | | | | * | |
Paul M. Mendlik (8) | | | 25,235 | | | | * | |
All executive officers as a group (8 persons) (9) (10) | | | 239,586 | | | | 2.4 | % |
| (1) | The address of each of our executive officers and directors is c/o West Corporation, 11808 Miracle Hills Drive, Omaha, Nebraska 68154. |
| (2) | The address for these stockholders is 9746 Ascot Drive, Omaha, Nebraska 68114. Includes, with respect to Mr. West, 750,000 Class A shares of common stock owned by the Gary and Mary West Wireless Health Institute (the “Institute”), a nonprofit organization, which has appointed Mr. West as sole representative and proxy with respect to its shares. Mr. West disclaims any beneficial ownership of any shares held by the Institute. |
| (3) | Includes 8,751,805 Class A and 1,093,976 Class L shares of common stock owned by Quadrangle Capital Partners II LP; 234,792 Class A and 29,349 Class L shares of common stock owned by Quadrangle Select |
79
| | Partners II LP; and 1,013,403 Class A and 126,675 Class L shares of common stock owned by Quadrangle Capital Partners II-A LP (collectively, the “Quadrangle Funds”). The Quadrangle Funds’ general partner is Quadrangle GP Investors II LP, whose general partner is QCP GP Investors II LLC (collectively, the “QF Advisors”). Shares held by the Quadrangle Funds may be deemed to be beneficially owned by the QF Advisors. The QF Advisors disclaim any beneficial ownership of any shares held by the Quadrangle Funds. Each of the Quadrangle Funds has an address c/o Quadrangle Group LLC, 375 Park Avenue, 14th Floor, New York, New York 10152. Voting or investment control over securities that the Quadrangle Funds own are acted upon by the investment committee of QCP GP Investors II LLC as general partner of Quadrangle GP Investors II LP, the general partner of the Quadrangle Funds. |
| (4) | Includes 19,917,333 Class A and 2,489,667 Class L shares of common stock owned by Thomas H. Lee Equity Fund VI, L.P.; 13,486,958 Class A and 1,685,870 Class L shares of common stock owned by Thomas H. Lee Parallel Fund VI, L.P.; 10,460,000 Class A and 1,307,500 Class L shares of common stock owned by THL Equity Fund VI Investors (West), L.P.; 2,355,901 Class A and 294,488 Class L shares of common stock owned by Thomas H. Lee Parallel (DT) Fund VI, L.P.; 36,540 Class A and 4,568 Class L shares of common stock owned by THL Coinvestment Partners, L.P.; and 1,600,000 Class A and 200,000 Class L shares of common stock owned by THL Equity Fund VI Investors (West) HL, L.P. (collectively, the “THL Funds”); 101,654 Class A and 12,707 Class L shares of common stock owned by Putnam Investment Holdings, LLC; and 101,614 Class A and 12,702 Class L shares of common stock owned by Putnam Investments Employees’ Securities Company III LLC (collectively, the “Putnam Funds”). The THL Funds’ general partner is THL Equity Advisors VI, LLC, whose sole member is Thomas H. Lee Partners, L.P., whose general partner is Thomas H. Lee Advisors, LLC (collectively, “Advisors”). Shares held by the THL Funds may be deemed to be beneficially owned by Advisors. Advisors disclaim any beneficial ownership of any shares held by the THL Funds. The Putnam Funds are co-investment entities of the THL Funds. Putnam Investment Holdings, LLC (“Holdings”) is the managing member of Putnam Investments Employees’ Securities Company III LLC (“ESC III”). Holdings disclaims any beneficial ownership of any shares held by ESC III. Putnam Investments LLC, the managing member of Holdings, disclaims beneficial ownership of any shares held by the Putnam Funds. Each of the THL Funds has an address c/o Thomas H. Lee Partners, L.P., 100 Federal Street, 35th Floor, Boston, Massachusetts 02110. The Putnam Funds have an address c/o Putnam Investment, Inc., 1 Post Office Square, Boston, Massachusetts 02109. |
| (5) | Includes 677,992 Class A and 84,749 Class L shares subject to options. |
| (6) | Includes 349,456 Class A and 43,682 Class L shares subject to options and 750,000 Class A shares held by family trusts. |
| (7) | Includes 440,000 Class A shares and 5,000 Class L shares of common stock owned by a family trust. |
| (8) | Includes 178,360 Class A shares and 22,295 Class L shares of common stock owned by family trusts. |
| (9) | Includes 1,368,360 Class A and 27,295 Class L shares of common stock owned by family trusts. |
| (10) | Includes 1,421,760 Class A and 177,720 Class L shares subject to options. |
The table above does not include 195,682 shares notionally granted under our Nonqualified Deferred Compensation Plan at February 14, 2011. These shares have not been granted, do not carry voting rights and cannot be sold until the end of the deferral periods, which begin in 2012 unless there is a change of control of the Company.
Except as otherwise noted, each person named in the table above has sole voting and investment power with respect to the shares. Beneficial ownership and percentages are calculated in accordance with SEC rules. Beneficial ownership includes shares subject to options that are currently exercisable or exercisable within 60 days.
80
| ITEM 13. | CERTAIN RELATIONSHIPS AND RELATED TRANSACTIONS AND DIRECTOR INDEPENDENCE |
Prior to the recapitalization on October 24, 2006, the board of directors consisted of six members, three of which were determined to be independent pursuant to Rule 4200 (a)(15) of NASDAQ. As a result of the recapitalization, the Company is no longer required to have independent directors on its board. While the Company is not subject to the NASDAQ listing standards, the board did review such standards and determined that none of the Company’s directors are independent under those standards as a result of their positions with Thomas H. Lee Partners, L.P., Quadrangle Group LLC or the Company, as applicable.
2006 Recapitalization
On October 24, 2006, we completed a recapitalization of the Company in a transaction sponsored by the Sponsors pursuant to the Agreement and Plan of Merger, dated as of May 31, 2006, between us and Omaha Acquisition Corp., a Delaware corporation formed by the Sponsors for the purpose of recapitalizing the Company. Omaha Acquisition Corp. was merged with and into the Company, with the Company continuing as the surviving corporation. Pursuant to such recapitalization, our publicly traded shares of common stock were cancelled in exchange for cash and Gary and Mary West converted approximately 85% of the shares of our common stock held by them prior to the recapitalization into the right to receive cash of approximately $1.4 billion (at a discount of approximately 12% to the price being paid in respect of the publicly traded shares) and the remaining 15% of their holdings into 2.5 million shares of our Class L common stock and 20 million shares of our Class A common stock. In connection with the recapitalization, our current executive officers received aggregate transaction payments of approximately $2.5 million and stay bonus payments, which were paid on the six-month and one year anniversaries of the recapitalization, of approximately $6.6 million. None of our current directors, other than Mr. Barker, in his capacity as an executive officer, received any payments in connection with the recapitalization.
Affiliates of Sponsors provide management and advisory services pursuant to a management agreement entered into in connection with the consummation of the recapitalization. The fees for services and expenses in 2010 and 2009 aggregated $4.2 million each year. Three members of our board are affiliated with Thomas H. Lee Partners, L.P.: Mr. Anthony J. DiNovi, Co-President, Mr. Soren L. Oberg, Managing Director, and Mr. Jeff T. Swenson, Director. One member of our board is affiliated with Quadrangle Group LLC: Mr. Steven G. Felsher, Senior Advisor.
Registration Rights Agreement
In connection with the recapitalization, we also entered into a registration rights and coordination agreement with certain stockholders including the THL Investors; the Quadrangle Investors; our founders, Gary L. West and Mary E. West; certain of our executive officers, including Thomas B. Barker, Nancee R. Berger, Paul M. Mendlik, David C. Mussman and Steven M. Stangl and each of their respective permitted assignees. Pursuant to this agreement, subject to certain exceptions and conditions, we are required to register their shares of common stock under the Securities Act, and they will have the right to participate in future registrations of securities by us.
Office Lease
We lease certain office space owned by a partnership whose partners are Mary and Gary West, who collectively own approximately 22% of our common stock at December 31, 2010. Related party lease expense was approximately $0.7 million each year for the years ended December 31, 2010, 2009 and 2008. The lease expires in 2014.
81
TOGM
On April 30, 2009, we entered into a series of amended and restated agreements with TOGM, LLC (“TOGM”) pursuant to which TOGM would finance up to 70% of the purchase price of selected receivables portfolios. Interest generally accrues on the outstanding debt at a fixed rate of 8.5%. The amended and restated agreements continued the facility executed as of May 21, 2008 and which expired December 31, 2008 pursuant to which TOGM had financed up to 80% of the purchase price of selected receivables portfolios at a variable rate equal to 3.5% over prime. The debt is non-recourse to us and collateralized by all of the assets of West Receivables Purchasing, LLC (“West Receivables”). The sole assets of West Receivables were the receivables portfolios which were partially financed by TOGM. At December 31, 2009, we had $0.7 million of non-recourse portfolio notes payable outstanding under this facility, which were sold to an unrelated third party.
In connection with the formation of West Receivables, we and TOGM entered into an operating agreement pursuant to which the members share in the profits of the portfolio after collection expenses and the repayment of principal and interest in proportion to their respective membership interests. We provided, directly or through a third party, all necessary services to West Receivables, including collection of the receivables pursuant to a servicing agreement. TOGM’s shareholders are Mary and Gary West, who collectively own approximately 22% of our common stock.
In December 2010, TOGM agreed that it had no further economic interest in West Receivables and authorized the liquidation of its assets, which was completed in December 2010.
The Company does not have a written related party transaction policy, however, under its charter, the audit committee will review and approve all related party transactions as required to be reported pursuant to item 404(a) of Regulation S-X.
| Item 14. | PRINCIPAL ACCOUNTANT FEES AND SERVICES |
All services provided by Deloitte & Touche LLP (“Deloitte & Touche”) were reviewed with our audit committee and senior management to confirm that the performance of such services was consistent with maintaining Deloitte & Touche’s independence.
The following table summarizes the fees we paid to Deloitte & Touche in 2010 and 2009.
| | | | | | | | |
Fee Type | | 2010 | | | 2009 | |
Audit | | $ | 1,216,140 | | | $ | 1,259,312 | |
Audit-related | | | 180,240 | | | | 261,840 | |
Tax | | | 636,755 | | | | 864,581 | |
All other | | | — | | | | — | |
| | | | | | | | |
Total | | $ | 2,033,135 | | | $ | 2,385,733 | |
Audit Fees—Audit fees consist of fees paid for the audits of our annual financial statements, the reviews of the consolidated financial statements included in our Quarterly Reports on Form 10-Q and statutory audits required for our foreign subsidiaries.
Audit-Related Fees—Audit-related fees consist of fees paid for work performed on: the Proposed Offering on Form S-1; the amendment and extension of our senior secured term loan facility and the debt offering memoranda for the 2018 Senior Notes and 2019 Senior Notes; SAS 70 reports; and the audit of our 401(k) Plan.
Tax Fees—Tax fees consist of fees paid for tax consultation, state tax planning, due diligence assistance on certain acquisitions, research and development credit analysis and international tax research and consultation.
The audit committee has adopted a policy requiring pre-approval by the committee for all services (audit and non-audit) to be provided to us by our external auditor. In accordance with that policy, our Audit Committee pre-approved all of the foregoing services.
82
PART IV
| ITEM 15. | EXHIBITS AND FINANCIAL STATEMENT SCHEDULES |
(a) Documents filed as a part of the report:
| | | | |
(1) Financial Statements: | | | | |
Report of Independent Registered Public Accounting Firm | | | F-1 | |
Consolidated statements of operations for the years ended December 31, 2010, 2009 and 2008 | | | F-2 | |
Consolidated balance sheets as of December 31, 2010 and 2009 | | | F-3 | |
Consolidated statements of cash flows for the years ended December 31, 2010, 2009 and 2008 | | | F-4 | |
Consolidated statements of stockholders’ deficit for the years ended December 31, 2010, 2009 and 2008 | | | F-5 | |
Notes to the Consolidated Financial Statements | | | F-6 | |
(2) Financial Statement Schedules: | | | | |
Schedule II (Consolidated valuation accounts for the three years ended December 31, 2010, 2009 and 2008) | | | S-1 | |
(3) Exhibits | | | | |
Exhibits identified in parentheses below, on file with the SEC, are incorporated by reference into this report.
| | |
Exhibit Number | | Description |
| 3.01 | | Amended and Restated Certificate of Incorporation of the Company (incorporated by reference to Exhibit 3.1 to Form 8-K dated October 30, 2006) |
| |
| 3.02 | | Amended and Restated Bylaws of the Company (incorporated by reference to Exhibit 3.2 to Form 8-K dated October 30, 2006) |
| |
| 10.01 | | West Corporation 2006 Executive Incentive Plan (incorporated by reference to Exhibit 10.12 to Form 10-Q filed on November 9, 2006) (1) |
| |
| 10.02 | | Indenture, dated as of October 24, 2006, among West Corporation, the Guarantors named on the Signature Pages thereto and The Bank of New York, as Trustee, with respect to the 11% senior subordinated notes due 2016 (incorporated by reference to Exhibit 4.2 to Form 10-Q filed on November 9, 2006) |
| |
| 10.03 | | Lease, dated September 1, 1994, by and between West Telemarketing Corporation and 99-Maple Partnership (Amendment No. 1) dated December 10, 2003 (incorporated by reference to Exhibit 10.07 to Form 10-K filed February 24, 2006) |
| |
| 10.04 | | Employment Agreement between the Company and Thomas B. Barker dated December 31, 2008 (incorporated by reference to Exhibit 10.1 to Form 8-K filed January 7, 2009) (1) |
| |
| 10.05 | | Employment Agreement between the Company and Nancee R. Berger dated December 31, 2008 (incorporated by reference to Exhibit 10.2 to Form 8-K filed January 7, 2009) (1) |
| |
| 10.06 | | Employment Agreement between the Company and Paul M. Mendlik, dated December 31, 2008 (incorporated by reference to Exhibit 10.4 to Form 8-K filed January 7, 2009) (1) |
| |
| 10.07 | | Exhibit A dated February 21, 2011 to the Employment Agreement between West Corporation and Todd B. Strubbe, dated September 28, 2009 (1) |
| |
| 10.08 | | Registration Rights and Coordination Agreement, dated as of October 24, 2006, among West Corporation, THL Investors, Quadrangle Investors, Other Investors, Founders and Managers named therein (incorporated by reference to Exhibit 4.5 to Form 10-Q filed on November 9, 2006) |
83
| | |
Exhibit Number | | Description |
| 10.09 | | Restatement Agreement (the “Restatement Agreement”), dated as of October 5, 2010, by and among Wells Fargo Bank, National Association, as administrative agent, West Corporation (“West”), certain domestic subsidiaries of West and the lenders party thereto (Exhibit A, the Amended and Restated Credit Agreement, is included as Exhibit 10.10) (incorporated by reference to Exhibit 10.1 to Form 8-K filed October 6, 2010) |
| |
| 10.10 | | Amended and Restated Credit Agreement, dated as of October 5, 2010, by and among West, certain domestic subsidiaries of West, Wells Fargo Bank, National Association, as administrative agent, Deutsche Bank Securities Inc. and Bank of America, N.A., as syndication agents, Wells Fargo Bank, National Association and General Electric Capital Corporation, as co-documentation agents, Wells Fargo Securities, LLC and Deutsche Bank Securities Inc., as joint lead arrangers, Wells Fargo Securities, LLC and Deutsche Bank Securities Inc., as joint bookrunners, and the lenders party thereto, adopted pursuant to the Restatement Agreement (incorporated by reference to Exhibit 10.2 to Form 8-K filed October 6, 2010) |
| |
| 10.11 | | Guarantee Agreement, dated as of October 24, 2006, among the guarantors identified therein and Lehman Commercial Paper Inc., as Administrative Agent (incorporated by reference to Exhibit 10.11 to Amendment No. 1 to Registration Statement on Form S-1 filed on November 6, 2009) |
| |
| 10.12 | | Indenture, dated as of October 5, 2010, among West, the guarantors named on the signature pages thereto and The Bank of New York Mellon Trust Company, N.A., as Trustee, with respect to the 8 5/8% senior notes due 2018 (incorporated by reference to Exhibit 10.3 to Form 8-K filed October 6, 2010) |
| |
| 10.13 | | Registration Rights Agreement, dated as of October 5, 2010, among West, the guarantors named on the signature pages thereto and Deutsche Bank Securities, Inc., Wells Fargo Securities, LLC, Goldman, Sachs & Co. and Morgan Stanley & Co. (incorporated by reference to Exhibit 10.4 to Form 8-K filed October 6, 2010) |
| |
| 10.14 | | Indenture, dated as of November 24, 2010, among West, the guarantors named on the signature pages thereto and The Bank of New York Mellon Trust Company, N.A., as Trustee, with respect to the 7 7/8% senior notes due 2019 (incorporated by reference to Exhibit 10.2 to Form 8-K filed November 24, 2010) |
| |
| 10.15 | | Registration Rights Agreement, dated as of November 24, 2010, among West, the guarantors named on the signature pages thereto and Deutsche Bank Securities, Inc., Wells Fargo Securities, LLC, Goldman, Sachs & Co., Merrill Lynch, Pierce, Fenner & Smith Incorporated and Morgan Stanley & Co. (incorporated by reference to Exhibit 10.3 to Form 8-K filed November 24, 2010) |
| |
| 10.16 | | West Corporation Nonqualified Deferred Compensation Plan, as amended and restated effective January 1, 2008 (incorporated by reference to Exhibit 10.15 to Form 10-K dated March 3, 2009) (1) |
| |
| 10.17 | | Security Agreement, dated as of October 24, 2006, among West Corporation, The Other Grantors Identified therein and Lehman Commercial Paper Inc., as Administrative Agent (incorporated by reference to Exhibit 10.3 to Form 10-Q filed on November 9, 2006) |
| |
| 10.18 | | Intellectual Property Security Agreement, dated as of October 24, 2006, among West Corporation, The Other Grantors Identified therein and Lehman Commercial Paper Inc., as Administrative Agent (incorporated by reference to Exhibit 10.4 to Form 10-Q filed on November 9, 2006) |
| |
| 10.19 | | Deed of Trust, Assignment of Leases and Rents, Security Agreement and Financing Statement, dated October 24, 2006, from West Corporation, as Trustor to Chicago Title Insurance Company, as Trustee and Lehman Commercial Paper Inc., as Beneficiary (incorporated by reference to Exhibit 10.5 to Form 10-Q filed on November 9, 2006) |
84
| | |
Exhibit Number | | Description |
| 10.20 | | Deed of Trust, Assignment of Leases and Rents, Security Agreement and Financing Statement, dated October 24, 2006, from West Business Services, LP to Lehman Commercial Paper Inc. (incorporated by reference to Exhibit 10.6 to Form 10-Q filed on November 9, 2006) |
| |
| 10.21 | | Mortgage, Assignment of Leases and Rents, Security Agreement and Financing Statement, dated October 24, 2006, from West Telemarketing, LP to Lehman Commercial Paper Inc. (incorporated by reference to Exhibit 10.7 to Form 10-Q filed on November 9, 2006) |
| |
| 10.22 | | Management Agreement, dated as of October 24, 2006, among Omaha Acquisition Corp., West Corporation, Quadrangle Advisors II LLC, and THL Managers VI, LLC (incorporated by reference to Exhibit 10.8 to Form 10-Q filed on November 9, 2006) |
| |
| 10.23 | | Founders Agreement, dated October 24, 2006, among West Corporation, Gary L. West and Mary E. West (incorporated by reference to Exhibit 10.9 to Form 10-Q filed on November 9, 2006) |
| |
| 10.24 | | Stockholder Agreement, dated as of October 24, 2006, among West Corporation, THL Investors, Quadrangle Investors, Other Investors, Founders and Managers named therein (incorporated by reference to Exhibit 10.10 to Form 10-Q filed on November 9, 2006) |
| |
| 10.25 | | Form of Rollover Agreement (incorporated by reference to Exhibit 10.11 to Form 10-Q filed on November 9, 2006) |
| |
| 10.26 | | Form of West Corporation Restricted Stock Award and Special Bonus Agreement (incorporated by reference to Exhibit 10.13 to Form 10-Q filed on November 9, 2006) (1) |
| |
| 10.27 | | Form of Option Agreement (incorporated by reference to Exhibit 10.14 to Form 10-Q filed on November 9, 2006) (1) |
| |
| 10.28 | | Form of Rollover Option Grant Agreement (incorporated by reference to Exhibit 10.15 to Form 10-Q filed on November 9, 2006) (1) |
| |
| 10.29 | | West Corporation Executive Retirement Savings Plan Amended and Restated Effective as of January 1, 2008 (incorporated by reference to Exhibit 10.29 to Form 10-K filed March 3, 2009) (1) |
| |
| 10.30 | | Amendment Number One to West Corporation’s 2006 Executive Incentive Plan (1) |
| |
| 10.31 | | Supplemental Indenture, dated as of March 16, 2007, by and among CenterPost Communications, Inc., TeleVox Software, Incorporated, West At Home, LLC and The Bank of New York, to the Indenture, dated as of October 24, 2006, by and among West Corporation, the guarantors named therein and The Bank of New York, with respect to West Corporation’s $450.0 million aggregate principal amount of 11% senior subordinated notes due October 15, 2016 (incorporated by reference to Exhibit 99.2 to Form 8-K filed on March 30, 2007) |
| |
| 10.32 | | Supplemental Indenture, dated as of March 30, 2007, by and among SmartTalk, Inc. and The Bank of New York, to the Indenture, dated as of October 24, 2006, by and among West Corporation, the guarantors named therein and The Bank of New York, with respect to West Corporation’s $450.0 million aggregate principal amount of 11% senior subordinated notes due October 15, 2016 (incorporated by reference to Exhibit 99.4 to Form 8-K filed on March 30, 2007) |
| |
| 10.33 | | Supplemental Indenture, dated as of June 19, 2007, by and among Omnium Worldwide, Inc. and The Bank of New York, to the Indenture, dated as of October 24, 2006, by and among West Corporation, the guarantors named therein and The Bank of New York, with respect to West Corporation’s $450.0 million aggregate principal amount of 11% senior subordinated notes due October 15, 2016 (incorporated by reference to Exhibit 10.35 to Form 10-K dated March 3, 2009) |
85
| | |
Exhibit Number | | Description |
| |
| 10.34 | | Supplemental Indenture, dated as of August 15, 2007, by and among West Business Services Corporation, West Telemarketing Corporation and The Bank of New York, to the Indenture, dated as of October 24, 2006, by and among West Corporation, the guarantors named therein and The Bank of New York, with respect to West Corporation’s $450.0 million aggregate principal amount of 11% senior subordinated notes due October 15, 2016 (incorporated by reference to Exhibit 10.37 to Form 10-K dated March 3, 2009) |
| |
| 10.35 | | Supplemental Indenture, dated as of June 12, 2008, by and among HBF Communications, Inc. and The Bank of New York, to the Indenture, dated as of October 24, 2006, by and among West Corporation, the guarantors named therein and The Bank of New York, with respect to West Corporation’s $450.0 million aggregate principal amount of 11% senior subordinated notes due October 15, 2016 (incorporated by reference to Exhibit 10.39 to Form 10-K dated March 3, 2009) |
| |
| 10.36 | | Supplemental Indenture, dated as of February 20, 2009, by and among Intrado Information Systems Holdings, Inc., Intrado Command Systems, Inc., Geo911, Inc., Positron Public Safety Systems Corp., Masys Corporation, West Corporation, and The Bank of New York, to the Indenture, dated as of October 24, 2006, by and among West Corporation, the guarantors named therein and The Bank of New York, with respect to West Corporation’s $450.0 million aggregate principal amount of 11% senior subordinated notes due October 15, 2016 (incorporated by reference to Exhibit 10.41 to Form 10-K dated March 3, 2009) |
| |
| 10.37 | | Supplemental Indenture, dated as of January 25, 2010, by and among Worldwide Asset Purchasing, LLC, Stream57 Corporation, West Corporation, and The Bank of New York Mellon, to the Indenture, dated as of October 24, 2006, by and among West Corporation, the guarantors named therein and The Bank of New York, with respect to West Corporation’s $450.0 million aggregate principal amount of 11% senior subordinated notes due October 15, 2016 (incorporated by reference to Exhibit 10.44 to Form 10-K filed on February 12, 2010) |
| |
| 10.38 | | Amended and Restated Credit Agreement By and Between West Receivables Purchasing, LLC as Borrower, and TOGM, LLC, as Lender, dated as of April 30, 2009 (incorporated by reference to Exhibit 10.01 to Form 10-Q dated May 5, 2009) |
| |
| 10.39 | | Amended and Restated Servicing Agreement By and Among West Asset Management, Inc., as Servicer, West Receivables Purchasing, LLC, as Borrower, and TOGM, LLC, as Lender, dated as of April 30, 2009 (incorporated by reference to Exhibit 10.02 to Form 10-Q dated May 5, 2009) |
| |
| 10.40 | | Form of Promissory Note between West Receivables Purchasing, LLC and TOGM, LLC (incorporated by reference to Exhibit 10.03 to Form 10-Q dated May 5, 2009) |
| |
| 10.41 | | Amended and Restated Operating Agreement of West Receivables Purchasing, LLC between TOGM, LLC and West Receivables Services, Inc. dated April 30, 2009 (incorporated by reference to Exhibit 10.04 to Form 10-Q dated May 5, 2009) |
| |
| 10.42 | | Amended and Restated Restricted Stock Award and Special Bonus Agreement between West Corporation and Thomas Barker, dated as of May 4, 2009 (incorporated by reference to Exhibit 10.05 to Form 10-Q dated May 5, 2009) (1). |
| |
| 10.43 | | Exhibit A dated February 21, 2011 to the Employment Agreement between West Corporation and Steven M. Stangl, dated December 31, 2008 (1) |
| |
| 10.44 | | Exhibit A dated February 21, 2011 to the Employment Agreement between West Corporation and Thomas B. Barker, dated December 31, 2008 (1) |
| |
| 10.45 | | Exhibit A dated February 21, 2011 to the Employment Agreement between West Corporation and Nancee R. Berger, dated December 31, 2008 (1) |
86
| | |
Exhibit Number | | Description |
| |
| 10.46 | | Exhibit A dated February 21, 2011 to the Employment Agreement between West Corporation and Paul M. Mendlik, dated December 31, 2008 (1) |
| |
| 10.47 | | Agreement of Resignation, Appointment and Acceptance, dated as of April 8, 2010 by and among West Corporation, The Bank of New York Mellon, as prior trustee, and The Bank of New York Mellon Trust Company, N.A. as successor Trustee with respect to West Corporation’s $450.0 million aggregate principal amount of 11% senior subordinated notes due October 15, 2016 (incorporated by reference to Exhibit 10.03 to Form 10-Q dated May 7, 2010) |
| |
| 10.48 | | Amendment Number One to the West Corporation Nonqualified Deferred Compensation Plan, dated as of April 30, 2010 (incorporated by reference to Exhibit 10.04 to Form 10-Q dated May 7, 2010) (1) |
| |
| 10.49 | | Supplemental Indenture, dated as of May 14, 2010, by and among West Unified Communications Services, LLC, West Corporation, and The Bank of New York Mellon Trust Company, N.A., to the Indenture, dated as of October 24, 2006, by and among West Corporation, the guarantors named therein and The Bank of New York with respect to West Corporation’s $450.0 million aggregate principal amount of 11% senior subordinated notes due October 15, 2016 (incorporated by reference to Exhibit 10.02 to Form 10-Q dated August 2, 2010) |
| |
| 10.50 | | Restructuring Agreement dated as of December 21, 2010, by and among TOGM, LLC, West Receivables Services, Inc. and West Receivables Purchasing, LLC |
| |
| 10.51 | | Form of Indemnification Agreement between West Corporation and its directors and officers (incorporated by reference to Exhibit 10.01 to Form 10-Q dated May 7, 2010) |
| |
| 21.01 | | Subsidiaries |
| |
| 31.01 | | Certification pursuant to 18 U.S.C. section 7241 as adopted pursuant to section 302 of the Sarbanes-Oxley Act of 2002 |
| |
| 31.02 | | Certification pursuant to 18 U.S.C. section 7241 as adopted pursuant to section 302 of the Sarbanes-Oxley Act of 2002 |
| |
| 32.01 | | Certification pursuant to 18 U.S.C. section 1350 as adopted pursuant to section 906 of the Sarbanes-Oxley Act of 2002 |
| |
| 32.02 | | Certification pursuant to 18 U.S.C. section 1350 as adopted pursuant to section 906 of the Sarbanes-Oxley Act of 2002 |
| (1) | Indicates management contract or compensation plan or arrangement. |
87
SIGNATURES
Pursuant to the requirements of Section 13 or 15(d) of the Securities Exchange Act of 1934, the registrant has duly caused this report to be signed on its behalf by the undersigned, thereunto duly authorized.
| | |
| WEST CORPORATION |
| |
By: | | /S/ THOMAS B. BARKER |
| | Thomas B. Barker |
| | Chief Executive Officer and Chairman |
| | Of the Board |
| | (Principal Executive Officer) |
February 23, 2011
Pursuant to the requirements of the Securities Exchange Act of 1934, this report has been signed below by the following persons on behalf of the registrant and in the capacities and on the date indicated.
| | |
Signatures | | Date |
/S/ ANTHONY J. DINOVI | | February 23, 2011 |
| Anthony J. DiNovi | | |
| Director | | |
| |
/S/ STEVEN G. FELSHER | | February 23, 2011 |
Steven G. Felsher | | |
| Director | | |
| |
/S/ SOREN L. OBERG | | February 23, 2011 |
| Soren L. Oberg | | |
| Director | | |
| |
/S/ JEFF T. SWENSON | | February 23, 2011 |
| Jeff T. Swenson | | |
| Director | | |
| |
/S/ THOMAS B. BARKER | | February 23, 2011 |
| Thomas B. Barker | | |
| Chairman of the Board, Chief Executive Officer and Director | | |
| (Principal Executive Officer) | | |
| |
/S/ PAUL M. MENDLIK | | February 23, 2011 |
| Paul M. Mendlik | | |
| Chief Financial Officer and Treasurer (Principal Financial Officer) | | |
| |
/S/ R. PATRICK SHIELDS | | February 23, 2011 |
| R. Patrick Shields | | |
| Senior Vice President—Chief Accounting Officer | | |
88
REPORT OF INDEPENDENT REGISTERED PUBLIC ACCOUNTING FIRM
To the Board of Directors of
West Corporation
Omaha, Nebraska
We have audited the accompanying consolidated balance sheets of West Corporation and subsidiaries (the “Company”) as of December 31, 2010 and 2009, and the related consolidated statements of operations, stockholders’ equity (deficit), and cash flows for each of the three years in the period ended December 31, 2010. Our audits also included the financial statement schedule listed in the Index at Item 15. These financial statements and financial statement schedule are the responsibility of the Company’s management. Our responsibility is to express an opinion on the financial statements and financial statement schedule based on our audits.
We conducted our audits in accordance with the standards of the Public Company Accounting Oversight Board (United States). Those standards require that we plan and perform the audit to obtain reasonable assurance about whether the financial statements are free of material misstatement. An audit includes examining, on a test basis, evidence supporting the amounts and disclosures in the financial statements. An audit also includes assessing the accounting principles used and significant estimates made by management, as well as evaluating the overall financial statement presentation. We believe that our audits provide a reasonable basis for our opinion.
In our opinion, such consolidated financial statements present fairly, in all material respects, the financial position of West Corporation and subsidiaries at December 31, 2010 and 2009, and the results of their operations and their cash flows for each of the three years in the period ended December 31, 2010, in conformity with accounting principles generally accepted in the United States of America. Also, in our opinion, such financial statement schedule, when considered in relation to the basic consolidated financial statements taken as a whole, presents fairly, in all material respects, the information set forth therein.
We have also audited, in accordance with the standards of the Public Company Accounting Oversight Board (United States), the Company’s internal control over financial reporting as of December 31, 2010, based on the criteria established inInternal Control—Integrated Framework issued by the Committee of Sponsoring Organizations of the Treadway Commission and our report dated February 23, 2011 expressed an unqualified opinion on the Company’s internal control over financial reporting.
/s/ Deloitte & Touche LLP
Omaha, Nebraska
February 23, 2011
F-1
WEST CORPORATION
CONSOLIDATED STATEMENTS OF OPERATIONS
(AMOUNTS IN THOUSANDS)
| | | | | | | | | | | | |
| | | Years Ended December 31, | |
| | | 2010 | | | 2009 | | | 2008 | |
REVENUE | | $ | 2,388,211 | | | $ | 2,375,748 | | | $ | 2,247,434 | |
COST OF SERVICES | | | 1,057,008 | | | | 1,067,777 | | | | 1,015,028 | |
SELLING, GENERAL AND ADMINISTRATIVE EXPENSES | | | 911,022 | | | | 907,358 | | | | 881,586 | |
| | | | | | | | | | | | |
OPERATING INCOME | | | 420,181 | | | | 400,613 | | | | 350,820 | |
| | | |
OTHER INCOME (EXPENSE): | | | | | | | | | | | | |
Interest income | | | 255 | | | | 311 | | | | 3,068 | |
Interest expense | | | (252,724 | ) | | | (254,103 | ) | | | (313,019 | ) |
Refinancing expense | | | (52,804 | ) | | | — | | | | — | |
Other, net | | | 5,872 | | | | 1,015 | | | | (11,689 | ) |
| | | | | | | | | | | | |
Other expense | | | (299,401 | ) | | | (252,777 | ) | | | (321,640 | ) |
| | | | | | | | | | | | |
| | | |
INCOME BEFORE INCOME TAX EXPENSE | | | 120,780 | | | | 147,836 | | | | 29,180 | |
| | | | | | | | | | | | |
| | | |
INCOME TAX EXPENSE | | | 60,476 | | | | 56,862 | | | | 11,731 | |
| | | | | | | | | | | | |
| | | |
NET INCOME | | | 60,304 | | | | 90,974 | | | | 17,449 | |
| | | |
LESS NET INCOME (LOSS) — NONCONTROLLING INTEREST | | | — | | | | 2,745 | | | | (2,058 | ) |
| | | | | | | | | | | | |
| | | |
NET INCOME — WEST CORPORATION | | $ | 60,304 | | | $ | 88,229 | | | $ | 19,507 | |
| | | | | | | | | | | | |
| | | |
EARNINGS (LOSS) PER COMMON SHARE: | | | | | | | | | | | | |
Basic Class L | | $ | 17.07 | | | $ | 17.45 | | | $ | 12.78 | |
| | | | | | | | | | | | |
Diluted Class L | | $ | 16.37 | | | $ | 16.67 | | | $ | 12.24 | |
| | | | | | | | | | | | |
Basic Class A | | $ | (1.25 | ) | | $ | (0.98 | ) | | $ | (1.23 | ) |
| | | | | | | | | | | | |
Diluted Class A | | $ | (1.25 | ) | | $ | (0.98 | ) | | $ | (1.23 | ) |
| | | | | | | | | | | | |
| | | |
WEIGHTED AVERAGE NUMBER OF SHARES OUTSTANDING: | | | | | | | | | | | | |
Basic Class L | | | 9,975 | | | | 9,954 | | | | 9,901 | |
Diluted Class L | | | 10,399 | | | | 10,409 | | | | 10,334 | |
Basic Class A | | | 87,955 | | | | 87,588 | | | | 87,324 | |
Diluted Class A | | | 87,955 | | | | 87,588 | | | | 87,324 | |
The accompanying notes are an integral part of these financial statements.
F-2
WEST CORPORATION
CONDENSED CONSOLIDATED BALANCE SHEETS
(AMOUNTS IN THOUSANDS)
| | | | | | | | |
| | | December 31, | |
| | | 2010 | | | 2009 | |
ASSETS | | | | | | | | |
CURRENT ASSETS: | | | | | | | | |
Cash and cash equivalents | | $ | 97,793 | | | $ | 59,068 | |
Trust and restricted cash | | | 15,122 | | | | 14,750 | |
Accounts receivable, net of allowance of $10,481 and $11,819 | | | 366,419 | | | | 353,622 | |
Deferred income taxes receivable | | | 29,968 | | | | 35,356 | |
Prepaid assets | | | 33,667 | | | | 34,063 | |
Other current assets | | | 34,058 | | | | 46,757 | |
| | | | | | | | |
Total current assets | | | 577,027 | | | | 543,616 | |
PROPERTY AND EQUIPMENT: | | | | | | | | |
Property and equipment | | | 1,032,205 | | | | 1,024,005 | |
Accumulated depreciation and amortization | | | (690,839 | ) | | | (690,738 | ) |
| | | | | | | | |
Total property and equipment, net | | | 341,366 | | | | 333,267 | |
GOODWILL | | | 1,629,396 | | | | 1,665,569 | |
INTANGIBLE ASSETS, net of accumulated amortization of $357,500 and $298,132 | | | 299,685 | | | | 350,722 | |
OTHER ASSETS | | | 157,776 | | | | 152,088 | |
| | | | | | | | |
TOTAL ASSETS | | $ | 3,005,250 | | | $ | 3,045,262 | |
| | | | | | | | |
LIABILITIES AND STOCKHOLDERS’ DEFICIT | | | | | | | | |
CURRENT LIABILITIES: | | | | | | | | |
Accounts payable | | $ | 64,149 | | | $ | 63,859 | |
Accrued expenses | | | 283,988 | | | | 279,379 | |
Current maturities of long-term debt | | | 15,425 | | | | 25,371 | |
| | | | | | | | |
Total current liabilities | | | 363,562 | | | | 368,609 | |
LONG-TERM OBLIGATIONS,less current maturities | | | 3,518,141 | | | | 3,607,872 | |
DEFERRED INCOME TAXES | | | 93,881 | | | | 96,964 | |
OTHER LONG-TERM LIABILITIES | | | 68,721 | | | | 64,561 | |
| | | | | | | | |
Total liabilities | | | 4,044,305 | | | | 4,138,006 | |
COMMITMENTS AND CONTINGENCIES (Note 16) CLASS L COMMON STOCK $0.001 PAR VALUE, 100,000 SHARES AUTHORIZED, 9,988 AND 9,971 SHARES ISSUED AND OUTSTANDING | | | 1,504,445 | | | | 1,332,721 | |
STOCKHOLDERS’ DEFICIT | | | | | | | | |
Class A common stock $0.001 par value, 400,000 shares authorized, 88,071 and 87,999 shares issued and 87,956 and 87,991 shares outstanding | | | 88 | | | | 88 | |
Retained deficit | | | (2,516,315 | ) | | | (2,408,770 | ) |
Accumulated other comprehensive loss | | | (26,250 | ) | | | (16,730 | ) |
Treasury stock at cost (115 and 8 shares) | | | (1,023 | ) | | | (53 | ) |
| | | | | | | | |
Total stockholders’ deficit | | | (2,543,500 | ) | | | (2,425,465 | ) |
| | | | | | | | |
TOTAL LIABILITIES AND STOCKHOLDERS’ DEFICIT | | $ | 3,005,250 | | | $ | 3,045,262 | |
| | | | | | | | |
The accompanying notes are an integral part of these condensed consolidated financial statements.
F-3
WEST CORPORATION
CONSOLIDATED STATEMENTS OF CASH FLOWS
(AMOUNTS IN THOUSANDS)
| | | | | | | | | | | | |
| | | Years Ended December 31, | |
| | | 2010 | | | 2009 | | | 2008 | |
CASH FLOWS FROM OPERATING ACTIVITIES: | | | | | | | | | | | | |
Net income | | $ | 60,304 | | | $ | 90,974 | | | $ | 17,449 | |
Adjustments to reconcile net income to net cash flows from operating activities: | | | | | | | | | | | | |
Depreciation | | | 103,330 | | | | 104,837 | | | | 103,218 | |
Amortization | | | 67,000 | | | | 83,510 | | | | 80,270 | |
Goodwill impairment | | | 37,675 | | | | — | | | | — | |
Allowance for impairment of purchased accounts receivable | | | — | | | | 25,464 | | | | 76,405 | |
Unrealized (gain) loss on foreign denominated debt | | | — | | | | (3,508 | ) | | | 5,558 | |
Provision for share based compensation | | | 4,233 | | | | 3,840 | | | | 1,404 | |
Deferred income tax expense (benefit) | | | 20,837 | | | | 28,274 | | | | (26,446 | ) |
Debt amortization | | | 15,868 | | | | 16,416 | | | | 15,802 | |
Accelerated debt amortization | | | 19,395 | | | | — | | | | — | |
Non cash (gain) loss on hedge agreements | | | (3,978 | ) | | | (9,570 | ) | | | 17,679 | |
Other | | | 652 | | | | 375 | | | | 107 | |
Changes in operating assets and liabilities, net of business acquisitions: | | | | | | | | | | | | |
Accounts receivable | | | (11,023 | ) | | | (506 | ) | | | (3,226 | ) |
Other assets | | | (9,521 | ) | | | (17,669 | ) | | | 9,113 | |
Accounts payable | | | (1,519 | ) | | | (4,721 | ) | | | (8,965 | ) |
Accrued expenses and other liabilities | | | 9,576 | | | | (44,859 | ) | | | (987 | ) |
| | | | | | | | | | | | |
Net cash flows from operating activities | | | 312,829 | | | | 272,857 | | | | 287,381 | |
| | | | | | | | | | | | |
CASH FLOWS FROM INVESTING ACTIVITIES: | | | | | | | | | | | | |
Business acquisitions, net of cash acquired of $2,138, $8,631 and $9,601 | | | (33,496 | ) | | | (31,711 | ) | | | (493,556 | ) |
Collections applied to principal of portfolio receivables, net of purchases of $0, $1,722 and $45,403 | | | 13,739 | | | | 37,341 | | | | 992 | |
Purchase of property and equipment | | | (118,191 | ) | | | (118,520 | ) | | | (105,381 | ) |
Other | | | 52 | | | | 275 | | | | 406 | |
| | | | | | | | | | | | |
Net cash flows from investing activities | | | (137,896 | ) | | | (112,615 | ) | | | (597,539 | ) |
| | | | | | | | | | | | |
CASH FLOWS FROM FINANCING ACTIVITIES: | | | | | | | | | | | | |
Payments of long-term obligations | | | (1,374,781 | ) | | | (201,674 | ) | | | — | |
Proceeds from issuance of long-term obligations | | | 1,301,850 | | | | — | | | | 417,167 | |
Debt issuance costs | | | (31,083 | ) | | | (7,968 | ) | | | (10,315 | ) |
Principal repayments of long-term obligations | | | (26,747 | ) | | | (25,284 | ) | | | (24,949 | ) |
Payments of capital lease obligations | | | (2,115 | ) | | | (1,293 | ) | | | (949 | ) |
Repurchase of common stock | | | (970 | ) | | | — | | | | — | |
Proceeds from stock and stock options exercised including excess tax benefits | | | 897 | | | | 3,200 | | | | 25 | |
Repayments of portfolio notes payable, net of proceeds from issuance of notes payable of $0, $0 and $33,096 | | | (686 | ) | | | (34,694 | ) | | | (31,834 | ) |
Noncontrolling interest distributions | | | — | | | | (4,131 | ) | | | (7,120 | ) |
Other | | | (16 | ) | | | — | | | | (54 | ) |
| | | | | | | | | | | | |
Net cash flows from financing activities | | | (133,651 | ) | | | (271,844 | ) | | | 341,971 | |
| | | | | | | | | | | | |
EFFECT OF EXCHANGE RATES ON CASH AND CASH EQUIVALENTS | | | (2,557 | ) | | | 2,330 | | | | (5,420 | ) |
NET CHANGE IN CASH AND CASH EQUIVALENTS | | | 38,725 | | | | (109,272 | ) | | | 26,393 | |
CASH AND CASH EQUIVALENTS, Beginning of period | | | 59,068 | | | | 168,340 | | | | 141,947 | |
| | | | | | | | | | | | |
CASH AND CASH EQUIVALENTS, End of period | | $ | 97,793 | | | $ | 59,068 | | | $ | 168,340 | |
| | | | | | | | | | | | |
The accompanying notes are an integral part of these financial statements.
F-4
WEST CORPORATION
CONSOLIDATED STATEMENTS OF STOCKHOLDERS’ EQUITY (DEFICIT)
(AMOUNTS IN THOUSANDS, EXCEPT SHARES )
| | | | | | | | | | | | | | | | | | | | | | | | | | | | | | | | |
| | | Class A
Common
Stock | | | Additional
Paid - in
Capital | | | Retained
Earnings
(Deficit) | | | Noncontrolling
Interest | | | Treasury
Stock | | | Other
Comprehensive
Income (Loss)
Foreign
Currency
Translation | | | Other
Comprehensive
Income (Loss)
on Cash Flow
Hedges | | | Total
Stockholders’
Equity
(Deficit) | |
BALANCE, January 1, 2008 | | $ | 87 | | | $ | — | | | $ | (2,231,302 | ) | | $ | 12,937 | | | $ | — | | | $ | 975 | | | $ | (9,895 | ) | | $ | (2,227,198 | ) |
Net income | | | | | | | | | | | 19,507 | | | | (2,058 | ) | | | | | | | | | | | | | | | 17,449 | |
Foreign currency translation adjustment, net of tax of ($4,276) | | | | | | | | | | | | | | | | | | | | | | | (6,977 | ) | | | | | | | (6,977 | ) |
Reclassification of a cash flow hedge into earnings | | | | | | | | | | | | | | | | | | | | | | | | | | | 1,234 | | | | 1,234 | |
Unrealized loss on cash flow hedges, net of tax of ($8,653) | | | | | | | | | | | | | | | | | | | | | | | | | | | (15,352 | ) | | | (15,352 | ) |
| | | | | | | | | | | | | | | | | | | | | | | | | | | | | | | | |
Total comprehensive loss | | | | | | | | | | | | | | | | | | | | | | | | | | | | | | | (3,646 | ) |
Noncontrolling interest distributions | | | | | | | | | | | | | | | (7,120 | ) | | | | | | | | | | | | | | | (7,120 | ) |
Noncontrolling interest from the Genesys acquisition | | | | | | | | | | | | | | | (127 | ) | | | | | | | | | | | | | | | (127 | ) |
Purchase of stock at cost (8,332 shares) | | | | | | | | | | | | | | | | | | | (53 | ) | | | | | | | | | | | (53 | ) |
Executive Deferred Compensation Plan contributions | | | | | | | 1,397 | | | | | | | | | | | | | | | | | | | | | | | | 1,397 | |
Executive Deferred Compensation Plan valuation change | | | | | | | 1,102 | | | | | | | | | | | | | | | | | | | | | | | | 1,102 | |
Stock options exercised including related | | | | | | | | | | | | | | | | | | | | | | | | | | | | | | | | |
tax benefits (15,000 shares) | | | | | | | 25 | | | | | | | | | | | | | | | | | | | | | | | | 25 | |
Share based compensation | | | | | | | 1,404 | | | | | | | | | | | | | | | | | | | | | | | | 1,404 | |
Accretion of class L common stock priority return preference | | | | | | | (3,928 | ) | | | (122,603 | ) | | | | | | | | | | | | | | | | | | | (126,531 | ) |
| | | | | | | | | | | | | | | | | | | | | | | | | | | | | | | | |
BALANCE, December 31, 2008 | | | 87 | | | | — | | | | (2,334,398 | ) | | | 3,632 | | | | (53 | ) | | | (6,002 | ) | | | (24,013 | ) | | | (2,360,747 | ) |
Net income | | | | | | | | | | | 88,229 | | | | 2,745 | | | | | | | | | | | | | | | | 90,974 | |
Foreign currency translation adjustment, net of tax of ($705) | | | | | | | | | | | | | | | | | | | | | | | 1,855 | | | | | | | | 1,855 | |
Reclassification of a cash flow hedge into earnings | | | | | | | | | | | | | | | | | | | | | | | | | | | 2,057 | | | | 2,057 | |
Unrealized gain on cash flow hedges, net of tax of ($3,905) | | | | | | | | | | | | | | | | | | | | | | | | | | | 9,373 | | | | 9,373 | |
| | | | | | | | | | | | | | | | | | | | | | | | | | | | | | | | |
Total comprehensive income | | | | | | | | | | | | | | | | | | | | | | | | | | | | | | | 104,259 | |
Noncontrolling interest distributions | | | | | | | | | | | | | | | (4,131 | ) | | | | | | | | | | | | | | | (4,131 | ) |
Noncash settlement with a noncontrolling interest | | | | | | | | | | | | | | | (2,246 | ) | | | | | | | | | | | | | | | (2,246 | ) |
Executive Deferred Compensation Plan contributions | | | | | | | 1,728 | | | | | | | | | | | | | | | | | | | | | | | | 1,728 | |
Executive Deferred Compensation Plan valuation change | | | | | | | 4,095 | | | | | | | | | | | | | | | | | | | | | | | | 4,095 | |
Stock options exercised including related | | | | | | | | | | | | | | | | | | | | | | | | | | | | | | | | |
tax benefits (572,660 shares) | | | 1 | | | | 3,532 | | | | | | | | | | | | | | | | | | | | | | | | 3,533 | |
Share based compensation | | | | | | | 1,701 | | | | | | | | | | | | | | | | | | | | | | | | 1,701 | |
Accretion of class L common stock priority return preference | | | | | | | (11,056 | ) | | | (162,601 | ) | | | | | | | | | | | | | | | | | | | (173,657 | ) |
| | | | | | | | | | | | | | | | | | | | | | | | | | | | | | | | |
BALANCE, December 31, 2009 | | | 88 | | | | — | | | | (2,408,770 | ) | | | — | | | | (53 | ) | | | (4,147 | ) | | | (12,583 | ) | | | (2,425,465 | ) |
Net income | | | | | | | | | | | 60,304 | | | | | | | | | | | | | | | | | | | | 60,304 | |
Foreign currency translation adjustment, net of tax of ($3,014) | | | | | | | | | | | | | | | | | | | | | | | (4,918 | ) | | | | | | | (4,918 | ) |
Unrealized loss on cash flow hedges, net of tax of ($2,821) | | | | | | | | | | | | | | | | | | | | | | | | | | | (4,602 | ) | | | (4,602 | ) |
| | | | | | | | | | | | | | | | | | | | | | | | | | | | | | | | |
Total comprehensive income | | | | | | | | | | | | | | | | | | | | | | | | | | | | | | | 50,784 | |
Executive Deferred Compensation Plan distributions, net | | | | | | | (305 | ) | | | | | | | | | | | | | | | | | | | | | | | (305 | ) |
Executive Deferred Compensation Plan valuation change | | | | | | | (275 | ) | | | | | | | | | | | | | | | | | | | | | | | (275 | ) |
Stock options exercised including related tax benefits (78,400 shares) | | | | | | | 897 | | | | | | | | | | | | | | | | | | | | | | | | 897 | |
Purchase of stock at cost (106,277 shares) | | | | | | | | | | | | | | | | | | | (970 | ) | | | | | | | | | | | (970 | ) |
Share based compensation | | | | | | | 2,099 | | | | | | | | | | | | | | | | | | | | | | | | 2,099 | |
Accretion of class L common stock priority return preference | | | | | | | (2,416 | ) | | | (167,849 | ) | | | | | | | | | | | | | | | | | | | (170,265 | ) |
| | | | | | | | | | | | | | | | | | | | | | | | | | | | | | | | |
BALANCE, December 31, 2010 | | $ | 88 | | | $ | — | | | $ | (2,516,315 | ) | | $ | — | | | $ | (1,023 | ) | | $ | (9,065 | ) | | $ | (17,185 | ) | | $ | (2,543,500 | ) |
| | | | | | | | | | | | | | | | | | | | | | | | | | | | | | | | |
The accompanying notes are an integral part of these financial statements.
F-5
WEST CORPORATION
NOTES TO CONSOLIDATED FINANCIAL STATEMENTS
YEARS ENDED DECEMBER 31, 2010, 2009 AND 2008
| 1. | SUMMARY OF SIGNIFICANT ACCOUNTING POLICIES |
Business Description:West Corporation (the “Company” or “West”) is a leading provider of technology-driven, voice and data solutions. “We,” “us” and “our” also refer to West and its consolidated subsidiaries, as applicable. We offer our clients a broad range of communications and infrastructure management solutions that help them manage or support critical communications. The scale and processing capacity of our proprietary technology platforms, combined with our world-class expertise and processes in managing telephony and human capital, enable us to provide our clients with premium outsourced communications solutions. Our automated service and conferencing solutions are designed to improve our clients’ cost structure and provide reliable, high-quality services. Our solutions also help deliver mission-critical services, such as public safety and emergency communications. We serve Fortune 1000 companies and other clients in a variety of industries, including telecommunications, banking, retail, financial services, technology and healthcare, and have sales and operations in the United States, Canada, Europe, the Middle East, Asia Pacific and Latin America.
We operate in two business segments:
| | • | | Unified Communications, including reservationless, operator-assisted, web and video conferencing services, streaming services, alerts and notifications services and consulting, project management and implementation of hosted and managed unified communications solutions; and |
| | • | | Communication Services, including emergency communication services, automated call processing and agent-based services. |
Unified Communications
—Conferencing & Collaboration Services.Operating under the InterCall brand, we are the largest conferencing services provider in the world based on conferencing revenue, according to Wainhouse Research, and managed over 115 million conference calls in 2010. We provide our clients with an integrated global suite of meeting replacement services. These include on-demand automated conferencing services, operator-assisted services for complex audio conferences or large events, web conferencing services that allow clients to make presentations and share applications and documents over the Internet, video conferencing applications that allow clients to experience real-time video presentations and conferences and streaming services to connect remote employees and host virtual events. We also provide consulting, project management and implementation of hosted and managed unified communications solutions.
—Alerts & Notifications Services.Our solutions leverage our proprietary technology platforms to allow clients to manage and deliver automated personalized communications quickly and through multiple delivery channels (voice, text messaging, email and fax). For example, we deliver patient notifications, appointment reminders and prescription reminders on behalf of our healthcare clients (medical and dental practices, hospitals and pharmacies), provide travelers with flight arrival and departure updates on behalf of our transportation clients and transmit emergency evacuation notices on behalf of municipalities. Our platform also enables two-way communications which allow the recipients of a message to respond with relevant information to our clients.
Communication Services
— Automated Services
—Emergency Communications Services.We believe we are the largest provider of emergency communications infrastructure systems and services, based on our own estimates of the number of 9-1-1 calls that we and other participants in the industry facilitated. Our solutions are critical in facilitating
F-6
WEST CORPORATION
NOTES TO CONSOLIDATED FINANCIAL STATEMENTS—(Continued)
YEARS ENDED DECEMBER 31, 2010, 2009 AND 2008
public safety agencies’ ability to coordinate responses to emergency events. We provide the network database solution that routes emergency calls to the appropriate 9-1-1 centers and allows the appropriate first responders (police, fire, ambulance) to be assigned to those calls. Our clients generally enter into long-term contracts and fund their obligations through monthly charges on users’ local telephone bills. We also provide fully-integrated desk-top communications technology solutions to public safety agencies that enable enhanced 9-1-1 call handling.
—Automated Call Processing.Over the last 21 years we believe we have developed a best-in-class suite of automated voice-oriented solutions. Our solutions allow our clients to effectively communicate with their customers through inbound and outbound interactive voice response (IVR) applications using natural language speech recognition, automated voice prompts and network-based call routing services. In addition to these front-end customer service applications, we also provide analyses that help our clients improve their automated communications strategy. Our automated services technology platforms serve as the backbone of our telephony management capabilities and our scale and operational flexibility have helped us launch and grow other key services, such as conferencing, alerts and notifications and West at Home.
—Agent-Based Services.We provide our clients with large-scale, agent-based services, including inbound customer care, customer acquisition and retention, business-to-business sales and account management, overpayment identification and recovery services, and collection of receivables on behalf of our clients. We have a flexible model with both on-shore and off-shore capabilities to fit our clients’ needs. We believe that we are known in the industry as a premium provider of these services, and we seek opportunities with clients for whom our services can add value while maintaining attractive margins for us. Our West at Home agent service is a remote call handling model that uses employees who work out of their homes. This service has a distinct advantage over traditional facility-based call center solutions by attracting higher quality agents. This model helps enhance our cost structure and significantly reduces our capital requirements.
Recapitalization:On October 24, 2006, we completed a recapitalization (the “recapitalization”) of the Company. Pursuant to such recapitalization, our publicly traded securities were cancelled in exchange for cash. The recapitalization was accounted for as a leveraged recapitalization, whereby the historical bases of our assets and liabilities were maintained.
Basis of Consolidation:The consolidated financial statements include our accounts and the accounts of our wholly owned and majority owned subsidiaries. All intercompany transactions and balances have been eliminated in the consolidated financial statements.
Use of Estimates:The preparation of financial statements in conformity with accounting principles generally accepted in the United States of America requires management to make estimates and assumptions that affect the reported amounts of assets and liabilities and disclosure of contingent assets and liabilities at the date of the financial statements and the reported amounts of revenues and expenses during the reporting period. Actual results could differ from those estimates.
Revenue Recognition:In our Unified Communications segment, our conferencing and collaboration services are generally billed and revenue recognized on a per participant minute basis or per seat basis and our alerts and notifications services are generally billed, and revenue recognized, on a per message or per minute basis. License fees charged for certain web services are recognized over the term of the license. Our Communication Services segment recognizes revenue for automated and agent-based services in the month that
F-7
WEST CORPORATION
NOTES TO CONSOLIDATED FINANCIAL STATEMENTS—(Continued)
YEARS ENDED DECEMBER 31, 2010, 2009 AND 2008
services are performed and services are generally billed based on call duration, hours of input, number of calls or a contingent basis. Emergency communications services revenue within the Communication Services segment is generated primarily from monthly fees based on the number of billing telephone numbers and cell towers covered under contract. In addition, product sales and installations are generally recognized upon completion of the installation and client acceptance of a fully functional system or, for contracts that are completed in stages and include contract-specified milestones representative of fair value, upon achieving such contract milestones. As it relates to installation sales, as of January 1, 2010, the Company early adopted new revenue recognition guidance for contracts signed after December 31, 2009, whereby revenue, and associated expense, is recognized when multiple elements are completed rather than recognizing 100% of revenue and expense upon contract completion. For contracts entered into prior to January 1, 2010, revenue associated with advance payments are deferred until the system installations are completed or specified milestones are attained. Costs incurred on uncompleted contracts are accumulated and recorded as deferred costs until the system installations are completed or specified milestones are attained. This guidance was adopted prospectively and specifically for the product sales and installation for the emergency communications services revenue. Contracts for annual recurring services such as support and maintenance agreements are generally billed in advance and are recognized as revenue ratably (on a monthly basis) over the contractual periods. Nonrefundable up-front fees and related costs are recognized ratably over the term of the contract or the expected life of the client relationship, whichever is longer.
Revenue for contingent collection services and overpayment identification and recovery services is recognized in the month collection payments are received based upon a percentage of cash collected or other agreed upon contractual parameters. In December 2010, we sold the balance of the investment in receivable portfolios and no longer participate in purchased receivables collection. Prior to the sale, we used either the level-yield method or the cost recovery method to recognize revenue on these purchased receivable portfolios.
Cost of Services:Cost of services includes labor, sales commissions, telephone and other expenses directly related to service activities.
Selling, General and Administrative Expenses:Selling, general and administrative expenses consist of expenses that support the ongoing operation of our business. These expenses include costs related to division management, facilities costs, depreciation, maintenance, amortization of finite-lived intangible assets, sales and marketing activities, client support services, bad debt expense and corporate management costs.
Other Income (Expense):Other income (expense) includes interest expense from short-term and long-term borrowings under credit facilities, the aggregate gain (loss) on debt transactions denominated in currencies other than the functional currency, sub-lease rental income and interest income.
Cash and Cash Equivalents:We consider short-term investments with original maturities of three months or less at acquisition to be cash equivalents.
Trust and Restricted Cash:Trust cash represents cash collected on behalf of our clients that has not yet been remitted to them. A related liability is recorded in accounts payable until settlement with the respective clients. Restricted cash primarily represents cash held as collateral for certain letters of credit.
Financial Instruments:Cash and cash equivalents, accounts receivable and accounts payable are short-term in nature and the net values at which they are recorded are considered to be reasonable estimates of their fair values.
F-8
WEST CORPORATION
NOTES TO CONSOLIDATED FINANCIAL STATEMENTS—(Continued)
YEARS ENDED DECEMBER 31, 2010, 2009 AND 2008
Accounts Receivable: Accounts receivable from customers is presented net of an allowance for doubtful accounts of approximately $10.5 million and $11.8 million at December 31, 2010 and 2009, respectively.
Property and Equipment: Property and equipment are recorded at cost. Depreciation expense is based on the estimated useful lives of the assets or remaining lease terms, whichever is shorter, and is calculated on the straight-line method. Our owned buildings have estimated useful lives ranging from 20 to 39 years and the majority of the other assets have estimated useful lives of three to five years. We review property, plant and equipment for impairment whenever events or changes in business circumstances indicate that the carrying amount of the assets may not be fully recoverable. Recoverability of an asset “held-for-use” is determined by comparing the carrying amount of the asset to the undiscounted net cash flows expected to be generated from the use of the asset. If the carrying amount is greater than the undiscounted net cash flows expected to be generated by the asset, the asset’s carrying amount is reduced to its fair value. An asset “held-for-sale” is reported at the lower of the carrying amount or fair value less cost to sell.
Goodwill and Intangible Assets:Goodwill at December 31, 2010 and 2009 was $1,629.4 million and $1,665.6 million, respectively. Intangible assets at December 31, 2010 and 2009, net of accumulated amortization, were $299.7 million and $350.7 million, respectively. Goodwill and intangible assets with indefinite lives are not amortized, but are tested for impairment on an annual basis. We test goodwill for impairment at the reporting unit level (operating segment or one level below an operating segment) on an annual basis in the fourth quarter or more frequently if we believe indicators of impairment exist. Goodwill of a reporting unit is tested for impairment between annual tests if an event occurs or circumstances change that would more-likely-than-not reduce the fair value of a reporting unit below its carrying amount. At December 31, 2010, our reporting units were one level below our operating segments. The performance of the impairment test involves a two-step process. The first step of the goodwill impairment test involves comparing the fair values of the applicable reporting units with their aggregate carrying values, including goodwill. We determine the fair value of our reporting units using the discounted cash flow methodology. The discounted cash flow methodology requires us to make key assumptions such as projected future cash flows, growth rates, terminal value and a weighted average cost of capital. If the carrying amount of a reporting unit exceeds the reporting unit’s fair value, we perform the second step of the goodwill impairment test to determine the amount of impairment loss. The second step of the goodwill impairment test involves comparing the implied fair value of the affected reporting unit’s goodwill with the carrying value of that goodwill.
Our indefinite-lived intangible assets consist of trade names and their values are assessed separately from goodwill in connection with our annual impairment testing. This assessment is made using the relief-from royalty method, under which the value of a trade name is determined based on a royalty that could be charged to a third party for using the trade name in question. The royalty, which is based on a reasonable rate applied against forecasted sales, is tax-effected and discounted to present value. The most significant assumptions in this evaluation include estimated future sales, the royalty rate and the after-tax discount rate.
Our finite-lived intangible assets are amortized over their estimated useful lives. Our finite-lived intangible assets are tested for recoverability whenever events or changes in circumstances such as reductions in demand or significant economic slowdowns are present on intangible assets used in operations that may indicate the carrying amount is not recoverable. Reviews are performed to determine whether the carrying value of an asset is recoverable, based on comparisons to undiscounted expected future cash flows. If this comparison indicates that the carrying value is not recoverable, the impaired asset is written down to fair value.
Other Assets: Other assets primarily include the unamortized balance of debt acquisition costs, assets held in non-qualified deferred compensation plans, and the unamortized balance of internally developed capitalized software and licensing agreements. The assets held in the non-qualified deferred compensation plans represent
F-9
WEST CORPORATION
NOTES TO CONSOLIDATED FINANCIAL STATEMENTS—(Continued)
YEARS ENDED DECEMBER 31, 2010, 2009 AND 2008
mutual funds invested in debt and equity securities and are classified as trading securities as employees have the ability to change the investment allocation of their deferred compensation at any time. These investments are reported at fair value with unrealized gains (losses) of $2.9 million, $3.9 million and ($4.9) million for the years ended December 31, 2010, 2009, and 2008, respectively, recognized currently within other income. The underlying obligation, recorded in other liabilities, is likewise reported at the investments’ fair value with adjustments recognized currently within compensation expense. Both the investments and the obligations are classified as non-current.
Income Taxes:We file a consolidated United States income tax return. We use an asset and liability approach for the financial reporting of income taxes in accordance with Accounting Standards Codification Topic 740Income Taxes (“ASC 740”). Deferred income taxes arise from temporary differences between financial and tax reporting. Income tax expense has been provided on the portion of foreign source income that we have determined will be repatriated to the United States. We record uncertain tax positions based on a two-step process, whereby (1) we determine whether it is more likely than not that the tax positions will be sustained based on the technical merits of the position and (2) for those tax positions that meet the more likely than not recognition threshold, we would recognize the largest amount of tax benefit that is greater than fifty percent likely to be realized upon ultimate settlement with the related tax authority.
Other Long-Term Liabilities: Other long-term liabilities primarily include liabilities held in non-qualified deferred compensation plans, uncertain tax positions, the non-current portion of hedge liabilities and non-current deferred revenue.
Other Comprehensive Income (Loss):Other comprehensive income (loss) is composed of unrealized gains or losses on foreign currency translation adjustments arising from changes in exchange rates of our foreign subsidiaries. Assets and liabilities are translated at the exchange rates in effect on the balance sheet dates. The translation adjustment is included in comprehensive income, net of related tax expense. Also, the gain or loss on the effective portion of cash flow hedges (i.e., change in fair value) is initially reported as a component of other comprehensive income (loss). The remaining gain or loss is recognized in interest expense in the same period in which the cash flow hedge affects earnings. These are the only components of other comprehensive income (loss).
Stock Based Compensation:We are required to recognize expense related to the fair value of employee stock option awards and to measure the cost of employee services received in exchange for an award of equity instruments based on the grant date fair value of the award.
Noncontrolling Interest:Effective January 1, 2009, we adopted Accounting Standards Codification 810,Consolidations, which clarified that a noncontrolling interest in a subsidiary is an ownership interest in the consolidated entity which should be reported as equity in the consolidated balance sheet. In December 2010, we sold the balance of the investment in receivable portfolios and no longer participate in purchased receivables collection. As a result of this sale, none of our subsidiaries have noncontrolling interest ownership structures.
Common Stock:Our equity investors (i.e., the Sponsors, the Founders and certain members of management) own a combination of Class L and Class A shares (in strips of eight Class A shares and one Class L share per strip). Supplemental management incentive equity awards (restricted stock and option programs) have been implemented with Class A shares/options only. General terms of these securities are:
| | • | | Class L shares: Each Class L share is entitled to a priority return preference equal to the sum of (x) $90 per share base amount plus (y) an amount sufficient to generate a 12% internal rate of return (“IRR”) |
F-10
WEST CORPORATION
NOTES TO CONSOLIDATED FINANCIAL STATEMENTS—(Continued)
YEARS ENDED DECEMBER 31, 2010, 2009 AND 2008
| | on that base amount, compounded quarterly, from the date of the recapitalization in which the Class L shares were originally issued, October 24, 2006 until the priority return preference is paid in full. Each Class L share also participates in any equity appreciation beyond the priority return on the same per share basis as the Class A shares. |
| | • | | Class A shares: Class A shares participate in the equity appreciation after the Class L priority return is satisfied. |
| | • | | Voting: Each share (whether Class A or Class L) is entitled to one vote per share on all matters on which stockholders vote, subject to Delaware law regarding class voting rights. |
| | • | | Distributions: Dividends and other distributions to stockholders in respect of shares, whether as part of an ordinary distribution of earnings, as a leveraged recapitalization or in the event of an ultimate liquidation and distribution of available corporate assets, are to be paid as follows. First, holders of Class L shares are entitled to receive an amount equal to the Class L base amount of $90 per share plus an amount sufficient to generate a 12% IRR on that base amount, compounded quarterly, from the closing date of the recapitalization to the date of payment. Second, after payment of this priority return to Class L holders, the holders of Class A shares and Class L shares participate together, as a single class, in any and all distributions by the Company. |
| | • | | Conversion of Class L shares: Class L shares automatically convert into Class A shares prior to an initial public offering (“IPO”). Also, the board of directors may elect to cause all Class L shares to be converted into Class A shares in connection with a transfer (by stock sale, merger or otherwise) of a majority of all common stock to a third party (other than to Thomas H. Lee Partners, LP and its affiliates). In the case of any such conversion (whether at an IPO or sale), if any unpaid Class L priority return (base $90/share plus accrued 12% IRR) remains unpaid at the time of conversion it will be “paid” in additional Class A shares valued at the deal price (in case of IPO, at the IPO price net of underwriter’s discount); that is, each Class L share would convert into a number of Class A shares equal to (i) one plus (ii) a fraction, the numerator of which is the unpaid priority return on such Class L share and the denominator of which is the value of a Class A share at the time of conversion. |
As the Class L stockholders control a majority of the votes of the board of directors through direct representation on the board of directors and the conversion and redemption features are considered to be outside the control of the Company, all shares of Class L common stock have been presented outside of permanent equity in accordance with ASC 480-10-599,Classification and Measurement of Redeemable Securities.At December 31, 2010 and 2009, the 12% priority return preference has been accreted and included in the Class L share balance.
A reconciliation of the Class L common shares for the years ended December 31, 2010 and 2009 is presented below, in thousands:
| | | | | | | | |
| | | 2010 | | | 2009 | |
Beginning of period balance | | $ | 1,332,721 | | | $ | 1,158,159 | |
Accretion of class L common stock priority return preference | | | 170,265 | | | | 173,657 | |
Executive Deferred Compensation Plan contributions and other | | | 1,459 | | | | 905 | |
| | | | | | | | |
End of period balance | | $ | 1,504,445 | | | $ | 1,332,721 | |
| | | | | | | | |
F-11
WEST CORPORATION
NOTES TO CONSOLIDATED FINANCIAL STATEMENTS—(Continued)
YEARS ENDED DECEMBER 31, 2010, 2009 AND 2008
Foreign Currency and Translation of Foreign Subsidiaries: The functional currencies of the Company’s foreign operations are the respective local currencies. All assets and liabilities of the Company’s foreign operations are translated into U.S. dollars at fiscal period-end exchange rates. Income and expense items are translated at average exchange rates prevailing during the fiscal period. The resulting translation adjustments are recorded as a component of stockholders’ equity and other comprehensive income. Foreign currency transaction gains or losses are recorded in the statement of operations.
Subsequent Events:We have evaluated subsequent events through February 23, 2011. No subsequent events requiring recognition were identified and therefore none were incorporated into the condensed consolidated financial statements presented herein.
Recently Issued Accounting Pronouncements:In December 2010, the Financial Accounting Standards Board (“FASB”) issued guidance requiring an entity, such as the Company, with reporting units that have carrying amounts that are zero or negative to assess whether it is more likely than not that the reporting units’ goodwill is impaired. The Company will be required to perform step two of the goodwill impairment test if there are any adverse qualitative factors indicating that an impairment may exist for their reporting units with a zero or negative carrying value. This guidance will be effective beginning with the Company’s first quarter 2011 interim period.
| 2. | ACCOUNTS RECEIVABLE SECURITIZATION |
During 2009, West Receivables LLC, a wholly-owned, bankruptcy-remote direct subsidiary of West Receivables Holdings LLC, entered into a three year $125.0 million revolving trade accounts receivable financing facility with Wachovia Bank, National Association. Under the facility, West Receivables Holdings LLC sells or contributes trade accounts receivables to West Receivables LLC, which sells undivided interests in the purchased or contributed accounts receivables for cash to one or more financial institutions. The availability of the funding is subject to the level of eligible receivables after deducting certain concentration limits and reserves. The current facility is subject to renewal in August 2012. The proceeds of the facility are available for general corporate purposes. West Receivables LLC and West Receivables Holdings LLC are consolidated in our condensed consolidated financial statements included elsewhere in this report.
All new trade receivables under the program generated by the West subsidiaries originating the accounts receivable (“originators”) are continuously contributed to or sold to West Receivables LLC through West Receivables Holdings LLC, another consolidated subsidiary of West. Sales are paid for with the proceeds from collections of receivables previously purchased and/or proceeds from the sale of undivided interests in the receivables. West Receivables Holdings LLC issues equity interests to the originators in exchange for accounts receivable, less a discount. West Receivables Holdings LLC sells the accounts receivable to West Receivables LLC in exchange for cash, or contributes the accounts receivable for additional equity interests in West Receivables LLC. West Receivables LLC can then sell undivided interests in the accounts receivable for cash. The highest balance outstanding under the accounts receivable securitization during 2010 was $20.0 million.
The asset securitization facility contains various customary affirmative and negative covenants and also contains customary default and termination provisions, which provide for acceleration of amounts owed under the program upon the occurrence of certain specified events, including, but not limited to, failure to pay yield and other amounts due, defaults on certain indebtedness, certain judgments, changes in control, certain events negatively affecting the overall credit quality of collateralized accounts receivable, bankruptcy and insolvency events and failure to meet financial tests requiring maintenance of certain leverage and coverage ratios, similar to those under our senior secured credit facility.
F-12
WEST CORPORATION
NOTES TO CONSOLIDATED FINANCIAL STATEMENTS—(Continued)
YEARS ENDED DECEMBER 31, 2010, 2009 AND 2008
In June 2009, the Financial Accounting Standards Board updated ASC Topic 860,Transfers and Servicing, which significantly changed the accounting for transfers of financial assets and was effective January 1, 2010. The update to ASC 860 eliminates the qualifying special purpose entity (“QSPE”) concept, establishes conditions for reporting a transfer of a portion of a financial asset as a sale, clarifies the financial asset de-recognition criteria, revises how interests retained by the transferor in a sale of financial assets initially are measured, and removes the guaranteed mortgage securitization recharacterization provisions. At December 31, 2010, we had no outstanding borrowings under our Accounts Receivable Securitization program. When we have outstanding borrowings, the borrowings and related receivables will be consolidated.
| 3. | MERGERS AND ACQUISITIONS |
SPN
On November 9, 2010, we completed the acquisition of substantially all of the assets of Specialty Pharmacy Network, Inc. (“SPN”), a provider of billing and management information to payers and providers that participate in managing, administering and paying specialty pharmacy claims. SPN’s primary offering is a server based application whose data mining capabilities allow SPN to identify indicators of medical claim overpayment based on a proprietary library of pharmacy edits. The purchase price was $3.2 million and was funded by cash on hand. The results of the acquired SPN assets have been included in the Communication Services segment since November 9, 2010.
TuVox
On July 21, 2010, we completed the acquisition of TuVox Incorporated, (“TuVox”) a provider of on-demand and interactive voice recognition applications. The purchase price was $16.5 million and was funded by cash on hand. The results of operations for TuVox have been included in the consolidated financial statements in the Communication Services segment since July 21, 2010.
Holly
On June 1, 2010, we completed the acquisition of Holly Australia Pty Ltd, (“Holly”), a provider of carrier-grade voice platforms. The purchase price was $9.2 million and was funded by cash on hand. The results of operations for Holly have been included in the consolidated financial statements in the Communication Services segment since June 1, 2010.
SKT
On April 1, 2010, we completed the acquisition of the SKT Business Communication Solutions division of the Southern Kansas Telephone Company, Inc. (“SKT”), a provider of professional services, systems integration and information technology specializing in the consulting, project management and implementation of unified communications solutions. The purchase price was $4.0 million and was funded by cash on hand. The results of operations of SKT have been included in the consolidated financial statements in the Unified Communications segment since April 1, 2010.
Stream57
On December 31, 2009, we completed the acquisition of the assets of Stream57, LLC, (“Stream57”) a New York, New York based global provider of web event services, also known as webcasts or webinars. The purchase price was approximately $28.3 million and was funded by cash on hand and partial use of our senior secured
F-13
WEST CORPORATION
NOTES TO CONSOLIDATED FINANCIAL STATEMENTS—(Continued)
YEARS ENDED DECEMBER 31, 2010, 2009 AND 2008
revolving credit facility. The assets acquired and liabilities assumed, including intangible assets and liabilities, are included in our December 31, 2009 consolidated balance sheet. The results of the Stream57 assets were included in the operating results of the Unified Communications segment beginning January 1, 2010.
The following table summarizes the estimated fair values of the assets acquired and liabilities assumed at the respective acquisition dates for SPN, TuVox, Holly, SKT and Stream57. The finite lived intangible assets are comprised of trade names, technology, non-competition agreements and customer relationships. We are in the process of completing the valuation of certain intangible assets and the acquisition accounting allocation, and accordingly the information presented with respect to the acquisitions of SPN, TuVox and Holly are provisional and subject to adjustment.
| | | | | | | | | | | | | | | | | | | | |
(Amounts in thousands) | | SPN | | | TuVox | | | Holly | | | SKT | | | Stream57 | |
Working Capital | | $ | — | | | $ | (1,583 | ) | | $ | 1,704 | | | $ | 2,037 | | | $ | (13 | ) |
Property and equipment | | | — | | | | 242 | | | | 110 | | | | 209 | | | | 355 | |
Other assets, net | | | — | | | | 7,671 | | | | — | | | | — | | | | — | |
Intangible assets | | | 550 | | | | 7,907 | | | | 4,300 | | | | 798 | | | | 7,060 | |
Goodwill | | | 2,638 | | | | 4,244 | | | | 4,412 | | | | 1,005 | | | | 20,973 | |
| | | | | | | | | | | | | | | | | | | | |
Total assets acquired | | | 3,188 | | | | 18,481 | | | | 10,526 | | | | 4,049 | | | | 28,375 | |
| | | | | | | | | | | | | | | | | | | | |
Non-current deferred taxes | | | — | | | | 2,030 | | | | 1,290 | | | | — | | | | 111 | |
| | | | | | | | | | | | | | | | | | | | |
Total liabilities assumed | | | — | | | | 2,030 | | | | 1,290 | | | | — | | | | 111 | |
| | | | | | | | | | | | | | | | | | | | |
Net assets acquired | | $ | 3,188 | | | $ | 16,451 | | | $ | 9,236 | | | $ | 4,049 | | | $ | 28,264 | |
| | | | | | | | | | | | | | | | | | | | |
Assuming the acquisitions of SPN, TuVox, Holly, SKT and Stream57 occurred as of the beginning of the periods presented, our unaudited pro forma results of operations for the years ended December 31, 2010 and 2009 would have been, in thousands, as follows:
| | | | | | | | |
| | | 2010 | | | 2009 | |
Revenue | | $ | 2,398,108 | | | $ | 2,405,467 | |
Net Income—West Corporation | | $ | 58,349 | | | $ | 84,065 | |
Earnings per common L share—basic | | $ | 17.07 | | | $ | 17.45 | |
Earnings per common L share—diluted | | $ | 16.37 | | | $ | 16.67 | |
Loss per common A share—basic | | $ | (1.27 | ) | | $ | (1.02 | ) |
Loss per common A share—diluted | | $ | (1.27 | ) | | $ | (1.02 | ) |
The pro forma results above are not necessarily indicative of the operating results that would have actually occurred if the acquisitions had been in effect on the dates indicated, nor are they necessarily indicative of future results of the combined companies.
F-14
WEST CORPORATION
NOTES TO CONSOLIDATED FINANCIAL STATEMENTS—(Continued)
YEARS ENDED DECEMBER 31, 2010, 2009 AND 2008
| 4. | GOODWILL AND OTHER INTANGIBLE ASSETS |
The following table presents the activity in goodwill by reporting segment for the years ended December 31, 2010 and 2009, in thousands:
| | | | | | | | | | | | |
| | | Unified | | | Communication | | | | |
| | | Communications | | | Services | | | Consolidated | |
Balance at January 1, 2009 | | $ | 820,766 | | | $ | 822,091 | | | $ | 1,642,857 | |
Acquisitions | | | 23,106 | | | | — | | | | 23,106 | |
Purchase accounting adjustments | | | 6,821 | | | | (10,988 | ) | | | (4,167 | ) |
Foreign currency translation adjustment | | | 3,773 | | | | — | | | | 3,773 | |
| | | | | | | | | | | | |
Balance at December 31, 2009 | | | 854,466 | | | | 811,103 | | | | 1,665,569 | |
Acquisitions | | | 1,005 | | | | 11,424 | | | | 12,429 | |
Purchase accounting adjustments | | | (71 | ) | | | 98 | | | | 27 | |
Foreign currency translation adjustment | | | (11,842 | ) | | | 888 | | | | (10,954 | ) |
| | | | | | | | | | | | |
Gross carrying value at December 31, 2010 | | | 843,558 | | | | 823,513 | | | | 1,667,071 | |
| | | | | | | | | | | | |
Impairment | | | — | | | | (37,675 | ) | | | (37,675 | ) |
| | | | | | | | | | | | |
Net balance at December 31, 2010 | | $ | 843,558 | | | $ | 785,838 | | | $ | 1,629,396 | |
| | | | | | | | | | | | |
The excess of the acquisition costs over the fair value of the assets acquired and liabilities assumed for the purchase of SPN, TuVox and Holly were assigned to goodwill based on preliminary estimates. We are in the process of completing the acquisition accounting for certain intangible assets and liabilities. The process of completing the acquisition accounting involves numerous time consuming steps for information gathering, verification and review. We expect to finalize this process in 2011. Goodwill recognized for SPN, TuVox, Holly and SKT at December 31, 2010 was approximately $2.6 million, $4.2 million, $5.4 million and $1.0 million, respectively.
The Company tests goodwill for impairment at the reporting unit level (one level below an operating segment) on an annual basis in the fourth quarter, or more frequently if management believes indicators of impairment exist. Goodwill of a reporting unit is tested for impairment between annual tests if an event occurs or circumstances change that would more-likely-than-not reduce the fair value of a reporting unit below its carrying amount. During 2010, the Company identified impairment indicators in one of our reporting units, our traditional direct response business (marketed as “West Direct”). As a result of these impairment indicators and the results of impairment tests performed using the discounted cash flows model, goodwill with a carrying value of $37.7 million was written down to the fair value of zero. The impairment charge primarily resulted from the decline in revenue in 2010 and continued general decline in the direct response business. These events caused us to revise downward our projected future cash flows for this reporting unit. The impairment charge was recorded in SG&A and is non-deductible for tax purposes.
During 2010 we completed the purchase price allocation for the Stream57 acquisition. The results of the valuation of certain intangible assets required $0.3 million reduction to finite-lived intangible assets with a corresponding increase to goodwill and decrease in deferred taxes from what was previously estimated. Further, working capital was reduced $0.7 million and a $0.1 million working capital cash settlement was paid resulting in an increase to goodwill. As a result of completing the purchase price allocation, the estimated useful economic lives of the finite-lived intangible assets were finalized.
F-15
WEST CORPORATION
NOTES TO CONSOLIDATED FINANCIAL STATEMENTS—(Continued)
YEARS ENDED DECEMBER 31, 2010, 2009 AND 2008
During 2010 we completed the purchase price allocation for the SKT acquisition. The results required no adjustment to goodwill or finite-lived intangible assets.
Subsequent to the goodwill impairment we recognized in the third quarter, our annual impairment testing of goodwill was performed during the fourth quarter of 2010. We were not required to perform step two analysis for the year ended December 31, 2010, as the fair value of each of our reporting units as calculated during the step one analysis exceeded the carrying value.
Factors contributing to the recognition of goodwill
Factors that contributed to a purchase price resulting in the recognition of goodwill, non-deductible for tax purposes, for the purchase of the SPN assets included their expertise and the large market opportunity in pharmacy insurance claims.
Factors that contributed to a purchase price resulting in the recognition of goodwill, non-deductible for tax purposes, for the purchase of TuVox included a reduction of future costs.
Factors that contributed to a purchase price resulting in the recognition of goodwill, non-deductible for tax purposes, for the purchase of Holly included a reduction of future licensing costs and expansion of voice software product offerings.
Factors that contributed to a purchase price resulting in the recognition of goodwill, deductible for tax purposes, for the purchase of SKT included expansion of unified communications offerings including professional services and systems integration.
Factors that contributed to a purchase price resulting in the recognition of goodwill, deductible for tax purposes, for the purchase of the Stream57 assets included expansion of our presence in event audio and video streaming as well as its potential in a large and growing market and cost savings opportunities.
Other intangible assets
Below is a summary of the major intangible assets and weighted average amortization periods for each identifiable intangible asset, in thousands:
| | | | | | | | | | | | | | | | |
| | | As of December 31, 2010 | | | Weighted
Average
Amortization
Period (Years) | |
Intangible assets | | Acquired
Cost | | | Accumulated
Amortization | | | Net Intangible
Assets | | |
Client Relationships | | $ | 473,144 | | | $ | (289,889 | ) | | $ | 183,255 | | | | 9.0 | |
Technology & Patents | | | 102,311 | | | | (47,376 | ) | | | 54,935 | | | | 10.5 | |
Trade names | | | 58,710 | | | | — | | | | 58,710 | | | | Indefinite | |
Trade names (finite-lived) | | | 12,379 | | | | (10,170 | ) | | | 2,209 | | | | 4.3 | |
Other intangible assets | | | 10,641 | | | | (10,065 | ) | | | 576 | | | | 5.6 | |
| | | | | | | | | | | | | | | | |
Total | | $ | 657,185 | | | $ | (357,500 | ) | | $ | 299,685 | | | | | |
| | | | | | | | | | | | | | | | |
F-16
WEST CORPORATION
NOTES TO CONSOLIDATED FINANCIAL STATEMENTS—(Continued)
YEARS ENDED DECEMBER 31, 2010, 2009 AND 2008
| | | | | | | | | | | | | | | | |
| | | As of December 31, 2009 | | | Weighted
Average
Amortization
Period (Years) | |
Intangible assets | | Acquired
Cost | | | Accumulated
Amortization | | | Net Intangible
Assets | | |
Client Relationships | | $ | 473,301 | | | $ | (247,927 | ) | | $ | 225,374 | | | | 9.0 | |
Technology & Patents | | | 95,909 | | | | (35,060 | ) | | | 60,849 | | | | 10.5 | |
Trade names | | | 59,966 | | | | — | | | | 59,966 | | | | Indefinite | |
Trade names (finite-lived) | | | 9,090 | | | | (6,101 | ) | | | 2,989 | | | | 5.4 | |
Other intangible assets | | | 10,588 | | | | (9,044 | ) | | | 1,544 | | | | 5.6 | |
| | | | | | | | | | | | | | | | |
Total | | $ | 648,854 | | | $ | (298,132 | ) | | $ | 350,722 | | | | | |
| | | | | | | | | | | | | | | | |
Amortization expense for finite-lived intangible assets was $61.3 million, $70.1 million and $73.4 million for the years ended December 31, 2010, 2009 and 2008, respectively. Estimated amortization expense in millions for the next five years for the intangible assets acquired in all acquisitions completed by us on or prior to December 31, 2010 is as follows:
| | | | |
2011 | | $ | 49.2 | |
2012 | | $ | 41.2 | |
2013 | | $ | 36.2 | |
2014 | | $ | 29.7 | |
2015 | | $ | 23.6 | |
The trade name intangible asset for five acquisitions (InterCall and ConferenceCall.com in 2003, Intrado in 2006, TeleVox in 2007 and Positron in 2008) were determined to have an indefinite life based on management’s current intentions. If factors were to change that would indicate the need to assign a finite life to these assets, we will do so and will commence amortization. During the fourth quarter of 2010, we performed our annual impairment analysis for these trade names using the relief-from-royalty methodology. No trade names were determined to be impaired during 2010.
The amount of finite-lived intangible assets recognized in the TuVox acquisition is approximately $7.9 million and is comprised of client relationships, technology and trade names. These finite-lived intangible assets are being amortized over one to eighteen years based on a method that most appropriately reflects our expected cash flows from these assets. Amortization expense for the TuVox finite-lived intangible assets was $0.1 million in 2010.
The amount of finite-lived intangible assets recognized in the Holly acquisition is approximately $4.3 million and is comprised of client relationships, technology and trade names. These finite-lived intangible assets are being amortized over three to fourteen years based on a method that most appropriately reflects our expected cash flows from these assets. Amortization expense for the Holly finite-lived intangible assets was $0.6 million in 2010.
The amount of finite-lived intangible assets recognized in the SKT acquisition is approximately $0.8 million and is comprised of client relationships, a non-compete agreement and trade names. These finite-lived intangible assets are being amortized over one to six years based on a method that most appropriately reflects our expected cash flows from these assets. Amortization expense for the SKT finite-lived intangible assets was $0.2 million in 2010.
The amount of finite-lived intangible assets recognized in the Stream57 asset acquisition is approximately $7.1 million and is comprised of client relationships, non-competition agreements, trade names and technology.
F-17
WEST CORPORATION
NOTES TO CONSOLIDATED FINANCIAL STATEMENTS—(Continued)
YEARS ENDED DECEMBER 31, 2010, 2009 AND 2008
These finite-lived intangible assets are being amortized over four to fourteen years based on a method that most appropriately reflects our expected cash flows from these assets. Amortization expense for the Stream57 finite-lived intangible assets was $1.2 million in 2010.
Below is a summary of other intangible assets, at acquired cost, by reporting segment, in thousands:
| | | | | | | | | | | | | | | | |
| | | Unified
Communications | | | Communication
Services | | | Corporate | | | Consolidated | |
As of December 31, 2010 | | | | | | | | | | | | | | | | |
Client relationships | | $ | 256,169 | | | $ | 216,975 | | | $ | — | | | $ | 473,144 | |
Technology & Patents | | | 32,492 | | | | 69,239 | | | | 580 | | | | 102,311 | |
Trade names | | | 37,356 | | | | 33,733 | | | | — | | | | 71,089 | |
Other intangible assets | | | 4,806 | | | | 5,835 | | | | — | | | | 10,641 | |
| | | | | | | | | | | | | | | | |
Total | | $ | 330,823 | | | $ | 325,782 | | | $ | 580 | | | $ | 657,185 | |
| | | | | | | | | | | | | | | | |
As of December 31, 2009 | | | | | | | | | | | | | | | | |
Client relationships | | $ | 262,104 | | | $ | 211,197 | | | $ | — | | | $ | 473,301 | |
Technology & Patents | | | 33,843 | | | | 61,673 | | | | 393 | | | | 95,909 | |
Trade names | | | 37,474 | | | | 31,582 | | | | — | | | | 69,056 | |
Other intangible assets | | | 4,863 | | | | 5,725 | | | | — | | | | 10,588 | |
| | | | | | | | | | | | | | | | |
Total | | $ | 338,284 | | | $ | 310,177 | | | $ | 393 | | | $ | 648,854 | |
| | | | | | | | | | | | | | | | |
Changes in purchased receivable portfolios for the years ended December 31, 2010 and 2009, respectively, in thousands, were as follows:
| | | | | | | | |
| | | 2010 | | | 2009 | |
Beginning of period | | $ | 13,739 | | | $ | 132,746 | |
Purchases, net of putbacks | | | (58 | ) | | | 1,722 | |
Recoveries, including portfolio sales of $7,009 and $8,664 | | | (28,070 | ) | | | (82,378 | ) |
Settlements | | | — | | | | (56,182 | ) |
Revenue recognized | | | 14,389 | | | | 43,295 | |
Portfolio allowances | | | — | | | | (25,464 | ) |
| | | | | | | | |
Balance at end of period | | | — | | | | 13,739 | |
Less: current portion | | | — | | | | (7,973 | ) |
| | | | | | | | |
Portfolio receivables, net of current portion | | $ | — | | | $ | 5,766 | |
| | | | | | | | |
In December 2010, we sold the balance of the investment in receivable portfolios for $6.6 million and no longer participate in purchased receivables collection.
At December 31, 2009, included in the portfolio receivables balance above were pools accounted for under the cost recovery method of $11.8 million. Under the cost recovery method of accounting, no income is recognized until the purchase price of a cost recovery portfolio has been fully recovered. During 2009, we recorded reductions in revenue of $25.5 million, as an allowance for impairment of purchased accounts receivable. This impairment was due to reduced liquidation rates and reduced future collection estimates on existing portfolios. The $13.7 million portfolio receivables at December 31, 2009, is net of a valuation allowance of $22.0 million.
F-18
WEST CORPORATION
NOTES TO CONSOLIDATED FINANCIAL STATEMENTS—(Continued)
YEARS ENDED DECEMBER 31, 2010, 2009 AND 2008
During 2009 a settlement was reached in theCFSC Capital Corp. XXXIV and CVI GVF Finco, LLC v. West Receivable Services Inc. et al. litigation. As a result of the settlement, we purchased CFSC Capital Corp. XXXIV’s interest in a majority-owned subsidiary (“WAP I”). We also abandoned our interest in a second majority-owned subsidiary (“WAP II”). All related lawsuits, claims and counterclaims between the parties were dismissed with prejudice and on the merits as provided for under the terms of the settlement. As a result of the settlement, the portfolio receivables decreased by $48.7 million, net of reserves of $78.2 million. Also, the non-recourse portfolio notes payable, noncontrolling interest, cash and accrued expenses decreased by $49.1 million, $2.2 million, $3.5 million and $0.9 million, respectively. Also during 2009, we disposed of health care portfolio notes receivable of $7.5 million, net of reserves of $4.2 million and the associated non-recourse notes payable of $7.5 million.
Property and equipment, at cost, in thousands, consisted of the following:
| | | | | | | | |
| | | December 31, | |
| | | 2010 | | | 2009 | |
Land and improvements | | $ | 7,428 | | | $ | 7,417 | |
Buildings | | | 98,197 | | | | 97,404 | |
Telephone and computer equipment | | | 719,311 | | | | 708,889 | |
Office furniture and equipment | | | 64,242 | | | | 68,647 | |
Leasehold improvements | | | 108,177 | | | | 105,327 | |
Construction in progress | | | 34,850 | | | | 36,321 | |
| | | | | | | | |
| | $ | 1,032,205 | | | $ | 1,024,005 | |
| | | | | | | | |
We lease certain land, buildings and equipment under operating leases which expire at varying dates through December 2021. Rent expense on operating leases was approximately $44.8 million, $53.3 million and $50.4 million for the years ended December 31, 2010, 2009 and 2008, respectively, exclusive of related-party lease expense. On all real estate leases, we pay real estate taxes, insurance and maintenance associated with the leased sites. Certain of the leases offer extension options ranging from month-to-month to five years.
Future minimum payments under non-cancelable operating leases with initial or remaining terms of one year or more, in thousands, are as follows:
| | | | | | | | | | | | |
Year Ending December 31, | | Non-
Related
Party Operating
Leases | | | Related
Party
Operating
Lease | | | Total
Operating
Leases | |
2011 | | $ | 32,491 | | | $ | 731 | | | $ | 33,222 | |
2012 | | | 23,606 | | | | 731 | | | | 24,337 | |
2013 | | | 15,268 | | | | 731 | | | | 15,999 | |
2014 | | | 11,160 | | | | 487 | | | | 11,647 | |
2015 | | | 9,326 | | | | — | | | | 9,326 | |
2016 and thereafter | | | 31,169 | | | | — | | | | 31,169 | |
| | | | | | | | | | | | |
Total minimum obligations | | $ | 123,020 | | | $ | 2,680 | | | $ | 125,700 | |
| | | | | | | | | | | | |
F-19
WEST CORPORATION
NOTES TO CONSOLIDATED FINANCIAL STATEMENTS—(Continued)
YEARS ENDED DECEMBER 31, 2010, 2009 AND 2008
Accrued expenses, in thousands, consisted of the following as of:
| | | | | | | | |
| | | December 31, | |
| | | 2010 | | | 2009 | |
Deferred revenue and customer deposits | | $ | 48,845 | | | $ | 54,530 | |
Accrued wages | | | 46,673 | | | | 44,698 | |
Accrued other taxes (non-income related) | | | 38,846 | | | | 55,450 | |
Interest payable | | | 31,318 | | | | 25,966 | |
Interest rate hedge position | | | 26,123 | | | | 16,421 | |
Accrued phone | | | 25,568 | | | | 23,525 | |
Accrued employee benefit costs | | | 17,214 | | | | 19,987 | |
Accrued lease expense | | | 8,695 | | | | 5,432 | |
Accrued settlements | | | 4,307 | | | | 2,175 | |
Other current liabilities | | | 36,399 | | | | 31,195 | |
| | | | | | | | |
| | $ | 283,988 | | | $ | 279,379 | |
| | | | | | | | |
Management Services
Affiliates of Thomas H. Lee Partners, L.P. and Quadrangle Group LLC provide management and advisory services pursuant to the management services agreement entered into in connection with the consummation of the recapitalization. The fees for services and expenses were $4.2 million each year for the years ended December 31, 2010, 2009 and 2008. On October 2, 2009, the Company filed a Registration Statement on Form S-1 (Registration No. 333-162292) with the Securities Exchange Commission and amendments to the Registration Statement on November 6, 2009, December 1, 2009, December 16, 2009 and February 16, 2010. Upon successful completion of the Proposed Offering, the contract for management services with the affiliates of Thomas H. Lee Partners, L.P. and Quadrangle Group LLC would be terminated. The early termination of this agreement will require a payment of an amount equal to the net present value (using a discount rate equal to the then prevailing yield on the U.S. Treasury Securities of like maturity) of the $4.0 million annual management fee that would have been payable under the management services agreement from the date of completion of the offering until the seventh anniversary of such offering, such fee to be due and payable at the closing of the offering.
Lease
We lease certain office space owned by a partnership whose partners own approximately 22% of our common stock at December 31, 2010. Related party lease expense was approximately $0.7 million each year for the years ended December 31, 2010, 2009 and 2008. The lease expires in 2014.
TOGM
On April 30, 2009, we entered into a series of amended and restated agreements with TOGM, LLC (“TOGM”) pursuant to which TOGM would finance up to 70% of the purchase price of selected receivables portfolios. Interest generally accrued on the outstanding debt at a fixed rate of 8.5%. The amended and restated agreements continued the facility executed as of May 21, 2008 and which expired December 31, 2008 pursuant
F-20
WEST CORPORATION
NOTES TO CONSOLIDATED FINANCIAL STATEMENTS—(Continued)
YEARS ENDED DECEMBER 31, 2010, 2009 AND 2008
to which TOGM had financed up to 80% of the purchase price of selected receivables portfolios at a variable rate equal to 3.5% over prime. The debt was non-recourse to us and collateralized by all of the assets of West Receivables Purchasing, LLC (“West Receivables”). The sole assets of West Receivables were the receivables portfolios which were partially financed by TOGM. At December 31, 2009, we had $0.7 million of non-recourse portfolio notes payable outstanding under this facility, which were sold to an unrelated third party.
In connection with the formation of West Receivables, we and TOGM entered into an operating agreement pursuant to which the members share in the profits of the portfolio after collection expenses and the repayment of principal and interest in proportion to their respective membership interests. We provided, directly or through a third party, all necessary services to West Receivables, including collection of the receivables pursuant to a servicing agreement. TOGM’s shareholders are Mary and Gary West, who collectively own approximately 22% of our common stock.
In December 2010, TOGM agreed that it had no further economic interest in West Receivables and authorized the liquidation of its assets which was completed in December 2010.
Long-term obligations, in thousands, consisted of the following as of:
| | | | | | | | |
| | | December 31, | |
| | | 2010 | | | 2009 | |
Senior Secured Term Loan Facility, due 2013 | | $ | 450,210 | | | $ | 1,465,263 | |
Senior Secured Term Loan Facility, due 2016 | | | 1,483,356 | | | | 994,885 | |
Senior Secured Revolving Credit Facility, due 2012 | | | — | | | | 72,931 | |
Senior Secured Revolving Credit Facility, due 2016 | | | — | | | | — | |
11% Senior Subordinated Notes, due 2016 | | | 450,000 | | | | 450,000 | |
8 5/8% Senior Notes, due 2018 | | | 500,000 | | | | — | |
7 7/8% Senior Notes, due 2019 | | | 650,000 | | | | — | |
9.5% Senior Notes, repaid in 2010 | | | — | | | | 650,000 | |
8.5% Mortgage Note, repaid in 2010 | | | — | | | | 164 | |
| | | | | | | | |
| | | 3,533,566 | | | | 3,633,243 | |
| | | | | | | | |
Less: current maturities | | | (15,425 | ) | | | (25,371 | ) |
| | | | | | | | |
Long-term obligations | | $ | 3,518,141 | | | $ | 3,607,872 | |
| | | | | | | | |
On October 5, 2010, we issued $500.0 million aggregate principal amount of 8 5/8% Senior Notes due 2018, and used the gross proceeds of the notes issuance to repay $500.0 million of our senior secured term loan facility due 2013.
On November 24, 2010, we issued $650.0 million aggregate principal amount of 7 7/8% Senior Notes due 2019, and used the gross proceeds of the notes issuance to repay $650.0 million of our 9.5% Senior Notes due 2014.
Interest expense during 2010, 2009 and 2008 on these long-term obligations was approximately $252.7 million, $250.8 million and $298.9 million, respectively.
F-21
WEST CORPORATION
NOTES TO CONSOLIDATED FINANCIAL STATEMENTS—(Continued)
YEARS ENDED DECEMBER 31, 2010, 2009 AND 2008
Future maturities of long-term debt, in thousands, were:
| | | | |
Year Ending December 31, | | Amount | |
2011 | | $ | 15,425 | |
2012 | | $ | 15,425 | |
2013 | | $ | 465,635 | |
2014 | | $ | 15,425 | |
2015 | | $ | 15,425 | |
Thereafter | | $ | 3,006,231 | |
Senior Secured Term Loan Facility and Senior Secured Revolving Credit Facility.
The Senior Secured Term Loan Facility and Senior Secured Revolving Credit Facility bear interest at variable rates. On October 5, 2010, we amended and restated our credit agreement, which modified the Company’s senior secured credit facilities in several respects, including: extending the maturity of approximately $158 million of our $250 million senior secured revolving credit facility (and securing approximately $43 million of additional senior secured revolving credit facility commitments for the extended term) from October 2012 to January 2016 with the interest rate margins of such extended maturity revolving credit loans increasing by 1.00 percent; extending the maturity of $500 million of our senior secured term loan facility from October 2013 to July 2016, with the interest rate margins of such extended senior secured term loans increasing by 1.875 percent; increasing the interest rate margins of approximately $984.6 million of our senior secured term loan facility due July 2016 by 0.375 percent to match the interest rate margins for the newly extended senior secured term loan facility and; modifying the step-down schedule in the current financial covenants and certain covenant baskets.
After giving effect to the prepayment of amortization payments payable in respect of the term loans due 2013, the amended and restated Senior Secured Term Loan Facility requires annual principal payments of approximately $15.4 million, paid quarterly, with balloon payments at maturity dates of October 24, 2013 and July 15, 2016 of approximately $450.2 million and $1,398.5 million, respectively. Pricing of the amended and restated senior secured term loan facility, due 2013, is based on the Company’s corporate debt rating and the grid ranges from 2.125% to 2.75% for LIBOR rate loans (LIBOR plus 2.375% at December 31, 2010), and from 1.125% to 1.75% for Base Rate loans (Base Rate plus 1.375% at December 31, 2010). The interest rate margins for the amended and restated senior secured term loans due 2016 are based on the Company’s corporate debt rating based on a grid, which ranges from 4.00% to 4.625% for LIBOR rate loans (LIBOR plus 4.25% at December 31, 2010), and from 3.00% to 3.625% for Base Rate loans (Base Rate plus 3.25% at December 31, 2010). The effective annual interest rates, inclusive of debt amortization costs, on the senior secured term loan facility for 2010 and 2009 were 5.21% and 5.25%, respectively.
Debt issuance costs for the October 5, 2010 amended and restated credit agreement were approximately $9.9 million.
The original maturity senior secured revolving credit facility pricing is based on the Company’s total leverage ratio and the grid ranges from 1.75% to 2.50% for LIBOR rate loans (LIBOR plus 2.0% at December 31, 2010), and the margin ranges from 0.75% to 1.50% for base rate loans (Base Rate plus 1.0% at December 31, 2010). The Company is required to pay each non-defaulting lender a commitment fee of 0.50% in respect of any unused commitments under the original maturity senior secured revolving credit facility. The commitment fee in respect of unused commitments under the original maturity senior secured revolving credit facility is subject to adjustment based upon our total leverage ratio. The average daily outstanding balance of the
F-22
WEST CORPORATION
NOTES TO CONSOLIDATED FINANCIAL STATEMENTS—(Continued)
YEARS ENDED DECEMBER 31, 2010, 2009 AND 2008
original maturity senior secured revolving credit facility during 2010 and 2009 was $13.1 million and $169.9 million, respectively. The highest balance outstanding on the original maturity senior secured revolving credit facility during 2010 and 2009 was $80.9 million and $224.0 million, respectively.
The extended maturity senior secured revolving credit facility pricing is based on the Company’s total leverage ratio and the grid ranges from 2.75% to 3.50% for LIBOR rate loans (LIBOR plus 3.0% at December 31, 2010), and the margin ranges from 1.75% to 2.50% for base rate loans (Base Rate plus 2.0% at December 31, 2010). The Company is required to pay each non-defaulting lender a commitment fee of 0.50% in respect of any unused commitments under the extended maturity senior secured revolving credit facility. The commitment fee in respect of unused commitments under the extended maturity senior secured revolving credit facility is subject to adjustment based upon our total leverage ratio. There have been no borrowings under the extended maturity senior secured revolving credit facility since its inception, October 5, 2010.
The senior secured credit facilities include certain customary representations and warranties, affirmative covenants, and events of default, including payment defaults, breaches of representations and warranties, covenant defaults, cross-defaults to certain indebtedness, certain events of bankruptcy, certain events under the Employee Retirement Income Security Act of 1974, material judgments, the invalidity of material provisions of the documentation with respect to the senior secured credit facilities, the failure of collateral under the security documents for the senior secured credit facilities, the failure of the senior secured credit facilities to be senior debt under the subordination provisions of certain of the Company’s subordinated debt and a change of control of the Company. If an event of default occurs, the lenders under the senior secured credit facilities will be entitled to take certain actions, including the acceleration of all amounts due under the senior secured credit facilities and all actions permitted to be taken by a secured creditor.
The Company may request additional tranches of term loans or increases to the revolving credit facility in an aggregate amount not to exceed $831.4 million including the aggregate amount of $600.4 million of principal payments previously made in respect of the term loan facility. The availability of such additional tranches of term loans or increases to the revolving credit facility is subject to the absence of any default and pro forma compliance with financial covenants and, among other things, the receipt of commitments by existing or additional financial institutions.
Multicurrency revolving credit facility
InterCall Conferencing Services Limited (“ICSL”), a foreign subsidiary of InterCall, maintained a $75.0 million multicurrency revolving credit facility. The credit facility was secured by substantially all of the assets of ICSL, and was not guaranteed by West or any of its domestic subsidiaries. On November 17, 2010, we provided notice to the lenders of our intent to cancel the facility effective November 22, 2010.
There was no outstanding balance on the multicurrency revolving credit facility at December 31, 2009. During 2010 there were no borrowings under the multicurrency revolving credit facility. The average daily outstanding balance of the multicurrency revolving credit facility during 2009 was $30.3 million. The highest balance outstanding on the multicurrency revolving credit facility during 2009 was $48.2 million.
2016 Senior Subordinated Notes
The Company’s $450.0 million aggregate principal amount of 11% senior subordinated notes due 2016 (the “2016 Senior Subordinated Notes”) bear interest that is payable semiannually.
F-23
WEST CORPORATION
NOTES TO CONSOLIDATED FINANCIAL STATEMENTS—(Continued)
YEARS ENDED DECEMBER 31, 2010, 2009 AND 2008
At any time prior to October 15, 2011, we may redeem all or a part of the 2016 Senior Subordinated Notes at a redemption price equal to 100% of the principal amount of 2016 Senior Subordinated Notes redeemed plus the applicable premium (as defined in the indenture governing the 2016 Senior Subordinated Notes) and accrued and unpaid interest to the date of redemption, subject to the rights of holders of 2016 Senior Subordinated Notes on the relevant record date to receive interest due on the relevant interest payment date.
On and after October 15, 2011, we may redeem the 2016 Senior Subordinated Notes in whole or in part at the redemption prices (expressed as percentages of principal amount of the 2016 Senior Subordinated Notes to be redeemed) set forth below plus accrued and unpaid interest thereon to the applicable date of redemption, subject to the right of holders of 2016 Senior Subordinated Notes of record on the relevant record date to receive interest due on the relevant interest payment date, if redeemed during the twelve-month period beginning on October 15 of each of the years indicated below:
| | | | |
Year | | Percentage | |
2011 | | | 105.500 | |
2012 | | | 103.667 | |
2013 | �� | | 101.833 | |
2014 and thereafter | | | 100.000 | |
2018 Senior Notes
On October 5, 2010, we issued $500 million aggregate principal amount of 8 5/8% senior notes that mature on October 1, 2018 (the “2018 Senior Notes”).
At any time prior to October 1, 2014, we may redeem all or a part of the 2018 Senior Notes at a redemption price equal to 100% of the principal amount of 2018 Senior Notes redeemed plus the applicable premium (as defined in the indenture governing the 2018 Senior Notes) and accrued and unpaid interest and all additional interest then owing pursuant to the registration rights agreement executed in connection with the 2018 Senior Notes, if any, to the date of redemption, subject to the rights of holders of 2018 Senior Notes on the relevant record date to receive interest due on the relevant interest payment date.
On and after October 1, 2014, we may redeem the 2018 Senior Notes in whole or in part at the redemption prices (expressed as percentages of principal amount of the 2018 Senior Notes to be redeemed) set forth below plus accrued and unpaid interest thereon and all additional interest then owing pursuant to the registration rights agreement executed in connection with the 2018 Senior Notes, if any, to the applicable date of redemption, subject to the right of holders of 2018 Senior Notes of record on the relevant record date to receive interest due on the relevant interest payment date, if redeemed during the twelve-month period beginning on October 1 of each of the years indicated below:
| | | | |
Year | | Percentage | |
2014 | | | 104.313 | |
2015 | | | 102.156 | |
2016 and thereafter | | | 100.000 | |
At any time (which may be more than once) before October 1, 2013, we can choose to redeem up to 35% of the outstanding notes with money that we raise in one or more equity offerings, as long as: we pay 108.625% of
F-24
WEST CORPORATION
NOTES TO CONSOLIDATED FINANCIAL STATEMENTS—(Continued)
YEARS ENDED DECEMBER 31, 2010, 2009 AND 2008
the face amount of the notes, plus accrued and unpaid interest; we redeem the notes within 90 days completing the equity offering; and at least 65% of the aggregate principal amount of the applicable series of notes issued remains outstanding afterwards.
Debt issuance costs for the 2018 Senior Notes were approximately $11.0 million.
2019 Senior Notes
On November 24, 2010, we issued $650.0 million aggregate principal amount of 7 7/8% senior notes that mature January 15, 2019 (the “2019 Senior Notes”).
At any time prior to November 15, 2013, we may redeem all or a part of the 2019 Senior Notes at a redemption price equal to 100% of the principal amount of 2019 Senior Notes redeemed plus the applicable premium (as defined in the indenture governing the 2019 Senior Notes) and accrued and unpaid interest and all additional interest then owing pursuant to the registration rights agreement executed in connection with the 2019 Senior Notes, if any, to the date of redemption, subject to the rights of holders of 2019 Senior Notes on the relevant record date to receive interest due on the relevant interest payment date.
On and after November 15, 2014, we may redeem the 2019 Senior Notes in whole or in part at the redemption prices (expressed as percentages of principal amount of the 2019 Senior Notes to be redeemed) set forth below plus accrued and unpaid interest thereon and all additional interest then owing pursuant to the registration rights agreement executed in connection with the 2019 Senior Notes, if any, to the applicable date of redemption, subject to the right of holders of 2019 Senior Notes of record on the relevant record date to receive interest due on the relevant interest payment date, if redeemed during the twelve-month period beginning on November 15 of each of the years indicated below:
| | | | |
Year | | Percentage | |
2014 | | | 103.938 | |
2015 | | | 101.969 | |
2016 and thereafter | | | 100.000 | |
At any time (which may be more than once) before November 15, 2013, we can choose to redeem up to 35% of the outstanding notes with money that we raise in one or more equity offerings, as long as: we pay 107.875% of the face amount of the notes, plus accrued and unpaid interest; we redeem the notes within 90 days completing the equity offering; and at least 65% of the aggregate principal amount of the applicable series of notes issued remains outstanding afterwards.
Debt issuance costs for the 2019 Senior Notes were approximately $10.2 million. The tender premium paid to redeem the 2014 senior notes was $32.8 million. Other expenses associated with the tender offer for the 2014 senior notes were approximately $0.6 million.
During 2010, we recorded $19.4 million of accelerated debt amortization related to the refinancing of our Senior Secured Term Loan Facility and the 2014 Senior Notes.
We and our subsidiaries, affiliates or significant shareholders may from time to time, in our or their sole discretion, purchase, repay, redeem or retire any of our outstanding debt or equity securities (including any publicly issued debt or equity securities), in privately negotiated or open market transactions, by tender offer or otherwise.
F-25
WEST CORPORATION
NOTES TO CONSOLIDATED FINANCIAL STATEMENTS—(Continued)
YEARS ENDED DECEMBER 31, 2010, 2009 AND 2008
Periodically, we have entered into interest rate swaps to hedge the cash flows from our variable rate debt, which effectively converts the hedged portion under our outstanding senior secured term loan facility to fixed rate debt. The initial assessments of hedge effectiveness were performed using regression analysis. The periodic measurements of hedge ineffectiveness are performed using the change in variable cash flows method.
The cash flow hedges are recorded at fair value with a corresponding entry, net of taxes, recorded in other comprehensive income (“OCI”) until earnings are affected by the hedged item. At December 31, 2010, the notional amount of debt outstanding under interest rate swap agreements was $1,600.0 million. The fixed interest rate on the interest rate swaps ranges from 1.685% to 3.532%.
The following table presents, in thousands, the fair value of the Company’s derivatives and consolidated balance sheet location.
| | | | | | | | | | | | |
| | | Liability Derivatives | |
| | | 2010 | | | 2009 | |
| | | Balance Sheet Location | | Fair Value | | | Balance Sheet Location | | Fair Value | |
Derivatives designated as hedging instruments: | | | | | | | | | | |
Interest rate and basis swaps | | Accrued expenses | | $ | 21,765 | | | Accrued expenses | | $ | 11,535 | |
Interest rate swaps | | Other long-term liabilities | | | 5,725 | | | Other long-term liabilities | | | 8,726 | |
| | | | | | | | | | | | |
| | | | | 27,490 | | | | | | 20,261 | |
Derivatives not designated as hedging instruments: | | | | | | | | | | |
Interest rate swaps | | Accrued expenses | | | 4,358 | | | Accrued expenses | | | 4,886 | |
Interest rate swaps | | Other long-term liabilities | | | — | | | Other long-term liabilities | | | 3,257 | |
| | | | | | | | | | | | |
Total derivatives | | | | $ | 31,848 | | | | | $ | 28,404 | |
| | | | | | | | | | | | |
The following presents, in thousands, the impact of interest rate swaps on the consolidated statements of operations for 2010, 2009 and 2008, respectively.
| | | | | | | | | | | | | | | | | | | | | | | | |
Derivatives designated as hedging instruments | | Amount of gain (loss) recognized
in OCI for the years ended
December 31, | | | Amount of gain (loss)
recognized in net income
on hedges (ineffective portion)
for the years ended December 31, | |
| | 2010 | | | 2009 | | | 2008 | | | 2010 | | | 2009 | | | 2008 | |
Interest rate swaps | | $ | (4,602 | ) | | $ | 9,373 | | | $ | (15,352 | ) | | $ | 179 | | | $ | 1,973 | | | $ | (1,972 | ) |
| | | | | | | | | | | | | | | | | | | | | | | | |
| | |
Location of gain (loss) reclassified from OCI into net
income | | | | | Amount of gain
(loss) reclassified
from OCI into net income
for the years ended December 31, | |
| | | | | | | | | | | 2010 | | | 2009 | | | 2008 | |
Interest expense | | | | | | | | | | | | | | $ | — | | | $ | 2,057 | | | $ | 1,234 | |
| | | | | | | | | | | | | | | | | | | | | | | | |
F-26
WEST CORPORATION
NOTES TO CONSOLIDATED FINANCIAL STATEMENTS—(Continued)
YEARS ENDED DECEMBER 31, 2010, 2009 AND 2008
Components of income tax expense, in thousands, were as follows:
| | | | | | | | | | | | |
| | | Year Ended December 31, | |
| | | 2010 | | | 2009 | | | 2008 | |
Current income tax expense: | | | | | | | | | | | | |
Federal | | $ | 8,174 | | | $ | 3,389 | | | $ | 4,058 | |
State | | | 3,547 | | | | 4,952 | | | | 3,521 | |
Foreign | | | 27,918 | | | | 20,247 | | | | 30,598 | |
| | | | | | | | | | | | |
| | | 39,639 | | | | 28,588 | | | | 38,177 | |
| | | | | | | | | | | | |
Deferred income tax expense (benefit): | | | | | | | | | | | | |
Federal | | | 14,290 | | | | 6,946 | | | | (12,892 | ) |
State | | | 1,225 | | | | 595 | | | | (1,359 | ) |
Foreign | | | 5,322 | | | | 20,733 | | | | (12,195 | ) |
| | | | | | | | | | | | |
| | | 20,837 | | | | 28,274 | | | | (26,446 | ) |
| | | | | | | | | | | | |
Total income tax expense | | $ | 60,476 | | | $ | 56,862 | | | $ | 11,731 | |
| | | | | | | | | | | | |
A reconciliation of income tax expense computed at statutory tax rates compared to effective income tax rates was as follows:
| | | | | | | | | | | | |
| | | Year Ended December 31, | |
| | | 2010 | | | 2009 | | | 2008 | |
Statutory rate | | | 35.0 | % | | | 35.0 | % | | | 35.0 | % |
Goodwill impairment | | | 11.2 | % | | | 0.0 | % | | | 0.0 | % |
State income taxes, net of Federal benefit | | | 2.1 | % | | | 2.4 | % | | | 7.8 | % |
Federal tax credits | | | -1.6 | % | | | -1.5 | % | | | -6.7 | % |
Uncertain tax positions | | | 1.3 | % | | | 0.8 | % | | | 0.4 | % |
Foreign items | | | 1.2 | % | | | 1.4 | % | | | 0.0 | % |
Non-deductible meals | | | 0.4 | % | | | 0.3 | % | | | 0.0 | % |
Noncontrolling interest in net income | | | 0.0 | % | | | -0.7 | % | | | 2.5 | % |
Other | | | 0.5 | % | | | 0.7 | % | | | 1.2 | % |
| | | | | | | | | | | | |
| | | 50.1 | % | | | 38.4 | % | | | 40.2 | % |
| | | | | | | | | | | | |
F-27
WEST CORPORATION
NOTES TO CONSOLIDATED FINANCIAL STATEMENTS—(Continued)
YEARS ENDED DECEMBER 31, 2010, 2009 AND 2008
Significant temporary differences between reported financial and taxable earnings that give rise to deferred tax assets and liabilities, in thousands, were as follows:
| | | | | | | | |
| | | Year Ended December 31, | |
| | | 2010 | | | 2009 | |
Deferred income tax assets: | | | | | | | | |
Net operating loss carryforwards | | $ | 139,756 | | | $ | 147,288 | |
Accrued expenses | | | 21,149 | | | | 22,027 | |
Tax credits | | | 15,510 | | | | 8,365 | |
Benefit plans | | | 14,662 | | | | 11,375 | |
Interest rate hedge activities | | | 10,564 | | | | 7,743 | |
Reserves not currently deductible for tax purposes | | | 4,682 | | | | 4,804 | |
Allowance for doubtful accounts | | | 2,453 | | | | 2,558 | |
Cost recovery | | | — | | | | 5,381 | |
Other | | | 4,737 | | | | 1,683 | |
| | | | | | | | |
Gross deferred income tax assets | | | 213,513 | | | | 211,224 | |
| | | | | | | | |
Less valuation allowance | | | (119,684 | ) | | | (101,849 | ) |
| | | | | | | | |
Total deferred income tax assets | | $ | 93,829 | | | $ | 109,375 | |
| | | | | | | | |
Deferred tax liabilities: | | | | | | | | |
Acquired intangibles amortization | | $ | 120,020 | | | $ | 120,960 | |
Excess tax depreciation over financial depreciation | | | 25,212 | | | | 14,097 | |
International earnings | | | 15,603 | | | | 29,355 | |
Foreign currency translation | | | (8,065 | ) | | | 2,367 | |
Prepaid expenses | | | 4,972 | | | | 4,204 | |
| | | | | | | | |
Total deferred tax liabilities | | | 157,742 | | | | 170,983 | |
| | | | | | | | |
Net deferred tax liability | | $ | 63,913 | | | $ | 61,608 | |
| | | | | | | | |
Deferred tax assets / liabilities included in the balance sheet are: | | | | | | | | |
Deferred income tax asset—current | | $ | 29,968 | | | $ | 35,356 | |
Deferred income tax liability—long-term | | | 93,881 | | | | 96,964 | |
| | | | | | | | |
Net deferred income taxes | | $ | 63,913 | | | $ | 61,608 | |
| | | | | | | | |
At December 31, 2010, we had federal and foreign net operating loss (“NOL”) carryforwards in the amount of $375.5 million which resulted in a net deferred tax asset of $31.2 million which is available to reduce future taxes in the U.S. and Canada. The NOL carryforwards are all attributable to acquired companies. In connection with the TuVox and Holly acquisitions, we assumed U.S. NOLs of approximately $42.6 million and approximately $3.5 million of Australia NOLs. The use of the U.S. NOL carryforwards is subject to limitations under Internal Revenue Code Section 382. As a result of these statutory limitations, we believe that $12.8 million of those NOL’s will be utilized to offset future taxable income. The Australian NOLs will be limited under the applicable Australian tax rules. The valuation allowances, which reduce deferred tax assets to an amount that will more likely than not be realized, were $119.7 million at December 31, 2010 and $101.8 million at December 31, 2009. Our valuation allowance increased $17.8 million in 2010. We also have tax credit carryforwards of $3.3 million, related to general business credits that can be offset against federal income tax in future years. The general business credits can be carried forward for 20 years from the date of origin and begin expiring in 2030. Also included in the net long-term deferred tax liability are offsetting amounts, $15.6 million, relating to
F-28
WEST CORPORATION
NOTES TO CONSOLIDATED FINANCIAL STATEMENTS—(Continued)
YEARS ENDED DECEMBER 31, 2010, 2009 AND 2008
cancellation of indebtedness (income) and original issue discount (interest expense) related to the Fifth Amendment of the Credit Agreement entered into on August 28, 2009 and the Amendment and Restatement entered into on October 5, 2010.
In 2010, 2009, and 2008, income tax benefits attributable to employee stock option transactions of $1.6 million, $1.7 million and $0 million, respectively were allocated to shareholders’ equity.
In preparing our tax returns, we are required to interpret complex tax laws and regulations. On an ongoing basis, we are subject to examinations by federal and state tax authorities that may give rise to different interpretations of these complex laws and regulations. The number of tax years that remain open and subject to tax audits varies depending upon the tax jurisdiction. Our major taxing jurisdictions include the U.S., United Kingdom and France. Due to the nature of the examination process, it generally takes years before these examinations are completed and matters are resolved. During 2010, the Company and the U.S. Internal Revenue Service completed the audit for tax years 2005 and 2006. At December 31, 2010, we believe the aggregate amount of any additional tax liabilities that may result from examinations, if any, will not have a material adverse effect on our financial condition, results of operations or cash flows.
The following summarizes the activity related to our unrecognized tax benefits recorded in accordance with ASC 740-10 in 2010 and 2009, in thousands:
| | | | |
Balance at January 1, 2008 | | $ | 16,008 | |
Increases for positions taken in current year | | | 374 | |
Increases for positions taken in prior years | | | 997 | |
Decrease due to settlements with taxing authorities | | | (1,668 | ) |
Expiration of the statute of limitations for the assessment of taxes | | | (313 | ) |
| | | | |
Balance at December 31, 2008 | | | 15,398 | |
Increases for positions taken in current year | | | 1,128 | |
Increases for acquired entities and positions taken in prior years | | | 1,847 | |
Decrease due to settlements with taxing authorities | | | (433 | ) |
| | | | |
Balance at December 31, 2009 | | | 17,940 | |
Increases for positions taken in current year | | | 4,283 | |
Expiration of the statute of limitations for the assessment of taxes | | | (2,248 | ) |
Decrease due to settlements with taxing authorities | | | (539 | ) |
| | | | |
Balance at December 31, 2010 | | $ | 19,436 | |
| | | | |
The unrecognized tax benefits at December 31, 2010 included $14.8 million of tax benefits that, if recognized, would affect our effective tax rate. We recognize interest related to unrecognized tax benefits and penalties as income tax expense. During 2010, 2009 and 2008, we accrued approximately $0.1 million, $1.0 million and $0.0 million, respectively, for interest and $0.0 million, $0.2 million and $0.0 million, respectively, for additional penalties related to these unrecognized tax benefits. At December 31, 2010, the aggregate recorded liability for interest and potential penalties was $6.0 million and $1.0 million, respectively. We do not expect our unrecognized tax benefits to change significantly over the next twelve months.
We have historically determined that the undistributed earnings of our foreign subsidiaries will be repatriated to the United States and accordingly, we have provided a deferred tax liability totaling $15.6 million and $29.3 million at December 31, 2010 and 2009, respectively, on such foreign source income. For the year
F-29
WEST CORPORATION
NOTES TO CONSOLIDATED FINANCIAL STATEMENTS—(Continued)
YEARS ENDED DECEMBER 31, 2010, 2009 AND 2008
ended December 31, 2010, we included in the current income tax provision $116.5 million of foreign subsidiary earnings, reorganized certain foreign subsidiaries to simplify our business structure, and evaluated our liquidity requirements in the United States and the capital requirements of our foreign subsidiaries. We have determined we currently have foreign earnings of approximately $132.5 million at December 31, 2010 which will be indefinitely reinvested, and therefore deferred income taxes of approximately $30.0 million have not been provided on such foreign subsidiary earnings.
| 12. | FAIR VALUE DISCLOSURES |
Accounting Standards Codification 820Fair Value Measurements and Disclosures(“ASC 820”) defines fair value, establishes a framework for measuring fair value, and expands disclosures about fair value measurements. The provisions of ASC 820 apply to other accounting pronouncements that require or permit fair value measurements. ASC 820:
| | • | | Defines fair value as the exchange price that would be received for an asset or paid to transfer a liability (an exit price) in the principal or most advantageous market for the asset or liability in an orderly transaction between market participants at the measurement date; and |
| | • | | Establishes a three-level hierarchy for fair value measurements based upon the transparency of inputs to the valuation of an asset or liability as of the measurement date. |
Inputs refer broadly to the assumptions that market participants would use in pricing the asset or liability, including assumptions about risk. To increase consistency and comparability in fair value measurements and related disclosures, the fair value hierarchy prioritizes the inputs to valuation techniques used to measure fair value into three broad levels. The three levels of the hierarchy are defined as follows:
| | • | | Level 1 inputs are quoted prices (unadjusted) in active markets for identical assets or liabilities. |
| | • | | Level 2 inputs are inputs other than quoted prices included within Level 1 that are observable for the asset or liability, either directly or indirectly for substantially the full term of the financial instrument. |
| | • | | Level 3 inputs are unobservable inputs for assets or liabilities. |
The categorization within the valuation hierarchy is based upon the lowest level of input that is significant to the fair value measurement. Following is a description of the valuation methodologies used for assets and liabilities measured at fair value.
Trading Securities (Asset).The assets held in the West Corporation Executive Retirement Savings Plan and the West Corporation Non-qualified Deferred Compensation Plan represent mutual funds, invested in debt and equity securities, classified as trading securities in accordance with Accounting Standards Codification 320Investments—Debt and Equity Securities (“ASC 320”) considering the employee’s ability to change the investment allocation of their deferred compensation at any time. Quoted market prices are available for these securities in an active market, therefore, the fair value of these securities is determined by Level 1 inputs. These assets are recorded within other assets.
Interest rate swaps.The effect of the interest rate swaps is to change a variable rate debt obligation to a fixed rate for that portion of the debt that is hedged. We record the interest rate swaps at fair value. The fair value of the interest rate swaps is based on a model whose inputs are observable (LIBOR swap rates); therefore, the fair value of these interest rate swaps is based on a Level 2 input.
F-30
WEST CORPORATION
NOTES TO CONSOLIDATED FINANCIAL STATEMENTS—(Continued)
YEARS ENDED DECEMBER 31, 2010, 2009 AND 2008
Assets and liabilities measured at fair value on a recurring basis, in thousands, are summarized below:
| | | | | | | | | | | | | | | | | | | | |
| | | Fair Value Measurement at December 31, 2010 Using | |
Description | | Carrying
Amount | | | Quoted Prices
in Active
Markets for
Identical Assets
(Level 1) | | | Significant
Other
Observable
Inputs
(Level 2) | | | Significant
Unobservable
Inputs
(Level 3) | | | Assets /
Liabilities
at Fair
Value | |
Assets | | | | | | | | | | | | | | | | | | | | |
Trading securities | | $ | 26,834 | | | $ | 26,834 | | | $ | — | | | $ | — | | | $ | 26,834 | |
| | | | | | | | | | | | | | | | | | | | |
Total assets at fair value | | $ | 26,834 | | | $ | 26,834 | | | $ | — | | | $ | — | | | $ | 26,834 | |
| | | | | | | | | | | | | | | | | | | | |
Liabilities | | | | | | | | | | | | | | | | | | | | |
Interest rate swaps | | $ | 31,848 | | | $ | �� | | | $ | 31,848 | | | $ | — | | | $ | 31,848 | |
| | | | | | | | | | | | | | | | | | | | |
Total liabilities at fair value | | $ | 31,848 | | | $ | — | | | $ | 31,848 | | | $ | — | | | $ | 31,848 | |
| | | | | | | | | | | | | | | | | | | | |
| |
| | | Fair Value Measurement at December 31, 2009 Using | |
Description | | Carrying
Amount | | | Quoted Prices
in Active
Markets for
Identical Assets
(Level 1) | | | Significant
Other
Observable
Inputs
(Level 2) | | | Significant
Unobservable
Inputs
(Level 3) | | | Assets /
Liabilities
at Fair
Value | |
Assets | | | | | | | | | | | | | | | | | | | | |
Trading securities | | $ | 19,524 | | | $ | 19,524 | | | $ | — | | | $ | — | | | $ | 19,524 | |
| | | | | | | | | | | | | | | | | | | | |
Total assets at fair value | | $ | 19,524 | | | $ | 19,524 | | | $ | — | | | $ | — | | | $ | 19,524 | |
| | | | | | | | | | | | | | | | | | | | |
Liabilities | | | | | | | | | | | | | | | | | | | | |
Interest rate swaps | | $ | 28,404 | | | $ | — | | | $ | 28,404 | | | $ | — | | | $ | 28,404 | |
| | | | | | | | | | | | | | | | | | | | |
Total liabilities at fair value | | $ | 28,404 | | | $ | — | | | $ | 28,404 | | | $ | — | | | $ | 28,404 | |
| | | | | | | | | | | | | | | | | | | | |
The fair value of our senior secured term loan facility, 11% senior subordinated notes, 8 5/8% senior notes and 7 7/8% senior notes based on market quotes at December 31, 2010 was approximately $3,604.6 million compared to the carrying amount of $3,533.6 million. The fair value of our senior secured term loan facility, 9.5% senior notes and 11% senior subordinated notes based on market quotes at December 31, 2009 was approximately $3,495.7 million compared to the carrying amount of $3,560.1 million.
Certain assets are measured at fair value on a non-recurring basis using significant unobservable inputs (Level 3) as defined by and in accordance with the provisions of ASC Topic 820. As such, working capital, property and equipment, goodwill, and other finite-lived intangible assets for our West Direct reporting unit with a net carrying amount totaling $44.2 million were written down to their fair value of $6.5 million during 2010. These write-downs resulted in a total impairment charge, recorded in SG&A of $37.7 million, which represents the balance of goodwill for the reporting unit. The fair value was determined using a discounted cash flows methodology.
During 2009, we recorded a $1.9 million impairment of the InPulse trade name which represented the difference between the trade name’s fair value and the $3.2 million carrying value of the trade name. The fair value was estimated using a relief from royalty method a Level 3 input.
F-31
WEST CORPORATION
NOTES TO CONSOLIDATED FINANCIAL STATEMENTS—(Continued)
YEARS ENDED DECEMBER 31, 2010, 2009 AND 2008
| 13. | OFF—BALANCE SHEET ARRANGEMENTS |
We utilize standby letters of credit to support primarily workers’ compensation policy requirements and certain operating leases. Performance obligations of certain operating subsidiaries are supported by performance bonds and letters of credit. These obligations will expire at various dates through September 2012 and are renewed as required. The outstanding commitments on these obligations at December 31, 2010 and 2009 were $23.3 million and $16.9 million, respectively.
| 14. | EMPLOYEE BENEFITS AND INCENTIVE PLANS |
Qualified Retirement Plan
We have a 401(k) plan, which covers substantially all employees eighteen years of age or older who will also complete a minimum of 1,000 hours of service in each calendar year. Under the plan, we match 50% of employees’ contributions up to 14% of their gross salary or the statutory limit, whichever is less, if the employee satisfies the 1,000 hours of service requirement during the calendar year. Our matching contributions vest 25% per year beginning after the second service anniversary date. The matching contributions are 100% vested after the employee has attained five years of service. Total employer contributions under the plan were approximately $7.5 million, $7.5 million and $6.9 million for the years ended December 31, 2010, 2009 and 2008, respectively.
In the United Kingdom we have a Group Personal Pension Plan which is available to all employees upon the successful completion of their 3 month probationary period. Under the plan, we match employee contributions up to a maximum of 3% of their base salary. Contributions are invested immediately in the members own fund choice or the default investment option should members not wish to make their own investment choices. Total employer contributions under the plan were approximately $0.9 million, $0.5 million, and $0.4 million for the years ended December 31, 2010, 2009 and 2008, respectively.
In Canada we have a Deferred Profit Sharing Plan (“DPSP”) and a Group RRSP, which covers substantially all employees who have materially and significantly contributed to the prosperity and profits of the Company. Under the plan, we match 50% of employees’ regular contributions to the Group RRSP up to 3% of their earnings or the statutory limit, whichever is less. Our matching contributions vest 100% on the second anniversary of membership in the DPSP. Total employer contributions under the plan were approximately $0.2 million, $0.2 million and $0.1 million for the years ended December 31, 2010, 2009 and 2008, respectively.
Non-Qualified Retirement Plans
We maintain a grantor trust under the West Corporation Executive Retirement Savings Plan (“Trust”). The principal of the Trust, and any earnings thereon shall be held separate and apart from our other funds. Participation in the Trust is voluntary and is restricted to highly compensated individuals as defined by the Internal Revenue Service. We will match 50% of employee contributions, subject to the combined limits of the 401(k) plan and the Trust. Matching contributions 100% vest after completion of three years of service. Our total contributions under the plan for the years ended December 31, 2010, 2009 and 2008 were approximately $2.0 million, $2.0 million and $1.8 million, respectively. Assets under the Trust at December 31, 2010 and 2009 were $25.3 million and $18.1 million, respectively.
We also maintain a Nonqualified Deferred Compensation Plan (as amended and restated effective January 1, 2008, the “Deferred Compensation Plan”). Pursuant to the terms of the Deferred Compensation Plan, eligible
F-32
WEST CORPORATION
NOTES TO CONSOLIDATED FINANCIAL STATEMENTS—(Continued)
YEARS ENDED DECEMBER 31, 2010, 2009 AND 2008
management, non-employee directors or highly compensated employees approved by the board of directors may elect to defer a portion of their compensation and have such deferred compensation invested in the same investments made available to participants of the 401(k) plan or in notional equity strips. We match a percentage of any amounts invested in notional equity strips (50% during 2010, 2009 and 2008). Such matched amounts are subject to 20% vesting each year. All matching contributions are 100% vested five years after the later of January 1, 2007 or the date the executive first participates in the Deferred Compensation Plan. Amounts deferred under the Deferred Compensation Plan and any earnings credited thereunder shall be held separate and apart from our other funds, but remain subject to claims by the Company’s general creditors. Our total contributions for the years ended December 31, 2010, 2009 and 2008 under the plan were approximately $1.2 million, $2.2 million and $1.5 million, respectively. Assets under the Deferred Compensation Plan at December��31, 2010 and 2009 were $41.0 million and $32.2 million, respectively.
2006 Executive Incentive Plan
In October 2006, the board of directors approved the 2006 Executive Incentive Plan (“EIP”). The EIP was established to advance the interests of the Company and its affiliates by providing for the grant to participants of stock-based and other incentive awards. Awards under the EIP are intended to align the incentives of the Company’s executives and investors and to improve the performance of the Company. The administrator will select participants from among those key employees and directors of and consultants and advisors to, the Company or its affiliates who, in the opinion of the administrator, are in a position to make a significant contribution to the success of the Company and its affiliates. A maximum of 359,986 equity strips (each comprised of eight shares of Class A Common and one share of Class L Common), in each case pursuant to rollover options, are authorized to be delivered in satisfaction of rollover option awards under the Plan. In addition, an aggregate maximum of 11,276,291 shares of Class A Common may be delivered in satisfaction of other awards under the Plan.
In general, stock options granted under the EIP become exercisable over a period of five years, with 20% of the stock option becoming exercisable at the end of each year. Once an option has vested, it generally remains exercisable until the tenth anniversary of the date of grant. In the case of a normal termination, the awards will remain exercisable for the shorter of (i) the one-year period ending with the first anniversary of the participant’s normal termination or (ii) the period ending on the latest date on which such award could have been exercised.
F-33
WEST CORPORATION
NOTES TO CONSOLIDATED FINANCIAL STATEMENTS—(Continued)
YEARS ENDED DECEMBER 31, 2010, 2009 AND 2008
Stock option activity under the 2006 EIP for the years ended December 31, 2010, 2009 and 2008 is set forth below:
| | | | | | | | | | | | |
| | | | | | Options Outstanding | |
| | | Options
Available
for Grant | | | Number of
Shares | | | Weighted
Average
Exercise
Price | |
Balance at January 1, 2008 | | | 618,847 | | | | 2,424,500 | | | $ | 1.64 | |
Granted | | | (395,000 | ) | | | 395,000 | | | | 6.36 | |
Canceled | | | 281,000 | | | | (281,000 | ) | | | 2.27 | |
Exercised | | | — | | | | (15,000 | ) | | | 1.64 | |
| | | | | | | | | | | | |
Balance at December 31, 2008 | | | 504,847 | | | | 2,523,500 | | | | 2.26 | |
Granted | | | (292,500 | ) | | | 292,500 | | | | 3.61 | |
Canceled | | | 242,000 | | | | (242,000 | ) | | | 2.36 | |
Exercised | | | — | | | | (72,500 | ) | | | 1.64 | |
| | | | | | | | | | | | |
Balance at December 31, 2009 | | | 454,347 | | | | 2,501,500 | | | | 2.42 | |
Granted | | | (235,000 | ) | | | 235,000 | | | | 9.04 | |
Canceled | | | 114,100 | | | | (114,100 | ) | | | 3.22 | |
Exercised | | | — | | | | (78,400 | ) | | | 2.00 | |
| | | | | | | | | | | | |
Balance at December 31, 2010 | | | 333,447 | | | | 2,544,000 | | | $ | 3.00 | |
| | | | | | | | | | | | |
At December 31, 2010, we expect that 72% of options granted will vest over the vesting period.
At December 31, 2010, the intrinsic value of vested options was approximately $13.4 million.
The following table summarizes the information on the options granted under the EIP at December 31, 2010:
| | | | | | | | | | | | | | | | | | | | |
Outstanding | | | Exercisable | |
Range of Exercise Prices | | Number of
Options | | | Average
Remaining
Contractual
Life (years) | | | Weighted
Average
Exercise
Price | | | Number of
Options | | | Weighted
Average
Exercise
Price | |
$1.64 | | | 1,799,000 | | | | 5.94 | | | $ | 1.64 | | | | 1,402,500 | | | $ | 1.64 | |
$3.61 | | | 245,000 | | | | 8.00 | | | $ | 3.61 | | | | 49,000 | | | $ | 3.61 | |
$6.36 | | | 270,000 | | | | 7.08 | | | $ | 6.36 | | | | 108,000 | | | $ | 6.36 | |
$9.04 | | | 230,000 | | | | 9.33 | | | $ | 9.04 | | | | — | | | $ | — | |
| | | | | | | | | | | | | | | | | | | | | |
$1.64 - $9.04 | | | 2,544,000 | | | | 6.56 | | | $ | 3.00 | | | | 1,559,500 | | | $ | 2.03 | |
| | | | | | | | | | | | | | | | | | | | | |
F-34
WEST CORPORATION
NOTES TO CONSOLIDATED FINANCIAL STATEMENTS—(Continued)
YEARS ENDED DECEMBER 31, 2010, 2009 AND 2008
| | | | | | | | | | | | |
Executive Management Rollover Options | | | | | | | | | | | | |
| Class A and Class L Equity Strip Options | | Options
Available
for Grant | | | Options Outstanding | |
| | | | Number of
Shares | | | Weighted
Average
Exercise
Price | |
Balance at January 1, 2008 | | | 17 | | | | 359,969 | | | $ | 33.47 | |
Canceled | | | — | | | | (1,995 | ) | | | 33.00 | |
Exercised | | | — | | | | — | | | | — | |
| | | | | | | | | | | | |
Balance at December 31, 2008 | | | 17 | | | | 357,974 | | | | 33.48 | |
Canceled | | | — | | | | — | | | | — | |
Exercised | | | — | | | | (62,520 | ) | | | 33.66 | |
| | | | | | | | | | | | |
Balance at December 31, 2009 | | | 17 | | | | 295,454 | | | | 33.33 | |
Canceled | | | — | | | | — | | | | — | |
Exercised | | | — | | | | (8,128 | ) | | | 33.00 | |
| | | | | | | | | | | | |
Balance at December 31, 2010 | | | 17 | | | | 287,326 | | | $ | 33.34 | |
| | | | | | | | | | | | |
An Equity Strip is comprised of eight options of Class A common stock and one option of Class L common stock.
The rollover options are fully vested.
The following table summarizes the outstanding and exercisable information on management rollover options granted under the EIP at December 31, 2010:
| | | | | | | | | | | | |
| Outstanding and Exercisable | |
Range of Exercise Prices | | | Number of
Options | | Average
Remaining
Contractual
Life (years) | | | Weighted
Average
Exercise
Price | |
| $ | 28.23 | | | 6,702 | | | 1.8 | | | $ | 28.23 | |
| $ | 33.00 | | | 248,218 | | | 1.9 | | | $ | 33.00 | |
| $ | 34.01 | | | 8,820 | | | 2.0 | | | $ | 34.01 | |
| $ | 38.15 | | | 23,586 | | | 1.9 | | | $ | 38.15 | |
| | | | | | | | | | | | | |
| $ | 28.23 - $38.15 | | | 287,326 | | | 1.9 | | | $ | 33.34 | |
| | | | | | | | | | | | | |
The aggregate intrinsic value of these options at December 31, 2010 was approximately $47.0 million.
We account for the stock option grants under the EIP in accordance with Accounting Standards Codification 718Compensation-Stock Compensation(“ASC 718”). The fair value of option awards granted under the EIP during 2010 and 2009 were $4.09 and $0.97 per option, respectively. We have estimated the fair value of EIP option awards on the grant date using a Black-Scholes option pricing model that uses the assumptions noted in the following table.
| | | | | | | | |
| | | 2010 | | | 2009 | |
Risk-free interest rate | | | 3.11 | % | | | 1.77 | % |
Dividend yield | | | 0.0 | % | | | 0.0 | % |
Expected volatility | | | 40.0 | % | | | 36.7 | % |
Expected life (years) | | | 6.5 | | | | 3.0 | |
F-35
WEST CORPORATION
NOTES TO CONSOLIDATED FINANCIAL STATEMENTS—(Continued)
YEARS ENDED DECEMBER 31, 2010, 2009 AND 2008
At December 31, 2010 and 2009, there was approximately $1.3 million of unrecorded and unrecognized compensation cost related to unvested share based compensation under the EIP.
Restricted Stock
Grants of restricted stock under the EIP are in three Tranches; 33.33% of the shares in Tranche 1, 22.22% of the shares in Tranche 2 and 44.45% of the shares in Tranche 3. Restricted stock acquired under the EIP will vest during the grantee’s employment by the Company or its subsidiaries in accordance with the provisions of the EIP, as follows:
The Tranche 1 shares will vest over a period of five years, with 20% of the shares becoming vested at the end of each year. Notwithstanding the above, 100% of a grantee’s outstanding and unvested Tranche 1 shares shall vest immediately upon a change of control.
The vesting schedule for Tranche 2 and Tranche 3 shares is subject to the Total Return of the Sponsors and the Sponsor IRR (“internal rate of return”) as of an exit event, subject to the following terms and conditions: Tranche 2 shares shall become 100% vested upon an exit event if, after giving effect to any vesting of the Tranche 2 shares on a exit event, Sponsors’ Total Return is greater than 200% and the Sponsor IRR exceeds 15%. Tranche 3 shares will be eligible to vest upon an exit event if, after giving effect to any vesting of the Tranche 2 shares and/or Tranche 3 shares on a exit event, Sponsors’ Total Return is more than 200% and the Sponsor IRR exceeds 15%, with the amount of Tranche 3 shares vesting upon the exit event varying with the amount by which the Sponsors’ Total Return exceeds 200%, as follows: 100%, if, after giving effect to any vesting of the Tranche 2 shares and/or the Tranche 3 shares on an exit event, the Total Return is equal to or greater than 300%; 0%, if, after giving effect to any vesting of the Tranche 2 shares and/or the Tranche 3 shares on an exit event, the Total Return is 200% or less; and if, after giving effect to any vesting of the Tranche 2 shares and/or the Tranche 3 shares on an exit event, the Total Return is greater than 200% and less than 300%, then the Tranche 3 shares shall vest by a percentage between 0% and 100% determined on a straight line basis. Total Return is defined as the number, expressed as a percentage, equal to (1) the sum of, in each case measured from October 24, 2006, (i) all cash dividends and distributions to the Sponsors in respect of their Initial Sponsor Shares, (ii) all cash proceeds from the sale or other disposition of such Initial Sponsor Shares, (iii) the fair market value, as determined in good faith by the Board, of any other property, securities or other consideration received by the Sponsors in respect of such Initial Sponsor Shares, and, (iv) solely in the case of an exit event which results in the sale of less than 100% of the Company’s Stock held by the Sponsors immediately prior to such event, the fair market value, as determined by the Board, of the portion of the Company’s Stock attributable to the Initial Sponsor Shares held by the Sponsors immediately after such exit event, divided by (2) the cost of such Initial Sponsors Shares.
Performance conditions that affect vesting are not reflected in estimating the fair value of an award at the grant date as those conditions are restrictions that stem from the forfeitability of instruments to which employees have not yet earned the right. ASC 718 requires that if the vesting of an award is based on satisfying both a service and performance condition, the company must initially determine which outcomes are probable of achievement and recognize the compensation cost over the longer of the explicit or implicit service period. Since both an exit event and the performance objectives have not been achieved, no compensation costs will be recognized on Tranches 2 or 3 until those events become probable. The unrecognized compensation costs of Tranches 2 and 3 in the aggregate at December 31, 2010 and December 31, 2009 were $8.5 million and $8.8 million, respectively.
On May 4, 2009, as authorized by the Board of Directors, the Company entered into an Amended and Restated Restricted Stock Award and Special Bonus Agreement with Thomas B. Barker, Chairman of the Board
F-36
WEST CORPORATION
NOTES TO CONSOLIDATED FINANCIAL STATEMENTS—(Continued)
YEARS ENDED DECEMBER 31, 2010, 2009 AND 2008
and Chief Executive Officer of the Company, related to the award of 1,650,000 shares of Class A Common Stock originally made on December 1, 2006 (the “Amended Agreement”). As with the original agreement, the vesting of the restricted stock grant are divided into three tranches, with Tranche 1, of 33.33% of such grant, vesting ratably over a five-year period of time commencing with the date of original grant, provided that vesting shall be accelerated in the event of an initial public offering or change of control of the Company. Under the Amended Agreement, the remaining 66.67% of the restricted stock grant vests based upon performance criteria tied to an exit event for the Sponsors, a sale of the Company and time. A sale of the Company is defined as a sale of the assets of the Company accounting for 80% or more of the Company’s consolidated EBITDA or a sale or other disposition of 80% of the shares held by the Investors for consideration other than cash or marketable securities. The vesting criteria are as follows:
| | • | | Tranche 2 shares, which are equal to 22.22% of Mr. Barker’s grant, shall become 100% vested upon an exit event of the Sponsors or sale of the Company if, after giving effect to any vesting of the Tranche 2 shares on the exit event or sale of the Company, the Sponsors’ total return is greater than 200% and the Sponsors’ internal rate of return exceeds 15%. |
| | • | | Tranche 3 shares, which are equal to 44.45% of Mr. Barker’s grant, shall become 50% vested upon the earliest to occur of an exit event of the Sponsors, a sale of the Company and December 1, 2011, and shall become vested with respect to the other 50% of the Tranche 3 shares upon an exit event of the Sponsors or sale of the Company if, after giving effect to any vesting of the Tranche 2 and Tranche 3 shares on the exit event or sale of the Company, the Sponsor’ total return is greater than 200% and the Sponsors’ internal rate of return exceeds 15%. |
In addition, all of Mr. Barker’s Tranche 2 and Tranche 3 shares vest upon an initial public offering of the Company.
Restricted Stock activity under the EIP for 2010, 2009 and 2008 are set forth below:
| | | | | | | | | | | | |
| | | | | | Restricted Stock
Outstanding | |
| | | Restricted Stock
Available
for Grant | | | Number of
Shares | | | Weighted
Average
Grant
Date Fair
Value | |
Balance at January 1, 2008 | | | 197,593 | | | | 8,003,332 | | | $ | 1.43 | |
Granted | | | (120,000 | ) | | | 120,000 | | | | 6.36 | |
Canceled | | | 99,990 | | | | (99,990 | ) | | | 1.43 | |
Purchased as treasury shares | | | — | | | | (8,332 | ) | | | 1.43 | |
| | | | | | | | | | | | |
Balance at December 31, 2008 | | | 177,583 | | | | 8,015,010 | | | | 1.50 | |
Granted | | | (425,000 | ) | | | 425,000 | | | | 8.72 | |
Canceled | | | 333,350 | | | | (333,350 | ) | | | 1.43 | |
| | | | | | | | | | | | |
Balance at December 31, 2009 | | | 85,933 | | | | 8,106,660 | | | | 1.88 | |
Granted | | | (2,500 | ) | | | 2,500 | | | | 9.04 | |
Canceled | | | 146,670 | | | | (146,670 | ) | | | 3.00 | |
Purchased as treasury shares | | | — | | | | (28,330 | ) | | | 2.01 | |
| | | | | | | | | | | | |
Balance at December 31, 2010 | | | 230,103 | | | | 7,934,160 | | | $ | 1.85 | |
| | | | | | | | | | | | |
F-37
WEST CORPORATION
NOTES TO CONSOLIDATED FINANCIAL STATEMENTS—(Continued)
YEARS ENDED DECEMBER 31, 2010, 2009 AND 2008
The following table summarizes the information on the restricted stock granted under the EIP at December 31, 2010:
| | | | | | | | | | | | | | | | | | | | |
Outstanding | | | Vested | |
Range of
Grant Prices | | Number of Shares | | | Average
Remaining
Contractual Life (years) | | | Weighted Average Grant Date Fair Value | | | Number of Shares | | | Weighted Average Grant Date Fair Value | |
$1.43 | | | 7,436,660 | | | | 5.92 | | | $ | 1.43 | | | | 1,938,473 | | | $ | 1.43 | |
$3.61 | | | 25,000 | | | | 7.92 | | | $ | 3.61 | | | | 1,667 | | | $ | 3.61 | |
$6.36 | | | 70,000 | | | | 7.08 | | | $ | 6.36 | | | | 9,332 | | | $ | 6.36 | |
$9.04 | | | 402,500 | | | | 9.00 | | | $ | 9.04 | | | | 26,664 | | | $ | 9.04 | |
| | | | | | | | | | | | | | | | | | | | | |
$1.43 - $9.04 | | | 7,934,160 | | | | 6.08 | | | $ | 1.85 | | | | 1,976,136 | | | $ | 1.56 | |
| | | | | | | | | | | | | | | | | | | | | |
We account for the restricted stock in accordance with ASC 718. Share based compensation for 2010, 2009 and 2008 for the EIP restricted stock grants was approximately $1.5 million, $1.1 million and $0.8 million, respectively. The weighted average fair value of the restricted stock granted under the EIP in 2010 and 2009 was $9.04 and $8.72, respectively. We have estimated the fair value of EIP restricted stock grants on the grant date using a Black-Scholes option pricing model that uses the same assumptions noted above for the EIP option awards.
At December 31, 2010 and 2009, there was approximately $2.2 million and $3.8 million of unrecorded and unrecognized compensation cost related to Tranche 1 unvested restricted stock under the EIP, respectively.
The components of stock-based compensation expense in thousands are presented below:
| | | | | | | | | | | | |
| | | Year Ended December 31, | |
| | | 2010 | | | 2009 | | | 2008 | |
Stock options | | $ | 609 | | | $ | 587 | | | $ | 597 | |
Restricted stock | | | 1,489 | | | | 1,114 | | | | 807 | |
Deferred compensation—notional shares | | | 2,135 | | | | 2,139 | | | | 1,025 | |
| | | | | | | | | | | | |
| | $ | 4,233 | | | $ | 3,840 | | | $ | 2,429 | |
| | | | | | | | | | | | |
The net income effect of stock-based compensation expense for 2010, 2009 and 2008 was approximately $2.6 million, $2.4 million and $1.5 million, respectively.
On October 2, 2009, the Company announced its intention to commence an equity offering and accordingly is providing the following information related to earnings per share.
We have two classes of common stock (Class L stock and Class A stock). Each Class L share is entitled to a priority return preference equal to the sum of (x) $90 per share base amount plus (y) an amount sufficient to generate a 12% internal rate of return on that base amount from the date of the recapitalization until the priority return preference is paid in full. Each Class L share also participates in any equity appreciation beyond the priority return on the same per share basis as the Class A shares. Class A shares participate in the equity appreciation after the Class L priority return is satisfied.
F-38
WEST CORPORATION
NOTES TO CONSOLIDATED FINANCIAL STATEMENTS—(Continued)
YEARS ENDED DECEMBER 31, 2010, 2009 AND 2008
The Class L stock is considered a participating stock security requiring use of the “two-class” method for the computation of basic net income (loss) per share in accordance with ASC 260Earnings Per Share. Losses are not allocated to the Class L Stock in the computation of basic earnings per share as the Class L Stock is not obligated to share in losses.
Basic earnings per share (“EPS”) excludes the effect of common stock equivalents and is computed using the “two-class” computation method, which divides earnings attributable to the Class L preference from total earnings. Any remaining income or loss is attributed to the Class A shares. Diluted earnings per share reflects the potential dilution that could result if options or other contingently issuable shares were exercised or converted into common stock and notional shares from the Deferred Compensation Plan were granted. Diluted earnings per common share assumes the exercise of stock options using the treasury stock method.
| | | | | | | | | | | | |
| | | Year Ended December 31, | |
(Amounts in thousands) | | 2010 | | | 2009 | | | 2008 | |
Net income—West Corporation | | $ | 60,304 | | | $ | 88,229 | | | $ | 19,507 | |
Less: accretion of Class L Shares | | | 170,265 | | | | 173,657 | | | | 126,531 | |
Net loss attributable to Class A Shares | | | (109,961 | ) | | | (85,428 | ) | | | (107,024 | ) |
Income attributable to Class L Shares (1) | | | 170,265 | | | | 173,657 | | | | 126,531 | |
| (1) | The L shareholders are allocated their priority return which is equivalent to the accretion while any losses are allocated to A shareholders as the L shareholders do not have a contractual obligation to share in losses. |
| | | | | | | | | | | | |
| | | Year Ended December 31, | |
(Amounts in, except per share amounts) | | 2010 | | | 2009 | | | 2008 | |
Earnings (loss) per common share: | | | | | | | | | | | | |
Basic Class L | | $ | 17.07 | | | $ | 17.45 | | | $ | 12.78 | |
Basic Class A | | $ | (1.25 | ) | | $ | (0.98 | ) | | $ | (1.23 | ) |
| | | |
Diluted Class L | | $ | 16.37 | | | $ | 16.67 | | | $ | 12.24 | |
Diluted Class A | | $ | (1.25 | ) | | $ | (0.98 | ) | | $ | (1.23 | ) |
| | | |
Weighted average number of shares outstanding: | | | | | | | | | | | | |
Basic Class L | | | 9,975 | | | | 9,954 | | | | 9,901 | |
Basic Class A | | | 87,955 | | | | 87,588 | | | | 87,324 | |
| | | |
Dilutive impact of stock options: | | | | | | | | | | | | |
| | | |
Class L | | | 424 | | | | 455 | | | | 433 | |
Class A | | | — | | | | — | | | | — | |
| | | |
Diluted Class L | | | 10,399 | | | | 10,409 | | | | 10,334 | |
Diluted Class A | | | 87,955 | | | | 87,588 | | | | 87,324 | |
For purposes of calculating the diluted earnings per share for the Class A shares, options outstanding to purchase Class A shares at December 31, 2010, 2009 and 2008 have been excluded from the computation of diluted Class A shares outstanding because the effect is anti-dilutive.
| 16. | COMMITMENTS AND CONTINGENCIES |
In the ordinary course of business, we and certain of our subsidiaries are defendants in various litigation matters and are subject to claims from our clients for indemnification, some of which may involve claims for
F-39
WEST CORPORATION
NOTES TO CONSOLIDATED FINANCIAL STATEMENTS—(Continued)
YEARS ENDED DECEMBER 31, 2010, 2009 AND 2008
damages that are substantial in amount. We do not believe the disposition of claims currently pending will have a material adverse effect on our financial position, results of operations or cash flows.
We operate in two business segments:
Unified Communications, including reservationless, operator-assisted, web and video conferencing services, streaming services, alerts and notifications services and consulting, project management and implementation of hosted and managed unified communications solutions; and
Communication Services, including emergency communication services, automated call processing and agent-based services.
| | | | | | | | | | | | |
| | | For the year ended December 31, | |
| | | 2010 | | | 2009 | | | 2008 | |
Revenue: | | | | | | | | | | | | |
Unified Communications | | $ | 1,220,216 | | | $ | 1,126,544 | | | $ | 995,161 | |
Communication Services | | | 1,173,945 | | | | 1,254,547 | | | | 1,258,182 | |
Intersegment eliminations | | | (5,950 | ) | | | (5,343 | ) | | | (5,909 | ) |
| | | | | | | | | | | | |
Total | | $ | 2,388,211 | | | $ | 2,375,748 | | | $ | 2,247,434 | |
| | | | | | | | | | | | |
Depreciation and Amortization | | | | | | | | | | | | |
(Included in Operating Income): | | | | | | | | | | | | |
Unified Communications | | $ | 87,278 | | | $ | 91,491 | | | $ | 88,948 | |
Communication Services | | | 83,052 | | | | 96,856 | | | | 94,540 | |
| | | | | | | | | | | | |
Total | | $ | 170,330 | | | $ | 188,347 | | | $ | 183,488 | |
| | | | | | | | | | | | |
Operating Income: | | | | | | | | | | | | |
Unified Communications | | $ | 320,411 | | | $ | 296,096 | | | $ | 256,853 | |
Communication Services | | | 99,770 | | | | 104,517 | | | | 93,967 | |
| | | | | | | | | | | | |
Total | | $ | 420,181 | | | $ | 400,613 | | | $ | 350,820 | |
| | | | | | | | | | | | |
Capital Expenditures: | | | | | | | | | | | | |
Unified Communications | | $ | 51,077 | | | $ | 57,529 | | | $ | 45,503 | |
Communication Services | | | 50,515 | | | | 49,273 | | | | 54,205 | |
Corporate | | | 20,457 | | | | 15,866 | | | | 9,057 | |
| | | | | | | | | | | | |
Total | | $ | 122,049 | | | $ | 122,668 | | | $ | 108,765 | |
| | | | | | | | | | | | |
| |
| | | As of December 31, | |
| | | 2010 | | | 2009 | | | 2008 | |
Assets: | | | | | | | | | | | | |
Unified Communications | | $ | 1,401,242 | | | $ | 1,395,714 | | | $ | 1,353,789 | |
Communication Services | | | 1,375,643 | | | | 1,436,222 | | | | 1,631,527 | |
Corporate | | | 228,365 | | | | 213,326 | | | | 329,473 | |
| | | | | | | | | | | | |
Total | | $ | 3,005,250 | | | $ | 3,045,262 | | | $ | 3,314,789 | |
| | | | | | | | | | | | |
F-40
WEST CORPORATION
NOTES TO CONSOLIDATED FINANCIAL STATEMENTS—(Continued)
YEARS ENDED DECEMBER 31, 2010, 2009 AND 2008
For 2010, 2009 and 2008, our largest 100 clients represented approximately 57%, 56% and 56% of total revenue, respectively. The aggregate revenue as a percentage of our total revenue from our largest client, AT&T, during 2010, 2009 and 2008 was approximately 11%, 12% and 13%, respectively. AT&T, represented approximately 7% of our gross receivables at December 31, 2010 and 2009.
No individual country outside of the U.S. accounted for greater than 10% of aggregate revenue for 2010, 2009 or 2008. Revenue is attributed to an organizational region based on location of the billed customer’s account. Geographic information by organizational region, in thousands, is noted below.
| | | | | | | | | | | | |
| | | 2010 | | | 2009 | | | 2008 | |
Revenue: | | | | | | | | | | | | |
North America | | $ | 1,999,341 | | | $ | 2,040,261 | | | $ | 1,993,440 | |
Europe, Middle East & Africa (EMEA) | | | 263,603 | | | | 240,990 | | | | 184,655 | |
Asia Pacific | | | 125,267 | | | | 94,497 | | | | 69,339 | |
| | | | | | | | | | | | |
Total | | $ | 2,388,211 | | | $ | 2,375,748 | | | $ | 2,247,434 | |
| | | | | | | | | | | | |
| | | | | | | | | | | | |
| | | As of December 31, | |
| | | 2010 | | | 2009 | | | 2008 | |
Long-Lived Assets: | | | | | | | | | | | | |
North America | | $ | 2,197,888 | | | $ | 2,250,795 | | | $ | 2,300,396 | |
Europe, Middle East & Africa (EMEA) | | | 210,689 | | | | 240,393 | | | | 266,769 | |
Asia Pacific | | | 19,646 | | | | 10,458 | | | | 8,576 | |
| | | | | | | | | | | | |
Total | | $ | 2,428,223 | | | $ | 2,501,646 | | | $ | 2,575,741 | |
| | | | | | | | | | | | |
Canada and Mexico represented approximately 1% of North American revenue during 2010, 2009 and 2008. Long-lived assets in Canada and Mexico represented less than 1% of North American long-lived assets at December 31, 2010 and December 31, 2009.
The aggregate gain (loss) on transactions denominated in currencies other than the functional currency of West Corporation or any of its subsidiaries was approximately ($2.8) million, $2.6 million and ($3.7) million in 2010, 2009 and 2008, respectively.
| 18. | CONCENTRATION OF CREDIT RISK |
Our accounts receivable subject us to the potential for credit risk with our customers. At December 31, 2010, three customers accounted for $40.3 million or 11.0% of gross accounts receivable, compared to $37.1 million, or 10.2% of gross receivables at December 31, 2009. We perform ongoing credit evaluations of our customers’ financial condition. We maintain an allowance for doubtful accounts for potential credit losses based upon historical trends, specific collection problems, historical write-offs, account aging and other analysis of all accounts and notes receivable. At February 18, 2011, $38.4 million, or 95%, of the December 31, 2010 accounts receivable from the three customers noted above had been received.
F-41
WEST CORPORATION
NOTES TO CONSOLIDATED FINANCIAL STATEMENTS—(Continued)
YEARS ENDED DECEMBER 31, 2010, 2009 AND 2008
| 19. | SUPPLEMENTAL CASH FLOW INFORMATION |
The following table summarizes, in thousands, supplemental information about our cash flows for the years ended December 31, 2010, 2009 and 2008:
| | | | | | | | | | | | |
| | | Years Ended December 31, | |
| | | 2010 | | | 2009 | | | 2008 | |
SUPPLEMENTAL DISCLOSURE OF CASH FLOW INFORMATION: | | | | | | | | | | | | |
Cash paid for interest | | $ | 231,698 | | | $ | 256,761 | | | $ | 280,213 | |
Cash paid for redemption call premium on 2014 Senior Notes | | $ | 32,759 | | | $ | — | | | $ | — | |
Cash paid for income taxes, net of $1,033, $2,084 and $1,513 for refunds in 2010, 2009 and 2008 | | $ | 28,439 | | | $ | 33,538 | | | $ | 18,083 | |
SUPPLEMENTAL DISCLOSURE OF CASH INVESTING ACTIVITIES: | | | | | | | | | | | | |
Purchase of portfolio receivables | | $ | — | | | $ | 1,722 | | | $ | 45,403 | |
Collections applied to principal of portfolio receivables | | $ | 13,739 | | | $ | 39,063 | | | $ | 46,395 | |
SUPPLEMENTAL DISCLOSURE OF CASH FINANCING ACTIVITIES: | | | | | | | | | | | | |
Proceeds from issuance of portfolio notes payable | | $ | — | | | $ | — | | | $ | 33,096 | |
Payments of portfolio notes payable | | $ | 686 | | | $ | 34,694 | | | $ | 64,930 | |
SUPPLEMENTAL DISCLOSURE OF NONCASH INVESTING ACTIVITIES: | | | | | | | | | | | | |
Acquisition of property through accounts payable commitments | | $ | 3,858 | | | $ | 140 | | | $ | 3,384 | |
Acquisition of property through assumption of long-term obligations | | $ | — | | | $ | 4,008 | | | $ | — | |
Settlement of portfolio receivables | | $ | — | | | $ | 56,182 | | | $ | — | |
SUPPLEMENTAL DISCLOSURE OF NONCASH FINANCING ACTIVITIES: | | | | | | | | | | | | |
Settlement of non-recourse portfolio notes payable | | $ | — | | | $ | 56,598 | | | $ | — | |
| 20. | QUARTERLY RESULTS OF OPERATIONS (UNAUDITED) |
The following is the summary of the unaudited quarterly results of operations for the two years ended December 31, 2010 and 2009, in thousands.
| | | | | | | | | | | | | | | | | | | | |
| | | Three Months Ended | | | Year Ended
December 31,
2010 | |
| | | March 31,
2010 | | | June 30,
2010 | | | September 30,
2010 (1) | | | December 31,
2010 (2) | | |
Revenue | | $ | 599,821 | | | $ | 596,549 | | | $ | 592,410 | | | $ | 599,431 | | | $ | 2,388,211 | |
Cost of services | | | 260,823 | | | | 263,433 | | | | 259,723 | | | | 273,029 | | | | 1,057,008 | |
| | | | | | | | | | | | | | | | | | | | |
Gross Profit | | | 338,998 | | | | 333,116 | | | | 332,687 | | | | 326,402 | | | | 1,331,203 | |
SG&A | | | 221,753 | | | | 214,639 | | | | 258,818 | | | | 215,812 | | | | 911,022 | |
| | | | | | | | | | | | | | | | | | | | |
Operating income | | | 117,245 | | | | 118,477 | | | | 73,869 | | | | 110,590 | | | | 420,181 | |
| | | | | | | | | | | | | | | | | | | | |
Net income (loss) | | $ | 36,003 | | | $ | 36,293 | | | $ | (8,429 | ) | | $ | (3,563 | ) | | $ | 60,304 | |
| | | | | | | | | | | | | | | | | | | | |
F-42
WEST CORPORATION
NOTES TO CONSOLIDATED FINANCIAL STATEMENTS—(Continued)
YEARS ENDED DECEMBER 31, 2010, 2009 AND 2008
| | | | | | | | | | | | | | | | | | | | |
| | | Three Months Ended | | | Year Ended
December 31,
2009 | |
| | | March 31,
2009 | | | June 30,
2009 | | | September 30,
2009 (3) | | | December 31,
2009 | | |
Revenue | | $ | 606,959 | | | $ | 606,907 | | | $ | 559,012 | | | $ | 602,870 | | | $ | 2,375,748 | |
Cost of services | | | 269,050 | | | | 269,268 | | | | 260,570 | | | | 268,889 | | | | 1,067,777 | |
| | | | | | | | | | | | | | | | | | | | |
Gross Profit | | | 337,909 | | | | 337,639 | | | | 298,442 | | | | 333,981 | | | | 1,307,971 | |
SG&A | | | 229,454 | | | | 229,893 | | | | 221,428 | | | | 226,583 | | | | 907,358 | |
| | | | | | | | | | | | | | | | | | | | |
Operating income | | | 108,455 | | | | 107,746 | | | | 77,014 | | | | 107,398 | | | | 400,613 | |
| | | | | | | | | | | | | | | | | | | | |
Net income (loss) | | $ | 30,624 | | | $ | 26,435 | | | $ | 3,896 | | | $ | 27,274 | | | $ | 88,229 | |
| | | | | | | | | | | | | | | | | | | | |
| (1) | Results of operations in the third quarter of 2010 were affected by the Communication Services segment recording a $37.7 million goodwill impairment charge which was not deductible for tax purposes. |
| (2) | Net loss in the fourth quarter of 2010 was affected by $52.8 million of refinancing expense. |
| (3) | Results of operations in the third quarter of 2009 were affected by the Communication Services segment recording a $25.5 million impairment charge to establish a valuation allowance against the carrying value of portfolio receivables. |
On February 1, 2011 we completed the acquisitions of Twenty First Century Communications, Inc. (“TFCC”) and Preferred One Stop Technologies Limited (“POSTcti”). TFCC is a provider of automated alerts and notifications to the electric utilities industry, government, public safety and corporate markets. Most utilities use a high volume call answering system developed by TFCC to field the heavy incoming call traffic associated with power outages. POSTcti is a provider of unified communications solutions and services in Europe. POSTcti enables and provides single source communication convergence from best-of-breed industry-leading providers, combined with customized professional services implementation and dedicated ongoing product support, to maximize investment. The aggregate purchase price for these acquisitions was approximately $46 million and the purchase prices for the acquisitions are subject to working capital adjustments. The POSTcti purchase is also subject to an earnout provision based upon achieving specified performance objectives. The acquisitions were funded with cash on hand and partial use of our accounts receivable securitization facility. Both of these acquisitions will be integrated into our Unified Communications segment.
| 22. | FINANCIAL INFORMATION FOR SUBSIDIARY GUARANTOR AND SUBSIDIARY NON-GUARANTOR |
West Corporation and our U.S. based wholly owned subsidiary guarantors, jointly, severally, fully and unconditionally are responsible for the payment of principal, premium and interest on our senior notes and senior subordinated notes. Presented below, in thousands, is condensed consolidated financial information for West Corporation and our subsidiary guarantors and subsidiary non-guarantors for the periods indicated.
F-43
WEST CORPORATION AND SUBSIDIARIES
NOTES TO CONSOLIDATED FINANCIAL STATEMENTS
CONDENSED CONSOLIDATING STATEMENTS OF OPERATIONS
(AMOUNTS IN THOUSANDS)
| | | | | | | | | | | | | | | | | | | | |
| | | Year Ended December 31, 2010 | |
| | | Parent /
Issuer | | | Guarantor
Subsidiaries | | | Non-Guarantor
Subsidiaries | | | Eliminations
and
Consolidating
Entries | | | Consolidated | |
REVENUE | | $ | — | | | $ | 1,945,300 | | | $ | 442,911 | | | $ | — | | | $ | 2,388,211 | |
COST OF SERVICES | | | — | | | | 883,559 | | | | 173,449 | | | | — | | | | 1,057,008 | |
SELLING, GENERAL AND ADMINISTRATIVE EXPENSES | | | 4,707 | | | | 768,656 | | | | 137,659 | | | | — | | | | 911,022 | |
| | | | | | | | | | | | | | | | | | | | |
OPERATING INCOME | | | (4,707 | ) | | | 293,085 | | | | 131,803 | | | | — | | | | 420,181 | |
OTHER INCOME (EXPENSE): | | | | | | | | | | | | | | | | | | | | |
Interest Expense, net of income | | | (157,501 | ) | | | (105,042 | ) | | | 10,074 | | | | — | | | | (252,469 | ) |
Refinancing Expense | | | (52,804 | ) | | | — | | | | — | | | | — | | | | (52,804 | ) |
Subsidiary Income | | | 192,854 | | | | 91,665 | | | | — | | | | (284,519 | ) | | | — | |
Other, net | | | 6,267 | | | | 8,726 | | | | (9,121 | ) | | | — | | | | 5,872 | |
| | | | | | | | | | | | | | | | | | | | |
Other expense | | | (11,184 | ) | | | (4,651 | ) | | | 953 | | | | (284,519 | ) | | | (299,401 | ) |
| | | | | |
INCOME BEFORE INCOME TAX EXPENSE AND NONCONTROLLING INTEREST | | | (15,891 | ) | | | 288,434 | | | | 132,756 | | | | (284,519 | ) | | | 120,780 | |
INCOME TAX EXPENSE (BENEFIT) | | | (76,195 | ) | | | 96,617 | | | | 40,054 | | | | — | | | | 60,476 | |
| | | | | | | | | | | | | | | | | | | | |
| | | | | |
NET INCOME | | | 60,304 | | | | 191,817 | | | | 92,702 | | | | (284,519 | ) | | | 60,304 | |
LESS NET INCOME (LOSS)—NONCONTROLLING INTEREST | | | — | | | | — | | | | — | | | | — | | | | — | |
| | | | | | | | | | | | | | | | | | | | |
NET INCOME—
WEST CORPORATION | | $ | 60,304 | | | $ | 191,817 | | | $ | 92,702 | | | $ | (284,519 | ) | | $ | 60,304 | |
| | | | | | | | | | | | | | | | | | | | |
F-44
WEST CORPORATION AND SUBSIDIARIES
NOTES TO CONSOLIDATED FINANCIAL STATEMENTS
CONDENSED CONSOLIDATING STATEMENTS OF OPERATIONS
(AMOUNTS IN THOUSANDS)
| | | | | | | | | | | | | | | | | | | | |
| | | Year Ended December 31, 2009 | |
| | | Parent/
Issuer | | | Guarantor
Subsidiaries | | | Non-
Guarantor
Subsidiaries | | | Eliminations and
Consolidating
Entries | | | Consolidated | |
REVENUE | | $ | — | | | $ | 1,909,968 | | | $ | 489,618 | | | $ | (23,838 | ) | | $ | 2,375,748 | |
COST OF SERVICES | | | — | | | | 868,400 | | | | 223,215 | | | | (23,838 | ) | | | 1,067,777 | |
SELLING, GENERAL AND ADMINISTRATIVE EXPENSES | | | 2,623 | | | | 761,409 | | | | 143,326 | | | | — | | | | 907,358 | |
| | | | | | | | | | | | | | | | | | | | |
OPERATING INCOME | | | (2,623 | ) | | | 280,159 | | | | 123,077 | | | | — | | | | 400,613 | |
OTHER INCOME (EXPENSE): | | | | | | | | | | | | | | | | | | | | |
Interest Income | | | 606 | | | | (5,790 | ) | | | 5,495 | | | | — | | | | 311 | |
Interest Expense | | | (143,778 | ) | | | (101,216 | ) | | | (9,109 | ) | | | — | | | | (254,103 | ) |
Subsidiary Income | | | 180,889 | | | | 122,574 | | | | — | | | | (303,463 | ) | | | — | |
Other, net | | | 3,097 | | | | (38,668 | ) | | | 36,586 | | | | — | | | | 1,015 | |
| | | | | | | | | | | | | | | | | | | | |
Other expense | | | 40,814 | | | | (23,100 | ) | | | 32,972 | | | | (303,463 | ) | | | (252,777 | ) |
INCOME BEFORE INCOME TAX EXPENSE AND NONCONTROLLING INTEREST | | | 38,191 | | | | 257,059 | | | | 156,049 | | | | (303,463 | ) | | | 147,836 | |
INCOME TAX EXPENSE (BENEFIT) | | | (50,038 | ) | | | 77,211 | | | | 29,689 | | | | — | | | | 56,862 | |
| | | | | | | | | | | | | | | | | | | | |
NET INCOME | | | 88,229 | | | | 179,848 | | | | 126,360 | | | | (303,463 | ) | | | 90,974 | |
LESS NET INCOME (LOSS)—NONCONTROLLING INTEREST | | | — | | | | (5 | ) | | | 2,750 | | | | — | | | | 2,745 | |
| | | | | | | | | | | | | | | | | | | | |
NET INCOME—
WEST CORPORATION | | $ | 88,229 | | | $ | 179,853 | | | $ | 123,610 | | | $ | (303,463 | ) | | $ | 88,229 | |
| | | | | | | | | | | | | | | | | | | | |
F-45
WEST CORPORATION AND SUBSIDIARIES
NOTES TO CONSOLIDATED FINANCIAL STATEMENTS
CONDENSED CONSOLIDATING STATEMENTS OF OPERATIONS
(AMOUNTS IN THOUSANDS)
| | | | | | | | | | | | | | | | | | | | |
| | | Year Ended December 31, 2008 | |
| | | Parent/
Issuer | | | Guarantor
Subsidiaries | | | Non-
Guarantor
Subsidiaries | | | Eliminations and
Consolidating
Entries | | | Consolidated | |
REVENUE | | $ | — | | | $ | 1,894,220 | | | $ | 401,837 | | | $ | (48,623 | ) | | $ | 2,247,434 | |
COST OF SERVICES | | | — | | | | 876,781 | | | | 186,870 | | | | (48,623 | ) | | | 1,015,028 | |
SELLING, GENERAL AND ADMINISTRATIVE EXPENSES | | | (7,121 | ) | | | 741,274 | | | | 147,433 | | | | — | | | | 881,586 | |
| | | | | | | | | | | | | | | | | | | | |
OPERATING INCOME | | | 7,121 | | | | 276,165 | | | | 67,534 | | | | — | | | | 350,820 | |
OTHER INCOME (EXPENSE): | | | | | | | | | | | | | | | | | | | | |
Interest Income | | | 2,366 | | | | (812 | ) | | | 1,514 | | | | — | | | | 3,068 | |
Interest Expense | | | (165,027 | ) | | | (130,658 | ) | | | (17,334 | ) | | | — | | | | (313,019 | ) |
Subsidiary Income | | | 132,828 | | | | 50,676 | | | | — | | | | (183,504 | ) | | | — | |
Other, net | | | (7,726 | ) | | | (6,204 | ) | | | 2,241 | | | | — | | | | (11,689 | ) |
| | | | | | | | | | | | | | | | | | | | |
Other expense | | | (37,559 | ) | | | (86,998 | ) | | | (13,579 | ) | | | (183,504 | ) | | | (321,640 | ) |
INCOME (LOSS) BEFORE INCOME TAX EXPENSE AND NONCONTROLLING INTEREST | | | (30,438 | ) | | | 189,167 | | | | 53,955 | | | | (183,504 | ) | | | 29,180 | |
INCOME TAX EXPENSE (BENEFIT) | | | (49,945 | ) | | | 57,108 | | | | 4,568 | | | | — | | | | 11,731 | |
NET INCOME (LOSS) | | | 19,507 | | | | 132,059 | | | | 49,387 | | | | (183,504 | ) | | | 17,449 | |
LESS NET INCOME (LOSS)—NONCONTROLLING INTEREST | | | — | | | | 11 | | | | (2,069 | ) | | | — | | | | (2,058 | ) |
| | | | | | | | | | | | | | | | | | | | |
NET INCOME—WEST CORPORATION | | $ | 19,507 | | | $ | 132,048 | | | $ | 51,456 | | | $ | (183,504 | ) | | $ | 19,507 | |
| | | | | | | | | | | | | | | | | | | | |
F-46
WEST CORPORATION AND SUBSIDIARIES
NOTES TO CONSOLIDATED FINANCIAL STATEMENTS
CONDENSED CONSOLIDATING BALANCE SHEET
(AMOUNTS IN THOUSANDS)
| | | | | | | | | | | | | | | | | | | | |
| | | December 31, 2010 | |
| | | Parent /
Issuer | | | Guarantor
Subsidiaries | | | Non-
Guarantor
Subsidiaries | | | Eliminations and
Consolidating
Entries | | | Consolidated | |
ASSETS | | | | | | | | | | | | | | | | | | | | |
CURRENT ASSETS: | | | | | | | | | | | | | | | | | | | | |
Cash and cash equivalents | | $ | — | | | $ | — | | | $ | 102,385 | | | $ | (4,592 | ) | | $ | 97,793 | |
Trust cash | | | — | | | | 15,122 | | | | — | | | | — | | | | 15,122 | |
Accounts receivable, net | | | — | | | | 48,738 | | | | 317,681 | | | | — | | | | 366,419 | |
Intercompany receivables | | | — | | | | 416,017 | | | | — | | | | (416,017 | ) | | | — | |
Deferred income taxes receivable | | | 9,848 | | | | 16,532 | | | | 3,588 | | | | — | | | | 29,968 | |
Prepaid assets | | | 2,981 | | | | 24,451 | | | | 6,235 | | | | — | | | | 33,667 | |
Other current assets | | | 2,559 | | | | 23,680 | | | | 7,819 | | | | — | | | | 34,058 | |
| | | | | | | | | | | | | | | | | | | | |
Total current assets | | | 15,388 | | | | 544,540 | | | | 437,708 | | | | (420,609 | ) | | | 577,027 | |
Property and equipment, net | | | 68,026 | | | | 243,300 | | | | 30,040 | | | | — | | | | 341,366 | |
INVESTMENT IN SUBSIDIARIES | | | 1,069,843 | | | | 271,278 | | | | — | | | | (1,341,121 | ) | | | — | |
GOODWILL | | | — | | | | 1,471,124 | | | | 158,272 | | | | — | | | | 1,629,396 | |
INTANGIBLES, net | | | — | | | | 244,833 | | | | 54,852 | | | | — | | | | 299,685 | |
OTHER ASSETS | | | 110,090 | | | | 288,496 | | | | (240,810 | ) | | | — | | | | 157,776 | |
| | | | | | | | | | | | | | | | | | | | |
TOTAL ASSETS | | $ | 1,263,347 | | | $ | 3,063,571 | | | $ | 440,062 | | | $ | (1,761,730 | ) | | $ | 3,005,250 | |
| | | | | | | | | | | | | | | | | | | | |
LIABILITIES AND STOCKHOLDERS’ EQUITY (DEFICIT) | | | | | | | | | | | | | | | | | | | | |
CURRENT LIABILITIES: | | | | | | | | | | | | | | | | | | | | |
Accounts payable | | $ | 7,448 | | | $ | 52,291 | | | $ | 9,002 | | | $ | (4,592 | ) | | $ | 64,149 | |
Intercompany payables | | | 340,974 | | | | — | | | | 75,043 | | | | (416,017 | ) | | | — | |
Accrued expenses | | | 10,412 | | | | 214,349 | | | | 59,227 | | | | — | | | | 283,988 | |
Current maturities of long-term debt | | | 4,777 | | | | 10,648 | | | | — | | | | — | | | | 15,425 | |
| | | | | | | | | | | | | | | | | | | | |
Total current liabilities | | | 363,611 | | | | 277,288 | | | | 143,272 | | | | (420,609 | ) | | | 363,562 | |
LONG-TERM OBLIGATIONS, less current maturities | | | 1,888,775 | | | | 1,629,366 | | | | — | | | | — | | | | 3,518,141 | |
DEFERRED INCOME TAXES | | | 20,421 | | | | 53,839 | | | | 19,621 | | | | — | | | | 93,881 | |
OTHER LONG-TERM LIABILITIES | | | 29,595 | | | | 37,644 | | | | 1,482 | | | | — | | | | 68,721 | |
CLASS L COMMON STOCK | | | 1,504,445 | | | | — | | | | — | | | | — | | | | 1,504,445 | |
TOTAL STOCKHOLDERS’ EQUITY (DEFICIT) | | | (2,543,500 | ) | | | 1,065,434 | | | | 275,687 | | | | (1,341,121 | ) | | | (2,543,500 | ) |
| | | | | | | | | | | | | | | | | | | | |
TOTAL LIABILITIES AND STOCKHOLDERS’ EQUITY (DEFICIT) | | $ | 1,263,347 | | | $ | 3,063,571 | | | $ | 440,062 | | | $ | (1,761,730 | ) | | $ | 3,005,250 | |
| | | | | | | | | | | | | | | | | | | | |
F-47
WEST CORPORATION AND SUBSIDIARIES
NOTES TO CONSOLIDATED FINANCIAL STATEMENTS
CONDENSED CONSOLIDATING BALANCE SHEET
(AMOUNTS IN THOUSANDS)
| | | | | | | | | | | | | | | | | | | | |
| | | December 31, 2009 | |
| | | Parent /
Issuer | | | Guarantor
Subsidiaries | | | Non-
Guarantor
Subsidiaries | | | Eliminations and
Consolidating
Entries | | | Consolidated | |
ASSETS | | | | | | | | | | | | | | | | | | | | |
CURRENT ASSETS: | | | | | | | | | | | | | | | | | | | | |
Cash and cash equivalents | | $ | 2,349 | | | $ | — | | | $ | 66,982 | | | $ | (10,263 | ) | | $ | 59,068 | |
Trust cash | | | — | | | | 14,750 | | | | — | | | | — | | | | 14,750 | |
Accounts receivable, net | | | — | | | | 42,772 | | | | 310,850 | | | | — | | | | 353,622 | |
Intercompany receivables | | | — | | | | 279,853 | | | | — �� | | | | (279,853 | ) | | | — | |
Portfolio receivables, current portion | | | — | | | | 2,483 | | | | 5,490 | | | | — | | | | 7,973 | |
Deferred income taxes receivable | | | 10,218 | | | | 17,498 | | | | 7,640 | | | | — | | | | 35,356 | |
Other current assets | | | 11,369 | | | | 48,080 | | | | 13,398 | | | | — | | | | 72,847 | |
| | | | | | | | | | | | | | | | | | | | |
Total current assets | | | 23,936 | | | | 405,436 | | | | 404,360 | | | | (290,116 | ) | | | 543,616 | |
Property and equipment, net | | | 60,968 | | | | 244,137 | | | | 28,162 | | | | — | | | | 333,267 | |
PORTFOLIO RECEIVABLES, NET OF CURRENT PORTION | | | — | | | | 1,795 | | | | 3,971 | | | | — | | | | 5,766 | |
INVESTMENT IN SUBSIDIARIES | | | 916,234 | | | | 274,544 | | | | — | | | | (1,190,778 | ) | | | — | |
GOODWILL | | | — | | | | 1,500,886 | | | | 164,683 | | | | — | | | | 1,665,569 | |
INTANGIBLES, net | | | — | | | | 281,319 | | | | 69,403 | | | | — | | | | 350,722 | |
OTHER ASSETS | | | 104,126 | | | | 293,866 | | | | (251,670 | ) | | | — | | | | 146,322 | |
| | | | | | | | | | | | | | | | | | | | |
TOTAL ASSETS | | $ | 1,105,264 | | | $ | 3,001,983 | | | $ | 418,909 | | | $ | (1,480,894 | ) | | $ | 3,045,262 | |
| | | | | | | | | | | | | | | | | | | | |
LIABILITIES AND STOCKHOLDERS’ EQUITY (DEFICIT) | | | | | | | | | | | | | | | | | | | | |
CURRENT LIABILITIES: | | | | | | | | | | | | | | | | | | | | |
Accounts payable | | $ | 3,596 | | | $ | 62,675 | | | $ | 7,851 | | | $ | (10,263 | ) | | $ | 63,859 | |
Intercompany payables | | | 210,985 | | | | — | | | | 68,868 | | | | (279,853 | ) | | | — | |
Accrued expenses | | | 62,486 | | | | 180,982 | | | | 35,226 | | | | — | | | | 278,694 | |
Current maturities of long-term debt | | | 7,552 | | | | 17,819 | | | | — | | | | — | | | | 25,371 | |
Current maturities of portfolio notes payable | | | — | | | | 685 | | | | — | | | | — | | | | 685 | |
Income taxes payable | | | (58,670 | ) | | | 50,800 | | | | 7,870 | | | | — | | | | — | |
| | | | | | | | | | | | | | | | | | | | |
Total current liabilities | | | 225,949 | | | | 312,961 | | | | 119,815 | | | | (290,116 | ) | | | 368,609 | |
LONG-TERM OBLIGATIONS, less current maturities | | | 1,900,555 | | | | 1,707,317 | | | | — | | | | — | | | | 3,607,872 | |
DEFERRED INCOME TAXES | | | 17,921 | | | | 59,333 | | | | 19,710 | | | | — | | | | 96,964 | |
OTHER LONG-TERM LIABILITIES | | | 53,583 | | | | 9,509 | | | | 1,469 | | | | — | | | | 64,561 | |
CLASS L COMMON STOCK | | | 1,332,721 | | | | — | | | | — | | | | — | | | | 1,332,721 | |
TOTAL STOCKHOLDERS’ EQUITY (DEFICIT) | | | (2,425,465 | ) | | | 912,863 | | | | 277,915 | | | | (1,190,778 | ) | | | (2,425,465 | ) |
| | | | | | | | | | | | | | | | | | | | |
TOTAL LIABILITIES AND STOCKHOLDERS’ EQUITY (DEFICIT) | | $ | 1,105,264 | | | $ | 3,001,983 | | | $ | 418,909 | | | $ | (1,480,894 | ) | | $ | 3,045,262 | |
| | | | | | | | | | | | | | | | | | | | |
F-48
WEST CORPORATION AND SUBSIDIARIES
NOTES TO CONSOLIDATED FINANCIAL STATEMENTS
CONDENSED CONSOLIDATING STATEMENTS OF CASH FLOWS
(AMOUNTS IN THOUSANDS)
| | | | | | | | | | | | | | | | | | | | |
| | | Year Ended December 31, 2010 | |
| | | Parent /
Issuer | | | Guarantor
Subsidiaries | | | Non-Guarantor
Subsidiaries | | | Eliminations
and
Consolidating
Entries | | | Consolidated | |
NET CASH PROVIDED BY OPERATING ACTIVITIES: | | $ | — | | | $ | 239,307 | | | $ | 78,114 | | | $ | (4,592 | ) | | $ | 312,829 | |
| | | | | |
CASH FLOWS FROM INVESTING ACTIVITIES: | | | | | | | | | | | | | | | | | | | | |
Business acquisitions | | | — | | | | (23,746 | ) | | | (9,750 | ) | | | — | | | | (33,496 | ) |
Purchase of property and equipment | | | (20,457 | ) | | | (83,403 | ) | | | (14,331 | ) | | | — | | | | (118,191 | ) |
Collections applied to principal of portfolio receivables | | | — | | | | 13,739 | | | | — | | | | — | | | | 13,739 | |
Other | | | — | | | | 52 | | | | — | | | | — | | | | 52 | |
| | | | | | | | | | | | | | | | | | | | |
Net cash provided by (used in) investing activities | | | (20,457 | ) | | | (93,358 | ) | | | (24,081 | ) | | | — | | | | (137,896 | ) |
| | | | | | | | | | | | | | | | | | | | |
CASH FLOWS FROM FINANCING ACTIVITIES: | | | | | | | | | | | | | | | | | | | | |
Payments of long-term obligations | | | (1,327,781 | ) | | | — | | | | (47,000 | ) | | | — | | | | (1,374,781 | ) |
Proceeds from issuance of long-term obligations | | | 1,254,850 | | | | — | | | | 47,000 | | | | — | | | | 1,301,850 | |
Debt issuance costs | | | (31,083 | ) | | | — | | | | — | | | | — | | | | (31,083 | ) |
Principal payments of long-term obligations | | | (7,688 | ) | | | (19,059 | ) | | | — | | | | — | | | | (26,747 | ) |
Payments of capital lease obligations | | | (2,005 | ) | | | (52 | ) | | | (58 | ) | | | — | | | | (2,115 | ) |
Repurchase of common stock | | | (970 | ) | | | — | | | | — | | | | — | | | | (970 | ) |
Proceeds from stock sale and options exercised | | | 897 | | | | — | | | | — | | | | — | | | | 897 | |
Payments of portfolio notes payable | | | — | | | | (686 | ) | | | — | | | | — | | | | (686 | ) |
Other | | | (16 | ) | | | — | | | | — | | | | — | | | | (16 | ) |
| | | | | | | | | | | | | | | | | | | | |
Net cash (used in) provided by financing activities | | | (113,796 | ) | | | (19,797 | ) | | | (58 | ) | | | — | | | | (133,651 | ) |
| | | | | | | | | | | | | | | | | | | | |
Intercompany | | | 131,904 | | | | (126,152 | ) | | | (16,015 | ) | | | 10,263 | | | | — | |
EFFECT OF EXCHANGE RATES ON CASH AND CASH EQUIVALENTS | | | — | | | | — | | | | (2,557 | ) | | | — | | | | (2,557 | ) |
NET CHANGE IN CASH AND CASH EQUIVALENTS | | | (2,349 | ) | | | — | | | | 35,403 | | | | 5,671 | | | | 38,725 | |
CASH AND CASH EQUIVALENTS, Beginning of period | | | 2,349 | | | | — | | | | 66,982 | | | | (10,263 | ) | | | 59,068 | |
| | | | | | | | | | | | | | | | | | | | |
CASH AND CASH EQUIVALENTS, End of period | | $ | — | | | $ | — | | | $ | 102,385 | | | $ | (4,592 | ) | | $ | 97,793 | |
| | | | | | | | | | | | | | | | | | | | |
F-49
WEST CORPORATION AND SUBSIDIARIES
NOTES TO CONSOLIDATED FINANCIAL STATEMENTS
CONDENSED CONSOLIDATING STATEMENTS OF CASH FLOWS
(AMOUNTS IN THOUSANDS)
| | | | | | | | | | | | | | | | | | | | |
| | | Year Ended December 31, 2009 | |
| | | Parent /
Issuer | | | Guarantor
Subsidiaries | | | Non-Guarantor
Subsidiaries | | | Eliminations
and
Consolidating
Entries | | | Consolidated | |
NET CASH PROVIDED BY OPERATING ACTIVITIES: | | $ | — | | | $ | 175,330 | | | $ | 107,790 | | | $ | (10,263 | ) | | $ | 272,857 | |
| | | | | |
CASH FLOWS FROM INVESTING ACTIVITIES: | | | | | | | | | | | | | | | | | | | | |
Business acquisitions | | | — | | | | (23,612 | ) | | | (8,099 | ) | | | — | | | | (31,711 | ) |
Purchase of portfolio receivables | | | — | | | | — | | | | (1,722 | ) | | | — | | | | (1,722 | ) |
Purchase of property and equipment | | | (15,866 | ) | | | (89,380 | ) | | | (13,274 | ) | | | — | | | | (118,520 | ) |
Collections applied to principal of portfolio receivables | | | — | | | | 8,467 | | | | 30,596 | | | | — | | | | 39,063 | |
Other | | | — | | | | 57 | | | | 218 | | | | — | | | | 275 | |
| | | | | | | | | | | | | | | | | | | | |
Net cash provided by (used in) investing activities | | | (15,866 | ) | | | (104,468 | ) | | | 7,719 | | | | — | | | | (112,615 | ) |
| | | | | | | | | | | | | | | | | | | | |
CASH FLOWS FROM FINANCING ACTIVITIES: | | | | | | | | | | | | | | | | | | | | |
Net change in revolving credit facilities | | | (151,187 | ) | | | — | | | | (50,487 | ) | | | — | | | | (201,674 | ) |
Principal payments of long-term obligations | | | (6,342 | ) | | | (18,942 | ) | | | — | | | | — | | | | (25,284 | ) |
Debt issuance costs | | | (7,968 | ) | | | — | | | | — | | | | — | | | | (7,968 | ) |
Proceeds from stock sale and options exercised | | | 3,200 | | | | — | | | | — | | | | — | | | | 3,200 | |
Payments of portfolio notes payable | | | — | | | | (1,603 | ) | | | (33,091 | ) | | | — | | | | (34,694 | ) |
Noncontrolling interest distributions | | | — | | | | — | | | | (4,131 | ) | | | — | | | | (4,131 | ) |
Payments of capital lease obligations | | | (904 | ) | | | (334 | ) | | | (55 | ) | | | — | | | | (1,293 | ) |
| | | | | | | | | | | | | | | | | | | | |
Net cash (used in) provided by financing activities | | | (163,201 | ) | | | (20,879 | ) | | | (87,764 | ) | | | — | | | | (271,844 | ) |
| | | | | | | | | | | | | | | | | | | | |
Intercompany | | | 55,742 | | | | (57,128 | ) | | | 1,386 | | | | — | | | | — | |
EFFECT OF EXCHANGE RATES ON CASH AND CASH EQUIVALENTS | | | — | | | | — | | | | 2,330 | | | | — | | | | 2,330 | |
NET CHANGE IN CASH AND CASH EQUIVALENTS | | | (123,325 | ) | | | (7,145 | ) | | | 31,461 | | | | (10,263 | ) | | | (109,272 | ) |
CASH AND CASH EQUIVALENTS, Beginning of period | | | 125,674 | | | | 7,145 | | | | 35,521 | | | | — | | | | 168,340 | |
| | | | | | | | | | | | | | | | | | | | |
CASH AND CASH EQUIVALENTS, End of period | | $ | 2,349 | | | $ | — | | | $ | 66,982 | | | $ | (10,263 | ) | | $ | 59,068 | |
| | | | | | | | | | | | | | | | | | | | |
F-50
WEST CORPORATION AND SUBSIDIARIES
NOTES TO CONSOLIDATED FINANCIAL STATEMENTS
CONDENSED CONSOLIDATING STATEMENTS OF CASH FLOWS
(AMOUNTS IN THOUSANDS)
| | | | | | | | | | | | | | | | |
| | | Year Ended December 31, 2008 | |
| | | Parent /
Issuer | | | Guarantor
Subsidiaries | | | Non-Guarantor
Subsidiaries | | | Consolidated | |
NET CASH PROVIDED BY OPERATING ACTIVITIES: | | $ | — | | | $ | 110,119 | | | $ | 177,262 | | | $ | 287,381 | |
| | | | |
CASH FLOWS FROM INVESTING ACTIVITIES: | | | | | | | | | | | | | | | | |
Business acquisitions | | | — | | | | (194,342 | ) | | | (299,214 | ) | | | (493,556 | ) |
Purchase of portfolio receivables | | | — | | | | (15,052 | ) | | | (30,351 | ) | | | (45,403 | ) |
Purchase of property and equipment | | | (9,057 | ) | | | (86,399 | ) | | | (9,925 | ) | | | (105,381 | ) |
Collections applied to principal of portfolio receivables | | | — | | | | 2,600 | | | | 43,795 | | | | 46,395 | |
Other | | | — | | | | 406 | | | | — | | | | 406 | |
| | | | | | | | | | | | | | | | |
Net cash provided by (used in) investing activities | | | (9,057 | ) | | | (292,787 | ) | | | (295,695 | ) | | | (597,539 | ) |
| | | | | | | | | | | | | | | | |
CASH FLOWS FROM FINANCING ACTIVITIES: | | | | | | | | | | | | | | | | |
Proceeds from issuance of new debt | | | 84,000 | | | | 50,000 | | | | — | | | | 134,000 | |
Net change in revolving credit facilities | | | 224,044 | | | | — | | | | 59,123 | | | | 283,167 | |
Principal payments of long-term obligations | | | (4,837 | ) | | | (20,112 | ) | | | — | | | | (24,949 | ) |
Debt issuance costs | | | (8,019 | ) | | | — | | | | (2,296 | ) | | | (10,315 | ) |
Proceeds from stock sale and options exercised | | | 25 | | | | — | | | | — | | | | 25 | |
Proceeds from issuance of portfolio notes payable | | | — | | | | 3,338 | | | | 29,758 | | | | 33,096 | |
Payments of portfolio notes payable | | | — | | | | (527 | ) | | | (64,403 | ) | | | (64,930 | ) |
Noncontrolling interest distributions | | | — | | | | — | | | | (7,120 | ) | | | (7,120 | ) |
Payments of capital lease obligations | | | — | | | | (949 | ) | | | — | | | | (949 | ) |
Other | | | (54 | ) | | | — | | | | — | | | | (54 | ) |
| | | | | | | | | | | | | | | | |
Net cash (used in) provided by financing activities | | | 295,159 | | | | 31,750 | | | | 15,062 | | | | 341,971 | |
| | | | | | | | | | | | | | | | |
Intercompany | | | (248,038 | ) | | | 161,075 | | | | 86,963 | | | | — | |
EFFECT OF EXCHANGE RATES ON CASH AND CASH EQUIVALENTS | | | — | | | | — | | | | (5,420 | ) | | | (5,420 | ) |
NET CHANGE IN CASH AND CASH EQUIVALENTS | | | 38,064 | | | | 10,157 | | | | (21,828 | ) | | | 26,393 | |
CASH AND CASH EQUIVALENTS, Beginning of period | | | 87,610 | | | | (3,012 | ) | | | 57,349 | | | | 141,947 | |
| | | | | | | | | | | | | | | | |
CASH AND CASH EQUIVALENTS, End of period | | $ | 125,674 | | | $ | 7,145 | | | $ | 35,521 | | | $ | 168,340 | |
| | | | | | | | | | | | | | | | |
F-51
Schedule II
WEST CORPORATION AND SUBSIDIARIES
CONSOLIDATED VALUATION ACCOUNTS
THREE YEARS ENDED DECEMBER 31, 2010
| | | | | | | | | | | | | | | | | | | | |
Description (amounts in thousands) | | Balance
Beginning
of Year | | | Reserves
Obtained
in
Acquisitions | | | Additions -
Charged
(Credited)
to Cost
and
Expenses | | | Deductions -
Amounts
Charged-Off | | | Balance
End of Year | |
December 31, 2010—Allowance for doubtful accounts—Accounts receivable | | $ | 11,819 | | | $ | 268 | | | $ | 4,222 | | | $ | 5,828 | | | $ | 10,481 | |
| | | | | | | | | | | | | | | | | | | | |
December 31, 2009—Allowance for doubtful accounts—Accounts receivable | | $ | 12,382 | | | $ | 18 | | | $ | 5,301 | | | $ | 5,882 | | | $ | 11,819 | |
| | | | | | | | | | | | | | | | | | | | |
December 31, 2008—Allowance for doubtful accounts—Accounts receivable | | $ | 6,471 | | | $ | 5,619 | | | $ | 5,004 | | | $ | 4,712 | | | $ | 12,382 | |
| | | | | | | | | | | | | | | | | | | | |
| | | | | |
| | | Balance
Beginning
of Year | | | Valuation
Allowance
obtained
in
Acquisitions | | | Additions | | | Deductions | | | Balance
End of Year | |
December 31, 2010—Allowance for deferred income tax asset valuation | | $ | (101,849 | ) | | $ | (20,770 | ) | | $ | (1,044 | ) | | $ | 3,979 | | | $ | (119,684 | ) |
| | | | | | | | | | | | | | | | | | | | |
December 31, 2009—Allowance for deferred income tax asset valuation | | $ | (100,676 | ) | | $ | (1,173 | ) | | $ | — | | | $ | — | | | $ | (101,849 | ) |
| | | | | | | | | | | | | | | | | | | | |
December 31, 2008—Allowance for deferred income tax asset valuation | | $ | (31,974 | ) | | $ | (64,348 | ) | | $ | (4,354 | ) | | $ | — | | | $ | (100,676 | ) |
| | | | | | | | | | | | | | | | | | | | |
S-1
EXHIBIT INDEX
Exhibits identified in parentheses below, on file with the SEC are incorporated by reference into this report.
| | |
Exhibit Number | | Description |
| 3.01 | | Amended and Restated Certificate of Incorporation of the Company (incorporated by reference to Exhibit 3.1 to Form 8-K dated October 30, 2006) |
| |
| 3.02 | | Amended and Restated Bylaws of the Company (incorporated by reference to Exhibit 3.2 to Form 8-K dated October 30, 2006) |
| |
| 10.01 | | West Corporation 2006 Executive Incentive Plan (incorporated by reference to Exhibit 10.12 to Form 10-Q filed on November 9, 2006) (1) |
| |
| 10.02 | | Indenture, dated as of October 24, 2006, among West Corporation, the Guarantors named on the Signature Pages thereto and The Bank of New York, as Trustee, with respect to the 11% senior subordinated notes due 2016 (incorporated by reference to Exhibit 4.2 to Form 10-Q filed on November 9, 2006) |
| |
| 10.03 | | Lease, dated September 1, 1994, by and between West Telemarketing Corporation and 99-Maple Partnership (Amendment No. 1) dated December 10, 2003 (incorporated by reference to Exhibit 10.07 to Form 10-K filed February 24, 2006) |
| |
| 10.04 | | Employment Agreement between the Company and Thomas B. Barker dated December 31, 2008 (incorporated by reference to Exhibit 10.1 to Form 8-K filed January 7, 2009) (1) |
| |
| 10.05 | | Employment Agreement between the Company and Nancee R. Berger dated December 31, 2008 (incorporated by reference to Exhibit 10.2 to Form 8-K filed January 7, 2009) (1) |
| |
| 10.06 | | Employment Agreement between the Company and Paul M. Mendlik, dated December 31, 2008 (incorporated by reference to Exhibit 10.4 to Form 8-K filed January 7, 2009) (1) |
| |
| 10.07 | | Exhibit A dated February 21, 2011, to the Employment Agreement between West Corporation and Todd B. Strubbe, dated September 28, 2009 (1)** |
| |
| 10.08 | | Registration Rights and Coordination Agreement, dated as of October 24, 2006, among West Corporation, THL Investors, Quadrangle Investors, Other Investors, Founders and Managers named therein (incorporated by reference to Exhibit 4.5 to Form 10-Q filed on November 9, 2006) |
| |
| 10.09 | | Restatement Agreement (the “Restatement Agreement”), dated as of October 5, 2010, by and among Wells Fargo Bank, National Association, as administrative agent, West Corporation (“West”), certain domestic subsidiaries of West and the lenders party thereto (Exhibit A, the Amended and Restated Credit Agreement, is included as Exhibit 10.10) (incorporated by reference to Exhibit 10.1 to Form 8-K filed October 6, 2010) |
| |
| 10.10 | | Amended and Restated Credit Agreement, dated as of October 5, 2010, by and among West, certain domestic subsidiaries of West, Wells Fargo Bank, National Association, as administrative agent, Deutsche Bank Securities Inc. and Bank of America, N.A., as syndication agents, Wells Fargo Bank, National Association and General Electric Capital Corporation, as co-documentation agents, Wells Fargo Securities, LLC and Deutsche Bank Securities Inc., as joint lead arrangers, Wells Fargo Securities, LLC and Deutsche Bank Securities Inc., as joint bookrunners, and the lenders party thereto, adopted pursuant to the Restatement Agreement (incorporated by reference to Exhibit 10.2 to Form 8-K filed October 6, 2010) |
| |
| 10.11 | | Guarantee Agreement, dated as of October 24, 2006, among the guarantors identified therein and Lehman Commercial Paper Inc., as Administrative Agent (incorporated by reference to Exhibit 10.11 to Amendment No. 1 to Registration Statement on Form S-1 filed on November 6, 2009) |
| | |
Exhibit Number | | Description |
| 10.12 | | Indenture, dated as of October 5, 2010, among West, the guarantors named on the signature pages thereto and The Bank of New York Mellon Trust Company, N.A., as Trustee, with respect to the 8 5/8% senior notes due 2018 (incorporated by reference to Exhibit 10.3 to Form 8-K filed October 6, 2010) |
| |
| 10.13 | | Registration Rights Agreement, dated as of October 5, 2010, among West, the guarantors named on the signature pages thereto and Deutsche Bank Securities, Inc., Wells Fargo Securities, LLC, Goldman, Sachs & Co. and Morgan Stanley & Co. (incorporated by reference to Exhibit 10.4 to Form 8-K filed October 6, 2010) |
| |
| 10.14 | | Indenture, dated as of November 24, 2010, among West, the guarantors named on the signature pages thereto and The Bank of New York Mellon Trust Company, N.A., as Trustee, with respect to the 7 7/8% senior notes due 2019 (incorporated by reference to Exhibit 10.2 to Form 8-K filed November 24, 2010) |
| |
| 10.15 | | Registration Rights Agreement, dated as of November 24, 2010, among West, the guarantors named on the signature pages thereto and Deutsche Bank Securities, Inc., Wells Fargo Securities, LLC, Goldman, Sachs & Co., Merrill Lynch, Pierce, Fenner & Smith Incorporated and Morgan Stanley & Co. (incorporated by reference to Exhibit 10.3 to Form 8-K filed November 24, 2010) |
| |
| 10.16 | | West Corporation Nonqualified Deferred Compensation Plan, as amended and restated effective January 1, 2008 (incorporated by reference to Exhibit 10.15 to Form 10-K dated March 3, 2009) (1) |
| |
| 10.17 | | Security Agreement, dated as of October 24, 2006, among West Corporation, The Other Grantors Identified therein and Lehman Commercial Paper Inc., as Administrative Agent (incorporated by reference to Exhibit 10.3 to Form 10-Q filed on November 9, 2006) |
| |
| 10.18 | | Intellectual Property Security Agreement, dated as of October 24, 2006, among West Corporation, The Other Grantors Identified therein and Lehman Commercial Paper Inc., as Administrative Agent (incorporated by reference to Exhibit 10.4 to Form 10-Q filed on November 9, 2006) |
| |
| 10.19 | | Deed of Trust, Assignment of Leases and Rents, Security Agreement and Financing Statement, dated October 24, 2006, from West Corporation, as Trustor to Chicago Title Insurance Company, as Trustee and Lehman Commercial Paper Inc., as Beneficiary (incorporated by reference to Exhibit 10.5 to Form 10-Q filed on November 9, 2006) |
| 10.20 | | Deed of Trust, Assignment of Leases and Rents, Security Agreement and Financing Statement, dated October 24, 2006, from West Business Services, LP to Lehman Commercial Paper Inc. (incorporated by reference to Exhibit 10.6 to Form 10-Q filed on November 9, 2006) |
| |
| 10.21 | | Mortgage, Assignment of Leases and Rents, Security Agreement and Financing Statement, dated October 24, 2006, from West Telemarketing, LP to Lehman Commercial Paper Inc. (incorporated by reference to Exhibit 10.7 to Form 10-Q filed on November 9, 2006) |
| |
| 10.22 | | Management Agreement, dated as of October 24, 2006, among Omaha Acquisition Corp., West Corporation, Quadrangle Advisors II LLC, and THL Managers VI, LLC (incorporated by reference to Exhibit 10.8 to Form 10-Q filed on November 9, 2006) |
| |
| 10.23 | | Founders Agreement, dated October 24, 2006, among West Corporation, Gary L. West and Mary E. West (incorporated by reference to Exhibit 10.9 to Form 10-Q filed on November 9, 2006) |
| |
| 10.24 | | Stockholder Agreement, dated as of October 24, 2006, among West Corporation, THL Investors, Quadrangle Investors, Other Investors, Founders and Managers named therein (incorporated by reference to Exhibit 10.10 to Form 10-Q filed on November 9, 2006) |
| |
| 10.25 | | Form of Rollover Agreement (incorporated by reference to Exhibit 10.11 to Form 10-Q filed on November 9, 2006) |
| | |
Exhibit Number | | Description |
| 10.26 | | Form of West Corporation Restricted Stock Award and Special Bonus Agreement (incorporated by reference to Exhibit 10.13 to Form 10-Q filed on November 9, 2006) (1) |
| |
| 10.27 | | Form of Option Agreement (incorporated by reference to Exhibit 10.14 to Form 10-Q filed on November 9, 2006) (1) |
| |
| 10.28 | | Form of Rollover Option Grant Agreement (incorporated by reference to Exhibit 10.15 to Form 10-Q filed on November 9, 2006) (1) |
| |
| 10.29 | | West Corporation Executive Retirement Savings Plan Amended and Restated Effective as of January 1, 2008 (incorporated by reference to Exhibit 10.29 to Form 10-K filed March 3, 2009) (1) |
| |
| 10.30 | | Amendment Number One to West Corporation’s 2006 Executive Incentive Plan (1)** |
| |
| 10.31 | | Supplemental Indenture, dated as of March 16, 2007, by and among CenterPost Communications, Inc., TeleVox Software, Incorporated, West At Home, LLC and The Bank of New York, to the Indenture, dated as of October 24, 2006, by and among West Corporation, the guarantors named therein and The Bank of New York, with respect to West Corporation’s $450.0 million aggregate principal amount of 11% senior subordinated notes due October 15, 2016 (incorporated by reference to Exhibit 99.2 to Form 8-K filed on March 30, 2007) |
| |
| 10.32 | | Supplemental Indenture, dated as of March 30, 2007, by and among SmartTalk, Inc. and The Bank of New York, to the Indenture, dated as of October 24, 2006, by and among West Corporation, the guarantors named therein and The Bank of New York, with respect to West Corporation’s $450.0 million aggregate principal amount of 11% senior subordinated notes due October 15, 2016 (incorporated by reference to Exhibit 99.4 to Form 8-K filed on March 30, 2007) |
| |
| 10.33 | | Supplemental Indenture, dated as of June 19, 2007, by and among Omnium Worldwide, Inc. and The Bank of New York, to the Indenture, dated as of October 24, 2006, by and among West Corporation, the guarantors named therein and The Bank of New York, with respect to West Corporation’s $450.0 million aggregate principal amount of 11% senior subordinated notes due October 15, 2016 (incorporated by reference to Exhibit 10.35 to Form 10-K dated March 3, 2009) |
| |
| 10.34 | | Supplemental Indenture, dated as of August 15, 2007, by and among West Business Services Corporation, West Telemarketing Corporation and The Bank of New York, to the Indenture, dated as of October 24, 2006, by and among West Corporation, the guarantors named therein and The Bank of New York, with respect to West Corporation’s $450.0 million aggregate principal amount of 11% senior subordinated notes due October 15, 2016 (incorporated by reference to Exhibit 10.37 to Form 10-K dated March 3, 2009) |
| |
| 10.35 | | Supplemental Indenture, dated as of June 12, 2008, by and among HBF Communications, Inc. and The Bank of New York, to the Indenture, dated as of October 24, 2006, by and among West Corporation, the guarantors named therein and The Bank of New York, with respect to West Corporation’s $450.0 million aggregate principal amount of 11% senior subordinated notes due October 15, 2016 (incorporated by reference to Exhibit 10.39 to Form 10-K dated March 3, 2009) |
| |
| 10.36 | | Supplemental Indenture, dated as of February 20, 2009, by and among Intrado Information Systems Holdings, Inc., Intrado Command Systems, Inc., Geo911, Inc., Positron Public Safety Systems Corp., Masys Corporation, West Corporation, and The Bank of New York, to the Indenture, dated as of October 24, 2006, by and among West Corporation, the guarantors named therein and The Bank of New York, with respect to West Corporation’s $450.0 million aggregate principal amount of 11% senior subordinated notes due October 15, 2016 (incorporated by reference to Exhibit 10.41 to Form 10-K dated March 3, 2009) |
| | |
Exhibit Number | | Description |
| 10.37 | | Supplemental Indenture, dated as of January 25, 2010, by and among Worldwide Asset Purchasing, LLC, Stream57 Corporation, West Corporation, and The Bank of New York Mellon, to the Indenture, dated as of October 24, 2006, by and among West Corporation, the guarantors named therein and The Bank of New York, with respect to West Corporation’s $450.0 million aggregate principal amount of 11% senior subordinated notes due October 15, 2016 (incorporated by reference to Exhibit 10.44 to Form 10-K filed on February 12, 2010) |
| |
| 10.38 | | Amended and Restated Credit Agreement By and Between West Receivables Purchasing, LLC as Borrower, and TOGM, LLC, as Lender, dated as of April 30, 2009 (incorporated by reference to Exhibit 10.01 to Form 10-Q dated May 5, 2009) |
| |
| 10.39 | | Amended and Restated Servicing Agreement By and Among West Asset Management, Inc., as Servicer, West Receivables Purchasing, LLC, as Borrower, and TOGM, LLC, as Lender, dated as of April 30, 2009 (incorporated by reference to Exhibit 10.02 to Form 10-Q dated May 5, 2009) |
| |
| 10.40 | | Form of Promissory Note between West Receivables Purchasing, LLC and TOGM, LLC (incorporated by reference to Exhibit 10.03 to Form 10-Q dated May 5, 2009) |
| |
| 10.41 | | Amended and Restated Operating Agreement of West Receivables Purchasing, LLC between TOGM, LLC and West Receivables Services, Inc. dated April 30, 2009 (incorporated by reference to Exhibit 10.04 to Form 10-Q dated May 5, 2009) |
| |
| 10.42 | | Amended and Restated Restricted Stock Award and Special Bonus Agreement between West Corporation and Thomas Barker, dated as of May 4, 2009 (incorporated by reference to Exhibit 10.05 to Form 10-Q dated May 5, 2009) (1). |
| |
| 10.43 | | Exhibit A dated February 21, 2011 to the Employment Agreement between West Corporation and Steven M. Stangl, dated December 31, 2008 (1)** |
| |
| 10.44 | | Exhibit A dated February 21, 2011 to the Employment Agreement between West Corporation and Thomas B. Barker, dated December 31, 2008 (1)** |
| |
| 10.45 | | Exhibit A dated February 21, 2011 to the Employment Agreement between West Corporation and Nancee R. Berger, dated December 31, 2008 (1)** |
| |
| 10.46 | | Exhibit A dated February 21, 2011 to the Employment Agreement between West Corporation and Paul M. Mendlik, dated December 31, 2008 (1)** |
| |
| 10.47 | | Agreement of Resignation, Appointment and Acceptance, dated as of April 8, 2010 by and among West Corporation, The Bank of New York Mellon, as prior trustee, and The Bank of New York Mellon Trust Company, N.A. as successor Trustee with respect to West Corporation’s $450.0 million aggregate principal amount of 11% senior subordinated notes due October 15, 2016 (incorporated by reference to Exhibit 10.03 to Form 10-Q dated May 7, 2010) |
| |
| 10.48 | | Amendment Number One to the West Corporation Nonqualified Deferred Compensation Plan, dated as of April 30, 2010 (incorporated by reference to Exhibit 10.04 to Form 10-Q dated May 7, 2010) (1) |
| |
| 10.49 | | Supplemental Indenture, dated as of May 14, 2010, by and among West Unified Communications Services, LLC, West Corporation, and The Bank of New York Mellon Trust Company, N.A., to the Indenture, dated as of October 24, 2006, by and among West Corporation, the guarantors named therein and The Bank of New York with respect to West Corporation’s $450.0 million aggregate principal amount of 11% senior subordinated notes due October 15, 2016 (incorporated by reference to Exhibit 10.02 to Form 10-Q dated August 2, 2010) |
| |
| 10.50 | | Restructuring Agreement dated as of December 21, 2010, by and among TOGM, LLC, West Receivables Services, Inc. and West Receivables Purchasing, LLC** |
| | |
Exhibit Number | | Description |
| |
| 10.51 | | Form of Indemnification Agreement between West Corporation and its directors and officers (incorporated by reference to Exhibit 10.01 to Form 10-Q dated May 7, 2010) |
| |
| 21.01 | | Subsidiaries** |
| |
| 31.01 | | Certification pursuant to 18 U.S.C. section 7241 as adopted pursuant to section 302 of the Sarbanes-Oxley Act of 2002** |
| |
| 31.02 | | Certification pursuant to 18 U.S.C. section 7241 as adopted pursuant to section 302 of the Sarbanes-Oxley Act of 2002** |
| |
| 32.01 | | Certification pursuant to 18 U.S.C. section 1350 as adopted pursuant to section 906 of the Sarbanes-Oxley Act of 2002** |
| |
| 32.02 | | Certification pursuant to 18 U.S.C. section 1350 as adopted pursuant to section 906 of the Sarbanes-Oxley Act of 2002** |
| (1) | Indicates management contract or compensation plan or arrangement. |