United States
Securities And Exchange Commission
Washington, D.C. 20549
FORM N-CSR
CERTIFIED SHAREHOLDER REPORT OF REGISTERED MANAGEMENT
INVESTMENT COMPANIES
| Investment Company Act file number | 811-8061 |
| Diamond Hill Funds |
| (Exact name of registrant as specified in charter) |
| | | | |
| 325 John H. McConnell Boulevard, Suite 200, Columbus, Ohio 43215 |
| (Address of principal executive offices) (Zip code) |
| | | | |
| James F. Laird, 325 John H. McConnell Boulevard, Suite 200, Columbus, Ohio 43215 |
| (Name and address of agent for service) |
| Registrant's telephone number, including area code: | | (614) 255-3333 |
| Date of fiscal year end: | 12/31 | |
| | | |
| Date of reporting period: | 12/31/06 | |
Form N-CSR is to be used by management investment companies to file reports with the Commission not later than 10 days after the transmission to stockholders of any report that is required to be transmitted to stockholders under Rule 30e-1 under the Investment Company Act of 1940 (17 CFR 270.30e-1). The Commission may use the information provided on Form N-CSR in its regulatory, disclosure review, inspection and policymaking roles.
A registrant is required to disclose the information specified by Form N-CSR, and the Commission will make this information public. A registrant is not required to respond to the collection of information contained in Form N-CSR unless the Form displays a currently valid Office of Management and Budget ("OMB") control number. Please direct comments concerning the accuracy of the information collection burden estimate and any suggestions for reducing the burden to Secretary, Securities and Exchange Commission, Washington, DC 20549-0102. The OMB has reviewed this collection of information under the clearance requirements of 44 U.S.C. § 3507.
Item 1. Reports to Stockholders.
Diamond Hill Funds Annual Report
| ANNUAL REPORT | |
| December 31, 2006 | |
SMALL CAP FUND (Closed to new investors.)
SMALL-MID CAP FUND
LARGE CAP FUND
SELECT FUND
LONG-SHORT FUND
FINANCIAL LONG-SHORT FUND
STRATEGIC INCOME FUND
Not FDIC Insured May Lose Value | No Bank Guarantee |
This material must be preceded or accompanied by a current prospectus.
Table of Contents
| Letter to Shareholders | 1 |
| Mission Statement, Pledge, and Fundamental Principles | 3 |
| Special Investment Letter - The Rouge et Noir Hedge Fund | 5 |
| Management Discussion of Fund Performance | |
| Diamond Hill Small Cap Fund | 7 |
| Diamond Hill Small-Mid Cap Fund | 10 |
| Diamond Hill Large Cap Fund | 13 |
| Diamond Hill Select Fund | 15 |
| Diamond Hill Long-Short Fund | 17 |
| Diamond Hill Financial Long-Short Fund | 19 |
| Diamond Hill Strategic Income Fund | 21 |
| Financial Statements | |
| Schedules of Investments | 23 |
| Statements of Assets & Liabilities | 35 |
| Statements of Operations | 37 |
| Statements of Changes in Net Assets | 38 |
| Schedule of Capital Share Transactions | 40 |
| Financial Highlights | 41 |
| Notes to Financial Statements | 48 |
| Report of Independent Registered Public Accounting Firm | 54 |
| Other Items | 55 |
| Schedule of Shareholder Expenses | 56 |
| Management of the Trust | 58 |
CAUTIONARY STATEMENT
At Diamond Hill, we pledge that, “we will communicate with our clients about our investment performance in a manner that will allow them to properly assess whether we are deserving of their trust.” Our views and opinions regarding the investment prospects of our portfolio holdings and Funds are “forward looking statements” which may or may not be accurate over the long term. While we believe we have a reasonable basis for our opinions, actual results may differ materially from those we anticipate. Information provided in this report should not be considered a recommendation to purchase or sell any particular security.
You can identify forward looking statements by words like “believe,” “expect,” “anticipate,” or similar expressions when discussing prospects for particular portfolio holdings and/or one of the Funds. We cannot assure future results. You should not place undue reliance on forward-looking statements, which speak only as of the date of this report. We disclaim any obligation to update or alter any forward-looking statements, whether as a result of new information, future events, or otherwise. This material is not authorized for distribution to prospective investors unless preceded or accompanied by a Prospectus. Please read the Prospectus carefully for a discussion of fees, expenses, and risks. Current performance may be lower or higher than that quoted herein. You may obtain a current copy of the Prospectus or more current performance information by calling 1-888-226-5595 or at Diamond Hill’s website (www.diamond-hill.com).
Dear fellow shareholders:
We are pleased to provide this 2006 year-end update for the Diamond Hill Funds. We appreciate the confidence that you have placed in us, and assure you that we are constantly guided by our fiduciary duties to you.
The following table summarizes the performance of the Diamond Hill Class A shares relative to their benchmarks as of December 31, 2006:
| | | | | | | | | | |
| | | | | Total Return | | | | | |
| | | | | Three | | Six | | One | | Three | | Five | | | | | |
| | | | | Months | | Months | | Year | | Years | | Years | | | | | |
| | | NAV | | Ended | | Ended | | Ended | | Ended | | Ended | | Since | | Inception | |
| Fund Name | | 12/31/06 | | 12/31/06 | | 12/31/06 | | 12/31/06 | | 12/31/06 | | 12/31/06 | | Inception | | Date | |
| | | | | | | | | | | | | | | | | | |
| Small Cap Fund (DHSCX) | | $ | 25.03 | | | 8.66 | % | | 3.57 | % | | 7.03 | % | | 16.03 | % | | 16.57 | % | | 17.99 | % | | 12/29/00 | |
| Russell 2000 | | | | | | 8.90 | % | | 9.38 | % | | 18.37 | % | | 13.56 | % | | 11.39 | % | | 9.83 | % | | | |
| | | | | | | | | | | | | | | | | | | | | | | | | | |
| Small-Mid Cap Fund | | $ | 10.91 | | | 8.19 | % | | 4.78 | % | | 9.81 | % | | NA | | | NA | | | 9.81 | % | | 12/31/05 | |
| Russell 2500 | | | | | | | % | | | % | | | % | | | | | | | | 16.17 | % | | | |
| | | | | | | | | | | | | | | | | | | | | | | | | | |
| Large Cap Fund (DHLAX) | | $ | 16.36 | | | 8.17 | % | | 9.60 | % | | 15.06 | % | | 17.43 | % | | 11.11 | % | | 10.17 | % | | 6/29/01 | |
| Russell 1000 | | | | | | 6.95 | % | | 12.36 | % | | 15.46 | % | | 10.98 | % | | 6.82 | % | | 4.58 | % | | | |
| | | | | | | | | | | | | | | | | | | | | | | | | | |
| Select Fund | | $ | 11.17 | | | 9.40 | % | | 8.46 | % | | 13.66 | % | | NA | | | NA | | | 13.66 | % | | 12/31/05 | |
| Russell 3000 | | | | | | | % | | | | | | % | | | | | | | | 15.72 | % | | | |
| | | | | | | | | | | | | | | | | | | | | | | | | | |
| Long-Short Fund (DIAMX) | | $ | 18.57 | | | 8.88 | % | | 8.82 | % | | 16.89 | % | | 18.38 | % | | 12.81 | % | | 11.09 | % | | 6/30/00 | |
| Russell 1000 | | | | | | 6.95 | % | | 12.36 | % | | 15.46 | % | | 10.98 | % | | 6.82 | % | | 1.67 | % | | | |
| Russell 3000 | | | | | | 7.12 | % | | 12.11 | % | | 15.72 | % | | 11.19 | % | | 7.17 | % | | 2.13 | % | | | |
| | | | | | | | | | | | | | | | | | | | | | | | | | |
| Financial Long-Short Fund (BANCX) | | $ | 20.90 | | | 5.25 | % | | 10.55 | % | | 16.35 | % | | 10.82 | % | | 16.51 | % | | 13.40 | % | | 8/1/97 | |
| S&P Supercomposite Financials(A) | | | | | | | % | | | % | | | % | | | % | | | % | | 8.48 | % | | | |
| NASDAQ Bank Index | | | | | | | % | | | % | | | % | | | % | | | % | | 10.03 | % | | | |
| | | | | | | | | | | | | | | | | | | | | | | | | | |
| Strategic Income Fund (DSIAX) | | $ | 11.71 | | | 3.85 | % | | 7.12 | % | | 10.26 | % | | 6.67 | % | | NA | | | 10.53 | % | | 9/30/02 | |
| Merril Lynch Domestic Master Index | | | | | | 1.23 | % | | 5.14 | % | | 4.32 | % | | 3.73 | % | | NA | | | 3.98 | % | | | |
Source: Diamond Hill Funds, Bloomberg LP and Frank Russell Company
Returns are shown without sales charges but include all other expenses. Returns greater than one year are annualized.
| (A) | Returns for the S&P Supercomposite Financials are price change only before November 29, 2001 and total return thereafter. |
Equity Funds and Markets
The major U.S. equity markets enjoyed returns in 2006 that were above long-term averages; with the S&P 500 and the Russell 1000 having total returns approaching 16%. This performance is at odds with our previously stated opinion that returns in this decade might be below historical returns, and comfortably below the returns in recent decades. It’s worth noting that since the beginning of this decade, broad market returns have indeed been significantly below long-term averages and in many cases, below the returns on cash. As much of this sub-par performance has been a result of the large cap stocks working off the valuation excesses that were built up in the late 1990’s, it’s not a recurring headwind. With the likelihood that going forward returns on large cap stocks are driven more by earnings than by P/E multiple contraction, market returns should improve from the levels of the past seven years. Only time will tell if it’s enough to make up for the performance so far in this decade.
The performance of our equity funds in 2006 was mixed. On the long only side, while our funds trailed their respective benchmarks, absolute returns were positive, led by Large Cap which returned over 15%. On the long-short side, relative returns were mixed, but absolute returns were solid, with Long-Short and Financial Long-Short earning returns in excess of 16%. As you may well know, our time horizon for investment decision making is 5 years. When evaluated over the last 5 years, our funds continue to exceed our performance objectives. Obviously our Select and Small-Mid Cap strategies do not have 5 year track records, and they run the risk of being judged on short-term results. Given our long-term orientation, evaluating any investment, whether it is a stock or a mutual fund, over a short time horizon, is something we would discourage.
Diamond Hill Funds Annual Report December 31, 2006
| Diamond Hill Funds Annual Report December 31, 2006 | Page 1 |
When thinking about what drives the market, several variables come to mind - earnings, inflation, interest rates, and valuation. In hindsight, one might be surprised by the performance of the equity market in 2006. During the year, the Federal Reserve raised short term rates by 100 basis points (equals one percentage point). Interest rates rose across the maturity spectrum, with short rates ending the year above long-term rates. Inflation expectations, while volatile, generally fell during the year. At the end of 2005, the broad market as measured by the S&P 500 was trading at 16.3x 2005 earnings, not excessive, but not a screaming bargain. At the moment, the S&P 500 is trading at 16.2x estimated 2006 earnings. So, while the negative valuation impact of higher rates was somewhat muted by lower inflation, the real kicker in 2006 was earnings growth. The market basically priced in the increase in earnings without much of a change in P-E. Over the past 5 years, earnings have grown at a compounded annual rate of nearly 18%. The key question looking forward is what will happen with fundamentals, especially earnings. For a variety of reasons, it would seem that the pace of earnings growth experienced over the past 5 years is not sustainable. If we are correct, stock selection will become even more important. This should play to one of our organizational strengths, as we invest on the basis of what we think about the future, not the past.
Our experience has taught us that investment managers are often defined by how they respond to adversity. We have often observed that stock prices are more volatile than intrinsic value, but not all managers have the temperament to stick to their research conclusions when the market disagrees with them. We remain singularly focused on investing with a long-term time horizon in businesses with growing intrinsic values when we can make that investment with an appropriate margin of safety.
Strategic Income Fund and Fixed Income Markets
During the first half of 2006, the Federal Reserve raised the federal funds rate 25 basis points per meeting from 4.25% to 5.25%. During the second half of 2006, the Federal Reserve was on hold as the economy slowed and core inflation stabilized. The 2-year Treasury yield began the year at 4.39%, reached 5.16% at the end of June, and closed the year at 4.81%. On those dates, the 10-year Treasury yield was 4.37%, 5.16%, and 4.70%.
While it is a little early to declare victory, it seems likely that the Federal Reserve has contained inflation without doing serious damage to the economy. It is remarkable that the 10-year Treasury yield and the BBB credit spread were both little changed between June 30, 2004 and December 31, 2006 as the Fed raised the federal funds rate from 1% to 5.25%. Based on history, with the federal funds rate at 5.25%, we would expect a 10-year Treasury yield of close to 6% or higher rather than 4.8%, unless the economy was headed into recession. More than anticipating a dramatically weaker economy, we believe that the low 10-year Treasury yield is a function of such factors as the glut of global savings in emerging market countries, soft demand for credit by businesses in developed countries, diminished volatility of global economic growth, and lower and less volatile global inflation. These same factors may also lead to a more muted credit cycle. In addition, while the trends for business and consumer health are likely to deteriorate, they are starting from historically strong levels. Our conclusion is that the long end of the Treasury curve is not particularly attractive and it is still worthwhile to search for pockets of value in the corporate bond and preferred markets.
Thank you again for your trust in the Diamond Hill Funds. As always, we will work hard to continue to earn it. Best wishes for 2007.
Diamond Hill Capital Management, Inc.
Investment Team
| /s/ Ric Dillon | /s/ Charles S. Bath | /s/ Kent A. Rinker |
| Ric Dillon, CFA | Charles S. Bath, CFA | Kent A. Rinker |
| | | |
| | | |
| /s/ Christopher M. Bingaman | /s/ Thomas P. Schindler | /s/ Chris Welch |
| Christopher M. Bingaman, CFA | Thomas P. Schindler, CFA | Chris Welch, CFA |
| | | |
| | | |
| /s/ William Zox | /s/ Richard Moore | /s/ William C. Dierker |
| William Zox, CFA, J.D., LL.M. | Richard Moore, CFA | William C. Dierker, CFA |
| | | |
| | | |
| /s/ Jason Downey | /s/ Bhavik Kothari | /s/ Suken D. Patel |
| Jason Downey, CFA | Bhavik Kothari, CFA | Suken D. Patel |
| Page 2 | Diamond Hill Funds Annual Report December 31, 2006 |
Mission Statement, Pledge
and Fundamental Principles
Mission | Our mission is to build and preserve wealth through a disciplined intrinsic value approach, independent thinking and aligning our interests with those of our clients. |
| | |
| | • Disciplined intrinsic value approach - taking a stake in a company as an owner or a lender, possessing the proper long-term investment temperament and seeking investments selling at a discount to a growing intrinsic value. |
| | |
| | • Independent thinking - intellectual curiosity, healthy skepticism and confidence in decisions that may be contrary to the norm. |
| | |
| | “You are neither right nor wrong because the crowd disagrees with you. You are right because your data and reasoning are right” |
| | - Benjamin Graham |
| | |
| | • Aligning our interests - mindful of our fiduciary duties to clients, all of our Portfolio Managers are significant investors in the same portfolios in which our clients invest. |
| | |
Pledge | Consistent with our mission, we make the following pledge to all of our clients: |
| | |
| | Our investment discipline is to assess the economics of the underlying business, its management, and the price that must be paid to own a piece of it. We seek to concentrate our investments in businesses that are available at prices below intrinsic value and are managed or controlled by trustworthy and capable people. Benjamin Graham pioneered this discipline during the 1930s and many others have practiced it with great success ever since, most notably Warren Buffett. |
| | |
| | We will communicate with our clients about our investment performance in a manner that will allow them to properly assess whether we are deserving of their trust. |
| | |
| | Our investment team will be comprised of people with integrity, sound experience and education, in combination with a strong work ethic and independence of thought. Especially important is that each possesses the highest level of character, business ethics and professionalism. |
| | |
| | Our employees will enjoy a working environment that supports professional and personal growth, thereby enhancing employee satisfaction, the productivity of the firm and the experience of our clients. |
| | |
| | We will invest the capital you entrust to us with the same care that we invest our own capital. To this end, Diamond Hill employees and affiliates are significant investors in the same portfolios in which our clients invest, and are collectively the largest shareholders in the Diamond Hill Funds. In addition, all Diamond Hill employees are subject to a Code of Ethics, which states that all personal investments must be made in a Diamond Hill fund, unless approved by our Chief Compliance Officer. |
| | |
Fundamental Principles - Equity | • Every share of stock has an intrinsic value that is independent of its current stock market price. We believe that we can determine a reasonable approximation of that intrinsic value in some cases. At any point in time, the stock market price may be either significantly higher or lower than intrinsic value. |
| | |
| | • Over short periods of time, as evidenced by extreme stock market volatility, the stock market price is heavily influenced by the emotions of market participants, which are far more difficult to predict than intrinsic value. While stock market prices may experience extreme fluctuations on a particular day, we believe intrinsic value is far less volatile. |
| | |
| | • Over sufficiently long periods of time, five years and longer, the stock market price tends to revert to intrinsic value. |
| Diamond Hill Funds Annual Report December 31, 2006 | Page 3 |
| | • We concentrate our investments in businesses whose per share intrinsic value is likely to grow. To achieve this, we assess the underlying economics of the businesses in which we invest and the industries and markets in which they participate. We seek to invest in businesses that possess a competitive advantage and significant growth prospects as well as outstanding managers and employees. |
| | |
| • We only invest in a business when the stock market price is lower than our conservative assessment of per share intrinsic value. In addition, every business in which we invest is “handicapped” by its price. While we would prefer to own only great businesses with superior managers, there are very few businesses that satisfy those criteria and additionally are available at attractive prices. As a result, we may invest in less attractive businesses at more than attractive prices. Depending on the price that we pay, our returns from less than ideal businesses may be even better than our returns from ideal businesses. |
| | |
| • In estimating intrinsic value, we use an interdisciplinary approach. Not only do we perform financial modeling including discounted cash flow, private market value, and leveraged buyout analyses, we draw from other areas we believe are relevant to our investment decision-making. These include economics, statistics and probability theory, politics, psychology, and consumer behavior. In short, we do not want to exclude from our thinking anything that can help us forecast future cash flows, our most important as well as most difficult job. |
| | |
| • We intend to achieve our return from both the closing of the gap between our purchase price and intrinsic value and the growth in per share intrinsic value. |
| | |
| • We do not define risk by price volatility. We define risk as the possibility that we are unable to obtain the return of the capital that we invest as well as a reasonable return on that capital when we need the capital for other purposes. If you will need the capital that you entrust to us in less than five years, then you should not invest that capital in the stock market. |
| |
Fundamental Principles - Fixed Income | • Our primary goal is to generate a yield greater than the current rate of inflation without bearing undue credit or interest rate risk. However, we cannot guarantee any specific yield. |
| | |
| • A flexible approach allows us to invest in both investment grade and non-investment grade corporate bonds as well as preferred securities, real estate investment trusts, master limited partnerships, and closed end funds. We can also invest in securities issued by the U.S. government and its agencies when conditions warrant. |
| | |
| • We balance our income objective with a focus on total return. Over the next five years, our objective is to earn equity-like returns in the income markets with lower year-to-year volatility and, more importantly, a much lower risk of permanent loss of capital. |
| Page 4 | Diamond Hill Funds Annual Report December 31, 2006 |
Special Investment Letter -
“The Rouge et Noir Hedge Fund”
I am fortunate to have come from a family that introduced me to investing at a young age. My brother shared that background, and we continue to spend considerable time discussing various investment and economic topics. He works for a large financial institution helping to manage their fixed income portfolio; however his interests are broad, and I often bounce investment issues off him as they relate to the equity markets. Several years ago, we were discussing some issues related to hedge fund investing. He sent me a hypothetical “hedge fund proposal”, which has broad implications in the world of professional investing. The following is his “proposal”:
I propose to manage a $1,024,000 hedge fund, promising to return about 0.89% per month with "no risk". I will invest the proceeds in cash to earn about 0.5% per month. In addition, each month I will do the following: I will bet $4,000 on black at a single-zero roulette wheel. If I win, I sit on the beach the rest of the month. If I lose, I double up. If I win that bet, my hard work for the month is over. If I lose that one, I double up again, and so forth. I will end up ahead by $4,000 each month unless I lose 8 bets in a row. The probability of winning at least one bet each month before going bankrupt is 1-(19/37)^8, or .9952. My probability, therefore, after 5 years of showing a history of returning 0.89% each and every month is .9952^60, or about 74.8%. At that time, I go to investors to market my track record and receive a few hundred million dollars to manage and take fees. Any interested investors?
Obviously, this is silly (and does not consider the effect of management fees), but it seems there may be some parallels to the real world of hedge fund investing. If I'm managing a hedge fund and I've promised stable monthly returns, what happens when my strategy blows up, even if that means a 2% down month rather than a 1% up month that I've promised? Do I "go to the casino" on the last day of the month and take bets to get me up to 1% for the month, with maybe a 96% chance of success (making 3)% but a 4% chance of losing everything? How do we know if a hedge fund has not done this?
This is not intended to be any slam on hedge fund investing. Obviously, there have been some hugely successful hedge funds. I'm just trying to raise an issue (in hopefully an amusing way).
The discussion is directed toward hedge fund investing, but I think its implications are much broader. His proposal uses a casino analogy to highlight some of the agency risks in hedge fund investing. It is the nature of the hedge fund fee structure to encourage the taking of unusual risks which can confuse the client. Risks which are low probability but high severity are difficult for anyone, particularly outsiders, to measure. It can be a profitable strategy for a hedge fund to take large risks, which are unlikely to be realized, in an attempt to earn small incremental returns in order to earn large performance fees. The roulette example highlights this risk, but in many ways, it was this type of risk that doomed the Long Term Capital Management hedge fund in the late 1990’s. They took large, but unlikely, risks through massive leverage to earn relatively small incremental returns. When the strategy backfired (the large but “unlikely” risks worked against them), the fund shareholders were left with huge losses.
Of course, the agency risk is not limited to hedge funds; it is an important concern for mutual fund investors as well. The roulette example is, in my mind, also analogous to the momentum market so prevalent in the late 1990’s. Investors made large investments when price became separated from value, in an attempt to keep pace with the momentum market. They did not realize they were taking ever larger risks for ever smaller incremental returns because, for a while, the strategy worked. However, eventually value prevailed and prices plummeted. In many ways, this is the risk we see with momentum investing, and why our investment decisions are always grounded in our valuation-based approach. Momentum investing can work for a long period of time and may fool investors into believing the strategy is generating excess returns. The problem is, when momentum investing stops working, the losses can be substantial. To us, it makes no sense to make any investment without first comparing price to value.
| Diamond Hill Funds Annual Report December 31, 2006 | Page 5 |
As always, our valuation driven approach requires a long-term perspective, and that is a point we are constantly emphasizing to our clients. In the short term, our approach may be to avoid what appear to be exciting areas of investment, because we see the risks as too great compared to the return opportunities. Those time periods are never fun, but they have happened in the past and will happen again in the future. But that is the nature of long-term valuation-based investing. We are constantly evaluating not just the potential return but the risk as well. Some risks are obvious. Hopefully this discussion helps investors to understand that other risks are difficult to discern but are still very real.
At Diamond Hill Investments, we are very focused on the risk/reward tradeoff in our investment decisions, and, while we will make mistakes, it will not be due to perverse incentives to take unwarranted risks. We manage our portfolios with the shareholders perspective, so we will not put business decisions ahead of fiduciary decisions.
/s/ Charles S. (Chuck) Bath
Charles S. (Chuck) Bath, CFA
| Page 6 | Diamond Hill Funds Annual Report December 31, 2006 |
Diamond Hill Small Cap Fund |
Performance Update |
Results (Class A) Since Inception*
| | | | | | | Since | |
| | | Year | | Five Years | | 12/29/00 | |
| | | Ended 12/31/06 | | Ended 12/31/06 | | Inception | |
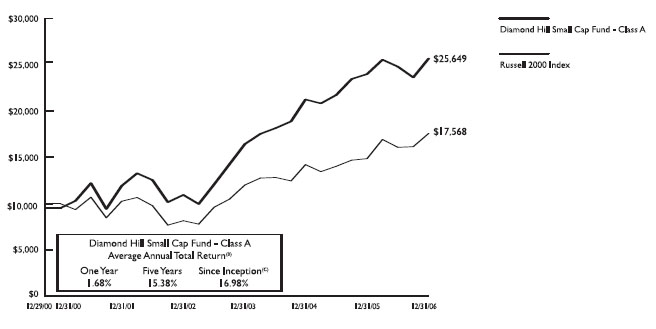
| Diamond Hill Small Cap Fund (DHSCX) | | | 7.03 | % | | 16.57 | % | | 17.99 | % |
| Russell 2000 Index | | | 18.37 | % | | 11.39 | % | | 9.83 | % |
| * | The Fund return excludes any sales charges but includes all other expenses. Standardized returns are disclosed on the following page. Results longer than one year are annualized. |
The Diamond Hill Small Cap Fund returned 7.03% in 2006, lagging well behind the Russell 2000 return of 18.37%. This absolute return is below our long-term expectation for the Fund, while the return for the Russell 2000 Index is far above our long-term expectation for the index. The Fund has now completed six calendar years, and 2006 represents the first calendar year the Fund has failed to exceed the index. We continue to emphasize five-year time frames over which to evaluate performance. The first five years proved satisfactory on both an absolute and relative return basis. However, after significantly underperforming the index this past year, we recognize that we must play “catch up” over the subsequent four years to achieve a similar relative victory in the second five years. The Fund closed to new investors at the end of 2005 and net flows have been fairly steady over the second half of the year.
The Fund began the year with approximately 29% of net assets held in cash or cash-like securities and ended the year with approximately 13% of the same. While the cash lowers the risk profile of the Fund, the returns generated from cash served as a material drag on relative performance in the year. This was especially true in the first quarter of the year when the Russell 2000 Index increased markedly. In this interest rate environment, one difficult judgment has been to decide what constitutes a suitable return for owning a particular small cap equity security (the required rate of return). In the first half of the year, the Fed continued its campaign to bring short-term rates back to some “neutral” level, during which the yield curve flattened and then inverted.
While energy sector investments contributed meaningfully to returns in 2004 and 2005, they were an area of disappointment in 2006. The price of natural gas fell for most of the year, with volatile intermittent swings, from its post Hurricane Katrina highs achieved in the fourth quarter of 2005. Demand for natural gas in the U.S. was negatively impacted by a warmer than normal winter. This led to a situation of storage exceeding historic norms, pressuring the commodity price downward. Oil ended the year at a price about where it began, also with much volatility. The winter heating season in the U.S. again got off to a sluggish start as December was warmer than normal. Our longer-term view remains that a tight supply-demand balance, especially in world oil markets, will likely lead to average commodity prices that are in excess of the prices implied by current energy-related equity prices. Two of our larger positions experienced declines in 2006. Cimarex (a 3.7% position on 12/31/2006) and Encore Acquisition (3.4)% both experienced slight production challenges, and the stock prices declined approximately 15% and 23%, respectively. In addition, drilling equipment company Helmerich & Payne (3.0)% declined about 20%. Faring better were Lufkin Industries (1.1)% and Whiting Petroleum (3.2)%, each of which nearly matched the index return. Berry Petroleum (2.6)% and Tidewater (0.9)% registered positive returns, but trailed the index.
In basic materials, James River Coal (0.3)% was a major disappointment, as the combination of warmer winter weather, which reduced coal demand, and new safety regulations pressuring production costs, led to a collapse in profitability. James River declined approximately 75%, making it the biggest negative contributor to Fund performance. Newsprint maker Bowater also declined approximately 30% before it was sold. Century Aluminum (1.3)%, Buckeye Technologies (1.2)%, and Martin Marietta (1.0)% all materially outperformed the index.
| Diamond Hill Funds Annual Report December 31, 2006 | Page 7 |
For the most part, our holdings in the financial sector performed well during 2006. However, relative to the index, we had a much lower percentage of the portfolio dedicated to the sector. The sector was an area of increased investment, particularly in the latter part of the year. The Fund ended the year with approximately 15% of net assets invested in the financial sector, up from about 6% at the beginning of the year.
In the consumer and industrial sectors, stock performance varied greatly. In airlines, a successful investment in US Airways culminated when we sold the remainder of our position after US Airways announced a takeover offer for Delta. While we could envision potential upside if the merger comes to fruition, we elected to sell our position at a substantial profit. Offsetting this success, both Airtran (2.6)% and Frontier Airlines (0.4)% declined. Industrial companies Lincoln Electric (1.0)%, Kaydon (1.2)%, and Trinity Industries (1.8)% all appreciated 20% or more. Security concern The Brink’s Company (1.8)% increased 34%, spa operator Steiner Leisure (1.4)% increased 28%, and athletic footwear and apparel company K-Swiss (1.5)%, purchased during the year, was up 20% from our average cost. Decliners include media company Belo (1.7)% down 12%, retailer Finish Line (2.1)% down 17%, and Gevity HR (1.5)% down 7%.
Thank you for your support, and we look forward to working with you in the coming years.
| /s/ R. H. Dillon | /s/ Thomas P. Schindler |
| R. H. Dillon, CFA | Thomas P. Schindler, CFA |
| Co-Portfolio Manager | Co-Portfolio Manager |
| Page 8 | Diamond Hill Funds Annual Report December 31, 2006 |
Comparison of the Change in Value of a $10,000 Investment in the Diamond Hill Small Cap Fund - Class A(A) and the Russell 2000 Index
| (A) | The chart above represents the performance of Class A shares only, which will vary from the performance of Class C and Class I shares based on the difference in loads and fees paid by shareholders in the different classes. |
| (B) | The average annual total returns shown above are adjusted for maximum applicable sales charge of 5.00%. |
| (C) | Class A shares commenced operations on December 29, 2000. |
Past performance is no guarantee of future results. The principal value and investment return of an investment will fluctuate so that an investor's shares, when redeemed, may be worth more or less than their original cost.
The performance of the above Fund does not reflect the deduction of taxes that a shareholder would pay on Fund distributions or the redemption of Fund shares.
Tabular Presentation of Schedule of Investments |
The table below provides the Small Cap Fund's sector allocation. We hope it will be useful to shareholders as it summarizes key information about the Fund's investments.
Sector Allocation | % of Net Assets |
| Consumer Discretionary | 19% | |
| Consumer Staples | 2% | |
| Energy | 21% | |
| Financial | 15% | |
| Health Care | 3% | |
| Industrial | 17% | |
| Information Technology | 3% | |
| Materials | 4% | |
| Utilities | 3% | |
| Cash and Cash Equivalents | 13% | |
| 100% | |
| Diamond Hill Funds Annual Report December 31, 2006 | Page 9 |
| |
Diamond Hill Small-Mid Cap Fund |
Performance Update |
Results (Class A) Since Inception*
| | | | | Since | |
| | | Year | | 12/31/05 | |
| | | Ended 12/31/06 | | Inception | |
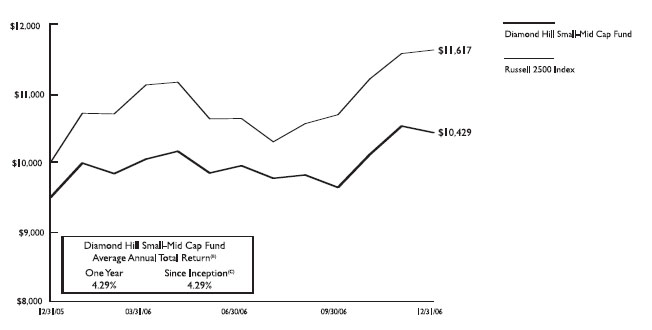
| Diamond Hill Small-Mid Cap Fund | | | 9.81 | % | | 9.81 | % |
| Russell 2500 Index | | | 16.17 | % | | 16.17 | % |
| * | The Fund return excludes any sales charges but includes all other expenses. Standard returns are disclosed on the following page. |
The Diamond Hill Small-Mid Cap Fund returned 9.81% in 2006. While this figure represents an adequate absolute return for investing in equities, it trailed the 16.17% return of the Russell 2500 Index. At Diamond Hill we emphasize that we feel the most appropriate time frame over which to measure our performance is five years. However, we recognize that to achieve above-average long-term returns, by definition we must have some subset of above-average returns over shorter time horizons, despite maintaining the long-term focus. As such, we are disappointed in our 2006 results relative to the benchmark, but continue to work toward delivering strong results over a five-year horizon.
One factor contributing to the Fund trailing its benchmark was our decision to maintain a sizable portion of assets in cash throughout much of the year. Early in the year this was in part related to new cash flows coming in as a sizable portion of existing assets, given the Fund’s small size at launch. As the year went on, however, the primary driver of the 15-20% cash position was our difficulty in finding opportunities that we felt were trading at significant discounts to our estimate of intrinsic value. We define risk as the permanent loss of capital, and therefore we will continue to only invest in opportunities where we feel we have an adequate margin of safety.
Our energy sector investments were an area of disappointment in 2006. While we had some notable successes, including Energen (a 1.0% position on 12/31/2006) and Noble Energy (2.7)%, on average our energy investments were flat to slightly down (in a stock market that rose double-digits). Production challenges at two of our largest holdings, Cimarex Energy (3.5)% and Encore Acquisition (3.3)%, held the stocks back. James River Coal (0.2)% was a major disappointment, as the combination of warmer winter weather, which reduced coal demand, and new safety regulations pressuring production costs, led to a collapse in profitability. The entire energy sector was hit during the third quarter by falling oil and gas prices, combined with the fallout of the Amaranth hedge fund collapse due to their failed bet on higher natural gas prices. We maintain the view that a tight supply-demand balance in world oil markets, in particular, should support oil prices over the next five years that are higher on average than the assumed prices built into the valuations of our stock holdings. Our energy sector weight at year end was 19.0%.
On the plus side, a number of individual holdings generated returns above 30% over the entire year, including Lincoln Electric (0.6)%, Martin Marietta Materials (1.1)% and The Brink’s Company (1.1)%. Additionally, the financial sector produced solid returns, with 1st Source (0.7)%, Assurant (0.6)% and Hanmi Financial (0.6)% all returning greater than 25% for the year.
Like all segments of the stock market, the small and mid-cap areas showed plenty of volatility in 2006. For example, home oxygen supplier Apria Healthcare Group’s (1.0)% stock fell over 25% by midyear, only to jump over 50% from its low, to end the year up 10%. Similarly, the stock of Noble Energy (2.7)% showed a 9.7% loss year-to-date on June 13, but had appreciated nearly 50% to be up 35.7% by mid-December, and ended the year with a 22.5% gain. Our investment approach includes assessing whether any current news leads us to change our intrinsic value estimate, but maintaining a strict long-term focus when assembling those estimates. While we anticipate that our time horizon should lead to a relatively low rate of portfolio turnover, we will continue to take advantage of what we perceive to be short-term “noise” in the market to add to or reduce our holdings, so long as our intrinsic value estimates support those actions.
| Page 10 | Diamond Hill Funds Annual Report December 31, 2006 |
Thank you for your support, and we look forward to working with you in the coming years.
| /s/ Christopher M. Bingaman | /s/ Thomas P. Schindler | /s/ Christopher A. Welch | |
| Christopher M. Bingaman, CFA | Thomas P. Schindler, CFA | Christopher A. Welch, CFA | |
| Co-Portfolio Manager | Co-Portfolio Manager | Co-Portfolio Manager | |
| Diamond Hill Funds Annual Report December 31, 2006 | Page 11 |
Comparison of the Change in Value of a $10,000 Investment in the Diamond Hill Small-Mid Cap Fund - Class A(A) and the Russell 2500 Index
| (A) | The chart above represents the performance of Class A shares only, which will vary from the performance of Class C and Class I shares based on the difference in loads and fees paid by shareholders in the different classes. |
| (B) | The average annual total returns shown above are adjusted for maximum applicable sales charge of 5.00%. |
| (C) | Class A shares commenced operations on December 31, 2005. |
| | Past performance is no guarantee of future results. The principal value and investment return of an investment will fluctuate so that an investor's shares, when redeemed, may be worth more or less than their original cost. |
| | The performance of the above Fund does not reflect the deduction of taxes that a shareholder would pay on Fund distributions or the redemption of Fund shares. |
| Tabular Presentation of Schedule of Investments |
The table below provides the Small-Mid Cap Fund's sector allocation. We hope it will be useful to shareholders as it summarizes key information about the Fund's investments.
Sector Allocation | % of Net Assets |
| Consumer Discretionary | 15% | |
| Consumer Staples | 2% | |
| Energy | 19% | |
| Financial | 14% | |
| Health Care | 2% | |
| Industrial | 17% | |
| Information Technology | 3% | |
| Materials | 5% | |
| Utilities | 4% | |
| Cash and Cash Equivalents | 19% | |
| | 100% | |
| Page 12 | Diamond Hill Funds Annual Report December 31, 2006 |
Diamond Hill Large Cap Fund |
| Performance Update |
Results (Class A) Since Inception* |
| | | | | | | Since | |
| | | Year | | Five Years | | 6/29/01 | |
| | | Ended 12/31/06 | | Ended 12/31/06 | | Inception | |
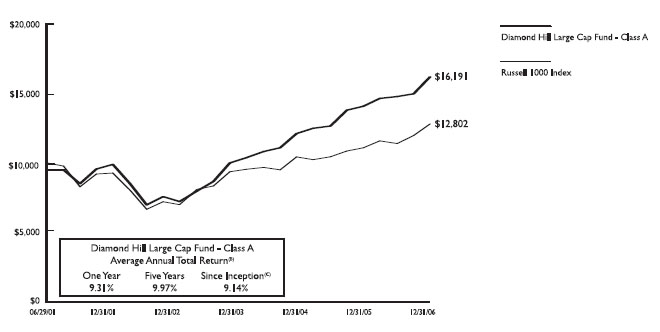
| Diamond Hill Large Cap Fund (DHLAX) | | | 15.06 | % | | 11.11 | % | | 10.17 | % |
| Russell 1000 Index | | | 15.46 | % | | 6.82 | % | | 4.58 | % |
| * | The Fund return excludes any sales charges but includes all other expenses. Standardized returns are disclosed on the following page. Results longer than one year are annualized. |
The Diamond Hill Large Cap Fund returned 15.06% in 2006 compared to 15.46% for the Russell 1000. I am pleased with the long-term performance of the Fund in both relative and absolute terms. The market rallied strongly in the second half of the year gaining back all the losses incurred in 2nd quarter.
Entering 2006 we had major investments in the energy sector which we maintained throughout most of the year. However, we eliminated the position in Anadarko Petroleum in the 4th quarter. The large acquisition they made in 2006 strained the balance sheet and increased the risk to shareholders. Companies such as ConocoPhillips (a 4.7% position on 12/31/2006) and Devon Energy (4.9)% were very important in providing favorable returns in 2006 and remain large holdings in the Fund.
Throughout the year, the Fund maintained large holdings in other commodity stocks as well. Phelps Dodge (0.3)% was a large holding we added to the Fund in 2004 and it was the biggest contributor to Fund performance in 2006. This was a gratifying investment and I significantly decreased our position in Phelps Dodge due to price appreciation resulting from the Freeport-McMoRan takeover offer.
U.S. Bancorp (3.0)% was a significant contributor to the Fund as the financial sector was the top sector contributor to the Fund. A number of financial stocks were added to the Fund during the year, including American International
Group (3.6)%, Merrill Lynch (1.5)%, Bank of New York (1.3)% and Citigroup (2.3)%. With strong potential earnings growth and solid dividend payments, their valuations look attractive with little downside risk.
Generally, I have continued to avoid technology holdings in the Fund. However, I did add Microsoft (1.8)%, Advanced Micro Devices (1.8)% and Lexmark (2.1)% to the Fund during the year as their valuations looked inexpensive.
I want to thank shareholders for their continued support. I hope to be working with you for many years to come.
/s/ Charles S. Bath
Charles S. Bath, CFA
Portfolio Manager
| Diamond Hill Funds Annual Report December 31, 2006 | Page 13 |
Comparison of the Change in Value of a $10,000 Investment in the Diamond Hill Large Cap Fund - Class A(A) and the Russell 1000 Index
| (A) | The chart above represents the performance of Class A shares only, which will vary from the performance of Class C and Class I shares based on the difference in loads and fees paid by shareholders in the different classes. |
| (B) | The average annual total returns shown above are adjusted for maximum applicable sales charge of 5.00%. |
| (C) | Class A shares commenced operations on June 29, 2001. |
Past performance is no guarantee of future results. The principal value and investment return of an investment will fluctuate so that an investor's shares, when redeemed, may be worth more or less than their original cost.
The performance of the above Fund does not reflect the deduction of taxes that a shareholder would pay on Fund distributions or the redemption of Fund shares.
Tabular Presentation of Schedule of Investments |
The table below provides the Large Cap Fund's sector allocation. We hope it will be useful to shareholders as it summarizes key information about the Fund's investments.
Sector Allocation | % of Net Assets |
| Consumer Discretionary | 12% | |
| Consumer Staples | 6% | |
| Energy | 17% | |
| Financial | 18% | |
| Health Care | 9% | |
| Industrial | 8% | |
| Information Technology | 6% | |
| Materials | 7% | |
| Telecommunications | 1% | |
| Utilities | 3% | |
| Cash and Cash Equivalents | 13% | |
| | 100% | |
| Page 14 | Diamond Hill Funds Annual Report December 31, 2006 |
Results (Class A) Since Inception*
| | | | | Since | |
| | | Year | | 12/31/05 | |
| | | Ended 12/31/06 | | Inception | |
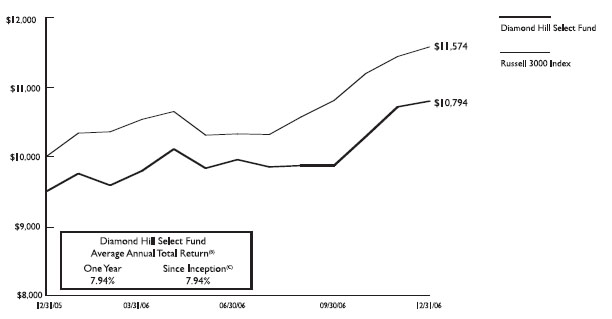
| Diamond Hill Select Fund | | | 13.66 | % | | 13.66 | % |
| Russell 3000 Index | | | 15.72 | % | | 15.72 | % |
* The Fund return excludes any sales charges but includes all other expenses. Standard returns are disclosed on the following page.
The inaugural year for the Select Fund was mixed. While the Fund did generate a 13.66% absolute return, which exceeded our expectations at the start of the year, it trailed the benchmark Russell 3000 Index return of 15.71%. It’s important to consider the fact that the positions in Select are drawn from our Small Cap, Small-Mid Cap, and Large Cap funds which had total returns in 2006 of 7.03%, 9.81% and 15.06%, respectively.
Obviously, our Select strategy does not have a 5 year track record, and it runs the risk of being judged on short-term results. Given our long-term orientation, evaluating any investment, whether it is a stock or a mutual fund, over a short time horizon, is something we would discourage.
Select is a concentrated fund reflecting what we feel are the best ideas from the underlying funds. Our intent is to amplify the impact of our best ideas. In 2006, some of these ideas were disappointing, and impacted the performance of the Fund.
Key performances in the Fund during 2006 included Phelps Dodge (a 0.3% position on 12/31/2006) which agreed to be acquired by Freeport McMoRan Copper & Gold late in the year. McDonald’s (3.6)% continued to drive same store sales while improving margins and cash flow. After trading down mid-year on concerns about higher costs to compete with Google and other Internet firms, Microsoft (3.2)% stock rebounded sharply on the expectation that growth from Windows Vista and Xbox 360, as well as general cost controls, would offset any margin pressure.
U.S. Bancorp (3.7)% which continued to execute well on the business front and continued to return capital to shareholders in the form of share repurchases and dividends.
Key detractors from performance in 2006 included James River Coal (0.3)%, which faced the duel pressures of much warmer than normal winter weather which decreased utility demand for coal, as well as higher costs following new federal and state safety regulations following multiple competitor mining accidents a year ago. AirTran (1.7)% was disappointing as well, as the company reduced its planned capacity growth rate for 2007 and 2008 as unit revenues were disappointing during the second half of 2006 due to increased competitive capacity along the East Coast. Cimarex Energy (2.6)% was affected by an inventory overhang in natural gas storage, due to a warmer than normal winter in 2006, and company specific operational setbacks. Advanced Micro Devices (1.6)% made progress with their first ever sales through Dell, but pricing pressure from Intel challenged results during the second half of the year. UnitedHealth Group (2.5)% suffered from disclosure that stock options had been backdated at the company. This ultimately resulted in the departure of long time CEO William McGuire.
The Select Fund team remains focused on investing with a long term time horizon in businesses with a growing intrinsic value and an appropriate margin of safety.
I would like to thank our shareholders for their continued support of the Fund.
| /s/ R. H. Dillon | /s/ William C. Dierker | /s/ Charles S. Bath | |
| R. H. Dillon, CFA | William C. Dierker, CFA | Charles S. Bath, CFA | |
| Co-Portfolio Manager | Co-Portfolio Manager | Co-Portfolio Manager | |
| Diamond Hill Funds Annual Report December 31, 2006 | Page 15 |
Comparison of the Change in Value of a $10,000 Investment in the Diamond Hill Select Fund - Class A(A) and the Russell 3000 Index
| (A) | The chart above represents the performance of Class A shares only, which will vary from the performance of Class C and Class I shares based on the difference in loads and fees paid by shareholders in the different classes. |
| (B) | The average annual total returns shown above are adjusted for maximum applicable sales charge of 5.00%. |
| (C) | Class A shares commenced operations on December 31, 2005. |
Past performance is no guarantee of future results. The principal value and investment return of an investment will fluctuate so that an investor's shares, when redeemed, may be worth more or less than their original cost.
The performance of the above Fund does not reflect the deduction of taxes that a shareholder would pay on Fund distributions or the redemption of Fund shares.
Tabular Presentation of Schedule of Investments |
The table below provides the Select Fund's sector allocation. We hope it will be useful to shareholders as it summarizes key information about the Fund's investments.
Sector Allocation | % of Net Assets |
| Consumer Discretionary | 12% | |
| Consumer Staples | 5% | |
| Energy | 19% | |
| Financial | 13% | |
| Health Care | 8% | |
| Industrial | 12% | |
| Information Technology | 8% | |
| Materials | 8% | |
| Telecommunications | 1% | |
| Utilities | 4% | |
| Cash and Cash Equivalents | 10% | |
| | 100% | |
| Page 16 | Diamond Hill Funds Annual Report December 31, 2006 |
Diamond Hill Long-Short Fund |
Results (Class A) Since Inception*
| | | | | | | Since | |
| | | Year | | Five Years | | 6/30/00 | |
| | | Ended 12/31/06 | | Ended 12/31/06 | | Inception | |
| Diamond Hill Long-Short Fund (DIAMX) | | | 16.89 | % | | 12.81 | % | | 11.09 | % |
| Russell 1000 Index** | | | 15.46 | % | | 6.82 | % | | 1.68 | % |
| Russell 3000 Index | | | 15.72 | % | | 7.17 | % | | 2.13 | % |
| * | The Fund return excludes any sales charges but includes all other expenses. Standardized returns are disclosed on the following page. Results longer than one year are annualized. |
| ** | Effective 12/31/06, the benchmark was changed to the Russell 1000 Index as a better representation of the market capitalization of securities held. |
The Diamond Hill Long-Short Fund returned 16.89% in 2006 compared to 15.46% for the Russell 1000 and 15.72% for the Russell 3000. We are pleased with the performance of the Fund in both relative and absolute terms. The performance was driven by strong performance in both the long and short positions with our consumer discretionary shorts leading the way.
Entering 2006, we had major investments in the energy sector which we maintained throughout most of the year. However, we eliminated the position in Anadarko Petroleum in the 4th quarter. The large acquisition they made in 2006 strained the balance sheet and increased the risk to shareholders. Companies such as ConocoPhillips (a 4.7% position on 12/31/2006) and Devon Energy (4.7)% were very important in providing favorable returns in 2006 and remain large holdings in the Fund.
Throughout the year, the Fund maintained large holdings in other commodity stocks as well. Phelps Dodge (0.3)% was a large holding we added to the Fund in 2004 and it was the biggest contributor to Fund performance in 2006. This was a gratifying investment and we significantly decreased our position in Phelps Dodge due to price appreciation resulting from the Freeport-McMoRan takeover offer.
McDonald’s (3.8)% is a large new holding in the portfolio which was a significant contributor to the performance of the Fund. McDonald’s is a well-run, high-quality company that is using its cash wisely through shares buybacks and raising its dividends. The company reduced the number of outstanding shares in a tax efficient way through the Chipotle spin-off and they have been remodeling U.S. stores instead of building more units.
The performance of the short portfolio was driven by gains in Apollo Group, Yahoo and other consumer discretionary stocks. Apollo is an education company whose shares were highly valued but faces a slowdown at the company and in the industry. Yahoo is struggling with competitive issues in the industry and those problems do not yet appear to be fully reflected in the stock price. These short positions are still in the portfolio as of year-end.
We want to thank shareholders for their support in 2006. We look forward to working with you in the years ahead.
| /s/ R.H. Dillon | /s/ Charles S. Bath |
| R.H. Dillon, CFA | Charles S. Bath, CFA |
| Co-Portfolio Manger | Co-Portfolio Manager |
| Diamond Hill Funds Annual Report December 31, 2006 | Page 17 |
Comparison of the Change in Value of a $10,000 Investment in the Diamond Hill Long-Short Fund - Class A(A), the Russell 1000 Index and the Russell 3000 Index
| (A) | The chart above represents the performance of Class A shares only, which will vary from the performance of Class C and Class I shares based on the difference in loads and fees paid by shareholders in the different classes. |
| (B) | The average annual total returns shown above are adjusted for maximum applicable sales charge of 5.00%. |
| (C) | Class A shares commenced operations on June 30, 2000. |
| (D) | Effective 12/31/06, the benchmark was changed to the Russell 1000 Index as a better representation of the market capitalization of securities held. |
Past performance is no guarantee of future results. The principal value and investment return of an investment will fluctuate so that an investor’s shares, when redeemed, may be worth more or less than their original cost.
The performance of the above Fund does not reflect the deduction of taxes that a shareholder would pay on Fund distributions or the redemption of Fund shares.
Tabular Presentation of Schedule of Investments |
The table below provides the Long-Short Fund's sector allocation. We hope it will be useful to shareholders as it summarizes key information about the Fund's investments.
| | % of Long | % of Net |
Sector Allocation | Portfolio | Assets |
Long Portfolio | | |
| Consumer Discretionary | 14% | 14% |
| Consumer Staples | 3% | 3% |
| Energy | 19% | 18% |
| Financial | 12% | 12% |
| Health Care | 8% | 8% |
| Industrial | 9% | 9% |
| Information Technology | 7% | 7% |
| Materials | 6% | 6% |
| Telecommunications | 1% | 1% |
| Utilities | 3% | 3% |
| Cash & Cash Equivalents | 18% | 17% |
| | 100% | |
| | % of Short | % of Net |
Sector Allocation | Portfolio | Assets |
Short Portfolio | | |
| Consumer Discretionary | 39% | -14% |
| Consumer Staples | 7% | -2% |
| Finance | 1% | -1% |
| Health Care | 8% | -3% |
| Industrial | 7% | -2% |
| Information Technology | 28% | -10% |
| Utilities | 1% | 0% |
| Exchange Traded Funds | 9% | -3% |
| | 100% | |
| | | |
Other | | |
| Segregated Cash with Brokers | | 37% |
| | | 100% |
| Page 18 | Diamond Hill Funds Annual Report December 31, 2006 |
Diamond Hill Financial Long-Short Fund |
Results (Class A) Since Inception*
| | | | | | | Since | |
| | | Year | | Five Years | | 8/1/97 | |
| | | Ended 12/31/06 | | Ended 12/31/06 | | Inception | |
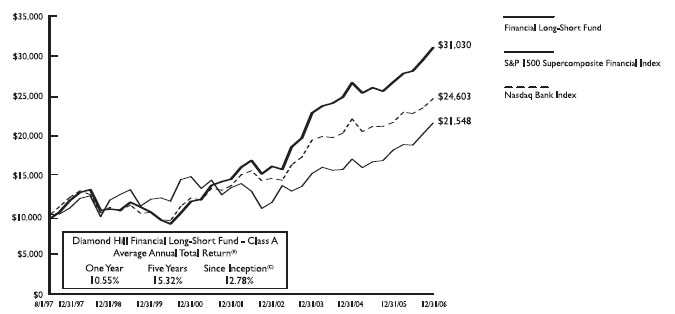
| Diamond Hill Financial Long-Short Fund (BANCX) | | | 16.35 | % | | 16.51 | % | | 13.40 | % |
| S&P SuperComposite 1500 Financial Index | | | 18.92 | % | | 9.99 | % | | 8.48 | % |
| NASDAQ Bank Index | | | 13.82 | % | | 12.54 | % | | 10.03 | % |
| * | The Fund return excludes any sales charges but includes all other expenses. Standardized returns are disclosed on the following page. Results longer than one year are annualized. |
Thank you for your interest in the Diamond Hill Financial Long-Short Fund.
The Diamond Hill Financial Long-Short Fund generated a total return of 16.35% for the year. Much like the Fund, equity indices in the U.S. were solidly in positive territory for the year. The S&P 500 index recorded a total return for the year of 15.79%, while the S&P 1500 Financials performed even better and posted a total return of 18.92%. The NASDAQ Bank index (which is generally indicative of the performance of small cap banks and thrifts) recorded a total return of 13.82%. In similar fashion to 2005, the performance of the financial sector across the market cap spectrum was mostly balanced with large cap financials performing in line with or even slightly better than small caps. Overall, I would characterize the performance of the Fund in 2006 as very satisfactory especially on a risk adjusted basis. I add the qualifier due to the addition of short positions to the portfolio as well as the meaningful cash position which was maintained throughout the year and especially during the fourth quarter. In other words, the Fund generally kept pace with its long-only benchmarks (as well as the overall equity markets) in a strong up year with considerably less net long exposure. Finally, as we frequently communicate to both current and prospective investors, we judge ourselves based on long-term returns (rolling five year periods) and on that front I am quite pleased with that result at the end of calendar 2006.
Notable positive contributors to the Fund’s performance in 2006 were Merrill Lynch (a 3.4% position on 12/31/2006), U.S. Bancorp (3.8)%, Bank of New York/Mellon (3.3)% and Morgan Stanley (2.6)%. These companies provided total returns for the year in the 20%-40% range. I mentioned Bank of New York and Mellon together as they are now intending to merge during the second quarter of 2007. As shareholders of both companies, we were pleased with the announcement of the transaction and believe both sets of shareholder have and will benefit from the proposed combination. This was the only significant merger agreement among our holdings during 2006. I do expect continued consolidation within the banking and thrift industries during the current year as fundamentals continue to be challenging while valuations still appear to be rather healthy. As one might expect from looking at the portfolio, I continue to see the most attractive risk reward situations in the large cap area of the sector and in companies that have significant revenues from non spread based sources.
As in the past, we continue to believe shareholders in the Fund will benefit from a relatively concentrated portfolio. We typically hold between 30 and 40 stocks with an average position size of roughly 3%. Also, as many of you already know, we have elected to maintain the portfolio as a long-short fund for the foreseeable future. We do not intend to do this as a ‘hedge’ to mitigate our long exposure/volatility, but instead as a way to enhance our performance over time. Finally, we continually strive to maintain our disciplined process of evaluating both the fundamentals and valuations of our current and prospective investments.
I would like to thank our shareholders for their continued support of the Fund.
/s/ Christopher M. Bingaman
Christopher M. Bingaman, CFA
Portfolio Manager
| Diamond Hill Funds Annual Report December 31, 2006 | Page 19 |
Comparison of the Change in Value of a $10,000 Investment in the Diamond Hill Financial Long-Short Fund - Class A(A), the S&P SuperComposite 1500 Financial Index and the NASDAQ Bank Index
| (A) | The chart above represents the performance of Class A shares only, which will vary from the performance of Class C shares based on the difference in loads and fees paid by shareholders in the different classes. |
| (B) | The average annual total returns shown above are adjusted for maximum applicable sales charge of 5.00%. |
| (C) | Class A shares commenced operations on August 1, 1997. |
Past performance is no guarantee of future results. The principal value and investment return of an investment will fluctuate so that an investor’s shares, when redeemed, may be worth more or less than their original cost.
The performance of the above Fund does not reflect the deduction of taxes that a shareholder would pay on Fund distributions or the redemption of Fund shares.
Tabular Presentation of Schedule of Investments |
The table below provides the Financial Long-Short Fund's sector allocation. We hope it will be useful to shareholders as it summarizes key information about the Fund's investments.
| | % of Long | % of Net |
Sector Allocation | Portfolio | Assets |
Long Portfolio | | |
| Common Stocks: | | |
| Finance - Banks & Thrifts | 33% | 33% |
| Finance - Broker Dealer | 6% | 6% |
| Finance - Diversified | 8% | 8% |
| Finance - Specialties | 6% | 6% |
Insurance | 13% | 13% |
| Real Estate Investment Trust | 1% | 1% |
| Cash & Cash Equivalents | 29% | 30% |
| Preferred Stocks: | | |
| Finance | 2% | 2% |
| Real Estate Investment Trust | 2% | 2% |
| | 100% | |
| | % of Short | % of Net |
Sector Allocation | Portfolio | Assets |
Short Portfolio | | |
| Commons Stocks: | | |
| Finance - Banks & Thrifts | 85% | -8% |
| Information Technology | 15% | -2% |
| | 100% | |
Other | | |
| Segregated Cash with Brokers | 9% |
| | | 100% |
| Page 20 | Diamond Hill Funds Annual Report December 31, 2006 |
Diamond Hill Strategic Income Fund |
Performance Update |
Results (Class A) Since Inception*
| | | | | Since | |
| | | Year | | 9/30/02 | |
| | | Ended 12/31/06 | | Inception | |
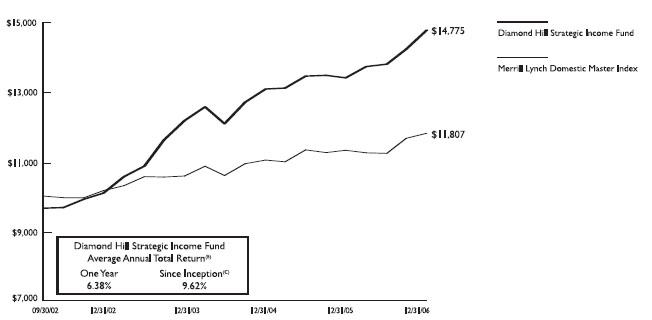
| Diamond Hill Strategic Income Fund (DSIAX) | | | 10.26 | % | | 10.53 | % |
| Merrill Lynch Domestic Master Index | | | 4.32 | % | | 3.98 | % |
| * | The Fund return excludes any sales charges but includes all other expenses. Standardized returns are disclosed on the following page. Results longer than one year are annualized. |
The Diamond Hill Strategic Income Fund generated a total return of 10.26% for 2006. During the first half of 2006, the Federal Reserve raised the federal funds rate 25 basis points per meeting from 4.25% to 5.25%. During the second half of 2006, the Federal Reserve was on hold as the economy slowed and core inflation stabilized. The 2-year Treasury yield began the year at 4.39%, reached 5.16% at the end of June, and closed the year at 4.81%. On those dates, the 10-year Treasury yield was 4.37%, 5.16%, and 4.70%. The Merrill Lynch Domestic Master Index produced a negative total return of 78 basis points for the first half of the year, a positive total return of 5.15% for the second half of the year, and a positive 4.32% for the entire year.
We benefited from three structural advantages that we expect to continue to add value over rolling three-to-five year periods. First, we do not manage the portfolio relative to any benchmark. Rather, we search for value in all classes of income producing securities regardless of whether they are in any index. For example, preferred securities, which are not in any of the broad fixed income indices, produced high single digit total returns during 2006. Preferred securities represented over 40% of the Fund throughout 2006.
Second, we have a three-to-five year time horizon that affords us the patience to hold undervalued securities until their value is recognized in the markets. General Motors Acceptance Corporation (a 3.4% position on 12/31/2006) debt was extremely volatile during 2005 as it was downgraded from investment grade to below investment grade status. The near term outlook for the price of GMAC debt was impossible to predict but the long term outlook was favorable if you were comfortable that GMAC would not be subject to the liabilities of General Motors and that General Motors would successfully sell a majority interest in GMAC. In 2006, GMAC debt performed well as General Motors sold a controlling interest in GMAC.
Finally, we invest a portion of the portfolio in high yielding equity securities with yields well in excess of long government bonds with the reasonable prospect of growth of the cash distributions over time at a rate equal to or greater than inflation. The long term risk-reward tradeoff of these securities seems much more favorable to us than long government bonds at current levels. Our high yielding equity securities were significant contributors to 2006 performance with total returns well over 20%.
During the last half of 2006, we gained confidence that the Federal Reserve would be able to contain inflation without doing serious damage to the economy. At the same time, the long end of the Treasury curve rallied to a level where we no longer found rates to be attractive. As a result, over the course of 2006, our exposure to corporate bonds and preferred securities increased by about 11 percentage points and our exposure to government bonds decreased by about 14 percentage points. While corporate bonds and preferred securities are generally fully valued, we have been able to uncover pockets of value that, in our view, offer a better risk-reward proposition than the government bond market.
Thank you for your support, and we look forward to working with you in the coming years.
/s/ Kent Rinker | /s/ William Zox | /s/ Rick Moore |
| Kent Rinker | William Zox, CFA, J.D., LL.M. | Rick Moore, CFA |
| Co-Portfolio Manager | Co-Portfolio Manager | Investment Analyst |
| Diamond Hill Funds Annual Report December 31, 2006 | Page 21 |
Comparison of the Change in Value of a $10,000 Investment in the Diamond Hill Strategic Income Fund - Class A(A) and the Merrill Lynch Domestic Master Index
| (A) | The chart above represents the performance of Class A shares only, which will vary from the performance of Class C and Class I shares based on the difference in loads and fees paid by shareholders in the different classes. |
| (B) | The total return shown above is adjusted for maximum applicable sales charge of 3.50%. |
| (C) | Class A shares commenced operations on September 30, 2002. |
Past performance is no guarantee of future results. The principal value and investment return of an investment will fluctuate so that an investor’s shares, when redeemed, may be worth more or less than their original cost.
The performance of the above Fund does not reflect the deduction of taxes that a shareholder would pay on Fund distributions or the redemption of Fund shares.
Tabular Presentation of Schedule of Investments |
The table below provides the Strategic Income Fund's sector allocation. We hope it will be useful to shareholders as it summarizes key information about the Fund's investments.
Sector Allocation | % of Net Assets |
| Master Limited Partnerships | 10% | |
| REIT Common Stock | 3% | |
| REIT Preferred Stock | 14% | |
| Trust Preferred Stock | 30% | |
| Collateralized Debt Obligations | 3% | |
| Corporate Bonds - Maturing > 2 Years | 15% | |
| Corporate Bonds - Maturing or | | |
| Likely to Be Called < 2 Years | 4% | |
| U.S. Government or Agency Securities | 14% | |
| Cash and Cash Equivalents | 7% | |
| | 100% | |
| Page 22 | Diamond Hill Funds Annual Report December 31, 2006 |
Diamond Hill Small Cap Fund
Schedule of Investments
December 31, 2006
| | | | | Market | |
| | | Shares | | Value | |
| | | | | | | | |
Common Stocks — 87.2% | | | | | | | |
Consumer Discretionary — 19.0% | | | | | | | |
| Aaron Rents, Inc. | | | 319,700 | | $ | 9,200,966 | |
| American Greetings Corp. | | | 580,000 | | | 13,844,600 | |
| Belo Corp. | | | 475,000 | | | 8,730,500 | |
| Brink's Co., The | | | 145,000 | | | 9,268,400 | |
| Callaway Golf Co. | | | 650,000 | | | 9,366,500 | |
| Finish Line, Inc., The | | | 745,000 | | | 10,638,600 | |
| K-Swiss, Inc. | | | 248,956 | | | 7,652,907 | |
| MoneyGram International, Inc. | | | 270,000 | | | 8,467,200 | |
| Polaris Industries, Inc. | | | 117,250 | | | 5,490,818 | |
| Steiner Leisure Ltd.* | | | 165,000 | | | 7,507,500 | |
| Tuesday Morning Corp. | | | 180,600 | | | 2,808,330 | |
| United Auto Group, Inc. | | | 240,000 | | | 5,656,800 | |
| | | | | | | 98,633,121 | |
| | | | | | | | |
Consumer Staples — 1.9% | | | | | | | |
| Del Monte Foods Co. | | | 475,000 | | | 5,239,250 | |
| Flowers Foods, Inc. | | | 167,867 | | | 4,530,730 | |
| | | | | | | 9,769,980 | |
| | | | | | | | |
Energy — 20.7% | | | | | | | |
| Berry Petroleum Co. | | | 426,800 | | | 13,235,068 | |
| Cimarex Energy Co. | | | 525,000 | | | 19,162,500 | |
| Encore Acquisition Co.* | | | 727,060 | | | 17,834,782 | |
| Helmerich & Payne, Inc. | | | 631,300 | | | 15,447,911 | |
| Hornbeck Offshore Services, Inc.* | | | 234,150 | | | 8,359,155 | |
| James River Coal Co.* | | | 157,000 | | | 1,456,960 | |
| Lufkin Industries, Inc. | | | 95,000 | | | 5,517,600 | |
| Southwestern Energy Co.* | | | 141,600 | | | 4,963,080 | |
| Tidewater, Inc. | | | 100,000 | | | 4,836,000 | |
| Whiting Petroleum Corp.* | | | 351,400 | | | 16,375,240 | |
| | | | | | | 107,188,296 | |
| | | | | | | | |
Financial — 15.1% | | | | | | | |
| 1st Source Corp. | | | 157,773 | | | 5,069,246 | |
| Capital Corp. of the West | | | 170,000 | | | 5,455,300 | |
| Centennial Bank Holdings, Inc.* | | | 685,000 | | | 6,480,100 | |
| Eagle Hospitality Properties Trust, Inc. | | | 501,700 | | | 4,605,606 | |
| First State Bancorp | | | 325,610 | | | 8,058,848 | |
| Hanmi Financial Corp. | | | 200,000 | | | 4,506,000 | |
| Hanover Insurance Group | | | 135,000 | | | 6,588,000 | |
| ITLA Capital Corp. | | | 121,606 | | | 7,042,203 | |
| MAF Bancorp, Inc. | | | 170,450 | | | 7,617,411 | |
| Summit Bank Corp. | | | 66,767 | | | 1,621,770 | |
| Taylor Capital Group, Inc. | | | 125,000 | | | 4,576,250 | |
| UCBH Holdings, Inc. | | | 371,425 | | | 6,522,223 | |
| United Fire & Casualty Co. | | | 278,400 | | | 9,813,600 | |
| | | | | | | 77,956,557 | |
| | | | | | | | |
Health Care — 2.7% | | | | | | | |
| Analogic Corp. | | | 150,900 | | | 8,471,526 | |
| Apria Healthcare Group, Inc.* | | | 209,135 | | | 5,573,448 | |
| | | | | | | 14,044,974 | |
| | | | | | | | |
Industrial — 17.3% | | | | | | | |
| Acco Brands Corp.* | | | 500,000 | | | 13,235,000 | |
| AirTran Holdings, Inc.* | | | 1,165,000 | | | 13,677,100 | |
| Apogee Enterprises, Inc. | | | 155,000 | | | 2,993,050 | |
| Frontier Airlines Holdings, Inc.* | | | 310,600 | | | 2,298,440 | |
| Greenbrier Companies, Inc., The | | | 260,000 | | | 7,800,000 | |
| Griffon Corp.* | | | 100,000 | | | 2,550,000 | |
| Kaydon Corp. | | | 150,000 | | | 5,961,000 | |
| Lincoln Electric Holdings, Inc. | | | 82,500 | | | 4,984,650 | |
| Toro Co., The | | | 177,800 | | | 8,290,814 | |
| Trinity Industries, Inc. | | | 262,500 | | | 9,240,000 | |
| Washington Group International, Inc. | | | 101,572 | | | 6,072,990 | |
| Werner Enterprises, Inc. | | | 718,600 | | | 12,561,128 | |
| | | | | | | 89,664,172 | |
| | | | | | | | |
Information Technology — 3.1% | | | | | | | |
| Gevity HR, Inc. | | | 325,000 | | | 7,699,250 | |
| QAD, Inc. | | | 450,000 | | | 3,775,500 | |
| TriZetto Group, Inc., The* | | | 246,400 | | | 4,526,368 | |
| | | | | | | 16,001,118 | |
| | | | | | | | |
Materials — 4.0% | | | | | | | |
| Buckeye Technologies, Inc.* | | | 535,425 | | | 6,414,392 | |
| Century Aluminum Co.* | | | 203,300 | | | 9,077,345 | |
| Martin Marietta Materials, Inc. | | | 50,000 | | | 5,195,500 | |
| | | | | | | 20,687,237 | |
| | | | | | | | |
Utilities — 3.4% | | | | | | | |
| UGI Corp. | | | 243,200 | | | 6,634,496 | |
| WPS Resources Corp. | | | 200,000 | | | 10,806,000 | |
| | | | | | | 17,440,496 | |
| | | | | | | | |
Total Common Stocks | | | | | $ | 451,385,951 | |
| Diamond Hill Funds Annual Report December 31, 2006 | Page 23 |
Diamond Hill Small Cap Fund
Schedule of Investments (Continued)
December 31, 2006
| | | | | Market | |
| | | Shares | | Value | |
| | | | | | | | |
Registered Investment Companies — 12.7% | | | | | | | |
| First American Prime | | | | | | | |
| Obligations Fund - Class Z | | | 65,795,649 | | $ | 65,795,649 | |
| | | | | | | | |
Total Investment Securities — 99.9% | | | | | | | |
| (Cost $473,346,474)** | | | | | $ | 517,181,600 | |
| | | | | | | | |
Other Assets In Excess | | | | | | | |
Of Liabilities — 0.1% | | | | | | 758,458 | |
| | | | | | | | |
Net Assets — 100.0% | | | | | $ | 517,940,058 | |
| * | Non-income producing security. |
| ** | Represents cost for financial reporting purposes. |
See accompanying Notes to Financial Statements.
Diamond Hill Small-Mid Cap Fund
Schedule of Investments
December 31, 2006
| | | | | | | Market | |
| | | | | | | Value | |
| | | | | | | | |
Common Stocks — 80.7% | | | | | | | |
Consumer Discretionary — 15.0% | | | | | | | |
| Aaron Rents, Inc. | | | 13,900 | | $ | 400,042 | |
| American Greetings Corp. | | | 16,500 | | | 393,855 | |
| Belo Corp. | | | 21,400 | | | 393,332 | |
| Black & Decker Corp., The | | | 6,600 | | | 527,802 | |
| Brink's Co., The | | | 4,050 | | | 258,876 | |
| Callaway Golf Co. | | | 20,700 | | | 298,287 | |
| Finish Line, Inc., The | | | 26,600 | | | 379,848 | |
| K-Swiss, Inc. | | | 11,000 | | | 338,140 | |
| MoneyGram International, Inc. | | | 5,000 | | | 156,800 | |
| Polaris Industries, Inc. | | | 4,900 | | | 229,467 | |
| United Auto Group, Inc. | | | 9,200 | | | 216,844 | |
| | | | | | | 3,593,293 | |
| | | | | | | | |
Consumer Staples — 1.9% | | | | | | | |
| Del Monte Foods Co. | | | 22,600 | | | 249,278 | |
| Flowers Foods, Inc. | | | 7,775 | | | 209,847 | |
| | | | | | | 459,125 | |
| | | | | | | | |
Energy — 19.0% | | | | | | | |
| Berry Petroleum Co. | | | 9,700 | | | 300,797 | |
| Cimarex Energy Co. | | | 23,100 | | | 843,150 | |
| Encore Acquisition Co.* | | | 32,400 | | | 794,772 | |
| Helmerich & Payne, Inc. | | | 18,800 | | | 460,036 | |
| Hornbeck Offshore Services, Inc.* | | | 8,600 | | | 307,020 | |
| James River Coal Co.* | | | 6,400 | | | 59,392 | |
| Lufkin Industries, Inc. | | | 2,300 | | | 133,584 | |
| Noble Energy, Inc. | | | 13,100 | | | 642,817 | |
| Southwestern Energy Co.* | | | 6,900 | | | 241,845 | |
| Tidewater, Inc. | | | 3,200 | | | 154,752 | |
| Whiting Petroleum Corp.* | | | 13,000 | | | 605,800 | |
| | | | | | | 4,543,965 | |
| | | | | | | | |
Financial — 13.4% | | | | | | | |
| 1st Source Corp. | | | 5,000 | | | 160,650 | |
| Assurant, Inc. | | | 2,700 | | | 149,175 | |
| Centennial Bank Holdings, Inc.* | | | 19,000 | | | 179,740 | |
| Comerica, Inc. | | | 7,100 | | | 416,628 | |
| First Horizon National Corp. | | | 7,700 | | | 321,706 | |
| Hanmi Financial Corp. | | | 6,800 | | | 153,204 | |
| Hanover Insurance Group | | | 4,600 | | | 224,480 | |
| MAF Bancorp, Inc. | | | 6,600 | | | 294,954 | |
| Page 24 | Diamond Hill Funds Annual Report December 31, 2006 |
Diamond Hill Small-Mid Cap Fund
Schedule of Investments (Continued)
December 31, 2006
| | | | | Market | |
| | | Shares | | Value | |
| | | | | | | | |
Common Stocks — 80.7% | | | | | | | |
Financial — 13.4% continued | | | | | | | |
| Sky Financial Group, Inc. | | | 8,500 | | $ | 242,590 | |
| Sovereign Bancorp, Inc. | | | 12,200 | | | 309,758 | |
| Summit Bank Corp. | | | 3,910 | | | 94,974 | |
| UCBH Holdings, Inc. | | | 14,000 | | | 245,840 | |
| United Fire & Casualty Co. | | | 11,500 | | | 405,375 | |
| | | | | | | 3,199,074 | |
| | | | | | | | |
Health Care — 2.2% | | | | | | | |
| Analogic Corp. | | | 5,200 | | | 291,928 | |
| Apria Healthcare Group, Inc.* | | | 9,275 | | | 247,179 | |
| | | | | | | 539,107 | |
| | | | | | | | |
Industrial — 17.2% | | | | | | | |
| Acco Brands Corp.* | | | 26,500 | | | 701,455 | |
| AirTran Holdings, Inc.* | | | 50,700 | | | 595,218 | |
| Dover Corp. | | | 4,900 | | | 240,198 | |
| Fluor Corp. | | | 7,000 | | | 571,550 | |
| Kaydon Corp. | | | 2,700 | | | 107,298 | |
| Lincoln Electric Holdings, Inc. | | | 2,200 | | | 132,924 | |
| Parker Hannifin Corp. | | | 1,700 | | | 130,696 | |
| Pentair, Inc. | | | 3,300 | | | 103,620 | |
| Toro Co., The* | | | 7,700 | | | 359,051 | |
| Trinity Industries, Inc. | | | 12,600 | | | 443,520 | |
| Washington Group International, Inc. | | | 3,200 | | | 191,328 | |
| Werner Enterprises, Inc. | | | 31,790 | | | 555,689 | |
| | | | | | | 4,132,547 | |
| | | | | | | | |
Information Technology — 3.3% | | | | | | | |
| Advanced Micro Devices, Inc.* | | | 18,800 | | | 382,580 | |
| Gevity HR, Inc. | | | 10,900 | | | 258,221 | |
| TriZetto Group, Inc., The* | | | 7,800 | | | 143,286 | |
| | | | | | | 784,087 | |
| | | | | | | | |
Materials — 5.3% | | | | | | | |
| Century Aluminum Co.* | | | 6,200 | | | 276,830 | |
| Lyondell Chemical Co. | | | 9,100 | | | 232,687 | |
| Martin Marietta Materials, Inc. | | | 2,600 | | | 270,166 | |
| MeadWestvaco Corp. | | | 16,200 | | | 486,972 | |
| | | | | | | 1,266,655 | |
| | | | | | | | |
Utilities — 3.4% | | | | | | | |
| Energen Corp. | | | 5,100 | | | 239,394 | |
| UGI Corp. | | | 6,200 | | | 169,136 | |
| WPS Resources Corp. | | | 7,600 | | | 410,628 | |
| | | | | | | 819,158 | |
| | | | | | | | |
Total Common Stocks | | | | | $ | 19,337,011 | |
| | | | | | | | |
Registered Investment Companies — 19.3% | | | | | | | |
| First American Prime | | | | | | | |
| Obligations Fund - Class Z 4,630,329 | | | | | $ | 4,630,329 | |
| | | | | | | | |
Total Investment Securities — 100.0% | | | | | | | |
| (Cost $23,054,868)** | | | | | $ | 23,967,340 | |
| | | | | | | | |
Liabilities In Excess | | | | | | | |
Of Other Assets — 0.0% | | | | | | (4,991 | ) |
| | | | | | | | |
Net Assets — 100.0% | | | | | $ | 23,962,349 | |
| * | Non-income producing security. |
| ** | Represents cost for financial reporting purposes. |
See accompanying Notes to Financial Statements.
| Diamond Hill Funds Annual Report December 31, 2006 | Page 25 |
Diamond Hill Large Cap Fund
Schedule of Investments
December 31, 2006
| | | | | Market | |
| | | Shares | | Value | |
| | | | | | | | |
Common Stocks — 86.0% | | | | | | | |
Consumer Discretionary — 11.7% | | | | | | | |
| Black & Decker Corp., The | | | 91,350 | | $ | 7,305,260 | |
| Brink's Co., The | | | 62,854 | | | 4,017,628 | |
| Fortune Brands, Inc. | | | 113,600 | | | 9,700,303 | |
| Gannett Co., Inc. | | | 136,700 | | | 8,264,882 | |
| Hanesbrands, Inc.* | | | 46,793 | | | 1,105,251 | |
| McDonald’s Corp. | | | 365,650 | | | 16,209,264 | |
| MoneyGram International, Inc. | | | 79,300 | | | 2,486,848 | |
| | | | | | | 49,089,436 | |
| | | | | | | | |
Consumer Staples — 6.3% | | | | | | | |
| Archer-Daniels-Midland Co. | | | 117,620 | | | 3,759,135 | |
| General Mills, Inc. | | | 71,050 | | | 4,092,480 | |
| Kimberly-Clark Corp. | | | 130,485 | | | 8,866,456 | |
| Sara Lee Corp. | | | 577,915 | | | 9,841,892 | |
| | | | | | | 26,559,963 | |
| | | | | | | | |
Energy — 16.6% | | | | | | | |
| Apache Corp. | | | 283,900 | | | 18,882,189 | |
| ConocoPhillips | | | 275,500 | | | 19,822,225 | |
| Devon Energy Corp. | | | 304,650 | | | 20,435,922 | |
| XTO Energy, Inc. | | | 221,350 | | | 10,414,518 | |
| | | | | | | 69,554,854 | |
| | | | | | | | |
Financial — 17.8% | | | | | | | |
| Allstate Corp. | | | 55,500 | | | 3,613,605 | |
| American International Group, Inc. | | | 212,140 | | | 15,201,953 | |
| Bank of America Corp. | | | 110,900 | | | 5,920,951 | |
| Bank of New York Co., Inc. | | | 142,900 | | | 5,625,973 | |
| Citigroup, Inc. | | | 170,600 | | | 9,502,420 | |
| Comerica, Inc. | | | 74,740 | | | 4,385,743 | |
| Merrill Lynch & Co., Inc. | | | 66,300 | | | 6,172,530 | |
| U.S. Bancorp | | | 347,655 | | | 12,581,635 | |
| Wells Fargo & Co. | | | 324,400 | | | 11,535,664 | |
| | | | | | | 74,540,474 | |
| | | | | | | | |
Health Care — 9.0% | | | | | | | |
| Abbott Laboratories | | | 185,860 | | | 9,053,240 | |
| Cardinal Health, Inc. | | | 97,800 | | | 6,301,254 | |
| Johnson & Johnson | | | 133,200 | | | 8,793,864 | |
| Pfizer, Inc. | | | 135,200 | | | 3,501,680 | |
| UnitedHealth Group, Inc. | | | 103,690 | | | 5,571,264 | |
| Wellpoint, Inc.* | | | 55,920 | | | 4,400,345 | |
| | | | | | | 37,621,647 | |
| | | | | | | | |
Industrial — 7.9% | | | | | | | |
| Fluor Corp. | | | 107,050 | | | 8,740,633 | |
| Norfolk Southern Corp. | | | 102,712 | | | 5,165,386 | |
| Parker Hannifin Corp. | | | 41,250 | | | 3,171,300 | |
| Southwest Airlines Co. | | | 399,570 | | | 6,121,412 | |
| Trinity Industries, Inc. | | | 95,425 | | | 3,358,960 | |
| Union Pacific Corp. | | | 71,550 | | | 6,584,031 | |
| | | | | | | 33,141,722 | |
| | | | | | | | |
Information Technology — 5.7% | | | | | | | |
| Advanced Micro Devices, Inc.* | | | 381,661 | | | 7,766,801 | |
| Lexmark International, Inc.* | | | 119,400 | | | 8,740,080 | |
| Microsoft Corp. | | | 250,000 | | | 7,465,000 | |
| | | | | | | 23,971,881 | |
| | | | | | | | |
Materials — 7.1% | | | | | | | |
| Dow Chemical Co. | | | 189,500 | | | 7,568,630 | |
| International Paper Co. | | | 112,200 | | | 3,826,020 | |
| MeadWestvaco Corp. | | | 264,850 | | | 7,961,391 | |
| Phelps Dodge Corp. | | | 10,750 | | | 1,286,990 | |
| Weyerhaeuser Co. | | | 130,100 | | | 9,191,565 | |
| | | | | | | 29,834,596 | |
| | | | | | | | |
Telecommunications — 1.0% | | | | | | | |
| Sprint Nextel Corp. | | | 230,250 | | | 4,349,423 | |
| | | | | | | | |
Utilities — 2.9% | | | | | | | |
| Dominion Resources, Inc. | | | 146,650 | | | 12,295,136 | |
| | | | | | | | |
Total Common Stocks | | | | | $ | 360,959,132 | |
| | | | | | | | |
Registered Investment Companies — 14.4% | | | | | | | |
| First American Prime | | | | | | | |
| Obligations Fund - Class Z | | | 60,675,986 | | $ | 60,675,986 | |
| | | | | | | | |
| Total Investment Securities — 100.4% | | | | | | | |
| (Cost $385,951,689)** | | | | | $ | 421,635,118 | |
| | | | | | | | |
Liabilities In Excess | | | | | | | |
Of Other Assets — (0.4)% | | | | | | (1,728,765 | ) |
| | | | | | | | |
Net Assets — 100.0% | | | | | $ | 419,906,353 | |
| * | Non-income producing security. |
| ** | Represents cost for financial reporting purposes. |
See accompanying Notes to Financial Statements.
| Page 26 | Diamond Hill Funds Annual Report December 31, 2006 |
Diamond Hill Select Fund
Schedule of Investments
December 31, 2006
| | | | | Market | |
| | | Shares | | Value | |
| | | | | | | | |
Common Stocks — 89.4% | | | | | | | |
Consumer Discretionary — 12.3% | | | | | | | |
| Belo Corp. | | | 8,825 | | $ | 162,204 | |
| Black & Decker Corp., The | | | 5,990 | | | 479,020 | |
| Fortune Brands, Inc. | | | 4,110 | | | 350,953 | |
| Gannett Co., Inc. | | | 6,300 | | | 380,898 | |
| Hanesbrands, Inc.* | | | 3,506 | | | 82,812 | |
| McDonald’s Corp. | | | 15,150 | | | 671,599 | |
| MoneyGram International, Inc. | | | 6,250 | | | 196,000 | |
| | | | | | | 2,323,486 | |
| | | | | | | | |
Consumer Staples — 5.0% | | | | | | | |
| Flowers Foods, Inc. | | | 6,175 | | | 166,663 | |
| General Mills, Inc. | | | 5,225 | | | 300,960 | |
| Sara Lee Corp. | | | 28,050 | | | 477,692 | |
| | | | | | | 945,315 | |
| | | | | | | | |
Energy — 19.1% | | | | | | | |
| Apache Corp. | | | 14,200 | | | 944,442 | |
| Cimarex Energy Co. | | | 13,715 | | | 500,598 | |
| ConocoPhillips | | | 13,000 | | | 935,350 | |
| Devon Energy Corp. | | | 14,950 | | | 1,002,845 | |
| Encore Acquisition Co.* | | | 7,500 | | | 183,975 | |
| James River Coal Co.* | | | 6,200 | | | 57,536 | |
| | | | | | | 3,624,746 | |
| | | | | | | | |
Financial — 12.7% | | | | | | | |
| American International Group, Inc. | | | 8,250 | | | 591,195 | |
| Citigroup, Inc. | | | 8,300 | | | 462,310 | |
| U.S. Bancorp | | | 19,400 | | | 702,086 | |
| Wells Fargo & Co. | | | 18,000 | | | 640,080 | |
| | | | | | | 2,395,671 | |
| | | | | | | | |
Health Care — 8.2% | | | | | | | |
| Abbott Laboratories | | | 7,450 | | | 362,890 | |
| Cardinal Health, Inc. | | | 4,500 | | | 289,935 | |
| Johnson & Johnson | | | 6,310 | | | 416,586 | |
| UnitedHealth Group, Inc. | | | 8,972 | | | 482,065 | |
| | | | | | | 1,551,476 | |
| | | | | | | | |
Industrial — 11.8% | | | | | | | |
| Acco Brands Corp.* | | | 9,900 | | | 262,053 | |
| AirTran Holdings, Inc.* | | | 26,600 | | | 312,284 | |
| Fluor Corp. | | | 7,300 | | | 596,045 | |
| Norfolk Southern Corp. | | | 5,343 | | | 268,699 | |
| Trinity Industries, Inc. | | | 8,137 | | | 286,422 | |
| Union Pacific Corp. | | | 5,525 | | | 508,411 | |
| | | | | | | 2,233,914 | |
| | | | | | | | |
Information Technology — 7.7% | | | | | | | |
| Advanced Micro Devices, Inc.* | | | 14,933 | | | 303,887 | |
| Lexmark International, Inc.* | | | 5,600 | | | 409,920 | |
| Microsoft Corp. | | | 20,000 | | | 597,200 | |
| TriZetto Group, Inc., The* | | | 8,000 | | | 146,960 | |
| | | | | | | 1,457,967 | |
| | | | | | | | |
Materials — 8.1% | | | | | | | |
| Dow Chemical Co. | | | 10,400 | | | 415,376 | |
| MeadWestvaco Corp. | | | 14,525 | | | 436,622 | |
| Phelps Dodge Corp. | | | 491 | | | 58,783 | |
| Weyerhauser Co. | | | 8,674 | | | 612,817 | |
| | | | | | | 1,523,598 | |
| | | | | | | | |
Telecommunications — 1.0% | | | | | | | |
| Sprint Nextel Corp. | | | 9,750 | | | 184,178 | |
| | | | | | | | |
Utilities — 3.5% | | | | | | | |
| Dominion Resources, Inc. | | | 8,000 | | | 670,720 | |
| | | | | | | | |
Total Common Stocks | | | | | $ | 16,911,071 | |
| | | | | | | | |
Registered Investment Companies — 10.9% | | | | | | | |
| First American Prime | | | | | | | |
| Obligations Fund - Class Z | | | 2,068,525 | | | 2,068,525 | |
| | | | | | | | |
Total Investment Securities — 100.3% | | | | | | | |
| (Cost $18,216,326)** | | | | | $ | 18,979,596 | |
| | | | | | | | |
Liabilities In Excess | | | | | | | |
Of Other Assets — (0.3)% | | | | | | (62,334 | ) |
| | | | | | | | |
Net Assets — 100.0% | | | | | $ | 18,917,262 | |
| * | Non-income producing security. |
| ** | Represents cost for financial reporting purposes. |
See accompanying Notes to Financial Statements.
| Diamond Hill Funds Annual Report December 31, 2006 | Page 27 |
Diamond Hill Long-Short Fund
Schedule of Investments
December 31, 2006
| | | | | Market | |
| | | Shares | | Value | |
| | | | | | | | |
Common Stocks — 79.8% | | | | | | | |
Consumer Discretionary — 13.8% | | | | | | | |
| Belo Corp. † | | | 598,200 | | $ | 10,994,916 | |
| Black & Decker Corp., The † | | | 356,532 | | | 28,511,864 | |
| Brink's Co., The † | | | 231,046 | | | 14,768,460 | |
| Fortune Brands, Inc. † | | | 363,000 | | | 30,996,570 | |
| Gannett Co., Inc. † | | | 415,950 | | | 25,148,337 | |
| Hanesbrands, Inc.* † | | | 126,781 | | | 2,994,567 | |
| McDonald’s Corp. † | | | 1,082,769 | | | 47,999,149 | |
| MoneyGram International, Inc. † | | | 368,500 | | | 11,556,160 | |
| | | | | | | 172,970,023 | |
| | | | | | | | |
Consumer Staples — 3.3% | | | | | | | |
| General Mills, Inc. † | | | 228,500 | | | 13,161,600 | |
| Sara Lee Corp. † | | | 1,619,950 | | | 27,587,749 | |
| | | | | | | 40,749,349 | |
| | | | | | | | |
Energy — 18.5% | | | | | | | |
| Apache Corp. † | | | 839,550 | | | 55,838,471 | |
| Cimarex Energy Co. † | | | 1,182,200 | | | 43,150,300 | |
| ConocoPhillips † | | | 820,850 | | | 59,060,157 | |
| Devon Energy Corp. † | | | 874,850 | | | 58,684,937 | |
| Encore Acquisition Co.* † | | | 528,550 | | | 12,965,332 | |
| James River Coal Co.* † | | | 251,950 | | | 2,338,096 | |
| | | | | | | 232,037,293 | |
| | | | | | | | |
Financial — 11.5% | | | | | | | |
| American International Group, Inc. † | | | 602,950 | | | 43,207,397 | |
| Citigroup, Inc. † | | | 467,200 | | | 26,023,040 | |
| U.S. Bancorp † | | | 1,053,200 | | | 38,115,308 | |
| Wells Fargo & Co. † | | | 1,033,550 | | | 36,753,038 | |
| | | | | | | 144,098,783 | |
| | | | | | | | |
Health Care — 7.8% | | | | | | | |
| Abbott Laboratories † | | | 620,750 | | | 30,236,733 | |
| Cardinal Health, Inc. † | | | 292,800 | | | 18,865,104 | |
| Johnson & Johnson † | | | 461,450 | | | 30,464,929 | |
| UnitedHealth Group, Inc. † | | | 337,840 | | | 18,152,143 | |
| | | | | | | 97,718,909 | |
| | | | | | | | |
Industrial — 8.6% | | | | | | | |
| Acco Brands Corp.* † | | | 399,614 | | | 10,577,783 | |
| AirTran Holdings, Inc.* † | | | 1,462,150 | | | 17,165,641 | |
| Fluor Corp. † | | | 315,950 | | | 25,797,318 | |
| Norfolk Southern Corp. † | | | 290,206 | | | 14,594,460 | |
| Trinity Industries, Inc. † | | | 380,950 | | | 13,409,440 | |
| Union Pacific Corp. † | | | 286,650 | | | 26,377,532 | |
| | | | | | | 107,922,174 | |
| | | | | | | | |
Information Technology — 6.5% | | | | | | | |
| Advanced Micro Devices, Inc.* † | | | 1,072,297 | | | 21,821,244 | |
| Lexmark International, Inc.* † | | | 329,450 | | | 24,115,740 | |
| Microsoft Corp. † | | | 947,650 | | | 28,296,829 | |
| TriZetto Group, Inc., The* † | | | 353,400 | | | 6,491,958 | |
| | | | | | | 80,725,771 | |
| | | | | | | | |
Materials — 5.7% | | | | | | | |
| Dow Chemical Co. † | | | 569,450 | | | 22,743,833 | |
| MeadWestvaco Corp. † | | | 768,750 | | | 23,108,625 | |
| Phelps Dodge Corp. † | | | 30,074 | | | 3,600,459 | |
| Weyerhaeuser Co. † | | | 307,850 | | | 21,749,603 | |
| | | | | | | 71,202,520 | |
| | | | | | | | |
Telecommunications — 1.2% | | | | | | | |
| Sprint Nextel Corp. † | | | 772,700 | | | 14,596,303 | |
| | | | | | | | |
Utilities — 2.9% | | | | | | | |
| Dominion Resources, Inc. † | | | 439,900 | | | 36,881,216 | |
Total Common Stocks | | | | | $ | 998,902,341 | |
| | | | | | | | |
Registered Investment Companies — 17.6% | | | | | | | |
| First American Prime | | | | | | | |
| Obligations Fund - Class Z | | | 219,822,738 | | $ | 219,822,738 | |
| | | | | | | | |
Total Investment Securities — 97.4% | | | | | | | |
| (Cost $1,139,480,217)** | | | | | $ | 1,218,725,079 | |
| | | | | | | | |
Segregated Cash With Brokers — 37.2% | | | | | | 466,370,405 | |
| | | | | | | | |
Securities Sold Short — (35.4)% | | | | | | | |
| (Proceeds $447,151,804) | | | | | | (443,164,226 | ) |
| | | | | | | | |
Other Assets In | | | | | | | |
Excess of Liabilities — (0.8)% | | | | | | 10,514,174 | |
| | | | | | | | |
Net Assets — 100.0% | | | | | $ | 1,252,445,432 | |
| * | Non-income producing security. |
| ** | Represents cost for financial reporting purposes. |
| † | Security position is entirely held in a segregated account as collateral for securities sold short aggregating a total market value of $998,902,341. |
See accompanying Notes to Financial Statements.
| Page 28 | Diamond Hill Funds Annual Report December 31, 2006 |
Diamond Hill Long-Short Fund
Schedule of Securities Sold Short
December 31, 2006
| | | | | Market | |
| | | Shares | | Value | |
| | | | | | | | |
Common Stocks — 90.8% | | | | | | | |
Consumer Discretionary — 39.0% | | | | | | | |
| Amazon.com, Inc.* | | | 945,791 | | $ | 37,320,913 | |
| Apollo Group, Inc.* | | | 425,281 | | | 16,573,201 | |
| Brunswick Corp. | | | 136,200 | | | 4,344,780 | |
| DIRECTV Group, Inc., The* | | | 482,400 | | | 12,031,056 | |
| EchoStar Communications | | | | | | | |
| Corp., Class A* | | | 146,011 | | | 5,552,798 | |
| Ford Motor Co. | | | 2,675,300 | | | 20,091,503 | |
| General Motors Corp. | | | 630,450 | | | 19,367,424 | |
| Gymboree Corp., The * | | | 114,600 | | | 4,373,136 | |
| Harley-Davidson, Inc. | | | 125,950 | | | 8,875,696 | |
| Kohl's Corp.* | | | 67,050 | | | 4,588,231 | |
| NetFlix, Inc.* | | | 186,000 | | | 4,809,960 | |
| P.F. Chang's China Bistro, Inc.* | | | 232,000 | | | 8,904,160 | |
| Panera Bread Co.* | | | 60,200 | | | 3,365,782 | |
| RadioShack Corp. | | | 842,000 | | | 14,128,760 | |
| Red Robin Gourmet Burgers, Inc.* | | | 190,645 | | | 6,834,623 | |
| Winnebago Industries, Inc. | | | 51,100 | | | 1,681,702 | |
| | | | | | | 172,843,725 | |
| | | | | | | | |
Consumer Staples — 6.6% | | | | | | | |
| Colgate-Palmolive Co. | | | 127,650 | | | 8,327,886 | |
| Kraft Foods, Inc. | | | 136,110 | | | 4,859,127 | |
| Procter & Gamble Co. | | | 251,750 | | | 16,179,972 | |
| | | | | | | 29,366,985 | |
| | | | | | | | |
Finance — 1.4% | | | | | | | |
| Corus Bankshares, Inc. | | | 105,232 | | | 2,427,702 | |
| PrivateBancorp, Inc. | | | 90,200 | | | 3,755,026 | |
| | | | | | | 6,182,728 | |
| | | | | | | | |
Health Care — 8.1% | | | | | | | |
| Boston Scientific Corp.* | | | 221,250 | | | 3,801,076 | |
| Laboratory Corp. of | | | | | | | |
| America Holdings* | | | 201,488 | | | 14,803,323 | |
| Quest Diagnostics, Inc. | | | 157,850 | | | 8,366,050 | |
| Tenet Healthcare Corp.* | | | 1,302,925 | | | 9,081,387 | |
| | | | | | | 36,051,836 | |
| | | | | | | | |
Industrial — 6.4% | | | | | | | |
| Boeing Co. | | | 123,000 | | | 10,927,320 | |
| Energy Conversion Devices, Inc.* | | | 197,400 | | | 6,707,652 | |
| United Parcel Service, Inc. | | | 141,245 | | | 10,590,550 | |
| | | | | | | 28,225,522 | |
| | | | | | | | |
Information Technology — 28.2% | | | | | | | |
| Apple Computer, Inc.* | | | 198,275 | | | 16,821,651 | |
| Applied Materials, Inc. | | | 718,925 | | | 13,264,166 | |
| Cisco Systems, Inc.* | | | 616,550 | | | 16,850,311 | |
| eBay, Inc.* | | | 423,700 | | | 12,740,659 | |
| Google, Inc.* | | | 29,050 | | | 13,376,944 | |
| Juniper Networks, Inc.* | | | 769,700 | | | 14,578,118 | |
| National Semiconductor Corp. | | | 331,050 | | | 7,514,835 | |
| Total System Services, Inc. | | | 223,050 | | | 5,886,290 | |
| Yahoo!, Inc.* | | | 926,200 | | | 23,655,148 | |
| | | | | | | 124,688,122 | |
| | | | | | | | |
Utilities — 1.1% | | | | | | | |
| Aqua America, Inc. | | | 213,500 | | | 4,863,531 | |
| | | | | | | | |
Total Common Stocks Sold Short | | | | | $ | 402,222,449 | |
| | | | | | | | |
Exchange Traded Funds — 9.2% | | | | | | | |
| Internet HOLDRs Trust | | | 135,350 | | $ | 7,099,107 | |
| Nasdaq 100 Trust, Series I | | | 625,030 | | | 26,976,295 | |
| Semiconductor HOLDRs Trust | | | 203,750 | | | 6,866,375 | |
| | | | | | | | |
Total Exchange Traded | | | | | | | |
Funds Sold Short | | | | | $ | 40,941,777 | |
| | | | | | | | |
Total Securities Sold Short - 100.0% | | | | | | | |
| (Proceeds $447,151,804) | | | | | $ | 443,164,226 | |
| * | Non-dividend expense producing security. |
See accompanying Notes to Financial Statements.
| Diamond Hill Funds Annual Report December 31, 2006 | Page 29 |
Diamond Hill Financial Long-Short Fund
Schedule of Investments
December 31, 2006
| | | | | Market | |
| | | Shares | | Value | |
| | | | | | | | |
Preferred Stocks — 4.1% | | | | | | | |
Finance — 2.3% | | | | | | | |
| Citizens Funding Trust I, 7.50%, 9/15/66 † | | | 10,000 | | $ | 260,000 | |
| Countrywide Capital V 7.000% PFD † | | | 20,000 | | | 504,000 | |
| KeyCorp Capital VIII, 7.00%, 6/15/66 † | | | 10,000 | | | 262,200 | |
| | | | | | | 1,026,200 | |
| | | | | | | | |
Real Estate Investment Trust — 1.8% | | | | | | | |
| Mills Corp., The † | | | 35,000 | | | 768,250 | |
| | | | | | | | |
Total Preferred Stocks | | | | | $ | 1,794,450 | |
| | | | | | | | |
Common Stocks — 67.2% | | | | | | | |
Finance - Banks & Thrifts — 33.4% | | | | | | | |
| 1st Source Corp. † | | | 10,900 | | $ | 350,217 | |
| Capital Corp. of the West † | | | 8,643 | | | 277,354 | |
| Centennial Bank Holdings, Inc. * † | | | 50,000 | | | 473,000 | |
| Comerica, Inc. † | | | 22,000 | | | 1,290,960 | |
| Fifth Third Bancorp † | | | 5,029 | | | 205,837 | |
| First Horizon National Corp. † | | | 17,000 | | | 710,260 | |
| First National Lincoln Corp. † | | | 14,394 | | | 241,100 | |
| First State Bancorp † | | | 21,512 | | | 532,422 | |
| Freedom Bank* † | | | 15,000 | | | 210,000 | |
| Greene County Bancshares, Inc. † | | | 5,865 | | | 233,016 | |
| Hanmi Financial Corp. † | | | 15,000 | | | 337,950 | |
| ITLA Capital Corp. † | | | 10,002 | | | 579,216 | |
| MAF Bancorp, Inc. † | | | 14,734 | | | 658,462 | |
| National City Corp. † | | | 5,000 | | | 182,800 | |
| PNC Financial Services Group, Inc. † | | | 10,000 | | | 740,400 | |
| Sky Financial Group, Inc. † | | | 15,400 | | | 439,516 | |
| Sovereign Bancorp, Inc. † | | | 20,000 | | | 507,800 | |
| Summit Bank Corp. † | | | 4,548 | | | 110,471 | |
| Taylor Capital Group, Inc. † | | | 12,000 | | | 439,320 | |
| UCBH Holdings, Inc. † | | | 20,000 | | | 351,200 | |
| U.S. Bancorp † | | | 46,000 | | | 1,664,740 | |
| Wachovia Corp. † | | | 19,680 | | | 1,120,776 | |
| Washington Mutual, Inc. † | | | 29,000 | | | 1,319,210 | |
| Wells Fargo & Co. † | | | 47,000 | | | 1,671,320 | |
| | | | | | | 14,647,347 | |
| | | | | | | | |
Finance - Broker Dealer — 6.0% | | | | | | | |
| Merrill Lynch & Co., Inc. † | | | 16,000 | | | 1,489,600 | |
| Morgan Stanley † | | | 14,000 | | | 1,140,020 | |
| | | | | | | 2,629,620 | |
| | | | | | | | |
Financial - Diversified — 7.5% | | | | | | | |
| Bank of America Corp. † | | | 24,474 | | | 1,306,667 | |
| Citigroup, Inc. † | | | 36,000 | | | 2,005,200 | |
| | | | | | | 3,311,867 | |
| | | | | | | | |
Financial Specialties — 6.1% | | | | | | | |
| Bank of New York Co., Inc. † | | | 37,000 | | | 1,456,690 | |
| Freddie Mac † | | | 18,000 | | | 1,222,200 | |
| | | | | | | 2,678,890 | |
| | | | | | | | |
Insurance — 13.1% | | | | | | | |
| Allstate Corp. † | | | 20,000 | | | 1,302,200 | |
| American International Group, Inc. † | | | 22,000 | | | 1,576,520 | |
| Assurant, Inc. † | | | 7,000 | | | 386,750 | |
| Hanover Insurance Group, Inc. † | | | 11,000 | | | 536,800 | |
| Ohio Casualty Corp. † | | | 14,000 | | | 417,340 | |
| PartnerRe Ltd. † | | | 4,600 | | | 326,738 | |
| SAFECO Corp. † | | | 3,500 | | | 218,925 | |
| United Fire & Casualty Co. † | | | 28,000 | | | 987,000 | |
| | | | | | | 5,752,273 | |
| | | | | | | | |
Real Estate Investment Trust — 1.1% | | | | | | | |
| Eagle Hospitality Properties Trust, Inc. † | | | 51,300 | | | 470,934 | |
| | | | | | | | |
Total Common Stocks | | | | | $ | 29,490,931 | |
| | | | | | | | |
Registered Investment Companies — 28.4% | | | | | | | |
| First American Prime | | | | | | | |
| Obligations Fund - Class Z | | | 12,472,119 | | $ | 12,472,119 | |
| Page 30 | Diamond Hill Funds Annual Report December 31, 2006 |
Diamond Hill Financial Long-Short Fund
Schedule of Investments (Continued)
December 31, 2006
| | | | | Market | |
| | | Shares | | Value | |
Total Investment Securities — 99.7% | | | | | | | |
| (Cost $37,220,441)** | | | | | $ | 43,757,500 | |
| | | | | | | | |
Segregated Cash With Brokers — 8.7% | | | | | | 3,828,162 | |
| | | | | | | | |
Securities Sold Short — (10.0)% | | | | | | | |
| (Proceeds $4,147,194) | | | | | | (4,383,578 | ) |
| | | | | | | | |
Other Assets In Excess | | | | | | | |
Of Liabilities — 1.6% | | | | | | 396,279 | |
| | | | | | | | |
Net Assets — 100.0% | | | | | $ | 43,598,363 | |
| * | Non-income producing security. |
| ** | Represents cost for financial reporting purposes. |
| † | Security position is entirely held in a segregated account as collateral for securities sold short aggregating a total market value of $31,285,381. |
See accompanying Notes to Financial Statements.
Diamond Hill Financial Long-Short Fund
Schedule of Securities Sold Short
December 31, 2006
| | | | | Market | |
| | | Shares | | Value | |
| | | | | | | | |
Common Stocks — 100.0% | | | | | | | |
Finance - Banks & Thrifts — 84.9% | | | | | | | |
| City Holding Co | | | 22,000 | | $ | 899,580 | |
| Corus Bankshares, Inc. | | | 11,900 | | | 274,533 | |
| First Marblehead Corp., The | | | 16,500 | | | 901,725 | |
| Privatebancorp, Inc. | | | 22,000 | | | 915,860 | |
| Virginia Commerce Bancorp, Inc.* | | | 19,000 | | | 377,720 | |
| Westamerican Bancorporation | | | 7,000 | | | 354,410 | |
| | | | | | | 3,723,828 | |
| | | | | | | | |
Information Technology — 15.1% | | | | | | | |
| Total System Services, Inc. | | | 25,000 | | | 659,750 | |
| | | | | | | | |
Total Common Stocks | | | | | | | |
Sold Short — 100% | | | | | | | |
| (Proceeds 4,147,194) | | | | | $ | 4,383,578 | |
| * | Non-dividend expense producing security. |
See accompanying Notes to Financial Statements.
| Diamond Hill Funds Annual Report December 31, 2006 | Page 31 |
Diamond Hill Strategic Income Fund
Schedule of Investments
December 31, 2006
| | | | | Market | |
| | | Shares | | Value | |
| | | | | | | | |
Common Stocks — 13.2% | | | | | | | |
Energy — 10.4% | | | | | | | |
| Atlas Pipeline Partners, L.P. | | | 28,380 | | $ | 1,362,240 | |
| Energy Transfer Partners, L.P. | | | 40,020 | | | 2,165,081 | |
| Enterprise Products Partners, L.P. | | | 37,195 | | | 1,077,911 | |
| Inergy, L.P. | | | 36,000 | | | 1,073,160 | |
| Markwest Energy Partners, L.P. | | | 23,500 | | | 1,401,775 | |
| Penn Virginia GP Holdings, L.P.* | | | 60,000 | | | 1,192,800 | |
| Plains All American Pipeline, L.P. | | | 33,780 | | | 1,729,536 | |
| Teekay LNG Partners, L.P. | | | 40,500 | | | 1,349,055 | |
| TEPPCO Partners, L.P. | | | 29,060 | | | 1,171,409 | |
| Valero, L.P. | | | 19,518 | | | 1,088,519 | |
| | | | | | | 13,611,486 | |
| | | | | | | | |
Real Estate Investment Trust — 2.8% | | | | | | | |
| Crystal River Capital, Inc. | | | 77,000 | | | 1,965,810 | |
| Eagle Hospitality Properties Trust, Inc. | | | 81,400 | | | 747,252 | |
| Education Realty Trust, Inc. | | | 60,050 | | | 886,939 | |
| | | | | | | 3,600,001 | |
| | | | | | | | |
Total Common Stocks | | | | | $ | 17,211,487 | |
| | | | | | | | |
Collateralized Debt Obligations — 3.1% | | | | | | | |
| Alesco Preferred Funding III † | | | 1,000,059 | | $ | 1,065,543 | |
| Alesco Preferred Funding IV † | | | 389 | | | 398,312 | |
| Alesco Preferred Funding V † | | | 91 | | | 91,210 | |
| Alesco Preferred Funding VI † | | | 700,687 | | | 575,843 | |
| Alesco Preferred Funding VI Series E † | | | 378,467 | | | 311,034 | |
| Fort Sheridan, Ltd., 144A † | | | 509,051 | | | 516,996 | |
| Taberna Preferred Funding, Ltd. † | | | 1,101,474 | | | 1,137,894 | |
Total Collateralized Debt Obligations | | | | | $ | 4,096,832 | |
| | | | | | | | |
Preferred Stocks — 44.1% | | | | | | | |
| Alexandria Real Estate Series C - REIT | | | 81,900 | | $ | 2,142,504 | |
| Apartment Invt. & Mgmt. Co., 7.75% - REIT | | | 12,000 | | | 305,400 | |
| Apartment Invt. & Mgmt. Co., 7.875% - REIT | | | 18,000 | | | 459,000 | |
| Apartment Invt. & Mgmt. Co., 8.00% - REIT | | | 23,200 | | | 590,440 | |
| Apartment Invt. & Mgmt. Co., 9.375% - REIT | | | 37,000 | | | 973,100 | |
| Arch Capital Group Ltd., 8.00% | | | 72,400 | | | 1,914,980 | |
| Aspen Insurance, 7.401% | | | 40,000 | | | 1,024,000 | |
| Axis Capital Series A, 7.25% | | | 63,000 | | | 1,626,030 | |
| Bancorpsouth Capital Trust I, 8.15% | | | 15,000 | | | 376,050 | |
| Capital One Capital II, 7.75% | | | 45,000 | | | 1,182,600 | |
| CBL & Associates Series C - REIT | | | 22,000 | | | 564,520 | |
| CBL & Associates Series D - REIT | | | 41,500 | | | 1,062,400 | |
| Citigroup Capital VIII | | | 105,000 | | | 2,643,900 | |
| Colonial Capital IV, 7.88% | | | 40,000 | | | 1,022,000 | |
| Comcast Corp., 7.00%, Series B | | | 73,700 | | | 1,903,671 | |
| Corporate Backed Trust Certificates, 7.75% | | | 5,000 | | | 133,000 | |
| Countrywide Capital, 7.00%* | | | 88,200 | | | 2,222,640 | |
| Cousins Properties, Inc. Series B - REIT | | | 58,200 | | | 1,485,846 | |
| Dominion CNG Capital Trust I | | | 20,000 | | | 507,200 | |
| Duke Realty Corp., Series N, 7.25% | | | 56,400 | | | 1,499,112 | |
| Health Care REIT, Inc. | | | 24,055 | | | 1,034,846 | |
| Health Care REIT, Inc., 7.625% | | | 44,200 | | | 1,143,454 | |
| Health Care REIT, Inc., 7.875% | | | 10,000 | | | 259,000 | |
| Huntington Preferred Capital, Inc. - REIT | | | 13,400 | | | 387,394 | |
| Innkeepers USA Trust | | | 16,000 | | | 403,360 | |
| Kilroy Realty Corp., 7.50% - REIT | | | 50,100 | | | 1,270,035 | |
| Laclede Capital Trust I | | | 49,000 | | | 1,250,480 | |
| LaSalle Hotel Properties - REIT, Series E | | | 24,000 | | | 612,000 | |
| LaSalle Hotel Properties - REIT, Series D | | | 38,100 | | | 973,931 | |
| Lexington Corporate Property Trust - REIT | | | 15,500 | | | 396,180 | |
| Merrill Lynch Capital Trust, 7.28% | | | 41,700 | | | 1,075,443 | |
| Merrill Lynch Capital Trust, 7.12% | | | 51,500 | | | 1,324,580 | |
| Morgan Stanley Capital Trust II | | | 57,000 | | | 1,447,800 | |
| Preferredplus Trust, 7.25% Series Val-1 | | | 20,300 | | | 518,259 | |
| Preferredplus Trust, 7.55%, Series FAR | | | 19,600 | | | 500,780 | |
| Protective Life, 7.25% | | | 50,000 | | | 1,304,500 | |
| PS Business Parks, Inc., 7.00% - REIT | | | 39,400 | | | 1,002,730 | |
| PS Business Parks, Inc., 7.60% - REIT | | | 19,300 | | | 495,624 | |
| Public Storage, Inc., 7.25%, Series K | | | 50,000 | | | 1,295,000 | |
| Renaissance Holdings Ltd., 7.30%, Series B | | | 62,500 | | | 1,593,125 | |
| Page 32 | Diamond Hill Funds Annual Report December 31, 2006 |
Diamond Hill Strategic Income Fund
Schedule of Investments (Continued)
December 31, 2006
| | | | | Market | |
| | | Shares | | Value | |
| | | | | | | | |
Preferred Stocks — 44.1% continued | | | | | | | |
| Renaissance Holdings Ltd., 8.10%, Series A | | | 23,000 | | $ | 579,140 | |
| Saturns - FON | | | 21,500 | | | 575,985 | |
| Selective INS GP, 7.50% | | | 80,000 | | | 2,045,000 | |
| SL Green Realty, 7.875%, Series D | | | 43,800 | | | 1,127,850 | |
| Southern Co. Capital Trust VI, 7.125% | | | 27,100 | | | 683,733 | |
| Sovereign Capital Trust, 7.75% | | | 54,000 | | | 1,444,500 | |
| Tanger Outlet Stores, 7.50%, Series C | | | 37,500 | | | 970,500 | |
| Taubman Centers, Inc., 8.00% - REIT | | | 58,260 | | | 1,532,238 | |
| Telephone & Data Systems, 7.60% | | | 31,000 | | | 777,170 | |
| Mills Corp., The, 7.875% - REIT | | | 35,000 | | | 768,250 | |
| Mills Corp., The, 8.75% - REIT | | | 31,100 | | | 717,166 | |
| Mills Corp., The, 9.00% - REIT | | | 40,500 | | | 943,650 | |
| US Cellular, 7.50% | | | 52,293 | | | 1,346,545 | |
| Virginia Power Capital Trust, 7.375% | | | 40,400 | | | 1,033,432 | |
| Wachovia Preferred Funding - REIT | | | 27,500 | | | 772,475 | |
| Zions Capital Trust Series B | | | 16,000 | | | 407,840 | |
Total Preferred Stocks | | | | | $ | 57,652,388 | |
| | | | | | | | |
Registered Investment Companies — 6.0% | | | | | | | |
| First American Prime Obligations Fund - Class Z | | | 4,518,676 | | $ | 4,518,675 | |
| Managed High Yield Plus Fund | | | 100,000 | | | 496,000 | |
| Nuveen Preferred and Convertible Income Fund II | | | 67,550 | | | 953,131 | |
| Nuveen Quality Preferred Income Fund | | | 33,900 | | | 503,076 | |
| Nuveen Quality Preferred Income Fund II | | | 45,100 | | | 680,108 | |
| Pimco High Income Fund | | | 40,000 | | | 638,000 | |
Total Registered | | | | | | | |
Investment Companies | | | | | $ | 7,788,990 | |
| | | | | Market | |
| | | Par Value | | Value | |
Corporate Bonds — 19.0% | | | | | |
Consumer Discretionary — 1.7% | | | | | |
| Goodyear Tire, 7.86%, 8/15/11 | | $ | 200,000 | | $ | 201,000 | |
| J. C. Penney Corp., Inc., 8.13%, 4/1/27 | | | 2,000,000 | | | 2,056,516 | |
| | | | | | | 2,257,516 | |
| | | | | | | | |
Consumer, Non-Cyclical — 1.3% | | | | | | | |
| Millennium America, Inc., 9.25%, 6/15/08 | | | 400,000 | | | 413,000 | |
| Reynolds American, Inc., 7.25%, 6/1/12 | | | 1,225,000 | | | 1,277,063 | |
| | | | | | | 1,690,063 | |
| | | | | | | | |
Energy — 5.2% | | | | | | | |
| Chesapeake Energy Corp., 7.63%, 7/15/13 | | | 500,000 | | | 526,875 | |
| Chesapeake Energy Corp., 7.75%, 1/15/15 | | | 1,500,000 | | | 1,561,875 | |
| Copano Energy, 8.13%, 3/1/16 | | | 2,000,000 | | | 2,070,000 | |
| Markwest Energy Finance Corp., 8.50%, 7/15/16 ^ | | | 2,550,000 | | | 2,652,000 | |
| | | | | | | 6,810,750 | |
| | | | | | | | |
Finance — 5.8% | | | | | | | |
| General Motors Acceptance Corp., 6.13%, 2/1/07 | | | 1,150,000 | | | 1,150,261 | |
| General Motors Acceptance Corp., 6.32%, 7/16/07 | | | 1,100,000 | | | 1,100,869 | |
| General Motors Acceptance Corp., 6.13%, 8/28/07 | | | 1,416,000 | | | 1,416,278 | |
| General Motors Acceptance Corp., 6.13%, 1/22/08 | | | 825,000 | | | 823,192 | |
| Montpelier, 6.13%, 8/15/13 | | | 2,200,000 | | | 2,143,319 | |
| Tobacco Settlement Financing Corp., 5.92%, 6/1/12 | | | 165,000 | | | 164,469 | |
| UBS Ag Structured, 5.07%, 6/20/08† | | | 750,000 | | | 738,750 | |
| | | | | | | 7,537,138 | |
| Diamond Hill Funds Annual Report December 31, 2006 | Page 33 |
Diamond Hill Strategic Income Fund
Schedule of Investments (Continued)
December 31, 2006
| | | | | Market | |
| | | | | Value | |
| | | | | | | | |
Industrial — 5.0% | | | | | | | |
| Beazer Homes, 8.63%, 5/15/11 | | $ | 485,000 | | $ | 499,550 | |
| K.B. Home, 7.75%, 2/1/10 | | | 1,435,000 | | | 1,460,113 | |
| Meritage Homes, 6.25%, 3/15/15 | | | 2,570,000 | | | 2,441,499 | |
| Standard Pacific Corp., 9.25%, 4/15/12 | | | 550,000 | | | 562,375 | |
| Standard Pacific Corp., 7.75%, 3/15/13 | | | 1,555,000 | | | 1,543,338 | |
| | | | | | | 6,506,875 | |
| | | | | | | | |
Utilities — 0.0% | | | | | | | |
| International Telephone, 7.50%, 7/1/11 | | | 40,000 | | | 40,023 | |
| | | | | | | | |
Total Corporate Bonds | | | | | $ | 24,842,365 | |
| | | | | | | | |
U.S. Government Agency Obligations — 14.0% | | | | | | | |
| FHLB, 6.00%, 4/25/16 | | $ | 2,500,000 | | $ | 2,512,775 | |
| FHLMC, 5.88%, 5/23/16 | | | 1,000,000 | | | 1,016,145 | |
| FHLMC, 6.00%, 8/18/16 | | | 1,000,000 | | | 1,006,507 | |
| FHLMC, 5.75%, 12/15/18 | | | 2,278,170 | | | 2,277,833 | |
| FHLMC MTN, 5.00%, 11/1/10 | | | 1,660,000 | | | 1,643,958 | |
| FNMA, 6.00%, 5/12/16 | | | 5,650,000 | | | 5,721,478 | |
| FNMA, 6.07%, 5/12/16 | | | 2,000,000 | | | 2,013,118 | |
| GNMA, 5.50%, 6/20/35 | | | 2,096,348 | | | 2,051,296 | |
Total U.S. Government | | | | | | | |
Agency Obligations | | | | | $ | 18,243,110 | |
| | | | | | | | |
Total Investment Securities — 99.4% | | | | | | | |
| (Amortized Cost $125,756,529)** | | | | | $ | 129,835,172 | |
| | | | | | | | |
Other Assets In Excess | | | | | | | |
Of Liabilities — 0.6% | | | | | | 746,678 | |
| | | | | | | | |
Net Assets — 100.0% | | | | | $ | 130,581,850 | |
| † | Restricted and illiquid securities valued at fair value and not registered under the Securities Act of 1933. Acquisition date and current cost: Alesco III - 3/04, $1,057,830; Alesco IV - 5/04, $395,331; Alesco V - 10/04, $93,055; Alesco VI - 12/04, $704,426; Alesco VI Series E - 03/05, $380,589; Fort Sheridan, Ltd. - 3/05, $512,147; Taberna Preferred Funding, Ltd. - 3/05, $1,121,850; UBS Ag Structured, 5.07%, 6/20/08 - 12/03, $750,802. At December 31, 2006, these securities had an aggregate market value of $4,835,582, representing 3.74% of net assets. |
| ^ | Restricted security not registered under the Securities Act of 1933. Acquisition date and current cost: Markwest Energy Finance Corp., 8.50%, 7/15/16 - 6/06, $2,048,086. At December 31, 2006 this security had a market value of $2,652,000, representing 2.05% of net assets. |
| * | Non-income producing security. |
| ** | Represents cost for financial reporting purposes. |
FHLB - Federal Home Loan Bank
FHLMC - Federal Home Loan Mortgage Corporation
FNMA - Federal National Mortgage Association
GNMA - Government National Mortgage Association
REIT - Real Estate Investment Trust
See accompanying Notes to Financial Statements.
| Page 34 | Diamond Hill Funds Annual Report December 31, 2006 |
Diamond Hill Funds
Statements of Assets & Liabilities
December 31, 2006
| | | | | Small-Mid | | | | | |
| | | Small Cap | | Cap | | Large Cap | | Select | |
| | | Fund | | Fund | | Fund | | Fund | |
Assets | | | | | | | | | |
| Investment securities, at cost | | $ | 473,346,474 | | $ | 23,054,868 | | $ | 385,951,689 | | $ | 18,216,326 | |
| Investment securities, at market value | | $ | 517,181,600 | | $ | 23,967,340 | | $ | 421,635,118 | | $ | 18,979,596 | |
| Receivable for securities sold | | | 2,094,565 | | | 75,668 | | | - | | | 21,042 | |
| Receivable for fund shares issued | | | 579,895 | | | 25,365 | | | 1,054,642 | | | 3,723 | |
| Receivable for dividends and interest | | | 680,380 | | | 38,363 | | | 785,839 | | | 29,147 | |
Total Assets | | | 520,536,440 | | | 24,106,736 | | | 423,475,599 | | | 19,033,508 | |
| | | | | | | | | | | | | | |
Liabilities | | | | | | | | | | | | | |
| Dividends payable | | | 112,054 | | | 1,878 | | | 221,313 | | | 45,808 | |
| Payable for securities purchased | | | 1,085,659 | | | 110,875 | | | 2,546,247 | | | 28,956 | |
| Payable for fund shares redeemed | | | 527,306 | | | - | | | 215,590 | | | 4,632 | |
| Payable to Investment Adviser | | | 357,116 | | | 14,931 | | | 211,253 | | | 11,276 | |
| Payable to Administrator | | | 152,471 | | | 5,383 | | | 117,912 | | | 5,292 | |
| Accrued distribution and service fees | | | 361,776 | | | 11,320 | | | 256,931 | | | 20,282 | |
Total Liabilities | | | 2,596,382 | | | 144,387 | | | 3,569,246 | | | 116,246 | |
| | | | | | | | | | | | | | |
Net Assets | | $ | 517,940,058 | | $ | 23,962,349 | | $ | 419,906,353 | | $ | 18,917,262 | |
| | | | | | | | | | | | | | |
Components of Net Assets | | | | | | | | | | | | | |
| Paid-in capital | | $ | 469,497,540 | | $ | 22,883,848 | | $ | 373,809,307 | | $ | 16,823,180 | |
| Accumulated net investment income | | | 199,279 | | | 702 | | | 11,899 | | | - | |
| Accumulated net realized gains | | | | | | | | | | | | | |
| from investment transactions | | | 4,408,113 | | | 165,327 | | | 10,401,718 | | | 1,330,812 | |
| Net unrealized appreciation | | | | | | | | | | | | | |
| on investments | | | 43,835,126 | | | 912,472 | | | 35,683,429 | | | 763,270 | |
Net Assets | | $ | 517,940,058 | | $ | 23,962,349 | | $ | 419,906,353 | | $ | 18,917,262 | |
| | | | | | | | | | | | | | |
Pricing of Class A Shares | | | | | | | | | | | | | |
| Net assets attributable to Class A shares | | $ | 431,524,050 | | $ | 9,608,182 | | $ | 338,285,697 | | $ | 10,036,243 | |
| Shares of beneficial interest outstanding | | | | | | | | | | | | | |
| (unlimited number of shares authorized, no par value) | | | 17,240,483 | | | 880,952 | | | 20,678,829 | | | 898,117 | |
| Net asset value and redemption price per share | | $ | 25.03 | | $ | 10.91 | | $ | 16.36 | | $ | 11.17 | |
| Maximum offering price per share | | $ | 26.35 | | $ | 11.48 | | $ | 17.22 | | $ | 11.76 | |
| | | | | | | | | | | | | | |
Pricing of Class C Shares | | | | | | | | | | | | | |
| Net assets attributable to Class C shares | | $ | 35,035,230 | | $ | 2,368,058 | | $ | 22,438,409 | | $ | 5,660,547 | |
| Shares of beneficial interest outstanding | | | | | | | | | | | | | |
| (unlimited number of shares authorized, no par value) | | | 1,460,105 | | | 218,292 | | | 1,403,008 | | | 507,327 | |
| Net asset value, offering price and | | | | | | | | | | | | | |
| redemption price per share (A) | | $ | 24.00 | | $ | 10.85 | | $ | 15.99 | | $ | 11.16 | |
| | | | | | | | | | | | | | |
Pricing of Class I Shares | | | | | | | | | | | | | |
| Net assets attributable to Class I shares | | $ | 51,380,778 | | $ | 11,986,109 | | $ | 59,182,247 | | $ | 3,220,472 | |
| Shares of beneficial interest outstanding | | | | | | | | | | | | | |
| (unlimited number of shares authorized, no par value) | | | 2,048,768 | | | 1,098,386 | | | 3,608,275 | | | 288,458 | |
| Net asset value, offering price and | | | | | | | | | | | | | |
| redemption price per share | | $ | 25.08 | | $ | 10.91 | | $ | 16.40 | | $ | 11.16 | |
| (A) | Redemption price per share varies based upon holding period. |
See accompanying Notes to Financial Statements.
| Diamond Hill Funds Annual Report December 31, 2006 | Page 35 |
Diamond Hill Funds
Statements of Assets & Liabilities
December 31, 2006
| | | | | Financial | | Strategic | |
| | | Long-Short | | Long-Short | | Income | |
| | | Fund | | Fund | | Fund | |
Assets | | | | | | | | | | |
| Investment securities, at cost | | $ | 1,139,480,217 | | $ | 37,220,441 | | $ | 125,756,529 | |
| Investment securities, at market value | | $ | 1,218,725,079 | | $ | 43,757,500 | | $ | 129,835,172 | |
| Deposits with brokers for securities sold short | | | 466,370,405 | | | 3,828,162 | | | - | |
| Cash | | | - | | | - | | | 36,783 | |
| Receivable for securities sold | | | 2,372,092 | | | 351,344 | | | 509,287 | |
| Receivable for fund shares issued | | | 11,027,749 | | | 111,466 | | | 944,635 | |
| Receivable for dividends and interest | | | 3,586,872 | | | 137,665 | | | 1,072,026 | |
Total Assets | | | 1,702,082,197 | | | 48,186,137 | | | 132,397,903 | |
| | | | | | | | | | | |
Liabilities | | | | | | | | | | |
| Securities sold short, at value (proceeds $447,151,804 for the | | | | | | | | | | |
| Long-Short Fund and $4,147,194 for the Financial Long-Short Fund) | | | 443,164,226 | | | 4,383,578 | | | - | |
| Dividends payable | | | 2,493,799 | | | 91,303 | | | 65,272 | |
| Payable for securities purchased | | | 1,272,135 | | | - | | | 1,540,189 | |
| Payable for dividends on securities sold short | | | 134,829 | | | 4,085 | | | - | |
| Payable for fund shares redeemed | | | 474,955 | | | 25,868 | | | 31,694 | |
| Payable to Investment Adviser | | | 917,604 | | | 36,566 | | | 53,333 | |
| Payable to Administrator | | | 324,285 | | | 13,161 | | | 30,697 | |
| Accrued distribution and service fees | | | 854,932 | | | 33,213 | | | 94,868 | |
Total Liabilities | | | 449,636,765 | | | 4,587,774 | | | 1,816,053 | |
| | | | | | | | | | | |
Net Assets | | $ | 1,252,445,432 | | $ | 43,598,363 | | $ | 130,581,850 | |
| | | | | | | | | | | |
Components of Net Assets | | | | | | | | | | |
| Paid-in capital | | $ | 1,137,870,059 | | $ | 37,118,670 | | $ | 126,538,979 | |
| Accumulated net investment income | | | 31,430 | | | 18,935 | | | 1,137,687 | |
| Accumulated net realized gains (losses) | | | | | | | | | | |
| from investment transactions | | | 31,311,503 | | | 160,083 | | | (1,173,459 | ) |
| Net unrealized appreciation on investments | | | 83,232,440 | | | 6,300,675 | | | 4,078,643 | |
Net Assets | | $ | 1,252,445,432 | | $ | 43,598,363 | | $ | 130,581,850 | |
| | | | | | | | | | | |
Pricing of Class A Shares | | | | | | | | | | |
| Net assets attributable to Class A shares | | $ | 773,161,385 | | $ | 38,978,217 | | $ | 49,371,713 | |
| Shares of beneficial interest outstanding | | | | | | | | | | |
| (unlimited number of shares authorized, no par value) | | | 41,642,709 | | | 1,864,843 | | | 4,217,585 | |
| Net asset value and redemption price per share | | $ | 18.57 | | $ | 20.90 | | $ | 11.71 | |
| Maximum offering price per share | | $ | 19.55 | | $ | 22.00 | | $ | 12.13 | |
| | | | | | | | | | | |
Pricing of Class C Shares | | | | | | | | | | |
| Net assets attributable to Class C shares | | $ | 188,550,343 | | $ | 4,620,146 | | $ | 26,908,483 | |
| Shares of beneficial interest outstanding | | | | | | | | | | |
| (unlimited number of shares authorized, no par value) | | | 10,546,563 | | | 229,860 | | | 2,300,533 | |
| Net asset value, offering price and | | | | | | | | | | |
| redemption price per share (A) | | $ | 17.88 | | $ | 20.10 | | $ | 11.70 | |
| | | | | | | | | | | |
Pricing of Class I Shares | | | | | | | | | | |
| Net assets attributable to Class I shares | | $ | 290,733,704 | | $ | - | | $ | 54,301,654 | |
| Shares of beneficial interest outstanding | | | | | | | | | | |
| (unlimited number of shares authorized, no par value) | | | 15,604,827 | | | - | | | 4,645,681 | |
| Net asset value, offering price and | | | | | | | | | | |
| redemption price per share | | $ | 18.63 | | $ | - | | $ | 11.69 | |
| (A) | Redemption price per share varies based upon holding period. |
See accompanying Notes to Financial Statements.
| Page 36 | Diamond Hill Funds Annual Report December 31, 2006 |
Diamond Hill Funds
Statements of Operations
For the year ended December 31, 2006
| | | | | Small-Mid | | | | | |
| | | Small Cap | | Cap | | Large Cap | | Select | |
| | | Fund | | Fund | | Fund | | Fund | |
Investment Income | | | | | | | | | | | | | |
| Dividends | | $ | 6,727,415 | | $ | 211,167 | | $ | 6,619,934 | | $ | 334,195 | |
| Interest | | | 2,332,572 | | | 3,596 | | | 352,150 | | | 194 | |
Total Investment Income | | | 9,059,987 | | | 214,763 | | | 6,972,084 | | | 334,389 | |
| | | | | | | | | | | | | | |
Expenses | | | | | | | | | | | | | |
| Investment advisory fees | | | 4,023,095 | | | 90,689 | | | 1,640,217 | | | 99,510 | |
| Administration fees | | | 1,777,106 | | | 37,220 | | | 961,401 | | | 48,201 | |
| Distribution fees - Class A | | | 1,031,234 | | | 16,535 | | | 581,474 | | | 21,536 | |
| Distribution and service fees - Class C | | | 387,687 | | | 16,680 | | | 161,697 | | | 38,537 | |
Total Expenses | | | 7,219,122 | | | 161,124 | | | 3,344,789 | | | 207,784 | |
| Fees waived | | | - | | | (13,164 | ) | | - | | | (1,555 | ) |
Net expenses | | | 7,219,122 | | | 147,960 | | | 3,344,789 | | | 206,229 | |
| | | | | | | | | | | | | | |
Net Investment Income | | | 1,840,865 | | | 66,803 | | | 3,627,295 | | | 128,160 | |
| | | | | | | | | | | | | | |
Realized and Unrealized Gains | | | | | | | | | | | | | |
on Investments | | | | | | | | | | | | | |
| Net realized gains from security transactions | | | 13,279,686 | | | 290,830 | | | 13,150,211 | | | 353,784 | |
| Net change in unrealized appreciation/depreciation | | | | | | | | | | | | | |
| on investments | | | 14,570,777 | | | 912,472 | | | 25,863,722 | | | 763,270 | |
Net Realized and Unrealized Gains | | | | | | | | | | | | | |
on Investments | | | 27,850,463 | | | 1,203,302 | | | 39,013,933 | | | 1,117,054 | |
| | | | | | | | | | | | | | |
Net Change in Net Assets | | | | | | | | | | | | | |
from Operations | | $ | 29,691,328 | | $ | 1,270,105 | | $ | 42,641,228 | | $ | 1,245,214 | |
| | | | | Financial | | Strategic | |
| | | Long-Short | | Long-Short | | Income | |
| | | Fund | | Fund | | Fund | |
| | | | | | | | |
Investment Income | | | | | | | | | | |
| Dividends | | $ | 29,458,413 | | $ | 966,051 | | $ | 5,189,768 | |
| Interest | | | 1,258,548 | | | 20,522 | | | 2,256,661 | |
Total Investment Income | | | 30,716,961 | | | 986,573 | | | 7,446,429 | |
| | | | | | | | | | | |
Expenses | | | | | | | | | | |
| Investment advisory fees | | | 7,019,583 | | | 281,198 | | | 494,045 | |
| Administration fees | | | 2,570,881 | | | 103,930 | | | 300,780 | |
| Distribution fees - Class A | | | 1,240,259 | | | 62,530 | | | 101,147 | |
| Distribution and service fees - Class C | | | 1,222,585 | | | 31,066 | | | 228,319 | |
| Dividend expense on securities sold short | | | 2,026,278 | | | 24,206 | | | - | |
Total Expenses | | | 14,079,586 | | | 502,930 | | | 1,124,291 | |
| | | | | | | | | | | |
Net Investment Income | | | 16,637,375 | | | 483,643 | | | 6,322,138 | |
| | | | | | | | | | | |
Realized and Unrealized Gains (Losses) | | | | | | | | | | |
on Investments | | | | | | | | | | |
| Net realized gains (losses) from security transactions | | | 48,765,541 | | | 1,001,438 | | | (1,176,522 | ) |
| Net realized gains on closed short positions | | | 7,580,802 | | | 6,179 | | | - | |
| Net change in unrealized appreciation/depreciation | | | | | | | | | | |
| on investments | | | 46,892,489 | | | 3,012,090 | | | 4,867,608 | |
Net Realized and Unrealized Gains | | | | | | | | | | |
on Investments | | | 103,238,832 | | | 4,019,707 | | | 3,691,086 | |
| | | | | | | | | | | |
Net Change in Net Assets | | | | | | | | | | |
from Operations | | $ | 119,876,207 | | $ | 4,503,350 | | $ | 10,013,224 | |
| * | Net of withholding tax of $12,828. |
See accompanying Notes to Financial Statements.
| Diamond Hill Funds Annual Report December 31, 2006 | Page 37 |
Diamond Hill Funds
Statements of Changes in Net Assets
| | | | | | | Small-Mid | | | | | | Select | |
| | | Small Cap Fund | | Cap Fund | | Large Cap Fund | | Fund | |
| | | For the Year | | For the Year | | For the Year | | For the Year | | For the Year | | For the Year | |
| | | Ended | | Ended | | Ended | | Ended | | Ended | | Ended | |
| | | December 31, | | December 31, | | December 31, | | December 31, | | December 31, | | December 31, | |
| | | 2006 | | 2005 (A) | | 2006 (B) | | 2006 | | 2005 (C) | | 2006 (B) | |
From Operations | | | | | | | | | | | | | | | | | | | |
| Net investment income | | $ | 1,840,865 | | $ | 141,795 | | $ | 66,803 | | $ | 3,627,295 | | $ | 441,041 | | $ | 128,160 | |
| Net realized gains (losses) from security transactions: | | | | | | | | | | | | | | | | | | | |
| Non-affiliated securities | | | 13,279,686 | | | 6,070,948 | | | 290,830 | | | 13,150,211 | | | 826,223 | | | 353,784 | |
| Affiliated securities | | | - | | | (24,485 | ) | | - | | | - | | | - | | | - | |
| Net change in unrealized appreciation/ | | | | | | | | | | | | | | | | | | | |
| depreciation on investments | | | 14,570,777 | | | 16,538,473 | | | 912,472 | | | 25,863,722 | | | 6,001,089 | | | 763,270 | |
Net Change in Net Assets from Operations | | | 29,691,328 | | | 22,726,731 | | | 1,270,105 | | | 42,641,228 | | | 7,268,353 | | | 1,245,214 | |
| | | | | | | | | | | | | | | | | | | | |
Distributions to Shareholders | | | | | | | | | | | | | | | | | | | |
| From net investment income - Class A | | | (1,461,271 | ) | | (88,670 | ) | | (11,426 | ) | | (2,849,167 | ) | | (385,575 | ) | | (72,460 | ) |
| From net investment income - Class C | | | - | | | - | | | - | | | (71,342 | ) | | - | | | (18,228 | ) |
| From net investment income - Class I | | | (377,249 | ) | | (52,777 | ) | | (54,675 | ) | | (697,950 | ) | | (52,388 | ) | | (36,839 | ) |
| From net realized gains on investments - Class A | | | (8,863,709 | ) | | (2,332,978 | ) | | (49,613 | ) | | (2,314,419 | ) | | (204,951 | ) | | (101,349 | ) |
| From net realized gains on investments - Class C | | | (754,982 | ) | | (341,473 | ) | | (12,636 | ) | | (158,661 | ) | | (22,510 | ) | | (57,943 | ) |
| From net realized gains on investments - Class I | | | (1,100,628 | ) | | (198,862 | ) | | (63,254 | ) | | (395,892 | ) | | (19,857 | ) | | (34,363 | ) |
Decrease in Net Assets from | | | | | | | | | | | | | | | | | | | |
Distributions to Shareholders | | | (12,557,839 | ) | | (3,014,760 | ) | | (191,604 | ) | | (6,487,431 | ) | | (685,281 | ) | | (321,182 | ) |
| | | | | | | | | | | | | | | | | | | | |
From Capital Transactions | | | | | | | | | | | | | | | | | | | |
Class A | | | | | | | | | | | | | | | | | | | |
| Proceeds from shares sold | | | 241,663,449 | | | 272,059,463 | | | 9,566,845 | | | 268,607,885 | | | 79,782,242 | | | 18,883,568 | |
| Reinvested distributions | | | 9,911,385 | | | 2,281,094 | | | 59,115 | | | 4,850,082 | | | 566,483 | | | 94,612 | |
| Payments for shares redeemed | | | (143,145,225 | ) | | (36,684,907 | ) | | (426,881 | ) | | (62,457,935 | ) | | (6,447,538 | ) | | (9,380,029 | ) |
Net Increase in Net Assets from | | | | | | | | | | | | | | | | | | | |
Class A Share Transactions | | | 108,429,609 | | | 237,655,650 | | | 9,199,079 | | | 211,000,032 | | | 73,901,187 | | | 9,598,151 | |
| | | | | | | | | | | | | | | | | | | | |
Class C | | | | | | | | | | | | | | | | | | | |
| Proceeds from shares sold | | | 1,486,361 | | | 25,920,075 | | | 2,414,652 | | | 12,780,229 | | | 7,614,242 | | | 6,235,183 | |
| Reinvested distributions | | | 681,608 | | | 291,659 | | | 10,875 | | | 195,346 | | | 20,057 | | | 47,945 | |
| Payments for shares redeemed | | | (9,741,761 | ) | | (3,260,981 | ) | | (144,768 | ) | | (2,147,915 | ) | | (516,179 | ) | | (901,037 | ) |
Net Increase (Decrease) in Net Assets | | | | | | | | | | | | | | | | | | | |
from Class C Share Transactions | | | (7,573,792 | ) | | 22,950,753 | | | 2,280,759 | | | 10,827,660 | | | 7,118,120 | | | 5,382,091 | |
| | | | | | | | | | | | | | | | | | | | |
Class I | | | | | | | | | | | | | | | | | | | |
| Proceeds from shares sold | | | 30,854,005 | | | 34,880,113 | | | 11,789,608 | | | 46,111,291 | | | 9,959,881 | | | 3,190,001 | |
| Reinvested distributions | | | 1,300,894 | | | 216,466 | | | 114,768 | | | 1,042,006 | | | 72,245 | | | 57,377 | |
| Payments for shares redeemed | | | (17,678,427 | ) | | (611,156 | ) | | (500,366 | ) | | (1,825,245 | ) | | (106,505 | ) | | (234,390 | ) |
Net Increase in Net Assets from Class I | | | | | | | | | | | | | | | | | | | |
Share Transactions | | | 14,476,472 | | | 34,485,423 | | | 11,404,010 | | | 45,328,052 | | | 9,925,621 | | | 3,012,988 | |
| | | | | | | | | | | | | | | | | | | | |
Total Increase in Net Assets | | | 132,465,778 | | | 314,803,797 | | | 23,962,349 | | | 303,309,541 | | | 97,528,000 | | | 18,917,262 | |
| | | | | | | | | | | | | | | | | | | | |
Net Assets | | | | | | | | | | | | | | | | | | | |
| Beginning of year | | | 385,474,280 | | | 70,670,483 | | | - | | | 116,596,812 | | | 19,068,812 | | | - | |
| End of year | | $ | 517,940,058 | | $ | 385,474,280 | | $ | 23,962,349 | | $ | 419,906,353 | | $ | 116,596,812 | | $ | 18,917,262 | |
| | | | | | | | | | | | | | | | | | | | |
Accumulated Net Investment Income | | $ | 199,279 | | $ | 138,005 | | $ | 702 | | $ | 11,899 | | $ | 3,063 | | $ | - | |
| (A) | Except for Class I shares, which represents the period from commencement of operations (April 29, 2005) through December 31, 2005. |
| (B) | Represents the period from commencement of operations (December 31, 2005) through December 31, 2006, and commencement of public offering and investment operations on January 3, 2006. |
| (C) | Except for Class I shares, which represents the period from commencement of operations (January 31, 2005) through December 31, 2005. |
See accompanying Notes to Financial Statements.
| Page 38 | Diamond Hill Funds Annual Report December 31, 2006 |
Diamond Hill Funds
Statements of Changes in Net Assets
| | | | | | | Financial | | Strategic | |
| | | Long-Short Fund | | Long-Short Fund | | Income Fund | |
| | | For the Year | | For the Year | | For the Year | | For the Year | | For the Year | | For the Year | |
| | | Ended | | Ended | | Ended | | Ended | | Ended | | Ended | |
| | | December 31, | | December 31, | | December 31, | | December 31, | | December 31, | | December 31, | |
| | | 2006 | | 2005 | | 2006 | | 2005 | | 2006 | | 2005 (A) | |
From Operations | | | | | | | | | | | | | | | | | | | |
| Net investment income | | $ | 16,637,375 | | $ | 1,645,465 | | $ | 483,643 | | $ | 293,936 | | $ | 6,322,138 | | $ | 3,724,159 | |
| Net realized gains (losses) from security transactions: | | | | | | | | | | | | | | | | | | | |
| Non-affiliated securities | | | 48,765,541 | | | 3,166,349 | | | 1,001,438 | | | 562,835 | | | (1,176,522 | ) | | (321,092 | ) |
| Affiliated securities | | | - | | | (64,286 | ) | | - | | | (10,916 | ) | | - | | | - | |
| Net realized gains (losses) on closed short positions | | | 7,580,802 | | | (510,782 | ) | | 6,179 | | | - | | | - | | | - | |
| Net change in unrealized appreciation/ | | | | | | | | | | | | | | | | | | | |
| depreciation on investments | | | 46,892,489 | | | 28,139,410 | | | 3,012,090 | | | (1,035,600 | ) | | 4,867,608 | | | (2,177,920 | ) |
Net Change in Net Assets from Operations | | �� | 119,876,207 | | | 32,376,156 | | | 4,503,350 | | | (189,745 | ) | | 10,013,224 | | | 1,225,147 | |
| | | | | | | | | | | | | | | | | | | | |
Distributions to Shareholders | | | | | | | | | | | | | | | | | | | |
| From net investment income - Class A | | | (10,232,380 | ) | | (1,064,052 | ) | | (450,305 | ) | | (277,083 | ) | | (2,386,238 | ) | | (1,813,171 | ) |
| From net investment income - Class C | | | (1,714,365 | ) | | (110,997 | ) | | (32,134 | ) | | (17,156 | ) | | (1,162,593 | ) | | (949,813 | ) |
| From net investment income - Class I | | | (4,666,367 | ) | | (470,175 | ) | | - | | | - | | | (2,292,771 | ) | | (935,928 | ) |
| From net realized gains on investments - Class A | | | (15,916,405 | ) | | (398,831 | ) | | (646,082 | ) | | (335,366 | ) | | - | | | - | |
| From net realized gains on investments - Class C | | | (4,076,127 | ) | | (178,867 | ) | | (77,458 | ) | | (52,250 | ) | | - | | | - | |
| From net realized gains on investments - Class I | | | (5,994,042 | ) | | (133,705 | ) | | - | | | - | | | - | | | - | |
Decrease in Net Assets from | | | | | | | | | | | | | | | | | | | |
Distributions to Shareholders | | | (42,599,686 | ) | | (2,356,627 | ) | | (1,205,979 | ) | | (681,855 | ) | | (5,841,602 | ) | | (3,698,912 | ) |
| | | | | | | | | | | | | | | | | | | | |
From Capital Transactions | | | | | | | | | | | | | | | | | | | |
Class A | | | | | | | | | | | | | | | | | | | |
| Proceeds from shares sold | | | 748,080,923 | | | 138,921,865 | | | 28,386,555 | | | 5,743,426 | | | 22,508,919 | | | 18,458,705 | |
| Reinvested distributions | | | 23,482,616 | | | 1,341,912 | | | 887,198 | | | 556,551 | | | 2,218,191 | | | 1,568,418 | |
| Payments for shares redeemed | | | (227,866,464 | ) | | (24,382,765 | ) | | (10,597,849 | ) | | (8,881,274 | ) | | (8,471,730 | ) | | (18,749,601 | ) |
Net Increase (Decrease) in Net Assets from | | | | | | | | | | | | | | | | | | | |
Class A Share Transactions | | | 543,697,075 | | | 115,881,012 | | | 18,675,904 | | | (2,581,297 | ) | | 16,255,380 | | | 1,277,522 | |
| | | | | | | | | | | | | | | | | | | | |
Class C | | | | | | | | | | | | | | | | | | | |
| Proceeds from shares sold | | | 116,274,212 | | | 43,809,596 | | | 2,362,985 | | | 2,066,101 | | | 10,823,237 | | | 8,119,575 | |
| Reinvested distributions | | | 4,678,090 | | | 246,770 | | | 85,778 | | | 61,907 | | | 977,800 | | | 716,306 | |
| Payments for shares redeemed | | | (16,096,040 | ) | | (1,883,931 | ) | | (734,210 | ) | | (3,388,240 | ) | | (6,161,653 | ) | | (3,425,855 | ) |
Net Increase (Decrease) in Net Assets from | | | | | | | | | | | | | | | | | | | |
Class C Share Transactions | | | 104,856,262 | | | 42,172,435 | | | 1,714,553 | | | (1,260,232 | ) | | 5,639,384 | | | 5,410,026 | |
| | | | | | | | | | | | | | | | | | | | |
Class I | | | | | | | | | | | | | | | | | | | |
| Proceeds from shares sold | | | 261,137,582 | | | 54,066,213 | | | - | | | - | | | 28,201,031 | | | 25,428,393 | |
| Reinvested distributions | | | 8,126,804 | | | 451,130 | | | - | | | - | | | 1,985,620 | | | 805,057 | |
| Payments for shares redeemed | | | (50,447,972 | ) | | (2,608,726 | ) | | - | | | - | | | (2,683,189 | ) | | (268,673 | ) |
Net Increase in Net Assets from Class I | | | | | | | | | | | | | | | | | | | |
Share Transactions | | | 218,816,414 | | | 51,908,617 | | | - | | | - | | | 27,503,462 | | | 25,964,777 | |
| | | | | | | | | | | | | | | | | | | | |
Total Increase (Decrease) in Net Assets | | | 944,646,272 | | | 239,981,593 | | | 23,687,828 | | | (4,713,129 | ) | | 53,569,848 | | | 30,178,560 | |
| | | | | | | | | | | | | | | | | | | | |
Net Assets | | | | | | | | | | | | | | | | | | | |
| Beginning of year | | | 307,799,160 | | | 67,817,567 | | | 19,910,535 | | | 24,623,664 | | | 77,012,002 | | | 46,833,442 | |
| End of year | | $ | 1,252,445,432 | | $ | 307,799,160 | | $ | 43,598,363 | | $ | 19,910,535 | | $ | 130,581,850 | | $ | 77,012,002 | |
| | | | | | | | | | | | | | | | | | | | |
Undistributed Net Investment Income | | $ | 31,430 | | $ | 241 | | $ | 18,935 | | $ | 36,750 | | $ | 1,137,687 | | $ | 142,058 | |
| (A) | Except for Class I shares, which represents the period from commencement of operations (January 31, 2005) through December 31, 2005. |
See accompanying Notes to Financial Statements.
| Diamond Hill Funds Annual Report December 31, 2006 | Page 39 |
Diamond Hill Funds
Schedule of Capital Share Transactions
| | | | | | | Small-Mid | | | | | | | |
| | | Small Cap Fund | | Cap Fund | | Large Cap Fund | | Select Fund | |
| | | For the | | For the | | For the | | For the | | For the | | For the | |
| | | Year | | Year | | Year | | Year | | Year | | Year | |
| | | Ended | | Ended | | Ended | | Ended | | Ended | | Ended | |
| | | December 31, | | December 31, | | December 31, | | December 31, | | December 31, | | December 31, | |
| | | 2006 | | 2005 (A) | | 2006 (B) | | 2006 | | 2005 (C) | | 2006 (B) | |
Shares | | | | | | | | | | | | | | | | | | | |
Class A Shares: | | | | | | | | | | | | | | | | | | | |
| Issued | | | 9,777,692 | | | 11,884,617 | | | 916,260 | | | 17,711,819 | | | 5,750,819 | | | 1,789,739 | |
| Reinvested | | | 391,952 | | | 95,244 | | | 5,370 | | | 295,973 | | | 39,239 | | | 8,440 | |
| Redeemed | | | (5,825,945 | ) | | (1,670,736 | ) | | (40,678 | ) | | (4,021,684 | ) | | (485,251 | ) | | (900,062 | ) |
| Net increase in shares outstanding | | | 4,343,699 | | | 10,309,125 | | | 880,952 | | | 13,986,108 | | | 5,304,807 | | | 898,117 | |
| Shares outstanding, beginning of period | | | 12,896,784 | | | 2,587,659 | | | - | | | 6,692,721 | | | 1,387,914 | | | - | |
| Shares outstanding, end of period | | | 17,240,483 | | | 12,896,784 | | | 880,952 | | | 20,678,829 | | | 6,692,721 | | | 898,117 | |
Class C Shares: | | | | | | | | | | | | | | | | | | | |
| Issued | | | 62,322 | | | 1,190,447 | | | 231,713 | | | 861,725 | | | 573,027 | | | 589,923 | |
| Reinvested | | | 28,154 | | | 12,631 | | | 992 | | | 12,222 | | | 1,423 | | | 4,291 | |
| Redeemed | | | (411,819 | ) | | (155,648 | ) | | (14,413 | ) | | (143,533 | ) | | (40,015 | ) | | (86,887 | ) |
| Net increase (decrease) in shares outstanding | | | (321,343 | ) | | 1,047,430 | | | 218,292 | | | 730,414 | | | 534,435 | | | 507,327 | |
| Shares outstanding, beginning of period | | | 1,781,448 | | | 734,018 | | | - | | | 672,594 | | | 138,159 | | | - | |
| Shares outstanding, end of period | | | 1,460,105 | | | 1,781,448 | | | 218,292 | | | 1,403,008 | | | 672,594 | | | 507,327 | |
Class I Shares: | | | | | | | | | | | | | | | | | | | |
| Issued | | | 1,236,764 | | | 1,494,015 | | | 1,133,512 | | | 2,936,838 | | | 724,463 | | | 304,517 | |
| Reinvested | | | 51,275 | | | 9,017 | | | 10,437 | | | 63,368 | | | 4,992 | | | 5,116 | |
| Redeemed | | | (716,344 | ) | | (25,959 | ) | | (45,563 | ) | | (113,791 | ) | | (7,595 | ) | | (21,175 | ) |
| Net increase in shares outstanding | | | 571,695 | | | 1,477,073 | | | 1,098,386 | | | 2,886,415 | | | 721,860 | | | 288,458 | |
| Shares outstanding, beginning of period | | | 1,477,073 | | | - | | | - | | | 721,860 | | | - | | | - | |
| Shares outstanding, end of period | | | 2,048,768 | | | 1,477,073 | | | 1,098,386 | | | 3,608,275 | | | 721,860 | | | 288,458 | |
| | | Long-Short Fund | | Financial Long-Short Fund | | Strategic Income Fund | |
| | | For the | | For the | | For the | | For the | | For the | | For the | |
| | | Year | | Year | | Year | | Year | | Year | | Year | |
| | | Ended | | Ended | | Ended | | Ended | | Ended | | Ended | |
| | | December 31, | | December 31, | | December 31, | | December 31, | | December 31, | | December 31, | |
| | | 2006 | | 2005 (C) | | 2006 | | 2005 | | 2006 | | 2005 (B) | |
Shares | | | | | | | | | | | | | | | | | | | |
Class A Shares: | | | | | | | | | | | | | | | | | | | |
| Issued | | | 42,263,327 | | | 9,071,724 | | | 1,417,131 | | | 308,794 | | | 1,967,217 | | | 1,594,116 | |
| Reinvested | | | 1,257,154 | | | 81,901 | | | 42,390 | | | 29,801 | | | 193,757 | | | 136,352 | |
| Redeemed | | | (12,814,047 | ) | | (1,656,054 | ) | | (534,193 | ) | | (482,068 | ) | | (740,245 | ) | | (1,622,010 | ) |
| Net increase (decrease) in shares outstanding | | | 30,706,434 | | | 7,497,571 | | | 925,328 | | | (143,473 | ) | | 1,420,729 | | | 108,458 | |
| Shares outstanding, beginning of period | | | 10,936,275 | | | 3,438,704 | | | 939,515 | | | 1,082,988 | | | 2,796,856 | | | 2,688,398 | |
| Shares outstanding, end of period | | | 41,642,709 | | | 10,936,275 | | | 1,864,843 | | | 939,515 | | | 4,217,585 | | | 2,796,856 | |
Class C Shares: | | | | | | | | | | | | | | | | | | | |
| Issued | | | 6,779,536 | | | 2,998,042 | | | 122,299 | | | 115,039 | | | 952,633 | | | 701,596 | |
| Reinvested | | | 260,608 | | | 15,703 | | | 4,273 | | | 3,444 | | | 85,466 | | | 62,364 | |
| Redeemed | | | (946,960 | ) | | (129,880 | ) | | (39,359 | ) | | (189,834 | ) | | (540,262 | ) | | (299,549 | ) |
| Net increase (decrease) in shares outstanding | | | 6,093,184 | | | 2,883,865 | | | 87,213 | | | (71,351 | ) | | 497,837 | | | 464,411 | |
| Shares outstanding, beginning of period | | | 4,453,379 | | | 1,569,514 | | | 142,647 | | | 213,998 | | | 1,802,696 | | | 1,338,285 | |
| Shares outstanding, end of period | | | 10,546,563 | | | 4,453,379 | | | 229,860 | | | 142,647 | | | 2,300,533 | | | 1,802,696 | |
Class I Shares: | | | | | | | | | | | | | | | | | | | |
| Issued | | | 14,523,326 | | | 3,586,245 | | | - | | | - | | | 2,455,009 | | | 2,205,980 | |
| Reinvested | | | 433,229 | | | 27,442 | | | - | | | - | | | 173,496 | | | 70,360 | |
| Redeemed | | | (2,799,639 | ) | | (165,776 | ) | | - | | | - | | | (235,712 | ) | | (23,452 | ) |
| Net increase in shares outstanding | | | 12,156,916 | | | 3,447,911 | | | - | | | - | | | 2,392,793 | | | 2,252,888 | |
| Shares outstanding, beginning of period | | | 3,447,911 | | | - | | | - | | | - | | | 2,252,888 | | | - | |
| Shares outstanding, end of period | | | 15,604,827 | | | 3,447,911 | | | - | | | - | | | 4,645,681 | | | 2,252,888 | |
| (A) | Except for Class I shares, which represents the period from commencement of operations (April 29, 2005) through December 31, 2005. |
| (B) | Represents the period from commencement of operations (December 31, 2005) through December 31, 2006, and commencement of public offering and investment operations on January 3, 2006. |
| (C) | Except for Class I shares, which represents the period from commencement of operations (January 31, 2005) through December 31, 2005. |
See accompanying Notes to Financial Statements.
| Page 40 | Diamond Hill Funds Annual Report December 31, 2006 |
Diamond Hill Funds
Financial Highlights
For a share outstanding throughout each period.
| | | Year Ended | | Year Ended | | Year Ended | | Year Ended | | Year Ended | |
| | | December 31, | | December 31, | | December 31, | | December 31, | | December 31, | |
Diamond Hill Small Cap Fund - Class A | | 2006 | | 2005 | | 2004 | | 2003 | | 2002 | |
| Net asset value at beginning of year | | $ | 23.95 | | $ | 21.41 | | $ | 16.82 | | $ | 11.26 | | $ | 12.29 | |
| Income (loss) from investment operations: | | | | | | | | | | | | | | | | |
| Net investment income (loss) | | | 0.09 | | | 0.02 | | | (0.03 | ) | | (0.06 | ) | | (0.17 | ) |
| Net realized and unrealized gains | | | | | | | | | | | | | | | | |
| (losses) on investments | | | 1.60 | | | 2.74 | | | 4.94 | | | 5.71 | | | (0.84 | ) |
| Total from investment operations | | | 1.69 | | | 2.76 | | | 4.91 | | | 5.65 | | | (1.01 | ) |
| Less Distributions: | | | | | | | | | | | | | | | | |
| Dividends from net investment income | | | (0.09 | ) | | (0.01 | ) | | - | | | - | | | - | |
| Distributions from net realized gains | | | (0.52 | ) | | (0.21 | ) | | (0.32 | ) | | (0.09 | ) | | (0.02 | ) |
| Total distributions | | | (0.61 | ) | | (0.22 | ) | | (0.32 | ) | | (0.09 | ) | | (0.02 | ) |
| Net asset value at end of year | | $ | 25.03 | | $ | 23.95 | | $ | 21.41 | | $ | 16.82 | | $ | 11.26 | |
| Total return(A) | | | 7.03 | % | | 12.90 | % | | 29.26 | % | | 50.18 | % | | (8.23 | )% |
| Net assets at end of year (000s) | | $ | 431,524 | | $ | 308,925 | | $ | 55,411 | | $ | 11,919 | | $ | 6,603 | |
| Ratio of net expenses to average net assets | | | 1.42 | % | | 1.45 | % | | 1.50 | % | | 1.50 | % | | 1.50 | % |
| Ratio of net investment income (loss) to average net assets | | | 0.38 | % | | 0.19 | % | | (0.35 | )% | | (0.57 | )% | | (0.70 | )% |
| Ratio of gross expenses to average net assets | | | 1.42 | % | | 1.45 | % | | 1.51 | % | | 1.51 | % | | 1.53 | % |
| Portfolio turnover rate | | | 30 | % | | 15 | % | | 30 | % | | 53 | % | | 49 | % |
| | | Year Ended | | Year Ended | | Year Ended | | Year Ended | | Year Ended | |
| | | December 31, | | December 31, | | December 31, | | December 31, | | December 31, | |
Diamond Hill Small Cap Fund - Class C | | 2006 | | 2005 | | 2004 | | 2003 | | 2002 | |
| Net asset value at beginning of year | | $ | 23.08 | | $ | 20.79 | | $ | 16.45 | | $ | 11.09 | | $ | 12.21 | |
| Income (loss) from investment operations: | | | | | | | | | | | | | | | | |
| Net investment loss | | | (0.10 | ) | | (0.08 | ) | | (0.15 | ) | | (0.18 | ) | | (0.23 | ) |
| Net realized and unrealized gains | | | | | | | | | | | | | | | | |
| (losses) on investments | | | 1.54 | | | 2.58 | | | 4.81 | | | 5.63 | | | (0.87 | ) |
| Total from investment operations | | | 1.44 | | | 2.50 | | | 4.66 | | | 5.45 | | | (1.10 | ) |
| Distributions from net realized gains | | | (0.52 | ) | | (0.21 | ) | | (0.32 | ) | | (0.09 | ) | | (0.02 | ) |
| Net asset value at end of year | | $ | 24.00 | | $ | 23.08 | | $ | 20.79 | | $ | 16.45 | | $ | 11.09 | |
| Total return(A) | | | 6.23 | % | | 12.05 | % | | 28.40 | % | | 49.15 | % | | (9.02 | )% |
| Net assets at end of year (000s) | | $ | 35,035 | | $ | 41,115 | | $ | 15,259 | | $ | 7,213 | | $ | 4,902 | |
| Ratio of net expenses to average net assets | | | 2.17 | % | | 2.20 | % | | 2.25 | % | | 2.25 | % | | 2.25 | % |
| Ratio of net investment loss to average net assets | | | (0.37 | )% | | (0.61 | )% | | (1.20 | )% | | (1.35 | )% | | (1.40 | )% |
| Ratio of gross expenses to average net assets | | | 2.17 | % | | 2.20 | % | | 2.26 | % | | 2.26 | % | | 2.28 | % |
| Portfolio turnover rate | | | 30 | % | | 15 | % | | 30 | % | | 53 | % | | 49 | % |
| | | Year Ended | | Period Ended | |
| | | December 31, | | December 31, | |
Diamond Hill Small Cap Fund - Class I | | 2006 | | 2005 (B) | |
| Net asset value at beginning of period | | $ | 23.99 | | $ | 19.93 | |
| Income from investment operations: | | | | | | | |
| Net investment income | | | 0.21 | | | 0.04 | |
| Net realized and unrealized gains on investments | | | 1.59 | | | 4.27 | |
| Total from investment operations | | | 1.80 | | | 4.31 | |
| Less Distributions: | | | | | | | |
| Dividends from net investment income | | | (0.19 | ) | | (0.04 | ) |
| Distributions from net realized gains | | | (0.52 | ) | | (0.21 | ) |
| Total distributions | | | (0.71 | ) | | (0.25 | ) |
| Net asset value at end of period | | $ | 25.08 | | $ | 23.99 | |
| Total return | | | 7.49 | % | | 21.63 | %(C) |
| Net assets at end of period (000s) | | $ | 51,381 | | $ | 35,434 | |
| Ratio of net expenses to average net assets | | | 0.99 | % | | 0.99 | %(D) |
| Ratio of net investment income to average net assets | | | 0.82 | % | | 0.74 | %(D) |
| Ratio of gross expenses to average net assets | | | 0.99 | % | | 0.99 | %(D) |
| Portfolio turnover rate | | | 30 | % | | 15 | % |
| (A) | Total returns shown exclude the effect of applicable sales charges. |
| (B) | Class I commenced operations on April 29, 2005. |
See accompanying Notes to Financial Statements.
| Diamond Hill Funds Annual Report December 31, 2006 | Page 41 |
Diamond Hill Funds
Financial Highlights
For a share outstanding throughout each period.
| | | Year Ended | |
| | | December 31, | |
Diamond Hill Small-Mid Cap Fund - Class A | | | 2006 (A | ) |
| Net asset value at beginning of year | | $ | 10.00 | |
| Income from investment operations: | | | | |
| Net investment income | | | 0.04 | |
| Net realized and unrealized gains | | | | |
| on investments | | | 0.94 | |
| Total from investment operations | | | 0.98 | |
| Less Distributions: | | | | |
| Dividends from net investment income | | | (0.01 | ) |
| Distributions from net realized gains | | | (0.06 | ) |
| Total distributions | | | (0.07 | ) |
| Net asset value at end of year | | $ | 10.91 | |
| Total return(B) | | | 9.81 | % |
| Net assets at end of year (000s) | | $ | 9,608 | |
| Ratio of net expenses to average net assets | | | 1.21 | % |
| Ratio of net investment income | | | | |
| to average net assets | | | 0.49 | % |
| Ratio of gross expenses to average net assets | | | 1.34 | % |
| Portfolio turnover rate | | | 33 | % |
| | | Year Ended | |
| | | December 31, | |
Diamond Hill Small-Mid Cap Fund - Class C | | 2006 (A) | |
| Net asset value at beginning of year | | $ | 10.00 | |
| Income (loss) from investment operations: | | | | |
| Net investment loss | | | (0.02 | ) |
| Net realized and unrealized gains | | | | |
| on investments | | | 0.93 | |
| Total from investment operations | | | 0.91 | |
| Distributions from net realized gains | | | (0.06 | ) |
| Net asset value at end of year | | $ | 10.85 | |
| Total return(B) | | | 9.08 | % |
| Net assets at end of year (000s) | | $ | 2,368 | |
| Ratio of net expenses to average net assets | | | 2.00 | % |
| Ratio of net investment loss to | | | | |
| average net assets | | | (0.27 | )% |
| Ratio of gross expenses to average net assets | | | 2.11 | % |
| Portfolio turnover rate | | | 33 | % |
| | | Year Ended | |
| | | December 31, | |
Diamond Hill Small-Mid Cap Fund - Class I | | 2006 (A) | |
| Net asset value at beginning of year | | $ | 10.00 | |
| Income from investment operations: | | | | |
| Net investment income | | | 0.04 | |
| Net realized and unrealized | | | | |
| gains on investments | | | 0.98 | |
| Total from investment operations | | | 1.02 | |
| Less Distributions: | | | | |
| Dividends from net investment income | | | (0.05 | ) |
| Distributions from net realized gains | | | (0.06 | ) |
| Total distributions | | | (0.11 | ) |
| Net asset value at end of year | | $ | 10.91 | |
| Total return | | | 10.18 | % |
| Net assets at end of year (000s) | | $ | 11,986 | |
| Ratio of net expenses to average net assets | | | 0.90 | % |
| Ratio of net investment income | | | | |
| to average net assets | | | 1.01 | % |
| Ratio of gross expenses to average net assets | | | 0.98 | % |
| Portfolio turnover rate | | | 33 | % |
| | | Year Ended | |
| | | December 31, | |
Diamond Hill Select Fund - Class A | | 2006 (A) | |
| Net asset value at beginning of year | | $ | 10.00 | |
| Income from investment operations: | | | | |
| Net investment income | | | 0.10 | |
| Net realized and unrealized gains | | | | |
| on investments | | | 1.27 | |
| Total from investment operations | | | 1.37 | |
| Less Distributions: | | | | |
| Dividends from net investment income | | | (0.08 | ) |
| Distributions from net realized gains | | | (0.12 | ) |
| Total distributions | | | (0.20 | ) |
| Net asset value at end of year | | $ | 11.17 | |
| Total return(A) | | | 13.66 | % |
| Net assets at end of year (000s) | | $ | 10,036 | |
| Ratio of net expenses to average net assets | | | 1.31 | % |
| Ratio of net investment income | | | | |
| to average net assets | | | 1.04 | % |
| Ratio of gross expenses to average net assets | | | 1.32 | % |
| Portfolio turnover rate | | | 80 | % |
| | | Year Ended | |
| | | December 31, | |
Diamond Hill Select Fund - Class C | | 2006 (A) | |
| Net asset value at beginning of year | | $ | 10.00 | |
| Income from investment operations: | | | | |
| Net investment income | | | 0.02 | |
| Net realized and unrealized gains | | | | |
| on investments | | | 1.30 | |
| Total from investment operations | | | 1.32 | |
| Less Distributions: | | | | |
| Dividends from net investment income | | | (0.04 | ) |
| Distributions from net realized gains | | | (0.12 | ) |
| Total distributions | | | (0.16 | ) |
| Net asset value at end of year | | $ | 11.16 | |
| Total return(A) | | | 13.11 | % |
| Net assets at end of year (000s) | | $ | 5,661 | |
| Ratio of net expenses to average net assets | | | 2.05 | % |
| Ratio of net investment income | | | | |
| to average net assets | | | 0.32 | % |
| Ratio of gross expenses to average net assets | | | 2.06 | % |
| Portfolio turnover rate | | | 80 | % |
| | | Year Ended | |
| | | December 31, | |
Diamond Hill Select Fund - Class I | | 2006 (A) | |
| Net asset value at beginning of year | | $ | 10.00 | |
| Income from investment operations: | | | | |
| Net investment income | | | 0.09 | |
| Net realized and unrealized | | | | |
| gains on investments | | | 1.32 | |
| Total from investment operations | | | 1.41 | |
| Less Distributions: | | | | |
| Dividends from net investment income | | | (0.13 | ) |
| Distributions from net realized gains | | | (0.12 | ) |
| Total distributions | | | (0.25 | ) |
| Net asset value at end of year | | $ | 11.16 | |
| Total return | | | 14.04 | % |
| Net assets at end of year (000s) | | $ | 3,220 | |
| Ratio of net expenses to average net assets | | | 0.84 | % |
| Ratio of net investment income | | | | |
| to average net assets | | | 1.47 | % |
| Ratio of gross expenses to average net assets | | | 0.86 | % |
| Portfolio turnover rate | | | 80 | % |
| (A) | Class A, Class C, and Class I commenced operations on December 31, 2005, and commenced public offering and investment operations on January 3, 2006. |
| (B) | Total return shown excludes the effect of applicable sales charges. |
See accompanying Notes to Financial Statements.
| Page 42 | Diamond Hill Funds Annual Report December 31, 2006 |
Diamond Hill Funds
Financial Highlights
For a share outstanding throughout the period.
| | | Year Ended | | Year Ended | | Year Ended | | Year Ended | | Year Ended | |
| | | December 31, | | December 31, | | December 31, | | December 31, | | December 31, | |
Diamond Hill Large Cap Fund - Class A | | 2006 | | 2005 | | 2004 | | 2003 | | 2002 | |
| Net asset value at beginning of year | | $ | 14.44 | | $ | 12.51 | | $ | 10.34 | | $ | 7.87 | | $ | 10.06 | |
| Income (loss) from investment operations: | | | | | | | | | | | | | | | | |
| Net investment income | | | 0.15 | | | 0.05 | | | 0.02 | | | 0.04 | | | 0.04 | |
| Net realized and unrealized gains | | | | | | | | | | | | | | | | |
| (losses) on investments | | | 2.03 | | | 1.98 | | | 2.16 | | | 2.47 | | | (2.13 | ) |
| Total from investment operations | | | 2.18 | | | 2.03 | | | 2.18 | | | 2.51 | | | (2.09 | ) |
| Less Distributions: | | | | | | | | | | | | | | | | |
| Dividends from net investment income | | | (0.14 | ) | | (0.06 | ) | | (0.01 | ) | | (0.04 | ) | | (0.04 | ) |
| Distributions from net realized gains | | | (0.12 | ) | | (0.04 | ) | | - | | | - | | | (0.06 | ) |
| Total distributions | | | (0.26 | ) | | (0.10 | ) | | (0.01 | ) | | (0.04 | ) | | (0.10 | ) |
| Net asset value at end of year | | $ | 16.36 | | $ | 14.44 | | $ | 12.51 | | $ | 10.34 | | $ | 7.87 | |
| Total return(A) | | | 15.06 | % | | 16.19 | % | | 21.12 | % | | 31.92 | % | | (20.74 | )% |
| Net assets at end of year (000s) | | $ | 338,286 | | $ | 96,637 | | $ | 17,369 | | $ | 6,437 | | $ | 3,300 | |
| Ratio of net expenses to average net assets | | | 1.21 | % | | 1.27 | % | | 1.40 | % | | 1.39 | % | | 1.40 | % |
| Ratio of net investment income to average net assets | | | 1.32 | % | | 1.08 | % | | 0.26 | % | | 0.62 | % | | 0.62 | % |
| Ratio of gross expenses to average net assets | | | 1.21 | % | | 1.27 | % | | 1.42 | % | | 1.43 | % | | 1.46 | % |
| Portfolio turnover rate | | | 32 | % | | 15 | % | | 13 | % | | 32 | % | | 71 | % |
| | | Year Ended | | Year Ended | | Year Ended | | Year Ended | | Year Ended | |
| | | December 31, | | December 31, | | December 31, | | December 31, | | December 31, | |
Diamond Hill Large Cap Fund - Class C | | 2006 | | 2005 | | 2004 | | 2003 | | 2002 | |
| Net asset value at beginning of year | | $ | 14.15 | | $ | 12.31 | | $ | 10.23 | | $ | 7.81 | | $ | 10.06 | |
| Income (loss) from investment operations: | | | | | | | | | | | | | | | | |
| Net investment income (loss) | | | 0.06 | | | 0.05 | | | (0.04 | ) | | - | | | - | |
| Net realized and unrealized gains | | | | | | | | | | | | | | | | |
| (losses) on investments | | | 1.95 | | | 1.83 | | | 2.12 | | | 2.42 | | | (2.19 | ) |
| Total from investment operations | | | 2.01 | | | 1.88 | | | 2.08 | | | 2.42 | | | (2.19 | ) |
| Less Distributions: | | | | | | | | | | | | | | | | |
| Dividends from net investment income | | | (0.05 | ) | | - | | | - | | | - | | | - | |
| Distributions from net realized gains | | | (0.12 | ) | | (0.04 | ) | | - | | | - | | | (0.06 | ) |
| Total distributions | | | (0.17 | ) | | (0.04 | ) | | - | | | - | | | (0.06 | ) |
| Net asset value at end of year | | $ | 15.99 | | $ | 14.15 | | $ | 12.31 | | $ | 10.23 | | $ | 7.81 | |
| Total return(A) | | | 14.18 | % | | 15.25 | % | | 20.33 | % | | 31.04 | % | | (21.73 | )% |
| Net assets at end of year (000s) | | $ | 22,438 | | $ | 9,518 | | $ | 1,700 | | $ | 871 | | $ | 260 | |
| Ratio of net expenses to average net assets | | | 1.96 | % | | 2.02 | % | | 2.15 | % | | 2.14 | % | | 2.15 | % |
| Ratio of net investment income | | | | | | | | | | | | | | | | |
| (loss) to average net assets | | | 0.57 | % | | 0.26 | % | | (0.54 | )% | | (0.14 | )% | | (0.10 | )% |
| Ratio of gross expenses to average net assets | | | 1.96 | % | | 2.02 | % | | 2.17 | % | | 2.18 | % | | 2.81 | % |
| Portfolio turnover rate | | | 32 | % | | 15 | % | | 13 | % | | 32 | % | | 71 | % |
| | | Year Ended | | Period Ended | |
| | | December 31, | | December 31, | |
Diamond Hill Large Cap Fund - Class I | | 2006 | | 2005 (B) | |
| Net asset value at beginning of period | | $ | 14.47 | | $ | 12.38 | |
| Income from investment operations: | | | | | | | |
| Net investment income | | | 0.13 | | | 0.08 | |
| Net realized and unrealized gains on investments | | | 2.12 | | | 2.13 | |
| Total from investment operations | | | 2.25 | | | 2.21 | |
| Less Distributions: | | | | | | | |
| Dividends from net investment income | | | (0.20 | ) | | (0.08 | ) |
| Distributions from net realized gains | | | (0.12 | ) | | (0.04 | ) |
| Total distributions | | | (0.32 | ) | | (0.12 | ) |
| Net asset value at end of period | | $ | 16.40 | | $ | 14.47 | |
| Total return | | | 15.49 | % | | 17.84 | %(C) |
| Net assets at end of period (000s) | | $ | 59,182 | | $ | 10,442 | |
| Ratio of net expenses to average net assets | | | 0.78 | % | | 0.80 | %(D) |
| Ratio of net investment income to average net assets | | | 1.82 | % | | 1.60 | %(D) |
| Ratio of gross expenses to average net assets | | | 78 | % | | 0.8 | %(D) |
| Portfolio turnover rate | | | 32 | % | | 15 | % |
| (A) | Total returns shown exclude the effect of applicable sales charges. |
| (B) | Class I commenced operations on January 31, 2005. |
See accompanying Notes to Financial Statements.
| Diamond Hill Funds Annual Report December 31, 2006 | Page 43 |
Diamond Hill Funds
Financial Highlights
For a share outstanding throughout each period.
| | | Year Ended | | Year Ended | | Year Ended | | Year Ended | | Year Ended | |
| | | December 31, | | December 31, | | December 31, | | December 31, | | December 31, | |
Diamond Hill Long-Short Fund - Class A | | 2006 | | 2005 | | 2004 | | 2003 | | 2002 | |
| Net asset value at beginning of year | | $ | 16.46 | | $ | 13.67 | | $ | 11.75 | | $ | 9.56 | | $ | 10.67 | |
| Income (loss) from investment operations: | | | | | | | | | | | | | | | | |
| Net investment income (loss) | | | 0.26 | | | 0.10 | | | 0.00(A | ) | | (0.01 | ) | | (0.06 | ) |
| Net realized and unrealized gains | | | | | | | | | | | | | | | | |
| (losses) on investments | | | 2.52 | | | 2.83 | | | 1.98 | | | 2.20 | | | (1.05 | ) |
| Total from investment operations | | | 2.78 | | | 2.93 | | | 1.98 | | | 2.19 | | | (1.11 | ) |
| Less Distributions: | | | | | | | | | | | | | | | | |
| Dividends from net investment income | | | (0.25 | ) | | (0.10 | ) | | - | | | - | | | - | |
| Distributions from net realized gains | | | (0.42 | ) | | (0.04 | ) | | (0.06 | ) | | - | | | - | |
| Total distributions | | | (0.67 | ) | | (0.14 | ) | | (0.06 | ) | | - | | | | |
| Net asset value at end of year | | $ | 18.57 | | $ | 16.46 | | $ | 13.67 | | $ | 11.75 | | $ | 9.56 | |
| Total return(B) | | | 16.89 | % | | 21.46 | % | | 16.86 | % | | 22.91 | % | | (10.4 | )% |
| Net assets at end of year (000s) | | $ | 773,161 | | $ | 180,035 | | $ | 47,008 | | $ | 16,216 | | $ | 11,518 | |
| Ratio of net expenses to average net assets | | | 1.77 | % | | 1.82 | % | | 1.78 | % | | 1.70 | % | | 1.60 | % |
| Ratio of net investment income (loss) to average net assets | | | 2.15 | % | | 1.12 | % | | 0.01 | % | | (0.07 | )% | | (0.39 | )% |
| Ratio of gross expenses to average net assets | | | 1.77 | % | | 1.82 | % | | 1.79 | % | | 1.71 | % | | 1.63 | % |
| Ratio of net expenses to average net assets, excluding | | | | | | | | | | | | | | | | |
| dividends on securities sold short | | | 1.51 | % | | 1.55 | % | | 1.60 | % | | 1.59 | % | | 1.48 | % |
| Portfolio turnover rate | | | 83 | % | | 58 | %(F) | | 53 | %(F) | | 41 | % | | 46 | % |
| | | Year Ended | | Year Ended | | Year Ended | | Year Ended | | Year Ended | |
| | | December 31, | | December 31, | | December 31, | | December 31, | | December 31, | |
Diamond Hill Long-Short Fund - Class C | | 2006 | | 2005 | | 2004 | | 2003 | | 2002 | |
| Net asset value at beginning of year | | $ | 15.92 | | $ | 13.26 | | $ | 11.48 | | $ | 9.42 | | $ | 10.60 | |
| Income (loss) from investment operations: | | | | | | | | | | | | | | | | |
| Net investment income (loss) | | | 0.16 | | | 0.03 | | | (0.05 | ) | | (0.04 | ) | | (0.29 | ) |
| Net realized and unrealized gains | | | | | | | | | | | | | | | | |
| (losses) on investments | | | 2.38 | | | 2.70 | | | 1.89 | | | 2.10 | | | (0.89 | ) |
| Total from investment operations | | | 2.54 | | | 2.73 | | | 1.84 | | | 2.06 | | | (1.18 | ) |
| Less Distributions: | | | | | | | | | | | | | | | | |
| Dividends from net investment income | | | (0.16 | ) | | (0.03 | ) | | - | | | - | | | - | |
| Distributions from net realized gains | | | (0.42 | ) | | (0.04 | ) | | (0.06 | ) | | - | | | - | |
| Total distributions | | | (0.58 | ) | | (0.07 | ) | | (0.06 | ) | | - | | | - | |
| Net asset value at end of year | | $ | 17.88 | | $ | 15.92 | | $ | 13.26 | | $ | 11.48 | | $ | 9.42 | |
| Total return(B) | | | 15.98 | % | | 20.58 | % | | 16.04 | % | | 21.87 | % | | (11.13 | )% |
| Net assets at end of year (000s) | | $ | 188,550 | | $ | 70,891 | | $ | 20,810 | | $ | 6,390 | | $ | 2,168 | |
| Ratio of net expenses to average net assets | | | 2.52 | % | | 2.57 | % | | 2.53 | % | | 2.45 | % | | 2.35 | % |
| Ratio of net investment income (loss) to average net assets | | | 1.40 | % | | 0.37 | % | | (0.73 | )% | | (0.75 | )% | | (1.15 | )% |
| Ratio of gross expenses to average net assets | | | 2.52 | % | | 2.57 | % | | 2.54 | % | | 2.46 | % | | 2.38 | % |
| Ratio of net expenses to average net assets, excluding | | | | | | | | | | | | | | | | |
| dividends on securities sold short | | | 2.26 | % | | 2.30 | % | | 2.35 | % | | 2.34 | % | | 2.23 | % |
| Portfolio turnover rate | | | 83 | % | | 58 | %(F) | | 53 | %(F) | | 41 | % | | 46 | % |
| Page 44 | Diamond Hill Funds Annual Report December 31, 2006 |
Diamond Hill Funds
Financial Highlights
For a share outstanding throughout each period.
| | | Year Ended | | Period Ended | |
| | | December 31, | | December 31, | |
Diamond Hill Long-Short Fund - Class I | | 2006 | | 2005 (C) | |
| Net asset value at beginning of period | | $ | 16.49 | | $ | 13.80 | |
| Income from investment operations: | | | | | | | |
| Net investment income | | | 0.28 | | | 0.14 | |
| Net realized and unrealized gains on investments | | | 2.59 | | | 2.73 | |
| Total from investment operations | | | 2.87 | | | 2.87 | |
| Less Distributions: | | | | | | | |
| Dividends from net investment income | | | (0.31 | ) | | (0.14 | ) |
| Distributions from net realized gains | | | (0.42 | ) | | (0.04 | ) |
| Total distributions | | | (0.73 | ) | | (0.18 | ) |
| Net asset value at end of period | | $ | 18.63 | | $ | 16.49 | |
| Total return | | | 17.37 | % | | 20.81 | %(D) |
| Net assets at end of period (000s) | | $ | 290,734 | | $ | 56,873 | |
| Ratio of net expenses to average net assets | | | 1.34 | % | | 1.39 | %(E) |
| Ratio of net investment income to average net assets | | | 2.60 | % | | 1.71 | %(E) |
| Ratio of gross expenses to average net assets | | | 1.34 | % | | 1.39 | %(E) |
| Ratio of net expenses to average net assets, excluding | | | | | | | |
| dividends on securities sold short | | | 1.08 | % | | 1.10 | %(E) |
| Portfolio turnover rate | | | 83 | % | | 58 | %(F) |
| (A) | Amount rounds to less than $ 0.005. |
| (B) | Total returns shown exclude the effect of applicable sales charges. |
| (C) | Class I commenced operations on January 31, 2005. |
| (F) | The portfolio turnover rate for December 31, 2005 and December 31, 2004 has been revised to include long-term short selling transactions. |
See accompanying Notes to Financial Statements.
| Diamond Hill Funds Annual Report December 31, 2006 | Page 45 |
Diamond Hill Funds
Financial Highlights
For a share outstanding throughout each period.
| | | Year Ended | | Year Ended | | Year Ended | | Year Ended | | Year Ended | |
| | | December 31, | | December 31, | | December 31, | | December 31, | | December 31, | |
Diamond Hill Financial Long-Short Fund - Class A | | 2006 | | 2005 | | 2004 | | 2003 | | 2002 | |
| Net asset value at beginning of year | | $ | 18.48 | | $ | 19.10 | | $ | 17.92 | | $ | 13.63 | | $ | 14.25 | |
| Income (loss) from investment operations: | | | | | | | | | | | | | | | | |
| Net investment income | | | 0.23 | | | 0.29 | | | 0.13 | | | 0.07 | | | 0.03 | |
| Net realized and unrealized gains (losses) | | | | | | | | | | | | | | | | |
| on investments | | | 2.79 | | | (0.24 | ) | | 2.84 | | | 5.60 | | | 1.58 | |
| Total from investment operations | | | 3.02 | | | 0.05 | | | 2.97 | | | 5.67 | | | 1.61 | |
| Less Distributions: | | | | | | | | | | | | | | | | |
| Dividends from net investment income | | | (0.24 | ) | | (0.30 | ) | | (0.13 | ) | | (0.06 | ) | | (0.03 | ) |
| Distributions from net realized gains | | | (0.36 | ) | | (0.37 | ) | | (1.66 | ) | | (1.32 | ) | | (2.20 | ) |
| Total distributions | | | (0.60 | ) | | (0.67 | ) | | (1.79 | ) | | (1.38 | ) | | (2.23 | ) |
| Net asset value at end of year | | $ | 20.90 | | $ | 18.48 | | $ | 19.10 | | $ | 17.92 | | $ | 13.63 | |
| Total return(A) | | | 16.35 | % | | 0.25 | % | | 16.67 | % | | 41.85 | % | | 11.22 | % |
| Net assets at end of year (000s) | | $ | 38,978 | | $ | 17,366 | | $ | 20,682 | | $ | 12,463 | | $ | 9,983 | |
| Ratio of net expenses to average net assets | | | 1.70 | % | | 1.67 | % | | 1.70 | % | | 1.68 | % | | 1.70 | % |
| Ratio of net investment income | | | | | | | | | | | | | | | | |
| to average net assets | | | 1.80 | % | | 1.41 | % | | 0.90 | % | | 0.45 | % | | 0.20 | % |
| Ratio of gross expenses to average net assets | | | 1.70 | % | | 1.67 | % | | 1.71 | % | | 1.70 | % | | 1.72 | % |
| Ratio of net expenses to average net assets, excluding | | | | | | | | | | | | | | | | |
| dividends on securities sold short | | | 1.62 | % | | - | | | - | | | - | | | - | |
| Portfolio turnover rate | | | 45 | % | | 28 | % | | 36 | % | | 53 | % | | 104 | % |
| | | Year Ended | | Year Ended | | Year Ended | | Year Ended | | Year Ended | |
| | | December 31, | | December 31, | | December 31, | | December 31, | | December 31, | |
Diamond Hill Financial Long-Short Fund - Class C | | 2006 | | 2005 | | 2004 | | 2003 | | 2002 | |
| Net asset value at beginning of year | | $ | 17.84 | | $ | 18.42 | | $ | 17.39 | | $ | 13.31 | | $ | 14.05 | |
| Income (loss) from investment operations: | | | | | | | | | | | | | | | | |
| Net investment income (loss) | | | 0.13 | | | 0.15 | | | 0.03 | | | (0.06 | ) | | 0.04 | |
| Net realized and unrealized gains (losses) | | | | | | | | | | | | | | | | |
| on investments | | | 2.63 | | | (0.24 | ) | | 2.70 | | | 5.46 | | | 1.46 | |
| Total from investment operations | | | 2.76 | | | (0.09 | ) | | 2.73 | | | 5.40 | | | 1.50 | |
| Less Distributions: | | | | | | | | | | | | | | | | |
| Dividends from net investment income | | | (0.14 | ) | | (0.12 | ) | | (0.04 | ) | | - | | | (0.04 | ) |
| Distributions from net realized gains | | | (0.36 | ) | | (0.37 | ) | | (1.66 | ) | | (1.32 | ) | | (2.20 | ) |
| Total distributions | | | (0.50 | ) | | (0.49 | ) | | (1.70 | ) | | (1.32 | ) | | (2.24 | ) |
| Net asset value at end of year | | $ | 20.10 | | $ | 17.84 | | $ | 18.42 | | $ | 17.39 | | $ | 13.31 | |
| Total return(A) | | | 15.47 | % | | (0.49 | )% | | 15.79 | % | | 40.85 | % | | 10.55 | % |
| Net assets at end of year (000s) | | $ | 4,620 | | $ | 2,544 | | $ | 3,941 | | $ | 1,974 | | $ | 787 | |
| Ratio of net expenses to average net assets | | | 2.45 | % | | 2.42 | % | | 2.45 | % | | 2.45 | % | | 2.45 | % |
| Ratio of net investment income (loss) | | | | | | | | | | | | | | | | |
| to average net assets | | | 1.03 | % | | 0.67 | % | | 0.20 | % | | (0.30 | )% | | (0.49 | )% |
| Ratio of gross expenses to average net assets | | | 2.45 | % | | 2.42 | % | | 2.46 | % | | 2.47 | % | | 2.47 | % |
| Ratio of net expenses to average net assets, excluding | | | | | | | | | | | | | | | | |
| dividends on securities sold short | | | 2.37 | % | | - | | | - | | | - | | | - | |
| Portfolio turnover rate | | | 45 | % | | 28 | % | | 36 | % | | 53 | % | | 104 | % |
| (A) | Total returns shown exclude the effect of applicable sales charges. |
See accompanying Notes to Financial Statements.
| Page 46 | Diamond Hill Funds Annual Report December 31, 2006 |
Diamond Hill Funds
Financial Highlights
For a share outstanding throughout each period.
| | | Year Ended | | Year Ended | | Year Ended | | Year Ended | | Period Ended | |
| | | December 31, | | December 31, | | December 31, | | December 31, | | December 31, | |
Diamond Hill Strategic Income Fund - Class A | | 2006 | | 2005 | | 2004 | | 2003 | | 2002 (A) | |
| Net asset value at beginning of period | | $ | 11.25 | | $ | 11.63 | | $ | 11.58 | | $ | 10.28 | | $ | 10.00 | |
| Income (loss) from investment operations: | | | | | | | | | | | | | | | | |
| Net investment income | | | 0.70 | | | 0.66 | | | 0.64 | | | 0.67 | | | 0.15 | |
| Net realized and unrealized gains | | | | | | | | | | | | | | | | |
| (losses) on investments | | | 0.42 | | | (0.38 | ) | | 0.19 | | | 1.39 | | | 0.30 | |
| Total from investment operations | | | 1.12 | | | 0.28 | | | 0.83 | | | 2.06 | | | 0.45 | |
| Less distributions: | | | | | | | | | | | | | | | | |
| Dividends from net investment income | | | (0.66 | ) | | (0.66 | ) | | (0.64 | ) | | (0.67 | ) | | (0.15 | ) |
| Distributions from net realized gains | | | - | | | - | | | (0.14 | ) | | (0.09 | ) | | (0.02 | ) |
| Total distributions | | | (0.66 | ) | | (0.66 | ) | | (0.78 | ) | | (0.76 | ) | | (0.17 | ) |
| Net asset value at end of period | | $ | 11.71 | | $ | 11.25 | | $ | 11.63 | | $ | 11.58 | | $ | 10.28 | |
| Total return(B) | | | 10.26 | % | | 2.41 | % | | 7.46 | % | | 20.67 | % | | 4.49 | %(C) |
| Net assets at end of period (000s) | | $ | 49,372 | | $ | 31,456 | | $ | 31,274 | | $ | 17,923 | | $ | 2,092 | |
| Ratio of net expenses to average net assets | | | 1.12 | % | | 1.17 | % | | 1.20 | % | | 1.19 | % | | 1.20 | %(D) |
| Ratio of net investment income to average net assets | | | 6.38 | % | | 5.74 | % | | 5.75 | % | | 6.01 | % | | 1.76 | %(D) |
| Ratio of gross expenses to average net assets | | | 1.12 | % | | 1.17 | % | | 1.21 | % | | 1.21 | % | | 1.23 | %(D) |
| Portfolio turnover rate | | | 43 | % | | 66 | % | | 84 | % | | 83 | % | | 77 | %(D) |
| | | Year Ended | | Year Ended | | Year Ended | | Year Ended | | Period Ended | |
| | | December 31, | | December 31, | | December 31, | | December 31, | | December 31, | |
Diamond Hill Strategic Income Fund - Class C | | 2006 | | 2005 | | 2004 | | 2003 | | 2002 (A) | |
| Net asset value at beginning of period | | $ | 11.24 | | $ | 11.63 | | $ | 11.58 | | $ | 10.28 | | $ | 10.00 | |
| Income (loss) from investment operations: | | | | | | | | | | | | | | | | |
| Net investment income | | | 0.62 | | | 0.58 | | | 0.56 | | | 0.60 | | | 0.19 | |
| Net realized and unrealized gains | | | | | | | | | | | | | | | | |
| (losses) on investments | | | 0.41 | | | (0.40 | ) | | 0.19 | | | 1.39 | | | 0.30 | |
| Total from investment operations | | | 1.03 | | | 0.18 | | | 0.75 | | | 1.99 | | | 0.49 | |
| Less distributions: | | | | | | | | | | | | | | | | |
| Dividends from net investment income | | | (0.57 | ) | | (0.57 | ) | | (0.56 | ) | | (0.60 | ) | | (0.19 | ) |
| Distributions from net realized gains | | | - | | | - | | | (0.14 | ) | | (0.09 | ) | | (0.02 | ) |
| Total distributions | | | (0.57 | ) | | (0.57 | ) | | (0.70 | ) | | (0.69 | ) | | (0.21 | ) |
| Net asset value at end of period | | $ | 11.70 | | $ | 11.24 | | $ | 11.63 | | $ | 11.58 | | $ | 10.28 | |
| Total return(B) | | | 9.43 | % | | 1.57 | % | | 6.70 | % | | 19.86 | % | | 4.85 | %(C) |
| Net assets at end of period (000s) | | $ | 26,908 | | $ | 20,257 | | $ | 15,560 | | $ | 8,428 | | $ | 94 | |
| Ratio of net expenses to average net assets | | | 1.87 | % | | 1.91 | % | | 1.95 | % | | 1.93 | % | | 1.95 | %(D) |
| Ratio of net investment income to average net assets | | | 5.63 | % | | 5.06 | % | | 5.02 | % | | 5.39 | % | | 2.64 | %(D) |
| Ratio of gross expenses to average net assets | | | 1.87 | % | | 1.91 | % | | 1.96 | % | | 1.95 | % | | 1.98 | %(D) |
| Portfolio turnover rate | | | 43 | % | | 66 | % | | 84 | % | | 83 | % | | 77 | %(D) |
| | | Year Ended | | Period Ended | |
| | | December 31, | | December 31, | |
Diamond Hill Strategic Income Fund - Class I | | 2006 | | 2005 (E) | |
| Net asset value at beginning of period | | $ | 11.23 | | $ | 11.65 | |
| Income (loss) from investment operations: | | | | | | | |
| Net investment income | | | 0.73 | | | 0.65 | |
| Net realized and unrealized gains | | | | | | | |
| (losses) on investments | | | 0.44 | | | (0.42 | ) |
| Total from investment operations | | | 1.17 | | | 0.23 | |
| Dividends from net investment income | | | (0.71 | ) | | (0.65 | ) |
| Net asset value at end of period | | $ | 11.69 | | $ | 11.23 | |
| Total return | | | 10.74 | % | | 2.03 | %(C) |
| Net assets at end of period (000s) | | $ | 54,302 | | $ | 25,299 | |
| Ratio of net expenses to average net assets | | | 0.68 | % | | 0.70 | %(D) |
| Ratio of net investment income to average net assets | | | 6.89 | % | | 6.57 | %(D) |
| Ratio of gross expenses to average net assets | | | 0.68 | % | | 0.70 | %(D) |
| Portfolio turnover rate | | | 43 | % | | 66 | % |
| (A) | Represents the period from commencement of operations (September 30, 2002) through December 31, 2002. |
| (B) | Total returns shown exclude the effect of applicable sales charges. |
| (E) | Represents the period from commencement of operations (January 31, 2005) through December 31, 2005. |
See accompanying Notes to Financial Statements.
| Diamond Hill Funds Annual Report December 31, 2006 | Page 47 |
Diamond Hill Funds
Notes to Financial Statements
December 31, 2006
Organization
The Diamond Hill Small Cap Fund (“Small Cap Fund”), Diamond Hill Small-Mid Cap Fund (“Small-Mid Cap Fund”), Diamond Hill Large Cap Fund (“Large Cap Fund”), Diamond Hill Select Fund (“Select Fund”), Diamond Hill Long-Short Fund (“Long-Short Fund” and formerly the Diamond Hill Focus Long-Short Fund), Diamond Hill Financial Long-Short Fund (“Financial Long-Short Fund” and formerly the Diamond Hill Bank & Financial Fund), and Diamond Hill Strategic Income Fund (“Strategic Income Fund”), are each a series of the Diamond Hill Funds (the “Trust”) (each a “Fund” and collectively the “Funds”). The Trust is an Ohio business trust, which is registered under the Investment Company Act of 1940, as amended, (the “1940 Act”) as an open-end, management investment company. Each Fund is a diversified series of the Trust. Effective December 30, 2005, the Small Cap Fund closed to new shareholders.
The Funds offer three classes of shares (Class A, Class C and Class I, except for the Financial Long-Short Fund which offers Class A and Class C shares). Each class of shares for each Fund has identical rights and privileges except with respect to distribution (12b-1) and service fees, voting rights on matters affecting a single class of shares, and the exchange privileges of each class of shares.
Significant Accounting Policies
The following is a summary of the Funds’ significant accounting policies:
Estimates — The preparation of financial statements in conformity with U.S. generally accepted accounting principles (“GAAP”) requires management to make estimates and assumptions that affect the reported amounts of assets and liabilities and disclosure of contingent assets and liabilities at the date of the financial statements and the reported amounts of income and expenses during the reporting period. Actual results could differ from those estimates.
Security valuation — Listed securities for which market quotations are readily available are valued at the closing prices as determined by the primary exchange where the securities are traded. Unlisted securities or listed securities for which the latest sales prices are not readily available are valued at the closing bid price in the principal market where such securities are normally traded. Debt securities are valued on the basis of valuations provided by dealers or by an independent pricing service that determines valuations based upon market transactions for normal, institutional-size trading units of similar securities. Short-term investments maturing in less than 61 days are valued at amortized cost, which approximates market. Securities for which market quotations are not readily available are valued at their "fair value". In these cases, a Valuation Committee established and appointed by the Trustees determines in good faith, subject to Trust procedures, the fair value of portfolio securities held by a Fund ("good faith fair valuation"). When a good faith fair valuation of a security is required, consideration is generally given to a number of factors, including, but not limited to the following: dealer quotes, published analyses by dealers or analysts of the situation at issue, transactions implicitly valuing the security (such as a merger, tender offer, etc.), the value of other securities or contracts which derive their value from the security at issue, and the implications (whether negative or positive) of the circumstances which have caused trading in the security to halt.
In September 2006, the Financial Accounting Standards Board (FASB) issued Statement on Financial Accounting Standards (SFAS) No. 157, “Fair Value Measurements.” This standard establishes a single authoritative definition of fair value, sets out a framework for measuring fair value and requires additional disclosures about fair value measurements. SFAS No. 157 applies to fair value measurements already required or permitted by existing standards. SFAS No. 157 is effective for financial statements issued for fiscal years beginning after November 15, 2007 and interim periods within those fiscal years. The changes to current generally accepted accounting principles from the application of this Statement relate to the definition of fair value, the methods used to measure fair value, and the expanded disclosures about fair value measurements. As of December 31, 2006, the Funds do not believe the adoption of SFAS No. 157 will impact the amounts reported in the financial statements, however, additional disclosures may be required about the inputs used to develop the measurements and the effect of certain of the measurements reported on the statement of changes in net assets for a fiscal period.
| Page 48 | Diamond Hill Funds Annual Report December 31, 2006 |
Diamond Hill Funds
Notes to Financial Statements (Continued)
December 31, 2006
Short sales — The Long-Short Fund, Financial Long-Short Fund and Strategic Income Fund may sell a security they do not own in anticipation of a decline in the value of that security. When the Funds sell a security short, they must borrow the security sold short and deliver it to the broker-dealer through which they made the short sale. A gain, limited to the price at which the Funds sold the security short, or a loss, unlimited in size, will be recognized upon closing a short sale. Cash received from short sales is maintained by brokers and is used to meet margin requirements for short calls. It is included as “Deposits with brokers for securities sold short” on the Statements of Assets & Liabilities.
Repurchase agreements — In connection with transactions in repurchase agreements, it is each Fund’s policy that its custodian take possession of the underlying collateral securities, the fair value of which exceeds the principal amount of the repurchase transaction, including accrued interest, at all times. If the seller defaults, and the fair value of the collateral declines, realization of the collateral by the Funds may be delayed or limited.
Security transactions — Changes in holdings of portfolio securities shall be reflected no later than in the first calculation on the first business day following trade date. However, for financial reporting purposes, portfolio security transactions are reported on trade date. The specific identification method is used for determining realized gains or losses for financial statements and income tax purposes. Dividend income is recognized on the ex-dividend date and interest income is recognized on an accrual basis. Discounts and premiums on securities purchased are amortized using the daily effective yield method.
Share valuation — The net asset value per share of each class of shares of each Fund is calculated daily by dividing the total value of a Fund’s assets attributable to that class, less liabilities attributable to that class, by the number of shares of that class outstanding.
Federal income taxes — Each Fund’s policy is to continue to comply with the requirements of the Internal Revenue Code that are applicable to regulated investment companies and to distribute substantially all of its taxable net investment income and any net realized capital gains to its shareholders. Therefore, no federal income tax provision is required.
Distributions to shareholders — Dividends from net investment income are declared and paid monthly for the Strategic Income Fund. Dividends from net investment income are declared and paid on an annual basis for the Small Cap Fund, Small-Mid Cap Fund, Large Cap Fund, Select Fund, Long-Short Fund, and Financial Long-Short Fund. The Funds record distributions received from investments in Real Estate Investment Trusts (REITS) in excess of income from underlying investments as a reduction of cost of investments and/or realized gain. Such amounts are based on estimates if actual amounts are not available and actual amounts of income, realized gain and return of capital may differ from the estimated amounts. The Funds adjust the estimated amounts of the components of distributions (and consequently net investment income) as an increase to unrealized appreciation (depreciation) and realized gain (loss) on investments as necessary once the issuers provide information about the actual composition of the distributions. Dividends are declared separately for each class. No class has preferential dividend rights; differences in per share rates are due to differences in separate class expenses. Net realized capital gains, if any, are distributed at least annually. Distributions from net investment income and from net capital gains are determined in accordance with U.S. income tax regulations, which may differ from GAAP in the United States. These differences are primarily due to differing treatments for paydown gains and losses on mortgage-backed securities, expiring capital loss carryforwards, and deferrals of certain losses. Permanent book and tax basis differences are reclassified among the components of net assets. Certain Funds may utilize earnings and profits distributed to shareholders on redemption of shares as part of the dividends paid deduction for income tax purposes.
Allocations — Investment income earned, realized capital gains and losses, and unrealized appreciation and depreciation for the Funds are allocated daily to each class of shares based upon its proportionate share of total net assets of the Fund. Class specific expenses are charged directly to the class incurring the expense. Common expenses, which are not attributable to a specific class, are allocated daily to each class of shares based upon its proportionate share of total net assets of the Fund. Expenses not directly billed to a Fund are allocated proportionally among all Funds daily in relation to net assets of each Fund or another reasonable measure.
| Diamond Hill Funds Annual Report December 31, 2006 | Page 49 |
Diamond Hill Funds
Notes to Financial Statements (Continued)
December 31, 2006
Investment Transactions
For the year ended December 31, 2006, the purchases and sales (including maturities) of investment securities (excluding short-term securities and U.S. government obligations) were as follows
| | | Purchases | | Sales | |
| Small Cap Fund | | $ | 275,065,832 | | $ | 116,709,475 | |
| Small-Mid Cap Fund | | $ | 21,624,006 | | $ | 3,490,297 | |
| Large Cap Fund | | $ | 295,176,855 | | $ | 74,835,860 | |
| Select Fund | | $ | 26,550,737 | | $ | 10,756,720 | |
| Long-Short Fund | | $ | 1,043,896,938 | | $ | 732,105,466 | |
| Financial Long-Short Fund | | $ | 15,588,403 | | $ | 10,735,460 | |
| Strategic Income Fund | | $ | 96,899,417 | | $ | 37,839,768 | |
The Funds pay commissions on the purchase and sale of investment securities. The commissions paid are included as part of the cost of purchases or net proceeds on the sale of investment securities and are not included in the presentation of Fund expenses on the Statements of Operations. The Funds paid the following commissions during the year ended December 31, 2006:
| | | | | Commissions as a % | |
| | | Total Commissions | | of Average Net Assets | |
| Small Cap Fund | | $ | 249,167 | | | 0.05% | |
| Small-Mid Cap Fund | | $ | 13,344 | | | 0.11% | |
| Large Cap Fund | | $ | 182,731 | | | 0.07% | |
| Select Fund | | $ | 17,712 | | | 0.12% | |
| Long-Short Fund | | $ | 1,509,805 | | | 0.19% | |
| Financial Long-Short Fund | | $ | 16,226 | | | 0.06% | |
| Strategic Income Fund | | $ | 12,807 | | | 0.01% | |
Investment Advisory Fees and Other Transactions with Affiliates
The Small Cap Fund, Small-Mid Cap Fund, Large Cap Fund, Select Fund, Long-Short Fund, Financial Long-Short Fund, and Strategic Income Fund each receive investment management and advisory services from Diamond Hill Capital Management, Inc. (“DHCM”) under management agreements that provide for fees to be paid at an annual rate of 0.80%, 0.75%, 0.60%, 0.70%, 0.90%, 1.00%, and 0.50% of the Funds’ average daily net assets, respectively. The advisory agreements are subject to annual approval by the Board of Trustees. In addition, each Fund has entered into an administrative services agreement whereby DHCM (“Administrator”) is paid a fee at an annual rate of 0.36% for Class A and Class C and 0.18% for Class I shares of each Funds’ average daily net assets. Prior to May 1, 2006, the fees paid by Class A and Class C were paid at an annual rate of 0.40% and Class I shares were paid at an annual rate of 0.20% of each Funds’ average daily net assets. These administrative fees are used to pay most of the Funds’ operating expenses except advisory, distribution, brokerage, taxes, interest, dividend expense on securities sold short, and extraordinary expenses.
Pursuant to rule 12b-1 of the 1940 Act, each Fund has adopted a distribution plan (together, the “Plans”). Under the Plans, Class A shares pay a distribution fee at an annual rate of 0.25% of Class A average daily net assets. Class C shares pay a distribution and shareholder-servicing fee at an annual rate of 0.75% and 0.25%, respectively, of Class C average daily net assets. Class I shares are not subject to any distribution or shareholder-servicing fees. The Trust entered into a Distribution Agreement on behalf of the Funds with IFS Fund Distributors, Inc. (“Distributor”). Pursuant to the Distribution Agreement, the Distributor acts as principal underwriter of each Fund’s shares.
For the year ended December 31, 2006, the Distributor received $12,013, $6,026, $12,472, $2,517, $134,918, $6,065, and $2,195, in sales commissions from the sales of Class A shares of the Small Cap Fund, Small-Mid Cap Fund, Large Cap Fund, Select Fund, Long-Short Fund, Financial Long-Short Fund, and Strategic Income Fund, respectively. The Distributor also received $17,387, $1,168, $7,180, $50,859, $887, and $3,153 of contingent deferred sales charges relating to redemptions of Class C shares of the Small Cap Fund, Small-Mid Cap Fund, Large Cap Fund, Long-Short Fund, Financial Long-Short Fund, and Strategic Income Fund, respectively.
| Page 50 | Diamond Hill Funds Annual Report December 31, 2006 |
Diamond Hill Funds
Notes to Financial Statements (Continued)
December 31, 2006
DHCM has an agreement with Integrated Investment Services, Inc. (“Integrated”) to provide sub-transfer agent, sub-fund accounting, and sub-administrative services for the Funds. The services to be provided under the agreements include day-to-day administration of matters related to the corporate existence of the Trust and its Funds (other than rendering investment advice), maintenance of books and records, preparation of reports, supervision of the Trust’s arrangement with the custodian and assistance in the preparation of the Trust’s registration statement under federal and state laws. Integrated is paid directly by DHCM under terms of these service agreements.
Certain officers of the Trust are affiliated with DHCM, Integrated or the Distributor. Such officers receive no compensation from the Funds for serving in their respective roles.
Commitments and Contingencies
The Funds indemnify the Trust’s officers and Trustees for certain liabilities that might arise from their performance of their duties to the Funds. Additionally, in the normal course of business, the Funds enter into contracts that contain a variety of representations and warranties and which provide general indemnifications. The Funds’ maximum exposure under these arrangements is unknown, as this would involve future claims that may be made against the Funds that have not yet occurred. However, based on experience, the Funds expect the risk of loss to be remote.
Federal Tax Information
The amount and character of income and capital gain distributions paid by the Funds are determined in accordance with Federal income tax regulations which may differ from GAAP. The tax character of distributions paid differs from the character of distributions shown on the Statements of Changes in Net Assets due primarily to short-term capital gains being treated as ordinary income for tax purposes and the use of equalization.
The tax character of distributions paid during 2006 and 2005 was as follows:
| | | Small Cap | | Small-Mid | | Large Cap | | Select | |
| | | Fund | | Cap Fund | | Fund | | Fund | |
| | | 2006 | | 2005 | | 2006 | | 2006 | | 2005 | | 2006 | |
| Distributions paid from: | | | | | | | | | | | | | | | | | | | |
| Ordinary income | | $ | 8,775,689 | | $ | 141,447 | | $ | 191,604 | | $ | 4,892,161 | | $ | 437,963 | | $ | 357,710 | |
| Long-term capital gains | | | 4,882,826 | | | 3,224,408 | | | - | | | 1,739,721 | | | 265,273 | | | - | |
| Total distributions | | $ | 13,658,515 | | $ | 3,365,855 | | $ | 191,604 | | $ | 6,631,882 | | $ | 703,236 | | $ | 357,710 | |
| | | Long-Short | | Financial | | Strategic | |
| | | Fund | | Long-Short Fund | | Income Fund | |
| | | 2006 | | 2005 | | 2006 | | 2005 | | 2006 | | 2005 | |
| Distributions paid from: | | | | | | | | | | | | | | | | | | | |
| Ordinary income | | $ | 37,941,138 | | $ | 1,645,224 | | $ | 522,904 | | $ | 273,912 | | $ | 5,841,602 | | $ | 3,601,032 | |
| Long-term capital gains | | | 5,437,134 | | | 840,687 | | | 825,774 | | | 626,653 | | | - | | | 97,880 | |
| Total distributions | | $ | 43,378,272 | | $ | 2,485,911 | | $ | 1,348,678 | | $ | 900,565 | | $ | 5,841,602 | | $ | 3,698,912 | |
| Diamond Hill Funds Annual Report December 31, 2006 | Page 51 |
Diamond Hill Funds
Notes to Financial Statements (Continued)
December 31, 2006
The following information is computed on a tax basis for each item as of December 31, 2006:
| | | Small | | Small-Mid | | Large | | Select | |
| | | Cap Fund | | Cap Fund | | Cap Fund | | Fund | |
| Federal tax cost of investments | | $ | 473,147,195 | | $ | 23,075,045 | | $ | 385,958,770 | | $ | 16,636,343 | |
| Gross unrealized appreciation | | | 64,006,128 | | | 1,573,520 | | | 38,945,480 | | | 2,871,852 | |
| Gross unrealized depreciation | | | (19,971,723 | ) | | (681,225 | ) | | (3,269,132 | ) | | (528,599 | ) |
| Net unrealized appreciation | | | 44,034,405 | | | 892,295 | | | 35,676,348 | | | 2,343,253 | |
| Undistributed ordinary income | | | - | | | 186,206 | | | 4,919,015 | | | 1,345,839 | |
| Undistributed long-term capital gains | | | 4,408,113 | | | - | | | 5,501,683 | | | - | |
| Other temporary differences | | | - | | | - | | | - | | | (1,595,010 | ) |
| Accumulated earnings | | $ | 48,442,518 | | $ | 1,078,501 | | $ | 46,097,046 | | $ | 2,094,082 | |
| | | | | Financial | | Strategic | |
| | | Long-Short | | Long-Short | | Income | |
| | | Fund | | Fund | | Fund | |
| Tax cost of portfolio investments | | $ | 1,140,632,403 | | $ | 37,239,983 | | $ | 124,592,172 | |
| Gross unrealized appreciation | | | 134,849,526 | | | 6,771,296 | | | 6,370,660 | |
| Gross unrealized depreciation | | | (52,769,272 | ) | | (490,163 | ) | | (1,127,660 | ) |
| Net unrealized appreciation | | | 82,080,254 | | | 6,281,133 | | | 5,243,000 | |
| Undistributed ordinary income | | | 16,662,952 | | | 96,064 | | | - | |
| Undistributed long-term capital gains | | | 15,832,167 | | | 102,496 | | | - | |
| Post-October losses | | | - | | | - | | | (486,181 | ) |
| Capital loss carryforward | | | - | | | - | | | (648,676 | ) |
| Other temporary differences | | | - | | | - | | | (65,272 | ) |
| Accumulated earnings | | $ | 114,575,373 | | $ | 6,479,693 | | $ | 4,042,871 | |
The difference between book basis and tax basis of accumulated earnings is attributable primarily to the tax deferral of losses on wash sales, the tax treatment of in-kind securities transactions, investments in Real Estate Investment Trusts and Limited Partnerships.
As of December 31, 2006, the Strategic Income Fund had $648,676 of capital loss carryforwards for federal income tax purposes which will expire in 2014. The Strategic Income Fund also elected to defer until its subsequent tax year capital losses incurred after October 31, 2006. These capital loss carryforwards and "Post-October" losses may be utilized in future years to offset net realized capital gains, if any, prior to distributing such gains to shareholders.
Reclassification of capital accounts - Reclassifications result primarily from the difference in the tax treatment of paydown gains and losses, equalization and investments in Real Estate Investment Trusts and Limited Partnerships. The following reclassifications have no impact on the net assets or net asset value per share of the Funds and are designed to present the Funds' capital accounts on a tax basis:
| | | | | Undistributed | | Accumulated | |
| | | Paid-In | | Net Investment | | Net Realized | |
| | | Capital | | Income (Loss) | | Gains (Losses) | |
| Small Cap Fund | | $ | 1,100,676 | | $ | 58,929 | | $ | (1,159,605 | ) |
| Large Cap Fund | | | 144,451 | | | - | | | (144,451 | ) |
| Select Fund | | | (1,170,050 | ) | | (633 | ) | | 1,170,683 | |
| Long-Short Fund | | | 778,586 | | | 6,926 | | | (785,512 | ) |
| Financial Long-Short Fund | | | 142,700 | | | (19,019 | ) | | (123,681 | ) |
| Strategic Income Fund | | | (847,987 | ) | | 515,093 | | | 332,894 | |
On July 13, 2006, the Financial Accounting Standards Board (FASB) released FASB Interpretation No. 48 “Accounting for Uncertainty in Income Taxes” (FIN 48). FIN 48 provides guidance for how uncertain tax positions should be recognized, measured, presented and disclosed in the financial statements. FIN 48 requires the evaluation of tax positions taken or expected to be taken in the course of preparing the Funds' tax returns to determine whether the tax positions are “more-likely-than-not” of being sustained by the applicable tax authority. Tax positions not deemed to meet the more-likely-than-not threshold would be recorded as a tax benefit or expense in the current year. Adoption of FIN 48 is required for fiscal years beginning after December 15, 2006 and is to be applied to all open tax years as of the effective date. Recent SEC guidance allows implementing FIN 48 in fund NAV calculations as late as the Fund’s last NAV calculation in the first required financial statement reporting period. As a result, the Funds will incorporate FIN 48 in their semi annual report on June 30, 2007. Management is in the process of determining the impact of adoption.
| Page 52 | Diamond Hill Funds Annual Report December 31, 2006 |
Diamond Hill Funds
Notes to Financial Statements (Continued)
December 31, 2006
In-Kind Transfer of Securities
During the year ended December 31, 2006, the Select Fund issued shares of beneficial interest in exchange for securities. The securities were transferred at their current value on the date of transaction for GAAP purposes and at their original cost for tax purposes. This book/tax difference is temporary in nature and will reverse as these in-kind securities are sold.
Transaction Date | | Shares Issued | | Book Cost | | Tax Cost | |
| 4/13/06 | | | Class A - 721,298 | | $ | 7,501,499 | | $ | 5,633,155 | |
| | | Class C - 234,859 | | $ | 2,442,537 | | $ | 1,762,459 | |
| | | Class I - 132,383 | | $ | 1,376,785 | | $ | 1,123,619 | |
Subsequent Event
Public offering commenced on January 3, 2007 for the Class I shares of the Diamond Hill Financial Long-Short Fund. Class I of the Diamond Hill Financial Long-Short Fund had no investment operations and no public shareholders as of December 31, 2006.
| Diamond Hill Funds Annual Report December 31, 2006 | Page 53 |
Report of Independent Registered Public
Accounting Firm
To the Shareholders and Board of Trustees
of the Diamond Hill Funds
We have audited the accompanying statements of assets and liabilities, including the schedules of investments, of the Diamond Hill Funds (comprised of the Diamond Hill Small Cap Fund, Diamond Hill Small-Mid Cap Fund, Diamond Hill Large Cap Fund, Diamond Hill Select Fund, Diamond Hill Long-Short Fund (formerly the Diamond Hill Focus Long-Short Fund), Diamond Hill Financial Long-Short Fund (formerly the Diamond Hill Bank & Financial Fund), and Diamond Hill Strategic Income Fund) (collectively, the “Funds”) as of December 31, 2006, and the related statements of operations for the year then ended, the statements of changes in net assets for each of the two years in the period then ended, and the financial highlights for each of the periods indicated therein. These financial statements and financial highlights are the responsibility of the Funds’ management. Our responsibility is to express an opinion on these financial statements and financial highlights based on our audits. The financial highlights presented for the year ended December 31, 2002 were audited by other auditors whose report dated January 17, 2003 expressed an unqualified opinion on those financial highlights.
We conducted our audits in accordance with the standards of the Public Company Accounting Oversight Board (United States). Those standards require that we plan and perform the audits to obtain reasonable assurance about whether the financial statements and financial highlights are free of material misstatement. We were not engaged to perform an audit of the Funds’ internal control over financial reporting. Our audits included consideration of internal control over financial reporting as a basis for designing audit procedures that are appropriate in the circumstances, but not for the purpose of expressing an opinion on the effectiveness of the Funds’ internal control over financial reporting. Accordingly, we express no such opinion. An audit also includes, examining, on a test basis, evidence supporting the amounts and disclosures in the financial statements and financial highlights, assessing the accounting principles used and significant estimates made by management, and evaluating the overall financial statement presentation. Our procedures included confirmation of securities owned as of December 31, 2006 by correspondence with the custodian and brokers. We believe that our audits provide a reasonable basis for our opinion.
In our opinion, the financial statements and financial highlights referred to above present fairly, in all material respects, the financial position of each of the respective portfolios comprising the Diamond Hill Funds as of December 31, 2006, the results of their operations for the year then ended, the changes in their net assets for each of the two years in the period then ended, and their financial highlights for each of the periods indicated therein, in conformity with U.S. generally accepted accounting principles.
Cincinnati, Ohio
February 22, 2007
| Page 54 | Diamond Hill Funds Annual Report December 31, 2006 |
Diamond Hill Funds
Other Items
December 31, 2006 (Unaudited)
Dividends Received Deduction
For corporate shareholders, the following ordinary dividends paid during the year ended December 31, 2006 qualify for the corporate dividends received deduction:
| Small Cap Fund | 43% |
| Small-Mid Cap Fund | 31% |
| Large Cap Fund | 51% |
| Select Fund | 16% |
| Long-Short Fund | 20% |
| Financial Long-Short Fund | 91% |
| Strategic Income Fund | 66% |
Proxy Voting
The investment adviser is responsible for exercising the voting rights associated with the securities purchased and held by the Funds. A description of the policies and procedures that the Adviser uses in fulfilling this responsibility and information regarding how those proxies were voted during the twelve month period ended June 30 are available without charge upon request by calling toll free 1-888-226-5595 or on the Securities and Exchange Commission’s website at http://www.sec.gov.
Portfolio Disclosure
The Trust files a complete listing of portfolio holdings as of the end of the first and third quarters of each fiscal year on Form N-Q. The complete listing (i) is available on the Commission’s website; (ii) may be reviewed and copied at the Commission’s Public Reference Room in Washington, DC; and (iii) will be made available to shareholders upon request by calling 1-888-226-5595. Information on the operation of the Public Reference Room may be obtained by calling 1-800-SEC-0330. Monthly portfolio holdings are also available on www.diamond-hill.com.
| Diamond Hill Funds Annual Report December 31, 2006 | Page 55 |
Diamond Hill Funds
Schedule of Shareholder Expenses
Hypothetical Example of a $1,000 Investment at Beginning of Period
(Unaudited)
All mutual funds have operating expenses. These expenses include costs for portfolio management, administrative services, and distribution fees. Operating expenses, which are deducted from a fund's gross income, directly reduce the investment return of the fund. A fund's expenses are expressed as a percentage of its net assets. This figure is known as the expense ratio.
We believe it is important for you to understand the impact of costs on your investment. The following example illustrates the costs that you would incur over the six-month period covered by this report if you invested $1,000 in the Fund, using the Funds' actual return and operating expenses for the six months ended December 31, 2006. The examples use actual net operating expenses applicable to that class. The calculation does not reflect sales charges (loads). If this cost was included, your costs would have been higher. The examples contain two sets of numbers, one using the actual return earned by each class of each Fund during the six months ended December 31, 2006, and one using a hypothetical 5% annual return (2.5% for the reporting period).
| | | | | Net Expense | | Beginning | | Ending | | | | | | | | | |
| | | | | Ratio | | Account | | Account | | | | | | | | | |
| | | | | Annualized | | Value | | Value | | Investment | | | | Distribution/ | | | |
| | | | | December 31, | | July 1, | | December 31, | | Advisory | | Administration | | Service | | Total Net | |
| | | | | 2006 | | 2006 | | 2006 | | Fees | | Fees | | Fees | | Expenses | |
Small Cap Fund | | | | | | | | | | | | | | | |
| Class A | | | Actual return | | | 1.41 | % | $ | 1,000.00 | | $ | 1,035.70 | | $ | 4.11 | | $ | 1.85 | | $ | 1.28 | | $ | 7.24 | |
| | | Hypothetical return | | | 1.41 | % | $ | 1,000.00 | | $ | 1,018.10 | | $ | 4.07 | | $ | 1.83 | | $ | 1.27 | | $ | 7.17 | |
| Class C | | | Actual return | | | 2.16 | % | $ | 1,000.00 | | $ | 1,031.90 | | $ | 4.10 | | $ | 1.84 | | $ | 5.12 | | $ | 11.06 | |
| | | Hypothetical return | | | 2.16 | % | $ | 1,000.00 | | $ | 1,014.32 | | $ | 4.06 | | $ | 1.83 | | $ | 5.08 | | $ | 10.97 | |
| Class I | | | Actual return | | | 0.98 | % | $ | 1,000.00 | | $ | 1,038.10 | | $ | 4.11 | | $ | 0.92 | | $ | - | | $ | 5.03 | |
| | | Hypothetical return | | | 0.98 | % | $ | 1,000.00 | | $ | 1,020.27 | | $ | 4.07 | | $ | 0.92 | | $ | - | | $ | 4.99 | |
| | | | | | | | | | | | | | | | | | | | | | | | | | |
Small-Mid Cap Fund | | | | | | | | | | | | | | | | | | | | | | |
| Class A | | | Actual return | | | 1.36 | % | $ | 1,000.00 | | $ | 1,047.80 | | $ | 3.86 | | $ | 1.86 | | $ | 1.28 | | $ | 7.00 | |
| | | Hypothetical return | | | 1.36 | % | $ | 1,000.00 | | $ | 1,018.37 | | $ | 3.80 | | $ | 1.83 | | $ | 1.27 | | $ | 6.90 | |
| Class C | | | Actual return | | | 2.11 | % | $ | 1,000.00 | | $ | 1,043.80 | | $ | 3.85 | | $ | 1.85 | | $ | 5.14 | | $ | 10.84 | |
| | | Hypothetical return | | | 2.11 | % | $ | 1,000.00 | | $ | 1,014.59 | | $ | 3.79 | | $ | 1.83 | | $ | 5.07 | | $ | 10.69 | |
| Class I | | | Actual return | | | 0.93 | % | $ | 1,000.00 | | $ | 1,049.40 | | $ | 3.86 | | $ | 0.92 | | $ | - | | $ | 4.78 | |
| | | Hypothetical return | | | 0.93 | % | $ | 1,000.00 | | $ | 1,020.54 | | $ | 3.80 | | $ | 0.91 | | $ | - | | $ | 4.71 | |
| | | | | | | | | | | | | | | | | | | | | | | | | | |
Large Cap Fund | | | | | | | | | | | | | | | | | | | | | | |
| Class A | | | Actual return | | | 1.21 | % | $ | 1,000.00 | | $ | 1,096.00 | | $ | 3.16 | | $ | 1.90 | | $ | 1.32 | | $ | 6.38 | |
| | | Hypothetical return | | | 1.21 | % | $ | 1,000.00 | | $ | 1,019.12 | | $ | 3.05 | | $ | 1.83 | | $ | 1.27 | | $ | 6.15 | |
| Class C | | | Actual return | | | 1.96 | % | $ | 1,000.00 | | $ | 1,091.70 | | $ | 3.16 | | $ | 1.90 | | $ | 5.26 | | $ | 10.32 | |
| | | Hypothetical return | | | 1.96 | % | $ | 1,000.00 | | $ | 1,015.34 | | $ | 3.04 | | $ | 1.83 | | $ | 5.07 | | $ | 9.94 | |
| Class I | | | Actual return | | | 0.78 | % | $ | 1,000.00 | | $ | 1,098.00 | | $ | 3.16 | | $ | 0.95 | | $ | - | | $ | 4.11 | |
| | | Hypothetical return | | | 0.78 | % | $ | 1,000.00 | | $ | 1,021.29 | | $ | 3.05 | | $ | 0.91 | | $ | - | | $ | 3.96 | |
| | | | | | | | | | | | | | | | | | | | | | | | | | |
Select Fund | | | | | | | | | | | | | | | | | | | | | | |
| Class A | | | Actual return | | | 1.31 | % | $ | 1,000.00 | | $ | 1,084.60 | | $ | 3.68 | | $ | 1.89 | | $ | 1.32 | | $ | 6.89 | |
| | | Hypothetical return | | | 1.31 | % | $ | 1,000.00 | | $ | 1,018.60 | | $ | 3.56 | | $ | 1.83 | | $ | 1.28 | | $ | 6.67 | |
| Class C | | | Actual return | | | 2.06 | % | $ | 1,000.00 | | $ | 1,081.40 | | $ | 3.67 | | $ | 1.89 | | $ | 5.24 | | $ | 10.80 | |
| | | Hypothetical return | | | 2.06 | % | $ | 1,000.00 | | $ | 1,014.83 | | $ | 3.55 | | $ | 1.83 | | $ | 5.08 | | $ | 10.46 | |
| Class I | | | Actual return | | | 0.88 | % | $ | 1,000.00 | | $ | 1,087.20 | | $ | 3.67 | | $ | 0.94 | | $ | - | | $ | 4.61 | |
| | | Hypothetical return | | | 0.88 | % | $ | 1,000.00 | | $ | 1,020.78 | | $ | 3.55 | | $ | 0.92 | | $ | - | | $ | 4.47 | |
| Page 56 | Diamond Hill Funds Annual Report December 31, 2006 |
Diamond Hill Funds
Schedule of Shareholder Expenses
Hypothetical Example of a $1,000 Investment at Beginning of Period (Continued)
(Unaudited)
| | | | | Net Expense | | Beginning | | Ending | | | | | | | | | |
| | | | | Ratio | | Account | | Account | | | | | | | | | |
| | | | | Annualized | | Value | | Value | | Investment | | | | Distribution/ | | | |
| | | | | December 31, | | July 1, | | December 31, | | Advisory | | Administration | | Service | | Total Net | |
| | | | | 2006 | | 2006 | | 2006 | | Fees | | Fees | | Fees | | Expenses | |
Long-Short Fund | | | | | | | | | | | | | | | |
| Class A | | | Actual return | | | 1.77 | % | $ | 1,000.00 | | $ | 1,088.20 | | $ | 5.54 | | $ | 2.22 | | $ | 1.53 | | $ | 9.29 | |
| | | Hypothetical return | | | 1.77 | % | $ | 1,000.00 | | $ | 1,016.31 | | $ | 5.35 | | $ | 2.14 | | $ | 1.48 | | $ | 8.97 | |
| Class C | | | Actual return | | | 2.51 | % | $ | 1,000.00 | | $ | 1,084.20 | | $ | 5.26 | | $ | 2.10 | | $ | 5.84 | | $ | 13.20 | |
| | | Hypothetical return | | | 2.51 | % | $ | 1,000.00 | | $ | 1,012.54 | | $ | 5.08 | | $ | 2.03 | | $ | 5.64 | | $ | 12.75 | |
| Class I | | | Actual return | | | 1.34 | % | $ | 1,000.00 | | $ | 1,090.40 | | $ | 5.87 | | $ | 1.17 | | $ | - | | $ | 7.04 | |
| | | Hypothetical return | | | 1.34 | % | $ | 1,000.00 | | $ | 1,018.47 | | $ | 5.67 | | $ | 1.13 | | $ | - | | $ | 6.80 | |
| | | | | | | | | | | | | | | | | | | | | | | | | | |
Financial Long-Short Fund | | | | | | | | | | | | | | | | | | | | | | |
| Class A | | | Actual return | | | 1.73 | % | $ | 1,000.00 | | $ | 1,105.50 | | $ | 5.72 | | $ | 2.06 | | $ | 1.42 | | $ | 9.20 | |
| | | Hypothetical return | | | 1.73 | % | $ | 1,000.00 | | $ | 1,016.46 | | $ | 5.47 | | $ | 1.97 | | $ | 1.37 | | $ | 8.81 | |
| Class C | | | Actual return | | | 2.48 | % | $ | 1,000.00 | | $ | 1,101.60 | | $ | 5.57 | | $ | 2.01 | | $ | 5.57 | | $ | 13.15 | |
| | | Hypothetical return | | | 2.48 | % | $ | 1,000.00 | | $ | 1,012.69 | | $ | 5.34 | | $ | 1.92 | | $ | 5.33 | | $ | 12.59 | |
| | | | | | | | | | | | | | | | | | | | | | | | | | |
Strategic Income Fund | | | | | | | | | | | | | | | | | | | | | | |
| Class A | | | Actual return | | | 1.11 | % | $ | 1,000.00 | | $ | 1,071.20 | | $ | 2.60 | | $ | 1.88 | | $ | 1.30 | | $ | 5.78 | |
| | | Hypothetical return | | | 1.11 | % | $ | 1,000.00 | | $ | 1,019.62 | | $ | 2.54 | | $ | 1.83 | | $ | 1.27 | | $ | 5.64 | |
| Class C | | | Actual return | | | 1.86 | % | $ | 1,000.00 | | $ | 1,067.10 | | $ | 2.60 | | $ | 1.87 | | $ | 5.21 | | $ | 9.68 | |
| | | Hypothetical return | | | 1.86 | % | $ | 1,000.00 | | $ | 1,015.84 | | $ | 2.54 | | $ | 1.83 | | $ | 5.07 | | $ | 9.44 | |
| Class I | | | Actual return | | | 0.68 | % | $ | 1,000.00 | | $ | 1,073.50 | | $ | 2.61 | | $ | 0.93 | | $ | - | | $ | 3.54 | |
| | | Hypothetical return | | | 0.68 | % | $ | 1,000.00 | | $ | 1,021.79 | | $ | 2.54 | | $ | 0.92 | | $ | - | | $ | 3.46 | |
_____________________
You can find more information about the Fund's expenses, including annual expense ratios for historical periods in the Financial Statements section of this report. For additional information on operating expenses and other shareholder costs, please refer to the Fund's prospectus. The prospectus presents hypothetical shareholder costs over various time periods based upon a $10,000 investment and a return of 5% a year. This standardized example, which appears in all mutual fund prospectuses, may be useful to you in comparing the costs of investing in different funds.
| Diamond Hill Funds Annual Report December 31, 2006 | Page 57 |
Diamond Hill Funds
Management of the Trust (unaudited)
Listed in the charts below is basic information regarding the Trustees and officers of the Trust.
| TRUSTEES: | | | | |
Name/ Address/3 Age | Position(s) Held with Trust | Term of Office1 and Length of Time Served | Principal Occupation(s) During Last 5 Years | Number of Portfolios in Fund Complex Overseen by Trustee |
Thomas E. Line Year of Birth: 1967 | Chairman Trustee | Since November 2005 | Managing Director and Chief Financial Officer, Red Capital Group (mortgage and investment banking subsidiary of National City Bank), October 2005 to the present;Vice President and Treasurer, Red Capital Group, September 2004 to October 2005; President, Focused Financial Consulting, Inc. (financial consulting), March 2002 to September 2004; Chief Operating Officer, Meeder Financial, Inc. (parent of investment adviser and mutual fund servicing companies), June 1998 to March 2002. | 7 |
| | | | | |
Elizabeth P. Kessler Year of Birth: 1968 | Trustee | Since November 2005 | Attorney - Jones Day | 7 |
| | | | | |
George A. Skestos Year of Birth: 1968 | Trustee | Since August 2000 | Managing Member, Arcadia Holdings, LLC (private investment banking firm), May 2001 to the present; President of Homewood Corporation (real estate development firm), January 2000 to the present. | 7 |
PRINCIPAL OFFICERS: | | | |
Name/ Address/3 Age | Position(s) Held with Trust | Term of Office and Length of Time Served | Principal Occupation(s) During Last 5 Years |
James F. Laird, Jr.2 Year of Birth: 1957 | President | Since December 2001 | Chief Financial Officer of Diamond Hill Investment Group, Inc., since December 2001. President of Diamond Hill Securities since July 2001. Vice President Corporate Strategy with Nationwide Insurance from January 2001 to July 2001. Senior Vice President Product Development with Villanova Capital from February 1999 through December 2000. |
| | | | |
Gary R.Young2 | Treasurer, Secretalry andChief Compliance Officer | Since May 2004 Since Sepltember 2004 | Controller of Diamond Hill Investment Group, Inc. since April 2004.Director of Mutual Fund Administration with Banc One Investment Advisors October 1998 through April 2004. Vice President and Manager of Mutual Fund Accounting and Financial Reporting with First Chicago NBD January 1996 through October 1998. |
| 1 | Each Trustee is elected to serve in accordance with the Declaration of Trust and Bylaws of the Trust until his or her successor is duly elected and qualified. |
| 2 | Mr. Laird and Mr.Young are each an “interested person” of the Trust as defined in the Investment Company Act of 1940, as amended, because of their relationship with Diamond Hill Capital Management, Inc. |
| 3 | The address of each Trustee and Officer is 325 John H. McConnell Boulevard - Suite 200, Columbus, Ohio 43215. |
The Statement of Additional Information contains additional information about the Trustees and is available without charge on www.diamond-hill.com or by calling 1-888-226-5595.
| Page 58 | Diamond Hill Funds Annual Report December 31, 2006 |

325 John H. McConnell Boulevard, Suite 200
Columbus, Ohio 43215
614.255.3333
www.diamond-hill.com
INVESTMENT ADVISER
Diamond Hill Capital Management, Inc.
DISTRIBUTOR
IFS Fund Distributors, Inc.
FOR ADDITIONAL INFORMATION, CALL
Integrated Investment Serivces, Inc.
Toll Free 888.226.5595
Item 2. Code of Ethics.
As of the end of the period covered by this report, the registrant has adopted a code of ethics that applies to the registrant's principal executive officer, principal financial officer, principal accounting officer or controller, or persons performing similar functions, regardless of whether these individuals are employed by the registrant or a third party.
Item 3. Audit Committee Financial Expert.
The registrant’s Board of Trustees has determined that the registrant has at least one audit committee financial expert serving on its audit committee. Mr. Thomas E. Line is the registrant’s “audit committee financial expert” and is “independent” (as each term is defined in Item 3 of Form N-CSR.
Item 4. Principal Accountant Fees and Services.
(a) Audit Fees. Audit fees totaled $89,700 and 65,500 in fiscal 2006 and 2005 respectively, including fees associated with the annual audit and filings of the registrant’s Form N-1A and Form N-SAR. The 2005 audit fees include $3,500 for post-audit review and issuing our consent for an additional Form N-1A filing during the year.
(b) Audit-Related Fees. There were no audit-related fees in fiscal 2006 and 2005.
(c) Tax Fees. Fees for tax compliance and consultative services totaled $19,600 and $13,000 in fiscal 2006 and 2005, respectively.
(d) All Other Fees. There were no other fees in fiscal 2006 and 2005.
(e)(1) Audit Committee Pre-Approval Policies. The Audit Committee’s pre-approval policies describe the types of audit, audit-related, tax and other services that may receive the general pre-approval of the Audit Committee. The pre-approval policies provide that annual audit service fees, tax services not specifically granted pre-approval, services exceeding pre-approved cost levels and other services that have not received general pre-approval will be subject to specific pre-approval by the Audit Committee. The pre-approval policies further provide that the Committee may grant general pre-approval to other audit services (statutory audits and services associated with SEC registration statements, periodic reports and other documents filed with the SEC or other documents issued in connection with securities offerings), audit-related services (accounting consultations related to accounting, financial reporting or disclosure matters not classified as “audit services,” assistance with understanding and implementing new accounting and financial reporting guidance from rulemaking authorities, agreed-upon or expanded audit procedures related to accounting and/or billing records required to respond to or comply with financial, accounting or regulatory reporting matters and assistance with internal control reporting requirements under Form N-SAR and Form N-CSR), tax services that have historically been provided by the auditor that the Committee believes would not impair the independence of the auditor and are consistent with the SEC’s rules on auditor independence and permissible non-audit services classified as “all other services” that are routine and recurring services.
(e)(2) All services described in paragraphs (b) through (d) of Item 4 were approved by the Audit Committee.
(f) Not applicable
(g) The aggregate non-audit fees for services to the registrant, its investment adviser and any entity controlling, controlled by, or under common control with the adviser that provides ongoing services to the registrant were $19,600 and $13,000 in 2006 and 2005, respectively.
(h) Not applicable
Item 5. Audit Committee of Listed Companies.
Not applicable.
Item 6. Schedule of Investments.
The Schedule of Investments in securities of unaffiliated issuers is included in the Annual Report.
Item 7. Disclosure of Proxy Voting Policies and Procedures for Closed-End Management Investment Companies.
Not applicable.
Item 8. Portfolio Managers of Closed-End Management Investment Companies.
Not applicable.
Item 9. Purchases of Equity Securities by Closed-End Management Investment Company and Affiliated Purchasers.
Not applicable.
Item 10. Submission of Matters to a Vote of Security Holders.
On August 18, 2005, the Board of Trustees of the Diamond Hill Funds adopted a “Policy Regarding General Shareholder Communications to the Board of Trustees of the Trust”.
Item 11. Controls and Procedures.
(a) Based on an evaluation of the registrant’s disclosure controls and procedures (as defined in Rule 30a-3(c) under the Investment Company Act of 1940), as of a date within 90 days of the filing date of this report, the registrant’s principal executive officer and principal financial officer have concluded that the registrant’s disclosure controls and procedures are effective.
(b) There were no changes in the registrant’s internal control over financial reporting (as defined in Rule 30a-3(d) under the Investment Company Act of 1940) that occurred during the registrant’s last fiscal half-year that have materially affected, or are reasonably likely to materially affect, the registrant’s internal control over financial reporting.
Item 12. Exhibits.
(a)(1) Code of Ethics for Senior Financial Officers is filed herewith
(a)(2) Certifications required by Item 12(a) of Form N-CSR are filed herewith.
(a)(3) Not applicable.
(b) Certification required by Item 12(b) of Form N-CSR is filed herewith
SIGNATURES
Pursuant to the requirements of the Securities Exchange Act of 1934 and the Investment Company Act of 1940, the registrant has duly caused this report to be signed on its behalf by the undersigned, thereunto duly authorized.
(Registrant) Diamond Hill Funds
By (Signature and Title)
/s/ James F. Laird
James F. Laird
President
Date: March 12, 2007
Pursuant to the requirements of the Securities Exchange Act of 1934 and the Investment Company Act of 1940, this report has been signed below by the following persons on behalf of the registrant and in the capacities and on the dates indicated.
By (Signature and Title)
/s/ James F. Laird
James F. Laird
President
Date: March 12, 2007
By (Signature and Title)
/s/ Gary R. Young
Gary R. Young.
Treasurer and Chief Financial Officer
Date: March 12, 2007