Under Sarbanes-Oxley Section 404, as implemented by the SEC and PCAOB, we were required to provide an initial management assessment on our internal control over financial reporting for fiscal 2007 and we have complied with that requirement in this Form 10-K.
Under current rules, we will be required to provide an auditors’ attestation on our internal controls for fiscal 2008. However, the SEC has recently proposed extending the deadline for that requirement so that, as long as we are a non-accelerated filer measured at June 30, 2008, we would not be required to comply with the auditor’s attestation requirement until fiscal 2009. We cannot assure you that, in the course of completing the work to satisfy the auditors’ attestation requirement, we or our auditors will not detect a material weakness in our internal control over financial reporting or that we can satisfactorily comply with the attestation requirement.
Schools and clinicians that use our products frequently use students’ names to register them in our products and enter into our database academic, diagnostic and/or demographic information about the students. In addition, the results of student use of our products are uploaded to our database. We have designed our system to safeguard this personally-identifiable information, but the protection of such information is an area of increasing public concern and significant government regulation, including but not limited to the Children’s Online Privacy Protection Act. If our privacy protection measures prove to be ineffective, we could be subject to liability claims for unauthorized access to or misuses of personally-identifiable information stored in our database. We may also face additional expenses to analyze and comply with increasing regulation in this area.
United States public schools are funded primarily through state and local tax revenues, which are devoted primarily to school building costs, teacher salaries and general operating expenses. Public schools also receive funding from the federal government through a variety of federal programs, many of which target children who are poor and/or are struggling academically. Federal funds typically are restricted to specified uses.
We believe that the funding for a substantial portion of our K-12 sales comes from federal funding, in particular IDEA (special education) and Title One funding. The current federal budget deficit and competing federal priorities may impact the availability of federal education funding. A cutback in federal education funding could have a materially adverse impact on our revenue.
State and local school funding can be significantly impacted by fluctuations in tax revenues due to changing economic conditions. States are forecasting shortfalls in their tax revenues for fiscal 2009, because of the existing housing slump and a potential recession in the nationwide economy. While education spending remains an important priority for states, it faces competition from demands for relief for homeowners, transportation spending and rising health care costs. An economic downturn leading to a significant reduction in state tax revenues could have a materially adverse impact on our revenue.
The availability of funding for instructional products like ours can also be affected by unpredictable events, such as increases in energy costs or damage due to severe weather. We believe that severe storms and spiking energy costs adversely impacted our sales in 2005. Unpredictable events of similar magnitude could adversely impact our revenue in the future.
The market in which we operate is very competitive. While our products are highly differentiated by their neuroscience basis and their focus on improving brain processing efficiency and developing cognitive skills, we nevertheless compete vigorously for the funding available to schools. We compete not only against other software-based reading intervention products but also against print and service-based offerings from other companies and against traditional methods of teaching language and reading. Many of the companies providing these competitive offerings are much larger than we are, are more established in the school market than we are, offer a broader range
of products to schools, and have greater financial, technical, marketing and distribution resources than we do. Encouraged by the No Child Left Behind Act, new competitors may enter our market segment and offer actual or claimed results similar to those achieved by our products. In addition, although traditional approaches to language and reading are fundamentally different from our approach, the traditional methods are more widely known and accepted and, therefore, represent significant competition for available funds.
If we lose key personnel or are unable to hire additional qualified personnel as necessary, we may not be able to achieve our business goals, which could materially and adversely affect our financial results and share price.
We depend on the performance of our senior management, sales, marketing, development, research, educational, finance and other administrative personnel with extensive experience in our industry and with our Company. The loss of key personnel could harm our ability to execute our business strategy, which could adversely affect our financial results and share price. In addition, we believe that our future success will depend in large part on our continued ability to identify, hire, retain and motivate highly skilled employees who are in great demand. We cannot assure you that we will be able to do so.
Our current liquidity resources may not be sufficient to meet our needs.
We believe that cash flow from operations will be our primary source of funding for our operations during 2008 and the next several years. In 2007 and 2006, we generated $6.1 million and $4.3 million, respectively, in cash from operating activities. We ended 2007 with $21.2 million in cash and cash equivalents. We expended $10.7 million in cash in connection with the acquisition of the Reading Assistant product line.
In addition, we have a line of credit with Comerica Bank totaling $5.0 million, which expires on December 30, 2008. At December 31, 2007 no borrowings were outstanding and we were in compliance with the covenants of that line.
Funding our liquidity needs out of cash flow from operations will require us to achieve certain levels of booked sales and expenses. If we are unable to achieve sufficient levels of cash flow from operations, or are unable to obtain waivers or amendments from Comerica in the event we do not comply with our covenants, we would be required either to obtain debt or equity financing from other sources, or to reduce expenses. Reducing our expenses could adversely affect our operations by reducing the resources available for sales, marketing, research or development efforts. We cannot assure you that we will be able to secure additional debt or equity financing on acceptable terms, if at all.
If we are unable to maintain our access to the intellectual property rights that we license from third parties, our sales and net income will be materially and adversely affected.
Our most important products are based on licensed inventions owned by the University of California and Rutgers, the State University of New Jersey. In 2007, we generated approximately 78% of our booked sales from products that use this licensed technology. If we were to lose our rights under these licenses (whether through expiration of our exclusive license period, expiration of the underlying patent’s exclusivity, invalidity or unenforceability of the underlying patents, a breach by us of the terms of the license agreements or otherwise), such a loss of these licensed rights or a requirement that we must re-negotiate these licenses could materially harm our booked sales, our revenue and our net income.
If we are unable to adequately protect our intellectual property rights or if we infringe on the rights of others, we could become subject to significant liabilities, need to seek licenses or lose our rights to sell our products.
Our ability to compete effectively depends in part on whether we are able to maintain the proprietary aspects of our technology and to operate without infringing on the proprietary rights of others. It is possible that our issued patents will not offer sufficient protection against competitors with similar technology, that our trademarks will be challenged or infringed by competitors, or that our pending patent applications will not result in the issuance of patents. Issued patents can prove to be invalid or unenforceable as a result of a variety of reasons, including deficiencies in prosecution. As a result of potential deficiencies during the prosecution of certain patents to which we have rights, it is possible that these patents may be subject to a claim of unenforceability or invalidity. If others are able to develop similar products due to the expiration, unenforceability or invalidity of the underlying patents, the resulting competition could materially harm our booked sales, revenue and net income. The Company
Page 25
historically has not registered its copyrights in the United States, which may make it difficult to collect damages from a third party that may be infringing a Company copyright. The degree of future protection for our proprietary rights is also uncertain for products or product improvements in early-stage development, because it is difficult to predict from early-stage development efforts which product(s) will ultimately be marketed or what form the ultimately marketed product(s) will take.
In addition, we could become party to patent or trademark infringement claims, litigation or interference proceedings. These proceedings could result from claims that we are violating the rights of others or may be necessary to enforce our own rights. Any such proceedings would result in substantial expense and significant diversion of management effort, and the outcome of any such proceedings cannot be accurately predicted. An adverse determination in such proceedings could subject us to significant liabilities or require us to seek licenses from third parties, which may not be available on commercially reasonable terms or at all. In addition, competitors may design around our technology or develop competing technologies. Intellectual property rights may also be unavailable or limited in some foreign countries, which could make it easier for competitors to capture or increase their market share with respect to related technologies.
We generally require the execution of a written licensing agreement, which restricts the use and copying of our software products. However, if unauthorized copying or misuse were to occur to a substantial degree, our sales could be adversely affected.
Our common stock is thinly traded and its price is volatile.
Our common stock presently trades on the Nasdaq Global Market, and our trading volume is low. For example, for the last three months of 2007, our average daily trading volume was approximately 43,000 shares. The market price of our common stock has been highly volatile since we became publicly traded and could continue to be subject to wide fluctuations.
The ownership of our common stock is concentrated.
At December 31, 2007, Trigran Investments owned approximately 24% of our outstanding stock, and our executive officers and directors held approximately 15% of the outstanding stock. As a result, these stockholders are able to exercise significant influence over all matters requiring stockholder approval, including the election of directors and approval of significant corporate transactions, and may have interests that diverge from those of other stockholders. This concentration of ownership may also delay, prevent or deter a change in control of our company.
| |
ITEM 1B. | UNRESOLVED STAFF COMMENTS |
Not applicable
We lease approximately 30,500 square feet of office space in Oakland, California for our headquarters under a lease that expires in December 2013. The lease includes two five-year options to extend the term of the lease. We also lease approximately 2,500 square feet of office space in Tucson, Arizona for our support center under a lease that expires in 2009. In early 2008, we entered into a new lease for our Reading Assistant operations in Waltham, Massachusetts for approximately 6,000 square feet that expires in September 2011. We are currently evaluating our space requirements in Tucson, Arizona and may lease additional space in that area. We believe our other facilities are sufficient for our operations currently and should be adequate to meet our needs for at least the next two years.
Litigation with Former Sales Representative
On January 23, 2008, Robert G. (Jerry) Smith, a former account manager in Florida, filed a complaint against us in US District Court for the Middle District of Florida. The lawsuit claims breach of contract for unpaid wages of approximately $423,000. Smith alleges that he is owed additional commission relating to large sale transaction in the second quarter of 2007. We are in the early stages of this proceeding. Discovery has not yet started.
Page 26
Litigation with School District Customer
On October 22, 2007, we were sued by the Christina School District (the “District”) in the US District Court for the District of Delaware. The District had previously been sued by investors who are the assignees of the lessor under a Master Lease Purchase Agreement (the “Lease Agreement”) entered into by the District in 2003. The District ceased making payments under the Lease Agreement and the investors have claimed that the District breached the Lease Agreement. The District filed a third party complaint against us, claiming that we must refund amounts paid to us by the District for training and consulting under our contracts with the District. Because the District decided not to use our products, it did not therefore use all of the services specified in the contract. The third party complaint alleges unjust enrichment against us. The District states that the amount it is seeking is approximately $220,000. We have filed a motion to dismiss the complaint, which has not yet been decided.
We believe that these claims are not meritorious and that we do not have any significant liability to these claimants.. We therefore do not believe that the resolution of these matters will have a material adverse effect on our financial position or results of operations.
| |
ITEM 4 | SUBMISSION OF MATTERS TO A VOTE OF SECURITY HOLDERS |
None
Page 27
EXECUTIVE OFFICERS
The following table sets forth various information concerning our executive officers, as of March 10, 2008:
| | | | |
NAME | | AGE | | POSITION |
| |
| |
|
|
Robert C. Bowen | | 66 | | Chairman and Chief Executive Officer |
| | | | |
D. Andrew Myers | | 36 | | President and Chief Operating Officer |
| | | | |
Linda L. Carloni | | 54 | | Vice President, General Counsel and Corporate Secretary |
| | | | |
Glenn G. Chapin | | 52 | | Vice President, Sales |
| | | | |
Jane A. Freeman | | 54 | | Executive Vice President, Chief Financial Officer, and Treasurer |
| | | | |
| | | | |
Dr. William M. Jenkins | | 57 | | Sr. Vice President, Product Development |
| | | | |
Jessica Lindl | | 34 | | Vice President, Marketing |
| | | | |
Gillian A. McCormack | | 52 | | Vice President, Operations |
Robert C. Bowen joined us as Chairman and Chief Executive Officer in June 2002. From 1989 to 2001, he served as a senior executive and officer of National Computer Systems, a provider of educational assessment and administrative software and services. His last assignment there, from 1995 to 2001, was as President of NCS Education, a leading provider of enterprise software for K-12 school districts. NCS was acquired by Pearson, PLC, in 2000. After retiring from NCS in 2001, Mr. Bowen consulted for various businesses in education until joining us. Previously, Mr. Bowen held senior executive positions with other leading education and publishing companies, including seventeen years with McGraw-Hill. Early in his career, Mr. Bowen was a high school math teacher, a coach, and a school district administrator. Mr. Bowen received his bachelor’s and master’s degrees from the University of Tennessee, Chattanooga.
D. Andrew Myers joined us as President and Chief Operating Officer in January 2008. Prior to joining us, Mr. Myers worked at Pearson Education since 1997. His last position was as Senior Vice President, Digital Product Development for Pearson Curriculum, where he was responsible for integrating the technology teams from six preceding business units into a digital development group of 275 employees. From August 2004 to March 2007, Mr. Myers was the Chief Operations Officer for Pearson Digital Learning, where he was responsible for setting product, financial, technical and operational strategies for that 580-employee business unit. From 2002 to 2004, Mr. Myers served as Vice President Sales for Pearson Digital Learning. Mr. Myers started with Pearson as a sales representative in 1996. Pearson Education is the education division of Pearson PLC, an international media company. Mr. Myers holds an MBA from the Haas School of Business at the University of California Berkeley and a BA in finance from the University of Utah.
Linda L. Carloni joined the Company as General Counsel in October 1999, became our Secretary in March 2000 and was appointed Vice President in June 2000. Before joining us, Ms. Carloni was a founder and Vice President of Alere Medical Incorporated, a healthcare services start-up. Earlier in her career, Ms. Carloni worked in technology transfer for the University of California, was the general counsel of Nellcor Incorporated, a medical device company, and was an associate and a partner at the Cooley Godward law firm. She received her bachelor’s degree in political science from Case Western Reserve University and her law degree from Boalt Hall School of Law at the University of California, Berkeley.
Glenn G. Chapin joined the Company in April 2001 as Vice President of K-12 Sales. Mr. Chapin brings to his role with us more than 25 years experience working with schools to implement technology based curriculum and management systems that impact teaching and student learning. From 1995 to 2001, Mr. Chapin held sales executive positions at CompassLearning, completing his service there as the Southern Region Vice President. Prior to his post at CompassLearning, Mr. Chapin held sales executive positions at National Computer Systems, where he held positions of increasing responsibility over a 15 year period, from serving as the Midwest territory sales representative and rising
Page 28
to Southern Region Sales VP prior to his departure. Mr. Chapin is a graduate of St. John Fischer College in Rochester, New York where he received his Bachelor of Science degree in Business Administration.
Jane A. Freeman joined us as Vice President, Finance and Treasurer in August 1999 and was named Chief Financial Officer in January 2000. She was appointed Senior Vice President in January 2004 and Executive Vice President in December 2007. She also served as our Vice President Business Development from August 1999 until June 2000. Prior to joining us, Ms. Freeman spent 20 years in the investment business. From 1988 through 1998, she was employed by Rockefeller & Co., a global investment firm, where she led the global asset allocation process, managed the US Small Cap equity product and served on the Management Committee of the firm. She is a director of four mutual funds managed by Harding Loevner LLP. Ms. Freeman holds a B.A. in mathematics and chemistry and an M.B.A. (with distinction) from Cornell University and a License in Applied Economics from the University of Louvain in Belgium.
Dr. William M. Jenkins was appointed Senior Vice President, Product Development in November 2000. Dr. Jenkins is a founder and served as our Vice President, Product Development from June 1997 until November 2000. From March 1996 to June 1997, Dr. Jenkins was our Vice President, Research and Development. From 1990 to 1996, Dr. Jenkins was an Adjunct Associate Professor at the University of California, San Francisco. Dr. Jenkins is the principal developer of our current software products. Dr. Jenkins holds a B.S. in Psychology, an M.A. in Psychobiology and a Ph.D. in Psychobiology from Florida State University, with additional post-doctoral training from UCSF.
Jessica Lindl joined us as Vice President of Marketing in March 2007. Prior to joining us, Ms. Lindl served as Vice President of Marketing and Product Management for Riverdeep, a leading developer of educational software. Ms. Lindl held marketing management positions of increasing responsibility at Riverdeep and The Learning Company, which was acquired by Riverdeep, from 2001 through 2006. Prior to her tenure at Riverdeep, Ms. Lindl served as the Director of Product Management for Simplexis, an e-procurement provider for the K-12 market, in 2000 and 2001 and as part of the sales management team for AT&T in San Francisco from 1995 to 1998. Ms. Lindl holds a bachelor’s degree in economics and international studies from Miami University in Oxford, Ohio and an MBA from the Haas School of Business at the University of California, Berkeley.
Gillian A. McCormack joined us as Vice President, Operations in October 2002. Prior to joining us, Ms. McCormack had served as vice president of professional and technical services for NCS Learn (Pearson Education) beginning in 2000. From 1994 through 2000, she was the vice president of customer support for NovaNET, an E-learning company. Earlier in her career, Ms. McCormack worked in management and field positions at Jostens Learning, an educational software company. Ms. McCormack began her career as an elementary and middle school teacher and was a master of teacher training in Tucson, Arizona. She holds a bachelor of science in elementary education and a bachelor of science in special education and learning disabled K-12 from the University of Arizona.
Page 29
ITEM 5. MARKET FOR THE REGISTRANT’S COMMON EQUITY AND RELATED STOCKHOLDER MATTERS
(a) Market Information. Our common stock currently is, and during all of 2006 and 2007 was, traded on the NASDAQ Global Market under the symbol “SCIL”. (In 2006, the name of the market was changed from the NASDAQ National Market to the NASDAQ Global Market.)
The following table sets forth, for the periods indicated, the closing high and low sales prices per share of our common stock as reported on the NASDAQ Global Market.
| | | | | | | |
2006 | | High | | Low | |
First Quarter | | $ | 5.96 | | $ | 4.28 | |
Second Quarter | | $ | 5.20 | | $ | 3.91 | |
Third Quarter | | $ | 5.25 | | $ | 3.82 | |
Fourth Quarter | | $ | 6.09 | | $ | 4.44 | |
| | | | | | | |
2007 | | High | | Low | |
First Quarter | | | 7.72 | | | 5.28 | |
Second Quarter | | | 7.71 | | | 6.23 | |
Third Quarter | | | 7.95 | | | 5.19 | |
Fourth Quarter | | | 6.49 | | | 4.98 | |
Holders. As of January 31, 2008, the approximate number of stockholders of record of our common stock was 112.
Dividend Policy. We have never declared or paid cash dividends on our common stock, and we do not anticipate paying any cash dividends in the foreseeable future. Our current Loan and Security Agreement with Comerica Bank provides that we may not pay any dividends other than stock dividends during the term of the Agreement.
Securities Authorized for Issuance under Equity Compensation Plans. For information regarding securities authorized for issuance under equity compensation plans, see Item 12.
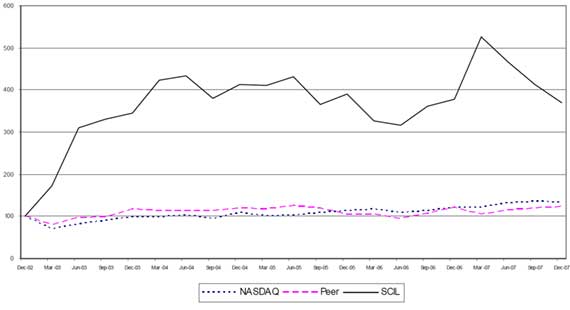
Performance Measurement Comparison.
The following chart compares the cumulative total stockholder return of Scientific Learning Common Stock for the five years ended December 31, 2007 with the cumulative total return during the same period of (i) the NASDAQ Composite Market Index and (ii) a Scientific Learning constructed peer group index. The companies in the peer group index were selected on the basis of similarity in the nature of their business. At December 31, 2007, the peer group included Plato Learning, Inc., Princeton Review, Renaissance Learning Inc., and Scholastic Corporation.
Over the last five years, the peer group has changed from time to time because of acquisitions, changes in business, and other changes affecting peer group companies. This table shows these changes:
| | |
Members of Peer Group | | Tenure in Peer Group |
| |
|
Excelligence | | Removed from peer group after September 30, 2006 after it stopped trading. |
| | |
Lightspan, Inc. | | Removed from peer group during 2003 upon its acquisition |
| | |
Riverdeep | | Removed from peer group during 2002 because its stock was moved from the Nasdaq to the Irish Stock Exchange |
| | |
Smart Force | | Removed from peer group during 2002 upon its acquisition |
| | |
Student Advantage | | Removed from peer group during 2002 when in the process of negotiating its sale |
| | |
Sylvan Learning Systems, Inc. | | Removed from peer group during 2003 because it changed the nature of its business. |
Page 30
The comparison assumes $100 was invested on December 31, 2002 in Scientific Learning Common Stock and in each of the foregoing indices. It also assumes reinvestment of dividends. The stock price performance shown in the graph below should not be considered indicative of potential future stock price performance.
Recent Sales of Unregistered Securities; Use of Proceeds from Registered Securities. Not applicable
(b) Not applicable
(c) Not applicable
Page 31
| |
ITEM 6. | SELECTED FINANCIAL DATA |
In thousands, except per share amounts
| | | | | | | | | | | | | | | | |
| | Year Ended December 31, | |
| | 2007 | | 2006 | | 2005 | | 2004 | | 2003 | |
| |
| |
| |
| |
| |
| |
Statement of Operations Data: | | | | | | | | | | | | | | | | |
Revenues: | | | | | | | | | | | | | | | | |
Products | | $ | 31,023 | | $ | 29,966 | | $ | 30,263 | | $ | 22,802 | | $ | 24,491 | |
Service and support | | | 15,030 | | | 11,032 | | | 10,056 | | | 8,174 | | | 5,425 | |
| |
|
| |
|
| |
|
| |
|
| |
|
| |
Total revenues | | | 46,053 | | | 40,998 | | | 40,319 | | | 30,976 | | | 29,916 | |
Cost of revenues: | | | | | | | | | | | | | | | | |
Products | | | 1,680 | | | 1,638 | | | 2,018 | | | 1,775 | | | 2,127 | |
Service and support | | | 8,539 | | | 7,897 | | | 5,637 | | | 4,981 | | | 3,872 | |
| |
|
| |
|
| |
|
| |
|
| |
|
| |
Total cost of revenues | | | 10,219 | | | 9,535 | | | 7,655 | | | 6,756 | | | 5,999 | |
| |
|
| |
|
| |
|
| |
|
| |
|
| |
Gross profit | | | 35,834 | | | 31,463 | | | 32,664 | | | 24,220 | | | 23,917 | |
| | | | | | | | | | | | | | | | |
Operating expenses: | | | | | | | | | | | | | | | | |
Sales and marketing | | | 24,868 | | | 21,073 | | | 17,619 | | | 16,087 | | | 12,961 | |
Research and development | | | 4,500 | | | 4,129 | | | 3,896 | | | 3,555 | | | 3,500 | |
General and administrative | | | 7,660 | | | 6,643 | | | 5,841 | | | 5,313 | | | 4,529 | |
Restructuring | | | — | | | — | | | — | | | — | | | (7 | ) |
| |
|
| |
|
| |
|
| |
|
| |
|
| |
Total operating expenses | | | 37,028 | | | 31,845 | | | 27,356 | | | 24,955 | | | 20,983 | |
| |
|
| |
|
| |
|
| |
|
| |
|
| |
Operating income (loss) | | | (1,194 | ) | | (382 | ) | | 5,308 | | | (735 | ) | | 2,934 | |
Other income from related party | | | 247 | | | 150 | | | 50 | | | 99 | | | 448 | |
Interest income (expense), net | | | 1,019 | | | 643 | | | 421 | | | (100 | ) | | (1,209 | ) |
| |
|
| |
|
| |
|
| |
|
| |
|
| |
| | | | | | | | | | | | | | | | |
Net income (loss) before income tax | | | 72 | | | 411 | | | 5,779 | | | (736 | ) | | 2,173 | |
Income tax provision (benefit) | | | (1,082 | ) | | 203 | | | 182 | | | (43 | ) | | 43 | |
| |
|
| |
|
| |
|
| |
|
| |
|
| |
Net income (loss) | | $ | 1,154 | | $ | 208 | | $ | 5,597 | | $ | (693 | ) | $ | 2,130 | |
| |
|
| |
|
| |
|
| |
|
| |
|
| |
| | | | | | | | | | | | | | | | |
Basic net income (loss) per share | | $ | 0.07 | | $ | 0.01 | | $ | 0.33 | | $ | (0.04 | ) | $ | 0.13 | |
| |
|
| |
|
| |
|
| |
|
| |
|
| |
| | | | | | | | | | | | | | | | |
Shares used in computing basic net income (loss) per share | | | 17,161 | | | 16,846 | | | 16,715 | | | 16,408 | | | 16,007 | |
| |
|
| |
|
| |
|
| |
|
| |
|
| |
Diluted net income (loss) per share | | $ | 0.06 | | $ | 0.01 | | $ | 0.31 | | $ | (0.04 | ) | $ | 0.13 | |
| |
|
| |
|
| |
|
| |
|
| |
|
| |
Shares used in computing diluted net income (loss) per share | | | 18,297 | | | 17,740 | | | 18,023 | | | 16,408 | | | 16,908 | |
| |
|
| |
|
| |
|
| |
|
| |
|
| |
| | | | | | | | | | | | | | | | |
Balance Sheet Data: | | | | | | | | | | | | | | | | |
| | | | | | | | | | | | | | | | |
Cash and cash equivalents | | $ | 21,179 | | $ | 16,364 | | $ | 9,022 | | $ | 10,281 | | $ | 3,648 | |
Short-term investments | | | — | | | — | | | 3,043 | | | — | | | — | |
Working capital | | | 7,862 | | | 3,951 | | | 2,842 | | | (3,986 | ) | | (11,331 | ) |
Total assets | | | 33,803 | | | 26,283 | | | 18,734 | | | 22,958 | | | 15,597 | |
Stockholders’ equity (deficit) (1) | | | 5,820 | | | 1,017 | | | (1,835 | ) | | (8,111 | ) | | (8,544 | ) |
| |
(1) | We have paid no cash dividends since our inception. |
Page 32
ITEM 7. MANAGEMENT’S DISCUSSION AND ANALYSIS OF FINANCIAL CONDITIONS AND RESULTS OF OPERATIONS
Overview
We develop and distribute the Fast ForWord family of software. Our patented products build learning capacity by rigorously and systematically applying neuroscience-based learning principles to improve the fundamental cognitive skills required to read and learn. Extensive outcomes research by independent researchers, our founding scientists, school districts and our company demonstrates the rapid and lasting gains achieved through Fast ForWord participation. Our products are marketed primarily to K-12 schools in the US, to whom we sell through a direct sales force. To facilitate the use of our products, we offer a variety of on-site and remote professional and technical services, as well as phone, email and web-based support. Since our inception, learners have used our Fast ForWord products over one million times and approximately 5,200 schools have purchased at least $10,000 of our Fast ForWord product licenses and services. As of December 31, 2007 we had 215 full-time equivalent employees, compared to 197 at December 31, 2006.
On January 7, 2008, we completed the acquisition of substantially all of the assets of Soliloquy Learning, including the Reading Assistant product, for $10.7 million in cash. The Scientific Learning Reading Assistant combines advanced speech recognition technology with scientifically based courseware to help students strengthen fluency, vocabulary and comprehension to become proficient life-long readers.
Business Highlights
We market our Fast ForWord products primarily as a reading intervention solution for struggling, at-risk, English Language Learners, and special education students. Approximately 70% of the estimated 55 million public and private school K-12 students in the United States test as not proficient in reading. While our installed base is growing, the approximately 5,200 schools that have purchased at least $10,000 of our product licenses and services represent a small fraction of the approximately 125,000 K-12 schools in the US.
Federal education funds are a critical resource in helping school districts address the needs of the most challenged learners. We believe that a significant proportion of our sales are funded by federal sources, particularly Title One and IDEA (special education) grants. In fiscal 2008, these programs are projected to total $25.4 billion. States are forecasting shortfalls in their taxation revenues for fiscal 2009 because of the existing housing slump and a potential recession in the nationwide economy. Such shortfalls would have an impact on education spending, although it is likely that education would remain among the top priorities.
Sales of our products are included in the growing supplemental education materials segment of the overall education materials market. Simba Information’s Publishing for the PreK-12 Market 2007 – 2008 (April 2007) estimates that:
| | |
| Ø | The total market for K-12 instructional materials is $8.58 billion, growing at 4.2% |
| | |
| Ø | The supplemental materials segment of that market is $4.29 billion |
| | |
| Ø | The fastest growing supplemental market, technology based electronic courseware, is $856 million and expected to grow 9.4% |
Company Highlights
In 2007 total revenue increased by 12% compared to 2006. This compares to an increase of 2% in 2006 compared to 2005. We attribute our revenue increase primarily to:
| | |
| • | Our improved sales capacity resulting from additional sales representatives hired in 2006 who became productive in 2007. |
| | |
| • | A continued focus within our sales organization on quickly closing transactions over $100,000, and on increasing the size of these transactions. |
Booked sales increased 16% in 2007 compared to 2006. Revenue increased at a slower rate than booked sales because in 2007 our sales mix contained a greater proportion of multiple year service and support offerings, where a significant amount of revenue is to be recognized in future periods, as compared to previous years. (For more explanation of booked sales, see Booked Sales and Selling Activity, below.)
We also experienced continued growth in our international sales, which increased 62% in 2007 compared to 2006, following an increase of 112% in 2006 compared to 2005. In 2007, international sales comprised approximately 2%
Page 33
of total sales, compared to 1.5% in 2006. We conduct our international business through value-added representatives (“VARs”). At December 31, 2007 we had 24 VARs selling in 42 countries.
We reported net income of $1.2 million in 2007, compared to net income of $0.2 million in 2006. The increase in net income is primarily due to an income tax benefit of approximately $1.2 million arising from the reduction of a portion of our deferred taxation valuation allowance.
During 2007 we introduced our Reading Progress Indicator service. While we are pleased with the initial results, the incremental revenue from this additional offering was not significant in 2007.
We ended 2007 with $21.2 million in cash and cash equivalents, and had no outstanding debt. We did not make use of our credit line during 2007. Net cash generated from operating activities was $6.1 million.
In January 2008 we completed the acquisition of the Soliloquy Reading Assistant product line and substantially all of the other assets of the Soliloquy Learning business, based in Waltham, Massachusetts, for cash consideration of $10.7 million. We estimate that as a direct result of this acquisition our revenue and our operating expenses in 2008 will increase.
Results of Operations
Revenues
| | | | | | | | | | | | | | | | |
| | Year Ended December 31, | |
| |
|
(dollars in thousands) | | 2007 | | Change | | 2006 | | Change | | 2005 | |
|
|
|
|
|
|
|
|
|
|
|
|
Products | | $ | 31,023 | | 4 | % | | $ | 29,966 | | -1 | % | | $ | 30,263 | |
Service and support | | | 15,030 | | 36 | % | | | 11,032 | | 10 | % | | | 10,056 | |
|
|
|
|
|
|
|
|
|
|
|
|
|
|
|
|
|
Total revenues | | $ | 46,053 | | 12 | % | | $ | 40,998 | | 2 | % | | $ | 40,319 | |
|
|
|
|
|
|
|
|
|
|
|
|
|
|
|
|
|
2007 revenue compared to 2006: Product revenues, which comprise the majority of our revenue, increased modestly in 2007 compared to 2006. The growth in product revenues was slower than total revenues due to lower than expected product sales, and an increase in multiple year service and support packages which include a lower proportion of product revenue. In 2007 one customer accounted for more than 10% of our total revenue. On average 48% of booked sales in 2007 were recognized into revenue in the quarter in which the sale occurred.
Our service and support revenue increased significantly in 2007 compared to 2006 due to more services delivered and a higher number of schools on support. At December 31, 2007 we had approximately 32% more schools on support than at December 31, 2006. The increase in schools on support is mainly due to our success in selling renewals to our growing installed base.
2006 revenue compared to 2005: Product revenue declined in 2006 compared to 2005 because we recognized approximately $6.5 million less revenue from sales made in prior periods. This decrease was almost offset by increased revenue recognized on sales booked in 2006. On average 52% of booked sales in 2006 were recognized into revenue in the quarter in which the sale occurred.
Service and support revenue increased in 2006 by 10%, primarily due to stronger sales of on-site services, partially offset by a lower level of revenue recognized from sales made in prior years. Service and support revenue also reflected the increase in the number of schools purchasing ongoing Progress Tracker access and support contracts. We had 26% more customers on support at December 31, 2006 than at December 31, 2005.
Booked sales and selling activity: Booked sales is a non-GAAP financial measure that management uses to evaluate current selling activity. We believe that booked sales is a useful metric for investors as well as management because it is the most direct measure of current demand for our products and services. Booked sales equals the total value (net of allowances) of software, services and support invoiced in the period. Revenue on a GAAP basis is recorded for booked sales when all four of the requirements for revenue recognition have been met; if any of the requirements to recognize revenue are not met, the sale is booked to deferred revenue. We use booked sales information for resource allocation, planning, compensation and other management purposes. We believe that revenue is the most comparable GAAP measure to booked sales. However, booked sales should not be considered in isolation from revenue, and is not intended to represent a substitute measure of revenue or any other performance measure calculated under GAAP.
Page 34
The following reconciliation table sets forth our booked sales, revenues and change in deferred revenue for the twelve months ended December 31, 2007, 2006 and 2005:
| | | | | | | | | | | | | | | | |
| | Year Ended December 31, | |
(dollars in thousands) | | 2007 | | Change | | 2006 | | Change | | 2005 | |
|
Booked sales | | $ | 49,849 | | 16 | % | | $ | 43,154 | | 37 | % | | $ | 31,538 | |
Less revenue | | | 46,053 | | 12 | % | | | 40,998 | | 2 | % | | | 40,319 | |
|
|
|
|
|
|
|
|
|
|
|
|
|
|
|
|
|
Net increase/(decrease) in deferred revenue | | | 3,796 | | | | | | 2,156 | | | | | | (8,781 | ) |
|
|
|
|
|
|
|
|
|
|
|
|
|
|
|
|
|
Total deferred revenue end of period | | $ | 22,955 | | 20 | % | | $ | 19,159 | | 13 | % | | $ | 17,003 | |
|
|
|
|
|
|
|
|
|
|
|
|
|
|
|
|
|
Booked sales in the K-12 sector, which accounted for over 91% of booked sales in 2007, increased 14% to $45.6 million compared to $40.2 million in 2006. Booked sales in the K-12 sector were $28.4 million in 2005.
We believe that the principal reasons for the increase in 2007 booked sales are:
| | |
| • | Our improved sales capacity resulting from additional sales representatives hired in 2006 who became productive in 2007. We had an average of 49 quota bearing sales representatives in 2007, compared to 42 in 2006. |
| | |
| • | A continued focus within our sales organization on quickly closing transactions over $100,000, and on increasing the size of these transactions. Our 2007 sales included one transaction for approximately $7.4 million. |
The increase in booked sales in 2007 was smaller than the increase that we experienced in 2006. The large increase in 2006 was mainly because sales in 2005 in several key states had been depressed due to severe weather conditions, spiking energy prices, and other factors that contributed to general funding uncertainty.
We believe large booked sales are an important indicator of mainstream education industry acceptance and an important factor in reaching our goal of increasing sales force productivity. In 2007 we continued to focus our sales force on multi-site sales, and we closed 90 transactions in excess of $100,000 compared to 102 in 2006 and 59 in 2005. Although we closed fewer large deals in 2007 than in 2006, the average size of these transactions increased substantially, from approximately $285,000 in 2006 to approximately $349,000 in 2007. The increase in average transaction size was mainly due to the impact of one transaction for approximately $7.4 million. For the year ended December 31, 2007, 69% of our K-12 booked sales were realized from sales over $100,000. For the comparable periods ending December 31, 2006 and 2005, large booked sales accounted for 67% and 59% of booked sales respectively.
Large booked sales include volume discounts but the percentage discount applicable to any given transaction will vary and the relative percentage of large sales and smaller sales in a given quarter may fluctuate. Because we discount product license fees but do not discount service and support fees, product booked sales and revenue are disproportionately affected by discounting. We cannot predict the size, number and timing of large transactions in the future.
Booked sales outside the K-12 market (primarily to the adult corrections market, private practice clinicians and international customers) increased by 40% in 2007 compared to 2006, mainly due to the impact of a large corrections sale. International sales increased by 62% in 2007 compared to 2006. Non K-12 sales in 2006 were flat relative to 2005.
Although federal, state and local budget pressures make for an uncertain funding environment for our customers, we are optimistic about our growth prospects in the K-12 market. However, achieving our booked sales growth objectives will depend on increasing customer acceptance of our products, which requires us to continue to focus on improving our products’ ease of use, their fit with school requirements, and our connection with classroom teachers and administrators. Our K-12 growth prospects are also influenced by factors outside our control including the overall level, certainty and allocation of state, local and federal funding. For a discussion of some of the other important factors that affect our results, see Risk Factors. In addition, the revenue recognized from our booked sales can be unpredictable. Our various license and service packages have substantially differing revenue recognition periods, and it is often difficult to predict which license package a customer will purchase, even when the amount and timing of a sale can be reasonably projected. See Management’s Discussion and Analysis – Application of
Page 35
Critical Accounting Policies for a discussion of our revenue recognition policy. In addition, the timing of a single large order or its implementation can significantly impact the level of booked sales and revenue at any given time.
Gross Profit and Cost of Revenues
| | | | | | | | | | |
| | Year Ended December 31, | |
(dollars in thousands) | | 2007 | | 2006 | | 2005 | |
|
Gross profit on products | | $ | 29,343 | | $ | 28,328 | | $ | 28,245 | |
Gross profit margin on products | | | 95 | % | | 95 | % | | 93 | % |
Gross profit on service and support | | | 6,491 | | | 3,135 | | | 4,419 | |
Gross profit margin on services and support | | | 43 | % | | 28 | % | | 44 | % |
|
|
|
|
|
|
|
|
|
|
|
Total gross profit | | $ | 35,834 | | $ | 31,463 | | $ | 32,664 | |
Total gross profit margin | | | 78 | % | | 77 | % | | 81 | % |
|
|
|
|
|
|
|
|
|
|
|
The overall gross profit margin improved slightly in 2007 compared to 2006. The increase in gross margin was driven primarily by increased service and support margins, partially offset by a reduction in the proportion of higher margin product revenue. Service and support revenue growth of 36%, combined with an 8% increase in service and support costs, resulted in an increase in the service and support gross margin from 28% to 43%. The main reasons for the increase in service and support gross margin were higher staff utilization and leverage from our new Tucson support center. Higher margin product revenues comprised 67% of total revenues in 2007 compared to 73% in 2006.
The overall gross profit margin declined in 2006 compared to 2005, as a small improvement in product margin was more than offset by a substantial decrease in services and support margin. Product margins improved primarily because capitalized software amortization, which was charged to product cost of revenue, ceased in June 2006. We also reduced costs by limiting the quantity of electronic media that we send to customers. Service and support margins declined from 2005 to 2006 primarily due to our investment in a new support center in Tucson, Arizona, which replaced an outside vendor. We also hired additional service staff in anticipation of increased service sales.
Operating Expenses
| | | | | | | | | | | | | | | | |
| | Year Ended December 31, | |
(dollars in thousands) | | 2007 | | Change | | 2006 | | Change | | 2005 | |
|
Sales and marketing | | $ | 24,868 | | 18 | % | | $ | 21,073 | | 20 | % | | $ | 17,619 | |
Research and development | | | 4,500 | | 9 | % | | | 4,129 | | 6 | % | | | 3,896 | |
General and administrative | | | 7,660 | | 15 | % | | | 6,643 | | 14 | % | | | 5,841 | |
|
|
|
|
|
|
|
|
|
|
|
|
|
|
|
|
|
Total operating expenses | | $ | 37,028 | | 16 | % | | $ | 31,845 | | 16 | % | | $ | 27,356 | |
|
|
|
|
|
|
|
|
|
|
|
|
|
|
|
|
|
Sales and Marketing: Sales and marketing expenses consist principally of salaries and incentive compensation paid to employees engaged in sales and marketing activities, travel costs, tradeshows, conferences, and marketing and promotional materials. The increase in sales and marketing costs in 2007 compared to 2006 is mostly due to higher employee costs, as headcount has increased by 11% year over year, and also to increased spending on marketing initiatives such as trade shows and the use of marketing consultants, partially offset by reduced incentive compensation costs. In 2006, our sales and marketing expenses increased over 2005, primarily due to increased sales and marketing staff, more marketing activities and higher commissions reflecting higher booked sales. Commissions in 2006 were $1.3 million higher than in 2005. At December 31, 2007, we had 51 field-based quota-bearing sales personnel selling to public schools, compared to 44 and 36 at December 31, 2006 and 2005 respectively. We expect our sales and marketing expenses to increase at a low double digit rate in 2008.
Research and Development: Research and development expenses principally consist of compensation paid to employees and consultants engaged in research and product development activities and product testing, together with software and equipment costs. The increased costs for 2007 compared to 2006 are primarily due to higher outsourced development costs. Research and development expenses increased by 6% in 2006 due primarily to stock compensation expenses and patent acquisition legal fees. We expect research and development expenses to almost double in 2008 due to the addition of the Reading Assistant employees and the amortization of the acquired intangible assets.
Page 36
General and Administrative: General and administrative expenses principally consist of salaries and compensation paid to our executives, accounting staff and other support personnel, as well as travel expenses for these employees, and outside legal and accounting fees. The increase in 2007 expenses compared to 2006 is mostly due to the legal, accounting, printing and travel costs of approximately $688,000 related to our secondary stock offering. Stock compensation expense was also higher in 2007 than in 2006. These costs were partially offset by lower expenses for management incentive compensation. General and administrative expenses increased by 14% in 2006 due primarily to stock compensation expenses and incentive compensation expenses, partially offset by a reduction in accounting and legal fees relating to the restatement of financial results that were expensed in 2005. Accounting and legal fees associated with the restatement that were expensed in 2005 totaled approximately $380,000. We expect general and administrative expenses to increase modestly in 2008.
Other Income from Related Party
In September 2003, we signed an agreement with Posit Science Corporation (“PSC”), transferring our patented technology to PSC for use in the health field. During the twelve months ended December 31, 2007, 2006 and 2005 we recorded $247,000, $150,000, and $50,000 respectively, for royalties received and services provided to PSC. Amounts received to date and any future receipts are being reported as other income as we do not consider these royalties to be part of our recurring operations.
Interest and Other Income (Expense), net
| | | | | | | | | | | | | | | | |
| | Year Ended December 31, | |
(dollars in thousands) | | 2007 | | Change | | 2006 | | Change | | 2005 | |
|
Interest on invested cash | | | 680 | | 38 | % | | | 494 | | 104 | % | | | 242 | |
Reclassification of service revenue | | | 332 | | 132 | % | | | 143 | | NA | | | | — | |
Miscellaneous | | | 7 | | 17 | % | | | 6 | | -97 | % | | | 179 | |
|
|
|
|
|
|
|
|
|
|
|
|
|
|
|
|
|
Interest and other income (expense), net | | $ | 1,019 | | 58 | % | | $ | 643 | | 53 | % | | $ | 421 | |
|
|
|
|
|
|
|
|
|
|
|
|
|
|
|
|
|
In 2007, interest and other income (expense), net, consisted primarily of interest earned on our invested cash of $680,000 and a reclassification of $332,000 of service and support revenue relating to two customers for whom we are no longer performing services. For 2006, interest and other income (expense), net, consisted primarily of interest earned of $494,000 and a reclassification of $143,000 of service and support revenue relating to the same two customers. In 2005, interest and other income (expense), net, comprised mainly interest earned on our invested cash of $242,000 and interest on officer loans of $170,000. All officer loans were repaid in full by March 31, 2006.
Income Tax Provision (Benefit)
During the fourth quarter of 2007, we recorded an income tax benefit of approximately $1.1 million. This benefit included a $1.2 million reduction in our deferred tax asset valuation allowance related to a portion of our deferred tax assets that will more likely than not be realized, based on future projected taxable income for fiscal 2008. Prior to the fourth quarter of 2007, we recorded a full valuation allowance against our deferred tax assets. These projections were based on one year of projected future taxable income.
As of December 31, 2007, we have U.S. federal and state net operating loss carryforwards of approximately $61.2 million and $46.5 million, respectively. The U.S. federal net operating loss carryforwards will expire at various dates beginning in 2018 through 2027 if not utilized. State net operating loss carryforwards will expire at various dates beginning in 2012 through 2017.
As of December 31, 2007, we had U.S. federal and state tax credit carryforwards of approximately $1.2 million and $0.9 million, respectively. The federal credit will expire at various dates beginning in 2011 through 2027, if not utilized. California state research and development credits can be carried forward indefinitely.
Net operating loss carryforwards and credit carryforwards reflected above are limited due to ownership changes as provided in the Internal Revenue Code and similar state provisions.
Page 37
Liquidity and Capital Resources
Our cash and cash equivalents and short-term investments were $21.2 million at December 31, 2007 compared to $16.4 million at December 31, 2006 and $12.1 million at December 31, 2005. At December 31, 2007 there were no borrowings outstanding under our credit line. In January 2008 we expended $9.7 million of our cash for the acquisition of the assets of Soliloquy Learning.
Net cash provided by operations in 2007 was $6.1 million, compared to cash provided by operations of $4.3 million in 2006 and $2.1 million used in operations in 2005. Overall, our receivable collection experience has remained strong throughout 2007. We collected $51.7 million of receivables in 2007, compared to $40.3 million of receivables in 2006 and $34.1 million in 2005.
Net cash used in investing activities in 2007 was $2.4 million, consisting of net purchases of property and equipment of $1.1 million, a loan to JTT Holdings of $1.0 million in connection with the January 2008 acquisition of Soliloquy Learning, and acquisition costs incurred of $319,000.
During the year ended December 31, 2006, we purchased an enterprise-wide customer relationship management system. As of December 31, 2007 and 2006, a net book value of $1.4 million and $463,000, respectively, related to the purchase and subsequent implementation of this system was included in property and equipment. These costs will be depreciated over the initial estimated useful life of five years.
Net cash generated by investing activities in 2006 was $2.4 million, consisting of the maturity of short-term investments of $3.0 million and officer loan repayments of $0.2 million, partially offset by property and equipment purchases of $0.8 million.
Net cash generated by investing activities in 2005 was $0.4 million, consisting of the purchase of $3.0 million of short-term investments and the purchase of hardware and software for $0.2 million, which were more than offset by the repayment of $3.6 million of officer loans.
Net cash generated by financing activities in 2007, 2006 and 2005 was $1.2 million, $0.6 million, and $0.5 million respectively. Net cash generated by financing activities in all three years resulted from the sale of stock upon option exercises and through purchases of stock through the employee stock purchase plan. There was no borrowing on our credit line in 2007 or 2006.
Because our booked sales tend to be seasonal, we may have negative cash flows in particular quarters, particularly the first quarter, when booked sales tend to be substantially lower than in other quarters.
On June 5, 2007 we amended our existing revolving line of credit agreement with Comerica Bank. The maximum that can be borrowed under the agreement is $5.0 million. The line expires on December 2, 2008. Borrowing under the line of credit bears interest at a floating prime rate, or a fixed rate of LIBOR plus 2.5%. To secure the line we granted Comerica a security interest in all of our assets other than our intellectual property. We also agreed with Comerica that we will not grant a security interest in our intellectual property to any third party. Borrowings under the line are subject to various covenants. The agreement includes a letter of credit sublimit not to exceed $1.0 million. At December 31, 2007, we have an outstanding letter of credit for $206,000. There were no borrowings outstanding on the line of credit at December 31, 2007 and we were in compliance with all our covenants.
We expect that cash flow from operations will continue to be our primary source of funds for the next several years. Again, this will require us to achieve certain levels of booked sales. If we are unable to achieve sufficient levels of cash flow from operations, we may seek other sources of debt or equity financing, or may be required to reduce expenses. Reducing our expenses could adversely affect our operations by reducing the resources available for sales, marketing, research or development efforts. We cannot assure you that we will be able to secure additional debt or equity financing on acceptable terms.
Off-Balance Sheet Arrangements
We have no off-balance sheet arrangements.
Page 38
Contractual Obligations and Commitments
We have a non-cancelable lease agreement for our corporate office facilities. The minimum lease payment is approximately $78,000 per month through 2008. After 2008 the base lease payment increases at a compound annual rate of approximately 5%. The lease expires in December 2013. We also have a lease agreement for our Tucson, Arizona office through April 2009 at an average rent of approximately $4,500 per month for the period subsequent to January 1, 2007. In early 2008, we entered into a new lease for our Reading Assistant operations in Waltham, Massachusetts for approximately 6,000 square feet that expires in September 2011. This lease, as well as the existing Waltham lease that expires on March 31, 2008, is included in the table under “operating lease obligations”.
We also make royalty payments to the institutions who participated in the original research that produced our initial products. Our minimum royalty payments are $150,000 per year.
The following table summarizes our obligations at December 31, 2007 and the effects such obligations are expected to have on our liquidity and cash flow in future periods.
| | | | | | | | | | | | | | | | | | | | | |
(dollars in thousands) | | 2008 | | 2009 | | 2010 | | 2011 | | 2012 and
thereafter | | Total | |
|
|
|
|
|
|
|
|
|
|
|
|
|
|
Contractual Obligations: | | | | | | | | | | | | | | | | | | | |
Operating lease obligations | | $ | 1,143 | | $ | 1,142 | | $ | 1,171 | | $ | 1,183 | | | $ | 2,312 | | | $ | 6,951 | |
Purchase obligations | | | 150 | | | 150 | | | 150 | | | 150 | | | | 450 | | | $ | 1,050 | |
|
|
|
|
|
|
|
|
|
|
|
|
|
|
|
|
|
|
|
|
|
|
Total | | $ | 1,293 | | $ | 1,292 | | $ | 1,321 | | $ | 1,333 | | | $ | 2,762 | | | $ | 8,001 | |
|
|
|
|
|
|
|
|
|
|
|
|
|
|
|
|
|
|
|
|
|
|
Our purchase order commitments at December 31, 2007 are not material
Effective January 1, 2007, we adopted the provisions of FASB Interpretation No. 48, “Accounting for Uncertainty in Income Taxes — an interpretation of FASB Statement No. 109.” At December 31, 2007, we had a liability for unrecognized tax benefits and an accrual for the payment of related interest totaling $25,000, of which approximately $3,000 is expected to be paid within one year. For the remaining liability, due to the uncertainties related to these tax matters, we are unable to make a reasonably reliable estimate when cash settlement with a taxing authority will occur. Refer to Note 10 to the Financial Statements for additional discussion on unrecognized tax benefits.
Loans to Current and Former Officers
In March 2001 we made full recourse loans to certain of our officers, in amounts totaling $3.1 million. In 2002 some of these officers left our Company. The notes were secured by shares of our Common Stock owned by the current and former officers. The loans bore interest at 4.94%. Principal and interest were due December 31, 2005. During the twelve months ended December 31, 2005 we received $3.6 million in loan repayments, including interest. At December 31, 2005 there was a remaining balance due of $297,000. This represented principal and interest from one of the former officers. During the first quarter of 2006 we received the balance due in the form of cash and stock.
Application of Critical Accounting Policies
Our financial statements are prepared in accordance with accounting principles generally accepted in the United States (“GAAP”). These accounting principles require us to make certain estimates, assumptions and judgments. We believe that the estimates, assumptions and judgments upon which we rely are reasonable based upon information available to us at the time. The estimates, assumptions and judgments that we make can affect the reported amounts of assets and liabilities as of the date of the financial statements, as well as the reported amounts of revenues and expenses during the periods presented. To the extent there are material differences between these estimates and actual results, our financial statements would be affected.
We believe that the estimates, assumptions and judgments pertaining to revenue recognition and allowance for doubtful accounts are the most critical assumptions to understand in order to evaluate our reported financial results. A detailed discussion of our use of estimates, assumptions and judgments as they relate to these polices is presented below. We have discussed the application of these critical accounting policies with the Audit Committee of the Board of Directors.
Page 39
Revenue Recognition
We derive revenue from the sale of licenses to our software and from service and support fees. Software license revenue is recognized in accordance with AICPA Statement of Position 97-2, “Software Revenue Recognition,” as amended by Statement of Position 98-9 (SOP 97-2). SOP 97-2 provides specific industry guidance and four basic criteria, which must be met to recognize revenue. These are: 1) persuasive evidence of an arrangement exists; 2) delivery of the product has occurred; 3) a fixed or determinable fee; and 4) the probability that the fee will be collected. The application of SOP 97-2 requires us to exercise significant judgment related to our specific transactions and transaction types.
Sales to our school customers typically include multiple elements (e.g., Fast ForWord software licenses, Progress Tracker, our Internet-based participant tracking service, support, training, implementation management, and other services). We recognize revenue using the residual method, whereby the difference between the total arrangement fee and the total “vendor specific objective evidence”(“VSOE”) of fair value of the undelivered elements is recognized as revenue relating to the delivered elements. VSOE of fair value for each element of an arrangement is based upon the normal pricing and discounting practices for those products and services when sold separately and, for support services, is also measured by the renewal price. We are required to exercise judgment in determining whether VSOE exists for each undelivered element based on whether our pricing for these elements is sufficiently consistent.
The value of software licenses, services and support invoiced during a particular period is recorded as deferred revenue until recognized. All revenue from transactions that include new products that have not yet been delivered is deferred until the delivery of all products. Deferred revenue is recognized as revenue as discussed below.
Multiple contracts with the same customer are generally accounted for as separate arrangements except in cases where contracts are so closely related that they are effectively part of a single arrangement.
Product revenue
Product revenue is primarily derived from the licensing of software and is recognized as follows:
| |
• | Perpetual licenses – software licensed on a perpetual basis. Revenue is recognized at the later of product delivery date or contract start date using the residual method. If VSOE does not exist for all the undelivered elements, all revenue is deferred and recognized ratably over the service period if the undelivered element is services or when all elements have been delivered. |
| |
• | Term licenses – software licensed for a specific time period, generally three to twelve months. Revenue is recognized ratably over the license term. |
| |
• | Individual participant licenses – software licensed for a single participant. Revenue is recognized over the average period of use, typically six weeks. |
Service and support revenue
Service and support revenue is derived from a combination of training, implementation, technical and professional services, online services and customer support. Training, technical and other professional services are typically sold on a per day basis. If VSOE exists for all elements of an arrangement or all elements except software licenses, services revenue is recognized as performed. If VSOE does not exist for all the elements in an arrangement except software licenses, service revenue is recognized over the longest contractual period in an arrangement. Revenue from services sold alone or with support is recognized as performed.
Allowance for Doubtful Accounts
We maintain an allowance for doubtful accounts for estimated losses due to the inability of customers to make payments. We adjust this allowance periodically based on our historical experience of bad debt write offs, which have been low in recent years. Cancellations and refunds are allowed in limited circumstances, and such amounts have not been significant.
Page 40
Income Taxes
We account for income taxes using the liability method, which requires the recognition of deferred tax assets or liabilities for the tax-effected temporary differences between the financial reporting and tax bases of our assets and liabilities, and for net operating loss and tax credit carryforwards. Prior to the fourth quarter of 2007, we recorded a full valuation allowance to reserve for the benefit of our deferred tax assets due to the uncertainty surrounding our ability to realize these assets.
During the fourth quarter of 2007, we recorded an income tax benefit of $1.1 million. This benefit included a $1.2 million reduction in the valuation allowance related to a portion of our deferred tax assets that will more likely than not be realized. This determination was primarily based on projected taxable income. In evaluating our ability to realize our deferred tax assets we consider all available positive and negative evidence including our past operating results and our forecast of future taxable income. In determining future taxable income, we make assumptions to forecast federal and state operating income, the reversal of temporary differences, and the implementation of any feasible and prudent tax planning strategies. These assumptions require significant judgment regarding the forecasts of future taxable income, and are consistent with the forecasts used to manage our business. We intend to maintain the remaining valuation allowance until sufficient further positive evidence exists to support further reversals of the valuation allowance. Our income tax expense recorded in the future will be reduced to the extent of offsetting decreases in our valuation allowance.
Stock-Based Compensation
Under the fair value recognition provisions of SFAS No. 123R, we use the Black-Scholes option valuation model to estimate stock-based compensation expense at the grant date based on the fair value of the award and recognize the expense ratably over the requisite service period of the award. Determining the appropriate fair value model and assumptions used in calculating the fair value of stock-based awards requires judgment, including estimating stock price volatility, forfeiture rates and expected life.
The estimated expected stock price volatility decreased from 80% in 2006 to 49% in 2007. Our expected stock price volatility is based upon our historical experience over the expected life of the options, and this decrease occurred as a result of historical periods beyond the expected life of the options containing highly volatile prices being eliminated from the fiscal 2007 volatility calculation.
In the fourth quarter of 2007 we changed our estimate of the forfeiture rate from 11% to 3.5%, based on our experience of actual forfeiture rates. This resulted in incremental stock compensation expense of approximately $316,000 in the fourth quarter. Stock compensation expense may be adjusted in the future if actual forfeiture rates differ significantly from our current estimates.
| |
ITEM 7A. | QUANTITATIVE AND QUALITATIVE DISCLOSURES ABOUT MARKET RISK |
Interest Rate Risk
Our exposure to market risk for changes in interest rates relates primarily to the rate of interest that we earn on our cash and cash equivalents. We did not hold any marketable debt securities at December 31, 2007. A hypothetical increase or decrease in market interest rates by 10% from the market interest rates at December 31, 2007 would not have a material affect on our results of operations.
Page 41
| |
ITEM 8. | FINANCIAL STATEMENTS AND SUPPLEMENTARY DATA |
| |
| Report of Ernst & Young LLP, Independent Registered Public Accounting Firm |
The Board of Directors and Stockholders
Scientific Learning Corporation
We have audited the accompanying balance sheets of Scientific Learning Corporation as of December 31, 2007 and 2006 and the related statements of income, stockholders equity (deficit), and cash flows for each of the three years in the period ended December 31, 2007. Our audits also included the financial statement schedule listed in the index at Item 15(a)(2). These financial statements and schedule are the responsibility of the Company’s management. Our responsibility is to express an opinion on these financial statements and schedule based on our audits.
We conducted our audits in accordance with the standards of the Public Company Accounting Oversight Board (United States). Those standards require that we plan and perform the audit to obtain reasonable assurance about whether the financial statements are free of material misstatement. We were not engaged to perform an audit of the Company’s internal control over financial reporting. Our audits included consideration of internal control over financial reporting as a basis for designing audit procedures that are appropriate in the circumstances, but not for the purpose of expressing an opinion on the effectiveness of the Company’s internal control over financial reporting. Accordingly, we express no such opinion. An audit also includes examining, on a test basis, evidence supporting the amounts and disclosures in the financial statements, assessing the accounting principles used and significant estimates made by management, and evaluating the overall financial statement presentation. We believe that our audits provide a reasonable basis for our opinion.
In our opinion, the financial statements referred to above present fairly, in all material respects, the financial position of Scientific Learning Corporation as of December 31, 2007 and 2006, and the results of its operations and its cash flows for each of the three years in the period ended December 31, 2007, in conformity with U.S. generally accepted accounting principles. Also, in our opinion, the related financial statement schedule, when considered in relation to the basic financial statements taken as a whole, presents fairly in all material respects the information set forth therein.
As discussed in Notes 1 and 10 to the financial statements, Scientific Learning Corporation changed its method of accounting for share based payments as of January 1, 2006 and its method of accounting for uncertain tax positions as of January 1, 2007.
/s/ ERNST & YOUNG LLP
San Francisco, California
March 10, 2008
Page 42
Scientific Learning Corporation
Balance Sheets
(In thousands, except share and per share amounts)
| | | | | | | | | | | |
| | December 31,
2007 | | December 31,
2006 | |
| |
| |
| |
Assets | | | | | | | |
Current assets: | | | | | | | |
Cash and cash equivalents | | | $ | 21,179 | | | | $ | 16,364 | | |
Accounts receivable, net of allowance for doubtful accounts of $96 and $99 at December 31, 2007 and 2006, respectively | | | | 6,155 | | | | | 7,098 | | |
Deferred income taxes | | | | 1,191 | | | | | — | | |
Prepaid expenses and other current assets | | | | 1,291 | | | | | 971 | | |
| | |
|
| | | |
|
| | |
| | | | | | | | | | | |
Total current assets | | | | 29,816 | | | | | 24,433 | | |
| | | | | | | | | | | |
Property and equipment, net | | | | 1,742 | | | | | 941 | | |
Loan to JTT Holdings | | | | 1,000 | | | | | — | | |
Deferred acquisition costs | | | | 319 | | | | | — | | |
Other assets | | | | 926 | | | | | 909 | | |
| | |
|
| | | |
|
| | |
|
Total assets | | | $ | 33,803 | | | | $ | 26,283 | | |
| | |
|
| | | |
|
| | |
| | | | | | | | | | | |
Liabilities and stockholders’ equity | | | | | | | | | | | |
Current liabilities: | | | | | | | | | | | |
Accounts payable | | | $ | 716 | | | | $ | 607 | | |
Accrued liabilities | | | | 3,859 | | | | | 5,089 | | |
Deferred revenue | | | | 17,379 | | | | | 14,786 | | |
| | |
|
| | | |
|
| | |
| | | | | | | | | | | |
Total current liabilities | | | | 21,954 | | | | | 20,482 | | |
Deferred revenue, long-term | | | | 5,576 | | | | | 4,373 | | |
Other liabilities | | | | 453 | | | | | 411 | | |
| | |
|
| | | |
|
| | |
| | | | | | | | | | | |
Total liabilities | | | | 27,983 | | | | | 25,266 | | |
| | | | | | | | | | | |
Commitments and contingencies | | | | | | | | | | | |
| | | | | | | | | | | |
Stockholders’ equity: | | | | | | | | | | | |
Preferred stock, $0.01 par value; 1,000,000 shares authorized,
no shares issued or outstanding | | | | — | | | | | — | | |
Common stock, $0.01 par value; 40,000,000 authorized,17,315,886 and 16,972,333 shares issued and outstanding at December 31, 2007 and 2006, respectively, and additional paid-in capital | | | | 82,558 | | | | | 78,909 | | |
Accumulated deficit | | | | (76,738 | ) | | | | (77,892 | ) | |
| | |
|
| | | |
|
| | |
| | | | | | | | | | | |
Total stockholders’ equity | | | | 5,820 | | | | | 1,017 | | |
| | |
|
| | | |
|
| | |
| | | | | | | | | | | |
Total liabilities and stockholders’ equity | | | $ | 33,803 | | | | $ | 26,283 | | |
| | |
|
| | | |
|
| | |
See accompanying notes.
Page 43
Scientific Learning Corporation
Statements of Income
(In thousands, except per share amounts)
| | | | | | | | | | |
| | Year Ended December 31, | |
| |
| |
| | 2007 | | 2006 | | 2005 | |
| |
| |
| |
| |
| | | | | | | | | | |
Revenues: | | | | | | | | | | |
Products | | $ | 31,023 | | $ | 29,966 | | $ | 30,263 | |
Service and support | | | 15,030 | | | 11,032 | | | 10,056 | |
| |
|
| |
|
| |
|
| |
Total revenues | | | 46,053 | | | 40,998 | | | 40,319 | |
| | | | | | | | | | |
Cost of revenues: | | | | | | | | | | |
Cost of products | | | 1,680 | | | 1,638 | | | 2,018 | |
Cost of service and support | | | 8,539 | | | 7,897 | | | 5,637 | |
| |
|
| |
|
| |
|
| |
Total cost of revenues | | | 10,219 | | | 9,535 | | | 7,655 | |
| |
|
| |
|
| |
|
| |
| | | | | | | | | | |
Gross profit | | | 35,834 | | | 31,463 | | | 32,664 | |
| | | | | | | | | | |
Operating expenses: | | | | | | | | | | |
Sales and marketing | | | 24,868 | | | 21,073 | | | 17,619 | |
Research and development | | | 4,500 | | | 4,129 | | | 3,896 | |
General and administrative | | | 7,660 | | | 6,643 | | | 5,841 | |
| |
|
| |
|
| |
|
| |
| | | | | | | | | | |
Total operating expenses | | | 37,028 | | | 31,845 | | | 27,356 | |
| |
|
| |
|
| |
|
| |
| | | | | | | | | | |
Operating income (loss) | | | (1,194 | ) | | (382 | ) | | 5,308 | |
| | | | | | | | | | |
Other income from related party | | | 247 | | | 150 | | | 50 | |
Interest and other income (expense), net | | | 1,019 | | | 643 | | | 421 | |
| |
|
| |
|
| |
|
| |
| | | | | | | | | | |
Net income before income tax | | | 72 | | | 411 | | | 5,779 | |
Income tax provision (benefit) | | | (1,082 | ) | | 203 | | | 182 | |
| |
|
| |
|
| |
|
| |
Net income | | $ | 1,154 | | $ | 208 | | $ | 5,597 | |
| |
|
| |
|
| |
|
| |
| | | | | | | | | | |
Basic net income per share: | | $ | 0.07 | | $ | 0.01 | | $ | 0.33 | |
| |
|
| |
|
| |
|
| |
Shares used in computing basic net income per share | | | 17,161 | | | 16,846 | | | 16,715 | |
| |
|
| |
|
| |
|
| |
Diluted net income per share: | | $ | 0.06 | | $ | 0.01 | | $ | 0.31 | |
| |
|
| |
|
| |
|
| |
Shares used in computing diluted net income per share | | | 18,297 | | | 17,740 | | | 18,023 | |
| |
|
| |
|
| |
|
| |
See accompanying notes.
Page 44
Scientific Learning Corporation
Statements of Cash Flows
(In thousands)
| | | | | | | | | | |
| | Year Ended December 31, | |
| |
| |
| | 2007 | | 2006 | | 2005 | |
| |
| |
| |
| |
| | | | | | | | | | |
Operating Activities: | | | | | | | | | | |
Net income | | $ | 1,154 | | $ | 208 | | $ | 5,597 | |
Amounts to reconcile net income to net cash provided by operating activities: | | | | | | | | | | |
Depreciation and amortization | | | 313 | | | 479 | | | 728 | |
Increase in interest receivable from current and former officers | | | — | | | — | | | (169 | ) |
Increase in interest receivable on short term investments | | | — | | | — | | | (44 | ) |
Stock-based compensation | | | 2,463 | | | 2,126 | | | 205 | |
Reduction of deferred tax asset valuation allowance | | | (1,191 | ) | | — | | | — | |
Changes in operating assets and liabilities: | | | | | | | | | | |
Accounts receivable | | | 943 | | | (3,579 | ) | | 2,142 | |
Prepaid expenses and other current assets | | | (320 | ) | | 341 | | | (6 | ) |
Other assets | | | (17 | ) | | 33 | | | (67 | ) |
Accounts payable | | | 109 | | | 393 | | | (389 | ) |
Accrued liabilities | | | (1,230 | ) | | 2,123 | | | (1,372 | ) |
Deferred revenue | | | 3,796 | | | 2,156 | | | (8,781 | ) |
Other liabilities | | | 42 | | | 25 | | | 42 | |
| |
|
| |
|
| |
|
| |
| | | | | | | | | | |
Net cash provided by (used in) operating activities | | | 6,062 | | | 4,305 | | | (2,114 | ) |
| | | | | | | | | | |
Investing Activities: | | | | | | | | | | |
Purchases of property and equipment, net | | | (1,114 | ) | | (821 | ) | | (181 | ) |
Loan to JTT Holdings | | | (1,000 | ) | | — | | | — | |
Deferred acquisition costs | | | (319 | ) | | — | | | — | |
Maturity (purchase) of short-term investments | | | — | | | 3,043 | | | (2,999 | ) |
Repayment on officer loans and accrued interest | | | — | | | 213 | | | 3,561 | |
| |
|
| |
|
| |
|
| |
| | | | | | | | | | |
Net cash provided by (used in) investing activities | | | (2,433 | ) | | 2,435 | | | 381 | |
| | | | | | | | | | |
Financing Activities: | | | | | | | | | | |
Proceeds from issuance of common stock, net | | | 1,186 | | | 602 | | | 474 | |
| |
|
| |
|
| |
|
| |
| | | | | | | | | | |
Net cash provided by financing activities | | | 1,186 | | | 602 | | | 474 | |
| |
|
| |
|
| |
|
| |
| | | | | | | | | | |
Increase (decrease) in cash and cash equivalents | | | 4,815 | | | 7,342 | | | (1,259 | ) |
| | | | | | | | | | |
Cash and cash equivalents at beginning of period | | | 16,364 | | | 9,022 | | | 10,281 | |
| |
|
| |
|
| |
|
| |
| | | | | | | | | | |
Cash and cash equivalents at end of period | | $ | 21,179 | | $ | 16,364 | | $ | 9,022 | |
| |
|
| |
|
| |
|
| |
| | | | | | | | | | |
Supplemental disclosure of cash flow information: | | | | | | | | | | |
Cash paid during the year for income taxes | | $ | 292 | | $ | 65 | | $ | 422 | |
| | | | | | | | | | |
Supplemental disclosure of noncash financing activities: | | | | | | | | | | |
Common stock surrendered in connection with repayment of officer loans | | | — | | $ | 84 | | | — | |
See accompanying notes
Page 45
Scientific Learning Corporation
Statements of Stockholders’ Equity (Deficit)
(In thousands, except share amounts)
| | | | | | | | | | | | | | | | | | | |
| | Common Stock and
Additional Paid-In
Capital | | Accumulated
Deficit | | Total
Stockholders’
Equity (Deficit) | |
| | Shares | | Amount | | | |
| |
| |
| |
| |
| |
Balance at December 31, 2004 | | | 16,657,589 | | | | 75,586 | | | | | (83,697 | ) | | | | (8,111 | ) | |
Issuance of common stock under stock option plan | | | 71,778 | | | | 215 | | | | | — | | | | | 215 | | |
Issuance of common stock under employee stock purchase plan | | | 58,795 | | | | 259 | | | | | — | | | | | 259 | | |
Stock-based compensation | | | — | | | | 137 | | | | | — | | | | | 137 | | |
Stock issued in exchange for services | | | 10,896 | | | | 68 | | | | | | | | | | 68 | | |
Net income and comprehensive income | | | — | | | | — | | | | | 5,597 | | | | | 5,597 | | |
| |
|
| | |
|
| | | |
|
| | | |
|
| | |
Balance at December 31, 2005 | | | 16,799,058 | | | $ | 76,265 | | | | $ | (78,100 | ) | | | $ | (1,835 | ) | |
Issuance of common stock under stock option plan | | | 86,422 | | | | 254 | | | | | — | | | | | 254 | | |
Issuance of common stock under employee stock purchase plan | | | 84,555 | | | | 348 | | | | | — | | | | | 348 | | |
Stock-based compensation | | | — | | | | 2,052 | | | | | — | | | | | 2,052 | | |
Stock issued in exchange for services | | | 17,079 | | | | 74 | | | | | — | | | | | 74 | | |
Stock surrendered | | | (14,781 | ) | | | (84 | ) | | | | — | | | | | (84 | ) | |
Net income and comprehensive income | | | — | | | | — | | | | | 208 | | | | | 208 | | |
| |
|
| | |
|
| | | |
|
| | | |
|
| | |
Balance at December 31, 2006 | | | 16,972,333 | | | $ | 78,909 | | | | $ | (77,892 | ) | | | $ | 1,017 | | |
Issuance of common stock under stock option plan | | | 182,375 | | | | 822 | | | | | | | | | | 822 | | |
Issuance of common stock under employee stock purchase plan | | | 81,791 | | | | 364 | | | | | | | | | | 364 | | |
Stock-based compensation | | | — | | | | 2,463 | | | | | | | | | | 2,463 | | |
Vesting of restricted stock units | | | 79,387 | | | | — | | | | | | | | | | — | | |
Net income and comprehensive income | | | | | | | | | | | | 1,154 | | | | | 1,154 | | |
| |
|
| | |
|
| | | |
|
| | | |
|
| | |
Balance at December 31, 2007 | | | 17,315,886 | | | $ | 82,558 | | | | $ | (76,738 | ) | | | $ | 5,820 | | |
| |
|
| | |
|
| | | |
|
| | | |
|
| | |
See accompanying notes
Page 46
Notes to Financial Statements
1. Summary of Significant Accounting Policies
Description of Business
Scientific Learning Corporation develops and distributes the Fast ForWord family of software. Our patented products build learning capacity by rigorously and systematically applying neuroscience-based learning principles to improve the fundamental cognitive skills required to read and learn. To facilitate the use of our products, we offer a variety of on-site and remote professional and technical services, as well as phone, email and web-based support. We sell primarily to K-12 schools in the United States through a direct sales force.
All of our activities are in one operating segment.
We were incorporated in 1995 in the State of California and were reincorporated in 1997 in the State of Delaware.
Use of Estimates
The preparation of financial statements in conformity with accounting principles generally accepted in the United States requires management to make certain estimates and assumptions that affect the reported amounts of assets and liabilities as of the date of the financial statements as well as the reported amounts of revenues and expenses during the periods presented. Actual results may differ from those estimated.
Revenue Recognition
We derive revenue from the sale of licenses to our software and from service and support fees. Software license revenue is recognized in accordance with AICPA Statement of Position 97-2, “Software Revenue Recognition,” as amended by Statement of Position 98-9 (SOP 97-2). SOP 97-2 provides specific industry guidance and four basic criteria, which must be met to recognize revenue. These are: 1) persuasive evidence of an arrangement exists; 2) delivery of the product has occurred; 3) a fixed or determinable fee; and 4) the probability that the fee will be collected. The application of SOP 97-2 requires us to exercise significant judgment related to our specific transactions and transaction types.
Booked sales to our school customers typically include multiple elements (e.g., Fast ForWord software licenses, Progress Tracker, our Internet-based participant tracking service, support, training, implementation management, and other services). We recognize revenue using the residual method, whereby the difference between the total arrangement fee and the total “vendor specific objective evidence” (“VSOE”) of fair value of the undelivered elements is recognized as revenue relating to the delivered elements. VSOE of fair value for each element of an arrangement is based upon the normal pricing and discounting practices for those products and services when sold separately and, for support services, is also measured by the renewal price. We are required to exercise judgment in determining whether VSOE of fair value exists for each undelivered element based on whether our pricing for these elements is sufficiently consistent.
The value of software licenses, services and support invoiced during a particular period is recorded as deferred revenue until recognized. All revenue from transactions that include new products that have not yet been delivered is deferred until the delivery of all products. Deferred revenue is recognized as revenue as discussed below. Direct costs related to deferred software license revenue are deferred until the related license revenue is recognized.
Multiple contracts with the same customer are generally accounted for as separate arrangements, except in cases where contracts are so closely related that they are effectively part of a single arrangement.
Product revenue
Product revenue is primarily derived from the licensing of software and is recognized as follows:
| |
• | Perpetual licenses – software licensed on a perpetual basis. Revenue is recognized at the later of product delivery date or contract start date using the residual method. If VSOE of fair value does not exist for all the undelivered elements, all revenue is deferred and recognized ratably over the service period if the undelivered element is services or when all elements have been delivered. |
Page 47
Notes to Financial Statements
| |
1. | Summary of Significant Accounting Policies (continued) |
| |
• | Term licenses – software licensed for a specific time period, generally three to twelve months. Revenue is recognized ratably over the license term. |
| |
• | Individual participant licenses – software licensed for a single participant. Revenue is recognized over the average period of use, typically six weeks. |
Service and support revenue
Service and support revenue is derived from a combination of training, implementation, technical and professional services, online services and customer support. Training, technical and other professional services are typically sold on a per day basis. If VSOE of fair value exists for all elements of an arrangement or all elements except software licenses, services revenue is recognized as performed. If VSOE of fair value does not exist for all the elements in an arrangement except software licenses, service revenue is recognized over the longest contractual period in an arrangement. Revenue from services sold alone or with support is recognized as performed.
Cash and Cash Equivalents
We consider all highly liquid investments purchased with an original maturity of three months or less to be cash equivalents. Cash and cash equivalents, which primarily consist of cash on deposit with banks, money market funds, and US Government debt with a maturity of three months or less, are stated at cost, which approximates fair value. Our cash and cash equivalents consisted of the following (in thousands):
| | | | | | | |
| | December 31, | |
| |
| |
| | 2007 | | 2006 | |
| |
| |
| |
Cash on deposit | | $ | 336 | | $ | 1,281 | |
Money market funds | | | 20,843 | | | 10,833 | |
US Government debt | | | — | | | 4,250 | |
| |
|
| |
|
| |
| | $ | 21,179 | | $ | 16,364 | |
| |
|
| |
|
| |
Short-Term Investments
We determine the appropriate classification of investments at the time of purchase in accordance with Statement of Financial Accounting Standards No. 115, “Accounting for Certain Investments in Debt and Equity Securities,” and reevaluate such determination at each balance sheet date.
Accounts Receivable
We conduct business primarily with public school districts and speech and language professionals in the United States. We maintain an allowance for doubtful accounts for estimated losses due to the inability of customers to make payments. We adjust this allowance periodically based on our historical experience of bad debt write offs.
Inventories
Product inventories, which are primarily finished goods, are stated at the lower of cost or market and are included in “Prepaid expenses and other current assets”. Cost is determined using a weighted average approach, which approximates the first-in first-out method. If inventory costs exceed expected market value due to obsolescence or lack of demand adjustments are recorded for the difference between the cost and the market value.
Fair Value of Financial Instruments
The carrying amounts of our cash and cash equivalents, short-term investments, accounts receivable, notes receivable from current and former officers, and accounts payable approximate fair value.
Page 48
Notes to Financial Statements
1. Summary of Significant Accounting Policies (continued)
Concentration of Risk
Financial instruments that potentially subject us to concentrations of credit risk consist principally of cash, cash equivalents, short-term investments and accounts receivable.
Cash and cash equivalents are invested in major financial institutions in the United States. Such deposits may be in excess of insured limits and are not insured in other jurisdictions. Management believes that the financial institutions that hold the Company’s investments are financially sound and, accordingly, minimal credit risk exists with respect to these investments.
Our accounts receivable are derived from booked sales to customers located primarily in the United States. We perform ongoing credit evaluations of our customers. We do not require collateral.
An allowance for doubtful accounts is determined with respect to those accounts that we have determined to be doubtful of collection. At December 31, 2007 one customer accounted for more than 10% of our accounts receivable. At December 31, 2006, no customer accounted for more than 10% of our accounts receivable. One customer accounted for more than 10% of our revenue in fiscal 2007. No customers accounted for more than 10% of our revenue in fiscal 2006 or 2005.
We have no off-balance sheet concentration of credit risk, such as foreign exchange contracts, option contracts or other hedging arrangements.
Our concentration of royalty arrangements potentially exposes us to risk. The patents and applications that we license are owned by the Regents of the University of California, and Rutgers, the State University of New Jersey, and relate to the basic speech and sound modification and adaptive technology developed at those institutions. In 2007, approximately 78% of our product booked sales was derived from selling products that use the licensed inventions.
Property and Equipment
Property and equipment are recorded at cost. Depreciation is computed using the straight-line method over the estimated useful lives of the assets, which range from three to five years.
Software Development Costs
We account for software development costs in accordance with Statement of Financial Accounting Standards (“SFAS”) No. 86, “Accounting for the Costs of Computer Software to be Sold, Leased or Otherwise Marketed,” under which certain software development costs incurred subsequent to the establishment of technological feasibility are capitalized and amortized over the estimated lives of the related products. Technological feasibility is established upon completion of a working model. In 2007, 2006 and 2005 costs incurred subsequent to the establishment of technological feasibility for new projects were not significant, and were charged to research and development expense. Software costs are amortized to cost of product revenues over the estimated useful life of the software, which is three years. Amortization was zero, $130,000, and $261,000 for the years ended December 31, 2007, 2006 and 2005, respectively. All capitalized software development costs were fully amortized by June 30, 2006.
Costs related to internally developed software and software purchased for internal use are capitalized in accordance with Statement of Position 98-1, “Accounting for Costs of Computer Software Developed or Obtained for Internal Use.” During the year ended December 31, 2006, we purchased an enterprise-wide, customer relationship management system. As of December 31, 2007, a net book value of $1.4 million related to the purchase and subsequent implementation of this system was included in property and equipment. These costs are being depreciated over the estimated useful life of five years.
Page 49
Notes to Financial Statements
1. Summary of Significant Accounting Policies (continued)
Long-Lived Assets
We regularly review the carrying value of long-lived assets. We continually make estimates regarding future cash flows and other factors to determine the fair value of the respective assets. If these estimates or their related assumptions change in the future, we may be required to record impairment charges for these assets.
Accounting for Stock-Based Compensation
Effective January 1, 2006 we began recording compensation expense associated with stock-based awards and other forms of equity compensation in accordance with SFAS 123R, “Share-Based Payment” (“SFAS 123R”). We adopted SFAS 123R using the modified prospective transition method and consequently have not retroactively adjusted results from prior periods. Under this transition method, compensation cost associated with stock-based awards recognized for fiscal years 2006 and 2007 includes 1) amortization related to the remaining unvested portion of stock-based awards granted prior to January 1, 2006, based on the grant date fair value estimated in accordance with the original provisions of SFAS 123 “Accounting for Stock-Based Compensation” (“FAS 123”); and 2) amortization related to stock-based awards granted subsequent to January 1, 2006, based on the grant-date fair value estimated in accordance with the provisions of SFAS 123R. In addition, we record expense over the service period in connection with shares issued under our employee stock purchase plan and stock options and restricted stock awards. The compensation expense for stock-based awards includes an estimate for forfeitures and is recognized over the service period of the award on a straight-line basis.
Prior to January 1, 2006, we accounted for stock-based awards using the intrinsic value method of accounting in accordance with APB 25, whereby the difference between the exercise price and the fair market value on the date of grant is recognized as compensation expense. Under the intrinsic value method of accounting, no compensation expense was recognized in our Statements of Income when the exercise price of our employee stock option grant equals the market price of the underlying common stock on the date of grant, and the measurement date of the option grant is certain. The measurement date is certain when the date of grant is fixed and determinable.
Advertising
Advertising costs are expensed as incurred. Advertising expense was $2,000, $26,000, and $18,000 for the years ended December 31, 2007, 2006 and 2005, respectively.
Income Taxes
We account for income taxes in accordance with SFAS No. 109, “Accounting for Income Taxes,” which requires the use of the liability method in accounting for income taxes. Under SFAS No. 109, deferred tax assets and liabilities are measured using enacted tax rates and laws that are expected to be in effect when the differences are expected to reverse. Valuation allowances are established when necessary to reduce deferred tax assets to the net amount expected to be realized.
Net Income Per Share
Basic net income per share is computed using the weighted-average number of common shares outstanding during the period. Diluted net income per share reflects the potential dilution of securities by adding common stock equivalents (computed using the treasury stock method) to the weighted-average number of common shares outstanding during the period, if dilutive.
Page 50
Notes to Financial Statements
1. Summary of Significant Accounting Policies (continued)
The following table sets forth the computation of net income per share (in thousands, except per share data):
| | | | | | | | | | |
| | Year Ended December 31, | |
| |
| |
| | 2007 | | 2006 | | 2005 | |
| |
| |
| |
| |
Net income | | $ | 1,154 | | $ | 208 | | $ | 5,597 | |
| |
|
| |
|
| |
|
| |
Weighted average shares used in calculation of basic net income
per share | | | 17,161 | | | 16,846 | | | 16,715 | |
Effect of dilutive securities: | | | | | | | | | | |
Employee stock options and awards | | | 1,136 | | | 894 | | | 1,308 | |
| |
|
| |
|
| |
|
| |
| | | | | | | | | | |
Weighted-average diluted common shares | | | 18,297 | | | 17,740 | | | 18,023 | |
| |
|
| |
|
| |
|
| |
| | | | | | | | | | |
Basic net income per share | | $ | 0.07 | | $ | 0.01 | | $ | 0.33 | |
| |
|
| |
|
| |
|
| |
| | | | | | | | | | |
Diluted net income per share | | $ | 0.06 | | $ | 0.01 | | $ | 0.31 | |
| |
|
| |
|
| |
|
| |
For the years ended December 31, 2007, 2006 and 2005, respectively, 923,621, 1,393,649 and 1,058,652 options with exercise prices greater than the average market price for our common stock were excluded from the calculation of diluted net income per share because their effect is anti-dilutive.
Recent Accounting Pronouncements
In September 2006, the FASB issued Statement of Financial Accounting Standards No. 157, “Fair Value Measurements” (“SFAS 157”). SFAS 157 defines fair value, establishes a framework for measuring fair value in accordance with generally accepted accounting principles and expands disclosures about fair value measurements. SFAS 157 is effective for fiscal years beginning after November 15, 2007. We do not believe that the adoption of SFAS 157 will have a material impact on our financial condition and results of operations.
In February 2007, the FASB issued Statement of Financial Accounting Standards No. 159, “The Fair Value Option for Financial Assets and Financial Liabilities” (“SFAS 159”), including an amendment of FASB Statement No. 115, which allows an entity the irrevocable option to elect fair value for the initial and subsequent measurement for certain financial assets and liabilities on an instrument-by-instrument basis. Subsequent measurements for the financial assets and liabilities an entity elects to record at fair value will be recognized in earnings. Statement 159 also establishes additional disclosure requirements. SFAS 159 is effective for fiscal years beginning after November 15, 2007. We have not elected to adopt SFAS 159.
In December 2007, the FASB issued Statement of Financial Accounting Standards No. 141 (revised 2007) (“SFAS 141R”), “Business Combinations” and Statement of Financial Accounting Standards No. 160 (“SFAS 160”), “Noncontrolling Interests in Consolidated Financial Statements, an amendment of Accounting Research Bulletin No. 51”. SFAS 141R will change how business acquisitions are accounted for and will impact financial statements both on the acquisition date and in subsequent periods. SFAS 160 will change the accounting and reporting for minority interests, which will be recharacterized as noncontrolling interests and classified as a component of equity. SFAS 141R and SFAS 160 are effective for us beginning in the first quarter of fiscal 2010. Early adoption is not permitted. We are currently evaluating the impact that SFAS 141R and SFAS 160 will have on our financial statements.
Page 51
Notes to Financial Statements
2. Stock-Based Compensation
Stock-Based Compensation Plans
On December 31, 2007, we had four active share-based compensation plans, which are described below.
In May 1999, our stockholders approved our 1999 Equity Incentive Plan. The total number of shares authorized for issuance under the plan is 6,492,666. Restricted stock units awarded under this plan generally vest over four years of continuous service in annual or semi-annual installments. Option awards have generally been granted with an exercise price equal to the market price of our common stock at the date of grant, and generally vest based on four years of continuous service with a ten-year contractual term.
In May 1999, our stockholders approved the 1999 Non-Employee Directors’ Stock Option Plan. The total number of shares authorized for issuance under this plan is 250,000.
In May 2002, the Board of Directors approved the 2002 CEO Stock Option Plan, which was subsequently approved by the shareholders in May 2003. The total number of shares authorized for issuance under this plan is 470,588.
In May 1999 the stockholders approved the 1999 Employee Stock Purchase Plan (ESPP), which became effective upon the completion of the initial public offering of our common stock. The total number of shares originally authorized for issuance under the plan was 700,000. In June 2007 an additional 500,000 shares were authorized.
Eligible employees may purchase common stock at 85% of the lesser of the fair market value of our common stock on the first day of the applicable one-year offering period or the last day of the applicable six-month purchase period. At December 31, 2007, 500,533 shares were available for issuance under this plan.
Adoption of SFAS No. 123R
Prior to January 1, 2006, we accounted for our stock plans under the provisions of Accounting Principles Board Opinion No. 25, “Accounting for Stock Issued to Employees” (APB No. 25). Effective January 1, 2006 we began recording compensation expense associated with stock-based awards and other forms of equity compensation in accordance with SFAS 123R, “Share-Based Payment”. We adopted the modified prospective transition method provided for under SFAS 123R, and consequently have not retroactively adjusted results from prior periods.
SFAS No. 123R requires us to estimate forfeitures at the time of grant and revise those estimates in subsequent periods if actual forfeitures differ from those estimates. We use historical data to estimate pre-vesting option forfeitures and record share-based compensation expense only for those awards that are expected to vest. For purposes of calculating pro forma information under SFAS 123 for periods prior to January 1, 2006, we accounted for forfeitures as they occurred. In the fourth quarter of 2007 we changed our estimate of the forfeiture rate from 11% to 3.5%, based on our experience of actual forfeiture rates. This resulted in incremental stock compensation expense of approximately $316,000 in the fourth quarter of fiscal 2007.
In anticipation of the adoption of SFAS No. 123R, we did not modify the terms of any previously granted options. We made minor changes to our equity compensation program by reducing the overall number of shares covered by equity compensation grants and granting restricted stock units beginning in the first quarter of 2006.
The following table presents the pro forma effect on net income and net income per share if we had applied the fair value recognition provisions of SFAS No. 123 to options granted under our share-based compensation arrangements during the year ended December 31, 2005 (in thousands, except per share data):
Page 52
Notes to Financial Statements
2. Stock-Based Compensation (continued)
| | | | |
Net income, as reported | | $ | 5,597 | |
Add: Stock-based compensation costs included in the determination of net income, net of related tax effects | | | 205 | |
| | | | |
Deduct: Total stock-based employee compensation expense determined under fair value based method for all awards, net of related tax effects | | | (1,998 | ) |
| |
|
| |
Pro forma net income | | $ | 3,804 | |
| |
|
| |
| | | | |
Basic net income per share, as reported | | $ | 0.33 | |
| |
|
| |
Basic net income per share, pro forma | | $ | 0.23 | |
| |
|
| |
Diluted net income per share, as reported | | $ | 0.31 | |
| |
|
| |
Diluted net income per share, pro forma | | $ | 0.21 | |
| |
|
| |
Compensation Cost
The following table summarizes the impact of share-based compensation resulting from the application of SFAS 123R in the years ended December 31, 2007 and 2006 (in thousands, except per share amounts):
| | | | | | | | | | | |
| | Year Ended December 31, | |
| |
| |
| | 2007 | | 2006 | |
| |
| |
| |
Cost of service and support revenues | | | $ | 216 | | | | $ | 193 | | |
Sales and marketing | | | | 892 | | | | | 738 | | |
Research and development | | | | 390 | | | | | 314 | | |
General and administrative | | | | 965 | | | | | 881 | | |
| | |
|
| | | |
|
| | |
Total stock-based compensation expense | | | $ | 2,463 | | | | $ | 2,126 | | |
| | |
|
| | | |
|
| | |
Valuation of Stock Option Awards
The fair value of each option award is estimated on the date of grant using the Black-Scholes option valuation model. This model requires the input of subjective assumptions, including expected stock price volatility, the estimated life of each award and estimated pre-vesting forfeitures. The fair value of these stock options was estimated assuming no expected dividends and estimates of expected life, volatility and risk-free interest rate at the time of grant. Estimated volatility is based on the historical prices of our common stock over the expected life of each option. Expected life of the options is based on our history of option exercise and cancellation activity. The risk free interest rates used are based on the U.S. Treasury yield curve in effect at the time of grants for periods corresponding with the expected life of the options. We use historical data to estimate pre-vesting option forfeitures. We recognize compensation expense for the fair values of these awards, which typically have graded vesting, on a straight-line basis over the requisite service period of each of these awards.
The fair value of stock options granted was estimated using the following weighted-average assumptions:
| | | | | | | | | | |
| | 2007 | | 2006 | | 2005 | |
| |
| |
| |
| |
|
Expected life (in years) | | | 4 | | | 4 | | | 4 | |
Risk-free interest rate | | | 4.9 | % | | 5.1 | % | | 3.7 | % |
Dividend yield | | | 0.0 | % | | 0.0 | % | | 0.0 | % |
Expected volatility | | | 49 | % | | 80 | % | | 106 | % |
Page 53
Notes to Financial Statements
2. Stock-Based Compensation (continued)
Summary of Stock Options
The following table summarizes all stock option activity under our share-based compensation plans for the year ended December 31, 2007:
| | | | | | | | | | | | | | |
| | Outstanding Options | |
| |
| |
| | Number of
Shares | | Weighted-
Average
Exercise
Price Per
Share | | Weighted-
Average
Remaining
Contractual
Term (Years) | | Aggregate
Intrinsic
Value | |
| |
|
|
|
|
|
|
| |
Outstanding at December 31, 2006 | | | 3,299,644 | | | $ | 4.23 | | | | | | | |
Granted | | | 230,000 | | | $ | 7.16 | | | | | | | |
Exercised | | | (182,375 | ) | | $ | 4.51 | | | | | | | |
Forfeited | | | (63,738 | ) | | $ | 9.24 | | | | | | | |
| |
|
| | | | | | | | | | | |
Outstanding at December 31, 2007 | | | 3,283,531 | | | $ | 4.33 | | | 4.72 | | $ | 6,277,925 | |
| |
|
| | |
|
| | |
| |
|
| |
| | | | | | | | | | | | | | |
Vested and expected to vest at December 31, 2007 | | | 3,106,914 | | | $ | 4.44 | | | 4.72 | | $ | 5,704,548 | |
| | | | | | | | | | | | | | |
Exercisable at December 31, 2007 | | | 2,202,374 | | | $ | 4.98 | | | 4.66 | | $ | 3,298,478 | |
| |
|
| | |
|
| | |
| |
|
| |
The aggregate intrinsic value of options outstanding at December 31, 2007 is calculated as the difference between the exercise price of the underlying options and the market price of our common stock for the 1,940,964 shares that had exercise prices that were lower than the $5.36 market price of our common stock at December 31, 2007 (“in the money options”). The total intrinsic value of options exercised during the years ended December 31, 2007, 2006 and 2005 was $416,000, $151,000, and $192,000, respectively. The fair value of options vested during the years ended December 31, 2007, 2006 and 2005 was $1.5 million, $1.7 million, and $1.7 million, respectively. The weighted average grant date fair value of options granted during the years ended December 31, 2007, 2006 and 2005 was $2.96, $2.67, and $4.31, respectively.
The following table summarizes information concerning outstanding and exercisable stock options at December 31, 2007:
| | | | | | | | | | | | | | | | | | | |
| | Outstanding | | Exercisable | |
| |
| |
| |
Price Range | | Number of
Shares | | Weighted-
Average
Exercise
Price Per
Share | | Weighted-
Average
Remaining
Contractual
Life (Years) | | Number of
Shares | | Weighted Average
Exercise Price Per
Share | |
|
|
|
|
|
|
|
|
|
|
|
|
|
$0.75 - $1.39 | | | 1,097,364 | | | $ | 1.38 | | | 4.4 | | | 347,364 | | | $ | 1.35 | | |
$1.40 - $1.90 | | | 376,600 | | | $ | 1.71 | | | 4.7 | | | 376,600 | | | $ | 1.71 | | |
$1.98 - $5.36 | | | 467,000 | | | $ | 4.22 | | | 4.1 | | | 457,375 | | | $ | 4.20 | | |
$5.39 - $5.95 | | | 662,170 | | | $ | 5.83 | | | 6.8 | | | 526,815 | | | $ | 5.81 | | |
$5.96 - $30.50 | | | 680,397 | | | $ | 9.14 | | | 3.6 | | | 494,220 | | | $ | 9.88 | | |
| |
|
| | | | | | | | |
|
| | | | | | |
| | | 3,283,531 | | | $ | 4.33 | | | 4.7 | | | 2,202,374 | | | $ | 4.98 | | |
| |
|
| | | | | | | | |
|
| | | | | | |
As of December 31, 2007, total unrecognized compensation cost related to stock options granted under our various plans was $1.1 million. We expect that cost to be recognized over a weighted-average period of 0.9 years.
Page 54
Notes to Financial Statements
2. Stock-Based Compensation (continued)
Summary of Restricted Stock Units and Restricted Stock Awards
The following table summarizes all restricted stock unit activity under our share-based compensation plans for the years ending December 31, 2007 and 2006:
| | | | | | | | | | | | |
| | Outstanding Restricted Stock Units | |
| |
| |
| | Number of
Shares | | Weighted-
Average
Remaining
Contractual
Term (Years) | | Aggregate
Intrinsic Value | |
| |
|
|
|
|
| |
Outstanding at December 31, 2006 | | 229,000 | | | | | | | | | | |
Awarded | | 351,500 | | | | | | | | | | |
Vested | | (90,499 | ) | | | | | | | | | |
Forfeited or expired | | (14,500 | ) | | | | | | | | | |
| |
| | | | | | | | | | |
Outstanding at December 31, 2007 | | 475,501 | | | | | | | | | | |
| |
| | | | | | | | | | |
| | | | | | | | | | | | |
Vested and expected to vest at
December 31, 2007 | | 434,629 | | | | 1.53 | | | $ | 2,329,611 | | |
| |
| | | |
| | |
|
| | |
Restricted stock units were granted for the first time in 2006 under our 1999 Equity Incentive Plan. The fair value of these grants was calculated based upon the fair market value of our stock at the date of grant, less an estimate of pre-vesting forfeitures. The weighted-average grant-date fair value of restricted stock units awarded during fiscal years 2007 and 2006 was $6.83 and $4.88, respectively, and the fair value of stock units that vested during fiscal years 2007 and 2006 was $771,000 and $289,000, respectively. As of December 31, 2007, total unrecognized compensation cost related to restricted stock units was $2.3 million. We expect that cost to be recognized over a weighted-average period of 3.0 years.
Employee Stock Purchase Plan (“ESPP”)
ESPP awards for offering periods prior to and after the adoption of SFAS No. 123R were valued using the Black-Scholes model using the following assumptions:
| | | | | | | | | | |
| | 2007 | | 2006 | | 2005 | |
| |
| |
| |
| |
|
Expected life (in years) | | | 0.5 - 1.0 | | | 0.5 - 1.0 | | | 0.5 - 1.0 | |
Risk-free interest rate | | | 5.0% | | | 4.2% | | | 2.6% | |
Dividend yield | | | 0.0% | | | 0.0% | | | 0.0% | |
Expected volatility | | | 44% | | | 40% | | | 45% | |
Disclosures Pertaining to All Share-Based Compensation Plans
Cash received under all share-based payment arrangements for the years ended December 31, 2007, 2006 and 2005 was $1.2 million, $602,000, and $474,000, respectively, related to the exercise of stock options and the purchase of ESPP shares. The weighted-average grant-date fair value of options, restricted stock units and restricted stock awards granted in the years ended December 31, 2007, 2006 and 2005 was $5.32, $4.21, and $4.36 per share, respectively.
Page 55
Notes to Financial Statements
3. Prepaid Expenses and Other Current Assets
Prepaid expenses and other current assets consist of the following (in thousands):
| | | | | | | |
| | December 31, | |
| |
| |
| | 2007 | | 2006 | |
| |
| |
| |
Prepaid expenses | | $ | 1,037 | | $ | 815 | |
Product inventory | | | 111 | | | 130 | |
Other receivables | | | 143 | | | 26 | |
| |
|
| |
|
| |
| | $ | 1,291 | | $ | 971 | |
| |
|
| |
|
| |
4. Property and Equipment
Property and equipment consists of the following (in thousands):
| | | | | | | |
| | December 31, | |
| |
| |
| | 2007 | | 2006 | |
| |
| |
| |
| | | | | | | |
Computer equipment and software | | | 6,376 | | $ | 5,284 | |
Office furniture and equipment | | | 1,518 | | | 1,518 | |
Leasehold improvements | | | 489 | | | 489 | |
| |
|
| |
|
| |
| | | 8,383 | | | 7,291 | |
Less accumulated depreciation | | | (6,641 | ) | | (6,350 | ) |
| |
|
| |
|
| |
| | $ | 1,742 | | $ | 941 | |
| |
|
| |
|
| |
Depreciation expense for the years ended December 31, 2007, 2006, and 2005 was $313,000, $350,000, and $467,000, respectively.
5. Deferred Acquisition Costs
Deferred acquisition costs consist principally of legal and accounting fees directly associated with the negotiation and execution of the Purchase Agreement for the acquisition of the Soliloquy Learning business (see Note 17). These costs will be included in the purchase price upon the closing of the transaction.
6. Other Assets
Other assets consist of the following (in thousands):
| | | | | | | |
| | December 31, | |
| |
| |
| | 2007 | | 2006 | |
| |
| |
| |
Long-term lease deposits | | $ | 855 | | $ | 855 | |
Other non current assets | | | 71 | | | 54 | |
| |
|
| |
|
| |
| | $ | 926 | | $ | 909 | |
| |
|
| |
|
| |
Page 56
Notes to Financial Statements
7. Accrued Liabilities
Accrued liabilities consist of the following (in thousands):
| | | | | | | |
| | December 31, | |
| |
| |
| | 2007 | | 2006 | |
| |
| |
| |
Accrued vacation | | $ | 903 | | $ | 1,036 | |
Accrued commissions and bonus | | | 1,267 | | | 2,710 | |
Accounts payable accruals | | | 663 | | | 503 | |
Other accrued liabilities | | | 1,026 | | | 768 | |
Accrued income tax payable | | | — | | | 72 | |
| |
|
| |
|
| |
| | $ | 3,859 | | $ | 5,089 | |
| |
|
| |
|
| |
8. Deferred Revenue
Deferred revenue consists of the following (in thousands):
| | | | | | | |
| | December 31, | |
| |
| |
| | 2007 | | 2006 | |
| |
| |
| |
Current: | | | | | | | |
Products | | $ | 4,586 | | $ | 5,484 | |
Service and support | | | 12,793 | | | 9,302 | |
| |
|
| |
|
| |
| | $ | 17,379 | | $ | 14,786 | |
| |
|
| |
|
| |
Long term: | | | | | | | |
Products | | $ | 505 | | $ | 1,519 | |
Service and support | | | 5,071 | | | 2,854 | |
| |
|
| |
|
| |
| | $ | 5,576 | | $ | 4,373 | |
| |
|
| |
|
| |
9. Bank Line of Credit
On June 5, 2007 we amended our existing revolving line of credit agreement with Comerica Bank. The maximum that can be borrowed under the agreement is $5.0 million. The line expires on December 2, 2008. Borrowing under the line of credit bears interest at a floating prime rate, or a fixed rate of LIBOR plus 2.5%. To secure the line we granted Comerica a security interest in all of our assets other than our intellectual property. We also agreed with Comerica that we will not grant a security interest in our intellectual property to any third party. Borrowings under the line are subject to various covenants. The agreement includes a letter of credit sublimit not to exceed $1.0 million. At December 31, 2007, we have an outstanding letter of credit for $206,000. There were no borrowings outstanding on the line of credit at December 31, 2007 and we were in compliance with all our covenants.
Page 57
Notes to Financial Statements
10. Income Taxes
All income before income taxes is derived from the United States.
The components of the provision (benefit) for income taxes are as follows (in thousands):
| | | | | | | | | | |
| | Year ended December 31, | |
| |
| |
| | 2007 | | 2006 | | 2005 | |
| |
| |
| |
| |
Current: | | | | | | | | | | |
Federal | | $ | 28 | | $ | 97 | | $ | 159 | |
State | | | 81 | | | 106 | | | 23 | |
| |
|
| |
|
| |
|
| |
Total current | | | 109 | | | 203 | | | 182 | |
| | | | | | | | | | |
Deferred: | | | | | | | | | | |
Federal | | | (1,055 | ) | | — | | | — | |
State | | | (136 | ) | | — | | | — | |
| |
|
| |
|
| |
|
| |
Total deferred | | | (1,191 | ) | | — | | | — | |
| | | | | | | | | | |
Total provision (benefit) for income taxes | | $ | (1,082 | ) | $ | 203 | | $ | 182 | |
| |
|
| |
|
| |
|
| |
Differences between income taxes calculated using the federal statutory income tax rate and the provision (benefit) for income taxes were as follows (in thousands):
| | | | | | | | | | |
| | Year ended December 31, | |
| |
| |
| | 2007 | | 2006 | | 2005 | |
| |
| |
| |
| |
| | | | | | | | | | |
Computed tax at statutory rate of 34% | | $ | 24 | | $ | 140 | | $ | 1,965 | |
State taxes, net of federal benefit | | | 80 | | | 73 | | | 23 | |
Federal Alternative Minimum Tax | | | 41 | | | 97 | | | 159 | |
Losses benefited | | | (783 | ) | | (631 | ) | | (2,015 | ) |
Non deductible stock-based compensation | | | 435 | | | 407 | | | — | |
Other non deductible expenses | | | 312 | | | 117 | | | 50 | |
Change in valuation allowance | | | (1,191 | ) | | | | | | |
| |
|
| |
|
| |
|
| |
Total provision (benefit) for income taxes | | $ | (1,082 | ) | $ | 203 | | $ | 182 | |
| |
|
| |
|
| |
|
| |
Deferred income taxes reflect the net tax effects of temporary differences between carrying amounts of assets and liabilities for financial reporting purposes and the amounts used for income tax purposes. Significant components of our deferred tax assets are as follows, (in thousands):
| | | | | | | |
| | December 31, | |
| | 2007 | | 2006 | |
| |
| |
| |
| | | | | | | |
Net operating losses | | $ | 22,507 | | $ | 23,353 | |
Capitalized software and development costs | | | 76 | | | 202 | |
Deferred revenue | | | 2,177 | | | 2,250 | |
Research credits carry forwards | | | 1,918 | | | 1,723 | |
Other | | | 1,780 | | | 509 | |
| |
|
| |
|
| |
Total gross deferred tax assets | | | 28,458 | | | 28,037 | |
Valuation Allowance | | | (27,267 | ) | | (28,037 | ) |
| |
|
| |
|
| |
Total net deferred tax assets | | $ | 1,191 | | $ | — | |
| |
|
| |
|
| |
Page 58
Notes to Financial Statements
10. Income Taxes (continued)
During the fourth quarter of 2007, we recorded an income tax benefit of $1.1 million. This benefit included a $1.2 million reduction in the valuation allowance related to a portion of our deferred tax assets that will more likely than not be realized. This determination was primarily based on projected taxable income. In evaluating our ability to realize our deferred tax assets we consider all available positive and negative evidence including our past operating results and our forecast of future taxable income. In determining future taxable income, we make assumptions to forecast federal and state operating income, the reversal of temporary differences, and the implementation of any feasible and prudent tax planning strategies. These assumptions require significant judgment regarding the forecasts of future taxable income, and are consistent with the forecasts used to manage our business. We intend to maintain the remaining valuation allowance until sufficient further positive evidence exists to support further reversals of the valuation allowance. Our income tax expense recorded in the future will be reduced to the extent of offsetting decreases in our valuation allowance.
As of December 31, 2007, we have U.S. federal and state net operating loss carryforwards of approximately $61.2 million and $46.5 million, respectively. The U.S. federal net operating loss carryforwards will expire at various dates beginning in 2018 through 2027 if not utilized. State net operating loss carryforwards will expire at various dates beginning in 2012 through 2017.
As of December 31, 2007, we have U.S. federal and state tax credit carryforwards of approximately $1.2 million and $0.9 million, respectively. The federal credit will expire at various dates beginning in 2011 through 2027, if not utilized. California state research and development credits can be carried forward indefinitely.
In connection with the Company’s adoption of SFAS 123R, the Company uses the “with-and-without” approach described in EITF Topic No. D-32, “Intraperiod Tax Allocation of the Tax Effect of Pretax Income from Continuing Operations” to determine the recognition and measurement of excess tax benefits. In addition, the Company has elected to account for indirect effects of stock option based awards on other tax attributes, such as research and alternative minimum tax credits, through the income statement. Accordingly, the Company has elected to recognize excess tax benefits from stock option exercises in additional paid in capital only if an incremental income tax benefit would be realized after considering all other tax attributes presently available to the Company.
Therefore, included in the net operating loss carryforwards are losses created by the exercise of stock options. Although these net operating loss carryforwards are reflected in total U.S. net operating tax loss carryforwards, pursuant to SFAS 123(R), deferred tax assets associated with these deductions are only recognized to the extent that they reduce taxes payable. Further, these recognized deductions are treated as direct increases to stockholders’ equity and as a result do not impact the Statement of Operations. To the extent stock-option related deductions are not recognized pursuant to SFAS123(R), the unrecognized benefit is not reflected on the Consolidated Balance Sheet. Accordingly, the Company has reduced deferred tax assets by approximately $1.2 million which represents the unrecognized benefit from stock-option related net operating loss carryforwards as of December 31, 2007, that is potentially available for utilization in future years.
Net operating loss carryforwards and credit carryforwards reflected above are limited due to ownership changes as provided in the Internal Revenue Code and similar state provisions.
Accounting for Uncertainty in Income Taxes
Effective January 1, 2007, we adopted the provisions of FASB Interpretation No. 48, “Accounting for Uncertainty in Income Taxes — an interpretation of SFAS No. 109” (“FIN 48”). FIN 48 prescribes a recognition threshold and a measurement attribute for the financial statement recognition and measurement of tax positions taken or expected to be taken in a tax return. For those benefits to be recognized, a tax position must be more-likely-than-not to be sustained upon examination by taxing authorities. There was not a material impact on our financial position and results of operations as a result of the adoption of the provisions of FIN 48. At December 31, 2007, we had a liability for unrecognized tax benefits of $1,876,000 (of which $25,000, if recognized, would favorably affect the company’s effective tax rate). We do not believe there will be any material changes in our unrecognized tax positions over the next twelve months.
Page 59
Notes to Financial Statements
10. Income Taxes (continued)
Interest and penalty costs related to unrecognized tax benefits are classified as a component of “Income Tax Expense” in the accompanying statement of operations and the corresponding liability in “Income Taxes Payable” or “Prepaid Income Taxes” in the accompanying balance sheet. We recognized $5,000 of interest expense related to unrecognized tax benefits for the year ended December 31, 2007.
We file income tax returns in the U.S. federal jurisdiction and various state jurisdictions. We are subject to U.S. federal income tax examination for calendar tax years ending 2005 through 2007. We recently completed an audit from the I.R.S for our 2004 and earlier tax years. Additionally, we are subject to various state income tax examinations for the 1997 through 2007 calendar tax years.
A reconciliation of the beginning and ending amount of unrecognized tax benefits is as follows: (in thousands):
| | | | |
Balance at January 1, 2007 | | $ | 1,361 | |
Additions for tax positions of prior years | | | 503 | |
Additions for tax positions related to 2007 | | | 12 | |
Reductions for tax positions of prior years | | | — | |
Settlements | | | — | |
Balance at December 31, 2007 | | $ | 1,876 | |
| |
|
| |
The Company accounts for any applicable interest and penalties on uncertain tax positions as a component of income tax expense. The liability for uncertain income taxes as of the date of adoption (January 1, 2007) and December 31, 2007 includes interest and penalties of zero and $ 25,000, respectively.
11. Stockholders’ Equity (Deficit)
Common Stock
At December 31, 2007, we had reserved shares of common stock for future issuance as follows:
| | | | |
Stock options outstanding | | | 3,283,531 | |
Stock awards outstanding | | | 475,501 | |
Stock options available for future grants | | | 971,167 | |
Employee stock purchase plan | | | 500,533 | |
Common stock warrants | | | 1,375,000 | |
| |
|
| |
| | | 6,605,732 | |
| |
|
| |
Common Stock Warrants
In 2001, we issued a fully vested non-forfeitable warrant to purchase 1,375,000 shares of our common stock at an exercise price of $8.00 per share. The warrant was issued to WPV, Inc., an affiliate of a significant former stockholder of ours, in connection with the guarantee of a line of credit to us. The warrant is outstanding and will expire if unexercised by March 9, 2008.
Page 60
12. Commitments and Contingencies
Leases
We lease our Oakland, California corporate office facility and our Tucson, Arizona office under non-cancelable operating leases with terms expiring in 2013 and 2009, respectively. In early 2008, we entered into a new lease for our Reading Assistant operations in Waltham, Massachusetts for approximately 6,000 square feet that expires in September 2011. This lease, as well as the existing Waltham lease that expires on March 31,2008, is included in the table.
Future minimum payments under these leases as of December 31, 2007 are as follows (in thousands):
| | | | |
2008 | | $ | 1,143 | |
2009 | | | 1,142 | |
2010 | | | 1,171 | |
2011 | | | 1,183 | |
2012 and thereafter | | | 2,312 | |
| |
|
| |
| | $ | 6,951 | |
| |
|
| |
Rent expense under all operating leases was $1.0 million for each of the years ended December 31, 2007, 2006 and 2005.
License Agreement
In September 1996, we entered into a license agreement with a university for the use of the intellectual property underlying its most significant current products. In exchange for the license, which expires in 2014, we issued stock and paid a license-issue fee. The agreement also provided for milestone payments, all of which have been made, and for royalties based on booked sales of products using the licensed technology. Royalty expenses were $1,028,000, $868,000, and $1,048,000 for the years ended December 31, 2007, 2006 and 2005, respectively, and are included in cost of product revenues. Annual minimum guaranteed royalty payments are $150,000.
If we lose or are unable to maintain the license agreement during the term of the underlying patents, it would adversely affect our business. The university may terminate the license agreement if we fail to perform or violate its terms without curing the violation within 60 days of receiving written notice of the violation.
Litigation
Litigation with Former Sales Representative
On January 23, 2008, Robert G. (Jerry) Smith, a former account manager in Florida, filed a complaint against us in US District Court for the Middle District of Florida. The lawsuit claims breach of contract for unpaid wages of approximately $423,000. Smith alleges that he is owed additional commission relating to large sale transaction in the second quarter of 2007. We are in the early stages of this proceeding, discovery has not yet started.
Litigation with School District Customer
On October 22, 2007, we were sued by the Christina School District (the “District”) in the US District Court for the District of Delaware. The District had previously been sued by investors who are the assignees of the lessor under a Master Lease Purchase Agreement (the “Lease Agreement”) entered into by the District in 2003. The District ceased making payments under the Lease Agreement and the investors have claimed that the District breached the Lease Agreement. The District filed a third party complaint against us, claiming that we must refund amounts paid to us by the District for training and consulting under our contracts with the District. Because the District decided not to use our products, it did not therefore use all of the services specified in the contract. The third party complaint alleges unjust enrichment against us. The District states that the amount it is seeking is approximately $220,000. We have filed a motion to dismiss the complaint, which has not yet been decided.
Page 61
Notes to Financial Statements
12. Commitments and Contingencies (continued)
We believe that these claims are not meritorious and that we do not have any significant liability to these claimants. We therefore do not believe that the resolution of these matters will have a material adverse effect on our financial position or results of operations.
13. Warranties; Indemnification
We generally provide a warranty that our software products substantially operate as described in the manuals and guides that accompany the software for a period of 90 days. The warranty does not apply in the event of misuse, accident, and certain other circumstances. To date, we have not incurred any material costs associated with these warranties and have no accrual for such items at December 31, 2007.
From time to time, we enter into contracts that require us, upon the occurrence of certain contingencies, to indemnify parties against third party claims. These contingent obligations primarily relate to (i) claims against our customers for violation of third party intellectual property rights caused by our products; (ii) claims resulting from personal injury or property damage resulting from our activities or products; (iii) claims by our office lessors arising out of our use of the premises; and (iv) agreements with our officers and directors under which we may be required to indemnify such persons for liabilities arising out of their activities on our behalf. Because the obligated amounts for these types of agreements usually are not explicitly stated, the overall maximum amount of these obligations cannot be reasonably estimated. No liabilities have been recorded for these obligations on our balance sheet as of December 31, 2007 or 2006.
14. Employee Retirement and Benefit Plan
We have a defined contribution retirement plan under Section 401(k) of the Internal Revenue Code, which covers substantially all employees. Eligible employees may contribute amounts to the plan, via payroll withholding, subject to certain limitations. In 2007 we started to match contributions by plan participants at a rate of 3% of salary, with an annual maximum of $2,000 per participant. For the year ended December 31, 2007 our matching contributions were $280,000.
15. Related Party Transactions
On September 30, 2003, we entered into an agreement with Posit Science Corporation (“Posit Science”), formerly Neuroscience Solutions Corporation, to provide Posit Science with exclusive rights in the healthcare field to certain intellectual property, patents and software we own or license, along with transfer of certain healthcare research projects. A co-founder, substantial shareholder, and member of our Board of Directors is a co-founder, officer, director and substantial shareholder of Posit Science.
The rights were acquired by Posit Science for a combination of cash, stock and future royalties. Posit Science paid $500,000 cash, of which $448,000 was recognized as other income during the year ended December 31, 2003. The balance was recognized over the next nine months as services were provided to Posit Science. Amounts received to date and any future receipts are being reported as other income as we do not consider the sale of these rights to be part of our recurring operations. Under the agreement, we will receive net royalties between 2% to 4% on products sold by Posit Science that use our patents or software.
We have a 3.5% equity interest in Posit Science. We recorded royalty income from Posit Science of $246,000, $150,000, and $50,000 in fiscal years 2007, 2006 and 2005, respectively. There is an amount of $158,000 due from Posit Science at December 31, 2007.
In July 2007 Michael A. Moses joined our Board of Directors as Vice Chair and also entered into a consulting agreement with us. The consulting agreement provides for a consulting fee of $40,000 per year and two stock options, both with a five year term and at a per share exercise price of $7.15, the closing price of the Company’s Common Stock on July 25, 2007. The first option grant for 80,000 shares vests over four years, with a one year cliff with ratable monthly vesting thereafter. The second option for 100,000 shares vests only in the event the per share price of the Company’s common stock reaches and maintains for 20 consecutive business days a specified target closing price as follows: 25,000 shares vesting at each target stock price of $15, $20, $25, and $30.
Page 62
Notes to Financial Statements
15. Related Party Transactions (continued)
We also have in place consulting agreements with two of our founders, who are also members of our Board of Directors. Dr. Tallal provides ongoing consulting in the areas of customer relationships and research planning and in 2007, received a retainer of approximately $83,000 for those services. Dr. Merzenich provides consulting services including public speaking, meetings with third parties and other projects as agreed from time to time. Dr. Merzenich is paid a consulting fee of $2,000 per day.
16. Interim Financial Information (unaudited)
Quarterly financial data (in thousands, except per share amounts):
| | | | | | | | | | | | | | | | | | | | | | |
| | 2007 | |
| |
| |
| | Quarter Ended | |
| | March 31 | | June 30 | | September 30 | | December 31 | | Total | |
| |
|
|
|
|
|
|
|
|
| |
Total revenues | | | $ | 8,812 | | | $ | 14,577 | | | $ | 11,350 | | | | $ | 11,314 | | | $ | 46,053 | |
| | | | | | | | | | | | | | | | | | | | | | |
Gross profit | | | | 6,253 | | | | 11,996 | | | | 9,019 | | | | | 8,566 | | | | 35,834 | |
| | | | | | | | | | | | | | | | | | | | | | |
Net income (loss) | | | | (2,628 | ) | | | 2,659 | | | | 246 | | | | | 877 | | | | 1,154 | |
| | | | | | | | | | | | | | | | | | | | | | |
Net income (loss) per share: | | | | | | | | | | | | | | | | | | | | | | |
Basic | | | $ | (0.15 | ) | | $ | 0.16 | | | $ | 0.01 | | | | $ | 0.05 | | | $ | 0.07 | |
| | | | | | | | | | | | | | | | | | | | | | |
Diluted | | | $ | (0.15 | ) | | $ | 0.15 | | | $ | 0.01 | | | | $ | 0.05 | | | $ | 0.06 | |
| | | | | | | | | | | | | | | | | | | | | | |
| | | | | | | | | | | | | | | | | | | | | | |
| | 2006 | |
| |
| |
| | Quarter Ended | |
| | March 31 | | June 30 | | September 30 | | December 31 | | Total | |
| |
| |
Total revenues | | | $ | 7,831 | | | $ | 12,953 | | | $ | 9,925 | | | | $ | 10,289 | | | $ | 40,998 | |
| | | | | | | | | | | | | | | | | | | | | | |
Gross profit | | | | 5,662 | | | | 10,446 | | | | 7,403 | | | | | 7,952 | | | $ | 31,463 | |
| | | | | | | | | | | | | | | | | | | | | | |
Net income (loss) | | | | (2,174 | ) | | | 2,388 | | | | (332 | ) | | | | 326 | | | $ | 208 | |
| | | | | | | | | | | | | | | | | | | | | | |
Net income (loss) per share: | | | | | | | | | | | | | | | | | | | | | | |
Basic | | | $ | (0.13 | ) | | $ | 0.14 | | | $ | (0.02 | ) | | | $ | 0.02 | | | $ | 0.01 | |
| | | | | | | | | | | | | | | | | | | | | | |
Diluted | | | $ | (0.13 | ) | | $ | 0.13 | | | $ | (0.02 | ) | | | $ | 0.02 | | | $ | 0.01 | |
| | | | | | | | | | | | | | | | | | | | | | |
Page 63
Notes to Financial Statements
17. Subsequent Event: Acquisition
On January 7, 2008 we entered into an Asset Purchase Agreement (the “Purchase Agreement”) with JTT Holdings Inc. dba Soliloquy Learning, (“JTT”), pursuant to which we agreed to acquire from JTT the Soliloquy Reading Assistant™ product line and substantially all of the other assets of the Soliloquy Learning business, based in Waltham, Massachusetts, for cash consideration.
Under the terms of the Purchase Agreement, we paid at closing $9.7 million and retained $1.0 million in satisfaction of outstanding indebtedness owed to us by JTT. Of the aggregate cash amount, $1,070,000 was withheld at the closing and placed into a third party escrow to secure JTT’s indemnification obligations to us under the Purchase Agreement. We assumed certain specified liabilities associated with the Soliloquy business pursuant to the Purchase Agreement.
At December 3, 2007, we had incurred $319,000 in costs related to this acquisition. These costs are classified as deferred acquisition costs on our balance sheet, and will be included as part of the purchase price allocation.
| |
ITEM 9. CHANGES IN AND DISAGREEMENTS WITH ACCOUNTANTS ON ACCOUNTING AND FINANCIAL DISCLOSURE |
| |
None. | |
| |
ITEM 9A(T). | CONTROLS AND PROCEDURES |
Evaluation of Disclosure Controls and Procedures
Disclosure controls and procedures are designed to ensure that information required to be disclosed in our reports filed under the Exchange Act, such as this Annual Report on Form 10-K, is recorded, processed, summarized and reported within the required time periods. These procedures are also designed to ensure that such information is accumulated and communicated to our management, including our Chief Executive Officer and Chief Financial Officer, as appropriate to allow timely decisions regarding required disclosure.
As required under Rule 13a-15(b) of the Exchange Act, our management, including the Chief Executive Officer and Chief Financial Officer, conducted an evaluation of the effectiveness of the Company’s disclosure controls and procedures as of the end of the period covered by this Annual Report on Form 10-K, and concluded that our disclosure controls and procedures were effective as of December 31, 2007.
It should be noted that a control system, no matter how well designed and operated, can provide only reasonable, not absolute, assurance that the objectives of the control system are met. As a result, there can be no assurance that a control system will succeed in preventing all possible instances of error and fraud. Our disclosure controls and procedures are designed to provide reasonable assurance of achieving their objectives, and the conclusions of our Chief Executive Officer and the Chief Financial Officer are made at the “reasonable assurance” level.
Changes in Internal Controls over Financial Reporting
There were no changes in our internal control over financial reporting that occurred during the year ended December 31, 2007 that have materially affected, or are reasonably likely to materially affect, our internal control over financial reporting.
Management’s Report on Internal Control over Financial Reporting
Our management is responsible for establishing and maintaining adequate internal control over financial reporting, as such term is defined in Rules 13a-15(f) and 15d-15(f) of the Exchange Act. Our internal control system was designed to provide reasonable assurance regarding the reliability of financial reporting and the preparation of financial statements for external purposes, in accordance with generally accepted accounting principles. Because of inherent limitations, a system of internal control over financial reporting may not prevent or detect misstatements. Also, projections of any evaluation of effectiveness to future periods are subject to the risk that controls may become inadequate due to change in conditions, or that the degree of compliance with the policies or procedures may deteriorate.
Page 64
Our management, including our Chief Executive Officer and Chief Financial Officer, conducted an evaluation of the effectiveness of our internal control over financial reporting using the criteria set forth by the Committee of Sponsoring Organizations of the Treadway Commission (COSO) in Internal Control—Integrated Framework. Based on its evaluation, our management concluded that our internal control over financial reporting was effective as of the end of the period covered by this report.
This annual report does not include an audit report of the Company’s registered public accounting firm regarding internal control over financial reporting. Management’s report was not subject to audit by the Company’s registered public accounting firm pursuant to temporary rules of the Securities and Exchange Commission that permit the Company to provide only management’s report in this annual report.
| |
ITEM 9B. | OTHER INFORMATION |
None.
Page 65
PART III
| |
ITEM 10. | DIRECTORS AND EXECUTIVE OFFICERS OF THE REGISTRANT |
The information required by this item with respect to our executive officers is contained in Part I “Executive Officers” and such information is also incorporated by reference in this section.
Information required by this item respecting our directors, audit committee and code of ethics is set forth under the caption “Proposal 1: Election of Directors” in our Proxy Statement relating to our 2008 Annual Meeting of Stockholders (the “Proxy Statement”) and is incorporated by reference into this Form 10-K Report. The Proxy Statement will be filed with the Securities and Exchange Commission in accordance with Rule 14a-6(c) promulgated under the Securities Exchange Act of 1934, as amended (the “Exchange Act”). With the exception of the foregoing information and other information specifically incorporated by reference into this Form 10-K Report, the Proxy Statement is not being filed as a part hereof.
Information with respect to compliance with Section 16(a) of the Exchange Act is set forth under the caption “Section 16(a) Beneficial Ownership Reporting Compliance” in the Proxy Statement and is incorporated by reference into this Form 10-K Report.
| |
ITEM 11. | EXECUTIVE COMPENSATION |
Information required by this item concerning compensation of executive officers and directors is set forth under the caption “Executive Compensation” in the Proxy Statement and is incorporated by reference into this Form 10-K Report.
| |
ITEM 12. SECURITY OWNERSHIP OF CERTAIN BENEFICIAL OWNERS AND MANAGEMENT AND RELATED STOCKHOLDER MATTERS |
Information required by this item concerning security ownership of certain beneficial owners and management is set forth under the caption “Security Ownership of Certain Beneficial Owners and Management” in the Proxy Statement and is incorporated by reference into this Form 10-K Report.
Information required by this item concerning shares authorized for issuance under equity compensation plans approved by stockholders and not approved by stockholders is set forth under the caption “Equity Compensation Plan Information” in the Proxy Statement and is incorporated by reference into this Form 10-K Report.
| |
ITEM 13. | CERTAIN RELATIONSHIPS AND RELATED TRANSACTIONS |
Information required by this item concerning certain relationships and related transactions is set forth under the captions “Employment Agreement” and “Certain Transactions” in the Proxy Statement and is incorporated by reference into this Form 10-K Report.
| |
ITEM 14. | PRINCIPAL ACCOUNTANT FEES AND SERVICES |
Information required by this item concerning the independent auditor’s fees and services is set forth under the caption “Ratification of Selection of Independent Registered Public Accounting Firm” in the Proxy Statement and is incorporated by reference into this Form 10-K Report.
Page 66
PART IV
| |
ITEM 15. | EXHIBITS, FINANCIAL STATEMENT SCHEDULES |
(a) Documents filed as part of this report:
| |
| (1) Financial Statements |
| |
| Report of Ernst & Young LLP, Independent Registered Public Accounting Firm |
| Balance Sheet – December 31, 2007 and 2006 |
| Statements of Income – Years Ended December 31, 2007, 2006 and 2005 |
| Statements of Stockholders’ Equity (Deficit) – Years Ended December 31, 2007, 2006 and 2005 |
| Statements of Cash Flows – Years Ended December 31, 2007, 2006 and 2005 |
| Notes to Financial Statements |
| |
| (2) Financial Statement Schedules |
| |
| As required under Item 8, Financial Statements and Supplementary Data, the financial statement schedule of the Company is provided in this separate section. The financial statement schedule included in this section is as follows: |
| |
| Schedule II – Valuation and Qualifying Accounts (in thousands): |
| | | | | | | | | | | | | | | | | | | | |
Allowance for Doubtful Accounts Years Ended December 31, | |
|
|
| |
| | Opening
Balance | | Charges
(credits) to
Operating
Expenses | | Additions
(deductions)
to Allowance | | Closing
Balance | |
2007 | | | $ | 99 | | | | $ | (3 | ) | | | | | | | $ | 96 | | |
2006 | | | $ | 81 | | | | $ | 18 | | | | | | | | $ | 99 | | |
2005 | | | $ | 121 | | | | $ | (40 | ) | | | $ | — | | | $ | 81 | | |
(b) Exhibits
A list of exhibits filed herewith is contained in the exhibit index that immediately precedes such exhibits and is incorporated herein by reference.
Page 67
EXHIBITS
| | | |
Exhibit
Number | | Description |
| |
|
| 3.1(14) | | Amended and Restated Certificate of Incorporation |
| | | |
| 3.2(15) | | Amended and Restated Bylaws |
| | | |
| 3.3(15) | | Certificate of Amendment to the Amended and Restated Certificate of Incorporation |
| | | |
| 4.1 | | Reference is made to Exhibits 3.1 and 3.2 |
| | | |
| 4.2(1) | | Specimen Stock Certificate |
| | | |
| 10.1(1)* | | Form of Indemnity Agreement with each of our directors and executive officers |
| | | |
| 10.2(10)* | | 1999 Equity Incentive Plan, as amended |
| | | |
| 10.3(10)* | | Forms of Restricted Stock Unit Grant Notice and Restricted Stock Unit Agreement under the Incentive Plan |
| | | |
| 10.4(3)* | | Forms of Stock Option Grant Notice, Stock Option Agreement and Stock Award Agreement under the Incentive Plan |
| | | |
| 10.5(9)* | | 1999 Non-Employee Directors’ Stock Option Plan, as amended |
| | | |
| 10.6(3)* | | Forms of Nonstatutory Stock Option Agreements under the Non-Employee Directors’ Stock Option Plan |
| | | |
| 10.7(3)* | | 1999 Employee Stock Purchase Plan, as amended |
| | | |
| 10.8(10)* | | Form of 1999 Employee Stock Purchase Plan Offering under the Employee Stock Purchase Plan |
| | | |
| 10.9(7)* | | Milestone Equity Incentive Plan |
| | | |
| 10.10(2)* | | 2002 CEO Option Plan |
| | | |
| 10.11(2)* | | Employment Agreement dated as of May 31, 2002 by and between Scientific Learning Corporation and Robert C. Bowen |
| | | |
| 10.12(7)* | | Letter Agreement dated January 2004 by and between the Registrant and Robert C. Bowen amending the Employment Agreement |
| | | |
| 10.13 (22) | | Amendment to Employment Agreement with Robert C. Bowen |
| | | |
| 10.14 (22) | | Offer of Employment Letter Agreement with D. Andrew Myers |
| | | |
| 10.15(8)* | | Independent Contractor Agreement dated April l7, 2003 between the Registrant and Paula A. Tallal and Project Assignment thereunder dated December 17, 2004 |
| | | |
| 10.16 (23)* | | Independent Contractor Agreement dated July 25, 2007 between the Registrant and Michael Merzenich |
| | | |
| 10.17 (23)* | | Independent Contractor Agreement dated July 25, 2007 between the Registrant and Michael A. Moses |
| | | |
| 10.18(11)* | | 2006 Management Incentive Plan |
| | | |
| 10.19 (13)* | | 2007 Management Incentive Plan |
| | | |
| 10.20(6) | | Loan and Security Agreement dated as of January 15, 2004 by and between the Registrant and Comerica Bank |
| | | |
| 10.21(9) | | First Amendment to Loan and Security Agreement, dated as of September 29, 2004, by and between Comerica Bank and the Registrant, amending the Loan and Security Agreement |
| | | |
| 10.22(10) | | Second Amendment to Loan and Security Agreement, dated as of December 2, 2005, by and between Comerica Bank and the Registrant, amending the Loan and Security Agreement |
| | | |
| 10.23(12) | | Third Amendment to Loan and Security Agreement, dated as of September 5, 2006, by and between Comerica Bank and the Registrant, amending the Loan and Security Agreement |
| | | |
| 10.24(15) | | Fourth Amendment to Loan and Security Agreement, dated as of June 5, 2007, by and between Comerica Bank and the Registrant, amending the Loan and Security Agreement |
| | | |
| 10.25(1)† | | Exclusive License Agreement, dated September 27, 1996, with the Regents of the University of California |
| | | |
| 10.26(5) | | Amendment No. 3 to Exclusive License Agreement, dated September 27, 1996, with the Regents of the University of California, amending the agreement |
| | | |
| 10.27(12) | | Amendment No. 4 to Exclusive License Agreement, dated September 27, 1996, with the Regents of the University of California, amending the agreement |
| | | |
| 10.28(5) | | Lease, dated as of October 1, 2003, with Rotunda Partners II |
| | | |
| 10.29(4) | | Technology Transfer Agreement dated as of September 30, 2003 by and between the Registrant and Neuroscience Solutions Corporation (now renamed Posit Science Corporation) or “NSC” |
| | | |
| 10.30(4) | | SLC License Agreement dated as of September 30, 2003 by and between the Registrant and NSC |
| | | |
| 10.31(4) | | NSC License Agreement dated as of September 30, 2003 by and between NSC and the Registrant |
| | | |
| 10.32 | | Major Reseller Agreement dated as of October 15, 2007, between Posit Science Corporation and Registrant |
Page 68
| | |
|
| 1) | Incorporated by reference to the exhibits previously filed with the Registrant’s Registration Statement on Form S-1 (File No. 333-56545). |
| | |
| 2) | Incorporated by reference to the exhibits previously filed with the Registrant’s Form 8-K on June 7, 2002 (File No. 000-24547). |
| | |
| 3) | Incorporated by reference to the exhibits previously filed with the Registrant’s Form 10-Q for the quarter ended June 30, 2003 (File No. 000-24547). |
| | |
| 4) | Incorporated by reference to the exhibits previously filed with the Registrant’s Form 8-K on October 1, 2003 (File No. 000-24547). |
| | |
| 5) | Incorporated by reference to the exhibits filed with the Registrant’s Form 10-Q for the quarter ended September 30, 2003 (File No. 000-24547). |
| | |
| 6) | Incorporated by reference to exhibits previously filed with the Registrant’s Form 8-K on February 5, 2004 (File No. 000-24547). |
| | |
| 7) | Incorporated by reference to the exhibits previously filed with the Registrant’s Form 10-Q for the quarter ended March 31, 2004 (File No. 000-24547). |
| | |
| 8) | Incorporated by reference to exhibits previously filed with the Registrant’s Form 8-K filed on December 20, 2004 (File No. 000-24547). |
| | |
| 9) | Incorporated by reference to exhibits previously filed with the Registrant’s Form 10-K for the year ended December 31, 2004 (File No. 000-24547). |
| | |
| 10) | Incorporated by reference to exhibits previously filed with the Registrant’s Form 10-K for the year ended December 31, 2005 (File No. 000-24547). |
| | |
| 11) | Incorporated by reference to the exhibits previously filed with the Registrant’s Form 10-Q for the quarter ended March 31, 2005 (File No. 000-24547). |
| | |
| 12) | Incorporated by reference to exhibits previously filed with the Registrant’s Form 10-K for the year ended December 31, 2006 (File No. 000-24547). |
| | |
| 13) | Incorporated by reference to exhibits previously filed with the Registrant’s Form 8-K filed on March 13, 2007 (File No. 000-24547). |
| | |
| 14) | Incorporated by reference to exhibits previously filed with the Registrant’s Form 10-Q for the quarter ended March 31, 2007 (File No. 000-24547). |
| | |
| 21) | Incorporated by reference to the exhibits previously filed with Amendment No. 1 to the Registrant’s Registration Statement on Form S-1 (File No. 333-143093). |
| | |
| 22) | Incorporated by reference to exhibits previously filed with the Registrant’s Form 8-K filed on December 7, 2007 (File No. 000-24547). |
Page 69
| | |
| 23) | Incorporated by reference to exhibits previously filed with the Registrant’s Form 8-K filed on July 26, 2007 (File No. 000-24547). |
| | |
| 24) | Incorporated by reference to exhibits previously filed with the Registrant’s Form 8-K filed on December 21, 2007 (File No. 000-24547). |
| | |
| † | Certain portions of this exhibit have been omitted based upon confidential treatment granted by the Securities and Exchange Commission for portions of the referenced exhibit. |
| | |
| * | Management contract or compensatory plan or arrangement. |
Page 70
SIGNATURES
Pursuant to the requirements of Section 13 or 15(d) of the Securities Exchange Act of 1934, the registrant has duly caused this report to be signed on its behalf by the undersigned, thereunto duly authorized.
SCIENTIFIC LEARNING CORPORATION
| | |
By /s/ Robert C. Bowen | | March 7, 2008 |
| | |
Robert C. Bowen | | |
Chief Executive Officer | | |
Pursuant to the requirements of the Securities Exchange Act of 1934, this report has been signed below by the following persons on behalf of the registrant and in the capacities and on the dates indicated.
| | | | |
SIGNATURES | | TITLE | | DATE |
|
|
|
|
|
| | | | |
/s/ Robert C. Bowen | | | | |
| | | | |
Robert C. Bowen | | Chairman, Chief Executive Officer and Director (Principal Executive Officer) | | March 7, 2008 |
| | | | |
/s/ Jane A. Freeman | | | | |
| | | | |
Jane A. Freeman | | Executive Vice President, Chief Financial Officer, and Treasurer (Principal Financial and Accounting Officer) | | March 7, 2008 |
| | | | |
/s/ Dr. Michael M. Merzenich | | | | |
| | | | |
Dr. Michael M. Merzenich | | Director | | March 7, 2008 |
| | | | |
| | | | |
/s/ Dr. Paula A. Tallal | | | | |
| | | | |
Dr. Paula A. Tallal | | Director | | March 7, 2008 |
| | | | |
| | | | |
/s/ Carleton A. Holstrom | | | | |
| | | | |
Carleton A. Holstrom | | Director | | March 7, 2008 |
| | | | |
| | | | |
/s/ Rodman W. Moorhead, III | | | | |
| | | | |
Rodman W. Moorhead, III | | Director | | March 7, 2008 |
| | | | |
| | | | |
/s/ Ajit M. Dalvi | | | | |
| | | | |
Ajit Dalvi | | Director | | March 7, 2008 |
| | | | |
| | | | |
/s/ Dr. Joseph B. Martin | | | | |
| | | | |
Dr. Joseph Martin | | Director | | March 7, 2008 |
| | | | |
| | | | |
/s/ Edward Vermont Blanchard, Jr. | | | | |
| | | | |
Edward Vermont Blanchard, Jr. | | Director | | March 7, 2008 |
| | | | |
| | | | |
/s/ David W. Smith | | | | |
| | | | |
David W. Smith | | Director | | March 7, 2008 |
| | | | |
| | | | |
/s/ Michael A. Moses | | | | |
| | | | |
Michael Moses | | Director | | March 7, 2008 |
| | | | |
/s/ Lance R. Odden | | | | |
| | | | |
Lance Odden | | Director | | March 7, 2008 |