UNITED STATES
SECURITIES AND EXCHANGE COMMISSION
Washington, D.C. 20549
FORM 10-K
þ ANNUAL REPORT PURSUANT TO SECTION 13 OR 15(d) OF THE SECURITIES EXCHANGE ACT OF 1934
For the fiscal year ended December 31, 2024
or
o TRANSITION REPORT PURSUANT TO SECTION 13 OR 15(d) OF THE SECURITIES EXCHANGE ACT OF 1934
For the transition period from to
Commission file number: 001-13425
RB Global, Inc.
(Exact Name of Registrant as Specified in its Charter)
| | | | | | | | |
| Canada | | 98-0626225 |
| (State or other jurisdiction of incorporation or organization) | | (I.R.S. Employer Identification No.) |
| | |
| Two Westbrook Corporate Center, Suite 500, | | |
| Westchester, Illinois, USA 60154 | | (708) 492-7000 |
| (Address of Principal Executive Offices and Zip Code) | | (Registrant’s Telephone Number, including Area Code) |
Securities registered pursuant to Section 12(b) of the Act:
| | | | | | | | | | | | | | |
| Title of Each Class | | Trading Symbol | | Name of Exchange on Which Registered |
| Common Shares | | RBA | | New York Stock Exchange |
| Common Share Purchase Rights | | N/A | | New York Stock Exchange |
Securities registered pursuant to Section 12(g) of the Act: Restricted Share Units
Indicate by check mark if the registrant is a well-known seasoned issuer, as defined in Rule 405 of the Securities Act. Yes þ No o
Indicate by check mark if the registrant is not required to file reports pursuant to Section 13 or Section 15(d) of the Act. Yes o No þ
Indicate by check mark whether the registrant (1) has filed all reports required to be filed by Section 13 or 15(d) of the Securities Exchange Act of 1934 during the preceding 12 months (or for such shorter period that the registrant was required to file such reports), and (2) has been subject to such filing requirements for the past 90 days. Yes þ No o
Indicate by check mark whether the registrant has submitted electronically every Interactive Data File required to be submitted pursuant to Rule 405 of Regulation S-T (§ 232.405 of this chapter) during the preceding 12 months (or for such shorter period that the registrant was required to submit such files). Yes þ No o
Indicate by check mark whether the registrant is a large accelerated filer, an accelerated filer, a non-accelerated filer, smaller reporting company, or an emerging growth company. See the definitions of “large accelerated filer”, “accelerated filer”, “smaller reporting company”, and “emerging growth company” in Rule 12b-2 of the Exchange Act.:
| | | | | | | | | | | |
Large accelerated filer þ | Accelerated filer o | Non-accelerated filer o | Smaller reporting company o |
| | | | Emerging growth company o |
If an emerging growth company, indicate by check mark if the registrant has elected not to use the extended transition period for complying with any new or revised financial accounting standards provided pursuant to Section 13(a) of the Exchange Act. o
Indicate by check mark whether the registrant has filed a report on and attestation to its management's assessment of the effectiveness of its internal control over financial reporting under Section 404(b) of the Sarbanes-Oxley Act (15 U.S.C. 7262(b)) by the registered public accounting firm that prepared or issued its audit report. þ
If securities are registered pursuant to Section 12(b) of the Act, indicate by check mark whether the financial statements of the registrant included in the filing reflect the correction of an error to previously issued financial statements. o
Indicate by check mark whether any of those error corrections are restatements that required a recovery analysis of incentive-based compensation received by any of the registrant’s executive officers during the relevant recovery period pursuant to § 240.10D-1(b). o
Indicate by check mark whether the registrant is a shell company (as defined in Rule 12b-2 of the Exchange Act). Yes o No þ
At June 30, 2024 (the last business day of the registrant’s most recently completed second fiscal quarter), the aggregate market value of the registrant’s common shares held by non-affiliates of the registrant (assuming for these purposes, but without conceding, that all executive officers and directors are "affiliates" of the registrant) was approximately $14,038,147,940. The number of common shares of the registrant outstanding as of January 31, 2025, was 184,748,861.
Documents Incorporated by Reference
Certain portions of the registrant’s definitive proxy statement to be filed with the Securities and Exchange Commission (“SEC”) pursuant to Regulation 14A not later than 120 days after the registrant’s fiscal year ended December 31, 2024, in connection with the registrant’s 2025 Annual and Special Meeting of Shareholders, are incorporated herein by reference into Part III of this Annual Report on Form 10-K.
RB GLOBAL, INC.
FORM 10-K
For the year ended December 31, 2024
INDEX
Cautionary Note Regarding Forward-Looking Statements
The information discussed in this Annual Report on Form 10-K of RB Global, Inc. (referred to herein as “RB Global”, the “Company”, “we”, or “us”) includes “forward-looking statements” within the meaning of Section 27A of the Securities Act of 1933 (the “Securities Act”) and Section 21E of the Securities Exchange Act of 1934 (the “Exchange Act”) and Canadian securities laws. Forward-looking statements are typically identified by such words as “aim”, “anticipate”, “believe”, “could”, “continue”, “estimate”, “expect”, “intend”, “may”, “ongoing”, “plan”, “potential”, “predict”, “will”, “should”, “would”, “could”, “likely”, “generally”, “future”, “long-term”, or the negative of these terms, and similar expressions intended to identify forward-looking statements. Forward-looking statements are based on current expectations and assumptions that are subject to risks and uncertainties that may cause actual results to differ materially. These statements are based on our current expectations and estimates about our business and markets, and may include, among others, statements relating to:
•our future strategy, objectives, targets, projections and performance;
•our ability to drive shareholder value;
•potential growth and market opportunities;
•the level of participation in our auctions and the success of our online marketplaces;
•our ability to grow our businesses, acquire new customers, enhance our sector reach, drive geographic depth, and scale our operations;
•the impact of our initiatives, services, investments, and acquisitions on us and our customers;
•the acquisition or disposition of properties;
•potential future mergers and acquisitions;
•our ability to integrate acquisitions;
•our future capital expenditures and returns on those expenditures;
•our ability to add new business and information solutions, including, among others, our ability to maximize and integrate technology to enhance our existing services and support additional value-added service offerings;
•the supply trend of equipment and vehicles in the market and the anticipated price environment, as well as the resulting effect on our business and Gross Transaction Value (“GTV”);
•our compliance with laws, rules, regulations, and requirements that affect our business;
•effects of various economic, financial, industry, and market conditions or policies, including inflation, the supply and demand for property, equipment, or natural resources;
•the behavior of commercial assets and vehicle pricing;
•the relative percentage of GTV represented by straight commission or underwritten (guarantee and inventory) contracts, and its impact on revenues and profitability;
•our future capital expenditures and returns on those expenditures;
•the effect of any currency exchange and interest rate fluctuations on our results of operations;
•the effect of any tariffs on our results of operations;
•the grant and satisfaction of equity awards pursuant to our compensation plans;
•any future declaration and payment of dividends, including the tax treatment of any such dividends;
•financing available to us from our credit facilities or other sources, our ability to refinance borrowings, and the sufficiency of our working capital to meet our financial needs; and
•our ability to satisfy our present operating requirements and fund future growth through existing working capital, credit facilities and debt.
While we have not described all potential risks related to our business and owning our common shares, the factors discussed in “Part I, Item 1A: Risk Factors” of this Annual Report on Form 10-K for the year ended December 31, 2024 are among those that may affect our performance materially or could cause our actual results, performance or achievements to differ materially from those expressed or implied by forward-looking statements. Except as required by applicable securities law and regulations of relevant securities exchanges, we do not intend to update publicly any forward-looking statements, even if our expectations have been affected by new information, future events or other developments. You should consider our forward-looking statements in light of the factors listed or referenced under “Risk Factors” herein.
SUMMARY OF RISK FACTORS
The following is a summary of the principal risks described below in “Part I, Item 1A: Risk Factors” in this Annual Report on Form 10-K. We believe that the risks described in the “Risk Factors” section are material to investors, but other factors not presently known to us or that we currently believe are immaterial may also adversely affect us. The following summary should not be considered an exhaustive summary of the material risks facing us, and it should be read in conjunction with the “Risk Factors” section and the other information contained in this Annual Report on Form 10-K:
Risks Related to Our Business
•Our business and operating results would be adversely affected due to the loss of one or more significant suppliers, a reduction in significant volume from suppliers, an adverse change in our supplier relationships, or a disruption to our supply of damaged, total loss and low-value vehicles.
•Our business and operating results would be adversely affected if we are unable to meet or exceed our buyer customers’ demand and expectations or due to a disruption in demand of damaged, total loss and low-value vehicles.
•Our market position and competitive advantage could be threatened by our competitors and/or disruptive new entrants.
•If our facilities lack the capacity to accept additional vehicles, then our relationships with insurance companies or other vehicle suppliers could be adversely affected.
•We may be unable to keep existing facilities or open new facilities in desirable locations and on favorable terms, which could materially and adversely affect our results of operations.
•Macroeconomic factors, including high fuel prices, high labor costs, inflation and changes in used car prices, may have an adverse effect on our revenues and operating results.
•Reliance on our subhaulers and trucking fleet operations could materially and adversely affect our business and reputation.
•Weather-related and other events beyond our control may adversely impact operations.
•An increase in the number of damaged and total loss vehicles we purchase could adversely affect our profitability.
•A significant change in used-vehicle prices could impact the proceeds and revenue from the sale of damaged and total loss vehicles.
•IAA assumes the settlement risk for vehicles sold through its marketplaces.
•Changes in laws affecting the import and export of damaged and total loss vehicles may have an adverse effect on our business and financial condition.
•We are subject to potential liabilities with respect to IAA’s prior separation from KAR Auction Services, Inc.
•We may not realize the anticipated benefits of, and synergies from, acquisitions and may become responsible for certain liabilities and integration costs as a result.
•Damage to our reputation could harm our business.
•We may incur losses as a result of our guarantee and inventory contracts and advances to consignors.
•The availability and performance of our information technology ("IT") systems and infrastructure is critical to our business and continued growth.
•Consumer behavior is rapidly changing, and if we are unable to successfully adapt to consumer preferences and develop and maintain a relevant and reliable inventory management and multichannel disposition experience for our customers, our financial performance and brand image could be adversely affected.
•We rely on data provided by third parties, the loss of which could limit the functionality of certain of our platforms and disrupt our business.
•Government regulation of the digital landscape is evolving, and unfavorable regulations could substantially harm our business and results of operations.
•If our ability, or the ability of our third party service partners, cloud computing providers or third party data center hosting facilities, to safeguard the reliability, integrity and confidentiality of our and their IT systems is compromised, if unauthorized access is obtained to our systems or customers’, suppliers', counterparties' and employees' confidential information, or if authorized access is blocked or disabled, we may incur material reputational harm, legal exposure, or a negative financial impact.
•Our future expenses may increase significantly and our operations and ability to expand may be limited as a result of licenses, laws and regulations governing auction sites, environmental protection, international trade, tariffs and other matters.
•Losing the services of one or more key personnel or the failure to attract, train and retain personnel could materially affect our business.
•Failure to maintain safe sites could materially affect our business and reputation.
•Income and commodity tax amounts, including tax expense, may be materially different than expected, and there is a trend by global tax collection authorities towards the adoption of more aggressive laws, regulations, interpretations and audit practices.
•Our substantial international operations expose us to additional risks that could harm our business, including foreign exchange rate fluctuations that could harm our results of operations.
•Our business operations may be subject to a number of federal and local laws, rules and regulations governing international trade, including export control regulations.
•Failure to comply with anti-bribery, anti-corruption, and anti-money laundering laws, including the U.S. Foreign Corrupt Practices Act of 1977, as amended, or the FCPA, the Corruption of Foreign Public Officials Act, or the CFPOA, and similar laws associated with our activities outside of the U.S. could subject us to penalties and other adverse consequences.
•We are pursuing a long-term growth strategy that may include acquisitions and developing and enhancing an appropriate sales strategy, which requires upfront investment with no guarantee of long-term returns.
•We are regularly subject to general litigation and other claims, which could have an adverse effect on our business and results of operations.
•Privacy concerns and our compliance with current and evolving domestic or foreign laws and regulations regarding the processing of personal information and other data may increase our costs, impact our marketing efforts, or decrease adoption and use of our products and services, and our failure to comply with those laws and regulations may expose us to liability and reputational harm.
•Our business continuity plan may not operate effectively in the event of a significant interruption of our business.
•Our insurance may be insufficient to cover losses that may occur as a result of our operations.
•Certain global conditions may affect our ability to conduct successful events.
Financial Risks
•Ineffective internal control over financial reporting could result in errors in our financial statements, reduce investor confidence, and adversely impact our stock price.
•We have substantial indebtedness, and the degree to which we are leveraged may materially and adversely affect our business, financial condition and results of operations.
•Our debt instruments have restrictive covenants that could limit our financial flexibility.
Risks Related to Our Intellectual Property
•We may be unable to adequately protect or enforce our intellectual property rights, which could harm our reputation and adversely affect our growth prospects.
Risks Related to Our Industry
•Competition could result in reductions in our future revenues and profitability.
•Decreases in the supply of, demand for, or market values of used equipment, could harm our business.
Risks Related to Our Organization and Governance
•Our articles, by-laws, shareholder rights plan and applicable Canadian provincial and federal law contain provisions that may have the effect of delaying or preventing a change in control.
•U.S. civil liabilities may not be enforceable against us, our directors, or our officers.
•We are governed by the corporate laws of Ontario, Canada, which in some cases have a different effect on shareholders than the corporate laws of Delaware.
PART I
ITEM 1: BUSINESS
Company Overview
RB Global, Inc. and its subsidiaries (collectively referred to as “RB Global”, the “Company”, "our", "us", or “we”) (NYSE & TSX: RBA) is a leading global marketplace that provides value-added insights, services, transaction solutions for buyers and sellers of commercial assets and vehicles worldwide. Through our auction sites in 14 countries and digital platforms, we serve customers and partners in approximately 170 countries across a variety of asset classes, including automotive, commercial transportation, construction, government surplus, lifting and material handling, energy, mining and agriculture.
We primarily facilitate transactions for customers in the automotive and commercial, construction and transportation ("CC&T") sectors. Our customers are primarily automotive insurance companies, as well as end users, dealers, fleet owners, and original equipment manufacturers (“OEMs”) of commercial assets and vehicles. Gross transaction value in our CC&T sector includes equipment needed for earth moving, lift and material handling, as well as vocational and commercial trucks and trailers. Our automotive sector includes all consumer automotive vehicles. The other sector primarily includes assets and equipment in the agricultural, forestry and energy industries, government surplus assets, smaller consumer recreational transportation items and parts sold in our vehicle dismantling business. Each respective sector includes salvage and non-salvage transactions.
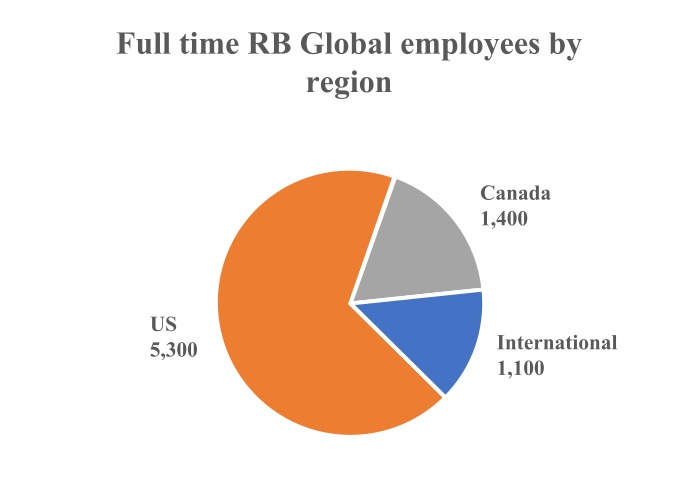
We have a global presence, with operations primarily in the United States, Canada, Australia and across Europe, and employ more than 7,800 full-time employees worldwide, of which approximately 67% are located in the United States.
Macroeconomic Conditions and Industry Trends
Various macroeconomic conditions and trends, such as inflationary pressures and interest rate volatility, impact our business, gross transaction value and operating costs. In addition, our gross transaction value is impacted by the combination of unit volume growth and changes in average selling prices.
Global supply chain disruptions and strong demand for CC&T assets significantly impacted our customers' transaction behavior in recent years. The COVID-19 pandemic initially led to a shortage of new equipment, driving up prices of used assets in our marketplace and extending asset holding periods. This pent-up demand subsequently fueled a surge in transactions in 2023 which normalized in the second half of 2024 creating a challenging comparison for the full year. Our customers and partners continue to experience lower equipment utilization rates, weaker end market demand, a higher interest rate environment, and higher costs to acquire new assets, resulting in delays in replacing or adding assets to their existing asset base. These trends are contributing to a lower need for our customers to transact equipment.
In our automotive sector, the total number of accidents and the number of accidents deemed a total loss influence unit volume growth in the industry. The total number of accidents is a function of the number of vehicles in service and the aggregated number of miles driven. Used automotive prices, the age, and the complexity of the design and technology content of vehicles, in combination with the cost of repair, are some of the factors that influence if a vehicle is deemed a total loss. The current inflation spread between automotive repair and used vehicles is providing a productive environment for a higher number of vehicles deemed a total loss as a percent of total accidents, which is driving industry salvage unit volume growth. Despite these positive trends, we have also seen used automotive prices remain fairly flat year over year, as pricing has normalized following the pandemic.
Competition
We encounter different competitors by region, sector, and service across the entire suite of solutions we offer to our partners and customers.
Competition in our CC&T sector for transaction solutions is highly fragmented geographically and by transaction format. We compete for sellers against online and physical auctioneers, brokers, OEMs and equipment dealers offering trade-in services. Some of our customers, including large fleet owners, may seek private sales instead of third-party transaction solutions. The market is constantly evolving and subject to change driven by new and existing competitors and technology-enabled selling solutions for sellers.
In the automotive sector, our sellers are comprised of primarily insurance companies seeking transaction solutions for their damaged or low-value vehicles. We primarily compete with Copart, Inc., as well as with Total Resource Auctions, Inc., a subsidiary of Cox Enterprises, and certain other independent used vehicle auction companies that regularly remarket damaged and total loss vehicles. We have contractual service level agreements and various supply agreements with our sellers, primarily automotive insurance customers.
Our performance against service level agreements and gross returns to drive optimal net returns is critical to our success as we compete.
Competitive Advantages
•Global platform - Our global platform allows us to connect buyers and sellers, offer insights and value-added services for commercial assets and vehicles through our omnichannel marketplace, both digitally and through our auction sites worldwide. We offer unmatched choice and flexibility, tailoring transaction solutions to suit our customers' diverse and changing needs. We also offer our customers a full spectrum of value-added services, such as transportation and logistics, appraisal, inspection, refurbishing, titling, loan payoff, and financial services.
•Trusted customer relationships - Our sales teams act as trusted advisors in their long-standing customer relationships. We take a long-term view, offering clear transparent communication and unparalleled solutions to simplify our customers' experience and cultivate lasting partnerships.
•Data, insights and services - Rich data and analytics are a cornerstone to providing the best customer experience. We invest in data science to deliver asset value predictions, generate user leads, prioritize marketing investments, interpret price trends, and more. Proprietary machine vision technology combined with proprietary algorithmic asset pricing are used internally to set target values and optimize marketplace operations and externally to provide our customers with real-time asset values. In addition, our Rouse Services ("Rouse") and brand is the leading provider of construction equipment rental metrics, benchmarks, and construction equipment valuations to lenders, rental companies, contractors, and dealers. Our business model is built upon an extensive data ecosystem, proprietary analytics, data science techniques, and trusted customer relationships rooted in service and confidentiality.
•Global presence - We achieve exceptional agility with our extensive global network of 311 locations, which enables us to be closer in proximity to our customers. This proximity helps minimize transportation costs and provides our customers with the choice of care, custody, and control of assets.
•Flexibility of yard space and teammates - Teammates working across different businesses and sectors can come together across multiple locations to meet our customers' needs when necessary. Specifically, in a catastrophic event impacting our automotive sector customers, we can increase the speed of our response and avoid incremental operating costs by leveraging all of our teammates and any unused capacity across our global network of locations.
•Global buyer base and demand engine - Our global presence and sophisticated approach to driving buyer demand allows us to generate deep pools of liquidity for transactions, enabling global market pricing for commercial assets and vehicle sellers and helping to deliver the best price realization. We serve customers in approximately 170 countries across a variety of sectors and continuously source and cultivate new buyers around the world.
•Brand - Our well-established brands are well recognized and have a loyal customer base. The Company's marketplace brands include Ritchie Bros., the world's largest auctioneer of commercial assets and vehicles, and IAA, a leading global digital marketplace connecting vehicle buyers and sellers. RB Global's portfolio of brands also includes Rouse, which provides complete end-to-end asset management, data-driven intelligence, and performance benchmarking system, SmartEquip, an innovative technology platform that supports customers' management of the equipment lifecycle and integrates parts procurement with both original equipment manufacturers and dealers and VeriTread, an online marketplace for heavy haul transport.
Growth Strategy
The foundation of our growth strategy is to put our partners and customers first and over-deliver on our commitments. By doing this consistently, along with operational excellence, we expect to solidify our position as their trusted global partner for insights, services, and transaction solutions.
We see significant opportunities to drive transactions and grow our market share by creating a seamless and trusted experience for our sellers and buyers. We have three key areas of strategic focus:
i.Achieve premium price performance for assets transacted across our omnichannel marketplaces while effectively accommodating our partners' liquidity preferences. The key is to manage supply and create deep liquidity pools by expanding our global buyer base through harnessing technology to merchandise assets at scale and provide a diverse and thoughtfully selected range of assets to meet each buyer's unique needs.
ii.Grow our enterprise partner base, which includes insurance companies in our automotive sector and large fleet owners in our CC&T sector. Our partners increasingly rely on our expertise to enhance their profitability by optimizing the lifecycle of the assets they transact through us. The more effectively we can communicate and demonstrate our value upstream from the transaction, the stronger our position will be to earn more transactions from partners and gain market share.
iii.Focus on driving growth with our regional CC&T customers, comprised of small and mid-size businesses that highly value the personalized engagement and relationship with our sales territory managers. By leveraging the expertise of our sales team as trusted advisors, we are confident in our ability to strengthen these existing relationships and build new ones. As we optimize and expand our sales coverage, we are well-positioned to capture additional market share and deliver sustained growth.
We aim to achieve our growth strategy by modernizing our technology capabilities, investing in the development of our teammates, and strategically acquiring businesses and technologies to expand our capabilities and market reach.
Service Offerings
We provide a global marketplace for our partners and customers to buy and sell a variety of asset classes by leveraging our proprietary transaction solutions, services and market insights. The table below outlines the various branded solutions we offer to help our partners and customers more efficiently manage their asset lifecycles and improve on their return on investments.
| | | | | | | | |
| Solution | Brand(s) | Description |
| Transaction Solutions | RB Auction | Onsite and online marketplace for selling and buying used equipment |
| IronPlanet | Online marketplace for selling and buying used equipment |
| Marketplace-E | Online make offer/buy now format |
| GovPlanet | Online marketplace for the sale of government and military assets |
| SalvageSale | Full-service project management and salvage inventory support |
| Ritchie Bros. Private Treaty | Confidential, negotiated sale of large equipment |
| IAA AuctionNow™ | Online auction bidding and buying solution, that features inventory located at physical branches and offsite locations. Available to a global buyer audience |
| IAA Buy Now™ | Online buy now format available between scheduled auctions, leveraging ML based pricing recommendations |
| IAA Custom Bid™ | Bidding tool that provides buyers focused on recycling the ability to set pre-bids in an auction based on vehicle attributes |
| IAA Timed Auctions™ | Timed auction format that allows for competitive bidding and sale prior to a scheduled auction |
| CSAToday® | Online portal that gives sellers the ability to manage their vehicle assets and monitor sales performance |
| Financial Services | Ritchie Bros. Financial Services | Loan origination service that uses a brokerage model to match loan applicants with appropriate financial lending institutions |
| Appraisal Services | Rouse Appraisals | Unbiased, certified appraisal services |
| Inspection Services | Ritchie Bros. Inspections | Truck and heavy equipment inspections |
| IAA Inspection Services® | Remote inspections and appraisals for salvage vehicles |
| Listings Services | Ritchie List, Mascus, Boom & Bucket | Online equipment listing service , B2B dealer portal, and an online fixed price marketplace platform |
| Refurbishing Services | Ritchie Bros. Refurbishing | Repair, paint, and other make-ready services |
| Transportation Services | Ritchie Bros. Logistics
| End-to-end transportation and customs clearance solution for sellers and buyers with shipping needs |
| VeriTread Transport | Online transportation marketplace, connecting shippers and carriers |
| IAA Transport™ | Integrated shipping solution allowing buyers to schedule shipment of vehicles during the checkout process |
| IAA Tow App™ | Mobile dispatch solution that assists the tow network |
| Data Services | Rouse™ | The leading provider of construction equipment market intelligence |
| IAA Vehicle Score™ | A cutting-edge computer vision tool that assesses vehicle damage severity. Our automated Vehicle Score model provides fast and accurate ratings based on photos taken at vehicle check-in, saving time and money |
| IAA Vehicle Value™ | A predictive model that uses machine learning and data mining methods to create an accurate, unbiased vehicle value |
| Parts Services | SmartEquip | Online marketplace connecting equipment owners with parts manufacturers |
| Catastrophe Response Services | Catastrophe (CAT) Services™ | Industry-leading strategic catastrophe response service focused on real estate capacity, operational execution, transportation logistics and vehicle merchandising and selling |
| Title Services | IAA Title Services® | Full suite of title services that facilitate the title documentation, settlement and retrieval process |
| IAA Loan Payoff™ | Service that mitigates the time-consuming process of managing a total loss claim requiring loan payoff and title release |
| DDI Technology | Electronic title and registration services for vehicles dealers and lenders |
Contract options
We offer consignors several contract options to meet their individual needs and sale objectives for selling assets, which include:
•Straight commission contracts, where the consignor receives the gross proceeds from the sale less a pre-negotiated commission rate;
•Fixed fee commission contracts, where the consignor receives the gross proceeds from the sale less a fixed flat fee; and
•Guarantee contracts, where the consignor receives a guaranteed minimum amount plus an additional amount if proceeds exceed a specified level.
We also offer our customers the option to enter into inventory contracts, where we purchase assets before they are resold in the auctions or marketplaces. We may also sell consigned assets or purchased inventory in private sales transactions.
Other value-added services
We also provide a wide array of value-added services to make the process of selling and buying equipment and vehicles convenient for our customers. In addition to the services listed in the table above, we also provide the following value-added services to our customers:
•Title search services, where registries are commercially available, to help ensure equipment sold through RB Global is free and clear of all liens and encumbrances (if we are not able to deliver clear title, we provide a full refund up to the purchase price to the buyer);
•Making equipment available for inspection, testing, and comparison by prospective buyers;
•Displaying high-quality, zoomable photographs of equipment on our website;
•Providing 360-degree video inspection technology to increase buyer confidence in equipment being purchased;
•Providing industry-leading professional equipment inspections and reports;
•Providing free detailed equipment information on our website for most equipment;
•Providing access to commercial transportation companies and customs brokerages through our logistical services, and
•Handling all pre-auction marketing, as well as collection and disbursement of proceeds.
Intellectual Property
We believe our intellectual property has significant value and is an important factor in marketing our organization, services, and website, as well as differentiating us from our competitors. We own or hold the rights to use valuable intellectual property such as trademarks, service marks, domain names and tradenames. We protect our intellectual property in Canada, the U.S., and internationally through federal, provincial, state, and common law rights, including registration of certain trademark and service marks for many of our brands, including our core brands. We also have secured patents for inventions and have registered our domain names.
We rely on contractual restrictions and rights to protect certain of our proprietary rights in products and services. Effective protection of our intellectual property can be expensive to maintain and may require litigation. We must protect our intellectual property rights and other proprietary rights in many jurisdictions throughout the world. In addition, we may, from time to time, be subject to intellectual property claims, including allegations of infringement, which can be costly to defend. For a discussion of the risks involved with intellectual property litigation and enforcement of our intellectual property rights, see the related information in “Part I, Item 1A: Risk Factors” of this Annual Report on Form 10-K.
Environmental, Social & Governance
In 2024, RB Global continued to advance its Environmental, Social and Governance ("ESG") framework, which was developed in 2022 and subsequently aligned with IAA's ESG program in 2023, and which includes the integration of ESG approaches, resources, and capabilities.
Our ESG framework remains instrumental in guiding our actions and driving our ESG progress. We use our framework to establish our goals and performance metrics. As with many areas of the business, we used the post-acquisition integration period to analyze and incorporate best practices of our brands' reporting to shape our combined ESG strategy. As part of our commitment to continuous improvement, we will continue to work closely with our ESG program stakeholders to ensure that our priorities remain aligned with our partners in the industry and the values that we share.
Below is an overview of RB Global's commitment to ESG. Please see our website for our latest sustainability reports and further details on our initiatives and accomplishments.
Environmental
The Company is regulated by federal, state, local jurisdictions, and international environmental laws governing the protection of the environment, health and safety, the use, transport and disposal of hazardous substances and control of emissions including greenhouse gases into the environment. Compliance with these existing laws has not had a material impact on our capital expenditures, earnings or global competitive position. However, climate change initiatives and changing laws and regulations governing the environment may affect the supply of, the demand for, and the market values of equipment in the future.
Our business enables a circular economy of vehicles and equipment. We engage our customers to optimize the use and efficiency of equipment, to re-use, refurbish and recycle before disposition, as extending the life of heavy equipment and vehicles is core to our business model. In turn, we believe this reduces waste and lessens the need to extract natural resources to produce equipment.
In 2024, we continued to take the opportunity to comprehensively evaluate our environmental impact, considering the impacts from the acquisition of IAA. In 2023, to support our reporting and take further meaningful action, we developed a baseline carbon inventory of Scopes 1, 2 and 3 inventory using recognized standards such as the Greenhouse Gas ("GHG") protocol. This enabled us to gain a more complete understanding of our global carbon footprint and identify areas where we can make improvements. With this valuable data, we are well-equipped to establish achievable reduction targets, track our progress, and effectively manage and mitigate our environmental impact.
We continue our commitment to environmental management by ensuring availability of treatment systems to manage wastewater, a recycling system to promote waste management and air filtration systems when necessary.
Social
Human Capital
We employ approximately 7,800 full-time employees and approximately 890 part-time employees worldwide at December 31, 2024. Approximately 5,200 of our full-time employees work at our auction and branch sites to support our operations and solution services and approximately 1,200 full-time employees are focused on sales and solutions for our customers. We also periodically hire contractors as needed to support our auctions, various businesses, and other projects.
Development and Engagement
We believe that our people are our greatest asset and that engaged employees are paramount to the health and success of our business. We invest in a variety of training, development and engagement practices to deliver on our growth agenda and create more leaders.
RB Global continues to invest in employee learning and development. All full-time employees are encouraged to have development plans that focus on career growth. We have curated tools and resources and developed training programs to provide our leaders and employees with the skills to grow successfully. We provide all of our employees access to virtual instructor-led courses, as well as access to a library of over 3,000 online courses and resources.
During 2024, we achieved the following objectives to strengthen the development and engagement of our people:
•We continue to hold quarterly performance conversations to drive performance and ongoing engagement, with a simplified year-end review process to allow for more meaningful conversations about accomplishments, values and opportunities.
•We offer a six-week Leadership Foundations Program to newly promoted and first-time managers, to instill the confidence needed to inspire, delegate, and communicate effectively in their new role.
•We launched a new self-service Mentorship Program to support and encourage employees to learn from connections and meaningful relationships with experienced leaders.
•We continue to support the sales team's expanded sales coverage initiative through our sales bootcamps. In addition, we launched the Master Your Craft training initiative, which provides focused, quick-hit lessons on key sales skills and best practices.
•We continue to strengthen our salvage sale operational training program by integrating analytics and personalized learning paths. Our strategic improvements aim to enhance workforce efficiency, reduce knowledge gaps, and drive growth.
•We strengthened our IAA title training program through a blended learning model with the aim to reduce attrition and enhance knowledge and efficiency within our workforce.
We continuously look for ways to create on-the-job learning opportunities so that our employees feel invested and engaged. Employees are involved in strategic initiatives and in finding ways to better serve our customers, and each other.
Health & Safety
Safety is a top priority at RB Global and core to who we are. Our objective is to keep our people healthy and safe – to send everyone home, every day, the way they came to work. Our global Environmental, Health, Safety and Security ("EHSS") team is focused on creating a unified approach to policies, procedures and best practices with the goal of keeping our teammates and customers safe. The EHSS team is responsible for introducing operational updates to support our commitment to maintaining the highest level of environmental, health and safety standards.
All new employees are required to complete a safety onboarding training that captures our health and safety programs, our policy statement and provides an overview of our global Employee Health and Safety (“EHSS”) policies and expectations. Our 2024 completion rate for the safety onboarding program was 97% (2023: 93%). We also have a risk management process to support our safety orientation programs and our health and safety commitment, which ensures that our employees are exposed to the lowest possible level of risk. Our risk management process begins with an annual review of all incidents from the prior year to identify trends and assess whether we need to address findings through changes in our policies and procedures.
In 2024, all auction sites completed monthly hazard assessments to identify risks and take the necessary corrective actions. In addition, we also require all of our global employees in operations to complete a mandatory annual safety training curriculum.
We measure our Total Recordable Injury Rate (“TRIR”), which is the number of reportable incidences per 100 full-time workers during the year. Our annual TRIR goal is to be lower than the industrial average. TRIR for 2024 was 1.78 (2023: 1.05), which was below the industrial average.
Community Giving
We are committed to support the communities where we live and work. In 2024, we responded to the devastating hurricanes across the United States through donations and sponsorship to local organizations to deliver critical resources such as food, clothing, housing and supplies.
Flexible Workplace
We continue to provide flexible work arrangements - on-site, remote and hybrid - to our people based on the needs of our customers and businesses and encourage opportunities to build engagement and foster connections on-site and within the hybrid world through numerous gatherings and social events across all offices.
Ethical Conduct
We are committed to a culture of excellence. We aim to build a community with strong values of responsibility and integrity, continue to invest in training and development, and to create an open environment where honest communications are the expectation – not the exception. Our Code of Conduct contains guidelines for conducting business with the highest standards of ethical behavior. We also offer the RB Global Ethics Hotline, which is operated by an independent third party and is always available from any location around the world, as a resource through, which anonymous concerns can be raised.
Governance
We believe in doing the right thing for everyone involved in our business and seek to do business with third parties who follow the same core values. This is reflected in our Code of Business Conduct and Ethics, which is delivered through annual training to our
employees and supported by our third-party Ethics Hotline. With the exception of our CEO, our Board of Directors consists of elected independent members.
Oversight of our ESG enterprise strategy is provided by the Nominating and Corporate Governance Committee, while our global ELT provides strategic direction and oversight of ESG across key business functions.
The Role of Technology
Building a modern architecture on which we can scale and grow profitably is a core element of our growth strategy. The role of technology in our business continues to evolve and becomes increasingly important, as our sellers and buyers adopt mobile and online channels to complete their transactions and fulfill their business needs. We continue to invest in technologies to transition to a modern cloud-based architecture, driven by microservices that allow for agility, flexibility and scalability of our solutions. In 2024, we also invested and acquired Boom & Bucket Inc, a digital fixed price marketplace which we can add to our portfolio of selling solutions.
We remain focused on technology enablement to transform the way we leverage technology to drive future profitable growth. We are in the deployment phase of providing our customers a modern unified payment system to process transaction solutions. We are also investing in the development of a new platform to unite our various auction platforms to provide greater stability and simplify our processes for buyers and sellers. Our new platform is designed to provide an updated modern design, improved search functions and navigation capabilities to make it easier for our customers to bid at our auctions and process their transactions. During 2024, we have begun to rollout our digital payments platform and digital checkout system at a select number of auction events and will continue to evaluate, invest and evolve our products and capabilities based on the ongoing needs of our customers and partners.
Our technology capabilities also deliver choices for our customers in the form of multiple channels for buyers and sellers, meeting customers’ asset management needs through information-rich software solutions and leveraging our rich data repository to drive strong sales and improved pricing decisions. We provide our customers with leading tools and capabilities to deliver full life-cycle asset management for used equipment and vehicles.
Revenue Mix
Our revenue is comprised of service revenue and inventory sales revenue. Total service revenue includes revenue by customer type, between revenue earned from buyers or sellers who transact in our live and online auctions, online marketplaces and private brokerages, as well as marketplace services revenue, revenue earned from optional services provided to our customers.
In the third quarter of 2024, we updated our presentation of disaggregated revenue to align to how management evaluates its financial and business performance. The prior year disaggregation of revenue amounts have been recast to conform with current period presentation. We previously disaggregated our revenue by commissions earned from our consignors, buyer fees earned from our buyers in each sale transaction, and presented all other fees earned in the rendering of our services, whether related to auctions, online marketplaces, private brokerage or other services, within marketplace services revenue. As part of our updated presentation, transactional seller revenue now includes commissions, pre-negotiated or fixed, as well as certain auction-related fees earned from sellers to complete the sale of an asset, such as towing to our yards, liens search, title processing and online listing and inspection fees. Transactional buyer revenue now includes buyer transaction fees based on a tiered structure earned from purchasers upon purchase of an asset, as well as other auction-related fees earned from buyers to complete the purchase of an asset, such as title processing, late-pick up, salvage buyer platform registration and other administrative processing charges. Accordingly, certain auction-related fees
were reclassified from marketplace services revenue to transactional seller or transactional buyer revenue. These changes were made in order to align with how management categorize revenues for internal management purposes.
Our service revenue is comprised of the following:
•Transactional seller revenue which includes commissions earned from consignors on the sale of consigned assets, as well as other fees earned from consignors to facilitate the sale of an asset such as towing to our yards, liens search, title processing and online listing and inspection fees.
•Transactional buyer revenue which includes transaction fees based on a tiered structure earned from the purchasers of consigned assets and inventory, as well as other fees earned from buyers to complete the purchase of an asset, such as title processing, late pick-up, vehicle buyer platform registration and other administrative processing charges.
•Marketplace services revenue which includes fees earned from various optional services provided to buyers, sellers, or other third-parties, such as transportation, buyer towing, refurbishment, financing, parts procurement, data and appraisal, and other ancillary services.
Inventory sales revenue relates to revenue earned through our inventory contracts and is recognized as the GTV of the assets sold, with the related cost recognized in cost of inventory sold.
Our revenue each period can fluctuate significantly based on the mix of sales arrangements, which is driven by customer preferences. Completed straight commission, fixed commission or guarantee commission contracts result in the commission being recognized as service revenue based on a percentage of gross transaction value or based on a fixed value, while completed inventory contracts result in the full GTV of the assets sold being recorded as inventory sales revenue. As a result, a change in the revenue mix between service revenue and revenue from inventory sales can have a significant impact on our revenue growth percentages.
Governmental Regulations and Environmental Laws
Our operations are subject to a variety of federal, provincial, state and local laws, rules, and regulations throughout the world. Compliance with these regulations and laws requires human level awareness, performance and expertise, and investments in our enterprise management systems to facilitate efficient workflow, data tracking and auditing capabilities to measure compliance. We believe that we are compliant in all material respects with those laws, rules, and regulations that affect our business, and that such compliance does not impose a material impediment on our ability to conduct our business.
We believe that, among other things, laws, rules, and regulations related to the following list of items affect our business:
•Imports and exports of commercial assets. Particularly, there are restrictions in the U.S. and Europe that may affect the ability of equipment owners to transport certain equipment between specified jurisdictions. Also, engine emission standards in some jurisdictions limit the operation of certain trucks and equipment in those regions.
•Development or expansion of auction sites. Such activities depend upon the receipt of required licenses, permits, and other governmental authorizations. We are also subject to various local zoning requirements pertaining to the location of our auction sites, which vary among jurisdictions.
•The use, storage, discharge, and disposal of environmentally sensitive materials. Under such laws, an owner or lessee of, or other person involved in, real estate may be liable for the costs of removal or remediation of certain hazardous or toxic substances located on or in, or emanating from, such property, as well as related costs of investigation and property damage. These laws often impose liability without regard to whether the owner or lessee or other person knew of, or was responsible for, the presence of such hazardous or toxic substances.
•Worker health and safety, privacy of customer information, and the use, storage, discharge, and disposal of environmentally sensitive materials.
•The acquisition and sale of totaled and recovered theft vehicles are regulated by state or other local motor vehicle departments in each of the locations in which we operate.
•Some of the transport vehicles used at our marketplaces are regulated by the U.S. Department of Transportation or similar regulatory agencies in the other countries in which we operate.
•In many states and provinces, regulations require that a damaged and total loss vehicle be forever “branded” with a salvage notice in order to notify prospective purchasers of the vehicle’s previous salvage status.
•Some state, provincial and local regulations limit who can purchase damaged and total loss vehicles, as well as determine whether a damaged and total loss vehicle can be sold as rebuildable or must be sold for parts or scrap only.
•We are subject to various local zoning requirements with regard to the location of our auction and storage facilities, which requirements vary from location to location.
•We are indirectly subject to the regulations of the Consumer Financial Protection Act of 2010 due to our vendor relationships with financial institutions.
•We deal with significant amounts of cash in our operations at certain locations and are subject to various reporting and anti-money laundering regulations.
Available Information
We file with the SEC reports on Form 10-K, Form 10-Q, Form 8-K, proxy materials and other filings required under the Exchange Act. Investors may access any materials we file with the SEC through the EDGAR database on the SEC’s website at www.sec.gov.
In addition, investors and others should note that we announce material financial information using our company website (https://rbglobal.com) and investor relations website (https://investor.rbglobal.com), which host our SEC filings, press releases, public conference calls, and webcasts. Information about RB Global, Inc., its business, and its results of operations may also be announced by posts on LinkedIn (https://www.linkedin.com/company/rb-global-inc).
The information that we post on our LinkedIn page could be deemed to be material information. As a result, we encourage investors, the media, and others interested in RB Global, Inc. to review the information that we post on our LinkedIn page.
We are providing these website addresses solely for the information of investors, and the information on or accessible through our websites and social media channel is not incorporated by reference in this Annual Report on Form 10-K.
Also available for investors in the Governance section of our investor relations website are the Code of Business Conduct and Ethics for our directors, officers and employees (“Code of Conduct”), Board Mandate, Audit Committee Charter, Nominating and Corporate Governance Committee Charter, Compensation Committee Charter, Corporate Governance Guidelines, Diversity Policy, Shareholder Engagement Policy, Articles and Bylaws, and Board Chair Role and Description. Additional information related to RB Global, Inc. is also available on SEDAR at www.sedar.com.
As a Business Corporations Act (Ontario) (“OBCA”) company with our principal place of business in Canada, U.S. civil liabilities may not be enforceable against us. Please see “Part I, Item 1A. Risk Factors — U.S. civil liabilities may not be enforceable against us, our directors, or our officers.
ITEM 1A: RISK FACTORS
An investment in our common stock involves a high degree of risk. In addition to the other information included in this Annual Report on Form 10-K, you should carefully consider each of the risks described below before purchasing our common shares. The risk factors set forth below are not the only risks that may affect our business. Our business could also be affected by additional risks not currently known to us or that we currently deem to be immaterial. If any of the following risks actually occur, our business, financial condition and results of operations could materially suffer. As a result, the trading price of our common shares could decline, and you may lose all or part of your investment. Information in this section may be considered “forward-looking statements.” See “Cautionary Note Regarding Forward-Looking Statements” for a discussion of certain qualifications regarding such statements.
Risk Related to Our Business
Our business and operating results would be adversely affected due to the loss of one or more significant suppliers, a reduction in significant volume from suppliers, an adverse change in our supplier relationships, or a disruption to our supply of damaged, total loss and low-value vehicles.
Our business depends on suppliers of damaged, total loss and low-value vehicles. Our vehicle suppliers include insurance companies, used-vehicle dealers, rental car and fleet lease companies, auto lenders and charitable organizations, among others. We have established long-term relationships with virtually all of the major automobile insurance companies. During fiscal 2024, approximately 22% of our consolidated revenues were associated with vehicles supplied by the Company's three largest supplier customers. Our agreements with insurance company suppliers are generally subject to cancellation by either party upon 30 to 90 days’ notice. There can be no assurance that our existing agreements will not be canceled or that we will be able to enter into future agreements on favorable terms with these suppliers. We work to develop strong relationships with our suppliers to better understand their needs. From time to time, however, we may experience the loss of suppliers or a reduction in volume from suppliers, including top vehicle suppliers. If we lose one or more of our significant suppliers, or if one or more of our large suppliers were to significantly reduce volume for any reason or favor competitors or new entrants, we may not be successful in replacing such business and our profitability and operating results could be materially adversely affected.
Generally, institutional and dealer suppliers make non-binding long-term commitments with us regarding consignment volumes. Changes in the consignment patterns of our key suppliers could have a material adverse effect on our business and operations. There
are many factors that can adversely affect volume from suppliers, many of which are beyond our control. These factors include, but are not limited to, the following:
•A decrease in the number of vehicles in operation or miles driven;
•Mild weather conditions that cause fewer traffic accidents;
•Reduction of policy writing by insurance providers that would affect the number of claims over a period of time;
•Increases in fuel prices that could lead to a reduction in the miles driven per vehicle, which may reduce the accident rate;
•Changes in vehicle technology, an increase in autonomous vehicles and vehicles equipped with advanced driver-assistance systems (ADAS);
•A decrease in the percentage of claims resulting in a total loss or elimination of automotive collision coverage by consumers;
•Delays or changes in state title processing;
•Government regulations on the standards for producing vehicles; and
•Changes in direct repair procedures that would reduce the number of newer, less damaged total loss vehicles, which tend to have higher salvage values.
Furthermore, in periods when the supply of vehicles from the insurance sector declines, salvage operators have acquired and, in the future, may acquire vehicles on their own. Also, when used vehicle prices are high, used-vehicle dealers may retail more of their trade-in vehicles on their own rather than selling them at auction. If the supply or value of damaged, total loss and low-value vehicles coming to auction declines significantly, our revenues and profitability may be adversely affected.
Our business and operating results would be adversely affected if we are unable to meet or exceed our buyer customers’ demand and expectations or due to a disruption in demand of damaged, total loss and low-value vehicles.
We believe our future success depends in part on our ability to respond to changes in buyer requirements, our ability to meet service level expectations of both buyers and sellers and our ability to meet regulatory requirements for such customers. IAA’s buyer customers include automotive body shops, rebuilders, used car dealers, automotive wholesalers, exporters, dismantlers, recyclers, brokers, and the general public, among others. We work to develop strong relationships and interactive dialogue with our customers to better understand current trends and customer needs. If we are not successful in meeting our customers’ expectations, our customer relationships could be negatively affected and result in a loss of future business, which would adversely affect our operating results and financial condition.
Our market position and competitive advantage could be threatened by our competitors and/or disruptive new entrants.
We face significant competition for the supply of damaged and total loss vehicles and the buyers of those vehicles. IAA’s principal sources of competition historically have come from (1) direct competitors, (2) new entrants, including new vehicle remarketing venues, and (3) existing alternative vehicle remarketing venues, including used-vehicle auctions and certain salvage buyer groups. Due to the increasing use of the Internet and other technology as marketing and distribution channels, we may face increasing competition from online wholesale and retail marketplaces (generally without any meaningful physical presence) and from our own customers, including insurance companies, when they sell directly to end users through such platforms rather than remarket vehicles through our marketplaces. Increased competition could result in price reductions, reduced margins or loss of market share.
Our future success also depends on our ability to respond to evolving industry trends, changes in customer requirements and new technologies. Some of IAA’s competitors may have greater financial and marketing resources than we do, may be able to respond more quickly to evolving industry dynamics and changes in customer requirements, or may be able to devote greater resources to the development, promotion and sale of new or emerging services and technologies. Our ability to successfully grow through investments in the area of emerging opportunities depends on many factors, including advancements in technology, regulatory changes and other factors that are difficult to predict, or that may significantly affect the future of electrification, autonomy, and mobility. If we are unable to compete successfully or to successfully adapt to industry changes, our business, revenues and profitability could be materially adversely affected.
If our facilities lack the capacity to accept additional vehicles, then our relationships with insurance companies or other vehicle suppliers could be adversely affected.
Capacity at our facilities varies from period to period and by region as a result of various factors, including natural disasters. We may not be able to reach agreements to purchase or lease storage facilities in markets where we have limited available capacity, and zoning restrictions or difficulties obtaining use permits may limit our ability to expand our capacity through acquisitions of new land. If we fail to have sufficient capacity at one or more of our facilities, our relationships with insurance companies or other vehicle suppliers could be adversely affected, which could adversely affect our operating results and financial condition.
We may be unable to keep existing facilities or open new facilities in desirable locations and on favorable terms, which could materially and adversely affect our results of operations.
Local land use and zoning regulations, environmental regulations and other regulatory requirements may impact our ability to find
suitable locations and influence the cost of our operations. Most of IAA’s salvage auction vehicle facilities are leased. The termination or expiration of leases at existing facilities may adversely affect us if the renewal terms of those leases are unacceptable to us and we are forced to close the facilities. If we determine to close a location, we may remain obligated under the applicable lease for the remaining lease term and may have to expense the unamortized portion of the right-of-use assets, in part or in full, as an impairment which may have a material impact on our consolidated results of operations and financial position. Also, if we are unable to maintain our existing facilities or open new facilities in desirable locations and on favorable terms, our results of operations could be materially and adversely affected. Further, in an increasing number of markets where we experience significant capacity constraints together with pressing customer demand and a lack of viable alternatives for expansion due to zoning and land use restrictions, we may be required to purchase, lease or occupy industrial sites, which may contain significant environmental impacts.
In addition, some of the facilities on which we operate are impacted by significant recognized environmental concerns and pollution conditions. IAA has incurred, and we may in the future incur, expenditures relating to compliance and risk mitigation efforts, releases of hazardous materials, investigative, remedial or corrective actions, claims by third parties and other environmental issues, and such expenditures, individually or in the aggregate, could be significant. Federal and state environmental authorities are currently investigating IAA’s role in contributing to contamination at the Lower Duwamish Waterway Superfund Site in Seattle, Washington and the role of one of IAA’s subsidiaries in contributing to the Pyrite Canyon Plume in Jurupa Valley, California. Our potential liability at these sites cannot be estimated at this time.
Macroeconomic factors, including high fuel prices, high labor costs, inflation and changes in used car prices, may have an adverse effect on our revenues and operating results.
Macroeconomic factors that affect oil prices and the vehicle and commodity markets can have adverse effects on our revenue and operating results. Significant increases in the cost of fuel, whether due to inflationary pressures or otherwise, could lead to a reduction in miles driven per car and a reduction in accident rates. A material reduction in accident rates, whether due to a reduction in miles driven or other factors, could reduce our vehicle assignment volumes, which in turn, could have a material adverse impact on our revenues. In addition, significant increases in the cost of fuel have resulted and could continue to result in an increase in the prices charged to us by our independent subhaulers and trucking fleet operators. Further, we have recently experienced labor shortages, which have resulted in an increase in associated costs, such as increased overtime to meet demand and increased wages to attract and retain employees. If these conditions or other inflationary pressures continue, our costs for towing and branch labor may continue to rise. To the extent we are unable to pass these costs on to our customers, the increase in prices charged by our independent subhaulers and trucking fleet operators and the increase in labor costs could negatively impact our profitability.
Volatility in salvage car prices could have a material adverse effect on our revenues in future periods.
Adverse economic conditions, including increases in interest rates and lease rates, real estate values and real estate development and construction costs, may increase the costs required to invest in capacity expansion or delay our ability to open new facilities, both of which could have a material impact on our consolidated results of operations and financial position.
Reliance on our subhaulers and trucking fleet operations could materially and adversely affect our business and reputation.
We rely on independent subhaulers and trucking fleet operations to pick up and deliver vehicles to and from our auction facilities. Consistent with the economy generally, we have recently experienced a shortage of towers and haulers, which has resulted in an increase in costs charged to us by towers and subhaulers for these services, and we cannot provide assurances that towers and subhaulers will be available in a timely manner to pick up and deliver vehicles. Failure to pick up and deliver vehicles in a timely manner could harm our brand and reputation, and adversely impact our overall business and results of operations. Further, an increase in fuel cost may lead to increased prices charged by our independent subhaulers and trucking fleet operators, which may significantly increase our cost. We may not be able to pass these costs on to our suppliers or buyers. We are also exposed to risks associated with inclement weather, disruptions in the transportation infrastructure and increase in the price of fuel, any of which could increase our operating costs. If we experience problems or are unable to negotiate or obtain favorable terms with our subhaulers, our results of operations could be materially and adversely affected.
Weather-related and other events beyond our control may adversely impact operations.
Extreme weather or other events, such as hurricanes, tornadoes, earthquakes, forest fires, floods, global pandemics or other health crises, terrorist attacks or war, may adversely affect the overall economic environment, the markets in which we compete, and our operations and profitability. These events, which may increase in frequency and magnitude as a result of climate change, may impact our physical auction facilities, causing a material increase in costs, or delays or cancellation of auction sales, which could have a material adverse impact on our revenues and profitability. In some instances, for example with the severe storm in September 2022 known as “Hurricane Ian”, these events may result in a sharp influx in the available supply of damaged and total loss vehicles and there can be no assurance that our business will have sufficient resources to handle such extreme increases in supply. Our failure to meet our customers’ demands in such situations could negatively affect our relationships with such customers and result in a loss of
future business, which would adversely affect our operating results and financial condition. In addition, revenues generated as a result of the total loss of vehicles associated with such a catastrophe are typically recognized subsequent to the incurrence of incremental costs and such revenues may not be sufficient to offset the costs incurred.
Mild weather conditions tend to result in a decrease in the available supply of damaged and total loss vehicles because traffic accidents decrease, and fewer vehicles are damaged. Accordingly, mild weather can have an adverse effect on our damaged and total loss vehicle inventories, which would be expected to have an adverse effect on our revenue and operating results and related growth rates.
An increase in the number of damaged and total loss vehicles we purchase could adversely affect our profitability.
In certain countries, the salvage market typically operates on a principal basis, in which a vehicle is purchased and then resold, rather than on an agent basis, in which the auction acts as a sales agent for the owner of the vehicle. Operating on a principal basis exposes us to inventory risks, including losses from theft, damage and obsolescence. If we purchase vehicles, the increased costs associated with acquiring the vehicles could have a material adverse effect on our gross profit margin and operating results. Vehicles sold under purchase agreements were approximately 4.1% of IAA’s vehicles sold both domestically and internationally for fiscal year 2024. In addition, when vehicles are purchased, we are subject to changes in vehicle values, such as those caused by changes in commodity prices or changes in used car prices. Decreases in commodity prices, such as steel and platinum, may negatively affect vehicle values and demand at auctions. In addition, declines in used car prices, especially if they occur faster than anticipated, can lead to a significant gap between pre-accident value and sales price.
A significant change in used-vehicle prices could impact the proceeds and revenue from the sale of damaged and total loss vehicles.
The volume of new vehicle production, accuracy of lease residual estimates, interest rate fluctuations, customer demand and changes in regulations, among other things, all potentially affect the pricing of used vehicles. A sustained reduction in used-vehicle pricing could result in lower proceeds from the sale of damaged and total loss vehicles and a related reduction in revenue per vehicle, a potential loss of consignors and decreased profitability. Conversely, when used vehicle prices are high, used-vehicle dealers may retail more of their trade-in vehicles on their own rather than selling them at auction, which could adversely affect our revenues and profitability.
IAA assumes the settlement risk for vehicles sold through its marketplaces.
Typically, following the sale of a vehicle, IAA does not release the vehicle to a buyer until such time as it has received full payment for the vehicle. We may be obligated, however, to remit payment to a seller before receiving payment from a buyer and in those circumstances, we may not have recourse against sellers for any buyer’s failure to satisfy its payment obligations. Because we retain possession of the vehicle, we can resell the vehicle to mitigate any potential losses. Since revenue for most vehicles does not include the gross sales proceeds, failure to collect the receivables in full may result in a net loss up to the amount of gross sales proceeds on a per vehicle basis in addition to any expenses incurred to collect the receivables and to provide the services associated with the vehicle. If we are unable to collect payments on a large number of vehicles and we are unable to resell them and recover our costs, the resulting payment obligations to the seller and decreased fee revenues may have a material adverse effect on our results of operations and financial condition.
Changes in laws affecting the import and export of damaged and total loss vehicles may have an adverse effect on our business and financial condition.
Changes in laws, regulations and treaties that restrict the importation of damaged and total loss vehicles into foreign countries may reduce the demand for damaged and total loss vehicles and impact our ability to maintain or increase IAA’s international buyer base. The adoption of such laws or regulations in other jurisdictions that have the effect of reducing or curtailing our activities abroad could have a material adverse effect on our results of operations and financial condition by reducing the demand for our products and services.
We are subject to potential liabilities with respect to IAA’s prior separation from KAR Auction Services, Inc.
On February 27, 2018, KAR Auction Services, Inc. (“KAR”) announced a plan to pursue the separation and spin-off (the “Separation”) of IAA (its salvage auction services business) into a separate public company. On June 28, 2019, KAR completed the distribution of 100% of the issued and outstanding shares of common stock of IAA to the holders of record of KAR’s common stock on June 18, 2019, on a pro rata basis (the “Distribution”). Under the terms of the Separation and Distribution, each of IAA and KAR is required to indemnify the other party from and with respect to certain liabilities. IAA’s and KAR’s ability to satisfy these indemnities, if called upon to do so, will depend respectively upon our and KAR’s future financial strength. If we are required to indemnify KAR, or if we are not able to collect on indemnification rights from KAR, our financial condition, liquidity or results of operations could be materially and adversely affected.
We may not realize the anticipated benefits of, and synergies from, acquisitions and may become responsible for certain liabilities and integration costs as a result.
We have acquired, and may continue to acquire, businesses that have previously operated independently from us. The integration of our operations with those of acquired businesses, including IAA, is intended to result in financial and operational benefits, including certain tax and run-rate synergies. There can be no assurance, however, regarding when or the extent to which we will be able to realize these and other benefits. Integration may also be difficult, unpredictable and subject to delay because of possible company culture conflicts and different opinions on future business development. We may be required to integrate or, in some cases, replace, numerous systems, including those involving management information, purchasing, accounting and finance, sales, billing, employee benefits, payroll and regulatory compliance, many of which may be dissimilar. Difficulties associated with the integration of acquired businesses could have a material adverse effect on our business.
In addition, in connection with acquisitions, we have assumed, and may assume in connection with future acquisitions, certain potential liabilities. To the extent such liabilities are not identified by us or to the extent indemnifications obtained from third parties are insufficient to cover such liabilities, these liabilities could have a material adverse effect on our business.
Damage to our reputation could harm our business.
One of our founding principles is that we operate a fair and transparent business, and consistently act with integrity. Maintaining a positive reputation is key to our ability to attract and maintain customers, investors and employees. Damage to our reputation could cause significant harm to our business. Harm to our reputation could arise in a number of ways, including, but not limited to, employee conduct which is not aligned with our Code of Business Conduct and Ethics (and associated Company policies around behavioral expectations) or our Company’s core values, safety incidents, failure to maintain customer service standards, loss of trust in the fairness of our sales processes, the types of assets that we choose or are obligated to sell, and other technology or compliance failures.
We may incur losses as a result of our guarantee and inventory contracts and advances to consignors.
Our most common type of auction contract is a straight commission contract, under which we earn a pre-negotiated, fixed commission rate on the gross sales price of the consigned equipment at auction. We use straight commission contracts when we act as agent for consignors. In recent years, a majority of our annual business has been conducted on a straight commission basis. In certain other situations, we will enter into underwritten transactions and either offer to (a) guarantee a minimum level of sale proceeds to the consignor, regardless of the ultimate selling price of the consignment; or (b) purchase the equipment outright from the seller for sale through one of our sales channels.
We determine the level of guaranteed proceeds or inventory purchase price based on appraisals performed on equipment by our internal personnel. Inaccurate appraisals could result in guarantees or inventory values that exceed the realizable auction proceeds. In addition, a change in market values could also result in guarantee or inventory values exceeding the realizable auction proceeds. If auction proceeds are less than the guaranteed amount, our commission will be reduced, and we could potentially incur a loss, and, if auction proceeds are less than the purchase price, we paid for equipment that we take into inventory temporarily, we will incur a loss. Because a majority of our auctions are unreserved, there is no way for us to protect against these types of losses by bidding on or acquiring any of the items at such auctions. In addition, we do not hold inventory indefinitely waiting for market conditions to improve. If our exposure to underwritten contracts increases, this risk would be compounded.
Occasionally, we advance to consignors a portion of the estimated auction proceeds prior to the auction. We generally make these advances only after taking possession of the assets to be auctioned and upon receipt of a security interest in the assets to secure the obligation. If we were unable to auction the assets or if auction proceeds were less than amounts advanced, we could incur a loss. Additionally, we have two vendor contracts with the U.S. Government’s Defense Logistics Agency (“DLA”) pursuant to which we acquire, manage and resell certain assets of the DLA. Each of the DLA contracts obliges the Company to purchase rolling and non-rolling stock assets in an amount and of a type over which we have limited ability to control. In many cases, the type of assets purchased are not what we typically sell through any of our other channels. Although the prices we pay for the non-rolling stock inventory are a fraction of the original acquisition value, we may not have the ability to attract buyers for those assets and we may be unable to sell those assets on a timely basis or at all. This would have an adverse effect on our financial results.
The availability and performance of our IT systems and infrastructure is critical to our business and continued growth.
The satisfactory performance, reliability and availability of our websites, online bidding service, auction management systems, enterprise resource planning systems, transaction processing systems, network infrastructure and customer relationship management systems are important to our reputation, our business and our continued growth. We currently rely on our own proprietary systems, licensed on-premise systems, and third-party cloud computing applications and infrastructure located in the United States and other countries. The systems and infrastructure we rely on may experience service interruptions or degradation because of hardware or software defects or malfunctions, denial of service or ransomware attacks and other cybersecurity events, human error and natural events beyond our control. The rapid evolution and increased adoption of artificial intelligence technologies may intensify our
cybersecurity risks. Additionally, as part of our management of these IT resources, we integrate, make updates to or initiate other types of changes to our systems and infrastructure to address ongoing availability and performance concerns or to improve the same, and the risk of disruption is increased when such changes are undertaken. Some of our systems are not fully redundant, and our recovery planning may not be sufficient for all possible disruptions. Further, the access to and use of needed hardware and software, including cloud computing resources, may not continue to be available at reasonable prices, on commercially reasonable terms or at all. Any loss of the right to access or use any of these components and resources, the degraded performance, or loss of the functionality, of our systems, or a failure to timely or successfully integrate and update our systems or infrastructure, could mean a failure to realize cost savings or operational benefits anticipated to be derived from an IT initiative, significantly increase our expenses, damage our reputation and otherwise result in delays in providing our services. Our business and results of operations would be particularly harmed if, for any reason, access to our online bidding service was lost or its functionality degraded.
Consumer behavior is rapidly changing, and if we are unable to successfully adapt to consumer preferences and develop and maintain a relevant and reliable inventory management and multichannel disposition experience for our customers, our financial performance and brand image could be adversely affected.
Our business continues to evolve into a one-stop inventory management and multichannel disposition company where customers can buy, sell, or list equipment, when, how, and where they choose- both onsite and online, and manage their existing fleets and/or inventory using our online inventory management tools. As a result of this evolution, increasingly we interact with our customers across a variety of different channels, including live auction, online, through mobile technologies, including the Ritchie Bros. mobile app, social media, and inventory management systems. Our customers are increasingly using tablets and mobile phones to make purchases online and to get detailed equipment information for assets that they own or are interested in purchasing. Our customers also engage with us online, including through social media, by providing feedback and public commentary about all aspects of our business. Consumer shopping patterns are rapidly changing, and our success depends on our ability to anticipate and implement innovations in customer experience and logistics in order to appeal to customers who increasingly rely on multiple channels to meet their equipment management and disposition needs. Our ability to provide a high quality and efficient customer experience is also dependent on external factors over which we may have little or no control, including, without limitation, the reliability and performance of the equipment sold in our marketplaces and the performance of third-party carriers who transport purchased equipment on behalf of buyers. If for any reason we are unable to implement our inventory management, data solutions, bidding tools and other multichannel initiatives, provide a convenient and consistent experience for our customers across all channels, or provide our customers the services they want, when and where they want them at a compelling value proposition, then our financial performance and brand image could be adversely affected.
We rely on data provided by third parties, the loss of which could limit the functionality of certain of our platforms and disrupt our business.
Our analytics teams rely on asset, pricing and other data, including personal data, provided to us by our customers and other third parties. Some of this data is provided to us pursuant to third-party data sharing policies and terms of use, under data sharing agreements by third-party providers or by customers with consent. Any of these parties could change their data sharing policies and terms of use, including by making them more restrictive, terminating or not renewing agreements, or, customers could revoke their consent, any of which could result in the loss of, or significant impairment to, our ability to collect and provide useful data or related services to our customers.
These third parties could also interpret our data collection and use policies or practices as being inconsistent with their policies or business objectives or lose confidence in our data protection and privacy practices, which could result in the loss of our ability to collect this data. Any such changes could impair our ability to deliver our analytics service to our customers in the manner currently anticipated or at all, impairing the return on investment that our customers derive from using our analytics platform and related products, as well as adversely affecting our business and our ability to generate revenue.
Government regulation of the digital landscape is evolving, and unfavorable regulations could substantially harm our business and results of operations.
We are subject to federal, provincial, state and local laws, rules and regulations governing digital commerce and online services. Existing and future laws and regulations may impede the growth of digital commerce or other services, in particular online marketplace services, and increase the cost of doing business, including providing online disposition services. These regulations and laws may cover taxation, tariffs, user privacy, data protection, machine learning and automated decision making, pricing, transaction processing, content, intellectual property rights, electronic contracts, digital marketing communications, consumer protection, and the characteristics and quality of our disposition services. It is not always clear how existing laws governing issues such as property transfers, digital, sales and similar taxes, intellectual property rights, and user privacy and data protection apply to digital commerce
and online services. Changes to laws, rules and regulations and unfavorable resolution of these issues may harm our business and results of operations.
If our ability, or the ability of our third party service partners, cloud computing providers or third party data center hosting facilities, to safeguard the reliability, integrity and confidentiality of our and their IT systems is compromised, if unauthorized access is obtained to our systems or customers’, suppliers', counterparties' and employees' confidential information, or if authorized access is blocked or disabled, we may incur material reputational harm, legal exposure, or a negative financial impact.
We rely on IT resources to manage and operate our business, including maintaining proprietary databases containing sensitive and confidential information about our customers, suppliers, counterparties and employees (which may include personal information and credit information) and utilizing approved third-party technology providers to support the management and operation of IT systems and infrastructure. The malicious tools and techniques used to obtain unauthorized access to or impair IT systems and devices and the data processed thereby evolve frequently in terms of attack vectors and sophistication and we may not be able to anticipate these vectors or to timely implement adequate preventative and protective measures. Unauthorized parties have and may in the future attempt to gain access to our and our providers’ primary and backup systems or facilities through various means, including hacking into IT systems or facilities, fraud, trickery or other means of deceiving our and their employees or contractors. Ransomware attacks are increasingly prevalent and severe, and can lead to significant interruptions in our operations, loss of data and income, reputational loss, and diversion of funds. Further, breaches experienced by other companies may also be leveraged against us and sophisticated actors can mask their attacks, making them increasingly difficult to identify and prevent. There can be no assurance that impacts from these incidents will not be material or significant in the future.
In addition, our limited control over our customers may affect the security and integrity of our IT systems and create financial, reputational or legal exposure. For example, our customers may accidentally disclose their passwords, use insecure passwords, or store them on a device that is lost or stolen, providing bad actors with access to a customer’s account with us and the possible means to redirect customer payments. Further, users of our services could have vulnerabilities on their own devices that are entirely unrelated to our systems and platforms but could mistakenly attribute their own vulnerabilities to us. Under credit card payment rules and our contracts with credit card processors, if there is a breach of payment card information used to process transactions, we could be liable to the payment card issuing banks for certain fraudulent credit card transactions and other payment disputes with customers, including the cost of issuing new cards and related expenses. If we were liable for a significant number of fraudulent transactions or unable to accept payment cards, our results of operations would be materially and adversely affected. Bad actors may also create fake websites or misleading communications that mimic our branding, product offerings, or invoicing systems, thereby deceiving customers into making purchases that they believe are legitimate. Such fraudulent activities could significantly damage our reputation, erode customer trust, and result in financial losses. Furthermore, the complex, global and fragmented nature of the internet ecosystem, including multiple domain registrars, hosting services, and internet service providers, can make it extremely difficult and time-consuming to identify and take down fraudulent websites or other misleading content, leaving our brand vulnerable to continued exploitation by malicious actors. This risk is heightened in foreign jurisdictions where we may have less influence over local enforcement mechanisms, or access to rapid legal recourse.
The information security measures we implement, maintain and follow that are designed to mitigate our risks with respect to IT-related cybersecurity incidents do not guarantee that our operations will not be disrupted, that we will prevent an attack from occurring in the future, or that our internal controls, for instance relating to user access management, will perform as intended to prevent unauthorized access to our systems and data. We continue to integrate and align security measures and internal controls across our operating businesses. These businesses are at varying stages of maturity, which presents challenges in standardizing security measures across the organization. Inconsistent or incomplete alignment of security measures could lead to vulnerabilities, compliance risks, or operational disruptions. Gaps or delays in our ongoing efforts to align these measures could impact the effectiveness of our overall security posture and expose us to potential security breaches. Any breach of our IT systems may have a material adverse impact on our business, the assessment of the performance of our internal control environment, results of operations, reputation, stock price and our ability to access capital markets, and may also be deemed to contribute to a material weakness in internal controls over financial reporting.
Security events, hacking or other malicious or surreptitious activity (or the perception that such activities have occurred), could damage our reputation, cause a loss of confidence in the security of our services and thereby a loss of customers, and expose us to a risk of loss, governmental investigations and enforcement actions or litigation and possible liability for damages. We may be required to make significant expenditures and divert management attention to monitor, detect and prevent security events, to remediate known or potential security vulnerabilities, or to alleviate problems caused by any security events. In addition, circumvention of our security measures may result in the loss or misappropriation of valuable business data, intellectual property or trade secret information, misappropriation of our customers’ or employees’ personal information, damage to our computing infrastructure, networks and stored data, service delays, key personnel being unable to perform duties or communicate throughout the organization, loss of sales, significant costs for data restoration and other adverse impacts on our business. Further, such a breach may require us to incur significant expenses to notify governmental agencies, individuals or other third parties pursuant to various privacy and security laws.
The costs of mitigating cybersecurity risks are significant and are likely to increase in the future. Our third-party service providers may be vulnerable to interruption or loss of valuable business data and information of our customers and employees (among others). Data stored by our third-party providers might be improperly accessed or unavailable due to a variety of events beyond our control, including, but not limited to, employee error or negligence, natural disasters, terrorist attacks, telecommunications failures, computer viruses, hackers and other security issues. Additionally, if any of our third-party technology providers violate applicable laws or our contracts or policies, such violations may also put our customers’ information at risk and could in turn have a material and adverse effect on our business. Our insurance policies may not be adequate to reimburse us for losses caused by security breaches, and we may not be able to fully collect, if at all, under these insurance policies.
Our future expenses may increase significantly and our operations and ability to expand may be limited as a result of licenses, laws and regulations governing auction sites, environmental protection, international trade, tariffs and other matters.
A variety of federal, provincial, state and local laws, rules and regulations throughout the world apply to our business, relating to, among other things, tax and accounting rules, the auction business, imports and exports of equipment, property ownership laws, licensing, worker safety, privacy and security of customer information, land use and the use, storage, discharge and disposal of environmentally sensitive materials. Complying with revisions to laws, rules and regulations could result in an increase in expenses and a deterioration of our financial performance. Failure to comply with applicable laws, rules and regulations could result in substantial liability to us, suspension or cessation of some or all of our operations, restrictions on our ability to expand at present locations or into new locations, requirements for the acquisition of additional equipment or other significant expenses or restrictions.
The development or expansion of auction sites depends upon receipt of required licenses, permits and other governmental authorizations. Our inability to obtain these required items could harm our business. Additionally, changes or concessions required by regulatory authorities could result in significant delays in, or prevent completion of, such development or expansion. International bidders and consignors could be deterred from participating in our auctions if governmental bodies impose additional export or import regulations or additional duties, taxes or other charges on exports or imports. The United States and other countries have imposed and may continue to impose new trade restrictions and export regulations, have levied tariffs and taxes on certain assets, and could significantly increase tariffs on a broad array of assets. Trade restrictions and export regulations, or increases in tariffs and additional taxes, including any retaliatory measures, could reduce participation from international bidders and consignors which could reduce GTV and harm our business, financial condition and results of operations.
Under some environmental laws, an owner, operator or lessee of, or other person involved in, real estate may be liable for the costs of removal or remediation of hazardous or toxic substances located on or in, or emanating from, the real estate, and related costs of investigation and property damage. These laws often impose liability without regard to whether the owner, operator, lessee or other person knew of, or was responsible for, the presence of the hazardous or toxic substances. Environmental contamination may exist at our owned or leased auction sites, or at other sites on which we may conduct auctions, or properties that we may be selling by auction, from prior activities at these locations or from neighboring properties. In addition, auction sites that we acquire or lease in the future may be contaminated, and future use of or conditions on any of our properties or sites could result in contamination. The costs related to claims arising from environmental contamination of any of these properties could harm our financial condition and results of operations.
There are restrictions in the United States, Canada, Europe and other jurisdictions in which we do business that may affect the ability of equipment owners to transport certain equipment between specified jurisdictions or the salability of older equipment. One example of these restrictions is environmental certification requirements in the United States, which prevent non-certified equipment from entering into commerce in the United States. In addition, engine emission standards in some jurisdictions limit the operation of certain trucks and equipment in those markets.
These restrictions, or the adoption of more stringent environmental laws, including laws enacted in response to climate change, could inhibit materially the ability of customers to ship equipment to or from our auction sites, reducing our GTV and harming our business, financial condition and results of operations.
Losing the services of one or more key personnel or the failure to attract, train and retain personnel could materially affect our business.
Our future success largely depends on our ability to attract, develop and retain skilled employees in all areas of our business, as well as to design an appropriate organization structure and plan effectively for succession. Although we actively manage our human resource risks, there can be no assurance that we will be successful in our efforts. If we fail to attract, develop and retain skilled employees in all areas of our business, our financial condition and results of operations may be adversely affected, and we may not achieve our growth or performance objectives.
The growth and performance of our business depends to a significant extent on the efforts and abilities of our employees. Many of our key employees have extensive experience with our business. These employees have knowledge and an understanding of our company
and industry that cannot be readily duplicated. The loss of any key personnel, or the inability to replace any lost personnel with equally trained personnel, could impair our ability to execute our business plan and growth strategy, cause us to lose customers and reduce our revenues. In addition, the success of our strategic initiatives to expand our business to complimentary service offerings will require new competencies in many positions, and our management and employees will have to adapt and learn new skills and capabilities. To the extent they are unable or unwilling to make these transformational changes or we are unable to attract new employees who are able to do so, we may be unable to realize the full benefits of our strategic initiatives. We do not maintain key person insurance on the lives of any of our executive officers or other key personnel. As a result, we would have no way to cover the financial loss if we were to lose the services of such employees. This uncertainty may adversely affect our ability to attract and retain key employees.
If any of our key personnel were to join a competitor or form a competing company, existing and potential customers could choose to form business relationships with that competitor instead of us. There can be no assurance that confidentiality, non-solicitation, non-competition or similar agreements signed by our former directors, officers, or employees will be effective in preventing a loss of business.
Failure to maintain safe sites could materially affect our business and reputation.
Our employees and customers are often in close proximity with mechanized equipment, moving vehicles and chemical and other industrial substances. Our auction sites and warehouses are, therefore, potentially dangerous places and involve the risk of accidents, environmental incidents and other incidents, which may expose us to investigations and litigation or could negatively affect the perception of customer and employee safety, health and security. Even in the absence of any incidents, unsafe site conditions could lead to employee turnover or harm our reputation generally, each of which would affect our financial performance. While safety is a primary focus of our business and is critical to our reputation and performance, our failure to implement safety procedures or implement ineffective safety procedures would increase this risk and our operations and results from operations may be adversely impacted.
Income and commodity tax amounts, including tax expense, may be materially different than expected, and there is a trend by global tax collection authorities towards the adoption of more aggressive laws, regulations, interpretations and audit practices.
Our global operations are subject to tax interpretations, regulations, and legislation in the numerous jurisdictions in which we operate, all of which are subject to continual change.
We accrue and pay income taxes and have significant income tax assets, liabilities, and expense that are estimates based primarily on the application of those interpretations, regulations and legislation, and the amount and timing of future taxable income, as well as our use of applicable accounting principles. Accordingly, we cannot be certain that our estimates and reserves are sufficient. The timing concerning the monetization of deferred income tax amounts is uncertain, as they are dependent on our future earnings and other events. Our deferred income tax amounts are valued based upon enacted income tax rates in effect at the time, which can be changed by governments in the future.
The audit and review activities of tax authorities affect the ultimate determination of the actual amounts of commodity taxes payable or receivable, income taxes payable or receivable, deferred income tax assets and liabilities, and income tax expense.
There is no assurance that taxes will be payable as anticipated or that the amount or timing of receipt or use of the tax-related assets will be as currently expected. Our experience indicates that taxation authorities are increasing the frequency and depth of audits and reviews. The Canada Revenue Agency (“CRA”) has been conducting audits for our 2014, 2015, 2020 and 2021 taxation years.
On December 3, 2024, the CRA issued the Company a Notice of Assessment and Statement of Interest (“NOA”) for CA$79.1 million (Canadian dollars) (approximately $55.1 million), for the taxation years 2010 through 2015, inclusive of CA$37.7 million in income taxes (approximately $26.3 million), and CA$41.4 million in interest and penalties (approximately $28.9 million). The CRA is asserting that one of the Company’s Luxembourg subsidiaries which was in operation from 2010 to 2020 was a resident in Canada from 2010 through 2015 and that its worldwide income should be subject to Canadian income taxation. The Company plans to object to the notice of assessment as it believes it is and has been in full compliance with Canadian tax laws and intends to pursue all available administrative and judicial remedies necessary to resolve this matter. As such, the Company plans to file a Notice of Objection with the CRA in March 2025 and accordingly has paid a deposit of CA$39.5 million (approximately $27.6 million) to the CRA in February 2025, the minimum required by law as part of the CRA’s objection process. In the event that the Company prevails in its objection or subsequent legal proceedings, the deposit would be refunded with interest to the Company. In the event that the Company’s tax filing position is not upheld by either the CRA or by a court of last resort, the Company would incur and record the amounts assessed in income tax, interest and penalties in its consolidated financial statements, which could have a material negative effect on the Company’s operations. In addition, during the third quarter of 2024, the CRA has requested information regarding the 2016 to 2020 taxation years for the same matter, which the Company provided to the CRA in January 2025. The Company has not received a notice of assessment relating to the 2016 to 2020 taxation years. Depending on the outcome of this matter with the CRA, the Company could incur additional income taxes, penalties and interest relating to the 2016 to 2020 taxation years, which could have
a material negative effect on its operations. In addition, future tax authority determinations, including changes to tax interpretations, regulations, legislation or jurisprudence, could have a material impact to our financial position. The fact that we operate internationally increases our exposure in this regard given the multiple forms of taxation imposed upon us. Further and more generally, there has been increased political, media and tax authority focus on taxation in recent years; the intent of which appears to be to enhance transparency and address perceived tax avoidance. As such, in addition to tax risk from a financial perspective, our activities may expose us to reputational risk.
Our substantial international operations expose us to additional risks that could harm our business, including foreign exchange rate fluctuations that could harm our results of operations.
We conduct business in many countries around the world and intend to continue to expand our presence in international markets, including emerging markets.
Although we report our financial results in U.S. dollars, a significant portion of our revenues and expenses are generated outside the U.S., primarily in currencies other than the U.S. dollar. In particular, a significant portion of our revenues are earned, and expenses incurred, in the Canadian dollar and the Euro. The results of operations of our foreign subsidiaries are translated from local currency into U.S. dollars for financial reporting purposes. If the U.S. dollar weakens against foreign currencies, the translation of these foreign currency denominated revenues or expenses will result in increased U.S. dollar denominated revenues and expenses. Similarly, if the U.S. dollar strengthens against foreign currencies, particularly the Canadian dollar and the Euro, our translation of foreign currency denominated revenues or expenses will result in lower U.S. dollar denominated revenues and expenses. We do not currently engage in foreign currency hedging arrangements on any of our revenues or expenses. Fluctuating currency exchange rates may negatively affect our business in international markets and our related results of operations.
In addition, currency exchange rate fluctuations between the different countries in which we conduct our operations impact the purchasing power of buyers, the motivation of consignors, asset values and asset flows between various countries, including those in which we do not have operations. These factors and other global economic conditions may harm our business and our results of operations.
Other risks inherent in doing business internationally include, but are not limited to the following: (a) trade barriers, trade regulations, currency controls, import or export regulations, tariffs and other restrictions on doing business freely; (b) local labor, environmental, tax, and other laws and regulations, and the potential for adverse changes in such laws and regulations or the interpretations thereof; (c) difficulties in staffing and managing foreign operations; (d) economic, political, social or labor instability or unrest; (e) terrorism, war, hostage-taking, or military repression; (f) corruption; (g) expropriation and nationalization, or difficulties in enforcing or protecting our property rights, including with respect to intellectual property; (h) increased exposure to high rates of inflation; and (i) unpredictability as to litigation in foreign jurisdictions and enforcement of local laws.
If we violate the complex foreign and U.S. laws and regulations that apply to our international operations, we may face fines, criminal actions or sanctions, prohibitions on the conduct of our business and damage to our reputation. These risks inherent in our international operations increase our costs of doing business internationally and may result in a material adverse effect on our operations or profitability.
Our business operations may be subject to a number of federal and local laws, rules and regulations governing international trade, including export control regulations.
Our business operations may be subject to a number of federal and local laws, rules and regulations, including the Export Administration Regulations, or EAR, maintained by the U.S. Department of Commerce, economic and trade sanctions maintained by the U.S. Department of the Treasury’s Office of Foreign Assets Control, or OFAC, and similar laws and regulations in Canada, the UK and the EU. These laws and regulations restrict us from providing services to, or otherwise engaging in direct or indirect transactions or dealings with, certain countries, territories, governments, and persons. We have implemented procedures designed to maintain compliance with these laws, including monitoring, on an automatic and manual basis, the identity and location of potential sellers and buyers. We can offer no assurances that these procedures will always be effective.
If we were to violate applicable export control or sanctions, we could be subject to administrative or criminal penalties, which in certain circumstances, could be material. We could be subject to damages, financial penalties, denial of export privileges, incarceration of our employees, other restrictions on our operations, and reputational harm. Further, any action on the part of the U.S. Department of Commerce, OFAC or other applicable regulator against the company or any of our employees for potential violations of these laws could have a negative impact on our reputation, business, operating results and prospects.
Failure to comply with anti-bribery, anti-corruption, and anti-money laundering laws, including the U.S. Foreign Corrupt Practices Act of 1977, as amended, or the FCPA, the Corruption of Foreign Public Officials Act, or the CFPOA, and similar laws associated with our activities outside of the U.S. could subject us to penalties and other adverse consequences.
We are subject to the FCPA, the CFPOA, the U.S. domestic bribery statute contained in 18 U.S.C. §201, the U.S. Travel Act, the USA
PATRIOT Act, the United Kingdom Bribery Act of 2010, or the U.K. Bribery Act, and similar other anti-corruption, anti-bribery and anti-money laundering laws in countries in which we conduct activities or facilitate the buying and selling of equipment, including the EU. We face significant risks if we fail to comply with the FCPA, the CFPOA and other anti-corruption and anti-bribery laws that prohibit companies and their employees and third-party intermediaries from authorizing, offering or providing, directly or indirectly, improper payments or benefits to foreign government officials, political parties or candidates, employees of public international organizations, and private-sector recipients for the corrupt purpose of obtaining or retaining business, directing business to any person, or securing any advantage. In many foreign countries, particularly in countries with developing economies, it may be a local custom that businesses engage in practices that are prohibited by the FCPA, the CFPOA or other applicable laws and regulations. In addition, we leverage various third parties to sell our solutions and conduct our business abroad. We and our other third-party intermediaries may have direct or indirect interactions with officials and employees of government agencies or state-owned or affiliated entities. We may be held liable for the corrupt or other illegal activities of these third-party intermediaries, our employees, representatives, contractors, partners, and agents, even if we do not explicitly authorize such activities. Our Code of Business Conduct and Ethics and other corporate policies mandate compliance with these anti-bribery laws, which often carry substantial penalties.
Any violation of the FCPA, other applicable anti-bribery, anti-corruption laws, and anti-money laundering laws could result in whistleblower complaints, adverse media coverage, investigations, loss of export privileges, severe criminal or civil sanctions and, in the case of the FCPA, suspension or debarment from U.S. government contracts, which could have a material and adverse effect on our reputation, business, operating results and prospects. In addition, responding to any enforcement action may result in a materially significant diversion of management’s attention and resources and significant defense costs and other professional fees.
We are pursuing a long-term growth strategy that may include acquisitions and developing and enhancing an appropriate sales strategy, which requires upfront investment with no guarantee of long-term returns.
We continue to pursue a long-term growth strategy that contemplates upfront investments, including (i) investments in emerging markets that may not generate profitable growth in the near term, (ii) adding new business and information solutions, and (iii) developing our people. Planning for future growth requires investments to be made now in anticipation of growth that may not materialize, and if our strategies do not successfully address the needs of current and potential customers, we may not be successful in maintaining or growing our GTV and our financial condition and results of operations may be adversely impacted. We may also not be able to improve our systems and controls as a result of increased costs, technological challenges, or lack of qualified employees. A large component of our selling, general and administrative expenses is considered fixed costs that we will incur regardless of any GTV growth. There can be no assurances that our GTV and revenues will be maintained or grow at a more rapid rate than our fixed costs.
Part of our long-term growth strategy includes growth through acquisitions, which poses a number of risks. We may not be successful in identifying appropriate acquisition candidates, consummating acquisitions on satisfactory terms or integrating any newly acquired or expanded business with our current operations. Our ability to acquire other businesses or technologies, make strategic investments or integrate acquired businesses effectively may also be impaired by adverse economic and political events, including trade tensions, and increased global scrutiny and evolving regulatory expectations relating to acquisitions and strategic investments. Additionally, significant costs may be incurred in connection with any acquisition and our integration of such businesses with our business, including legal, accounting, financial advisory and other costs. We may also not realize the anticipated benefits of, and synergies from, such acquisition. We cannot guarantee that any future business acquisitions will be pursued, that any acquisitions that are pursued will be consummated, or that we will achieve the anticipated benefits of completed acquisitions.
We are regularly subject to general litigation and other claims, which could have an adverse effect on our business and results of operations.
We are subject to general litigation and other claims that arise in the ordinary course of our business. The outcome and impact of such litigation cannot be predicted with certainty, but regardless of the outcome, these proceedings can have an adverse impact on us because of legal costs, diversion of management resources and other factors. While the results of these claims have not historically had a material effect on us, we may not be able to defend ourselves adequately against these claims in the future, and these proceedings may have a material adverse impact on our financial condition or results of operations.
Additionally, the outcome of a proceeding may differ materially from the Company's best estimate. For example, we currently have an ongoing dispute with Ms. Ann Fandozzi, former Chief Executive Officer, and current Director, regarding her departure from the Company. Since the third quarter of 2023, the Company has been recording an accrual to reflect the best estimate of the settlement amount, and to date has recorded an expense of $11.2 million, which reflects the current best estimate of a settlement amount net of a recapture of previously recognized compensation expense based on the terms of Ms. Fandozzi’s employment agreement following her resignation. The matter is currently in arbitration in accordance with the terms of Ms. Fandozzi’s employment agreement. Any changes to the estimated payment amount as a result of the settlement of the matter could be material and any such payment or our
inability to resolve the dispute in a timely manner may adversely affect our results of operations. See "Part II, Item 8: Financial Statements and Supplementary Data - Note 27 Contingencies" for further information.
We may also be subject to intellectual property claims, which are extremely costly to defend, could require us to pay significant damages, and could limit our ability to use certain technologies in the future. Companies in the internet and technology industries are frequently subject to litigation based on allegations of infringement or other violations of intellectual property rights.
Third-party intellectual property rights may cover significant aspects of our technologies or business methods or block us from expanding our offerings. Any intellectual property claim against us, with or without merit, could be time consuming and expensive to settle or litigate and could divert the attention of our management. Litigation regarding intellectual property rights is inherently uncertain due to the complex issues involved, and we may not be successful in defending ourselves in such matters.
Many potential litigants, including some patent-holding companies, have the ability to dedicate substantial resources to enforcing their intellectual property rights. Any claims successfully brought against us could subject us to significant liability for damages, and we may be required to stop using technology or other intellectual property alleged to be in violation of a third party’s rights. We also might be required to seek a license for third-party intellectual property. Such a license may be unavailable or may require us to pay significant royalties or submit to unreasonable terms, which would increase our operating expenses. We may also be required to develop alternative non-infringing technology, which could require significant time and expense. If we cannot license or develop technology for any allegedly infringing aspect of our business, we would be forced to limit our service and may be unable to compete effectively. Any of these results could harm our business.
Privacy concerns and our compliance with current and evolving domestic or foreign laws and regulations regarding the processing of personal information and other data may increase our costs, impact our marketing efforts, or decrease adoption and use of our products and services, and our failure to comply with those laws and regulations may expose us to liability and reputational harm.
Governments and regulators around the world continue to propose and adopt new, or modify existing, laws, regulations and interpretative guidance addressing data privacy, data protection, data sovereignty and the processing of data, generally. Although we monitor the regulatory environment and have invested in addressing these developments, such as through our cybersecurity and privacy readiness programs, these laws may require us to incur further compliance costs to make changes to our practices, products and services to enable us or our customers to meet the new legal requirements. In addition, if we are found to have breached any such laws or regulations, we may be subject to enforcement actions that require us to change our practices, products and services, which may negatively impact our revenue, as well as expose us to liability through new or higher potential penalties and fines for non-compliance, civil and criminal penalties, and litigation for alleged violations, as well as adverse publicity that could cause our customers to lose trust in us and negatively impact our reputation and business in a manner that harms our financial position. These new or proposed laws and regulations are subject to differing interpretations that may change over time resulting in further compliance costs, as well as diversion of resources to monitor and address developments. New and proposed laws and regulations may also be inconsistent among jurisdictions or conflict with other laws and regulations. As a result, these requirements and other potential self-regulatory standards and industry codes of conduct could require us to take on more onerous obligations in our contracts, restrict our ability to store, transfer and otherwise process data or, in some cases, impact our ability to offer certain services in certain locations, to deploy software or data solutions, to market to current and prospective customers, or to derive insights from customers’ online activity and data globally.
We believe that laws and regulations in the United States, Canada, the United Kingdom, Australia the European Union and in other jurisdictions will be increasingly restrictive in the field of data privacy and protection and will in turn result in an increase in regulatory burdens for us to address to continue meeting our customers’ expectations, in particular in relation to the sharing of personal information with third parties, the use of machine learning and big data, and the tracking of online activities for advertising. As our capacity to process large volumes of data increases, customer sentiment towards increased transparency and control and further interpretive guidance from regulatory agencies may require us to change our operations and practices in a manner adverse to our business. In this uncertain and shifting regulatory and trust climate, even the perception that the privacy and security of personal information are not satisfactorily addressed or do not meet regulatory requirements could result in adverse publicity and reputation loss.
Our business continuity plan may not operate effectively in the event of a significant interruption of our business.
We have implemented a formal business continuity plan covering most significant aspects of our business that would take effect in the event of a significant interruption to our business, or the loss of key systems as a result of a natural or other disaster. Although we have tested our business continuity plan as part of the implementation, there can be no assurance that it will operate effectively or that our business, results of operations and financial condition will not be materially affected in the event of a significant interruption of our
business. If we were subject to a disaster or serious security breach, it could materially damage our business, financial condition and results of operations.
Our insurance may be insufficient to cover losses that may occur as a result of our operations.
We maintain property and general liability insurance. This insurance may not remain available to us at commercially reasonable rates, and the amount of our coverage may not be adequate to cover all liabilities that we may incur. Our auctions generally involve the operation of large equipment close to a large number of people, and despite our focus on safe work practices, an accident could damage our facilities, injure auction attendees and harm our reputation and our business. In addition, if we were held liable for amounts exceeding the limits of our insurance coverage or for claims outside the scope of our coverage, the resulting costs could harm our financial condition and results of operations.
Certain global conditions may affect our ability to conduct successful events.
Like most businesses with global operations, we are subject to the risk of certain global or regional adverse conditions, such as pandemics or other disease outbreaks, or natural disasters including extreme weather or other events, such as hurricanes, tornadoes, earthquakes, forest fires or floods that could hinder our ability to conduct our scheduled auctions, restrict our customers’ travel patterns or their desire to attend auctions or impact our online operations, including disrupting the internet or mobile networks or one or more of our service providers. If any of these conditions were to occur, we may not be able to generate sufficient equipment consignments to sustain our business or to attract enough bidders to our auctions to achieve world fair market values for the items we sell. This could harm our financial condition and results of operations. To the extent that climate change causes rising sea levels, increased intensity of weather, and increased frequency of extreme precipitation and flooding, the risks noted above may increase.
Financial Risk Factors
Ineffective internal control over financial reporting could result in errors in our financial statements, reduce investor confidence, and adversely impact our stock price.
As a public company, we are required to furnish a report by management on the effectiveness of our internal control over financial reporting. This assessment is required to include disclosure of any material weaknesses identified by our management in our internal control over financial reporting identified by our management. We are also required to have our independent registered public accounting firm issue an opinion on the effectiveness of our internal control over financial reporting on an annual basis.
Any failure to maintain internal control over financial reporting could severely inhibit our ability to accurately report our financial condition or results of operations. If we are unable to conclude in the future that our internal control over financial reporting is effective, or if our independent registered public accounting firm determines we have a material weakness in our internal control over financial reporting, we could lose investor confidence in the accuracy and completeness of our financial reports, our stock price could decline, and we could be subject to sanctions or investigations by the New York Stock Exchange, the SEC or other regulatory authorities. Failure to remedy any material weakness in our internal control over financial reporting, or to implement or maintain other effective control systems required of public companies, could also restrict our future access to the capital markets.
We have substantial indebtedness, and the degree to which we are leveraged may materially and adversely affect our business, financial condition and results of operations.
At December 31, 2024, we have $2.7 billion of total debt outstanding, consisting of:
•$1.3 billion under an amended credit agreement (the "Credit Agreement") entered into in December 2022 with a syndicate of lenders; and
•$550.0 million aggregate principal amount of 6.750% senior secured notes due March 15, 2028, and $800.0 million aggregate principal amount of 7.750% senior unsecured notes due March 15, 2031 (together the "Notes")
There are no current drawings under our foreign credit facilities, and we can borrow an additional $705.9 million under the Credit Agreement.
Our ability to make payments on and to refinance our indebtedness, as well as any future debt that we may incur, will depend on our ability to generate cash in the future from operations, financings or asset sales. Our ability to generate cash is subject to general economic, financial, competitive, legislative, regulatory and other factors that are beyond our control. We may not generate sufficient funds to service our debt and meet our business needs, such as funding working capital or the expansion of our operations. If we are not able to repay or refinance our debt as it becomes due, we may be forced to take certain actions, including reducing spending on marketing, advertising and new product innovation, reducing future financing for working capital, capital expenditures and general corporate purposes, selling assets or dedicating an unsustainable level of our cash flow from operations to the payment of principal and interest on our indebtedness. In addition, our ability to withstand competitive pressures and to react to changes in our industry, including both the live and online auction industry, could be impaired.
The lenders who hold our debt could also accelerate amounts due in the event that we default, which could potentially trigger a default or acceleration of the maturity of our other debt. In addition, our leverage could put us at a competitive disadvantage compared to our competitors that are less leveraged. These competitors could have greater financial flexibility to pursue strategic acquisitions and secure additional financing for their operations. Our leverage could also impede our ability to withstand downturns in our industry or the economy in general. We may incur substantial additional indebtedness in the future. The terms of the Credit Agreement and the indentures governing the Notes will limit, but not prohibit, us from incurring additional indebtedness. If we incur any additional indebtedness that has the same priority as the Notes and the guarantees thereof, the holders of that indebtedness will be entitled to share ratably with the holders of the Notes and the guarantees thereof in any proceeds distributed in connection with any insolvency, liquidation, reorganization, dissolution or other winding-up of the Company. Subject to restrictions in the Credit Agreement and the indenture governing the Notes, we also will have the ability to incur additional secured indebtedness that would be effectively senior to the Notes offered hereby, to the extent of the value of the assets securing such obligations. If new indebtedness is added to our current debt levels, the related risks that we now face could intensify.
Our debt instruments have restrictive covenants that could limit our financial flexibility.
The terms of the Credit Agreement and the Notes indentures contain financial and other restrictive covenants that limit our ability to engage in activities that may be in our long-term best interests. Our ability to borrow under our Credit Agreement is subject to compliance with a consolidated leverage ratio covenant and a consolidated interest coverage ratio covenant.
The Credit Agreement includes other restrictions that limit our ability in certain circumstances to: incur indebtedness; grant liens; engage in mergers, consolidations and liquidations; make asset dispositions, restricted payments and investments; enter into transactions with affiliates; and amend, modify or prepay certain indebtedness. The indentures governing the Notes contain covenants that limit our ability in certain circumstances to: incur additional indebtedness (including guarantees thereof); incur or create liens on their assets securing indebtedness; make certain restricted payments; make certain investments; dispose of certain assets; allow certain restrictions on the ability of our restricted subsidiaries to pay dividends or make other payments to us; engage in certain transactions with affiliates; and consolidate, amalgamate or merge with or into other companies.
Our failure to comply with these covenants could result in an event of default that, if not cured or waived, could result in the acceleration of substantially all of our funded debt. We do not have sufficient working capital to satisfy our debt obligations in the event of an acceleration of all or a significant portion of our outstanding indebtedness.
Risks Related to Our Intellectual Property
We may be unable to adequately protect or enforce our intellectual property rights, which could harm our reputation and adversely affect our growth prospects.
We regard our proprietary technologies and intellectual property as integral to our success. We protect our proprietary technology through a combination of trade secrets, third-party confidentiality and nondisclosure agreements, additional contractual restrictions on disclosure and use, and patent, copyright, and trademark laws.
We are the registered owners of many Internet domain names internationally. As we seek to protect our domain names in an increasing number of jurisdictions, we may not be successful in doing so in certain jurisdictions. Our competitors may adopt trade names or domain names similar to ours, thereby impeding our ability to promote our marketplace and possibly leading to customer confusion. In addition, we could face trade name or trademark or service mark infringement claims brought by owners of other registered or unregistered trademarks or service marks, including trademarks or service marks that may incorporate variations of our brand names. The legal means we use to protect our proprietary technology and intellectual property do not afford complete protection and may not adequately protect our rights or permit us to gain or keep any competitive advantage. We cannot guarantee that: any of our present or future intellectual property rights will not lapse or be invalidated, circumvented, challenged or abandoned; our intellectual property rights will provide competitive advantages to us; our ability to assert our intellectual property rights against potential competitors or to settle current or future disputes will not be limited by our agreements with third parties; any of our pending or future patent applications will be issued or have the coverage originally sought; or our intellectual property rights will be enforced in jurisdictions where competition may be intense or where legal protection may be weak.
We also may allow certain of our registered intellectual property rights, or our pending applications or registrations for intellectual property rights, to lapse or to become abandoned if we determine that obtaining or maintaining the applicable registered intellectual property rights is not worthwhile. Further, although it is our practice to enter into confidentiality agreements and intellectual property assignment agreements with our employees and contractors, these agreements may not be enforceable or may not provide meaningful protection for our trade secrets or other proprietary information in the event of unauthorized use or disclosure or other breaches of the agreements.
Despite our efforts to protect our proprietary rights, unauthorized parties may attempt to copy, reverse engineer, or otherwise obtain and use our products or technology. We cannot be certain that we will be able to prevent unauthorized use of our technology or
infringement or misappropriation of our intellectual property, particularly in foreign countries where the laws may not protect our proprietary rights. Effective patent, copyright, trademark, service mark, trade secret, and domain name protection is time-consuming and expensive to maintain. Litigation may be necessary to enforce our intellectual property rights, to protect our trade secrets, or to determine the validity and scope of the proprietary rights of others, which could result in substantial costs and diversion of our resources. In addition, our efforts may be met with defenses and counterclaims challenging the validity and enforceability of our intellectual property rights or may result in a court determining that our intellectual property rights are unenforceable. If we are unable to cost-effectively protect our intellectual property rights, then our business could be harmed. If competitors are able to use our technology or develop proprietary technology similar to ours or competing technologies, our ability to compete effectively and our growth prospects could be adversely affected.
Risk Related to Our Industry
Competition could result in reductions in our future revenues and profitability.
The global used equipment market, including the auction segment of that market, is highly fragmented. We compete for potential purchasers and sellers of equipment with other auction companies and with non-auction competitors such as equipment manufacturers, distributors and dealers, equipment rental companies, and other online marketplaces. When sourcing equipment to sell at our auctions or other marketplaces, we compete with other onsite and online auction companies, OEM and independent dealers, equipment brokers, other third parties, and equipment owners that have traditionally disposed of equipment in private sales.
Some of our competitors have significantly greater financial and marketing resources and name recognition than we do. New competitors with greater financial and other resources and/or different business models/strategies may enter the equipment auction market in the future. Additionally, existing or future competitors may succeed in entering and establishing successful operations in new geographic markets prior to our entry into those markets. They may also compete against us through internet-based services and other combined service offerings.
If commission rates decline, or if our strategy to compete against our many competitors is not effective, our revenues, market share, financial condition and results of operations may be adversely impacted. We may be susceptible to loss of business if competing selling models become more appealing to customers. If our selling model becomes undesirable or we are not successful in adding services complementary to our existing selling model and business, we may not be successful increasing market penetration over the long-term, which could prevent us from achieving our long-term earnings growth targets.
Decreases in the supply of, demand for, or market values of used equipment, could harm our business.
Our revenues could decrease if there is significant erosion in the supply of, demand for, or market values of used equipment, which could adversely affect our financial condition and results of operations. We have no control over any of the factors that affect the supply of or demand for used equipment and the circumstances that cause market values for equipment to fluctuate including, among other things, economic uncertainty, the global geopolitical climate, disruptions to credit and financial markets, lower commodity prices, and our customers’ restricted access to capital. Recent economic conditions have caused fluctuations in the supply, mix and market values of used equipment available for sale, which has a direct impact on our revenues.
In addition, price competition and the availability of equipment directly affect the supply of, demand for, and market value of used equipment. Climate change initiatives, including significant changes to engine emission standards applicable to equipment, may also adversely affect the supply of demand for our market values of equipment.
Risk Related to Our Organization and Governance
Our articles, by-laws, shareholder rights plan and applicable Canadian provincial and federal law contain provisions that may have the effect of delaying or preventing a change in control.
Certain provisions of our articles of continuance and by-laws, as well as certain provisions of the Business Corporations Act (Ontario) (the “OBCA”) and applicable Canadian securities law, could discourage potential acquisition proposals, delay or prevent a change in control or materially adversely impact the price that certain investors might be willing to pay for our common shares. For instance, our articles of continuance authorize our board of directors to determine the designations, rights and restrictions to be attached to, and to issue an unlimited number of, junior preferred shares and senior preferred shares. In addition, our by-laws contain provisions establishing that shareholders must give advance notice to us in circumstances where nominations of persons for election to our board of directors are made by our shareholders other than pursuant to either a requisition of a meeting made in accordance with the provisions of the OBCA or a shareholder proposal made in accordance with the provisions of the OBCA. Among other things, these advance notice provisions set a deadline by which shareholders must notify us in writing of an intention to nominate directors for
election to the board of directors prior to any shareholder meeting at which directors are to be elected and set forth the information required in this notice for it to be valid.
Our board of directors has adopted a shareholder rights plan (the “Rights Plan”), pursuant to which we issued one right in respect of each common share outstanding. Under the Rights Plan, following a transaction in which any person becomes an “acquiring person” as defined in the Rights Plan, each right will entitle the holder to receive a number of common shares provided in the Rights Plan. The purposes of the Rights Plan are (i) to provide our board of directors time to consider value-enhancing alternatives to a take-over bid and to allow competing bids to emerge; (ii) to ensure that shareholders are provided equal treatment under a take-over bid; and (iii) to give adequate time for shareholders to properly assess a take-over bid without undue pressure. The Rights Plan can potentially impose a significant penalty on any person commencing a takeover bid that would result in the offeror becoming the beneficial owner of 20% or more of our outstanding common shares.
Any of these provisions, as well as certain provisions of the OBCA and applicable Canadian securities law, may discourage a potential acquirer from proposing or completing a transaction that may have otherwise presented a premium to our shareholders.
U.S. civil liabilities may not be enforceable against us, our directors, or our officers.
We are governed by the OBCA and a portion of our business is in Canada. Certain of our directors and officers reside outside of the United States, and all or a substantial portion of their assets, as well as a substantial portion of our assets, are located outside the United States. As a result, it may be difficult for investors to effect service of process within the United States upon us and such directors and officers or to enforce judgments obtained against us or such persons, in U.S. courts, in any action, including actions predicated upon the civil liability provisions of U.S. federal securities laws or any other laws of the United States.
Additionally, rights predicated solely upon civil liability provisions of U.S. federal securities laws or any other laws of the United States may not be enforceable in original actions, or actions to enforce judgments obtained in U.S. courts, brought in Canadian courts, including courts in the Province of British Columbia.
We are governed by the corporate laws of Ontario, Canada which in some cases have a different effect on shareholders than the corporate laws of Delaware.
We are governed by the OBCA and other relevant laws, which may affect the rights of shareholders differently than those of a company governed by the laws of a U.S. jurisdiction, and may, together with our charter documents, have the effect of delaying, deferring or discouraging another party from acquiring control of our company by means of a tender offer, a proxy contest or otherwise, or may affect the price an acquiring party would be willing to offer in such an instance.
ITEM 1B: UNRESOLVED STAFF COMMENTS
Not applicable.
ITEM 1C: CYBERSECURITY
Risk Management & Strategy
RB Global recognizes the critical importance of assessing, identifying and managing material risks to our business associated with cybersecurity threats and incidents. Cybersecurity risks are identified through various means, including internal assessments of IT initiatives and systems, cybersecurity assessments of third party providers, penetration testing using third party tools and techniques to test technical controls, vulnerability identification and management procedures, and monitoring emerging threat intelligence, as well as emerging laws and regulations. Our strategy to manage cybersecurity risk prioritizes threat prevention, as well as resiliency through established defense, detection and response mechanisms and processes. These mechanisms and processes include risk-based technical security controls, policy enforcement mechanisms, alert monitoring and other security tools (such as our security incident event management platform, which provides a centralized view of all alerts within our information systems environment), incident tracking and management (for both internal events and those reported by third party providers), employee training, and contractual arrangements with third parties that provide cybersecurity risk management services. Through these processes, we regularly monitor the efficacy of our protection, detection and response mechanisms to cybersecurity threats and implement changes as appropriate. Key metrics in relation to such monitoring include detection and remediation of incidents, vulnerability reporting and patching, detecting and takedowns relating to digital fraud, and outcomes of our phishing simulations. We continue to integrate our cybersecurity practices into our Enterprise Risk Management program, overseen by the Enterprise Risk Management Committee, which identifies and tracks cyber-related business and compliance risks across the Company and helps prioritize related activity for the internal audit team.
Additionally, management has established two cross-functional committees made up of appropriate personnel throughout the Company, the Data Privacy Committee ("DPC") and the Security Steering Committee ("SSC"), to frame, review and guide our processes. The SSC is comprised of our Chief Technology Officer ("CTO"), our Chief Information Security Officer ("CISO"), and other IT leaders, as well as representatives from Risk Management, Product Management, Human Resources and Legal. The DPC is responsible for developing strategies and policies relating to data privacy and protection and the SSC provides a forum for engaging stakeholders on security and risk reduction initiatives, setting security policies and assessing the effectiveness of Company efforts to monitor, prevent, prevent, and remediate security threats and incidents.
We maintain a comprehensive security program that includes physical, administrative and technical safeguards designed to prevent and timely and appropriately respond to cybersecurity threats or incidents. We have in the past, and may in the future, also engage third party consultants to assist in assessing, benchmarking, implementing, monitoring and enhancing our security program. We also continue to invest in dedicated information security resources and technology to strengthen our programs and controls around people and processes. In the event of a cybersecurity incident, we have established an incident response and breach management process led by our CISO with the support of leaders from our legal, operations, and risk management departments. We have retainers with experienced breach coaches in multiple jurisdictions that have been pre-approved by our insurers and a reputable third-party incident response provider on call as necessary. Cybersecurity incidents, once identified, are evaluated, ranked by severity and prioritized for response and remediation. Incidents are evaluated to determine materiality, as well as operational, business and privacy impact.
Recognizing that our employees are a crucial line of defense against cybersecurity threats, RB Global conducts mandatory onboarding and annual security awareness training. We also designate October as Cybersecurity Awareness Month and emphasize through various information campaigns the importance of data and systems security and privacy. Additionally, we deploy phishing simulations to provide “experiential learning” on how to recognize phishing attempts and we measure the effectiveness of our training.
We are not aware of having experienced, directly or through our third-party providers, any risks from cybersecurity threats or incidents through the date of this Report that have materially affected the Company, its business strategy, results of operations or financial condition, or are reasonably likely to have such an effect. This does not guarantee that future incidents or threats will not have a material impact, or that we or our third-party providers are not currently the subject of an undetected incident or threat that may have such an impact. For more information on our cybersecurity related risks, see Item 1A Risk Factors of this Annual Report on Form 10-K.
Governance
The Board of Directors and management are actively involved and play an important part in the oversight of cybersecurity threats and incidents. Our Audit Committee reviews the Company’s cybersecurity strategy and readiness at least annually and receives a quarterly, or more often as needed, briefing from our Chief Technology Officer ("CTO") and CISO on cybersecurity matters and key performance indicators relating to the security program. The Audit Committee briefs the full Board of Directors on cybersecurity, and where necessary, management is available to provide further insight into such matters or other related cybersecurity matters. The Global Internal Audit department, which reports to the Audit Committee, annually tests the design and operating effectiveness of certain cybersecurity-related processes. Our Board members also engage in ad hoc conversations with management on cybersecurity-related news events and discuss any updates to our cybersecurity risk management and strategy processes as needed. Visibility and transparency regarding our cybersecurity program and cybersecurity threats and incidents provides the Board with the foundation for oversight over the Company's security operations, program status and cybersecurity risk management.
At the management level, our cybersecurity risk management and strategy processes are overseen by the Company's CTO, CISO and VP, Global Internal Audit and Enterprise Risk Management with ongoing feedback and risk reduction initiative support from the SSC. The committee generally meets quarterly to discuss operational cybersecurity risks and associated remediation efforts. The Company's CTO and CISO each have substantial work experience in roles involving IT, including security, network management, application and systems engineering and architecture. Our CTO has served in various roles in IT for more than 20 years, including most recently serving as the Sr. Vice President of Product Engineering from 2021 to 2023, and VP, Digital from 2020 to 2021 at a large public retail company where she played a leading role in the retailer's technology transformation. She holds an undergraduate degree in industrial engineering. The Company's CISO has served in various roles in IT and information security for more than 20 years across a number of industries, including financial and investment management, human resources consulting, and consumer data intelligence. Most recently, in addition to his role as the Company's CISO, he served as our VP, Information Technology since 2017. Over the past 5 years, he has sat on various industry CISO advisory boards and currently sits on two advisory boards for companies transforming security operations through artificial intelligence and enriched security data management solutions. He also holds an undergraduate diploma in computer systems networking and telecommunications and several certifications, including a certification in computer hacking forensic investigation. Our VP, Global Internal Audit and Enterprise Risk Management has 25 years of experience in auditing internal controls and risk management. Most recently, he served as IAA's VP, Internal Audit since 2022 up until the Company's acquisition of IAA and as Global Director, Finance & Internal Controls from 2020 to 2022 of a large medical waste disposal and
secure information destruction business. He holds an undergraduate degree in accounting and information systems and several designations, including a certification in risk management assurance. These individuals remain informed about, and monitor the prevention, mitigation, detection and remediation of cybersecurity threats and incidents through their leadership of the cybersecurity risk management and strategy processes and management committees described above.
ITEM 2: PROPERTIES
We own and lease various properties globally, primarily in the United States, Canada, Australia, and Europe, including in the United Kingdom. We use the properties for our operations, primarily as auction sites, branches and for storage, as well as for administrative offices, which support our various businesses and brands.
We are headquartered in Westchester, Illinois, United States, which is held through a lease until 2027. We also lease other administrative offices primarily in the United States, Canada, and the Netherlands. In total, we lease over 1 million square feet of administrative office space around the world.
We have operating locations in 50 large metropolitan areas in the United States and Canada, in all 50 states in the United States and in 9 out of the 13 Canadian provinces and territories. The close proximity of our locations to large metropolitan areas benefits our sellers who prefer to drop off their assets at our auction sites, where we offer care, custody and control, as well as our buyers who prefer to physically inspect an asset prior to bidding. Our wide network of auction sites and their proximity to major cities further allows us to respond quickly during catastrophic events, and deliver on our commitments to insurance companies, while reducing our incremental costs. To support our partners, customers and operations during catastrophic events, we also hold agreements that give us the option to lease and use certain properties totaling approximately 2,000 acres within certain timeframes, as necessary.
The table below sets forth a summary of our owned and leased properties for operations, by region and acreage, at December 31, 2024:
| | | | | | | | | | | | | | | | | | | | |
| Location | | Number of Locations | | Owned Acreage | | Leased Acreage |
| United States | | 246 | | | 3,704 | | | 7,377 | |
| Canada | | 30 | | | 884 | | | 539 | |
| International | | 35 | | | 788 | | | 248 | |
| Total | | 311 | | 5,376 | | 8,164 |
During 2024, primarily in our automotive sector, we opened 5 new operating locations in the United States and Canada and expanded some of our existing locations to support additional operating activities. Additionally, we converted 13 previously leased properties to owned properties, primarily through lease buyouts.
To support our GovPlanet operations, we also lease two warehouses in addition to the above.
We regularly evaluate our capacity in all markets to ensure our administrative offices and operating facilities continue to meet our varied and extensive needs and allow us to conduct our operations to the best of our abilities. Where appropriate, we will increase our capacity through the acquisition of additional land and facilities, either through purchase or lease.
ITEM 3: LEGAL PROCEEDINGS
We have no material legal proceedings pending, other than ordinary routine litigation incidental to the business, and we do not know of any material proceedings contemplated by governmental authorities.
ITEM 4: MINE SAFETY DISCLOSURES
Not applicable.
PART II
ITEM 5: MARKET FOR REGISTRANT’S COMMON EQUITY, RELATED STOCKHOLDER MATTERS, AND ISSUER PURCHASES OF EQUITY SECURITIES
Outstanding Share Data
We are a public company and our common shares are listed under the symbol “RBA” on the New York Stock Exchange (“NYSE”) and the Toronto Stock Exchange (“TSX”). The Series A Senior Preferred Shares of the Company are not listed on any exchange and there is no established public trading market for the Series A Senior Preferred Shares. Holders of the Series A Senior Preferred Shares are entitled to vote together with the common shares on an as-converted basis on all matters permitted by applicable law, subject to certain exceptions to enable compliance with applicable antitrust law. As of February 26, 2025, each holder of Series A Senior Preferred Shares would be entitled to 0.0139696 vote per Series A Senior Preferred Share held. Series A Senior Preferred Shares represent, as of February 26, 2025, 6,775,252 votes, which is the number of common shares into which the Series A Senior Preferred Shares could be converted as of February 26, 2025. Such number of votes represents approximately 3.5% of the voting rights attached to the Company’s securities as of February 26, 2025.
In the event of a take-over bid for the common shares, a holder of Series A Senior Preferred Shares may participate in such take-over bid by exercising the conversion rights attached to such Series A Senior Preferred Shares. Each outstanding Series A Senior Preferred Share shall be convertible into common shares at the option of the holder, subject to the terms and conditions contained in the articles of the Company. Under certain circumstances prescribed under the articles of the Company, a holder of Series A Senior Preferred Shares may also have the right to require the Company to redeem all or any portion of such holder’s Series A Senior Preferred Shares for cash in the event of a take-over bid.
Financial information about our equity and share-based payments is set forth in our consolidated financial statements in "Part II, Item 8: Financial Statements and Supplementary Data - Note 23 Temporary Equity, Stockholders' Equity and Dividends and Item 8: Financial Statements and Supplementary Data - Note 24 Share-based Payments" of this Annual Report on Form 10-K.
Market Information
Our common shares, without par value, are issued in registered form. The transfer agent for the shares is Computershare Trust Company of Canada, 100 University Avenue, 9th Floor, Toronto, Ontario M5J 2Y1. Our common shares trade on the NYSE and on the TSX under the symbol “RBA.” On February 25, 2025, there were 1,130 holders of record of our common shares that do not include the shareholders for whom shares are held in a nominee or street name.
Dividend Policy
We currently pay a regular quarterly cash dividend of $0.29 per common share. We intend to continue to declare and pay a regular quarterly cash dividend on our common shares; however, any decision to declare and pay dividends in the future will be made at the discretion of our Board of Directors, after considering our operating results, financial condition, cash requirements, financing agreement restrictions and any other factors our Board of Directors may deem relevant.
Because RB Global Inc. is a holding company with no material assets other than the shares of its subsidiaries, our ability to pay dividends on our common shares depends on the income and cash flow of our subsidiaries. No financing agreements to which our subsidiaries are party currently restrict those subsidiaries from paying dividends.
Pursuant to income tax legislation, Canadian resident individuals who receive “eligible dividends” in 2006 and subsequent years will be entitled to an enhanced gross-up and dividend tax credit on such dividends. All dividends that we pay are “eligible dividends” unless indicated otherwise.
Comparison of Cumulative Return
The following graph compares the cumulative return on a $100 investment in our common shares over the last five fiscal years beginning December 31, 2019 through December 31, 2024, to that of the cumulative return on a $100 investment in the Russell Global Index (“Russell 2000”), the S&P / TSX Composite Index (“S&P/TSX”) and the Dow Jones Industrial Average Index (“DJIA”) for the same period. In calculating the cumulative return, reinvestment of dividends, if any, is assumed. The indices are included for comparative purpose only. This graph is not “soliciting material,” is not deemed filed with the SEC and is not to be incorporated by reference in any of our filings under the Securities Act or the Exchange Act, whether made before or after the date hereof and irrespective of any general incorporation language in any such filing.
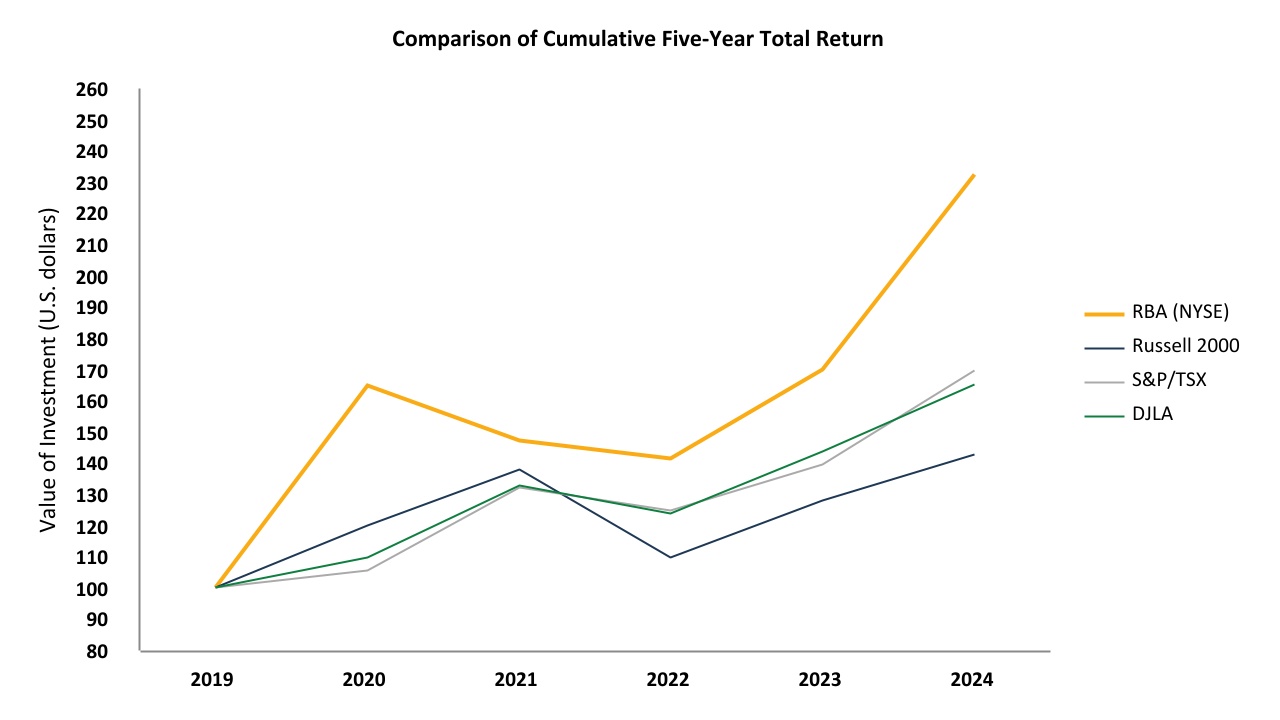
| | | | | | | | | | | | | | | | | | | | | | | | | | | | | | | | | | | | | | |
| Company / index | | 2019 | | 2020 | | 2021 | | 2022 | | 2023 | | 2024 |
| RBA (NYSE) | | $ | 100.0 | | | $ | 164.6 | | | $ | 147.1 | | | $ | 141.4 | | | $ | 169.9 | | | $ | 232.3 | |
| Russell 2000 | | $ | 100.0 | | | $ | 119.9 | | | $ | 137.7 | | | $ | 109.5 | | | $ | 128.0 | | | $ | 142.7 | |
| S&P/TSX | | $ | 100.0 | | | $ | 105.6 | | | $ | 132.2 | | | $ | 124.6 | | | $ | 139.3 | | | $ | 169.5 | |
| DJIA | | $ | 100.0 | | | $ | 109.7 | | | $ | 132.7 | | | $ | 123.6 | | | $ | 143.6 | | | $ | 165.1 | |
Securities Authorized for Issuance under Equity Compensation Plans
The following table sets forth information about the Company’s equity compensation plans at December 31, 2024.
| | | | | | | | | | | | | | | | | | | | | | | |
| Plan Category | | Number of securities to be issued
upon exercise of options,
warrants and rights
(a) | | Weighted average exercise
price of outstanding options,
warrants and rights
(b) | | Number of securities remaining
available for future issuance under
equity compensation plans (excluding
securities reflected in column (a))
(c) | |
| Equity compensation plans approved by security holders | | 3,370,692 | (1) | $ | 64.49 | | (2) | 10,265,156 | (3) |
| Equity compensation plans not approved by security holders | | — | | — | | | — | |
| Total | | 3,370,692 | | $ | 64.49 | | | 10,265,156 | |
_____________________________________________________
(1)Reflects our 2023 Share Incentive Plan, which was approved by the Company's shareholders on May 8, 2023, as well as equity awards granted under our previous plans until expiration or settlement. This amount reflects 100% of target numbers of PSUs granted and includes dividend equivalent rights credited in connection with such PSUs. Under the Plan, the number of PSUs that vest is conditional upon specified market, service, and/or performance vesting conditions being met. For the August 2023 and March 2024 PSUs with market conditions, the market vesting condition is based on the total stockholder return performance of the Company relative to the performance of the Russell 3000 index members at the date of grant. The August 2023 and March 2024 PSUs with market conditions can result in participants earning between 0% and 200% of the target number granted. Share units granted under our Plan with no market vesting conditions are based on the achievement of specific performance measures and can result in participants earning between 0% and 200% of the target number of PSUs granted. Further, we have the option to choose whether to settle these PSUs without market vesting conditions in cash or in shares. For further discussion on the PSUs granted under our Plans, refer to "Part II, Item 8: Financial Statements and Supplementary Data - Note 24 Share-based Payments."
(2)Weighted average exercise price does not include the effect of our outstanding share units.
(3)Consists of 7,958,801 common shares available for issuance under the 2023 Share Incentive Plan and 2,306,355 common shares available for issuance under the 2023 ESPP.
Exchange Controls
Canada has no system of exchange controls. There are no Canadian restrictions on the repatriation of capital or earnings of a Canadian public company to non-resident investors. There are no laws in Canada or exchange restrictions affecting the remittance of dividends and other payments to U.S. Resident Holders (as defined below) of our common shares, other than withholding tax.
There are no limitations under the laws of Canada or in our organizational documents on the right of foreigners to hold or vote our common shares, except that the Investment Canada Act may require review and approval by the Minister of Industry (Canada) of certain acquisitions of control of RB Global by a “non-Canadian”. “Non-Canadian” generally means an individual who is not a Canadian citizen, or a corporation, partnership, trust or joint venture that is ultimately controlled by non-Canadians.
Certain Canadian Federal Income Tax Considerations for U.S. Residents
The following summarizes certain Canadian federal income tax consequences generally applicable under the Income Tax Act (Canada) and the regulations promulgated thereunder (collectively, the “Canadian Tax Act”) and the Canada-U.S. Income Tax Convention (1980) (the “Convention”) to the holding and disposition of common shares by a U.S. Resident Holder (as defined below).
This summary is restricted to beneficial owners of common shares each of whom, at all relevant times for the purposes of the Canadian Tax Act and the Convention, (i) is resident solely in the U.S., (ii) is entitled to the full benefits of the Convention, (iii) holds all common shares as capital property, (iv) deals at arm’s length with and is not affiliated with RB Global, (v) does not and is not deemed to use or hold any common shares in a business carried on in Canada, and (vi) is not an "authorized foreign bank" (as defined in the Canadian Tax Act) or an insurer that carries on business in Canada and elsewhere (each such holder, a “U.S. Resident Holder”).
Certain U.S.-resident entities that are fiscally transparent for U.S. federal income tax purposes (including limited liability companies) may not be regarded by the CRA as entitled to the benefits of the Convention. Members of or holders of an interest in such an entity that holds common shares should consult their own tax advisers regarding the extent, if any, to which the CRA will extend the benefits of the Convention in respect of common shares held by such entity.
Generally, a U.S. Resident Holder’s common shares will be considered to be capital property of a U.S. Resident Holder provided that the U.S. Resident Holder does not acquire, hold or dispose of the common shares in one or more transactions considered to be an adventure or concern in the nature of trade and does not hold the common shares in the course of carrying on a business.
This summary is based on the provisions of the Canadian Tax Act and the Convention in effect on the date hereof, all specific proposals to amend the Canadian Tax Act and Convention publicly announced by or on behalf of the Minister of Finance (Canada) on or before the date hereof (the “Tax Proposals”), and the current published administrative policies of the CRA. It is assumed that the Tax Proposals will be enacted as currently proposed, and that there will be no other change to any applicable law or the CRA's administrative policies, whether by judicial, legislative, governmental or administrative decision or action, although no assurance can be given in these respects. Except as otherwise expressly provided, this summary does not take into account any provincial, territorial or foreign tax considerations, which may differ materially from those set out herein.
This summary is of a general nature only and it is not intended to be, nor should it be construed to be, legal or tax advice to any holder of common shares, and no representation with respect to Canadian federal income tax consequences to any holder of common shares is made herein. Accordingly, holders of common shares should consult their own tax advisers with respect to their individual circumstances.
Disposition of Common Shares
A U.S. Resident Holder will not be subject to tax under the Canadian Tax Act in respect of any capital gain realized by such U.S. Resident Holder on a disposition of common shares unless the common shares constitute “taxable Canadian property” (within the meaning of the Canadian Tax Act) of the U.S. Resident Holder at the time of disposition and the U.S. Resident Holder is not entitled under the Convention to an exemption from Canadian tax on the gain.
Generally, a U.S. Resident Holder’s common share will not constitute “taxable Canadian property” of the U.S. Resident Holder at the time of disposition provided that such share is listed on a “designated stock exchange” for purposes of the Canadian Tax Act (which currently includes the TSX and NYSE) unless at any time during the 60-month period immediately preceding the disposition both of the following conditions are true:
(i)the U.S. Resident Holder, any one or more persons with whom the U.S. Resident Holder does not deal at arm’s length, or any partnership in which the U.S. Resident Holder or persons with whom the U.S. Resident Holder did not deal at arm’s length holds a membership interest directly or indirectly through one or more partnerships, alone or in any combination, owned 25% or more of the issued shares of any class or series of our share capital; and
(ii)more than 50% of the fair market value of such common share was derived directly or indirectly from, or from any combination of, real or immovable property situated in Canada, “Canadian resource properties” (as defined in the Canadian Tax Act), “timber resource properties” (as defined in the Canadian Tax Act), or options in respect of, interests in or civil law rights in, such properties, whether or not such properties exist.
In certain circumstances set out in the Canadian Tax Act, a common share may be deemed to be “taxable Canadian property” for purposes of the Canadian Tax Act.
Even if the common shares constitute “taxable Canadian property” to a U.S. Resident Holder, under the Convention, such a U.S. Resident Holder will not be subject to tax under the Canadian Tax Act on any capital gain realized by such holder on a disposition of such common shares, provided the value of such common shares is not derived principally from real property situated in Canada (within the meaning of the Convention).
U.S. Resident Holders whose common shares may be taxable Canadian property should consult their own tax advisers
Dividends on Common Shares
Dividends paid or credited, or deemed to be paid or credited, on common shares to a U.S. Resident Holder will generally be subject to Canadian withholding tax. Under the Canadian Tax Act, the rate of withholding tax is 25% of the gross amount of such dividends, which rate may be subject to reduction under the provisions of an applicable income tax treaty or convention. Under the Convention, a U.S. Resident Holder who is a beneficial owner of a dividend will generally be subject to Canadian withholding tax at the rate of 15% of the gross amount of such dividend, unless the beneficial owner is a company which owns (or is deemed under the Convention to own) at least 10% of the voting shares of RB Global at that time, in which case the rate of Canadian withholding tax is generally reduced to 5%.
ITEM 6: [RESERVED]
ITEM 7: MANAGEMENT’S DISCUSSION AND ANALYSIS OF FINANCIAL CONDITION AND RESULTS OF OPERATIONS
This section of the Form 10-K generally discusses 2024 and 2023 items and year-to-year comparisons between 2024 and 2023. Discussions of 2022 items and year-to-year comparisons between 2023 and 2022 that are not included in this Form 10-K can be found in “Part II, Item 7: Management’s Discussion and Analysis of Financial Condition and Results of Operations” of the Company’s Annual Report on Form 10-K for the fiscal year ended December 31, 2023. This discussion and analysis should be read in conjunction with the “Cautionary Note Regarding Forward-Looking Statements” and the consolidated financial statements and the notes thereto included in “Part II, Item 8. Financial Statements and Supplementary Data” presented in this Annual Report on Form 10-K. This discussion and analysis contains forward-looking statements that involve risks and uncertainties.
Our actual results could differ materially from those expressed or implied in any forward-looking statements due to various factors, including those set forth under “Part I, Item 1A: Risk Factors” in this Annual Report on Form 10-K.
We prepare our consolidated financial statements in accordance with U.S. generally accepted accounting principles (“US GAAP”). Except for Gross Transaction Value ("GTV"), which is a measure of operational performance and not a measure of financial performance, liquidity, or revenue, the amounts discussed below are based on our consolidated financial statements. Unless indicated otherwise, all tabular dollar amounts, including related footnotes, presented below are expressed in millions of United States (“U.S.”) dollars.
In the accompanying analysis of financial information, we sometimes use information derived from consolidated financial data but not presented in our consolidated financial statements prepared in accordance with US GAAP. Certain of these data are considered “non-GAAP financial measures” under the SEC rules. The definitions and reasons we use these non-GAAP financial measures and the reconciliations to their most directly comparable US GAAP financial measures are included either with the first use thereof or in the “Non-GAAP Measures” section within “Part II, Item 7: Management’s Discussion and Analysis of Financial Condition and Results of Operations.”
Overview
Established in 1958, RB Global, Inc. (NYSE and TSX: RBA) is a leading global marketplace that connects sellers and buyers of commercial assets and vehicles. Through our omnichannel platform, we facilitate transactions for customers primarily in our commercial, construction and transportation ("CC&T") and automotive sectors. We also provide our customers value-added marketplace services, technology solutions for vehicle merchandising, platforms for lifecycle management of assets, and a market data intelligence platform to help customers make more informed business decisions.
Our marketplace brands include Ritchie Bros., the world's largest auctioneer of commercial assets and vehicles offering online bidding, and IAA, Inc. ("IAA"), a leading global digital marketplace connecting vehicle buyers and sellers. Our portfolio of brands also includes Rouse Services ("Rouse"), which provides a complete end-to-end asset management, data-driven intelligence and performance benchmarking system; SmartEquip Inc. ("SmartEquip"), an innovative technology platform that supports customers' management of the equipment lifecycle and integrates parts procurement with both OEMs and dealers; and VeriTread LLC ("VeriTread"), an online marketplace for heavy haul transport.
Our CC&T sector includes heavy equipment such as excavators, dozers, lift and material handling, vocational and commercial trucks and trailers. Our automotive sector includes all consumer automotive vehicles. The other sector primarily includes assets and equipment in the agricultural, forestry and energy industries, government surplus assets, smaller consumer recreational transportation items and parts sold in our vehicle dismantling business. All sectors include salvage and non-salvage transactions.
Our customers primarily include automotive insurance companies, as well as end users, dealers, fleet owners, and original equipment manufacturers (“OEMs”) of commercial assets and vehicles. We also serve customers in the agriculture, energy, and natural resources sectors, as well as government entities.
We have a global presence, primarily with operations in the United States, Canada, Australia and across Europe, and employ more than 7,800 full-time employees worldwide, of which approximately 67% are located in the United States.
Key Operating Metrics
We regularly review a number of metrics, including the following key operating metrics, to evaluate our business, measure our performance, identify trends affecting our business, and make operating decisions. We believe these key operating metrics are useful to investors because management uses these metrics to assess the growth of our business and the effectiveness of our operational strategies.
We define our key operating metrics as follows:
GTV: Represents total proceeds from all items sold on our auctions and online marketplaces, third-party online marketplaces, private brokerage services and other disposition channels. GTV is not a measure of financial performance, liquidity, or revenue, and is not presented in the Company’s consolidated financial statements.
Inventory return: Inventory sales revenue less cost of inventory sold.
Inventory rate: Inventory return divided by inventory sales revenue.
Total lots sold: A single asset to be sold, or a group of assets bundled for sale as one unit. Low value assets are sometimes bundled into a single lot, collectively referred to as “small value lots.”
Historically, we presented GTV from the sale of parts in our vehicle dismantling business within our automotive sector and excluded the number of parts sold from our total lots sold metric. Commencing in the second quarter of 2024, management began to review the number of parts sold in our vehicle dismantling business within our other sector and as part of our total lots sold metric.
Performance Overview and Consolidated Results
For the year ended December 31, 2024, as compared to the year ended December 31, 2023:
•Total GTV increased 14% to $15.9 billion.
•Total revenue increased 16% to $4.3 billion.
◦Service revenue increased 23% to $3.4 billion.
◦Inventory sales revenue decreased 3% to $920.6 million.
•Net income increased 100% to $412.8 million.
•Net income available to common stockholders increased 113% to $372.7 million.
•Diluted earnings per share (“EPS”) available to stockholders increased 93% to $2.01 per share.
•Diluted adjusted EPS available to stockholders increased 17% to $3.49 per share.
•Adjusted earnings before interest, taxes, depreciation and amortization (“EBITDA”) increased 26% to $1.3 billion.
Operational Highlights
During 2024, we saw several changes in our executive leadership team. Eric J Guerin was appointed Chief Financial Officer, effective January 15, 2024. Eric J. Guerin brings extensive senior executive financial leadership experience, most recently serving as the Chief Financial Officer at a leading distributor of packaging, facility solutions and print products. Nancy King was appointed Chief Technology Officer, effective June 3, 2024, and brings extensive hands-on information technology leadership experience from her roles at multiple Fortune 100 organizations. Steve Lewis was appointed Chief Operating Officer, effective September 3, 2024, and brings extensive senior leadership experience in operations and supply chain management, as well as a honed approach to driving business growth through operational excellence.
Below are some other notable operational highlights during 2024:
•RB Global had strong operating results and growth, resulting in a 14% year-over-year increase in total GTV and 16% year-over year increase in total revenues.
•Through our continuous improvement program, we consistently delivered exceptional performance, as measured against our service level agreements, to our automotive insurance company customers. We also drove industry leading average selling prices for our partners, enabled by investment in technology and attracting record-high engagement from international buyers. These advancements and ongoing transparency initiatives have reinforced our leadership in salvage vehicles, resulting in significant partnership wins in the United States and in Australia.
•On October 31, 2024, the Company completed the acquisition of Boom & Bucket, Inc ("Boom & Bucket"), a digital fixed price marketplace to add to our portfolio of selling solutions, serving the construction equipment industry. We believe that Boom & Bucket's technology, talent and market capabilities offer an exciting complement to our full-service disposition portfolio.
•In 2024, we continued to invest in the development of our technology, particularly in a new digital payments platform that replaces outdated manual processes and legacy technology with a modern financial backbone to offer our buyers and partners increased choice in our services, including self-serve access to critical financial tools, and provide our buyers and sellers the best in-class experience.
•In January 2024, we enhanced IAA's merchandising services to provide more accurate VIN decoding to our customers and improve the overall customer experience for all users, buyers and sellers, by providing more comprehensive data. Buyers of vehicles are now able to search for specific makes, models, and trims of vehicles with more confidence due to more data, configuration rules and industry-leading data-engineering capabilities.
•During the year, in our automotive sector, we continued to expand our international customer base with new market alliances in Oman in the Middle East and in Lithuania in Eastern Europe. These market alliances will help us connect with a base of new buyers and broaden our market share.
Results of Operations
| | | | | | | | | | | | | | | | | | | | | | | | | | | | | | | | |
| | Year ended December 31, |
| | | | | | | | % Change |
| (in U.S. dollars in millions, except percentages) | | 2024 | | 2023 | | 2022 | | 2024 over 2023 | | 2023 over 2022 |
| Service revenue | | $ | 3,363.6 | | | $ | 2,732.5 | | | $ | 1,050.6 | | | 23 | % | | 160 | % |
| Inventory sales revenue | | 920.6 | | | 947.1 | | | 683.2 | | | (3) | % | | 39 | % |
| Total revenue | | 4,284.2 | | | 3,679.6 | | | 1,733.8 | | | 16 | % | | 112 | % |
| Costs of services | | 1,415.7 | | | 1,007.6 | | | 168.1 | | | 41 | % | | 499 | % |
| Cost of inventory sold | | 863.8 | | | 893.6 | | | 608.6 | | | (3) | % | | 47 | % |
| Selling, general and administrative | | 773.9 | | | 743.7 | | | 539.9 | | | 4 | % | | 38 | % |
| Acquisition-related and integration costs | | 29.0 | | | 216.1 | | | 37.3 | | | (87) | % | | 479 | % |
| Depreciation and amortization | | 444.4 | | | 352.2 | | | 97.2 | | | 26 | % | | 262 | % |
| Total operating expenses | | 3,526.8 | | | 3,213.2 | | | 1,451.1 | | | 10 | % | | 121 | % |
| Gain on disposition of property, plant and equipment | | 3.8 | | | 4.9 | | | 170.8 | | | (22) | % | | (97) | % |
Operating income1 | | 761.2 | | | 471.3 | | | 453.5 | | | 62 | % | | 4 | % |
| Net income | | 412.8 | | | 206.0 | | | 319.8 | | | 100 | % | | (36) | % |
| Net income available to common stockholders | | 372.7 | | | 174.9 | | | 319.7 | | | 113 | % | | (45) | % |
| Effective tax rate | | 25.0 | % | | 27.1 | % | | 21.2 | % | | (210)bps | | 590bps |
| | | | | | | | | | |
| Total GTV | | $ | 15,904.8 | | | $ | 13,930.6 | | | $ | 6,025.9 | | | 14 | % | | 131 | % |
| Service GTV | | 14,984.2 | | | 12,983.5 | | | 5,342.7 | | | 15 | % | | 143 | % |
| Inventory GTV | | 920.6 | | | 947.1 | | | 683.2 | | | (3) | % | | 39 | % |
| | | | | | | | | | |
| Inventory return | | $ | 56.8 | | | $ | 53.5 | | | $ | 74.6 | | | 6 | % | | (28) | % |
| Inventory rate | | 6.2 | % | | 5.6 | % | | 10.9 | % | | 60bps | | (530)bps |
1 Foreign exchange gain (loss) for the year ended 2022 has been reclassified from operating income to a separate line below operating income.
Total GTV
Total GTV increased 14% to $15.9 billion in 2024 as compared to $13.9 billion in 2023.
The following summarizes our total GTV by geography and by sector for the periods indicated:
| | | | | | | | | | | | | | | | | | | | | | | | | | | | | | | | | | | | | | | | |
| | Year ended December 31, | | | | | | | | |
| | | | | | | | % Change | | | | | | | | |
| (in U.S. dollars in millions, except percentages) | | 2024 | | 2023 | | 2022 | | 2024 over 2023 | | 2023 over 2022 | | | | | | | | |
| United States | | $ | 11,966.4 | | | $ | 10,266.1 | | | $ | 3,432.4 | | | 17 | % | | 199 | % | | | | | | | | |
| Canada | | 2,688.1 | | | 2,460.8 | | | 1,707.1 | | | 9 | % | | 44 | % | | | | | | | | |
| International | | 1,250.3 | | | 1,203.7 | | | 886.4 | | | 4 | % | | 36 | % | | | | | | | | |
| Total GTV | | $ | 15,904.8 | | | $ | 13,930.6 | | | $ | 6,025.9 | | | 14 | % | | 131 | % | | | | | | | | |
| | | | | | | | | | | | | | | | | | | | | | | | | | | | | | | | |
| | Year ended December 31, |
| | | | | | | | % Change |
| (in U.S. dollars in millions, except percentages) | | 2024 | | 2023 | | 2022 | | 2024 over 2023 | | 2023 over 2022 |
| Automotive | | $ | 8,277.6 | | | $ | 6,531.2 | | | $ | 186.0 | | | 27 | % | | 3,411 | % |
| CC&T | | 5,805.8 | | | 5,446.5 | | | 4,252.9 | | | 7 | % | | 28 | % |
| Other | | 1,821.4 | | | 1,952.9 | | | 1,587.0 | | | (7) | % | | 23 | % |
| Total GTV | | $ | 15,904.8 | | | $ | 13,930.6 | | | $ | 6,025.9 | | | 14 | % | | 131 | % |
The following table illustrates the breakdown of total lots sold by sector for the periods indicated:
| | | | | | | | | | | | | | | | | | | | | | | | | | | | | | | | |
| | Year ended December 31, |
| | | | | | | | % Change |
| (in '000's of lots sold, except percentages) | | 2024 | | 2023 | | 2022 | | 2024 over 2023 | | 2023 over 2022 |
| Automotive | | 2,297.2 | | | 1,788.4 | | | 21.0 | | | 28 | % | | 8,416 | % |
| CC&T | | 432.3 | | | 314.5 | | | 181.5 | | | 37 | % | | 73 | % |
| Other | | 617.3 | | | 591.1 | | | 415.3 | | | 4 | % | | 42 | % |
| Total Lots Sold | | 3,346.8 | | | 2,694.0 | | | 617.8 | | | 24 | % | | 336 | % |
In 2024, total GTV and lots sold increased primarily due to the full quarter inclusion of IAA in the first quarter of 2024, compared to the 11-day stub period in the first quarter of 2023. Excluding this impact, GTV remained primarily flat year over year. We saw higher GTV volumes from catastrophic events in our automotive sector, and higher GTV in our CC&T sector driven by higher lot volumes from our strategic accounts, primarily from a large consignor contract in transportation. These increases were primarily offset by unfavorable asset mix as well as price declines, predominantly observed within our CC&T and other sectors, and lower volumes from a shift in assignment volumes from a customer in our automotive sector.
Total Revenue
Total revenue increased 16% to $4.3 billion in 2024 as compared to 2023, with total service revenue increasing by 23% and partially offset by a 3% decrease in inventory sales revenue.
Service Revenue
The following table summarizes key components of total service revenue for the periods indicated:
| | | | | | | | | | | | | | | | | | | | | | | | | | | | | | | | |
| | Year ended December 31, |
| | | | | | | | % Change |
| (in U.S. dollars in millions, except percentages) | | 2024 | | 2023 | | 2022 | | 2024 over 2023 | | 2023 over 2022 |
| Transactional seller revenue | | $ | 939.4 | | | $ | 851.7 | | | $ | 514.6 | | | 10 | % | | 66 | % |
| Transactional buyer revenue | | 2,067.1 | | | 1,593.2 | | | 330.6 | | | 30 | % | | 382 | % |
| Marketplace services revenue | | 357.1 | | | 287.6 | | | 205.4 | | | 24 | % | | 40 | % |
| Total service revenue | | $ | 3,363.6 | | | $ | 2,732.5 | | | $ | 1,050.6 | | | 23 | % | | 160 | % |
In the third quarter of 2024, we updated our presentation of disaggregated revenue to align to how management evaluates its financial and business performance. As a result, transactional seller revenue now includes commissions, pre-negotiated or fixed, as well as certain auction-related fees earned from sellers to complete the sale of an asset, such as towing to our yards, liens search, title processing and online listing and inspection fees. Transactional buyer revenue now includes buyer transaction fees based on a tiered structure earned from purchasers upon purchase of an asset, as well as other auction-related fees earned from buyers to complete the purchase of an asset, such as title processing, late-pick up, salvage buyer platform registration and other administrative processing charges. Accordingly, certain auction-related fees were reclassified from marketplace services revenue to transactional seller or transactional buyer revenue, and prior period disaggregation of revenue amounts have been recast to conform with current period presentation.
In 2024, total service revenue increased 23%, with transactional buyer revenue increasing 30%, marketplace services revenue increasing 24% and transactional seller revenue increasing 10%.
Transactional buyer revenue increased 30%, primarily driven by the inclusion of IAA in the first quarter of 2024 for the full quarter compared to the 11-day stub period in the first quarter of 2023. Excluding the impact of the IAA acquisition in the first quarter, transactional buyer revenue growth exceeded the 14% increase in total GTV mainly from higher buyer fee rate structures implemented throughout 2024 across all sectors, but primarily within our automotive sector.
Marketplace services revenue increased 24%, driven primarily from higher fees earned from transportation services provided to a large consignor contract in the United States in our CC&T sector, as well as due to the increase in fees from the inclusion of IAA in the first quarter of 2024 for the full quarter compared to the 11-day stub period in the first quarter of 2023.
Transactional seller revenue increased 10%, primarily due to the inclusion of IAA in the first quarter of 2024 for the full quarter compared to the 11-day stub period in the first quarter of 2023. Excluding the impact of the IAA acquisition in the first quarter, transactional seller revenue growth was less than the 15% increase in service GTV due to softer performances primarily in our guarantee contracts in Canada within our CC&T sector.
Inventory Sales Revenue
Inventory sales revenue decreased 3% in 2024, primarily driven by lower volumes in our CC&T sector in the United States from softer year-over-year performance due to lower price realization and an unfavorable contract mix, as well as due to the non-repeat of a large inventory package in the utilities sector. We also saw softer performances in our GovPlanet business driven primarily from a higher volume of low value assets and pricing pressure. These decreases were partially offset by the inclusion of inventory sales revenue from IAA in the first quarter of 2024 for the full quarter compared to the 11-day stub period in the first quarter of 2023 and favorable performances in Canada in our CC&T sector driven by a few significant inventory contracts.
Costs of Services
Costs of services increased 41% to $1.4 billion, primarily due to the full quarter inclusion of IAA in the first quarter of 2024 compared to the 11-day stub period in the the first quarter of 2023, which contributed 85% of the increase, and primarily relates to costs to provide towing services to buyers, building and facility costs including operating lease costs for auction sites, as well as employee compensation expenses. We also incurred higher costs of services in connection with a large consignor contract in transportation in the United States, which included higher costs to provide transportation services and higher payments to a third party as part of a profit-
sharing arrangement. Further, we saw higher costs of services in our automotive sector as prior year included a benefit related to a fair value adjustment made to prepaid consigned vehicle charges on the opening balance sheet of IAA at acquisition. In addition, we saw higher employee compensation expenses as a result of changes made to our employee benefit plans and higher employee labor costs to support increased activity. In our automotive sector, in line with higher volumes, we also saw higher cost of services due to increases in yard lease expense, title search costs, new digital services tax and operating branch costs.
Cost of Inventory Sold
Cost of inventory sold decreased 3% to $863.8 million, primarily in line with the decrease in inventory sales revenue of 3%.
Selling, General and Administrative
Selling, general and administrative expenses increased 4% to $773.9 million, mainly due to the full quarter inclusion of IAA in the first quarter of 2024 compared to the 11-day stub period in the first quarter of 2023. We also saw higher share-based payments expense due to an increase in the size and fair value of share units granted. In addition, our costs increased due to a new digital services tax enacted in Canada on certain in-scope revenues which was retroactively applied to the period from January 1, 2022 to June 30, 2024. These increases were partially offset by lower short-term incentive-based compensation expense, lower travel, advertising and promotional expenses, lower employee compensation expenses as a result of a reduced headcount from our integration activities and lower costs due to strategic cost reduction initiatives.
Acquisition-related and Integration Costs
Acquisition-related and integration costs decreased 87% to $29.0 million, primarily given the significant investment banking, consulting, financing, legal and other acquisition-related costs incurred in the prior year to complete the acquisition of IAA on March 20, 2023. We have also incurred lower severance and integration costs as integration activities and restructuring is being completed. In addition, we recognized a net $16.3 million expense as settlement for the termination of a non-compete agreement bound by IAA prior to the acquisition in the prior year.
Operating Income
Operating income increased 62% to $761.2 million, primarily driven by the significant decrease in acquisition-related and integration costs and the inclusion of IAA operating income in the first quarter of 2024 for a full quarter compared to the 11-day stub period in the first quarter of 2023. In addition, we saw a higher flow-through of service revenue driven by the CC&T sector. These increases are partially offset by higher depreciation and amortization driven by the acquisition of IAA.
Income Tax Expense and Effective Tax Rate
Income tax expense increased 80% to $137.3 million in 2024, compared to $76.4 million in 2023. Our effective tax rate was 25.0%, compared to 27.1% in 2023. The decrease in the effective tax rate over the prior year was primarily due to a decrease in non-deductible expenses. Partially offsetting this decrease was a lower proportionate benefit related to Foreign-Derived Intangible Income (“FDII”).
Net Income
Net income attributable to controlling interests increased 100% to $413.1 million, compared to $206.5 million in 2023. The increase was primarily driven by higher operating income, partially offset by higher income tax expense and higher interest expense due to an increase in long-term debt from funding the IAA acquisition on March 20, 2023.
Diluted EPS
Diluted EPS available to stockholders increased 93% to $2.01 per share compared to $1.04 in 2023. The increase is primarily due to an increase in net income attributable to controlling interests, as described above, partially offset by an increase in the weighted average number of dilutive shares outstanding primarily driven by the shares issued for the acquisition of IAA on March 20, 2023.
U.S. Dollar Exchange Rate Comparison
We conduct global operations in many different currencies, with our presentation currency being the U.S dollar. The following table presents the variance in select foreign exchange rates over the comparative reporting periods:
| | | | | | | | | | | | | | | | | | | | | | | | | | | | | | | | |
| | | | | | | | % Change |
| Value of one local currency to U.S. dollar | | 2024 | | 2023 | | 2022 | | 2024 over 2023 | | 2023 over 2022 |
| Period-end exchange rate - December 31, | | | | | | | | | | |
| Canadian dollar | | 0.6969 | | 0.7558 | | 0.7378 | | (8) | % | | 2 | % |
| Euro | | 1.0406 | | 1.1067 | | 1.0661 | | (6) | % | | 4 | % |
| British pound sterling | | 1.2548 | | 1.2734 | | 1.2054 | | (1) | % | | 6 | % |
| Australian dollar | | 0.6219 | | 0.6826 | | 0.6765 | | (9) | % | | 1 | % |
| | | | | | | | | | |
| Average exchange rate - Year ended December 31, | | | | | | | | | | |
| Canadian dollar | | 0.7302 | | 0.7411 | | 0.7690 | | (1) | % | | (4) | % |
| Euro | | 1.0823 | | 1.0820 | | 1.0543 | | — | % | | 3 | % |
| British pound sterling | | 1.2780 | | 1.2434 | | 1.2376 | | 3 | % | | — | % |
| Australian dollar | | 0.6598 | | 0.6645 | | 0.6949 | | (1) | % | | (4) | % |
In 2024, approximately 27% of our revenues and 29% of our operating expenses were denominated in currencies other than the U.S. dollar, compared to 29% and 30%, respectively, in 2023.
We recognized $1.9 million in foreign exchange losses in 2024 and $1.8 million of losses in 2023. Foreign exchange had an unfavorable impact on total revenue and a favorable impact on expenses. These impacts were mainly due to the fluctuations in the Canadian dollar, British pound sterling, and Australian dollar exchanges rates relative to the U.S. dollar during the year.
Non-GAAP Measures
As part of management’s non-GAAP measures, we may eliminate the financial impact of certain items that we do not consider to be part of our normal operating results.
Adjusted net income available to common stockholders increased 29% to $646.8 million, compared to $502.2 million in 2023.
Diluted adjusted EPS available to common stockholders increased 17% to $3.49 per share, compared to $2.99 per share in 2023.
Adjusted EBITDA increased 26% to $1.3 billion, compared to $1.0 billion in 2023.
Refer to the non-GAAP measures section below on pages 45-51 for further information. Debt
We have a credit agreement (the "Credit Agreement"), which is comprised of multicurrency revolving facilities and the Term Loan A facility (the “TLA Facility”). The TLA Facility is comprised of a facility denominated in US dollars (the "USD TLA Facility"), and a facility denominated in Canadian dollars (the "CAD TLA Facility"). TLA Facility borrowings bear interest at a benchmark rate plus an applicable margin. The Credit Agreement matures on September 21, 2026.
The TLA Facility loans are subject to quarterly installments of 1.25% of principal, with the balance payable at maturity. During 2024, the Company repaid $450.0 million (2023: $150.0 million) of principal on the USD TLA Facility. At December 31, 2024, there are no mandatory principal repayments remaining on the USD TLA Facility until maturity of the debt. We continue to seek opportunities to prepay our debt.
At December 31, 2024, the Company also had $550.0 million aggregate principal amount of 6.750% senior secured notes due March 15, 2028 (the "Secured Notes"), and (ii) $800.0 million aggregate principal amount of 7.750% senior unsecured notes due March 15, 2031 (the "Unsecured Notes") (collectively, the "Notes"). These Notes were used, along with the USD TLA Facility, to fund the acquisition of IAA, and accrue interest to be paid in cash semi-annually in arrears. The Secured Notes are jointly and severally guaranteed on a senior secured basis and the Unsecured Notes are jointly and severally guaranteed on a senior unsecured basis by
certain of the Company’s subsidiaries.
The below were our committed and uncommitted revolving credit facilities at December 31, 2024 and 2023:
| | | | | | | | | | | | | | |
| (in U.S. dollars in millions) | | December 31, 2024 | | December 31, 2023 |
| Committed | | | | |
| Multicurrency revolving credit facilities | | $ | 750.0 | | | $ | 750.0 | |
| Uncommitted | | | | |
| Foreign demand revolving credit facilities | | 15.0 | | | 5.0 | |
| Total revolving credit facilities | | $ | 765.0 | | | $ | 755.0 | |
| Unused | | | | |
| Multicurrency revolving credit facilities | | $ | 705.9 | | | $ | 724.7 | |
| Foreign demand revolving credit facilities | | 15.0 | | | $ | 5.0 | |
| Total credit facilities unused | | $ | 720.9 | | | $ | 729.7 | |
Debt Covenants
We were in compliance with all financial and other covenants applicable to our credit facilities at December 31, 2024.
Our ability to borrow under the Credit Agreement is subject to compliance with financial covenants of a consolidated leverage ratio and a consolidated interest coverage ratio. In the event of sustained deterioration of global markets and economies, we expect the covenants pertaining to our leverage ratio would be the most restrictive to our ability to access funding under our Credit Agreement. We continue to evaluate courses of action to maintain current levels of liquidity and compliance with our debt covenants.
For more information on our debt, see "Item 8: Financial Statements and Supplementary Data - Note 21 Debt" in our consolidated financial statements.
Liquidity and Capital Resources
Our short-term cash requirements include (i) payment of quarterly dividends to common shareholders on an as-declared basis, and payment of participating dividends and preferential dividends to preferred equity holders, (ii) settlement of contracts with consignors, partners and other suppliers, (iii) personnel expenditures, with a majority of short-term incentive compensation paid annually in the first quarter following each fiscal year, (iv) income tax payments, primarily paid in quarterly installments, (v) payments on our short-term debt, as well as interest payments on both our short-term and long-term debt, (vi) payment of amounts committed under certain service agreements to build our modern IT architecture, (vii) payments on our operating and finance lease obligations, (viii) other capital expenditures and working capital needs, and (ix) advances.
On December 3, 2024, the Canadian Revenue Agency ("CRA") issued the Company a Notice of Assessment and Statement of Interest (“NOA”) for CA$79.1 million (Canadian dollars) (approximately $55.1 million) for additional taxes, interest and penalties with respect to the Company's Luxembourg subsidiary relating to taxation years 2010 through 2015. In early February 2025, to begin the appeal process, the Company paid a required deposit of CA$39.5 million (approximately $27.6 million) to the CRA, 50% of the assessed amount. In the event the Company's tax filing position is not upheld, the Company would be required to pay the remaining 50% of the assessed amount, plus interest. However, in the event that the Company prevails in its objection or subsequent legal proceedings, the deposit would be refunded with interest to the Company. The matter is expected to take years to resolve. The CRA has also requested information regarding the 2016 to 2020 taxation years for the same matter. For more information on the matter, see "Part II, Item 8: Financial Statements and Supplementary Data - Note 8 Income Taxes" in our consolidated financial statements.
We believe that our existing working capital and availability under our credit facilities are sufficient to satisfy our present operating requirements and contractual obligations, including the CRA matter noted above. In the current interest rate environment, the Company intends to continue to evaluate and pursue the most financially beneficial arrangements to fund future capital expenditures, which may include lease agreements or cash purchases.
Our long-term cash requirements include scheduled principal repayments of long-term debt upon maturity relating to the TLA Facility and the Notes, repayment of any drawn funds under our revolving credit facilities, as well as scheduled repayments of operating and finance lease obligations relating to the Company’s commercial leases for various auctions sites, branches and offices, operating leases for computer equipment, software, motor vehicles and small office equipment, and finance lease arrangements for certain vehicles, computers, yard equipment, fixtures, and office furniture. In addition, we also have scheduled repayments due on our equipment
financing obligations. For more information on our debt and leases, see "Part II, "Item 8: Financial Statements and Supplementary Data - Note 21 Debt" and "Item 8: Financial Statements and Supplementary Data - Note 25 Leases" respectively, in our consolidated financial statements.
Cash provided by operating activities can fluctuate significantly from period to period. We assess our liquidity based on our ability to generate cash and secure credit to fund operating, investing, and financing activities. Our liquidity is primarily affected by fluctuations in cash provided by operating activities, significant acquisitions of businesses, payment of dividends, our net capital spending1, and repayments of debt. We are also committed under various letters of credit and provide certain guarantees in the normal course of business. We believe our principal sources of liquidity, which include cash flow from operations and our unused capacity under our revolving credit facilities of $720.9 million, is sufficient to fund our current and planned operating activities.
Book overdrafts represent outstanding checks and other pending disbursements, which are in excess of cash account balances with a right of offset. The excess of such amounts is included within trade and other liabilities in our consolidated balance sheets.
If we were to consider further acquisitions to deliver on our strategic growth drivers, we may seek financing through equity markets or additional debt markets. The issuance of additional equity securities may result in dilution to our shareholders. Issuance of preferred equity securities could provide for rights, preferences or privileges senior to those of our common stock. Further, this additional capital may not be available on reasonable terms, or at all.
Cash Flows | | | | | | | | | | | | | | | | | | | | | | | | | | | | | | | | |
| | Year ended December 31, |
| | | | | | | | Change |
| (in U.S. dollars in millions) | | 2024 | | 2023 | | 2022 | | 2024 over 2023 | | 2023 over 2022 |
| Cash provided by (used in): | | | | | | | | | | |
| Operating activities | | $ | 932.0 | | | $ | 544.0 | | | $ | 463.1 | | | $ | 388.0 | | | $ | 80.9 | |
| Investing activities | | (301.6) | | | (3,108.3) | | | 77.2 | | | 2,806.7 | | | (3,185.5) | |
| Financing activities | | (645.5) | | | 2,676.2 | | | (1,258.1) | | | (3,321.7) | | | 3,934.3 | |
| Effect of changes in foreign currency rates | | (24.0) | | | 10.1 | | | (18.8) | | | (34.1) | | | 28.9 | |
| Net increase (decrease) in cash, cash equivalents, and restricted cash | | $ | (39.1) | | | $ | 122.0 | | | $ | (736.6) | | | $ | (161.1) | | | $ | 858.6 | |
Net cash provided by operating activities was $932.0 million in 2024, as compared to net cash provided by operating activities of $544.0 million in 2023. The increase of $388.0 million is mainly due to an increase in net income, as discussed above, and a lower cash outflow from the net change in operating assets and liabilities of $43.9 million. The decrease in cash outflow from the net change in operating assets and liabilities was primarily driven by an increase in book overdrafts, due to timing, prepaid consigned vehicle charges due to the inclusion of IAA, and lower tax payments due to the non-repeat of taxes paid in 2023 for the taxable gain portion on the sale of the Bolton property. In addition, we also saw lower cash outflows relating to timing of payments for inventory purchases and timing of recovery of advances from customers. These decreases in cash outflows were partially offset by timing and settlement of higher interest payments on our debt, as well as the size and timing of our auctions. In addition, as a result of the inclusion of IAA from its acquisition on March 20, 2023, in the current year, we saw higher cash outflows in incentive-based employee compensation, higher payments for indirect taxes, lower reimbursement of leasehold improvements from lessors, as well as higher operating lease payments.
Net cash used in investing activities was $301.6 million in 2024, as compared to net cash used in investing activities of $3.1 billion in 2023. Net cash used in investing activities decreased by $2.8 billion primarily due to cash used in the prior year to fund the acquisitions of IAA and VeriTread, as well as lower net capital expenditures on property, plant and equipment and investments in intangible assets as we shift to more cloud computing arrangements. These decreases were offset by an increase in cash outflow of approximately $8.6 million for the acquisition of Boom & Bucket.
Net cash used in financing activities was $645.5 million in 2024, as compared to net cash provided by financing activities of $2.7 billion in 2023. The change is primarily driven by higher cash inflows in the prior period, as we raised $3.1 billion in debt to fund the acquisition of IAA through the TLA Facility and the Notes, net of debt issuance costs, and received $496.9 million in net proceeds from the issuance of the Series A Senior Preferred Shares and common stock. In addition, we repaid $600.0 million of long-term debt in the first half of 2023 for the redemption of our 2016 Notes and $100.0 million repayment of debt on our USD TLA Facility, as
1 We calculate net capital spending as property, plant and equipment additions plus intangible asset additions less proceeds on disposition of property, plant and equipment.
compared to $450.0 million repayment on our USD TLA Facility in the current year. We also paid less dividends to common stockholders in the current year, primarily due to the payment of a one-time special dividend in connection with the IAA acquisition in the prior year, higher cash inflows from our employee share purchase plan and higher proceeds from the exercise of stock options, driven by a higher share price.
Dividend Information
We declared and paid a regular cash dividend of $0.29 per common share for the quarters ended September 30, 2024, and June 30, 2024, and $0.27 per common share for the quarters ended March 31, 2024, December 31, 2023, September 30, 2023, and June 30, 2023. On March 7, 2023, we declared a special cash dividend of $1.08 per share, payable to stockholders of record at the close of business on March 17, 2023, excluding holders of Series A Senior Preferred Shares (the “Special Dividend”). The Special Dividend was paid in cash on March 28, 2023, following the acquisition of IAA. We have declared, but not yet paid, a dividend of $0.29 per common share for the quarter ended December 31, 2024. All dividends that we pay are “eligible dividends” for Canadian income tax purposes unless indicated otherwise.
Critical Accounting Policies, Judgments, Estimates and Assumptions
In preparing our consolidated financial statements in conformity with US GAAP, we must make decisions that impact the reported amounts and related disclosures. Such decisions include the selection of the appropriate accounting principles to be applied and the assumptions on which to base accounting estimates. In reaching such decisions, we apply judgments based on our understanding and analysis of the relevant circumstances and historical experience.
The following discussion of critical accounting policies and estimates is intended to supplement the significant accounting policies presented in the notes to our consolidated financial statements included in “Part II, Item 8: Financial Statements and Supplementary Data” presented in this Annual Report on Form 10-K, which summarize the accounting policies and methods used in the preparation of those consolidated financial statements. The policies and the estimates discussed below are included here because they require more significant judgments and estimates in the preparation and presentation of our consolidated financial statements than other policies and estimates. Actual amounts could differ materially from those estimated by us at the time our consolidated financial statements are prepared.
Business Combinations
Accounting for business combinations requires estimates with respect to the fair value of the assets acquired and liabilities assumed. Such estimates of fair value require valuation methods, which rely on significant estimates and assumptions, especially for intangible assets. In connection with the IAA purchase price allocation, which was finalized in the first quarter of 2024, the valuation of intangible assets required significant estimates and assumptions, and the valuations of property, plant, and equipment, and operating lease right-of-use assets also required estimates and assumptions.
The valuation of customer relationship intangible assets was performed using the multi-period excess earnings method of the income approach and required significant estimates and assumptions regarding revenue growth rates and discount rates, and the valuation of other acquired intangible assets was performed using the relief from royalty method of the income approach and required estimates and assumptions regarding revenue growth rates, royalty rates, customer attrition rates, and discount rates, as applicable. The Company based these estimates on historical and anticipated results, industry trends, economic analysis, and various other assumptions, including assumptions as to the occurrence of future events. The discount rates used to discount expected cash flows to present values were derived from a weighted average cost of capital analysis and adjusted to reflect inherent risks. The valuation of most acquired property, plant, and equipment, other than land, was performed using the replacement cost method of the cost approach and required certain estimates and assumptions regarding estimates of replacement cost and adjustments to account for physical deterioration and obsolescence. The fair value of most acquired land and the off-market component of right-of-use assets were estimated using sales comparison method of the market approach and included certain estimates and assumptions with respect to market value or market rents, growth rates, and discount rates, as applicable.
Goodwill
We test goodwill for impairment as at December 31, or more frequently whenever events or circumstances change that would more likely than not reduce the fair value of a reporting unit below its carrying amount. We have the option to first perform a qualitative assessment of a reporting unit by assessing qualitative factors. If it is determined that it is more likely than not that the reporting unit’s fair value is less than its carrying value, a quantitative impairment assessment is performed to identify potential goodwill impairment. The reporting unit’s fair value is determined using various valuation approaches and techniques that involve assumptions based on what management believes a hypothetical marketplace participant would use in estimating fair value on the measurement date. Fair value determinations require considerable judgment and can be sensitive to changes in underlying assumptions. Typically, for our reporting units, under an income approach method, the key assumptions and estimates that impact the estimated fair value include
revenue, earnings growth rates and the discount rate. For valuations performed under the market approach, the key assumptions and estimates would include the selection of guideline public companies and transactions comparable to the reporting unit.
An impairment loss is recognized as the difference between the reporting unit’s carrying amount and its fair value. If the difference between the reporting unit’s carrying amount and fair value is greater than the amount of goodwill allocated to the reporting unit, the impairment loss is restricted by the amount of the goodwill allocated to the reporting unit.
Prior to December 31, 2024, we had the following reporting units: Ritchie Bros., IAA, Listings Services, Rouse, SmartEquip and VeriTread; however, in the fourth quarter of 2024, based on a change in how management evaluates these businesses, the former Rouse, SmartEquip, VeriTread and Listings Services businesses were combined into our Services reporting unit. As the Company reorganized its reporting structure as at December 31, 2024, we performed goodwill impairment testing immediately before (Listings Services and Rouse reporting units using a qualitative approach, and SmartEquip and VeriTread reporting units using a quantitative approach that utilizes both income and market approaches) and after the reorganization of the reporting units that were impacted by performing a qualitative assessment, and concluded that there were no impairment indicators. In addition, at December 31, 2024, we performed goodwill impairment testing for our Ritchie Bros. reporting unit using a qualitative approach and for our IAA reporting unit using a quantitative approach, and also concluded that there was no impairment.
Based on the Company’s annual goodwill impairment testing as of December 31, 2024, management concluded that there are no reporting units that are at material risk of being impaired.
Income Taxes
The accounting for the Company's position in regards to the NOA received from the CRA, described in Item 8: Financial Statements and Supplementary Data - Note 3 Significant Judgments, Estimates and Assumptions, also required significant judgment and an assessment over whether it is more likely than not that the Company's tax position will be sustained. The matter required management to evaluate the tax technical merits and assess the likelihood of its resolution at appeals or through litigation.
Adoption of New Standards
For a discussion of our new and amended accounting standards refer to "Part II, Item 8: Financial Statements and Supplementary Data - Note 2 Significant Accounting Policies" of this Annual Report on Form 10-K.
Recent Accounting Pronouncements
Recent accounting pronouncements that significantly impact our accounting policies or the presentation of our consolidated financial position or performance have been disclosed in the notes to our consolidated financial statements included in "Part II, Item 8: Financial Statements and Supplementary Data - Note 2 Significant Accounting Policies" of this Annual Report on Form 10-K.
Non-GAAP Measures
We reference various non-GAAP measures throughout this Annual Report on Form 10-K. These measures do not have a
standardized meaning and are, therefore, unlikely to be comparable to similar measures presented by other companies. The
presentation of this financial information, which is not prepared under any comprehensive set of accounting rules or principles, is not
intended to be considered in isolation of, or as a substitute for, the financial information prepared and presented in accordance with US
GAAP.
Adjusted Net Income Attributable to Common Stockholders and Diluted Adjusted EPS Attributable to Common Stockholders Reconciliation
We believe that adjusted net income available to common stockholders provides useful information about the growth or decline of our
net income available to common stockholders for the relevant financial period, and eliminates the financial impact of adjusting items
we do not consider to be part of our normal operating results. Diluted adjusted EPS available to common stockholders eliminates the
financial impact of adjusting items from net income available to common stockholders that we do not consider to be part of our normal
operating results.
Adjusted net income available to common stockholders is calculated as net income available to common stockholders, excluding the
effects of adjusting items that we do not consider to be part of our normal operating results, such as share-based payments expense,
acquisition-related and integration costs, amortization of acquired intangible assets, executive transition costs and certain other items.
Net income available to common stockholders is calculated as net income attributable to controlling interests, less cumulative
dividends on Series A Senior Preferred Shares and allocated earnings to participating securities.
Diluted adjusted EPS available to common stockholders is calculated by dividing adjusted net income available to common
stockholders by the weighted average number of dilutive shares outstanding, except that it is computed based upon the lower of the
two-class method or the if-converted method, which includes the effects of the assumed conversion of the Series A Senior Preferred
Shares and the effect of shares issuable under the Company’s stock-based incentive plans, if such effect is dilutive.
Please refer to page 50 for a summary of adjusting items.
The following table reconciles adjusted net income available to common stockholders and diluted adjusted EPS available to common
stockholders to net income available to common stockholders and diluted EPS available to common stockholders, which are the most
directly comparable GAAP measures in our consolidated financial statements:
| | | | | | | | | | | | | | | | | | | | | | | | | | | | | |
| Year ended December 31, |
| | | | | | | % Change |
| (in U.S. dollars in millions, except share, per share data, and percentages) | 2024 | | 2023 | | 2022 | | 2024 over 2023 | | 2023 over 2022 |
| Net income available to common stockholders | $ | 372.7 | | | $ | 174.9 | | | $ | 319.7 | | | 113 | % | | (45) | % |
| Share-based payments expense | 56.3 | | | 45.5 | | | 37.0 | | | 24 | % | | 23 | % |
| Acquisition-related and integration costs | 29.0 | | | 216.1 | | | 37.3 | | | (87) | % | | 479 | % |
| Amortization of acquired intangible assets | 274.9 | | | 226.2 | | | 33.4 | | | 22 | % | | 577 | % |
| (Gain) on disposition of property, plant and equipment and related costs | (1.2) | | | (0.8) | | | (166.9) | | | 50 | % | | (100) | % |
| Prepaid consigned vehicle charges | (4.7) | | | (67.0) | | | — | | | (93) | % | | NM |
| Loss on redemption of the 2016 and 2021 Notes and certain related interest expense | — | | | 3.3 | | | 9.7 | | | NM | | (66) | % |
| Change in fair value of derivatives | — | | | — | | | (1.3) | | | NM | | NM |
| Other legal, advisory, restructuring and non-income tax expenses | 13.4 | | | 2.0 | | | 5.0 | | | 570 | % | | (60) | % |
| Executive transition costs | 6.7 | | | 12.0 | | | — | | | (44) | % | | NM |
| Remeasurements in connection with business combinations | 1.2 | | | (2.9) | | | — | | | NM | | NM |
| Related tax effects of the above | (91.4) | | | (95.8) | | | (4.0) | | | (5) | % | | 2295 | % |
| Related allocation of the above to participating securities | (10.1) | | | (11.3) | | | — | | | (11) | % | | NM |
| Adjusted net income available to common stockholders | $ | 646.8 | | | $ | 502.2 | | | $ | 269.9 | | | 29 | % | | 86 | % |
| Weighted average number of dilutive shares outstanding | 185,254,557 | | 168,203,981 | | 111,886,025 | | 10 | % | | 50 | % |
| Diluted earnings per share available to common stockholders | $ | 2.01 | | | $ | 1.04 | | | $ | 2.86 | | | 93 | % | | (64) | % |
| Diluted adjusted earnings per share available to common stockholders | $ | 3.49 | | | $ | 2.99 | | | $ | 2.41 | | | 17 | % | | 24 | % |
NM = Not meaningful
Adjusted EBITDA
We believe adjusted EBITDA provides useful information about the growth or decline of our net income when compared between
different financial periods. We use adjusted EBITDA as a key performance measure because we believe it facilitates operating
performance comparisons from period to period and it provides management with the ability to monitor its controllable incremental
revenues and costs.
Adjusted EBITDA is calculated by adding back depreciation and amortization, interest expense, income tax expense, and subtracting
interest income from net income, as well as adding back the adjusting items as described on page 50.
The following table reconciles adjusted EBITDA to net income, which is the most directly comparable GAAP measure in, or
calculated from, our consolidated financial statements:
| | | | | | | | | | | | | | | | | | | | | | | | | | | | | | | | |
| | Year ended December 31, |
| | | | | | | | % Change |
| | | | | | | | 2024 over | | 2023 over |
| (in U.S. dollars in millions, except percentages) | | 2024 | | 2023 | | 2022 | | 2023 | | 2022 |
| Net income | | $ | 412.8 | | | $ | 206.0 | | | $ | 319.8 | | | 100 | % | | (36) | % |
| Add: depreciation and amortization | | 444.4 | | | 352.2 | | | 97.2 | | | 26 | % | | 262 | % |
| Add: interest expense | | 233.7 | | | 213.8 | | | 57.9 | | | 9 | % | | 269 | % |
| Less: interest income | | (26.2) | | | (22.0) | | | (7.0) | | | 19 | % | | 214 | % |
| Add: income tax expense | | 137.3 | | | 76.4 | | | 86.2 | | | 80 | % | | (11) | % |
| EBITDA | | 1,202.0 | | | 826.4 | | | 554.1 | | | 45 | % | | 49 | % |
| Share-based payments expense | | 56.3 | | | 45.5 | | | 37.0 | | | 24 | % | | 23 | % |
| Acquisition-related and integration costs | | 29.0 | | | 216.1 | | | 37.3 | | | (87) | % | | 479 | % |
| (Gain) loss on disposition of property, plant and equipment and related costs | | (1.2) | | | (0.8) | | | (166.9) | | | 50 | % | | (100) | % |
| Prepaid consigned vehicle charges | | (4.7) | | | (67.0) | | | — | | | (93) | % | | NM |
| Change in fair value of derivatives | | — | | | — | | | (1.3) | | | NM | | NM |
| Other legal, advisory, restructuring and non-income tax expenses | | 13.4 | | | 2.0 | | | 5.0 | | | 570 | % | | (60) | % |
| Executive transition costs | | 6.7 | | | 12.0 | | | — | | | (44) | % | | NM |
| Remeasurements in connection with business combinations | | 1.2 | | | (1.4) | | | — | | | NM | | NM |
| Adjusted EBITDA | | $ | 1,302.7 | | | $ | 1,032.8 | | | $ | 465.2 | | | 26 | % | | 122 | % |
NM = Not meaningful
Adjusted Net Debt and Adjusted Net Debt/ Adjusted EBITDA Reconciliation
We believe that comparing adjusted net debt/adjusted EBITDA on a trailing twelve-month basis for different financial periods
provides useful information about the performance of our operations, as an indicator of the amount of time it would take us to settle
both our short and long-term debt. We do not consider this to be a measure of our liquidity, which is our ability to settle only short-term obligations, but rather a measure of how well we fund liquidity. Measures of liquidity are noted under “Liquidity and Capital
Resources".
Adjusted net debt is calculated by subtracting cash and cash equivalents from short and long-term debt and long-term debt in escrow.
Adjusted net debt/Adjusted EBITDA is calculated by dividing adjusted net debt by adjusted EBITDA.
The following table reconciles adjusted net debt to debt, adjusted EBITDA to net income, and adjusted net debt/ adjusted EBITDA to
debt/ net income, respectively, which are the most directly comparable GAAP measures in, or calculated from, our consolidated
financial statements. Please refer to page 50 for a summary of adjusting items.
| | | | | | | | | | | | | | | | | | | | | | | | | | | | | | | | |
| | Year ended December 31, |
| | | | | | | | % Change |
| (in U.S. dollars in millions, except percentages) | | 2024 | | 2023 | | 2022 | | 2024 over 2023 | | 2023 over 2022 |
| Short-term debt | | $ | 27.7 | | | $ | 13.7 | | | $ | 29.1 | | | 102 | % | | (53) | % |
| Long-term debt | | 2,626.2 | | | 3,075.8 | | | 581.5 | | | (15) | % | | 429 | % |
| Debt | | 2,653.9 | | | 3,089.5 | | | 610.6 | | | (14) | % | | 406 | % |
| Less: cash and cash equivalents | | (533.9) | | | (576.2) | | | (494.3) | | | (7) | % | | 17 | % |
| Adjusted net debt | | 2,120.0 | | | 2,513.3 | | | 116.3 | | | (16) | % | | 2061 | % |
| Net income | | $ | 412.8 | | | $ | 206.0 | | | $ | 319.8 | | | 100 | % | | (36) | % |
| Add: depreciation and amortization | | 444.4 | | | 352.2 | | | 97.1 | | | 26 | % | | 263 | % |
| Add: interest expense | | 233.7 | | | 213.8 | | | 57.9 | | | 9 | % | | 269 | % |
| Less: interest income | | (26.2) | | | (22.0) | | | (7.0) | | | 19 | % | | 214 | % |
| Add: income tax expense | | 137.3 | | | 76.4 | | | 86.2 | | | 80 | % | | (11) | % |
| EBITDA | | 1,202.0 | | | 826.4 | | | 554.0 | | | 45 | % | | 49 | % |
| Share-based payments expense | | 56.3 | | | 45.5 | | | 37.0 | | | 24 | % | | 23 | % |
| Acquisition-related and integration costs | | 29.0 | | | 216.1 | | | 37.3 | | | (87) | % | | 479 | % |
| (Gain) on disposition of property, plant and equipment and related costs | | (1.2) | | | (0.8) | | | (166.9) | | | 50 | % | | (100) | % |
| Prepaid consigned vehicle charges | | (4.7) | | | (67.0) | | | — | | | (93) | % | | NM |
| Change in fair value of derivatives | | — | | | — | | | (1.3) | | | NM | | NM |
| Other legal, advisory, restructuring and non-income tax expenses | | 13.4 | | | 2.0 | | | 5.1 | | | 570 | % | | (61) | % |
| Executive transition costs | | 6.7 | | | 12.0 | | | — | | | (44) | % | | NM |
| Remeasurements in connection with business combinations | | 1.2 | | | (1.4) | | | — | | | NM | | NM |
| Adjusted EBITDA | | $ | 1,302.7 | | | $ | 1032.8 | | | $ | 465.2 | | | 26 | % | | 122 | % |
| Debt/net income | | 6.4 x | | 15.0 x | | 1.9 x | | (57) | % | | 689 | % |
| Adjusted net debt/adjusted EBITDA | | 1.6 x | | 2.4 x | | 0.3 x | | (33) | % | | 700 | % |
NM = Not meaningful
Adjusted Return and Adjusted ROIC Reconciliation
We believe that comparing adjusted ROIC on a trailing twelve-month basis for different financial periods provides useful information
about the after-tax return generated by our investments. Adjusted ROIC is a measure used by management to determine how
productively the Company uses its long-term capital to gauge investment decisions.
ROIC is calculated as reported return divided by average invested capital. Reported return is defined as net income attributable to
controlling interests excluding the impact of net interest expense and tax effected at the Company’s adjusted annualized effective tax rate. Adjusted ROIC is calculated as adjusted return divided by adjusted average invested capital. Adjusted return is defined as reported return and adjusted for items that we do not consider to be part of our normal operating results and tax effected at the applicable tax rate.
Adjusted average invested capital is calculated as average invested capital but excludes any long-term debt in escrow. Please refer to page 50 for a summary of adjusting items.
The following table reconciles adjusted return and adjusted ROIC to net income attributable to controlling interests and adjusted
average invested capital to average invested capital, which are the most directly comparable GAAP measures in, or calculated from,
our consolidated financial statements:
| | | | | | | | | | | | | | | | | | | | | | | | | | | | | | | | |
| | Year ended December 31, |
| | | | | | | | % Change |
| (in U.S. dollars in millions, except percentages) | | 2024 | | 2023 | | 2022 | | 2024 over 2023 | | 2023 over 2022 |
| Net income attributable to controlling interests | | $ | 413.1 | | | $ | 206.5 | | | $ | 319.7 | | | 100 | % | | (35) | % |
| Add: | | | | | | | | | | |
| Interest expense | | 233.7 | | | 213.8 | | | 57.9 | | | 9 | % | | 269 | % |
| Interest income | | (26.2) | | | (22.0) | | | (7.0) | | | 19 | % | | 214 | % |
| Interest, net | | 207.5 | | | 191.8 | | | 50.9 | | | 8 | % | | 277 | % |
| Tax on interest, net | | (51.3) | | | (46.0) | | | (12.7) | | | 12 | % | | 262 | % |
| Reported return | | $ | 569.3 | | | $ | 352.3 | | | $ | 357.9 | | | 62 | % | | (2) | % |
| | | | | | | | | | |
| Add: | | | | | | | | | | |
| Share-based payments expense | | 56.3 | | | 45.5 | | | 37.0 | | | 24 | % | | 23 | % |
| Acquisition-related and integration costs | | 29.0 | | | 216.1 | | | 37.3 | | | (87) | % | | 479 | % |
| Amortization of acquired intangible assets | | 274.9 | | | 226.2 | | | 33.4 | | | 22 | % | | 577 | % |
| (Gain) loss on disposition of property, plant and equipment and related costs | | (1.2) | | | (0.8) | | | (166.9) | | | 50 | % | | (100) | % |
| Prepaid consigned vehicle charges | | (4.7) | | | (67.0) | | | — | | | (93) | % | | (100) | % |
| Change in fair value of derivatives | | — | | | — | | | (1.3) | | | — | % | | (100) | % |
| Other legal, advisory, restructuring and non-income tax expenses | | 13.4 | | | 2.0 | | | 5.1 | | | 570 | % | | (61) | % |
| Executive transition costs | | 6.7 | | | 12.0 | | | — | | | (44) | % | | 100 | % |
| Remeasurements in connection with business combinations | | 1.2 | | | (2.9) | | | — | | | (143) | % | | (100) | % |
| Related tax effects of the above | | (91.4) | | | (95.8) | | | (4.0) | | | (5) | % | | 2295 | % |
| Adjusted return | | $ | 853.5 | | | $ | 687.6 | | | $ | 298.5 | | | 24 | % | | 130 | % |
| | | | | | | | | | |
| Short-term debt - opening balance | | $ | 13.7 | | | $ | 29.1 | | | $ | 6.1 | | | (53) | % | | 377 | % |
| Short-term debt - ending balance | | 27.7 | | | 13.7 | | | 29.1 | | | 102 | % | | (53) | % |
| Average short-term debt | | 20.7 | | | 21.4 | | | 17.6 | | | (3) | % | | 22 | % |
| Long-term debt - opening balance | | 3,075.8 | | | 581.5 | | | 1,737.4 | | | 429 | % | | (67) | % |
| Less: long-term debt in escrow | | — | | | — | | | (933.5) | | | — | % | | (100) | % |
| Adjusted opening long-term debt | | 3,075.8 | | | 581.5 | | | 803.9 | | | 429 | % | | (28) | % |
| Long-term debt - ending balance | | 2,626.2 | | | 3,075.8 | | | 581.5 | | | (15) | % | | 429 | % |
| Less: long-term debt in escrow | | — | | | — | | | — | | | — | % | | — | % |
| Adjusted ending long-term debt | | 2,626.2 | | | 3,075.8 | | | 581.5 | | | (15) | % | | 429 | % |
| Average long-term debt | | 2,851.0 | | | 1,828.7 | | | 1,159.5 | | | 56 | % | | 58 | % |
| Adjusted average long-term debt | | 2,851.0 | | | 1,828.7 | | | 692.7 | | | 56 | % | | 164 | % |
| Preferred equity - opening balance | | 482.0 | | | — | | | — | | | 100 | % | | — | % |
| Preferred equity - ending balance | | 482.0 | | | 482.0 | | | — | | | — | % | | 100 | % |
| Average preferred equity | | 482.0 | | | 241.0 | | | — | | | 100 | % | | 100 | % |
| Stockholders' equity - opening balance | | 5,016.7 | | | 1,289.6 | | | 1,070.7 | | | 289 | % | | 20 | % |
| Stockholders' equity - ending balance | | 5,224.0 | | | 5,016.7 | | | 1,289.6 | | | 4 | % | | 289 | % |
| Average stockholders' equity | | 5,120.4 | | | 3,153.2 | | | 1,180.2 | | | 62 | % | | 167 | % |
| Average invested capital | | $ | 8,474.1 | | | $ | 5,244.3 | | | $ | 2,357.3 | | | 62 | % | | 122 | % |
| Adjusted average invested capital | | $ | 8,474.1 | | | $ | 5,244.3 | | | $ | 1,890.5 | | | 62 | % | | 177 | % |
| | | | | | | | | | |
| ROIC | | 6.7 | % | | 6.7 | % | | 15.2 | % | | 0bps | | (850)bps |
| Adjusted ROIC | | 10.1 | % | | 13.1 | % | | 15.8 | % | | (300)bps | | (270)bps |
NM = Not meaningful
Adjusting items for the year ended December 31, 2024:
Recognized in the fourth quarter of 2024
•$15.2 million share-based payments expense.
•$6.1 million of acquisition-related and integration costs, primarily relating to severance and integration activities in connection with the acquisition of IAA.
•$68.5 million amortization of acquired intangible assets from acquisitions.
•$0.7 million relating to a fair value adjustment made to the prepaid consigned vehicle charges on the opening balance sheet of IAA at acquisition.
•$1.3 million of other legal, advisory, restructuring and non-income tax expenses, including costs incurred with the CRA dispute.
•$2.4 million of estimated executive transition costs, primarily estimated settlement and legal amounts associated with the departure of our former CEO on August 1, 2023.
Recognized in the third quarter of 2024
•$9.7 million share-based payments expense.
•$6.0 million of acquisition-related and integration costs, primarily relating to the acquisition of IAA.
•$67.9 million amortization of acquired intangible assets from past acquisitions.
•$0.2 million loss on disposition of property, plant and equipment and related costs, primarily driven by non-cash costs arising from the accounting for the sale of the Bolton property, recorded in selling, general and administrative cost, partially offset by a $0.5 million gain on the disposition of property, plant and equipment.
•$0.6 million relating to a fair value adjustment made to the prepaid consigned vehicle charges on the opening balance sheet of IAA at acquisition.
•$2.2 million of other legal, advisory, restructuring and non-income tax expenses, which primarily includes an estimated accrual for the settlement amount of an unusual legal claim recorded in other income (loss), as well as terminated and ongoing transaction costs recorded in selling, general and administrative costs.
•$0.6 million of estimated executive transition costs, primarily legal costs, associated with the departure of our former CEO on August 1, 2023.
•$1.2 million of remeasurements in connection with a business combination which relates to the revaluation of a contingent consideration liability for IAA's acquisition of Marisat, Inc. in 2021.
Recognized in the second quarter of 2024
•$18.1 million share-based payments expense.
•$4.1 million of acquisition-related and integration costs, primarily relating to the acquisition of IAA.
•$69.0 million amortization of acquired intangible assets from past acquisitions.
•$0.4 million loss on disposition of property, plant and equipment and related costs, primarily driven by non-cash costs arising from the accounting for the sale of the Bolton property, recorded in selling, general and administrative costs.
•$1.3 million relating to a fair value adjustment made to the prepaid consigned vehicle charges on the opening balance sheet of IAA at acquisition.
•$7.7 million of other legal, advisory, restructuring and non-income tax expenses, which includes an estimated accrual for a new digital services tax in Canada on certain in-scope revenues earned for the period from January 1, 2022 to June 30, 2024, legal costs in connection with the settlement of an unusual legal claim accrued in the first quarter of 2024, as well as terminated and ongoing transaction costs.
•$2.0 million of estimated executive transition costs associated with the departure of our former CEO on August 1, 2023, which includes estimated settlement amounts and related costs.
Recognized in the first quarter of 2024
•$13.3 million share-based payments expense.
•$12.8 million of acquisition-related and integration costs primarily relating to the acquisition of IAA.
•$69.6 million amortization of acquired intangible assets from past acquisitions, of which $61.9 million related to the acquired intangible assets from the acquisition of IAA.
•$1.8 million gain on disposition of property, plant and equipment and related costs, primarily driven by a $2.2 million gain on a lease modification, offset by non-cash costs arising from the accounting for the sale of the Bolton property, recorded in selling, general and administrative costs.
•$2.1 million relating to a fair value adjustment made to the prepaid consigned vehicle charges on the opening balance sheet of IAA, which do not have a future benefit at acquisition, and therefore has created a favorable reduction to our cost of services in the quarter.
•$2.2 million of other advisory, legal and restructuring costs, which primarily includes a $1.9 million loss on the settlement of an unusual legal claim recorded in other income, $0.3 million of terminated and ongoing transaction costs and $0.1 million of costs incurred with the CRA's investigation.
•$1.7 million of estimated executive transition costs associated with the departures of certain executives on August 1, 2023, which includes severance, estimated settlement amounts and related costs.
The adjusting items recognized in our prior quarters are discussed in "Part II, Item 7: Management’s Discussion and Analysis of Financial Condition and Results of Operations” of our Annual Report on Form 10-K for the year ended December 31, 2023.
ITEM 7A: QUANTITATIVE AND QUALITATIVE DISCLOSURES ABOUT MARKET RISK
Foreign Currency Exchange Rate Risk
We conduct operations in local currencies in countries around the world and the functional currency of our subsidiaries outside of the United States is generally the applicable local currency. Our consolidated financial statements are presented in U.S. dollars. As a result, we are exposed to currency fluctuations and exchange rate risk. We cannot accurately predict the future effects of foreign currency fluctuations on our financial condition or results of operations, nor quantify their effects on the macroeconomic environment. The proportion of revenues denominated in currencies other than the U.S. dollar in a given period may differ from the annual proportion for the year ended December 31, 2024, which was 27%, and depends on the size and location of auctions held during the period. On an annual basis, we expect fluctuations in revenues and operating expenses to largely offset and generally act as a natural hedge against exposure to fluctuations in the value of the U.S. dollar.
During 2024, we recorded a foreign currency translation adjustment loss of $80.8 million, compared to income of $41.1 million in 2023. Our foreign currency translation adjustment, which is recorded as a component of consolidated other comprehensive income (loss), arises from the translation of our net assets denominated in currencies other than the U.S. dollar to the U.S. dollar for reporting purposes. Based on our exposures to foreign currency exchange rate risk at December 31, 2024, and assuming all other variables remain constant, a 10% change in the Canadian dollar, GBP and Euro against the U.S. dollar would have resulted in an additional foreign currency translation adjustment of approximately $113.0 million within consolidated other comprehensive income (loss).
We also have foreign exchange rate risk related to our intercompany balances denominated in various currencies other than the U.S dollar. However, we enter into forward contracts to protect against such foreign currency exchange rate risks. As such, after consideration of the effect of foreign exchange contracts in place at December 31, 2024, a 10% foreign currency exchange rate change would not have a significant impact on our net income.
Interest Rate Risk
Loans under our syndicated and foreign credit facilities bear interest, at our option, at a rate equal to either a base rate (or Canadian prime rate for certain Canadian dollar borrowings) or floating rate customarily used by the syndicate and depending on the borrowing currency, including SOFR, SONIA, €STR, EURIBOR, TIBOR, CORRA, and BBSY. In either case, an applicable margin is added to the rate. At December 31, 2024, we had a total of $1.3 billion in loans (facilities drawn and term loans) bearing floating rates of interest, as compared to $1.8 billion at December 31, 2023. Based on the amount owing at December 31, 2024, and assuming all other variables remain constant, a change in the interest rate by 100 bps would result in an increase/decrease of approximately $13.3 million in the pre-tax interest we accrue per annum.
At December 31, 2024, fixed rate debt on our senior secured and unsecured notes represents 51% of our long-term debt and bears interest at a fixed rate of 6.750% per annum for the senior secured notes and 7.750% per annum for the senior unsecured notes. We continue to monitor our exposure to interest rate risk, and while we have not adopted a long-term hedging strategy to protect against interest rate fluctuations associated with our variable rate debt, we may consider hedging specific borrowings if we deem it appropriate in the future.
ITEM 8: FINANCIAL STATEMENTS AND SUPPLEMENTARY DATA
Report of Independent Registered Public Accounting Firm
To the Shareholders and the Board of Directors of RB Global, Inc.
Opinion on the Financial Statements
We have audited the accompanying consolidated balance sheets of RB Global, Inc. (the Company) as of December 31, 2024 and 2023, the related consolidated statements of income, comprehensive income, changes in temporary equity and stockholders’ equity, and cash flows, for each of the two years in the period ended December 31, 2024, and the related notes (collectively referred to as the “consolidated financial statements”). In our opinion, the consolidated financial statements present fairly, in all material respects, the financial position of the Company at December 31, 2024 and 2023, and the results of its operations and its cash flows for each of the two years in the period ended December 31, 2024, in conformity with U.S. generally accepted accounting principles.
We also have audited, in accordance with the standards of the Public Company Accounting Oversight Board (United States) (PCAOB), the Company's internal control over financial reporting as of December 31, 2024, based on criteria established in Internal Control-Integrated Framework issued by the Committee of Sponsoring Organizations of the Treadway Commission (2013 framework) and our report dated February 26, 2025 expressed an unqualified opinion thereon.
Basis for Opinion
These financial statements are the responsibility of the Company's management. Our responsibility is to express an opinion on the Company’s financial statements based on our audits. We are a public accounting firm registered with the PCAOB and are required to be independent with respect to the Company in accordance with the U.S. federal securities laws and the applicable rules and regulations of the Securities and Exchange Commission and the PCAOB.
We conducted our audits in accordance with the standards of the PCAOB. Those standards require that we plan and perform the audit to obtain reasonable assurance about whether the financial statements are free of material misstatement, whether due to error or fraud. Our audits included performing procedures to assess the risks of material misstatement of the financial statements, whether due to error or fraud, and performing procedures that respond to those risks. Such procedures included examining, on a test basis, evidence regarding the amounts and disclosures in the financial statements. Our audits also included evaluating the accounting principles used and significant estimates made by management, as well as evaluating the overall presentation of the financial statements. We believe that our audits provide a reasonable basis for our opinion.
Critical Audit Matter
The critical audit matter communicated below is a matter arising from the current period audit of the financial statements that was communicated or required to be communicated to the audit committee and that: (1) relates to accounts or disclosures that are material to the financial statements and (2) involved our especially challenging, subjective or complex judgments. The communication of the critical audit matter does not alter in any way our opinion on the consolidated financial statements, taken as a whole, and we are not, by communicating the critical audit matter below, providing a separate opinion on the critical audit matter or on the account or disclosures to which it relates.
| | | | | | | | |
| | Uncertain Tax Position – Canada Revenue Agency ("CRA") matter |
| Description of the Matter | | As discussed in Notes 2, 3 and 8 of the consolidated financial statements, the Company is subject to income taxes in the U.S., Canada and other foreign jurisdictions during the ordinary course of business, including tax positions for which the ultimate tax determination is uncertain. Liabilities for uncertain tax positions are recognized in accordance with ASC 740, Income Taxes. The Company evaluates the tax position for recognition by determining if the weight of available evidence indicates that it is more likely than not that the position will be sustained based on the tax technical merits, including resolution of related appeals or litigation processes, if any. Recognized income tax positions are measured at the largest amount that is more than likely of being realized.
As disclosed in Note 8, on December 3, 2024, the CRA issued the Company a Notice of Assessment and Statement of Interest (“NOA”) for C$79.1 million (approximately $55.1 million), for the taxation years 2010 through 2015, inclusive of C$37.7 million in income taxes (approximately $26.3 million), and C$41.4 million in interest and penalties (approximately $28.9 million). The CRA is asserting that one of the Company’s Luxembourg subsidiaries which was in operation from 2010 to 2020 was resident in Canada from 2010 through 2015 and that its worldwide income should be subject to Canadian income taxation. The CRA also requested, in the third quarter of 2024, additional information for the 2016 through 2020 tax years; however, has not issued a NOA for that period.
At December 31, 2024, the Company has not recorded any UTP liabilities relating to these matters in the consolidated financial statements because it is the Company’s conclusion that it is more likely than not that the Company’s tax filing positions will ultimately be sustained.
As a result, significant judgment is required in evaluating the Company’s uncertain tax positions relating to the above matters for the period 2010 through 2020, notably as it relates to whether the tax position’s technical merits are more likely than not to be sustained.
Auditing the Company’s positions in regard to the CRA matter was especially challenging because the evaluation of whether a tax position is more likely than not to be sustained is complex and involves significant auditor judgment including interpretation of jurisdiction-specific tax legislation and related case law.
|
| How We Addressed the Matter in Our Audit | | We obtained an understanding, evaluated the design, and tested the effectiveness of controls over the Company’s process to assess the technical merits of the income tax position underlying the CRA matters, including controls over the assessment as to whether the tax position is more likely than not to be sustained, and the development of the related financial statement disclosures.
Our audit procedures included, among others, evaluating the technical merits underlying the CRA matters that the Company used to assess its uncertain tax positions. We involved our international tax professionals in assessing the technical merits of the Company’s tax positions relating to the CRA matters, including but not limited to the Company’s internal analyses and memoranda, external legal opinions obtained by the Company as to applicable tax and case law, documentation received from and provided to the CRA and evaluating the underlying facts and evidence upon which the Company’s income tax positions are based. We also made inquiries of management, internal and external counsel, and obtained written representations from management as to certain aspects of the CRA matter. We used our knowledge, including the use of professionals with specialized skill and knowledge of and experience with international income tax laws of the relevant taxing jurisdictions to evaluate the Company’s accounting for the CRA matter. We evaluated developments in the applicable regulatory environments to assess potential effects on the Company’s positions, including recent decisions in relevant court cases. Additionally, we evaluated the Company’s disclosures of the uncertain tax positions in relation to the CRA matter. |
| | | | | |
| /s/ | Ernst & Young LLP |
| We have served as the Company’s auditor since 2023. |
| Chicago, Illinois |
| February 26, 2025 |
Report of Independent Registered Public Accounting Firm
To the Shareholders and the Board of Directors of RB Global, Inc.
Opinion on the Financial Statements
We have audited the accompanying consolidated statements of income, comprehensive income, changes in temporary equity and stockholders’ equity and cash flows of RB Global, Inc. (the “Company”) for the year ended December 31, 2022, and the related notes (collectively referred to as the “consolidated financial statements”). In our opinion, the consolidated financial statements present fairly, in all material respects, the results of its operations and its cash flows for the year ended December 31, 2022, in conformity with U.S. generally accepted accounting principles.
Basis for Opinion
These financial statements are the responsibility of the Company's management. Our responsibility is to express an opinion on the Company’s financial statements based on our audit. We are a public accounting firm registered with the Public Company Accounting Oversight Board (United States) (“PCAOB”) and are required to be independent with respect to the Company in accordance with the U.S. federal securities laws and the applicable rules and regulations of the Securities and Exchange Commission and the PCAOB.
We conducted our audit in accordance with the standards of the PCAOB. Those standards require that we plan and perform the audit to obtain reasonable assurance about whether the financial statements are free of material misstatement, whether due to error or fraud. Our audit included performing procedures to assess the risks of material misstatement of the financial statements, whether due to error or fraud, and performing procedures that respond to those risks. Such procedures included examining, on a test basis, evidence regarding the amounts and disclosures in the financial statements. Our audit also included evaluating the accounting principles used and significant estimates made by management, as well as evaluating the overall presentation of the financial statements. We believe that our audit provides a reasonable basis for our opinion.
| | | | | |
| /s/ | Ernst & Young LLP |
| Chartered Professional Accountants |
| We served as the Company‘s auditor from 2013 to 2023. |
| Vancouver, Canada |
| February 21, 2023 |
Consolidated Income Statements
(Expressed in millions of U.S. dollars, except share and per share data)
| | | | | | | | | | | | | | | | | | | | |
| Year ended December 31, | | 2024 | | 2023 | | 2022 |
| Revenue: | | | | | | |
| Service revenue | | $ | 3,363.6 | | | $ | 2,732.5 | | | $ | 1,050.6 | |
| Inventory sales revenue | | 920.6 | | | 947.1 | | | 683.2 | |
| Total revenue | | 4,284.2 | | | 3,679.6 | | | 1,733.8 | |
| | | | | | |
| Operating expenses: | | | | | | |
| Costs of services | | 1,415.7 | | | 1,007.6 | | | 168.1 | |
| Cost of inventory sold | | 863.8 | | | 893.6 | | | 608.6 | |
| Selling, general and administrative | | 773.9 | | | 743.7 | | | 539.9 | |
| Acquisition-related and integration costs | | 29.0 | | | 216.1 | | | 37.3 | |
| Depreciation and amortization | | 444.4 | | | 352.2 | | | 97.2 | |
| Total operating expenses | | 3,526.8 | | | 3,213.2 | | | 1,451.1 | |
| Gain on disposition of property, plant and equipment | | 3.8 | | | 4.9 | | | 170.8 | |
| Operating income | | 761.2 | | | 471.3 | | | 453.5 | |
| | | | | | |
| Interest expense | | (233.7) | | | (213.8) | | | (57.9) | |
| Interest income | | 26.2 | | | 22.0 | | | 7.0 | |
| Change in fair value of derivatives, net | | — | | | — | | | 1.3 | |
| Other (loss) income, net | | (1.7) | | | 4.7 | | | 1.1 | |
| Foreign exchange (loss) gain | | (1.9) | | | (1.8) | | | 1.0 | |
| Income before income taxes | | 550.1 | | | 282.4 | | | 406.0 | |
| | | | | | |
| Income tax expense | | 137.3 | | | 76.4 | | | 86.2 | |
| Net income | | $ | 412.8 | | | $ | 206.0 | | | $ | 319.8 | |
| | | | | | |
| Net income (loss) attributable to: | | | | | | |
| Controlling interests | | $ | 413.1 | | | $ | 206.5 | | | $ | 319.7 | |
| Non-controlling interests | | — | | | — | | | 0.1 | |
| Redeemable non-controlling interests | | (0.3) | | | (0.5) | | | — | |
| Net income | | $ | 412.8 | | | $ | 206.0 | | | $ | 319.8 | |
| | | | | | |
| Net income attributable to controlling interests: | | 413.1 | | 206.5 | | 319.7 |
| Cumulative dividends on Series A Senior Preferred Shares | | (26.7) | | | (24.3) | | | — | |
| Allocated earnings to Series A Senior Preferred Shares | | (13.7) | | | (7.3) | | | — | |
| Net income available to common stockholders | | $ | 372.7 | | | $ | 174.9 | | | $ | 319.7 | |
| | | | | | |
| Earnings per share available to common stockholders: | | | | | | |
| Basic | | $ | 2.03 | | | $ | 1.05 | | | $ | 2.89 | |
| Diluted | | $ | 2.01 | | | $ | 1.04 | | | $ | 2.86 | |
| | | | | | |
| Weighted average number of shares outstanding: | | | | | | |
| Basic | | 183,958,258 | | 166,963,575 | | 110,781,282 |
| Diluted | | 185,254,557 | | 168,203,981 | | 111,886,025 |
See accompanying notes to the consolidated financial statements.
Consolidated Statements of Comprehensive Income
(Expressed in millions of U.S. dollars)
| | | | | | | | | | | | | | | | | | | | |
| Year ended December 31, | | 2024 | | 2023 | | 2022 |
| | | | | | |
| Net income | | $ | 412.8 | | | $ | 206.0 | | | $ | 319.8 | |
| Other comprehensive income (loss), net of income tax: | | | | | | |
| Foreign currency translation adjustments | | (80.8) | | | 41.1 | | | (29.1) | |
| Comprehensive income | | $ | 332.0 | | | $ | 247.1 | | | $ | 290.7 | |
| | | | | | |
| Comprehensive income (loss) attributable to: | | | | | | |
| Controlling interests | | $ | 332.3 | | | $ | 247.6 | | | $ | 290.6 | |
| Non-controlling interests | | — | | | — | | | 0.1 | |
| Redeemable non-controlling interests | | (0.3) | | | (0.5) | | | — | |
| Comprehensive income | | $ | 332.0 | | | $ | 247.1 | | | $ | 290.7 | |
See accompanying notes to the consolidated financial statements.
Consolidated Balance Sheets
(Expressed in millions of U.S. dollars, except share data)
| | | | | | | | | | | | | | |
| | December 31,
2024 | | December 31,
2023 |
| Assets | | | | |
| Current assets: | | | | |
| Cash and cash equivalents | | $ | 533.9 | | | $ | 576.2 | |
| Restricted cash | | 174.9 | | | 171.7 | |
| Trade and other receivables, net of allowance for credit losses of $7.2 and $6.4, respectively | | 709.4 | | | 731.5 | |
| Prepaid consigned vehicle charges | | 67.9 | | | 66.9 | |
| Inventory | | 121.5 | | | 166.5 | |
| Other current assets | | 77.0 | | | 91.2 | |
| Income taxes receivable | | 30.2 | | | 10.0 | |
| Total current assets | | 1,714.8 | | | 1,814.0 | |
| Property, plant and equipment, net | | 1,275.4 | | | 1,200.9 | |
| Operating lease right-of-use assets | | 1,529.1 | | | 1,475.5 | |
| Other non-current assets | | 98.4 | | | 85.6 | |
| Intangible assets, net | | 2,668.7 | | | 2,914.1 | |
| Goodwill | | 4,511.8 | | | 4,537.0 | |
| Deferred tax assets | | 8.8 | | | 10.3 | |
| Total assets | | $ | 11,807.0 | | | $ | 12,037.4 | |
| | | | |
| Liabilities, Temporary Equity and Stockholders' Equity | | | | |
| Current liabilities: | | | | |
| Auction proceeds payable | | $ | 378.0 | | | $ | 502.5 | |
| Trade and other liabilities | | 782.0 | | | 685.8 | |
| Current operating lease liabilities | | 113.3 | | | 118.0 | |
| Income taxes payable | | 26.2 | | | 8.5 | |
| Short-term debt | | 27.7 | | | 13.7 | |
| Current portion of long-term debt | | 4.1 | | | 14.2 | |
| Total current liabilities | | 1,331.3 | | | 1,342.7 | |
| Long-term operating lease liabilities | | 1,431.1 | | | 1,354.3 | |
| Long-term debt | | 2,622.1 | | | 3,061.6 | |
| Other non-current liabilities | | 97.4 | | | 86.7 | |
| Deferred tax liabilities | | 608.7 | | | 682.7 | |
| Total liabilities | | 6,090.6 | | | 6,528.0 | |
| | | | |
| Temporary equity: | | | | |
| Series A Senior Preferred Shares; shares authorized, issued and outstanding: 485,000,000 (December 31, 2023: 485,000,000) | | 482.0 | | | 482.0 | |
| Redeemable non-controlling interest | | 8.1 | | | 8.4 | |
| | | | |
| Stockholders' equity: | | | | |
Senior preferred and junior preferred stock; unlimited shares authorized; shares issued and outstanding, other than Series A Senior Preferred Shares: nil (December 31, 2023: nil) | | — | | | — | |
| Common stock, no par value; unlimited shares authorized; shares issued and outstanding: 184,732,582 (December 31, 2023: 182,843,942) | | 4,163.1 | | | 4,054.2 | |
| Additional paid-in capital | | 95.4 | | | 88.0 | |
| Retained earnings | | 1,090.3 | | | 918.5 | |
| Accumulated other comprehensive loss | | (124.8) | | | (44.0) | |
| Stockholders' equity | | 5,224.0 | | | 5,016.7 | |
| Non-controlling interests | | 2.3 | | | 2.3 | |
| Total stockholders' equity | | 5,226.3 | | | 5,019.0 | |
| Total liabilities, temporary equity and stockholders' equity | | $ | 11,807.0 | | | $ | 12,037.4 | |
See accompanying notes to the consolidated financial statements.
Consolidated Statements of Changes in Temporary Equity and Stockholders' Equity
(Expressed in millions of U.S. dollars, except where noted)
| | | | | | | | | | | | | | | | | | | | | | | | | | | | | | | | | | | | | | | | | | | | | | | | | | | | | | | | | | | | | | |
| | | | | Redeemable
non-
controlling
interest | | | Attributable to common stockholders | | Non-
controlling
interest | | Total stockholders' equity |
| Series A Senior Preferred Shares | | | | Common stock | | Additional
paid-In
capital | | Retained
earnings | | Accumulated
other
comprehensive
loss | | |
| Shares | | Amount | | | | Shares | | Amount | | | | | |
| Balance, December 31, 2021 | — | | $ | — | | | $ | — | | | | 110,618,049 | | $ | 227.5 | | | $ | 59.5 | | | $ | 839.6 | | | $ | (56.0) | | | $ | 0.5 | | | $ | 1,071.1 | |
| Net income | — | | — | | | — | | | | — | | — | | | — | | | 319.7 | | | — | | | — | | | 319.7 | |
| Other comprehensive loss | — | | — | | | — | | | | — | | — | | | — | | | — | | | (29.1) | | | — | | | (29.1) | |
| | | | | | | | | | | | | | | | | | | | |
| Stock option exercises | — | | — | | — | | | 159,920 | | 7.2 | | | (1.4) | | | — | | | — | | | — | | | 5.8 | |
| Issuance of common stock related to vesting of share units | — | | — | | — | | | 103,394 | | 3.0 | | | (6.8) | | | — | | | — | | | — | | | (3.8) | |
| Share-based continuing employment costs related to business combinations | — | | — | | — | | | — | | 8.6 | | | (1.1) | | | — | | | — | | | — | | | 7.5 | |
| Share-based payments expense | — | | — | | — | | | — | | — | | | 34.2 | | | — | | | — | | | — | | | 34.2 | |
| Equity-classified share units dividend equivalents | — | | — | | — | | | — | | — | | | 0.9 | | | (0.9) | | | — | | | — | | | — | |
| Dividends paid to common stockholders | — | | — | | — | | | — | | — | | | — | | | (115.2) | | | — | | | — | | | (115.2) | |
| Balance, December 31, 2022 | — | | $ | — | | | $ | — | | | | 110,881,363 | | $ | 246.3 | | | $ | 85.3 | | | $ | 1,043.2 | | | $ | (85.1) | | | $ | 0.5 | | | $ | 1,290.1 | |
| Net income (loss) | — | | — | | (0.5) | | | — | | — | | | — | | | 206.5 | | | — | | | — | | | 206.5 | |
| Other comprehensive income | — | | — | | — | | | — | | — | | | — | | | — | | | 41.1 | | | — | | | 41.1 | |
| | | | | | | | | | | | | | | | | | | | |
| Stock option exercises | — | | — | | — | | | 723,443 | | 42.9 | | | (8.4) | | | — | | | — | | | — | | | 34.5 | |
| Issuance of common stock related to vesting of share units | — | | — | | — | | | 467,747 | | 17.4 | | | (36.4) | | | — | | | — | | | — | | | (19.0) | |
| Issuance of common stock related to ESPP | — | | — | | — | | | 180,503 | | 11.4 | | | (2.2) | | | — | | | — | | | — | | | 9.2 | |
| Issuance of common stock related to business combination | — | | — | | — | | | 70,339,723 | | 3,712.9 | | | — | | | — | | | — | | | — | | | 3,712.9 | |
| Share-based continuing employment costs related to business combinations | — | | — | | — | | | — | | 8.3 | | | (5.3) | | | — | | | — | | | — | | | 3.0 | |
| Replacement of share-based awards in business combination | — | | — | | — | | | — | | — | | | 13.1 | | | — | | | — | | | — | | | 13.1 | |
| Share-based payments expense | — | | — | | — | | | — | | — | | | 40.3 | | | — | | | — | | | — | | | 40.3 | |
| Equity-classified share units dividend equivalents | — | | — | | — | | | — | | — | | | 1.6 | | | (1.6) | | | — | | | — | | | — | |
| NCI acquired in business combination | — | | — | | 8.9 | | | — | | — | | | — | | | — | | | — | | | 1.8 | | | 1.8 | |
| Issuance of Series A Senior Preferred Shares and common stock, net of issuance costs | 485,000,000 | | 482.0 | | — | | | 251,163 | | 15.0 | | | — | | | — | | | — | | | — | | | 15.0 | |
| Participating dividends on Series A Senior Preferred Shares | — | | — | | — | | | — | | — | | | — | | | (7.3) | | | — | | | — | | | (7.3) | |
| Preferred dividends on Series A Senior Preferred Shares | — | | — | | — | | | — | | — | | | — | | | (24.3) | | | — | | | — | | | (24.3) | |
| Dividends paid to common stockholders | — | | — | | — | | | — | | — | | | — | | | (298.0) | | | — | | | — | | | (298.0) | |
| Balance, December 31, 2023 | 485,000,000 | | $ | 482.0 | | | $ | 8.4 | | | | 182,843,942 | | $ | 4,054.2 | | | $ | 88.0 | | | $ | 918.5 | | | $ | (44.0) | | | $ | 2.3 | | | $ | 5,019.0 | |
| | | | | | | | | | | | | | | | | | | | | | | | | | | | | | | | | | | | | | | | | | | | | | | | | | | | | | | | | | | | | | |
| | | | | Redeemable
non-
controlling
interest | | | Attributable to common stockholders | | Non-
controlling
interest | | Total stockholders' equity |
| Series A Senior Preferred Shares | | | | Common stock | | Additional
paid-In
capital | | Retained
earnings | | Accumulated
other
comprehensive
loss | | |
| Shares | | Amount | | | | Shares | | Amount | | | | | |
| Net income (loss) | — | | — | | (0.3) | | | — | | — | | | — | | | 413.1 | | | — | | | — | | | 413.1 | |
| Other comprehensive loss | — | | — | | — | | | — | | — | | | — | | | — | | | (80.8) | | | — | | | (80.8) | |
| | | | | | | | | | | | | | | | | | | | |
| Stock option exercises | — | | — | | — | | | 1,044,547 | | 61.4 | | | (12.1) | | | — | | | — | | | — | | | 49.3 | |
| Issuance of common stock related to vesting of share units | — | | — | | — | | | 335,372 | | 14.3 | | | (30.0) | | | — | | | — | | | — | | | (15.7) | |
| Issuance of common stock related to ESPP | — | | — | | — | | | 513,142 | | 32.9 | | | (6.7) | | | — | | | — | | | — | | | 26.2 | |
| Share-based continuing employment costs related to business combinations | — | | — | | — | | | (4,421) | | 0.3 | | | (0.4) | | | — | | | — | | | — | | | (0.1) | |
| | | | | | | | | | | | | | | | | | | | |
| | | | | | | | | | | | | | | | | | | | |
| Share-based payments expense | — | | — | | — | | | — | | — | | | 55.5 | | | — | | | — | | | — | | | 55.5 | |
| Equity-classified share units dividend equivalents | — | | — | | — | | | — | | — | | | 1.1 | | | (1.1) | | | — | | | — | | | — | |
| | | | | | | | | | | | | | | | | | | | |
| | | | | | | | | | | | | | | | | | | | |
| Participating dividends on Series A Senior Preferred Shares | — | | — | | — | | | — | | — | | | — | | | (7.5) | | | — | | | — | | | (7.5) | |
| Preferred dividends on Series A Senior Preferred Shares | — | | — | | — | | | — | | — | | | — | | | (26.7) | | | — | | | — | | | (26.7) | |
| Dividends paid to common stockholders | — | | — | | — | | | — | | — | | | — | | | (206.0) | | | — | | | — | | | (206.0) | |
| Balance, December 31, 2024 | 485,000,000 | | $ | 482.0 | | | $ | 8.1 | | | | 184,732,582 | | $ | 4,163.1 | | | $ | 95.4 | | | $ | 1,090.3 | | | $ | (124.8) | | | $ | 2.3 | | | $ | 5,226.3 | |
See accompanying notes to the consolidated financial statements.
Consolidated Statements of Cash Flows
(Expressed in millions of U.S. dollars)
| | | | | | | | | | | | | | | | | | | | |
| Year ended December 31, | | 2024 | | 2023 | | 2022 |
| Cash provided by (used in): | | | | | | |
| Operating activities: | | | | | | |
| Net income | | $ | 412.8 | | | $ | 206.0 | | | $ | 319.8 | |
| Adjustments for items not affecting cash: | | | | | | |
| Depreciation and amortization | | 444.4 | | | 352.2 | | | 97.2 | |
| Share-based payments expense | | 62.4 | | | 55.8 | | | 41.7 | |
| Deferred income tax benefit | | (69.2) | | | (65.8) | | | (0.3) | |
| Unrealized foreign exchange (gain) loss | | (0.4) | | | 6.6 | | | (6.5) | |
| Gain on disposition of property, plant and equipment | | (3.8) | | | (4.9) | | | (170.8) | |
| Allowance for expected credit losses | | 5.1 | | | 5.9 | | | — | |
| Loss on redemption of notes | | — | | | 3.3 | | | 4.8 | |
| Gain on remeasurement of investment upon acquisition | | — | | | (1.4) | | | — | |
| Amortization of debt issuance costs | | 12.5 | | | 10.1 | | | 3.9 | |
| Amortization of right-of-use assets | | 154.4 | | | 109.9 | | | 19.4 | |
| Inventory write-downs | | 14.9 | | | 7.0 | | | — | |
| Other, net | | (1.3) | | | 3.0 | | | 2.7 | |
| Net changes in operating assets and liabilities | | (99.8) | | | (143.7) | | | 151.2 | |
| Net cash provided by operating activities | | 932.0 | | | 544.0 | | | 463.1 | |
| Investing activities: | | | | | | |
| Acquisition of IAA, net of cash acquired | | — | | | (2,753.9) | | | — | |
| Acquisition of VeriTread, net of cash acquired | | — | | | (24.7) | | | — | |
| Acquisition of SmartEquip, net of cash acquired | | — | | | — | | | (0.1) | |
| Acquisition of Boom and Bucket, net of cash acquired | | (8.6) | | | — | | | — | |
| Property, plant and equipment additions | | (167.4) | | | (227.9) | | | (32.0) | |
| Proceeds on disposition of property, plant and equipment | | 2.6 | | | 32.6 | | | 165.5 | |
| Intangible asset additions | | (109.5) | | | (118.3) | | | (40.0) | |
| Repayment of loans receivable | | 8.1 | | | 4.0 | | | 5.5 | |
| Issuance of loans receivable | | (24.1) | | | (18.8) | | | (22.0) | |
| Other, net | | (2.7) | | | (1.3) | | | 0.3 | |
| Net cash (used in) provided by investing activities | | (301.6) | | | (3,108.3) | | | 77.2 | |
| Financing activities: | | | | | | |
| Issuance of Series A Senior Preferred Shares and common stock, net of issuance costs | | — | | | 496.9 | | | — | |
| Dividends paid to common stockholders | | (206.0) | | | (298.0) | | | (115.2) | |
| | | | | | |
| Dividends paid to Series A Senior Preferred shareholders | | (34.2) | | | (30.4) | | | — | |
| Proceeds from exercise of options and share option plans | | 75.5 | | | 43.7 | | | 5.9 | |
| Payment of withholding taxes on issuance of shares | | (14.8) | | | (15.9) | | | (4.0) | |
| Net increase (decrease) in short-term debt | | 14.5 | | | (15.5) | | | 0.8 | |
| Proceeds from long-term debt | | — | | | 3,175.0 | | | — | |
| Repayment of long-term debt | | (454.4) | | | (654.4) | | | (1,131.0) | |
| Payment of debt issue costs | | (0.3) | | | (41.7) | | | (4.3) | |
| Repayment of finance lease and equipment financing obligations | | (26.5) | | | (19.2) | | | (10.3) | |
| Proceeds of equipment financing obligations | | 2.6 | | | 37.6 | | | — | |
| Payment of contingent consideration | | (1.9) | | | (1.9) | | | — | |
| Net cash (used in) provided by financing activities | | (645.5) | | | 2,676.2 | | | (1,258.1) | |
| Effect of changes in foreign currency rates on cash, cash equivalents, and restricted cash | | (24.0) | | | 10.1 | | | (18.8) | |
| Net (decrease) increase in cash, cash equivalents, and restricted cash | | (39.1) | | | 122.0 | | | (736.6) | |
| Cash, cash equivalents, and restricted cash, beginning of period | | 747.9 | | | 625.9 | | | 1,362.5 | |
| Cash, cash equivalents, and restricted cash, end of period | | $ | 708.8 | | | $ | 747.9 | | | $ | 625.9 | |
See accompanying notes to the consolidated financial statements.
| | |
Notes to the Consolidated Financial Statements (Tabular amounts expressed in millions of United States dollars, except where noted) |
1. Description of Business and Basis of Preparation
Description of Business
RB Global, Inc. and its subsidiaries (collectively referred to as the “Company”, “RB Global”, “we”, “us”, or “our”) is a leading, omnichannel marketplace that provides value-added insights, services and transaction solutions for buyers and sellers of commercial assets and vehicles worldwide. The Company has auction sites in 14 countries and a digital platform to serve customers in approximately 170 countries across a variety of asset classes, including automotive, commercial transportation, construction, government surplus, lifting and material handling, energy, mining and agriculture.
The Company's marketplace brands include Ritchie Bros., the world's largest auctioneer of commercial assets and vehicles offering online bidding, and IAA, a leading global digital marketplace connecting vehicle buyers and sellers. RB Global's portfolio of brands also includes Rouse Services, which provides a complete end-to-end asset management, data-driven intelligence and performance benchmarking system, SmartEquip, an innovative technology platform that supports customers' management of the equipment lifecycle and integrates parts procurement with both original equipment manufacturers and dealers, and VeriTread, an online marketplace for heavy haul transport.
RB Global, Inc. is a company incorporated in Canada under the Business Corporations Act (Ontario), whose shares are publicly traded on the New York Stock Exchange (“NYSE”) and the Toronto Stock Exchange (“TSX”).
Basis of Preparation
These financial statements have been prepared in accordance with United States generally accepted accounting principles (“US GAAP”) and the following accounting policies have been consistently applied, except as otherwise noted, in the preparation of the consolidated financial statements. Unless otherwise indicated, all amounts in the following tables are in millions except share and per share amounts.
2. Significant Accounting Policies
Basis of Consolidation
The consolidated financial statements include the accounts of the Company and its wholly-owned and non-wholly owned subsidiaries in which the Company has a controlling financial interest either through voting rights or means other than voting rights. They include the accounts of RB Global, Inc. and its subsidiaries from their respective dates of formation, acquisition or control. All significant inter-company transactions and balances have been eliminated. Where the Company’s ownership interest in a consolidated subsidiary is less than 100%, the non-controlling interests’ share of these non-wholly owned subsidiaries is reported in the Company’s consolidated balance sheets as a separate component of equity or within temporary equity. The non-controlling interests’ share of the net income of these non-wholly owned subsidiaries is reported in the Company’s consolidated income statements as a deduction from the Company’s net income to arrive at net income attributable to controlling interests of the Company.
Revenue Recognition
Revenues are comprised of:
•Service revenue, including the following:
i.Transactional seller revenues, which includes commissions earned from consignors on the sale of consigned assets, as well as other fees earned from consignors to facilitate the sale of an asset such as towing to our yards, liens search, title processing and online listing and inspection fees;
ii.Transactional buyer revenues, which includes buyer transaction fees based on a tiered structure earned from the purchasers of consigned assets and inventory, as well as other fees earned from buyers to complete the purchase of an asset, such as title processing, late pick-up, buyer platform registration and other administrative processing charges; and
| | |
Notes to the Consolidated Financial Statements (Tabular amounts expressed in millions of United States dollars, except where noted) |
2. Significant Accounting Policies (continued)
iii.Marketplace services revenues, which includes fees earned from various optional services provided to buyers, sellers, or other third-parties, such as transportation, buyer towing, refurbishment, financing, parts procurement, data and appraisal, and other ancillary services.
•Inventory sales revenue, which consists of revenue relating to assets that are purchased by the Company and then resold.
The Company recognizes revenue when control of the promised goods or services is transferred to customers, or upon completion of the performance obligation, in an amount that reflects the consideration we expect to be entitled to in exchange for those goods or services. A performance obligation is a promise in a contract to transfer a distinct good or service, or a series of distinct goods or services, to the customer. A contract’s transaction price is allocated to each distinct performance obligation and recognized as revenue when, or as, the performance obligation is satisfied. The transaction price is reduced by estimates of variable consideration, such as volume rebates and discounts. All estimates, which are evaluated at each reporting period, are based on the Company’s historical experience, anticipated volumes, and judgment.
The Company earns commissions from consignments by offering several contract options:
•Straight commission contracts, where the consignor receives the gross proceeds from the sale less a pre-negotiated commission rate;
•Fixed fee commission contracts, where the consignor receives the gross proceeds from the sale less a fixed flat fee; and
•Guarantee contracts, where the consignor receives a guaranteed minimum amount plus an additional amount if proceeds exceed a specified level.
The Company also offers its customers the option to enter into inventory contracts, where it purchases assets before they are resold in its auctions or marketplaces. The Company may also sell consigned assets or purchased inventory in private sales transactions.
Service Revenue
The Company’s commissions are earned as a pre-negotiated fixed percentage rate of the gross selling price of the asset sold or as a fixed fee. Fixed fees are earned in auction contracts from consignors relating primarily to the sale of vehicles and includes the remarketing of vehicles, including the inbound tow, processing, storage, titling, enhancing and sale at auction. Related costs are deferred and recognized at the time of sale. Other commissions are earned typically when the Company guarantees a certain level of proceeds to a consignor.
With the final acceptance of the winning bid, the highest bidder becomes legally obligated to pay the full purchase price, which is the winning bid of the property purchased and the seller is legally obligated to relinquish the property in exchange for the winning bid less any seller’s commission. For auction and marketplace sales, transactional seller and buyer revenue is recognized when a binding obligation with the buyer is created upon the final acceptance of the winning bid, and the performance obligations, including other sale related services, are satisfied at the end of the sale process. Revenue is measured at the fair value of the consideration received or receivable and is shown net of value-added tax and duties.
Under the standard terms and conditions of its auction and marketplace sales, except for contracts for the sale of some vehicles, the Company is not obligated to pay a consignor for property that has not been paid for by the buyer, provided the property has not been released to the buyer. Under the standard terms and conditions of its vehicle auction and marketplace sales, the Company in certain arrangements may have to pay a consignor for property that has not been paid for by the buyer. If the buyer defaults on its payment obligation, also referred to as a collapsed sale, the sale is cancelled in the period in which the determination is made, and the property is returned to the consignor or placed for sale at a later date. In some cases, if the buyer defaults on its payment obligation but the Company has already paid the consignor for the property, then the property is considered inventory, recognized on the Company's consolidated balance sheets, and placed for sale at a later date. The Company recognizes a provision for expected collapsed or cancelled sales, which is based on an estimate of the service revenues relating to transactions that may not complete and where the buyer may default on its obligation. The Company determines the provision based on historical collapse experience, customer data and reasonable and supportable forecasts of the outcome of such transactions.
| | |
Notes to the Consolidated Financial Statements (Tabular amounts expressed in millions of United States dollars, except where noted) |
2. Significant Accounting Policies (continued)
Guarantee contracts typically include a pre-negotiated percentage of the guaranteed gross proceeds plus a percentage of proceeds in excess of the guaranteed amount. Losses from guarantee contracts are recorded in the period in which the relevant sale is completed or accrued if they become probable and estimable.
The Company may also enter into arrangements with customers and other third parties in the disposition of consigned assets to generate revenues, where it may share commissions or buyer transaction fees. Where commissions or buyer fees are shared with a third party there is judgment in evaluating whether the Company is acting as the principal in the arrangement and reports revenue on a gross basis, or as the agent in the arrangement and reports revenue on a net basis. As part of this evaluation, the Company assesses if it obtains control of the asset or service before the asset is sold and whether it is ultimately primarily responsible for fulfillment of the sale. Where buyer fees are shared with consignors, the consideration is recorded as a reduction of revenue.
Transactional buyer revenue also includes buyer platform registration fees to access certain vehicle auction and marketplace sales for a one- or two-year term which are recognized ratably over the contract term.
Marketplace services revenue is recognized in the period in which the service is provided or the product is delivered to the customer.
Inventory Sales Revenue
Revenue related to inventory contracts is recognized in the period in which the Company's sale process is completed and control of the asset has been transferred to the buyer. Once a binding obligation on the part of a buyer to pay for the inventory is created through the sale process, the Company invoices the buyer for the purchase price of the asset, taxes, and, if applicable, the buyer transaction fee or other buyer fees, and collects payment from the buyer.
Costs of Services
Costs of services incurred in earning revenue are comprised of expenses incurred in direct relation to conducting auctions and earning marketplace services fees.
For our auction sites that conduct weekly auctions in the automotive sector, cost of services includes both full-time and part-time labor, lease expense, towing, onsite customer care support and other operating costs. For our other auction sites that conduct auctions generally once or twice a quarter, mainly in the commercial, construction and transportation sector, cost of services includes direct part-time and temporary labor costs, marketing, travel and other operating costs to support the auction events. In addition, cost of services includes inspection costs, mainly labor and travel costs, to primarily support auctions, and includes fees paid to third parties who may introduce the Company to the seller of the assets sold in the Company's auctions or marketplaces. Cost of services also includes lease expense, full-time and part-time labor and other operating costs to support our GovPlanet weekly auctions.
Costs of services incurred in earning marketplace services fees includes direct labor, ancillary and logistical service expenses, including transportation costs, and other operating costs such as marketing, travel and technology directly related to the services provided. Costs of services excludes depreciation and amortization expenses.
Share-based Payments
The Company uses the fair value method of accounting for share-based payment awards, including stock options, performance based restricted share unit ("PSU"), time-based restricted share unit ("RSU"), and employee share purchase plan (“ESPP”) awards to measure the cost of employee services received in exchange for the stock-based awards. The Company classifies a share-based payment award as an equity or liability payment based on the substantive terms of the award and related arrangements.
PSU and RSU awards granted to senior executives and employees of the Company are measured at fair value on the grant date based on the Company's closing common share price on the date of grant, and its fair value is recognized to shared-based compensation expense over the vesting period with a corresponding increase to APIC recorded in equity. RSUs vest based on the passage of time and include restrictions related to employment. Share-based compensation expense relating to RSUs is recognized using the graded vesting method. The number of PSUs that vest is conditional upon specified market, service, and/or performance vesting conditions being met. The Company has the option to settle PSUs and RSUs in cash or shares. With respect to settling in shares, the Company has the option to either (i) arrange for the purchase shares on the open market on the employee’s behalf based on the cash value that otherwise would be delivered, or (ii) to issue a number of shares equal to the number of units that vest. The Company expects to settle PSUs and RSUs in shares and accordingly classifies these awards as equity.
| | |
Notes to the Consolidated Financial Statements (Tabular amounts expressed in millions of United States dollars, except where noted) |
2. Significant Accounting Policies (continued)
If the PSU includes a market condition, the Company assesses the probability of satisfying the market condition in its estimate of fair value based on a Monte Carlo valuation model. PSUs with market conditions vest based on the passage of time and achievement of performance criteria or market conditions. Share-based payments expense for PSUs with market conditions is recognized regardless of whether the market conditions are satisfied subject to continuing service over the requisite service period.
At the end of each reporting period, the Company revises its estimate of the number of equity instruments expected to vest. The impact of the revision of the original estimates, if any, is recognized in earnings, such that the consolidated expense reflects the revised estimate, with a corresponding adjustment to equity. Dividend equivalents on the equity-classified PSUs and RSUs are recognized as a reduction to retained earnings over the service period.
The cost of stock options is measured at fair value on the date of grant using the Black-Scholes model. The fair value of stock options expected to vest is expensed over the respective service period of the individual awards with the corresponding increase to APIC recorded in equity. Upon exercise, any consideration paid on exercise of the stock options and amounts fully amortized in APIC are credited to the common shares.
Deferred share units ("DSU") granted to members of the Board of Directors of the Company vest immediately upon grant and are not subject to market vesting conditions. The Company expects to settle DSUs in cash, where the settlement amount is determined following cessation of service to the Board of Directors, and accordingly the DSU awards are classified as liability awards. These awards are measured at fair value at the date of grant and expensed to share-based payments expense with recognition of a corresponding liability. These awards are subsequently re-measured at fair value each reporting date up to and including the settlement date based on the closing price of the Company's common shares and changes in fair value are recognized in share-based payments expense.
The impact of forfeitures and fair value revisions to the share-based payment awards, if any, are recognized in earnings such that the cumulative expense reflects the revisions, with a corresponding adjustment to the settlement liability. Liability-classified share unit liabilities are presented in trade and other liabilities.
The Company also recognizes share-based payments expense for its ESPP based on the grant date fair value, which is recognized to earnings using the accelerated method over the requisite service period.
Leases
The Company determines if an arrangement is a lease at inception. The Company may have lease agreements with lease and non-lease components, which are generally accounted for separately. The Company applies a portfolio approach to account for leases of certain similar assets with similar terms. Right-of-Use ("ROU") assets represent the right to use an underlying asset for the lease term and lease liabilities represent the obligation to make lease payments arising from the lease.
The Company considers leases with an initial term of 12 months or less as short-term in nature and does not record such leases on the consolidated balance sheets. For all other leases, ROU assets and lease liabilities are recognized at the lease commencement date based on the present value of lease payments over the lease term, initial direct costs incurred, and prepaid lease payments and exclude lease incentives. The Company includes lease payments for renewal options, purchase options (finance leases), or termination options in its determination of lease term, ROU asset, and lease liability when it is reasonably certain that the Company will exercise such options. As most of the Company's leases do not provide an implicit rate, management uses the Company’s incremental borrowing rate based on the information available at the lease commencement date in determining the present value of lease payments. Management uses the implicit rate when readily determinable.
Operating lease expense is recognized on a straight-line basis over the lease term and is included in costs of services and selling, general and administrative expenses. Finance lease ROU assets are generally amortized over the lease term and are included in depreciation expense. The interest on finance lease liabilities is included in interest expense.
Sale and Leaseback Transactions
If the transfer of an asset pursuant to a sale and leaseback transaction qualifies as a sale, the Company derecognizes the underlying asset and recognizes a gain or loss. The Company recognizes a lease obligation arising from the leaseback and the corresponding ROU asset. If the fair value of the consideration for the sale of an asset does not equal the fair value of the asset, or if the payments for the lease are not at market rates, the Company will make adjustments to measure the sale proceeds at fair value. Any below-market terms
| | |
Notes to the Consolidated Financial Statements (Tabular amounts expressed in millions of United States dollars, except where noted) |
2. Significant Accounting Policies (continued)
are accounted for as a prepayment of lease payments and any above-market terms are accounted for as additional financing provided by the buyer-lessor.
If the transfer of an asset pursuant to a sale and leaseback transaction does not qualify as a sale and control has not transferred, the asset is not derecognized and no gain or loss is recorded as the transaction is accounted for as a financing transaction.
Derivative Financial Instruments
Derivative instruments are recorded on the consolidated balance sheets at fair value. Unrealized gains and losses on derivatives not designated in a hedging relationship are recorded as part of operating income or within change in fair value of derivatives, net in the consolidated income statements depending on the nature of the derivative. Fair values of derivative instruments are determined using inputs based on market conditions existing at the balance sheet date, as well as the settlement date of the derivative, if applicable. Derivatives embedded in non-derivative contracts are recognized separately unless they are closely related to the host contract.
Fair Value Measurement
Fair value is the exit price that would be received to sell an asset or the price paid to transfer a liability in an orderly transaction between market participants at the measurement date.
All assets and liabilities for which fair value is measured or disclosed in the consolidated financial statements at fair value are categorized within the fair value hierarchy, based on the lowest level input that is significant to the fair value measurement or disclosure:
•Level 1: Inputs that are based upon quoted active markets for identical assets or liabilities.
•Level 2: Inputs, other than quoted prices included within Level 1, which are observable either directly or indirectly.
•Level 3: Unobservable inputs where there is little or no market activity for the asset or liability. These inputs reflect management's best estimate of what market participants would use to price the assets or liabilities at the measurement date.
For assets and liabilities that are recognized in the consolidated financial statements at fair value on a recurring basis, the Company determines whether transfers have occurred between levels in the hierarchy by re-assessing categorization at the end of each reporting period.
Foreign Currency Translation
The parent entity’s presentation and functional currency is the United States dollar. The functional currency for each of the parent entity’s subsidiaries is the currency of the primary economic environment in which the entity operates, which is usually the currency of the country of residency.
Accordingly, the financial statements of the Company’s subsidiaries that are not denominated in United States dollars have been translated into United States dollars using the exchange rate at the end of each reporting period for asset and liability amounts and the monthly average exchange rate for amounts included in the determination of earnings. Any gains or losses from the translation of asset and liability amounts are included in foreign currency translation adjustment in other comprehensive income (loss), net of income tax.
In preparing the financial statements of the individual subsidiaries, transactions in currencies other than the entity’s functional currency are recognized at the rates of exchange prevailing at the dates of the transaction. At the end of each reporting period, monetary assets and liabilities denominated in foreign currencies are remeasured at the rates prevailing at that date. Foreign currency differences arising on remeasurement of monetary items are recognized in earnings, except for gains or losses arising from intra-entity foreign currency transactions that are of a long-term investment nature, which are included in foreign currency translation adjustments in other comprehensive income (loss), net of income tax.
Cash and Cash Equivalents and Restricted Cash
Cash and cash equivalents is comprised of cash on hand, deposits with financial institutions, and other short-term, highly liquid investments with original maturity of three months or less and overdraft balances to the extent the financial institution has the legal right of offset. Cash and cash equivalents are readily convertible to known amounts of cash.
| | |
Notes to the Consolidated Financial Statements (Tabular amounts expressed in millions of United States dollars, except where noted) |
2. Significant Accounting Policies (continued)
In certain jurisdictions, local laws require the Company to hold cash in segregated bank accounts, which are used to settle auction proceeds payable resulting from live onsite auctions and online marketplace sales conducted in those regions. In addition, the Company also holds cash generated from its online marketplace sales in separate escrow accounts, for settlement of the respective online marketplace transactions as a part of its secured escrow service. Cash balances relating to these arrangements are reported as restricted cash. Restricted cash balances also include funds held in accounts owned by the Company in support of short-term stand-by letters of credit to provide seller security. Non-current restricted cash consists of funds that are restricted as to withdrawal or use for other than current operations and are designated for expenditure in the acquisition of non-current assets and in business combinations.
Book overdrafts represent outstanding checks and other pending disbursements which are in excess of cash account balances with a right of offset. Such amounts are recorded in accounts payable and are reflected as an operating activity in the consolidated statements of cash flows.
Trade and Other Receivables
Trade accounts receivable primarily includes amounts due from customers as a result of the sale of assets at auctions and online
marketplaces, fees to be collected from buyers, and amounts due for services provided by the Company such as parts procurement, data, transportation and logistics and financing. Trade and other receivables also includes amounts to be collected from landlords of certain leased facilities for reimbursement of leasehold improvements, as well as advance charges that the Company paid on a seller's behalf in the sale of vehicles. In addition, trade and other receivables includes the current portion of loans receivable.
Accounts receivable are reported net of an allowance for credit losses. The allowance for credit losses is the Company's best estimate of the amount of probable credit losses in existing receivables, and is based on historical write-off experience, customer economic data and reasonable and supportable forecasts of future economic conditions. The Company regularly reviews the allowance for credit losses and past due balances for collectability. Account balances are charged against the allowance when the Company believes that the receivable will not be recovered.
Advances Against Auction Contracts
Advances against auction contracts arise when the Company pays owners, in advance, a portion of the expected gross auction proceeds from the sale of the related assets at future auctions. The Company’s policy is to limit the amount of advances to a percentage of the estimated gross auction proceeds from the sale of the related assets, and before advancing funds, require proof of owner’s title to and equity in the assets, as well as receive delivery of the assets.
Advances against auction contracts are generally secured by the assets to which they relate, as the Company requires owners to provide promissory notes and security instruments registering the Company as a charge against the asset. Advances against auction contracts are usually settled within two weeks of the date of sale, as they are netted against the associated auction proceeds payable to the owner.
Concentration of Credit Risk
The Company maintains cash, cash equivalents and restricted cash with high quality financial institutions and diversifies its deposits across several banks. Foreign exchange forward contracts are only executed with reputable lenders under our credit facility. Financial instruments that potentially subject the Company to credit risk consist primarily of advanced charges receivable, trade accounts receivable and loans receivable. Advanced charges receivable are deducted from the sales proceeds upon settlement after an auction event or disposition of the assets. The majority of trade accounts receivable are collateralized with assets held in the Company's possession. In addition, buyers do not take possession of assets until the balance due for those assets is paid in full. The risk associated with trade accounts receivable concentration is also limited due to the large number of accounts and their geographic dispersion. In some cases, trade accounts receivables relating to other services are deducted from the sales proceeds upon settlement, if applicable. Trade and other receivables may also include amounts to be collected from landlords for certain leased facilities for reimbursement of leasehold improvements, and these advances are secured by the underlying real estate related to the lease or the Company has the option to purchase the property if costs are not reimbursed timely by the landlord. The Company participates in certain lending arrangements that are fully collateralized and secured by certain equipment whose fair value exceeds the loan amount at inception, and in some arrangements, also secured by other assets.
Prepaid Consigned Vehicle Charges
| | |
Notes to the Consolidated Financial Statements (Tabular amounts expressed in millions of United States dollars, except where noted) |
2. Significant Accounting Policies (continued)
Prepaid consigned vehicle charges include the inbound tow, titling, and enhancement charges associated with a consigned vehicle on a specific identification basis. These prepaid charges are recorded in cost of services at the date the vehicle is sold and revenue is recognized.
Inventory
Inventory consists of commercial assets and vehicles purchased for resale. Inventory is valued at the lower of cost and net realizable value, where net realizable value represents the expected sale price upon disposition of the asset inclusive of buyer fees and other fees, less make-ready costs and costs of disposal and transportation. The significant elements of cost include the acquisition price, in-bound transportation costs, and make-ready costs to prepare the inventory for sale that are not selling expenses. Write-downs to the carrying value of inventory are recorded in cost of inventory sold on the consolidated income statements. Cost of inventory sold is determined using a specific identification basis.
Property, Plant and Equipment
Property, plant and equipment are stated at cost less accumulated depreciation. Cost includes all expenditures that are directly attributable to the acquisition or development of the asset.
The cost of self-constructed assets includes the cost of materials and direct labor, any other costs directly attributable to bringing the assets to working condition for their intended use, the costs of dismantling and removing items and restoring the site on which they are located (if applicable), and capitalized interest on qualifying assets. Subsequent costs are included in the asset’s carrying amount or recognized as a separate asset, as appropriate, only when it is probable that future economic benefits associated with the item will flow to the Company and the cost of the item can be measured reliably.
All repairs and maintenance costs are charged to earnings during the period in which they are incurred. Gains and losses on disposal of an item of property, plant and equipment are determined based on the difference between the proceeds received from disposal of an item and its carrying amount and are recognized in operating income on the income statements.
The basis for depreciation of the cost of an item and their estimated useful lives based on their usage is as follows:
| | | | | | | | | | | | | | |
| Asset | | Basis | | Rate / term |
| Land improvements and site improvements | | Declining balance | | 10 | % |
| Buildings and building improvements | | Straight-line | | 15 - 30 years |
| Yard, automotive and office equipment | | Declining balance | | 20 - 30% |
| Computer software and equipment | | Straight-line | | 3 - 5 years |
| Leasehold improvements | | Straight-line | | Lesser of lease term or economic life |
No depreciation is provided on freehold land or on assets in the course of construction or development. Depreciation of property, plant and equipment under finance leases is recorded in depreciation expense.
Long-lived Assets Held for Sale
Long-lived assets, or disposal groups comprising assets and liabilities, that are expected to be recovered primarily through sale rather than through continuing use are classified as assets held for sale. Immediately before classification as held for sale, the assets, or components of a disposal group, are measured at carrying amount in accordance with the Company’s accounting policies. Thereafter, the assets, or disposal group, are measured at the lower of their carrying amount and fair value less cost to sell and are not depreciated.
Intangible Assets
Intangible assets are measured at cost less accumulated amortization and accumulated impairment losses. Cost includes all expenditures that are directly attributable to the acquisition or development of the asset, net of any amounts received in relation to those assets. Costs of internally developed software and technology assets are amortized on a straight-line basis over their remaining estimated useful lives. Costs incurred prior to establishing technological feasibility or prior to the beginning of the application development stage of the asset are charged to operations as such costs are incurred. Once technological feasibility is established or the
| | |
Notes to the Consolidated Financial Statements (Tabular amounts expressed in millions of United States dollars, except where noted) |
2. Significant Accounting Policies (continued)
application development stage has begun, directly attributable costs are capitalized until the software and technology assets are available for use.
Amortization is recognized in earnings on a straight-line basis over the estimated useful lives of intangible assets from the date that they are available for use. The amortization periods of finite-lived intangible assets are re-evaluated periodically when facts and circumstances indicate that the remaining useful lives may have changed. Indefinite-lived trade names and trademarks are not amortized. The estimated useful lives of the Company's intangible assets are as follows:
| | | | | | | | |
| Asset | | Rate / term |
| Trade names and trademarks | | 2 - 15 years or indefinite-lived |
| Customer relationships | | 6 - 20 years |
| Software and technology assets | | 3 - 7 years |
Customer relationships includes relationships with buyers and sellers.
Cloud Computing Arrangements
The Company capitalizes costs incurred to implement cloud computing arrangements that are service contracts hosted by third-party vendors within prepaid assets, presented in other current assets and other non-current assets on the consolidated balance sheets. Once the implementation of the cloud computing arrangement is complete and ready for its intended use, the implementation costs are amortized to selling, general and administrative expense over the expected term of the associated hosting arrangement on a straight-line basis, taking into account any renewal options which are reasonably certain to be exercised.
Impairment of Long-lived and Indefinite-lived Assets
Long-lived assets, comprised of property, plant and equipment, ROU assets, and intangible assets subject to amortization, are assessed for impairment whenever events or circumstances indicate that their carrying value may not be recoverable. For the purpose of impairment testing, long-lived assets are grouped and tested for recoverability at the lowest level that generates independent cash flows. An impairment loss is recognized when the carrying value of the assets or asset groups is greater than the future projected undiscounted cash flows. The impairment loss is calculated as the excess of the carrying value over the fair value of the asset or asset group. Fair value is based on valuation techniques or third party appraisals. Significant estimates and judgments are applied in determining these cash flows and fair values.
Indefinite-lived intangible assets are tested annually for impairment as of December 31, and more frequently if indicators of potential impairment exist. The Company has the option of performing a qualitative assessment to first determine whether the quantitative impairment test is necessary. This involves an assessment of qualitative factors to determine the existence of events or circumstances that would indicate whether it is more likely than not that the fair value of the indefinite-lived intangible asset is less than its carrying value. If the qualitative assessment indicates it is not more likely than not that the fair value is less than its carrying value, a quantitative impairment test is not required. Where a quantitative impairment test is required, the procedure is to compare the indefinite-lived intangible asset’s fair value with its carrying amount. An impairment loss is recognized as the difference between the indefinite-lived intangible asset’s carrying amount and its fair value.
Goodwill
Goodwill represents the excess of the purchase price of an acquired business over the fair value assigned to the assets acquired and liabilities assumed in a business combination.
Goodwill is not amortized, but it is tested annually for impairment at the reporting unit level as of December 31, and more frequently if indicators of potential impairment are identified. The Company performs a qualitative impairment assessment if it determines that it is more likely than not that the fair value of a reporting unit to which goodwill belongs is less than its carrying amount.
If a quantitative impairment test is required, the reporting unit’s fair value is compared to its carrying amount, including goodwill and if the reporting unit's carrying amount exceeds its fair value, an impairment loss is recognized. In quantitative analyses, the determination of fair value requires estimates and assumptions. The Company bases these estimates on historical and anticipated
| | |
Notes to the Consolidated Financial Statements (Tabular amounts expressed in millions of United States dollars, except where noted) |
2. Significant Accounting Policies (continued)
results, industry trends, economic analysis, and various other assumptions, including assumptions as to the occurrence of future events.
Deferred Financing Costs
Deferred financing costs represent the unamortized debt issuance costs incurred on the issuance of the Company’s long-term debt and are amortized to interest expense using the effective interest method over the lives of the related long term debt. Deferred financing costs are presented as a reduction in the carrying amount of the related long term debt or are deferred on the balance sheets in other non-current assets as a deferred charge until drawn, associated with the benefit of being able to access capital over the contractual term of the long term-debt. Deferred financing costs presented in other non-current assets relate to the Company's revolving credit facilities. The Company expenses the portion of deferred financing costs associated with partial repayments of debt to interest expense.
Income Taxes
The current tax expense is based on taxable profit for the period and includes any adjustments to tax payable in respect of previous years. Taxable profit differs from income before income taxes as reported in the consolidated income statements because it excludes (i) items of income or expense that are taxable or deductible in other years and (ii) items that are never taxable or deductible. The Company’s liability for current tax is calculated using tax rates that have been enacted by the balance sheet date.
Income taxes are accounted for using the asset and liability method in accordance with ASC 740, Income Taxes. Deferred income tax assets and liabilities are based on temporary differences, which are differences between the accounting basis and the tax basis of the assets and liabilities, and non-capital loss, capital loss, and tax credits carryforwards are measured using the enacted tax rates and laws expected to apply when these differences reverse. Deferred tax benefits, including non-capital loss, capital loss, and tax credits carryforwards, are recognized to the extent that realization of such benefits is considered more likely than not. The effect on deferred tax assets and liabilities of a change in tax rates is recognized in earnings in the period that enactment occurs. When realization of deferred income tax assets does not meet the more-likely-than-not criterion for recognition, a valuation allowance is recognized.
Interest and penalties related to income taxes, including unrecognized tax benefits, are recorded in income tax expense in the consolidated income statements.
Liabilities for uncertain tax positions are recognized in accordance with ASC 740, Income Taxes. The Company evaluates the tax position for recognition by determining if the weight of available evidence indicates that it is more likely than not that the position will be sustained based on the technical merits, including resolution of related appeals or litigation processes, if any. Recognized income tax positions are measured at the largest amount that is more than 50% likely of being realized. The Company continually assesses the likelihood and amount of potential adjustments and adjusts the income tax provision, income taxes payable, and deferred taxes in the period in which the facts that give rise to a revision become known.
Redeemable Non-controlling Interest
Redeemable non-controlling interest is classified as temporary equity on the consolidated balance sheet, as the holder may demand
cash and put the non-controlling interest to the Company. Redeemable non-controlling interest is initially carried at its acquisition date
fair value. If it becomes probable that the redeemable non-controlling interest will be redeemed, the Company then will recognize any
change in its estimated redemption value immediately to retained earnings and adjust the carrying amount to equal the estimated
redemption value at the end of each reporting period.
Redeemable Convertible Preferred Stock
Redeemable convertible preferred stock is classified as temporary equity on the consolidated balance sheet because it could become
redeemable due to a change in control, which would be outside of the Company’s control and requires a cash payment upon
redemption. The redeemable convertible preferred stock is initially carried at fair value, and if redemption becomes probable, the
Company will recognize any change in its estimated redemption value immediately to retained earnings and adjust the carrying
amount to equal the estimated redemption value at the end of each reporting period. Direct and incremental costs incurred in
connection with the issuance of redeemable convertible stock are recorded against the proceeds received and included in its initial
carrying amount.
| | |
Notes to the Consolidated Financial Statements (Tabular amounts expressed in millions of United States dollars, except where noted) |
2. Significant Accounting Policies (continued)
Earnings Per Share
Basic earnings per share (“EPS”) is calculated based on the two-class method, given that the Company’s Series A Senior Preferred Shares are considered a participating security as it contractually entitles its holders to participate in the Company’s earnings. The two-class method is an earnings allocation method for computing earnings or losses per share when a Company’s capital structure includes common stock and participating securities. The two-class method determines earnings per share between holders of common stock and the Company’s participating preferred stock based on dividends declared and their respective participation rights in undistributed earnings.
Net income available to common stockholders is computed as: net income attributable to controlling interests less cumulative dividends on Series A Senior Preferred Shares and allocated earnings to Series A Senior Preferred Shares. Basic EPS is calculated by dividing net income available to common stockholders by the weighted average common stock outstanding. Diluted EPS is calculated similarly, except that it is computed based upon the lower of the two-class method or the if-converted method, which includes the effects of the assumed conversion of the Series A Senior Preferred Shares, and the effect of shares issuable under the Company’s stock-based incentive plans if such effect is dilutive.
Diluted EPS includes the effects of the assumed conversion of potentially dilutive securities, which includes unvested PSUs, unvested RSUs, outstanding stock options and stock committed under the ESPP. The dilutive effect of potentially dilutive securities is reflected in diluted EPS by application of the treasury stock method. Under the treasury stock method, an increase in the fair market value of the Company’s common stock can result in a greater dilutive effect from potentially dilutive securities.
Defined Contribution Plans
Certain employees of the Company are members of retirement benefit plans to which the Company matches up to a specified percentage of employee contributions or, in certain jurisdictions, contributes a specified percentage of payroll costs as mandated by the local authorities. The only obligation of the Company with respect to the retirement benefit plans is to make the specified contributions. Contributions to the defined contribution plans are charged to the consolidated income statements reflecting the period of the employee's service.
Advertising Costs
Advertising costs are expensed as incurred and included in costs of services and selling, general and administrative expenses on the consolidated income statements. Advertising expense, directly related to auction events, recorded in costs of services was $10.6 million, $9.4 million, and $9.9 million for 2024, 2023, and 2022, respectively. Advertising expense recorded in selling, general and administrative expenses was $24.6 million, $26.1 million, and $16.7 million for 2024, 2023, and 2022, respectively.
Self-insurance Reserves
The Company self-insures a portion of employee medical benefits, as well as a portion of its automobile, general liability and workers’
compensation claims. The Company has insurance coverage that limits the exposure on individual claims. The cost of the insurance is
expensed over the contract periods. Utilizing historical claims experience, the Company records an accrual for the claims related to its
employee medical benefits, automobile, general liability and workers’ compensation claims based upon the expected amount of all
such claims, which includes the cost of claims that have been incurred but not reported.
Business Combinations
Business combinations are accounted for using the acquisition method. The purchase price is determined based on the fair value of the assets transferred, liabilities assumed, and equity interests issued, after considering any transactions that are separate from the business combination and which are accounted for separately. The Company allocates the aggregate of the fair value of the purchase consideration transferred to the tangible and intangible assets acquired and the liabilities assumed at their estimated fair values on the date of acquisition with any excess recorded as goodwill. The purchase price allocation may be provisional during a measurement period of up to one year to provide reasonable time to obtain the information necessary to identify and measure the assets acquired and liabilities assumed. Any such measurement period adjustments are recognized to the assets and liabilities assumed, with the corresponding offset to goodwill, in the period in which the adjustment amounts are determined. Acquisition-related costs are expensed as incurred as a component of acquisition-related and integration costs.
| | |
Notes to the Consolidated Financial Statements (Tabular amounts expressed in millions of United States dollars, except where noted) |
2. Significant Accounting Policies (continued)
Where the acquired assets and liabilities do not meet the definition of a business, or substantially all of the fair value of the gross assets acquired are concentrated in a single identifiable asset or group of similar identifiable assets, the acquisition is considered an asset acquisition, and is accounted for using the cost accumulation model where the cost of the acquisition, including certain transaction costs, are allocated to the assets acquired on the basis of relative fair values.
Recently Adopted Accounting Pronouncements
In November 2023, the FASB issued Accounting Standards Update ("ASU") 2023-07, Segment Reporting (Topic 280): Improvements to Reportable Segment Disclosures which requires enhanced disclosure regarding reportable segments. The Company adopted the ASU during the fiscal year ended December 31, 2024 and the required disclosures are included in Note 5.
Recently Issued Accounting Pronouncements
In December 2023, the FASB issued ASU 2023-09, Income Taxes (Topic 740): Improvements to Income Tax Disclosures, which will require enhanced annual disclosures regarding rate reconciliations and expanded disclosures of income taxes paid information. The amendments are effective for the Company for the fiscal year ended December 31, 2025.
In November 2024, the FASB issued ASU 2024-03, Income Statement - Reporting Comprehensive Income (Subtopic 220-40): Disaggregation of Income Statement Expenses, which will require disclosure and additional information of specific expense categories in the notes to the financial statements, The amendments are effective for the Company for the fiscal year ended December 31, 2027 and interim periods in the fiscal year ended December 31, 2028.
The Company is in the process of evaluating the impact that the above pronouncements may have on its consolidated financial statements and related disclosures.
3. Significant Judgments, Estimates and Assumptions
The preparation of financial statements in conformity with US GAAP requires management to make judgments, estimates and assumptions that affect the reported amounts of assets and liabilities and the disclosures of contingent liabilities at the date of the financial statements, and the reported amounts of revenues and expenses during the reporting period. Actual results could differ from those estimates.
The accounting for the Company's position in regards to the Notice of Assessment and Statement of Interest (“NOA”) received from the Canada Revenue Agency ("CRA"), described in Note 8, required significant judgment and an assessment over whether it is more likely than not that the Company's tax position will be sustained. The matter required management to evaluate the tax technical merits and assess the likelihood of its resolution at appeals or through litigation.
4. Acquisitions
(a)Boom and Bucket Acquisition
On October 31, 2024, the Company completed its acquisition of Boom and Bucket Inc. ("Boom and Bucket") for a total purchase price of approximately $10 million. Boom and Bucket is a digital dealer that connects buyers and sellers in the sale of used heavy equipment through its online fixed price marketplace platform. The acquisition was accounted for as an asset acquisition as substantially all of the fair value of the gross assets acquired is concentrated in a single identifiable asset, the developed technology platform. The purchase price consisted primarily of cash proceeds paid to the former shareholders and reimbursement of transaction costs. The acquired developed technology platform will be amortized from its acquisition date over its estimated useful life of three years.
(b)IAA Acquisition
On March 20, 2023, the Company completed its acquisition of IAA, Inc. ("IAA") for a total purchase price of approximately $6.6 billion. The Company acquired IAA to create a leading omnichannel marketplace for vehicle buyers and sellers. IAA stockholders received $12.80 per share in cash and 0.5252 shares of the Company for each share of IAA common stock they owned (the “Exchange Ratio”). As such, the Company paid $1.7 billion in cash consideration and issued 70.3 million shares of its common stock. In addition, the Company repaid $1.2 billion of IAA’s net debt, which included all outstanding borrowings and unpaid fees under IAA’s credit agreement and $500.0 million principal amount of IAA senior notes, at a redemption price equal to 102.75% of the principal amount
| | |
Notes to the Consolidated Financial Statements (Tabular amounts expressed in millions of United States dollars, except where noted) |
4. Acquisitions (continued)
plus accrued and unpaid interest. IAA’s outstanding equity awards were also cancelled and exchanged into equivalent outstanding equity awards relating to the Company’s common stock, based on the equity award exchange ratio of 0.763139.
The acquisition was accounted for in accordance with ASC 805, Business Combinations. The following table summarizes the final allocation of the purchase price to the fair value of assets acquired and liabilities assumed:
| | | | | |
| Purchase price (cash: $1,714.2 million; fair value of common shares issued: $3,712.9 million; repayment of net debt: $1,157.1 million; reimbursement of costs: $48.8 million; and fair value of exchanged equity awards: $13.1 million) | $ | 6,646.1 | |
| |
| Assets acquired: | |
| Cash and cash equivalents | 166.6 | |
| Trade and other receivables | 497.3 | |
| Inventory | 57.1 | |
| Other current assets | 28.0 | |
| Income taxes receivable | 0.6 | |
| Property, plant and equipment | 618.5 | |
| Operating lease right-of-use assets | 1,289.7 | |
| Other non-current assets | 34.8 | |
| Intangible assets | 2,712.1 | |
| Liabilities assumed: | |
| Auction proceeds payable | 60.7 | |
| Trade and other liabilities | 257.0 | |
| Current operating lease liability | 77.5 | |
| Income taxes payable | 3.5 | |
| Long-term operating lease liability | 1,192.7 | |
| Other non-current liabilities | 24.3 | |
| Deferred tax liabilities | 689.5 | |
| |
| Fair value of identifiable net assets acquired | 3,099.5 | |
| Goodwill acquired on acquisition | $ | 3,546.6 | |
The following table summarizes the final fair values of the identifiable intangible assets acquired:
| | | | | | | | | | | | | | |
| Asset | | Preliminary fair value
at acquisition | | Weighted average
amortization period |
| Customer relationships | | $ | 2,293.5 | | | 15 years |
| Developed technology | | 245.2 | | | 4 years |
| Trade names and trademarks | | 166.6 | | | 5 years |
| Software under development | | 6.8 | | | — | |
| | $ | 2,712.1 | | | 13.4 years |
Goodwill relates to synergies expected to be achieved from the operations of the combined company, the assembled workforce of IAA, and intangible assets that do not qualify for separate recognition. Expected synergies include both increased revenue opportunities and the cost savings from the planned integration of platform infrastructure, facilities, personnel, and systems. The transaction is considered a non-taxable business combination and the goodwill is not deductible for tax purposes.
(c)VeriTread Acquisition
On January 3, 2023, the Company acquired 8,889,766 units of VeriTread LLC ("VeriTread"), for $25.1 million cash consideration from its existing unitholders and acquired another 1,056,338 units through an investment of $3.0 million cash. As a result, the
| | |
Notes to the Consolidated Financial Statements (Tabular amounts expressed in millions of United States dollars, except where noted) |
4. Acquisitions (continued)
Company increased its investment in VeriTread to 75% and obtained control of VeriTread pursuant to an amended operating agreement on January 18, 2023. Immediately prior to the acquisition, the Company owned 11% of VeriTread, with an acquisition date fair value of $4.3 million based on the per unit purchase price, and therefore, upon remeasurement of its previously held interest, the Company recorded a gain of $1.4 million in other income, net at acquisition. VeriTread is a transportation technology company that provides an online marketplace solution for open deck transport, connecting shippers and service providers.
Concurrently, the Company entered into a put/call agreement with one of the minority unitholders of VeriTread for its remaining units, another 21% ownership interest. Pursuant to this agreement, the minority unitholder has rights, in certain circumstances, to put or sell its remaining units of VeriTread to the Company, subject to VeriTread achieving certain performance targets at a predetermined value or fair value, depending on the timing and targets achieved. The Company also has the right to call or purchase the remaining units of the minority unitholder upon achievement of certain integration milestones at fair value. The redeemable non-controlling interest is classified in temporary equity on the consolidated balance sheets. On the acquisition date the Company determined that redemption of the redeemable non-controlling interest was probable. An additional non-controlling interest of 4% held in VeriTread is classified within equity as that interest does not contain put/call options.
The acquisition was accounted for in accordance with ASC 805, Business Combinations. The following table summarizes the final allocation of the purchase price to the fair value of assets acquired and liabilities assumed:
| | | | | |
| Purchase price (cash: $28.1 million; and fair value of previously held equity interest: $4.3 million) | $ | 32.4 | |
| |
| Fair value of identifiable net assets acquired | 17.9 | |
| Redeemable non-controlling interest | (8.9) | |
| Non-controlling interest | (1.8) | |
| |
| Goodwill acquired on acquisition | $ | 25.2 | |
The final fair value of identifiable net assets acquired consists of cash and cash equivalents of $3.4 million, trade and other receivables and other current assets of $0.9 million, trade and other liabilities of $1.1 million, and identifiable intangible assets of $14.7 million as summarized in the following table:
| | | | | | | | | | | | | | |
| Asset | | Fair value
at acquisition | | Weighted average
amortization period |
| Customer relationships | | $ | 7.2 | | | 5 years |
| Software and technology assets | | 7.1 | | | 7 years |
| Trade names and trademarks | | 0.4 | | | 2 years |
| | $ | 14.7 | | | 5.9 years |
Goodwill relates to benefits expected from the acquisition of VeriTread’s business, its assembled workforce and associated technical expertise, as well as anticipated synergies from applying VeriTread’s transportation platform, network of transport carriers, equipment database and services to the Company’s customer base. This acquisition is expected to accelerate the Company’s marketplace strategy, which brings services, insights, and transaction solutions together to improve the overall customer experience. The transaction is considered a non-taxable business combination and the goodwill is not deductible for tax purposes.
5. Segment Information
The Company has one operating and reportable segment which reflects the manner in which the Company’s Chief Operating Decision Maker (“CODM”), its Chief Executive Officer, reviews and assesses the performance of the business and allocates resources.
The information used by the CODM to assess performance and allocate resources includes various measures of segment profit, however, for the purposes of the disclosures required by ASC 280, Segment Reporting and ASU 2023-07, Segment Reporting (Topic 280): Improvements to Reportable Segment Disclosures, the Company has determined that the measure most consistent with the measurement principles used in measuring the corresponding amounts in the consolidated financial statements is net income. Consolidated financial information is used to monitor forecast versus actual results in order to make key operating decisions. The
| | |
Notes to the Consolidated Financial Statements (Tabular amounts expressed in millions of United States dollars, except where noted) |
5. Segment Information (continued)
CODM does not evaluate the performance of the Company or allocate resources at any level below the consolidated level or based on the Company's assets or liabilities.
The following discloses the significant segment expenses, in the context of deriving net income, that are regularly provided to and reviewed by the CODM reconciled to the segment’s net income:
| | | | | | | | | | | | | | | | | | | | |
| At December 31, | | 2024 | | 2023 | | 2022 |
| Revenue | | $ | 4,284.2 | | | $ | 3,679.6 | | | $ | 1,733.8 | |
| Significant segment expenses | | | | | | |
| Costs of services | | 1,415.7 | | | 1,007.6 | | | 168.1 | |
| Cost of inventory sold | | 863.8 | | | 893.6 | | | 608.6 | |
| Selling, general and administrative | | 773.9 | | | 743.7 | | | 539.9 | |
| Acquisition-related and integration costs | | 29.0 | | | 216.1 | | | 37.3 | |
| Depreciation and amortization | | 444.4 | | | 352.2 | | | 97.2 | |
| Interest expense | | 233.7 | | | 213.8 | | | 57.9 | |
| Income tax expense | | 137.3 | | | 76.4 | | | 86.2 | |
| Other segment items | | (26.4) | | | (29.8) | | | (181.2) | |
| Net income | | $ | 412.8 | | | $ | 206.0 | | | $ | 319.8 | |
Other segment items consists of gain on disposition of property, plant and equipment, change in fair value of derivatives, net, interest income, and foreign exchange (loss) gain, as reported on the consolidated income statements.
The following tables summarize revenue and property, plant, and equipment by geographic area based on the location of the underlying auction activity or rendering of services and location of the underlying assets:
| | | | | | | | | | | | | | | | | | | | |
| Year ended December 31, | | 2024 | | 2023 | | 2022 |
| Revenue | | | | | | |
| United States | | $ | 3,094.1 | | | $ | 2,591.6 | | | $ | 970.9 | |
| Canada | | 640.6 | | | 551.5 | | | 375.7 | |
| Europe | | 333.0 | | | 321.8 | | | 143.2 | |
| Australia | | 137.2 | | | 136.7 | | | 181.3 | |
| Other | | 79.3 | | | 78.0 | | | 62.7 | |
| | $ | 4,284.2 | | | $ | 3,679.6 | | | $ | 1,733.8 | |
| | | | | | | | | | | | | | | | | | | | |
| At December 31, | | 2024 | | 2023 | | 2022 |
| Property, plant, and equipment | | | | | | |
| United States | | $ | 947.7 | | | $ | 884.9 | | | $ | 241.9 | |
| Canada | | 176.4 | | | 155.0 | | | 87.3 | |
| Europe | | 113.0 | | | 117.5 | | | 86.7 | |
| Australia | | 18.2 | | | 20.2 | | | 20.0 | |
| Other | | 20.1 | | | 23.3 | | | 23.2 | |
| | $ | 1,275.4 | | | $ | 1,200.9 | | | $ | 459.1 | |
The geographic composition of operating lease right-of-use assets is similar to that of property, plant, and equipment.
| | |
Notes to the Consolidated Financial Statements (Tabular amounts expressed in millions of United States dollars, except where noted) |
6. Revenue
During the year ended December 31, 2024 the Company updated its presentation of disaggregated revenue to be consistent with how management currently evaluates its financial and business performance. The prior year disaggregation of revenue amounts have been recast to conform with current period presentation.
The following table summarizes the Company's revenue from the rendering of services and the sale of inventory:
| | | | | | | | | | | | | | | | | | | | |
| Year ended December 31, | | 2024 | | 2023 | | 2022 |
| Transactional seller revenue | | $ | 939.4 | | | $ | 851.7 | | | $ | 514.6 | |
| Transactional buyer revenue | | 2,067.1 | | | 1,593.2 | | | 330.6 | |
| Marketplace services revenue | | 357.1 | | | 287.6 | | | 205.4 | |
| Total service revenue | | 3,363.6 | | | 2,732.5 | | | 1,050.6 | |
| Inventory sales revenue | | 920.6 | | | 947.1 | | | 683.2 | |
| | $ | 4,284.2 | | | $ | 3,679.6 | | | $ | 1,733.8 | |
During fiscal 2024 approximately 22% (2023: 19%) of consolidated revenues were associated with vehicles supplied by the Company's three (2023: three) largest provider customers.
7. Operating Expenses
Acquisition-related and Integration Costs
Acquisition-related and integration costs consist of operating expenses incurred in connection with business combinations, such as due
diligence, advisory, legal, integration, severance, acceleration of share-based payments expense, and share-based continuing
employment costs. Integration costs primarily include expenses incurred with third-parties to support integration activities to achieve
cost synergies and integration goals relating to recent acquisitions.
The following is a summary of our acquisition-related and integration costs by significant acquisition and nature:
| | | | | | | | | | | | | | | | | | | | |
| Year ended December 31, | | 2024 | | 2023 | | 2022 |
| IAA acquisition | | | | | | |
| Financing | | $ | — | | | $ | 30.0 | | | $ | — | |
| Severance | | 13.8 | | | 41.1 | | | — | |
| Integration | | 11.7 | | | 34.5 | | | — | |
| Acceleration of share-based payments expense | | 1.0 | | | 6.8 | | | — | |
| Legal | | — | | | 12.3 | | | 7.8 | |
| Investment banking, consulting and other acquisition-related costs | | 1.2 | | | 68.8 | | | 13.5 | |
| Settlement of pre-existing contractual arrangement | | — | | | 16.3 | | | — | |
| | 27.7 | | 209.8 | | 21.3 | |
| | | | | | |
| Other acquisitions | | 1.3 | | 6.3 | | 16.0 |
| | $ | 29.0 | | | $ | 216.1 | | | $ | 37.3 | |
Other acquisitions primarily consists of costs in connection with the acquisitions of Boom and Bucket, VeriTread, SmartEquip, and Rouse Services, as well as costs incurred with the terminated Euro Auctions acquisition in 2022.
| | |
Notes to the Consolidated Financial Statements (Tabular amounts expressed in thousands of United States dollars, except where noted) |
7. Operating Expenses (continued)
Depreciation and Amortization
| | | | | | | | | | | | | | | | | | | | |
| Year ended December 31, | | 2024 | | 2023 | | 2022 |
| Depreciation | | $ | 103.6 | | | $ | 86.2 | | | $ | 31.4 | |
| Amortization | | 340.8 | | | 266.0 | | | 65.8 | |
| | $ | 444.4 | | | $ | 352.2 | | | $ | 97.2 | |
8. Income Taxes
The components of the provision for income taxes are as follows:
| | | | | | | | | | | | | | | | | | | | |
| Year ended December 31, | | 2024 | | 2023 | | 2022 |
| Canadian: | | | | | | |
| Current tax expense | | $ | 74.3 | | | $ | 43.4 | | | $ | 60.9 | |
| Deferred tax expense | | (5.7) | | | (2.7) | | | 2.7 | |
| | | | | | |
| Foreign: | | | | | | |
| Current tax expense before application of operating loss carryforwards | | 132.3 | | | 100.2 | | | 29.6 | |
| Tax benefit of operating loss carryforwards | | (0.1) | | | (1.4) | | | (4.0) | |
| Total current tax expense | | 132.2 | | | 98.8 | | | 25.6 | |
| Deferred tax (benefit) | | (63.5) | | | (63.1) | | | (3.0) | |
| Total deferred tax (benefit) | | (63.5) | | | (63.1) | | | (3.0) | |
| | $ | 137.3 | | | $ | 76.4 | | | $ | 86.2 | |
The provision for income taxes was different from the Canadian and provincial statutory rate applied to income before taxes and is reconciled as follows:
| | | | | | | | | | | | | | | | | | | | |
| Year ended December 31, | | 2024 | | 2023 | | 2022 |
| Earnings before income tax | | $ | 550.1 | | | $ | 282.4 | | | $ | 406.0 | |
| Statutory federal and provincial tax rate in British Columbia, Canada | | 27.00 | % | | 27.00 | % | | 27.00 | % |
| Expected income tax expense | | $ | 148.5 | | | $ | 76.2 | | | $ | 109.6 | |
| | | | | | |
| Different tax rates of subsidiaries operating in foreign jurisdictions | | (10.9) | | | (3.7) | | | (6.4) | |
| Non-deductible expenses | | 4.1 | | | 11.1 | | | 7.7 | |
| Executive compensation and fringe benefits | | 3.5 | | | 5.0 | | | 0.3 | |
| Non-taxable gain on capital items | | 0.1 | | | (0.4) | | | (19.4) | |
| Benefit of Foreign-Derived Intangible Income (FDII) | | (3.2) | | | (6.9) | | | — | |
| | | | | | |
| Unrecognized tax benefits | | 5.5 | | | 2.0 | | | (1.5) | |
| Equity compensation | | (5.1) | | | (3.9) | | | (2.3) | |
| | | | | | |
| Other | | (5.2) | | | (3.0) | | | (1.8) | |
| | $ | 137.3 | | | $ | 76.4 | | | $ | 86.2 | |
Permanently reinvested undistributed pre-tax earnings of the Company's foreign subsidiaries were approximately $297.6 million for the year ended December 31, 2024 (2023: $113.1 million; 2022: $93.1 million). Earnings retained by subsidiaries as at December 31, 2024 were approximately $878.6 million (2023: $676.7 million). If the undistributed earnings of foreign subsidiaries were to be remitted, income tax expense and withholding tax expense would need to be recognized, net of any applicable foreign tax credits. It is not practicable for the Company to determine the additional tax that may be incurred upon remittance of these earnings.
| | |
Notes to the Consolidated Financial Statements (Tabular amounts expressed in thousands of United States dollars, except where noted) |
8. Income Taxes (continued)
The Company offsets all deferred tax assets and liabilities by tax filing jurisdiction, as well as any related valuation allowance, and presents them as a single non-current deferred income tax asset or non-current deferred income tax liability. Deferred tax assets and deferred tax liabilities were as follows:
| | | | | | | | | | | | | | |
| At December 31, | | 2024 | | 2023 |
| Deferred tax assets: | | | | |
| Working capital | | $ | 25.1 | | | $ | 33.6 | |
| Property, plant and equipment | | 4.9 | | | 5.2 | |
| Share-based compensation | | 14.4 | | | 11.9 | |
| Tax losses and tax credit carryforwards | | 39.1 | | | 37.9 | |
| Lease liabilities | | 381.8 | | | 356.2 | |
| Notes receivable/payable | | 8.8 | | | 2.3 | |
| Other | | 17.2 | | | 9.6 | |
| Total deferred tax assets | | 491.3 | | | 456.7 | |
| | | | |
| Deferred tax liabilities: | | | | |
| Property, plant and equipment | | $ | (74.7) | | | $ | (86.4) | |
| Goodwill | | (23.6) | | | (12.8) | |
| Intangible assets | | (586.6) | | | (653.5) | |
| Right-of-use assets | | (376.2) | | | (354.7) | |
| Long-term debt | | — | | | (0.9) | |
| Notes receivable/payable | | (17.7) | | | (5.6) | |
| Other | | (5.6) | | | (6.0) | |
| Total deferred tax liabilities | | (1,084.4) | | | (1,119.9) | |
| | | | |
| Net deferred tax liabilities | | $ | (593.1) | | | $ | (663.2) | |
| | | | |
| Valuation allowance | | (6.8) | | | (9.1) | |
| Net deferred tax | | $ | (599.9) | | | $ | (672.3) | |
At December 31, 2024, the Company had non-capital loss carryforwards that are available to reduce taxable income in the future years. These non-capital loss carryforwards expire as follows:
| | | | | |
| 2025 | $ | — | |
| 2026 | — | |
| 2027 | 0.3 | |
| 2028 | — | |
| 2029 and thereafter | 62.4 | |
| $ | 62.7 | |
The Company has capital loss carryforwards of approximately $67.1 million (2023: $73.4 million) available to reduce future capital gains and interest deduction carryforwards of $63.5 million (2023: $60.7 million), both of which carryforward indefinitely.
Tax losses are denominated in the currency of the countries in which the respective subsidiaries are located and operate. Fluctuations in currency exchange rates could reduce the U.S. dollar equivalent value of these tax loss and tax credit carry forwards in future years.
| | |
Notes to the Consolidated Financial Statements (Tabular amounts expressed in thousands of United States dollars, except where noted) |
8. Income Taxes (continued)
A reconciliation of the beginning and ending amount of unrecognized tax benefits from uncertain tax positions is as follows:
| | | | | | | | | | | | | | |
| At December 31, | | 2024 | | 2023 |
| Unrecognized tax benefits, beginning of year | | $ | 25.1 | | | $ | 16.0 | |
| Increases – tax positions related to acquisitions | | 0.3 | | | 8.0 | |
| Increases – tax positions taken in prior period | | 5.1 | | | 1.2 | |
| Decreases – tax positions taken in prior period | | — | | | (0.4) | |
| Increases – tax positions taken in current period | | 3.1 | | | 4.1 | |
| Settlement and lapse of statute of limitations | | (5.7) | | | (4.0) | |
| Effect of foreign currency translation | | (1.2) | | | 0.2 | |
| Unrecognized tax benefits, end of year | | $ | 26.7 | | | $ | 25.1 | |
At December 31, 2024, the Company had gross unrecognized tax benefits of $26.7 million (2023: $25.1 million). Of this total, $18.7 million (2023: $13.6 million) represents the net amount of unrecognized tax benefits that, if recognized, would favorably impact the effective tax rate.
The Company records interest expense and penalties related to unrecognized tax benefits within the Company's provision for income taxes on the consolidated income statements. At December 31, 2024, the Company had accrued $4.4 million (2023: $4.4 million) for interest and penalties that have been included in the above reconciliation table, and during the year ended December 31, 2024 the Company has recognized $0.1 million recovery (2023: $0.6 million) in interest and penalties in the consolidated income statements.
The Company is routinely subject to tax audits and reviews in various jurisdictions around the world. Tax authorities may challenge the manner in which the Company has filed its tax returns and reported its income.
On December 3, 2024, the CRA issued the Company an NOA for CA$79.1 million (Canadian dollars) (approximately $55.1 million), for the taxation years 2010 through 2015, inclusive of CA$37.7 million in income taxes (approximately $26.3 million), and CA$41.4 million in interest and penalties (approximately $28.9 million). The CRA is asserting that one of the Company’s Luxembourg subsidiaries which was in operation from 2010 to 2020 was resident in Canada from 2010 through 2015 and that its worldwide income should be subject to Canadian income taxation.
The Company plans to object to the notice of assessment as it believes it is and has been in full compliance with Canadian tax laws and intends to pursue all available administrative and judicial remedies necessary to resolve this matter. As such, the Company plans to file a Notice of Objection with the CRA in March 2025 and accordingly has paid a deposit of CA$39.5 million (approximately $27.6 million) to the CRA in early February 2025, the minimum required by law as part of the CRA’s objection process. In the event that the Company prevails in its objection or subsequent legal proceedings, the deposit would be refunded with interest to the Company.
In the event that the Company’s tax filing position is not upheld by either the CRA or by a court of last resort, the Company would incur and record the amounts assessed in income tax, interest and penalties in its consolidated financial statements, which could have a material negative effect on the Company’s results of operations.
In addition, during the third quarter of 2024, the CRA has requested information regarding the 2016 to 2020 taxation years for the same matter, which the Company provided to the CRA in January 2025. The Company has not received a notice of assessment relating to the 2016 to 2020 taxation years. Depending on the outcome of this matter with the CRA, the Company could incur additional income taxes, penalties and interest relating to the 2016 to 2020 taxation years, which could have a material negative effect on its results of operations.
At December 31, 2024, the Company has not recorded any amounts relating to this matter in the consolidated financial statements because it is the Company’s conclusion that it is more likely than not that the Company’s tax filing position will ultimately be sustained.
The Company is unable to predict the ultimate outcome of this matter and the final disposition of any appeals, or litigation, which could take numerous years to resolve.
| | |
Notes to the Consolidated Financial Statements (Tabular amounts expressed in thousands of United States dollars, except where noted) |
9. Earnings Per Share Available to Common Stockholders
| | | | | | | | | | | | | | | | | | | | |
| Year ended December 31, | | 2024 | | 2023 | | 2022 |
| Net income available to common stockholders | | $ | 372.7 | | | $ | 174.9 | | | $ | 319.7 | |
| | | | | | |
| | | | | | |
| Basic weighted average shares outstanding | | 183,958,258 | | 166,963,575 | | 110,781,282 |
| Weighted average effect of dilutive securities: | | | | | | |
| Share units | | 684,066 | | 689,290 | | 516,144 |
| Stock options and employee share purchase plan | | 612,233 | | 551,116 | | 588,599 |
| Diluted weighted average shares outstanding | | 185,254,557 | | 168,203,981 | | 111,886,025 |
| | | | | | |
| Earnings per share available to common stockholders: | | | | | | |
| Basic | | $ | 2.03 | | | $ | 1.05 | | | $ | 2.89 | |
| Diluted | | $ | 2.01 | | | $ | 1.04 | | | $ | 2.86 | |
10. Supplemental Cash Flow Information
Net Changes in Operating Assets and Liabilities
| | | | | | | | | | | | | | | | | | | | |
| Year ended December 31, | | 2024 | | 2023 | | 2022 |
| Trade and other receivables | | $ | 14.8 | | | $ | (36.8) | | | $ | (44.1) | |
| Prepaid consigned vehicle charges | | (1.5) | | | (66.6) | | | — | |
| Inventory | | 26.2 | | | (10.7) | | | (7.2) | |
| Advances against auction contracts | | 14.1 | | | (12.6) | | | (5.7) | |
| Prepaid expenses and deposits | | 1.0 | | | 1.2 | | | 2.6 | |
| Income taxes receivable | | (20.5) | | | (6.6) | | | 16.8 | |
| Auction proceeds payable | | (113.2) | | | (12.1) | | | 139.1 | |
| Trade and other liabilities | | 104.2 | | | 174.5 | | | 18.6 | |
| Income taxes payable | | 16.7 | | | (37.2) | | | 35.2 | |
| Operating lease obligation | | (134.3) | | | (124.5) | | | (12.9) | |
| Other | | (7.3) | | | (12.3) | | | 8.8 | |
| | $ | (99.8) | | | $ | (143.7) | | | $ | 151.2 | |
Other Supplemental Cash Flow Information
| | | | | | | | | | | | | | | | | | | | |
| Year ended December 31, | | 2024 | | 2023 | | 2022 |
| Interest paid, net of interest capitalized | | $ | 228.8 | | | $ | 163.4 | | | $ | 38.0 | |
| Interest received | | 26.2 | | | 22.0 | | | 7.0 | |
| Net income taxes paid | | 201.0 | | | 180.0 | | | 29.6 | |
| Non-cash purchase of property, plant and equipment under finance leases | | 37.7 | | | 12.7 | | | 13.4 | |
| Non-cash right of use assets obtained in exchange for new lease obligations | | 231.7 | | | 188.7 | | | 30.3 | |
| | |
Notes to the Consolidated Financial Statements (Tabular amounts expressed in thousands of United States dollars, except where noted) |
11. Fair Value Measurement
The following table summarizes the fair values and carrying amounts of the Company's financial instruments that are required to be recorded or disclosed at fair value on a recurring basis:
| | | | | | | | | | | | | | | | | | | | | | | | | | | | | |
| | | December 31, 2024 | | December 31, 2023 |
| Category | | Carrying
amount | | Fair value | | Carrying
amount | | Fair value |
| | | | | | | | | |
| Loans receivable | Level 2 | | $ | 53.6 | | | $ | 53.3 | | | $ | 37.7 | | | $ | 37.6 | |
| Derivative financial assets | Level 2 | | — | | | — | | | 0.4 | | | 0.4 | |
| Derivative financial liabilities | Level 2 | | 0.2 | | | 0.2 | | | — | | | — | |
| Contingent consideration liability | Level 3 | | 4.8 | | | 4.8 | | | 5.2 | | | 5.2 | |
| Long-term debt | | | | | | | | | |
| | | | | | | | | |
| Secured Notes | Level 1 | | 544.8 | | | 563.8 | | | 543.2 | | | 565.1 | |
| Unsecured Notes | Level 1 | | 790.9 | | | 837.5 | | | 789.5 | | | 848.0 | |
| Term loans | Level 2 | | 1,290.5 | | | 1,297.5 | | | 1,743.1 | | | 1,758.1 | |
The fair value of loans receivable with a maturity date greater than one year are determined by estimating discounted cash flows using
market rates. The fair value of derivative financial assets and derivative financial liabilities, which consist of forward currency contracts, are determined using observable inputs, including foreign currency spot exchange rates and forward pricing curves, and considers the credit risk of the Company and its counterparties. The fair value of the contingent consideration liability, which relates to IAA's acquisition of Marisat, Inc. in 2021, is determined using certain unobservable inputs, including the likelihood of the achievement of volume targets. The fair values of the Secured Notes and Unsecured Notes are determined by reference to a quoted market price traded in an over-the-counter broker market. The carrying values of the term loans, before deduction of deferred debt issuance costs, approximate their fair values as the interest rates on the loans are short-term in nature.
12. Derivative Financial Instruments
The Company enters into forward currency contracts from time to time to manage exposure to foreign currency exchange rate
fluctuations recognized by its subsidiaries on certain loans receivable and significant intercompany balances. The unrealized gain
(loss) on forward currency contracts recognized within foreign exchange (loss) gain is as follows:
| | | | | | | | | | | | | | | | | | | | |
| Year ended December 31, | | 2024 | | 2023 | | 2022 |
| Unrealized gain (loss) on forward currency contracts | | $ | 0.5 | | | $ | 0.4 | | | $ | (4.6) | |
The total gross notional amount of forward currency contracts outstanding as at December 31, 2024 is $48.1 million (2023: $33.9 million).
| | |
Notes to the Consolidated Financial Statements (Tabular amounts expressed in thousands of United States dollars, except where noted) |
13. Trade and Other Receivables
| | | | | | | | | | | | | | |
| | December 31,
2024 | | December 31,
2023 |
| Advanced charges receivable | | $ | 347.3 | | | $ | 374.7 | |
| Trade accounts receivable | | 301.7 | | | 315.8 | |
| Loans receivable | | 35.4 | | | 21.8 | |
| Consumption taxes receivable | | 25.6 | | | 21.1 | |
| Other receivables | | 6.6 | | | 4.5 | |
| | 716.6 | | | 737.9 | |
| Less: allowance for credit losses | | (7.2) | | | (6.4) | |
| | $ | 709.4 | | | $ | 731.5 | |
The Company generally has possession of assets or asset titles collateralizing a significant portion of trade receivables. Trade receivables are due for settlement within seven days of the date of sale, after which they are interest bearing. Consumption taxes receivable are deemed fully recoverable unless disputed by the relevant tax authority. Other receivables are unsecured and non-interest bearing.
The following table presents the activity in the allowance for credit losses on trade receivables and loans receivables for the period ended December 31, 2024:
| | | | | | | | | | | | | | |
| | December 31,
2024 | | December 31,
2023 |
| Allowance for credit losses, beginning of year | | $ | 6.4 | | | $ | 3.3 | |
| Provision | | 5.1 | | | 5.9 | |
| Write-offs charged against the allowance | | (4.3) | | | (2.8) | |
| Allowance for credit losses, end of year | | $ | 7.2 | | | $ | 6.4 | |
Loans Receivable
The Company participates in certain lending arrangements that are fully collateralized and secured by certain equipment, and in some arrangements, also secured by other assets. These arrangements typically have terms of one to five years. In an event of default under these agreements, the Company will be entitled to the proceeds of disposition of the collateral to recover its loans receivable balance. The allowance for credit losses is not significant.
14. Inventory
At each period end, inventory is reviewed to ensure that it is recorded at the lower of cost and net realizable value. During the year ended December 31, 2024, the Company recorded inventory write-downs of $14.9 million (2023: $7.0 million; 2022: $4.4 million) as a component of cost of inventory sold.
15. Other Current Assets
| | | | | | | | | | | | | | |
| | December 31,
2024 | | December 31,
2023 |
| Prepaid expenses and deposits | | $ | 52.3 | | | $ | 52.5 | |
| | | | |
| Inventory deposits | | 17.4 | | | 16.5 | |
| Advances against auction contracts | | 7.3 | | | 21.9 | |
| Derivative financial assets | | — | | | 0.3 | |
| | $ | 77.0 | | | $ | 91.2 | |
| | |
Notes to the Consolidated Financial Statements (Tabular amounts expressed in millions of United States dollars, except where noted) |
16. Property, Plant and Equipment
| | | | | | | | | | | | | | | | | | | | |
| At December 31, 2024 | | Cost | | Accumulated
depreciation | | Net book value |
| Land | | $ | 610.9 | | | $ | — | | | $ | 610.9 | |
| Buildings and improvements | | 499.6 | | | (243.0) | | | 256.6 | |
| Yard, automotive and office equipment | | 348.1 | | | (157.7) | | | 190.4 | |
| Computer software and equipment | | 109.2 | | | (83.0) | | | 26.2 | |
| Leasehold improvements | | 174.3 | | | (66.4) | | | 107.9 | |
| Assets under development | | 83.4 | | | — | | | 83.4 | |
| | $ | 1,825.5 | | | $ | (550.1) | | | $ | 1,275.4 | |
| | | | | | | | | | | | | | | | | | | | |
| At December 31, 2023 | | Cost | | Accumulated
depreciation | | Net book value |
| Land | | $ | 549.2 | | | $ | — | | | $ | 549.2 | |
| Buildings and improvements | | 491.1 | | | (236.1) | | | 255.0 | |
| Yard, automotive and office equipment | | 306.0 | | | (117.5) | | | 188.5 | |
| Computer software and equipment | | 108.2 | | | (79.5) | | | 28.7 | |
| Leasehold improvements | | 160.0 | | | (37.3) | | | 122.7 | |
| Assets under development | | 56.8 | | | — | | | 56.8 | |
| | $ | 1,671.3 | | | $ | (470.4) | | | $ | 1,200.9 | |
During the year ended December 31, 2024, interest of $4.5 million (2023: $1.8 million; 2022: $0.1 million) was capitalized to the cost of assets under development.
Additions during the year include $37.6 million (2023: $12.6 million; 2022: $13.2 million) of property, plant and equipment under finance leases.
On March 17, 2022, the Company completed the sale and leaseback of a parcel of land including all buildings, in Bolton, Ontario, Canada for a total sale consideration of CA$208.2 million (approximately $165 million) net of closing and transaction costs, and recognized a gain on disposition of property, plant and equipment of $169.1 million.
17. Other Non-current Assets
| | | | | | | | | | | |
| December 31,
2024 | | December 31,
2023 |
| Refundable deposits | $ | 30.1 | | | $ | 27.9 | |
| Loans receivable | 18.2 | | | 15.9 | |
| Cloud computing implementation costs | 17.8 | | | 9.9 | |
| Investments | 11.9 | | | 12.9 | |
| Tax receivable | 6.0 | | | 9.1 | |
| Deferred debt issue costs | 2.8 | | | 4.0 | |
| Other | 11.6 | | | 5.9 | |
| $ | 98.4 | | | $ | 85.6 | |
| | |
Notes to the Consolidated Financial Statements (Tabular amounts expressed in millions of United States dollars, except where noted) |
18. Intangible Assets
| | | | | | | | | | | | | | | | | | | | |
| At December 31, 2024 | | Cost | | Accumulated
amortization | | Net book value |
| Trade names and trademarks | | $ | 220.5 | | | $ | (63.2) | | | $ | 157.3 | |
| Customer relationships | | 2,538.1 | | | (393.7) | | | 2,144.4 | |
| Software and technology assets | | 781.1 | | | (416.9) | | | 364.2 | |
| Software under development | | 2.8 | | | — | | | 2.8 | |
| | | | | | |
| | $ | 3,542.5 | | | $ | (873.8) | | | $ | 2,668.7 | |
| | | | | | | | | | | | | | | | | | | | |
| At December 31, 2023 | | Cost | | Accumulated
amortization | | Net book value |
| Trade names and trademarks | | $ | 221.9 | | | $ | (29.7) | | | $ | 192.2 | |
| Customer relationships | | 2,553.1 | | | (225.0) | | | 2,328.1 | |
| Software and technology assets | | 670.4 | | | (285.5) | | | 384.9 | |
| Software under development | | 8.9 | | | — | | | 8.9 | |
| | | | | | |
| | $ | 3,454.3 | | | $ | (540.2) | | | $ | 2,914.1 | |
At December 31, 2024, a net carrying amount of $52.7 million (December 31, 2023: $59.0 million) included in intangible assets was not subject to amortization, $49.9 million of which relates to certain trade names and trademarks and the remainder relates to software under development.
During the year ended December 31, 2024, interest of $1.0 million (2023: $1.6 million; 2022: $0.4 million) was capitalized to the cost of software under development.
At December 31, 2024, estimated annual amortization expense for the next five years ended December 31 are as follows:
| | | | | |
| 2025 | $ | 340.2 | |
| 2026 | 319.3 | |
| 2027 | 244.9 | |
| 2028 | 192.9 | |
| 2029 | 178.7 | |
| $ | 1,276.0 | |
19. Goodwill
| | | | | |
| Balance, December 31, 2022 | $ | 948.8 | |
| Additions from business combinations | 3,572.4 | |
| Effect of foreign currency translation | 15.8 | |
| Balance, December 31, 2023 | 4,537.0 | |
| |
| Effect of foreign currency translation | (25.2) | |
| Balance, December 31, 2024 | $ | 4,511.8 | |
| | |
Notes to the Consolidated Financial Statements (Tabular amounts expressed in millions of United States dollars, except where noted) |
20. Trade and Other Liabilities
| | | | | | | | | | | | | | |
| | December 31, 2024 | | December 31, 2023 |
| Book overdrafts | | $ | 276.5 | | | $ | 129.1 | |
| Accrued liabilities | | 237.3 | | | 294.5 | |
| Trade payables | | 139.7 | | | 138.9 | |
| Taxes payable | | 63.4 | | | 63.7 | |
| Current portion of finance leases and equipment financing obligations | | 26.0 | | | 24.4 | |
| Deferred revenue | | 20.6 | | | 17.5 | |
| Share unit liabilities | | 8.4 | | | 7.6 | |
| Other payables | | 10.1 | | | 10.1 | |
| | $ | 782.0 | | | $ | 685.8 | |
Taxes payable includes value added tax, sales tax, and digital services tax.
21. Debt
| | | | | | | | | | | | | | | | | | | | |
| | Interest Rate1 | | December 31,
2024 | | December 31,
2023 |
| Short-term debt | | 7.07 | % | | $ | 27.7 | | | $ | 13.7 | |
| | | | | | |
| Long-term debt: | | | | | | |
| Term loans (maturing September 2026): | | | | | | |
| Term Loan A Facility loan denominated in Canadian dollars, secured | | 5.85 | % | | 72.5 | | | 83.1 | |
| Term Loan A Facility loan denominated in US dollars, secured | | 6.92 | % | | 1,225.0 | | | 1,675.0 | |
| Less: unamortized debt issuance costs | | | | (7.0) | | | (15.0) | |
| | | | | | |
| Senior secured and unsecured notes: | | | | | | |
| Senior secured notes due in March 2028 | | 6.75 | % | | 550.0 | | | 550.0 | |
| Less: unamortized debt issuance costs | | | | (5.2) | | | (6.8) | |
| Senior unsecured notes due in March 2031 | | 7.75 | % | | 800.0 | | | 800.0 | |
| Less: unamortized debt issuance costs | | | | (9.1) | | | (10.5) | |
| Total long-term debt | | | | 2,626.2 | | | 3,075.8 | |
| Less: current portion of long-term debt | | | | 4.1 | | | 14.2 | |
| Long-term debt | | | | $ | 2,622.1 | | | $ | 3,061.6 | |
1 Interest rates on short-term debt and term loans reflect the weighted-average interest rates on borrowings as of December 31, 2024.
At December 31, 2024, the Company had unused committed revolving credit facilities aggregating $705.9 million that are available until September 2026 subject to certain covenant restrictions, and unused uncommitted revolving credit facilities aggregating $15.0 million with no maturity date. The Company was in compliance with all financial and other covenants applicable to the credit facilities at December 31, 2024.
Term Loans
In 2016, the Company entered into a credit agreement with a syndicate of lenders (as amended and restated, supplemented or
otherwise modified from time to time, the “Credit Agreement”). The Credit Agreement is comprised of multicurrency revolving
facilities (the “Revolving Facilities”) and the Term Loan A facility (the “TLA Facility”). The TLA Facility is comprised of a facility
| | |
Notes to the Consolidated Financial Statements (Tabular amounts expressed in millions of United States dollars, except where noted) |
21. Debt (continued)
denominated in U.S. dollars (the “USD TLA Facility”) and a facility denominated in Canadian dollars (the “CAD TLA Facility”). TLA Facility borrowings bear interest at a benchmark rate plus an applicable margin. The Credit Agreement matures on September 21, 2026.
On March 20, 2023, with the closing of the acquisition of IAA, the USD TLA Facility was funded for $1.8 billion and the existing
delayed-draw term facility of CAD $115.9 million was refinanced and converted to the CAD TLA Facility. The TLA Facility loans
are subject to quarterly installments of 1.25% of principal, with the balance payable at maturity. During the year ended
December 31, 2024, the Company repaid $450.0 million of principal on the USD TLA Facility (2023: $150.0 million). As of December 31, 2024, there are no mandatory principal repayments remaining on the USD TLA Facility until maturity of the debt.
Senior Secured and Unsecured Notes
On March 15, 2023, the Company completed the offering of (i) $550.0 million aggregate principal amount of 6.75% senior secured notes due March 15, 2028 (the “Secured Notes”) and (ii) $800.0 million aggregate principal amount of 7.75% senior unsecured notes due March 15, 2031 (the “Unsecured Notes”, and together with the Secured Notes, the “Notes”). The gross proceeds of the Notes were used, along with the TLA Facility, to fund the acquisition of IAA. Interest on the Notes is payable in cash semi-annually in
arrears on March 15 and September 15 of each year, and began on September 15, 2023. The Secured Notes are jointly and severally
guaranteed on a senior secured basis and the Unsecured Notes are jointly and severally guaranteed on a senior unsecured basis by
certain of the Company’s subsidiaries.
At December 31, 2024, principal repayments for the remaining period to the contractual maturity for our long term debt are as follows: | | | | | |
| |
| 2025 | $ | 4.1 | |
| 2026 | 1,293.4 | |
| 2027 | — | |
| 2028 | 550.0 | |
| 2029 | — | |
| Thereafter | 800.0 | |
| $ | 2,647.5 | |
22. Other Non-current Liabilities
| | | | | | | | | | | | | | |
| | December 31,
2024 | | December 31,
2023 |
| Unrecognized tax benefits | | $ | 26.7 | | | $ | 25.1 | |
| Finance lease liabilities | | 36.7 | | | 16.4 | |
| Equipment financing obligations | | 26.1 | | | 36.9 | |
| Other | | 7.9 | | | 8.3 | |
| | $ | 97.4 | | | $ | 86.7 | |
Equipment financing obligations are generally due in blended monthly installments over the remaining terms of the agreements which mature between 2025 and 2029.
23. Temporary Equity, Stockholders' Equity and Dividends
Series A Senior Preferred Shares
The Series A Senior Preferred Shares are convertible into common stock and were issued at an initial conversion price of $73.00 per share, which is subject to customary anti-dilution adjustment provisions. The conversion price is $71.58 per share as of December 31, 2024. The Series A Senior Preferred Shares carry a 5.5% preferred dividend, which is payable quarterly, in cash or in shares at the Company's option, and are entitled to participate on an as-converted basis in the Company's regular quarterly common share dividends, subject to a $0.27 per share per quarter floor.
| | |
Notes to the Consolidated Financial Statements (Tabular amounts expressed in millions of United States dollars, except where noted) |
23. Temporary Equity, Stockholders' Equity and Dividends (continued)
On the fourth anniversary of the issuance date of February 1, 2023, holders will have the right to increase the preferred dividend to 7.5%, and on the ninth anniversary of the issuance date, holders will have the right to increase the preferred dividend to a fixed percentage equal to the greater of (a) 600 bps over the daily simple SOFR as then in effect and (b) 10.50%, subject, in each case, to the Company’s right to redeem the Series A Senior Preferred Shares for which a dividend rate increase has been demanded.
Upon consummation of one or more specified change of control transactions, the holders will have the right to require the Company to repurchase the Series A Senior Preferred Shares in cash provided, however, that each holder, at its option, may elect instead to convert its Series A Senior Preferred Shares into the applicable change of control consideration. In addition, the Company has the right to redeem the Series A Senior Preferred Shares in the event of a change of control transaction where the successor entity is not traded on certain eligible markets. The possible future redemption of the Series A Senior Preferred Shares as a result of a change in control has been assessed as not probable at December 31, 2024.
Holders of the Series A Senior Preferred Shares are entitled to vote together with the common stock on an as-converted basis on all matters permitted by applicable law, subject to certain exceptions to enable compliance with applicable antitrust law. The Series A Senior Preferred Shares rank, with respect to rights as to dividends, distributions, redemptions and payments upon the liquidation, dissolution and winding up of the Company, (a) senior to all of the junior preferred stock, common stock and any other class or series of capital shares of the Company, issued or authorized after the Series A Senior Preferred Shares issuance date, the terms of which do not expressly provide that such class or series ranks senior to or on a parity with the Series A Senior Preferred Shares, (b) on a parity basis with each other class or series of capital shares issued or authorized after the Series A Senior Preferred Shares issuance date, the terms of which expressly provide that such class or series ranks on a parity basis with the Series A Senior Preferred Shares, and (c) junior with each other class or series of capital shares issued or authorized after the Series A Senior Preferred Shares issuance date, the terms of which expressly provide that such class or series ranks on a senior basis to the Series A Senior Preferred Shares.
Redeemable Non-controlling Interests
Redeemable non-controlling interest relates to a put/call agreement with one of the minority unitholders of VeriTread under which the holder can put its remaining 21% interest in VeriTread to the Company, if certain performance targets are met. As the purchase of the remaining 21% interest from the minority unitholder is outside the control of the Company the redeemable non-controlling interest is classified in temporary equity on the consolidated balance sheets. At December 31, 2024 the Company assessed that redemption of the non-controlling interest remains probable and that there has been no material change to the estimated redemption value.
The Company also recognized an additional 4% non-controlling interest in VeriTread within equity as that interest does not contain put/call options.
| | |
Notes to the Consolidated Financial Statements (Tabular amounts expressed in millions of United States dollars, except where noted) |
23. Temporary Equity, Stockholders' Equity and Dividends (continued)
Common Stock Dividends
Declared and Paid
| | | | | | | | | | | | | | | | | | | | | | | | | | | | | |
| Declaration date | | Dividend per share | | Record date | | Total dividends | | Payment date |
| Year ended December 31, 2024: | | | | | | | | | |
| Fourth quarter 2023 | January 19, 2024 | | $ | 0.27 | | | February 9, 2024 | | $ | 49.3 | | | March 1, 2024 |
| First quarter 2024 | May 8, 2024 | | 0.27 | | | May 29, 2024 | | 49.6 | | | June 20, 2024 |
| Second quarter 2024 | August 2, 2024 | | 0.29 | | | August 28, 2024 | | 53.5 | | | September 18, 2024 |
| Third quarter 2024 | November 6, 2024 | | 0.29 | | | November 27, 2024 | | 53.6 | | | December 18, 2024 |
| | | | | | | | | |
| Year ended December 31, 2023: | | | | | | | | | |
| Fourth quarter of 2022 | January 13, 2023 | | $ | 0.27 | | | February 10, 2023 | | $ | 30.0 | | | March 3, 2023 |
| Special Dividend | March 6, 2023 | | 1.08 | | | March 17, 2023 | | 120.4 | | | March 28, 2023 |
| First quarter 2023 | May 9, 2023 | | 0.27 | | | May 30, 2023 | | 49.1 | | | June 20, 2023 |
| Second quarter 2023 | August 2, 2023 | | 0.27 | | | August 23, 2023 | | 49.2 | | | September 13, 2023 |
| Third quarter 2023 | November 7, 2023 | | 0.27 | | | November 30, 2023 | | 49.3 | | | December 21, 2023 |
| | | | | | | | | |
| Year ended December 31, 2022: | | | | | | | | | |
| Fourth quarter of 2021 | January 21, 2022 | | $ | 0.25 | | | February 11, 2022 | | $ | 27.7 | | | March 4, 2022 |
| First quarter 2022 | May 6, 2022 | | 0.25 | | | May 27, 2022 | | 27.7 | | | June 17, 2022 |
| Second quarter 2022 | August 3, 2022 | | 0.27 | | | August 24, 2022 | | 29.9 | | | September 14, 2022 |
| Third quarter 2022 | November 2, 2022 | | 0.27 | | | November 23, 2022 | | 29.9 | | | December 14, 2022 |
Declared and Undistributed
Subsequent to December 31, 2024 the Company's Board of Directors declared a dividend of $0.29 per common share, payable on March 3, 2025 to stockholders of record on February 14, 2025.
Foreign Currency Translation Reserve
Foreign currency translation adjustment, a component of other comprehensive income (loss), includes the following:
| | | | | | | | | | | | | | | | | | | | |
| Year ended December 31, | | 2024 | | 2023 | | 2022 |
| Gains (losses) on intercompany foreign currency transactions of a long-term investment nature | | $ | (9.6) | | | $ | 2.3 | | | $ | (10.5) | |
| | |
Notes to the Consolidated Financial Statements (Tabular amounts expressed in thousands of United States dollars, except where noted) |
24. Share-based Payments
The following table summarizes the components of share-based payment expense by consolidated income statement classification:
| | | | | | | | | | | | | | | | | | | | |
| Year ended December 31, | | 2024 | | 2023 | | 2022 |
| Selling, general and administrative: | | | | | | |
| Stock option compensation expense | | $ | 3.5 | | | $ | 7.7 | | | $ | 12.2 | |
| Equity-classified share units | | 47.1 | | | 32.0 | | | 22.0 | |
| Liability-classified share units | | 2.9 | | | 2.5 | | | — | |
| Employee share purchase plan | | 7.3 | | | 4.7 | | | 2.8 | |
| | 60.8 | | | 46.9 | | | 37.0 | |
| Acquisition-related and integration costs: | | | | | | |
| Acceleration of share-based payments expense | | 1.0 | | | 6.8 | | | — | |
| Share-based continuing employment costs | | 0.6 | | | 3.8 | | | 7.5 | |
| | 1.6 | | | 10.6 | | | 7.5 | |
| | $ | 62.4 | | | $ | 57.5 | | | $ | 44.5 | |
Conversion of IAA Share Based Awards
In connection with the acquisition of IAA in March 2023, IAA’s stock options, RSUs and PSU awards were cancelled and exchanged into 187,727 Company stock options and 366,379 Company RSU awards. At the closing of the acquisition, the converted share-based awards had an estimated aggregate fair value of $24.9 million, of which $4.8 million was attributable to post-combination services and is being recognized as share-based payments expense over the remaining service periods. The Company awards are subject to the same terms and conditions as applicable to the corresponding IAA equity awards held prior to the acquisition of IAA, including vesting terms, with the exception of any Company RSU awards that replace IAA’s PSU awards, where vesting will no longer be subject to the achievement of performance goals and will be solely based on providing continued services to the Company through the end of the applicable service period.
Stock Option Plans
On May 8, 2023, the Company’s shareholders approved the 2023 Share Incentive Plan (“2023 Plan”) under which 9,355,000 common shares of the Company were reserved for issuance. The 2023 Plan allows the Company to grant to employees, officers, non-employee directors and other key persons various types of equity-based awards, including stock options, PSUs and RSUs.
At December 31, 2024, there were 7,958,801 (December 31, 2023: 8,511,523) shares available for issuance under the 2023 Plan.
| | |
Notes to the Consolidated Financial Statements (Tabular amounts expressed in millions of United States dollars, except where noted) |
24. Share-based Payments (continued)
The following table summarizes stock option activity:
| | | | | | | | | | | | | | | | | | | | | | | | | | | | | | | | | | | | | | | | | | | | | | | |
| Stock options | | Premium-priced stock options |
| Common
shares under
option | | WA
exercise
price | | WA
remaining
contractual
life (in years) | | Aggregate
intrinsic
value | | Common
shares under
option | | WA
exercise
price | | WA
remaining
contractual
life (in years) | | Aggregate
intrinsic
value |
| Outstanding, December 31, 2021 | 2,208,057 | | $ | 42.55 | | | 7.7 | | $ | 41.9 | | | 1,017,064 | | $ | 91.24 | | | 5.7 | | $ | — | |
| Granted | 710,847 | | 58.08 | | | — | | | — | | | 119,157 | | 91.37 | | | — | | | — | |
| Exercised | (159,920) | | 36.72 | | | — | | | 4.5 | | | — | | — | | | — | | | — | |
| Forfeited | (28,689) | | 48.09 | | | — | | | — | | | (17,789) | | 90.93 | | | — | | | — | |
| Outstanding, December 31, 2022 | 2,730,295 | | $ | 46.88 | | | 7.3 | | $ | 31.2 | | | 1,118,432 | | $ | 91.26 | | | 4.7 | | $ | — | |
| Granted | 262,725 | | 58.09 | | | — | | | — | | | — | | — | | | — | | | — | |
| Assumed in IAA acquisition | 187,727 | | 50.96 | | | — | | | — | | | — | | — | | | — | | | — | |
| Exercised | (721,503) | | 47.67 | | | — | | | 10.3 | | | — | | — | | | — | | | — | |
| Forfeited | (140,162) | | 53.84 | | | — | | | — | | | (225,765) | | 91.26 | | | — | | | — | |
| Outstanding, December 31, 2023 | 2,319,082 | | $ | 47.82 | | | 6.3 | | $ | 44.5 | | | 892,667 | | $ | 91.26 | | | 3.6 | | $ | — | |
| | | | | | | | | | | | | | | |
| Exercised | (978,238) | | 44.71 | | | — | | | 31.8 | | | (66,309) | | 83.92 | | | — | | | 0.4 | |
| Forfeited | (12,773) | | 53.96 | | | — | | | — | | | (110,671) | | 95.46 | | | — | | | — | |
| Outstanding, December 31, 2024 | 1,328,071 | | $ | 50.05 | | | 5.5 | | $ | 49.9 | | | 715,687 | | $ | 91.29 | | | 2.5 | | $ | 1.3 | |
| Exercisable, December 31, 2024 | 969,828 | | $ | 47.14 | | | 4.9 | | $ | 41.8 | | | 435,789 | | $ | 91.24 | | | 2.5 | | $ | 1.3 | |
Stock options
The Company did not grant any stock options during the year ended December 31, 2024. Stock options granted previously have been valued using the Black Scholes option pricing model. Expected volatility was based upon the historical volatility of the Company's common shares for the period corresponding with the expected term of the options. Stock options were granted with an exercise price equal to the fair market value of the Company’s common shares at the grant date, with a three-year vesting period and terms not exceeding 10 years. The options outstanding at December 31, 2024 expire on dates ranging to August 8, 2033. The weighted average grant date fair value of options granted during the years ended December 31, 2023 and December 31, 2022 were $17.63 and $14.35, respectively.
The significant assumptions used to estimate the fair value of stock options granted in 2022 and 2023 are presented in the following table on a weighted average basis:
| | | | | | | | | | | | | | | | |
| | | | December 31, 2023 | | December 31, 2022 |
| Risk free interest rate | | | | 4.2 | % | | 2.2 | % |
| Expected dividend yield | | | | 1.84 | % | | 1.74 | % |
| Expected lives of the stock options | | | | 4 years | | 4 years |
| Expected volatility | | | | 35.8 | % | | 31.8 | % |
At December 31, 2024, the unrecognized stock-based compensation cost related to non-vested stock options was $0.9 million, which is expected to be recognized over a weighted average period of 0.9 years. Cash received from stock-based award exercises for the year ended December 31, 2024 was $49.3 million (2023: $34.5 million; 2022: $5.9 million). The actual tax benefit realized related to the exercise of stock options totaled $2.3 million for the year ended December 31, 2024 (2023: $0.8 million; 2022: $0.4 million).
The fair value of the stock options assumed in the acquisition of IAA in March 2023 was estimated on the acquisition date using the Black-Scholes option pricing model. The weighted average fair value of the assumed options was $15.52. The significant assumptions used to estimate the fair value of these assumed stock options are presented in the following table on a weighted average basis:
| | |
Notes to the Consolidated Financial Statements (Tabular amounts expressed in millions of United States dollars, except where noted) |
24. Share-based Payments (continued)
| | | | | | | | |
| | December 31, 2023 |
| Risk free interest rate | | 3.9 | % |
| Expected dividend yield | | 2.05 | % |
| Expected lives of the stock options | | 2 years |
| Expected volatility | | 33.3 | % |
Premium-priced Stock Options
In 2021 and 2022, the Company granted premium-priced stock options to senior executives with exercise prices above the fair market value of the Company’s common shares on the respective grant dates, and which vest and become exercisable upon the third anniversary of their grant date. The weighted average estimated grant date fair value was $8.00 per option.
The significant assumptions used to estimate the fair values using a Monte Carlo simulation model were as follows:
| | | | | | | | | | |
| | | | December 31, 2022 |
| Risk free interest rate | | | | 3.0 | % |
| Expected dividend yield | | | | 1.63 | % |
| Expected lives of the stock options | | | | 4 years |
| Expected volatility | | | | 30.2 | % |
At December 31, 2024, the unrecognized compensation expense associated with premium-price options was nil.
Share Units
The following table summarizes share unit activity: | | | | | | | | | | | | | | | | | | | | | | | | | | | | | | | | | | | | | | | | | | | | | | | |
| Equity-classified | | Liability-classified |
| PSUs (Performance Conditions) | | PSUs (Market Conditions) | | RSUs | | DSUs |
| Number | | WA grant
date fair
value | | Number | | WA grant
date fair
value | | Number | | WA grant
date fair
value | | Number | | WA grant
date fair
value |
| Outstanding, December 31, 2021 | 523,618 | | $ | 45.90 | | | 88305 | | $ | 65.45 | | | 79,112 | | $ | 54.96 | | | 156,589 | | $ | 35.28 | |
| Granted | 236,855 | | 58.53 | | | 14,574 | | 69.92 | | | 34,495 | | 57.71 | | | 21,824 | | 58.24 | |
| Vested and settled | (93,241) | | 36.42 | | | — | | — | | | (37,714) | | 50.29 | | | (70,048) | | 36.13 | |
| Forfeited | (4,598) | | 51.76 | | | — | | — | | | (7,869) | | 60.30 | | | — | | — | |
| Outstanding, December 31, 2022 | 662,634 | | $ | 51.71 | | | 102,879 | | $ | 66.08 | | | 68,024 | | $ | 58.32 | | | 108,365 | | $ | 39.35 | |
| Granted | 94,729 | | 58.04 | | | 80,398 | | 85.33 | | | 425,309 | | 53.35 | | | 24,573 | | 55.49 | |
| Assumed in IAA acquisition | — | | | — | | | — | | — | | | 366,379 | | 52.79 | | | — | | — | |
| Vested and settled | (283,086) | | 42.23 | | | — | | — | | | (309,102) | | 53.22 | | | (32,378) | | 54.68 | |
| Forfeited | (58,848) | | 60.62 | | | (9,017) | | 68.59 | | | (10,939) | | 55.06 | | | — | | — | |
| Outstanding at December 31, 2023 | 415,429 | | $ | 58.35 | | | 174,260 | | $ | 74.83 | | | 539,671 | | $ | 53.64 | | | 100,560 | | $ | 38.36 | |
| Granted | 164,520 | | | 76.11 | | | 162,942 | | | 122.91 | | | 340,271 | | | 76.64 | | | 11,887 | | 72.93 | |
| Vested and settled | (114,315) | | | 58.79 | | | (58,511) | | | 66.08 | | | (237,766) | | | 53.74 | | | (38,957) | | 45.28 | |
| Forfeited | (15,459) | | | 58.37 | | | (9,737) | | | 84.04 | | | (34,371) | | | 62.12 | | | — | | — | |
| Outstanding at December 31, 2024 | 450,175 | | $ | 64.73 | | | 268,954 | | $ | 105.53 | | | 607,805 | | $ | 66.00 | | | 73,490 | | $ | 40.29 | |
| | |
Notes to the Consolidated Financial Statements (Tabular amounts expressed in millions of United States dollars, except where noted) |
24. Share-based Payments (continued)
PSUs
PSUs are granted to executives and senior employees and may contain performance vesting conditions or market vesting conditions, conditional upon the Company's total shareholder return relative to a peer group. PSUs typically have three year performance and market vesting conditions. The PSUs with market conditions granted in June 2022 have approximately a two year performance period to coincide with the remaining performance period of the August 2021 grant.
The fair value of PSUs with performance conditions are estimated on the respective grant date using the closing price of the Company’s common shares listed on the NYSE.
The fair value of PSUs with market conditions are estimated on the grant date using a Monte Carlo simulation model. The significant assumptions used to estimate the fair value are presented in the following table on a weighted average basis: | | | | | | | | | | | | | | | | | | | | |
| | December 31, 2024 | | December 31, 2023 | | December 31, 2022 |
| Risk free interest rate | | 4.4 | % | | 4.5 | % | | 2.7 | % |
| Expected dividend yield | | — | % | | — | % | | 1.63 | % |
| Expected lives of the PSUs | | 3 years | | 2 years | | 2 years |
| Expected volatility | | 32.2 | % | | 32.7 | % | | 33.4 | % |
| Average expected volatility of comparable companies | | 48.3 | % | | 48.6 | % | | 34.4 | % |
At December 31, 2024, the unrecognized share unit expense related to PSUs with market conditions was $17.1 million, which is expected to be recognized over a weighted average period of 2.07 years and the unrecognized share unit expense related to PSUs with performance conditions was $12.0 million, which is expected to be recognized over a weighted average period of 1.92 years.
RSUs
RSUs granted to employees typically vest over a three year service period and RSUs granted to directors vest on the earlier of (i) the one year anniversary of the grant date and (ii) the date of the Company's next annual meeting of shareholders. The issuance of shares related to RSUs granted to directors may be deferred at the holder's election.
Fair values of RSUs are estimated on grant date using the closing price of the Company’s common shares listed on the NYSE. At December 31, 2024, the unrecognized share unit expense related to equity-classified RSUs was $16.5 million, which is expected to be recognized over a weighted average period of 1.38 years.
DSUs
Fair values of DSUs are estimated on the respective grant date and at each reporting date using the closing price of the Company’s common shares listed on the NYSE. DSUs are granted to members of the Board of Directors. There is no unrecognized share unit expense related to liability-classified DSUs as they vest immediately and are expensed upon grant. At December 31, 2024, the Company had a total share unit liability of $8.4 million (2023: $7.6 million) in respect of DSUs presented in trade and other liabilities.
The total market value of liability-classified share units which vested during the year ended December 31, 2024 was $3.2 million (2023: $1.8 million; 2022: $4.9 million).
Employee Share Purchase Plan
In February 2023, the Board approved the suspension of the Company’s 1999 Employee Stock Purchase Plan. On May 8, 2023, the Company's shareholders approved the 2023 Employee Stock Purchase Plan (the "2023 ESPP") under which 3,000,000 common shares of the Company were reserved for issuance. The 2023 ESPP allows eligible employees to contribute up to 15% of their base compensation during each semi-annual offering period, up to twenty-five thousand dollars, towards the purchase of the Company’s stock, at 85% of the lower of the fair market value on: i. the first day of the applicable offering period, or ii. the last day of the applicable purchase period within the offering period. Employees also have the option to participate through a cashless program, by electing to settle on a net basis on purchase date. At the end of each purchase period, employee contributions are used to purchase the Company's common stock.
| | |
Notes to the Consolidated Financial Statements (Tabular amounts expressed in millions of United States dollars, except where noted) |
24. Share-based Payments (continued)
During each of the years ended December 31, 2024 and December 31, 2023, there were two offerings under the 2023 ESPP. The 2024 offerings had weighted average grant date fair values of $15.94 and $19.42 (2023: $11.99 and $12.43).
The significant assumptions used to estimate the fair value of ESPP awards are presented in the following table on a weighted average basis:
| | | | | | | | | | | | | | |
| | December 31, 2024 | | December 31, 2023 |
| Risk free interest rate | | 4.4 | % | | 5.3 | % |
| Expected dividend yield | | 1.26 | % | | 1.81 | % |
| Expected lives of the ESPP | | 9 months | | 8 months |
| Expected volatility | | 27.5 | % | | 28.1 | % |
At December 31, 2024, there were 2,306,355 (December 31, 2023: 2,819,497) shares available for issuance under the 2023 ESPP.
25. Leases
The components of lease expense are as follows: | | | | | | | | | | | | | | | | | | | | |
| Year ended December 31, | | 2024 | | 2023 | | 2022 |
| Operating lease cost | | $ | 250.8 | | | $ | 192.1 | | | $ | 23.0 | |
| Finance lease cost | | | | | | |
| Amortization of leased assets | | 12.5 | | | 11.3 | | | 10.2 | |
| Interest on lease liabilities | | 1.7 | | | 1.3 | | | 0.8 | |
| Short-term lease cost | | 12.6 | | | 17.0 | | | 12.2 | |
| Sublease income | | (1.0) | | | (0.6) | | | (0.1) | |
| | $ | 276.6 | | | $ | 221.1 | | | $ | 46.1 | |
Operating Leases
The Company has entered into leases for various properties used for auctions or offices, the majority of which are non-cancellable. The Company also has leases for computer equipment, motor vehicles and small office equipment where it is not in the best interest of the Company to purchase these assets. The majority of the Company's operating leases have a fixed term with a remaining life between one month and 19 years, with renewal options included in the contracts. The leases have varying contract terms, escalation clauses and renewal options. Generally, there are no restrictions placed upon the lessee by entering into these leases, other than restrictions on use of property, sub-letting and alterations. The Company has not included any purchase options available within its operating lease portfolio in its determination of its operating lease liability.
| | |
Notes to the Consolidated Financial Statements (Tabular amounts expressed in millions of United States dollars, except where noted) |
25. Leases (continued)
The future aggregate minimum lease payments under non-cancellable operating leases are as follows:
| | | | | |
| 2025 | $ | 195.9 | |
| 2026 | 201.1 | |
| 2027 | 194.6 | |
| 2028 | 183.9 | |
| 2029 | 172.7 | |
| Thereafter | 1,220.8 | |
| Total future minimum lease payments | $ | 2,169.0 | |
| less: imputed interest | (624.6) | |
| Total operating lease liabilities | $ | 1,544.4 | |
| less: current operating lease liabilities | (113.3) | |
| Long-term operating lease liabilities | $ | 1,431.1 | |
At December 31, 2024, the weighted average remaining lease term for operating leases is 11.8 years (December 31, 2023: 12.4 years) and the weighted average discount rate is 5.6% (December 31, 2023: 4.3%). There are no additional undiscounted commitments for leases not yet commenced at December 31, 2024 (December 31, 2023: nil).
Finance Leases
The Company has entered into finance lease arrangements for certain vehicles, computer and yard equipment, fixtures, and office furniture. The majority of the leases have a fixed term with a remaining life of one month to five years with renewal options included in the contracts. In certain of these leases, the Company has the option to purchase the leased asset at fair market value or a stated residual value at the end of the lease term. For certain leases such as vehicle leases, the Company has included renewal options in the measurement of its lease balances.
Property, plant, and equipment includes the following finance lease assets:
| | | | | | | | | | | | | | | | | | | | |
| At December 31, 2024 | | Cost | | Accumulated
depreciation | | Net book
value |
| Auto equipment | | $ | 32.8 | | | $ | (16.6) | | | $ | 16.2 | |
| Computer equipment | | 14.3 | | | (9.9) | | | 4.4 | |
| Yard and others | | 38.5 | | | (10.0) | | | 28.5 | |
| | $ | 85.6 | | | $ | (36.5) | | | $ | 49.1 | |
| | | | | | | | | | | | | | | | | | | | |
| At December 31, 2023 | | Cost | | Accumulated depreciation | | Net book
value |
| Auto equipment | | $ | 27.6 | | | $ | (13.0) | | | $ | 14.6 | |
| Computer equipment | | 15.4 | | | (8.4) | | | 7.0 | |
| Yard and others | | 10.9 | | | (7.4) | | | 3.5 | |
| | $ | 53.9 | | | $ | (28.8) | | | $ | 25.1 | |
| | |
Notes to the Consolidated Financial Statements (Tabular amounts expressed in millions of United States dollars, except where noted) |
25. Leases (continued)
The future aggregate minimum lease payments under non-cancellable finance leases are as follows:
| | | | | |
| 2025 | $ | 15.1 | |
| 2026 | 13.8 | |
| 2027 | 11.8 | |
| 2028 | 8.2 | |
| 2029 | 4.8 | |
| Total future minimum lease payments | $ | 53.7 | |
| less: imputed interest | (3.1) |
| Total finance lease liabilities | $ | 50.6 | |
| less: current finance lease liabilities | (13.9) |
| Long-term finance lease liabilities | $ | 36.7 | |
At December 31, 2024, the weighted average remaining lease term for finance leases is 3.9 years (December 31, 2023: 3.2 years) and the weighted average discount rate is 6.1% (December 31, 2023: 5.7%).
Subleases
At December 31, 2024, the total future minimum sublease payments expected to be received under non-cancellable subleases is $6.4 million (December 31, 2023: $2.6 million).
26. Commitments
At December 31, 2024, the Company had committed to capital expenditures for property, plant and equipment totaling approximately $26.9 million (December 31, 2023: $36.5 million) and expenditures for intangible assets and technology services agreements totaling approximately $26.7 million (December 31, 2023: $28.6 million).
27. Contingencies
Legal and Other Claims
On July 31, 2023, Ann Fandozzi informed the Company’s Board of her intention to resign from her position as the Company’s Chief
Executive Officer due to a disagreement with the Company regarding her compensation as Chief Executive Officer. The Board accepted her verbal resignation and interpreted her subsequent conduct as affirmation of her resignation. The Company advised Ms. Fandozzi that it was accepting her resignation effective immediately and waiving any written procedural notice requirements under the Employment Agreement by and between Ritchie Bros. Auctioneers (Canada) Ltd. and Ms. Fandozzi, dated December 14, 2019. Ms. Fandozzi disputes that she tendered her resignation. On February 21, 2024, Ms. Fandozzi formally resigned from the Company’s Board. The matter is currently in arbitration in accordance with the terms of Ms. Fandozzi’s employment agreement.
During the year ended December 31, 2024, the Company recorded an expense of $5.0 million (December 31, 2023: $6.2 million) reflecting changes to the estimated fair value of certain share-based payment awards. Any changes to the estimated payment amount to Ms. Fandozzi as a result of the settlement of the matter could be material.
The Company is subject to legal and other claims that arise in the ordinary course of its business. Management does not believe that the results of these claims will have a material effect on the Company’s consolidated balance sheets or consolidated income statements.
Guarantee Contracts
In the normal course of business, the Company will in certain situations guarantee to a consignor a minimum level of proceeds in connection with the sale at auction of that consignor’s equipment.
At December 31, 2024, there were $39.1 million of assets guaranteed under contract, of which 44% is expected to be sold prior to March 31, 2025 with the remainder to be sold by December 31, 2025 (December 31, 2023: $67.5 million of which 70% was expected
| | |
Notes to the Consolidated Financial Statements (Tabular amounts expressed in thousands of United States dollars, except where noted) |
27. Contingencies (continued)
to be sold prior to the end of March 31, 2024 with the remainder to be sold by December 31, 2024). The outstanding guarantee amounts are undiscounted and before estimated proceeds from sale at auction.
ITEM 9: CHANGES IN AND DISAGREEMENTS WITH ACCOUNTANTS ON ACCOUNTING AND FINANCIAL DISCLOSURE
Not applicable.
ITEM 9A: CONTROLS AND PROCEDURES
Disclosure Controls and Procedures
Management of the Company, including the Chief Executive Officer (“CEO”) and Chief Financial Officer (“CFO”), have evaluated the effectiveness of the Company’s disclosure controls and procedures as of the end of the year covered by this Form 10-K. The term “disclosure controls and procedures” means controls and other procedures established by the Company that are designed to ensure that information required to be disclosed by the Company in the reports that it files or submits under the Exchange Act is recorded, processed, summarized and reported within the time periods specified in the SEC’s rules and forms. Disclosure controls and procedures include, without limitation, controls and procedures designed to ensure that information required to be disclosed by the Company in the reports that it files or submits under the Exchange Act is accumulated and communicated to the Company’s management, including its CEO and CFO, as appropriate, to allow timely decisions regarding required disclosure.
Based upon their evaluation of the Company’s disclosure controls and procedures, as of December 31, 2024, the CEO and the CFO concluded that the disclosure controls are effective to provide reasonable assurance that information required to be disclosed by the Company in the reports that it files or submits under the Exchange Act is accumulated and communicated to management, including the CEO and CFO, as appropriate, to allow timely decisions regarding required disclosure and were effective to provide reasonable assurance that such information is recorded, processed, summarized and reported within the time periods specified by the SEC’s rules and forms.
The Company, including its CEO and CFO, does not expect that its internal controls and procedures will prevent or detect all error and all fraud. A control system, no matter how well conceived or operated, can provide only reasonable, not absolute, assurance that the objectives of the control system are met.
Management’s Report on Internal Control over Financial Reporting
Management of the Company is responsible for establishing and maintaining adequate internal controls over financial reporting for the Company as defined in Rule 13a-15(f) and 15d-15(f) under the Exchange Act. The Company’s internal control over financial reporting is a process designed under the supervision of the Company’s CEO and CFO, overseen by the Company’s Board of Directors and implemented by the Company’s management and other personnel, to provide reasonable assurance regarding the reliability of financial reporting and the preparation of the financial statements for external purposes in accordance with U.S. generally accepted accounting principles, and the requirements of the SEC.
Because of its inherent limitations, internal control over financial reporting may not prevent or detect misstatements. Also, projections of any evaluation of effectiveness to future periods are subject to the risk that controls may become inadequate because of changes in conditions or that the degree of compliance with policies and procedures may deteriorate.
Management has assessed the effectiveness of the Company’s internal control over financial reporting as of December 31, 2024. In making this assessment, management used the criteria described in “Internal Control – Integrated Framework” issued by the Committee of Sponsoring Organizations of the Treadway Commission (2013 Framework) (“COSO”). Based on its assessment under the framework in COSO, management has concluded that internal control over financial reporting was effective as of December 31, 2024.
Attestation Report of Registered Public Accounting Firm
The attestation report required under this Item 9A is set forth below under the caption “Report of Independent Registered Public Accounting Firm.”
Changes in Internal Control over Financial Reporting
There were no changes in the Company's internal control over financial reporting during the fourth quarter of 2024 that have materially affected, or are reasonably likely to materially affect the Company's internal control over financial reporting.
Report of Independent Registered Public Accounting Firm
To the Shareholders and the Board of Directors of RB Global, Inc.
Opinion on Internal Control Over Financial Reporting
We have audited RB Global, Inc.’s internal control over financial reporting as of December 31, 2024, based on criteria established in Internal Control—Integrated Framework issued by the Committee of Sponsoring Organizations of the Treadway Commission (2013 framework) (the COSO criteria). In our opinion, RB Global, Inc. (the Company) maintained, in all material respects, effective internal control over financial reporting as of December 31, 2024, based on the COSO criteria.
We also have audited, in accordance with the standards of the Public Company Accounting Oversight Board (United States) (PCAOB), the consolidated balance sheets of the Company as of December 31, 2024 and 2023, the related consolidated statements of income, comprehensive income, changes in temporary equity and stockholders’ equity, and cash flows, for each of the two years in the period ended December 31, 2024, and the related notes and our report dated February 26, 2025 expressed an unqualified opinion thereon.
Basis for Opinion
The Company’s management is responsible for maintaining effective internal control over financial reporting and for its assessment of the effectiveness of internal control over financial reporting included in the accompanying Management’s Report on Internal Control over Financial Reporting. Our responsibility is to express an opinion on the Company’s internal control over financial reporting based on our audit. We are a public accounting firm registered with the PCAOB and are required to be independent with respect to the Company in accordance with the U.S. federal securities laws and the applicable rules and regulations of the Securities and Exchange Commission and the PCAOB.
We conducted our audit in accordance with the standards of the PCAOB. Those standards require that we plan and perform the audit to obtain reasonable assurance about whether effective internal control over financial reporting was maintained in all material respects.
Our audit included obtaining an understanding of internal control over financial reporting, assessing the risk that a material weakness exists, testing and evaluating the design and operating effectiveness of internal control based on the assessed risk, and performing such other procedures as we considered necessary in the circumstances. We believe that our audit provides a reasonable basis for our opinion.
Definition and Limitations of Internal Control Over Financial Reporting
A company’s internal control over financial reporting is a process designed to provide reasonable assurance regarding the reliability of financial reporting and the preparation of financial statements for external purposes in accordance with generally accepted accounting principles. A company’s internal control over financial reporting includes those policies and procedures that (1) pertain to the maintenance of records that, in reasonable detail, accurately and fairly reflect the transactions and dispositions of the assets of the company; (2) provide reasonable assurance that transactions are recorded as necessary to permit preparation of financial statements in accordance with generally accepted accounting principles, and that receipts and expenditures of the company are being made only in accordance with authorizations of management and directors of the company; and (3) provide reasonable assurance regarding prevention or timely detection of unauthorized acquisition, use, or disposition of the company’s assets that could have a material effect on the financial statements.
Because of its inherent limitations, internal control over financial reporting may not prevent or detect misstatements. Also, projections of any evaluation of effectiveness to future periods are subject to the risk that controls may become inadequate because of changes in conditions, or that the degree of compliance with the policies or procedures may deteriorate.
| | |
| /s/ Ernst & Young LLP |
| Chicago, Illinois |
| February 26, 2025 |
ITEM 9B: OTHER INFORMATION
None.
ITEM 9C: DISCLOSURE REGARDING FOREIGN JURISDICTIONS THAT PREVENT INSPECTIONS
None.
PART III
ITEM 10: DIRECTORS, EXECUTIVE OFFICERS AND CORPORATE GOVERNANCE
The information responsive to this Item is incorporated by reference to our definitive Proxy Statement for our 2025 Annual and Special Meeting of Shareholders, to be filed within 120 days of December 31, 2024, pursuant to Regulation 14A under the Securities Exchange Act of 1934, as amended (the "2025 Proxy Statement").
We have adopted a written code of business conduct and ethics, which applies to all of our directors, officers and employees, including our principal executive officer and our principal financial and accounting officer. Our Code of Business Conduct and Ethics is available on our website (https://investor.rbglobal.com/governance/governance-documents/default.aspx) and can be obtained by writing to RB Global Investor Relations, Two Westbrook Corporate Center, Suite #500, Westchester, Illinois, USA 60154, or by sending an email to our Investor Relations department at IR@rbglobal.com. The information contained on our website is not incorporated by reference into this Annual Report on Form 10-K. Any amendments, other than technical, administrative or other non-substantive amendments, to our Code of Business Conduct and Ethics or waivers from the provisions of the Code of Business Conduct and Ethics for our principal executive officer and our principal financial and accounting officer will be promptly disclosed on our website following the effective date of such amendment or waiver.
The Company has an insider trading policy governing the purchase, sale and other dispositions of the Company's securities that applies to all Company's directors, officers, employees and other covered persons. The Company believes that its insider trading policy is reasonably designed to promote compliance with insider trading laws, rules and regulations, and listing standards applicable to the Company. A copy of the Company's insider trading policy is filed as Exhibit 19.1 to this Form 10-K.
ITEM 11: EXECUTIVE COMPENSATION
The information responsive to this Item is incorporated by reference to our 2025 Proxy Statement.
ITEM 12: SECURITY OWNERSHIP OF CERTAIN BENEFICIAL OWNERS AND MANAGEMENT AND RELATED STOCKHOLDER MATTERS
The information responsive to this Item is incorporated by reference to our 2025 Proxy Statement.
ITEM 13: CERTAIN RELATIONSHIPS AND RELATED TRANSACTIONS, AND DIRECTOR INDEPENDENCE
The information responsive to this Item is incorporated by reference to our 2025 Proxy Statement.
ITEM 14: PRINCIPAL ACCOUNTANT FEES AND SERVICES
The information responsive to this Item is incorporated by reference to our 2025 Proxy Statement.
PART IV
ITEM 15: EXHIBITS, FINANCIAL STATEMENT SCHEDULES
(a)Documents Filed with this Report:
(1)FINANCIAL STATEMENTS
(2)FINANCIAL STATEMENT SCHEDULES
None.
(3)EXHIBITS
The exhibits listed in (b) below are filed as part of this Annual Report on Form 10-K and incorporated herein by reference.
(b)Exhibits:
| | | | | | | | |
| Exhibit Number | | Document |
| 2.1* | | Agreement and Plan of Merger and Reorganization, dated as of November 7, 2022, by and among Ritchie Bros. Auctioneers Incorporated, Ritchie Bros. Holdings Inc., Impala Merger Sub I, LLC, Impala Merger Sub II, LLC, and IAA, Inc. (incorporated by reference to Exhibit 2.1 to the Company’s Current Report on Form 8-K filed on November 7, 2022) |
| 2.2 | | Amendment to the Agreement and Plan of Merger and Reorganization, dated January 22, 2023, by and among Ritchie Bros. Auctioneers Incorporated, Ritchie Bros, Holdings Inc., Impala Merger Sub I, LLC, Impala Merger Sub II, LLC, and IAA, Inc. (incorporated by reference to Exhibit 2.1 to the Company’s Current Report on Form 8-K filed on January 22, 2023) |
| 3.1 | | |
| 3.2 | | |
| 4.1 | | |
| 4.2 | | |
| 4.3 | | Indenture, dated as of March 15, 2023, among Ritchie Bros. Auctioneers Incorporated, Ritchie Bros. Holdings Inc. and U.S. Bank Trust Company, National Association, as trustee, and U.S. Bank Trust Company, National Association, as collateral agent, relating to Ritchie Bros. Holdings Inc.’s 6.750% Senior Secured Notes due 2028 (includes form of note) (incorporated by reference to Exhibit 4.1 to the Company’s Current Report on Form 8-K filed on March 15, 2023) |
| 4.4 | | Supplemental Indenture, dated as of March 20, 2023, by and between Ritchie Bros. Holdings Inc., as issuer, the parties that are signatories thereto as Subsidiary Guarantors, as subsidiary guarantors, and U.S. Bank Trust Company, National Association, as trustee (incorporated by reference to Exhibit 4.2 to the Company’s Current Report on Form 8-K filed on March 21, 2023) |
| 4.5 | | |
| 4.6 | | Supplemental Indenture, dated as of March 20, 2023, by and between Ritchie Bros. Holdings Inc., as issuer, the parties that are signatories thereto as Subsidiary Guarantors, as subsidiary guarantors, and U.S. Bank Trust Company, National Association, as trustee and collateral agent (incorporated by reference to Exhibit 4.4 to the Company’s Current Report on Form 8-K filed on March 21, 2023) |
| 4.7 | | Intercreditor Agreement, dated as of March 20, 2023, by and between Bank of America, N.A., as administrative agent, and U.S. Bank Trust Company, National Association, as collateral agent, and consented to by the Company and the subsidiaries of the Company party to such consent as grantors of Collateral (incorporated by reference to Exhibit 4.5 to the Company’s Current Report on Form 8-K filed on March 21, 2023) |
| | | | | | | | |
| 10.1# | | |
| 10.2# | | |
| 10.3# | | |
| 10.4# | | |
| 10.5# | | |
| 10.6# | | |
| 10.7# | | |
| 10.8# | | |
| 10.9# | | |
| 10.10# | | |
| 10.11# | | |
| 10.12# | | |
| 10.13# | | |
| 10.14# | | |
| 10.15# | | |
| 10.16# | | |
| 10.17# | | |
| 10.18# | | |
| 10.19# | | |
| 10.20# | | |
| 10.21# | | |
| 10.22# | | |
| 10.23# | | |
| 10.24 | | Credit Agreement, dated as of October 27, 2016, by and among the Company, the other borrowers and guarantors party thereto, Bank of America, N.A., as administrative agent, U.S. swing line lender and L/C issuer, Royal Bank of Canada, as Canadian swing line lender and L/C issuer, and the other lenders party thereto (incorporated by reference to Exhibit 10.1 to the Company’s Current Report on Form 8-K/A filed on November 4, 2016) |
| | | | | | | | |
| 10.25 | | First Amendment, dated as of January 17, 2017, to Credit Agreement, dated as of October 27, 2016, by and among the Company, the other borrowers and guarantors party thereto, Bank of America, N.A., as administrative agent, U.S. swing line lender and L/C issuer, Royal Bank of Canada, as Canadian swing line lender and L/C issuer, and the other lenders party thereto (incorporated by reference to Exhibit 10.50 to the Company’s Annual Report on Form 10‐K filed on February 21, 2017) |
| 10.26 | | Third Amendment to Credit Agreement, dated as of August 14, 2020, among the Company, certain of its subsidiaries, each as a borrower and/or a guarantor, the lenders party thereto and Bank of America, N.A., as administrative agent, U.S. swing line lender and letter of credit issuer (incorporated by reference to Exhibit 10.1 to the Company’s Current Report on Form 8-K filed on August 17, 2020) |
| 10.27 | | Fourth Amendment to Credit Agreement, dated as of September 21, 2021, among the Company, certain of its subsidiaries, each as a borrower and/or a guarantor, the lenders party thereto, Bank of America, N.A., as administrative agent, U.S. swing line lender and letter of credit issuer and Royal Bank of Canada, as Canadian swing line lender and letter of credit issuer (incorporated by reference to Exhibit 10.1 to the Company’s Current Report on Form 8-K filed on September 21, 2021) |
| 10.28# | | |
| 10.29# | | |
| 10.30# | | |
| 10.31# | | |
| 10.32# | | |
| 10.33# | | |
| 10.34# | | |
| 10.35# | | |
| 10.36# | | |
| 10.37# | | |
| 10.38# | | |
| 10.39 | | Commitment Letter, dated as of November 7, 2022, by and among Ritchie Bros. Auctioneers Incorporated, Goldman Sachs Bank, Bank of America, N.A., BofA Securities, Inc., Royal Bank of Canada and RBC Capital Markets, LLC (incorporated by reference to Exhibit 10.1 to the Company’s Current Report on Form 8-K filed on November 7, 2022) |
| 10.40 | | Sixth Amendment to Credit Agreement, dated as of December 9, 2022, among the Company, certain of its subsidiaries, each as a borrower and/or a guarantor, the lenders party thereto, Bank of America, N.A., as administrative agent, U.S. swing line lender and a letter of credit issuer (incorporated by reference to Exhibit 10.1 to the Company’s Current Report on Form 8-K filed on December 12, 2022) |
| 10.41 | | |
| 10.42 | | |
| | | | | | | | |
| 10.43 | | |
| 10.44 | | Escrow and Security Agreement, dated as of March 15, 2023, among Ritchie Bros. Holdings Inc., U.S. Bank Trust Company, National Association, as escrow agent, and U.S. Bank Trust Company, National Association, as trustee, relating to the Issuer’s 6.750% senior secured notes due 2028 (incorporated by reference to Exhibit 99.1 to the Company’s Current Report on Form 8-K filed on March 15, 2023) |
| 10.45 | | Escrow and Security Agreement, dated as of March 15, 2023, among Ritchie Bros. Holdings Inc., U.S. Bank Trust Company, National Association, as escrow agent, and U.S. Bank Trust Company, National Association, as trustee, relating to the Issuer’s 7.750% senior notes due 2031 (incorporated by reference to Exhibit 99.2 to the Company’s Current Report on Form 8-K filed on March 15, 2023) |
| 10.46# | | |
| 10.47# | | |
| 10.48# | | |
| 10.49# | | |
| 10.50# | | |
| 19.1 | | |
| 21.1 | | |
| 23.1 | | |
| 23.2 | | |
| 31.1 | | |
| 31.2 | | |
| 32.1 | | |
| 32.2 | | |
| 97.1 | | |
| 101.INS | | Inline XBRL Instance Document |
| 101.SCH | | Inline XBRL Taxonomy Extension Schema Document |
| 101.CAL | | Inline XBRL Taxonomy Extension Calculation Linkbase Document |
| 101.DEF | | Inline XBRL Taxonomy Extension Definition Linkbase Document |
| 101.LAB | | Inline XBRL Taxonomy Extension Label Linkbase Document |
| 101.PRE | | Inline XBRL Taxonomy Extension Presentation Linkbase Document |
| 104 | | Cover Page for the Company’s Annual Report on Form 10-K for the year ended December 31, 2024, formatted in Inline XBRL |
_____________________________________________________# Indicates management contract or compensatory plan or arrangement.
* Schedules have been omitted pursuant to Item 601(b)(2) of Regulation S-K. The registrant will furnish copies of any such schedules to the U.S. Securities and Exchange Commission upon request.
ITEM 16: FORM 10-K SUMMARY
Not applicable.
Pursuant to the requirements of Section 13 or 15(d) of the Securities Exchange Act of 1934, the registrant has duly caused this report to be signed on its behalf by the undersigned, thereunto duly authorized.
| | | | | | | | |
| RB Global, Inc. |
| Date: February 26, 2025 | By: | /s/ Jim Kessler |
| | Jim Kessler Chief Executive Officer |
Pursuant to the requirements of the Securities Exchange Act of 1934, this Report has been signed below by the following persons on behalf of the registrant and in the capacities and on the dates indicated.
| | | | | | | | | | | |
| By: | /s/ Jim Kessler | Chief Executive Officer | February 26, 2025 |
| Jim Kessler | (principal executive officer) |
| | | |
| By: | /s/ Eric J. Guerin | Chief Financial Officer | February 26, 2025 |
| Eric J. Guerin | (principal financial officer) | |
| | | |
| By: | /s/ Robert G. Elton | Chair of the Board | February 26, 2025 |
| Robert G. Elton | | |
| | | |
| By: | /s/ Brian Bales | Director | February 26, 2025 |
| Brian Bales | | |
| | | |
| By: | /s/ Adam DeWitt | Director | February 26, 2025 |
| Adam DeWitt | | |
| | | |
| By: | /s/ Gregory Morrison | Director | February 26, 2025 |
| Gregory Morrison | | |
| | | |
| By: | /s/ Timothy O'Day | Director | February 26, 2025 |
| Timothy O'Day | | |
| | | |
| By: | /s/ Sarah E Raiss | Director | February 26, 2025 |
| Sarah E. Raiss | | |
| | | |
| By: | /s/ Michael Sieger | Director | February 26, 2025 |
| Michael Sieger | | |
| | | |
| By: | /s/ Debbie Stein | Director | February 26, 2025 |
| Debbie Stein | | |
| | | |
| By: | /s/ Carol Stephenson | Director | February 26, 2025 |
| Carol Stephenson | | |
| | | |