UNITED STATES
SECURITIES AND EXCHANGE COMMISSION
Washington, D.C. 20549
FORM 10-K
| | | | | |
| ☒ | ANNUAL REPORT PURSUANT TO SECTION 13 OR 15(d) OF THE SECURITIES EXCHANGE ACT OF 1934 |
For the Fiscal Year Ended December 31, 2024
or
| | | | | |
| ☐ | TRANSITION REPORT PURSUANT TO SECTION 13 OR 15(d) OF THE SECURITIES EXCHANGE ACT OF 1934 |
| For the transition period from to |
Commission File No. 1-13881
MARRIOTT INTERNATIONAL, INC.
(Exact name of registrant as specified in its charter)
| | | | | | | | | | | | | | | | | | | | |
| Delaware | | 52-2055918 |
| (State or other jurisdiction of incorporation or organization) | | (IRS Employer Identification No.) |
| | | | | | |
| 7750 Wisconsin Avenue | | Bethesda | | Maryland | | 20814 |
| (Address of Principal Executive Offices) | | (Zip Code) |
(Registrant’s Telephone Number, Including Area Code) (301) 380-3000
| | | | | | | | | | | | | | |
| Securities registered pursuant to Section 12(b) of the Act: |
| Title of Each Class | | Trading Symbol(s) | | Name of Each Exchange on Which Registered |
| Class A Common Stock, $0.01 par value | | MAR | | Nasdaq Global Select Market |
Securities registered pursuant to Section 12(g) of the Act: NONE
Indicate by check mark if the registrant is a well-known seasoned issuer, as defined in Rule 405 of the Securities Act. Yes ☒ No o
Indicate by check mark if the registrant is not required to file reports pursuant to Section 13 or Section 15(d) of the Act. Yes o No ☒
Indicate by check mark whether the registrant: (1) has filed all reports required to be filed by Section 13 or 15(d) of the Securities Exchange Act of 1934 during the preceding 12 months (or for such shorter period that the registrant was required to file such reports), and (2) has been subject to such filing requirements for the past 90 days. Yes ☒ No o
Indicate by check mark whether the registrant has submitted electronically every Interactive Data File required to be submitted pursuant to Rule 405 of Regulation S-T (§ 232.405 of this chapter) during the preceding 12 months (or for such shorter period that the registrant was required to submit such files). Yes ☒ No o
Indicate by check mark whether the registrant is a large accelerated filer, an accelerated filer, a non-accelerated filer, a smaller reporting company, or an emerging growth company. See the definitions of “large accelerated filer,” “accelerated filer,” “smaller reporting company,” and “emerging growth company” in Rule 12b-2 of the Exchange Act.
| | | | | | | | | | | | | | | | | | | | | | | |
| Large accelerated filer | ☒ | | Accelerated filer | o | | Emerging growth company | o |
| Non-accelerated filer | o | | Smaller reporting company | o | | | |
If an emerging growth company, indicate by check mark if the registrant has elected not to use the extended transition period for complying with any new or revised financial accounting standards provided pursuant to Section 13(a) of the Exchange Act. o |
Indicate by check mark whether the registrant has filed a report on and attestation to its management's assessment of the effectiveness of its internal control over financial reporting under Section 404(b) of the Sarbanes-Oxley Act (15 U.S.C. 7262(b)) by the registered public accounting firm that prepared or issued its audit report. ☒
If securities are registered pursuant to Section 12(b) of the Act, indicate by check mark whether the financial statements of the registrant included in the filing reflect the correction of an error to previously issued financial statements. o
Indicate by check mark whether any of those error corrections are restatements that required a recovery analysis of incentive-based compensation received by any of the registrant’s executive officers during the relevant recovery period pursuant to §240.10D-1(b). o
Indicate by check mark whether the registrant is a shell company (as defined in Rule 12b-2 of the Act). Yes ☐ No ☒
The aggregate market value of shares of common stock held by non-affiliates at June 30, 2024, was $56,461,271,207.
There were 275,695,298 shares of Class A Common Stock, par value $0.01 per share, outstanding at January 31, 2025.
DOCUMENTS INCORPORATED BY REFERENCE
Portions of the Proxy Statement prepared for the 2025 Annual Meeting of Stockholders are incorporated by reference into Part III of this report.
MARRIOTT INTERNATIONAL, INC.
FORM 10-K TABLE OF CONTENTS
FISCAL YEAR ENDED DECEMBER 31, 2024
Throughout this report, we refer to Marriott International, Inc., together with its consolidated subsidiaries, as “we,” “us,” “Marriott,” or the “Company.” In order to make this report easier to read, we also refer throughout to (1) our Consolidated Financial Statements as our “Financial Statements,” (2) our Consolidated Statements of Income as our “Income Statements,” (3) our Consolidated Balance Sheets as our “Balance Sheets,” (4) our Consolidated Statements of Cash Flows as our “Statements of Cash Flows,” (5) our properties, brands, or markets in the United States and Canada as “U.S. & Canada,” and (6) our properties, brands, or markets in our Europe, Middle East & Africa, Greater China, Asia Pacific excluding China, and Caribbean & Latin America regions, as “International.” References throughout to numbered “Notes” refer to the Notes to our Financial Statements, unless otherwise stated. In addition, we use the term “hotel owners” throughout this report to refer, collectively, to owners of hotels and other lodging offerings operating in our system pursuant to management agreements, franchise agreements, license agreements or similar arrangements, and we use the term “hotels in our system” to refer to hotels and other lodging offerings operating in our system pursuant to such arrangements, as well as hotels that we own or lease. The terms “hotel owners” and “hotels in our system” exclude Homes & Villas by Marriott Bonvoy® (which we also exclude from our property and room count), timeshare, residential, and The Ritz-Carlton Yacht Collection®.
Cautionary Statement
All statements in this report are made as of the date this Form 10-K is filed with the U.S. Securities and Exchange Commission (the “SEC”). We undertake no obligation to publicly update or revise these statements, whether as a result of new information, future events or otherwise. We make forward-looking statements in Management’s Discussion and Analysis of Financial Condition and Results of Operations and elsewhere in this report based on the beliefs and assumptions of our management and on information available to us through the date this Form 10-K is filed with the SEC. Forward-looking statements include information related to our development pipeline; our expectations regarding rooms growth; our expectations related to new brands, offerings, and growth opportunities; our expectations regarding our ability to meet our liquidity requirements; our capital expenditures and other investment spending and reimbursement expectations; our expectations regarding future dividends and share repurchases; our expectations regarding certain claims, legal proceedings, settlements or resolutions; our comprehensive initiative to enhance our effectiveness and efficiency across the Company, including related goals, anticipated cost reductions, and other expected or potential benefits and outcomes; and other statements that are preceded by, followed by, or include the words “believes,” “expects,” “anticipates,” “intends,” “plans,” “estimates,” “foresees,” or similar expressions; and similar statements concerning anticipated future events and expectations that are not historical facts.
We caution you that these statements are not guarantees of future performance and are subject to numerous evolving risks and uncertainties that we may not be able to accurately predict or assess, including the risks and uncertainties we describe in Part I, Item 1A, “Risk Factors,” of this report and other factors we describe from time to time in our periodic filings with the SEC.
PART I
Item 1. Business.
Overview
We are a worldwide operator, franchisor, and licensor of hotel, residential, timeshare, and other lodging properties under more than 30 brand names at different price and service points. Consistent with our focus on management, franchising, and licensing, we own or lease very few of our lodging properties (less than one percent of our system). As of year-end 2024, our system included 9,361 properties (1,706,331 rooms) in 144 countries and territories, and we also had nearly 3,800 hotels (over 577,000 rooms) in our development pipeline.
We discuss our operations in the following reportable business segments: (1) U.S. & Canada, (2) Europe, Middle East & Africa (“EMEA”), (3) Greater China, and (4) Asia Pacific excluding China (“APEC”). Our Caribbean & Latin America (“CALA”) operating segment does not meet the applicable accounting criteria for separate disclosure as a reportable business segment, and as such, we include its results in “Unallocated corporate and other.” See Note 14 for more information.
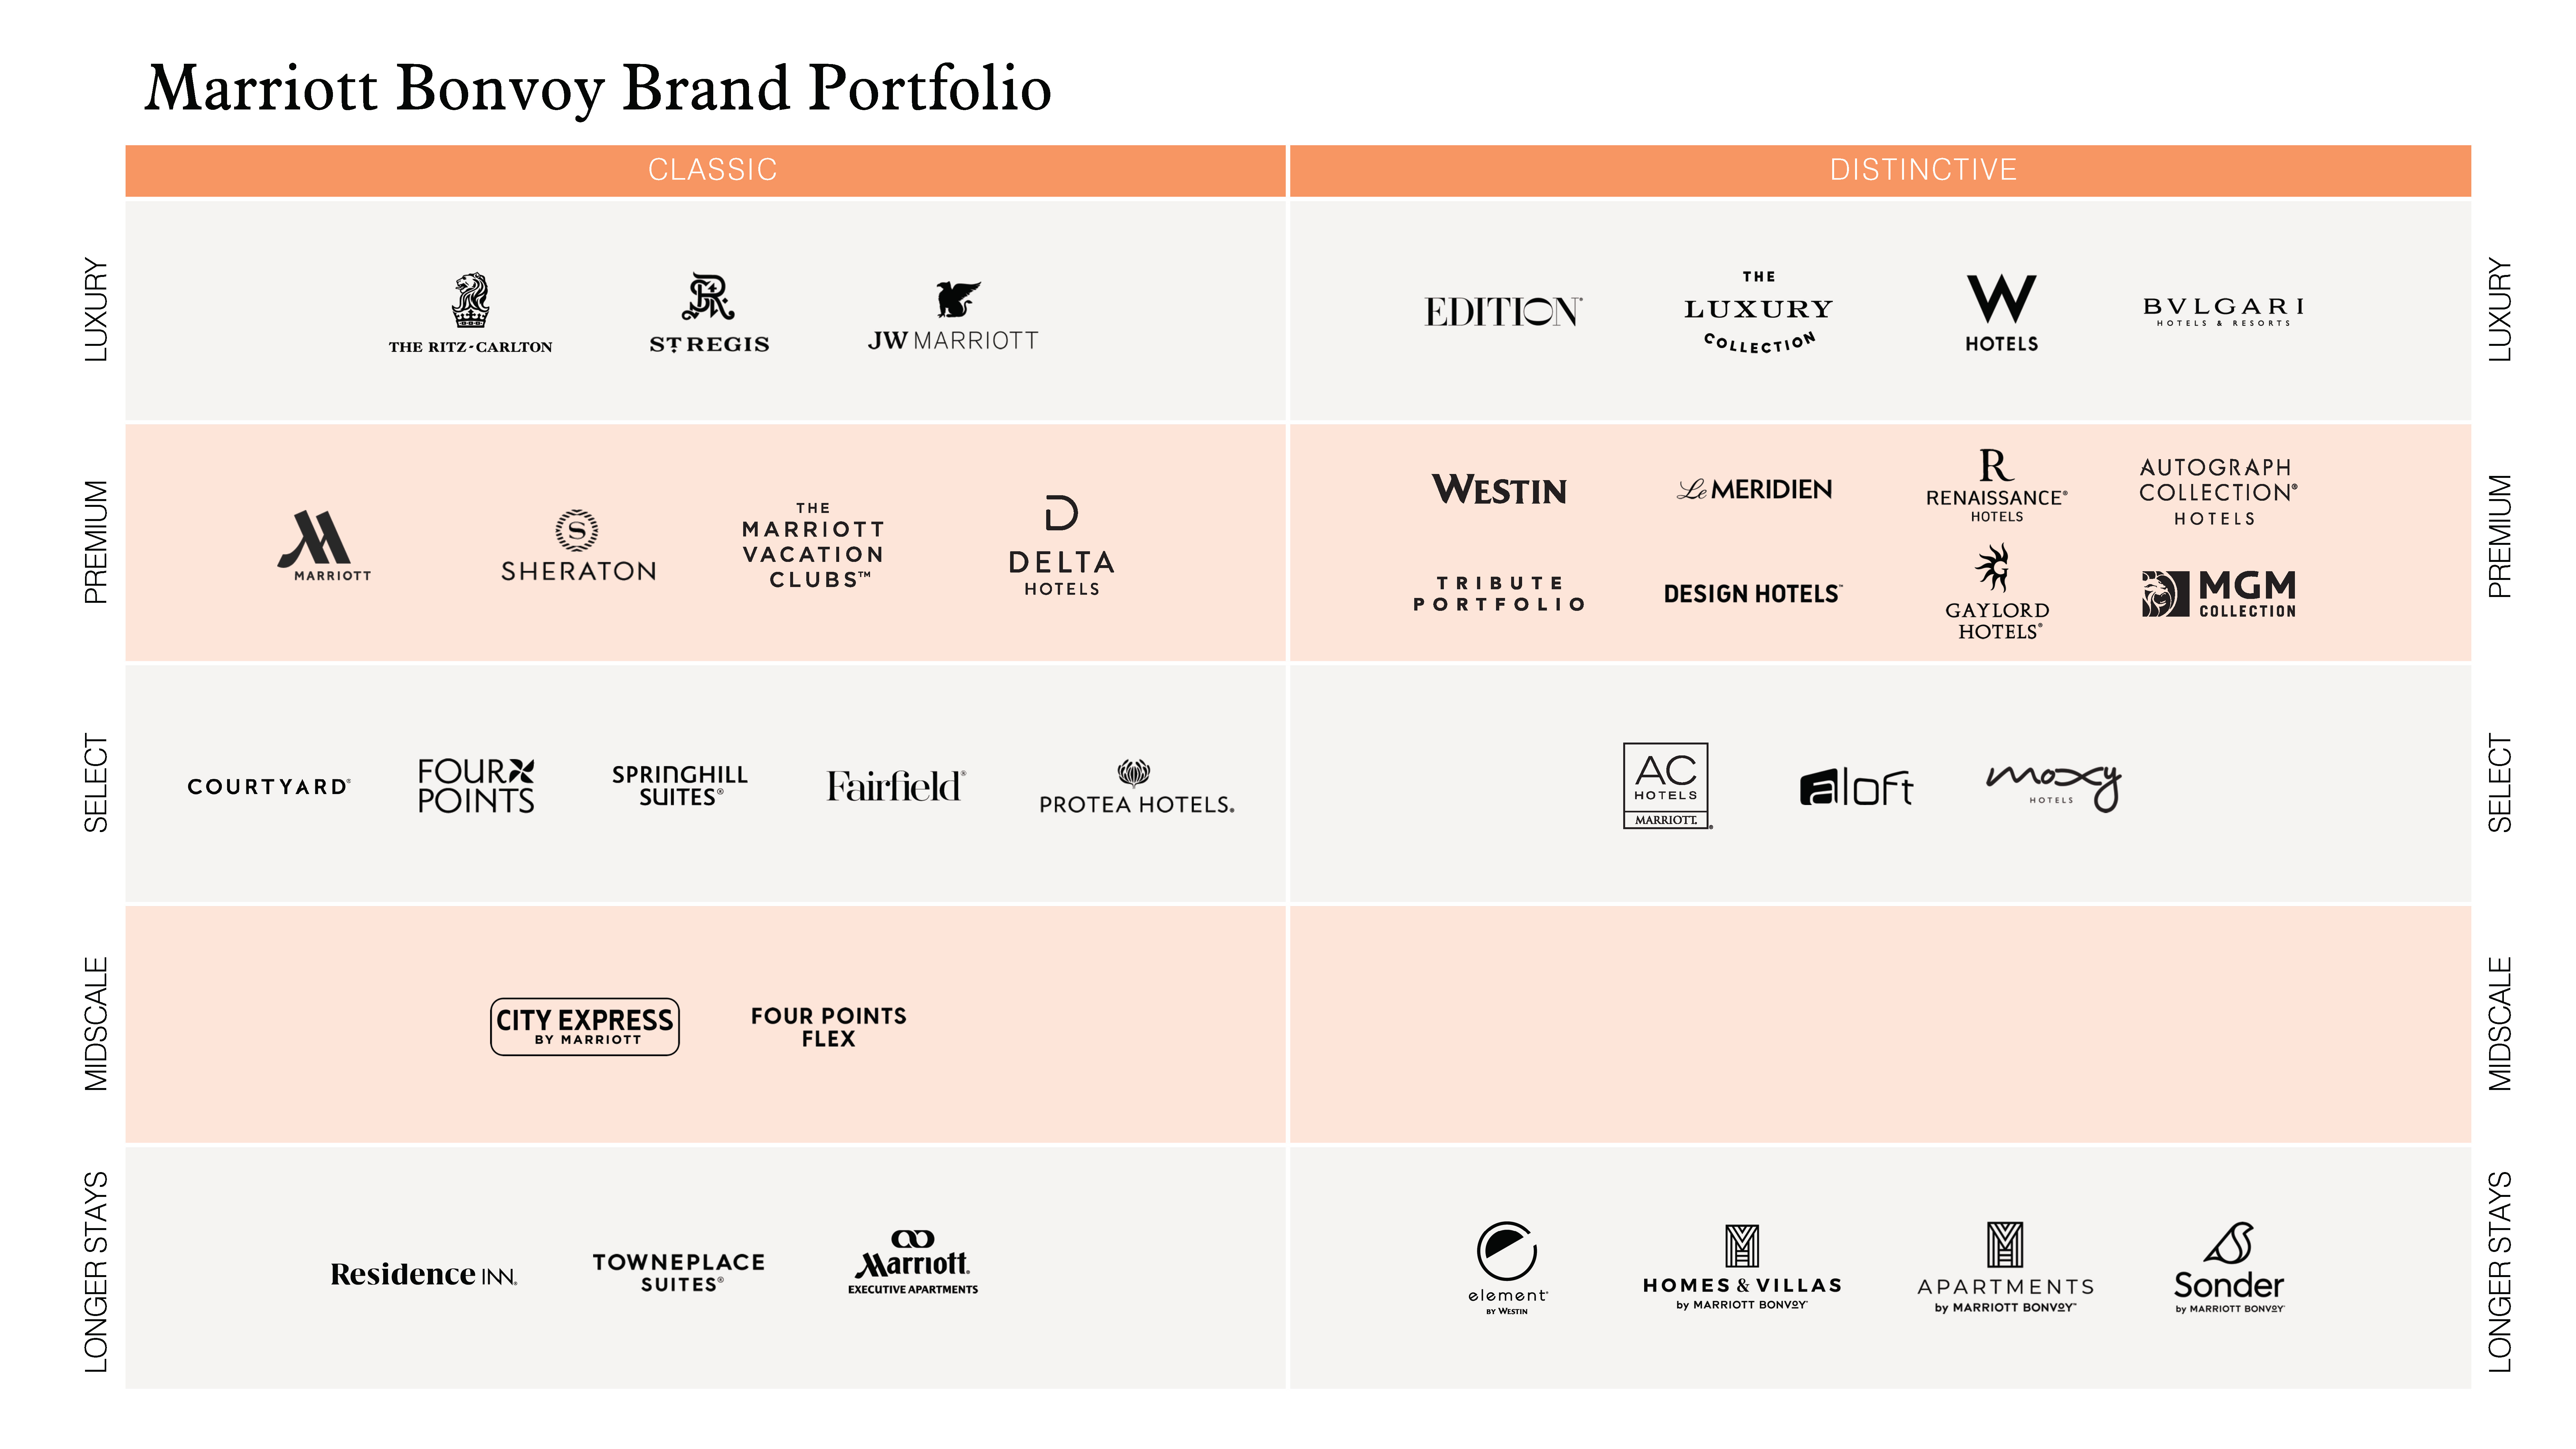
Brand Portfolio
We believe that our brand portfolio offers the most compelling range of brands and lodging offerings in hospitality. Our brands are categorized by style of offering - Classic and Distinctive. Our Classic brands offer time-honored hospitality for the modern traveler, and our Distinctive brands offer memorable experiences with a unique perspective - each of which we group into four quality tiers: Luxury, Premium, Select, and Midscale. Luxury offers bespoke and superb amenities and services. Premium offers sophisticated and thoughtful amenities and services. Select offers smart and easy amenities and services. Midscale offers limited services and essential amenities at a more affordable price point. Longer stay brands, which are classified under multiple quality tiers, offer amenities that mirror the comforts of home. The following table shows the portfolio of brands owned, operated, and/or licensed by Marriott for properties open at year-end 2024. In 2025, we expect properties to open under additional brand offerings, including our StudioResTM brand and our outdoor-focused lodging offerings.
The following table shows the geographic distribution of properties operating under the brands in our portfolio at year-end 2024:
| | | | | | | | | | | | | | | | | | | | | | | | | | |
| | U.S. & Canada | Europe | Middle East & Africa | Asia Pacific excluding China | Greater China | Caribbean & Latin America | Total |
| Luxury |
JW Marriott® | Properties | 35 | 8 | 13 | 29 | 24 | 17 | 126 |
| Rooms | 19,269 | 2,525 | 4,734 | 9,399 | 9,556 | 4,496 | 49,979 |
The Ritz-Carlton® | Properties | 43 | 13 | 16 | 24 | 18 | 9 | 123 |
| Rooms | 13,227 | 2,820 | 4,049 | 4,821 | 5,158 | 2,007 | 32,082 |
The Luxury Collection® | Properties | 19 | 40 | 15 | 30 | 5 | 11 | 120 |
| Rooms | 9,903 | 5,801 | 2,691 | 7,125 | 1,488 | 1,570 | 28,578 |
W Hotels® | Properties | 26 | 11 | 6 | 11 | 11 | 8 | 73 |
| Rooms | 8,417 | 2,271 | 2,175 | 2,754 | 3,905 | 1,931 | 21,453 |
St. Regis® | Properties | 13 | 7 | 14 | 10 | 14 | 5 | 63 |
| Rooms | 2,669 | 887 | 3,511 | 2,066 | 3,659 | 675 | 13,467 |
EDITION® | Properties | 5 | 5 | 4 | 3 | 2 | 1 | 20 |
| Rooms | 1,379 | 819 | 703 | 496 | 646 | 180 | 4,223 |
| Bvlgari | Properties | — | 4 | 1 | 2 | 2 | — | 9 |
| Rooms | — | 332 | 121 | 157 | 201 | — | 811 |
| Premium |
Marriott® Hotels | Properties | 336 | 75 | 31 | 55 | 71 | 34 | 602 |
| Rooms | 131,983 | 21,341 | 9,976 | 16,512 | 24,852 | 9,174 | 213,838 |
Sheraton® | Properties | 166 | 49 | 32 | 56 | 99 | 29 | 431 |
| Rooms | 64,254 | 13,469 | 9,513 | 16,914 | 38,399 | 8,091 | 150,640 |
Westin® | Properties | 136 | 18 | 8 | 39 | 31 | 15 | 247 |
| Rooms | 55,323 | 6,074 | 2,147 | 11,026 | 10,370 | 4,347 | 89,287 |
Autograph Collection® | Properties | 162 | 87 | 17 | 23 | 4 | 39 | 332 |
| Rooms | 37,404 | 12,024 | 2,753 | 4,969 | 571 | 12,777 | 70,498 |
Renaissance® Hotels | Properties | 90 | 25 | 6 | 15 | 32 | 10 | 178 |
| Rooms | 28,315 | 5,834 | 1,728 | 3,806 | 11,307 | 2,959 | 53,949 |
Le Méridien® | Properties | 24 | 16 | 20 | 33 | 21 | 3 | 117 |
| Rooms | 5,262 | 5,164 | 6,490 | 7,735 | 5,862 | 562 | 31,075 |
Delta Hotels by Marriott® (Delta Hotels®) | Properties | 92 | 32 | 8 | — | 4 | 3 | 139 |
| Rooms | 21,817 | 5,586 | 1,876 | — | 1,529 | 561 | 31,369 |
MGM Collection with Marriott Bonvoy (2) | Properties | 12 | — | — | — | — | — | 12 |
| Rooms | 26,210 | — | — | — | — | — | 26,210 |
Tribute Portfolio® | Properties | 88 | 28 | 8 | 13 | 8 | 9 | 154 |
| Rooms | 16,578 | 3,794 | 1,173 | 1,444 | 1,735 | 1,011 | 25,735 |
Gaylord® Hotels | Properties | 6 | — | — | — | — | — | 6 |
| Rooms | 10,220 | — | — | — | — | — | 10,220 |
Design Hotels® | Properties | 20 | 93 | 9 | 13 | 4 | 22 | 161 |
| Rooms | 2,157 | 6,912 | 768 | 955 | 783 | 531 | 12,106 |
Marriott Executive Apartments® | Properties | — | 3 | 13 | 13 | 11 | 2 | 42 |
| Rooms | — | 212 | 1,841 | 1,785 | 1,735 | 240 | 5,813 |
Apartments by Marriott BonvoyTM | Properties | — | — | — | — | — | 2 | 2 |
| Rooms | — | — | — | — | — | 231 | 231 |
| Sonder by Marriott Bonvoy | Properties | 104 | 56 | 3 | — | — | — | 163 |
| Rooms | 6,501 | 1,850 | 844 | — | — | — | 9,195 |
| | | | | | | | | | | | | | | | | | | | | | | | | | |
| | U.S. & Canada | Europe | Middle East & Africa | Asia Pacific excluding China | Greater China | Caribbean & Latin America | Total |
| Select |
Courtyard by Marriott® (Courtyard®) | Properties | 1,076 | 80 | 12 | 65 | 58 | 50 | 1,341 |
| Rooms | 148,671 | 14,639 | 2,635 | 13,184 | 14,951 | 8,100 | 202,180 |
Fairfield by Marriott® (Fairfield®) | Properties | 1,174 | 1 | — | 72 | 66 | 18 | 1,331 |
| Rooms | 111,495 | 222 | — | 9,614 | 10,398 | 2,521 | 134,250 |
Residence Inn by Marriott® (Residence Inn®) | Properties | 873 | 30 | 8 | — | — | 9 | 920 |
| Rooms | 107,249 | 3,446 | 1,205 | — | — | 1,328 | 113,228 |
SpringHill Suites by Marriott® (SpringHill Suites®) | Properties | 563 | — | — | — | — | — | 563 |
| Rooms | 66,666 | — | — | — | — | — | 66,666 |
Four Points by Sheraton® (Four Points®) | Properties | 148 | 24 | 23 | 50 | 67 | 20 | 332 |
| Rooms | 22,028 | 4,309 | 5,520 | 11,501 | 17,724 | 2,624 | 63,706 |
TownePlace Suites by Marriott® (TownePlace Suites®) | Properties | 525 | — | — | — | — | — | 525 |
| Rooms | 53,208 | — | — | — | — | — | 53,208 |
Aloft® Hotels | Properties | 166 | 11 | 12 | 17 | 14 | 17 | 237 |
| Rooms | 24,010 | 1,763 | 2,743 | 4,296 | 3,180 | 2,769 | 38,761 |
AC Hotels by Marriott® | Properties | 126 | 88 | 2 | 7 | 2 | 19 | 244 |
| Rooms | 21,029 | 11,909 | 286 | 1,966 | 378 | 3,007 | 38,575 |
Moxy® Hotels | Properties | 44 | 93 | — | 13 | 11 | — | 161 |
| Rooms | 7,805 | 17,587 | — | 2,886 | 2,052 | — | 30,330 |
Element® Hotels | Properties | 90 | 2 | 7 | 3 | 8 | — | 110 |
| Rooms | 12,428 | 275 | 1,189 | 572 | 1,647 | — | 16,111 |
Protea Hotels® by Marriott | Properties | — | — | 64 | — | — | — | 64 |
| Rooms | — | — | 6,932 | — | — | — | 6,932 |
| Midscale |
City Express by MarriottSM | Properties | 1 | — | — | — | — | 152 | 153 |
| Rooms | 83 | — | — | — | — | 17,694 | 17,777 |
Four Points FlexSM by Sheraton | Properties | — | 11 | 4 | 13 | — | — | 28 |
| Rooms | — | 1,420 | 231 | 3,386 | — | — | 5,037 |
| Residences |
| Residences | Properties | 72 | 12 | 17 | 20 | 2 | 14 | 137 |
| Rooms | 7,664 | 619 | 2,429 | 3,808 | 302 | 862 | 15,684 |
| Subtotal Properties | 6,235 | 922 | 373 | 629 | 589 | 518 | 9,266 |
| Subtotal Rooms | 1,043,224 | 153,904 | 80,263 | 143,177 | 172,388 | 90,248 | 1,683,204 |
| | | | | | | | |
Timeshare (1) | Properties | | | | | | | 93 |
| Rooms | | | | | | | 22,750 |
Yacht (1) | Properties | | | | | | | 2 |
| Rooms | | | | | | | 377 |
| Total Properties | | | | | | | 9,361 |
| Total Rooms | | | | | | | 1,706,331 |
(1)We exclude geographical data for Timeshare and Yacht as these offerings are captured within “Unallocated corporate and other.”
(2)Excludes five MGM Collection with Marriott Bonvoy properties (two Autograph Collection, one Tribute Portfolio, one The Luxury Collection, and one W Hotels), which are presented within their respective brands.
Property and room counts presented by brand in the above table include certain hotels in our system that are not yet operating under such brand, but are expected to operate under such brand following the completion of planned renovations. In addition, Four Points Flex by Sheraton refers to properties previously referred to as Four Points Express by Sheraton.
Company-Operated Properties
At year-end 2024, we had 2,032 company-operated properties (586,201 rooms), which included properties under long-term management agreements with hotel owners and properties that we own and lease.
Terms of our management agreements vary, but we earn a management fee that is typically composed of a base management fee, which is a percentage of the revenues of the hotel, and an incentive management fee, which is based on the profits of the hotel. In many cases (particularly in our U.S. & Canada, Europe, and CALA regions), incentive management fees
are subject to a specified owner return. Our management agreements also typically include reimbursement of costs of operations (both direct and indirect). Such agreements are generally for initial periods of 20 to 30 years, with options for us to renew for up to 10 or more additional years. Our lease agreements also vary, but may include fixed annual rentals plus additional rentals based on a specified percentage of annual revenues that exceed a fixed amount. In many jurisdictions, our management agreements may be subordinated to mortgages or other liens securing indebtedness of the hotel owners. Many of our management agreements also permit the hotel owners to terminate the agreement if we do not meet certain performance metrics, financial returns fail to meet defined levels for a period of time, and we have not cured those deficiencies.
For the hotels we operate, we generally are responsible for hiring, training, and supervising the associates needed to operate the hotels and for incurring operational and administrative costs related to the operation of the hotels, and hotel owners are required to reimburse us for those costs. We provide centralized programs and services, such as our Loyalty Program (as defined below), reservations, and marketing, as well as various accounting and data processing services, and hotel owners are required to reimburse us for those costs as well.
Franchised, Licensed, and Other Properties
We have franchise, license, and other arrangements that permit hotel owners and certain other third parties to use many of our lodging brand names and systems.
Under our hotel franchising arrangements, we generally receive an initial application fee and continuing royalty fees, which typically range from four to seven percent of room revenues, plus for certain brands, up to four percent of food and beverage revenues, as well as reimbursement for centralized programs and services, such as our Loyalty Program, reservations, and marketing. Such agreements are generally for periods of 10 to 20 years.
We also have license and other agreements with third parties for certain offerings, such as for our timeshare properties, MGM Collection with Marriott Bonvoy, Design Hotels, and The Ritz-Carlton Yacht Collection, pursuant to which we receive royalty and certain other fees. For our timeshare properties, we receive royalty fees under license agreements with Marriott Vacations Worldwide Corporation and its affiliates (collectively, “MVW”) for certain brands. The royalty fees we receive from MVW consist of a fixed annual fee, adjusted for inflation, plus certain variable fees based on sales volumes. Certain licensees are also charged for certain systems and centralized programs and services, such as our Loyalty Program, reservations, and marketing.
At year-end 2024, we had 7,192 franchised, licensed, and other properties (1,104,446 rooms and timeshare units).
Residential
We use or license certain of our trademarks for the sale of residential real estate, often in conjunction with hotel development. We receive one-time branding fees upon the sale of each branded residential unit by the third-party developers who construct and sell the residences, with limited amounts, if any, of our capital at risk. We often also manage the related homeowners’ association and receive continuing management fees for that service. At year-end 2024, we had 137 branded residential properties (15,684 residential units).
Intellectual Property
We operate in a highly competitive industry and our brand names, trademarks, service marks, trade names, and logos are very important to our business, including the development, sales and marketing of our lodging offerings and services. We believe that our brand names and other intellectual property have come to represent outstanding quality, care, service, and value to our customers, guests, and the traveling public. Accordingly, we register and protect our intellectual property where we deem appropriate and otherwise protect against its unauthorized use.
Loyalty and Credit Card Programs
Marriott Bonvoy® is central to our business strategy. It encompasses our portfolio of over 30 brands and other travel offerings, our direct channels, and our award-winning travel loyalty program, which we refer to throughout this report as our “Loyalty Program.” Loyalty Program members can earn points for stays at participating properties and other travel offerings, such as Homes & Villas by Marriott Bonvoy, a global offering focusing on the premium and luxury tiers of rental homes, as well as through purchases with co-branded credit cards and our Loyalty Program partners. Members can redeem points for stays at participating properties, airline tickets, airline frequent flyer program miles, rental cars, products from Marriott Bonvoy Boutiques®, and a variety of other awards, including experiences from Marriott Bonvoy Moments®.
We believe that our Loyalty Program generates substantial repeat business that might otherwise go to competing properties. In 2024, 72 percent of our U.S. hotel room nights and 65 percent of our global hotel room nights were booked by Loyalty Program members. We strategically market to this large and growing guest base to generate revenue.
We have co-branded credit cards associated with Marriott Bonvoy in 11 countries. In the U.S., we have multi-year agreements with JPMorgan Chase and American Express. We also license credit card programs internationally, including in Japan, China, Canada, the United Arab Emirates, and other markets. We generally earn fixed amounts that are payable at contract inception and variable amounts that are paid to us monthly over the term of the agreements primarily based on card usage. We believe that our co-branded credit cards create a diverse revenue stream for the Company, reflect the quality and value of our portfolio of brands, and contribute to the strength of our Loyalty Program by creating value for our customers, hotel owners, and other parties with whom we have an affiliation. Payments received under our co-branded credit card agreements represent a significant funding source for the Loyalty Program.
See the “Loyalty Program” caption in Note 2 for more information about our Loyalty Program and co-branded credit cards.
Sales and Marketing and Reservation Systems
Marriott.com, the Marriott Bonvoy mobile app, and our other direct digital channels offer seamless digital experiences. We deliver customer-minded enhancements, including powerful in-stay capabilities through our mobile app, such as contactless check-in and check-out, Mobile Key, chat, service requests, mobile dining, and more. In addition, we are focused on strengthening Marriott Bonvoy by attracting more Loyalty Program members and localizing our experiences to reach new customers around the world. Our focus on creating frictionless experiences throughout our direct digital channels is foundational to our worldwide technology systems transformation. This multi-year transformation of our reservations, property management, and loyalty systems is focused on introducing new technology that delivers more choices for customers, new capabilities for associates, and new revenue opportunities for hotels in our system.
Our above-property sales deployment and revenue management strategies are designed around the way the customer wants to buy and the strategic priorities of hotels in our system. Our above-property sales strategy focuses on offering global business-to-business solutions, driving efficiencies, optimizing revenue, and enhancing customer loyalty while minimizing duplication of efforts at the hotel level. We also utilize innovative and sophisticated revenue management systems, many of which are proprietary, which are designed to facilitate pricing decisions, increase efficiency, and optimize property-level revenue. Most of the hotels in our portfolio utilize web-based programs to effectively manage the rate set-up and modification processes, which provides for greater pricing flexibility and increased efficiency.
Our marketing strategies focus on building awareness, increasing demand, promoting Marriott Bonvoy, and increasing customer loyalty. We do this through a variety of brand and marketing programs, offerings, and tools.
Competition
We compete for guests in many areas, including brand recognition and reputation, location, guest satisfaction, room rates, quality of service, amenities, quality of accommodations, safety and security, and the ability to earn and redeem loyalty program points. We encounter strong competition in the short-term lodging market from regional, national, and international chains that operate lodging properties or franchise their brands, lodging properties that are not affiliated with a chain, and online platforms, including Airbnb and Vrbo, that allow travelers to book short-term rentals of homes and apartments as an alternative to hotel rooms. Although we believe that our strong brand recognition assists us in attracting and retaining guests and hotel owners, we compete against many other companies with strong brands and guest appeal, including Hilton, IHG Hotels & Resorts, Hyatt, Wyndham Hotels & Resorts, Accor, Choice Hotels, Best Western Hotels & Resorts, and others. Our direct digital channels also compete for guests with online travel services platforms, such as Expedia.com, Priceline.com, Booking.com, Travelocity.com, Orbitz.com, and Trip.com, and search engines such as Google, Bing, Yahoo, and Baidu.
We believe that the location and quality of our lodging offerings, our Loyalty Program, our marketing programs, our reservation systems, and our emphasis on guest service and guest and associate satisfaction contribute to guest preference across all our brands.
Affiliation with a brand is common in the U.S. lodging industry. In 2024, approximately 73 percent of U.S. hotel rooms were brand-affiliated. Although lodging properties outside the U.S. also often affiliate with a brand, such brand affiliation is
less prevalent than in the U.S. Based on lodging industry data, we have an approximately 17 percent share of the U.S. hotel market and a four percent share of the hotel market outside the U.S. (based on number of rooms).
We believe that our brands are attractive to hotel owners seeking a management company, franchise, or other licensing affiliation because of the benefits of our Loyalty Program, centralized reservation systems, marketing programs, and other offerings, and our emphasis on guest service.
Seasonality
In general, business at hotels in our system fluctuates moderately with the seasons. Business at some resort properties may be more seasonal depending on location.
Human Capital Management
Marriott’s long history of service, innovation, and growth is built on a culture of putting people first. We are committed to investing in our associates, with a focus on leadership development, competitive compensation, and creating a sense of well-being and belonging for all.
At year-end 2024, Marriott managed the employment of approximately 418,000 associates. This number includes approximately 155,000 associates employed by Marriott at properties, customer care centers, and above-property operations, as well as approximately 263,000 associates who are employed by our hotel owners but whose employment is managed by Marriott (which is common outside the U.S.). Approximately 118,000 of the associates employed by Marriott are located in the U.S., of which approximately 20,000 belong to labor unions. Outside the U.S., some of our associates are represented by trade unions, works councils, or employee associations. These numbers do not include hotel personnel employed by our independent franchisees and licensees or management companies hired by our franchisees and licensees. Marriott is committed to conducting its business in accordance with high ethical and legal standards, and our franchisees are expected to develop responsible human capital management practices.
We are focused on maintaining Marriott’s position as an employer of choice both for job seekers and our existing associates. To attract talent, we are targeting new labor pools, optimizing our recruiting practices, and sharing our story of long-term career potential. Our people brand, “Be™”, showcases associate stories to highlight the meaningful work and numerous opportunities at the Company. At our headquarters in Bethesda, Maryland, we utilize a hybrid work model to allow for flexibility and choice to meet the needs of our corporate workforce. For many hotel-based associates, we are innovating the way hotel jobs are structured, introducing more flexibility and choice through our integrated jobs program, which allows associates to have more cross-training and engaging roles.
We encourage continual feedback from our associates at all levels. We measure associate satisfaction through our Associate Engagement Survey, which gives all associates the opportunity to provide feedback about their work experience, providing valuable insights so we can drive improvements in our culture. In 2024, we changed our cadence from an annual survey to three times per year to allow for more frequent feedback. Our associate engagement scores exceeded the “Global Best Employer” external benchmark in 2024, and we were recognized as a top 10 company on the Fortune 100 Best Companies to Work For® in 2024, a list we have been on for 27 consecutive years.
In 2024, we launched a comprehensive initiative, with a focus on our headquarters and corporate offices, to enhance our effectiveness and efficiency across the Company and to advance our strategic objectives. As part of these efforts, we streamlined some roles, reshaped work to focus on our highest priorities, and de-layered the organization to speed up and simplify decision-making capabilities of our teams.
Our human capital strategy is based on three signature elements – Growing Great Leaders, Investing in Associates, and Providing Access to Opportunity.
Growing Great Leaders
We believe that associates at every level can inspire others through great leadership. Our Leadership Framework, designed to help us grow great leaders, starts with three Leadership Essentials that clearly define what great leadership means at Marriott at all levels of the organization. In 2024, we also revamped our leadership development offerings with tailored programming that targets successive managerial levels, creating a clear pathway for associates to progressively grow into leadership roles. Our leadership competencies are integrated into our performance management process and leadership development programs. Our talent development strategy is designed to provide opportunities for our associates to develop and grow their careers with Marriott for the long term while driving the performance of our business.
Investing in Associates
We are focused on providing our associates with the tools, resources, and support they need to thrive – both personally and professionally. We provide our eligible U.S. associates and their families with access to comprehensive compensation and benefits offerings, such as health care coverage, work/life support benefits, and other offerings, including retirement savings and employee stock purchase plans. Outside the U.S., we offer comprehensive compensation and benefit programs that vary based on the geographic market and we regularly evaluate these programs for competitiveness against the external talent market. Our TakeCare program provides associates with tools and resources to support their physical, mental, and financial well-being.
In addition, pay equity is foundational to our compensation structures and practices. Globally, pay equity best practices guide our determination of starting pay for our associates, including our policy of prohibiting compensation history inquiries. In the U.S., we conduct pay equity audits at least annually and make adjustments as needed.
Providing Access to Opportunity
Our focus on access to opportunity encompasses a range of initiatives and programs to support our goal to make all stakeholders (including associates, guests, hotel owners, and suppliers) feel welcome and valued. The Inclusion and Social Impact Committee of our Board of Directors (“Board”), established over 20 years ago, assists the Board in providing oversight of the Company’s strategy related to our people-first culture, associate well-being and inclusion, and corporate social responsibility and environmental matters.
Sustainability and Social Impact
We are focused on creating a positive and sustainable impact wherever we do business. Our sustainability and social impact platform, Serve 360: Doing Good in Every Direction, is built around four focus areas: Nurture Our World; Sustain Responsible Operations; Empower Through Opportunity; and Welcome All and Advance Human Rights. Our efforts are centered around (1) making the communities and environments where we operate better places to live, work, and visit, (2) embedding sustainability across our operations, (3) providing access to workplace readiness and opportunity for all to grow and succeed, and (4) encouraging cultural understanding and connecting people through the power of travel.
Our sustainability strategy and initiatives focus on a wide range of issues, including designing resource-efficient hotels, implementing technologies to track and reduce energy and water consumption, as well as waste and food waste, increasing the use of renewable energy, managing water-related risks, focusing on third-party sustainability certifications at the hotel-level, supporting ecosystem restoration initiatives, and focusing on responsible and local sourcing.
We have set near-term and long-term science-based emissions reduction targets, which were verified by the Science Based Targets initiative in 2024.
In response to humanitarian crises and natural disasters, hotels in our system often look to support their local communities in need by donating funds, hotel stays, food, supplies, and volunteer hours. We also deploy our Company relief funds to support affected associates and their families and charitable organizations providing relief in impacted areas. We also continue to focus on our efforts to advance human rights, including by continuing to train associates in human trafficking awareness and donating our training program to the broader lodging industry.
Government Regulations
As a company with global operations, we are subject to a wide variety of laws, regulations, and government policies around the world. Some of the regulations that most affect us and our business include those related to employment practices; marketing and advertising; consumer protection; trade and economic sanctions; anti-bribery, anti-corruption, and anti-money laundering; intellectual property; cybersecurity, data privacy, data localization, data transfers, and the handling of personally identifiable information; competition; climate and the environment; health, safety, and accessibility; liquor sales; the offer and sale of franchises; and credit card products.
Internet Address and Company SEC Filings
Our primary Internet address is Marriott.com. On the investor relations portion of our website, Marriott.com/investor, we provide a link to our electronic filings with the SEC, including our annual report on Form 10-K, our quarterly reports on Form 10-Q, our current reports on Form 8-K, and any amendments to these reports. We make all such filings available free of charge as soon as reasonably practicable after filing. The information found on our website is not part of this or any other report we file with or furnish to the SEC.
Item 1A. Risk Factors.
We are subject to various risks that make an investment in our securities risky. The events and consequences discussed in these risk factors could, in circumstances we may or may not be able to accurately predict, recognize, or control, have a material adverse effect on our business, liquidity, financial condition, and results of operations. In addition, these risks could cause results to differ materially from those we express in forward-looking statements contained in this report or in other Company communications. These risk factors do not identify all risks that we face, and our business could also be affected by factors, events, or uncertainties that are not presently known to us or that we currently do not consider to present significant risks to our operations.
Risks Relating to Our Industry
Our industry is highly competitive, which may impact our ability to compete successfully for guests. We operate in markets that contain many competitors. Our hotel brands and other lodging offerings generally compete with regional, national, and international chains that operate lodging properties or franchise their brands, lodging properties that are not affiliated with a chain, and online platforms that allow travelers to book short-term rentals of homes and apartments. Our ability to remain competitive and attract and retain business, group and leisure travelers depends on our success in distinguishing and driving preference for our lodging products and services, including our Loyalty Program, direct channels, consumer-facing technology platforms and services, our co-branded credit cards, and other offerings. If we cannot compete successfully in these areas, our business, liquidity, financial condition, and results of operations could be materially adversely affected. Further, new lodging supply in individual markets could have a negative impact on the hotel industry and hamper our ability to maintain or increase room rates or occupancy in those markets.
Economic and other global, national, and regional conditions and events have in the past impacted, and could in the future impact, our business, financial results and growth. Because we conduct our business on a global scale, we are affected by changes in global, national, or regional economies, governmental policies (including in areas such as trade, travel, immigration, labor, healthcare, and related issues), and geopolitical, public health, social and other conditions and events. Our business, financial results and growth are impacted by weak or volatile economic conditions; pandemics and other outbreaks of disease; natural and man-made disasters; changes in energy prices, interest rates and currency values; political instability, geopolitical disputes or conflict, actual or threatened war, terrorist activity, civil unrest and other acts of violence; heightened travel security measures, travel advisories, and disruptions in air and ground travel; and concerns over the foregoing. These conditions and events have in the past materially negatively impacted, and could in the future materially negatively impact, our business, operations, and financial results in many ways, including, but not limited to, as follows:
•reducing revenues at hotels in our system, impacting our fees and the ability of hotels to meet expenses, including payment of amounts owed to us;
•reducing revenues we receive from other programs and offerings;
•adversely affecting the value of our owned and leased properties or investments;
•affecting the ability or willingness of hotel owners to service, repay or refinance existing indebtedness or similar obligations, including loans or guaranty advances we have made to or for them;
•making it more difficult for hotel owners to obtain financing on commercially acceptable terms, or at all;
•causing hotel construction and opening delays;
•decreasing the rate at which new projects enter our pipeline;
•causing hotels to exit our system;
•increasing operating costs;
•requiring us to borrow or otherwise raise a significant amount of cash in order to preserve financial flexibility, repay maturing debt and manage debt maturities;
•causing the terms of our borrowing to be more expensive or more restrictive; and
•adversely affecting associate hiring and retention.
The conditions and events discussed in this risk factor could also give rise to, aggravate, and impact our ability to allocate resources to mitigate the other risks that we identify below, which in turn could materially adversely affect our business, liquidity, financial condition, and results of operations.
Risks Relating to Our Business
Operational Risks
Premature termination of our agreements with hotel owners could hurt our financial performance. Our agreements with hotel owners may be subject to premature termination in certain circumstances, such as the bankruptcy of a hotel owner, the failure of a hotel owner to comply with its payment or other obligations under the agreement, a failure under some agreements to meet specified financial or performance criteria which we do not cure, or in certain limited cases, other
negotiated contractual termination rights. Hotel owners may assert the right to terminate our agreements even where the agreements provide otherwise, and some courts have upheld such assertions about our agreements and may do so in the future. When terminations occur for certain of these or other reasons, we may need to enforce our right to damages for breach of contract and related claims, which may cause us to incur significant legal fees and expenses. We may have difficulty collecting damages from the hotel owner, and any damages we ultimately collect could be less than the projected future value of the fees and other amounts we would have otherwise collected under the agreement with the hotel owner. A significant loss of these agreements could hurt our financial performance or our ability to grow our business.
Disagreements with hotel owners and other counterparties may result in arbitration or litigation or delay implementation of product or service initiatives. Consistent with our focus on management, franchising, and licensing, we own very few of our lodging properties. The nature of our rights and responsibilities under our agreements with hotel owners and other counterparties may be subject to interpretation. This has from time to time given rise to disagreements with such parties, and may give rise to such disagreements in the future, including over new product, service, or systems initiatives and their associated costs, the timing and amount of capital investments, and reimbursement for operating costs, system costs, or other amounts. We have seen, and may in the future see, an increase in such disagreements during periods when hotel returns are weaker. We seek to resolve any disagreements and to develop and maintain positive relations with our hotel owners and other counterparties, but we cannot always do so. Failure to resolve such disagreements has resulted in arbitration or litigation, and could do so in the future. We could suffer significant losses, reduced profits, or constraints on our operations as the result of adverse dispute resolution outcomes.
An increase in the use of Internet travel intermediaries to book hotel reservations could adversely impact our business. Some of our hotel rooms are booked through Internet travel intermediaries such as Expedia.com, Priceline.com, Booking.com, Travelocity.com, Orbitz.com, and Trip.com. In addition to their focus on leisure travel, these intermediaries also provide offerings for corporate travel and group meetings. Internet search engines may also divert business away from our channels to intermediaries. Although our Best Rate Guarantee and Member Rate programs have helped limit guest preference shift to intermediaries and greatly reduced the ability of intermediaries to undercut the published rates at hotels in our system, intermediaries continue to use a variety of aggressive online marketing methods to attract guests, including the purchase by certain companies of trademarked online keywords such as “Marriott” from Internet search engines such as Google, Bing, Yahoo, and Baidu to steer guests toward their websites. Our business and profitability could be harmed to the extent that guest booking preference shifts from our direct digital channels to Internet travel intermediaries, diverting bookings away from our direct digital channels and increasing the overall cost of bookings for hotels in our system. At the same time, if we are not able to negotiate new agreements on satisfactory terms when our existing contracts with intermediaries (which generally have two- to three-year terms) come up for renewal, our business and prospects could be negatively impacted in a number of ways, including by reducing bookings or making our brands less attractive to hotel owners.
Our growth strategy depends upon attracting hotel owners to our platform, and future arrangements with these third parties may be less favorable to us, depending on the terms offered by our competitors. Adding properties to our system entails entering into and maintaining various arrangements with hotel owners. Our ability to attract and retain hotel owners and the terms of our agreements with hotel owners are influenced by the needs and preferences of hotel owners and the offerings otherwise available to hotel owners in the market, among other things. We cannot assure you that any of our current arrangements will continue or that we will be able to renew agreements or enter into new agreements in the future on terms that are as favorable to us as those that exist today.
The effects of, or our failure to comply with, applicable laws, regulations, and government policies may disrupt our business, lower our revenues, increase our costs, reduce our profits, limit our growth, or damage our reputation. We, the hotels in our system, our other lodging offerings, and the programs that we offer are subject to or affected by a variety of laws, regulations, and government policies around the globe, including, among others, those related to employment practices; marketing and advertising; consumer protection; trade and economic sanctions; anti-bribery, anti-corruption, and anti-money laundering; intellectual property; cybersecurity, data privacy, data localization, data transfers, and the handling of personally identifiable information; competition; climate and the environment; health, safety, and accessibility; liquor sales; the offer and sale of franchises; and credit card products. These laws, regulations, and government policies may be complex and change frequently and could have a range of adverse effects on our business. The compliance programs, internal controls, and policies we maintain and enforce need to be updated regularly to keep pace with changing laws, regulations, and government policies, may not cover all applicable risk areas, and, as we have seen in the past, may not prevent us, our associates, service providers, or agents from materially violating applicable laws, regulations, and government policies. The requirements of applicable laws, regulations, and government policies, our failure to meet such requirements (including investigations and publicity resulting from actual or alleged failures), or actions we take to comply with such requirements or investigations could have significant adverse effects on our results of operations, reputation, or ability to grow our business.
Third-party claims that we infringe the intellectual property rights of others or our failure to defend our own intellectual property rights could materially adversely affect our business. Third parties sometimes make claims against us for infringing their intellectual property rights (including as a result of the actions of our hotel owners, service providers, and other parties with whom we do business). We have been and are currently party to a number of such claims and may be subject to additional claims in the future. Such claims have in the past, and could in the future:
•be expensive and time consuming to defend;
•require or result in significant monetary payments to claimants;
•require or result in the limitation or cessation of our use of the intellectual property at issue;
•force us to redesign or rebrand our products or services; or
•result in other adverse effects on our business or reputation.
We may also be required to indemnify hotel owners, service providers, and other parties with whom we do business for losses they incur as a result of any infringement claims against them related to our intellectual property or as a result of our use of the intellectual property of third parties.
In addition, if third parties copy or use our intellectual property without authorization, the value of our brands, our competitive advantages, or our goodwill could be harmed. The steps we take to secure, protect, and defend our intellectual property rights may not succeed or be adequate to prevent others from infringing, copying, or using our intellectual property without proper authorization. Such steps, including enforcing our intellectual property rights, are costly and could force us to divert our resources, lead to counterclaims or other claims against us, or otherwise result in harm to our business.
If our brands, goodwill, or other intangible assets become impaired, we may be required to record significant non-cash charges to earnings. We hold a significant amount of goodwill and other intangible assets on our Balance Sheets. We review goodwill and indefinite-lived intangible assets for impairment annually or whenever events or circumstances indicate impairment may have occurred. Estimated fair values of our brands or reporting units could change if, for example, there are changes in the business climate, unanticipated changes in the competitive environment, adverse legal or regulatory claims, actions or developments, changes in guests’ perception and the reputation of our brands, or changes in interest rates, operating cash flows, or market capitalization. Because of the significance of our goodwill and other intangible assets, any future impairment of these assets could require material non-cash charges to our results of operations, which could have a material adverse effect on our reported financial condition and results of operations.
Our business depends on the quality and reputation of our Company and our brands, and any deterioration could adversely impact our market share, reputation, business, financial condition, or results of operations. Many factors can affect the reputation and value of our Company or one or more of our brands, hotels in our system, or other offerings, including adherence to service and other brand standards; matters related to, or incidents involving, food quality and safety, guest and associate safety, health and cleanliness, sustainability and climate impact, supply chain management, inclusion and belonging, human rights, and support for local communities; and compliance with applicable laws. Reputational value is also based on perceptions, and broad access to social media makes it easy for anyone to provide public feedback that can influence perceptions of us, our brands, hotels in our system, or other offerings, and it may be difficult to control or effectively manage negative publicity, regardless of whether it is accurate. While reputations may take decades to build, negative incidents can quickly erode trust and confidence, particularly if they result in adverse mainstream and social media publicity, governmental investigations, proceedings or penalties, or litigation. Negative incidents could lead to tangible adverse effects on our business, including lost sales, boycotts, reduced enrollment and/or participation in our Loyalty Program, loss of development opportunities, adverse government attention, adverse reaction from hotel owners, service providers, or other third parties, or associate retention and recruiting difficulties. Any material decline in the reputation or perceived quality of our brands or corporate image could affect our market share, reputation, business, financial condition, or results of operations.
Actions by our hotel owners or others could adversely affect our image and reputation. We franchise and license many of our brand names and trademarks to third parties for lodging, timeshare, and residential properties, and with respect to our credit card programs and other offerings, and enter into marketing and other strategic collaborations with other companies. Under the terms of their agreements with us, these third parties interact directly with guests and others under or in connection with our brand and trade names. These third parties sometimes fail to maintain or act in accordance with applicable brand standards; experience operational problems, including data or privacy incidents, or circumstances involving guest or associate health or safety; or project a brand image inconsistent with ours, each of which can cause our image and reputation to suffer. Although our agreements with these parties generally provide us with recourse and remedies in the event of a breach, including termination of the agreements under certain circumstances, it could be expensive or time-consuming for us to pursue such remedies and even if we are successful in pursuing such remedies, that may not be sufficient to mitigate reputational harm to us. We also cannot assure you that in every instance a court would ultimately enforce our contractual termination rights or that we could collect any awarded damages from the defaulting party.
Collective bargaining activity and strikes could materially disrupt hotel operations, increase labor costs, and interfere with the ability of our management to focus on executing our business strategies. A significant number of associates at our managed, leased, and owned hotels are covered by collective bargaining agreements. If relationships with our organized associates or the unions that represent them become adverse, then, as we have seen in the past, the properties we operate could experience labor disruptions such as strikes, lockouts, boycotts, and public demonstrations. Numerous collective bargaining agreements are typically subject to negotiation each year, and the successful resolution of such negotiations in the past does not mean that future negotiations will be resolved without significant strikes or disruptions, or on satisfactory terms. For many of the hotels in our system, including our franchised and licensed properties, we do not have the ability to control the negotiations of collective bargaining agreements, and collective bargaining activity and labor disruptions at these properties could adversely impact our business. Labor disputes and disruptions sometimes result in adverse publicity or regulatory investigations and adversely affect operations and revenues at impacted hotels. In addition, labor disputes and disruptions or increased demands from labor unions can sometimes harm associate relations, result in increased regulatory requirements or inquiries and enforcement by governmental authorities, harm relationships with guests and customers, divert management attention, and reduce customer demand, all of which could have a significant adverse effect on our reputation, business, financial condition, or results of operations.
In addition, labor regulation and the negotiation of new or existing collective bargaining agreements could, as we have seen in the past, lead to higher wage and benefit costs, changes in work rules that raise operating expenses and legal costs, and limitations on our ability or the ability of our hotel owners to take cost saving measures during economic downturns. Increased unionization of the workforce at hotels in our system, new labor legislation, or changes in regulations could disrupt operations at hotels in our system, reduce profitability, or interfere with the ability of our management to focus on executing our business strategies.
Our business could suffer if we or the hotels in our system cannot attract and retain associates or as the result of the loss of the services of our senior executives. We and the hotels in our system compete with other companies both within and outside of our industry for personnel. We and the hotels in our system have in the past experienced, and could in the future experience, challenges hiring for certain positions due to various factors, such as increasing wage expectations or competition for labor from other industries, and these circumstances could continue or worsen in the future to an extent and for durations that we are not able to predict. If we or the hotels in our system cannot recruit, train, develop, and retain sufficient numbers of associates, we could experience significant negative impacts on operations, associate morale and turnover, guest satisfaction, or our internal control environment. Insufficient numbers of associates could also limit our ability to grow and expand our business. Labor shortages have in the past resulted, and could in the future result, in higher wages and initial hiring costs, increasing our labor costs and labor costs at hotels in our system, which could reduce our revenues and profits. In addition, the efforts and abilities of our senior executives are important elements of maintaining our competitive position and driving future growth, and the loss of the services of one or more of our senior executives could result in challenges executing our business strategies or other adverse effects on our business.
Extreme weather, natural disasters, climate change, and sustainability-related concerns have impacted our business in the past and could in the future have a material adverse effect on our business and results of operations. We, the hotels in our system, and our other lodging offerings are subject to the risks associated with extreme weather, natural disasters, and climate change, including physical impacts, changes in laws and regulations, and changing consumer preferences. We have seen a decline in travel and reduced demand for lodging as a result of natural disasters and extreme weather in some markets and in areas of the world from which we draw guests, and the prevalence and impact of these events may increase or worsen in the future. Natural disasters, extreme weather, and other climate impacts and events (including rising sea levels, extreme hot or cold weather, flooding, water shortages, fires, and droughts) have impacted, and continue to impact, hotels in our system, including by causing physical damage that prevents or limits the operations of the property or resulting in increases in insurance, energy or other operating costs. Significant costs could be involved in improving the efficiency and climate resiliency of hotels in our system and otherwise preparing for, responding to, and mitigating climate or sustainability related impacts, events, or concerns. Compliance with climate-related legislation and regulation, and our efforts to achieve science-based emissions reduction targets or other sustainability initiatives, have been and are expected to continue to be complex and costly. Climate or other sustainability-related concerns may affect customers’ travel choices, including their frequency of travel. As a result of the foregoing, as we have seen in the past to some extent, we may experience reduced demand, increased costs, operating disruptions or limitations, and physical damage to hotels in our system, and we could experience constraints on our growth, all of which could adversely affect our profits and growth.
Insurance may not cover damage to, or losses involving, hotels in our system or other aspects of our business, and the cost of such insurance could increase. We require comprehensive property and liability insurance policies for hotels in our system with coverage features and insured limits that we believe are customary. Market forces beyond our control may nonetheless limit the scope of the insurance coverage we or our hotel owners can obtain, or our or their ability to obtain coverage at reasonable rates. Certain types of losses, generally of a catastrophic nature, such as earthquakes, fires, hurricanes
and floods, terrorist acts, pandemics, or liabilities that result from incidents involving the security of information systems, may result in high deductibles, low limits, or may be uninsurable, or the cost of obtaining insurance may be unacceptably high. As a result, we and our hotel owners may not be successful in obtaining insurance without increases in cost or decreases in coverage levels, or may not be successful in obtaining insurance at all. For example, over the past several years following the severe and widespread damage caused by natural disasters, coupled with continued large global losses, the property, liability, and other insurance markets have seen significant cost increases. Further, in the event of a substantial loss, the insurance coverage we or our hotel owners carry may not be sufficient to pay the full market value or replacement cost of any lost investment or in some cases could result in certain losses being totally uninsured. As a result, our revenues and profits could be adversely affected, and for properties we own or lease, we could lose some or all of the capital that we have invested in the property and we could remain obligated for guarantees, debt, or other financial obligations.
Our Loyalty Program plays a significant role in our business, and unfavorable developments affecting the program could adversely affect our business and results of operations. Our Loyalty Program is an important aspect of our business. Our Loyalty Program faces significant competition from the loyalty programs offered by other hospitality companies, as well as from loyalty programs offered by bank travel programs, airlines, and others. There is significant competition among loyalty programs in terms of the value and utility of program currency, rewards ranges and values, other program terms and conditions, and other program features, including co-branded credit card affiliations and offerings. If we are not able to maintain a competitive and attractive loyalty program or if we make changes to our Loyalty Program, including as a result of legal or regulatory requirements or considerations, we could experience significant adverse effects on our reputation, business, financial condition, or results of operations, including our ability to acquire, engage, and retain members in our Loyalty Program and our ability to operate other programs (including our co-branded credit card program).
Exchange rate fluctuations could result in significant foreign currency gains and losses and affect our business results. We earn revenues and incur expenses in foreign currencies in connection with our operations outside of the U.S. Accordingly, fluctuations in currency exchange rates may significantly increase the amount of U.S. dollars required for foreign currency expenses or significantly decrease the U.S. dollars we receive from foreign currency revenues. We are also exposed to currency translation risk because the results of our non-U.S. business are generally reported in local currency, which we then translate to U.S. dollars for inclusion in our Financial Statements. As a result, exchange rate changes between foreign currencies and the U.S. dollar affect the amounts we record for our foreign assets, liabilities, revenues, and expenses, and could have a material negative effect on our financial results. To the extent that our international operations continue to grow, our exposure to foreign currency exchange rate fluctuations will grow. Even though we enter into foreign exchange hedging arrangements for some of the currencies in which we do business, exchange rate fluctuations will result in foreign currency gains and losses and could materially affect our results. Our hedging arrangements may also create their own costs and risks, including in the form of cash flow impacts, credit requirements, and counterparty risk.
Development and Financing Risks
Our hotel owners depend on capital to buy, develop, and improve hotels, and they may be unable to access capital when necessary. Current and potential hotel owners must periodically spend money to fund new hotel investments, as well as to refurbish and improve existing hotels. The availability of funds for new investments and improvement of existing hotels by our current and potential hotel owners depends in large measure on their ability to access the capital markets. Obtaining financing on attractive terms has been, and may in the future be further, constrained by the capital markets for hotel and real estate investments.
Our ability to grow our system is subject to the range of risks associated with real estate investments. Our ability to sustain continued growth through management, franchise, or license agreements with hotel owners is affected, and may potentially be limited, by a variety of factors influencing real estate development generally. These include site availability, financing availability, planning, zoning and other local approvals, and other limitations that may be imposed by market and submarket factors, such as projected room occupancy and rate, changes in growth in demand compared to projected supply, territorial restrictions in our agreements with hotel owners, costs of construction, demand for and availability of construction resources, and other disruptive conditions in global, regional, or local markets.
Our owned properties and other real estate investments subject us to numerous risks. We have a number of owned and leased properties and investments in joint ventures that own properties, which are each subject to the risks that generally relate to investments in real property. We may seek to sell some of these properties over time; however, equity real estate investments can be difficult to sell, and we may not be able to complete asset sales at prices we find acceptable or at all. Moreover, the investment returns available from equity investments in real estate depend in large part on the amount of income earned and capital appreciation generated, if any, by the particular properties, and the expenses incurred. A variety of other factors also affect income from properties and real estate values, including local market conditions and new supply of hotels and other lodging products, availability and costs of staffing, governmental regulations, insurance, zoning, tax and eminent domain laws,
interest rate levels, and the availability of financing. Our real estate investments have been, and could in the future be, impacted by any of these factors, resulting in a material adverse impact on our results of operations or financial condition. If our properties do not generate revenue sufficient to meet operating expenses and make needed capital expenditures, our income could be adversely affected, and we could be required to record additional significant non-cash impairment charges to our results of operations.
Risks associated with development and sale of residential properties associated with our lodging properties or brands may reduce our profits. We license many of our brands for use in connection with the development and sale of residential properties. Such projects pose further risks beyond those generally associated with our lodging business, which may reduce our profits or compromise our brand equity, including risks that: (1) changes in residential real estate demand generally may reduce our profits and could make it more difficult to convince future project developers of the value added by our brands; and (2) increases in interest rates, reductions in mortgage availability or the tax benefits of mortgage financing or residential ownership generally, or increases in the costs of residential ownership could prevent potential customers from buying residential products or reduce the prices they are willing to pay.
More hotel projects in our development pipeline may be cancelled or delayed in opening, which could adversely affect our growth prospects. We report a significant number of hotels in our development pipeline, including hotels under construction, hotels subject to signed contracts, and hotels approved for development but not yet under contract. The eventual opening of such pipeline hotels and, in particular, the approved hotels that are not yet under contract, is subject to numerous risks, including the other risks described in this section. We have seen construction timelines for pipeline hotels lengthen due to various factors, including challenges related to financing, and these circumstances could continue or worsen in the future. Accordingly, we cannot assure you that all of our development pipeline will result in additional hotels entering our system, or that those hotels will open when we anticipate.
Losses on loans or guarantees that we have made to third parties impact our profits. From time to time, we make loans to hotel owners as described in Note 12 and provide guarantees to hotel owners or lenders as described in Note 7. We have suffered losses, and could suffer losses in the future, when hotel owners default on loans that we provide or when we are required to fund under guarantees and do not receive reimbursement from the hotel owner.
If hotel owners cannot repay or refinance mortgage loans secured by their properties, our revenues and profits could decrease and our business could be harmed. Many hotel owners have pledged their hotels as collateral for mortgage loans that they entered into when those properties were purchased or refinanced. If those hotel owners cannot meet required debt service payments or repay or refinance maturing indebtedness on favorable terms or at all, the lenders could declare a default, accelerate the related debt, and foreclose on the property, or the hotel owners could declare bankruptcy, as we have seen in the past and could see in the future. In some cases, such foreclosures or bankruptcies have in the past resulted, and could in the future result, in the termination of our management, franchise, or license agreements, eliminating our anticipated income and cash flows, which could have a significant negative effect on our results of operations.
Technology, Information Protection, and Privacy Risks
Disruption in the functioning of our reservation, Loyalty Program, or other core operational systems, or our use of certain new technologies, could adversely affect our business. In the operation of our business, we manage or use sophisticated technology and systems, including those used for our reservation, customer relationship management, analytics, revenue management, property management, human resources and payroll systems, our Loyalty Program, and technologies we make available to our guests and for associates. The cost, speed, accuracy, and efficiency of these technologies and systems are critical aspects of our business and are important considerations for hotel owners when choosing our brands. Our business may suffer if we or our hotel owners, service providers, or other third parties fail to maintain, upgrade, or prevent disruption to these systems. Disruptions in or changes to these systems, including during upgrades or replacements, could result in a disruption to our business and the loss of important data.
We are incorporating artificial intelligence (“AI”) technologies into certain of our processes, offerings, and services, and these technologies may become increasingly important in our operations over time. The introduction of these technologies, particularly generative AI, into our processes, offerings, and services may also result in new or expanded risks and liabilities, including due to increased governmental or regulatory scrutiny, legal claims and assertions, compliance and ethical considerations, data security and privacy risks, and other factors that could adversely affect our business, reputation, financial condition, or results of operations. In addition, it is possible that AI could be improperly utilized by associates while carrying out their responsibilities or lead to unintended consequences, including generating content that is factually inaccurate, misleading or otherwise flawed, or biased, or that results in other unintended harmful impacts, which could harm our reputation and business and expose us to risks related to inaccuracies or errors in the output of such technologies.
A failure to keep pace with developments in technology could impair our operations or competitive position. The lodging industry continues to demand the use of sophisticated technology and systems, including those used for our reservation, customer relationship management, analytics, revenue management, property management, human resources and payroll systems, our Loyalty Program, and technologies we make available to our guests and for associates, and these and other technologies and systems must be refined, updated, and/or replaced with more advanced systems on a regular basis. Our business could suffer if we cannot refine, update, and/or replace technologies and systems as quickly or effectively as our competitors, sufficiently in advance of obsolescence or performance failure or degradation, or within budgeted costs and time frames. We also may not achieve the benefits that we anticipate from any new or upgraded technology or system, and a failure to do so could result in higher than anticipated costs or lower guest satisfaction or could impair our operating results. We are undertaking a multi-year transformation of our reservations, property management, and loyalty systems. The development and deployment of our new systems could involve delays, system interruptions, compromises of data security, or other operational impacts, including impacts on our internal control environment. Our business could also suffer if the use of technologies that provide alternatives to in-person meetings and events results in a decrease in demand for our lodging properties.
We are exposed to risks and costs associated with protecting the integrity and security of data. In the operation of our business, we collect, store, use, and transmit large volumes of personal data regarding associates, guests, customers, hotel owners, service providers, other third parties, and our own business operations, including credit card numbers, reservation and loyalty data, and other personal data, in various information systems that we maintain and in systems maintained by third parties, including those of our hotel owners, service providers, and other third parties. The integrity and protection of this personal data is critical to our business. Our guests and associates also have a high expectation that we, as well as our hotel owners, service providers, and other third parties, will adequately protect and appropriately use their personal data. The information, security, and privacy requirements imposed by global laws and governmental regulation, our contractual obligations, and the requirements of the payment card industry continue to become increasingly stringent in many jurisdictions in which we operate. Our information systems and the information systems maintained or used by our hotel owners, service providers, and other third parties may not be able to satisfy these changing legal and regulatory requirements and associate and guest expectations; we and/or these third parties may require significant additional investments or time to do so; and security controls that we and/or these third parties may implement sometimes do not operate effectively or as intended. We have incurred and may in the future incur significant additional costs to meet these requirements, obligations, and expectations, and in the event of alleged or actual noncompliance, we may experience increased operating costs, increased exposure to payment obligations and litigation, and increased risk of damage to our reputation and brand.
The Data Security Incident, and other information security incidents, could have numerous adverse effects on our business. As a result of the data security incident involving unauthorized access to the Starwood Hotels & Resorts Worldwide, LLC, formerly known as Starwood Hotels & Resorts Worldwide, Inc. (“Starwood”), reservations database that we disclosed in November 2018 (the “Data Security Incident”), numerous lawsuits were filed against us, as described further in Note 7, and we may be named as a party in additional lawsuits or receive other claims related to the Data Security Incident. A number of federal, state, and foreign governmental authorities made inquiries, opened investigations, or requested information and/or documents related to the Data Security Incident, including under various data protection and privacy regulations. Responding to and resolving these lawsuits, claims, and/or investigations has resulted in payments and other expenses, such as the payment to the AG Offices (as described below), and could result in material additional payments or remedial or other expenses. In the 2024 fourth quarter, we reached final resolutions with the U.S. Federal Trade Commission (“FTC”) and the Attorney General offices from 49 U.S. states and the District of Columbia (the “AG Offices”) in relation to the Data Security Incident. Among other terms, the resolution with the AG Offices included a $52 million monetary payment. The resolutions with the FTC and the AG Offices include various ongoing requirements relating to our data privacy and information security programs. In the event of alleged or actual noncompliance with the resolutions with the FTC and AG Offices, we could face enforcement actions or contempt proceedings that could potentially result in fines, penalties, requirements to make additional changes to our data privacy and information security programs or business practices, or other adverse outcomes, which could have a material adverse effect on our financial condition and damage our reputation and brand.
Other governmental authorities investigating or seeking information about the Data Security Incident have imposed and may further impose undertakings, injunctive relief, consent decrees, or other penalties, which could, among other things, materially increase our costs or otherwise require us to alter how we operate our business and could damage our reputation and brand. Significant management time and Company resources have been, and will continue to be, devoted to matters related to the Data Security Incident. Insurance coverage designed to limit our exposure to losses such as those related to the Data Security Incident is costly and may not be sufficient or available to cover all of our expenses or other losses (including payments imposed by the AG Offices or other regulators and other payments, fines, or penalties) related to the Data Security Incident, and certain expenses by their nature (such as, for example, expenses related to enhancing our data privacy and information security programs) are not covered by our insurance program.
Additional cybersecurity incidents could have adverse effects on our business. We have enhanced our security measures to safeguard our information systems and data, and we intend to continue implementing additional measures in the future, but, as we have seen in the past, our measures may not be sufficient to maintain the confidentiality, security, or availability of the data we collect, store, and use to operate our business. Security measures implemented by our hotel owners, service providers, and other third parties or their service providers also may not be sufficient, as we have seen in the past. Efforts to hack or circumvent security measures, efforts to gain unauthorized access to, exploit or disrupt the operation or integrity of our data or information systems, failures of information systems or software to operate as designed or intended, viruses, “ransomware” or other malware, “supply chain” attacks, “phishing” or other types of business communications compromises, operator error, or inadvertent releases of data have impacted, and may in the future impact, our information systems and records or those of our hotel owners, service providers, or other third parties. Security measures, no matter how well designed or implemented, may only mitigate and not fully eliminate risks, and security events, when detected by security tools or third parties, may not always be immediately understood or acted upon. Our reliance on computer, Internet-based, and mobile systems and communications, and the frequency and sophistication of efforts by third parties to gain unauthorized access or prevent authorized access to such systems, have greatly increased in recent years. Our increased reliance on cloud-based services and on remote access to information systems and our use of AI technologies increases the Company’s exposure to potential cybersecurity incidents. We and our hotel owners, service providers, and other third parties have experienced cyberattacks, attempts to disrupt access to systems and data, and attempts to affect the operation or integrity of data or systems, and the frequency and sophistication of such efforts could continue to increase. Any additional significant theft of, unauthorized access to, compromise or loss of, loss of access to, or fraudulent use of guest, associate, hotel owner, service provider, Company, or other data as a result of a cybersecurity incident could adversely impact our reputation and could result in legal, regulatory, and other consequences, including remedial and other expenses, fines, or litigation. Depending on the nature and scope of the event, future compromises in the security of our information systems or those of our hotel owners, service providers, or other third parties, or other future disruptions or compromises of data or information systems, could lead to future interruptions in, or other adverse effects on, the operation of our systems or those of our hotel owners, service providers, or other third parties. This could result in operational interruptions and/or outages and a loss of profits, as well as negative publicity and other adverse effects on our business, including lost sales, loss of consumer confidence, boycotts, reduced enrollment and/or participation in our Loyalty Program, litigation, regulatory investigations or actions, diminished associate satisfaction, and/or retention and recruiting difficulties, all of which could materially affect our market share, reputation, business, financial condition, or results of operations.
Because we have experienced cybersecurity incidents in the past, additional cybersecurity incidents or the failure to detect and appropriately respond to additional cybersecurity incidents could magnify the severity of the adverse effects on our business. The techniques used to obtain unauthorized access, disable or degrade service, or sabotage information systems change frequently (including the integration of new technology such as AI), can be difficult to detect for long periods of time, and can involve difficult or prolonged assessment or remediation periods even once detected, which could also magnify the severity of these adverse effects. We cannot assure you that all potential causes of past significant cybersecurity incidents have been identified and remediated; additional measures may be needed to prevent significant incidents in the future. The steps we take may not be sufficient to prevent future significant cybersecurity incidents and as a result, such incidents may occur again. Although we carry cyber insurance that is designed to protect us against certain losses related to cyber risks, that insurance coverage may not be sufficient or available to cover all expenses or other losses (including payments, fines, or penalties) or all types of claims that may arise in connection with cyberattacks, security compromises, and other related incidents. Furthermore, in the future such insurance may not be available on commercially reasonable terms, or at all.
Changes in privacy and data security laws could increase our operating costs and increase our exposure to payment obligations and litigation. We are subject to numerous, complex, and frequently changing laws, regulations, and contractual obligations designed to protect personal information. Various U.S. federal and state laws, data privacy, security, and localization laws outside of the U.S., payment card industry security standards, and other information privacy and security standards are all applicable to us. Significant legislative, judicial, or regulatory changes have been and could be issued in the future. Compliance with changes in applicable data security and privacy laws and regulations and contractual obligations (including our resolutions with the FTC and AG Offices), including the need to respond to investigations into our compliance, has increased and is expected to in the future increase our costs, and may restrict our business operations, increase our exposure to payment obligations and litigation in the event of alleged noncompliance, and adversely affect our reputation.
Changes in laws could adversely affect our ability to market our products effectively. We rely on a variety of direct marketing techniques, including email marketing, online advertising (including through social media), and postal mailings. Any further legal restrictions under various U.S. federal, state, or international laws, or new international, federal, or state laws on marketing and solicitation or international privacy, e-privacy, and anti-spam laws that govern these activities could adversely affect the continuing effectiveness of email, online advertising (including through social media), and postal mailing techniques and could require changes in our marketing strategy. If this occurs, we may not be able to develop adequate alternative marketing strategies, which could impact the amount and timing of our sales of certain products. We also obtain access to
potential guests and customers from travel service providers or other companies with whom we have substantial relationships, and we market to some individuals on these lists directly or by including our marketing message in the other companies’ marketing materials. If access to these lists were to be prohibited or otherwise restricted, our ability to develop new guests and customers and introduce them to our products could be impaired.
General Risk Factors
Delaware law and our governing corporate documents contain, and our Board of Directors could implement, anti-takeover provisions that could deter takeover attempts. Under the Delaware business combination statute, a stockholder holding 15 percent or more of our outstanding voting stock could not acquire us without Board of Directors’ consent for at least three years after the date the stockholder first held 15 percent or more of the voting stock. Our governing corporate documents also, among other things, require supermajority votes for mergers and similar transactions. In addition, our Board of Directors could, without stockholder approval, implement other anti-takeover defenses, such as a stockholder rights plan.
Changes in tax law, interpretations of existing tax law, or agreements or disputes with tax authorities could increase our tax costs. Determination of our worldwide provision for income taxes and other tax liabilities requires estimation and significant judgment, including because of the number of countries and territories in which we provide programs and services and the accounting complexity of certain of those programs and services. Applicable domestic and foreign tax authorities audit and review our determinations, and an adverse outcome resulting from any such audit or review could have a material negative effect on our operating results, cash flows, and financial condition. Our tax expenses and liabilities have in the past been and could in the future be affected by changes in tax laws or the interpretation of tax laws in any of the many jurisdictions in which we do business, as well as changes in our business operations.
Item 1B. Unresolved Staff Comments.
None.
Item 1C. Cybersecurity.
Risk Management and Strategy
We manage risks from cybersecurity threats, as such term is defined in Item 106(a) of Regulation S-K, through our overall enterprise risk management process, which is overseen by our Board. Management has created a global information security program, which encompasses a dedicated global information security team and policies, procedures, and processes for assessing, identifying, and managing risks from cybersecurity threats. Marriott’s policies, procedures, and processes generally follow recognized frameworks established by the National Institute of Standards and Technology (“NIST”) and the International Organization for Standardization, as well as other relevant standards. Our program is designed to maintain the confidentiality, integrity, security, and availability of the data that is created, collected, stored, and used to operate our business.
We assess, identify, and manage risks from cybersecurity threats through various mechanisms, which from time to time may include tabletop exercises, business unit assessments, control gap analyses, threat modeling, impact analyses, internal audits, external audits, vulnerability scans, penetration tests, and engagement of third parties to conduct analyses of our information security program. We obtain cybersecurity threat intelligence from recognized forums, third parties, and other sources as part of our risk assessment process. We also maintain a risk-based approach for assessing, identifying, and managing risks from cybersecurity threats associated with key third-party service providers, hotel owners, and other companies with whom we do business.
With respect to incident response, we maintain a Global Information Security & Privacy Incident Response Plan (“IRP”), which applies to information security incidents involving properties owned, leased, or managed by Marriott, as well as our above-property business locations. Our IRP sets out a coordinated, multi-functional approach for investigating, containing, and mitigating incidents, including reporting findings and keeping senior management and other key stakeholders informed and involved as appropriate. In general, our incident response process follows the NIST framework and focuses on four phases: (i) preparation; (ii) detection and analysis; (iii) containment, eradication, and recovery; and (iv) post-incident remediation.
For properties that are not owned, leased, or managed by Marriott, the franchisees, licensees, or other applicable counterparties are generally responsible for information security at such properties and the systems and business processes related to information security that are under their direction and control. Franchisees and licensees are typically required to comply with Marriott brand standards relating to information security, which include an obligation to report relevant information security incidents to us.
In the 2024 fourth quarter, we reached final resolutions with the FTC and the AG Offices in relation to the Data Security Incident. The resolutions with the FTC and the AG Offices include various ongoing requirements relating to our data privacy and information security programs.
We do not believe that risks from cybersecurity threats, including as a result of any previous cybersecurity incidents, have materially affected or are reasonably likely to materially affect our overall business strategy, results of operations, or financial condition over the long term. However, there can be no assurance that we, our hotel owners, our third-party service providers, or other companies with whom we do business, will not experience a cybersecurity threat or incident in the future that could materially adversely affect our business strategy, results of operations, or financial condition. See the discussion about the Starwood Data Security Incident under the “Litigation, Claims, and Government Investigations” caption in Note 7 to our financial statements, the discussion of the same in Part II, Item 7, “Management’s Discussion and Analysis of Financial Condition and Results of Operations,” and the discussion of cybersecurity risk in Part I, Item 1A, “Risk Factors.”
Governance
Our Board has established a Technology and Information Security Oversight Committee (“TISOC”) to assist the Board in providing oversight of matters pertaining to technology, information security, and privacy, including risks from cybersecurity threats; management’s efforts to monitor and mitigate those risks; and significant cybersecurity incidents. The TISOC meets at least four times per year and typically receives reports from our Chief Information Security Officer (“CISO”) and other members of management about these matters. The Board’s Audit Committee receives reports regarding information security and technology-related audits conducted by our internal audit department. Risks from cybersecurity threats are also discussed with the full Board as part of regular legal updates and management presentations, the Board’s oversight of enterprise risk management, and periodic education sessions.
To establish, implement, and evaluate our risk management policies and practices with respect to cybersecurity threats, and to facilitate the communication of such matters to the Board, the TISOC, and the Audit Committee, as applicable, we have established a number of management committees, several of which include senior leaders and direct reports of the Company’s President and CEO, that serve as our policymaking and management-level governing bodies with respect to our information security and data privacy programs; oversee the implementation of our information security and data privacy risk management strategy; and identify, consider, and escalate information security and data privacy issues that may arise in our business.
Our global information security team led by our CISO works in coordination with these management committees and other cross-functional teams and is principally responsible for overseeing our information security strategy, working collaboratively with business leaders across the organization to assess, identify, and manage risks from cybersecurity threats, and to address cybersecurity incidents when they arise. Our information security program is operated on a 24/7 basis to address risks from cybersecurity threats and to respond to cybersecurity incidents globally.
Our CISO and other members of senior management responsible for our information security program have extensive experience assessing and managing risks from cybersecurity threats, including decades of experience in information technology and information security positions; serving in information technology leadership positions at other large public companies; and having other significant experience in the areas of risk management, information technology, and information security. Our CISO has more than 27 years of experience in information technology and/or information security, including more than 13 years in such positions in the hospitality industry.
Item 2. Properties.
Under our asset-light business model, we typically manage or franchise hotels and other lodging offerings, rather than own them. As of December 31, 2024, we owned or leased 14 hotels (5,539 rooms) in U.S. & Canada and 37 hotels (8,773 rooms) in International. Additionally, most of our regional offices, customer engagement centers, and sales offices, as well as our corporate headquarters, are in leased facilities. See Part I, Item 1, “Business,” earlier in this report, and the “Properties and Rooms” caption in Part II, Item 7, “Management’s Discussion and Analysis of Financial Condition and Results of Operations” for more information about our company-operated properties.
Item 3. Legal Proceedings.
See the information under the “Litigation, Claims, and Government Investigations” caption in Note 7, which we incorporate here by reference. Within this section, we use a threshold of $1 million in disclosing material environmental proceedings involving a governmental authority, if any.
From time to time, we are also subject to other legal proceedings and claims in the ordinary course of business, including adjustments proposed during governmental examinations of the various tax returns we file. While management presently
believes that the ultimate outcome of these other proceedings, individually and in aggregate, will not materially harm our financial position, cash flows, or overall trends in results of operations, legal proceedings are inherently uncertain, and unfavorable rulings could, individually or in aggregate, have a material adverse effect on our business, financial condition, or operating results.
Item 4. Mine Safety Disclosures.
Not applicable.
Information about our Executive Officers
See the information under “Information about our Executive Officers” in Part III, Item 10 of this report for information about our executive officers, which we incorporate here by reference.
PART II
Item 5. Market for Registrant’s Common Equity, Related Stockholder Matters, and Issuer Purchases of Equity Securities.
Market Information
At January 31, 2025, 275,695,298 shares of our Class A Common Stock (our “common stock”) were outstanding and were held by 29,557 stockholders of record. Our common stock trades on the Nasdaq Global Select Market under the trading symbol MAR.
Fourth Quarter 2024 Issuer Purchases of Equity Securities
| | | | | | | | | | | | | | | | | | | | | | | | | | |
| (in millions, except per share amounts) | | | | | | | | |
| Period | | Total Number of Shares Purchased | | Average Price per Share | | Total Number of Shares Purchased as Part of Publicly Announced Plans or Programs (1) | | Maximum Number of Shares That May Yet Be Purchased Under the Plans or Programs (1) |
| | | | | | | | |
| | | | | | | | |
| | | | | | | | |
| | | | | | | | |
| | | | | | | | |
| | | | | | | | |
| | | | | | | | |
| | | | | | | | |
| | | | | | | | |
| October 1, 2024 - October 31, 2024 | | 0.8 | | | $ | 259.10 | | | 0.8 | | | 14.9 | |
| November 1, 2024 - November 30, 2024 | | 0.3 | | | $ | 287.09 | | | 0.3 | | | 14.6 | |
| December 1, 2024 - December 31, 2024 | | 0.9 | | | $ | 288.31 | | | 0.9 | | | 13.7 | |
(1)On November 9, 2023, we announced that our Board of Directors increased our common stock repurchase authorization by 25 million shares. At year-end 2024, 13.7 million shares remained available for repurchase under Board approved authorizations. We may repurchase shares in the open market or in privately negotiated transactions, and we account for these shares as treasury stock.
Item 6. Reserved.
Item 7. Management’s Discussion and Analysis of Financial Condition and Results of Operations.
A discussion regarding our financial condition and results of operations for year-end 2023 compared to year-end 2022 can be found in Part II, Item 7, “Management’s Discussion and Analysis of Financial Condition and Results of Operations,” of our Annual Report on Form 10-K for the fiscal year ended December 31, 2023, as filed with the SEC on February 13, 2024 (“2023 Form 10-K”).
BUSINESS AND OVERVIEW
Overview
We are a worldwide operator, franchisor, and licensor of hotel, residential, timeshare, and other lodging properties under more than 30 brand names. We discuss our operations in the following reportable business segments: (1) U.S. & Canada, (2) Europe, Middle East & Africa (“EMEA”), (3) Greater China, and (4) Asia Pacific excluding China (“APEC”). Our Caribbean & Latin America (“CALA”) operating segment does not meet the applicable accounting criteria for separate disclosure as a reportable business segment, and as such, we include its results in “Unallocated corporate and other.”
Under our asset-light business model, we typically manage or franchise hotels and other lodging offerings, rather than own them. Terms of our management agreements vary, but we earn a management fee that is typically composed of a base management fee, which is a percentage of the revenues of the hotel, and an incentive management fee, which is based on the profits of the hotel. In many cases (particularly in our U.S. & Canada, Europe, and CALA regions), incentive management fees are subject to a specified owner return. Under our hotel franchising arrangements, we generally receive an initial application fee and continuing royalty fees, which are typically based on a percentage of room revenues, plus for certain brands, a percentage
of food and beverage revenues. We also have license and other agreements with third parties for certain offerings, such as for our timeshare properties, MGM Collection with Marriott Bonvoy, Design Hotels, and The Ritz-Carlton Yacht Collection, under which we receive royalty fees and certain other fees. Additionally, we earn fees for other uses of our intellectual property, including primarily co-branded credit card fees, as well as residential branding fees and certain other licensing fees.
Performance Measures
We believe Revenue per Available Room (“RevPAR”), which we calculate by dividing property level room revenue by total rooms available for the period, is a meaningful indicator of our performance because it measures the period-over-period change in room revenues. RevPAR may not be comparable to similarly titled measures, such as revenues, and should not be viewed as necessarily correlating with our fee revenue. We also believe occupancy and average daily rate (“ADR”), which are components of calculating RevPAR, are meaningful indicators of our performance. Occupancy, which we calculate by dividing total rooms sold by total rooms available for the period, measures the utilization of a property’s available capacity. ADR, which we calculate by dividing property level room revenue by total rooms sold, measures average room price and is useful in assessing pricing levels. RevPAR, occupancy, and ADR statistics are on a systemwide basis for comparable properties, unless otherwise stated. Unless otherwise stated, all changes refer to year-over-year changes for the comparable period. Comparisons to prior periods are on a constant U.S. dollar basis, which we calculate by applying exchange rates for the current period to the prior comparable period. We believe constant dollar analysis provides valuable information regarding the performance of hotels in our system as it removes currency fluctuations from the presentation of such results.
We define our comparable properties as hotels in our system that were open and operating under one of our brands since the beginning of the last full calendar year (since January 1, 2023 for the current period) and have not, in either the current or previous year: (1) undergone significant room or public space renovations or expansions, (2) been converted between company-operated and franchised, or (3) sustained substantial property damage or business interruption. Our comparable properties also exclude MGM Collection with Marriott Bonvoy, Design Hotels, The Ritz-Carlton Yacht Collection, and timeshare properties. For 2024, we had 5,439 comparable U.S. & Canada properties and 1,741 comparable International properties.
Business Trends
We saw solid global RevPAR growth during 2024 compared to 2023. In 2024, worldwide RevPAR increased 4.3 percent compared to 2023, reflecting ADR growth of 2.8 percent and occupancy improvement of 1.0 percentage point. The increase in RevPAR was driven by strong year-over-year demand growth in nearly all our regions.
In the U.S. & Canada, where demand has normalized, RevPAR increased 3.0 percent in 2024, led by strong demand from group as well as strong demand from transient customer segments across our brand tiers.
In EMEA, RevPAR growth of 9.1 percent in 2024 was driven by strong demand in most countries across the region, aided by the 2024 Paris Olympics and other special events. In APEC, RevPAR increased 12.9 percent in 2024, driven by strong demand, including an increase in inbound demand into the region. In CALA, RevPAR increased 8.8 percent in 2024, driven by strong demand throughout the region. In Greater China, RevPAR declined 2.3 percent in 2024 due to lower domestic demand as a result of macro-economic conditions and an increase in outbound travel.
In 2024, we launched a comprehensive initiative to enhance our effectiveness and efficiency across the Company. At this point in the process, we expect this initiative to yield $80 million to $90 million of annual general and administrative cost reductions beginning in 2025. These efforts are also anticipated to deliver cost savings to our hotel owners.
As part of these efforts, in the second half of 2024, we implemented a voluntary retirement program for certain above-property associates, and some above-property roles in the organization were eliminated or redefined. We substantially completed this initiative as of year-end 2024.
Starwood Data Security Incident
On November 30, 2018, we announced a data security incident involving unauthorized access to the Starwood reservations database (the “Data Security Incident”). We are currently unable to reasonably estimate the range of total possible financial impact to the Company from the Data Security Incident in excess of the expenses already recorded; however, we do not believe this incident will impact our long-term financial health. See Note 7 for additional information related to legal proceedings and governmental investigations related to the Data Security Incident.
System Growth and Pipeline
Our system grew from 8,785 properties (1,597,380 rooms) at year-end 2023 to 9,361 properties (1,706,331 rooms) at year-end 2024. The increase compared to year-end 2023 reflected gross additions of 666 properties (123,389 rooms), including the addition of 16 properties (approximately 38,000 rooms) from our exclusive, long-term strategic licensing agreement with MGM Resorts International and 163 properties (approximately 9,000 rooms) from our long-term agreement with Sonder Holdings Inc., and deletions of 90 properties (14,572 rooms). Our 2024 gross room additions included approximately 52,300 rooms located outside U.S. & Canada and roughly 75,300 rooms converted from competitor brands.
At year-end 2024, we had nearly 3,800 properties and over 577,000 rooms in our development pipeline, which includes roughly 29,000 rooms approved for development but not yet under signed contracts. Our development pipeline includes over 229,000 rooms, or 40 percent, that were under construction or in the process of converting to our system at year-end 2024. Fifty-five percent of the rooms in our development pipeline are located outside U.S. & Canada.
In 2024, we signed over 1,200 development deals with hotel owners and other counterparties for nearly 162,000 rooms globally. Approximately 34 percent of rooms signed were the result of conversion opportunities. During 2024, we continued to strengthen our luxury portfolio and grow our midscale brands. In December 2024, we also announced the expansion of our outdoor-focused lodging offerings.
In 2025, we expect net rooms growth of 4 to 5 percent.
Properties and Rooms
The following table shows our properties and rooms by ownership type.
| | | | | | | | | | | | | | | | | | | | | | | | | | | | | | | | | | | | | | | | | | | | | | | |
| Properties | | Rooms |
| December 31, 2024 | | December 31, 2023 | | vs. December 31, 2023 | | December 31, 2024 | | December 31, 2023 | | vs. December 31, 2023 |
| Managed | 1,981 | | | 2,046 | | | (65) | | | (3) | % | | 571,889 | | | 575,963 | | | (4,074) | | | (1) | % |
Franchised/Licensed/Other (1) | 7,192 | | | 6,563 | | | 629 | | | 10 | % | | 1,104,446 | | | 994,354 | | | 110,092 | | | 11 | % |
| Owned/Leased | 51 | | | 50 | | | 1 | | | 2 | % | | 14,312 | | | 13,115 | | | 1,197 | | | 9 | % |
| Residential | 137 | | | 126 | | | 11 | | | 9 | % | | 15,684 | | | 13,948 | | | 1,736 | | | 12 | % |
| Total | 9,361 | | | 8,785 | | | 576 | | | 7 | % | | 1,706,331 | | | 1,597,380 | | | 108,951 | | | 7 | % |
(1)In addition to franchised, includes our timeshare properties, MGM Collection with Marriott Bonvoy, Design Hotels, and The Ritz-Carlton Yacht Collection.
Lodging Statistics
The following table presents RevPAR, occupancy, and ADR statistics for comparable properties for 2024, and 2024 compared to 2023. Systemwide statistics include data from our franchised properties, in addition to our company-operated
properties. | | | | | | | | | | | | | | | | | | | | | | | | | | | | | | | | | | | | | | |
| |
| RevPAR | | Occupancy | | Average Daily Rate |
| 2024 | | vs. 2023 | | 2024 | | vs. 2023 | | | 2024 | | vs. 2023 |
| | | | | | | | | | | | |
| | | | | | | | | | | | |
| | | | | | | | | | | | |
| | | | | | | | | | | | |
| Comparable Company-Operated Properties | | | | | | | | | | | | |
| U.S. & Canada | $ | 177.07 | | | 3.4 | % | | 69.4 | % | | 0.5 | % | pts. | | $ | 255.23 | | | 2.6 | % |
| Europe | $ | 215.26 | | | 7.0 | % | | 72.1 | % | | 0.7 | % | pts. | | $ | 298.73 | | | 6.0 | % |
| Middle East & Africa | $ | 132.47 | | | 11.2 | % | | 68.6 | % | | 2.9 | % | pts. | | $ | 193.15 | | | 6.5 | % |
| Greater China | $ | 84.57 | | | (2.5) | % | | 68.7 | % | | 1.2 | % | pts. | | $ | 123.16 | | | (4.2) | % |
| | | | | | | | | | | | |
| Asia Pacific excluding China | $ | 122.13 | | | 12.2 | % | | 72.5 | % | | 3.7 | % | pts. | | $ | 168.45 | | | 6.5 | % |
| Caribbean & Latin America | $ | 182.62 | | | 8.7 | % | | 66.0 | % | | 2.0 | % | pts. | | $ | 276.82 | | | 5.5 | % |
| | | | | | | | | | | | |
International - All (1) | $ | 124.96 | | | 6.6 | % | | 69.9 | % | | 2.1 | % | pts. | | $ | 178.79 | | | 3.3 | % |
Worldwide (2) | $ | 147.09 | | | 4.9 | % | | 69.7 | % | | 1.5 | % | pts. | | $ | 211.12 | | | 2.7 | % |
| Comparable Systemwide Properties | | | | | | | | | | | | |
| U.S. & Canada | $ | 131.26 | | | 3.0 | % | | 70.1 | % | | 0.4 | % | pts. | | $ | 187.14 | | | 2.4 | % |
| Europe | $ | 154.31 | | | 7.6 | % | | 70.3 | % | | 2.7 | % | pts. | | $ | 219.39 | | | 3.5 | % |
| Middle East & Africa | $ | 123.62 | | | 12.1 | % | | 68.0 | % | | 2.8 | % | pts. | | $ | 181.72 | | | 7.6 | % |
| Greater China | $ | 78.91 | | | (2.3) | % | | 67.7 | % | | 1.0 | % | pts. | | $ | 116.55 | | | (3.7) | % |
| Asia Pacific excluding China | $ | 124.66 | | | 12.9 | % | | 72.5 | % | | 3.8 | % | pts. | | $ | 171.98 | | | 6.9 | % |
| Caribbean & Latin America | $ | 151.98 | | | 8.8 | % | | 65.8 | % | | 1.8 | % | pts. | | $ | 231.13 | | | 5.8 | % |
| | | | | | | | | | | | |
International - All (1) | $ | 121.75 | | | 7.6 | % | | 69.2 | % | | 2.4 | % | pts. | | $ | 175.89 | | | 3.9 | % |
Worldwide (2) | $ | 128.23 | | | 4.3 | % | | 69.8 | % | | 1.0 | % | pts. | | $ | 183.58 | | | 2.8 | % |
(1)Includes Europe, Middle East & Africa, Greater China, Asia Pacific excluding China, and Caribbean & Latin America.
(2)Includes U.S. & Canada and International - All.
CONSOLIDATED RESULTS
The discussion below presents an analysis of our consolidated results of operations for 2024 compared to 2023. Also see the “Business Trends” section above for further discussion.
Fee Revenues
| | | | | | | | | | | | | | | | | | | | | | | | | | | | | |
| ($ in millions) | 2024 | | 2023 | | | | Change 2024 vs. 2023 | | |
| Base management fees | $ | 1,288 | | | $ | 1,238 | | | | | $ | 50 | | | 4 | % | | | | |
| Franchise fees | 3,113 | | | 2,831 | | | | | 282 | | | 10 | % | | | | |
| Incentive management fees | 769 | | | 755 | | | | | 14 | | | 2 | % | | | | |
| Gross fee revenues | 5,170 | | | 4,824 | | | | | 346 | | | 7 | % | | | | |
| Contract investment amortization | (103) | | | (88) | | | | | (15) | | | (17) | % | | | | |
| Net fee revenues | $ | 5,067 | | | $ | 4,736 | | | | | $ | 331 | | | 7 | % | | | | |
The increase in base management fees primarily reflected higher RevPAR and unit growth ($26 million).
The increase in franchise fees primarily reflected higher RevPAR, unit growth ($99 million), higher co-branded credit card fees ($59 million), higher residential branding fees ($36 million), and higher fees from properties that converted from managed to franchised ($31 million).
The increase in incentive management fees primarily reflected higher profits at managed hotels. In 2024, we earned incentive management fees from 69 percent of our managed hotels worldwide, compared to 68 percent in 2023. We earned incentive management fees from 31 percent of our U.S. & Canada managed hotels and 85 percent of our International managed hotels in each of 2024 and 2023. In addition, 67 percent of our total incentive management fees in 2024 came from our International managed hotels, primarily in EMEA and APEC, versus 65 percent in 2023.
Owned, Leased, and Other
| | | | | | | | | | | | | | | | | | | | | | | | | | | | | |
| ($ in millions) | 2024 | | 2023 | | | | Change 2024 vs. 2023 | | |
| Owned, leased, and other revenue | $ | 1,551 | | | $ | 1,564 | | | | | $ | (13) | | | (1) | % | | | | |
| Owned, leased, and other - direct expenses | 1,200 | | | 1,165 | | | | | 35 | | | 3 | % | | | | |
| Owned, leased, and other, net | $ | 351 | | | $ | 399 | | | | | $ | (48) | | | (12) | % | | | | |
Owned, leased, and other revenue, net of direct expenses, decreased primarily due to $65 million of higher termination fees recorded in the prior year, largely related to one development project in U.S. & Canada.
Cost Reimbursements
| | | | | | | | | | | | | | | | | | | | | | | | | | | | | |
| ($ in millions) | 2024 | | 2023 | | | | Change 2024 vs. 2023 | | |
| Cost reimbursement revenue | $ | 18,482 | | | $ | 17,413 | | | | | $ | 1,069 | | | 6 | % | | | | |
| Reimbursed expenses | 18,799 | | | 17,424 | | | | | 1,375 | | | 8 | % | | | | |
| Cost reimbursements, net | $ | (317) | | | $ | (11) | | | | | $ | (306) | | | (2,782) | % | | | | |
Cost reimbursements, net (cost reimbursement revenue, net of reimbursed expenses) varies due to timing differences between the costs we incur for centralized programs and services and the related reimbursements we receive from hotel owners and certain other counterparties. Over the long term, our centralized programs and services are not designed to impact our economics, either positively or negatively. See Note 2 for more information about the accounting for cost reimbursements, including our Loyalty Program.
The decrease in cost reimbursements, net primarily reflected lower revenues, net of expenses, for many of our programs and services, and Loyalty Program activity, which incurred higher program expenses.
Other Operating Expenses
| | | | | | | | | | | | | | | | | | | | | | | | | | | | | |
| ($ in millions) | 2024 | | 2023 | | | | Change 2024 vs. 2023 | | |
| Depreciation, amortization, and other | $ | 183 | | | $ | 189 | | | | | $ | (6) | | | (3) | % | | | | |
| General, administrative, and other | 1,074 | | | 1,011 | | | | | 63 | | | 6 | % | | | | |
| Restructuring and merger-related charges | 77 | | | 60 | | | | | 17 | | | 28 | % | | | | |
General, administrative, and other expenses increased primarily due to higher compensation costs ($53 million) and higher guarantee reserves ($22 million).
Restructuring and merger-related charges increased primarily due to $37 million of restructuring charges for employee termination benefits discussed in Note 16 and a $30 million reserve for a loan commitment related to the Company’s acquisition of Starwood, partially offset by $35 million of lower charges related to the Data Security Incident discussed in Note 7.
Non-Operating Income (Expense)
| | | | | | | | | | | | | | | | | | | | | | | | | | | | | |
| ($ in millions) | 2024 | | 2023 | | | | Change 2024 vs. 2023 | | |
| Gains and other income, net | $ | 31 | | | $ | 40 | | | | | $ | (9) | | | (23) | % | | | | |
| | | | | | | | | | | | | |
| Interest expense | (695) | | | (565) | | | | | (130) | | | (23) | % | | | | |
| Interest income | 40 | | | 30 | | | | | 10 | | | 33 | % | | | | |
| Equity in earnings | 8 | | | 9 | | | | | (1) | | | (11) | % | | | | |
Gains and other income, net decreased primarily due to a gain recorded in the prior year on the sale of a hotel in the CALA region ($24 million).
Interest expense increased primarily due to higher debt balances driven by Senior Notes issuances, net of maturities ($125 million).
Income Taxes
| | | | | | | | | | | | | | | | | | | | | | | | | | | | | |
| ($ in millions) | 2024 | | 2023 | | | | Change 2024 vs. 2023 | | |
| Provision for income taxes | $ | (776) | | | $ | (295) | | | | | $ | (481) | | | (163) | % | | | | |
Our tax provision increased in 2024 primarily due to intellectual property restructuring transactions resulting in non-U.S. tax benefits in the prior year ($228 million), the prior year release of a tax valuation allowance as the Company concluded it is more likely than not to recognize non-U.S. tax benefits ($223 million), and the prior year release of tax reserves, which was mostly due to the completion of a prior year tax audit ($103 million). The increase was partially offset by a decrease in pre-tax income ($51 million).
BUSINESS SEGMENTS
The following discussion presents an analysis of the operating results of our reportable business segments for 2024 compared to 2023. Also see the “Business Trends” section above for further discussion.
| | | | | | | | | | | | | | | | | | | | | | | | | | | | | |
| ($ in millions) | 2024 | | 2023 | | | | Change 2024 vs. 2023 | | |
| U.S. & Canada | | | | | | | | | | | |
| Segment net fee revenues | $ | 2,875 | | | $ | 2,734 | | | | | $ | 141 | | | 5 | % | | | | |
| Segment profit | 2,640 | | | 2,724 | | | | | (84) | | | (3) | % | | | | |
| EMEA | | | | | | | | | | | | | |
| Segment net fee revenues | 575 | | | 516 | | | | | 59 | | | 11 | % | | | | |
| Segment profit | 512 | | | 441 | | | | | 71 | | | 16 | % | | | | |
| Greater China | | | | | | | | | | | | | |
| Segment net fee revenues | 249 | | | 265 | | | | | (16) | | | (6) | % | | | | |
| Segment profit | 186 | | | 208 | | | | | (22) | | | (11) | % | | | | |
| APEC | | | | | | | | | | | | | |
| Segment net fee revenues | 340 | | | 284 | | | | | 56 | | | 20 | % | | | | |
| Segment profit | 280 | | | 243 | | | | | 37 | | | 15 | % | | | | |
| | | | | | | | | | | | | | | | | | | | | | | | | | | | | | | | | | | | | | | | | | | | | | | |
| Properties | | Rooms |
| December 31, 2024 | | December 31, 2023 | | vs. December 31, 2023 | | December 31, 2024 | | December 31, 2023 | | vs. December 31, 2023 |
| U.S. & Canada | 6,235 | | | 5,965 | | | 270 | | | 5 | % | | 1,043,224 | | | 979,631 | | | 63,593 | | | 6 | % |
| EMEA | 1,295 | | | 1,142 | | | 153 | | | 13 | % | | 234,167 | | | 218,167 | | | 16,000 | | | 7 | % |
| Greater China | 589 | | | 525 | | | 64 | | | 12 | % | | 172,388 | | | 159,871 | | | 12,517 | | | 8 | % |
| APEC | 629 | | | 567 | | | 62 | | | 11 | % | | 143,177 | | | 130,158 | | | 13,019 | | | 10 | % |
In 2024, net fee revenues grew in U.S. & Canada, EMEA, and APEC compared to 2023, primarily driven by higher RevPAR and unit growth (see the Lodging Statistics and Properties and Rooms tables above for more information), as well as higher profits at managed hotels. In Greater China, net fee revenues decreased in 2024 primarily due to lower RevPAR.
U.S. & Canada segment profit decreased in 2024 compared to 2023 despite the higher net fee revenues due to $138 million of lower cost reimbursement revenue, net of reimbursed expenses, $59 million of lower owned, leased, and other revenue, net of direct expenses, and $28 million of higher general, administrative, and other expenses. Owned, leased, and other revenue, net of direct expenses decreased primarily due to higher termination fees in the prior year, largely related to one development project. General, administrative, and other expenses increased primarily due to higher guarantee reserves.
EMEA segment profit increased in 2024 compared to 2023 due to higher net fee revenues and $30 million of lower general, administrative, and other expenses, primarily due to lower litigation accruals, partially offset by $26 million of lower cost reimbursement revenue, net of reimbursed expenses.
LIQUIDITY AND CAPITAL RESOURCES
Our Credit Facility
We are party to a $4.5 billion multicurrency revolving credit agreement (as amended, the “Credit Facility”). Available borrowings under the Credit Facility support our commercial paper program and general corporate needs. U.S. dollar borrowings under the Credit Facility bear interest at SOFR (the Secured Overnight Financing Rate) plus a spread based on our
public debt rating. We also pay quarterly fees on the Credit Facility at a rate based on our public debt rating. We classify outstanding borrowings under the Credit Facility and outstanding commercial paper borrowings (which generally have short-term maturities of 45 days or less) as long-term based on our ability and intent to refinance the outstanding borrowings on a long-term basis. The Credit Facility expires on December 14, 2027.
The Credit Facility contains certain covenants, including a single financial covenant that limits our maximum leverage (consisting of the ratio of Adjusted Total Debt to EBITDA, each as defined in the Credit Facility) to not more than 4.5 to 1.0. Our outstanding public debt does not contain a corresponding financial covenant or a requirement that we maintain certain financial ratios. We currently satisfy the covenants in our Credit Facility and public debt instruments, including the leverage covenant under the Credit Facility, and do not expect the covenants will restrict our ability to meet our anticipated borrowing and liquidity needs.
We monitor the status of the capital markets and regularly evaluate the effect that changes in capital market conditions may have on our ability to fund our liquidity needs. We believe the Credit Facility, and our access to capital markets, together with cash we expect to generate from operations, remain adequate to meet our liquidity requirements.
Commercial Paper
We issue commercial paper in the U.S. Because we do not have purchase commitments from buyers for our commercial paper, our ability to issue commercial paper is subject to market demand. We do not expect that fluctuations in the demand for commercial paper will affect our liquidity, given our borrowing capacity under the Credit Facility and access to capital markets.
Cash from Operations
Net cash provided by operating activities decreased by $421 million in 2024 compared to 2023. Net cash provided by operating activities in 2024 reflected a cash outflow of $300 million in the “Restructuring and merger-related charges” caption of our Statements of Cash Flows for the settlement of the guarantee liability associated with the purchase of the Sheraton Grand Chicago (discussed in Note 3). Cash flows for 2023 reflected reduced cash received from U.S. co-branded credit card issuers related to the 2020 prepayment of certain future revenues. Such reductions ended as of year-end 2023.
Our ratio of current assets to current liabilities was 0.4 to 1.0 at both year-end 2024 and year-end 2023. We have significant borrowing capacity under our Credit Facility should we need additional working capital.
Investing Activities Cash Flows
Capital Expenditures and Other Investments. We made capital and technology expenditures of $750 million in 2024 and $452 million in 2023. Capital and technology expenditures in 2024 increased by $298 million compared to 2023, primarily due to approximately $200 million of spending related to the Sheraton Grand Chicago capitalized assets (discussed in Note 3) and higher than typical spending on our worldwide technology systems transformation, the overwhelming portion of which is expected to be reimbursed over time. In 2023, we also had cash outflows of $101 million due to the City Express brand acquisition.
We expect capital expenditures and other investments will total approximately $1.0 billion to $1.1 billion for 2025, including capital and technology expenditures, loan advances, contract acquisition costs, and other investing activities, but excluding any potential property or brand acquisitions, which we cannot forecast with sufficient accuracy and which may be significant. Our anticipated capital and technology expenditures include higher than typical spending on our worldwide technology systems transformation and renovations of hotels in our owned and leased portfolio.
Dispositions. Property and asset sales generated $16 million of cash proceeds in 2024 and $71 million in 2023.
Over time, we have sold lodging properties, both completed and under development, generally subject to long-term management agreements. Our ability to attract third-party purchasers, and their ability to raise the debt and equity capital necessary to acquire such properties, depends in part on the perceived risks in the lodging industry and other constraints inherent in the capital markets. We monitor the status of the capital markets and regularly evaluate the potential impact of changes in capital market conditions on our business operations. We have made, and expect to continue making, selective and opportunistic investments to add units to our lodging business, which may include property acquisitions and renovations, new construction, loans, guarantees, and equity investments. Over time, we seek to minimize capital invested in our business through asset sales subject to long-term management or franchise agreements.
Financing Activities Cash Flows
Debt. Debt increased by $2,574 million in 2024, to $14,447 million at year-end 2024 from $11,873 million at year-end 2023, primarily due to the issuances of our Series PP Notes and Series QQ Notes ($1,480 million) and Series NN Notes and Series OO Notes ($1,468 million), partially offset by the maturity of our Series CC Notes ($550 million). See Note 9 for additional information on Senior Notes issuances.
Our long-term financial objectives include maintaining diversified financing sources, optimizing the mix and maturity of our long-term debt, and reducing our working capital. At year-end 2024, our long-term debt had a weighted average interest rate of 4.5 percent and a weighted average maturity of approximately 5.0 years. The ratio of our fixed-rate long-term debt to our total long-term debt was 0.9 to 1.0 at year-end 2024.
See the “Our Credit Facility” caption in this “Liquidity and Capital Resources” section for more information on our Credit Facility.
Share Repurchases and Dividends. We repurchased 15.4 million shares of our common stock for $3.7 billion in 2024. Year-to-date through February 7, 2025, we repurchased 1.2 million shares for $350 million. For additional information, see “Market for Registrant’s Common Equity, Related Stockholder Matters, and Issuer Purchases of Equity Securities” in Part II, Item 5.
Our Board declared the following quarterly cash dividends in 2024: (1) $0.52 per share declared on February 8, 2024 and paid on March 29, 2024 to stockholders of record on February 22, 2024; (2) $0.63 per share declared on May 10, 2024 and paid on June 28, 2024 to stockholders of record on May 24, 2024; (3) $0.63 per share declared on August 2, 2024 and paid on September 30, 2024 to stockholders of record on August 16, 2024; and (4) $0.63 per share declared on November 7, 2024 and paid on December 31, 2024 to stockholders of record on November 21, 2024.
We expect to continue to return cash to stockholders through a combination of share repurchases and cash dividends.
Material Cash Requirements
Our material cash requirements include the following contractual obligations and off-balance sheet arrangements.
•At year-end 2024, we had $14,447 million of debt plus $3,110 million of future interest payments, of which a total of $1,866 million is payable within the next 12 months from year-end 2024. See Note 9 for further information about our long-term debt and Note 8 for further information about our finance leases.
•We enter into operating leases primarily for hotels, offices, and equipment, which are discussed in Note 8.
•At December 31, 2024, projected Deemed Repatriation Transition Tax payments under the 2017 Tax Cuts and Jobs Act totaled $135 million, which is payable within the next 12 months from year-end 2024.
•The Company had guarantees and letters of credit as of year-end 2024, which are discussed in Note 7. The majority of our remaining guarantee commitments are not expected to be funded within the next 12 months from year-end 2024.
•In the normal course of business, we enter into purchase commitments related to the programs and services that we typically provide to hotel owners, and we incur other obligations to manage the daily operating needs of the hotels that we manage. Since our contracts with hotel owners generally require reimbursement for expenses incurred in providing these programs and services and managing the daily operating needs of the hotels that we manage, these obligations are not expected to have a material impact on our net income and cash flow over the long term.
NEW ACCOUNTING STANDARDS
We do not expect that accounting standards updates issued to date and that are effective after December 31, 2024 will have a material effect on our Financial Statements.
CRITICAL ACCOUNTING POLICIES AND ESTIMATES
Our preparation of financial statements in accordance with GAAP requires management to make estimates and assumptions that affect reported amounts and related disclosures. Management considers an accounting policy and estimate to be critical if: (1) we must make assumptions that were uncertain when the estimate was made; and (2) changes in the estimate, or selection of a different estimate methodology could have a material effect on our consolidated results of operations or financial condition.
While we believe that our estimates, assumptions, and judgments are reasonable, they are based on information available when the estimate or assumption was made. Actual results may differ significantly. Additionally, changes in our assumptions, estimates or assessments due to unforeseen events or otherwise could have a material impact on our financial position or results of operations.
See Note 2 for further information related to our critical accounting policies and estimates, which are as follows:
Loyalty Program, including how we estimate the breakage of hotel points, credit card points, and free night certificates, the volume of points and free night certificates that will be issued under our co-branded credit card agreements, the amount of consideration to which we will be entitled under our co-branded credit card agreements, and the stand-alone selling prices of goods and services provided under our co-branded credit card agreements. Changes in these estimates could result in material changes to our liability for guest loyalty program and Loyalty Program revenue. Based on the conditions existing at December 31, 2024 and holding other factors constant, a one percent decrease in our estimate of the breakage of points could result in an increase in the liability for guest loyalty program of approximately $50 million. The breakage impact may vary significantly depending on the specific Loyalty Program points for which the anticipated breakage changes.
Goodwill, including how we evaluate the fair value of reporting units and when we record an impairment loss on goodwill. Our reporting units are the same as our operating segments. See Note 14 for more information. During the 2024 fourth quarter, we conducted our annual goodwill impairment test, and no impairment charges were recorded. The estimated fair values of all our reporting units significantly exceeded their carrying amounts at the date of their most recent estimated fair value determination.
Intangibles and Long-Lived Assets, including how we evaluate the fair value of intangibles and long-lived assets and when we record impairment losses on intangibles and long-lived assets. During 2024, we evaluated our intangibles and long-lived asset groups for impairment and did not record any material impairment charges. The estimated fair values of all our indefinite-lived intangible assets significantly exceeded their carrying amounts at the date of their most recent estimated fair value determination.
Item 7A. Quantitative and Qualitative Disclosures About Market Risk.
We are exposed to market risk primarily from changes in interest rates and currency exchange rates. We manage our exposure to these risks by monitoring available financing alternatives, through the development and application of credit granting policies, and by entering into derivative arrangements. We do not foresee any significant changes in either our exposure to fluctuations in interest rates or currency rates or how we manage such exposure in the future.
We use derivative instruments, including cash flow hedges, fair value hedges, net investment in non-U.S. operations hedges, and other derivative instruments, as part of our overall strategy to manage our exposure to market risks associated with fluctuations in interest rates and currency exchange rates. We continue to have exposure to such risks to the extent they are not hedged. See Note 2 for more information on derivative instruments. We use forward contracts not designated as hedging instruments to manage currency exchange rate risk associated with certain cash and intercompany loan balances. We intend to offset the gains and losses related to these forward contracts with the gains and losses related to the remeasurement of our cash and intercompany loan balances, such that there is a negligible effect on earnings. We do not consider the fair value or earnings impact of these forward contracts to be material to our consolidated financial statements.
We are exposed to interest rate risk on our floating-rate notes receivable and floating-rate debt, including the effect of interest rate swaps. Changes in interest rates also impact the fair value of our fixed-rate notes receivable and the fair value of our fixed-rate long-term debt.
The following table sets forth the scheduled maturities and the total fair value as of year-end 2024 for our financial instruments that are impacted by interest rate risk:
| | | | | | | | | | | | | | | | | | | | | | | | | | | | | | | | | | | | | | | | | | | | | | | |
| | Maturities by Period | | | | |
| ($ in millions) | 2025 | | 2026 | | 2027 | | 2028 | | 2029 | | There-
after | | Total Carrying Amount | | Total Fair Value |
Assets - Maturities represent expected principal receipts. Fair values represent assets. |
| Fixed-rate notes receivable | $ | 7 | | | $ | 5 | | | $ | 7 | | | $ | 4 | | | $ | — | | | $ | 15 | | | $ | 38 | | | $ | 33 | |
| Average interest rate | | | | | | | | | | | | | 0.75 | % | | |
| Floating-rate notes receivable | $ | 4 | | | $ | 76 | | | $ | 6 | | | $ | 21 | | | $ | — | | | $ | — | | | $ | 107 | | | $ | 109 | |
| Average interest rate | | | | | | | | | | | | | 6.78 | % | | |
Liabilities - Maturities represent expected principal payments. Fair values represent liabilities. |
| Fixed-rate debt | $ | (1,300) | | | $ | (1,195) | | | $ | (990) | | | $ | (1,438) | | | $ | (1,279) | | | $ | (6,539) | | | $ | (12,741) | | | $ | (12,402) | |
| Average interest rate | | | | | | | | | | | | | 4.43 | % | | |
| Floating-rate debt | $ | — | | | $ | — | | | $ | (1,582) | | | $ | — | | | $ | — | | | $ | — | | | $ | (1,582) | | | $ | (1,582) | |
| Average interest rate | | | | | | | | | | | | | 4.91 | % | | |
Item 8. Financial Statements.
The following financial information is included on the pages indicated:
MANAGEMENT’S REPORT ON
INTERNAL CONTROL OVER FINANCIAL REPORTING
Management of Marriott International, Inc. (the “Company”) is responsible for establishing and maintaining adequate internal control over financial reporting and for assessing the effectiveness of internal control over financial reporting. The Company has designed its internal control over financial reporting to provide reasonable assurance on the reliability of financial reporting and the preparation of the consolidated financial statements in accordance with U.S. generally accepted accounting principles.
The Company’s internal control over financial reporting includes those policies and procedures that: (1) pertain to the maintenance of records that, in reasonable detail, accurately and fairly reflect the Company’s transactions and dispositions of the Company’s assets; (2) provide reasonable assurance that transactions are recorded as necessary to permit preparation of the consolidated financial statements in accordance with U.S. generally accepted accounting principles, and that receipts and expenditures of the Company are being made only in accordance with authorizations of the Company’s management and directors; and (3) provide reasonable assurance regarding prevention or timely detection of unauthorized acquisition, use, or disposition of the Company’s assets that could have a material effect on the consolidated financial statements.
Because of inherent limitations in internal control over financial reporting, such controls may not prevent or detect misstatements. Also, projections of any evaluation of the effectiveness of internal controls to future periods are subject to the risk that controls may become inadequate because of changes in conditions, or that the degree of compliance with the policies or procedures may deteriorate.
In connection with the preparation of the Company’s annual consolidated financial statements, management assessed the effectiveness of the Company’s internal control over financial reporting as of December 31, 2024, based on criteria established in the Internal Control-Integrated Framework issued by the Committee of Sponsoring Organizations of the Treadway Commission (2013 Framework) (the “COSO criteria”).
Based on this assessment, management has concluded that, applying the COSO criteria, as of December 31, 2024, the Company’s internal control over financial reporting was effective to provide reasonable assurance of the reliability of financial reporting and the preparation of financial statements for external purposes in accordance with U.S. generally accepted accounting principles.
Ernst & Young LLP (PCAOB ID: 42), the independent registered public accounting firm that audited the Company’s consolidated financial statements included in this report, has issued an attestation report on the effectiveness of the Company’s internal control over financial reporting, a copy of which appears on the following page.
REPORT OF INDEPENDENT REGISTERED PUBLIC ACCOUNTING FIRM
To the Stockholders and Board of Directors of Marriott International, Inc.
Opinion on Internal Control over Financial Reporting
We have audited Marriott International, Inc.’s internal control over financial reporting as of December 31, 2024, based on criteria established in Internal Control-Integrated Framework issued by the Committee of Sponsoring Organizations of the Treadway Commission (2013 framework) (the COSO criteria). In our opinion, Marriott International, Inc. (the Company) maintained, in all material respects, effective internal control over financial reporting as of December 31, 2024, based on the COSO criteria.
We also have audited, in accordance with the standards of the Public Company Accounting Oversight Board (United States) (PCAOB), the consolidated balance sheets of the Company as of December 31, 2024 and 2023, the related consolidated statements of income, comprehensive income, stockholders’ (deficit) equity and cash flows for each of the three years in the period ended December 31, 2024, and the related notes, and our report dated February 11, 2025 expressed an unqualified opinion thereon.
Basis for Opinion
The Company’s management is responsible for maintaining effective internal control over financial reporting and for its assessment of the effectiveness of internal control over financial reporting included in the accompanying Management’s Report on Internal Control Over Financial Reporting. Our responsibility is to express an opinion on the Company’s internal control over financial reporting based on our audit. We are a public accounting firm registered with the PCAOB and are required to be independent with respect to the Company in accordance with the U.S. federal securities laws and the applicable rules and regulations of the Securities and Exchange Commission and the PCAOB.
We conducted our audit in accordance with the standards of the PCAOB. Those standards require that we plan and perform the audit to obtain reasonable assurance about whether effective internal control over financial reporting was maintained in all material respects.
Our audit included obtaining an understanding of internal control over financial reporting, assessing the risk that a material weakness exists, testing and evaluating the design and operating effectiveness of internal control based on the assessed risk, and performing such other procedures as we considered necessary in the circumstances. We believe that our audit provides a reasonable basis for our opinion.
Definition and Limitations of Internal Control Over Financial Reporting
A company’s internal control over financial reporting is a process designed to provide reasonable assurance regarding the reliability of financial reporting and the preparation of financial statements for external purposes in accordance with generally accepted accounting principles. A company’s internal control over financial reporting includes those policies and procedures that (1) pertain to the maintenance of records that, in reasonable detail, accurately and fairly reflect the transactions and dispositions of the assets of the company; (2) provide reasonable assurance that transactions are recorded as necessary to permit preparation of financial statements in accordance with generally accepted accounting principles, and that receipts and expenditures of the company are being made only in accordance with authorizations of management and directors of the company; and (3) provide reasonable assurance regarding prevention or timely detection of unauthorized acquisition, use, or disposition of the company’s assets that could have a material effect on the financial statements.
Because of its inherent limitations, internal control over financial reporting may not prevent or detect misstatements. Also, projections of any evaluation of effectiveness to future periods are subject to the risk that controls may become inadequate because of changes in conditions, or that the degree of compliance with the policies or procedures may deteriorate.
Tysons, Virginia
February 11, 2025
REPORT OF INDEPENDENT REGISTERED PUBLIC ACCOUNTING FIRM
To the Stockholders and Board of Directors of Marriott International, Inc.
Opinion on the Financial Statements
We have audited the accompanying consolidated balance sheets of Marriott International, Inc. (the Company) as of December 31, 2024, and 2023, the related consolidated statements of income, comprehensive income, stockholders’ (deficit) equity and cash flows for each of the three years in the period ended December 31, 2024, and the related notes (collectively referred to as the “consolidated financial statements”). In our opinion, the consolidated financial statements present fairly, in all material respects, the financial position of the Company at December 31, 2024 and 2023, and the results of its operations and its cash flows for each of the three years in the period ended December 31, 2024, in conformity with U.S. generally accepted accounting principles.
We also have audited, in accordance with the standards of the Public Company Accounting Oversight Board (United States) (PCAOB), the Company’s internal control over financial reporting as of December 31, 2024, based on criteria established in Internal Control-Integrated Framework issued by the Committee of Sponsoring Organizations of the Treadway Commission (2013 framework) and our report dated February 11, 2025 expressed an unqualified opinion thereon.
Basis for Opinion
These financial statements are the responsibility of the Company’s management. Our responsibility is to express an opinion on these financial statements based on our audits. We are a public accounting firm registered with the PCAOB and are required to be independent with respect to the Company in accordance with the U.S. federal securities laws and the applicable rules and regulations of the Securities and Exchange Commission and the PCAOB.
We conducted our audits in accordance with the standards of the PCAOB. Those standards require that we plan and perform the audit to obtain reasonable assurance about whether the financial statements are free of material misstatement, whether due to error or fraud. Our audits included performing procedures to assess the risks of material misstatement of the financial statements, whether due to error or fraud, and performing procedures that respond to those risks. Such procedures included examining, on a test basis, evidence regarding the amounts and disclosures in the financial statements. Our audits also included evaluating the accounting principles used and significant estimates made by management, as well as evaluating the overall presentation of the financial statements. We believe that our audits provide a reasonable basis for our opinion.
Critical Audit Matters
The critical audit matters communicated below are matters arising from the current period audit of the financial statements that were communicated or required to be communicated to the audit committee and that: (1) relate to accounts or disclosures that are material to the financial statements and (2) involved our especially challenging, subjective or complex judgments. The communication of critical audit matters does not alter in any way our opinion on the consolidated financial statements, taken as a whole, and we are not, by communicating the critical audit matters below, providing separate opinions on the critical audit matters or on the accounts or disclosures to which they relate.
| | | | | | | | |
| | Accounting for the Loyalty Program |
| Description of the Matter | | During 2024, the Company recognized $3,010 million of revenues previously deferred as of December 31, 2023, and had deferred revenue of $7,519 million as of December 31, 2024, associated with the Marriott Bonvoy guest loyalty program (the Loyalty Program). As discussed in Note 2 to the financial statements, the Company recognizes revenue for performance obligations relating to Loyalty Program points and free night certificates as they are redeemed and the related performance obligations are satisfied. The Company recognizes a portion of revenue for the licensed intellectual property performance obligation under the sales-based royalty criteria, with the remaining portion recognized on a straight-line basis over the contract term. Revenue is recognized utilizing complex models based upon the estimated standalone selling price per point and per free night certificate, which includes judgment in making the estimates of variable consideration and breakage of points. |
| | |
| | Auditing Loyalty Program results is complex due to: (1) the complexity of models and high volume of data used to monitor and account for Loyalty Program results, (2) the complexity in accounting for the amendment to one of the Company’s domestic co-branded credit card agreements, as well as the judgment in estimating the relative standalone selling price of the related performance obligations, and (3) the complexity and judgment of estimating the standalone selling price per Loyalty Program point, including both the estimate of variable consideration under the Company’s co-branded credit card agreements which has significant estimation uncertainty associated with projecting future cardholder spending and redemption activity, and the estimated breakage of Loyalty Program points which requires the use of specialists. |
| | |
| How We Addressed the Matter in Our Audit | | We obtained an understanding, evaluated the design, and tested the operating effectiveness of controls over the Company’s process of accounting for the Loyalty Program. For example, we tested controls over the accounting methods and model used in reporting results of the Loyalty Program, management’s review of the assumptions and data inputs utilized in estimating the standalone selling price per Loyalty Program point, as well as the development of the estimated breakage. |
| | |
| | To test the recognition of revenues and costs associated with the Loyalty Program, we performed audit procedures that included, among others, testing the clerical accuracy and consistency with US GAAP of the accounting model developed by the Company to recognize revenue and costs associated with the Loyalty Program, and testing significant inputs into the accounting model, including the estimated standalone selling price and recognition of points earned and redeemed during the period. We involved our valuation specialists to assist in our testing procedures with respect to the estimate of relative standalone selling price of the performance obligations associated with the amendment to a domestic co-branded credit card agreement. We involved our actuarial professionals to assist in our testing procedures with respect to the estimate of the breakage of Loyalty Program points. We evaluated management’s methodology for estimating the breakage of Loyalty Program points, and we tested underlying data and actuarial assumptions used in estimating the breakage. We evaluated the reasonableness of management’s assumptions, including projections of cash flows, used to estimate variable consideration under the Company’s co-branded credit cards. |
| | |
| | | | | | | | |
| | Accounting for General and Administrative Expenses and Reimbursed Expenses |
| Description of the Matter | | During 2024, the Company recognized $1,074 million of general and administrative expenses and $18,799 million of reimbursed expenses. As discussed in Note 2 to the financial statements, the Company incurs certain expenses that are for the benefit of, and reimbursable from, hotel owners and certain other counterparties. Such amounts are recorded in the period in which the expense is incurred and include judgment with respect to the allocation of certain costs between general and administrative expenses, which are non-reimbursable, and reimbursed expenses. |
| | |
| | Auditing the classification of general and administrative expenses and reimbursed expenses is complex due to: (1) judgment associated with testing management’s conclusions regarding the allocation of costs between reimbursable and non-reimbursable expenses and (2) incentives within management’s compensation structure designed to achieve certain financial targets that exclude the impact of reimbursed expenses. |
| | |
| How We Addressed the Matter in Our Audit | | We obtained an understanding, evaluated the design, and tested the operating effectiveness of controls over the Company’s process of accounting for reimbursed expenses, general and administrative expenses, and the process for allocating expenses. For example, we tested management’s controls over the review of the allocation of certain costs to determine if they were reasonably classified. |
| | |
| | To test the recognition of reimbursed expenses for appropriate classification, we performed audit procedures that included, among others, (1) testing manual journal entries made to reimbursed expenses and general and administrative expenses and (2) performing analytical procedures over total reimbursed expenses and general and administrative expenses in order to identify any trends or indicators of material errors in the classification of expenses. |
| | |
We have served as the Company’s auditor since 2002.
Tysons, Virginia
February 11, 2025
MARRIOTT INTERNATIONAL, INC.
CONSOLIDATED STATEMENTS OF INCOME
Fiscal Years 2024, 2023, and 2022
(in millions, except per share amounts)
| | | | | | | | | | | | | | | | | |
| | 2024 | | 2023 | | 2022 |
| REVENUES | | | | | |
| Base management fees | $ | 1,288 | | | $ | 1,238 | | | $ | 1,044 | |
| Franchise fees | 3,113 | | | 2,831 | | | 2,505 | |
| Incentive management fees | 769 | | | 755 | | | 529 | |
| Gross fee revenues | 5,170 | | | 4,824 | | | 4,078 | |
| Contract investment amortization | (103) | | | (88) | | | (89) | |
| Net fee revenues | 5,067 | | | 4,736 | | | 3,989 | |
| Owned, leased, and other revenue | 1,551 | | | 1,564 | | | 1,367 | |
Cost reimbursement revenue (1) | 18,482 | | | 17,413 | | | 15,417 | |
| 25,100 | | | 23,713 | | | 20,773 | |
| OPERATING COSTS AND EXPENSES | | | | | |
| Owned, leased, and other - direct | 1,200 | | | 1,165 | | | 1,074 | |
| Depreciation, amortization, and other | 183 | | | 189 | | | 193 | |
| General, administrative, and other | 1,074 | | | 1,011 | | | 891 | |
| Restructuring and merger-related charges | 77 | | | 60 | | | 12 | |
Reimbursed expenses (1) | 18,799 | | | 17,424 | | | 15,141 | |
| 21,333 | | | 19,849 | | | 17,311 | |
| OPERATING INCOME | 3,767 | | | 3,864 | | | 3,462 | |
| Gains and other income, net | 31 | | | 40 | | | 11 | |
| | | | | |
| Interest expense | (695) | | | (565) | | | (403) | |
| Interest income | 40 | | | 30 | | | 26 | |
Equity in earnings (1) | 8 | | | 9 | | | 18 | |
| INCOME BEFORE INCOME TAXES | 3,151 | | | 3,378 | | | 3,114 | |
| Provision for income taxes | (776) | | | (295) | | | (756) | |
| NET INCOME | $ | 2,375 | | | $ | 3,083 | | | $ | 2,358 | |
| EARNINGS PER SHARE | | | | | |
| Earnings per share – basic | $ | 8.36 | | | $ | 10.23 | | | $ | 7.27 | |
| Earnings per share – diluted | $ | 8.33 | | | $ | 10.18 | | | $ | 7.24 | |
(1)See Note 15 for disclosure of related party amounts.
See Notes to Consolidated Financial Statements.
MARRIOTT INTERNATIONAL, INC.
CONSOLIDATED STATEMENTS OF COMPREHENSIVE INCOME
Fiscal Years 2024, 2023, and 2022
(in millions)
| | | | | | | | | | | | | | | | | |
| | 2024 | | 2023 | | 2022 |
| Net income | $ | 2,375 | | | $ | 3,083 | | | $ | 2,358 | |
| Other comprehensive income (loss) | | | | | |
| Foreign currency translation adjustments | (437) | | | 86 | | | (389) | |
| Other adjustments, net of tax | 21 | | | (4) | | | 2 | |
| | | | | |
| | | | | |
| | | | | |
| Total other comprehensive (loss) income, net of tax | (416) | | | 82 | | | (387) | |
| Comprehensive income | $ | 1,959 | | | $ | 3,165 | | | $ | 1,971 | |
See Notes to Consolidated Financial Statements.
MARRIOTT INTERNATIONAL, INC.
CONSOLIDATED BALANCE SHEETS
Fiscal Years Ended 2024 and 2023
(in millions)
| | | | | | | | | | | |
| December 31,
2024 | | December 31,
2023 |
| ASSETS | | | |
| Current assets | | | |
| Cash and equivalents | $ | 396 | | | $ | 338 | |
| Accounts and notes receivable, net | 2,795 | | | 2,712 | |
| Prepaid expenses and other | 294 | | | 261 | |
| | | |
| 3,485 | | | 3,311 | |
| Property and equipment, net | 1,833 | | | 1,581 | |
| Intangible assets | | | |
| Brands | 5,770 | | | 5,907 | |
| Contract acquisition costs and other | 3,718 | | | 3,283 | |
| Goodwill | 8,731 | | | 8,886 | |
| 18,219 | | | 18,076 | |
| Equity method investments | 298 | | | 308 | |
| Notes receivable, net | 136 | | | 138 | |
| Deferred tax assets | 650 | | | 673 | |
| Operating lease assets | 845 | | | 929 | |
| Other noncurrent assets | 716 | | | 658 | |
| $ | 26,182 | | | $ | 25,674 | |
| LIABILITIES AND STOCKHOLDERS’ DEFICIT | | | |
| Current liabilities | | | |
| Current portion of long-term debt | $ | 1,309 | | | $ | 553 | |
| Accounts payable | 763 | | | 738 | |
| Accrued payroll and benefits | 1,449 | | | 1,390 | |
| Liability for guest loyalty program | 3,487 | | | 3,328 | |
| Accrued expenses and other | 1,641 | | | 1,753 | |
| 8,649 | | | 7,762 | |
| Long-term debt | 13,138 | | | 11,320 | |
| Liability for guest loyalty program | 4,032 | | | 3,678 | |
| Deferred tax liabilities | 81 | | | 209 | |
| Deferred revenue | 1,103 | | | 1,018 | |
| Operating lease liabilities | 794 | | | 887 | |
| Other noncurrent liabilities | 1,377 | | | 1,482 | |
| Stockholders’ deficit | | | |
| Class A Common Stock | 5 | | | 5 | |
| Additional paid-in-capital | 6,179 | | | 6,051 | |
| Retained earnings | 16,531 | | | 14,838 | |
| Treasury stock, at cost | (24,644) | | | (20,929) | |
| Accumulated other comprehensive loss | (1,063) | | | (647) | |
| (2,992) | | | (682) | |
| $ | 26,182 | | | $ | 25,674 | |
See Notes to Consolidated Financial Statements.
MARRIOTT INTERNATIONAL, INC.
CONSOLIDATED STATEMENTS OF CASH FLOWS
Fiscal Years 2024, 2023, and 2022
(in millions)
| | | | | | | | | | | | | | | | | |
| | 2024 | | 2023 | | 2022 |
| OPERATING ACTIVITIES | | | | | |
| Net income | $ | 2,375 | | | $ | 3,083 | | | $ | 2,358 | |
| Adjustments to reconcile to cash provided by operating activities: | | | | | |
Depreciation, amortization, and other (including depreciation and amortization classified in reimbursed expenses) (2) | 492 | | | 436 | | | 400 | |
| Stock-based compensation | 237 | | | 205 | | | 192 | |
| Income taxes | (172) | | | (612) | | | 280 | |
| Liability for guest loyalty program | 514 | | | 301 | | | (119) | |
| Contract acquisition costs | (341) | | | (221) | | | (149) | |
| Restructuring and merger-related charges | (278) | | | 47 | | | (8) | |
| Working capital changes | (82) | | | 69 | | | (542) | |
| | | | | |
| Other | 4 | | | (138) | | | (49) | |
| Net cash provided by operating activities | 2,749 | | | 3,170 | | | 2,363 | |
| INVESTING ACTIVITIES | | | | | |
| Capital and technology expenditures | (750) | | | (452) | | | (332) | |
| Asset acquisition | (26) | | | (101) | | | — | |
| Dispositions | 16 | | | 71 | | | 1 | |
| Loan advances | (10) | | | (77) | | | (11) | |
| Loan collections | 36 | | | 61 | | | 14 | |
| Other | — | | | 33 | | | 31 | |
| Net cash used in investing activities | (734) | | | (465) | | | (297) | |
| FINANCING ACTIVITIES | | | | | |
| Commercial paper/Credit Facility, net | 163 | | | 546 | | | (182) | |
| Issuance of long-term debt | 2,948 | | | 1,918 | | | 983 | |
| Repayment of long-term debt | (558) | | | (684) | | | (804) | |
| Issuance of Class A Common Stock | 73 | | | 29 | | | — | |
| | | | | |
| Dividends paid | (682) | | | (587) | | | (321) | |
| Purchase of treasury stock | (3,762) | | | (3,953) | | | (2,566) | |
| Stock-based compensation withholding taxes | (138) | | | (108) | | | (89) | |
| Other | — | | | (25) | | | 17 | |
| Net cash used in financing activities | (1,956) | | | (2,864) | | | (2,962) | |
| INCREASE (DECREASE) IN CASH, CASH EQUIVALENTS, AND RESTRICTED CASH | 59 | | | (159) | | | (896) | |
CASH, CASH EQUIVALENTS, AND RESTRICTED CASH, beginning of period (1) | 366 | | | 525 | | | 1,421 | |
CASH, CASH EQUIVALENTS, AND RESTRICTED CASH, end of period (1) | $ | 425 | | | $ | 366 | | | $ | 525 | |
(1)The 2024 amounts include beginning restricted cash of $28 million at December 31, 2023 and ending restricted cash of $29 million at December 31, 2024, which we present in the “Prepaid expenses and other” and “Other noncurrent assets” captions of our Balance Sheets.
(2)We reclassified depreciation and amortization classified in reimbursed expenses from the “Other” caption within operating activities to the “Depreciation, amortization, and other” caption of our Statements of Cash Flows. We reclassified prior period amounts, which totaled $159 million in 2023 and $118 million in 2022, to conform to our current presentation.
See Notes to Consolidated Financial Statements.
MARRIOTT INTERNATIONAL, INC.
CONSOLIDATED STATEMENTS OF STOCKHOLDERS’ (DEFICIT) EQUITY
Fiscal Years 2024, 2023, and 2022
(in millions, except per share amounts)
| | | | | | | | | | | | | | | | | | | | | | | | | | | | | | | | | | | | | | | | | |
| Common Shares Outstanding | | | Total | | Class A Common Stock | | Additional Paid-in-Capital | | Retained Earnings | | Treasury Stock, at Cost | | Accumulated Other Comprehensive Loss |
| 326.3 | | | Balance at December 31, 2021 | $ | 1,414 | | | $ | 5 | | | $ | 5,892 | | | $ | 10,305 | | | $ | (14,446) | | | $ | (342) | |
| — | | | Net income | 2,358 | | | — | | | — | | | 2,358 | | | — | | | — | |
| — | | | Other comprehensive loss | (387) | | | — | | | — | | | — | | | — | | | (387) | |
| — | | | Dividends ($1.00 per share) | (321) | | | — | | | — | | | (321) | | | — | | | — | |
| 1.1 | | | Stock-based compensation plans | 104 | | | — | | | 73 | | | — | | | 31 | | | — | |
| (16.8) | | | Purchase of treasury stock | (2,600) | | | — | | | — | | | — | | | (2,600) | | | — | |
| 310.6 | | | Balance at December 31, 2022 | 568 | | | 5 | | | 5,965 | | | 12,342 | | | (17,015) | | | (729) | |
| — | | | Net income | 3,083 | | | — | | | — | | | 3,083 | | | — | | | — | |
| — | | | Other comprehensive income | 82 | | | — | | | — | | | — | | | — | | | 82 | |
| — | | | Dividends ($1.96 per share) | (587) | | | — | | | — | | | (587) | | | — | | | — | |
| 1.4 | | | Stock-based compensation plans | 126 | | | — | | | 86 | | | — | | | 40 | | | — | |
| (21.5) | | | Purchase of treasury stock | (3,954) | | | — | | | — | | | — | | | (3,954) | | | — | |
| 290.5 | | | Balance at December 31, 2023 | (682) | | | 5 | | | 6,051 | | | 14,838 | | | (20,929) | | | (647) | |
| — | | | Net income | 2,375 | | | — | | | — | | | 2,375 | | | — | | | — | |
| — | | | Other comprehensive loss | (416) | | | — | | | — | | | — | | | — | | | (416) | |
| — | | | Dividends ($2.41 per share) | (682) | | | — | | | — | | | (682) | | | — | | | — | |
| 1.6 | | | Stock-based compensation plans | 174 | | | — | | | 128 | | | — | | | 46 | | | — | |
| (15.4) | | | Purchase of treasury stock | (3,761) | | | — | | | — | | | — | | | (3,761) | | | — | |
| 276.7 | | (1) | Balance at December 31, 2024 | $ | (2,992) | | | $ | 5 | | | $ | 6,179 | | | $ | 16,531 | | | $ | (24,644) | | | $ | (1,063) | |
(1)Our restated certificate of incorporation authorizes 800,000,000 shares of our common stock, with a par value of $0.01 per share and 10,000,000 shares of preferred stock, without par value. At year-end 2024, we had 276,671,710 of these authorized shares of our common stock and no preferred stock outstanding.
See Notes to Consolidated Financial Statements.
MARRIOTT INTERNATIONAL, INC.
NOTES TO CONSOLIDATED FINANCIAL STATEMENTS
NOTE 1. BASIS OF PRESENTATION
The consolidated financial statements present the results of operations, financial position, and cash flows of Marriott International, Inc. and subsidiaries (referred to in this report as “we,” “us,” “Marriott,” or the “Company”). In order to make this report easier to read, we also refer throughout to (1) our Consolidated Financial Statements as our “Financial Statements,” (2) our Consolidated Statements of Income as our “Income Statements,” (3) our Consolidated Balance Sheets as our “Balance Sheets,” (4) our Consolidated Statements of Cash Flows as our “Statements of Cash Flows,” (5) our properties, brands, or markets in the United States and Canada as “U.S. & Canada,” and (6) our properties, brands, or markets in our Europe, Middle East & Africa, Greater China, Asia Pacific excluding China, and Caribbean & Latin America regions, as “International.” References throughout to numbered “Notes” refer to these Notes to Consolidated Financial Statements, unless otherwise stated. In addition, we use the term “hotel owners” throughout this report to refer, collectively, to owners of hotels and other lodging offerings operating in our system pursuant to management agreements, franchise agreements, license agreements or similar arrangements, and we use the term “hotels in our system” to refer to hotels and other lodging offerings operating in our system pursuant to such arrangements, as well as hotels that we own or lease. The terms “hotel owners” and “hotels in our system” exclude Homes & Villas by Marriott Bonvoy® (which we also exclude from our property and room count), timeshare, residential, and The Ritz-Carlton Yacht Collection®.
Preparation of financial statements that conform with U.S. generally accepted accounting principles (“GAAP”) requires management to make estimates and assumptions that affect the reported amounts of assets and liabilities as of the date of the financial statements, the reported amounts of revenues and expenses during the reporting periods, and the disclosures of contingent liabilities. Accordingly, ultimate results could differ from those estimates.
The accompanying Financial Statements reflect all normal and recurring adjustments necessary to present fairly our financial position at fiscal year-end 2024 and fiscal year-end 2023 and the results of our operations and cash flows for fiscal years 2024, 2023, and 2022. We have eliminated all material intercompany transactions and balances between entities consolidated in these Financial Statements.
NOTE 2. SUMMARY OF SIGNIFICANT ACCOUNTING POLICIES
Revenue Recognition
Base Management and Incentive Management Fees: For our managed properties, we have performance obligations to provide hotel management services and a license to our intellectual property for the use of our brand names. As compensation for such services, we are generally entitled to receive base management fees, which are a percentage of the revenues of properties, and incentive management fees, which are generally based on a measure of hotel profitability. Both the base management and incentive management fees are variable consideration, as the transaction price is based on a percentage of revenue or profit, as defined in each contract. We recognize base management fees on a monthly basis over the term of the agreement as those amounts become payable. We recognize incentive management fees on a monthly basis over the term of the agreement based on each property’s financial results, as long as we do not expect a significant reversal due to projected future hotel performance or cash flows in future periods.
Franchise Fee and Royalty Fee Revenue: For our franchised properties, we have a performance obligation to provide franchisees and operators a license to our intellectual property for use of certain of our brand names. As compensation for such services, we are typically entitled to initial application fees and ongoing royalty fees. Our ongoing royalty fees represent variable consideration, as the transaction price is based on a percentage of certain revenues of the properties, as defined in each contract. We recognize royalty fees on a monthly basis over the term of the agreement as those amounts become payable. Initial application and relicensing fees are fixed consideration payable upon submission of a franchise application or renewal and are recognized on a straight-line basis over the initial or renewal term of the franchise agreements.
Owned and Leased Hotel Revenue: At our owned and leased hotels, we have performance obligations to provide accommodations and other ancillary services to hotel guests. As compensation for such goods and services, we are typically entitled to a fixed nightly fee for an agreed upon period and additional fixed fees for any ancillary services purchased. These fees are generally payable at the time the hotel guest checks out of the hotel. We generally satisfy the performance obligations over time, and we recognize the revenue from room sales and from other ancillary guest services on a daily basis, as the rooms are occupied and we have rendered the services.
Cost Reimbursements: Under our agreements with hotel owners and certain other counterparties, we are entitled to be reimbursed for certain costs we incur on behalf of their properties, with no added mark-up. These costs primarily consist of
payroll and related expenses at managed properties where we are the employer of the employees at the properties and include certain operational and administrative costs as provided for in our contracts with the hotel owners. We are entitled to reimbursement in the period we incur the related reimbursable costs, which we recognize within the “Cost reimbursement revenue” caption of our Income Statements.
Hotel owners and certain other counterparties participate in certain centralized programs and services, such as marketing, sales, reservations, and insurance programs, which we operate for their benefit. We do not operate these programs and services to generate a profit over the long term, and accordingly, when we recover the costs that we incur for these programs and services from our hotel owners and other counterparties we do not seek a mark-up. The amounts we charge for these programs and services are generally a combination of fixed fees and variable fees based on sales or other metrics and are payable on a monthly basis. We generally recognize revenue within the “Cost reimbursement revenue” caption of our Income Statements when the amounts may be billed to hotel owners and other counterparties, and we recognize expenses within the “Reimbursed expenses” caption as they are incurred. This pattern of recognition results in timing differences between the costs incurred for centralized programs and services and the related reimbursement in our operating and net income. Over the long term, these programs and services are not designed to impact our economics, either positively or negatively. In addition, we present in the “Reimbursed expenses” caption of our Income Statements spending funded by the proceeds ($664 million, $425 million after-tax) from the 2017 sale of our interest in Avendra LLC, which we committed would be used for the benefit of hotels in our system. Such spending totaled less than $1 million in 2024, $161 million ($120 million after-tax) in 2023, and $69 million ($52 million after-tax) in 2022. As of December 31, 2024, we have completed our spending funded by the Avendra sale proceeds.
Other Revenue: Includes Global Design fees (described below), termination fees, and other property and brand revenues, which we present within the “Owned, leased, and other revenue” caption of our Income Statements. We generally recognize termination fees when collection is probable and other revenue as services are rendered. Amounts received in advance are deferred as liabilities.
We provide certain hotel design and construction review (“Global Design”) services to hotel owners, generally during the period prior to a hotel’s opening or during the period a hotel is converting to a Marriott brand (the “pre-opening period”). As compensation for such services, we may be entitled to receive a fixed fee that is payable during the pre-opening period of the hotel. These services are not a distinct performance obligation, and therefore we recognize the fees on a straight-line basis over the initial term of the management, franchise, or license agreement.
Practical Expedients and Exemptions: We do not disclose the amount of variable consideration that we expect to recognize in future periods in the following circumstances:
(1) if we recognize the revenue based on the amount invoiced or services performed;
(2) for sales-based or usage-based royalty promised in exchange for a license of intellectual property; or
(3) if the consideration is allocated entirely to a wholly unsatisfied promise to transfer a distinct service that forms part of a single performance obligation, and the terms of the consideration relate specifically to our efforts to transfer, or to a specific outcome from transferring the service.
We are required to collect certain taxes and fees from customers on behalf of governmental agencies and remit these to the applicable governmental agencies on a periodic basis. We do not include these taxes in determining the transaction price.
Loyalty Program: Loyalty Program members earn points based on the money they spend at participating properties; the exchange of timeshare ownership interests; purchases of timeshare interval, fractional ownership, and residential products; and through participation in travel experiences and affiliated partners’ programs, such as those offered by credit card, car rental, airline, and other companies. Members can redeem points for stays at participating properties, airline tickets, airline frequent flyer program miles, rental cars, merchandise, and a variety of other awards. Points cannot be redeemed for cash.
Under our Loyalty Program, we have a performance obligation to provide or arrange for the provision of goods or services to Loyalty Program members in exchange for the redemption of points earned from past activities. We operate our Loyalty Program as a cross-brand marketing program to participating properties. Our agreements with hotel owners and certain other counterparties require that properties reimburse us for costs of operating the Loyalty Program, with no added mark-up, including costs related to the following activities, which we expense as incurred in our “Reimbursed expenses” caption of our Income Statements: marketing, promotion, and communications and services provided to Loyalty Program members. We generally receive monthly cash contributions from participating properties based on a portion of qualified spend by Loyalty Program members (when the points are earned). We recognize these contributions into revenue as we provide the related service (when the points are redeemed). The amount of revenue we recognize upon point redemption is based on a blend of historical funding rates and is impacted by our estimate of the “breakage” for points that members will never redeem. Breakage
is estimated based on historical member activity and expectations of future member behavior. We recognize revenue net of the redemption cost within our “Cost reimbursement revenue” caption on our Income Statements, as our performance obligation is to facilitate the transaction between the Loyalty Program member and the property or program partner. Our redemption cost could be higher or lower than our revenue recognized in any given period.
We have multi-year agreements for our co-branded credit cards associated with our Loyalty Program. Under these agreements, we have performance obligations to provide a license to the intellectual property associated with our brands and marketing lists (“Licensed IP”) to the financial institutions that issue the credit cards, to arrange for the redemption of Loyalty Program points as discussed in the preceding paragraph, and to arrange for the redemption of free night certificates and gift cards provided to cardholders. We receive fees from these agreements, including fixed amounts that are primarily payable at contract inception, and variable amounts that are paid to us monthly over the term of the agreements, generally based on: (1) the number of free night certificates issued or redeemed; (2) the number of Loyalty Program points purchased; (3) the volume of cardholder spend; and (4) the number of gift cards issued. We allocate those fees among the performance obligations, including the Licensed IP, our Loyalty Program points, free night certificates, and gift cards provided to cardholders based on their estimated standalone selling prices. The estimation of the standalone selling prices requires significant judgments based upon generally accepted valuation methodologies regarding the value of our Licensed IP, the amount of funding we will receive, and the number of Loyalty Program points, free night certificates, and gift cards cardholders will ultimately redeem. We base our estimates of these amounts on our historical experience and expectation of future cardholder behavior. We recognize the portion of the Licensed IP revenue that meets the sales-based royalty criteria as the credit cards are used and the remaining portion of the Licensed IP revenue on a straight-line basis over the contract term. In our Income Statements, we primarily recognize Licensed IP revenue in the “Franchise fees” caption, and we recognize a portion in the “Cost reimbursement revenue” caption. We recognize the revenue related to the Loyalty Program points as discussed in the preceding paragraph. We recognize the revenue related to the free night certificates and gift cards when the related service is provided. We recognize revenue net of the redemption cost, as our performance obligation is to facilitate the transaction between the Loyalty Program member and the managed or franchised property.
Contract Balances: We generally receive payments from customers as we satisfy our performance obligations. We record a receivable when we have an unconditional right to receive payment and only the passage of time is required before payment is due. We record deferred revenue when we receive payment, or have the unconditional right to receive payment, in advance of the satisfaction of our performance obligations related to franchise application and relicensing fees, Global Design fees, credit card branding license fees, and our Loyalty Program.
Our current and noncurrent deferred revenue increased by $76 million, to $1,299 million at December 31, 2024, from $1,223 million at December 31, 2023, primarily as a result of revenue deferred in 2024 related to our co-branded credit cards, gift cards, franchise application and relicensing fees, and certain centralized programs and services fees. The increase was partially offset by $222 million of revenue recognized in 2024 that was deferred as of December 31, 2023.
Our current and noncurrent liability for guest loyalty program increased by $513 million, to $7,519 million at December 31, 2024, from $7,006 million at December 31, 2023, primarily reflecting an increase in points earned by members. The increase was partially offset by $3,010 million of revenue recognized in 2024, that was deferred as of December 31, 2023. The current portion of our liability for guest loyalty program increased compared to December 31, 2023, due to higher estimated redemptions in the short-term. At each reporting period, we evaluate the estimates used in the recognition of Loyalty Program revenues, including estimates of the breakage of points that members will never redeem and the amount of funding we expect to receive over the life of the agreements with various third parties. In 2024, the updated estimates resulted in a net decrease in revenue, and a corresponding increase in the liability for guest loyalty program of approximately $72 million.
Costs Incurred to Obtain and Fulfill Contracts with Customers
We incur certain costs to obtain and fulfill contracts with customers, which we capitalize and amortize on a straight-line basis over the initial, non-cancellable term of the contract. We classify incremental costs of obtaining a contract with a customer in the “Contract acquisition costs and other” caption of our Balance Sheets, the related amortization in the “Contract investment amortization” caption of our Income Statements, and the cash flow impact in the “Contract acquisition costs” caption of our Statements of Cash Flows. We assess the assets for impairment when events or changes in circumstances indicate that we may not be able to recover the carrying amount. We recognize an impairment loss for the amount by which the carrying amount exceeds the expected net future cash flows. We classify certain direct costs to fulfill a contract with a customer in the “Other noncurrent assets” and “Prepaid expenses and other” captions of our Balance Sheets, and the related amortization in the “Owned, leased, and other - direct” caption of our Income Statements. We had capitalized costs to fulfill contracts with customers of $419 million at December 31, 2024 and $402 million at December 31, 2023. See Note 10 for information on capitalized costs incurred to obtain contracts with customers.
Real Estate Sales
We recognize a gain or loss on real estate transactions when control of the asset transfers to the buyer, generally at the time the sale closes. In sales transactions where we retain a management contract, the terms and conditions of the management contract are generally comparable to the terms and conditions of the management contracts obtained directly with hotel owners in competitive processes.
Retirement Savings Plan
We contribute to tax-qualified retirement plans for the benefit of U.S. employees who meet certain eligibility requirements and choose to participate in the plans. Participating employees specify the percentage or amount of salary they wish to contribute from their compensation, and the Company typically makes matching or supplemental contributions. We recognized compensation costs from Company contributions of $240 million in 2024, $215 million in 2023, and $137 million in 2022.
Non-U.S. Operations
The U.S. dollar is the functional currency of our consolidated and unconsolidated entities operating in the U.S. The functional currency of our consolidated and unconsolidated entities operating outside of the U.S. is generally the principal currency of the economic environment in which the entity primarily generates and expends cash. We translate the financial statements of consolidated entities whose functional currency is not the U.S. dollar into U.S. dollars, and we do the same, as needed, for unconsolidated entities whose functional currency is not the U.S. dollar. We translate assets and liabilities at the exchange rate in effect as of the financial statement date and translate income statement accounts using the weighted average exchange rate for the period. We include translation adjustments from currency exchange and the effect of exchange rate changes on intercompany transactions of a long-term investment nature as a separate component of stockholders’ (deficit) equity. We report gains and losses from currency exchange rate changes for intercompany receivables and payables that are not of a long-term investment nature, as well as for third-party transactions, currently in operating costs and expenses.
Stock-Based Compensation
Our stock-based compensation awards primarily consist of restricted stock units (“RSUs”). We measure compensation costs for our stock-based payment transactions at fair value based on the average of the high and low stock price on the grant date (discounted for the lack of marketability and dividends), and we recognize those costs in our Financial Statements over the vesting period during which the employee provides service in exchange for the award.
Advertising Costs
We expense costs to produce advertising as they are incurred and to communicate advertising as the communication occurs and record such amounts in our “Reimbursed expenses” caption of our Income Statements to the extent undertaken on behalf of hotel owners. We recognized advertising costs of $993 million in 2024, $794 million in 2023, and $635 million in 2022.
Income Taxes
We record the amounts of taxes payable or refundable for the current year, as well as deferred tax liabilities and assets for the future tax consequences of events we have recognized in our Financial Statements or tax returns, using judgment in assessing future profitability and the likely future tax consequences of those events. We base our estimates of deferred tax assets and liabilities on current tax laws, rates and interpretations, and, in certain cases, business plans and other expectations about future outcomes. We develop our estimates of future profitability based on our historical data and experience, industry projections, micro and macro general economic condition projections, and our expectations. We account for U.S. tax on Global Intangible Low-Taxed Income in the period incurred.
We generally recognize the effect of the tax law changes in the period of enactment. Changes in existing tax laws and rates, their related interpretations, and the uncertainty generated by the current economic environment may affect the amounts of our deferred tax liabilities or the valuations of our deferred tax assets over time. Our accounting for deferred tax consequences represents management’s best estimate of future events that can be appropriately reflected in the accounting estimates.
For tax positions we have taken or expect to take in a tax return, we apply a more likely than not threshold (that is, a likelihood of more than 50 percent), under which we must conclude a tax position is more likely than not to be sustained, assuming that the position will be examined by the appropriate taxing authority that has full knowledge of all relevant information, to recognize the benefit. In determining our provision for income taxes, we use judgment, reflecting our estimates
and assumptions, in applying the more likely than not threshold. We recognize accrued interest and penalties for our unrecognized tax benefits as a component of tax expense. See Note 6 for further information.
Cash and Equivalents
We consider all highly liquid investments with an initial maturity of three months or less at date of purchase to be cash equivalents.
Accounts Receivable
Our accounts receivable primarily consist of amounts due from hotel owners and include reimbursements of costs we incurred on their behalf. We record an allowance for credit losses measured over the contractual life of the instrument based on an assessment of historical collection activity and current and forecasted future economic conditions by region. Our allowance for credit losses was $199 million at December 31, 2024 and $197 million at December 31, 2023.
Assets Held for Sale
We consider properties to be assets held for sale when (1) management commits to a plan to sell the property; (2) it is unlikely that the disposal plan will be significantly modified or discontinued; (3) the property is available for immediate sale in its present condition; (4) actions required to complete the sale of the property have been initiated; (5) sale of the property is probable and we expect the completed sale will occur within one year; and (6) the property is actively being marketed for sale at a price that is reasonable given our estimate of current market value. Upon designation of a property as an asset held for sale, we record the property’s value at the lower of its carrying amount or its estimated fair value, less estimated costs to sell, and we cease depreciation.
Goodwill
We test goodwill for potential impairment at least annually in the fourth quarter, or more frequently if an event or other circumstance indicates that we may not be able to recover the carrying amount of the net assets of the reporting unit. In evaluating goodwill for impairment, we may assess qualitative factors to determine whether it is more likely than not that the fair value of a reporting unit is less than its carrying amount. Factors we consider when making this determination include, but are not limited to, assessing general economic conditions, hospitality industry trends, and overall financial performance of the reporting unit. If we bypass the qualitative assessment, or if we conclude that it is more likely than not that the fair value of a reporting unit is less than its carrying amount, then we perform a quantitative impairment test by comparing the fair value of a reporting unit with its carrying amount.
We calculate the estimated fair value of a reporting unit using a combination of the income and market approaches. For the income approach, we use internally developed discounted cash flow models that include the following assumptions, among others: projections of revenues, expenses, and related cash flows based on assumed long-term growth rates and demand trends; expected future investments to grow new units; and estimated discount rates. For the market approach, we use internal analyses based primarily on market comparables. We base these assumptions on our historical data and experience, third-party appraisals, industry projections, micro and macro general economic condition projections, and our expectations.
We have had no goodwill impairment charges for the last three fiscal years.
Intangibles and Long-Lived Assets
We assess indefinite-lived intangible assets for continued indefinite use and for potential impairment annually, or more frequently if an event or other circumstance indicates that we may not be able to recover the carrying amount of the asset. Like goodwill, we may first assess qualitative factors to determine whether it is more likely than not that the fair value of the indefinite-lived intangible is less than its carrying amount. If the carrying amount of the asset exceeds the fair value, we recognize an impairment loss in the amount of that excess.
We test definite-lived intangibles and long-lived asset groups for recoverability when changes in circumstances indicate that we may not be able to recover the carrying amount; for example, when there are material adverse changes in projected revenues or expenses, significant underperformance relative to historical or projected operating results, or significant negative industry or economic trends. We also test recoverability when management has committed to a plan to sell or otherwise dispose of an asset group and we expect to complete the plan within a year. We evaluate recoverability of an asset group by comparing its carrying amount, including right-of-use assets, to the future net undiscounted cash flows that we expect the asset group will generate. If the comparison indicates that we will not be able to recover the carrying amount of an asset group, we recognize an impairment loss for the amount by which the carrying amount exceeds the estimated fair value. When we recognize an
impairment loss for assets to be held and used, we depreciate the adjusted carrying amount of those assets over their remaining useful life.
We calculate the estimated fair value of an intangible asset or asset group using the income approach or the market approach. We utilize the same assumptions and methodology for the income approach that we describe in the “Goodwill” caption above. For the market approach, we use internal analyses based primarily on market comparables and assumptions about market capitalization rates, growth rates, and inflation.
Investments
We hold equity interests in ventures established to develop or acquire and own hotel properties or that otherwise support our hospitality operations. We account for these investments as either an equity method investment, a financial asset, or a controlled subsidiary. We apply the equity method of accounting if we have significant influence over the entity, typically when we hold 20 percent or more of the voting common stock (or equivalent) of an investee but do not have a controlling financial interest. In certain circumstances, such as with investments in limited liability companies or limited partnerships, we apply the equity method of accounting when we own as little as three to five percent. We account for financial assets at fair value if it is readily determinable, at our share of the entity’s net assets if the investment qualifies for the net asset value practical expedient, or using the fair value alternative method, whereby investments are measured at cost less impairment, adjusted for observable price changes. We consolidate entities that we control.
When we acquire an investment that qualifies for the equity method of accounting, we determine the acquisition date fair value of the identifiable assets and liabilities. If our carrying amount exceeds our proportional share in the equity of the investee, we amortize the difference on a straight-line basis over the underlying assets’ estimated useful lives when calculating equity method earnings attributable to us, excluding the difference attributable to land, which we do not amortize.
We evaluate an investment for impairment when circumstances indicate that we may not be able to recover the carrying amount. When evaluating our ventures, we consider loan defaults, significant underperformance relative to historical or projected operating performance, or significant negative industry or economic trends. Additionally, a venture’s commitment to a plan to sell some or all of its assets could cause us to evaluate the recoverability of the venture’s individual long-lived assets and possibly the venture itself. We impair investments we account for using the equity method of accounting when we determine that there has been an “other-than-temporary” decline in the venture’s estimated fair value compared to its carrying amount. We perform qualitative assessments for investments we account for using the fair value alternative method and we record any associated impairment when the fair value is less than the carrying amount.
Under the accounting guidance for the consolidation of variable interest entities, we analyze our variable interests, including equity investments, loans, and guarantees, to determine if an entity in which we have a variable interest is a variable interest entity. Our analysis includes both quantitative and qualitative reviews. We base our quantitative analysis on the forecasted cash flows of the entity, and our qualitative analysis on our review of the design of the entity, its organizational structure including decision-making ability, and relevant financial agreements. We also use our qualitative analysis to determine if we must consolidate a variable interest entity as its primary beneficiary.
Fair Value Measurements
We have various financial instruments we must measure at fair value on a recurring basis, including certain marketable securities and derivatives. We also apply the provisions of fair value measurement to various nonrecurring measurements for our financial and nonfinancial assets and liabilities. See Note 12 for further information.
Accounting standards define fair value as the price that would be received to sell an asset or paid to transfer a liability in an orderly transaction between market participants at the measurement date (an exit price). We measure our assets and liabilities using inputs from the following three levels of the fair value hierarchy:
Level 1 inputs are unadjusted quoted prices in active markets for identical assets or liabilities that we have the ability to access at the measurement date.
Level 2 inputs include quoted prices for similar assets and liabilities in active markets, quoted prices for identical or similar assets or liabilities in markets that are not active, inputs other than quoted prices that are observable for the asset or liability (e.g., interest rates, yield curves, etc.), and inputs that are derived principally from or corroborated by observable market data by correlation or other means (market corroborated inputs).
Level 3 inputs include unobservable inputs that reflect our assumptions about what factors market participants would use in pricing the asset or liability. We develop these inputs based on the best information available, including our own data.
Derivative Instruments
We record derivatives at fair value. The designation of a derivative instrument as a hedge and its ability to meet the hedge accounting criteria determine how we reflect the change in fair value of the derivative instrument in our Financial Statements. A derivative qualifies for hedge accounting if, at inception, we expect the derivative will be highly effective in offsetting the underlying hedged cash flows or fair value and we fulfill the hedge documentation standards at the time we enter into the derivative contract. We designate a hedge as a cash flow hedge, a fair value hedge, or a hedge of the net investment in non-U.S. operations based on the exposure we are hedging. For the effective portion of qualifying cash flow hedges, we record changes in fair value in accumulated other comprehensive income (“AOCI”). We release the derivative’s gain or loss from AOCI to match the timing of the underlying hedged items’ effect on earnings. The change in fair value of qualifying fair value hedges as well as changes in fair value of the underlying hedged items to the hedged risks are recorded concurrently in earnings.
We review the effectiveness of our hedging instruments quarterly and discontinue hedge accounting for any hedge that we no longer consider to be highly effective. We recognize changes in fair value for derivatives not designated as hedges or those not qualifying for hedge accounting in current period earnings. Upon termination of cash flow hedges, we release gains and losses from AOCI based on the timing of the underlying cash flows or revenue recognized, unless the termination results from the failure of the intended transaction to occur in the expected time frame. Such untimely transactions require us to immediately recognize in earnings the gains and/or losses that we previously recorded in AOCI.
Changes in interest rates and currency exchange rates expose us to market risk. We manage our exposure to these risks by monitoring available financing alternatives, as well as through development and application of credit granting policies. We also use derivative instruments as part of our overall strategy to manage our exposure to market risks. As a matter of policy, we only enter into transactions that we believe will be highly effective at offsetting the underlying risk, and we do not use derivatives for trading or speculative purposes.
Leases
We determine if an arrangement is a lease or contains a lease at the inception of the contract. We evaluate leases for classification as operating or financing upon lease commencement. Our leases generally contain fixed and variable components. The variable components of our leases are primarily based on operating performance of the leased property. Our lease agreements may also include non-lease components, such as common area maintenance, which we combine with the lease component to account for both as a single lease component.
Lease liabilities, which represent our obligation to make lease payments arising from the lease, and corresponding right-of-use assets, which represent our right to use an underlying asset for the lease term, are recognized at the commencement date of the lease based on the present value of fixed future payments over the lease term. We calculate the present value of future payments using the discount rate implicit in the lease, if available, or our incremental borrowing rate.
For operating leases, lease expense relating to fixed payments is recognized on a straight-line basis over the lease term and lease expense relating to variable payments is expensed as incurred. For finance leases, the amortization of the asset is recognized over the shorter of the lease term or useful life of the underlying asset.
Guarantees
We measure and record our liability for the fair value of a guarantee on a nonrecurring basis, that is when we issue or modify a guarantee. We base our calculation of the estimated fair value of a guarantee on the income approach or the market approach, depending on the type of guarantee. For the income approach, we use internally developed discounted cash flow and Monte Carlo simulation models that include the following assumptions, among others: projections of revenues and expenses and related cash flows based on assumed growth rates and demand trends; historical volatility of projected performance; the guaranteed obligations; and applicable discount rates. We base these assumptions on our historical data and experience, industry projections, micro and macro general economic condition projections, and our expectations. For the market approach, we use internal analyses based primarily on market comparable data and our assumptions about market capitalization rates, credit spreads, growth rates, and inflation.
The offsetting entry for the guarantee liability depends on the circumstances in which the guarantee was issued. Funding under the guarantee reduces the recorded liability. In most cases, when we do not forecast any funding, we amortize the liability into income on a straight-line basis over the remaining term of the guarantee. On a quarterly basis, we evaluate all material estimated liabilities based on the operating results and the terms of the guarantee. If we conclude that it is probable that we will be required to fund a greater amount than previously estimated, we record a loss except to the extent that the applicable contracts provide that the advance can be recovered as a loan.
Self-Insurance Programs
We self-insure for certain levels of liability, workers’ compensation, property insurance, and employee medical coverage. We accrue estimated costs of these self-insurance programs at the present value of projected settlements for known and incurred but not reported claims. We use a discount rate of 4.25 percent, based upon market rates, to determine the present value of the projected settlements, which we consider to be reasonable given our history of settled claims, including payment patterns and the fixed nature of the individual settlements. We classify the current portion of our self-insurance reserve in the “Accrued expenses and other” caption and the noncurrent portion in the “Other noncurrent liabilities” caption of our Balance Sheets. The current portion of our self-insurance reserve was $198 million at December 31, 2024 and $172 million at December 31, 2023. The noncurrent portion of our self-insurance reserve was $422 million at December 31, 2024 and $387 million at December 31, 2023.
Legal Contingencies
We are subject to various legal proceedings and claims, the outcomes of which are uncertain. We record an accrual for legal contingencies when we determine that it is probable that we have incurred a liability and we can reasonably estimate the amount of the loss. In making such determinations we evaluate, among other things, the probability of an unfavorable outcome and, when we believe it probable that a liability has been incurred, our ability to make a reasonable estimate of the loss. We review these accruals each reporting period and make revisions based on changes in facts and circumstances.
Business Combinations
We allocate the purchase price of an acquisition to the tangible and intangible assets acquired and liabilities assumed based on their estimated fair values at the acquisition date. We recognize as goodwill the amount by which the purchase price of an acquired entity exceeds the net of the fair values assigned to the assets acquired and liabilities assumed. In determining the fair values of assets acquired and liabilities assumed, we use various recognized valuation methods including the income and market approaches. Further, we make assumptions within certain valuation techniques, including discount rates, royalty rates, and the amount and timing of future cash flows. We record the net assets and results of operations of an acquired entity in our Financial Statements from the acquisition date. We initially perform these valuations based upon preliminary estimates and assumptions by management or independent valuation specialists under our supervision, where appropriate, and make revisions as estimates and assumptions are finalized. We expense acquisition-related costs as we incur them.
Asset Acquisitions
Acquisitions that do not meet the definition of a business are accounted for as asset acquisitions. We allocate the cost of the acquisition, including direct and incremental transaction costs, to the individual assets acquired and liabilities assumed on a relative fair value basis. Goodwill is not recognized in an asset acquisition.
New Accounting Standards Adopted
Accounting Standards Update (“ASU”) 2023-07 - “Segment Reporting (Topic 280): Improvements to Reportable Segment Disclosures”: ASU 2023-07, issued by the Financial Accounting Standards Board, requires the disclosure of significant segment expenses by reportable segment if such expenses are regularly provided to the chief operating decision maker (“CODM”) and included in each reported measure of segment profit or loss. ASU 2023-07 also requires disclosure of the CODM’s title and position and an explanation of how the CODM uses the reported measure of a segment profit or loss in assessing segment performance and allocating resources. We adopted ASU 2023-07 retrospectively in the 2024 fourth quarter to the disclosures presented in Note 14.
NOTE 3. ACQUISITION
In the 2024 fourth quarter, we completed the asset acquisition of the Sheraton Grand Chicago hotel and the fee simple interest in the land underlying the hotel for a purchase price of $514 million, including direct transaction costs. This acquisition is the result of a 2017 transaction in which we granted the owner a one-time right to require us to purchase the leasehold interest in the land and the hotel for $300 million in cash (the “put option”), which we previously accounted for as a guarantee liability. In January 2024, the owner exercised the put option, and at the same time the put transaction closed, we exercised our option to purchase the fee simple interest in the underlying land for an additional $200 million in cash. We determined that the capitalizable value of the acquired assets was $214 million on the acquisition date. We estimated the fair value of the hotel and land using a combination of two income approaches, which included Level 3 inputs such as forecasted future net cash flows, property resale value, and discount rates. We recorded the acquired assets in the Property and equipment, net caption of our Balance Sheets and applied the remaining $300 million of the purchase price to the release of the guarantee liability.
NOTE 4. EARNINGS PER SHARE
The table below illustrates the reconciliation of the earnings and number of shares used in our calculations of basic and diluted earnings per share, the latter of which uses the treasury stock method to calculate the dilutive effect of the Company’s potential common stock:
| | | | | | | | | | | | | | | | | |
| (in millions, except per share amounts) | 2024 | | 2023 | | 2022 |
| Computation of Basic Earnings Per Share | | | | | |
| Net income | $ | 2,375 | | | $ | 3,083 | | | $ | 2,358 | |
| Shares for basic earnings per share | 284.2 | | | 301.5 | | | 324.4 | |
| Basic earnings per share | $ | 8.36 | | | $ | 10.23 | | | $ | 7.27 | |
| Computation of Diluted Earnings Per Share | | | | | |
| Net income | $ | 2,375 | | | $ | 3,083 | | | $ | 2,358 | |
| Shares for basic earnings per share | 284.2 | | | 301.5 | | | 324.4 | |
| Effect of dilutive securities | | | | | |
| Stock-based compensation | 1.0 | | | 1.4 | | | 1.4 | |
| Shares for diluted earnings per share | 285.2 | | | 302.9 | | | 325.8 | |
| Diluted earnings per share | $ | 8.33 | | | $ | 10.18 | | | $ | 7.24 | |
NOTE 5. STOCK-BASED COMPENSATION
RSUs and PSUs
We granted RSUs in 2024 to certain officers and employees, and those units vest generally over four years in equal annual installments commencing one year after the grant date. We also granted performance-based RSUs (“PSUs”) in 2024 to certain executives, which are earned subject to continued employment and the satisfaction of certain performance and market conditions based on the degree of achievement of pre-established targets for 2026 adjusted EBITDA performance and relative total stockholder return over the 2024 to 2026 performance period.
We had deferred compensation costs for unvested awards for RSUs, including PSUs, of approximately $173 million at year-end 2024 and $171 million at year-end 2023. The weighted average remaining term for RSUs outstanding at year-end 2024 was 2.2 years.
The following table provides additional information on RSUs, including PSUs, for the last three fiscal years:
| | | | | | | | | | | | | | | | | |
| 2024 | | 2023 | | 2022 |
| Stock-based compensation expense (in millions) | $ | 203 | | | $ | 179 | | | $ | 181 | |
| Weighted average grant-date fair value (per unit) | $ | 222 | | | $ | 167 | | | $ | 168 | |
| Aggregate intrinsic value of distributed RSUs (in millions) | $ | 340 | | | $ | 297 | | | $ | 253 | |
The following table presents the changes in our outstanding RSUs, including PSUs, during 2024 and the associated weighted average grant-date fair values:
| | | | | | | | | | | |
| Number of RSUs (in millions) | | Weighted Average Grant-Date Fair Value (per unit) |
| Outstanding at year-end 2023 | 3.1 | | | $ | 144 | |
| Granted | 1.0 | | | 222 | |
| Distributed | (1.4) | | | 133 | |
| Forfeited | (0.1) | | | 178 | |
| Outstanding at year-end 2024 | 2.6 | | | $ | 178 | |
Other Information
At year-end 2024, we had approximately 11 million remaining shares authorized for grant under the 2023 Marriott International, Inc. Stock and Cash Incentive Plan.
NOTE 6. INCOME TAXES
The components of our earnings before income taxes for the last three fiscal years consisted of:
| | | | | | | | | | | | | | | | | |
| (in millions) | 2024 | | 2023 | | 2022 |
| U.S. | $ | 1,717 | | | $ | 2,113 | | | $ | 2,268 | |
| Non-U.S. | 1,434 | | | 1,265 | | | 846 | |
| $ | 3,151 | | | $ | 3,378 | | | $ | 3,114 | |
Our (provision) benefit for income taxes for the last three fiscal years consisted of:
| | | | | | | | | | | | | | | | | | | | |
| (in millions) | 2024 | | 2023 | | 2022 |
| Current | -U.S. Federal | $ | (447) | | | $ | (431) | | | $ | (364) | |
| -U.S. State | (124) | | | (158) | | | (82) | |
| -Non-U.S. | (282) | | | (249) | | | (155) | |
| | (853) | | | (838) | | | (601) | |
| | | | | | |
| Deferred | -U.S. Federal | 125 | | | 94 | | | (129) | |
| -U.S. State | 19 | | | 16 | | | (25) | |
| -Non-U.S. | (67) | | | 433 | | | (1) | |
| | 77 | | | 543 | | | (155) | |
| | $ | (776) | | | $ | (295) | | | $ | (756) | |
Unrecognized Tax Benefits
The following table reconciles our unrecognized tax benefit balance for each year from the beginning of 2022 to the end of 2024:
| | | | | |
| (in millions) | Amount |
| Unrecognized tax benefit at beginning of 2022 | $ | 282 | |
| |
| Change attributable to tax positions taken in prior years | (15) | |
| Change attributable to tax positions taken during the current period | 3 | |
| Decrease attributable to settlements with taxing authorities | (15) | |
| |
| Unrecognized tax benefit at year-end 2022 | 255 | |
| Change attributable to tax positions taken in prior years | (90) | |
| Change attributable to tax positions taken during the current period | 16 | |
| Decrease attributable to settlements with taxing authorities | (9) | |
| |
| Unrecognized tax benefit at year-end 2023 | 172 | |
| Change attributable to tax positions taken in prior years | (4) | |
| Change attributable to tax positions taken during the current period | 17 | |
| Decrease attributable to settlements with taxing authorities | (2) | |
| |
| Unrecognized tax benefit at year-end 2024 | $ | 183 | |
Our unrecognized tax benefit balance included $171 million at year-end 2024, $161 million at year-end 2023, and $241 million at year-end 2022 of tax positions that, if recognized, would impact our effective tax rate. It is reasonably possible that within the next 12 months we will reach resolution of income tax examinations in one or more jurisdictions. The actual amount of any change to our unrecognized tax benefits could vary depending on the timing and nature of the settlement. Therefore, an estimate of the change cannot be provided. We recognize accrued interest and penalties for our unrecognized tax benefits as a component of tax expenses. Related interest expense totaled $14 million in 2024, $6 million in 2023, and $13 million in 2022. We accrued interest and penalties related to our unrecognized tax benefits of approximately $63 million at year-end 2024 and $52 million at year-end 2023.
We file income tax returns, including returns for our subsidiaries, in various jurisdictions around the world. The U.S. Internal Revenue Service has examined our federal income tax returns, and as of year-end 2024, we have settled all issues for
tax years through 2022. Our 2023 and 2024 tax year audits are currently ongoing. Various foreign, state, and local income tax returns are also under examination by the applicable taxing authorities.
Deferred Income Taxes
Deferred income tax balances reflect the effects of temporary differences between the carrying amounts of assets and liabilities and their tax bases, as well as from net operating loss and tax credit carry-forwards. We state those balances at the enacted tax rates we expect will be in effect when we pay or recover the taxes. Deferred income tax assets represent amounts available to reduce income taxes we will pay on taxable income in future years. We evaluate our ability to realize these future tax deductions and credits by assessing whether we expect to have sufficient future taxable income from all sources, including reversal of taxable temporary differences, forecasted operating earnings, and available tax planning strategies to utilize these future deductions and credits. We establish a valuation allowance when we no longer consider it more likely than not that a deferred tax asset will be realized.
The following table presents the tax effect of each type of temporary difference and carry-forward that gave rise to significant portions of our deferred tax assets and liabilities as of year-end 2024 and year-end 2023:
| | | | | | | | | | | |
| (in millions) | At Year-End 2024 | | At Year-End 2023 |
| Deferred Tax Assets | | | |
| Employee benefits | $ | 302 | | | $ | 265 | |
| Net operating loss carry-forwards | 1,046 | | | 1,132 | |
| Accrued expenses and other reserves | 153 | | | 219 | |
| | | |
| Tax credits | 62 | | | 64 | |
| Loyalty Program | 313 | | | 277 | |
| Deferred income | 114 | | | 102 | |
| Lease liabilities | 239 | | | 266 | |
| Interest limitation | 123 | | | 67 | |
| Property and equipment | 15 | | | — | |
| Other | 36 | | | 40 | |
| Deferred tax assets | 2,403 | | | 2,432 | |
| Valuation allowance | (1,070) | | | (1,149) | |
| Deferred tax assets after valuation allowance | 1,333 | | | 1,283 | |
| Deferred Tax Liabilities | | | |
| | | |
| Property and equipment | — | | | (62) | |
| Intangibles | (477) | | | (471) | |
| Right-of-use assets | (223) | | | (248) | |
| Self-insurance | (6) | | | (22) | |
| Other | (58) | | | (16) | |
| Deferred tax liabilities | (764) | | | (819) | |
| Net deferred taxes | $ | 569 | | | $ | 464 | |
Our valuation allowance is primarily attributable to non-U.S. net operating loss carry-forwards.
At year-end 2024, we had approximately $50 million of tax credits that will expire through 2034 and $12 million of tax credits that do not expire. We recorded $22 million of net operating loss benefits in 2024 and $25 million in 2023. At year-end 2024, we had approximately $4,611 million of primarily state and foreign net operating losses, of which $2,963 million will expire through 2044.
We made no provision for U.S. income taxes or additional non-U.S. taxes on certain undistributed earnings of non-U.S. subsidiaries. These earnings could become subject to additional taxes if the non-U.S. subsidiaries dividend or loan those earnings to an affiliate or if we sell our interests in the non-U.S. subsidiaries. We cannot practically estimate the amount of additional taxes that might be payable on the undistributed earnings.
Reconciliation of U.S. Federal Statutory Income Tax Rate to Actual Income Tax Rate
The following table reconciles the U.S. statutory tax rate to our effective income tax rate for the last three fiscal years:
| | | | | | | | | | | | | | | | | |
| 2024 | | 2023 | | 2022 |
| U.S. statutory tax rate | 21.0 | % | | 21.0 | % | | 21.0 | % |
| U.S. state income taxes, net of U.S. federal tax benefit | 2.4 | | | 2.8 | | | 2.8 | |
| Non-U.S. income | 1.6 | | | 0.3 | | | (0.5) | |
| Change in valuation allowance | (0.9) | | | (5.8) | | | 0.4 | |
| Change in uncertain tax positions | 0.4 | | | (2.3) | | | 0.3 | |
| | | | | |
| | | | | |
| | | | | |
| | | | | |
| Excess tax benefits related to equity awards | (1.0) | | | (0.8) | | | (0.7) | |
| U.S. tax on foreign earnings | 1.0 | | | 1.1 | | | 0.2 | |
| Intellectual property restructuring | 0.0 | | | (7.9) | | | 0.0 | |
| Other, net | 0.1 | | | 0.3 | | | 0.8 | |
| Effective rate | 24.6 | % | | 8.7 | % | | 24.3 | % |
Other Information
We paid cash for income taxes, net of refunds, of $947 million in 2024, $907 million in 2023, and $476 million in 2022.
NOTE 7. COMMITMENTS AND CONTINGENCIES
Guarantees
We issue guarantees to certain lenders and hotel owners, chiefly to obtain long-term management and franchise contracts. The guarantees generally have a stated maximum funding amount and a term of three to 10 years. The terms of guarantees to lenders generally require us to fund if cash flows from hotel operations are inadequate to cover annual debt service or to repay the loan at maturity. The terms of the guarantees to hotel owners generally require us to fund if the hotels do not attain specified levels of operating profit. Guarantee fundings to lenders and hotel owners are generally recoverable out of future hotel cash flows and/or proceeds from the sale or refinancing of hotels.
We present the maximum potential amount of our future guarantee fundings and the carrying amount of our liability for our debt service, operating profit, and other guarantees for which we are the primary obligor at year-end 2024 in the following table:
| | | | | | | | | | | | | | |
(in millions) Guarantee Type | | Maximum Potential
Amount
of Future Fundings | | Recorded Liability for
Guarantees |
| Debt service | | $ | 62 | | | $ | 6 | |
| Operating profit | | 140 | | | 89 | |
| Other | | 18 | | | 4 | |
| | $ | 220 | | | $ | 99 | |
Our liability at year-end 2024 for guarantees for which we are the primary obligor is reflected in our Balance Sheets as $14 million of “Accrued expenses and other” and $85 million of “Other noncurrent liabilities.”
Our maximum potential guarantees listed in the preceding table include $59 million of operating profit guarantees that will not be in effect until the underlying properties open and we begin to operate the properties or certain other events occur.
In conjunction with financing obtained for specific projects or properties owned by us or entities in which we have an investment, we may provide industry standard indemnifications to the lender for loss, liability, or damage occurring as a result of the actions of the entity or our own actions.
Letters of Credit
At year-end 2024, we had $130 million of letters of credit outstanding (all outside the Credit Facility, as defined in Note 9), most of which were for our self-insurance programs. Surety bonds issued as of year-end 2024 totaled $185 million, most of which state governments requested in connection with our self-insurance programs.
Starwood Data Security Incident
Description of Event
On November 30, 2018, we announced a data security incident involving unauthorized access to the Starwood Hotels & Resorts Worldwide, LLC, formerly known as Starwood Hotels & Resorts Worldwide, Inc. (“Starwood”), reservations database (the “Data Security Incident”). Working with leading security experts, we determined that there was unauthorized access to the Starwood network since 2014 and that an unauthorized party had copied information from the Starwood reservations database and taken steps towards removing it. We discontinued use of the Starwood reservations database for business operations at the end of 2018.
Litigation, Claims, and Government Investigations
Following our announcement of the Data Security Incident, approximately 100 lawsuits were filed by consumers and others against us in U.S. federal, U.S. state and Canadian courts related to the incident. The plaintiffs in the cases that remain pending, who generally purport to represent various classes of consumers, generally claim to have been harmed by alleged actions and/or omissions by the Company in connection with the Data Security Incident and assert a variety of common law and statutory claims seeking monetary damages, injunctive relief, costs and attorneys’ fees, and other related relief. The active U.S. cases are consolidated in the U.S. District Court for the District of Maryland (the “District Court”), pursuant to orders of the U.S. Judicial Panel on Multidistrict Litigation (the “MDL”). The District Court granted in part and denied in part class certification of various U.S. groups of consumers. In August 2023, the U.S. Court of Appeals for the Fourth Circuit (the “Fourth Circuit”) vacated the District Court’s class certification decision because the District Court failed to first consider the effect of a class-action waiver signed by all putative class members. On remand, after briefing, the District Court issued an order reinstating the same classes that had previously been certified. We promptly petitioned the Fourth Circuit, seeking leave to appeal that ruling. The Fourth Circuit granted that petition on January 18, 2024, oral argument was held on November 1, 2024, and we await a decision. A case brought by the City of Chicago (which is consolidated in the MDL proceeding) also remains pending. The Canadian cases have effectively been consolidated into a single case in the province of Ontario. We dispute the allegations in these lawsuits and are vigorously defending against such claims.
In addition, various U.S. federal, U.S. state and foreign governmental authorities made inquiries, opened investigations, or requested information and/or documents related to the Data Security Incident and related matters. Most of these matters have been resolved or no longer appear to be active. In the 2024 fourth quarter, we reached final resolutions with the U.S. Federal Trade Commission and the Attorney General offices from 49 U.S. states and the District of Columbia (the “AG Offices”). Among other terms, the resolution with the AG Offices included a $52 million monetary payment, the majority of which we paid in the 2024 fourth quarter, and which is not material to our Financial Statements. We do not expect the terms of these resolutions to have a material impact on our current or ongoing operations.
While we believe it is reasonably possible that we may incur losses in excess of the amounts recorded associated with the above described MDL proceedings and unresolved regulatory investigations related to the Data Security Incident, it is not possible to reasonably estimate the amount of such losses or range of loss in excess of the amounts recorded that might result from adverse judgments, settlements, fines, penalties or other resolution of these proceedings and investigations based on: (1) in the case of the above described MDL proceedings, the current stage of these proceedings, the absence of specificity as to alleged damages, the uncertainty as to the certification of a class or classes and the size of any certified class, and the lack of resolution of significant factual and legal issues, and (2) uncertainty regarding unresolved inquiries, investigations, or requests for information and/or documents.
Other Legal Proceedings
During 2024, we recorded certain expenses related to settled and ongoing claims brought against the Company regarding the use of copyrighted music. These amounts are not material to our Financial Statements. While we believe it is reasonably possible that we may incur losses in excess of the amounts already recorded for the unresolved claims, we are currently unable to reasonably estimate the amount of losses or range of loss in excess of the amounts recorded. At this time, we do not expect these claims or resolutions to have a material impact on the Company’s financial position or operations.
NOTE 8. LEASES
We enter into operating and finance leases primarily for hotels, offices, and equipment. Most leases have initial terms of up to 20 years, and contain one or more renewals at our option, generally for five- or 10-year periods. We have generally not included these renewal periods in the lease term as it is not reasonably certain that we will exercise the renewal option.
The following table details the composition of lease expense and supplemental cash flow information for 2024, 2023, and 2022:
| | | | | | | | | | | | | | | | | | | | |
| (in millions) | | 2024 | | 2023 | | 2022 |
Operating lease cost | | $ | 143 | | | $ | 155 | | | $ | 165 | |
| Variable lease cost | | 122 | | | 128 | | | 90 | |
| Operating cash outflows for operating leases | | 154 | | | 240 | | | 191 | |
The following table presents our future minimum lease payments at year-end 2024:
| | | | | | | | | | | |
| (in millions) | Operating Leases | | Finance Leases |
| 2025 | $ | 145 | | $ | 14 |
| 2026 | 124 | | 15 |
| 2027 | 87 | | 15 |
| 2028 | 82 | | 16 |
| 2029 | 80 | | 16 |
| Thereafter | 644 | | 76 |
| Total minimum lease payments | $ | 1,162 | | $ | 152 |
| Less: Amount representing interest | 264 | | 28 |
| Present value of minimum lease payments | $ | 898 | | $ | 124 |
| | | |
| | | |
| | | |
| | | |
| | | |
| | | |
| | | |
| | | |
The following table presents the composition of our current and noncurrent lease liability at year-end 2024 and 2023:
| | | | | | | | | | | | | | | | | | | | | | | |
| (in millions) | December 31, 2024 | | December 31, 2023 |
| Operating Leases | | Finance Leases | | Operating Leases | | Finance Leases |
Current (1) | $ | 104 | | | $ | 9 | | | $ | 105 | | | $ | 8 | |
Noncurrent (2) | 794 | | | 115 | | | 887 | | | 123 | |
| $ | 898 | | | $ | 124 | | | $ | 992 | | | $ | 131 | |
(1)Operating leases are recorded in the “Accrued expenses and other” and finance leases are recorded in the “Current portion of long-term debt” captions of our Balance Sheets.
(2)Operating leases are recorded in the “Operating lease liabilities” and finance leases are recorded in the “Long-term debt” captions of our Balance Sheets.
The following table presents additional information about our lease obligations at year-end 2024 and 2023:
| | | | | | | | | | | | | | | | | | | | | | | | | | |
| | 2024 | | 2023 |
| | Operating Leases | | Finance Leases | | Operating Leases | | Finance Leases |
| | | | | | | | |
| Weighted Average Remaining Lease Term (in years) | | 13 | | 9 | | 13 | | 10 |
| Weighted Average Discount Rate | | 4.3 | % | | 4.4 | % | | 4.3 | % | | 4.4 | % |
NOTE 9. LONG-TERM DEBT
We provide detail on our long-term debt balances, net of discounts, premiums, and debt issuance costs, in the following table at year-end 2024 and 2023:
| | | | | | | | | | | |
| (in millions) | At Year-End 2024 | | At Year-End 2023 |
| Senior Notes: | | | |
Series P Notes, interest rate of 3.8%, face amount of $350, maturing October 1, 2025 (effective interest rate of 4.0%) | $ | 349 | | | $ | 349 | |
Series R Notes, interest rate of 3.1%, face amount of $750, maturing June 15, 2026 (effective interest rate of 3.3%) | 749 | | | 748 | |
Series V Notes, interest rate of 3.8%, face amount of $318, maturing March 15, 2025 (effective interest rate of 2.8%) | 319 | | | 321 | |
Series W Notes, interest rate of 4.5%, face amount of $278, maturing October 1, 2034 (effective interest rate of 4.1%) | 287 | | | 288 | |
Series X Notes, interest rate of 4.0%, face amount of $450, maturing April 15, 2028 (effective interest rate of 4.2%) | 447 | | | 447 | |
Series AA Notes, interest rate of 4.7%, face amount of $300, maturing December 1, 2028 (effective interest rate of 4.8%) | 298 | | | 298 | |
Series CC Notes, interest rate of 3.6%, face amount of $550, matured April 15, 2024 (effective interest rate of 3.9%) | — | | | 545 | |
Series EE Notes, interest rate of 5.8%, face amount of $600, maturing May 1, 2025 (effective interest rate of 6.0%) | 599 | | | 598 | |
Series FF Notes, interest rate of 4.6%, face amount of $1,000, maturing June 15, 2030 (effective interest rate of 4.8%) | 991 | | | 990 | |
Series GG Notes, interest rate of 3.5%, face amount of $1,000, maturing October 15, 2032 (effective interest rate of 3.7%) | 989 | | | 988 | |
Series HH Notes, interest rate of 2.9%, face amount of $1,100, maturing April 15, 2031 (effective interest rate of 3.0%) | 1,093 | | | 1,091 | |
Series II Notes, interest rate of 2.8%, face amount of $700, maturing October 15, 2033 (effective interest rate of 2.8%) | 695 | | | 694 | |
Series JJ Notes, interest rate of 5.0%, face amount of $1,000, maturing October 15, 2027 (effective interest rate of 5.4%) | 990 | | | 987 | |
Series KK Notes, interest rate of 4.9%, face amount of $800, maturing April 15, 2029 (effective interest rate of 5.3%) | 788 | | | 785 | |
Series LL Notes, interest rate of 5.5%, face amount of $450, maturing September 15, 2026 (effective interest rate of 5.9%) | 447 | | | 445 | |
Series MM Notes, interest rate of 5.6%, face amount of $700, maturing October 15, 2028 (effective interest rate of 5.9%) | 693 | | | 691 | |
Series NN Notes, interest rate of 4.9%, face amount of $500, maturing May 15, 2029 (effective interest rate of 5.3%) | 491 | | | — | |
Series OO Notes, interest rate of 5.3%, face amount of $1,000, maturing May 15, 2034 (effective interest rate of 5.6%) | 980 | | | — | |
Series PP Notes, interest rate of 4.8%, face amount of $500, maturing March 15, 2030 (effective interest rate of 5.0%) | 495 | | | — | |
Series QQ Notes, interest rate of 5.4%, face amount of $1,000, maturing March 15, 2035 (effective interest rate of 5.5%) | 986 | | | — | |
| Commercial paper | 1,582 | | | 1,421 | |
| Credit Facility | — | | | — | |
| Finance lease obligations | 124 | | | 131 | |
| Other | 55 | | | 56 | |
| $ | 14,447 | | | $ | 11,873 | |
| Less current portion | (1,309) | | | (553) | |
| $ | 13,138 | | | $ | 11,320 | |
All our long-term debt is recourse to us but unsecured. All the Senior Notes shown in the table above are our unsecured and unsubordinated obligations, which rank equally with our other Senior Notes and all other unsecured and unsubordinated indebtedness that we have issued or will issue from time to time, and are governed by the terms of an indenture, dated as of November 16, 1998, between us and The Bank of New York Mellon (formerly The Bank of New York), as trustee. We may redeem some or all of each series of the Senior Notes before maturity under the terms provided in the applicable form of Senior Note.
In August 2024, we issued $500 million aggregate principal amount of 4.800 percent Series PP Notes due March 15, 2030 (the “Series PP Notes”) and $1.0 billion aggregate principal amount of 5.350 percent Series QQ Notes due March 15, 2035 (the “Series QQ Notes”). We will pay interest on the Series PP Notes and Series QQ Notes in March and September of each year, commencing in March 2025. Net proceeds from the offering of the Series PP Notes and Series QQ Notes were approximately $1.480 billion, after deducting the underwriting discount and expenses, and were made available for general corporate purposes, including working capital, capital expenditures, acquisitions, stock repurchases, or repayment of outstanding indebtedness.
In February 2024, we issued $500 million aggregate principal amount of 4.875 percent Series NN Notes due May 15, 2029 (the “Series NN Notes”) and $1.0 billion aggregate principal amount of 5.300 percent Series OO Notes due May 15, 2034 (the “Series OO Notes”). We pay interest on the Series NN Notes and Series OO Notes in May and November of each year. Net proceeds from the offering of the Series NN Notes and Series OO Notes were approximately $1.468 billion, after deducting the underwriting discount and expenses, and were made available for general corporate purposes, including working capital, capital expenditures, acquisitions, stock repurchases, or repayment of outstanding indebtedness.
We are party to a $4.5 billion multicurrency revolving credit agreement (as amended, the “Credit Facility”). Available borrowings under the Credit Facility support our commercial paper program and general corporate needs. U.S. dollar borrowings under the Credit Facility bear interest at SOFR (the Secured Overnight Financing Rate) plus a spread based on our public debt rating. We also pay quarterly fees on the Credit Facility at a rate based on our public debt rating. We classify outstanding borrowings under the Credit Facility and outstanding commercial paper borrowings (which generally have short-term maturities of 45 days or less) as long-term based on our ability and intent to refinance the outstanding borrowings on a long-term basis. The Credit Facility expires on December 14, 2027.
The following table presents future principal payments, net of discounts, premiums, and debt issuance costs, for our debt at year-end 2024:
| | | | | |
| (in millions) | Debt Principal Payments |
| 2025 | $ | 1,309 | |
| 2026 | 1,205 | |
| 2027 | 2,583 | |
| 2028 | 1,450 | |
| 2029 | 1,292 | |
| Thereafter | 6,608 | |
| Balance at year-end 2024 | $ | 14,447 | |
We paid cash for interest, net of amounts capitalized, of $599 million in 2024, $476 million in 2023, and $345 million in 2022.
NOTE 10. INTANGIBLE ASSETS AND GOODWILL
The following table details the composition of our intangible assets at year-end 2024 and 2023:
| | | | | | | | | | | |
| (in millions) | At Year-End 2024 | | At Year-End 2023 |
| Definite-lived Intangible Assets | | | |
| Costs incurred to obtain contracts with customers | $ | 2,538 | | | $ | 2,185 | |
Acquired contracts and other | 1,918 | | | 1,911 | |
| Software | 792 | | | 576 | |
| 5,248 | | | 4,672 | |
| Accumulated amortization | (1,471) | | | (1,328) | |
| 3,777 | | | 3,344 | |
| Indefinite-lived Intangible Brand Assets | 5,711 | | | 5,846 | |
| $ | 9,488 | | | $ | 9,190 | |
We capitalize direct costs that we incur to obtain contracts with customers, which we amortize on a straight-line basis over the initial term of the agreements, generally ranging from 15 to 30 years.
For contracts acquired in business combinations and asset acquisitions, we record a definite-lived intangible asset at the acquisition date, which is amortized on a straight-line basis over the remaining life of the contract. We capitalize costs incurred to develop internal-use software and acquire software licenses and begin amortizing these costs when the software is substantially ready for its intended use on a straight-line basis over its estimated useful life, generally ranging from two to seven years. For acquired contracts, software, and other intangible assets, we recorded amortization expense of $255 million in 2024, $226 million in 2023, and $197 million in 2022 (of which $158 million in 2024, $122 million in 2023, and $83 million in 2022 was included in the “Reimbursed expenses” caption of our Income Statements). For these assets, we estimate that our aggregate amortization expense will be $241 million in 2025, $205 million in 2026, $175 million in 2027, $138 million in 2028, and $102 million in 2029.
The following table details the carrying amount of our goodwill at year-end 2024 and 2023:
| | | | | | | | | | | | | | | | | | | | | | | | | | | | | | | | | | | |
| (in millions) | U.S. & Canada | | EMEA | | Greater China | | APEC | | CALA | | Total Goodwill |
| | | | | | | | | | | |
| | | | | | | | | | | |
| Balance at year-end 2023 | $ | 5,333 | | | $ | 1,467 | | | $ | 999 | | | $ | 763 | | | $ | 324 | | | $ | 8,886 | |
| | | | | | | | | | | |
| | | | | | | | | | | |
| | | | | | | | | | | |
| Foreign currency translation | (32) | | | (50) | | | (20) | | | (32) | | | (21) | | | (155) | |
| | | | | | | | | | | |
| | | | | | | | | | | |
| | | | | | | | | | | |
| | | | | | | | | | | |
| Balance at year-end 2024 | $ | 5,301 | | | $ | 1,417 | | | $ | 979 | | | $ | 731 | | | $ | 303 | | | $ | 8,731 | |
NOTE 11. PROPERTY AND EQUIPMENT
The following table presents the composition of our property and equipment balances at year-end 2024 and 2023:
| | | | | | | | | | | |
| (in millions) | At Year-End 2024 | | At Year-End 2023 |
| Land | $ | 768 | | | $ | 669 | |
| Buildings and leasehold improvements | 1,238 | | | 1,108 | |
| Furniture and equipment | 619 | | | 622 | |
| Construction in progress | 89 | | | 72 | |
| 2,714 | | | 2,471 | |
| Accumulated depreciation | (881) | | | (890) | |
| $ | 1,833 | | | $ | 1,581 | |
We record property and equipment at cost, including interest and real estate taxes we incur during development and construction. We capitalize the cost of improvements that extend the useful life of property and equipment when we incur them. These capitalized costs may include structural costs, equipment, fixtures, floor, and wall coverings. We expense all repair and maintenance costs when we incur them. We compute depreciation using the straight-line method over the estimated useful lives of the assets (generally three to 40 years), and we amortize leasehold improvements over the shorter of the asset life or lease term. Our gross depreciation expense totaled $128 million in 2024, $122 million in 2023, and $114 million in 2022 (of which $42 million in 2024, $37 million in 2023, and $35 million in 2022 was included in the “Reimbursed expenses” caption of our Income Statements). Fixed assets attributed to operations located outside the U.S. were $554 million at year-end 2024 and $552 million at year-end 2023.
NOTE 12. FAIR VALUE OF FINANCIAL INSTRUMENTS
We believe that the fair values of our current assets and current liabilities approximate their reported carrying amounts. We present the carrying amounts and the fair values of noncurrent financial assets and liabilities that qualify as financial instruments in the following table:
| | | | | | | | | | | | | | | | | | | | | | | |
| | At Year-End 2024 | | At Year-End 2023 |
| (in millions) | Carrying
Amount | | Fair Value | | Carrying
Amount | | Fair Value |
| Notes receivable | $ | 136 | | | $ | 133 | | | $ | 138 | | | $ | 131 | |
| Total noncurrent financial assets | $ | 136 | | | $ | 133 | | | $ | 138 | | | $ | 131 | |
| | | | | | | |
| Senior Notes | $ | (11,419) | | | $ | (11,083) | | | $ | (9,720) | | | $ | (9,393) | |
| Commercial paper | (1,582) | | | (1,582) | | | (1,421) | | | (1,421) | |
| | | | | | | |
| | | | | | | |
| Total noncurrent financial liabilities | $ | (13,001) | | | $ | (12,665) | | | $ | (11,141) | | | $ | (10,814) | |
Our notes receivable include mezzanine and other loans to hotel owners, generally to facilitate the development or renovation of a hotel and sometimes to facilitate brand programs or initiatives. We estimate the fair value of our notes receivable by discounting cash flows using risk-adjusted rates, both of which are Level 3 inputs.
We determine the fair value of our Senior Notes using quoted market prices, which are directly observable Level 1 inputs. The carrying amount of our commercial paper borrowings approximate fair value due to their short maturity and because they bear interest at a market rate.
See the “Fair Value Measurements” caption of Note 2 for more information on the input levels we use in determining fair value.
NOTE 13. ACCUMULATED OTHER COMPREHENSIVE LOSS
The following table details the accumulated other comprehensive loss activity for 2024, 2023, and 2022:
| | | | | | | | | | | | | | | | | |
| (in millions) | Foreign Currency Translation Adjustments | | Other Adjustments | | Accumulated Other Comprehensive Loss |
| Balance at year-end 2021 | $ | (351) | | | $ | 9 | | | $ | (342) | |
Other comprehensive (loss) income before reclassifications (1) | (390) | | | 11 | | | (379) | |
| Reclassification adjustments | 1 | | | (9) | | | (8) | |
| Net other comprehensive (loss) income | (389) | | | 2 | | | (387) | |
| Balance at year-end 2022 | $ | (740) | | | $ | 11 | | | $ | (729) | |
Other comprehensive income (loss) before reclassifications (1) | 89 | | | (4) | | | 85 | |
| Reclassification adjustments | (3) | | | — | | | (3) | |
| Net other comprehensive income (loss) | 86 | | | (4) | | | 82 | |
| Balance at year-end 2023 | $ | (654) | | | $ | 7 | | | $ | (647) | |
Other comprehensive income (loss) before reclassifications (1) | (437) | | | 25 | | | (412) | |
| Reclassification adjustments | — | | | (4) | | | (4) | |
| Net other comprehensive income (loss) | (437) | | | 21 | | | (416) | |
| Balance at year-end 2024 | $ | (1,091) | | | $ | 28 | | | $ | (1,063) | |
(1)Other comprehensive income (loss) before reclassifications for foreign currency translation adjustments includes intra-entity foreign currency transactions that are of a long-term investment nature, which resulted in gains (losses) of $30 million for 2024, $(28) million for 2023, and $32 million for 2022.
NOTE 14. BUSINESS SEGMENTS
Beginning in the 2024 first quarter, we modified our segment structure as a result of a change in the way our “chief operating decision maker” (“CODM”) evaluates performance and allocates resources within the Company, resulting in the following four reportable business segments: (1) U.S. & Canada, (2) Europe, Middle East & Africa (“EMEA”), (3) Greater China, and (4) Asia Pacific excluding China (“APEC”). Our Caribbean & Latin America (“CALA”) operating segment does not meet the applicable accounting criteria for separate disclosure as a reportable business segment, and as such, we include its results in “Unallocated corporate and other.” We revised the prior period amounts shown in the tables below to conform to our current presentation.
Our President and Chief Executive Officer, who is our CODM, evaluates the performance of our operating segments using “segment profits,” which is based largely on the results of the segment without allocating corporate expenses, income taxes, indirect general, administrative, and other expenses, or restructuring and merger-related charges. We assign gains and losses, equity in earnings or losses, and direct general, administrative, and other expenses to each of our segments. “Unallocated corporate and other” includes a portion of our revenues (such as fees we receive from our credit card programs and timeshare licensing agreements), revenues and expenses for our Loyalty Program, general, administrative, and other expenses, restructuring and merger-related charges, equity in earnings or losses, and other gains or losses that we do not allocate to our segments, as well as results of our CALA operating segment.
Our CODM uses segment profits to allocate resources (including employees and investment spending) to each segment, primarily as part of the annual budget process. Our CODM reviews budget-to-actual variances on a quarterly basis to assess segment performance. Additionally, our CODM uses segment profits to compare the results of each segment with one another and in the determination of compensation for segment leadership.
Our CODM monitors assets for the consolidated Company but does not use assets by operating segment when assessing performance or making operating segment resource allocations.
Segment Revenues, Expenses, and Profits
The following tables present our revenues (disaggregated by segment and major revenue stream), segment expenses, and segment profits for each of the last three fiscal years:
| | | | | | | | | | | | | | |
| 2024 |
| (in millions) | U.S. & Canada | EMEA | Greater China | APEC |
| Gross fee revenues | $ | 2,951 | | $ | 589 | | $ | 250 | | $ | 345 | |
| Contract investment amortization | (76) | | (14) | | (1) | | (5) | |
| Net fee revenues | 2,875 | | 575 | | 249 | | 340 | |
| Owned, leased, and other revenue | 437 | | 595 | | 27 | | 141 | |
| Cost reimbursement revenue | 15,300 | | 1,236 | | 306 | | 495 | |
| Total reportable segment revenue | 18,612 | | 2,406 | | 582 | | 976 | |
| Less: | | | | |
| Owned, leased, and other - direct | 330 | | 499 | | 14 | | 118 | |
| Depreciation, amortization, and other | 84 | | 38 | | 9 | | 8 | |
| General, administrative, and other | 182 | | 110 | | 55 | | 64 | |
| Reimbursed expenses | 15,381 | | 1,252 | | 319 | | 510 | |
| Other segment items (primarily non-operating income and expenses) | (5) | | (5) | | (1) | | (4) | |
| Total reportable segment profit | $ | 2,640 | | $ | 512 | | $ | 186 | | $ | 280 | |
| | | | | | | | | | | | | | |
| 2023 |
| (in millions) | U.S. & Canada | EMEA | Greater China | APEC |
| Gross fee revenues | $ | 2,799 | | $ | 529 | | $ | 265 | | $ | 288 | |
| Contract investment amortization | (65) | | (13) | | — | | (4) | |
| Net fee revenues | 2,734 | | 516 | | 265 | | 284 | |
| Owned, leased, and other revenue | 506 | | 574 | | 18 | | 135 | |
| Cost reimbursement revenue | 14,456 | | 1,178 | | 317 | | 411 | |
| Total reportable segment revenue | 17,696 | | 2,268 | | 600 | | 830 | |
| Less: | | | | |
| Owned, leased, and other - direct | 340 | | 481 | | 12 | | 116 | |
| Depreciation, amortization, and other | 84 | | 40 | | 10 | | 9 | |
| General, administrative, and other | 154 | | 140 | | 55 | | 61 | |
| Reimbursed expenses | 14,399 | | 1,168 | | 317 | | 409 | |
| Other segment items (primarily non-operating income and expenses) | (5) | | (2) | | (2) | | (8) | |
| Total reportable segment profit | $ | 2,724 | | $ | 441 | | $ | 208 | | $ | 243 | |
| | | | | | | | | | | | | | |
| 2022 |
| (in millions) | U.S. & Canada | EMEA | Greater China | APEC |
| Gross fee revenues | $ | 2,486 | | $ | 455 | | $ | 120 | | $ | 181 | |
| Contract investment amortization | (60) | | (17) | | — | | (3) | |
| Net fee revenues | 2,426 | | 438 | | 120 | | 178 | |
| Owned, leased, and other revenue | 479 | | 481 | | 17 | | 97 | |
| Cost reimbursement revenue | 12,848 | | 1,010 | | 214 | | 289 | |
| Total reportable segment revenue | 15,753 | | 1,929 | | 351 | | 564 | |
| Less: | | | | |
| Owned, leased, and other - direct | 386 | | 369 | | 14 | | 99 | |
| Depreciation, amortization, and other | 81 | | 45 | | 12 | | 9 | |
| General, administrative, and other | 135 | | 103 | | 50 | | 48 | |
| Reimbursed expenses | 12,714 | | 979 | | 210 | | 281 | |
| Other segment items (primarily non-operating income and expenses) | (9) | | (2) | | 3 | | (7) | |
| Total reportable segment profit | $ | 2,446 | | $ | 435 | | $ | 62 | | $ | 134 | |
The following table presents reconciliations of our total reportable segment revenue and profit to consolidated revenue and income before income taxes for each of the last three fiscal years:
| | | | | | | | | | | | | | | | | | |
| (in millions) | 2024 | | 2023 | | 2022 | |
| Reconciliation of revenue | | | | | | |
| Total reportable segment revenue | $ | 22,576 | | | $ | 21,394 | | | $ | 18,597 | | |
| Unallocated corporate and other | 2,524 | | | 2,319 | | | 2,176 | | |
| Consolidated revenue | $ | 25,100 | | | $ | 23,713 | | | $ | 20,773 | | |
| | | | | | |
| Reconciliation of income before income taxes | | | | | | |
| Total reportable segment profit | $ | 3,618 | | | $ | 3,616 | | | $ | 3,077 | | |
| Unallocated corporate and other | 188 | | | 297 | | | 414 | | |
| Interest expense, net of interest income | (655) | | | (535) | | | (377) | | |
| Consolidated income before income taxes | $ | 3,151 | | | $ | 3,378 | | | $ | 3,114 | | |
Revenues attributed to operations located outside the U.S. were $5,512 million in 2024, $5,160 million in 2023, and $4,032 million in 2022, including cost reimbursement revenue outside the U.S. of $3,018 million in 2024, $2,806 million in 2023, and $2,231 million in 2022.
Segment profits attributed to operations located outside the U.S. were $1,329 million in 2024, $1,258 million in 2023, and $898 million in 2022, including cost reimbursements, net (cost reimbursement revenue, net of reimbursed expenses) outside the U.S. of $(55) million in 2024, $23 million in 2023, and $67 million in 2022.
NOTE 15. RELATED PARTY TRANSACTIONS
Equity Method Investments
We have equity method investments in entities that own or lease properties for which we provide management services and receive fees. In addition, in some cases we provide loans, preferred equity, or guarantees to these entities.
The following table presents Income Statement data resulting from transactions with these related parties. This table does not include our Financial Statement captions with insignificant related party activity.
| | | | | | | | | | | | | | | | | |
| (in millions) | 2024 | | 2023 | | 2022 |
| | | | | |
| | | | | |
| | | | | |
| | | | | |
| Cost reimbursement revenue | $ | 131 | | | $ | 122 | | | $ | 104 | |
| | | | | |
| | | | | |
| Reimbursed expenses | (135) | | | (126) | | | (104) | |
| | | | | |
| | | | | |
| | | | | |
| Equity in earnings | 8 | | | 9 | | | 18 | |
The carrying amount of our equity method investments was $298 million at year-end 2024 and $308 million at year-end 2023. This value exceeded our share of the book value of the investees’ net assets by $223 million at year-end 2024 and $231 million at year-end 2023, primarily due to the value that we assigned to land, contracts, and buildings owned by the investees.
Other Related Parties
We earned management fees of approximately $13 million in 2024, $13 million in 2023, and $11 million in 2022, plus reimbursement of certain expenses, from our operation of properties in which JWM Family Enterprises, L.P., which is beneficially owned and controlled by J.W. Marriott, Jr., Deborah Marriott Harrison, David S. Marriott, and other members of the Marriott family, indirectly holds varying percentages of ownership. We earned gross fee revenues of approximately $6 million in 2024, $4 million in 2023, and $4 million in 2022, plus reimbursement of certain expenses, from managed and franchised properties in which other members of the Marriott family hold varying interests.
NOTE 16. RESTRUCTURING CHARGES
In 2024, we launched a comprehensive initiative to enhance our effectiveness and efficiency across the Company.
In connection with these efforts, in 2024, we recorded $68 million of charges for employee termination benefits, of which we present $37 million in the “Restructuring and merger-related charges” caption and $31 million in the “Reimbursed expenses” caption of our Income Statements. We substantially completed this initiative as of year-end 2024.
The following table presents our restructuring reserve activity during the period:
| | | | | | | | | |
| (in millions) | Employee termination benefits | | | | |
| Balance at December 31, 2023 | $ | — | | | | | |
| Charges | 68 | | | | | |
| Cash payments | (8) | | | | | |
| Other | (4) | | | | | |
| Balance at December 31, 2024, classified in “Accrued expenses and other” | $ | 56 | | | | | |
Item 9. Changes in and Disagreements with Accountants on Accounting and Financial Disclosure.
None.
Item 9A. Controls and Procedures.
Disclosure Controls and Procedures
We evaluated the effectiveness of our disclosure controls and procedures (as such term is defined in Rules 13a-15(e) and 15d-15(e) under the Securities Exchange Act of 1934 (the “Exchange Act”)) as of the end of the period covered by this annual report under the supervision and with the participation of our management, including our Chief Executive Officer and Chief Financial Officer. Management necessarily applied its judgment in assessing the costs and benefits of those controls and procedures, which by their nature, can provide only reasonable assurance about management’s control objectives. You should note that the design of any system of controls is based in part upon certain assumptions about the likelihood of future events, and we cannot assure you that any design will succeed in achieving its stated goals under all potential future conditions, regardless of how remote. Based upon this evaluation, our Chief Executive Officer and Chief Financial Officer concluded that
our disclosure controls and procedures were effective and operating to provide reasonable assurance that we record, process, summarize, and report the information we are required to disclose in the reports that we file or submit under the Exchange Act within the time periods specified in the rules and forms of the SEC, and to provide reasonable assurance that we accumulate and communicate such information to our management, including our Chief Executive Officer and Chief Financial Officer, as appropriate to allow timely decisions about required disclosure.
Internal Control Over Financial Reporting
We have set forth management’s report on internal control over financial reporting and the attestation report of our independent registered public accounting firm on our internal control over financial reporting in Part II, Item 8 of this Form 10-K, and we incorporate those reports here by reference.
We made no changes in internal control over financial reporting during the 2024 fourth quarter that materially affected, or are reasonably likely to materially affect, our internal control over financial reporting.
Item 9B. Other Information.
During the 2024 fourth quarter, no director or Section 16 officer adopted or terminated any Rule 10b5-1 plans or non-Rule 10b5-1 trading arrangements.
Item 9C. Disclosure Regarding Foreign Jurisdictions that Prevent Inspections.
Not applicable.
PART III
Items 10, 11, 12, 13, 14.
As described below, we incorporate by reference in this Annual Report on Form 10-K certain information appearing in the Proxy Statement that we will furnish to our stockholders for our 2025 Annual Meeting of Stockholders.
| | | | | |
| Item 10. Directors, Executive Officers, and Corporate Governance. | We incorporate this information by reference to “Nominees to our Board of Directors,” “Committees of the Board — Audit Committee,” “Transactions with Related Persons,” “Delinquent Section 16(a) Reports,” “Selection of Director Nominees” and “Insider Trading Policies and Procedures” sections of our Proxy Statement. We have included information regarding our executive officers and our Code of Ethics below. |
| |
| Item 11. Executive Compensation. | We incorporate this information by reference to the “Executive and Director Compensation” and “Compensation Committee Interlocks and Insider Participation” sections of our Proxy Statement. |
| |
| Item 12. Security Ownership of Certain Beneficial Owners and Management and Related Stockholder Matters. | We incorporate this information by reference to the “Securities Authorized for Issuance Under Equity Compensation Plans” and the “Stock Ownership” sections of our Proxy Statement. |
| |
| Item 13. Certain Relationships and Related Transactions, and Director Independence. | We incorporate this information by reference to the “Transactions with Related Persons” and “Director Independence” sections of our Proxy Statement. |
| |
| Item 14. Principal Accountant Fees and Services. | We incorporate this information by reference to the “Independent Registered Public Accounting Firm Fee Disclosure” and the “Pre-Approval of Independent Auditor Fees and Services Policy” sections of our Proxy Statement. |
INFORMATION ABOUT OUR EXECUTIVE OFFICERS
We include below certain information on our executive officers. This information is as of February 1, 2025, except where indicated.
| | | | | | | | | | | | | | |
| Name and Title | | Age | | Business Experience |
Anthony G. (Tony) Capuano President and Chief Executive Officer | | 59 | | | Tony Capuano was appointed Chief Executive Officer (“CEO”) in February 2021 and was additionally designated President in February 2023. Prior to his appointment as CEO, Mr. Capuano was Group President, Global Development, Design and Operations Services, a role he assumed in January 2020. In that role, he was responsible for leading the Company’s global development and design efforts and overseeing the Company’s Global Operations discipline. Mr. Capuano began his Marriott career in 1995 as part of the Market Planning and Feasibility team. Between 1997 and 2005, he led Marriott’s full-service development efforts in the Western U.S. and Canada. From 2005 to 2008, Mr. Capuano served as Senior Vice President of full-service development for North America. In 2008, his responsibilities expanded to include all of U.S. and Canada and the Caribbean and Latin America, and he became Executive Vice President and Global Chief Development Officer in 2009. Mr. Capuano earned his bachelor’s degree in Hotel Administration from Cornell University. He is a member of the Cornell Hotel Society, The Cornell School of Hotel Administration Dean’s Advisory Board, the Business Roundtable, and the American Hotel and Lodging Association’s IREFAC Council. Additionally, Mr. Capuano serves on the Board of Directors of McDonald’s Corporation, The Economic Club of Washington, D.C., and Save Venice, a nonprofit organization dedicated to preserving the artistic heritage of Venice, Italy. |
| | | | |
Satyajit (Satya) Anand President, Europe, Middle East & Africa | | 60 | | | Satya Anand was appointed President, Europe, Middle East & Africa (EMEA) in October 2020, and is responsible for developing and managing Marriott's portfolio in the region. Mr. Anand began his career with Marriott International in 1988 and prior to assuming his role as President, EMEA, he served as Chief Operations Officer, Luxury & Southern Europe and Global Design EMEA from July 2016. Prior to this, Mr. Anand was Marriott’s Chief Financial Officer for Europe for four years and held Area Vice President roles for Western and Central Europe, respectively, as well as various Cluster General Manager, operations and finance positions both on and above property. Mr. Anand holds a bachelor’s degree in Accounting from Bangalore’s MES College of Commerce and completed his Diploma in Hotel and Tourism Management from the Institute of Tourism & Hotel Management in Semmering, Austria. |
| | | | |
Benjamin T. (Ty) Breland
Executive Vice President
and Chief Human Resources Officer | | 49 | | | Ty Breland was appointed Executive Vice President and Chief Human Resources Officer effective October 2021. Prior to that appointment, Mr. Breland served as Global HR Officer for Talent Development & Organizational Capability, a role he assumed in 2016. In that role, Mr. Breland had executive oversight for talent management, including leadership development, organizational capability, and change management. Mr. Breland also oversaw The Ritz-Carlton Leadership Center and served as the senior Human Resources leader for the Company’s Global Development, Design & Operations Services disciplines. Mr. Breland joined Marriott in 2004 as a member of the Company’s Talent Management and Analytics group and held a variety of other senior human resources leadership positions, including Global HR Integration Officer, responsible for the Human Resources integration for Marriott’s merger with Starwood Hotels & Resorts. From 2011 to 2015, Mr. Breland served as Regional Vice President of Human Resources for the Eastern Region of the U.S. Mr. Breland earned his Bachelor of Science in Psychology and Ph.D. in Industrial/Organizational Psychology from Virginia Tech, where he is a board member for the Virginia Tech Hospitality Business School. |
| | | | |
| | | | | | | | | | | | | | |
| Name and Title | | Age | | Business Experience |
William P. (Liam) Brown
Group President, United States and Canada | | 64 | | | Liam Brown was appointed Group President, United States and Canada effective January 2021, and is responsible for developing and managing Marriott's portfolio in the region. Prior to this role, Mr. Brown served as the President and Managing Director of Europe from 2018 to 2019, followed by Group President of Europe, Middle East & Africa in 2020. Mr. Brown joined Marriott in 1989 and served as President for Franchising, Owner Services and Managed by Marriott Select Brands, North America from 2012 to 2018. Other key positions previously held by Mr. Brown include Chief Operations Officer for the Americas for Select Service & Extended Stay Lodging and Owner & Franchise Services, as well as Senior Vice President and Executive Vice President of Development for Marriott’s Select Service & Extended Stay lodging products. Mr. Brown also serves on the Executive Committee of the American Hotel and Lodging Association. He holds a Hotel Diploma and Business Degree from the Dublin Institute of Technology, Trinity College and earned his Master of Business Administration from the Robert H. Smith School of Management at the University of Maryland. |
| | | | |
Felitia O. Lee
Controller and
Chief Accounting Officer | | 63 | | | Felitia Lee was appointed Marriott’s Controller and Chief Accounting Officer and principal accounting officer effective August 2020, with responsibility for the global accounting operations of the Company including oversight of financial reporting and analysis, accounting policy, general accounting, consumer and technology accounting, finance and accounting governance, finance shared services, and financial contract compliance. Ms. Lee joined Marriott in May 2020, supporting the management of the Company’s accounting operations. Prior to joining Marriott, Ms. Lee was the Senior Vice President and Controller for Kohl’s Corporation since 2018, and prior to joining Kohl’s Corporation, Ms. Lee held the title of Vice President and Controller of the Pepsi Beverage Company along with a number of other leadership positions with PepsiCo, Inc. She earned her Bachelor of Science in Accounting from Santa Clara University. She is a Certified Public Accountant and a member of the American Institute of Certified Public Accountants. |
| | | | |
Yibing Mao President, Greater China | | 61 | | | Yibing Mao was appointed President, Greater China in February 2023, and is responsible for developing and managing Marriott's portfolio in the region. Ms. Mao joined Marriott in 1996 and held the title of Senior Vice President & Chief Counsel, Asia Pacific from May 2016 until she stepped down in 2020. From 2021 to February 2023, she was a member of the Board of Directors of Las Vegas Sands Corporation. Ms. Mao received a Bachelor of Laws from Jilin University, Master of Law from Peking University, and a J.D. degree from Duke University School of Law. |
| | | | |
Rajeev (Raj) Menon President, Asia Pacific excluding China | | 56 | | | Rajeev Menon was appointed President, Asia Pacific excluding China (APEC) in October 2019, and is responsible for developing and managing Marriott's portfolio in the region. Prior to being appointed President, APEC, Mr. Menon served as the Chief Operating Officer for APEC from March 2015 through September 2019. Mr. Menon joined Marriott International in April 2001 as the General Manager of Renaissance Mumbai Hotel and Convention Center and Marriott Executive Apartments, Mumbai. Mr. Menon is a Board member of the Singapore Hotel Association, US/ASEAN Business Council, and Singapore Tourism Board. He completed his education including Hotel Management in New Delhi and is also a graduate of the Advanced Management Program (AMP Class 194) at Harvard Business School. |
| | | | |
| | | | | | | | | | | | | | |
| Name and Title | | Age | | Business Experience |
Kathleen K. (Leeny) Oberg Chief Financial Officer and Executive Vice President, Development | | 64 | | | Leeny Oberg was appointed Executive Vice President and Chief Financial Officer effective January 2016 and was additionally designated Executive Vice President, Business Operations in October 2021. In February 2023, Ms. Oberg began leading the Company’s Global Development organization and was appointed Chief Financial Officer and Executive Vice President, Development. Previously, Ms. Oberg was the Chief Financial Officer for The Ritz-Carlton since 2013. Prior to assuming that role, Ms. Oberg served in a range of financial leadership positions with Marriott, including Senior Vice President, Corporate and Development Finance and Senior Vice President, International Project Finance and Asset Management for Europe and the Middle East and Africa. Ms. Oberg first joined Marriott as part of its Investor Relations group in 1999. Ms. Oberg is an active member of the American Hotel and Lodging Association’s IREFAC Council, and she currently serves on the Board of Directors of Adobe Inc. She earned her Bachelor of Science in Commerce, with concentrations in Finance and Management Information Systems, from the University of Virginia, McIntire School of Commerce and received her Master of Business Administration from Stanford University Graduate School of Business. |
| | | | |
Drew L. Pinto Executive Vice President and Chief Revenue & Technology Officer | | 53 | | | Drew Pinto was appointed Executive Vice President and Chief Revenue & Technology Officer in February 2023, and is responsible for leading global sales and support channels, revenue management, digital, and information technology strategy for the Company. Since joining the Company in 2004, Mr. Pinto has held various leadership roles, including Global Officer, Global Sales, Distribution, and Revenue Management from January 2021 to February 2023 and Senior Vice President, Distribution & Revenue Strategy from January 2019 to January 2021. Mr. Pinto earned a Bachelor of Arts degree from Yale University and his Master of Business Administration from the University of Michigan Ross School of Business. |
| | | | |
Rena Hozore Reiss
Executive Vice President and
General Counsel
| | 65 | | | Rena Hozore Reiss was appointed Executive Vice President and General Counsel effective December 2017. Ms. Reiss previously held the position of Executive Vice President, General Counsel and Corporate Secretary at Hyatt Hotels. Prior to her position with Hyatt, Ms. Reiss was an attorney in Marriott’s law department from 2000 to 2010 building her career in roles with increasing responsibility, ultimately holding the position of Senior Vice President and Associate General Counsel in which she led Marriott’s managed development efforts in the Americas region. Ms. Reiss serves on the Board of Directors of the American Hotel and Lodging Association and of Legal Aid DC. She earned her A.B. from Princeton University and her J.D. from Harvard Law School. |
| | | | |
Peggy F. Roe Executive Vice President and Chief Customer Officer | | 53 | | | Peggy Roe was appointed Executive Vice President and Chief Customer Officer in February 2023, and is responsible for overseeing development and execution of all aspects of Marriott’s global consumer strategy. Since joining Marriott in 2003, Ms. Roe has held various leadership roles focused on growth and innovation. From January 2020 to February 2023, she served as Global Officer, Customer Experience, Loyalty, and New Ventures, and from October 2013 to December 2019, she served as Chief Sales and Marketing Officer, Asia Pacific. She co-founded the Marriott Women in Leadership initiative in Asia Pacific in 2014 and is a board member of the Hong Kong chapter of the Asian University for Women. She currently leads Marriott’s Women’s Associate Resource Group. Ms. Roe is a graduate of the University of Michigan and holds a Master of Business Administration from Harvard Business School. |
Code of Ethics and Business Conduct Guide
The Company has long maintained and enforced a Code of Ethics that applies to all Marriott associates, including our Chief Executive Officer, Chief Financial Officer, and Principal Accounting Officer, and to each member of the Board. The Code of Ethics is encompassed in our Business Conduct Guide, which is available in the Investor Relations section of our website (Marriott.com/investor) by clicking on “Governance” and then “Documents & Charters.” We intend to post on that website any future changes or amendments to our Code of Ethics, and any waiver of our Code of Ethics that applies to any of our executive officers or a member of our Board within four business days following the date of the amendment or waiver.
PART IV
Item 15. Exhibits and Financial Statement Schedules.
LIST OF DOCUMENTS FILED AS PART OF THIS REPORT
(1) FINANCIAL STATEMENTS
We include this portion of Item 15 under Part II, Item 8 of this Annual Report on Form 10-K.
(2) FINANCIAL STATEMENT SCHEDULES
We include the financial statement schedule information required by the applicable accounting regulations of the SEC in the notes to our financial statements and incorporate that information in this Item 15 by reference.
(3) EXHIBITS
Any stockholder who wants a copy of the following Exhibits may obtain one from us upon request at a charge that reflects the reproduction cost of such Exhibits. Requests should be made to the Secretary, Marriott International, Inc., 7750 Wisconsin Avenue, Department 52/862, Bethesda, MD 20814.
We have not filed as exhibits certain instruments defining the rights of holders of the long-term debt of Marriott or its subsidiary Starwood Hotels & Resorts Worldwide, LLC, pursuant to Item 601(b)(4)(iii) of Regulation S-K promulgated under the Exchange Act, because the amount of debt authorized and outstanding under each such instrument does not exceed 10 percent of the total assets of the Company’s and its consolidated subsidiaries. The Company agrees to furnish a copy of any such instrument to the SEC upon request.
| | | | | | | | | | | | | | |
| Exhibit No. | | Description | | Incorporation by Reference (where a report is indicated below, that document has been previously filed with the SEC and the applicable exhibit is incorporated by reference thereto) |
| | | | |
| 3.1 | | Restated Certificate of Incorporation. | | |
| | | | |
| 3.2 | | Amended and Restated Bylaws. | | |
| | | | |
| 4.1 | | Form of Common Stock Certificate. | | |
| | | | |
| 4.2 | | Indenture, dated as of November 16, 1998, between the Company and The Bank of New York Mellon, as successor to JPMorgan Chase Bank, N.A., formerly known as The Chase Manhattan Bank. | | |
| | | | |
| 4.3 | | Description of Registrant’s Securities. | | |
| | | | |
| 10.1.1 | | U.S. $4,500,000 Sixth Amended and Restated Credit Agreement dated as of December 14, 2022 with Bank of America, N.A. as administrative agent and certain banks. | | |
| | | | |
| 10.1.2 | | First Amendment, dated as of May 17, 2024 and effective as of June 4, 2024, to the Sixth Amended and Restated Credit Agreement with Bank of America, N.A. as administrative agent, and certain banks, dated as of December 14, 2022. | | |
| | | | |
| 10.2 | | Amended and Restated License, Services and Development Agreement, dated September 20, 2024 and effective as of January 1, 2024, by and among the Company, Marriott Worldwide Corporation, and Marriott Vacations Worldwide Corporation, and the other signatories thereto. | | |
| | | | |
| | | | | | | | | | | | | | |
| Exhibit No. | | Description | | Incorporation by Reference (where a report is indicated below, that document has been previously filed with the SEC and the applicable exhibit is incorporated by reference thereto) |
| 10.3.1 | | License, Services and Development Agreement entered into on November 17, 2011, among The Ritz-Carlton Hotel Company, L.L.C., Marriott Vacations Worldwide Corporation, and the other signatories thereto. | | |
| | | | |
| 10.3.2 | | First Amendment to License, Services, and Development Agreement for Ritz-Carlton Projects, dated February 26, 2018, among The Ritz-Carlton Hotel Company, L.L.C., Marriott Vacations Worldwide Corporation, and the other signatories thereto. | | |
| | | | |
| 10.4 | | Marriott Bonvoy Affiliation Agreement entered into on November 10, 2021, among the Company, Marriott Rewards, L.L.C., Marriott Vacations Worldwide Corporation and certain of its subsidiaries, Marriott Ownership Resorts, Inc., and the other signatories thereto. | | |
| | | | |
| *10.5.1 | | 2023 Marriott International, Inc. Stock and Cash Incentive Plan. | | |
| | | | |
| *10.5.2 | | United Kingdom Sub-Plan of the 2023 Marriott International, Inc. Stock and Cash Incentive Plan (December 2023). | | |
| | | | |
| *10.6.1 | | Form of Non-Employee Director Deferred Share Award Agreement for the 2023 Marriott International, Inc. Stock and Cash Incentive Plan. | | |
| | | | |
| *10.6.2 | | Form of Non-Employee Director Deferred Fee Award Agreement for the 2023 Marriott International, Inc. Stock and Cash Incentive Plan. | | |
| | | | |
| *10.7 | | Form of Non-Employee Director Stock Appreciation Right Agreement for the 2023 Marriott International, Inc. Stock and Cash Incentive Plan. | | |
| | | | |
| *10.8.1 | | Marriott International, Inc. Stock and Cash Incentive Plan, as amended through February 13, 2014. | | |
| | | | |
| *10.8.2 | | Amendment dated August 7, 2014 to the Marriott International, Inc. Stock and Cash Incentive Plan. | | |
| | | |
| *10.8.3 | | Amendment dated September 23, 2016 to the Marriott International, Inc. Stock and Cash Incentive Plan. | | |
| | | | |
| *10.8.4 | | Amendment dated November 10, 2016 to the Marriott International, Inc. Stock and Cash Incentive Plan. | | |
| | | | |
| *10.8.5 | | Amendment dated May 5, 2017 to the Marriott International, Inc. Stock and Cash Incentive Plan. | | |
| | | | |
| *10.8.6 | | Amendment dated February 15, 2019 to the Marriott International, Inc. Stock and Cash Incentive Plan. | | |
| | | | |
| *10.8.7 | | Amendment dated May 10, 2019 to the Marriott International, Inc. Stock and Cash Incentive Plan. | | |
| | | | |
| *10.8.8 | | Amendment dated May 8, 2020 to the Marriott International, Inc. Stock and Cash Incentive Plan. | | |
| | | | |
| *10.9.1 | | Form of Executive Restricted Stock Unit/MI Shares Agreement for the Marriott International, Inc. Stock and Cash Incentive Plan (February 2021). | | |
| | | | |
| *10.9.2 | | Form of MI Shares Agreement for the Marriott International, Inc. Stock and Cash Incentive Plan (February 2023). | | |
| | | | |
| | | | | | | | | | | | | | |
| Exhibit No. | | Description | | Incorporation by Reference (where a report is indicated below, that document has been previously filed with the SEC and the applicable exhibit is incorporated by reference thereto) |
| *10.9.3 | | Form of Restricted Stock Unit Agreement for the 2023 Marriott International, Inc. Stock and Cash Incentive Plan (February 2024). | | |
| | | | |
| *10.10.1 | | Form of Stock Appreciation Rights Agreement for the Marriott International, Inc. Stock and Cash Incentive Plan (pre-February 2018). | | |
| | | | |
| *10.10.2 | | Form of Stock Appreciation Rights Agreement for the Marriott International, Inc. Stock and Cash Incentive Plan (February 2018). | | |
| | | | |
| *10.10.3 | | Form of Stock Appreciation Rights Agreement for the Marriott International, Inc. Stock and Cash Incentive Plan (March 2019). | | |
| | | | |
| *10.10.4 | | Form of Stock Appreciation Rights Agreement for the Marriott International, Inc. Stock and Cash Incentive Plan (February 2021). | | |
| | | | |
| *10.10.5 | | Form of Stock Appreciation Rights Agreement for the Marriott International, Inc. Stock and Cash Incentive Plan (February 2023). | | |
| | | | |
| *10.10.6 | | Form of Stock Appreciation Rights Agreement for the 2023 Marriott International, Inc. Stock and Cash Incentive Plan (February 2024). | | |
| | | | |
| *10.11.1 | | Form of Performance Share Unit Award Agreement for the Marriott International, Inc. Stock and Cash Incentive Plan (February 2021). | | |
| | | | |
| *10.11.2 | | Form of Performance Share Unit Award Agreement for the Marriott International, Inc. Stock and Cash Incentive Plan (February 2023). | | |
| | | | |
| *10.11.3 | | Form of Performance Share Unit Award Agreement for the 2023 Marriott International, Inc. Stock and Cash Incentive Plan (February 2024). | | |
| | | | |
| *10.12.1 | | Form of Non-Employee Director Deferred Fee Award Agreement for the Marriott International, Inc. Stock and Cash Incentive Plan. | | |
| | | | |
| *10.12.2 | | Form of Non-Employee Director Deferred Share Award Agreement for the Marriott International, Inc. Stock and Cash Incentive Plan. | | |
| | | | |
| *10.13.1 | | Form of Non-Employee Director Stock Appreciation Right Agreement for the Marriott International, Inc. Stock and Cash Incentive Plan (Pre-May 2022). | | |
| | | | |
| *10.13.2 | | Form of Non-Employee Director Stock Appreciation Right Agreement for the Marriott International, Inc. Stock and Cash Incentive Plan (May 2022). | | |
| | | | |
| *10.14.1 | | Marriott International, Inc. Executive Deferred Compensation Plan, amended and restated as of February 11, 2022. | | |
| | | | |
| *10.14.2 | | First Amendment to the Marriott International, Inc. Executive Deferred Compensation Plan, effective as of October 31, 2022. | | |
| | | | |
| *10.14.3 | | Second Amendment to the Marriott International, Inc. Executive Deferred Compensation Plan, effective as of January 1, 2024. | | |
| | | | |
| *10.14.4 | | Third Amendment to the Marriott International, Inc. Executive Deferred Compensation Plan, effective as of January 1, 2025. | | |
| | | | |
| | | | | | | | | | | | | | |
| Exhibit No. | | Description | | Incorporation by Reference (where a report is indicated below, that document has been previously filed with the SEC and the applicable exhibit is incorporated by reference thereto) |
| *10.15.1 | | Starwood 2013 Long-Term Incentive Compensation Plan. | | |
| | | | |
| *10.15.2 | | Amendment dated June 29, 2016 to the Starwood 2013 Long-Term Incentive Compensation Plan. | | |
| | | | |
| *10.15.3 | | Amendment dated September 23, 2016 to the Starwood 2013 Long-Term Incentive Compensation Plan. | | |
| | | | |
| *10.15.4 | | Amendment dated May 5, 2017 to the Starwood 2013 Long-Term Incentive Compensation Plan. | | |
| | | | |
| *10.16 | | Amended and Restated Aircraft Time Sharing Agreement, effective as of September 14, 2023, between Marriott International Administrative Services, Inc. and Anthony Capuano. | | |
| | | | |
| 10.17 | | Third Amended and Restated Aircraft Time Sharing Agreement, effective as of November 7, 2024, between Marriott International Administrative Services, Inc. and J. Willard Marriott, Jr. | | |
| | | | |
| *10.18 | | Aircraft Time Sharing Agreement, effective as of February 9, 2023, between Marriott International Administrative Services, Inc. and David Marriott. | | |
| | | | |
| 19 | | Marriott International, Inc. Securities Trading Policy (MIP-11). | | |
| | | | |
| 21 | | Subsidiaries of Marriott International, Inc. | | |
| | | | |
| 23 | | Consent of Ernst & Young LLP. | | |
| | | | |
| 31.1 | | Certification of Chief Executive Officer Pursuant to Rule 13a-14(a). | | |
| | | | |
| 31.2 | | Certification of Chief Financial Officer Pursuant to Rule 13a-14(a). | | |
| | | | |
| 32 | | Section 1350 Certifications. | | |
| | | | |
| 97 | | Marriott International, Inc. Rule 10D-1 Clawback Policy. | | |
| | | | |
| 101 | | The following financial statements from Marriott International, Inc.’s Annual Report on Form 10-K for the year ended December 31, 2024, formatted in Inline XBRL (Extensible Business Reporting Language): (i) the Consolidated Statements of Income for the year ended December 31, 2024, December 31, 2023, and December 31, 2022; (ii) the Consolidated Balance Sheets at December 31, 2024, and December 31, 2023; (iii) the Consolidated Statements of Cash Flows for the year ended December 31, 2024, December 31, 2023, and December 31, 2022; (iv) the Consolidated Statements of Comprehensive Income for the year ended December 31, 2024, December 31, 2023, and December 31, 2022; (v) the Consolidated Statements of Stockholders’ (Deficit) Equity for the year ended December 31, 2024, December 31, 2023, and December 31, 2022; and (vi) Notes to Consolidated Financial Statements. | | Submitted electronically with this report. |
| | | | |
| 101.INS | | XBRL Instance Document. | | Submitted electronically with this report. |
| | | | |
| 101.SCH | | XBRL Taxonomy Extension Schema Document. | | Submitted electronically with this report. |
| | | | |
| 101.CAL | | XBRL Taxonomy Calculation Linkbase Document. | | Submitted electronically with this report. |
| | | | |
| 101.DEF | | XBRL Taxonomy Extension Definition Linkbase. | | Submitted electronically with this report. |
| | | | |
| | | | | | | | | | | | | | |
| Exhibit No. | | Description | | Incorporation by Reference (where a report is indicated below, that document has been previously filed with the SEC and the applicable exhibit is incorporated by reference thereto) |
| 101.LAB | | XBRL Taxonomy Label Linkbase Document. | | Submitted electronically with this report. |
| | | | |
| 101.PRE | | XBRL Taxonomy Presentation Linkbase Document. | | Submitted electronically with this report. |
| | | | |
| 104 | | The cover page from Marriott International, Inc.’s Annual Report on Form 10-K for the year ended December 31, 2024, formatted in Inline XBRL (included as Exhibit 101). | | Submitted electronically with this report. |
* Denotes management contract or compensatory plan.
Item 16. Form 10-K Summary.
None.
SIGNATURES
Pursuant to the requirements of Section 13 or 15(d) of the Exchange Act, we have duly caused this Form 10-K to be signed on our behalf by the undersigned, thereunto duly authorized, on this 11th day of February 2025.
MARRIOTT INTERNATIONAL, INC.
| | | | | | | | | | | | | | |
| By: | | /s/Anthony G. Capuano | | |
| | Anthony G. Capuano | | |
| | President and Chief Executive Officer | | |
Pursuant to the requirements of the Exchange Act, this Form 10-K has been signed by the following persons on our behalf in the capacities indicated and on the date indicated above.
| | | | | | | | |
| PRINCIPAL EXECUTIVE OFFICER: |
| | |
| /s/Anthony G. Capuano | | President, Chief Executive Officer and Director |
| Anthony G. Capuano | |
| | |
| PRINCIPAL FINANCIAL OFFICER: | | |
| | |
| /s/Kathleen K. Oberg | | Chief Financial Officer and Executive Vice President, Development |
| Kathleen K. Oberg | |
| | |
| PRINCIPAL ACCOUNTING OFFICER: | | |
| | |
| /s/Felitia O. Lee | | Controller and Chief Accounting Officer |
| Felitia O. Lee | |
| | |
| DIRECTORS: | | |
| | |
| /s/David S. Marriott | | /s/Aylwin B. Lewis |
| David S. Marriott, Chairman of the Board | | Aylwin B. Lewis, Director |
| | |
| /s/Isabella D. Goren | | /s/Margaret M. McCarthy |
| Isabella D. Goren, Director | | Margaret M. McCarthy, Director |
| | |
| /s/Deborah Marriott Harrison | | /s/Grant F. Reid |
| Deborah Marriott Harrison, Director | | Grant F. Reid, Director |
| | |
| /s/Frederick A. Henderson | | /s/Horacio D. Rozanski |
| Frederick A. Henderson, Director | | Horacio D. Rozanski, Director |
| | |
| /s/Lauren R. Hobart | | /s/Susan C. Schwab |
| Lauren R. Hobart, Director | | Susan C. Schwab, Director |
| | |
| /s/Debra L. Lee | | |
| Debra L. Lee, Director | | |
| | |
| | |
| | |