UNITED STATES
SECURITIES AND EXCHANGE COMMISSION
Washington, D.C. 20549
FORM 10-K
(Mark One)
| x | ANNUAL REPORT PURSUANT TO SECTION 13 OR 15(d) OF THE SECURITIES EXCHANGE ACT OF 1934 |
For the fiscal year ended June 30, 2008
Or
| ¨ | TRANSITION REPORT PURSUANT TO SECTION 13 OR 15(d) OF THE SECURITIES EXCHANGE ACT OF 1934 |
Commission file number: 000-29175
AVANEX CORPORATION
(Exact name of registrant as specified in its charter)
| | |
| Delaware | | 94-3285348 |
(State or other jurisdiction of incorporation or organization) | | (I.R.S. Employer Identification Number) |
| |
40919 Encyclopedia Circle Fremont, California | | 94538 |
| (Address of principal executive offices) | | (Zip Code) |
Registrant’s telephone number, including area code: (510) 897-4188
Securities registered pursuant to Section 12(b) of the Act:
Common Stock, $0.001 par value
(Title of Class)
The NASDAQ Stock Market LLC
(Name of Each Exchange on Which Registered)
Securities registered pursuant to Section 12(g) of the Act:
Preferred Share Rights (currently attached to and trading only with Common Stock)
Indicate by check mark if the registrant is a well-known seasoned issuer, as defined in Rule 405 of the Securities Act. Yes ¨ No x
Indicate by check mark if the registrant is not required to file reports pursuant to Section 13 or Section 15(d) of the Act. Yes ¨ No x
Indicate by check mark whether the registrant (1) has filed all reports required to be filed by Section 13 or 15(d) of the Securities Exchange Act of 1934 during the preceding 12 months (or for such shorter period that the registrant was required to file such reports), and (2) has been subject to such filing requirements for the past 90 days. Yes x No ¨
Indicate by check mark if disclosure of delinquent filers pursuant to Item 405 of Regulation S-K is not contained herein, and will not be contained, to the best of the registrant’s knowledge, in definitive proxy or information statements incorporated by reference in Part III of this Form 10-K or any amendment to this Form 10-K. ¨
Indicate by check mark whether the Registrant is a large accelerated filer, an accelerated filer, a non-accelerated filer, or a smaller reporting company. See definitions of “large accelerated filer,” “accelerated filer” and “smaller reporting company” in Rule 12b-2 of the Exchange Act.
Large accelerated filer ¨ Accelerated filer x Non-accelerated filer ¨ Smaller reporting company ¨
Indicate by check mark whether the Registrant is a shell company (as defined in Rule 12b-2 of the Act). Yes ¨ No x
As of December 31, 2007, the last business day of the Registrant’s most recently completed second fiscal quarter, the aggregate market value of voting stock held by non-affiliates of the Registrant was approximately $228.9 million based upon the closing price on the Nasdaq Global Market reported for such date. As of August 26, 2008, the Registrant had 15,341,458 outstanding shares of common stock.
DOCUMENTS INCORPORATED BY REFERENCE
Portions of the Registrant’s Proxy Statement that will be filed with the Commission pursuant to Section 14(a) in connection with the 2008 Annual Meeting of Stockholders are incorporated herein by reference in Part III of this Annual Report on Form 10-K to the extent stated herein. The Proxy Statement will be filed within 120 days of Registrant’s fiscal year ended June 30, 2008.
AVANEX CORPORATION
ANNUAL REPORT ON FORM 10-K
FOR THE FISCAL YEAR ENDED JUNE 30, 2008
TABLE OF CONTENTS
SPECIAL NOTE REGARDING FORWARD-LOOKING STATEMENTS
Certain statements contained in this Annual Report on Form 10-K that are not purely historical are “forward-looking statements” within the meaning of the federal securities laws, including, without limitation, statements regarding our expectations, beliefs, anticipations, commitments, intentions and strategies regarding the future. In some cases you can identify forward-looking statements by terms such as “may,” “could,” “would,” “might,” “will,” “should,” “expect,” “plan,” “intend,” “forecast,” “anticipate,” “believe,” “estimate,” “predict,” “potential,” “continue” or the negative of these terms or other comparable terminology. Actual results could differ from those projected in any forward-looking statements for the reasons, among others, detailed in “Risk Factors” in Item 1A. The forward-looking statements are made as of the date of this Form 10-K and we assume no obligation to update the forward-looking statements, or to update the reasons why actual results could differ from those projected in the forward-looking statements.
PART I
Overview
We are a global provider of high-performance, intelligent, photonic products including optical components, modules and subsystems. Our products enable optical communication networks to regenerate, transmit and manage voice, video and data optical signals efficiently. Telecommunication system integrators and their network carrier customers use our products to enhance system performance and increase network speed and capacity. We believe we are one of the largest broad-based suppliers of telecom optical equipment.
In 2003, we acquired all of the outstanding equity of Alcatel Optronics France, a subsidiary of Alcatel, certain assets of the optical components business of Corning Incorporated, and substantially all of the assets of Vitesse’s Optical Components Systems Division. As part of these acquisitions, Alcatel and Corning Incorporated licensed certain intellectual property rights to us. Over the past five years, we have integrated and restructured these assets and have shifted most of our manufacturing operations and portions of our development resources to lower-cost geographic regions. For instance, in March 2005, we announced that we had opened an operations center in Bangkok, Thailand to centralize global manufacturing and operational overhead functions in a lower-cost region. In July 2005, we announced the opening of a development and marketing office in Shanghai, China. In April 2007, we sold ninety percent (90%) of our share capital and voting rights of our wholly-owned subsidiary in France, including our Indium Phosphide (InP) and Gallium Arsenide (GaAs) semiconductor fabs, and our laser, terrestrial pump, submarine pump and Fiber Bragg Grating (FBG) product lines, to 3S Photonics.
In order to expand our transmission product portfolio, in July 2007, we acquired the assets relating to the MSA 300-pin transponder and XFP transceiver businesses of the Commercial Communication Products Division of Essex Corporation, a subsidiary of Northrop Grumman Space and Mission Systems Corporation.
We have one of the broadest optical product portfolio platforms available, with a scalable and efficient global operating model.
We were incorporated in October 1997 as a California corporation, and in January 2000, we were reincorporated as a Delaware corporation. Our principal executive office is located at 40919 Encyclopedia Circle, Fremont, California, 94538. We also maintain facilities in Horseheads, New York; Melbourne, Florida; Shanghai, China; Villebon Sur Yvette, France; San Donato, Italy; and Bangkok, Thailand. Our main telephone number is (510) 897-4188, and our web site address is www.avanex.com. We are not including the information contained in our web site or any other information that may be accessed through our web site as part of, or incorporating it by reference into, this Annual Report on Form 10-K. Our annual reports on Form 10-K, quarterly reports on Form 10-Q, current reports on Form 8-K, and amendments to such reports are available, free of charge, through our internet web site, as soon as reasonably practicable, after we electronically file such material with, or furnish it to the Securities and Exchange Commission (SEC).
Avanex and the Avanex logo are registered trademarks of Avanex Corporation. This Annual Report on Form 10-K also includes other trade names, trademarks and service marks of ours and other companies.
1
Recent Events
Following the close of market on August 12, 2008, we effected a fifteen-for-one reverse stock split of our common stock. Accordingly, each fifteen shares of issued and outstanding Avanex common stock and equivalents as of the close of market on August 12, 2008 was converted into one share of common stock, and the reverse stock split was reflected in the trading price of Avanex’s common stock at the opening of market on August 13, 2008. Unless indicated otherwise, all share amounts and per share prices appearing in this Annual Report on Form 10-K reflect the reverse stock split for all periods presented.
On July 7, 2008, Dr. Jo Major, Jr. was terminated from his position as President and Chief Executive Officer of the Company. On July 6, 2008, Dr. Major resigned from the Company’s Board of Directors. Also on July 7, 2008, Marla Sanchez resigned from her position as Senior Vice President and Chief Financial Officer of the Company. On August 25, 2008, Patrick Edsell resigned from his position as Senior Vice President and General Manager.
Industry
Optical technology transfers information in the form of light signals along optical fibers. The light signals are transmitted through fiber optic cable. Beyond lasers, many other optical components and subsystems are utilized within optical networks to generate, clean, amplify, isolate, route, or otherwise enhance light signals.
Over the last several years, the optical components, modules and subsystems industry has experienced a modest increase in business levels, as compared to previous years, because network carriers and cable companies have been deploying new communication networks or have been upgrading the backbone of existing communication networks. The increasing demand for optical solutions is in response to growing bandwidth demand driven by increased transmission of video, voice and data over optical communication networks, and by a need among network carriers to decrease the total cost of ownership of their networks. Certain large telecommunications network carriers have also disclosed that they plan to deploy, and have begun to deploy, new broadband access networks based on fiber optic technologies. These fiber-to-the-premise networks significantly increase the capacity and expand the type of services that can be utilized by residential users.
Products
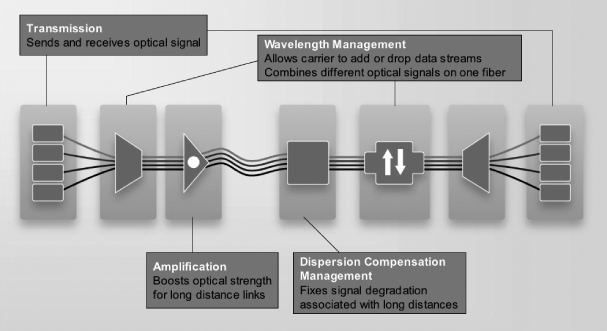
Our product portfolio is comprised of the following product families (depicted visually above):
Amplification—Our Amplification product family includes products that optically amplify transmission signals, including Erbium doped fiber amplifiers.
2
Wavelength Management—Our Wavelength Management platform includes Switching and Routing solutions, Multiplexing and Signal Processing solutions and Micro-Optics and Integrated Modules, including products that optically add and drop transmission signals in both fixed and reconfigurable versions, products that optically multiplex or demultiplex signals based on thin film filters, planar and interleaver technologies, and products that optically attenuate signal power across a single or multiple wavelength bands.
Dispersion Compensation Management—Our Dispersion Compensation product family consists of products that optically compensate for chromatic dispersion and dispersion degradation of transmission signals, including fixed and tunable products based on dispersion compensating fiber and cascaded etalons.
Transmission—Our Transmission product family includes transceivers and transponders. These products transmit and receive optical signals on optical fibers. Our Transmission product family also includes Lithium Niobate Modulators, which are optical devices fabricated from Lithium Niobate and other optical devices that manipulate the phase of magnitude of an optical signal. Their primary function is to transfer information on an optical carrier by modulating the light.
Competition
The optical communications markets are rapidly evolving. We expect these markets to continue to be highly competitive because of the available capacity and easily obtained funding. We believe that our principal competitors in the optical subsystems, modules and components industry include Bookham, Inc., EMCORE Corporation, JDS Uniphase Corporation, Oplink Communications, Inc., Opnext, Inc. and Optium Corporation. We believe we differentiate ourselves from our competitors by offering high levels of customer value through collaborative product design, technology innovation, optical/ mechanical performance, intelligent features for configuration, control and monitoring, multi-function integration and overall customization. The principal competitive factors upon which we compete include breadth of product line, availability, performance, product reliability, innovation and selling price. We believe that we compete favorably with our competitors with respect to the foregoing factors.
Consolidation in the optical systems and components industry in the past has intensified, and future consolidation could further intensify, the competitive pressures that we face. For example, Finisar Corporation and Optium Corporation, and Opnext Inc. and StrataLight Communications, Inc. have recently announced proposed combinations. In addition, Oplink Communications and EMCORE Corporation have expanded their businesses through acquisitions. Significant consolidation has also taken place recently at the carrier level and at our customer level. Recent mergers among our customers include that of ADVA Optical Networking with Movaz Networks Inc., Alcatel with Lucent Technologies Inc., Ericsson AB with Marconi, and the merger of the optical businesses of Marconi Communications and Nokia.
We also face competition from companies that may expand into our industry and introduce additional competitive products. Existing and potential customers are also our potential competitors. These customers may develop or acquire additional competitive products or technologies, which may cause them to reduce or cease their purchases from us. Please see “Risk Factors” in Item 1A of this Annual Report on Form 10-K, including in Section II: “Market and Competitive Risks.”
Research and Development
We believe that research and development is critical to our strategic growth objectives. Our research and development activities are focused on new products that integrate multiple optical functions and that offer intelligent features for configuration, control and monitoring. To accomplish this, our research and development team possesses expertise in the areas of optical components, micro-optic and integrated-optic design, as well as in electronics, firmware, and software. Most of our efforts are directed toward the development of platforms with new revenue potential, but we do continue to invest in current technological platforms to ensure our continued competitiveness in the future.
Our research and development expenses totaled $28.3 million for the fiscal year ended June 30, 2008, $25.2 million for the fiscal year ended June 30, 2007, and $23.5 million for the fiscal year ended June 30, 2006. During
3
fiscal 2008, research and development expenditures increased due to higher prototype parts spending and additional staff in the U.S. and China. During fiscal 2007, research and development expenditures increased as we added staff in China and increased patent-related expenses; however, by the end of fiscal 2007, expenses had decreased to comparable levels with the prior year with the sale of our subsidiary in France. In addition, we have moved significant engineering resources to our Shanghai location to increase the cost effectiveness of our overall research and development activities and to provide support to our third-party contract manufacturers. As of June 30, 2008, we employed 182 people in our research and development groups in Fremont, California; Melbourne, Florida; Horseheads, New York; Villebon Sur Yvette, France; San Donato, Italy; and Shanghai, China.
During fiscal 2006, 2007 and 2008, we saw an increase in the number of customers purchasing integrated subsystem products, as well as an increase in the complexity of such products with existing customers as the demand for more intelligent, efficient and flexible optical fiber networks increases. We continue to invest in such products, as we believe applications for these types of products will become increasingly important in the future. For risks associated with our research and development efforts, please see “Risk Factors” in Item 1A of this Annual Report on Form 10-K, including in Section IV: “Operations and Research and Development Risks.”
Sales and Marketing
We primarily market our products to telecommunications system integrators. Our marketing efforts are centered on the demonstration of, and education about, our products’ performance at trade shows and customer visits. We sell and market our products through a combination of direct sales, distributors and representatives.
As of June 30, 2008, our direct sales organization consisted of directly employed account managers in the United States, Europe and Asia, supported by application engineers and product line managers. We focus our direct sales efforts on service providers and telecommunications systems and optical module manufacturers. The direct sales account managers cover the market on an assigned-account, regional basis and work as a team with systems engineers and product line managers. As of June 30, 2008, our sales and marketing organization consisted of 68 people. We provide customer service directly to our customers.
In order to further our international sales objectives, we have established relationships with distributors and manufacturer’s representatives geographically as needed to support our customers. These distributors and representatives have expertise in distributing complex telecommunications equipment in their markets and provide basic customer service to the end customers they serve.
While we have diversified our customer base, we expect that a substantial proportion of our sales will continue to be concentrated with a limited number of customers. During fiscal 2008, Alcatel-Lucent accounted for 25% of our net revenue and Tellabs accounted for 21% of our net revenue. During fiscal 2007, Alcatel-Lucent accounted for 29% of our net revenue and Tellabs accounted for 17% of our net revenue. During fiscal 2006, Alcatel accounted for 27% of our net revenue and Nortel accounted for 11% of our net revenue.
A summary of certain financial information by geographic location is found in Note 15 in the Notes to Consolidated Financial Statements.
Backlog
We do not believe that backlog as of any particular date is meaningful, as our sales are made primarily pursuant to standard purchase orders for delivery of products. Only a small portion of our orders are non-cancelable, and the dollar amount associated with the non-cancelable portion is not significant.
Manufacturing
During fiscal 2007, we completed the transition of most of our manufacturing operations to third party contract manufacturers located in Thailand and China, whose operations are coordinated through our Asian Operations Center in Bangkok, Thailand; however, we continue to manufacture Lithium Niobate chips that are used in our products in San Donato, Italy. As of June 30, 2008, our manufacturing support organization consisted of 241 people.
4
We currently purchase several key components used in our products and equipment from single or limited sources of supply, including Bookham Inc., Corning, Eudyna Devices Inc., JDS Uniphase Corporation and Photop, Inc. These key components include lasers, variable optical attenuators, thin film filters, gain flattening filters, and optical fiber. We also purchase turnkey solutions from OEM manufacturers, such as Browave Corporation, Fabrinet, Optiworks, and Photop Inc. For risks associated with our manufacturing strategy, please see “Risk Factors” in Item 1A of this Annual Report on Form 10-K, including Section IV: “Operations and Research and Development Risks.”
Our United States, Europe and Asia sites are currently TL-9000 certified. We will continue to refine our quality processes to ensure that we maintain our high standards of product quality and customer satisfaction.
Patents and Intellectual Property
As of June 30, 2008, we held approximately 535 U.S. patents and approximately 269 foreign patents (issued and pending), covering a broad range of photonics and optical communications products and technologies. These technologies are incorporated into our products and are covered by patents that expire through April 2026; however, we also have patents that have not been incorporated into our products. In addition, our intellectual property includes trade secrets, trademarks, and copyrights. We do not expect to maintain or enhance our market position primarily through the exercise of our intellectual property rights because the rapid evolution of technology and the wide distribution of patents in our industry preclude such market positioning through intellectual property. We will pursue opportunities to license our intellectual property if we believe that we can be adequately compensated or if there is the potential for a beneficial cross-license agreement.
Our engineering teams have significant expertise in photonic, micro-optic and systems-level design and manufacturing. While we rely on patent, copyright, trade secret and trademark law to protect our technology, we also believe that other factors, such as the technological and creative skills of our personnel, new product developments, frequent product enhancements and reliable product maintenance are essential to establishing and maintaining a technology leadership position.
We generally enter into confidentiality or license agreements with our employees, consultants and corporate partners, and generally control access to and distribution of our proprietary information.
In addition, we have been granted licenses to use other intellectual property, including patents of Alcatel, Corning and various other third parties. For risks associated with our patents and intellectual property, please see “Risk Factors” in Item 1A of this Annual Report on Form 10-K, including Section V: “Intellectual Property and Litigation Risks.”
Employees
As of June 30, 2008, we had 576 employees and consultants comprised of 241 employees in manufacturing support, 182 employees in research and development, 68 employees in sales and marketing, and 85 employees in general and administrative capacities. The work force is located in Canada, China, France, Germany, Italy, Japan, Thailand, the United Kingdom, and the United States.
As of June 30, 2008, some of our employees located in Europe were represented by labor organizations.
We consider our relations with our employees to be good. Our future success depends on our continuing ability to attract, train and retain highly qualified technical, sales and managerial personnel. Please see “Risk Factors” in Item 1A of this Annual Report on Form 10-K, including Section IV: “Operations and Research and Development Risks,” specifically the risk factor entitled “We depend on key personnel to manage our business effectively, and if we are unable to hire, retain or motivate qualified personnel, our ability to sell our products could be harmed.”
5
In addition to the other information contained in this Annual Report on Form 10-K, we have identified the following risks and uncertainties that may have a material adverse affect on our business, financial condition or results of operations. Investors should carefully consider the risks described below before making an investment decision. The risks described below are not the only ones we face. Additional risks not presently known to us or that we currently believe are immaterial may also impair our business operations. Our business could be harmed by any of these risks. The trading price of our common stock could decline due to any of these risks and investors may lose all or part of their investment. This section should be read in conjunction with the Condensed Consolidated Financial Statements and Notes thereto, and Management’s Discussion and Analysis of Financial Condition and Results of Operations contained in this Form 10-K.
I. Financial and Revenue Risks.
Prior to fiscal 2008, we had a history of negative cash flows and losses, which could return if we do not continue to increase our revenue and/or further reduce our costs.
Prior to fiscal 2008, we experienced operating losses in each quarterly and annual period since our inception in 1997, and we may again incur operating losses for an indeterminate period of time. As of June 30, 2008, we had an accumulated deficit of $700.4 million. For each of our prior fiscal years except for fiscal 2008, we had negative operating cash flow, and we may incur negative operating cash flow in future periods. There can be no assurance that our business will be profitable in the future or that additional losses and negative cash flows from operations will not be incurred, which could have a material adverse affect on our financial condition.
Due to insufficient cash generated from operations in the past, we funded our operations primarily through the sale of equity securities, debt securities, bank borrowings, equipment lease financings, acquisitions and other capital raising transactions. Although we implemented cost reduction programs during the past several years, we continue to have significant fixed expenses, and we expect to continue to incur considerable manufacturing, sales and marketing, product development and administrative expenses.
Our future profitability depends on our ability to maintain or improve gross margin and control operating expenses. If we do not maintain or improve gross margin and control operating expenses, our financial condition and results of operations will be adversely impacted.
During the fiscal years ended June 30, 2008, 2007 and 2006, our gross margin percentage was 31%, 18% and 5%, respectively. Despite our continued efforts to improve our gross margin, there can be no assurance that our gross margin will improve or be maintained in the future.
We have reduced fixed costs through the extensive reliance on third party contract manufacturing and the relocation of most of our manufacturing operations into a central facility in Bangkok, Thailand. We may further reduce fixed costs by relocating certain transactional activities to lower cost regions. We have faced and may face execution issues working with our contract manufacturers, including difficulties managing our supply chain and deliveries to our customers. From a financial viewpoint, should these difficulties occur, we could see negative impacts to revenue, gross margin and inventory levels.
In addition, over our limited operating history, the average selling prices of our existing products have decreased and this trend may continue. However, our overall product mix has shifted toward products with higher levels of integration, typically selling at higher unit prices. Future price decreases may be due to a number of factors, including competitive pricing pressures, rapid technological change and sales discounts. Therefore, to maintain or improve our gross margin, we must develop and introduce new products and product enhancements on a timely basis and reduce our costs of production. Moreover, as our average selling prices decline, we must increase our unit sales volume, or introduce new products, to maintain or increase our total revenues. If our average selling prices decline more rapidly than our costs of production, our gross margin will decline. This would adversely impact our business, financial condition and results of operations. If we are unable to continue to generate positive gross margin, our cash flows from operations would be negatively impacted, and we would be unable to maintain profitability.
6
Our future revenues and operating results are inherently unpredictable, and as a result, we may fail to meet the expectations of securities analysts or investors, which could cause our stock price to decline.
Our revenues and operating results have fluctuated significantly from quarter-to-quarter in the past, and may continue to fluctuate significantly in the future. Factors that are likely to cause these fluctuations, some of which are outside of our control, include, without limitation, the following:
| | • | | the current economic environment and other developments in the telecommunications industry, including the severe business setbacks of customers or potential customers; |
| | • | | the average margin of the mix of products we sell; |
| | • | | fluctuations in demand for and sales of our products, which will depend upon the speed and magnitude of the transition to an all-optical network, the acceptance of our products in the marketplace, and the general level of spending on infrastructure projects in the telecommunications industry; |
| | • | | cancellations of orders and shipment rescheduling; |
| | • | | changes in product specifications required by customers for existing and future products; |
| | • | | satisfaction of contractual customer acceptance criteria and related revenue recognition issues; |
| | • | | our ability to maintain appropriate manufacturing capacity through our contract manufacturers and materials suppliers, from whom we have no long-term commitments; |
| | • | | the ability of our outsourced manufacturers to timely produce and deliver subcomponents, and possibly complete products in the quantity and of the quality we require; |
| | • | | the current practice of our customers in the telecommunications industry of sporadically placing large orders with short lead times; |
| | • | | our ability to comply with new rules and regulations; |
| | • | | competitive factors, including the introduction of new products and product enhancements by competitors and potential competitors, pricing pressures, and the competitive environment in the markets into which we sell our photonic processing solutions and products, including competitors with substantially greater resources than we have; |
| | • | | our ability to effectively develop, introduce, manufacture, and ship new and enhanced products in a timely manner without defects; |
| | • | | the availability and cost of components for our products; |
| | • | | new product introductions that may result in increased research and development expenses and sales and marketing expenses that are incurred in one quarter, with revenues, if any, that are not recognized until a subsequent quarter; |
| | • | | the unpredictability of customer demand and difficulties in meeting such demand; |
| | • | | revisions to our estimated reserves and allowances, as well as other accounting provisions or charges; |
| | • | | costs associated with, and the outcome of, any litigation to which we are, or may become, a party; and |
| | • | | customer perception of our financial condition and resulting effects on our orders and revenue. |
A high percentage of our expenses, including those related to manufacturing, engineering, sales and marketing, research and development, and general and administrative functions, are fixed in the short term. As a result, if we experience delays in generating and recognizing revenue, our quarterly operating results are likely to be harmed.
Due to these and other factors, we believe that quarter-to-quarter comparisons of our operating results may not be meaningful. Our results for one quarter should not be relied upon as any indication of our future performance. It is possible that in future quarters our operating results may be below the expectations of public market analysts or investors. If this occurs, the price of our common stock would likely decrease.
7
We may not continue to realize the anticipated benefits from our restructuring efforts.
As part of our cost reduction efforts, over the past several years we have implemented various restructuring programs to realign our resources in response to changes in the industry and customer demand. These efforts have included transferring most of our manufacturing operations to lower-cost contract manufacturers and selling our semiconductor fabs and related product lines in France. Our past restructuring programs may have a material effect on our financial position in the future as we pay rent for excess facilities. We may initiate future restructuring actions, which are likely to result in additional expenses that could affect our results of operations or financial position. There can be no assurance that we will realize the benefits we anticipate from our current or future restructuring programs or that such programs will reduce our operating expenses and improve our cost structure.
A lack of effective internal control over financial reporting could result in an inability to report our financial results accurately, which could lead to a loss of investor confidence in our financial reports and have an adverse effect on our stock price.
Effective internal controls are necessary for us to provide reliable financial reports. If we cannot provide reliable financial reports or prevent fraud, our business and operating results could be harmed. We have in the past discovered, and may in the future discover, deficiencies, including those considered to be material weaknesses, in our internal controls. For example, as more fully described in Item 9A of this Annual Report on Form 10-K, our management concluded that as of June 30, 2008 we did not maintain effective internal controls over the following:
Controls over the review of journal entries for inventory and taxes related to certain foreign subsidiaries were inadequately designed to prevent or detect a material misstatement of the consolidated financial statements.
Our management determined that these control deficiencies were considered a material weakness that could result in a material misstatement to annual or interim financial statements that would not be prevented or detected. As a result, our management concluded that our internal control over financial reporting was not effective as of June 30, 2008 using the criteria set forth in the Internal Control-Integrated Framework issued by the Committee of Sponsoring Organizations of the Treadway Commission (“COSO”). We expect the remediation of this material weakness to occur during fiscal year 2009.
A failure to implement and maintain effective internal control over financial reporting, including a failure to implement corrective actions to address the control deficiencies identified above, could result in a material misstatement of our financial statements or otherwise cause us to fail to meet our financial reporting obligations. This, in turn, could result in a loss of investor confidence in the accuracy and completeness of our financial reports, which could have an adverse effect on our business, financial condition, operating results and our stock price, and we could be subject to stockholder litigation.
We incur increased costs as a result of being a public company.
As a public company, we incur significant legal, accounting and other expenses. In addition, the Sarbanes-Oxley Act of 2002, as well as future accounting rules and regulations subsequently implemented by the Securities and Exchange Commission and Nasdaq, have required changes in corporate governance practices of public companies. These rules and regulations have increased our legal and financial compliance costs and have made some activities more time consuming and costly. In addition, we incur additional costs associated with our public company reporting requirements.
Our stock price is highly volatile.
The trading price of our common stock has fluctuated significantly since our initial public offering in February 2000, and is likely to remain volatile in the future. For example, since the beginning of fiscal 2007 through to August 26, 2008, our common stock has closed as low as $6.35 and as high as $34.20 per share. The trading price of our common stock could be subject to wide fluctuations in response to many events or factors, including the following:
| | • | | quarterly variations in our operating results; |
| | • | | significant developments in the businesses of telecommunications companies; |
8
| | • | | changes in financial estimates by securities analysts; |
| | • | | changes in market valuations or financial results of telecommunications-related companies; |
| | • | | announcements by us or our competitors of technology innovations, new products, or significant acquisitions, strategic partnerships or joint ventures; |
| | • | | any deviation from projected growth rates in revenues; |
| | • | | any loss of a major customer or a major customer order; |
| | • | | additions or departures of key management or engineering personnel; |
| | • | | any deviations in our net revenue or in losses from levels expected by securities analysts; |
| | • | | activities of short sellers and risk arbitrageurs; |
| | • | | future sales of our common stock or the availability of additional financing; |
| | • | | volume fluctuations, which are particularly common among highly volatile securities of telecommunications-related companies; and |
| | • | | material weaknesses in internal controls. |
In addition, the stock market has experienced volatility that has particularly affected the market prices of equity securities of many high technology companies, which often has been unrelated or disproportionate to the operating performance of these companies. These broad market fluctuations may adversely affect the market price of our common stock. There is substantial risk that our quarterly results will fluctuate.
Sales of securities by our stockholders or warrantholders could affect the market price of our common stock or have a dilutive effect upon our stockholders.
On October 29, 2007, the Pirelli Group acquired all the shares of our common stock previously held by Alcatel-Lucent. As of August 26, 2008, the Pirelli Group owned shares of our common stock representing approximately 12% of the outstanding shares of our common stock. If the Pirelli Group or our other large stockholders sell substantial amounts of our common stock in the public market, it could cause the market price of our common stock to fall, and could make it more difficult for us to raise capital through public offerings or other sales of our capital stock.
In addition, we have issued warrants to purchase initially up to an aggregate of 665,417 shares of common stock to certain institutional investors that are exercisable through 2011 at exercise prices ranging from $32.18 to $110.85 per share, subject to broad-based anti-dilution provisions, including weighted-average price-based anti-dilution provisions. If these institutional investors exercise the warrants, we will issue shares of our common stock and such issuances may be dilutive to our stockholders. Because the exercise price of the warrants may be adjusted from time to time in accordance with the provisions of the warrants, the number of shares that could actually be issued may be greater than the amount described above. For example, in connection with our March 1, 2007 financing, the holders of the warrants we issued on March 9, 2006 received an antidilution adjustment pursuant to the terms of such warrants resulting in up to 7,815 additional shares being issued upon the exercise of such warrants and the reduction of the exercise price of the warrants from $40.95 per share to $40.30 per share.
We may have difficulty obtaining additional capital.
Our balance of unrestricted cash, cash equivalents, and short-term investments increased from $43.8 million at June 30, 2007 to $55.4 million at June 30, 2008. Except for the past fiscal year, we have not been profitable, and there can be no assurance that our business will remain profitable in the future. A failure to remain profitable would have an adverse affect on our financial condition. It may be difficult for us to raise additional capital. If adequate capital is not available to us as required, or is not available on favorable terms, our business, operating results and financial condition would be adversely affected.
9
II. Market and Competitive Risks.
Market conditions in the telecommunications industry may significantly harm our financial position.
Worldwide economic conditions generally, and market conditions in the telecommunications industry specifically, may significantly harm our financial position. We sell our products primarily to a few large customers in the telecommunications industry. Two customers accounted for an aggregate of 25% and 21% of our net revenue, respectively, for the fiscal year ended June 30, 2008. We expect that the majority of our revenues will continue to depend on sales of our products to a small number of customers. If current customers do not continue to place significant orders, or if they cancel or delay current orders, we may not be able to replace those orders. In addition, any negative developments in the business of existing customers could result in significantly decreased sales to these customers, which could seriously harm our business, operating results and financial condition. We have experienced, and in the future we may experience, losses as a result of the inability to collect accounts receivable, as well as the loss of ongoing business from customers experiencing financial difficulties. If our customers fail to meet their payment obligations, we could experience reduced cash flows and losses in excess of amounts reserved. Because of our reliance on a limited number of customers, any decrease in revenues from, or loss of, one or more of these customers without a corresponding increase in revenues from other customers would harm our business, operating results and financial condition.
Our customers may cancel or delay purchases with little or no advance notice to us.
Our customers typically purchase our products pursuant to individual purchase orders, and only a small portion of our orders is non-cancelable. Accordingly, our customers may cancel, defer or decrease purchases without significant consequence to them and with little or no advance notice. Further, certain of our customers have a tendency to purchase our products near the end of a fiscal quarter. Cancellation or delays of such orders may cause us to fail to achieve that quarter’s financial and operating goals. Decreases in purchases, cancellations of purchase orders, or deferrals of purchases may significantly harm our business, operating results and financial condition, particularly if we are not able to anticipate these events.
We experience intense competition with respect to our products.
We believe that our principal competitors in the optical systems and components industry include Bookham Inc., EMCORE Corporation, JDS Uniphase Corporation, Oplink Communications, Inc., Opnext Inc., and Optium Corporation. We may also face competition from companies that expand into our industry in the future.
A few of our competitors have longer operating histories and significantly greater financial, technical, marketing and other resources than we have. As a result, some of these competitors are able to devote greater resources to the development, promotion, sale, and support of their products. In addition, our competitors that have larger market capitalization or cash reserves are better positioned than we are to acquire other companies in order to gain new technologies or products that may displace our product lines. Consolidation in the optical systems and components industry could intensify the competitive pressures that we face because these consolidated competitors may have longer operating histories and significantly greater financial, technical, marketing and other resources than we have.
Some existing customers and potential customers, as well as, suppliers and potential suppliers, are also our competitors. These customers and suppliers may develop or acquire additional competitive products or technologies in the future, which may cause them to reduce or cease their purchases from us or their supply to us, as the case may be. Further, these customers may reduce or discontinue purchasing our products if they perceive us as a serious competitive threat with regard to sales of products to their customers. Additionally, suppliers may reduce or discontinue selling materials to us if they perceive us as a serious competitive threat with regard to sales of products to their customers. As a result of these factors, we expect that competitive pressures will intensify and may result in price reductions, reduced margins, and loss of market share.
Competition in the optical systems and components industry has contributed to substantial price-driven competition. As a result, sales prices for specific products have decreased over time at varying rates, in some instances significantly. Price pressure is exacerbated by the rapid emergence of new technologies and the evolution of technical standards, which can greatly diminish the value of products relying on older technologies
10
and standards. In addition, the current economic and industry environment in the telecommunications sector has resulted in pressure to reduce prices for our products, and we expect pricing pressure to continue for the foreseeable future, which may adversely affect our operating results. Reduced spending by our customers has caused and may continue to cause increased price competition, resulting in a decline in the prices we charge for our products. If our customers and potential customers continue to constrain their spending, or if the prices we charge continue to decline, our revenues and margins may be adversely affected.
We will lose market share and may not be successful if our customers do not qualify our products to be designed into their products and systems or if our customers significantly delay purchasing our products.
In the telecommunications industry, service providers and optical systems manufacturers often undertake extensive qualification processes prior to placing orders for large quantities of products such as ours, because these products must function as part of a larger system or network. Once they decide to use a particular supplier’s product or component, these potential customers design the product into their system, which is known as a “design-in” win. Suppliers whose products or components are not designed in are unlikely to make sales to that company until the adoption of a future redesigned system at the earliest, which could occur several years after the last design-in win. If we fail to achieve design-in wins in potential customers’ qualification processes, we may lose the opportunity for significant sales to such customers for a significant period of time.
The long sales cycles for sales of our products to customers may cause operating results to vary from quarter to quarter, which could continue to cause volatility in our stock price, and may prevent us from being profitable.
The period of time between our initial contact with certain of our customers and the receipt of an actual purchase order from such customers often spans a time period of six to nine months, or longer. During this time, customers may perform, or require us to perform, extensive and lengthy evaluation and testing of our products and our manufacturing processes before purchasing our products. While our customers are evaluating our products before they place an order with us, we may incur substantial sales and marketing and research and development expenses, expend significant management efforts, increase manufacturing capacity and order long-lead-time supplies. If we increase capacity and order supplies in anticipation of an order that does not materialize, our gross margin will decline, and we will have to carry and write off excess inventory. Even if we receive an order, if we are required to add additional internal manufacturing capacity in order to service the customer’s requirements, such manufacturing capacity may be underutilized in subsequent periods, especially if orders are delayed or cancelled. Either situation could cause our business, results of operations, and financial condition to be below the expectations of public market analysts or investors, which could, in turn, cause the price of our common stock to decline.
If the communications industry does not continue to evolve and grow steadily, our business may not succeed.
Future demand for our products is uncertain and unpredictable, and will depend to a great degree on the speed of the widespread adoption of optical networks. If the transition occurs too slowly or ceases altogether, the market for our products and the growth of our business will be significantly limited.
Our future success depends on the continued growth and success of the telecommunications industry, including the continued growth of the Internet as a widely used medium for commerce and communication and the continuing demand for increased bandwidth over communications networks. If the Internet does not continue to expand as a widespread communication medium and commercial marketplace, the need for significantly increased bandwidth across networks and the market for optical transmission products may not develop. As a result, it would be unlikely that our products would achieve commercial success.
The rate at which telecommunications service providers and other optical network users have built new optical networks or installed new systems in their existing optical networks has fluctuated in the past, and these fluctuations may continue in the future. Sales of our components depend on sales of fiber optic telecommunications systems by our systems-level customers, which are shipped in quantity when telecommunications service providers add capacity. Systems manufacturers compete for sales in each capacity
11
deployment. If systems manufacturers that use our products in their systems do not win a contract, their demand for our products will decline, reducing our future revenues. Similarly, a telecommunications service provider’s delay in selecting systems manufacturers for a deployment could delay our shipments and revenues.
III. Acquisition and Divestiture Risks.
Acquisitions, divestitures and other significant transactions may adversely affect our business.
We regularly review acquisition, divestiture and other strategic opportunities that would further our business objectives, complement our existing product offerings, augment our market coverage, secure supplies of critical materials or enhance our technological capabilities. The anticipated benefits of our acquisitions, divestitures and other strategic transactions may not be realized or may be realized more slowly than we expected. Acquisitions, divestitures and other strategic opportunities have resulted in, and in the future could result in, a number of financial consequences, including without limitation:
| | • | | potentially dilutive issuances of equity securities; |
| | • | | reduced cash balances and related interest income; |
| | • | | higher fixed expenses, which require a higher level of revenues to maintain gross margin; |
| | • | | the incurrence of debt and contingent liabilities, including indemnification obligations; |
| | • | | restructuring actions, which could result in charges that have a material effect on our results of operations and our financial position; |
| | • | | loss of customers, suppliers, distributors, licensors or employees of the acquired company; |
| | • | | legal, accounting and advisory fees; |
| | • | | amortization expenses related to intangible assets; and |
| | • | | one-time write-offs of large amounts. |
For example, in connection with our acquisition of the optical components businesses of Alcatel and Corning, we issued shares of our common stock to Alcatel and to Corning representing 28% and 17%, respectively, of the outstanding shares of our common stock on a post-transaction basis. In connection with such acquisitions, we recorded restructuring liabilities at July 31, 2003 with a fair value of $64.1 million relating to workforce reductions, which were included in the purchase price of such acquisitions. Following these acquisitions, we recorded additional significant restructuring liabilities that involved the acquired businesses and resulted in, among other things, a significant reduction in the size of our workforce, consolidation of our facilities and increased reliance on outsourced, third-party manufacturing.
In fiscal 2007, we sold ninety percent (90%) of the shares of Avanex France, the operator of our semiconductor fabs and associated product lines located in Nozay, France. We agreed to indemnify the buyers of Avanex France generally for a period of up to two years in an amount generally not exceeding €5 million for breaches of certain representations, warranties and covenants relating to the condition of the business prior to and at the time of sale. Should any such liabilities or expenses be of a material amount, our finances could be materially and adversely affected. We may experience a shortfall in revenue, lose existing or potential customers or otherwise experience material adverse effects upon our business, results of operation and financial condition.
Additionally, if any potential acquisitions are not completed, we are required to expense the frequently significant legal, accounting, consulting and other costs of pursuing these transactions in the period in which the activity ceases, which could adversely affect our operating results and may not be anticipated. For example, in fiscal 2007, we expensed approximately $2.1 million in diligence and professional fees related to a potential acquisition with which we decided not to proceed further.
Furthermore, our past acquisition and disposition activity has involved, and our future acquisition, disposition and other significant transactions may involve, numerous operational risks, including:
| | • | | difficulties integrating or divesting operations, personnel, technologies, products and the information systems of the acquired or divested companies; |
12
| | • | | diversion of management’s attention from other business concerns; |
| | • | | diversion of resources from our existing businesses, products or technologies; |
| | • | | risks of entering geographic and business markets in which we have no or limited prior experience; and |
| | • | | potential loss of key employees of acquired organizations. |
IV. Operations and Research and Development Risks.
We face various risks related to our manufacturing operations that may adversely affect our business.
We may experience delays, disruptions or quality control problems in our manufacturing operations or the manufacturing operations of our third party manufacturers, and, as a result, product shipments to our customers could be delayed beyond the shipment schedules requested by our customers, which would negatively affect our business, results of operations, and financial condition. In the past, we have experienced disruptions in the manufacture of some of our products due to changes in our manufacturing processes, which resulted in reduced manufacturing yields, delays in the shipment of our products and deferral of revenue recognition. Any disruptions in the future could adversely affect our revenues, gross margin, and results of operations. Changes in our manufacturing processes or those of our third party manufacturers, or the inadvertent use of defective materials by our third party manufacturers or us, could significantly reduce our manufacturing yields and product reliability. Lower than expected manufacturing yields could delay product shipments and further impair our gross margin. These operational issues have included capacity constraints at our contract manufacturers, raw materials shortages, logistics issues, and manufacturing yield issues for some of our new products.
We may need to develop new manufacturing processes and techniques that will involve higher levels of automation, or may need to further relocate certain manufacturing operations to lower cost regions to improve our gross margin and achieve the targeted cost levels of our customers. If we fail to manage this process effectively, or if we experience delays, disruptions or quality control problems in our manufacturing operations, our shipments of products to our customers could be delayed.
We face risks related to our concentration of research and development efforts on a limited number of key industry standards and technologies, and our future success depends on our ability to develop and introduce new and enhanced products successfully that meet the needs of our customers in a timely manner.
In the past, we have concentrated our research and development efforts on a limited number of technologies that we believed had the best growth prospects. If we are unable to develop commercially viable products using these technologies, or these technologies do not become generally accepted, our business will likely suffer.
The markets for our products are characterized by rapid technological change, frequent new product introduction, changes in customer requirements, and evolving industry standards. Our future performance will depend upon the successful development, introduction and market acceptance of new and enhanced products that address these changes. We may not be able to develop the underlying core technologies necessary to create new or enhanced products, or to license or otherwise acquire these technologies from third parties. Product development delays may result from numerous factors, including:
| | • | | changing product specifications and customer requirements; |
| | • | | difficulties in hiring and retaining necessary technical personnel; |
| | • | | difficulties in reallocating engineering resources and overcoming resource limitations; |
| | • | | changing market or competitive product requirements; |
| | • | | unanticipated engineering complexities, and |
| | • | | failure to compete with new product releases by our competitors. |
Our industry has increased its focus on products that transmit voice, video and data traffic over shorter distances and that are offered at lower cost than the products that we offer to our telecommunications customers for transmission of information over longer distances. If we are unable to develop products that meet the requirements of potential customers of these products, our business, results of operations, and financial condition could suffer.
13
The development of new, technologically advanced products is a complex and uncertain process requiring high levels of innovation and highly skilled engineering and development personnel, as well as the accurate anticipation of technological and market trends. We cannot assure that we will be able to identify, develop, manufacture, market or support new or enhanced products successfully, or on a timely basis. In addition, the introduction of new and enhanced products may cause our customers to defer or cancel orders for existing products. To the extent customers defer or cancel orders for existing products due to the expectation of a new product release, or if there is any delay in the development or introduction of our new products or the enhancements of our products, our business, results of operations, and financial condition would suffer. Further, we cannot assure that our new products will gain market acceptance or that we will be able to respond effectively to competitive products, technological changes or emerging industry standards. Any failure to respond effectively to competitive products, technological change or emerging industry standards would significantly harm our business, results of operations and financial condition.
If we are unable to forecast component and material requirements accurately or if we are unable to commit to deliver sufficient quantities of our products to satisfy customers’ needs, our results of operations will be adversely affected.
Our customers typically require us to commit to delivering certain quantities of our products to them (in guaranteed safety stock, guaranteed capacity or otherwise) without committing themselves to purchase such products, or any quantity of such products. Therefore, wide variations between estimates of our customers’ needs and their actual purchases may result in:
| | • | | a surplus and potential obsolescence of inventory, materials and capacity, if estimates of our customers’ requirements are greater than our customers’ actual need; or |
| | • | | a lack of sufficient products to satisfy our customers’ needs, if estimates of our customers’ requirements are less than our customers’ actual needs. |
We use a rolling six-month to twelve-month demand forecast based on anticipated and historical product orders to determine our component and material requirements. It is very important that we accurately predict both the demand for our products and the lead times required to obtain the necessary components and materials. It is very difficult to develop accurate forecasts of product demand, especially given the current uncertain conditions in the telecommunications industry. Order cancellations and lower order volumes by our customers have in the past created excess inventories. For example, inventory write-offs are primarily the result of our inability to anticipate decreases in demand for certain of our products and variations in product mix ordered by our customers. For the fiscal years ended June 30, 2008 and June 30, 2007, we recorded write-offs of $4.7 million and $12.9 million, respectively, for excess and obsolete inventory. If we fail to accurately predict both the demand for our products and the lead times required to obtain the necessary components and materials in the future, we could incur additional excess and obsolete inventory write-downs. If we underestimate our component and material requirements, we may have inadequate inventory, which could interrupt our manufacturing and delay delivery of our products to our customers. Any of these occurrences would negatively affect our business, results of operations, and financial condition.
Network carriers and telecommunication system integrators historically have required that suppliers commit to provide specified quantities of products over a given period of time. If we are unable to commit to deliver sufficient quantities of our products to satisfy a customer’s anticipated needs, we may lose the opportunity to make significant sales to that customer over a lengthy period of time. In addition, we may be unable to pursue large orders if we do not have sufficient manufacturing capacity to enable us to provide customers with specified quantities of products. We rely heavily upon the capacity and willingness of third party contract manufacturers and materials suppliers to enable us to fulfill our commitments to our customers, but we generally do not have the benefit of long term or other supply or services contracts with our third party contract manufacturers and materials suppliers, who are generally not obligated to adhere to our production schedule. If we cannot deliver sufficient quantities of our products, we may lose business, which could adversely impact our business, results of operations and financial condition.
14
If our customers do not qualify our manufacturing processes, they may not purchase our products and our operating results could suffer.
Certain of our customers will not purchase our products prior to qualification of our manufacturing processes and approval of our quality assurance system. The qualification process determines whether the manufacturing line meets the quality, performance, and reliability standards of our customers. These customers may also require that we, and any manufacturer that we may use, be registered under international quality standards, such as ISO 9001. Our United States, Europe and Asia sites are currently TL-9000 certified. Delays in obtaining customer qualification of our manufacturing processes or approval of our quality assurance system may cause a product to be removed from a long-term supply program and result in significant lost revenue opportunity over the term of that program.
We depend upon a limited number of contract manufacturers and materials suppliers to manufacture and provide a majority of our products, and our dependence on these manufacturers and suppliers may result in product delivery delays, may harm our operations or have an adverse effect upon our business.
We rely on a limited number of outsourced manufacturers and suppliers to manufacture and provide a substantial majority of our components, subassemblies, and finished products. In particular, one contract manufacturer, Fabrinet, currently manufactures products for sale, which constitutes a significant majority of our net revenue. We intend to develop further our relationships with this and with other manufacturers so that they will eventually manufacture many of our high volume key components and subassemblies in the future. The qualification of these independent manufacturers and materials suppliers under quality assurance standards is an expensive and time-consuming process. Our independent manufacturers have a limited history of manufacturing optical subcomponents. Any interruption in the operations of these manufacturers, or any deficiency in the quality or quantity of the subcomponents or products built for us by these manufacturers, could impede our ability to meet our scheduled product deliveries to our customers. Operational issues could result, such as capacity constraints at our contract manufacturers, raw materials shortages, logistics issues, and manufacturing yield issues for some of our new products. As a result, we may lose existing or potential customers.
We have limited experience in working with outsourced manufacturers and suppliers. As a result, we may not be able to manage our relationships with them effectively. If we cannot manage our manufacturing and supplier relationships effectively, or if these manufacturers and suppliers fail to deliver components in a timely manner, we could experience significant delays in product deliveries, which may have an adverse effect on our business and results of operations. Increased reliance on outsourced manufacturing and suppliers, and the ultimate disposition of our manufacturing capacity in the future, may result in impairment expense relating to our long-lived assets in future periods, which would have an adverse impact on our business, financial condition, and results of operations.
Our products may have defects that might not be detected until full deployment of a customer’s network, which could result in a loss of customers and revenue and in damage to our reputation.
Our products are designed to be deployed in large and complex optical networks and must be compatible with existing and future components of such networks. Our products can only be fully tested for reliability when deployed in networks for long periods of time. Our products may not operate as expected, and our customers may discover errors, defects, or incompatibilities in our products only after they have been fully deployed and are operating under peak stress conditions. If we are unable to fix errors or other problems, we could experience:
| | • | | loss of customers or customer orders; |
| | • | | loss of or delay in revenues; |
| | • | | loss or damage to our brand and reputation; |
| | • | | inability to attract new customers or achieve market acceptance; |
| | • | | diversion of development resources; |
| | • | | increased service and warranty costs; |
15
| | • | | legal actions by our customers; and |
| | • | | increased insurance costs. |
We may be required to indemnify our customers against certain liabilities arising from defects in our products, which liabilities may also include the following costs and expenses:
| | • | | costs and expenses incurred by our customers or their customers to fix the problems; and |
| | • | | costs and expenses incurred by our customers or their customers to replace our products, or their products which incorporate our products, with other product solutions. |
While we carry insurance policies covering this type of liability, these policies may not provide sufficient protection should a claim be asserted. To date, product defects have not had a material negative effect on our business, results of operations, or financial condition; however, we cannot assure that they will not have a material negative effect on us in the future.
We depend on key personnel to manage our business effectively, and if we are unable to hire, retain, or motivate qualified personnel, our ability to sell our products could be harmed.
Our future success depends, in part, on certain key employees and on our ability to attract and retain highly skilled personnel. In addition, there have been changes in our executive management team, and there can be no assurance that these changes will be successful. The loss of the services of any of our key personnel, the inability to attract or retain qualified personnel, or delays in hiring required personnel, particularly engineering, sales or marketing personnel, may seriously harm our business, results of operations, and financial condition. For example, Dr. Jo Major, our former President and Chief Executive Officer, Marla Sanchez, our former Chief Financial Officer, and Pat Edsell, our former General Manager, recently left the Company. None of our officers or key employees has an employment agreement for a specific term, and these employees may terminate their employment at any time. We do not have key person life insurance policies covering any of our employees. Our ability to continue to attract and retain highly skilled personnel will be a critical factor in determining whether we will be successful in the future. Competition for highly skilled personnel is frequently intense, especially in the San Francisco Bay Area. We may not be successful in attracting, assimilating or retaining qualified personnel to fulfill our current or future needs.
In addition, we have implemented restructuring programs designed to attempt to improve our financial performance. Among other things, we have moved substantially all of our manufacturing operations to lower cost locations. As a result, our headcount in North America and Europe has been substantially reduced and may be reduced further in the future. To date, such actions have not resulted in substantial work stoppages. Decreases in labor productivity, however, whether formalized by a work stoppage or a strike, or by decreased productivity due to morale issues could have an adverse effect on our business and operating results.
We face various risks that could prevent us from successfully manufacturing, marketing and distributing our products internationally.
We have expanded our international operations in Thailand and China, including the expansion of overseas product manufacturing, and we may continue to expand internationally in the future. Further, we have increased international sales and intend to further increase our international sales and the number of our international customers. We have also initiated significant restructuring programs overseas, and may initiate additional restructuring programs overseas in the future. Our international operations have required and will continue to require significant management attention and financial resources. For instance, we have incurred, and may continue to incur, startup costs to open our operations center in Thailand and our research and development office in Shanghai, and may incur costs in transferring operations to Thailand. We currently have limited experience in manufacturing, marketing and distributing our products internationally, particularly from our new operations center in Thailand. In addition, international operations are subject to inherent risks, including, without limitation, the following:
| | • | | greater difficulty in accounts receivable collection and longer collection periods; |
| | • | | difficulties inherent in managing operations and employees in remote foreign operations; |
16
| | • | | import or export licensing and product certification requirements; |
| | • | | tariffs, duties, price controls or other restrictions on foreign currencies or trade barriers imposed by foreign countries; |
| | • | | potential adverse tax consequences; |
| | • | | seasonal reductions in business activity in some parts of the world; |
| | • | | burdens of complying with a wide variety of foreign laws and regulations, particularly with respect to taxes, intellectual property, license requirements, employment matters and environmental requirements; |
| | • | | the impact of recessions in economies outside of the United States; |
| | • | | unexpected changes in regulatory or certification requirements for optical systems or networks; and |
| | • | | political and economic instability, terrorism and war. |
Some of our suppliers and contract manufacturers, including Fabrinet, also have international operations and are subject to the risks described above. Even if we are able to manage the risks of international operations successfully, our business may be materially adversely affected if our suppliers or contract manufacturers are not able to manage these risks successfully.
A portion of our international revenues and expenses are now denominated in foreign currencies. It has not been our recent practice to engage in the hedging of foreign currency transactions to mitigate foreign currency risk. Therefore, fluctuations in the value of foreign currencies could have a negative impact on the profitability of our global operations, which would seriously harm our business, results of operations, and financial condition.
V. Intellectual Property and Litigation Risks.
Current and future litigation against us could be costly and time consuming to defend.
We are subject to legal proceedings and claims that arise in the ordinary course of business. Litigation may result in substantial costs and may divert management’s attention and resources, which may seriously harm our business, results of operations, financial condition and liquidity.
We may be unable to protect our proprietary technology, which could significantly impair our ability to compete.
We rely on a combination of patent, copyright, trademark and trade secret laws, confidentiality agreements and other contractual restrictions on disclosure to protect our intellectual property rights. We also rely on confidentiality agreements with our employees, consultants and corporate partners, and controlled access to and distribution of our technology, documentation and other confidential information. We have numerous patents issued or applied for in the United States and abroad, of which some may be jointly filed or owned with other parties. Further, we license certain intellectual property from third parties, including Alcatel-Lucent and Corning, that is critical to our business, and we also license intellectual property to other parties. We cannot assure that any patent applications or issued patents will protect our proprietary technology effectively, or that any patent applications or patents issued will not be challenged by third parties. Further, we cannot assure that parties from whom we license intellectual property will not violate their agreements with us; that they will not license their intellectual property to third parties; that their patent applications, patents and other intellectual property will protect our technology, products and business; or that their patent applications, patents, and other intellectual property will not be challenged by third parties. For example, Alcatel-Lucent has cross licenses with various third parties, which, when combined with their own intellectual property, may permit these third parties to compete with us. Our intellectual property also consists of trade secrets, requiring more monitoring and control mechanisms to protect. Despite our efforts to protect our proprietary rights, unauthorized parties may attempt to copy or otherwise obtain and use our products or technology. Monitoring unauthorized use of our products is difficult, and we cannot be certain that the steps we take will prevent misappropriation or unauthorized use of our technology. Further, other parties may independently develop similar or competing technology or design around any patents that may be issued or licensed to us.
17
We use various methods to attempt to protect our intellectual property rights. However, we cannot be certain that these methods will prevent the misappropriation of our intellectual property. In particular, the laws in foreign countries may not protect our proprietary rights as fully as the laws in the United States.
We face risks with regard to third-party intellectual property licenses.
From time to time we may be required to license technology or intellectual property from third parties for our product offerings or to develop new products or product enhancements. We cannot assure that third-party licenses will be available to us on commercially reasonable terms, if at all. The inability to obtain a necessary third-party license required for our product offerings or to develop new products and product enhancements could require us to substitute technology of lower quality or performance standards or of greater cost, either of which could prevent us from operating our business. If we are unable to obtain licenses from third parties if and as necessary, then we may also be subject to litigation to defend against infringement claims from these third parties.
We may become subject to litigation or claims from or against third parties regarding intellectual property rights, which could divert resources, cause us to incur significant costs, and restrict our ability to utilize certain technology.
We may become a party to litigation in the future to protect our intellectual property or we may be subject to litigation to defend against infringement claims of others. These claims and any resulting lawsuits, if successful, could subject us to significant liability for damages and invalidation of our proprietary rights. These lawsuits, regardless of their success, would likely be time-consuming and expensive to resolve and would divert management’s time and attention. Any potential intellectual property litigation also could force us to do one or more of the following:
| | • | | stop selling, incorporating, or using our products that use the challenged intellectual property; |
| | • | | obtain a license to sell or use the relevant technology from the owner of the infringed intellectual property right, which license may not be available on reasonable terms, or at all; |
| | • | | redesign the products that use the technology; or |
| | • | | indemnify certain customers and others against intellectual property claims asserted against them. |
If we are forced to take any of these actions, our business may be seriously harmed.
We may in the future initiate claims or litigation against third parties for infringement of our proprietary rights in order to determine the scope and validity of our proprietary rights or the proprietary rights of competitors, or we may be required to grant certain third parties permission to enforce our intellectual property on our behalf. These claims could result in us being joined as a party to a lawsuit, counterclaims against us or our customers, invalidation or narrow interpretations of our proprietary rights, costly litigation, and the diversion of our technical and management personnel’s time and attention. Although we carry general liability insurance, our insurance may not cover potential claims of the above types or may not be adequate to indemnify us for all liability that may be imposed.
VI. Other Risks.
Our business and future operating results may be adversely affected by events that are outside of our control.
Our business and operating results are vulnerable to interruption by events outside of our control, such as earthquakes, fire, power loss, telecommunications failures and uncertainties arising out of terrorist attacks throughout the world, including the continuation or potential worsening of the current global economic environment, the economic consequences of military action and the associated political instability, and the effect of heightened security concerns on domestic and international travel and commerce. We cannot assure that the insurance we maintain against fires, floods and general business interruptions will be adequate to cover our losses for such events in any particular case.
In addition, we handle hazardous materials as part of our manufacturing activities and are subject to a variety of governmental laws and regulations related to the use, storage, recycling, labeling, reporting, treatment,
18
transportation, handling, discharge and disposal of such hazardous materials. Although we believe that our operations conform to presently applicable environmental laws and regulations, we may incur costs in order to comply with current or future environmental laws and regulations, including costs associated with permitting, investigation and remediation of hazardous materials, and installation of capital equipment relating to pollution abatement, production modification and/or hazardous materials management. In addition, we currently sell products that incorporate firmware and electronic components. The additional level of complexity created by combining firmware and electronic components with our optical components requires that we comply with additional regulations, both domestically and abroad, related to power consumption, electrical emissions and homologation. Any failure to obtain the necessary permits or comply with the necessary laws and regulations successfully could have a material adverse effect on our operations.
Certain provisions of our certificate of incorporation and bylaws and Delaware law could delay or prevent a change of control of us.
Certain provisions of our certificate of incorporation and bylaws and Delaware law may discourage, delay or prevent a merger or acquisition that a stockholder may consider favorable. These provisions allow us to issue preferred stock with rights senior to those of our common stock and impose various procedural and other requirements that could make it more difficult for our stockholders to effect certain corporate actions.
| ITEM 1B. | UNRESOLVED STAFF COMMENTS |
Not applicable.
We lease the following properties:
| | | | | | |
Location | | Square
Feet | | Principal Operations | | Date Lease Expires |
Bangkok, Thailand | | 15,610 | | Administrative office | | February 28, 2009 |
Bangkok, Thailand | | 3,300 | | Warehouse | | May 31, 2009 |
Horseheads, New York | | 15,000 | | Administrative office and Research & Development | | January 31, 2009 |
Fremont, California #1 | | 54,000 | | Corporate headquarters | | October 17, 2009 |
Fremont, California #2 | | 91,000 | | Administrative office | | April 15, 2010 |
Newark, California #1 | | 48,000 | | Administrative office (Vacant) | | November 30, 2010 |
Newark, California #2 | | 62,000 | | Administrative office | | November 30, 2010 |
Melbourne, Florida | | 7,000 | | Administrative office and Research & Development | | May 15, 2009 |
Villebon, France | | 8,830 | | Administrative office and Research & Development | | April 25, 2010 |
San Donato, Italy | | 65,700 | �� | Manufacturing and Administrative | | June 30, 2011 |
Shanghai, China | | 24,400 | | Administrative office and Reasearch & Development | | December 31, 2009 |
We believe that existing facilities are in excess of our needs. We are currently evaluating the most appropriate use of our existing facilities and the possibility of subleasing more of our space to third parties. We currently sublease some of the space at our facilities in Fremont and Newark, California to other companies.
From time to time, we are subject to various legal proceedings that arise from the normal course of business activities. In addition, from time to time, third parties assert patent or trademark infringement claims against us in the form of letters and other forms of communication. We do not believe that any of these legal proceedings or claims is likely to have a material adverse effect on our consolidated results of operations, financial condition, or cash flows. However, it is possible that an unfavorable resolution of one or more such proceedings could in the future materially affect our future results of operations, cash flows, or financial position in a particular period.
IPO Class Action Lawsuit
On August 6, 2001, Avanex, certain of its officers and directors, and various underwriters in its initial public offering (“IPO”) were named as defendants in a class action filed in the United States District Court for the Southern District of New York, captioned Beveridge v. Avanex Corporation et al., Civil Action No. 01-CV-7256.
19
This action and other subsequently filed substantially similar class actions have been consolidated into In re Avanex Corp. Initial Public Offering Securities Litigation, Civil Action No. 01 Civ. 6890. The consolidated amended complaint in the action generally alleges that various investment bank underwriters engaged in improper and undisclosed activities related to the allocation of shares in Avanex’s IPO. Plaintiffs have brought claims for violation of several provisions of the federal securities laws against those underwriters, and also against Avanex and certain of its directors and officers, seeking unspecified damages on behalf of a purported class of purchasers of Avanex’s common stock between February 3, 2000 and December 6, 2000. Various plaintiffs have filed similar actions asserting virtually identical allegations against more than 40 investment banks and 250 other companies. All of these “IPO allocation” securities class actions currently pending in the Southern District of New York have been assigned to Judge Shira A. Scheindlin for coordinated pretrial proceedings as In re Initial Public Offering Securities Litigation, 21 MC 92. On October 9, 2002, the claims against Avanex’s directors and officers were dismissed without prejudice pursuant to a tolling agreement. The issuer defendants filed a coordinated motion to dismiss all common pleading issues, which the Court granted in part and denied in part in an order dated February 19, 2003. The Court’s order did not dismiss the Section 10(b) or Section 11 claims against Avanex.
In June 2004, a stipulation of settlement and release of claims against the issuer defendants, including Avanex, was submitted to the Court for approval. In August 2005, the Court preliminarily approved the settlement. In December 2006, the appellate court overturned the certification of classes in the six test cases that were selected by the underwriter defendants and plaintiffs in the coordinated proceedings. The case involving Avanex is not one of the six test cases. Because class certification was a condition of the settlement, it was unlikely that the settlement would receive final Court approval. On June 25, 2007, the Court entered an order terminating the proposed settlement based upon a stipulation among the parties to the settlement. Plaintiffs have filed amended master allegations and amended complaints and moved for class certification in the six focus cases, which the defendants in those cases have opposed. On March 26, 2008, the Court largely denied the defendants’ motion to dismiss the amended complaints. It is uncertain whether there will be any revised or future settlement. If a settlement does not occur, and litigation against Avanex continues, Avanex believes it has meritorious defenses and intends to defend the action vigorously. Nevertheless, an unfavorable result in litigation may result in substantial costs and may divert management’s attention and resources, which could harm our business, financial condition, results of operations or cash flow in a particular period.
Section 16(b) Demand
On October 3, 2007, a purported Avanex shareholder filed a complaint for violation of Section 16(b) of the Securities Exchange Act of 1934, which prohibits short-swing trading, against the Company’s IPO underwriters. The complaint, Vanessa Simmonds v. Morgan Stanley, et al., Case No. C07-01568, filed in District Court for the Western District of Washington, seeks the recovery of short-swing profits. The Company is named as a nominal defendant. No recovery is sought from the Company.
Arbitration against 3S Photonics
On December 27, 2007, the Company filed an arbitration claim against 3S Photonics in New York regarding disputes primarily involving the early termination of the Global Distributor Agreement by 3S Photonics and other payment obligations the Company believed 3S Photonics owes to it. 3S Photonics filed a response and counter-claim to the arbitration in which it denied the Company’s claim and alleged among other matters that the Company had breached certain contractual agreements resulting in damages to 3S Photonics. In March 2008, 3S Photonics instituted legal proceedings against the Company in the Commercial Court of Evry in France. 3S Photonics alleged that the Company disparaged 3S Photonics by, among other things, issuing a press release announcing that the Company had initiated arbitration proceedings against 3S Photonics relating to the early termination of the Global Distributor Agreement.
In June 2008, the Company settled its dispute with 3S Photonics. While neither side admitted liability, the two parties agreed to a settlement that included payables, receivables and lost profits under the parties’ terminated Global Distributor Agreement, and a release by both parties of all claims asserted against each other. With this resolution, there is no further litigation between Avanex and 3S Photonics.
20
| ITEM 4. | SUBMISSION OF MATTERS TO A VOTE OF SECURITY HOLDERS |
There were no matters submitted to a vote of security holders during the fourth quarter of fiscal 2008.
EXECUTIVE OFFICERS OF THE COMPANY
Our executive officers as of August 26, 2008 are as follows:
| | | | |
Name | | Age | | Position |
Giovanni Barbarossa | | 46 | | Interim Chief Executive Officer, Senior Vice President and Chief Technology Officer |
Mark Weinswig | | 35 | | Interim Chief Financial Officer, Vice President, Finance and Treasurer |
Bradley Kolb | | 49 | | Senior Vice President, Operations |
Scott Parker | | 52 | | Senior Vice President, Sales |
Giovanni Barbarossa has served as our Interim Chief Executive Officer since July 2008 and as our Senior Vice President and Chief Technology Officer since May 2002. Dr. Barbarossa led the Active Component Business Unit from August 2004 to June 2005 and served as Vice President of Product Development from May 2001 to August 2004. Prior to being promoted to Vice President of Product Development, Dr. Barbarossa was Director of Research and Development from February 2000 until May 2001. From 1999 to February 2000, Dr. Barbarossa served as Project Manager in the Optical Networking Division of Agilent Technologies. Dr. Barbarossa held various positions, including Team Leader in the Optical Application Specific Integrated Circuits Department and Member of Technical Staff of Bell Laboratories at Lucent Technologies, a developer and manufacturer of communications products, from 1995 through 1999. Dr. Barbarossa received his Ph.D. degree in Electronics Engineering from the University of Glasgow, U.K. and a B.S. degree in Electrical Engineering from the University of Bari, Italy.
Mark Weinswig has served as our Interim Chief Financial Officer and Vice President, Finance and Treasurer since July 2008. Prior to that, Mr. Weinswig served as Director and Business Unit Controller at Coherent, Inc., from January 2006 until July 2008. Prior to that, he served as Vice President, Financial Planning and Business Development at Avanex from September 2003 until January 2006, and as Director Investor Relations and Strategic Projects from April 2000 until May 2003. During the period from May 2003 until September 2003, Mr. Weinswig worked at the Company as a consultant. Before he joined the company in April 2000, Mr. Weinswig was an analyst from 1998 to 2000 with Morgan Stanley Dean Witter’s Institutional Equity Research Group, where he focused on the telecommunications industry. Mr. Weinswig is a Certified Public Accountant (inactive), has the Certified Financial Analyst designation and holds an M.B.A from the University of Santa Clara, and a bachelor’s degree in Business Administration from Indiana University.
Bradley Kolb joined Avanex in March 2006, as Senior Vice-President of Operations. Mr. Kolb has 20 years of operational roles and an extensive background in the management of contract manufacturing in different continents including Europe, North America and Asia. Between October 2003 and March 2006, Mr. Kolb was Vice President of Operations and Chief Financial Officer at Vivato, Inc., a venture capital backed startup firm. Between January 2001 and September 2003, Mr. Kolb was Vice President of Operations at Proxim Inc., a manufacturer of wireless networking equipment for WiFi and broadband wireless networks. Between 1999 and 2001, Mr. Kolb was Vice President of Operations at Resilience Corporation, a venture backed company producing fault tolerant computers. Previously, Mr. Kolb held various positions at American Microdevices Manufacturing Inc., Motorola-Indala Corporation, Litton Applied Technology and Varian Associates. Mr. Kolb holds an M.B.A. from the Graduate School of Business at the University of Chicago, and a B.S. degree in Electrical Engineering from the University of Illinois.
Scott Parker joined Avanex in November 2007 as our Senior Vice President, Sales. Prior to joining Avanex, Mr. Parker served as Vice President of Sales and Marketing at Integration Associates, Inc. from April 2004 to November 2007 and as CEO at Chelsio Communications, Inc. from June 2002 to February 2004. Prior to that, Mr. Parker served as Senior Vice President of Sales and Marketing for JDS Uniphase Corporation from March 2000 to April 2002. Mr. Parker has also held sales and general manager positions at VLSI Research Inc., at National Semiconductor Corporation and at Intel Corporation. Mr. Parker holds an M.B.A and a B.S. in Marketing, both from the University of Utah.
21
PART II.
| ITEM 5. | MARKET FOR REGISTRANT’S COMMON EQUITY, RELATED STOCKHOLDER MATTERS AND ISSUER PURCHASES OF EQUITY SECURITIES |
Our common stock is traded on the NASDAQ Global Market under the symbol “AVNX.” The following table shows, for the periods indicated, the high and low per share closing prices of common stock, as reported by the NASDAQ Global Market for each of the last eight quarters ending June 30, 2008:
| | | | | | |
| | | High | | Low |
Fiscal year 2007 Quarters Ended: | | | | | | |
September 30, 2006 | | $ | 28.80 | | $ | 18.75 |
December 31, 2006 | | $ | 31.65 | | $ | 22.35 |
March 31, 2007 | | $ | 34.20 | | $ | 26.40 |
June 30, 2007 | | $ | 27.45 | | $ | 22.35 |
| | |
Fiscal year 2008 Quarters Ended: | | | | | | |
September 30, 2007 | | $ | 30.75 | | $ | 22.50 |
December 31, 2007 | | $ | 28.35 | | $ | 14.55 |
March 31, 2008 | | $ | 15.45 | | $ | 8.70 |
June 30, 2008 | | $ | 18.00 | | $ | 9.60 |
Following the close of market on August 12, 2008, we effected a fifteen-for-one reverse stock split of our common stock. Accordingly, each fifteen shares of issued and outstanding Avanex common stock and equivalents as of the close of market on August 12, 2008 was converted into one share of common stock, and the reverse stock split was reflected in the trading price of Avanex’s common stock at the opening of market on August 13, 2008.
On August 26, 2008, the last reported sale price of our common stock on the NASDAQ Global Market was $6.35 per share. As of August 26, 2008, there were approximately 438 stockholders of record of our common stock. Because brokers and other institutions on behalf of stockholders hold many of our shares of common stock, we are unable to estimate the total number of stockholders represented by these record holders.
We have never declared or paid any cash dividends on our common stock. We currently intend to retain any future earnings to fund the development and growth of our business and do not anticipate paying any cash dividends in the foreseeable future.
22
| ITEM 6. | SELECTED FINANCIAL DATA |
You should read the following selected consolidated financial data in conjunction with “Management’s Discussion and Analysis of Financial Condition and Results of Operations” and our consolidated financial statements and the notes thereto included elsewhere in this Annual Report on Form 10-K. The statement of operations data set forth below for the years ended June 30, 2008, 2007 and 2006 and the balance sheet data as of June 30, 2008 and 2007 are derived from, and are qualified by reference to, our audited consolidated financial statements included elsewhere in this Annual Report on Form 10-K. The statement of operations data set forth below for the years ended June 30, 2005 and 2004 and the balance sheet data as of June 30, 2006, 2005, and 2004 are derived from audited financial statements not included in this Annual Report on Form 10-K.
| | | | | | | | | | | | | | | | | | | | |
| | | 2008 (1) | | | 2007 (1) | | | 2006 (1) | | | 2005 | | | 2004 (2) | |
| | | (In thousands, except per share data) | |
Consolidated Statement of Operations Data: | | | | | | | | | | | | | | | | | | | | |
Net revenue | | $ | 208,094 | | | $ | 212,755 | | | $ | 162,944 | | | $ | 160,695 | | | $ | 106,932 | |
Cost of revenue | | | 144,509 | | | | 174,550 | | | | 154,484 | | | | 165,258 | | | | 133,259 | |
| | | | | | | | | | | | | | | | | | | | |
Gross profit (loss) | | | 63,585 | | | | 38,205 | | | | 8,460 | | | | (4,563 | ) | | | (26,327 | ) |
Operating expenses: | | | | | | | | | | | | | | | | | | | | |
Research and development | | | 28,325 | | | | 25,231 | | | | 23,471 | | | | 33,124 | | | | 42,107 | |
Sales and marketing | | | 16,735 | | | | 15,261 | | | | 13,236 | | | | 16,803 | | | | 19,808 | |
General and administrative | | | 18,238 | | | | 23,278 | | | | 16,652 | | | | 17,758 | | | | 24,718 | |
Amortization of intangibles | | | 771 | | | | 2,703 | | | | 5,448 | | | | 5,723 | | | | 4,573 | |
Restructuring | | | (164 | ) | | | 1,511 | | | | 1,912 | | | | 29,272 | | | | 3,779 | |
Gain on disposal of property and equipment | | | (23 | ) | | | (527 | ) | | | (5,064 | ) | | | (1,850 | ) | | | — | |
(Gain) loss on sale of subsidiary | | | (1,996 | ) | | | 3,216 | | | | — | | | | — | | | | — | |
| | | | | | | | | | | | | | | | | | | | |
Total operating expenses | | | 61,886 | | | | 70,673 | | | | 55,655 | | | | 100,830 | | | | 94,985 | |
| | | | | | | | | | | | | | | | | | | | |
Income (loss) from operations | | | 1,699 | | | | (32,468 | ) | | | (47,195 | ) | | | (105,393 | ) | | | (121,312 | ) |
Interest and other income (expense), net | | | 3,948 | | | | 2,327 | | | | (7,497 | ) | | | (2,978 | ) | | | 3,299 | |
| | | | | | | | | | | | | | | | | | | | |
Income (loss) from continuing operations before income taxes and discontinued operations | | | 5,647 | | | | (30,141 | ) | | | (54,692 | ) | | | (108,371 | ) | | | (118,013 | ) |
Provision for income taxes | | | (927 | ) | | | (464 | ) | | | — | | | | — | | | | — | |
| | | | | | | | | | | | | | | | | | | | |
Income (loss) before discontinued operations | | | 4,720 | | | | (30,605 | ) | | | (54,692 | ) | | | (108,371 | ) | | | (118,013 | ) |
Loss from discontinued operations | | | — | | | | — | | | | — | | | | — | | | | (6,054 | ) |
| | | | | | | | | | | | | | | | | | | | |
Net income (loss) | | $ | 4,720 | | | $ | (30,605 | ) | | $ | (54,692 | ) | | $ | (108,371 | ) | | $ | (124,067 | ) |
| | | | | | | | | | | | | | | | | | | | |
Income (loss) per share from continuing operations before discontinued operations basic and diluted | | $ | 0.37 | | | $ | (2.12 | ) | | $ | (5.03 | ) | | $ | (11.27 | ) | | $ | (13.56 | ) |
Income (loss) per share from discontinued operations basic and diluted | | $ | — | | | $ | — | | | $ | — | | | $ | — | | | $ | (0.70 | ) |
Net income (loss) per common share basic | | $ | 0.31 | | | $ | (2.16 | ) | | $ | (5.03 | ) | | $ | (11.27 | ) | | $ | (14.25 | ) |
Net income (loss) per common share diluted | | $ | 0.31 | | | $ | (2.16 | ) | | $ | (5.03 | ) | | $ | (11.27 | ) | | $ | (14.25 | ) |
Weighted average number of shares used in computing basic net income (loss) per common share | | | 15,242 | | | | 14,196 | | | | 10,882 | | | | 9,616 | | | | 8,704 | |
Weighted average number of shares used in computing diluted net income (loss) per common share | | | 15,370 | | | | 14,196 | | | | 10,882 | | | | 9,616 | | | | 8,704 | |
| | | | | |
Balance Sheet Data: | | | | | | | | | | | | | | | | | | | | |
Cash, cash equivalents, restricted cash and short-term investments | | $ | 59,205 | | | $ | 47,399 | | | $ | 74,335 | | | $ | 73,905 | | | $ | 89,090 | |
Long-term investments | | $ | — | | | $ | — | | | $ | — | | | $ | — | | | $ | 55,145 | |
Working capital | | $ | 71,678 | | | $ | 63,149 | | | $ | 82,364 | | | $ | 75,720 | | | $ | 83,804 | |
Total assets | | $ | 141,067 | | | $ | 135,000 | | | $ | 165,558 | | | $ | 199,656 | | | $ | 275,196 | |
Long-term liabilities | | $ | 6,563 | | | $ | 9,619 | | | $ | 29,187 | | | $ | 52,919 | | | $ | 26,556 | |
Total stockholders’ equity | | $ | 85,395 | | | $ | 72,082 | | | $ | 73,338 | | | $ | 53,748 | | | $ | 157,464 | |
| (1) | Net loss for fiscal 2008, fiscal 2007, and fiscal 2006 included stock-based compensation expense under Statement of Financial Accounting Standards No. 123 (revised 2004), “Share-Based Payment,” (“SFAS 123(R)”) of $6.0 million, $7.1 million and $4.5 million, respectively, related to employee stock options and employee stock purchases. For the years ending June 30, 2005, and 2004, the Company accounted for stock option grants and stock purchase rights to employees and directors in accordance with Accounting Principles Board Opinion No. 25, “Accounting for Stock Issued to Employees” (“APB Opinion No. 25”) and, accordingly, recognized no compensation expense for stock option grants or stock purchase rights with an exercise price equal to or greater than the fair value of the shares at the date of grant. See Note 13 to the Consolidated Financial Statements. |
| (2) | We acquired Alcatel’s and Corning’s optical components businesses on July 31, 2003 in a transaction accounted for as a purchase. Additionally, we acquired certain assets of Vitesse Semiconductor’s Optical Systems Division on August 28, 2003 in a transaction accounted for as a purchase. The consolidated statement of operations for fiscal year 2004 include the results of operations of the optical components businesses acquired from Alcatel and Corning subsequent to July 31, 2003 and the optical systems business acquired from Vitesse subsequent to August 28, 2003. |
23
| ITEM 7. | MANAGEMENT’S DISCUSSION AND ANALYSIS OF FINANCIAL CONDITION AND RESULTS OF OPERATIONS |
You should read the following discussion and analysis of our financial condition and results of operations together with “Selected Financial Data” and our consolidated financial statements and related notes appearing elsewhere in this Annual Report on Form 10-K. This discussion and analysis contains forward-looking statements that involve risks, uncertainties and assumptions including, without limitation, statements regarding our operating expenses, gross margin, and statements regarding our expectations, beliefs, anticipations, commitments, intentions and strategies regarding the future. The actual results may differ materially from those anticipated in these forward-looking statements as a result of certain factors, including, but not limited to, those presented under “Risk Factors” in Item 1A and elsewhere in this Annual Report on Form 10-K. For ease of reference, we refer to the fiscal years ended June 30, 2008, June 30, 2007, June 30, 2006, June 30, 2005, and June 30, 2004 as fiscal 2008, fiscal 2007, fiscal 2006, fiscal 2005, and fiscal 2004, respectively.
Overview
We design, manufacture and market fiber optic-based products that increase the performance of optical networks. We sell our products to telecommunications system integrators and their network carrier customers. We were incorporated in October 1997 in California and reincorporated in Delaware in January 2000. We began making volume shipments of our products during the quarter ended September 30, 1999.
In fiscal 2004, we assumed restructuring liabilities with fair values of $64.1 million at the date of acquisition of the optical components businesses of Alcatel-Lucent and Corning, which were included in the purchase price. Subsequent to these acquisitions, we have continued to restructure our organization, primarily through the downsizing of our workforce and the abandonment of excess facilities. As of June 30, 2008, our accrued restructuring liability balance was $8.0 million, consisting of excess facilities costs payable through fiscal 2011.
The restructurings have resulted in, among other things, a significant reduction in the size of our workforce, consolidation of our facilities, and increased reliance on outsourced, third-party manufacturing. In March 2005, we announced that we had opened an operations center in Bangkok, Thailand to centralize global manufacturing and operational overhead functions in a lower-cost region. In July 2005, we announced the opening of a development and marketing office in Shanghai, China. In April 2007, we sold ninety percent (90%) of the share capital and voting rights of our wholly owned subsidiary, Avanex France, which operated our semiconductor fabs and associated product lines located in Nozay, France.
Although we have relocated most of our manufacturing operations to reduce our production costs, we expect to continuously take actions to further reduce costs and improve our gross margin. However, there can be no assurance that our cost structure will not increase in the future or that we will be able to align our cost structure with our expectations.
Following the close of market on August 12, 2008, we effected a fifteen-for-one reverse stock split of our common stock. Accordingly, each fifteen shares of issued and outstanding Avanex common stock and equivalents as of the close of market on August 12, 2008 was converted into one share of common stock, and the reverse stock split was reflected in the trading price of Avanex’s common stock at the opening of market on August 13, 2008. Unless indicated otherwise, all share amounts and per share prices appearing in this Annual Report on Form 10-K reflect the reverse stock split for all periods presented.
Net Revenue. The market for optical equipment continues to evolve and the volume and timing of orders is difficult to predict. A customer’s decision to purchase our products typically involves a commitment of its resources and a lengthy evaluation and product qualification process. This initial evaluation and product qualification process typically takes several months and includes technical evaluation, integration, testing, planning and implementation into the equipment design. Implementation cycles for our products can be lengthy, and the practice of customers in the communications industry to sporadically place orders with short lead time may cause our net revenue, gross margin, operating results and the identity of our largest customers to vary significantly and unexpectedly from quarter to quarter.
24
To date, a substantial proportion of our sales have been concentrated with a limited number of customers. During fiscal 2008, two customers accounted for 25% and 21% of our net revenue, respectively. During fiscal 2007, two customers accounted for 29% and 17% of our net revenue, respectively. During fiscal 2006, two customers accounted for 27% and 11% of our net revenue, respectively. We expect that a substantial portion of our sales will remain concentrated with a limited number of customers.
Cost of Revenue. Our cost of revenue consists of costs of components and raw materials, direct labor, warranty, manufacturing overhead, payments to our contract manufacturers and inventory write-offs for obsolete and excess inventory. We rely on a single or limited number of suppliers to manufacture some key components and raw materials used in our products, and we rely on the outsourcing of some turnkey solutions.
We write off the cost of inventory that we specifically identify and consider obsolete or in excess of future sales estimates. We define obsolete inventory as products that we no longer market, for which there is no demand, or inventory that will no longer be used in the manufacturing process. Excess inventory is generally defined as inventory in excess of projected usage, and is determined using management’s best estimate of future demand at the time, based upon information then available to us. We wrote off excess and obsolete inventory of $4.7 million in fiscal 2008, $12.9 million in fiscal 2007, and $12.8 million in fiscal 2006.
Gross Profit.Gross profit represents revenue less cost of revenue. During fiscal 2008, gross margin increased to 31% of revenue, which was an increase in gross margin of 13 percentage points over our fiscal 2007 gross margin of 18%. The Global Distributor Agreement and legal settlement with 3S Photonics comprised 2 percentage points of this increase. The remainder of the increase was due to a more profitable mix of products sold to our customers, decreased vendor costs, improved yields, the introduction of new products with lower production costs, and cost reductions resulting from having our design and operations teams working with our contract manufacturers to lower production costs.
Research and Development Expenses. Research and development expenses consist primarily of salaries and related personnel costs, fees paid to consultants and outside service providers, costs of allocated facilities, non-recurring engineering charges, and prototype costs related to the design, development, testing, pre-manufacturing, and significant improvement of our products. We expense our research and development costs as they are incurred. We believe that research and development is critical to our strategic product development objectives. We further believe that, in order to meet the changing requirements of our customers, we must continue to fund investments in several development projects in parallel.
Sales and Marketing Expenses. Sales and marketing expenses consist primarily of salaries, commissions, and related personnel costs of employees in sales, marketing, customer service, and costs of allocated facilities, and promotional and other marketing expenses.
General and Administrative Expenses. General and administrative expenses consist primarily of salaries and related personnel costs for executive, finance, accounting, legal, and human resources personnel, costs of allocated facilities, recruiting expenses, professional fees, and other corporate expenses.
Amortization of Intangibles. A portion of the purchase price in a business combination is allocated to goodwill and intangibles. Goodwill is not amortized, but rather is assessed for impairment at least annually. Intangible assets with definite lives continue to be amortized over their estimated useful lives.
Restructuring. Restructuring expense generally includes employee severance costs and the costs of excess facilities associated with formal restructuring plans.
Gain on Disposal of Property and Equipment. Gain on disposals includes gains incurred as a result of the disposal of property, plant, or equipment for an amount greater than the net book value.
Gain (loss) on Sale of Subsidiary. Gain (loss) on sale of subsidiary consists of the net gain (loss) from the sale of our subsidiary in France in April 2007.
Interest and Other Income. Interest and other income consist primarily of interest earned from the investment of our cash and cash equivalents, short-term investments, long-term investments, and foreign currency exchange rate loss.
25
Interest and Other Expense. Interest and other expense consist primarily of interest expense associated with borrowings under our line of credit, senior secured convertible notes, and capital lease obligations.
Income Taxes. In accordance with Financial Accounting Standard Board (“FASB”) Statement No. 109, “Accounting for Income Taxes”, we recognize income taxes using an asset and liability approach. This approach requires the recognition of taxes payable or refundable for the current year and deferred tax liabilities and assets for the future tax consequences of events that have been recognized in our consolidated financial statements or tax returns. The measurement of current and deferred taxes is based on provisions of the enacted tax law, and the effects of future changes in tax laws or rates are not anticipated.
In July 2007, we adopted FABS Interpretation (“FIN”) No. 48, which creates a single model to address accounting for uncertainty in tax positions by prescribing a minimum recognition threshold that a tax position is required to meet before being recognized in the financial statements. FIN 48 establishes a two-step approach for evaluating tax positions. The first step, recognition, occurs when a company concludes (based solely on the technical aspects of the tax matter) that a tax position is more likely than not to be sustained on examination by a taxing authority. The second step, measurement, is only considered after step one has been satisfied and measures any tax benefit at the largest amount that is deemed more likely than not to be realized upon ultimate settlement of the uncertainty. Tax positions that fail to qualify for initial recognition are recognized in the first subsequent interim period that they meet the more likely than not standard, when they are resolved through negotiation or litigation with the taxing authority or upon the expiration of the statute of limitations. The application of tax laws and regulations is subject to legal and factual interpretation, judgment and uncertainty. Tax laws and regulations themselves are subject to change as a result of changes in fiscal policy, changes in legislation, evolution of regulations and court rulings. Therefore, the actual liability for U.S. or foreign taxes may be materially different from our estimates, which could result in the need to record additional tax liabilities or potentially to reverse previously recorded tax liabilities.
Critical Accounting Policies and Estimates
The preparation of our consolidated financial statements in accordance with accounting principles generally accepted in the United States of America (“GAAP”) requires management to make estimates and assumptions that affect the reported amounts of assets, liabilities, net revenues and expenses, and related disclosures. We believe our estimates and assumptions are reasonable; however, actual results and the timing of the realization of such amounts could differ from these estimates. We believe the following critical accounting policies affect our more significant judgments and estimates used in the preparation of our consolidated financial statements.
Revenue Recognition. Our revenue recognition policy complies with SEC Staff Accounting Bulletin (“SAB”) No. 104, “Revenue Recognition.” We recognize product revenue when persuasive evidence of an arrangement exists, the product has been shipped, risk of loss has been transferred, collectibility is reasonably assured, fees are fixed or determinable and there are no uncertainties with respect to customer acceptance. We record a provision for estimated sales returns and price adjustments in the same period as when the related revenues are recorded. These estimates are based on historical sales returns and adjustments, other known factors, and our return policy. If future sales returns or price adjustment levels differ from the historical data we use to calculate these estimates, changes to the provision may be required. We generally do not accept product returns from customers; however, we do sell our products under warranty. The specific terms and conditions of our warranties vary by customer and region in which we do business; the warranty period is generally one year.
Allowance for Doubtful Accounts. In the last three years, our uncollectible accounts experience has been almost zero. When we become aware, subsequent to delivery, of a customer’s potential inability to meet its obligations, we record a specific allowance for doubtful accounts. If the financial condition of our customers were to deteriorate, resulting in an impairment of their ability to make payments, additional allowances may be required. Such an allowance may be magnified due to the concentration of our sales to a limited number of customers. At June 30, 2008, we determined that an allowance was not required.
Excess and Obsolete Inventory. We write off the cost of inventory that we specifically identify and consider obsolete or excessive to fulfill future sales estimates. We define obsolete inventory as products that we no longer market or for which there is no demand, or inventory that will no longer be used in the manufacturing process.
26
Excess inventory is generally defined as inventory in excess of projected usage, and is determined using management’s best estimate of future demand at the time, based upon information then available to us.
In estimating excess inventory, we use a range of six-month to twelve-month demand forecasts. We assess inventory on a quarterly basis and write-down those inventories which are obsolete or in excess of our forecasted usage to their estimated realizable value. Our estimates of realizable value are based upon our analysis including, but not limited to forecasted sales levels by product, expected product life cycle, product development plans, and future demand requirements. If actual market conditions are less favorable than our forecasts or actual demand from our customers is lower than our estimates, we may be required to record additional inventory write downs. If actual market conditions are more favorable than anticipated, inventory previously written down may be sold, resulting in lower cost of sales and higher income from operations than expected in that period.
Stock-based Compensation Expense. We account for employee stock-based compensation costs in accordance with FASB Statement No. 123(R), “Share-Based Payment” (“SFAS 123(R)”) and SAB No. 107, “Share-Based Payment” (“SAB 107”). We utilize the Black-Scholes option pricing model to estimate the fair value of employee stock-based compensation at the date of grant, which requires the input of highly subjective assumptions, including expected volatility and expected life. Historical volatility was used in estimating the fair value of our stock-based awards, and the expected life was estimated to be 6.25 years using the simplified method permitted under SAB 107 through December 31, 2007. Beginning January 1, 2008, we have estimated the time-to-exercise based on historical exercise patterns of employee and director populations. Further, as required under SFAS 123(R), we now estimate forfeitures for options granted that are not expected to vest. Changes in these inputs and assumptions can materially affect the measure of estimated fair value of our share-based compensation. The estimated fair value is charged to earnings on a straight-line basis over the vesting period of the underlying awards, which is generally four years. The Black-Scholes option pricing model was developed for use in estimating the fair value of traded options having no vesting restrictions and being fully transferable. Accordingly, our estimate of fair value may not represent the value assigned by a third-party in an arms-length transaction. While our estimate of fair value and the associated charge to earnings materially impacts our results of operations, it has no impact on our cash position.
Goodwill.SFAS No. 142, “Goodwill and Other Intangible Assets” (SFAS 142) prescribes a two-step process for impairment testing of goodwill. The first step screens for impairment, while the second step, measures the impairment, if any. SFAS 142 requires impairment testing based on reporting units. Management believes that we operate in one segment, which we consider our sole reporting unit. Therefore, goodwill is tested for impairment at the enterprise level. The fair value of the enterprise, which was determined based on our market capitalization at June 30, 2008 and 2007, exceeded its carrying value, and goodwill was determined not to be impaired at June 30, 2008 and 2007. Goodwill at June 30, 2008 and 2007 was $9.4 million.
Impairment of Long-lived Assets. We evaluate the recoverability of long-lived assets in accordance with FASB Statement No. 144, “Accounting for the Impairment or Disposal of Long-lived Assets.” Recoverability of the asset is measured by comparison of its carrying amount to the undiscounted future net cash flows the asset is expected to generate. If such assets are considered to be impaired, the impairment to be recognized is measured as the amount by which the carrying amount of the asset exceeds its fair market value.
Warranties. In general, we provide a product warranty for one year from the date of shipment. We accrue for the estimated cost to provide warranty services at the time revenue is recognized. The specific terms and conditions of our warranties vary by customer and region in which we do business. Our estimate of costs to service our warranty obligations is based on historical experience and expectation of future conditions. To the extent we experience increased warranty claim activity or increased costs associated with servicing those claims, our warranty costs will increase resulting in decreases to gross profit. Conversely, to the extent we experience decreased warranty claim activity, or decreased costs associated with servicing those claims, our warranty costs will decrease resulting in increases to gross profit. We periodically assess the adequacy of our recorded warranty liabilities and adjust the amounts as necessary.
Restructuring. During the past few years we have recorded significant accruals in connection with restructuring programs. Given the significance and complexity of restructuring activities, and the timing of the
27
execution of such activities, the restructuring accrual process involves periodic reassessments of estimates made at the time the original decisions were made, including evaluating real estate market conditions for expected vacancy periods and sub-lease rents. Although we believe that these estimates accurately reflect the costs of the restructuring programs, actual results may differ, thereby requiring us to record additional provisions or reverse a portion of such provisions.
Purchase Accounting. We account for business combinations under the purchase method of accounting and accordingly, the assets acquired and liabilities assumed are recorded at their fair values. The recorded values of assets and liabilities are based on management estimates, or if market price information is not available, based on the best information available. The values are based on our judgments and estimates, and accordingly, our financial position or results of operations may be affected by changes in these estimates and judgments. Specifically, our valuation of intangible assets is based on a discounted cash flow valuation methodology that incorporates estimates of future revenue, revenue growth, expenses, estimated useful lives, balance sheet assumptions and weighted-average cost of capital.
Contingencies. We are or have been subject to proceedings, lawsuits and other claims related to our initial public offering and other matters. We evaluate contingent liabilities including threatened or pending litigation in accordance with FASB Statement No. 5, “Accounting for Contingencies”. If the potential loss from any claim or legal proceeding is considered probable and the amount can be estimated, we accrue a liability for the estimated loss. Because of uncertainties related to these matters, accruals are based upon management’s judgment and the best information available to management at the time. As additional information becomes available, we reassess the potential liability related to its pending claims and litigation and may revise our estimates.
In addition to product warranties, we, from time to time, in the normal course of business, indemnify certain customers with whom we enter into contractual relationships. We have agreed to hold the other party harmless against third party claims that our products, when used for their intended purpose, infringe the intellectual property rights of such third party or other claims made against certain parties. It is not possible to determine the maximum potential amount of liability under these indemnification obligations due to the limited history of prior indemnification claims and the unique facts and circumstances that are likely to be involved in each particular claim. The estimated fair value of these indemnification provisions is minimal. To date, we have not incurred any costs related to claims under these provisions, and no amounts have been accrued in our financial statements.
Income Taxes. We account for income taxes under the liability method, which recognizes deferred tax assets and liabilities for the expected future tax consequences of temporary differences between the tax bases of assets and liabilities and their financial statement reported amounts, and for net operating loss and tax credit carry forwards. We record a valuation allowance against deferred tax assets when it is more likely than not that such assets will not be realized.
While we have considered future taxable income and ongoing prudent and feasible tax planning strategies in assessing the need for the valuation allowance, in the event we were to determine that we would be able to realize our deferred tax assets in the future in excess of our net recorded amount, an adjustment to the allowance for the deferred tax asset would increase income in the period such determination was made.
Change in accounting policy
In September 2006, the FASB issued SFAS No. 158, “Employers’ Accounting for Defined Benefit Pension and Other Postretirement Plans—an amendment of FASB Statements No. 87, 88, 106, and 132(R).” This pronouncement requires an employer to recognize the overfunded or underfunded status of a defined benefit postretirement plan (other than a multiemployer plan) as an asset or liability on its statement of financial position using prospective application. SFAS No. 158 also requires an employer to recognize changes in that funded status in the year in which the changes occur through comprehensive income. In addition, this statement requires an employer to measure the funded status of a plan as of the date of its year-end statement of financial position, with limited exceptions. We adopted this statement in fiscal 2007. Upon adoption, we recorded an adjustment of $0.3 million to the ending balance of accumulated other comprehensive income for pension benefit plan.
28
Results of Operations
The following table sets forth, for the periods indicated, the percentage of net revenue of certain items in our Consolidated Statements of Operations:
| | | | | | | | | | | | | | | | | | | | | |
| | | Years Ended June 30, | |
| | | 2008 | | | % of rev | | | 2007 | | | % of rev | | | 2006 | | | % of rev | |
Net revenue | | $ | 208,094 | | | 100 | % | | $ | 212,755 | | | 100 | % | | $ | 162,944 | | | 100 | % |
Cost of revenue | | | 144,509 | | | 69 | % | | | 174,550 | | | 82 | % | | | 154,484 | | | 95 | % |
| | | | | | | | | | | | | | | | | | | | | |
Gross profit | | | 63,585 | | | 31 | % | | | 38,205 | | | 18 | % | | | 8,460 | | | 5 | % |
Operating expenses: | | | | | | | | | | | | | | | | | | | | | |
Research and development | | | 28,325 | | | 14 | % | | | 25,231 | | | 12 | % | | | 23,471 | | | 15 | % |
Sales and marketing | | | 16,735 | | | 8 | % | | | 15,261 | | | 7 | % | | | 13,236 | | | 8 | % |
General and administrative | | | 18,238 | | | 9 | % | | | 23,278 | | | 11 | % | | | 16,652 | | | 10 | % |
Amortization of intangibles | | | 771 | | | 0 | % | | | 2,703 | | | 1 | % | | | 5,448 | | | 3 | % |
Restructuring | | | (164 | ) | | 0 | % | | | 1,511 | | | 1 | % | | | 1,912 | | | 1 | % |
Gain on disposal of property and equipment | | | (23 | ) | | 0 | % | | | (527 | ) | | 0 | % | | | (5,064 | ) | | -3 | % |
(Gain) loss on sale of subsidiary | | | (1,996 | ) | | -1 | % | | | 3,216 | | | 1 | % | | | — | | | 0 | % |
| | | | | | | | | | | | | | | | | | | | | |
Total operating expenses | | | 61,886 | | | 30 | % | | | 70,673 | | | 33 | % | | | 55,655 | | | 34 | % |
| | | | | | | | | | | | | | | | | | | | | |
Income (loss) from operations | | | 1,699 | | | 1 | % | | | (32,468 | ) | | -15 | % | | | (47,195 | ) | | -29 | % |
Interest and other income | | | 4,100 | | | 2 | % | | | 2,292 | | | 1 | % | | | 2,787 | | | 1 | % |
Interest and other expense | | | (152 | ) | | 0 | % | | | 35 | | | 0 | % | | | (10,284 | ) | | -6 | % |
| | | | | | | | | | | | | | | | | | | | | |
Income (loss) before income taxes | | | 5,647 | | | 3 | % | | | (30,141 | ) | | -14 | % | | | (54,692 | ) | | -34 | % |
Provision for income taxes | | | (927 | ) | | -1 | % | | | (464 | ) | | 0 | % | | | — | | | 0 | % |
| | | | | | | | | | | | | | | | | | | | | |
Net income (loss) | | $ | 4,720 | | | 2 | % | | $ | (30,605 | ) | | -14 | % | | $ | (54,692 | ) | | -34 | % |
| | | | | | | | | | | | | | | | | | | | | |
Net Revenue
Net revenue for fiscal 2008 was $208.1 million, which represents a decrease of $4.7 million or 2% from net revenue of $212.8 million for fiscal 2007. The decrease in revenue was attributable to a slight decrease in demand for our products from existing customers.
Net revenue for fiscal 2007 was $212.8 million, which represents an increase of $49.9 million or 31% from net revenue of $162.9 million for fiscal 2006. The increase in revenue was attributable to an overall increase in demand for our products from existing customers and the introduction of new products.
During fiscal 2008, sales to Alcatel-Lucent and Tellabs accounted for 25% and 21% of our net revenue, respectively. During fiscal 2007, sales to Alcatel-Lucent and Tellabs accounted for 29% and 17% of our net revenue, respectively. During fiscal 2006, sales to Alcatel and Nortel accounted for 27% and 11% of our net revenue, respectively. While we have substantially diversified our customer base, we expect that a substantial portion of our sales will remain concentrated with a limited number of customers. Sales to our major customers vary significantly from period to period, and we do not have the ability to predict future sales to these customers.
Net revenue from customers outside the United States accounted for $137.2 million, $137.6 million and $113.8 million of total net revenue, or 66%, 65% and 70%, for the years ended June 30, 2008, 2007 and 2006, respectively.
Cost of Revenue and Gross Margin
Cost of revenue decreased to $144.5 million for fiscal 2008 from $174.6 million for fiscal 2007. The decrease was primarily due to the decrease in excess and obsolete inventory and manufacturing overhead. Cost of revenue increased to $174.6 million for fiscal 2007 from $154.5 million for fiscal 2006. The increase was primarily due to the increase in total net revenue.
29
We wrote off excess and obsolete inventory of $4.7 million in fiscal 2008, $12.9 million in fiscal 2007 and $12.8 million in fiscal 2006. These write-offs were primarily due to lower demand for certain products and lower expected usage of previously purchased inventory. The reduction in the write-off of excess and obsolete inventory in fiscal 2008 was primarily due to improved accuracy in predicting the demand for our products and the product mix ordered by our customers. We sold inventory previously written-off with original cost totaling $2.9 million, $1.2 million and $0.2 million for fiscal 2008, 2007 and 2006, respectively, due to unforeseen demand for such inventory. As a result, cost of revenue associated with the sale of this inventory was zero. The selling price of the finished goods that included these components was similar to the selling price of products that did not include components that were written-off. These items were subsequently used or sold because customers ordered products that included these components in excess of our estimates.
Gross margin as a percentage of net revenue improved to 31% in fiscal 2008 from 18% in fiscal 2007 due to a number of factors. Manufacturing overhead as a percentage of net revenue decreased as we improved productivity of our centralized supply-chain operational center in a lower-cost region. Also, direct manufacturing costs as a percentage of net revenue decreased due to improvements in our supply chain procurement. These favorable factors were assisted by a higher volume of sales of products with higher gross margin, as well as lower write-offs of excess and obsolete inventory. Additionally, we reduced cost of goods sold by approximately $3.7 million in fiscal 2008 due to the Global Distributor and legal settlement with 3S Photonics, accounting for approximately 2% of the increase. Our gross margin percentage improved to 18% for fiscal 2007 from 5% for fiscal 2006, primarily due to cost reductions associated with shifting global manufacturing operations to contract manufacturers in lower-cost regions and increased focus on design for manufacturability to achieve lower costs. In addition, the improvement in gross margin percentage was driven by a shift to products with higher volume and higher gross margin.
Our gross margin is and will be primarily affected by changes in mix of products sold, manufacturing volume, changes in sales prices, product demand, inventory write-downs, sales of previously written-off inventory, warranty costs, and production yields. We expect cost of revenue, as a percentage of net revenue, to fluctuate from period to period. We expect gross margin to remain level or decline compared to fiscal 2008.
Research and Development
Research and development expenses increased $3.1 million to $28.3 million for fiscal 2008 from $25.2 million for fiscal 2007. As a percentage of net revenue, research and development expenses increased to 14% for fiscal 2008 from 12% for fiscal 2007. The increase in research and development expenses was primarily due to increased personnel-related costs due to increased headcount in the U.S. and China, as well as increased prototype-parts spending.
Research and development expenses increased $1.7 million to $25.2 million for fiscal 2007 from $23.5 million for fiscal 2006. As a percentage of net revenue, research and development expenses decreased to 12% for fiscal 2007 from 15% for fiscal 2006. The increase in research and development expenses was primarily due to increased personnel-related costs (such as stock-based compensation expenses and increased headcount in China, offset by closure of our R&D office in Thailand and sale of our office in France) and patent-related legal expenses.
We expect our research and development expenses to remain level as a percentage of revenue in fiscal 2009. There can be no assurance that our research and development expenses will not increase in the future.
Sales and Marketing
Sales and marketing expenses increased $1.4 million to $16.7 million for fiscal 2008 from $15.3 million for fiscal 2007. As a percentage of net revenue, sales and marketing expenses increased to 8% in fiscal 2008 from 7% in fiscal 2007. The increase in sales and marketing expenses was primarily due to personnel-related costs (such as commissions) and increased travel expenses.
Sales and marketing expenses increased $2.1 million to $15.3 million for fiscal 2007 from $13.2 million for fiscal 2006. As a percentage of net revenue, sales and marketing expenses decreased to 7% in fiscal 2007 from
30
8% in fiscal 2006. The increase in sales and marketing expenses was primarily due to personnel-related costs (such as stock-based compensation expense and commissions), increased travel expenses and increased corporate marketing expenses.
We expect our sales and marketing expenses to remain level or decline as a percentage of revenue in fiscal 2009. There can be no assurance that our sales and marketing expense will not increase in the future.
General and Administrative
General and administrative expenses decreased $5.1 million to $18.2 million for fiscal 2008 from $23.3 million for fiscal 2007. As a percentage of net revenue, general and administrative expenses decreased to 9% in fiscal 2008 from 11% in fiscal 2007. The primary reasons for the decrease were decreased personnel-related expenses, audit and legal expenses, and consulting due diligence expenses than in the prior year.
General and administrative expenses increased $6.6 million to $23.3 million for fiscal 2007 from $16.7 million for fiscal 2006. As a percentage of net revenue, general and administrative expenses increased to 11% in fiscal 2007 from 10% in fiscal 2006. The primary reasons for the increase were increased audit and legal expenses, consulting due diligence expenses related to a potential acquisition that we decided not to pursue, and increased personnel-related expenses (such as stock-based compensation expense).
We expect general and administrative expenses to remain level or increase as a percentage of revenue in fiscal 2009. There can be no assurance that our general and administrative expenses will not increase in the future.
Amortization of Intangible Assets
Amortization of intangible assets decreased by $1.9 million to $0.8 million for fiscal 2008, from $2.7 million for fiscal 2007. The decrease was primarily attributable to the remaining intangible assets becoming fully amortized during fiscal 2008, which resulted in less expense during the remainder of fiscal 2008.
Amortization of intangible assets decreased by $2.7 million to $2.7 million for fiscal 2007, from $5.4 million for fiscal 2006. The decrease was primarily attributable to some of the intangible assets becoming fully amortized during fiscal 2007, which resulted in less expense during the remainder of fiscal 2007.
Restructuring
Over the past several years, we have implemented various restructuring programs to realign resources in response to the changes in our industry and customer demand, and we continue to assess our current and future operating requirements accordingly.
For fiscal 2008, we had a recovery in restructuring expenses of $0.2 million due to changes in our estimate of sublease income from excess facilities at our Fremont site. For fiscal 2007, restructuring expenses of $1.5 million resulted from an additional provision for severance benefits totaling $0.3 million, combined with expenses for abandoned facilities in the amount of $1.2 million. Our accrued restructuring liability balance at June 30, 2008 was $8.0 million and will be payable through 2011.
(Gain) loss on Sale of Subsidiary
In April 2007, we sold ninety percent (90%) of the share capital and voting rights of our wholly owned subsidiary, Avanex France, which operated our semiconductor fabs and associated product lines located in Nozay, France, to 3S Photonics. In fiscal 2007, the sale resulted in a loss to the Company of approximately $3.2 million primarily as a result of the approximately $24.9 million cash paid, transaction expenses incurred of approximately $1.0 million, and transfer of approximately $4.3 million of assets, partially offset by approximately $15.9 million of liabilities written-off, the assumption of approximately $6.7 million of liabilities by 3S Photonics, the write-off of cumulative translation gain related to Nozay of approximately $3.3 million, and a reduction of the pension obligation of approximately $1.1 million related to the sale.
31
In July 2007, we entered into a Settlement Agreement with 3S Photonics that finalized the cash payments between the two parties under the share purchase agreement entered into in February 2007. As part of the Settlement Agreement, we placed in an escrow account the amount of €2 million to provide for payment of certain vendor liabilities claimed by 3S Photonics. In March 2008, the parties finalized the liabilities and the remaining escrow funds of €1,512,506 were returned to us and recognized as a gain on the subsidiary sale.
Interest and Other Income
Interest and other income increased $1.8 million to $4.1 million in fiscal 2008 from $2.3 million in fiscal 2007. The primary reason for this increase was foreign currency transaction gains.
Interest and other income decreased $0.5 million to $2.3 million in fiscal 2007 from $2.8 million in fiscal 2006. The primary reason for this decrease was the release of a previously accrued property tax accrual in the prior year, partially offset by a slight increase in interest income.
Interest and Other Expense
Interest and other expense decreased slightly by $0.2 million in fiscal 2008 to $0.2 million from a credit of $35,000 in fiscal 2007. Interest and other expense decreased by $10.3 million in fiscal 2007 to a credit of $35,000 from $10.3 million in fiscal 2006. The primary reason for the decrease was the loss on extinguishment of debt recorded in fiscal 2006, a decrease in interest expense due to the conversion of the senior convertible notes, and a decrease in foreign currency transaction gains.
Provision for Income Taxes
The provisions for income taxes of $0.9 million and $0.5 million were recorded for estimated taxes due on income generated in certain foreign and state tax jurisdictions for fiscal 2008 and 2007, respectively. The income tax provision for fiscal 2008 and fiscal 2007 reflects an effective tax rate of 16% and (2)%, respectively, which differs from the statutory tax rate due to the tax impact of income from foreign operations and unbenefited losses on U.S. taxes due to the full valuation allowance on our net deferred tax assets in accordance with FASB Statement No. 109.
As of June 30, 2008, our net deferred tax assets are fully offset by a valuation allowance. FASB Statement No. 109 “Accounting for Income Taxes,” provides for the recognition of deferred tax assets if realization of such assets is more likely than not to occur. Based upon the weight of available evidence, which includes our historical operating performance and reported cumulative net losses since inception, we provide a full valuation allowance against our net deferred tax assets. We reassess the need for our valuation allowance on a quarterly basis.
In June 2006, the FASB issued FASB Interpretation (“FIN”) No. 48, “Accounting for Uncertainty in Income Taxes—an interpretation of FASB Statement No. 109.” This interpretation clarifies the accounting for uncertainty in income taxes recognized in an entity’s financial statements in accordance with SFAS No. 109, “Accounting for Income Taxes.” It prescribes a recognition threshold and measurement attribute for financial statement disclosure of tax positions taken or expected to be taken on a tax return. We adopted FIN 48 on July 1, 2007 and the adoption did not have a material impact on our consolidated balance sheet and statement of operations for fiscal 2008.
Liquidity and Capital Resources
Prior to our initial public offering, we financed our operations primarily through private sales of convertible preferred stock. In February 2000, we received net proceeds of approximately $238.0 million from the initial public offering of our common stock and a concurrent sale of stock to corporate investors. Subsequent to our initial public offering, we have financed our operations through the sale of equity securities, issuance of convertible notes and warrants, bank borrowings, equipment lease financing and acquisitions.
On March 6, 2006, we sold 1.6 million shares of common stock at a price per share of $30.00 for an aggregate purchase price of $48.1 million. The net proceeds from such sale of the shares of common stock were
32
$44.7 million, after deducting the placement fee and offering expenses. The purchasers also received warrants to purchase up to an aggregate of 0.5 million shares of common stock at an exercise price of $40.95 per share, subject to adjustment for anti-dilution, exercisable on and after September 9, 2006 and on or before March 9, 2010.
In connection with our March 1, 2007 financing, the holders of such warrants received an antidilution adjustment pursuant to the terms of such warrants resulting in up to 7,815 additional shares to be issued upon the exercise of such warrants and the reduction of the exercise price of the warrants from $40.95 per share to $40.30 per share. The sale of common stock and issuance of the warrants was made pursuant to an effective registration statement on Form S-3.
On March 1, 2007, we sold 719,670 shares of common stock of Avanex at a price per share of $27.79 for an aggregate purchase price of $20 million. The purchaser also received a warrant to purchase up to an additional 179,918 shares of common stock. The warrant is exercisable at an exercise price of $32.18 per share and for a term starting March 31, 2007 and ending March 1, 2011. For more information, please see Note 12 in the Notes to Consolidated Financial Statements.
As of June 30, 2008, Avanex had cash and cash equivalents of $14.8 million and short-term investments of $40.6 million for an aggregate of $55.4 million, excluding restricted cash of $3.8 million.
The net cash provided by operating activities during fiscal 2008 of $16.5 million was due primarily to net income of $4.7 million for fiscal 2008, in addition to $13.8 million of non-cash charges. Changes in operating assets and liabilities during fiscal 2008 used $2.0 million of cash.
Net cash used by investing activities during fiscal 2008 was $17.5 million, comprised of $11.7 million representing the net change in short-term investments, capital purchases of $3.5 million, purchase of assets from Essex of $2.1 million, and a $0.2 million increase in restricted cash.
Net cash provided by financing activities was $0.8 million during fiscal 2008, which was the result of proceeds generated through the sale of common stock through the Employee Stock Purchase Plan and from the exercise of stock options.
Our contractual obligations at June 30, 2008 were as follows (in thousands):
| | | | | | | | | | | | | | | |
| | | Contractual Obligations Due by Period |
| | | Less than
1 year | | 1-3 years | | 4-5 years | | After 5
years | | Total |
Capital lease obligations | | $ | 15 | | $ | 18 | | $ | 3 | | $ | — | | $ | 36 |
Operating leases, net of subleases | | | 4,767 | | | 6,969 | | | 183 | | | — | | | 11,919 |
Pension | | | — | | | — | | | — | | | 306 | | | 306 |
Severance * | | | 1,031 | | | 82 | | | — | | | — | | | 1,113 |
Unconditional purchase obligations | | | 24,512 | | | — | | | — | | | — | | | 24,512 |
| | | | | | | | | | | | | | | |
| | $ | 30,325 | | $ | 7,069 | | $ | 186 | | $ | 306 | | $ | 37,886 |
| | | | | | | | | | | | | | | |
| * | Includes executive terminations subsequent to year-end of approximately $1.0 million. |
We have unconditional purchase obligations to certain of our suppliers and contract manufacturers that support our ability to manufacture our products. As of June 30, 2008, we had approximately $24.5 million of unconditional purchase obligations, none of which is included on our balance sheet in accounts payable.
Under operating leases and capital leases described in the table above, we have included total future minimum rent expense under non-cancelable leases for both current and abandoned facilities and equipment leases. We have included in the balance sheet $2.9 million and $5.0 million in current and long-term restructuring accruals, respectively, for the abandoned facilities as of June 30, 2008.
33
Recent Accounting Pronouncements
In September 2006, the FASB issued Statement No. 157, “Fair Value Measurements” (“Statement 157”). Statement 157 defines fair value, establishes a framework for measuring fair value and expands fair value measurement disclosures. Statement 157 is effective for our fiscal year beginning July 1, 2008. We are currently evaluating the impact of the adoption of Statement 157 on our consolidated balance sheet and statement of operations.
In February 2007, the FASB issued Statement No. 159, “The Fair Value Option for Financial Assets and Financial Liabilities, including an amendment of FASB Statement No. 115” (“Statement 159”), which allows an entity the irrevocable option to elect fair value for the initial and subsequent measurement for certain financial assets and liabilities under an instrument-by-instrument election. Subsequent measurements for the financial assets and liabilities an entity elects to fair value will be recognized in earnings. Statement 159 also establishes additional disclosure requirements. Statement 159 is effective for our fiscal year beginning July 1, 2008. The adoption of Statement 159 will not have a material impact on our consolidated balance sheet and statement of operations.
| ITEM 7A. | QUANTITATIVE AND QUALITATIVE DISCLOSURES ABOUT MARKET RISK |
Interest Rate Risk
Our exposure to market risk for changes in interest rates relates primarily to our investment portfolio. The objectives of our investment activities are preservation and safety of principal; maintenance of adequate liquidity to meet cash flow requirements; attainment of a competitive market rate of return on investments; minimization of risk on all investments; and avoidance of inappropriate concentrations of investments.
We place our investments with high quality credit issuers in short-term securities, and maturities can range from overnight to 36 months. The average maturity of the portfolio will not exceed 18 months. The portfolio includes only marketable securities with active secondary or resale markets to ensure portfolio liquidity. We do not have any derivative financial instruments. Accordingly, we do not believe that our investments have significant exposure to interest rate risk.
The following table summarizes average interest rate and fair market value of the short-term securities and restricted cash and investments held by Avanex (in thousands), which were classified as available-for-sale at June 30, 2008 and June 30, 2007:
| | | | | | | | |
| | | June 30,
2008 | | | June 30,
2007 | |
Amortized cost | | $ | 48,969 | | | $ | 32,575 | |
Fair market value | | | 49,099 | | | | 32,562 | |
Average annual interest rate | | | 4.09 | % | | | 5.09 | % |
Exchange Rate Risk
Our international business is subject to normal international business risks including, but not limited to, differing economic conditions, changes in political climate, differing tax structures, other regulations and restrictions, and foreign exchange rate volatility. Accordingly, our future results could be materially adversely affected by changes in these or other factors.
We have operations in the United States, China, Thailand, France, and Italy. Accordingly, we have sales and expenses that are denominated in currencies other than the U.S. dollar. As a result, currency fluctuations between the U.S. dollar and the currencies in which we do business could cause foreign currency translation gains or losses that we would recognize in the period incurred. A 10% fluctuation in the dollar at June 30, 2008 would have led to an additional profit of approximately $2.6 million (dollar weakening), or an additional loss of approximately $2.6 million (dollar strengthening) on our net cash position in outstanding assets and liabilities. We cannot predict the effect of exchange rate fluctuations on our future operating results because of the variability of currency exposure and the potential volatility of currency exchange rates. It has not been our practice to engage in the hedging of foreign currency transactions to mitigate for foreign currency risk, and currently, we do not hedge our exposure to translation gains and losses related to foreign currency net asset exposures.
34
| ITEM 8. | FINANCIAL STATEMENTS AND SUPPLEMENTARY DATA |
INDEX TO CONSOLIDATED FINANCIAL STATEMENTS
35
REPORT OF DELOITTE & TOUCHE LLP
INDEPENDENT REGISTERED PUBLIC ACCOUNTING FIRM
The Board of Directors and Stockholders
Avanex Corporation
We have audited the accompanying consolidated balance sheets of Avanex Corporation and subsidiaries (the “Company”) as of June 30, 2008 and 2007, and the related consolidated statements of operations, stockholders’ equity and comprehensive income (loss), and cash flows for each of the three years in the period ended June 30, 2008. Our audits also included the financial statement schedule listed in the Index at Item 15(a). These financial statements and financial statement schedule are the responsibility of the Company’s management. Our responsibility is to express an opinion on the financial statements and financial statement schedule based on our audits.
We conducted our audits in accordance with the standards of the Public Company Accounting Oversight Board (United States). Those standards require that we plan and perform the audit to obtain reasonable assurance about whether the financial statements are free of material misstatement. An audit includes examining, on a test basis, evidence supporting the amounts and disclosures in the financial statements. An audit also includes assessing the accounting principles used and significant estimates made by management, as well as evaluating the overall financial statement presentation. We believe that our audits provide a reasonable basis for our opinion.
In our opinion, such consolidated financial statements present fairly, in all material respects, the financial position of Avanex Corporation and subsidiaries as of June 30, 2008 and 2007, and the results of their operations and their cash flows for each of the three years in the period ended June 30, 2008, in conformity with accounting principles generally accepted in the United States of America. Also, in our opinion, such financial statement schedule, when considered in relation to the basic consolidated financial statements taken as a whole, presents fairly, in all material respects, the information set forth therein.
As discussed in Note 1 to the consolidated financial statements, the Company changed its method of accounting for uncertainties in income taxes upon adoption of Financial Accounting Standards Board (“FASB”) Interpretation No. 48,Accounting for Uncertainty in Income Taxes—an interpretation of FASB Statement No. 109 effective July 1, 2007, and its method of accounting for defined benefit pension and other postretirement plans upon the adoption of FASB Statement No. 158,Employers’ Accounting for Defined Benefit Pension and Other Postretirement Plans—an amendment of FASB Statements No. 87, 88, 106, and 132(R) as of June 30, 2007.
We have also audited, in accordance with the standards of the Public Company Accounting Oversight Board (United States), the Company’s internal control over financial reporting as of June 30, 2008, based on the criteria established inInternal Control—Integrated Framework issued by the Committee of Sponsoring Organizations of the Treadway Commission and our report dated September 4, 2008, expressed an adverse opinion on the Company’s internal control over financial reporting because of a material weakness.
/s/ DELOITTE & TOUCHE LLP
San Jose, California
September 4, 2008
36
AVANEX CORPORATION AND SUBSIDIARIES
CONSOLIDATED BALANCE SHEETS
(In thousands, except share and per share data)
| | | | | | | | |
| | | June 30, | |
| | | 2008 | | | 2007 | |
Assets | | | | | | | | |
Current assets: | | | | | | | | |
Cash and cash equivalents | | $ | 14,839 | | | $ | 14,837 | |
Restricted cash | | | 3,776 | | | | 3,620 | |
Short-term investments | | | 40,590 | | | | 28,942 | |
Accounts receivable | | | 39,032 | | | | 33,764 | |
Inventories | | | 15,979 | | | | 15,188 | |
Due from related party | | | 85 | | | | 14,381 | |
Other current assets | | | 6,486 | | | | 5,716 | |
| | | | | | | | |
Total current assets | | | 120,787 | | | | 116,448 | |
Property and equipment, net | | | 7,688 | | | | 5,900 | |
Intangibles, net | | | 314 | | | | 559 | |
Goodwill | | | 9,408 | | | | 9,408 | |
Deposits and other assets | | | 2,870 | | | | 2,685 | |
| | | | | | | | |
Total assets | | $ | 141,067 | | | $ | 135,000 | |
| | | | | | | | |
Liabilities and Stockholders’ Equity | | | | | | | | |
Current liabilities: | | | | | | | | |
Accounts payable | | $ | 33,255 | | | $ | 32,549 | |
Accrued compensation | | | 6,272 | | | | 6,091 | |
Accrued warranty | | | 626 | | | | 873 | |
Due to related party | | | 110 | | | | 2,144 | |
Other accrued expenses and deferred revenue | | | 5,893 | | | | 8,796 | |
Current portion of long-term obligations | | | 13 | | | | 9 | |
Current portion of accrued restructuring | | | 2,940 | | | | 2,837 | |
| | | | | | | | |
Total current liabilities | | | 49,109 | | | | 53,299 | |
Long-term liabilities: | | | | | | | | |
Accrued restructuring | | | 5,043 | | | | 8,269 | |
Other long-term obligations | | | 1,520 | | | | 1,350 | |
| | | | | | | | |
Total liabilities | | | 55,672 | | | | 62,918 | |
| | | | | | | | |
Stockholders’ equity: | | | | | | | | |
Common stock, $0.001 par value, 30,000,000 shares authorized; 15,318,982 and 15,078,955 shares outstanding, net of 10,555 treasury shares, at June 30, 2008 and June 30, 2007, respectively | | | 15 | | | | 15 | |
Additional paid-in capital | | | 784,492 | | | | 776,112 | |
Accumulated other comprehensive income | | | 1,277 | | | | 1,064 | |
Accumulated deficit | | | (700,389 | ) | | | (705,109 | ) |
| | | | | | | | |
Total stockholders’ equity | | | 85,395 | | | | 72,082 | |
| | | | | | | | |
Total liabilities and stockholders’ equity | | $ | 141,067 | | | $ | 135,000 | |
| | | | | | | | |
See accompanying notes.
37
AVANEX CORPORATION AND SUBSIDIARIES
CONSOLIDATED STATEMENTS OF OPERATIONS
(In thousands, except per share data)
| | | | | | | | | | | | |
| | | Year Ended June 30, | |
| | | 2008 | | | 2007 | | | 2006 | |
Net revenue: | | | | | | | | | | | | |
Third parties | | $ | 189,821 | | | $ | 151,380 | | | $ | 119,054 | |
Related parties | | | 18,273 | | | | 61,375 | | | | 43,890 | |
| | | | | | | | | | | | |
Total net revenue | | | 208,094 | | | | 212,755 | | | | 162,944 | |
Cost of revenue: | | | | | | | | | | | | |
Cost of revenue except for purchases from related parties | | | 143,518 | | | | 174,059 | | | | 151,758 | |
Purchases from related parties | | | 991 | | | | 491 | | | | 2,726 | |
| | | | | | | | | | | | |
Total cost of revenue | | | 144,509 | | | | 174,550 | | | | 154,484 | |
| | | | | | | | | | | | |
Gross profit | | | 63,585 | | | | 38,205 | | | | 8,460 | |
Operating expenses: | | | | | | | | | | | | |
Research and development | | | 28,325 | | | | 25,231 | | | | 23,471 | |
Sales and marketing | | | 16,735 | | | | 15,261 | | | | 13,236 | |
General and administrative: | | | | | | | | | | | | |
Third parties | | | 18,238 | | | | 22,663 | | | | 15,701 | |
Related parties | | | — | | | | 615 | | | | 951 | |
Amortization of intangibles | | | 771 | | | | 2,703 | | | | 5,448 | |
Restructuring | | | (164 | ) | | | 1,511 | | | | 1,912 | |
Gain on disposal of property and equipment | | | (23 | ) | | | (527 | ) | | | (5,064 | ) |
(Gain) loss on sale of subsidiary | | | (1,996 | ) | | | 3,216 | | | | — | |
| | | | | | | | | | | | |
Total operating expenses | | | 61,886 | | | | 70,673 | | | | 55,655 | |
| | | | | | | | | | | | |
Income (loss) from operations | | | 1,699 | | | | (32,468 | ) | | | (47,195 | ) |
Interest and other income | | | 4,100 | | | | 2,292 | | | | 2,787 | |
Interest and other expense | | | (152 | ) | | | 35 | | | | (10,284 | ) |
| | | | | | | | | | | | |
Income (loss) before income taxes | | | 5,647 | | | | (30,141 | ) | | | (54,692 | ) |
Income tax provision | | | (927 | ) | | | (464 | ) | | | — | |
| | | | | | | | | | | | |
Net income (loss) | | $ | 4,720 | | | $ | (30,605 | ) | | $ | (54,692 | ) |
| | | | | | | | | | | | |
Basic net income (loss) per common share | | $ | 0.31 | | | $ | (2.16 | ) | | $ | (5.03 | ) |
| | | | | | | | | | | | |
Diluted net income (loss) per common share | | $ | 0.31 | | | $ | (2.16 | ) | | $ | (5.03 | ) |
| | | | | | | | | | | | |
Weighted-average number of shares used in computing: | | | | | | | | | | | | |
Basic net income (loss) per common share | | | 15,242 | | | | 14,196 | | | | 10,882 | |
| | | | | | | | | | | | |
Diluted net income (loss) per common share | | | 15,370 | | | | 14,196 | | | | 10,882 | |
| | | | | | | | | | | | |
See accompanying notes.
38
AVANEX CORPORATION AND SUBSIDIARIES
CONSOLIDATED STATEMENTS OF STOCKHOLDERS’ EQUITY AND COMPREHENSIVE INCOME (LOSS)
(In thousands, except share data)
| | | | | | | | | | | | | | | | | | | | | | | |
| | | Common
Stock | | Additional
Paid-in
Capital | | | Deferred Stock
Compensation | | | Accumulated
Deficit | | | Accumulated
Other
Comprehensive
Income (Loss) | | | Total
Stockholders’
Equity | |
Balance at June 30, 2005 | | $ | 10 | | $ | 668,058 | | | $ | (353 | ) | | $ | (619,445 | ) | | $ | 5,478 | | | $ | 53,748 | |
Reclassification of deferred stock compensation to additional paid-in capital upon the adoption of SFAS 123(R) | | | — | | | (353 | ) | | | 353 | | | | — | | | | — | | | | — | |
Issuance of 103,408 shares of common stock upon exercise of stock options | | | — | | | 2,107 | | | | — | | | | — | | | | — | | | | 2,107 | |
Issuance of 77,105 shares of common stock in connection with restricted stock units | | | — | | | — | | | | — | | | | — | | | | — | | | | — | |
Issuance of 39,149 shares of common stock in connection with employee stock purchase plan | | | — | | | 409 | | | | — | | | | — | | | | — | | | | 409 | |
Modification of warrants, net of issuance costs of $258 | | | — | | | 686 | | | | — | | | | — | | | | — | | | | 686 | |
Issuance of common stock, net of issuance costs of $3,509 | | | 2 | | | 44,663 | | | | — | | | | — | | | | — | | | | 44,665 | |
Issuance of common stock in connection with conversion of senior secured debentures | | | 1 | | | 23,120 | | | | — | | | | — | | | | — | | | | 23,121 | |
Stock-based compensation | | | | | | 4,452 | | | | — | | | | — | | | | — | | | | 4,452 | |
Common stock withheld on exercise of restricted stock units for tax withholding | | | — | | | — | | | | — | | | | (367 | ) | | | — | | | | (367 | ) |
Comprehensive loss: | | | | | | | | | | | | | | | | | | | | | | | |
Unrealized gain on investments | | | — | | | — | | | | — | | | | — | | | | 461 | | | | 461 | |
Cumulative translation adjustment | | | — | | | — | | | | — | | | | — | | | | (1,252 | ) | | | (1,252 | ) |
Net loss | | | — | | | — | | | | — | | | | (54,692 | ) | | | — | | | | (54,692 | ) |
| | | | | | | | | | | | | | | | | | | | | | | |
Comprehensive loss | | | | | | | | | | | | | | | | | | | | | | (55,483 | ) |
| | | | | | | | | | | | | | | | | | | | | | | |
Balance at June 30, 2006 | | | 13 | | | 743,142 | | | | — | | | | (674,504 | ) | | | 4,687 | | | | 73,338 | |
Issuance of 23,667 shares of common stock upon exercise of stock options | | | — | | | 363 | | | | — | | | | — | | | | — | | | | 363 | |
Issuance of 151,619 shares of common stock in connection with restricted stock units | | | 1 | | | 2 | | | | — | | | | — | | | | — | | | | 3 | |
Issuance of 82,645 shares of common stock upon exercise of warrants | | | — | | | 1,400 | | | | — | | | | — | | | | — | | | | 1,400 | |
Issuance of 28,456 shares of common stock in connection with employee stock purchase plan | | | — | | | 367 | | | | — | | | | — | | | | — | | | | 367 | |
Issuance of 410,767 shares of common stock in connection with conversion of 8% senior convertible notes | | | — | | | 4,986 | | | | — | | | | — | | | | — | | | | 4,986 | |
Issuance of 719,670 shares of common stock, net of issuance costs of $1,267 | | | 1 | | | 18,743 | | | | — | | | | — | | | | — | | | | 18,744 | |
Stock-based compensation | | | — | | | 7,109 | | | | — | | | | — | | | | — | | | | 7,109 | |
Comprehensive loss: | | | | | | | | | | | | | | | | | | | | | | | |
Unrealized gain on investments | | | — | | | — | | | | — | | | | — | | | | 10 | | | | 10 | |
Cumulative translation adjustment | | | — | | | — | | | | — | | | | — | | | | (3,968 | ) | | | (3,968 | ) |
Net actuarial gain | | | — | | | — | | | | — | | | | — | | | | 335 | | | | 335 | |
Net loss | | | — | | | — | | | | — | | | | (30,605 | ) | | | — | | | | (30,605 | ) |
| | | | | | | | | | | | | | | | | | | | | | | |
Comprehensive loss | | | | | | | | | | | | | | | | | | | | | | (34,228 | ) |
| | | | | | | | | | | | | | | | | | | | | | | |
Balance at June 30, 2007 | | | 15 | | | 776,112 | | | | — | | | | (705,109 | ) | | | 1,064 | | | | 72,082 | |
Issuance of 25,321 shares of common stock upon exercise of stock options | | | — | | | 398 | | | | — | | | | | | | | | | | | 398 | |
Issuance of 193,562 shares of common stock in connection with restricted stock units | | | — | | | — | | | | — | | | | — | | | | — | | | | — | |
Issuance of 31,383 shares of common stock in connection with employee stock purchase plan | | | — | | | 382 | | | | — | | | | — | | | | — | | | | 382 | |
Issuance of 482 shares in connection with Officer and Director Purchase Plan | | | — | | | 8 | | | | — | | | | — | | | | — | | | | 8 | |
Issuance of restricted stock units in connection with accrued compensation distribution | | | — | | | 1,553 | | | | — | | | | — | | | | — | | | | 1,553 | |
Stock-based compensation | | | — | | | 6,039 | | | | — | | | | — | | | | — | | | | 6,039 | |
Comprehensive loss: | | | | | | | | | | | | | | | | | | | | | | | |
Unrealized loss on investments | | | — | | | — | | | | — | | | | — | | | | (31 | ) | | | (31 | ) |
Cumulative translation adjustment | | | — | | | — | | | | — | | | | — | | | | 207 | | | | 207 | |
Net actuarial gain | | | — | | | — | | | | — | | | | — | | | | 37 | | | | 37 | |
Net income | | | — | | | — | | | | — | | | | 4,720 | | | | — | | | | 4,720 | |
| | | | | | | | | | | | | | | | | | | | | | | |
Comprehensive income | | | | | | | | | | | | | | | | | | | | | | 4,933 | |
| | | | | | | | | | | | | | | | | | | | | | | |
Balance at June 30, 2008 | | $ | 15 | | $ | 784,492 | | | $ | — | | | $ | (700,389 | ) | | $ | 1,277 | | | $ | 85,395 | |
| | | | | | | | | | | | | | | | | | | | | | | |
See accompanying notes.
39
AVANEX CORPORATION AND SUBSIDIARIES
CONSOLIDATED STATEMENTS OF CASH FLOWS
(In thousands)
| | | | | | | | | | | | |
| | | For the Year Ended June 30, | |
| | | 2008 | | | 2007 | | | 2006 | |
Operating Activities: | | | | | | | | | | | | |
Net income (loss) | | $ | 4,720 | | | $ | (30,605 | ) | | $ | (54,692 | ) |
Adjustments to reconcile net income (loss) to net cash provided by (used in) operating activities: | | | | | | | | | | | | |
Gain on disposal of property and equipment | | | (23 | ) | | | (767 | ) | | | (5,064 | ) |
Depreciation and amortization | | | 3,476 | | | | 2,360 | | | | 5,565 | |
Amortization of intangibles | | | 769 | | | | 2,698 | | | | 5,448 | |
Gain on investment in subsidiary | | | — | | | | (223 | ) | | | — | |
Stock-based compensation | | | 6,039 | | | | 7,109 | | | | 4,452 | |
(Reversal of) provision for doubtful accounts and sales returns | | | (1,199 | ) | | | 1,194 | | | | (2,538 | ) |
Net cash used in sale of subsidiary | | | — | | | | (19,557 | ) | | | — | |
Loss in connection with convertible notes modification | | | — | | | | — | | | | 4,525 | |
Non-cash interest expense | | | — | | | | 424 | | | | 2,160 | |
Write-down of excess and obsolete inventory | | | 4,725 | | | | 13,034 | | | | 12,790 | |
Changes in operating assets and liabilities: | | | | | | | | | | | | |
Accounts receivable | | | 7,115 | | | | (7,646 | ) | | | (10,727 | ) |
Inventories | | | (4,806 | ) | | | (11,739 | ) | | | 5,488 | |
Other current assets | | | (327 | ) | | | 8,813 | | | | 16,828 | |
Other assets | | | (173 | ) | | | 331 | | | | (53 | ) |
Due to/from related parties | | | (2,662 | ) | | | (10,595 | ) | | | 10,364 | |
Accounts payable | | | 4,604 | | | | (1,685 | ) | | | 8,127 | |
Accrued compensation | | | 908 | | | | 3,312 | | | | (2,912 | ) |
Accrued restructuring | | | (3,123 | ) | | | (3,462 | ) | | | (26,787 | ) |
Accrued warranty | | | (247 | ) | | | (1,006 | ) | | | (3,521 | ) |
Other accrued expenses and deferred revenues | | | (3,287 | ) | | | 1,892 | | | | (12,053 | ) |
| | | | | | | | | | | | |
Net cash provided by (used in) operating activities | | | 16,509 | | | | (46,118 | ) | | | (42,600 | ) |
| | | | | | | | | | | | |
Investing Activities: | | | | | | | | | | | | |
Purchases of investments | | | (174,108 | ) | | | (418,704 | ) | | | (123,005 | ) |
Maturities of investments | | | 162,429 | | | | 428,468 | | | | 123,699 | |
Decrease (increase) in restricted cash | | | (156 | ) | | | 3,085 | | | | 1,489 | |
Investment in third parties | | | — | | | | (1,250 | ) | | | — | |
Purchases of property and equipment | | | (3,542 | ) | | | (2,403 | ) | | | (2,508 | ) |
Proceeds from sale of property and equipment | | | 28 | | | | 106 | | | | 4,824 | |
Net cash used in asset purchase | | | (2,139 | ) | | | — | | | | — | |
| | | | | | | | | | | | |
Net cash provided by (used in) investing activities | | | (17,488 | ) | | | 9,302 | | | | 4,499 | |
| | | | | | | | | | | | |
Financing Activities: | | | | | | | | | | | | |
Payments on capital lease obligations | | | (8 | ) | | | — | | | | (2,268 | ) |
Payments in connection with convertible notes modification | | | — | | | | — | | | | (4,075 | ) |
Proceeds from issuance of capital lease obligations with related party | | | — | | | | 637 | | | | — | |
Proceeds from issuance of common stock | | | 787 | | | | 20,869 | | | | 47,181 | |
| | | | | | | | | | | | |
Net cash provided by financing activities | | | 779 | | | | 21,506 | | | | 40,838 | |
| | | | | | | | | | | | |
Effect of exchange rate changes on cash | | | 202 | | | | 1,184 | | | | (585 | ) |
| | | | | | | | | | | | |
Net increase (decrease) in cash and cash equivalents | | | 2 | | | | (14,126 | ) | | | 2,152 | |
Cash and cash equivalents at beginning of period | | | 14,837 | | | | 28,963 | | | | 26,811 | |
| | | | | | | | | | | | |
Cash and cash equivalents at end of period | | $ | 14,839 | | | $ | 14,837 | | | $ | 28,963 | |
| | | | | | | | | | | | |
Supplemental Information: | | | | | | | | | | | | |
Cash paid during the period for: | | | | | | | | | | | | |
Interest expense | | $ | 4 | | | $ | 36 | | | $ | 164 | |
Income taxes | | $ | 348 | | | $ | — | | | $ | — | |
Non-cash investing and financing activities: | | | | | | | | | | | | |
Issuance and modifications of warrants | | $ | — | | | $ | — | | | $ | 686 | |
Conversion of senior convertible notes into common stock | | $ | — | | | $ | 4,994 | | | $ | 23,121 | |
Investment in equity securities in exchange for equipment | | $ | — | | | $ | — | | | $ | 658 | |
Reduction in pension liability in connection with sale of subsidiary | | $ | — | | | $ | 2,122 | | | $ | — | |
Fixed asset purchases included in accounts payable | | $ | 269 | | | $ | 28 | | | $ | 110 | |
Pension liability recognized in accumulated other comprehensive income | | $ | 37 | | | $ | 335 | | | $ | — | |
Net issuance of restricted stock awards (restricted stock and restricted stock units) | | $ | 4,311 | | | $ | 4,124 | | | $ | 2,812 | |
See accompanying notes.
40
AVANEX CORPORATION
NOTES TO CONSOLIDATED FINANCIAL STATEMENTS
Note 1. Description of Business and Summary of Significant Accounting Policies
The Company
Avanex Corporation (“the Company”, “we”, “us” and “our”) designs, manufactures and markets fiber optic-based products, known as photonic processors, which are designed to increase the performance of optical networks. The Company sells products to telecommunications system integrators and their network carrier customers. The Company was incorporated in October 1997 in California and reincorporated in Delaware in January 2000.
Basis of Presentation
The consolidated financial statements include the accounts of the Company and its wholly owned subsidiaries. All inter-company balances have been eliminated in consolidation.
Use of Estimates
The preparation of consolidated financial statements in conformity with accounting principles generally accepted in the United States requires management to make estimates and assumptions that affect the amounts reported in the consolidated financial statements and accompanying notes. Actual results could differ materially from those estimates. Significant estimates made by management include revenue recognition, sales returns provision, bad debt provision, inventory write-downs, warranty provision, impairment of goodwill and other acquired intangible assets, restructuring expenses, tax valuation allowance, and litigation and contingency assessments.
Cash and Cash Equivalents and Short-Term Investments
Cash and cash equivalents consist of cash deposited in checking and money market accounts. They are recorded at market value.
Restricted cash is security for certain leasing arrangements.
The Company considers all other highly liquid investment securities to be short-term investments. All of our short-term investments are classified as available-for-sale securities and are carried at fair value, with unrealized gains and losses, if any, included as a component of accumulated other comprehensive income in stockholders’ equity.
Interest, dividends, realized gains and losses and any other borrowing-related costs are included in interest and other income (expense). Realized gains and losses are recognized based on the specific identification method.
Fair Value of Financial Instruments
The Company evaluates the estimated fair value of financial instruments using available market information. The use of different market assumptions could have a negative effect on the estimated fair value amounts. The fair value of the Company’s cash and cash equivalents, accounts receivable, accounts payable, accrued liabilities and debt approximates the carrying amount due to the relatively short maturity of these items.
Concentration of Credit and Other Risks
Financial instruments, which subject the Company to potential credit risk, consist of demand deposit accounts, money market accounts, short-term investments and accounts receivable. The Company maintains its demand deposit accounts, money market accounts and short-term investments primarily with three financial institutions. The Company invests its excess cash principally in debt securities.
41
AVANEX CORPORATION
NOTES TO CONSOLIDATED FINANCIAL STATEMENTS—(Continued)
The Company sells its products primarily to large communications equipment vendors. The Company extends collection terms standard within the industry but does not require collateral from its customers. When the Company becomes aware, subsequent to delivery, of a customer’s potential inability to meet its payment obligations, the Company records a specific allowance for doubtful accounts. In the last four years, our uncollectible accounts experience has been insignificant. At June 30, 2008, we determined that an allowance was not required. If the financial condition of its customers were to deteriorate, resulting in an impairment of their ability to make payments, additional allowances may be required. This may be magnified due to the concentration of its sales to a limited number of customers. The Company has not experienced significant credit losses to date. Concentrations of credit risk exist to the extent of amounts presented in the financial statements.
Inventories
Inventories consist of raw materials, work-in-process and finished goods and are stated at the lower of cost or market. Cost is computed on a currently adjusted standard basis (which approximates actual costs on a first-in, first-out basis).
The Company writes off the cost of inventory that the Company specifically identifies and considers obsolete or excessive to fulfill future sales estimates. The Company defines obsolete inventory as products that we no longer market, for which there is no demand, or inventory that will no longer be used in the manufacturing process. Excess inventory is generally defined as inventory in excess of projected usage, and is determined using management’s best estimate of future demand at the time, based upon information then available to the Company.
In estimating excess inventory, the Company used a range of six-month to twelve-month demand forecasts in fiscal 2008 and 2007. In addition, we assess inventory on a quarterly basis and write-down those inventories which are obsolete or in excess of our forecasted usage to their estimated realizable value. Our estimates of realizable value are based upon our analysis including, but not limited to, forecasted sales by product, expected product life cycle, product development plans and future demand requirements. Our marketing department plays a key role in our excess review process by providing updated sales forecasts, managing product rollovers and working with sub-contract manufacturing to maximize recovery of excess inventory.
Property and Equipment
Property and equipment are stated at cost less accumulated depreciation and amortization. Depreciation is calculated using the straight-line method over the estimated useful lives of the assets, or two to four years for computer hardware and software except for enterprise resource planning software, three to five years for production and engineering equipment, and five years for office equipment, furniture and fixtures, and enterprise resource planning software. The Company amortizes capital leases and leasehold improvements using the straight-line method over the lesser of the assets’ estimated useful lives or remaining lease terms (typically two to five years).
Goodwill and Intangibles, Net
Statement of Financial Accounting Standards (“SFAS”) No. 142, “Goodwill and Other Intangible Assets” (SFAS 142) prescribes a two-step process for impairment testing of goodwill. The first step screens for impairment, while the second step, measures the impairment, if any. SFAS 142 requires impairment testing based on reporting units. Management believes that we operate in one segment, which we consider our sole reporting unit. Therefore, goodwill is tested for impairment at the enterprise level. The fair value of the enterprise, which was determined based on our market capitalization at June 30, 2008 and 2007, exceeded its carrying value, and goodwill was determined not to be impaired at June 30, 2008 and 2007. Goodwill at June 30, 2008 and 2007 was $9.4 million.
42
AVANEX CORPORATION
NOTES TO CONSOLIDATED FINANCIAL STATEMENTS—(Continued)
We periodically review our intangible assets for impairment and assess whether significant events or changes in business circumstances indicate that the carrying value of the assets may not be recoverable. This could occur when the carrying amount of an asset exceeds the anticipated future undiscounted cash flows expected to result from the use of the asset and its eventual disposition. The amount of the impairment loss to be recorded, if any, is calculated as the excess of the asset’s carrying value over its estimated fair value. Changes to estimated useful lives would impact the amount of amortization expense recorded in earnings.
Impairment of Long-Lived Assets
The Company evaluates the recoverability of long-lived assets in accordance with SFAS No. 144, “Accounting for the Impairment or Disposal of Long-Lived Assets.” When events or changes in circumstances indicate that the carrying amount of long-lived assets may not be recoverable, the Company recognizes such impairment in the event the net book value of such assets exceeds the future undiscounted cash flows attributable to such assets. We also periodically reassess the estimated remaining useful lives of our long lived assets. As of June 30, 2008, we determined there was no impairment of long-lived assets.
Restructuring Costs
During the past few years, the Company has recorded significant accruals in connection with restructuring programs. Given the significance and complexity of restructuring activities, and the timing of the execution of such activities, the restructuring accrual process involves periodic reassessments of estimates made at the time the original decisions were made, including evaluating real estate market conditions for expected vacancy periods and sub-lease rents. Although these estimates accurately reflect the costs of the restructuring programs, actual results may differ, thereby requiring the Company to record additional provisions or reverse a portion of such provisions.
Pension Benefits
For defined benefit pension plans, liabilities and prepaid expenses are determined using the Projected Unit Credit Method (with projected final salary), and recognizing actuarial gains and losses in excess of more than 10% of the present value of the defined benefit obligation or 10% of the fair value of any plan assets over the expected average remaining working lives of the employees participating in the plan.
The Company adopted SFAS No. 158, “Employers’ Accounting for Defined Benefit Pension and Other Postretirement Plans—an amendment of Financial Accounting Standard Board (“FASB”) Statements No. 87, 88, 106, and 132(R)” in fiscal 2007. Upon adoption, the Company recorded an adjustment of $0.3 million to the ending balance of accumulated other comprehensive income for pension benefit plan.
Contingency Accruals
The Company evaluates contingent liabilities including threatened or pending litigation in accordance with SFAS No. 5, “Accounting for Contingencies.” If the potential loss from any claim or legal proceedings is considered probable and the amount can be estimated, the Company accrues a liability for the estimated loss. Because of uncertainties related to these matters, accruals are based upon management’s judgment and the best information available to management at the time. As additional information becomes available, the Company reassesses the potential liability related to its pending claims and litigation and may revise its estimates.
In addition to product warranties, Avanex, from time to time, in the normal course of business, indemnifies certain customers with whom it enters into contractual relationships. Avanex has agreed to hold the other party harmless against third party claims that Avanex’s products, when used for their intended purpose, infringe the intellectual property rights of such third party or other claims made against certain parties. It is not possible to determine the maximum potential amount of liability under these indemnification obligations due to the limited
43
AVANEX CORPORATION
NOTES TO CONSOLIDATED FINANCIAL STATEMENTS—(Continued)
history of prior indemnification claims and the unique facts and circumstances that are likely to be involved in each particular claim. The estimated fair value of these indemnification provisions is minimal. To date, the Company has not incurred any costs related to claims under these provisions, and no amounts have been accrued in the accompanying financial statements.
Foreign Currency
The functional currencies of the Company’s foreign subsidiaries are their respective local currencies. Accordingly, all assets and liabilities of the foreign operations are translated to U.S. dollars at current period end exchange rates, and revenues and expenses are translated to U.S. dollars using weighted average exchange rates in effect during the period. The gains and losses from the translation of these subsidiaries’ financial statements into the U.S. dollar are recorded directly into a separate component of stockholders’ equity under the caption “Accumulated Other Comprehensive Income.” Currency transaction gains and losses are included in the Company’s results of operations.
Accumulated Other Comprehensive Income
SFAS No. 130 “Reporting Comprehensive Income” (“FAS 130”) requires that all items required to be recognized under accounting standards as components of comprehensive income, including unrealized gains and losses on available-for-sale securities and foreign currency translation adjustments be reported in the consolidated financial statements. As a result, the Company has reported comprehensive income (loss) within the accompanying Consolidated Statements of Stockholders’ Equity and Comprehensive Income (Loss).
Revenue Recognition
Revenue is recognized when persuasive evidence of an arrangement exists, the product has been shipped, risk of loss has been transferred, collectibility is reasonably assured, fees are fixed or determinable, and there are no uncertainties with respect to customer acceptance. In addition, when the Company approves sales returns or becomes aware of disputed sales invoices, the Company records an allowance for estimated sales returns and price adjustments. The Company generally does not accept product returns from customers; however, the Company does sell its products under warranty. Specific warranty terms and conditions vary by customer and region in which the Company does business; however, the warranty period is generally one year.
Stock-Based Compensation
The Company grants stock options and stock purchase rights for a fixed number of shares to employees and directors with an exercise price equal to the fair value of the shares at the date of grant. We adopted SFAS No. 123 (revised 2004), “Share-Based Payment (SFAS 123(R)), effective July 1, 2005. SFAS 123(R) requires the recognition of the fair value of stock compensation in net income. We recognize the stock compensation expense over the requisite service period of the individual grantees, which generally equals the vesting period. For more information, please see Note 12 to Consolidated Financial Statements.
Equity instruments granted to consultants are accounted for under the fair value method using the Black-Scholes option-pricing model and are subject to periodic revaluations over their vesting terms. The expense is recognized as the instruments vest.
Research and Development Costs
Research and development costs are expensed as incurred.
44
AVANEX CORPORATION
NOTES TO CONSOLIDATED FINANCIAL STATEMENTS—(Continued)
Income Taxes
The Company uses the liability method to account for income taxes. Under this method, deferred tax assets and liabilities are determined based on differences between financial reporting and tax bases of assets and liabilities. Deferred tax assets and liabilities are measured using enacted tax rates and laws that will be in effect when the differences are expected to reverse. A valuation allowance is provided to reduce net deferred tax assets to an amount that is more likely than not to be realized.
In June 2006, the FASB issued FASB Interpretation (“FIN”) No. 48, “Accounting for Uncertainty in Income Taxes—an interpretation of FASB Statement No. 109.” This interpretation clarifies the accounting for uncertainty in income taxes recognized in an entity’s financial statements in accordance with SFAS No. 109, “Accounting for Income Taxes.” It prescribes a recognition threshold and measurement attribute for financial statement disclosure of tax positions taken or expected to be taken on a tax return. We adopted FIN 48 effective for our fiscal year beginning July 1, 2007 and the adoption did not have a material impact on our consolidated balance sheet and statement of operations for fiscal 2008.
Earnings per Share
Basic net income (loss) per share is calculated using the weighted average number of shares of common stock outstanding. Diluted earnings per share is computed in the same manner and also gives effect to all dilutive common equivalent shares outstanding during the period using the treasury stock method. Common equivalent shares consist of stock options issued to employees under employee stock option plans and warrants.
Following the close of market on August 12, 2008, we effected a fifteen-for-one reverse stock split of our common stock. Accordingly, each fifteen shares of issued and outstanding Avanex common stock and equivalents as of the close of market on August 12, 2008 was converted into one share of common stock, and the reverse stock split was reflected in the trading price of Avanex’s common stock at the opening of market on August 13, 2008. Unless indicated otherwise, all share amounts and per share prices appearing in these consolidated financial statements for all periods presented reflect the reverse stock split.
Recent Accounting Pronouncements
In September 2006, the FASB issued Statement No. 157, “Fair Value Measurements” (“Statement 157”). Statement 157 defines fair value, establishes a framework for measuring fair value and expands fair value measurement disclosures. Statement 157 is effective for our fiscal year beginning July 1, 2008. We are currently evaluating the impact of the adoption of Statement 157 on our consolidated balance sheet and statement of operations.
In February 2007, the FASB issued Statement No. 159, “The Fair Value Option for Financial Assets and Financial Liabilities, including an amendment of FASB Statement No. 115” (“Statement 159”), which allows an entity the irrevocable option to elect fair value for the initial and subsequent measurement for certain financial assets and liabilities under an instrument-by-instrument election. Subsequent measurements for the financial assets and liabilities an entity elects to fair value will be recognized in earnings. Statement 159 also establishes additional disclosure requirements. Statement 159 is effective for our fiscal year beginning July 1, 2008. The adoption of Statement 159 will not have a material impact on our consolidated balance sheet and statement of operations.
Note 2. Disposition
On February 28, 2007, the Company entered into a share purchase agreement with Global Research Company, a société à responsibilité limitée incorporated under the laws of France (“GRC”), and Mr. Didier Sauvage, an individual and former employee of the Company (together with GRC, the “Purchasers”), pursuant to which the Company sold ninety percent (90%) of the share capital and voting rights of its wholly owned
45
AVANEX CORPORATION
NOTES TO CONSOLIDATED FINANCIAL STATEMENTS—(Continued)
subsidiary, Avanex France, a société anonyme incorporated under the laws of France, which owned the Company’s semiconductor fabs and associated product lines located in Nozay, France, to the Purchasers for the nominal amount of €1.00. The sale closed on April 16, 2007. The Purchasers changed the name of Avanex France to “3S Photonics” following the closing.
The sale involved the divestiture of the Company’s laser, terrestrial and submarine pumps and Fiber Bragg Grating product lines. The Company has continued to operate its optical interfaces (OIF) business and optical fiber amplifiers and raman amplifiers business, which were transferred to a new wholly owned subsidiary of the Company in France prior to the closing.
The sale resulted in a loss to the Company of approximately $3.2 million primarily as a result of the approximately $24.9 million cash paid, transaction expenses incurred of approximately $1.0 million, and transfer of approximately $4.3 million of assets, partially offset by approximately $15.9 million of liabilities written-off, the assumption of approximately $6.7 million of liabilities by 3S Photonics, the write-off of cumulative translation gain related to Nozay of approximately $3.3 million, and a reduction of the pension obligation of approximately $1.1 million related to the sale.
In July 2007, the Company and 3S Photonics entered into a Cash Settlement Agreement that finalized the cash payments between the two parties under the share purchase agreement entered into in February 2007. As part of the Cash Settlement Agreement, the Company placed in an escrow account the amount of €2 million to provide for payment of certain vendor liabilities claimed by 3S Photonics. In March 2008, the parties finalized the liabilities and the remaining escrow funds of €1,512,506 were returned to the Company and recognized as a gain on the subsidiary sale.
In July 2007, the Company and 3S Photonics entered into an Amendment Agreement to the Global Distributor Agreement whereby the Company distributed products manufactured by 3S Photonics. The Amendment Agreement provided that the Global Distributor Agreement between the Company and 3S Photonics terminated in April 2008, except for one customer, Alcatel-Lucent, for which 3S Photonics had the right to extend the term of the Global Distributor Agreement for an additional year. This amendment was granted in exchange for a cash payment by 3S Photonics to Avanex. 3S Photonics agreed to provide Avanex with free product or cash under the Global Distributor Agreement in the amount of €415,806 per quarter for six quarters. As a result of the Global Distributor Agreement and legal settlement in June 2008, the Company reduced cost of goods sold by approximately $3.7 million in fiscal 2008.
On December 27, 2007, the Company filed an arbitration claim against 3S Photonics in New York regarding disputes primarily involving the early termination of the Global Distributor Agreement by 3S Photonics and other payment obligations the Company believed 3S Photonics owes to it. 3S Photonics filed a response and counter-claim to the arbitration in which it denied the Company’s claim and alleged among other matters that the Company had breached certain contractual agreements resulting in damages to 3S Photonics. In March 2008, 3S Photonics instituted legal proceedings against the Company in the Commercial Court of Evry in France. 3S Photonics alleged that the Company disparaged 3S Photonics by, among other things, issuing a press release announcing that the Company had initiated arbitration proceedings against 3S Photonics relating to the early termination of the Global Distributor Agreement. 3S Photonics alleged damages in excess of €21 million.
In June, 2008, the Company and 3S Photonics settled their dispute. While neither side admitted liability, the two parties agreed to a settlement that included payables, receivables and lost profits under the parties’ terminated Global Distributor Agreement, and a release by both parties of all claims asserted against each other. With this resolution, there is no remaining litigation between Avanex and 3S Photonics.
46
AVANEX CORPORATION
NOTES TO CONSOLIDATED FINANCIAL STATEMENTS—(Continued)
Note 3. Restructuring
A summary of the Company’s accrued restructuring liability is as follows (in thousands):
| | | | | | | | |
| | | June 30, | |
| | | 2008 | | | 2007 | |
Accrued facility closure costs | | $ | 7,983 | | | $ | 11,106 | |
Less current portion | | | (2,940 | ) | | | (2,837 | ) |
| | | | | | | | |
Non-current portion | | $ | 5,043 | | | $ | 8,269 | |
| | | | | | | | |
Accrued Restructuring Liability Related to Acquisitions
In fiscal 2004, the Company acquired the optical components businesses of Alcatel and Corning. As part of the acquisitions, the Company recorded restructuring liabilities at July 31, 2003 with a fair value of $64.1 million relating to future workforce reductions, which were included in the purchase price of the optical components businesses of Alcatel and Corning. During fiscal 2007, the Company made cash payments to participants and to third parties who assumed liabilities of the remaining $3.4 million relating to the 2003 workforce reduction.
Other Restructuring
Over the past several years, the Company has implemented various restructuring programs to realign resources in response to the changes in the industry and customer demand, and the Company continues to assess its current and future operating requirements accordingly. The Company’s restructuring programs include centralizing global manufacturing at its operations center in Thailand.
During fiscal 2006, the Company approved a work force reduction of 41 employees due to the re-alignment of our work force as a result of the transfer of most of our manufacturing operations to third-party contract manufacturers. The reduction in force was completed in October 2006. The costs associated with this restructuring consisted primarily of severance costs of $1.7 million.
The restructurings have resulted and will result in, among other things, a significant reduction in the size of the Company’s workforce, consolidation of its facilities and increased reliance on outsourced, third-party manufacturing.
The following table summarizes changes in accrued restructuring for fiscal 2008 and 2007, excluding accruals related to the acquisitions noted above (in thousands):
| | | | | | | | | | | | | | | | | |
| | | Accrued
Liability at
June 30, 2007 | | Additional
Accruals
During
Fiscal 2008 | | Cash Payments
During
Fiscal 2008 | | | Recovery During
Fiscal 2008 | | | Accrued
Liability at
June 30, 2008 |
Workforce reduction, fiscal 2004 | | $ | — | | $ | — | | $ | — | | | $ | — | | | $ | — |
Workforce reduction, fiscal 2005 | | | 11 | | | — | | | (11 | ) | | | — | | | | — |
Workforce reduction, fiscal 2006 | | | — | | | — | | | — | | | | — | | | | — |
Abandonment of excess leased facilities | | | 11,095 | | | 615 | | | (2,948 | ) | | | (779 | ) | | | 7,983 |
| | | | | | | | | | | | | | | | | |
Total | | $ | 11,106 | | $ | 615 | | $ | (2,959 | ) | | $ | (779 | ) | | $ | 7,983 |
| | | | | | | | | | | | | | | | | |
47
AVANEX CORPORATION
NOTES TO CONSOLIDATED FINANCIAL STATEMENTS—(Continued)
| | | | | | | | | | | | | | | | | |
| | | Accrued
Liability at
June 30, 2006 | | Additional
Accruals
During
Fiscal 2007 | | Cash Payments
During
Fiscal 2007 | | | Recovery During
Fiscal 2007 | | | Accrued
Liability at
June 30, 2007 |
Workforce reduction, fiscal 2004 | | $ | 542 | | $ | — | | $ | (542 | ) | | $ | — | | | $ | — |
Workforce reduction, fiscal 2005 | | | 2,828 | | | 320 | | | (3,135 | ) | | | (2 | ) | | | 11 |
Workforce reduction, fiscal 2006 | | | 62 | | | — | | | (60 | ) | | | (2 | ) | | | — |
Abandonment of excess leased facilities | | | 12,708 | | | 1,278 | | | (2,803 | ) | | | (88 | ) | | | 11,095 |
| | | | | | | | | | | | | | | | | |
Total | | $ | 16,140 | | $ | 1,598 | | $ | (6,540 | ) | | $ | (92 | ) | | $ | 11,106 |
| | | | | | | | | | | | | | | | | |
Note 4. Net Income (Loss) per Share
The following table presents the calculation of basic and diluted net income (loss) per share (in thousands, except per share data):
| | | | | | | | | | | |
| | | Year Ended June 30, | |
| | | 2008 | | 2007 | | | 2006 | |
Net income (loss) | | $ | 4,720 | | $ | (30,605 | ) | | $ | (54,692 | ) |
| | | | | | | | | | | |
Shares used to compute basic net income (loss) per share | | | 15,242 | | | 14,196 | | | | 10,882 | |
Potentially dilutive shares used to compute net income per share on a diluted basis | | | 128 | | | — | | | | — | |
| | | | | | | | | | | |
Shares used to compute diluted net income (loss) per share | | | 15,370 | | | 14,196 | | | | 10,882 | |
| | | | | | | | | | | |
Net income (loss) per share: | | | | | | | | | | | |
Basic | | $ | 0.31 | | $ | (2.16 | ) | | $ | (5.03 | ) |
| | | | | | | | | | | |
Diluted | | $ | 0.31 | | $ | (2.16 | ) | | $ | (5.03 | ) |
| | | | | | | | | | | |
During the periods presented, the Company had securities outstanding that could potentially dilute basic earnings per share in the future, but were excluded from the computation of diluted net loss per share, as their effect would have been anti-dilutive. The anti-dilutive securities are as follows:
| | | | | | |
| | | Balance at June 30 |
| | | 2008 | | 2007 | | 2006 |
Employee stock options | | 811,080 | | 887,175 | | 842,804 |
8% convertible notes | | — | | — | | 410,767 |
Warrants attached to 8% convertible notes | | — | | 529,201 | | 578,512 |
Warrants granted to landlord | | 4,000 | | 4,000 | | 4,000 |
Warrants attached to March 2006 equity securities offering | | 489,315 | | 489,315 | | 481,500 |
Warrants attached to March 2007 equity securities offering | | 179,917 | | 179,917 | | — |
| | | | | | |
| | 1,484,312 | | 2,089,608 | | 2,317,583 |
| | | | | | |
Note 5. Consolidated Balance Sheet Detail
Cash, Cash Equivalents, and Short-term Investments
The Company generally invests its excess cash in debt instruments of the U.S. Treasury, government agencies, and corporations with strong credit ratings. Such investments are made in accordance with the Company’s investment policy, which establishes guidelines relative to diversification and maturities designed to maintain safety and liquidity. To date, the Company has not experienced any significant losses on its debt investments.
48
AVANEX CORPORATION
NOTES TO CONSOLIDATED FINANCIAL STATEMENTS—(Continued)
The table below summarizes the amortized cost, fair value and gross unrealized gains and losses related to available-for-sale securities, aggregated by security type. All of our investments have maturity dates of one year or less from the date of purchase.
Cash, Cash equivalents, and short-term investments consist of the following (in thousands):
| | | | | | | | | | | | | |
| | | Amortized
Cost | | Gross
Unrealized
Gains | | Gross
Unrealized
Losses | | | Estimated
Fair
Value |
June 30, 2008 | | | | | | | | | | | | | |
Cash | | $ | 10,106 | | $ | — | | $ | — | | | $ | 10,106 |
Cash Equivalents—Money Market Funds | | | 4,733 | | | — | | | — | | | | 4,733 |
Restricted cash—Certificates of Deposit and United States Government Agencies | | | 3,776 | | | — | | | — | | | | 3,776 |
Short-term Investments: | | | | | | | | | | | | | |
Commercial Paper | | | 7,981 | | | 1 | | | — | | | | 7,982 |
United States Government Agencies | | | 32,653 | | | 2 | | | (47 | ) | | | 32,608 |
| | | | | | | | | | | | | |
Subtotal, short-term investments | | | 40,634 | | | 3 | | | (47 | ) | | | 40,590 |
| | | | | | | | | | | | | |
Total cash, cash equivalents and short-term investments | | $ | 59,249 | | $ | 3 | | $ | (47 | ) | | $ | 59,205 |
| | | | | | | | | | | | | |
June 30, 2007 | | | | | | | | | | | | | |
Cash | | $ | 14,661 | | $ | — | | $ | — | | | $ | 14,661 |
Cash Equivalents—Money Market Funds | | | 176 | | | — | | | — | | | | 176 |
Restricted cash—Certificates of Deposit and United States Government Agencies | | | 3,620 | | | — | | | — | | | | 3,620 |
Short-term Investments: | | | | | | | | | | | | | |
Certificates of Deposit | | | 11 | | | — | | | — | | | | 11 |
Commercial Paper | | | 17,060 | | | — | | | (1 | ) | | | 17,059 |
United States Government Agencies | | | 4,019 | | | — | | | (5 | ) | | | 4,014 |
Corporate Notes | | | 3,272 | | | 1 | | | — | | | | 3,273 |
Corporate Bonds | | | 2,580 | | | — | | | (9 | ) | | | 2,571 |
Foreign Debt Securities | | | 2,013 | | | 1 | | | — | | | | 2,014 |
| | | | | | | | | | | | | |
Subtotal, short-term investments | | | 28,955 | | | 2 | | | (15 | ) | | | 28,942 |
| | | | | | | | | | | | | |
Total cash, cash equivalents and short-term investments | | $ | 47,412 | | $ | 2 | | $ | (15 | ) | | $ | 47,399 |
| | | | | | | | | | | | | |
Inventory
Inventories, net, consist of the following (in thousands):
| | | | | | |
| | | June 30, |
| | | 2008 | | 2007 |
Raw materials | | $ | 7,981 | | $ | 4,781 |
Work-in-process | | | 360 | | | 591 |
Finished goods | | | 7,638 | | | 9,816 |
| | | | | | |
| | $ | 15,979 | | $ | 15,188 |
| | | | | | |
The Company recorded charges to cost of revenue of $4.7 million for excess and obsolete inventory in fiscal 2008, $12.9 million in fiscal 2007, and $12.8 million in fiscal 2006. The write-off was primarily due to lower demand for certain products and lower expected usage of previously purchased inventory. Management did not believe it could fully recover the purchase price of this inventory in the future.
49
AVANEX CORPORATION
NOTES TO CONSOLIDATED FINANCIAL STATEMENTS—(Continued)
The Company sold inventory previously written-off with original cost totaling $2.9 million in fiscal 2008, $1.2 million in fiscal 2007 and $0.2 million in fiscal 2006. The majority of this inventory sold in each year had been written-off in a prior year. As a result, cost of revenue associated with the sale of this inventory was zero.
Other Current Assets
Other current assets consist of the following (in thousands):
| | | | | | |
| | | June 30, |
| | | 2008 | | 2007 |
VAT receivable and research tax credit receivable | | $ | 2,424 | | $ | 1,213 |
Prepaid insurance | | | 305 | | | 493 |
Prepaid rent | | | — | | | 10 |
Billings to contract manufacturers | | | 2,714 | | | 3,302 |
Prepaid expenses and other assets | | | 1,043 | | | 698 |
| | | | | | |
| | $ | 6,486 | | $ | 5,716 |
| | | | | | |
Property and Equipment
Property and equipment consist of the following (in thousands):
| | | | | | | | |
| | | June 30, | |
| | | 2008 | | | 2007 | |
Computer hardware and software | | $ | 9,893 | | | $ | 9,217 | |
Production and engineering equipment | | | 39,813 | | | | 34,537 | |
Office equipment, furniture and fixtures | | | 1,360 | | | | 971 | |
Leasehold improvements | | | 1,852 | | | | 1,791 | |
| | | | | | | | |
Total acquisition cost | | | 52,918 | | | | 46,516 | |
Accumulated depreciation and amortization | | | (45,229 | ) | | | (40,616 | ) |
| | | | | | | | |
Net book value | | $ | 7,688 | | | $ | 5,900 | |
| | | | | | | | |
Warranties
In general, the Company provides a product warranty for one year from the date of shipment. The Company accrues for the estimated costs of product warranties during the period in which revenue is recognized. The Company estimates the costs of its warranty obligations based on its historical experience and expectation of future conditions. The Company periodically assesses the adequacy of its recorded warranty liabilities and adjusts the amounts as necessary.
Changes in the Company’s product warranty accrual for fiscal 2008, fiscal 2007 and fiscal 2006 are as follows (in thousands):
| | | | | | | | | | | | |
| | | Years Ended June 30, | |
| | | 2008 | | | 2007 | | | 2006 | |
Balance at beginning of year | | $ | 873 | | | $ | 1,799 | | | $ | 5,268 | |
Accrual for sales during the year | | | 197 | | | | 1,334 | | | | 1,826 | |
Cost of warranty repair | | | (444 | ) | | | (906 | ) | | | (877 | ) |
Change in estimate and expiration for prior provisions | | | — | | | | (1,354 | ) | | | (4,418 | ) |
| | | | | | | | | | | | |
Balance at end of year | | $ | 626 | | | $ | 873 | | | $ | 1,799 | |
| | | | | | | | | | | | |
50
AVANEX CORPORATION
NOTES TO CONSOLIDATED FINANCIAL STATEMENTS—(Continued)
During fiscal 2007, the Company determined that the pattern for replacement as opposed to repair had shifted resulting in decreases to previous estimates for product warranty costs.
Other Accrued Expenses and Deferred Revenue
Other accrued expenses and deferred revenue consist of the following (in thousands):
| | | | | | |
| | | June 30, |
| | | 2008 | | 2007 |
Accrued escrow agreement | | $ | — | | $ | 2,700 |
Professional services | | | 1,243 | | | 1,899 |
Other accruals | | | 2,138 | | | 1,196 |
Taxes—foreign income, sales & use, and other taxes | | | 1,511 | | | 843 |
Contract manufacturer contingent liability | | | 320 | | | 981 |
Deferred revenue | | | 442 | | | 508 |
Building deposits owed to third parties | | | 97 | | | 439 |
Accrued severance | | | 142 | | | 230 |
| | | | | | |
Total | | $ | 5,893 | | $ | 8,796 |
| | | | | | |
Accumulated Other Comprehensive Income
Accumulated other comprehensive income is comprised of the following (in thousands):
| | | | | | | | | | |
| | | June 30, | |
| | | 2008 | | | | | 2007 | |
Unrealized loss on investments | | $ | (44 | ) | | | | $ | (13 | ) |
Cumulative translation adjustment | | | 949 | | | | | | 742 | |
Net actuarial gain | | | 372 | | | | | | 335 | |
| | | | | | | | | | |
Total | | $ | 1,277 | | | | | $ | 1,064 | |
| | | | | | | | | | |
Note 6. Other Intangibles
The following table reflects the carrying amount of intangible assets at June 30, 2008 and June 30, 2007 (in thousands):
| | | | | | | | | | | | | | | | | | | | | | |
| | | Weighted-
average
Life, in
Quarters | | Net
Carrying
Amount,
June 30,
2006 | | Less Fiscal
2007
Amortization | | | Net
Carrying
Amount,
June 30,
2007 | | Acquisition | | Less Fiscal
2008
Amortization | | | Net
Carrying
Amount,
June 30,
2008 |
Purchased technology | | 12 | | $ | 3,034 | | $ | (2,475 | ) | | $ | 559 | | $ | 300 | | $ | (659 | ) | | $ | 200 |
Supply agreement | | — | | | 136 | | | (136 | ) | | | — | | | — | | | — | | | | — |
Other | | 8 | | | 76 | | | (76 | ) | | | — | | | 226 | | | (112 | ) | | | 114 |
| | | | | | | | | | | | | | | | | | | | | | |
| | | | $ | 3,246 | | $ | (2,687 | ) | | $ | 559 | | $ | 526 | | $ | (771 | ) | | $ | 314 |
| | | | | | | | | | | | | | | | | | | | | | |
The amortization of other intangible assets is expected to be $314,000 in fiscal 2009.
Note 7. Related Party Transactions
On July 31, 2003, Alcatel (now known as Alcatel-Lucent) was issued 28% of the Company’s common stock and Corning was issued 17% of the Company’s common stock on a post-transaction basis. On October 29, 2007,
51
AVANEX CORPORATION
NOTES TO CONSOLIDATED FINANCIAL STATEMENTS—(Continued)
the Pirelli Group acquired all the shares of the Company’s common stock then held by Alcatel-Lucent. As of June 30, 2008, Pirelli and Corning owned shares representing 12% and zero percent, respectively, of the outstanding shares of Avanex common stock. The Company sells products to and purchases raw materials and components from the Pirelli Group and Alcatel-Lucent in the regular course of business. Additionally, Alcatel-Lucent and Corning provided certain administrative and other transitional services to the Company.
Amounts sold to and purchased from related parties were as follows (in thousands):
| | | | | | | | | |
| | | Year Ended June 30, |
| | | 2008* | | 2007** | | 2006*** |
Related party transactions | | | | | | | | | |
Sales to related parties | | $ | 18,273 | | $ | 61,375 | | $ | 43,890 |
Purchases from/services provided to related parties in cost of revenue | | | 991 | | | 491 | | | 2,726 |
Administrative and transitional services purchased from/provided to related parties; fiscal 2007 and 2006 amounts include facilities rent credits | | | — | | | 615 | | | 951 |
Royalty income | | | — | | | — | | | 190 |
| * | On October 29, 2007, the Pirelli Group acquired all the shares of the Company’s common stock held by Alcatel-Lucent. Thus, related party transactions for the year ended June 20, 2008 include Alcatel-Lucent through October 29, 2007, and the Pirelli Group from October 20, 2007 to June 30, 2008. |
| ** | On November 30, 2006, the merger of Alcatel and Lucent was completed and the combined company was named “Alcatel-Lucent.” As a result, we have included both Alcatel and Lucent transactions in the related party disclosure beginning December 1, 2006. |
| *** | On December 31, 2005, Corning no longer owned shares in Avanex. As a result, we have only included transactions with Corning in the related party disclosure for fiscal 2006. |
Amounts due from and due to related parties (in thousands):
| | | | | | |
| | | June 30, |
| | | 2008* | | 2007** |
Due from related parties | | $ | 85 | | $ | 14,381 |
Due to related parties | | $ | 110 | | $ | 2,144 |
| * | On October 29, 2007, the Pirelli Group acquired all the shares of the Company’s common stock held by Alcatel-Lucent. Thus, as of June 30, 2008, the Pirelli Group is a related party, and as of June 30, 2007, Alcatel-Lucent is a related party. |
| ** | On November 30, 2006, the merger of Alcatel and Lucent was completed and the combined company was named “Alcatel Lucent.” As a result, we have included both Alcatel and Lucent transactions in the related party disclosure beginning December 1, 2006. |
Receivables due from related parties at June 30, 2008 are amounts owed by the Pirelli Group contractually payable to the Company.
Note 8. Commitments and Contingencies
Operating Leases
In September 1999 and April 2000, the Company entered into operating leases for its corporate headquarters and manufacturing facility. Upon the expiration of each lease in October 2009 and April 2010, the Company has an option to extend the respective lease term for an additional five-year period. In July 2004, the Company assumed certain operating leases in Europe in connection with its acquisitions. The Company also has an operating lease for certain facilities in Newark, California which the Company no longer occupies. The remaining lease obligation is included in accrued restructuring costs.
52
AVANEX CORPORATION
NOTES TO CONSOLIDATED FINANCIAL STATEMENTS—(Continued)
Future minimum lease payments under non-cancelable operating leases having initial terms in excess of one year as of June 30, 2008 are as follows (in thousands):
| | | | | | | | | | | | | | |
| | | Total Cash
Obligation | | Amount Included in
Accrued Restructuring
Liability | | | Sublease
Payments | | | Future
Expense |
Years ending June 30, | | | | | | | | | | | | | | |
2009 | | $ | 5,779 | | $ | (2,940 | ) | | $ | (1,012 | ) | | $ | 1,827 |
2010 | | | 4,631 | | | (2,690 | ) | | | (695 | ) | | $ | 1,246 |
2011 | | | 3,114 | | | (2,353 | ) | | | (80 | ) | | $ | 681 |
2012 | | | 182 | | | — | | | | — | | | $ | 182 |
2013 | | | — | | | — | | | | — | | | $ | — |
Remaining years | | | — | | | — | | | | — | | | $ | — |
| | | | | | | | | | | | | | |
Total minimum lease payments | | $ | 13,706 | | $ | (7,983 | ) | | $ | (1,787 | ) | | $ | 3,936 |
| | | | | | | | | | | | | | |
Amounts shown in the above table are net of sublease income. The Company’s rental expense under operating leases was $2.8 million, $2.5 million and $7.3 million for the years ended June 30, 2008, 2007 and 2006, respectively.
Contingencies
From time to time, in the normal course of business, Avanex indemnifies certain customers with whom it enters into contractual relationships. Avanex has agreed to hold the other party harmless against third party claims that Avanex’s products, when used for their intended purpose, infringe the intellectual property rights of such third party or other claims made against certain parties. It is not possible to determine the maximum potential amount of liability under these indemnification obligations due to the limited history of prior indemnification claims and the unique facts and circumstances that are likely to be involved in each particular claim. The estimated fair value of these indemnification provisions is minimal. To date, the Company has not incurred any costs related to claims under these provisions, and no amounts have been accrued in the accompanying financial statements.
In addition, from time to time, Avanex is subject to various legal proceedings that arise from the normal course of business activities. In addition, from time to time, third parties assert patent or trademark infringement claims against Avanex in the form of letters and other forms of communication. Avanex does not believe that any of these legal proceedings or claims is likely to have a material adverse effect on its consolidated results of operations, financial condition, or cash flows. However, it is possible that an unfavorable resolution of one or more such proceedings could in the future materially affect Avanex’s future results of operations, cash flows, or financial position in a particular period.
IPO Class Action Lawsuit
On August 6, 2001, Avanex, certain of its officers and directors, and various underwriters in its initial public offering (“IPO”) were named as defendants in a class action filed in the United States District Court for the Southern District of New York, captioned Beveridge v. Avanex Corporation et al., Civil Action No. 01-CV-7256. This action and other subsequently filed substantially similar class actions have been consolidated into In re Avanex Corp. Initial Public Offering Securities Litigation, Civil Action No. 01 Civ. 6890. The consolidated amended complaint in the action generally alleges that various investment bank underwriters engaged in improper and undisclosed activities related to the allocation of shares in Avanex’s IPO. Plaintiffs have brought claims for violation of several provisions of the federal securities laws against those underwriters, and also against Avanex and certain of its directors and officers, seeking unspecified damages on behalf of a purported class of purchasers of Avanex’s common stock between February 3, 2000 and December 6, 2000. Various
53
AVANEX CORPORATION
NOTES TO CONSOLIDATED FINANCIAL STATEMENTS—(Continued)
plaintiffs have filed similar actions asserting virtually identical allegations against more than 40 investment banks and 250 other companies. All of these “IPO allocation” securities class actions currently pending in the Southern District of New York have been assigned to Judge Shira A. Scheindlin for coordinated pretrial proceedings as In re Initial Public Offering Securities Litigation, 21 MC 92. On October 9, 2002, the claims against Avanex’s directors and officers were dismissed without prejudice pursuant to a tolling agreement. The issuer defendants filed a coordinated motion to dismiss all common pleading issues, which the Court granted in part and denied in part in an order dated February 19, 2003. The Court’s order did not dismiss the Section 10(b) or Section 11 claims against Avanex.
In June 2004, a stipulation of settlement and release of claims against the issuer defendants, including Avanex, was submitted to the Court for approval. In August 2005, the Court preliminarily approved the settlement. In December 2006, the appellate court overturned the certification of classes in the six test cases that were selected by the underwriter defendants and plaintiffs in the coordinated proceedings. The case involving Avanex is not one of the six test cases. Because class certification was a condition of the settlement, it was unlikely that the settlement would receive final Court approval. On June 25, 2007, the Court entered an order terminating the proposed settlement based upon a stipulation among the parties to the settlement. Plaintiffs have filed amended master allegations and amended complaints and moved for class certification in the six focus cases, which the defendants in those cases have opposed. On March 26, 2008, the Court largely denied the defendants’ motion to dismiss the amended complaints. It is uncertain whether there will be any revised or future settlement. If a settlement does not occur, and litigation against Avanex continues, Avanex believes it has meritorious defenses and intends to defend the action vigorously. Nevertheless, an unfavorable result in litigation may result in substantial costs and may divert management’s attention and resources, which could harm our business, financial condition, results of operations or cash flow in a particular period.
Section 16(b) Demand
On October 3, 2007, a purported Avanex shareholder filed a complaint for violation of Section 16(b) of the Securities Exchange Act of 1934, which prohibits short-swing trading, against the Company’s IPO underwriters. The complaint, Vanessa Simmonds v. Morgan Stanley, et al., Case No. C07-01568, filed in District Court for the Western District of Washington, seeks the recovery of short-swing profits. The Company is named as a nominal defendant. No recovery is sought from the Company.
Note 9. Pension and Post-Retirement Benefits Other Than Pension Plans
With the acquisition of the optical components business of Alcatel, Avanex assumed a defined benefit pension plan covering the employees in France. The benefit obligation recorded on acquisition (project benefit obligation) was actuarially determined. The Company has not funded any of the benefit obligation as of June 30, 2008 and 2007.
Adoption of SFAS No. 158
SFAS No. 158, “Employers’ Accounting for Defined Benefit Pension and Other Postretirement Plans—an amendment of FASB Statements No. 87, 88, 106, and 132(R),” requires an employer to recognize the overfunded or underfunded status of a defined benefit postretirement plan (other than a multiemployer plan) as an asset or liability on its statement of financial position using prospective application. SFAS No.158 also requires an employer to recognize changes in that funded status in the year in which the changes occur through comprehensive income.
The Company adopted SFAS No. 158 in fiscal 2007. Upon adoption, the Company recorded an adjustment of $0.3 million to the ending balance of accumulated other comprehensive income for pension benefit plan.
54
AVANEX CORPORATION
NOTES TO CONSOLIDATED FINANCIAL STATEMENTS—(Continued)
The following table provides the incremental effect of applying SFAS No. 158 on the Consolidated Balance Sheets as of June 30, 2007 for the pension plan:
| | | | | | | | | | |
| | | Before
Application
of SFAS
No. 158 | | Adjustments
Due to
SFAS
No. 158 | | | After
Application
of SFAS
No. 158 |
| | | (In thousands) |
Pension liability | | $ | 560 | | $ | (335 | ) | | $ | 225 |
Total liabilities | | $ | 63,253 | | $ | (335 | ) | | $ | 62,918 |
Accumulated other comprehensive income (loss) | | $ | 729 | | $ | 335 | | | $ | 1,064 |
Total shareholders’ equity | | $ | 71,747 | | $ | 335 | | | $ | 72,082 |
Pension Benefit Plan
The following table provides information about changes in the benefit obligation and amounts recognized on the Consolidated Balance Sheets and in accumulated other comprehensive income:
| | | | | | | | |
| | | Pension
Benefits
2008 | | | Pension
Benefits
2007 | |
| | | (In thousands) | |
Change in benefit obligation: | | | | | | | | |
Beginning balance | | $ | 225 | | | $ | 1,062 | |
Service cost | | | 13 | | | | 69 | |
Interest cost | | | 12 | | | | 51 | |
Actuarial loss (gain) | | | (68 | ) | | | (9 | ) |
Curtailment/settlement | | | — | | | | (998 | ) |
Exchange rate changes | | | 41 | | | | 50 | |
| | | | | | | | |
Ending balance | | $ | 223 | | | $ | 225 | |
| | | | | | | | |
Amounts recognized on the consolidated balance sheets consist of: | | | | | | | | |
Other long term obligations | | $ | 223 | | | $ | 225 | |
Accumulated other comprehensive income | | | 427 | | | | 335 | |
| | | | | | | | |
Net amount recognized | | $ | 650 | | | $ | 560 | |
| | | | | | | | |
The change in accumulated other comprehensive income includes the actuarial gain/loss, as well as foreign exchange gain/loss on accumulated other comprehensive income for $55,000 as of June 30, 2008.
Components of net periodic benefit (gain)/cost for pension benefits were as follows:
| | | | | | | | |
| | | Year ended June 30, | |
| | | 2008 | | | 2007 | |
| | | (In thousands) | |
Pension benefit: | | | | | | | | |
Service cost | | $ | 13 | | | $ | 69 | |
Interest cost | | | 12 | | | | 51 | |
Amortization of actuarial gain | | | (31 | ) | | | — | |
Settlement associated with sale of subsidiary | | | — | | | | (998 | ) |
Effect of settlement on actuarial gain | | | — | | | | (1,371 | ) |
| | | | | | | | |
Net periodic benefit (gain) cost | | $ | (6 | ) | | $ | (2,249 | ) |
| | | | | | | | |
55
AVANEX CORPORATION
NOTES TO CONSOLIDATED FINANCIAL STATEMENTS—(Continued)
Contributions and Estimated Future Benefit Payments
To date, the Company has made no contribution to its pension plan. The Company does not have significant statutory or contractual funding requirements for the qualified defined benefit plan.
The following estimated future benefit payments, which reflect expected future service, as appropriate, are expected to be paid:
| | | |
| | | Pension
Benefit |
| | | (In thousands) |
Year | | | |
2009 – 2013 | | $ | — |
2014 – 2018 | | | 209 |
2019 | | | 97 |
| | | |
Total | | $ | 306 |
| | | |
Weighted Average Assumptions Used
Weighted average assumptions used to determine benefit obligations at June 30, 2008 and June 30, 2007 were as follows:
| | | | | | |
| | | Pension Benefits | |
| | | 2008 | | | 2007 | |
Discount rate | | 5.20 | % | | 4.65 | % |
Rate of compensation increase | | 3.5 | % | | 2.5 | % |
Expected residual active life (in years) | | 11.0 | | | 9.3 | |
Assumed discount rates are used in measurements of the projected, accumulated and vested benefit obligations and the service and interest cost components of net periodic pension cost. Management makes estimates of discount rates to reflect the rates at which the pension benefits could be effectively settled. In making those estimates, management evaluates rates of return on high-quality fixed-income investments currently available and expected to be available during the period to maturity of the pension benefits.
Note 10. Financing Arrangements
Senior Convertible Notes and Capital Lease Obligations
Senior Convertible Notes
On May 19, 2005, the Company closed a private placement of $35 million of the Company’s 8.0% senior secured convertible notes and warrants to purchase common stock. On November 8, 2005, certain terms of the May 2005 convertible note financing were amended pursuant to Amendment Agreements entered into between Avanex and each holder of such notes, and the Company issued amended and restated notes and amended and restated warrants.
During fiscal 2006, the amortization of prepaid interest, accretion of notes discount and the increase in the valuation of the Company’s warrants prior to their registration totaled $3.8 million. Unaccreted discount was $1.0 million at June 30, 2006.
During fiscal 2006, holders of $29.5 million of the outstanding Amended and Restated Notes converted to common stock. At June 30, 2006, the notes balance was $5.5 million at face value, and $4.6 million net of unaccreted discount.
During fiscal 2007, holders of the remaining $5.5 million of the Amended and Restated Notes converted to common stock. Accordingly, as of June 30, 2008, the Company does not have any outstanding Notes.
56
AVANEX CORPORATION
NOTES TO CONSOLIDATED FINANCIAL STATEMENTS—(Continued)
Capital Lease Obligations
Payments due under capital lease agreements for equipment as of June 30, 2008 are as follows (in thousands):
| | | | |
| | | Total Cash
Obligation | |
Year ending June 30, 2009 | | $ | 15 | |
Less: Amounts representing interest | | | (2 | ) |
| | | | |
Present value of net minimum lease payments | | $ | 13 | |
| | | | |
The Company leases certain equipment and other fixed assets under capital lease agreements. The assets and liabilities under the capital leases are recorded at the lesser of the present value of aggregate future minimum lease payments, including estimated bargain purchase options, or the fair value of the assets under lease. Assets under capital leases are amortized over the shorter of the lease term or useful life of the assets. At June 30, 2007 and 2008, the Company had minimal capital lease obligations.
Note 11. Stockholders’ Equity
Following the close of market on August 12, 2008, we effected a fifteen-for-one reverse stock split of our common stock. Accordingly, each fifteen shares of issued and outstanding Avanex common stock and equivalents as of the close of market on August 12, 2008 was converted into one share of common stock, and the reverse stock split was reflected in the trading price of Avanex’s common stock at the opening of market on August 13, 2008. Unless indicated otherwise, all share amounts and per share prices appearing in the consolidated financial statements reflect the reverse stock split.
Securities Purchase Agreements
On March 6, 2006, the Company entered into a Securities Purchase Agreement with certain buyers who were parties to the agreement for the sale of 1.6 million registered shares of common stock at a price per share of $30.00 for an aggregate purchase price of approximately $48.1 million. The investors also received warrants to purchase up to an aggregate of 0.5 million shares of common stock at an exercise price of $40.95 per share, subject to adjustment for antidilution, exercisable on or before March 9, 2010.
The number of shares deliverable upon exercise of the warrants and the exercise price of the warrants are each subject to adjustment whenever we issue or sell certain of our equity securities for a consideration per share less than a price equal to the applicable exercise price of the warrants. In connection with the Company’s March 1, 2007 financing, the holders of such warrants received an antidilution adjustment pursuant to the terms of such warrants resulting in up to 7,815 additional shares being issued upon the exercise of such warrants and the reduction of the exercise price of the warrants from $40.95 per share to $40.30 per share.
The net proceeds from the sale of the shares of common stock were $44.7 million, after deducting a placement fee and the Company’s offering expenses. In addition, if the warrants issued to the investors are exercised in full for cash, the Company will receive an additional $18.5 million in net proceeds.
On March 1, 2007, the Company sold 719,670 shares of common stock of Avanex at a price per share of $27.79 for an aggregate purchase price of $20 million. In connection with the sale, the investor received a warrant to purchase up to an additional 179,918 shares of common stock. The warrant is exercisable at an exercise price of $32.18 per share through March 1, 2011.
57
AVANEX CORPORATION
NOTES TO CONSOLIDATED FINANCIAL STATEMENTS—(Continued)
Shares Reserved
Common stock reserved for future issuance is as follows:
| | |
| | | June 30, 2008 |
Stock Option: | | |
Options outstanding | | 909,126 |
Restricted stock units outstanding | | 235,260 |
Reserved for future grants | | 1,525,609 |
Employee stock purchase plan | | 176,456 |
Officer and director share purchase plan | | 132,851 |
Warrants | | 673,232 |
| | |
Total shares reserved for future issuance | | 3,652,534 |
| | |
Note 12. Stock-based Compensation
Stock Option and Stock Rights Plans
The Company adopted the 1998 Stock Plan, which has been amended (the “Option Plan”), under which officers, employees, directors, and consultants may be granted options to purchase shares of the Company’s common stock. The Option Plan permits options to be granted at an exercise price of not less than the fair value on the date of grant as determined by the Board of Directors. Options are generally granted with ten-year terms and four-year vesting periods.
The authorized shares under the Option Plan automatically increase each July 1 by an amount equal to the lesser of (i) 400,000 shares, (ii) 4.9% of the Company’s outstanding shares, or (iii) a smaller amount determined by the Company’s Board of Directors. A total of 1,460,056 shares of the Company’s common stock have been reserved for future issuance under the Option Plan as of June 30, 2008.
The Option Plan also permits the Company to grant restricted stock units to employees. During fiscal 2008, the Company granted restricted stock units to employees that vest over periods of two to four years.
In January 2000, the Company adopted the 1999 Director Option Plan, which has been amended (the “Director Plan”). Non-employee directors are entitled to participate in the Director Plan. The Director Plan provides for an automatic initial grant of an option to purchase 5,333 shares of Avanex common stock to each non-employee director on the date when a person first becomes a non-employee director. Each initial option grant will vest as to 25% of the shares subject to the option on each anniversary of its date of grant. After each initial option grant, each non-employee director will automatically be granted an option to purchase 1,333 shares of Avanex common stock each year on the date of the Company’s annual stockholder’s meeting. These options will vest and become fully exercisable on the anniversary of the date of grant. Option grants generally have a term of 10 years. The exercise price of all options will be the fair market value per share of Avanex common stock on the date of grant. After the initial grant, each non-employee director will automatically be granted 667 Restricted Stock Units each year on the date of the Company’s annual stockholders’ meeting. The Restricted Stock Unit grants will fully vest and become 100% payable on the anniversary of the date of grant.
The Director Plan also provides for automatic annual increases each July 1, by an amount equal to the lesser of (i) 10,000 shares, (ii) 0.25% of the outstanding shares on that date, or (iii) a smaller amount determined by the Company’s Board of Directors. A total of 40,220 shares of the Company’s common stock have been reserved for future issuance under the Director Plan as of June 30, 2008.
58
AVANEX CORPORATION
NOTES TO CONSOLIDATED FINANCIAL STATEMENTS—(Continued)
Determining Fair Value
Valuation and amortization method—The Company estimates the fair value of stock options granted using the Black-Scholes option-pricing formula and a single option award approach. This fair value is then amortized on a straight-line basis over the requisite service periods of the awards, which is generally the vesting period.
Expected Term—Through December 31, 2007, the Company’s expected term was based on the SEC Staff Accounting Bulletin 107 simplified method. Beginning January 1, 2008, the Company has estimated the time-to-exercise based on historical exercise patterns of employee and director populations.
Expected Volatility—The Company’s volatility factor is estimated using the Company’s stock price history.
Expected Dividend—The Black-Scholes valuation model calls for a single expected dividend yield as an input. The dividend yield of zero is based on the fact that the Company has never paid cash dividends and has no present intention to pay cash dividends in the future.
Risk-Free Interest Rate—The Company bases the risk-free interest rate used in the Black-Scholes valuation method on the implied yield currently available on U.S. Treasury zero-coupon issues with an equivalent remaining term. Where the expected term of the Company’s stock-based awards does not correspond with the terms for which interest rates are quoted, the Company performs a straight-line interpolation to determine the rate from the available term maturities.
Fair Value—Fair value of the Company’s stock options granted to employees for the years ended June 30, 2008 and 2007 was estimated using the following weighted-average assumptions:
| | | | | | | | | | | | |
| | | Year Ended June 30, | |
| | | 2008 | | | 2007 | | | 2006 | |
Option Plan Shares: | | | | | | | | | | | | |
Expected term (in years) | | | 6.06 | | | | 6.25 | | | | 6.25 | |
Volatility | | | 76.2 | % | | | 77.0 | % | | | 80.0 | % |
Expected dividend | | | 0 | % | | | 0 | % | | | 0 | % |
Risk-free interest rate | | | 3.62 | % | | | 4.70 | % | | | 4.63 | % |
Weighted-average fair value | | $ | 15.50 | | | $ | 18.66 | | | $ | 21.67 | |
| | | |
ESPP Shares: | | | | | | | | | | | | |
Expected term (in years) | | | 1.00 | | | | 1.00 | | | | 1.00 | |
Volatility | | | 64.8 | % | | | 79.0 | % | | | 79.5 | % |
Expected dividend | | | 0 | % | | | 0 | % | | | 0 | % |
Risk-free interest rate | | | 3.07 | % | | | 4.93 | % | | | 4.31 | % |
Weighted-average fair value | | $ | 12.08 | | | $ | 12.86 | | | $ | 11.99 | |
Stock Compensation Expense
The following table summarizes the Company’s stock-based compensation expense:
| | | | | | | | | |
| | | Year Ended June 30, |
| | | 2008 | | 2007 | | 2006 |
Cost of sales | | $ | 1,051 | | $ | 1,110 | | $ | 422 |
Research and development | | | 2,097 | | | 2,292 | | | 1,321 |
Sales and marketing | | | 884 | | | 854 | | | 451 |
General and administrative | | | 2,007 | | | 2853.0 | | | 2,258 |
| | | | | | | | | |
Total stock-based compensation expense | | $ | 6,039 | | $ | 7,109 | | $ | 4,452 |
| | | | | | | | | |
59
AVANEX CORPORATION
NOTES TO CONSOLIDATED FINANCIAL STATEMENTS—(Continued)
At June 30, 2008, the total compensation cost related to unvested stock-based awards granted to employees under the Company’s stock option plans but not yet recognized was approximately $9.6 million, net of estimated forfeitures of $4.2 million. This cost will be amortized on a straight-line basis over a weighted-average period of approximately 2.7 years and will be adjusted for subsequent changes in estimated forfeitures.
Stock Option Activity
The Company issues new shares of common stock upon exercise of stock options. The following is a summary of option activity for Avanex’s stock option plans:
| | | | | | | | | | | |
| | | Number of
Shares | | | Weighted-
average
Exercise
Price | | Weighted-
average
Remaining
Contractual
Term in Years | | Aggregate
Intrinsic
Value, in
thousands |
Outstanding at July 1, 2005 | | 1,309,332 | | | $ | 76.24 | | 4.3 | | $ | 2,010 |
Granted | | 177,286 | | | $ | 26.42 | | | | | |
Exercised | | (103,408 | ) | | $ | 20.36 | | | | | |
Forfeitures and cancellations | | (540,406 | ) | | $ | 75.82 | | | | | |
| | | | | | | | | | | |
Outstanding at June 30, 2006 | | 842,804 | | | $ | 72.88 | | 7.6 | | $ | 1,986 |
Granted | | 228,170 | | | $ | 25.80 | | | | | |
Exercised | | (23,667 | ) | | $ | 15.38 | | | | | |
Forfeitures and cancellations | | (160,132 | ) | | $ | 68.32 | | | | | |
| | | | | | | | | | | |
Outstanding at June 30, 2007 | | 887,175 | | | $ | 63.13 | | 6.6 | | $ | 1,889 |
Granted | | 216,436 | | | $ | 22.47 | | | | | |
Exercised | | (25,321 | ) | | $ | 15.71 | | | | | |
Canceled | | (169,164 | ) | | $ | 51.01 | | | | | |
| | | | | | | | | | | |
Outstanding at June 30, 2008 | | 909,126 | | | $ | 57.02 | | 5.1 | | $ | 269 |
| | | | | | | | | | | |
Vested and expected to vest at June 30, 2008 | | 849,273 | | | $ | 59.39 | | 5.0 | | $ | 240 |
| | | | | | | | | | | |
Exercisable at June 30, 2008 | | 569,840 | | | $ | 76.62 | | 4.1 | | $ | 136 |
| | | | | | | | | | | |
| | | | | | | | | | | | |
Range of Exercise
Prices | | Number Outstanding As of June 30, 2008 | | Average Remaining Contractual Term, in Years | | Weighted
Average
Exercise
Price | | Number Exercisable, As of June 30, 2008 | | Weighted
Average
Exercise
Price |
| $ 5.85 – $ 16.50 | | 98,046 | | 6.72 | | $ | 13.76 | | 53,550 | | $ | 13.96 |
| $ 16.51 – $ 23.85 | | 90,359 | | 8.37 | | $ | 20.62 | | 23,995 | | $ | 20.36 |
| $ 24.15 – $ 24.15 | | 2,366 | | 9.22 | | $ | 24.15 | | 0 | | $ | 0.00 |
| $ 24.60 – $ 24.60 | | 169,641 | | 3.93 | | $ | 24.60 | | 33,609 | | $ | 24.60 |
| $ 25.20 – $ 29.70 | | 95,793 | | 7.99 | | $ | 27.81 | | 34,958 | | $ | 27.93 |
| $ 30.90 – $ 34.80 | | 98,234 | | 1.73 | | $ | 34.15 | | 86,023 | | $ | 34.48 |
| $ 34.95 – $ 43.20 | | 91,869 | | 6.20 | | $ | 39.89 | | 77,651 | | $ | 39.55 |
| $ 44.25 – $ 59.25 | | 122,443 | | 5.05 | | $ | 54.48 | | 119,679 | | $ | 54.65 |
| $ 60.00 – $ 87.75 | | 91,746 | | 3.63 | | $ | 71.37 | | 91,746 | | $ | 71.37 |
| $ 96.90 – $2,088.75 | | 48,629 | | 2.04 | | $ | 442.09 | | 48,629 | | $ | 442.09 |
| | | | | | | | | | | | |
| | 909,126 | | 5.13 | | $ | 57.02 | | 569,840 | | | 76.62 |
| | | | | | | | | | | | |
The aggregate intrinsic value is calculated as the difference between the exercise price of the underlying awards and the quoted price of the Company’s common stock. During the years ended June 30, 2008, 2007 and
60
AVANEX CORPORATION
NOTES TO CONSOLIDATED FINANCIAL STATEMENTS—(Continued)
2006, the aggregate intrinsic value of options exercised under the Company’s stock option plans was $274,000, $338,000 and $915,000, respectively. Intrinsic value was determined as of the date of option exercise.
Under the Option Plan, the Company may also grant share purchase rights either alone, in addition to, or in tandem with other awards granted under the Option Plan and/or cash awards granted outside the Option Plan. Exercise of these share purchase rights are made pursuant to restricted stock purchase agreements containing provisions established by the Board of Directors. These provisions may give the Company the right to repurchase the shares at the original sales price. This right expires at a rate determined by the Board of Directors, generally at a rate of 25% after one year and 1/48 per month thereafter. There were 1,800 share purchase rights issued in the year ended June 30, 2006, and there were no share purchase rights issued in the years ended June 30, 2008 and 2007. As of June 30, 2008, 2007 and 2006, no shares were subject to repurchase.
The weighted-average fair value of stock options granted during fiscal 2008, 2007 and 2006 were $15.50, $18.66 and $21.67 per share, respectively.
Restricted Stock Unit Activity
The Company issues new shares of common stock upon the vesting of restricted stock units. The following is a summary of activity for Avanex’s restricted stock unit awards granted under its option plans:
| | | | | | | | | | | | | |
| | | Number
of Shares | | | Weighted-
average
Exercise
Price | | Weighted-
average
Remaining
Contractual
Term in Years | | Aggregate
Intrinsic
Value, in
thousands | | Weighted
Average
Grant Date
Fair Value |
Outstanding at July 1, 2005 | | — | | | | | | | | | | | |
Awarded | | 395,217 | | | $ | 0.015 | | | | | | | |
Released | | (77,105 | ) | | $ | 0.015 | | | | | | | |
Forfeited | | (46,886 | ) | | $ | 0.015 | | | | | | | |
| | | | | | | | | | | | | |
Outstanding at June 30, 2006 | | 271,226 | | | $ | 0.015 | | 2.5 | | $ | 7,154 | | 26.83 |
Awarded | | 213,560 | | | $ | 0.015 | | | | | | | |
Released | | (151,619 | ) | | $ | 0.015 | | | | | | | |
Forfeited | | (52,568 | ) | | $ | 0.015 | | | | | | | |
| | | | | | | | | | | | | |
Outstanding at June 30, 2007 | | 280,599 | | | $ | 0.015 | | 1.3 | | $ | 7,575 | | 24.60 |
Awarded | | 217,994 | | | $ | 0.015 | | | | | | | 26.03 |
Released | | (193,562 | ) | | $ | 0.015 | | | | | | | 22.27 |
Forfeited | | (69,771 | ) | | $ | 0.015 | | | | | | | 24.62 |
| | | | | | | | | | | | | |
Outstanding at June 30, 2008 | | 235,260 | | | $ | 0.015 | | 1.5 | | $ | 3,877 | | 25.37 |
| | | | | | | | | | | | | |
Vested and expected to vest at June 30, 2008 | | 200,032 | | | $ | 0.015 | | 1.4 | | $ | 3,296 | | |
| | | | | | | | | | | | | |
The aggregate intrinsic value is calculated as the difference between the exercise price of the underlying awards and the quoted price of the Company’s common stock. During the years ended June 30, 2008, 2007 and 2006, the aggregate intrinsic value of restricted stock units vested under the Company’s stock option plans was $4.3 million, $4.1 million and $2.8 million, respectively. Intrinsic value was determined as of the date of restricted stock unit release.
1999 Employee Stock Purchase Plan
In January 2000, the Company adopted the 1999 Employee Stock Purchase Plan (the “Stock Purchase Plan”) for its employees. The Stock Purchase Plan permits participants to purchase the Company’s common stock through payroll deductions of up to 10% of the participant’s compensation. The maximum number of
61
AVANEX CORPORATION
NOTES TO CONSOLIDATED FINANCIAL STATEMENTS—(Continued)
shares a participant may purchase during each offering period is 200 shares. The price of common stock purchases will be 85% of the lower of the fair market value at the beginning of the offering period and the ending of the offering period.
The Stock Purchase Plan provides for automatic annual increases each July 1, to shares reserved for issuance by an amount equal to the lesser of (i) 50,000 shares, (ii) 1% of the outstanding shares on that date, or (iii) a smaller amount determined by the Company’s Board of Directors. A total of 176,456 shares of the Company’s common stock have been reserved for future issuance under the Stock Purchase Plan as of June 30, 2008.
Employee Stock Purchase Plan (“ESPP”) Information
In connection with our ESPP, the following shares were issued during the years ended June 30, 2008, 2007 and 2006:
| | | | | | | | | |
| | | Year Ended June 30, |
| | | 2008 | | 2007 | | 2006 |
Number of shares issued | | | 31,383 | | | 28,456 | | | 39,149 |
Weighted-average purchase price | | $ | 12.08 | | $ | 12.86 | | $ | 11.99 |
During the years ended June 30, 2008, 2007 and 2006, the aggregate intrinsic value of shares purchased under the Company’s ESPP was $182,000, $326,000 and $143,000, respectively.
Officer and Director Share Purchase Plan
In April 2008, the Company adopted the Officer and Director Share Purchase Plan (“ODPP”) for its executive officers and directors. The ODPP permits participants to purchase shares of the Company’s common stock at fair market value in lieu of salary or, in the case of directors, retainer fees. Eligible individuals will voluntarily participate in the ODPP by authorizing payroll deductions or, in the case of directors, deductions from retainer fees for the purpose of purchasing Avanex shares. Elections to participate in the ODPP may only be made during open trading windows under the Company’s insider trading policy when the participant does not otherwise possess material non-public information concerning the Company. The Board of Directors has authorized 133,333 shares to be made available for purchase by officers and directors under this ODPP which commenced in May 2008.
A total of 132,851shares of the Company’s common stock have been reserved for future issuance under the Officer and Director Share Purchase Plan as of June 30, 2008.
In connection with our ODPP, the following shares were issued during the year ended June 30, 2008:
| | | |
| | | Year Ended June 30, 2008 |
Number of shares issued | | | 482 |
Weighted-average purchase price | | $ | 16.56 |
Note 13. Income Taxes
The Company provides for income taxes using an asset and liability approach, under which deferred income taxes are provided based upon enacted laws and rates applicable to periods in which the taxes become payable.
The domestic and foreign components of income (loss) before income taxes were as follows (in thousands):
| | | | | | | | | | | | |
| | | Year Ended June 30, | |
| | | 2008 | | | 2007 | | | 2006 | |
Domestic | | $ | (5,138 | ) | | $ | (22,206 | ) | | $ | (46,680 | ) |
Foreign | | | 10,785 | | | | (7,935 | ) | | | (8,012 | ) |
| | | | | | | | | | | | |
Total | | $ | 5,647 | | | $ | (30,141 | ) | | $ | (54,692 | ) |
| | | | | | | | | | | | |
62
AVANEX CORPORATION
NOTES TO CONSOLIDATED FINANCIAL STATEMENTS—(Continued)
The reconciliation of income tax expense (benefit) at the statutory federal income tax rate of 34% to net income tax provision included in the statement of operations for the years ended June 30, 2008, 2007 and 2006 are as follows (in thousands):
| | | | | | | | | | | | |
| | | Year Ended June 30, | |
| | | 2008 | | | 2007 | | | 2006 | |
U.S. Fed taxes (benefit) at statutory rate | | $ | 1,919 | | | $ | (10,272 | ) | | $ | (18,595 | ) |
State income taxes, net of federal benefit | | | 20 | | | | — | | | | — | |
Foreign loss not benefited | | | 729 | | | | 2,544 | | | | 2,712 | |
FAS 123 (R) adoption | | | — | | | | — | | | | 12,450 | |
Expiring NOLs | | | — | | | | 215 | | | | — | |
Change in valuation allowance | | | (1,472 | ) | | | 7,947 | | | | 2,868 | |
Credits | | | (591 | ) | | | — | | | | — | |
Other | | | 322 | | | | 30 | | | | 565 | |
| | | | | | | | | | | | |
Total | | $ | 927 | | | $ | 464 | | | $ | — | |
| | | | | | | | | | | | |
Deferred tax assets and liabilities reflect the net tax effects of net operating loss and tax credit carryovers and the temporary differences between the carrying amounts of assets and liabilities for financial reporting and the amounts used for income tax purposes. Significant components of the Company’s deferred tax assets are as follows (in thousands):
| | | | | | | | | | | | |
| | | June 30, | |
| | | 2008 | | | 2007 | | | 2006 | |
Deferred Tax Assets: | | | | | | | | | | | | |
NOL’s | | $ | 121,503 | | | $ | 94,252 | | | $ | 153,194 | |
Tax credit carryforwards | | | 6,939 | | | | 5,646 | | | | 5,076 | |
Inventory reserves | | | 5,556 | | | | 10,515 | | | | 9,993 | |
Restructuring charges | | | 2,912 | | | | 4,029 | | | | 4,845 | |
Other | | | 10,561 | | | | 9,490 | | | | 5,965 | |
Intangibles | | | 1,056 | | | | 2,332 | | | | 822 | |
| | | | | | | | | | | | |
Total deferred tax assets | | | 148,527 | | | | 126,264 | | | | 179,895 | |
Valuation allowance | | | (148,527 | ) | | | (126,264 | ) | | | (179,895 | ) |
| | | | | | | | | | | | |
Net Deferred Tax Assets | | $ | — | | | $ | — | | | $ | — | |
| | | | | | | | | | | | |
Realization of deferred tax assets is dependent upon future earnings, if any, the timing and amount of which are uncertain. Accordingly, the net deferred tax assets have been fully offset by a valuation allowance. The valuation allowance increased (decreased) by $22.3 million and ($53.6) million during June 30, 2008 and June 30, 2007, respectively.
As of June 30, 2008, the Company had net operating loss carry forwards for federal income tax purposes of approximately $305 million which expire in the years 2012 through 2028 and federal research and development tax credits of approximately $5.9 million which expire in years 2013 through 2028. The Company also had state net operating loss carry forwards of approximately $111.3 million which expire in the years 2009 through 2028 and state research and development tax credits of approximately $7.4 million which have no expiration. The Company had net operating loss carry forwards for foreign income tax purposes of approximately $78.7 million.
As of June 30, 2007, insufficient evidence was available to recognize certain foreign net operating losses or loss carry forwards, therefore a portion of the foreign net operating losses was derecognized with a corresponding offset to the valuation allowance. During fiscal 2008, the Company obtained sufficient evidence to support the
63
AVANEX CORPORATION
NOTES TO CONSOLIDATED FINANCIAL STATEMENTS—(Continued)
inclusion of the foreign net operating losses. Thus, as of June 30, 2008, the Company included a portion of the formerly derecognized NOL’s in its deferred tax asset schedule with a corresponding offset to the valuation allowance.
Utilization of the net operating losses may be subject to substantial annual limitation due to federal and state ownership limitations. The utilization of net operating losses is subject to Section 382 limitation resulting from changes in ownership of the Company.
Effective July 1, 2007, we adopted Financial Accounting Standards Interpretation, or FIN, No. 48, “Accounting for Uncertainty in Income Taxes—an interpretation of FASB Statement No. 109.” FIN No. 48 prescribes a recognition threshold and measurement attribute for the financial statement recognition and measurement of uncertain tax positions taken or expected to be taken in a company’s income tax return, and also provides guidance on derecognition, classification, interest and penalties, accounting in interim periods, disclosure, and transition. FIN No. 48 utilizes a two-step approach for evaluating uncertain tax positions accounted
for in accordance with SFAS No. 109, “Accounting for Income Taxes” or SFAS No. 109. The first step, “Recognition” requires a company to determine if the weight of available evidence indicates that a tax position is more likely than not to be sustained upon audit, including resolution of related appeals or litigation processes, if any. The second step, “Measurement” is based on the largest amount of benefit, which is more likely than not to be realized on ultimate settlement. As the Company had recorded a full valuation allowance against its deferred tax assets, there was no cumulative effect of adopting FIN No. 48. Upon adoption, the total amount of gross unrecognized tax benefits was $6.3 million.
At June 30, 2008, we had approximately $6.4 million in total unrecognized tax benefits. A reconciliation of the beginning and ending amount of unrecognized tax benefits is as follows (in thousands):
| | | |
Balance at July 1, 2007 | | $ | 6,325 |
Additions based on tax positions related to the current year | | | 28 |
Reductions based on tax positions related to prior years | | | — |
Settlements | | | — |
| | | |
Balance at June 30, 2008 | | $ | 6,353 |
| | | |
At June 30, 2008, the total unrecognized tax benefits of $6.4 million consist of approximately $6.4 million of unrecognized tax benefits that have been netted against the related deferred tax assets. None of the unrecognized tax benefit will impact the rate in future years until the Company releases its valuation allowance.
We recognize interest and/or penalties related to uncertain tax positions in income tax expense. To the extent accrued interest and penalties do not ultimately become payable, amounts accrued will be reduced and reflected as a reduction of the overall income tax provision in the period that such determination is made. There were no interest and penalties accrued upon the adoption of FIN No. 48 on July 1, 2007 nor at June 30, 2008.
We file income tax returns in the United States on a federal basis, in California and various foreign jurisdictions. The tax years 2001 to 2006 remain open to examination in the United States and California which are the major taxing jurisdictions in which we are subject to tax.
Note 14. Market Sales, Export Sales, Significant Customers, and Concentration of Supply
SFAS No. 131, “Disclosures about Segments of an Enterprise and Related Information,” establishes standards for the way public business enterprises report information about operating segments in annual financial statements and requires that those enterprises report selected information about operating segments in interim financial reports. SFAS No. 131 also establishes standards for related disclosures about products and services, geographic areas and major customers.
64
AVANEX CORPORATION
NOTES TO CONSOLIDATED FINANCIAL STATEMENTS—(Continued)
The Company’s chief operating decision maker is considered to be the Company’s Chief Executive Officer (“CEO”). The CEO reviews the Company’s financial information presented on a consolidated basis substantially similar to the accompanying consolidated financial statements. Therefore, the Company has concluded that it operates in one segment, to manufacture and market photonic processors, and accordingly has provided only the required enterprise wide disclosures. The Company has adopted a matrix management organizational structure, whereby management of worldwide activities is on a functional basis.
Customers who represented 10% or more of our net revenue or accounts receivable were as follows:
| | | | | | | | | | | | | | | |
| | | Percentage of Net Revenue
for the Year ended June 30, | | | Percent of Accounts
Receivable at June 30, | |
| | | 2008 | | | 2007 | | | 2006 | | | 2008 | | | 2007 | |
Company A | | 25 | % | | 29 | % | | 27 | % | | 21 | % | | 24 | % |
Company B | | 21 | % | | 17 | % | | * | | | 17 | % | | 10 | % |
Company C | | * | | | * | | | 11 | % | | * | | | * | |
| | | | | | | | | | | | | | | |
| | 46 | % | | 46 | % | | 38 | % | | 38 | % | | 34 | % |
| | | | | | | | | | | | | | | |
* less than 10%
Revenues by geographical area were as follows (in thousands):
| | | | | | | | | |
| | | Year Ended June 30, |
| | | 2008 | | 2007 | | 2006 |
Americas | | $ | 93,304 | | $ | 95,189 | | $ | 75,889 |
Europe | | | 68,946 | | | 84,126 | | | 67,151 |
Asia-Pac | | | 45,844 | | | 33,440 | | | 19,904 |
| | | | | | | | | |
Total | | $ | 208,094 | | $ | 212,755 | | $ | 162,944 |
| | | | | | | | | |
Long-lived assets by geographical area were as follows (in thousands):
| | | | | | |
| | | Year Ended
June 30, |
| | | 2008 | | 2007 |
U.S. | | $ | 5,159 | | $ | 3,949 |
Non-U.S. | | | 2,529 | | | 1,951 |
| | | | | | |
| | $ | 7,688 | | $ | 5,900 |
| | | | | | |
Note 15. Acquisition
On July 2, 2007, the Company purchased certain assets from Essex Corporation (“Essex”), a subsidiary of Northrop Grumman Space and Mission Systems Corporation, for $2.1 million in cash, including $0.2 million of direct transaction costs incurred in connection with the acquisition. The Company acquired the assets relating to the MSA 300-pin transponder and XFP transceiver businesses of the Commercial Communication Products Division of Essex.
The transaction was accounted for as a purchase of assets in accordance with FASB Statement No. 141, “Business Combination”; therefore, the tangible assets acquired were recorded at fair value on the acquisition date.
In allocating the purchase price based on estimated fair values, we recorded approximately $1.6 million and $0.5 million of tangible and intangible assets acquired, respectively. The tangible assets consist of $1.1 million of
65
AVANEX CORPORATION
NOTES TO CONSOLIDATED FINANCIAL STATEMENTS—(Continued)
fixed assets, $0.3 million of inventory, and $0.2 million of prepaid rent, while the intangible assets consist of $0.3 million for technology and $0.2 million for a non-compete agreement. The allocation of the purchase price was based upon assessments by management of the fair value of the assets acquired.
Note 16. Quarterly Financial Data (Unaudited)
| | | | | | | | | | | | | | | | | | | | | | | | | | | | | | | | |
| | | Jun. 30,
2008* | | | Mar. 31,
2008 | | | Dec. 31,
2007 | | | Sep. 30,
2007 | | | Jun. 30,
2007 | | | Mar. 31,
2007 | | | Dec. 31,
2006 | | | Sep. 30,
2006 | |
| | | (In thousands except per share data) | |
| | | (Unaudited) | |
Consolidated Statement of Operations Data: | | | | | | | | | | | | | | | | | | | | | | | | | | | | | | | | |
Net revenue | | $ | 51,822 | | | $ | 49,556 | | | $ | 52,007 | | | $ | 54,709 | | | $ | 51,098 | | | $ | 55,143 | | | $ | 55,623 | | | $ | 50,891 | |
Cost of revenue | | | 35,643 | | | | 33,461 | | | | 35,888 | | | | 39,517 | | | | 38,999 | | | | 44,845 | | | | 45,127 | | | | 45,579 | |
| | | | | | | | | | | | | | | | | | | | | | | | | | | | | | | | |
Gross profit | | | 16,179 | | | | 16,095 | | | | 16,119 | | | | 15,192 | | | | 12,099 | | | | 10,298 | | | | 10,496 | | | | 5,312 | |
Operating expenses: | | | | | | | | | | | | | | | | | | | | | | | | | | | | | | | | |
Research and development | | | 6,935 | | | | 7,012 | | | | 7,604 | | | | 6,774 | | | | 7,511 | | | | 6,263 | | | | 5,832 | | | | 5,625 | |
Sales and marketing | | | 4,211 | | | | 4,407 | | | | 4,202 | | | | 3,915 | | | | 3,779 | | | | 4,043 | | | | 3,891 | | | | 3,548 | |
General and administrative | | | 4,162 | | | | 4,621 | | | | 4,980 | | | | 4,475 | | | | 3,469 | | | | 5,083 | | | | 9,075 | | | | 5,651 | |
Amortization of intangibles | | | 56 | | | | 55 | | | | 101 | | | | 559 | | | | 664 | | | | 531 | | | | 656 | | | | 852 | |
Restructuring costs (recovery) | | | 137 | | | | 32 | | | | 2 | | | | (335 | ) | | | (17 | ) | | | 1,155 | | | | 436 | | | | (63 | ) |
(Gain) loss on disposal of property and equipment | | | (24 | ) | | | 1 | | | | — | | | | — | | | | (484 | ) | | | 5 | | | | (28 | ) | | | (20 | ) |
(Gain) loss on sale of subsidiary | | | — | | | | (1,996 | ) | | | — | | | | — | | | | 3,216 | | | | | | | | | | | | | |
| | | | | | | | | | | | | | | | | | | | | | | | | | | | | | | | |
Total operating expenses | | | 15,477 | | | | 14,132 | | | | 16,889 | | | | 15,388 | | | | 18,138 | | | | 17,080 | | | | 19,862 | | | | 15,593 | |
| | | | | | | | | | | | | | | | | | | | | | | | | | | | | | | | |
Income (loss) from operations | | | 702 | | | | 1,963 | | | | (770 | ) | | | (196 | ) | | | (6,039 | ) | | | (6,782 | ) | | | (9,366 | ) | | | (10,281 | ) |
Interest and other income, net | | | 979 | | | | 1,371 | | | | 1,083 | | | | 515 | | | | 818 | | | | 129 | | | | 813 | | | | 567 | |
| | | | | | | | | | | | | | | | | | | | | | | | | | | | | | | | |
Income (loss) before income taxes | | | 1,681 | | | | 3,334 | | | | 313 | | | | 319 | | | | (5,221 | ) | | | (6,653 | ) | | | (8,553 | ) | | | (9,714 | ) |
Provision for income taxes | | | (428 | ) | | | 2 | | | | (227 | ) | | | (274 | ) | | | (464 | ) | | | — | | | | — | | | | — | |
| | | | | | | | | | | | | | | | | | | | | | | | | | | | | | | | |
Net income (loss) | | $ | 1,253 | | | $ | 3,336 | | | $ | 86 | | | $ | 45 | | | $ | (5,685 | ) | | $ | (6,653 | ) | | $ | (8,553 | ) | | $ | (9,714 | ) |
| | | | | | | | | | | | | | | | | | | | | | | | | | | | | | | | |
Basic net income (loss) per common share | | $ | 0.08 | | | $ | 0.22 | | | $ | 0.01 | | | $ | 0.00 | | | $ | (0.38 | ) | | $ | (0.47 | ) | | $ | (0.62 | ) | | $ | (0.71 | ) |
| | | | | | | | | | | | | | | | | | | | | | | | | | | | | | | | |
Diluted net income (loss) per common share | | $ | 0.08 | | | $ | 0.22 | | | $ | 0.01 | | | $ | 0.00 | | | $ | (0.38 | ) | | $ | (0.47 | ) | | $ | (0.62 | ) | | $ | (0.71 | ) |
| | | | | | | | | | | | | | | | | | | | | | | | | | | | | | | | |
Basic shares outstanding | | | 15,321 | | | | 15,294 | | | | 15,235 | | | | 15,116 | | | | 15,044 | | | | 14,268 | | | | 13,791 | | | | 13,692 | |
Diluted shares outstanding | | | 15,330 | | | | 15,301 | | | | 15,460 | | | | 15,389 | | | | 15,044 | | | | 14,268 | | | | 13,791 | | | | 13,692 | |
| * | For the three months ended June 30, 2008 the Company posted certain adjustments after its earnings release on August 21, 2008, which resulted in net income decreasing by $39,000. Gross margin, however, decreased to 31%, as compared to 32% previously reported. |
66
| ITEM 9. | CHANGES IN AND DISAGREEMENTS WITH ACCOUNTANTS ON ACCOUNTING AND FINANCIAL DISCLOSURE |
Not applicable.
| ITEM 9A. | CONTROLS AND PROCEDURES |
Evaluation of Disclosure Controls and Procedures
Management, including our principal executive officer and principal financial officer, conducted an evaluation of the effectiveness of our disclosure controls and procedures, as defined in Rules 13a-15(e) and 15d-15(e) under the Securities Exchange Act of 1934, as of June 30, 2008. Based upon that evaluation, our principal executive officer and principal financial officer have concluded that our disclosure controls and procedures were not effective as of June 30, 2008 because of the material weakness discussed below.
Management’s Report on Internal Control over Financial Reporting
Our management is responsible for establishing and maintaining adequate internal control over financial reporting as defined in Rules 13a-15(f) and 15d-15(f) under the Securities Exchange Act of 1934. Our internal control over financial reporting is a process designed to provide reasonable assurance regarding the reliability of financial reporting and the preparation of financial statements for external reporting purposes in accordance with generally accepted accounting principles in the United States (“U.S. GAAP”). Internal control over financial reporting includes those policies and procedures that: (i) pertain to the maintenance of records that, in reasonable detail, accurately and fairly reflect our transactions and dispositions of assets; (ii) provide reasonable assurance that transactions are recorded as necessary to permit preparation of financial statements in accordance with U.S. GAAP, and that our receipts and expenditures are being made only in accordance with authorizations of our management and directors; and (iii) provide reasonable assurance regarding prevention or timely detection of unauthorized acquisition, use or disposition of our assets that could have a material effect on the financial statements.
Because of its inherent limitations, internal control over financial reporting may not prevent or detect misstatements. Also, projections of any evaluation of effectiveness to future periods are subject to the risk that controls may become inadequate because of changes in conditions, or that the degree of compliance with the policies or procedures may deteriorate.
Our management, including our principal executive officer and principal financial officer, assessed the effectiveness of our internal control over financial reporting as of June 30, 2008. In making this assessment, management used the criteria set forth in Internal Control-Integrated Framework issued by the Committee of Sponsoring Organizations of the Treadway Commission (COSO). Management’s assessment identified the following material weakness that results in more than a remote likelihood that a material misstatement of the annual or interim financial statements will not be prevented or detected:
Controls over the review of journal entries for inventory and taxes related to certain foreign subsidiaries were inadequately designed to prevent or detect a material misstatement of the consolidated financial statements.
Because of the weakness described above, management’s assessment is a conclusion that, as of June 30, 2008, our internal control over financial reporting was not effective based on the COSO criteria. Deloitte & Touche LLP, an independent registered public accounting firm, audited management’s assessment of the effectiveness of our internal control over financial reporting. Deloitte & Touche LLP issued an audit report thereon, which is included herein.
Our management is treating the outstanding material weakness, as well as the control environment, seriously and intends to implement the following actions to remediate the deficiencies:
Design and implement controls over the review of journal entries for certain foreign subsidiaries and increase training where necessary.
67
These actions are part of an overall program that management is implementing during the fiscal year ending June 30, 2009.
Changes in Internal Control over Financial Reporting During the Fiscal Quarter Ended June 30, 2008
There were no changes in our internal control over financial reporting during the quarter ended June 30, 2008 that have materially affected, or are reasonably likely to materially affect, our internal control over financial reporting other than the material weakness noted above.
| ITEM 9B. | OTHER INFORMATION |
Not applicable.
68
REPORT OF DELOITTE & TOUCHE LLP
INDEPENDENT REGISTERED PUBLIC ACCOUNTING FIRM
The Board of Directors and Stockholders of
Avanex Corporation:
We have audited the internal control over financial reporting of Avanex Corporation and subsidiaries (the “Company”) as of June 30, 2008, based on criteria established inInternal Control—Integrated Framework issued by the Committee of Sponsoring Organizations of the Treadway Commission. The Company’s management is responsible for maintaining effective internal control over financial reporting and for its assessment of the effectiveness of internal control over financial reporting, included in the accompanying Management’s Report on Internal Control Over Financial Reporting. Our responsibility is to express an opinion on the Company’s internal control over financial reporting based on our audit.
We conducted our audit in accordance with the standards of the Public Company Accounting Oversight Board (United States). Those standards require that we plan and perform the audit to obtain reasonable assurance about whether effective internal control over financial reporting was maintained in all material respects. Our audit included obtaining an understanding of internal control over financial reporting, assessing the risk that a material weakness exists, testing and evaluating the design and operating effectiveness of internal control based on the assessed risk, and performing such other procedures as we considered necessary in the circumstances. We believe that our audit provides a reasonable basis for our opinion.
A company’s internal control over financial reporting is a process designed by, or under the supervision of, the company’s principal executive and principal financial officers, or persons performing similar functions, and effected by the company’s board of directors, management, and other personnel to provide reasonable assurance regarding the reliability of financial reporting and the preparation of financial statements for external purposes in accordance with generally accepted accounting principles. A company’s internal control over financial reporting includes those policies and procedures that (1) pertain to the maintenance of records that, in reasonable detail, accurately and fairly reflect the transactions and dispositions of the assets of the company; (2) provide reasonable assurance that transactions are recorded as necessary to permit preparation of financial statements in accordance with generally accepted accounting principles, and that receipts and expenditures of the company are being made only in accordance with authorizations of management and directors of the company; and (3) provide reasonable assurance regarding prevention or timely detection of unauthorized acquisition, use, or disposition of the company’s assets that could have a material effect on the financial statements.
Because of the inherent limitations of internal control over financial reporting, including the possibility of collusion or improper management override of controls, material misstatements due to error or fraud may not be prevented or detected on a timely basis. Also, projections of any evaluation of the effectiveness of the internal control over financial reporting to future periods are subject to the risk that the controls may become inadequate because of changes in conditions, or that the degree of compliance with the policies or procedures may deteriorate.
A material weakness is a deficiency, or a combination of deficiencies, in internal control over financial reporting, such that there is a reasonable possibility that a material misstatement of the company’s annual or interim financial statements will not be prevented or detected on a timely basis. The following material weakness has been identified and included in management’s assessment: As of June 30, 2008, controls over the review of journal entries for inventory and taxes related to certain foreign subsidiaries were inadequately designed to prevent or detect a material misstatement of the consolidated financial statements. This material weakness was considered in determining the nature, timing, and extent of audit tests applied in our audit of the consolidated financial statements and financial statement schedule as of and for the year ended June 30, 2008, of the Company and this report does not affect our report on such financial statements and financial statement schedule.
In our opinion, because of the effect of the material weakness identified above on the achievement of the objectives of the control criteria the Company has not maintained effective internal control over financial reporting as of June 30, 2008, based on the criteria established inInternal Control—Integrated Framework issued by the Committee of Sponsoring Organizations of the Treadway Commission.
69
We have also audited, in accordance with the standards of the Public Company Accounting Oversight Board (United States), the consolidated financial statements and financial statement schedule as of and for the year ended June 30, 2008, of the Company, and our report dated September 4, 2008, expressed an unqualified opinion on those financial statements and financial statement schedule and included an explanatory paragraph regarding the change in the Company’s method of accounting for uncertainties in income taxes upon the adoption of Financial Accounting Standards Board Interpretation No. 48,Accounting for Uncertainty in Income Taxes—an interpretation of FASB Statement No. 109, as described in Note 1 to the consolidated financial statements.
/s/ DELOITTE & TOUCHE LLP
San Jose, California
September 4, 2008
70
PART III.
| ITEM 10. | DIRECTORS, EXECUTIVE OFFICERS AND CORPORATE GOVERNANCE |
The information required by this Item concerning our directors, compliance with Section 16 of the Securities and Exchange Act of 1934, our code of ethics that applies to our principal executive officer, principal financial officer and principal accounting officer and our Audit Committee is incorporated by reference to the information set forth in the sections entitled “Proposal One—Election of Directors,” “Section 16(a) Beneficial Ownership Reporting Compliance” and “Corporate Governance” in our Proxy Statement for our 2008 Annual Meeting of Stockholders to be filed with the Securities and Exchange Commission not later than 120 days after the end of our fiscal year (the “Proxy Statement”). Information regarding the Registrant’s executive officers is set forth at the end of Part I of this Annual Report on Form 10-K under the caption “Executive Officers of the Company.”
| ITEM 11. | EXECUTIVE COMPENSATION |
Information required by this Item is incorporated by reference to the information set forth under the caption “Executive Compensation” in the Proxy Statement.
| ITEM 12. | SECURITY OWNERSHIP OF CERTAIN BENEFICIAL OWNERS AND MANAGEMENT AND RELATED STOCKHOLDER MATTERS |
Information required by this Item is incorporated by reference to the information set forth under the sections entitled “Security Ownership of Beneficial Owners and Management” and “Equity Compensation Plan Information” in the Proxy Statement.
| ITEM 13. | CERTAIN RELATIONSHIPS AND RELATED TRANSACTIONS, AND DIRECTOR INDEPENDENCE |
Information required by this Item is incorporated by reference to the information set forth under the caption “Certain Relationships and Related Transactions” and “Corporate Governance” in the Proxy Statement.
| ITEM 14. | PRINCIPAL ACCOUNTING FEES AND SERVICES |
The information required by this Item is incorporated by reference to the section entitled “Ratification of Appointment of Independent Registered Public Accounting Firm—Accounting Fees” in the Proxy Statement.
71
PART IV.
| ITEM 15. | EXHIBITS, FINANCIAL STATEMENT SCHEDULES |
(a) The following documents are filed as part of this Report:
1. Financial Statements: See Index to Consolidated Financial Statements under Part II, Item 8 of this Annual Report on Form 10-K.
2. Financial Statement Schedule: The following financial statement schedule of Avanex, Inc., for the fiscal years ended June 30, 2008, 2007 and 2006, is filed as part of this Report and should be read in conjunction with the Consolidated Financial Statements of Avanex, Inc.
Schedule II Valuation and Qualifying Accounts
Schedules not listed above have been omitted because they are not applicable or are not required or the information required to be set forth therein is included in the Consolidated Financial Statements or Notes thereto.
3. Exhibits: See Item 15(b) below. We have filed, or incorporated into this Annual Report by reference, the exhibits listed on the accompanying Exhibits Index immediately following the signature page of this Form 10-K.
(b) Exhibits:
We have filed, or incorporated into this Annual Report by reference, the exhibits listed on the accompanying Exhibits Index immediately following the signature page of this Form 10-K.
(c) Financial Statement Schedules: See Item 15(a), above.
| ITEM 15(A)(2) | FINANCIAL STATEMENT SCHEDULE II |
Schedule II—Valuation and Qualifying Accounts
| | | | | | | | | | | | | |
| | | Balance at
Beginning of
Year | | Charged to
Costs and
Expenses | | | Deductions (1) | | Balance at
End of Year |
| | | (amounts in thousands) |
Allowance for doubtful accounts | | | | | | | | | | | | | |
Year ended June 30, 2006 | | $ | 1,992,000 | | $ | (1,992,000 | ) | | $ | — | | $ | — |
Year ended June 30, 2007 | | $ | — | | $ | — | | | $ | — | | $ | — |
Year ended June 30, 2008 | | $ | — | | $ | — | | | $ | — | | $ | — |
| (1) | Deductions represent uncollectible accounts written off, net of recoveries. |
All other schedules have been omitted because they are not applicable or are not required or the information required to be set forth therein is included in the Consolidated Financial Statements or Notes thereto.
72
SIGNATURES
Pursuant to the requirements of Section 13 or 15(d) of the Securities Exchange Act of 1934, the Registrant has duly caused this Annual Report on Form 10-K to be signed on its behalf by the undersigned, thereunto duly authorized.
| | |
AVANEX CORPORATION (Registrant) |
| |
By: | | /S/ GIOVANNI BARBAROSSA |
| | Giovanni Barbarossa Interim Chief Executive Officer (Duly Authorized Officer and Principal Executive Officer) |
Date: September 5, 2008
POWER OF ATTORNEY
KNOW ALL PERSONS BY THESE PRESENTS, that each person whose signature appears below constitutes and appoints Giovanni Barbarossa and Mark Weinswig, and each of them, as his or her true and lawful attorneys-in-fact and agents, with full power of substitution and resubstitution, for him or her and in his or her name, place, and stead, in any and all capacities, to sign any and all amendments to this report, and to file the same, with all exhibits thereto, and other documents in connection therewith, with the Securities and Exchange Commission, granting unto said attorneys-in-fact and agents, and each of them, full power and authority to do and perform each and every act and thing requisite and necessary to be done in connection therewith, as fully to all intents and purposes as he or she might or could do in person, hereby ratifying and confirming all that said attorneys-in-fact and agents, or any of them or their or his substitute or substitutes, may lawfully do or cause to be done by virtue hereof.
Pursuant to the requirements of the Securities Exchange Act of 1934, this Annual Report on Form 10-K has been signed by the following persons in the capacities on September 5, 2008.
| | |
Signature | | Title |
| |
/S/ GIOVANNI BARBAROSSA Giovanni Barbarossa | | Interim Chief Executive Officer (principal
executive officer) |
| |
/S/ MARK WEINSWIG Mark Weinswig | | Interim Chief Financial Officer (principal
financial and accounting officer) |
| |
/S/ VINTON CERF Vinton Cerf | | Director |
| |
/S/ GREG DOUGHERTY Greg Dougherty | | Director |
| |
/S/ JOEL A. SMITH III Joel A. Smith III | | Director |
| |
/S/ PAUL SMITH Paul Smith | | Non-Executive Chairman of the Board of
Directors and Director |
| |
/S/ SUSAN WANG Susan Wang | | Director |
| |
/S/ DENNIS WOLF Dennis Wolf | | Director |
73
EXHIBIT INDEX
| | |
Exhibit
Number | | Description |
| 2.1 | | Share Purchase Agreement, dated February 28, 2007, by and among Avanex Corporation, Global Research Company and Mr. Didier Sauvage (which is incorporated herein by reference to Exhibit 2.1 of Avanex’s Current Report on Form 8-K, filed on March 2, 2007). |
| |
| 2.2 | | Asset Purchase and Sale Agreement, dated July 2, 2007, between the Registrant and Essex Corporation(which is incorporated herein by reference to Exhibit 2.2 of the Registrant’s Annual Report on Form 10-K filed on September 27, 2007). |
| |
| 3.1 | | Certificate of Incorporation of the Registrant, as amended to date (which is incorporated herein by reference to Exhibit 3.1 of the Registrant’s Quarterly Report on Form 10-Q filed on May 16, 2000). |
| |
| 3.2 | | Certificate of Designation of Rights, Preferences and Privileges of Series A Participating Preferred Stock of Avanex Corporation (which is incorporated herein by reference to Exhibit 3.4 of the Registrant’s Form 8-A filed on August 24, 2001). |
| |
| 3.3 | | Certificate of Amendment to the Amended and Restated Certificate of Incorporation, dated November 20, 2006 (which is incorporated herein by reference to Exhibit 3.3 to the Registrant’s Registration Statement on Form S-3 filed on March 30, 2007). |
| |
| 3.4 | | Certificate of Amendment to the Amended and Restated Certificate of Incorporation, dated August 12, 2008(filed herewith). |
| |
| 3.5 | | Bylaws of the Registrant (which are incorporated herein by reference to Exhibit 3.1 of the Registrant’s Quarterly Report on Form 10-Q filed on May 2, 2008). |
| |
| 4.1 | | Reference is made to Exhibits 3.1, 3.2, 3.3, 3.4 and 3.5. |
| |
| 4.2 | | Specimen Common Stock Certificate (which is incorporated herein by reference to Exhibit 4.1 of the Registrant’s Amendment No. 2 to Registration Statement No. 333-92097 on Form S-1 filed on January 14, 2000). |
| |
| 4.3 | | Preferred Stock Rights Agreement dated July 26, 2001, between the Registrant and EquiServe Trust Company, N. A. (which is incorporated herein by reference to Exhibit 4.5 of the Registrant’s Form 8-A filed on August 24, 2001). |
| |
| 4.4 | | First Amendment to the Preferred Stock Rights Agreement dated March 18, 2002, between the Registrant and EquiServe Trust Company, N. A. (which is incorporated herein by reference to Exhibit 4.2 of the Registrant’s Form 8-A/A filed on March 28, 2002). |
| |
| 4.5 | | Second Amendment to the Preferred Stock Rights Agreement dated May 12, 2003, between the Registrant and EquiServe Trust Company, N. A. (which is incorporated herein by reference to Exhibit 4.3 of the Registrant’s Form 8-A/A filed on May 30, 2003). |
| |
| 4.6 | | Third Amendment to the Preferred Stock Rights Agreement dated May 16, 2005, between the Registrant and EquiServe Trust Company, N. A. (which is incorporated herein by reference to Exhibit 4.1 of the Registrant’s Current Report on Form 8-K filed on May 17, 2005). |
| |
| 4.7 | | Fourth Amendment to the Preferred Stock Rights Agreement, dated March 6, 2006 between the Registrant and Computershare Trust Company, N.A., formerly known as EquiServe Trust Company, N.A.(which is incorporated herein by reference to Exhibit 4.2 to the Registrant’s Current Report on Form 8-K filed March 7, 2006). |
| |
| 4.8 | | Form of Warrant(which is incorporated herein by reference to Exhibit 4.1 to the Registrant’s Current Report on Form 8-K filed March 7, 2006). |
| |
| 4.9 | | Description of Amendment to Warrants(which is incorporated herein by reference to Exhibit 1.01 to the Registrant’s Current Report on Form 8-K filed on November 9, 2006). |
| | |
Exhibit
Number | | Description |
| 4.10 | | Warrant to Purchase Common Stock, dated March 1, 2007 (which is incorporated herein by reference to Exhibit 4.1 to the Registrant’s Current Report on Form 8-K filed on March 2, 2007). |
| |
| 4.11 | | Registration Rights Agreement, dated March 1, 2007 (which is incorporated herein by reference to Exhibit 4.2 to the Registrant’s Current Report on Form 8-K filed on March 2, 2007). |
| |
| 4.12 | | Description of Amendment to Warrants(which is incorporated herein by reference to Exhibit 1.01 to the Registrant’s Current Report on Form 8-K filed on November 9, 2006). |
| |
| 10.1* | | Form of Indemnification Agreement between Registrant and each of its directors and officers (which is incorporated herein by reference to Exhibit 10.1 of the Registrant’s Registration Statement No. 333-92027 on Form S-1 filed on December 3, 1999). |
| |
| 10.2* | | 1998 Stock Plan, as amended and restated (filed herewith). |
| |
| 10.3* | | Forms of agreement under 1998 Stock Plan, as amended(which is incorporated herein by reference to Exhibit 10.2 of the Registrant’s Amendment No. 2 to Registration Statement No. 333-92097 on Form S-1 filed on January 14, 2000). |
| |
| 10.4* | | 1999 Employee Stock Purchase Plan, as amended (filed herewith). |
| |
| 10.5* | | 1999 Director Option Plan, as amended (filed herewith). |
| |
| 10.6* | | Officer and Director Share Purchase Plan and Election Form (filed herewith). |
| |
| 10.7* | | Form of Restricted Stock Purchase Agreement between the Registrant certain of its executive officers (which is incorporated herein by reference to Exhibit 10.8 of the Registrant’s Registration Statement No. 333-92027 on Form S-1 filed on December 3, 1999). |
| |
| 10.8* | | Form of Restricted Stock Purchase Agreement between the Registrant and certain of its directors (which is incorporated herein by reference to Exhibit 10.1 of the Registrant’s Quarterly Report on Form 10-Q filed on November 14, 2005). |
| |
| 10.9* | | Form of stock option agreement between the Registrant and certain of its executive officers (which is incorporated herein by reference to Exhibit 10.9 of the Registrant’s Annual Report on Form 10-K filed on September 20, 2002). |
| |
| 10.10* | | Form of stock option agreement between the Registrant and certain of its executive officers (which is incorporated herein by reference to Exhibit 10.8 of the Registrant’s Annual Report on Form 10-K filed on September 26, 2003). |
| |
| 10.11* | | Forms of stock option agreements between the Registrant and certain of its directors (which are incorporated herein by reference to Exhibit 10.10 of the Registrant’s Annual Report on Form 10-K filed on September 20, 2002). |
| |
| 10.12* | | Forms of stock option agreements between the Registrant and certain of its directors (which are incorporated herein by reference to Exhibit 10.10 of the Registrant’s Annual Report on Form 10-K filed on September 26, 2003). |
| |
| 10.13* | | Form of stock option agreement between the Registrant and certain of its executive officers (which is incorporated herein by reference to Exhibit 10.5 of the Registrant’s Quarterly Report on Form 10-Q filed on February 9, 2005). |
| |
| 10.14* | | Form of Restricted Stock Unit Agreement between the Registrant and certain of its employees(which is incorporated herein by reference to Exhibit 10.1 to the Registrant’s Current Report on Form 8-K filed January 4, 2006). |
| |
| 10.15* | | Form of Restricted Stock Unit Agreement between the Registrant and certain of its executive officers(which is incorporated herein by reference to Exhibit 10.2 to the Registrant’s Current Report on Form 8-K filed January 4, 2006). |
| | |
Exhibit
Number | | Description |
| 10.16* | | Form of Restricted Stock Unit Agreement between the Registrant and certain of its executive officers(which is incorporated herein by reference to Exhibit 10.1 to the Registrant’s Current Report on Form 8-K filed February 8, 2006). |
| |
| 10.17* | | Employment Agreement between Jo. S. Major Jr. and the Registrant dated August 18, 2004 (which is incorporated herein by reference to Exhibit 10.1 of the Registrant’s Quarterly Report on Form 10-Q filed on November 9, 2004). |
| |
| 10.18* | | Amendment No. 1 to Employment Agreement between Jo. S. Major Jr. and the Registrant dated November 1, 2004 (which is incorporated herein by reference to Exhibit 10.2 of the Registrant’s Quarterly Report on Form 10-Q filed on November 9, 2004). |
| |
| 10.19* | | Offer of Employment between Marla Sanchez and the Registrant dated October 25, 2006 (which is incorporated herein by reference to Exhibit 10.1 to the Registrant’s Quarterly Report on Form 10-Q filed on February 7, 2007). |
| |
| 10.20* | | Offer of Employment between Patrick Edsell and the Registrant dated January 19, 2007(which is incorporated herein by reference to Exhibit 10.20 of the Registrant’s Annual Report on Form 10-K filed on September 27, 2007). |
| |
| 10.21* | | Offer of Employment between Yves LeMaitre and the Registrant dated May 25, 2005 (which is incorporated herein by reference to Exhibit 10.20 to the Registrant’s Annual Report on Form 10-K filed on September 28, 2005). |
| |
| 10.22* | | Offer of Employment between Bradley Kolb and the Registrant dated February 24, 2006(which is incorporated herein by reference to Exhibit 10.23 to the Registrant’s Annual Report on Form 10-K filed on September 28, 2006). |
| |
| 10.23* | | Form of Restricted Stock Unit Agreement Under 1999 Director Option Plan(which is incorporated herein by reference to Exhibit 10.1 to the Registrant’s Current Report on Form 8-K, filed on November 16, 2006). |
| |
| 10.24* | | Description of Severance Policy(which is incorporated herein by reference to Exhibit 10.27 to the Registrant’s Annual Report on Form 10-K filed on September 28, 2005). |
| |
| 10.25 | | Lease between the Registrant and Stevenson Business Park LLC for Building B of 40919 Encyclopedia Circle, Fremont, California dated September 8, 1999 (which is incorporated herein by reference to Exhibit 10.25 of the Registrant’s Registration Statement No. 333-92027 on Form S-1 filed on December 3, 1999). |
| |
| 10.26 | | Lease Agreement between Stevenson Business Park, LLC and the Registrant for Building C of 40919 Encyclopedia Circle, Fremont, California dated March 1, 2000 (which is incorporated herein by reference to Exhibit 10.38 of the Registrant’s Quarterly Report on Form 10-Q filed on May 16, 2000). |
| |
| 10.27 | | Lease Agreement between GAL-LPC Stevenson Boulevard, LP and the Registrant for Buildings A and E of 39611 and 39630 Eureka Boulevard, Newark, California dated August 9, 2000 (which is incorporated herein by reference to Exhibit 10.35 of the Registrant’s Quarterly Report on Form 10-Q filed on November 15, 2000). |
| |
| 10.28† | | Intellectual Property Rights Agreement between Corning Incorporated and Avanex Corporation Relating to Photonics dated July 31, 2003 (which is incorporated herein by reference to Exhibit 10.2 of the Registrant’s Quarterly Report on Form 10-Q/A filed on January 16, 2004). |
| |
| 10.29 | | Intellectual Property License Agreement between Alcatel and Avanex Corporation dated July 31, 2003 (which is incorporated herein by reference to Exhibit 10.6 of the Registrant’s Quarterly Report on Form 10-Q filed on November 14, 2003). |
| | |
Exhibit
Number | | Description |
| 10.30† | | Frame Purchase Agreement for Opto Electronic Components between Avanex Corporation and Alcatel dated July 31, 2003 (which is incorporated herein by reference to Exhibit 10.8 of the Registrant’s Quarterly Report on Form 10-Q/A filed on January 16, 2004). |
| |
| 10.31 | | Securities Purchase Agreement, dated March 6, 2006, by and among the Registrant and the buyers named therein(which is incorporated herein by reference to Exhibit 10.1 to the Registrant’s Current Report on Form 8-K filed March 7, 2006). |
| |
| 10.32† | | Volume Supply Agreement, dated May 6, 2004, between the Registrant and Fabrinet (which is incorporated herein by reference to Exhibit 10.12 of the Registrant’s Quarterly Report on
Form 10-Q filed on February 14, 2006). |
| |
| 10.33†† | | First Amendment to the Volume Supply Agreement, dated April 1, 2008, between the Registrant and Fabrinet(filed herewith). |
| |
| 10.34 | | Securities Purchase Agreement, dated March 1, 2007, between the Registrant and the investor named therein (which is incorporated herein by reference to Exhibit 4.1 to the Registrant’s Current Report on Form 8-K filed on March 2, 2007). |
| |
| 10.35* | | Form of Restricted Stock Unit Agreement Under 1999 Director Option Plan(which is incorporated herein by reference to Exhibit 10.1 to the Registrant’s Current Report on Form 8-K, filed on November 16, 2006). |
| |
| 10.36* | | Description of Non-Employee Director compensation and Restricted Stock Awards(which is incorporated herein by reference to Item 1.01 of the Registrant’s Current Report on Form 8-K filed on August 23, 2006). |
| |
| 10.37* | | Description of changes in the compensation of Jo. S. Major Jr.(which is incorporated herein by reference to Item 1.01 of the Registrant’s Current Report on Form 8-K filed on November 15, 2006). |
| |
| 10.38* | | Description of Fiscal 2008 Incentive Bonus Plan (which is incorporated herein by reference to Item 5.02 of the Registrant’s Current Report on Form 8-K filed on September 12, 2007). |
| |
| 10.39* | | Offer of Employment between Giovanni Barbarossa and the Registrant dated November 20, 2002 (which is incorporated herein by reference to Exhibit 10.12 of the Registrant’s Annual Report on Form 10-K filed on September 13, 2004). |
| |
| 10.40* | | Separation Agreement with Yves LeMaitre(which is incorporated herein by reference to Item 5.02 to the Registrant’s Current Report on Form 8-K filed on November 8, 2007). |
| |
| 10.41* | | Offer of Employment between Scott Parker and the Registrant dated November 8, 2007 (filed herewith). |
| |
| 21.1 | | List of subsidiaries of the Registrant (filed herewith). |
| |
| 23.1 | | Consent of Deloitte & Touche LLP, Independent Registered Public Accounting Firm (filed herewith). |
| |
| 24.1 | | Power of Attorney (See signature page). |
| |
| 31.1 | | Certification of Chief Executive Officer pursuant to Rule 13a-14(a)/15d-14(a) (filed herewith). |
| |
| 31.2 | | Certification of Chief Financial Officer pursuant to Rule 13a-14(a)/15d-14(a) (filed herewith). |
| |
| 32.1 | | Certification of Chief Executive Officer and Chief Financial Officer pursuant to 18 U.S.C. Section 1350(filed herewith). |
| † | Portions of this exhibit have been omitted pursuant to a request for confidential treatment granted by the Commission. |
| †† | Portions of this exhibit have been omitted pursuant to a request for confidential agreement submitted to the Commission. |
| * | Indicates management contract or compensatory plan or arrangement. |