SECURITIES AND EXCHANGE COMMISSION
Washington, D.C. 20549
FORM 10-Q
(Mark One)
| | | |
| þ | | QUARTERLY REPORT PURSUANT TO SECTION 13 OR 15(d) OF THE SECURITIES EXCHANGE ACT OF 1934
|
For the quarterly period ended September 30, 2007
OR
| | | |
| o | | TRANSITION REPORT PURSUANT TO SECTION 13 OR 15(d) OF THE SECURITIES EXCHANGE ACT OF 1934
|
For the transition period from ______ to ______
Commission File Number: 000-50066
HARRINGTON WEST FINANCIAL GROUP, INC.
(Exact name of registrant as specified in its charter)
| | | |
Delaware
(State or other jurisdiction of incorporation or organization) | | 48-1175170
(I.R.S. Employer Identification No.) |
610 Alamo Pintado Road
Solvang, California
(Address of principal executive offices)
93463
(Zip Code)
(805) 688-6644
(Registrant’s telephone number, including area code)
(Former name, former address and former fiscal year, if changed since last report)
Indicate by check mark whether the registrant (1) has filed all reports required to be filed by Section 13 or 15(d) of the Securities Exchange Act of 1934 during the preceding 12 months (or for such shorter period that the registrant was required to file such reports), and (2) has been subject to such filing requirements for the past 90 days.þ Yes o No
Indicate by check mark whether the registrant is a large accelerated filer, an accelerated filer, or a non-accelerated filer. See definition of “accelerated filer and large accelerated filer” in Rule 12b-2 of the Exchange Act. (Check one):
Large accelerated filero Accelerated filero Non-accelerated filerþ
Indicate by check mark whether the registrant is a shell company (as defined in Rule 12b-2 of the Securities Exchange Act of 1934).
o Yes þ No
Indicate the number of shares outstanding of each of the issuer’s classes of common stock, as of the latest practicable date:
5,554,003 shares of Common Stock, par value $0.01 per share, outstanding as of November 5, 2007.
HARRINGTON WEST FINANCIAL GROUP, INC.
TABLE OF CONTENTS
-1-
PART 1-FINANCIAL INFORMATION
Item 1:Condensed Consolidated Financial Statements
HARRINGTON WEST FINANCIAL GROUP, INC.
CONDENSED CONSOLIDATED STATEMENTS OF FINANCIAL CONDITION (Unaudited)
(Dollars in thousands, except per share data)
| | | | | | | | | |
| | | September 30, 2007 | | | December 31, 2006 | |
| ASSETS | | | | | | | | |
| | | | | | | | | |
| Cash and cash equivalents | | $ | 17,331 | | | $ | 21,178 | |
| Trading account assets | | | 1,304 | | | | 837 | |
| Securities available-for-sale at fair value | | | 355,314 | | | | 309,729 | |
| Securities held to maturity (fair value of $61 at September 30, 2007 and $71 at December 31, 2006) | | | 59 | | | | 69 | |
| Loans receivable, (net of allowance for loan losses of $6,308 and $5,914 at September 30, 2007 and December 31, 2006, respectively) | | | 766,032 | | | | 757,033 | |
| Accrued interest receivable | | | 5,246 | | | | 5,315 | |
| Premises and equipment, net | | | 15,710 | | | | 15,581 | |
| Due from broker | | | 138 | | | | 142 | |
| Prepaid expenses and other assets | | | 3,165 | | | | 4,959 | |
| Investment in FHLB stock, at cost | | | 11,804 | | | | 14,615 | |
| Income tax receivable | | | 719 | | | | 112 | |
| Bank owned life insurance | | | 21,043 | | | | 18,472 | |
| Deferred taxes | | | 4,184 | | | | — | |
| Goodwill | | | 5,496 | | | | 5,496 | |
| Core deposit intangible, net | | | 748 | | | | 935 | |
| | | | | | | |
| | | | | | | | | |
| TOTAL ASSETS | | $ | 1,208,293 | | | $ | 1,154,473 | |
| | | | | | | |
| | | | | | | | | |
| LIABILITIES & STOCKHOLDERS’ EQUITY LIABILITIES: | | | | | | | | |
| Deposits: | | | | | | | | |
| Interest bearing | | $ | 778,465 | | | $ | 677,665 | |
| Non-interest bearing | | | 47,222 | | | | 55,092 | |
| | | | | | | |
| | | | | | | | | |
| Total Deposits | | | 825,687 | | | | 732,757 | |
| | | | | | | | | |
| FHLB advances | | | 236,000 | | | | 257,000 | |
| Securities sold under repurchase agreements | | | 49,727 | | | | 65,141 | |
| Subordinated debt | | | 25,774 | | | | 25,774 | |
| Accrued interest payable and other liabilities | | | 5,771 | | | | 5,005 | |
| Income taxes payable | | | 248 | | | | — | |
| Deferred income taxes | | | 1,648 | | | | 1,098 | |
| | | | | | | |
| | | | | | | | | |
| TOTAL LIABILITIES | | | 1,144,855 | | | | 1,086,775 | |
| | | | | | | |
| | | | | | | | | |
| STOCKHOLDERS’ EQUITY: | | | | | | | | |
| Preferred stock, $.01 par value: 1,200,000 shares authorized: none issued and outstanding as of September 30,2007 and December 31, 2006 | | | — | | | | — | |
| Common stock, $.01 par value; 10,800,000 shares authorized: 5,552,803 shares issued and outstanding as of September 30, 2007 and 5,460,393 shares issued and outstanding December 31, 2006 | | | 56 | | | | 55 | |
| Additional paid-in capital | | | 34,350 | | | | 33,332 | |
| Retained earnings | | | 35,447 | | | | 34,964 | |
| Accumulated other comprehensive loss, net of tax | | | (6,415 | ) | | | (653 | ) |
| | | | | | | |
| | | | | | | | | |
| TOTAL STOCKHOLDERS’ EQUITY | | | 63,438 | | | | 67,698 | |
| | | | | | | |
| | | | | | | | | |
| TOTAL LIABILITIES & STOCKHOLDERS’ EQUITY | | $ | 1,208,293 | | | $ | 1,154,473 | |
| | | | | | | |
The accompanying notes are an integral part of these condensed financial statements.
-2-
HARRINGTON WEST FINANCIAL GROUP, INC.
CONDENSED CONSOLIDATED STATEMENTS OF INCOME AND COMPREHENSIVE INCOME
(Unaudited)
(Dollars in thousands, except per share data)
| | | | | | | | | | | | | | | | | |
| | | Three months ended | | | Nine months ended | |
| | | September 30, | | | September 30, | |
| | | 2007 | | | 2006 | | | 2007 | | | 2006 | |
| INTEREST INCOME | | | | | | | | | | | | | | | | |
| Interest on loans | | $ | 15,130 | | | $ | 14,317 | | | $ | 45,202 | | | $ | 40,256 | |
| Interest and dividends on securities | | | 5,112 | | | | 4,661 | | | | 13,674 | | | | 14,590 | |
| | | | | | | | | | | | | |
| | | | | | | | | | | | | | | | | |
| Total interest income | | | 20,242 | | | | 18,978 | | | | 58,876 | | | | 54,846 | |
| | | | | | | | | | | | | |
| | | | | | | | | | | | | | | | | |
| INTEREST EXPENSE | | | | | | | | | | | | | | | | |
| Interest on deposits | | | 8,700 | | | | 6,866 | | | | 24,077 | | | | 18,232 | |
| Interest on FHLB advances and other borrowings | | | 3,500 | | | | 4,409 | | | | 11,452 | | | | 13,410 | |
| | | | | | | | | | | | | |
| | | | | | | | | | | | | | | | | |
| Total interest expense | | | 12,200 | | | | 11,275 | | | | 35,529 | | | | 31,642 | |
| | | | | | | | | | | | | |
| NET INTEREST INCOME BEFORE PROVISION FOR LOAN LOSSES | | | 8,042 | | | | 7,703 | | | | 23,347 | | | | 23,204 | |
| PROVISION FOR LOAN LOSSES | | | 200 | | | | 200 | | | | 400 | | | | 490 | |
| | | | | | | | | | | | | |
| | | | | | | | | | | | | | | | | |
| NET INTEREST INCOME AFTER PROVISION FOR LOAN LOSSES | | | 7,842 | | | | 7,503 | | | | 22,947 | | | | 22,714 | |
| | | | | | | | | | | | | |
| | | | | | | | | | | | | | | | | |
| OTHER INCOME | | | | | | | | | | | | | | | | |
| Net (loss) on sale of available-for-sale securities | | | — | | | | — | | | | (1,004 | ) | | | (613 | ) |
| Income from trading assets | | | (378 | ) | | | 150 | | | | (372 | ) | | | 983 | |
| Other-than-temporary loss | | | (1,906 | ) | | | — | | | | (1,906 | ) | | | — | |
| Other income (loss) | | | — | | | | (26 | ) | | | — | | | | (28 | ) |
| Increase in cash surrender value of life insurance | | | 209 | | | | 185 | | | | 616 | | | | 567 | |
| Banking fee income and other income | | | 787 | | | | 746 | | | | 2,582 | | | | 2,471 | |
| | | | | | | | | | | | | |
| Total other income | | | (1,288 | ) | | | 1,055 | | | | (84 | ) | | | 3,380 | |
| | | | | | | | | | | | | |
| | | | | | | | | | | | | | | | | |
| OTHER EXPENSES | | | | | | | | | | | | | | | | |
| Salaries & employee benefits | | | 3,308 | | | | 3,104 | | | | 9,817 | | | | 9,166 | |
| Premises & equipment | | | 975 | | | | 960 | | | | 2,893 | | | | 2,772 | |
| Insurance premiums | | | 83 | | | | 104 | | | | 254 | | | | 324 | |
| Marketing | | | 84 | | | | 122 | | | | 314 | | | | 336 | |
| Computer services | | | 239 | | | | 213 | | | | 687 | | | | 610 | |
| Professional fees | | | 162 | | | | 199 | | | | 628 | | | | 759 | |
| Office expenses & supplies | | | 195 | | | | 231 | | | | 613 | | | | 684 | |
| Other | | | 703 | | | | 610 | | | | 1,987 | | | | 1,836 | |
| | | | | | | | | | | | | |
| Total other expenses | | | 5,749 | | | | 5,543 | | | | 17,193 | | | | 16,487 | |
| | | | | | | | | | | | | |
| | | | | | | | | | | | | | | | | |
| INCOME BEFORE INCOME TAXES | | | 805 | | | | 3,015 | | | | 5,670 | | | | 9,607 | |
| | | | | | | | | | | | | | | | | |
| INCOME TAXES | | | 307 | | | | 913 | | | | 2,121 | | | | 3,332 | |
| | | | | | | | | | | | | |
| | | | | | | | | | | | | | | | | |
| NET INCOME | | $ | 498 | | | $ | 2,102 | | | $ | 3,549 | | | $ | 6,275 | |
| | | | | | | | | | | | | |
| | | | | | | | | | | | | | | | | |
| TOTAL COMPREHENSIVE INCOME (LOSS) | | | ($5,586 | ) | | $ | 1,718 | | | | ($2,213 | ) | | $ | 7,428 | |
| | | | | | | | | | | | | |
| | | | | | | | | | | | | | | | | |
| BASIC EARNINGS PER SHARE | | $ | 0.09 | | | $ | 0.39 | | | $ | 0.64 | | | $ | 1.15 | |
| | | | | | | | | | | | | |
| | | | | | | | | | | | | | | | | |
| DILUTED EARNINGS PER SHARE | | $ | 0.09 | | | $ | 0.38 | | | $ | 0.63 | | | $ | 1.13 | |
| | | | | | | | | | | | | |
| | | | | | | | | | | | | | | | | |
| BASIC WEIGHTED AVERAGE SHARES OUTSTANDING | | | 5,550,353 | | | | 5,448,820 | | | | 5,537,873 | | | | 5,435,238 | |
| | | | | | | | | | | | | |
| | | | | | | | | | | | | | | | | |
| DILUTED WEIGHTED AVERAGE SHARES OUTSTANDING | | | 5,642,512 | | | | 5,585,527 | | | | 5,641,914 | | | | 5,563,214 | |
| | | | | | | | | | | | | |
The accompanying notes are an integral part of these condensed financial statements.
-3-
HARRINGTON WEST FINANCIAL GROUP, INC.
CONDENSED CONSOLIDATED STATEMENTS OF STOCKHOLDERS’ EQUITY
AND COMPREHENSIVE INCOME (Unaudited)
(Dollars in thousands, except share and per share data)
| | | | | | | | | | | | | | | | | | | | | | | | | | | | | |
| | | | | | | | | | | | | | | | | | | | | | | Accumulated | | | | |
| | | | | | | | | | | Additional | | | | | | | | | | | Other | | | Total | |
| | | Common Stock | | | Paid-in | | | Retained | | | Comprehensive | | | Comprehensive | | | Stockholders’ | |
| | | Stock | | | Amt | | | Capital | | | Earnings | | | Income | | | Loss | | | Equity | |
| Balance, January 1, 2006 | | | 5,384,843 | | | $ | 54 | | | $ | 32,059 | | | $ | 29,458 | | | | | | | $ | (1,997 | ) | | $ | 59,574 | |
| | | | | | | | | | | | | | | | | | | | | | | | | | | | | |
| Comprehensive income: | | | | | | | | | | | | | | | | | | | | | | | | | | | | |
| Net income | | | | | | | | | | | | | | | 8,228 | | | $ | 8,228 | | | | | | | | 8,228 | |
| Other comprehensive income, net of tax | | | | | | | | | | | | | | | | | | | | | | | | | | | | |
| Unrealized gains on securities | | | | | | | | | | | | | | | | | | | 1,008 | | | | 1,008 | | | | 1,008 | |
| Effective portion in change in fair value of cash flow hedges | | | | | | | | | | | | | | | | | | | 336 | | | | 336 | | | | 336 | |
| | | | | | | | | | | | | | | | | | | | | | | | | | | | |
| | | | | | | | | | | | | | | | | | | | | | | | | | | | | |
| Total comprehensive income | | | | | | | | | | | | | | | | | | $ | 9,572 | | | | | | | | | |
| | | | | | | | | | | | | | | | | | | | | | | | | | | | |
| | | | | | | | | | | | | | | | | | | | | | | | | | | | | |
| Stock options exercised, including tax benefit of $397 | | | 75,550 | | | | 1 | | | | 825 | | | | | | | | | | | | | | | | 826 | |
| Stock options earned | | | | | | | | | | | 448 | | | | | | | | | | | | | | | | 448 | |
| | | | | | | | | | | | | | | | | | | | | | | | | | | | | |
| Dividends on Common Stock at $.50 per share | | | | | | | | | | | | | | | (2,722 | ) | | | | | | | | | | | (2,722 | ) |
| | | | | | | | | | | | | | | | | | | | | | | |
| | | | | | | | | | | | | | | | | | | | | | | | | | | | | |
| Balance, December 31, 2006 | | | 5,460,393 | | | | 55 | | | | 33,332 | | | | 34,964 | | | | | | | | (653 | ) | | | 67,698 | |
| | | | | | | | | | | | | | | | | | | | | | | |
| | | | | | | | | | | | | | | | | | | | | | | | | | | | | |
| Comprehensive income: | | | | | | | | | | | | | | | | | | | | | | | | | | | | |
| Net income | | | | | | | | | | | | | | | 3,549 | | | $ | 3,549 | | | | | | | | 3,549 | |
| Other comprehensive income, net of tax | | | | | | | | | | | | | | | | | | | | | | | | | | | | |
| Unrealized losses on securities | | | | | | | | | | | | | | | | | | | (4,431 | ) | | | (4,431 | ) | | | (4,431 | ) |
| Effective portion in change in fair value of cash flow hedges | | | | | | | | | | | | | | | | | | | (1,331 | ) | | | (1,331 | ) | | | (1,331 | ) |
| | | | | | | | | | | | | | | | | | | | | | | | | | | | |
| | | | | | | | | | | | | | | | | | | | | | | | | | | | | |
| Total comprehensive income | | | | | | | | | | | | | | | | | | | ($2,213 | ) | | | | | | | | |
| | | | | | | | | | | | | | | | | | | | | | | | | | | | |
| | | | | | | | | | | | | | | | | | | | | | | | | | | | | |
| Stock options exercised, including tax benefit of $147 | | | 92,410 | | | | 1 | | | | 730 | | | | | | | | | | | | | | | | 731 | |
| Stock options earned | | | | | | | | | | | 288 | | | | | | | | | | | | | | | | 288 | |
| Dividends on common stock at $.55 per share | | | | | | | | | | | | | | | (3,066 | ) | | | | | | | | | | | (3,066 | ) |
| | | | | | | | | | | | | | | | | | | | | | | |
| | | | | | | | | | | | | | | | | | | | | | | | | | | | | |
| Balance, September 30, 2007 | | | 5,552,803 | | | $ | 56 | | | $ | 34,350 | | | $ | 35,447 | | | | | | | $ | (6,415 | ) | | $ | 63,438 | |
| | | | | | | | | | | | | | | | | | | | | | | |
The accompanying notes are an integral part of these condensed financial statements.
-4-
HARRINGTON WEST FINANCIAL GROUP, INC.
CONDENSED CONSOLIDATED STATEMENTS OF CASH FLOWS (Unaudited)
(Dollars in thousands)
| | | | | | | | | |
| | | Nine months ended | | | Nine months ended | |
| | | September 30, | | | September 30, | |
| | | 2007 | | | 2006 | |
| CASH FLOWS FROM OPERATING ACTIVITIES: | | | | | | | | |
| Net income | | $ | 3,549 | | | $ | 6,275 | |
| Adjustments to reconcile net income to net cash provided by operating activities: | | | | | | | | |
| Accretion of deferred loan fees and costs | | | (192 | ) | | | (390 | ) |
| Depreciation and amortization | | | 1,141 | | | | 1,070 | |
| Amortization of premiums and discounts on loans receivable and securities | | | 797 | | | | 1,609 | |
| Provision for loan losses | | | 400 | | | | 490 | |
| Loss on sale of available-for-sale securities and other than temporary loss | | | 2,910 | | | | 613 | |
| Activity in trading account assets | | | (13 | ) | | | 128 | |
| (Gain) on securities held for trading | | | (454 | ) | | | (3 | ) |
| FHLB stock dividend | | | (566 | ) | | | (602 | ) |
| Earnings on bank owned life insurance | | | (616 | ) | | | (567 | ) |
| Decrease (increase) in accrued interest receivable | | | 69 | | | | (438 | ) |
| Increase (decrease) in income taxes receivable, net of payable | | | (359 | ) | | | 37 | |
| Stock options expensed | | | 288 | | | | 335 | |
| Deferred income taxes | | | (80 | ) | | | 1,392 | |
| (Increase) decrease in prepaid expenses and other assets | | | 777 | | | | (1,581 | ) |
| (Decrease) in accrued expenses and other liabilities | | | (354 | ) | | | (2,442 | ) |
| | | | | | | |
| Net cash provided by operating activities | | | 7,297 | | | | 5,926 | |
| | | | | | | |
| | | | | | | | | |
| CASH FLOWS FROM INVESTING ACTIVITIES: | | | | | | | | |
| Net increase in loans receivable | | | (9,258 | ) | | | (71,590 | ) |
| Proceeds from sales of securities available for sale | | | 35,999 | | | | 44,327 | |
| Principal paydowns on securities available for sale | | | 83,522 | | | | 67,497 | |
| Principal paydowns on securities held to maturity | | | 10 | | | | 9 | |
| Purchases of securities available for sale | | | (175,892 | ) | | | (45,333 | ) |
| Purchase of bank owned life insurance | | | (2,000 | ) | | | — | |
| Net purchase of premises and equipment | | | (1,083 | ) | | | (5,034 | ) |
| Redemption of FHLB Stock | | | 3,377 | | | | 2,557 | |
| | | | | | | |
| Net cash used in investing activities | | | (65,325 | ) | | | (7,567 | ) |
| | | | | | | |
| | | | | | | | | |
| CASH FLOWS FROM FINANCING ACTIVITIES: | | | | | | | | |
| Net increase in deposits | | | 92,930 | | | | 39,314 | |
| (Decrease) increase in securities sold under agreements to repurchase | | | (15,414 | ) | | | 875 | |
| Decrease in FHLB advances | | | (21,000 | ) | | | (40,000 | ) |
| Exercise of stock options on common stock, including tax benefits | | | 731 | | | | 361 | |
| Dividends paid on common stock | | | (3,066 | ) | | | (2,040 | ) |
| | | | | | | |
| Net cash provided by (used in) financing activities | | | 54,181 | | | | (1,490 | ) |
| | | | | | | |
| | | | | | | | | |
| NET DECREASE IN CASH AND CASH EQUIVALENTS | | | (3,847 | ) | | | (3,131 | ) |
| | | | | | | | | |
| CASH AND CASH EQUIVALENTS, BEGINNING OF PERIOD | | | 21,178 | | | | 19,312 | |
| | | | | | | |
| | | | | | | | | |
| CASH AND CASH EQUIVALENTS, END OF PERIOD | | $ | 17,331 | | | $ | 16,181 | |
| | | | | | | |
| | | | | | | | | |
| SUPPLEMENTAL DISCLOSURES OF CASH FLOW INFORMATION | | | | | | | | |
| Cash paid during the period for: | | | | | | | | |
| Interest | | $ | 36,297 | | | $ | 32,053 | |
| Income Taxes | | $ | 2,672 | | | $ | 2,904 | |
The accompanying notes are an integral part of these condensed financial statements.
-5-
HARRINGTON WEST FINANCIAL GROUP, INC.
NOTES TO CONDENSED CONSOLIDATED FINANCIAL STATEMENTS
(Unaudited)
1. SUMMARY OF SIGNIFICANT ACCOUNTING POLICIES
Business of the Company– Harrington West Financial Group, Inc. (the “Company”) is a diversified, community-based financial institution holding company, incorporated on August 29, 1995 to acquire and hold all of the outstanding common stock of Los Padres Bank, FSB (the “Bank”), a federally chartered savings bank. We provide a broad menu of financial services to individuals and small to medium sized businesses and operate sixteen banking offices in three markets as follows: eleven Los Padres banking offices on the California Central Coast, two Los Padres banking offices in Scottsdale, Arizona, and three banking offices located in the Kansas City metropolitan area, which are operated as a division under the Harrington Bank brand name. The Company also owns Harrington Wealth Management Company, a trust and investment management company with $191.1 million in assets under management or custody, which offers services to individuals and small institutional clients through a customized asset allocation approach by investing predominantly in low fee, indexed mutual funds and exchange traded funds.
Basis of Presentation– The consolidated financial statements are prepared in accordance with accounting principles generally accepted in the United States of America for interim financial information and general practices within the banking industry. In the opinion of the Company’s management, all adjustments consisting of normal recurring accruals necessary for a fair presentation of the financial condition and results of operation for the interim periods included herein have been made.
The following is a summary of significant principles used in the preparation of the accompanying financial statements. In preparing the financial statements, management of the Company has made a number of estimates and assumptions relating to the reporting of assets and liabilities, including the allowance for loan losses, valuation of investment securities and derivatives, the disclosure of contingent assets and liabilities and the disclosure of income and expenses for the periods presented in conformity with accounting principles generally accepted in the United States of America. Actual results could differ from those estimates.
The unaudited condensed consolidated interim financial statements of the Company and subsidiaries presented herein should be read in conjunction with the consolidated financial statements of the Company for the year ended December 31, 2006, included in the Company’s Annual Report on Form 10-K.
Allowance for Loan Losses– Allowance for loan losses is increased by charges to income and decreased by charge-offs (net of recoveries). Charge-offs are recorded when management believes the uncollectability of the loan balance is confirmed.
The allowance is maintained at a level believed by management to be sufficient to absorb estimated probable incurred credit losses. Management’s determination of the adequacy of the allowance is based on periodic evaluations of the credit portfolio and other relevant factors. This evaluation is inherently subjective, as it requires material estimates, including, among others, the amounts and timing of expected future cash flows on impaired loans, estimated losses on commercial loans, consumer loans and mortgages, and general amounts for historical loss experience, economic conditions, uncertainties in estimating losses and inherent risks in the various credit portfolios, all of which may be susceptible to significant change.
-6-
In determining the adequacy of the allowance for loan losses, the Company makes specific allocations to impaired loans in accordance with Statement of Financial Accounting Standards (“SFAS”) No. 114,Accounting by Creditors for Impairment of a Loan. Loans are identified as impaired when it is deemed probable that the borrower will be unable to meet the scheduled principal and interest payments under the terms of the loan agreement. Impairment is based on the present value of expected future cash flows discounted at the loan’s effective interest rate, except that as a practical expedient, a creditor may measure impairment based on a loan’s observable market price or the fair value of the collateral if the loan is collateral dependent.
Allocations to non-homogenous loan pools are developed by loan type and risk factor and are based on historical loss trends and management’s judgment concerning those trends and other relevant factors. These factors may include, among others, trends in criticized assets, regional and national economic conditions, changes in lending policies and procedures, trends in local real estate values and changes in volumes and terms of the loan portfolio.
Homogenous (consumer and residential mortgage) loan allocations are made at a total portfolio level based on historical loss experience adjusted for portfolio activity and economic conditions.
Adoption of new accounting standards— The Company adopted FASB Interpretation 48, Accounting for Uncertainty in Income Taxes (“FIN 48”), as of January 1, 2007. A tax position is recognized a benefit only if it is “more likely than not” that the tax position would be sustained in a tax examination, with a tax examination being presumed to occur. The amount recognized is the largest amount of tax benefit that is greater than 50% likely of being realized on examination. For tax positions not meeting the “more likely than not” test, no tax benefit is recorded. The Company has determined that the adoption of FIN 48 did not have a material effect on the financial statements.
The Company and its subsidiaries are subject to U.S. Federal income tax as well as income tax of the states of California, Arizona, Kansas, Indiana and Hawaii. The Company is no longer subject to examination by taxing authorities for years before 2002. The Company does not expect the total amount of unrecognized tax benefits to significantly increase in the next six months.
The Company recognizes interest and/or penalties related to income tax matters in income tax expense. The Company did not have any amounts accrued for interest and penalties at September 30, 2007.
In September 2006, the FASB Emerging Issues Task Force finalized Issue No. 06-5, Accounting for Purchases of Life Insurance — Determining the Amount That Could Be Realized in Accordance with FASB Technical Bulletin No. 85-4 (Accounting for Purchases of Life Insurance). This issue requires that a policyholder consider contractual terms of a life insurance policy in determining the amount that could be realized under the insurance contract. It also requires that if the contract provides for a greater surrender value if all individual policies in a group are surrendered at the same time, that the surrender value be determined based on the assumption that policies will be surrendered on an individual basis. Lastly, the issue discusses whether the cash surrender value should be discounted when the policyholder is contractually limited in its ability to surrender a policy. This issue is effective for fiscal years beginning after December 15, 2006. The adoption of this issue does not have a material impact on the financial statements.
-7-
2. EARNINGS PER SHARE
The following tables represent the calculation of earnings per share (“EPS”) for the periods presented.
| | | | | | | | | | | | | | | | | | | | | | | | | |
| | | Three months ended September 30, 2007 | | Nine months ended September 30, 2007 |
| | | | | | | | | | | Per- | | | | | | | | | | Per- |
| (net income amounts | | Income | | Shares | | Share | | Income | | Shares | | Share |
| in thousands) | | (Numerator) | | (Denominator) | | Amount | | (Numerator) | | (Denominator) | | Amount |
| Basic EPS | | $ | 498 | | | | 5,550,353 | | | $ | 0.09 | | | $ | 3,549 | | | | 5,537,873 | | | $ | 0.64 | |
| Effect of dilutive stock options | | | | | | | 92,159 | | | | (0.00 | ) | | | | | | | 104,041 | | | | (0.01 | ) |
| | | | | |
| Diluted EPS | | $ | 498 | | | | 5,642,512 | | | $ | 0.09 | | | $ | 3,549 | | | | 5,641,914 | | | $ | 0.63 | |
| | | | | |
| | | | | | | | | | | | | | | | | | | | | | | | | |
| | | Three months ended September 30, 2006 | | Nine months ended September 30, 2006 |
| | | | | | | | | | | Per- | | | | | | | | | | Per- |
| | | Income | | Shares | | Share | | Income | | Shares | | Share |
| | | (Numerator) | | (Denominator) | | Amount | | (Numerator) | | (Denominator) | | Amount |
| Basic EPS | | $ | 2,102 | | | | 5,448,820 | | | $ | 0.39 | | | $ | 6,275 | | | | 5,435,238 | | | $ | 1.15 | |
| Effect of dilutive stock options | | | | | | | 136,707 | | | | (0.01 | ) | | | | | | | 127,976 | | | | (0.02 | ) |
| | | | | |
| Diluted EPS | | $ | 2,102 | | | | 5,585,527 | | | $ | 0.38 | | | $ | 6,275 | | | | 5,563,214 | | | $ | 1.13 | |
| | | | | |
Anti-dilutive options totaling 321,700 and 201,500 for the quarter ended September 30, 2007 and 2006, respectively, and 320,000 and 201,500 for year-to-date September 30, 2007 and 2006, respectively, are excluded from the calculation of earnings per share.
3. OTHER-THAN-TEMPORARY IMPAIRMENT
As further discussed in Management’s Discussion and Analysis, management determined that available-for-sale securities with an amortized cost of $2.4 million were deemed other than temporarily impaired. As such, these securities were written down by $1.9 million to fair value through earnings in the September 2007 quarter.
Item 2:Management’s Discussion and Analysis of Financial Condition and Results of Operations
Corporate Profile
Harrington West Financial Group, Inc. (NASDAQ: HWFG) is a diversified, community-based, financial institution holding company. Our primary business is delivering an array of financial products and services to commercial and retail consumers through our sixteen full-service banking offices in multiple markets. We also operate Harrington Wealth Management Company, our wholly owned subsidiary, which provides trust and investment management services to individuals and small institutional clients through customized investment allocations and a high service approach. The culture of our company emphasizes building long-term customer relationships through exemplary personalized service. Our corporate headquarters are in Solvang, California with executive offices in Scottsdale, Arizona.
-8-
Mission and Philosophy
Our mission is to increase shareholder value through the development of highly profitable, community-based banking operations that offer a broad range of high value loan alternatives, deposit products, and investment and trust services for commercial and retail customers in the markets of the California central coast and the metropolitan areas of Kansas City and Phoenix/Scottsdale.
Multiple Market Strategy
Although our markets are geographically dispersed, we can compete effectively in each region due to our considerable market knowledge of each area, our placement of local management with extensive banking experience in the respective market, our strong community ties that enhance relationship development, the favorable demographic and economic characteristics specific to each market, and our broad product menu.
We believe this multiple market banking strategy benefits our shareholders by providing the Company with the ability to:
| | 1. | | Diversify its loan portfolio and thus economic and credit risk |
| |
| | 2. | | Capitalize on the most favorable growth markets |
| |
| | 3. | | Deploy elements of our diverse product mix that are best suited for each market |
| |
| | 4. | | Price products strategically among the markets to maximize profitability |
While employing this strategy, we have expanded our banking facilities from four to sixteen offices since 1996. We operate eleven full-service offices on the central coast of California from Thousand Oaks to Atascadero, three banking offices in Johnson County, Kansas, the fastest growing area of the Kansas City metro, and two offices in Scottsdale, Arizona. HWFG’s third banking office in the Phoenix metro in the city of Surprise is in the development stages and expected to open in early 2008. The Company has purchased parcels for banking offices in the growing Deer Valley Airpark in north central Phoenix and in Gilbert, AZ in the southeast Phoenix metro.
We are considering additional expansion opportunities in each region and plan to open two to three offices every eighteen to twenty-four months. We evaluate opportunities for acquiring entities, which offer financial services, but remain value-oriented. We expect acquisitions will be accretive to earnings per share within a twelve-month period.
Product Line Diversification
Over the last seven years, we have broadened our product lines to diversify revenue sources and to become a full service community banking company. In 1999, we added Harrington Wealth Management Company, a federally registered trust and investment management company, to provide our customers a consultative and customized investment process for their trust and investment funds. In 2000, we added a full line of commercial banking and deposit products for small-to-medium-sized businesses and developed our consumer lending lines to include home equity lines of credit. In 2001, we added Internet banking and bill pay services to augment our in-branch services. In 2003, we further expanded mortgage banking and security brokerage activities in all of our markets. In 2004, we implemented the Overdraft Privilege Program and started to offer brokerage and insurance products through an alliance with UVEST Financial Services, Inc.
-9-
Modern Financial and Investment Management Skills
We have expertise in investment and asset liability management. Our Chief Executive Officer spent thirteen years in this field consulting on risk management practices with banking institutions and advising on mortgage and related assets managed on a short duration basis. On February 27, 2007, we announced the hiring of John R. Mason as Chief Investment Officer. Mr. Mason has over twenty years experience in the investment and risk management fields. We have completed the process of bringing all of the risk and investment management operations in-house with a marginal cost savings versus our Portfolio and Rate Risk Analysis Agreement with Smith Breeden Associates, Inc., which terminated on April 30, 2007.
We utilize excess capital in a short duration and high credit quality investment portfolio comprised largely of mortgage and related securities. Our goal is to produce a pre-tax return on these investments of .75% to 1.00% over the related funding cost. We believe our ability to price loans and investments on an option-adjusted spread basis and manage the interest rate risk of longer term, fixed rate loans, allows us to compete effectively against other institutions that do not offer these products. (For further information on September 2007 quarter developments, please see page 17).
Control Banking Risks
We seek to control banking risks. Our disciplined credit evaluation and underwriting environment emphasizes the assessment of collateral support, cash flows, guarantor support, and stress testing. We manage operational risk through stringent policies, procedures, and controls and manage interest rate risk through our modern financial and hedging skills and the application of risk management tools.
Concentrate on Selected Performance Measures
We evaluate our performance based upon the primary measures of return on average equity, which we seek to maintain in the low to mid-teens, earnings per share growth, and franchise value creation through the growth of deposits, loans, and wealth management assets.
Profitability Drivers
We expect these factors will drive more consistent and growing profitability in the future:
| | 1. | | Steady development and growth of loans, deposits, and investment management and trust accounts in all of our markets. |
| |
| | 2. | | Changing the loan mix to higher risk-adjusted spread earning categories such as business lending, commercial real estate lending, small tract construction and construction-to-permanent loan lending, and selected consumer lending activities such as home equity lines of credit. |
| |
| | 3. | | Growing our non-interest bearing consumer and commercial deposits and continuing to change the overall deposit mix toward core deposit accounts. |
| |
| | 4. | | Diversifying and increasing our banking fee income through existing and new sources such as our overdraft protection program and other deposit fees, loan fee income from mortgage banking and prepayment penalties, Harrington Wealth Management trust and investment fees, and other retail banking fees. |
-10-
| | 5. | | Achieving a high level of performance on our investment portfolio by earning a pre-tax total return interest income plus net gains and losses on securities and related total return swaps over one month LIBOR of approximately .75% to 1.00% per annum. |
| |
| | 6. | | Controlling interest rate risk of the institution to a lower level and seeking high credit quality of the loan and investment portfolios. |
Together, we believe these factors will contribute to consistent and growing profitability. The effect of these factors on our financial results is discussed further in the following sections:
Results of Operations
The Company reported net income of $498 thousand for the three months ended September 30, 2007, as compared to $2.1 million for the three months ended September 30, 2006. The Company reported net income of $3.5 million for the nine months ended September 30, 2007, as compared to $6.3 million for the nine months ended September 30, 2006. On a diluted earnings per share basis, the Company earned $.09 per share for the three months ended September 30, 2007 and $.38 for the three months ended September 30, 2006. Net earnings were reduced by a pre-tax mark to market loss of $387 thousand on commercial mortgage backed securities (CMBS) total return swaps (TROR) in HWFG’s trading portfolio and a $1.9 million pre-tax write-down of all $2.4 million of HWFG’s non-insured sub-prime, net interest margin (NIM) securities due to deteriorating credit quality of the underlying loans.(see page 20 for a detailed explanation). Return on average equity was 3.0% in the September 2007 quarter compared to 12.8 % in the same period in 2006, respectively.
Net interest margin was 2.95% in the September 2007 quarter, expanding 10 bps and 7 bps from the June 2007 and September 2006 quarters, respectively. Net interest income was $8.0 million in the September 2007 quarter compared to $7.6 million in the June 2007 quarter (increasing 5.5%) and $7.7 million in the September 2006 quarter (increasing 4.4%). Favorable funding dynamics, widening credit spreads, the positive effect from repositioning the investment portfolio in the June 2007 quarter, and growth in average earning assets drove the improvement in margin and net interest income. HWFG believes it is prudent to focus on building the core franchise of loans and deposits under its loan, investment and deposit pricing disciplines and sacrificing some growth, if competitive conditions warrant. HWFG will remain opportunistic in making investments based on available risk-adjusted spreads sufficient to meet its targeted return in equity and risk-adjusted spreads.
Management measures the performance of the investment portfolio as the spread between its total return (interest income plus net gains and losses on securities and hedges) and one month LIBOR with a goal of achieving a spread of .75% to 1.00%. Management expects to manage the size of the investment portfolio opportunistically as equity capital levels warrant and based on the growth of core banking assets and liabilities. (See page 16 for a description of the investment portfolio).
The following tables set forth, for the periods presented, information regarding (i) the total dollar amount of interest income from interest-earning assets and the resultant average yields; (ii) the total dollar amount of interest expense on interest-bearing liabilities and the resultant average rate; (iii) net interest income before provision for loan losses; (iv) interest rate spread; and (v) net interest margin. Information is based on average daily balances during the periods presented.
-11-
| | | | | | | | | | | | | | | | | | | | | | | | | |
| | | Three months ended | | | Three months ended | |
| | | September 30, 2007 | | | September 30, 2006 | |
| (In thousands) | | Balance | | | Income | | | Rate (6) | | | Balance | | | Income | | | Rate (6) | |
| Interest earning assets: | | | | | | | | | | | | | | | | | | | | | | | | |
| Loans receivable (1) | | $ | 763,000 | | | $ | 15,130 | | | | 7.91 | % | | $ | 730,840 | | | $ | 14,317 | | | | 7.82 | % |
| FHLB stock | | | 12,081 | | | | 161 | | | | 5.29 | % | | | 14,806 | | | | 205 | | | | 5.49 | % |
| Securities and trading account assets (2) | | | 317,215 | | | | 4,890 | | | | 6.17 | % | | | 329,143 | | | | 4,384 | | | | 5.33 | % |
| Cash and cash equivalents (3) | | | 11,552 | | | | 61 | | | | 2.09 | % | | | 10,469 | | | | 72 | | | | 2.73 | % |
| | | | | | | | | | | | | | | | | | | | | |
| Total interest earning assets | | | 1,103,848 | | | | 20,242 | | | | 7.32 | % | | | 1,085,258 | | | | 18,978 | | | | 6.98 | % |
| | | | | | | | | | | | | | | | | | | | | | | |
| Non-interest-earning assets | | | 51,388 | | | | | | | | | | | | 50,544 | | | | | | | | | |
| | | | | | | | | | | | | | | | | | | | | | | |
| Total assets | | $ | 1,155,236 | | | | | | | | | | | $ | 1,135,802 | | | | | | | | | |
| | | | | | | | | | | | | | | | | | | | | | | |
| | | | | | | | | | | | | | | | | | | | | | | | | |
| Interest bearing liabilities: | | | | | | | | | | | | | | | | | | | | | | | | |
| Deposits: | | | | | | | | | | | | | | | | | | | | | | | | |
| NOW and money market accounts | | $ | 97,757 | | | $ | 642 | | | | 2.61 | % | | $ | 89,650 | | | $ | 506 | | | | 2.24 | % |
| Passbook accounts and certificates of deposit | | | 651,325 | | | | 8,058 | | | | 4.91 | % | | | 567,142 | | | | 6,360 | | | | 4.45 | % |
| | | | | | | | | | | | | | | | | | | | | |
| Total deposits | | | 749,082 | | | | 8,700 | | | | 4.61 | % | | | 656,792 | | | | 6,866 | | | | 4.15 | % |
| | | | | | | | | | | | | | | | | | | | | | | | | |
| FHLB advances (4) | | | 209,752 | | | | 2,570 | | | | 4.86 | % | | | 274,185 | | | | 3,425 | | | | 4.96 | % |
| Reverse repurchase agreements | | | 50,330 | | | | 357 | | | | 2.78 | % | | | 59,439 | | | | 447 | | | | 2.94 | % |
| Other borrowings (5) | | | 25,774 | | | | 573 | | | | 8.70 | % | | | 25,774 | | | | 537 | | | | 8.15 | % |
| | | | | | | | | | | | | | | | | | | | | |
| Total interest-bearing liabilities | | | 1,034,938 | | | | 12,200 | | | | 4.66 | % | | | 1,016,190 | | | | 11,275 | | | | 4.38 | % |
| | | | | | | | | | | | | | | | | | | | | | | |
| Non-interest-bearing deposits | | | 45,164 | | | | | | | | | | | | 47,852 | | | | | | | | | |
| Non-interest-bearing liabilities | | | 8,704 | | | | | | | | | | | | 6,658 | | | | | | | | | |
| | | | | | | | | | | | | | | | | | | | | | | |
| Total liabilities | | | 1,088,806 | | | | | | | | | | | | 1,070,700 | | | | | | | | | |
| Stockholders’ equity | | | 66,430 | | | | | | | | | | | | 65,102 | | | | | | | | | |
| | | | | | | | | | | | | | | | | | | | | | | |
| Total liabilities and stockholders’ equity | | $ | 1,155,236 | | | | | | | | | | | $ | 1,135,802 | | | | | | | | | |
| | | | | | | | | | | | | | | | | | | | | | | |
| Net interest-earning assets (liabilities) | | $ | 68,910 | | | | | | | | | | | $ | 69,068 | | | | | | | | | |
| | | | | | | | | | | | | | | | | | | | | | | |
| | | | | | | | | | | | | | | | | | | | | | | | | |
| Net interest income/interest rate spread | | | | | | $ | 8,042 | | | | 2.66 | % | | | | | | $ | 7,703 | | | | 2.60 | % |
| | | | | | | | | | | | | | | | | | | | | |
| Net interest margin | | | | | | | | | | | 2.95 | % | | | | | | | | | | | 2.88 | % |
| | | | | | | | | | | | | | | | | | | | | | | |
| Ratio of average interest-earning assets to average interest-bearing liabilities | | | | | | | | | | | 106.66 | % | | | | | | | | | | | 106.80 | % |
| | | | | | | | | | | | | | | | | | | | | | | |
| | |
| 1) | | Balance includes non-accrual loans. Income includes fees earned on loans originated and accretion of deferred loan fees. |
| |
| 2) | | Consists of securities classified as available for sale, held to maturity and trading account assets. Excludes SFAS 115 adjustments to fair value, which are included in other non-interest earning assets. |
| |
| 3) | | Consists of cash and due from banks and federal funds sold. |
| |
| 4) | | Interest on FHLB advances is net of hedging costs. Hedging costs include interest income and expense and ineffectiveness adjustments for cash flow hedges. The Company uses pay-fixed, receive floating LIBOR swaps to hedge the short term repricing characteristics of the floating FHLB advances. |
| |
| 5) | | Consists of other debt and a note payable under a revolving line of credit. |
| |
| 6) | | Annualized. |
-12-
| | | | | | | | | | | | | | | | | | | | | | | | | |
| | | Nine Months Ended | | | Nine Months Ended | |
| | | September 30, 2007 | | | September 30, 2006 | |
| (In thousands) | | Balance | | | Income | | | Rate (6) | | | Balance | | | Income | | | Rate (6) | |
| Interest earning assets: | | | | | | | | | | | | | | | | | | | | | | | | |
| Loans receivable (1) | | $ | 761,381 | | | $ | 45,202 | | | | 7.92 | % | | $ | 704,447 | | | $ | 40,256 | | | | 7.62 | % |
| FHLB stock | | | 13,463 | | | | 528 | | | | 5.24 | % | | | 15,678 | | | | 607 | | | | 5.18 | % |
| Securities and trading account assets (2) | | | 302,550 | | | | 12,934 | | | | 5.70 | % | | | 358,064 | | | | 13,790 | | | | 5.14 | % |
| Cash and cash equivalents (3) | | | 11,996 | | | | 212 | | | | 2.36 | % | | | 11,107 | | | | 193 | | | | 2.32 | % |
| | | | | | | | | | | | | | | | | | | | | |
| Total interest earning assets | | | 1,089,390 | | | | 58,876 | | | | 7.21 | % | | | 1,089,296 | | | | 54,846 | | | | 6.72 | % |
| | | | | | | | | | | | | | | | | | | | | | | |
| Non-interest-earning assets | | | 52,822 | | | | | | | | | | | | 48,773 | | | | | | | | | |
| | | | | | | | | | | | | | | | | | | | | | | |
| Total assets | | $ | 1,142,212 | | | | | | | | | | | $ | 1,138,069 | | | | | | | | | |
| | | | | | | | | | | | | | | | | | | | | | | |
| | | | | | | | | | | | | | | | | | | | | | | | | |
| Interest bearing liabilities: | | | | | | | | | | | | | | | | | | | | | | | | |
| Deposits: | | | | | | | | | | | | | | | | | | | | | | | | |
| NOW and money market accounts | | $ | 100,742 | | | $ | 1,992 | | | | 2.64 | % | | $ | 100,103 | | | $ | 1,603 | | | | 2.14 | % |
| Passbook accounts and certificates of deposit | | | 606,846 | | | | 22,085 | | | | 4.87 | % | | | 543,431 | | | | 16,629 | | | | 4.09 | % |
| | | | | | | | | | | | | | | | | | | | | |
| Total deposits | | | 707,588 | | | | 24,077 | | | | 4.55 | % | | | 643,534 | | | | 18,232 | | | | 3.79 | % |
| | | | | | | | | | | | | | | | | | | | | | | | | |
| FHLB advances (4) | | | 228,927 | | | | 8,574 | | | | 5.01 | % | | | 292,817 | | | | 10,587 | | | | 4.83 | % |
| Reverse repurchase agreements | | | 56,432 | | | | 1,167 | | | | 2.73 | % | | | 59,220 | | | | 1,325 | | | | 2.95 | % |
| Other borrowings (5) | | | 25,774 | | | | 1,711 | | | | 8.75 | % | | | 25,774 | | | | 1,498 | | | | 7.66 | % |
| | | | | | | | | | | | | | | | | | | | | |
| Total interest-bearing liabilities | | | 1,018,721 | | | | 35,529 | | | | 4.65 | % | | | 1,021,345 | | | | 31,642 | | | | 4.12 | % |
| | | | | | | | | | | | | | | | | | | | | | | |
| Non-interest-bearing deposits | | | 47,315 | | | | | | | | | | | | 47,575 | | | | | | | | | |
| Non-interest-bearing liabilities | | | 7,761 | | | | | | | | | | | | 5,938 | | | | | | | | | |
| | | | | | | | | | | | | | | | | | | | | | | |
| Total liabilities | | | 1,073,797 | | | | | | | | | | | | 1,074,858 | | | | | | | | | |
| Stockholders’ equity | | | 68,415 | | | | | | | | | | | | 63,211 | | | | | | | | | |
| | | | | | | | | | | | | | | | | | | | | | | |
| Total liabilities and stockholders’ equity | | $ | 1,142,212 | | | | | | | | | | | $ | 1,138,069 | | | | | | | | | |
| | | | | | | | | | | | | | | | | | | | | | | |
| Net interest-earning assets (liabilities) | | $ | 70,669 | | | | | | | | | | | $ | 67,951 | | | | | | | | | |
| | | | | | | | | | | | | | | | | | | | | | | |
| | | | | | | | | | | | | | | | | | | | | | | | | |
| Net interest income/interest rate spread | | | | | | $ | 23,347 | | | | 2.56 | % | | | | | | $ | 23,204 | | | | 2.60 | % |
| | | | | | | | | | | | | | | | | | | | | |
| Net interest margin | | | | | | | | | | | 2.86 | % | | | | | | | | | | | 2.86 | % |
| | | | | | | | | | | | | | | | | | | | | | | |
| Ratio of average interest-earning assets to average interest-bearing liabilities | | | | | | | | | | | 106.94 | % | | | | | | | | | | | 106.65 | % |
| | | | | | | | | | | | | | | | | | | | | | | |
| | |
| 1) | | Balance includes non-accrual loans. Income includes fees earned on loans originated and accretion of deferred loan fees. |
| |
| 2) | | Consists of securities classified as available for sale, held to maturity and trading account assets. Excludes SFAS 115 adjustments to fair value, which are included in other non-interest earning assets. |
| |
| 3) | | Consists of cash and due from banks and federal funds sold. |
| |
| 4) | | Interest on FHLB advances is net of hedging costs. Hedging costs include interest income and expense and ineffectiveness adjustments for cash flow hedges. The Company uses pay-fixed, receive floating LIBOR swaps to hedge the short term repricing characteristics of the floating FHLB advances. |
| |
| 5) | | Consists of other debt and a note payable under a revolving line of credit. |
| |
| 6) | | Annualized. |
The Company reported interest income of $20.2 million for the three months ended September 30, 2007, compared to $19.0 million for the three months ended September 30, 2006, an increase of $1.3
-13-
million or 6.67%. The Company reported interest income of $58.9 million for the nine months ended September 30, 2007, compared to $54.8 million for the nine months ended September 30, 2006, an increase of $4.0 million or 7.35%. The primary reason for the increase during the periods was the increase in the volume of net loans receivable and a higher yield on securities and loans due to the repositioning of the investment portfolio in the June 2007 quarter and the addition of higher yielding investment grade mortgage securities.
The Company reported total interest expense of $12.2 million for the three months ended September 30, 2007, compared to $11.3 million for the three months ended September 30, 2006, an increase of $925 thousand or 8.20%. For the nine months ended September 30, 2007, the Company reported total interest expense of $35.5 million, compared to $31.6 million for the nine months ended September 30, 2006, an increase of $3.9 million or 12.28%. The increase in interest expense during the period was attributable to an increase in both the volume and cost of interest-bearing deposits during the periods ending September 30, 2007.
The following table sets forth the activity in our allowance for loan losses for the periods indicated.
| | | | | | | | | | | | | | | | | |
| | | For the Quarter Ended | | | For the Nine Months Ended | |
| | | September | | | September | |
| | | 2007 | | | 2006 | | | 2007 | | | 2006 | |
| | | (Dollars in thousands) | | | (Dollars in thousands) | |
| Balance at beginning of period | | $ | 6,113 | | | $ | 5,614 | | | $ | 5,914 | | | $ | 5,661 | |
| | | | | | | | | | | | | | | | | |
| Charge-offs: | | | | | | | | | | | | | | | | |
| Real Estate Loans | | | | | | | | | | | | | | | | |
| Single-family Residential | | | — | | | | — | | | | — | | | | — | |
| Multi-family Residential | | | — | | | | — | | | | — | | | | — | |
| Commercial | | | — | | | | — | | | | — | | | | — | |
| Commercial & Industrial | | | — | | | | (13 | ) | | | — | | | | (369 | ) |
| Consumer and Other Loans | | | (5 | ) | | | — | | | | (6 | ) | | | (1 | ) |
| | | | | | | | | | | | | |
| Total Charge-offs | | | (5 | ) | | | (13 | ) | | | (6 | ) | | | (370 | ) |
| Recoveries: | | | — | | | | 44 | | | | — | | | | 64 | |
| | | | | | | | | | | | | |
| Net Recoveries (Charge-offs) | | | (5 | ) | | | 31 | | | | (6 | ) | | | (306 | ) |
| Provision (credit) for Losses on Loans | | | 200 | | | | 200 | | | | 400 | | | | 490 | |
| | | | | | | | | | | | | |
| | | | | | | | | | | | | | | | | |
| Balance at end of period | | $ | 6,308 | | | $ | 5,845 | | | $ | 6,308 | | | $ | 5,845 | |
| | | | | | | | | | | | | | | | | |
| Allowance for Loan Losses as a percent of total loans outstanding | | | 0.82 | % | | | 0.78 | % | | | 0.82 | % | | | 0.78 | % |
| | | | | | | | | | | | | | | | | |
| Ratio of Net Charge-offs to Average Loans outstanding | | | 0.00 | % | | | 0.00 | % | | | 0.00 | % | | | 0.04 | % |
The provision reflects the reserves required based upon, among other things, the Company’s analysis of the composition, credit quality and shift to growth of its single-family real estate and construction loans and decrease in commercial and industrial and other segments of the loan portfolios. Our allowance for loan losses has four components: (i) an allocated allowance for specifically identified problem loans, (ii) a formula allowance for non-homogenous loans, (iii) a formula allowance for large groups of smaller balance homogenous loans and (iv) an unallocated allowance. Each of these
-14-
components is determined based upon estimates that can and do change when the actual events occur. The formula allowance uses a model based on historical losses as an indicator of future losses and as a result could differ from the losses incurred in the future; however, since this history is updated with the most recent loss information, the differences that might otherwise occur may be mitigated. The specific allowance uses various techniques to arrive at an estimate of loss. Historical loss information, discounted cash flows, fair market value of collateral and secondary market information are all used to estimate those losses.
Banking fee and other income was $1.0 million in the September 2007 quarter compared with $1.1 million in the June 2007 quarter and $931 thousand in the September 2006 quarter. Harrington Wealth Management Fee income, BOLI income, and Deposit fee income drove the growth in banking fees over the comparable September 2006 and 2007 quarters, while prepayment penalty fee income decreased due to lower levels of prepayments.
| | | | | | | | | | | | | | | | | | | | | | | | | |
| | | Banking Fee & Other Income | |
| | | (Dollars in thousands) | |
| | | | | | | | | | | | | | | September | | | September | | | | |
| | | September | | | September | | | % | | | 2007 | | | 2006 | | | % | |
| | | 2007 Quarter | | | 2006 Quarter | | | Change | | | YTD | | | YTD | | | Change | |
| |
Banking Fee Type | | | | | | | | | | | | | | | | | | | | | | | | |
| | | | | | | | | | | | | | | | | | | | | | | | | |
| Mortgage Brokerage Fee, Prepayment Penalties & Other Loan Fees | | $ | 119 | | | $ | 176 | | | | -32.4 | % | | $ | 628 | | | $ | 551 | | | | 14.0 | % |
| | | | | | | | | | | | | | | | | | | | | | | | | |
| Deposit, Other Retail Banking Fees & Other Fee Income | | | 430 | | | | 356 | | | | 20.8 | % | | | 1,239 | | | | 1,302 | | | | -4.8 | % |
| | | | | | | | | | | | | | | | | | | | | | | | | |
| Harrington Wealth Management Fees | | | 238 | | | | 214 | | | | 11.2 | % | | | 715 | | | | 618 | | | | 15.7 | % |
| | | | | | | | | | | | | | | | | | | | | | | | | |
| BOLI Income, net | | | 209 | | | | 185 | | | | 13.0 | % | | | 616 | | | | 567 | | | | 8.6 | % |
| | | | | | | | | | | | | | | | | | | |
| | | | | | | | | | | | | | | | | | | | | | | | | |
Total Banking Fee & Other Income | | $ | 996 | | | $ | 931 | | | | 7.0 | % | | $ | 3,198 | | | $ | 3,038 | | | | 5.3 | % |
| | | | | | | | | | | | | | | | | | | | | |
Operating expenses were stable at $5.7 million in the September 2007 quarter compared to $5.7 million in the June 2007 quarter and up only 3.7% over the $5.5 million of the September 2006 quarter. Operating expenses increased 4.3% in 2007 as compared to the first nine months of 2006. HWFG continues to invest in business development officers in its loan and HWM divisions and grow the number of its banking centers on a measured basis, while attempting to control other costs. During the last year, HWFG added a banking center in the Kansas City metro and added four new commercial lenders and two business development officers throughout the franchise. The cost of additional lenders and business development officers and higher benefit costs have been offset by lower incentive compensation, consulting fees, and market expenses in 2007. As previously announced, HWFG terminated its Portfolio and Rate Risk Analysis Agreement with Smith Breeden Associates Inc, as of April 30, 2007, and fully implemented these functions on an in-house basis with marginal cost savings in the quarter.
HWFG’s tax rate stabilized at 37.4% in the September 2007 quarter compared to the 34.7% tax rate in the September 2006 quarter, where HWFG benefited from a favorable tax ruling by the Franchise Tax Board of California on the apportionment of income to the states where HWFG does business.
-15-
Financial Condition
The purpose of this section is to elaborate on the nature of and reasons for the changes in HWFG’s balance sheet and its financial condition in the September 2007 quarter. Although HWFG’s core mission is to develop its loans, deposits, and HWM and other banking fees in its multiple markets, HWFG has, since its founding in 1996, invested in primarily mortgage and related securities when opportunities are favorable in an effort to create incremental profits and increase the book value of equity. In the September 2007 quarter, HWFG capitalized on the unprecedented dislocations in the mortgage markets by adding mortgage related securities at high risk-adjusted spreads based on its analysis.
Securities
The U.S. residential mortgage market is estimated to be in excess of $10 trillion in outstanding principal amount. The sub-prime portion of this market is approximately 12% of the total or $1.2 trillion. Sub-prime mortgage loans are generally considered the lowest credit segment in the mortgage market as the borrowers have low credit scores (FICO scores under 660). HWFG is not a program originator of sub-prime loans but does invest in investment grade sub-prime securities, largely rated AAA or AA by one or more rating agency, in a portion of its investment portfolio when HWFG’s analysis indicates the spreads and return potential of these securities are high relative to the underlying risk.
Few sub-prime mortgages are held by the entities that originated them. Most of these mortgages are pooled and securitized into a trust structure. The trust will then issue bonds to finance the sub-prime mortgages, and these mortgages and related securities will be serviced by a third party. The securities issued typically consist of senior and subordinate bonds, or tranches, and a small equity piece referred to as over-collateralization (OC). OC is the amount by which the assets owned by the trust exceed the liabilities (the sub-prime securities) issued. Senior bonds are typically rated AAA and have payment priority over the subordinate tranches. The subordinate tranches are typically issued with ratings from AA down to BB. A subordinate security with a higher credit rating has payment priority over those with lower ratings in the event of credit loss. The credit performance of these securities vary widely based on the year of origination, the underwriting standards, the servicer’s expertise and the loan to value of the underlying loans. The sub-prime market is therefore very fragmented, allowing for excess returns through favorable analysis and selection of securities.
In order for the securities, or tranches, issued by the mortgage trust to attain high ratings, the rating agencies require certain levels of protection in the form of OC and subordination. Collectively these are referred to as credit enhancement. The amount of credit enhancement required is based on the characteristics of the loans in the trust. These characteristics are used by rating agencies to project the likelihood of future defaults and losses on the collateral. For the lowest rated tranche, this support will generally be limited to the OC. To increase the rating of the security to AAA, however, further protection in the form of subordination covers expected losses by many times. For example, credit enhancement of 20% or greater in many AA and AAA securities is made up of 4% OC and 16% subordination from the tranches junior to these securities in payment priority in the event of loss.
Based on the extremely poor performance of sub-prime loans originated between late 2005 and early 2007, it appears that rating agencies’ models were inaccurate in their projections of delinquencies and defaults and perhaps relied too heavily on historical performance, which focused on a very low mortgage rate and very high home price appreciation environment. As a result, the “sizing” of the required credit enhancement for a given rating appears too small based on recent performance of sub-prime mortgages originated in this period. Over the course of 2007, rating agencies have revised downward their original ratings on hundreds of sub-prime mortgage securities which were issued during the 2005-2007 time period.
A significant portion of the sub-prime write-downs incurred by larger financial institutions and investment banks in the September 2007 quarter have been on Collateralized Debt Obligations (CDO)
-16-
with largely BBB and BBB- sub-prime securities as the collateral for these CDOs. These BBB securities were then tranched to provide the higher rated CDO securities priority on the cash flows of these BBB securities. However, with the large delinquencies of the underlying sub-prime loans issued in the 2005 to 2007 period and the very low subordination of the BBB securities, a leveraging of credit risk occurred and even some AAA rated CDO securities have incurred write-downs. HWFG has not invested in sub-prime CDO’s.
HWFG does not rely solely on the rating agencies’ analysis and ratings of sub-prime securities. Management performs its own independent analysis of the expected cash flows for more extreme delinquency, default, and estimates of losses incurred in the foreclosure and sale process to determine whether credit enhancement is sufficient for the spread to be earned relative to the risk of default. HWFG also reviews the nature of the issuers and their underwriting performance as well as the capabilities and performance of the servicers of the underlying loans and securities.
In the September 2007 quarter, as delinquency and loss factors increased significantly and ratings were adjusted by the agencies on the sub-prime securities, spreads on almost all mortgage loan and related securities widened precipitously as credit conditions deteriorated and a sharp re-pricing of credit risk developed on almost all fixed income credit classes. Historically, periods of extreme market stress present excellent opportunities for HWFG to add high quality securities at wide risk-adjusted spreads. The AFS portfolio had been reduced by $114.5 million over the last two years of tighter spreads, higher home valuations, and more liberal underwriting standards, it was in a position to respond to the liquidity crisis and capitalize on the resulting higher spread environment in the September 2007 quarter.
In the September 2007 quarter, HWFG added $98.4 million of high credit quality mortgage related investments to its available for sale (AFS) portfolio, which increased to $355.3 million net of pay-downs at September 20, 2007 from $286.4 million at June 30, 2007.
-17-
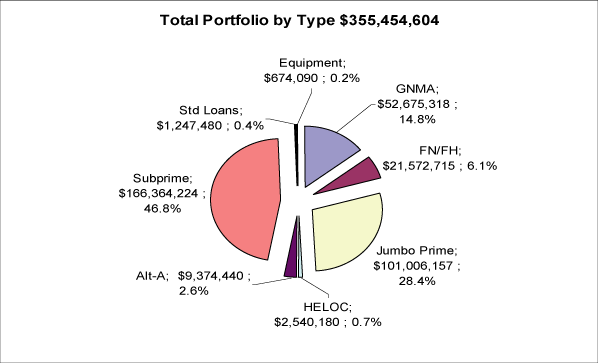
HWFG’s combined $355.5 million investment portfolios had the following composition and rating characteristics at September 30, 2007:
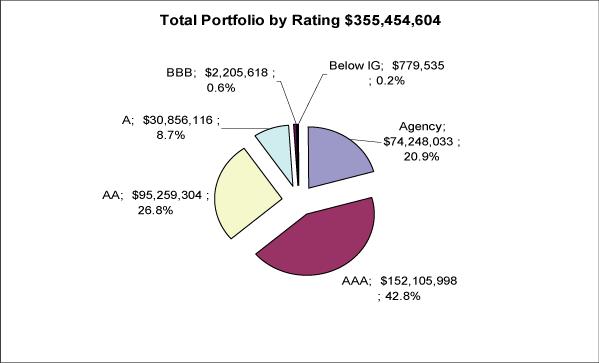
The agency ratings associated with our combined investment portfolios consisted of the following at September 30, 2007:
-18-
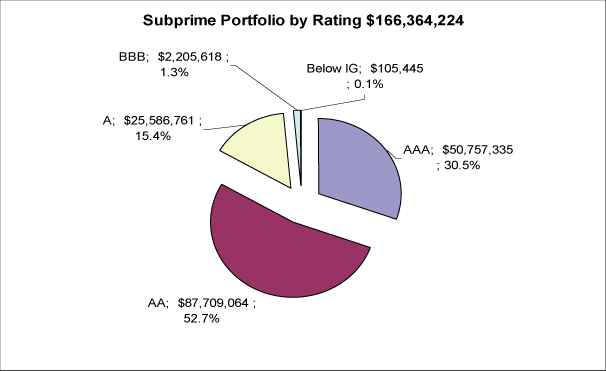
Of the securities purchased in the September 2007 quarter, 76% or $75.1 million have sub-prime defined mortgage loans as the underlying collateral, have a weighted average rating of AA+, and a weighted average credit enhancement level of 46.9% of the securities’ amount. All of the securities purchased are rated AA or higher by one or more rating agency. The remaining investment purchases made in the September 2007 quarter include Prime and Alt-A mortgage related investments and are all rated AAA by at least one rating agency. On average, the September 2007 quarter investments were purchased at deep discounts and estimated spreads from 100 to 300 basis points to LIBOR. As of September 30, 2007, 99% of HWFG’s $166.4 million in sub-prime securities are rated A or higher and 84% are rated AA or higher by one or more rating agency.
-19-
On an ongoing basis HWFG monitors and evaluates the credit ratings and performance of its entire portfolio of mortgage related securities. HWFG performs stress testing of the cash flows on lower rated securities by projecting higher levels of delinquency, default, and losses on underlying foreclosed loans. During the third quarter evaluation, it was determined that a small portion of the sub-prime portfolio (1.4% of book value) had become impaired, which relies on the spread between the sub-prime loans and issued securities plus prepayment penalty fees rather than the principal and interest of the loans like almost all of HWFG’s other sub-prime securities. That is, all $2.4 million book value of non-insured, NIM sub-prime securities were deemed other than temporarily impaired, and these securities were written down by $1.9 million to market value through earnings in the September 2007 quarter. The NIM securities were purchased on average approximately 18 months ago, have paid down approximately 79% of the original principal amount, and were originally investment-grade rated. Several factors are evaluated in management’s stress-testing and conclusions. These factors include a dramatic increase in the level of delinquencies, losses on the liquidation of collateral, declines in over-collateralization amounts and ratings downgrades on some of the securities. Based on its ongoing monitoring, HWFG expects to earn all interest and principal on its other AFS mortgage investment securities; however, a more severe deterioration of the housing and credit markets, beyond stress test levels, could lead to additional write-offs.
-20-
The amortized cost and fair value of available for sale securities are included in the tables that follow. As noted within these tables, asset backed securities (underlying securities mortgages) were at an unrealized loss of $7.6 million, or 96% of book value on average at September 30, 2007, versus an unrealized gain of $344 thousand at December 31, 2006. The decline in value is attributable to market conditions that are described above from pages 16 through 20. The amortized cost and market values of available for sale securities are as follows:
| | | | | | | | | |
| | | Amortized Cost | | | Fair Value | |
September 30, 2007 | | �� | | | | | | |
| | | | | | | | | |
| Mortgage-backed securities — pass throughs | | $ | 74,397 | | | $ | 74,108 | |
| Collateralized mortgage obligations | | | 111,316 | | | | 110,610 | |
| Asset-backed securities (underlying securities mortgages) | | | 176,292 | | | | 168,675 | |
| Asset-backed securities | | | 2,017 | | | | 1,921 | |
| | | | | | | |
Total | | $ | 364,022 | | | $ | 355,314 | |
| | | | | | | |
| | | | | | | | | |
| | | Amortized Cost | | | Fair Value | |
December 31, 2006 | | | | | | | | |
| | | | | | | | | |
| Mortgage-backed securities — pass throughs | | $ | 98,244 | | | $ | 96,945 | |
| Collateralized mortgage obligations | | | 76,182 | | | | 75,795 | |
| Commercial mortgate-backed securities | | | 31,312 | | | | 31,081 | |
| Asset-backed securities (underlying securities mortgages) | | | 102,815 | | | | 103,159 | |
| Asset-backed securities | | | 2,747 | | | | 2,749 | |
| | | | | | | |
Total | | $ | 311,300 | | | $ | 309,729 | |
| | | | | | | |
With the re-pricing of risk and widening of spreads, HWFG also reinitiated a holding of commercial mortgage backed securities (CMBS) total rate of return (TROR) swaps to capitalize on the wider spreads. A position of $70 million notional amount of AAA rated CMBS TROR swaps was added at progressively wider spread levels throughout the quarter. This investment earns a spread (about 80 bps) between the AAA rated CMBS 8.5+ year index yield and the adjusted 10 year LIBOR swap rate on the notional amount of the swaps plus the gain or loss from the change in this spread over the holding period of six months. For example, a 10 bps tightening or widening of this spread on $70 million notional amount of AAA CMBS results in approximately a $492 thousand gain or loss, respectively. At September 30, 2007, spreads widened a weighted average of approximately 8 bps from initiation of the swaps, resulting in a pre-tax mark to market loss of $387 thousand loss in the September 2007 quarter. Prior to reinitiating a CMBS TROR swap position in the September 2007 quarter, HWFG had earned $5.9 million pre-tax on TROR swaps in the period from 2003 to 2006. HWFG’s analysis of CMBS spreads continues to indicate a favorable profit opportunity, in that spreads remain wide on a historical basis and are expected to tighten.
Loans
The Company’s primary focus with respect to its lending operations has historically been the direct origination of single-family and multi-family residential, commercial real estate, business, and
-21-
consumer loans. As part of its strategic plan to diversify its loan portfolio, the Company, starting in 2000, has been increasing its emphasis on loans secured by commercial real estate, industrial loans and consumer loans.
Loan growth has been slower over the last year at 3.1% relative to HWFG’s historical and target performance, as HWFG has maintained a cautious position on the housing and economic environment. Net loans reached $766.0 million at September 30, 2007 compared to $743.3 million at September 30, 2006. Competition remains robust with undisciplined pricing by some market participants. HWFG anticipates that the spread widening, if sustained, in the securitized loan markets will eventually spill over into the banking markets, and HWFG’s loan growth will trend toward its historical and target levels of 8% to 12% over the next year.
The Company recognizes that certain types of loans are inherently riskier than others. For instance, the commercial real estate loans that the Company makes are riskier than home mortgages because they are generally larger, often rely on income from small-business tenants, and historically have produced higher default rates on an industry wide basis. Likewise commercial loans are riskier than consumer and mortgage loans because they are generally larger and depend upon the success of often complex businesses. Furthermore construction loans and land acquisition and development loans present higher credit risk than do other real estate loans due to their speculative nature. Unsecured loans are also inherently riskier than collateralized loans. However, these loans also provide a higher risk-adjusted margin and diversification benefits to the loan portfolio.
Loan quality was stable in the quarter. Non-performing loans were $1.9 million or .16% of the total assets at September 30, 2007 vs. $98 thousand, or .01% of total assets as of December 31, 2006. Virtually all of the $1.9 million in non-performing loans at September 30, 2007 relates to an upscale, single family development loan participation in California, where the lead participant was unable to reach terms with the borrower by quarter’s end on a suitable extension and forbearance agreement. HWFG increased its allowance for loan losses by $200 thousand in the quarter to $6.3 million or .82% of total loans at September 30, 2007. Although non-performing loans were stable, given the current housing market, credit conditions, and HWFG’s credit risk analysis, this provision was made.
The loan portfolio continues to be diversified among HWFG’s business lines as shown in the following chart:
HWFG Net Loan Growth and Mix
(Dollars in millions)
| | | | | | | | | | | | | | | | | | | | | | | | | |
| | | September 30, 2007 | | | December 31, 2006 | | | September 30, 2006 | |
| | | | | | | % of | | | | | | | % of | | | | | | | % of | |
| Loan Type | | Total | | | Total | | | Total | | | Total | | | Total | | | Total | |
| Commercial Real Estate | | $ | 249.4 | | | | 32.2 | % | | $ | 264.9 | | | | 34.7 | % | | $ | 260.5 | | | | 34.7 | % |
| Multi-family Real Estate | | | 79.1 | | | | 10.2 | % | | | 79.9 | | | | 10.4 | % | | | 78.7 | | | | 10.5 | % |
| Construction (1) | | | 135.9 | | | | 17.5 | % | | | 112.6 | | | | 14.7 | % | | | 106.9 | | | | 14.2 | % |
| Single-family Real Estate | | | 119.6 | | | | 15.4 | % | | | 106.7 | | | | 13.9 | % | | | 115.1 | | | | 15.3 | % |
| Commercial and Industrial Loans | | | 114.8 | | | | 14.8 | % | | | 119.1 | | | | 15.6 | % | | | 112.1 | | | | 14.9 | % |
| Land Acquisition and Development | | | 48.5 | | | | 6.3 | % | | | 54.7 | | | | 7.1 | % | | | 50.5 | | | | 6.7 | % |
| Consumer Loans | | | 24.6 | | | | 3.2 | % | | | 25.3 | | | | 3.3 | % | | | 25.7 | | | | 3.4 | % |
| Other Loans (2) | | | 2.8 | | | | 0.4 | % | | | 2.2 | | | | 0.3 | % | | | 2.2 | | | | 0.3 | % |
| | | | | | | | | | | | | | | | | | | |
Total Gross Loans | | $ | 774.7 | | | | 100.0 | % | | $ | 765.4 | | | | 100.0 | % | | $ | 751.7 | | | | 100.0 | % |
| Allowance for loan loss | | | (6.3 | ) | | | | | | | (5.9 | ) | | | | | | | (5.9 | ) | | | | |
| Deferred fees | | | (1.9 | ) | | | | | | | (2.1 | ) | | | | | | | (2.1 | ) | | | | |
| Discounts/Premiums | | | (0.5 | ) | | | | | | | (0.4 | ) | | | | | | | (0.4 | ) | | | | |
| | | | | | | | | | | | | | | | | | | | | | |
Net Loans Receivable | | $ | 766.0 | | | | | | | $ | 757.0 | | | | | | | $ | 743.3 | | | | | |
| | | | | | | | | | | | | | | | | | | | | | |
-22-
| | |
| (1) | | Includes loans secured by residential, land and commercial properties. At September 30, 2007, we had $49.2 million of construction loans secured by single-family residential properties, $47.5 million secured by commercial properties, $34.4 million for land development and $4.8 million secured by multi-family residential properties. |
| |
| (2) | | Includes loans collateralized by deposits and consumer line of credit loans. |
Deposits
Net of $50 million in California State deposits received, retail and business deposits were up marginally in the September 2007 quarter over the June 2007 quarter and up 9.5% year over year. Average non-interest bearing deposits were $47.3 million at September 30, 2007, down slightly from the September 2006 period and down 5.6% from the September 2006 quarter. HWFG reduced its CD pricing in the quarter after strong promotional deposit growth in the June 2007 quarter. HWFG’s emphasis on core deposit development (business and consumer checking, savings and money market accounts) remains a key strategy. In 2007, HWFG provided its banking centers, business developers and lending officers sales training, product tools and incentives to better capture these deposits and to lay the foundation for growth in 2008.
HWFG is also focused on developing more low and non-costing deposits through a dual pronged program: (1) a sales development and incentive program throughout its banking centers focused on calling on viable commercial and retail DDA prospects, and (2) an incentive and training program for all business and commercial real estate lenders to gather more core deposits from commercial customers in a team approach with the banking centers. HWFG is also adding remote deposit products to enhance customer convenience.
FHLB Advances
Advances from the Federal Home Loan Bank (“FHLB”) of San Francisco decreased to $236.0 million at September 30, 2007, compared to $257.0 million at December 31, 2006, or 8.2%, primarily due to the California State deposits received during the current quarter. For additional information concerning limitations on FHLB advances, see “Liquidity and Capital Resources.”
Stockholders’ Equity
Stockholders’ equity was $63.4 million at September 30, 2007, as compared to $67.7 million at December 31, 2006, a decrease of $4.3 million or 6.3%. The value of cash flow hedges recorded in equity decreased by $1.3 million after tax due to increased interest rates and spread widening on securities. Furthermore, and with the extreme widening of spreads, the mark to market value of the AFS portfolio declined by $4.4 million on an after tax basis from June 30, 2007. Book value per share, therefore, was $11.42 at September 30, 2007 compared to $12.08 at the same time a year ago, as earnings during the period were less than the total of the changes in market values on the AFS portfolio and swaps accounted for as cash flow hedges and $3.1 million of dividends declared or $.55 per share in the period. Stockholders’ equity was positively influenced by $3.5 million of net income recognized, $731 thousand of additional paid in capital from options exercised, and $288 thousand from options expensed.
Liquidity and Capital Resources
Liquidity-The liquidity of Los Padres Bank was 10.1% at September 30, 2007 as compared to 15.5% at December 31, 2006, and 13.3% at June 30, 2007. Los Padres Bank is a consolidated subsidiary of the Company and is monitored closely for regulatory purposes at the Bank level by calculating the ratio of cash, cash equivalents (not committed, pledged or required to liquidate specific liabilities), investments
-23-
and qualifying mortgage-backed securities to the sum of total deposits plus borrowings payable within one year. At September 30, 2007, Los Padres Bank’s “liquid” assets totaled approximately $66.8 million.
In general, Los Padres Bank’s liquidity is represented by cash and cash equivalents and is a product of its operating, investing and financing activities. The Bank’s primary sources of internal liquidity consist of deposits, prepayments and maturities of outstanding loans and mortgage-backed and related securities, maturities of short-term investments, sales of mortgage-backed and related securities and funds provided from operations. The Bank’s external sources of liquidity consist of borrowings, primarily advances from the FHLB of San Francisco, securities sold under agreements to repurchase and a revolving line of credit loan facility, which it maintains with two banks. At September 30, 2007, the Bank had $236.0 million in FHLB advances and had $186.2 million of additional borrowing capacity with the FHLB of San Francisco based on a 35% of total Bank asset limitation. Borrowing capacity from the FHLB is further limited to $128.8 million based on excess collateral pledged at the FHLB as of September 30, 2007.
The Company had a revolving line of credit with a maximum borrowing capacity of $15.0 million that matured on September 30, 2007. At September 30, 2007, and December 31, 2006, the Company was not indebted under this revolving line of credit. The Company intends to negotiate a new line of credit in the near future, and we would utilize this line of credit for growth opportunities and to provide working capital.
A substantial source of the Company’s cash flow from which it services its debt and capital trust securities, pays its obligations, and pays dividends to its shareholders is the receipt of dividends from Los Padres Bank. The availability of dividends from Los Padres Bank is limited by various statutes and regulations. In order to make such dividend payments, Los Padres Bank is required to provide annual advance notice to the Office of Thrift Supervision (“OTS”), at which time the OTS may object to the proposed dividend payments. It is possible, depending upon the financial condition of Los Padres Bank and other factors, the OTS could object to the payment of dividends by Los Padres Bank on the basis that the payment of such dividends is an unsafe or unsound practice. In the event Los Padres Bank is unable to pay dividends to us, we may not be able to service our debt, pay our obligations, or pay dividends on our common stock.
Capital Resources.Federally insured savings institutions such as Los Padres Bank are required to maintain minimum levels of regulatory capital. Under applicable regulations, an institution is well capitalized if it has a total risk-based capital ratio of at least 10.0%, a Tier 1 risk-based capital ratio of at least 6.0% and a leverage ratio of at least 5.0%, with no written agreement, order, capital directive, prompt corrective action directive or other individual requirement by the OTS to maintain a specific capital measure. An institution is adequately capitalized if it has a total risk-based capital ratio of at least 8.0% and a Tier 1 risk-based capital ratio of at least 4.0% and a leverage ratio of at least 4.0% (or 3.0% if it has a composite rating of “1”). The regulation also establishes three categories for institutions with lower ratios: undercapitalized, significantly undercapitalized and critically undercapitalized. At September 30, 2007, Los Padres Bank met the capital requirements of a “well capitalized” institution under applicable OTS regulations. At September 30, 2007, the Bank’s Tier 1 (Core) Capital Ratio was 7.08%, Total Risk-Based Capital Ratio was 10.83%, Tier 1 Risk-Based Capital Ratio was 10.08% and Leverage Ratio was 7.08%.
On May 3, 2005, the Company announced a share repurchase program of up to 200,000 shares as market conditions warrant. These shares will be purchased in the open market or privately negotiated transactions. No shares were repurchased by the Company in the September 2007 quarter.
-24-
Asset and Liability Management
The Company evaluates the change in its market value of portfolio equity (“MVPE”) to changes in interest rates and seeks to manage these changes to relatively low levels through various risk management techniques. MVPE is defined as the net present value of the cash flows from an institution’s existing assets, liabilities and off-balance sheet instruments. The MVPE is estimated by valuing the Company’s assets, liabilities and off-balance sheet instruments under various interest rate scenarios. The extent to which assets gain or lose value in relation to the gains or losses of liabilities determines the appreciation or depreciation in equity on a market value basis. MVPE analysis is intended to evaluate the impact of immediate and sustained interest rate shifts of the current yield curve upon the market value of the current balance sheet. In general, financial institutions are negatively affected by an increase in interest rates to the extent that interest-bearing liabilities mature or reprice more rapidly than interest-earning assets. This factor causes the income and MVPE of these institutions to increase as rates fall and decrease as interest rates rise.
The Company’s management believes that its asset and liability management strategy, as discussed below, provides it with a competitive advantage over other financial institutions. The Company believes that its ability to hedge its interest rate exposure through the use of various interest rate contracts provides it with the flexibility to acquire loans structured to meet its customer’s preferences and investments that provide attractive net risk-adjusted spreads, regardless of whether the customer’s loan or our investment is fixed-rate or adjustable-rate or short-term or long-term. Similarly, the Company can choose a cost-effective source of funds and subsequently engage in an interest rate swap or other hedging transaction so that the interest rate sensitivities of its interest-earning assets and interest-bearing liabilities are more closely matched.
The Company’s asset and liability management strategy is formulated and monitored by the board of directors of Los Padres Bank. The Board’s written policies and procedures are implemented by the Asset and Liability Committee of Los Padres Bank (“ALCO”), which is comprised of Los Padres Bank’s chief executive officer, president, chief financial officer, chief lending officer, president of the Kansas region/chief commercial lending officer, and four non-employee directors of Los Padres Bank. The ALCO meets at least eight times a year to review the sensitivity of Los Padres Bank’s assets and liabilities to interest rate changes, investment opportunities, the performance of the investment portfolios, and prior purchase and sale activity of securities. The ALCO also provides guidance to management on reducing interest rate risk and on investment strategy and retail pricing and funding decisions with respect to Los Padres Bank’s overall asset and liability composition. The ALCO reviews Los Padres Bank’s liquidity, cash flow needs, interest rate sensitivity of investments, deposits and borrowings, core deposit activity, current market conditions and interest rates on both a local and national level in connection with fulfilling its responsibilities.
The ALCO regularly reviews interest rate risk with respect to the impact of alternative interest rate scenarios on net interest income and on Los Padres Bank’s MVPE. The Asset and Liability Committee also reviews analyses concerning the impact of changing market volatility, prepayment forecast error, and changes in option-adjusted spreads and non-parallel yield curve shifts.
In the absence of hedging activities, the Company’s MVPE would decline as a result of a general increase in market rates of interest. This decline would be due to the market values of the Company’s assets being more sensitive to interest rate fluctuations than are the market values of its liabilities due to its investment in and origination of generally longer-term assets which are funded with shorter-term liabilities. Consequently, the elasticity (i.e.,the change in the market value of an asset or liability as a result of a change in interest rates) of the Company’s assets is greater than the elasticity of its liabilities.
Accordingly, the primary goal of the Company’s asset and liability management policy is to effectively increase the elasticity of its liabilities and/or effectively contract the elasticity of its assets so
-25-
that the respective elasticities are matched as closely as possible. This elasticity adjustment can be accomplished internally, by restructuring the balance sheet, or externally by adjusting the elasticities of assets and/or liabilities through the use of interest rate contracts. The Company’s strategy is to hedge, either internally through the use of longer-term certificates of deposit or less sensitive transaction deposits and FHLB advances, or externally through the use of various interest rate contracts.
External hedging generally involves the use of interest rate swaps, caps, floors, options and futures. The notional amount of interest rate contracts represents the underlying amount on which periodic cash flows are calculated and exchanged between counterparties. However, this notional amount does not necessarily represent the principal amount of securities that would effectively be hedged by that interest rate contract.
In selecting the type and amount of interest rate contract to utilize, the Company compares the elasticity of a particular contract to that of the securities to be hedged. An interest rate contract with the appropriate offsetting elasticity could have a notional amount much greater than the face amount of the securities being hedged.
The Company adopted SFAS No. 133,Accounting for Derivative Instruments and Hedging Activities,on January 1, 2001. SFAS No. 133 as amended, requires that an entity recognize all interest rate contracts as either assets or liabilities in the statement of financial condition and measure those instruments at fair value. If certain conditions are met, an interest rate contract may be specifically designated as a fair value hedge, a cash flow hedge, or a hedge of foreign currency exposure. The accounting for changes in the fair value of an interest rate contract (that is, gains and losses) depends on the intended use of the interest rate contract and the resulting designation. To qualify for hedge accounting, the Company must show that at the inception of the interest rate contracts, and on an ongoing basis, the changes in the fair value of the interest rate contracts are expected to be highly effective in offsetting related changes in the cash flows of the hedged liabilities. The Company has entered into various interest rate swaps for the purpose of hedging certain of its short-term liabilities. These interest rate swaps qualify for hedge accounting. Accordingly, the effective portion of the accumulated change in the fair value of the cash flow hedges is recorded in a separate component of stockholders’ equity, net of tax, while the ineffective portion is recognized in earnings immediately.
The Company has also entered into various total return swaps in an effort to enhance income, where cash flows are based on the level and changes in the yield spread on investment grade commercial mortgage indexes and asset backed referenced securities relative to similar duration LIBOR swap rates. These swaps do not qualify for hedge accounting treatment and are included in the trading account assets and are reported at fair value with realized and unrealized gains and losses on these instruments recognized in income (loss) from trading account assets. During the quarter, HWFG added $70 million in notional amount of AAA rated CMBS TROR swaps with a fair value of $442 thousand at September 30, 2007 as compared to zero at December 31, 2006.
Critical Accounting Policies
Critical accounting policies are discussed within our Form 10-K dated December 31, 2006. There are no changes to these policies as of September 30, 2007.
Cautionary Statement Regarding Forward-Looking Statements.
Certain statements contained in this Form 10-Q, including, without limitation, statements containing the words “believes”, “anticipates”, “intends”, “expects”, and words of similar import, constitute “forward-looking statements” within the meaning of Section 27A of the Securities Act of 1933 and Section 21E of the Securities Exchange Act of 1934. Such forward looking statements involve
-26-
known and unknown risks, uncertainties and other factors that may cause our actual results, performance or achievements to be materially different from any future results, performance or achievements expressed or implied by such forward-looking statements. Such factors include, among others, the following: general economic and business conditions in those areas in which we operate, demographic changes, competition, fluctuations in interest rates, changes in business strategy or development plans, changes in governmental regulation, credit quality, the availability of capital to fund the expansion of our business, economic, political and global changes arising from the war on terrorism, the conflict with Iraq and its aftermath, and other factors referenced in our 2006 Annual Report as filed on form 10-K, including in “Item 1A. Risk Factors.”
Because these forward-looking statements are subject to risks and uncertainties, our actual results may differ materially from those expressed or implied by these statements. You are cautioned not to place undue reliance on our forward-looking statements, which speak only as of the date of this Form 10-Q. Forward-looking statements are not guarantees of performance. They involve risks, uncertainties and assumptions. The future results and stockholder values of our common stock may differ materially from those expressed in these forward-looking statements. Many of the factors that will determine these results and values are beyond our ability to control or predict.
We do not undertake any obligation to release publicly any revisions to any forward-looking statements to reflect events or circumstances after the date of this Form 10-Q or to reflect the occurrence of unanticipated events.
Item 3:Quantitative and Qualitative Disclosures about Market Risk
The OTS requires each thrift institution to calculate the estimated change in the institution’s MVPE assuming an instantaneous, parallel shift in the Treasury yield curve of 100 to 300 basis points either up or down in 100 basis point increments. The OTS permits institutions to perform this MVPE analysis using their own internal model based upon reasonable assumptions.
In estimating the market value of mortgage loans and mortgage-backed securities, the Company utilizes various prepayment assumptions, which vary, in accordance with historical experience, based upon the term, interest rate, prepayment penalties, if applicable, and other factors with respect to the underlying loans. At September 30, 2007, these prepayment assumptions varied from 2.3% to 34.6% for fixed-rate mortgages and mortgage-backed securities and varied from 4.1% to 30.4% for adjustable-rate mortgages and mortgage-backed securities.
The following table sets forth at September 30, 2007, the estimated sensitivity of the Bank’s MVPE to parallel yield curve shifts using the Company’s internal market value calculation which was implemented in the September 2007 quarter. The table demonstrates the sensitivity of the Company’s assets and liabilities both before and after the inclusion of its interest rate contracts.
-27-
| | | | | | | | | | | | | | | | | | | | | | | | | | | | | | | | | |
| | | Change In Interest Rates (In Basis Points) | | | | |
| | | -300 | | -200 | | -100 | | Base | | +100 | | +200 | | +300 | | | | |
| | | |
| Market value gain (loss) in assets | | $ | 40,834 | | | $ | 29,966 | | | $ | 16,461 | | | | | | | $ | (18,215 | ) | | $ | (38,018 | ) | | $ | (58,895 | ) | | | | |
| Market value gain (loss) of liabilities | | | (23,055 | ) | | | (14,495 | ) | | | (7,100 | ) | | | | | | | 6,430 | | | | 13,009 | | | | 20,851 | | | | | |
| | | | | | | | | | | | | | | | | | | | | | | | | | | | | | | | | |
| | | |
| Market value gain (loss) of net assets before interest rate contracts | | | 17,779 | | | | 15,471 | | | | 9,361 | | | | | | | | (11,785 | ) | | | (25,009 | ) | | | (38,044 | ) | | | | |
| | | | | | | | | | | | | | | | | | | | | | | | | | | | | | | | | |
| Market value gain (loss) of interest rate contracts | | | (15,463 | ) | | | (10,072 | ) | | | (4,922 | ) | | | | | | | 4,708 | | | | 9,212 | | | | 13,522 | | | | | |
| | | |
| | | | | | | | | | | | | | | | | | | | | | | | | | | | | | | | | |
| Total change in MVPE (2) | | $ | 2,316 | | | $ | 5,399 | | | $ | 4,439 | | | | | | | $ | (7,077 | ) | | $ | (15,797 | ) | | $ | (24,522 | ) | | | | |
| | | |
| | | | | | | | | | | | | | | | | | | | | | | | | | | | | | | | | |
| Change in MVPE as a percent of: | | | | | | | | | | | | | | | | | | | | | | | | | | | | | | | | |
| MV of total assets of Bank | | | 1.00 | % | | | 2.34 | % | | | 1.92 | % | | | | | | | -3.07 | % | | | -6.85 | % | | | -10.63 | % | | | | |
| Total assets of the Bank | | | -0.34 | % | | | 0.02 | % | | | 0.12 | % | | | | | | | -0.30 | % | | | -0.71 | % | | | -1.12 | % | | | | |
| | |
| (1) | | Assumes an instantaneous parallel change in interest rates at all maturities. |
| |
| (2) | | Based on the Company’s pre-tax tangible MVPE of $91.9 million at September 30, 2007. |
| |
| (3) | | Pre-tax tangible MVPE as a percentage of tangible assets. |
The table set forth above does not purport to show the impact of interest rate changes on the Company’s equity under generally accepted accounting principles. Market value changes only impact the Company’s income statement or the balance sheet to the extent the affected instruments are marked to market, and over the life of the instruments as an impact on recorded yields.
Item 4:Controls and Procedures
As of the end of the period covered by this report the Company carried out an evaluation under the supervision and with the participation of the Company’s management, including the Company’s Chief Executive Officer, Chief Operating Officer and Chief Financial Officer, of the effectiveness of the design and operation of the Company’s disclosure controls and procedures pursuant to Rule 13a-15(b) under the Securities Exchange Act of 1934 (the “Exchange Act”). The evaluation was based on confirmations provided by a number of senior officers. Based upon that evaluation, the Company’s Chief Executive Officer, Chief Operating Officer and Chief Financial Officer concluded that the Company’s disclosure controls and procedures are effective in timely alerting them to material information relating to the Company (including its consolidated subsidiaries) required to be included in the Company’s periodic SEC filings. For the quarter ended September 30, 2007, there have been no significant changes in the Company’s internal controls over financial reporting that have materially affected, or are reasonably likely to materially affect, the Company’s internal control over financial reporting.
Disclosure controls and procedures are Company controls designed to ensure that information required to be disclosed by the Company in the reports that it files or submits under the Exchange Act is recorded, processed, summarized and reported within the time periods specified in the SEC’s rules and forms. Disclosure controls and procedures include, without limitation, controls and procedures designed to ensure that information required to be disclosed by the Company in the reports that it files or submits under the Exchange Act is accumulated and communicated to the Company’s management, including its Chief Executive Officer, Chief Operating Officer and Chief Financial Officer, as appropriate, to allow timely decisions regarding required disclosure. In designing these controls and procedures, management recognizes that they can only provide reasonable assurance of achieving the desired control objectives. Management also evaluated the cost-benefit relationship of possible controls and procedures.
-28-
PART II —OTHER INFORMATION
Item 1:Legal Proceedings
| | | The Company is involved in various legal proceedings occurring in the ordinary course of business, which, in the aggregate, are believed by management to be immaterial to the financial condition and results of operations of the Company. |
Item 1A.Risk Factors
| | | There were no material changes in the third quarter of 2007 to the risk factors discussed in the Company’s 10-K for the year ended December 31, 2006 |
Item 2:Unregistered Sales of Equity Securities and Use of Proceeds
Not Applicable.
Item 3:Defaults Upon Senior Securities
Not applicable.
Item 4:Submission of Matters to a Vote of Security Holders.
None
Item 5:Other Information
Not applicable.
Item 6:Exhibits
| | | |
| EXHIBIT NO. | | DESCRIPTION |
| 31.1 | | Section 302 Certification by Chief Executive Officer filed herewith. |
| | | |
| 31.2 | | Section 302 Certification by Chief Operating Officer filed herewith. |
| | | |
| 31.3 | | Section 302 Certification by Chief Financial Officer filed herewith. |
| | | |
| 32 | | Section 906 Certification by Chief Executive Officer, Chief Operating Officer and Chief Financial Officer furnished herewith. |
-29-
SIGNATURES
Pursuant to the requirements of the Securities Exchange Act of 1934, the Registrant has duly caused this report to be signed on its behalf by the undersigned, thereunto duly authorized.
| | | | | |
| | HARRINGTON WEST FINANCIAL GROUP, INC.
| |
| November 9, 2007 | By: | /s/Craig J. Cerny | |
| | | Craig J. Cerny | |
| | | Chairman of the Board and Chief Executive Officer
(Principal Executive Officer) | |
| |
| | | |
| November 9, 2007 | By: | /s/William W. Phillips, jr. | |
| | | William W. Phillips, Jr. | |
| | | President, Chief Operating Officer
(Principal Executive Officer) | |
| |
| | | |
| November 9, 2007 | By: | /s/Kerril Steele | |
| | | Kerril Steele | |
| | | Sr. Vice-President, Chief Financial Officer
(Principle Financial and Accounting Officer) | |
-30-