UNITED STATES
SECURITIES AND EXCHANGE COMMISSION
Washington, D.C. 20549
FORM N-CSR
CERTIFIED SHAREHOLDER REPORT OF REGISTERED
MANAGEMENT INVESTMENT COMPANIES
Investment Company Act file number: 811-08839
SPDR® SERIES TRUST
(Exact name of registrant as specified in charter)
One Iron Street, Boston, Massachusetts 02210
(Address of principal executive offices) (zip code)
Sean O’Malley, Esq.
Senior Vice President and General Counsel
c/o SSGA Funds Management, Inc.
One Iron Street
Boston, Massachusetts 02210
(Name and address of agent for service)
Copy to:
W. John McGuire, Esq.
Morgan, Lewis & Bockius LLP
1111 Pennsylvania Avenue, NW
Washington, DC 20004
Registrant’s telephone number, including area code: (617) 664-1465
Date of fiscal year end: December 31
Date of reporting period: December 31, 2023
Item 1. Reports to Shareholders.
| (a) | The Reports to Shareholders are attached herewith. |
Annual Report
December 31, 2023
SPDR® Series Trust - Fixed Income Funds
| SPDR Bloomberg Emerging Markets Local Bond ETF |
| SPDR Bloomberg International Corporate Bond ETF |
| SPDR Bloomberg International Treasury Bond ETF |
| SPDR Bloomberg Short Term International Treasury Bond ETF |
| SPDR FTSE International Government Inflation-Protected Bond ETF |
The information contained in this report is intended for the general information of shareholders of the Trust. This report is not authorized for distribution to prospective investors unless preceded or accompanied by a current Trust prospectus which contains important information concerning the Trust. You may obtain a current prospectus and SAI from the Distributor by calling 1-866-787-2257 or visiting https://www.ssga.com/spdrs. Please read the prospectus carefully before you invest.
TABLE OF CONTENTS
The information contained in this report is intended for the general information of shareholders of the Trust. This report is not authorized for distribution to prospective investors unless preceded or accompanied by a current Trust prospectus which contains important information concerning the Trust. You may obtain a current prospectus and SAI from the Distributor by calling 1-866-787-2257 or visiting https://www.ssga.com/spdrs. Please read the prospectus carefully before you invest.
[This Page Intentionally Left Blank]
Notes to Performance Summaries (Unaudited)
The performance chart of a Fund’s total return at net asset value (“NAV”), the total return based on market price and its benchmark index is provided for comparative purposes only and represents the periods noted. A Fund’s per share NAV is the value of one share of a Fund and is calculated by dividing the value of total assets less total liabilities by the number of shares outstanding. The NAV return is based on the NAV of a Fund and the market return is based on the market price per share of a Fund. The market price used to calculate the market return is determined by using the midpoint between the highest bid and the lowest offer on the exchange on which the shares of a Fund are listed for trading, as of the time that a Fund’s NAV is calculated. NAV and market returns assume that dividends and capital gain distributions have been reinvested in a Fund at NAV. Market returns do not include brokerage commissions that may be payable on secondary market transactions. If brokerage commissions were included market returns would be lower.
An index is a statistical measure of a specified financial market or sector. An index does not actually hold a portfolio of securities and therefore does not reflect deductions for fees or expenses. In comparison, a Fund’s performance is negatively impacted by these deductions. Index returns reflect all items of income, gain and loss and the reinvestment of dividends and other income.
The Bloomberg EM Local Currency Government Diversified Index is designed to measure the performance of the fixed-rate local currency sovereign debt of emerging market countries. The index includes government bonds issued by investment grade and non-investment grade countries outside the United States, in local currencies, that have a remaining maturity of one year or more and are rated B3/B-/B- or higher using the middle rating of Moody’s Investors Service, Inc., S&P Global Ratings and Fitch Ratings, Inc. respectively.
The Bloomberg Global Aggregate ex-USD >$1B: Corporate Bond Index is designed to be a broad based measure of the global investment-grade, fixed rate, fixed income corporate markets outside the United States. The index is part of the Bloomberg Global ex-USD Aggregate Bond Index (the “Aggregate Index”). The major components of the Aggregate Index are the Pan-European Aggregate and the Asian Pacific Aggregate Indices. The securities in the index must have a $1 billion USD equivalent market capitalization outstanding and at least 1 year remaining. Securities must be fixed rate, although zero coupon bonds and step-ups are permitted. Additionally, securities must be rated investmen grade (Baa3/BBB-/BBB- or better) using the middle rating from Moody’s Investors Service, Inc., S&P Global Ratings and Fitch Ratings, Inc. after dropping the highest and lowest available ratings. If only two agencies rate a security, then the more conservative (lower) rating will be used. If only one rating agency rates a security, then that one rating will be used. Excluded from the index are subordinated debts, convertible securities, floating-rate notes, fixed-rate perpetuals, warrants, inflation-linked bonds and structured notes. The index is market capitalization weighted and the securities in the index are updated on the last business day of each month.
The Bloomberg Global Treasury ex-US Capped Index is designed to track the fixed-rate local currency sovereign debt of investment grade countries outside the United States. The index includes government bonds issued by investment grade countries outside the United States, in local currencies, that have a remaining maturity of one year or more and are rated investment grade (Baa3/BBB-/BBB-or higher using the middle rating of Moody’s Investors Service, Inc., S&P Global Ratings and Fitch Ratings, Inc. respectively). The index is calculated by Bloomberg Index Services Limited using a modified “market capitalization” methodology. This design ensures that each constituent country within the index is represented in a proportion consistent with its percentage with respect to the total market capitalization of the index. The index is rebalanced on a monthly basis.
The Bloomberg 1-3 Year Global Treasury ex-US Capped Index is designed to measure the performance of fixed-rate local currency sovereign debt of investment grade countries outside the United States that have remaining maturities of one to three years. The index includes government bonds issued by investment grade countries outside the United States, in local currencies, that have remaining maturities of one to three years and are rated investment grade (Baa3/BBB-/BBB- or higher using the middle rating of Moody’s Investors Service, Inc., S&P Global Ratings and Fitch Ratings, Inc. respectively). The securities in the index must be fixed-rate and have certain minimum amounts outstanding, depending upon the currency in which the bonds are denominated. The index is calculated by Bloomberg Index Services Limited using a modified “market capitalization” methodology. This design ensures that each constituent country within the index is represented in a proportion consistent with its percentage with respect to the total market capitalization of the index. Component securities in each constituent country are represented in a proportion consistent with their percentage relative to the other component securities in the constituent country. The securities in the index are updated monthly, on the last business day of each month.
The FTSE International Inflation-Linked Securities Select Index is designed to measure the total return performance of inflation-linked bonds outside the United States with fixed-rate coupon payments that are linked to an inflation index. Inflation-protected public obligations of the inflation-linked government bond markets of developed and emerging market countries, commonly known in the United States as TIPS, are securities issued by such governments that are designed to provide inflation protection to investors. The index includes government debt (direct obligations of the issuer country) but does not include quasi-government debt or corporate debt.
See accompanying notes to financial statements.
1
SPDR BLOOMBERG EMERGING MARKETS LOCAL BOND ETF
MANAGEMENT’S DISCUSSION OF FUND PERFORMANCE (UNAUDITED)
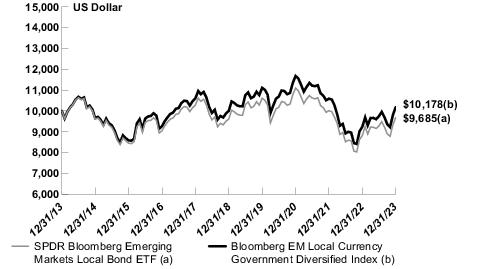
The SPDR Bloomberg Emerging Markets Local Bond ETF (the “Fund”) seeks to provide investment results that, before fees and expenses, correspond generally to the price and yield performance of an index that tracks the fixed-rate local currency sovereign debt of emerging market countries. The Fund’s benchmark is the Bloomberg EM Local Currency Government Diversified Index (the “Index”).
For the 12-month period ended December 31, 2023 (the “Reporting Period”), the total return for the Fund was 9.79%, and the Index was 10.14%. The Fund and Index returns reflect the reinvestment of dividends and other income. The Fund’s performance reflects the expenses of managing the Fund, including brokerage and advisory expenses. The Index is unmanaged and Index returns do not reflect fees and expenses of any kind, which would have a negative impact on returns. Fees, expenses, cash drag, tax withholdings, and sampling contributed to the difference between the Fund’s performance and that of the index.
Global concerns around heightened inflation, changes in central bank policies, and March’s banking crisis were primary drivers of Fund performance during the Reporting Period. The Fund performed in line with expectations.
Global markets experienced heightened volatility in March after a number of U.S. regional banks as well as Credit Suisse were downgraded by ratings agencies and ultimately either failed or were bought by other large banks. The incident sent shockwaves through global markets as investors feared contagion into other sectors of the global economy. Ultimately, the contagion story did not play out, and market volatility was calmed as early as April.
In order to reign in persistent inflation and overheated economies across the globe, countries’ central banks began an about-face on previous easy monetary policy in 2022, with many embarking on aggressive rate hiking cycles. The European Central bank and Bank of England raised interest rates by a total of 4.50% and 5.00% respectively over the past two years. The hawkish pivot of global central banks roiled sovereign markets and sent yields soaring, leading to negative returns within the sector during the first half of 2023. By the second half of the year, and especially in the fourth quarter, global tightening seemed to finally take effect on cooling inflation, and major central banks paused their rate hiking. With the end of heightened inflation in sight for many economies, markets are now pricing in hikes for 2024. This change in sentiment led to a global bond rally in the fourth quarter, with the Fund posting its strongest returns during the Reporting Period.
The Fund uses forwards to manage currency exposure, particularly when there are flows around month-end, and for currency exposure purposes during market holidays and in the event of challenging liquidity in bond markets.
The views expressed above reflect those of the Fund’s portfolio manager only through the Reporting Period, and do not necessarily represent the views of the Adviser as a whole. Any such views are subject to change at any time based upon market or other conditions and the Adviser disclaims any responsibility to update such views. These views may not be relied on as investment advice and, because investment decisions for a fund are based on numerous factors, may not be relied on as an indication of trading intent on behalf of any fund.
See accompanying notes to financial statements.
2
SPDR Bloomberg Emerging Markets Local Bond ETF
Performance Summary (Unaudited)
Performance as of December 31, 2023
| | Cumulative Total Return | | Average Annual Total Return |
| | Net
Asset
Value | Market
Value | Bloomberg EM Local Currency Government Diversified Index | | Net
Asset
Value | Market
Value | Bloomberg EM Local Currency Government Diversified Index |
| ONE YEAR | 9.79% | 9.07% | 10.14% | | 9.79% | 9.07% | 10.14% |
| FIVE YEARS | 0.85% | 0.20% | 1.79% | | 0.17% | 0.04% | 0.36% |
| TEN YEARS | (3.15)% | (4.14)% | 1.78% | | (0.32)% | (0.42)% | 0.18% |
Comparison of Change in Value of a $10,000 Investment
(Based on Net Asset Value)
Line graph is based on cumulative total return.
The total expense ratio for SPDR Bloomberg Emerging Markets Local Bond ETF as stated in the Fees and Expenses table of the most recent prospectus is 0.30%. Please see the financial highlights for the total expense ratio for the fiscal period ended December 31, 2023.
Performance quoted represents past performance, which is no guarantee of future results. Investment return and principal value will fluctuate, so you may have a gain or loss when shares are sold. Current performance may be higher or lower than that quoted. Visit https://www.ssga.com/spdrs for most recent month-end performance. The returns do not reflect the deduction of taxes that a shareholder would pay on Fund distributions or on the redemption or sale of Fund shares. See "Notes to Performance Summaries" on page 1 for more information.
See accompanying notes to financial statements.
3
SPDR Bloomberg Emerging Markets Local Bond ETF
Portfolio Statistics (Unaudited)
Top Five Holdings as of December 31, 2023
| | | |
| | Description | % of Net Assets | |
| | Brazil Letras do Tesouro Nacional
Zero Coupon, 7/1/2026 | 0.9% | |
| | Brazil Notas do Tesouro Nacional
10.00% 1/1/2025 | 0.9 | |
| | Mexico Bonos
5.75% 3/5/2026 | 0.9 | |
| | Mexico Bonos
7.75% 5/29/2031 | 0.9 | |
| | Brazil Letras do Tesouro Nacional
Zero Coupon, 1/1/2026 | 0.8 | |
| | TOTAL | 4.4% | |
(The five largest holdings are subject to change, and there are no guarantees the Fund will continue to remain invested in any particular company.)
Asset Allocation as of December 31, 2023
| | | |
| | | % of Net Assets | |
| | Foreign Government Obligations | 97.8% | |
| | Short-Term Investments | 1.9 | |
| | Other Assets in Excess of Liabilities | 0.3 | |
| | TOTAL | 100.0% | |
Top Ten Countries as of December 31, 2023
| | | |
| | Description | % of Total Investments | |
| | South Korea | 12.6% | |
| | China | 12.4 | |
| | Indonesia | 7.3 | |
| | Brazil | 6.8 | |
| | Mexico | 6.7 | |
| | Thailand | 4.6 | |
| | Czech Republic | 4.5 | |
| | Philippines | 4.5 | |
| | South Africa | 4.4 | |
| | Poland | 4.4 | |
| | TOTAL | 68.2% | |
(The Fund's asset allocation and sector breakdown are expressed as a percentage of net assets and total investments, respectively, and may change over time.)
See accompanying notes to financial statements.
4
SPDR BLOOMBERG INTERNATIONAL CORPORATE BOND ETF
MANAGEMENT'S DISCUSSION OF FUND PERFORMANCE (UNAUDITED)
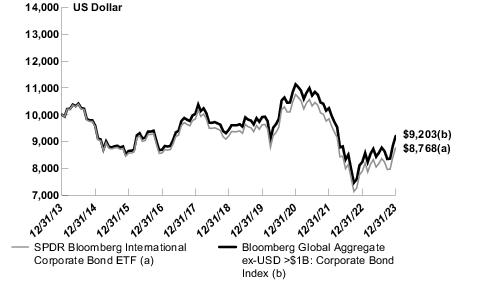
The SPDR Bloomberg International Corporate Bond ETF (the “Fund”) seeks to provide investment results that, before fees and expenses, correspond generally to the price and yield performance of an index that tracks the investment grade corporate sector of the global bond market outside of the united States. The Fund’s benchmark is the Bloomberg Global Aggregate ex-USD >$1B: Corporate Bond Index (the “Index”).
For the 12-month period ended December 31, 2023 (the “Reporting Period”), the total return for the Fund was 11.13%, and the Index was 11.75%. The Fund and Index returns reflect the reinvestment of dividends and other income. The Fund’s performance reflects the expenses of managing the Fund, including brokerage and advisory expenses. The Index is unmanaged and Index returns do not reflect fees and expenses of any kind, which would have a negative impact on returns. Fees and expenses, cash drag, the cumulative effect of security misweights, and tax withholdings contributed to the difference between the Fund’s performance and that of the Index.
Global concerns around heightened inflation, changes in central bank policies, and the March banking crisis were primary drivers of Fund performance during the Reporting Period. The Fund performed in line with expectations.
Global markets experienced heightened volatility in March after a number of U.S. regional banks as well as Credit Suisse were downgraded by ratings agencies and ultimately either failed or were bought by other large banks. The incident sent shockwaves through global markets as investors feared contagion into other sectors of the global economy and corporate bond performance suffered as investors fled to safe-haven assets. Ultimately, the contagion story did not play out, and market volatility was calmed as early as April.
In order to reign in persistent inflation and overheated economies across the globe, countries’ central banks began an about-face on previous easy monetary policy in 2022, with many embarking on aggressive rate hiking cycles. The European Central bank and Bank of England raised interest rates by a total of 4.50% and 5.00% respectively over the past two years. The hawkish pivot of global central banks roiled sovereign markets and sent yields soaring, leading to negative returns within the sector during the first half of 2023. By the second half of the year, and especially in the fourth quarter, global tightening seemed to finally take effect on cooling inflation, and major central banks paused their rate hiking. With the end of heightened inflation in sight for many economies, markets are now pricing in hikes for 2024. This change in sentiment led to a global bond rally in the fourth quarter, with the Fund posting its strongest returns during the Reporting Period.
The Fund did not invest in derivatives during the Reporting Period.
The views expressed above reflect those of the Fund’s portfolio manager only through the Reporting Period, and do not necessarily represent the views of the Adviser as a whole. Any such views are subject to change at any time based upon market or other conditions and the Adviser disclaims any responsibility to update such views. These views may not be relied on as investment advice and, because investment decisions for a fund are based on numerous factors, may not be relied on as an indication of trading intent on behalf of any fund.
See accompanying notes to financial statements.
5
SPDR Bloomberg International Corporate Bond ETF
Performance Summary (Unaudited)
Performance as of December 31, 2023
| | Cumulative Total Return | | Average Annual Total Return |
| | Net
Asset
Value | Market
Value | Bloomberg Global Aggregate ex-USD >$1B: Corporate Bond Index | | Net
Asset
Value | Market
Value | Bloomberg Global Aggregate ex-USD >$1B: Corporate Bond Index |
| ONE YEAR | 11.13% | 10.74% | 11.75% | | 11.13% | 10.74% | 11.75% |
| FIVE YEARS | (4.76)% | (4.90)% | (2.46)% | | (0.97)% | (1.00)% | (0.50)% |
| TEN YEARS | (12.32)% | (12.27)% | (7.97)% | | (1.31)% | (1.30)% | (0.83)% |
Comparison of Change in Value of a $10,000 Investment
(Based on Net Asset Value)
Line graph is based on cumulative total return.
The total expense ratio for SPDR Bloomberg International Corporate Bond ETF as stated in the Fees and Expenses table of the most recent prospectus is 0.50%. Please see the financial highlights for the total expense ratio for the fiscal period ended December 31, 2023.
Performance quoted represents past performance, which is no guarantee of future results. Investment return and principal value will fluctuate, so you may have a gain or loss when shares are sold. Current performance may be higher or lower than that quoted. Visit https://www.ssga.com/spdrs for most recent month-end performance. The returns do not reflect the deduction of taxes that a shareholder would pay on Fund distributions or on the redemption or sale of Fund shares. See "Notes to Performance Summaries" on page 1 for more information.
See accompanying notes to financial statements.
6
SPDR Bloomberg International Corporate Bond ETF
Portfolio Statistics (Unaudited)
Top Five Holdings as of December 31, 2023
| | | |
| | Description | % of Net Assets | |
| | Morgan Stanley
4.66% 3/2/2029 | 0.4% | |
| | Seven & i Holdings Co. Ltd.
0.19% 12/19/2025 | 0.3 | |
| | NTT Finance Corp.
0.84% 6/20/2033 | 0.3 | |
| | NTT Finance Corp.
0.38% 9/20/2030 | 0.3 | |
| | Credit Agricole SA
3.88% 4/20/2031 | 0.3 | |
| | TOTAL | 1.6% | |
(The five largest holdings are subject to change, and there are no guarantees the Fund will continue to remain invested in any particular company.)
Asset Allocation as of December 31, 2023
| | | |
| | | % of Net Assets | |
| | Corporate Bonds & Notes | 98.3% | |
| | Short-Term Investments | 4.1 | |
| | Liabilities in Excess of Other Assets | (2.4) | |
| | TOTAL | 100.0% | |
See accompanying notes to financial statements.
7
SPDR BLOOMBERG INTERNATIONAL TREASURY BOND ETF
MANAGEMENT’S DISCUSSION OF FUND PERFORMANCE (UNAUDITED)
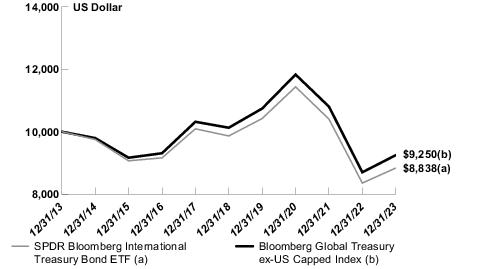
SPDR Bloomberg International Treasury Bond ETF (the “Fund”) seeks to provide investment results that, before fees and expenses, correspond generally to the price and yield performance of an index that tracks the fixed-rate local currency sovereign debt of investment grade countries outside the united States. The Fund’s benchmark is the Bloomberg Global Treasury ex-US Capped Index (the “Index”).
For the 12-month period ended December 31, 2023 (the “Reporting Period”), the total return for the Fund was 5.73%, and the Index was 6.25%. The Fund and Index returns reflect the reinvestment of dividends and other income. The Fund’s performance reflects the expenses of managing the Fund, including brokerage and advisory expenses. The Index is unmanaged and Index returns do not reflect fees and expenses of any kind, which would have a negative impact on returns. Fees and expenses, cash drag, the cumulative effect of security misweights, and tax withholdings contributed to the difference between the Fund’s performance and that of the Index.
Global concerns around heightened inflation and changes in central bank policies were primary drivers of Fund performance during the Reporting Period. The Fund performed in line with expectations.
In order to reign in persistent inflation and overheated economies across the globe, countries’ central banks began an about-face on previous easy monetary policy in 2022, with many embarking on aggressive rate hiking cycles. The European Central bank and Bank of England raised interest rates by a total of 4.50% and 5.00% respectively over the past two years. The hawkish pivot of global central banks roiled sovereign markets and sent yields soaring, leading to negative returns within the sector during the first half of 2023. By the second half of the year, and especially in the fourth quarter, global tightening seemed to finally take effect on cooling inflation, and major central banks paused their rate hiking. With the end of heightened inflation in sight for many economies, markets are now pricing in hikes for 2024. This change in sentiment led to a global bond rally in the fourth quarter, with the Fund posting its strongest returns during the Reporting Period.
The Fund did not invest in derivatives during the Reporting Period.
The views expressed above reflect those of the Fund’s portfolio manager only through the Reporting Period, and do not necessarily represent the views of the Adviser as a whole. Any such views are subject to change at any time based upon market or other conditions and the Adviser disclaims any responsibility to update such views. These views may not be relied on as investment advice and, because investment decisions for a fund are based on numerous factors, may not be relied on as an indication of trading intent on behalf of any fund.
See accompanying notes to financial statements.
8
SPDR Bloomberg International Treasury Bond ETF
Performance Summary (Unaudited)
Performance as of December 31, 2023
| | Cumulative Total Return | | Average Annual Total Return |
| | Net
Asset
Value | Market
Value | Bloomberg Global Treasury ex-US Capped Index | | Net
Asset
Value | Market
Value | Bloomberg Global Treasury ex-US Capped Index |
| ONE YEAR | 5.73% | 5.10% | 6.25% | | 5.73% | 5.10% | 6.25% |
| FIVE YEARS | (10.41)% | (10.83)% | (8.71)% | | (2.18)% | (2.27)% | (1.81)% |
| TEN YEARS | (11.62)% | (11.93)% | (7.50)% | | (1.23)% | (1.26)% | (0.78)% |
Comparison of Change in Value of a $10,000 Investment
(Based on Net Asset Value)
Line graph is based on cumulative total return.
The total expense ratio for SPDR Bloomberg International Treasury Bond ETF as stated in the Fees and Expenses table of the most recent prospectus is 0.35%. Please see the financial highlights for the total expense ratio for the fiscal period ended December 31, 2023.
Performance quoted represents past performance, which is no guarantee of future results. Investment return and principal value will fluctuate, so you may have a gain or loss when shares are sold. Current performance may be higher or lower than that quoted. Visit https://www.ssga.com/spdrs for most recent month-end performance. The returns do not reflect the deduction of taxes that a shareholder would pay on Fund distributions or on the redemption or sale of Fund shares. See "Notes to Performance Summaries" on page 1 for more information.
See accompanying notes to financial statements.
9
SPDR Bloomberg International Treasury Bond ETF
Portfolio Statistics (Unaudited)
Top Five Holdings as of December 31, 2023
| | | |
| | Description | % of Net Assets | |
| | China Government Bonds
4.08% 10/22/2048 | 0.4% | |
| | Korea Treasury Bonds
5.50% 3/10/2028 | 0.4 | |
| | Japan Government Ten Year Bonds
0.40% 6/20/2033 | 0.3 | |
| | Japan Government Ten Year Bonds
0.10% 12/20/2030 | 0.3 | |
| | Kingdom of Belgium Government Bonds
5.00% 3/28/2035 | 0.3 | |
| | TOTAL | 1.7% | |
(The five largest holdings are subject to change, and there are no guarantees the Fund will continue to remain invested in any particular company.)
Asset Allocation as of December 31, 2023
| | | |
| | | % of Net Assets | |
| | Foreign Government Obligations | 99.1% | |
| | Short-Term Investment | 3.0 | |
| | Liabilities in Excess of Other Assets | (2.1) | |
| | TOTAL | 100.0% | |
Top Ten Countries as of December 31, 2023
| | | |
| | Description | % of Total Investments | |
| | Japan | 22.7% | |
| | France | 4.8 | |
| | United Kingdom | 4.8 | |
| | South Korea | 4.6 | |
| | Australia | 4.5 | |
| | Canada | 4.5 | |
| | China | 4.5 | |
| | Italy | 4.4 | |
| | Germany | 4.4 | |
| | Spain | 4.4 | |
| | TOTAL | 63.6% | |
(The Fund's asset allocation and top ten countries are expressed as a percentage of net assets and total investments, respectively, and may change over time.)
See accompanying notes to financial statements.
10
SPDR BLOOMBERG SHORT TERM INTERNATIONAL TREASURY BOND ETF
MANAGEMENT’S DISCUSSION OF FUND PERFORMANCE (UNAUDITED)
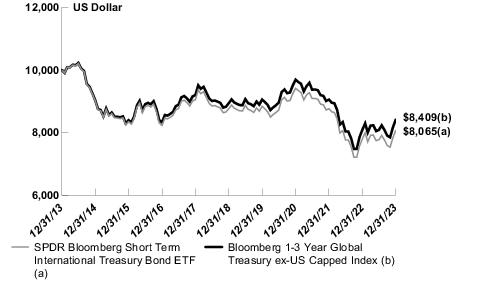
The SPDR Bloomberg Short Term International Treasury Bond ETF (the “Fund”) seeks to provide investment results that, before fees and expenses, correspond generally to the price and yield performance of an index that tracks the short-term (1-3 year remaining maturity) fixed rate, investment grade debt issued by foreign governments of investment grade countries. The Fund’s benchmark is the Bloomberg 1-3 Year Global Treasury ex-US Capped Index (the “Index”).
For the 12-month period ended December 31, 2023 (the “Reporting Period”), the total return for the Fund was 3.49%, and the Index was 4.01%. The Fund and Index returns reflect the reinvestment of dividends and other income. The Fund’s performance reflects the expenses of managing the Fund, including brokerage and advisory expenses. The Index is unmanaged and Index returns do not reflect fees and expenses of any kind, which would have a negative impact on returns. Fees and expenses, cash drag, the cumulative effect of security misweights, and tax withholdings contributed to the difference between the Fund’s performance and that of the Index.
Global concerns around heightened inflation and changes in central bank policies were primary drivers of Fund performance during the Reporting Period. The Fund performed in line with expectations.
In order to reign in persistent inflation and overheated economies across the globe, countries’ central banks began an about-face on previous easy monetary policy in 2022, with many embarking on aggressive rate hiking cycles. The European Central bank and Bank of England raised interest rates by a total of 4.50% and 5.00% respectively over the past two years. The hawkish pivot of global central banks roiled sovereign markets and sent yields soaring, leading to negative returns within the sector during the first half of 2023. By the second half of the year, and especially in the fourth quarter, global tightening seemed to finally take effect on cooling inflation, and major central banks paused their rate hiking. With the end of heightened inflation in sight for many economies, markets are now pricing in hikes for 2024. This change in sentiment led to a global bond rally in the fourth quarter, with the Fund posting its strongest returns during the Reporting Period.
The Fund did not invest in derivatives during the Reporting Period.
The views expressed above reflect those of the Fund’s portfolio manager only through the Reporting Period, and do not necessarily represent the views of the Adviser as a whole. Any such views are subject to change at any time based upon market or other conditions and the Adviser disclaims any responsibility to update such views. These views may not be relied on as investment advice and, because investment decisions for a fund are based on numerous factors, may not be relied on as an indication of trading intent on behalf of any fund.
See accompanying notes to financial statements.
11
SPDR Bloomberg Short Term International Treasury Bond ETF
Performance Summary (Unaudited)
Performance as of December 31, 2023
| | Cumulative Total Return | | Average Annual Total Return |
| | Net
Asset
Value | Market
Value | Bloomberg 1-3 Year Global Treasury ex-US Capped Index | | Net
Asset
Value | Market
Value | Bloomberg 1-3 Year Global Treasury ex-US Capped Index |
| ONE YEAR | 3.49% | 2.99% | 4.01% | | 3.49% | 2.99% | 4.01% |
| FIVE YEARS | (7.96)% | (7.79)% | (5.89)% | | (1.64)% | (1.61)% | (1.21)% |
| TEN YEARS | (19.35)% | (19.30)% | (15.91)% | | (2.13)% | (2.12)% | (1.72)% |
Comparison of Change in Value of a $10,000 Investment
(Based on Net Asset Value)
Line graph is based on cumulative total return.
The total expense ratio for SPDR Bloomberg Short Term International Treasury Bond ETF as stated in the Fees and Expenses table of the most recent prospectus is 0.35%. Please see the financial highlights for the total expense ratio for the fiscal period ended December 31, 2023.
Performance quoted represents past performance, which is no guarantee of future results. Investment return and principal value will fluctuate, so you may have a gain or loss when shares are sold. Current performance may be higher or lower than that quoted. Visit https://www.ssga.com/spdrs for most recent month-end performance. The returns do not reflect the deduction of taxes that a shareholder would pay on Fund distributions or on the redemption or sale of Fund shares. See "Notes to Performance Summaries" on page 1 for more information.
See accompanying notes to financial statements.
12
SPDR Bloomberg Short Term International Treasury Bond ETF
Portfolio Statistics (Unaudited)
Top Five Holdings as of December 31, 2023
| | | |
| | Description | % of Net Assets | |
| | Japan Government Five Year Bonds
0.10% 12/20/2025 | 2.1% | |
| | Japan Government Five Year Bonds
0.10% 3/20/2025 | 2.1 | |
| | Japan Government Five Year Bonds
0.10% 6/20/2025 | 1.5 | |
| | Mexico Bonos
5.75% 3/5/2026 | 1.5 | |
| | Japan Government Ten Year Bonds
0.10% 6/20/2026 | 1.5 | |
| | TOTAL | 8.7% | |
(The five largest holdings are subject to change, and there are no guarantees the Fund will continue to remain invested in any particular company.)
Asset Allocation as of December 31, 2023
| | | |
| | | % of Net Assets | |
| | Foreign Government Obligations | 98.9% | |
| | Short-Term Investment | 0.0 * | |
| | Other Assets in Excess of Liabilities | 1.1 | |
| | TOTAL | 100.0% | |
| * | Amount shown represents less than 0.05% of net assets. |
Top Ten Countries as of December 31, 2023
| | | |
| | Description | % of Total Investments | |
| | Japan | 23.5% | |
| | France | 5.3 | |
| | Italy | 4.9 | |
| | South Korea | 4.7 | |
| | Germany | 4.7 | |
| | Canada | 4.6 | |
| | Spain | 4.6 | |
| | United Kingdom | 4.6 | |
| | China | 4.6 | |
| | Australia | 4.5 | |
| | TOTAL | 66.0% | |
(The Fund's asset allocation and top ten countries are expressed as a percentage of net assets and total investments, respectively, and may change over time.)
See accompanying notes to financial statements.
13
SPDR FTSE INTERNATIONAL GOVERNMENT INFLATION-PROTECTION BOND ETF
MANAGEMENT’S DISCUSSION OF FUND PERFORMANCE (UNAUDITED)
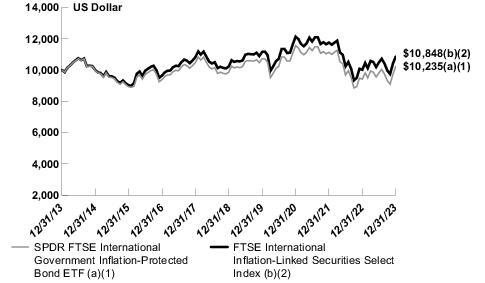
The SPDR FTSE International Government Inflation-Protected Bond ETF (the “Fund”) seeks to provide investment results that, before fees and expenses, correspond generally to the price and yield performance of an index that tracks the inflation protected sector of the global bond market outside the United States. The Fund’s benchmark is the FTSE International Inflation-Linked Securities Select Index (the “Index”).
For the 12-month period ended December 31, 2023 (the “Reporting Period”), the total return for the Fund was 8.74%, and the Index was 9.51%. The Fund and Index returns reflect the reinvestment of dividends and other income. The Fund’s performance reflects the expenses of managing the Fund, including brokerage and advisory expenses. The Index is unmanaged and Index returns do not reflect fees and expenses of any kind, which would have a negative impact on returns. Fees, expenses, cash drag, tax withholdings, and sampling contributed to the difference between the Fund’s performance and that of the index.
Global concerns around heightened inflation, changes in central bank policies, and the March banking crisis were primary drivers of Fund performance during the Reporting Period. The Fund performed in line with expectations.
Global markets experienced heightened volatility in March after a number of U.S. regional banks as well as Credit Suisse were downgraded by ratings agencies and ultimately either failed or were bought by other large banks. The incident sent shockwaves through global markets as investors feared contagion into other sectors of the global economy. Ultimately, the contagion story did not play out, and market volatility was calmed as early as April.
In order to reign in persistent inflation and overheated economies across the globe, countries’ central banks began an about-face on previous easy monetary policy in 2022, with many embarking on aggressive rate hiking cycles. The European Central bank and Bank of England raised interest rates by a total of 4.50% and 5.00% respectively over the past two years. The hawkish pivot of global central banks roiled sovereign markets and sent yields soaring, leading to negative returns within the sector during the first half of 2023. By the second half of the year, and especially in the fourth quarter, global tightening seemed to finally take effect on cooling inflation, and major central banks paused their rate hiking. With the end of heightened inflation in sight for many economies, markets are now pricing in hikes for 2024. This change in sentiment led to a global bond rally in the fourth quarter, with the Fund posting its strongest returns during the period.
The Fund did not invest in derivatives during the Reporting Period.
The views expressed above reflect those of the Fund’s portfolio manager only through the Reporting Period, and do not necessarily represent the views of the Adviser as a whole. Any such views are subject to change at any time based upon market or other conditions and the Adviser disclaims any responsibility to update such views. These views may not be relied on as investment advice and, because investment decisions for a fund are based on numerous factors, may not be relied on as an indication of trading intent on behalf of any fund.
See accompanying notes to financial statements.
14
SPDR FTSE International Government Inflation-Protected Bond ETF
Performance Summary (Unaudited)
Performance as of December 31, 2023
| | Cumulative Total Return | | Average Annual Total Return |
| | Net
Asset
Value | Market
Value | FTSE International Inflation-Linked Securities Select Index | | Net
Asset
Value | Market
Value | FTSE International Inflation-Linked Securities Select Index |
| ONE YEAR | 8.74% | 8.83% | 9.51% | | 8.74% | 8.83% | 9.51% |
| FIVE YEARS(1) (2) | 3.84% | 3.73% | 7.33% | | 0.76% | 0.73% | 1.42% |
| TEN YEARS(1) (2) | 2.35% | 2.65% | 8.48% | | 0.23% | 0.26% | 0.82% |
| (1) | Effective February 15, 2016, the Fund changed its benchmark index from the DB Global Government ex-US Inflation-Linked Securities Select Index. The Fund's performance in the tables is based on the Fund's prior investment strategy to track a different benchmark index for periods prior to February 15, 2016. |
| (2) | The FTSE International Inflation-Linked Securities Select Index (formerly, Citi International Inflation-Linked Securities Select Index) inception date is January 15, 2016. Index returns in the line graph below represent the Fund’s prior benchmark index from December 31, 2009 through February 14, 2016 and the FTSE International Inflation-Linked Securities Select Index (formerly, Citi International Inflation-Linked Securities Select Index from February 15, 2016 through December 31, 2023. |
Comparison of Change in Value of a $10,000 Investment
(Based on Net Asset Value)
Line graph is based on cumulative total return.
The total expense ratio for SPDR FTSE International Government Inflation-Protected Bond ETF as stated in the Fees and Expenses table of the most recent prospectus is 0.50%. Please see the financial highlights for the total expense ratio for the fiscal period ended December 31, 2023.
Performance quoted represents past performance, which is no guarantee of future results. Investment return and principal value will fluctuate, so you may have a gain or loss when shares are sold. Current performance may be higher or lower than that quoted. Visit https://www.ssga.com/spdrs for most recent month-end performance. The returns do not reflect the deduction of taxes that a shareholder would pay on Fund distributions or on the redemption or sale of Fund shares. See "Notes to Performance Summaries" on page 1 for more information.
See accompanying notes to financial statements.
15
SPDR FTSE International Government Inflation-Protected Bond ETF
Portfolio Statistics (Unaudited)
Top Five Holdings as of December 31, 2023
| | | |
| | Description | % of Net Assets | |
| | Spain Government Bonds Inflation-Linked
0.70% 11/30/2033 | 1.8% | |
| | Deutsche Bundesrepublik Bonds Inflation-Linked
0.50% 4/15/2030 | 1.5 | |
| | Turkiye Government Bonds
1.50% 6/18/2025 | 1.5 | |
| | Spain Government Bonds Inflation-Linked
1.00% 11/30/2030 | 1.3 | |
| | Deutsche Bundesrepublik Bonds Inflation-Linked
0.10% 4/15/2026 | 1.3 | |
| | TOTAL | 7.4% | |
(The five largest holdings are subject to change, and there are no guarantees the Fund will continue to remain invested in any particular company.)
Asset Allocation as of December 31, 2023
| | | |
| | | % of Net Assets | |
| | Foreign Government Obligations | 99.3% | |
| | Short-Term Investment | 0.0 * | |
| | Other Assets in Excess of Liabilities | 0.7 | |
| | TOTAL | 100.0% | |
| * | Amount shown represents less than 0.05% of net assets. |
Top Ten Countries as of December 31, 2023
| | | |
| | Description | % of Total Investments | |
| | United Kingdom | 18.8% | |
| | Brazil | 8.7 | |
| | France | 7.8 | |
| | Colombia | 4.7 | |
| | Australia | 4.7 | |
| | Mexico | 4.7 | |
| | Italy | 4.7 | |
| | Sweden | 4.7 | |
| | Canada | 4.6 | |
| | Japan | 4.6 | |
| | TOTAL | 68.0% | |
(The Fund's asset allocation and top ten countries are expressed as a percentage of net assets and total investments, respectively, and may change over time.)
See accompanying notes to financial statements.
16
SPDR BLOOMBERG EMERGING MARKETS LOCAL BOND ETF
SCHEDULE OF INVESTMENTS
December 31, 2023
| Security Description | | | Principal
Amount | | Value |
| FOREIGN GOVERNMENT OBLIGATIONS — 97.8% | | | |
| BRAZIL — 6.8% | | | |
| Brazil Government International Bonds: | | | | | |
8.50%, 1/5/2024
| | BRL | 350,000 | | $ 71,932 |
10.25%, 1/10/2028
| | BRL | 1,000,000 | | 208,097 |
| Brazil Letras do Tesouro Nacional: | | | | | |
Series LTN, Zero Coupon, 10/1/2024
| | BRL | 17,000,000 | | 3,250,980 |
Series LTN, Zero Coupon, 1/1/2025
| | BRL | 58,400,000 | | 10,923,659 |
Series LTN, Zero Coupon, 4/1/2025
| | BRL | 65,000,000 | | 11,912,545 |
Zero Coupon, 7/1/2025
| | BRL | 29,500,000 | | 5,287,032 |
Series LTN, Zero Coupon, 1/1/2026
| | BRL | 93,000,000 | | 15,906,974 |
Series LTN, Zero Coupon, 7/1/2026
| | BRL | 112,000,000 | | 18,279,891 |
Series LTN, Zero Coupon, 7/1/2027
| | BRL | 55,000,000 | | 8,135,530 |
| Brazil Notas do Tesouro Nacional: | | | | | |
Series NTNF, 10.00%, 1/1/2025
| | BRL | 85,950,000 | | 17,706,310 |
Series NTNF, 10.00%, 1/1/2027
| | BRL | 74,875,000 | | 15,477,085 |
Series NTNF, 10.00%, 1/1/2029
| | BRL | 70,890,000 | | 14,551,214 |
Series NTNF, 10.00%, 1/1/2031
| | BRL | 21,000,000 | | 4,273,018 |
Series NTNF, 10.00%, 1/1/2033
| | BRL | 34,300,000 | | 6,930,884 |
| | | | | | 132,915,151 |
| CHILE — 3.5% | | | |
| Bonos de la Tesoreria de la Republica en pesos: | | | | | |
2.30%, 10/1/2028 (a)
| | CLP | 1,535,000,000 | | 1,533,961 |
2.50%, 3/1/2025
| | CLP | 3,730,000,000 | | 4,094,702 |
2.80%, 10/1/2033 (a)
| | CLP | 1,000,000,000 | | 920,120 |
4.50%, 3/1/2026
| | CLP | 5,915,000,000 | | 6,646,806 |
4.70%, 9/1/2030 (a)
| | CLP | 6,990,000,000 | �� | 7,697,231 |
5.00%, 10/1/2028 (a)
| | CLP | 4,600,000,000 | | 5,185,432 |
5.00%, 3/1/2035
| | CLP | 7,875,000,000 | | 8,833,219 |
5.10%, 7/15/2050
| | CLP | 2,970,000,000 | | 3,302,468 |
5.30%, 11/1/2037
| | CLP | 3,500,000,000 | | 4,067,136 |
5.80%, 6/1/2024 (a)
| | CLP | 4,720,000,000 | | 5,372,076 |
5.80%, 10/1/2034
| | CLP | 2,550,000,000 | | 3,068,831 |
6.00%, 4/1/2033 (a)
| | CLP | 3,650,000,000 | | 4,450,277 |
Series 30YR, 6.00%, 1/1/2043
| | CLP | 7,595,000,000 | | 9,416,839 |
| Security Description | | | Principal
Amount | | Value |
7.00%, 5/1/2034 (a)
| | CLP | 2,700,000,000 | | $ 3,544,491 |
| | | | | | 68,133,589 |
| CHINA — 12.3% | | | |
| China Development Bank: | | | | | |
Series 1518, 3.74%, 9/10/2025
| | CNY | 2,000,000 | | 288,951 |
Series 1605, 3.80%, 1/25/2036
| | CNY | 6,500,000 | | 1,003,971 |
Series 1510, 4.21%, 4/13/2025
| | CNY | 9,000,000 | | 1,300,277 |
Series 1805, 4.88%, 2/9/2028
| | CNY | 3,000,000 | | 461,308 |
| China Government Bonds: | | | | | |
1.99%, 4/9/2025
| | CNY | 43,000,000 | | 6,044,537 |
2.00%, 6/15/2025
| | CNY | 25,000,000 | | 3,513,860 |
2.18%, 8/25/2025
| | CNY | 25,000,000 | | 3,523,695 |
2.18%, 8/15/2026
| | CNY | 10,000,000 | | 1,406,024 |
2.22%, 9/25/2025
| | CNY | 5,000,000 | | 705,204 |
2.24%, 5/25/2025
| | CNY | 20,000,000 | | 2,819,761 |
2.26%, 2/24/2025
| | CNY | 23,000,000 | | 3,245,842 |
2.28%, 11/25/2025
| | CNY | 27,000,000 | | 3,810,984 |
2.30%, 5/15/2026
| | CNY | 20,000,000 | | 2,820,352 |
2.33%, 12/15/2025
| | CNY | 20,000,000 | | 2,826,344 |
2.35%, 3/15/2025
| | CNY | 25,000,000 | | 3,530,774 |
2.37%, 1/20/2027
| | CNY | 18,500,000 | | 2,609,474 |
2.39%, 11/15/2026
| | CNY | 20,000,000 | | 2,828,038 |
2.40%, 7/15/2028
| | CNY | 15,000,000 | | 2,115,904 |
2.44%, 10/15/2027
| | CNY | 15,000,000 | | 2,119,911 |
2.46%, 2/15/2026
| | CNY | 40,000,000 | | 5,666,675 |
2.48%, 4/15/2027
| | CNY | 20,000,000 | | 2,829,492 |
2.48%, 9/25/2028
| | CNY | 15,000,000 | | 2,121,696 |
Series 2216, 2.50%, 7/25/2027
| | CNY | 19,000,000 | | 2,689,790 |
2.52%, 8/25/2033
| | CNY | 5,000,000 | | 701,693 |
2.54%, 12/25/2030
| | CNY | 20,000,000 | | 2,820,332 |
Series INBK, 2.55%, 10/15/2028
| | CNY | 15,000,000 | | 2,129,826 |
2.60%, 9/15/2030
| | CNY | 5,000,000 | | 706,884 |
2.60%, 9/1/2032
| | CNY | 20,000,000 | | 2,819,286 |
2.62%, 4/15/2028
| | CNY | 21,000,000 | | 2,989,109 |
2.62%, 9/25/2029
| | CNY | 20,000,000 | | 2,838,278 |
2.62%, 6/25/2030
| | CNY | 25,000,000 | | 3,541,268 |
2.64%, 1/15/2028
| | CNY | 21,000,000 | | 2,988,286 |
2.67%, 5/25/2033
| | CNY | 20,000,000 | | 2,834,198 |
2.67%, 11/25/2033
| | CNY | 20,000,000 | | 2,846,930 |
2.68%, 5/21/2030
| | CNY | 31,000,000 | | 4,401,646 |
2.69%, 8/12/2026
| | CNY | 29,920,000 | | 4,264,112 |
2.69%, 8/15/2032
| | CNY | 30,000,000 | | 4,259,355 |
2.75%, 6/15/2029
| | CNY | 24,000,000 | | 3,429,684 |
2.75%, 2/17/2032
| | CNY | 23,000,000 | | 3,283,115 |
2.76%, 5/15/2032
| | CNY | 15,000,000 | | 2,140,749 |
2.79%, 12/15/2029
| | CNY | 20,000,000 | | 2,859,655 |
2.80%, 3/24/2029
| | CNY | 20,000,000 | | 2,865,646 |
See accompanying notes to financial statements.
17
SPDR BLOOMBERG EMERGING MARKETS LOCAL BOND ETF
SCHEDULE OF INVESTMENTS (continued)
December 31, 2023
| Security Description | | | Principal
Amount | | Value |
2.80%, 3/25/2030
| | CNY | 23,000,000 | | $ 3,289,905 |
2.80%, 11/15/2032
| | CNY | 15,000,000 | | 2,149,493 |
2.85%, 6/4/2027
| | CNY | 30,000,000 | | 4,297,434 |
2.88%, 2/25/2033
| | CNY | 23,000,000 | | 3,319,080 |
2.89%, 11/18/2031
| | CNY | 20,500,000 | | 2,955,877 |
Series 1610, 2.90%, 5/5/2026
| | CNY | 10,000,000 | | 1,432,558 |
2.91%, 10/14/2028
| | CNY | 30,000,000 | | 4,327,343 |
3.00%, 10/15/2053
| | CNY | 10,000,000 | | 1,455,771 |
3.01%, 5/13/2028
| | CNY | 28,000,000 | | 4,049,658 |
3.02%, 10/22/2025
| | CNY | 34,000,000 | | 4,867,685 |
3.02%, 5/27/2031
| | CNY | 36,000,000 | | 5,235,310 |
3.03%, 3/11/2026
| | CNY | 37,000,000 | | 5,312,807 |
Series 1916, 3.12%, 12/5/2026
| | CNY | 27,600,000 | | 3,985,250 |
3.12%, 10/25/2052
| | CNY | 10,000,000 | | 1,466,507 |
Series 1915, 3.13%, 11/21/2029
| | CNY | 28,000,000 | | 4,088,745 |
3.19%, 4/15/2053
| | CNY | 13,000,000 | | 1,954,253 |
Series 1828, 3.22%, 12/6/2025
| | CNY | 7,790,000 | | 1,122,054 |
Series 1907, 3.25%, 6/6/2026
| | CNY | 29,800,000 | | 4,310,078 |
Series 1827, 3.25%, 11/22/2028
| | CNY | 10,000,000 | | 1,471,613 |
3.27%, 11/19/2030
| | CNY | 37,000,000 | | 5,471,818 |
Series 1619, 3.27%, 8/22/2046
| | CNY | 10,000,000 | | 1,495,477 |
3.28%, 12/3/2027
| | CNY | 25,400,000 | | 3,714,414 |
Series 1906, 3.29%, 5/23/2029
| | CNY | 24,600,000 | | 3,625,493 |
3.32%, 4/15/2052
| | CNY | 10,000,000 | | 1,517,092 |
3.39%, 3/16/2050
| | CNY | 24,000,000 | | 3,677,020 |
3.40%, 7/15/2072
| | CNY | 10,000,000 | | 1,582,563 |
Series 1626, 3.48%, 11/21/2066
| | CNY | 6,700,000 | | 1,065,169 |
Series 1710, 3.52%, 5/4/2027
| | CNY | 5,000,000 | | 735,218 |
Series 1608, 3.52%, 4/25/2046
| | CNY | 11,000,000 | | 1,704,680 |
3.53%, 10/18/2051
| | CNY | 10,000,000 | | 1,571,533 |
Series 1819, 3.54%, 8/16/2028
| | CNY | 10,000,000 | | 1,487,331 |
3.72%, 4/12/2051
| | CNY | 14,000,000 | | 2,275,567 |
3.73%, 5/25/2070
| | CNY | 25,000,000 | | 4,241,459 |
Series 1521, 3.74%, 9/22/2035
| | CNY | 7,800,000 | | 1,236,127 |
Series 1525, 3.74%, 10/20/2045
| | CNY | 8,000,000 | | 1,334,949 |
3.76%, 3/22/2071
| | CNY | 21,000,000 | | 3,589,014 |
Series 1705, 3.77%, 2/20/2047
| | CNY | 13,000,000 | | 2,097,867 |
3.81%, 9/14/2050
| | CNY | 24,000,000 | | 3,946,522 |
Series 1910, 3.86%, 7/22/2049
| | CNY | 20,000,000 | | 3,295,793 |
Series 1023, 3.96%, 7/29/2040
| | CNY | 8,000,000 | | 1,324,520 |
| Security Description | | | Principal
Amount | | Value |
Series 1817, 3.97%, 7/23/2048
| | CNY | 10,000,000 | | $ 1,668,798 |
Series 1908, 4.00%, 6/24/2069
| | CNY | 9,000,000 | | 1,607,996 |
Series 1715, 4.05%, 7/24/2047
| | CNY | 10,000,000 | | 1,684,681 |
Series 1003, 4.08%, 3/1/2040
| | CNY | 5,000,000 | | 831,521 |
Series 1824, 4.08%, 10/22/2048
| | CNY | 19,300,000 | | 3,283,701 |
Series 1508, 4.09%, 4/27/2035
| | CNY | 1,000,000 | | 163,904 |
Series 1806, 4.22%, 3/19/2048
| | CNY | 8,000,000 | | 1,385,043 |
Series 1722, 4.28%, 10/23/2047
| | CNY | 3,250,000 | | 566,391 |
Series 1116, 4.50%, 6/23/2041
| | CNY | 11,000,000 | | 1,947,106 |
Series 1417, 4.63%, 8/11/2034
| | CNY | 7,000,000 | | 1,175,413 |
Series 1319, 4.76%, 9/16/2043
| | CNY | 2,000,000 | | 369,623 |
| | | | | | 241,768,140 |
| COLOMBIA — 4.1% | | | |
Colombia Government International Bonds 9.85%, 6/28/2027
| | COP | 115,000,000 | | 27,910 |
| Colombia TES: | | | | | |
Series B, 5.75%, 11/3/2027
| | COP | 20,750,000,000 | | 4,740,791 |
Series B, 6.00%, 4/28/2028
| | COP | 28,015,000,000 | | 6,372,436 |
Series B, 6.25%, 11/26/2025
| | COP | 10,875,000,000 | | 2,662,326 |
Series B, 6.25%, 7/9/2036
| | COP | 5,300,000,000 | | 997,341 |
Series B, 7.00%, 3/26/2031
| | COP | 47,350,000,000 | | 10,539,058 |
Series B, 7.00%, 6/30/2032
| | COP | 34,364,000,000 | | 7,417,444 |
Series B, 7.25%, 10/18/2034
| | COP | 26,825,000,000 | | 5,685,598 |
Series B, 7.25%, 10/26/2050
| | COP | 31,600,000,000 | | 5,917,863 |
Series B, 7.50%, 8/26/2026
| | COP | 49,202,000,000 | | 12,139,203 |
Series B, 7.75%, 9/18/2030
| | COP | 17,800,000,000 | | 4,180,289 |
Series B, 9.25%, 5/28/2042
| | COP | 41,400,000,000 | | 9,700,530 |
Series B, 13.25%, 2/9/2033
| | COP | 29,700,000,000 | | 9,102,252 |
| | | | | | 79,483,041 |
See accompanying notes to financial statements.
18
SPDR BLOOMBERG EMERGING MARKETS LOCAL BOND ETF
SCHEDULE OF INVESTMENTS (continued)
December 31, 2023
| Security Description | | | Principal
Amount | | Value |
| CZECH REPUBLIC — 4.5% | | | |
| Czech Republic Government Bonds: | | | | | |
Series 135, Zero Coupon, 12/12/2024
| | CZK | 25,000,000 | | $ 1,065,822 |
Series 130, 0.05%, 11/29/2029
| | CZK | 71,750,000 | | 2,588,504 |
Series 100, 0.25%, 2/10/2027
| | CZK | 94,930,000 | | 3,788,348 |
Series 94, 0.95%, 5/15/2030
| | CZK | 199,280,000 | | 7,523,735 |
Series 95, 1.00%, 6/26/2026
| | CZK | 124,530,000 | | 5,161,986 |
Series 121, 1.20%, 3/13/2031
| | CZK | 198,370,000 | | 7,462,751 |
Series 120, 1.25%, 2/14/2025
| | CZK | 140,390,000 | | 6,037,946 |
Series 125, 1.50%, 4/24/2040
| | CZK | 38,660,000 | | 1,238,076 |
Series 138, 1.75%, 6/23/2032
| | CZK | 99,140,000 | | 3,810,859 |
Series 142, 1.95%, 7/30/2037
| | CZK | 45,600,000 | | 1,634,998 |
Series 103, 2.00%, 10/13/2033
| | CZK | 169,350,000 | | 6,494,518 |
Series 89, 2.40%, 9/17/2025
| | CZK | 168,200,000 | | 7,266,972 |
Series 78, 2.50%, 8/25/2028
| | CZK | 204,700,000 | | 8,677,201 |
Series 105, 2.75%, 7/23/2029
| | CZK | 154,350,000 | | 6,552,568 |
Series 145, 3.50%, 5/30/2035
| | CZK | 48,000,000 | | 2,091,850 |
Series 49, 4.20%, 12/4/2036
| | CZK | 92,180,000 | | 4,283,250 |
Series 154, 4.50%, 11/11/2032
| | CZK | 55,000,000 | | 2,585,169 |
Series 53, 4.85%, 11/26/2057
| | CZK | 22,300,000 | | 1,121,506 |
Series 11Y, 4.90%, 4/14/2034
| | CZK | 24,000,000 | | 1,176,397 |
Series 150, 5.00%, 9/30/2030
| | CZK | 69,200,000 | | 3,324,756 |
Series 149, 5.50%, 12/12/2028
| | CZK | 51,000,000 | | 2,471,319 |
Series 153, 5.75%, 3/29/2029
| | CZK | 18,000,000 | | 880,929 |
Series 152, 6.20%, 6/16/2031
| | CZK | 15,000,000 | | 778,403 |
| | | | | | 88,017,863 |
| HUNGARY — 3.7% | | | |
| Hungary Government Bonds: | | | | | |
Series 26/E, 1.50%, 4/22/2026
| | HUF | 1,443,380,000 | | 3,759,402 |
| Security Description | | | Principal
Amount | | Value |
Series 26/F, 1.50%, 8/26/2026
| | HUF | 1,851,000,000 | | $ 4,757,646 |
Series 29/A, 2.00%, 5/23/2029
| | HUF | 608,020,000 | | 1,466,254 |
Series 33/A, 2.25%, 4/20/2033 (b)
| | HUF | 772,070,000 | | 1,685,585 |
Series 34/A, 2.25%, 6/22/2034 (b)
| | HUF | 815,900,000 | | 1,707,232 |
Series 24/C, 2.50%, 10/24/2024
| | HUF | 1,726,200,000 | | 4,808,077 |
Series 26/D, 2.75%, 12/22/2026
| | HUF | 2,403,600,000 | | 6,311,780 |
Series 27/A, 3.00%, 10/27/2027 (b)
| | HUF | 858,170,000 | | 2,258,042 |
Series 30/A, 3.00%, 8/21/2030 (b)
| | HUF | 2,877,500,000 | | 7,125,213 |
Series 38/A, 3.00%, 10/27/2038 (b)
| | HUF | 2,378,160,000 | | 4,795,465 |
Series 41/A, 3.00%, 4/25/2041
| | HUF | 671,300,000 | | 1,287,866 |
Series 31/A, 3.25%, 10/22/2031 (b)
| | HUF | 1,469,870,000 | | 3,611,813 |
Series 28/B, 4.50%, 3/23/2028 (b)
| | HUF | 1,092,400,000 | | 3,002,694 |
4.50%, 5/27/2032
| | HUF | 940,000,000 | | 2,459,443 |
Series 32/A, 4.75%, 11/24/2032
| | HUF | 2,287,700,000 | | 6,088,442 |
Series 25/B, 5.50%, 6/24/2025
| | HUF | 1,567,820,000 | | 4,478,607 |
Series 28/A, 6.75%, 10/22/2028
| | HUF | 3,011,700,000 | | 9,027,623 |
Series 26/H, 9.50%, 10/21/2026
| | HUF | 950,000,000 | | 2,970,188 |
| | | | | | 71,601,372 |
| INDONESIA — 7.3% | | | |
| Indonesia Treasury Bonds: | | | | | |
Series FR90, 5.13%, 4/15/2027
| | IDR | 78,000,000,000 | | 4,870,124 |
Series FR86, 5.50%, 4/15/2026
| | IDR | 70,900,000,000 | | 4,511,638 |
Series FR64, 6.13%, 5/15/2028
| | IDR | 73,750,000,000 | | 4,724,464 |
Series FR88, 6.25%, 6/15/2036
| | IDR | 30,000,000,000 | | 1,890,154 |
Series FR95, 6.38%, 8/15/2028
| | IDR | 20,000,000,000 | | 1,294,512 |
Series FR91, 6.38%, 4/15/2032
| | IDR | 90,000,000,000 | | 5,775,502 |
Series FR93, 6.38%, 7/15/2037
| | IDR | 15,000,000,000 | | 959,603 |
Series FR62, 6.38%, 4/15/2042
| | IDR | 1,700,000,000 | | 107,063 |
Series FR81, 6.50%, 6/15/2025
| | IDR | 62,000,000,000 | | 4,027,242 |
Series FR87, 6.50%, 2/15/2031
| | IDR | 113,700,000,000 | | 7,343,940 |
See accompanying notes to financial statements.
19
SPDR BLOOMBERG EMERGING MARKETS LOCAL BOND ETF
SCHEDULE OF INVESTMENTS (continued)
December 31, 2023
| Security Description | | | Principal
Amount | | Value |
Series FR65, 6.63%, 5/15/2033
| | IDR | 60,000,000,000 | | $ 3,905,124 |
Series 100, 6.63%, 2/15/2034
| | IDR | 5,000,000,000 | | 324,708 |
Series 101, 6.88%, 4/15/2029
| | IDR | 10,000,000,000 | | 658,325 |
Series FR89, 6.88%, 8/15/2051
| | IDR | 30,000,000,000 | | 1,939,664 |
Series FR59, 7.00%, 5/15/2027
| | IDR | 68,000,000,000 | | 4,483,221 |
Series FR82, 7.00%, 9/15/2030
| | IDR | 108,600,000,000 | | 7,199,326 |
Series FR96, 7.00%, 2/15/2033
| | IDR | 45,000,000,000 | | 3,023,917 |
Series FR98, 7.13%, 6/15/2038
| | IDR | 10,000,000,000 | | 678,346 |
Series FR92, 7.13%, 6/15/2042
| | IDR | 70,000,000,000 | | 4,705,644 |
Series FR97, 7.13%, 6/15/2043
| | IDR | 30,000,000,000 | | 2,018,283 |
Series FR84, 7.25%, 2/15/2026
| | IDR | 18,000,000,000 | | 1,184,035 |
Series FR76, 7.38%, 5/15/2048
| | IDR | 41,700,000,000 | | 2,843,302 |
Series FR74, 7.50%, 8/15/2032
| | IDR | 31,300,000,000 | | 2,149,774 |
Series FR80, 7.50%, 6/15/2035
| | IDR | 70,600,000,000 | | 4,882,987 |
Series FR75, 7.50%, 5/15/2038
| | IDR | 46,910,000,000 | | 3,258,321 |
Series FR83, 7.50%, 4/15/2040
| | IDR | 78,500,000,000 | | 5,438,051 |
Series FR78, 8.25%, 5/15/2029
| | IDR | 72,150,000,000 | | 5,044,080 |
Series FR58, 8.25%, 6/15/2032
| | IDR | 3,710,000,000 | | 264,456 |
Series FR72, 8.25%, 5/15/2036
| | IDR | 47,090,000,000 | | 3,443,041 |
Series FR56, 8.38%, 9/15/2026
| | IDR | 84,300,000,000 | | 5,733,079 |
Series FR68, 8.38%, 3/15/2034
| | IDR | 92,700,000,000 | | 6,720,253 |
Series FR79, 8.38%, 4/15/2039
| | IDR | 46,000,000,000 | | 3,432,747 |
Series FR73, 8.75%, 5/15/2031
| | IDR | 39,050,000,000 | | 2,835,075 |
Series FR67, 8.75%, 2/15/2044
| | IDR | 17,050,000,000 | | 1,321,356 |
Series FR71, 9.00%, 3/15/2029
| | IDR | 55,000,000,000 | | 3,945,840 |
Series FR57, 9.50%, 5/15/2041
| | IDR | 1,000,000,000 | | 81,809 |
Series FR45, 9.75%, 5/15/2037
| | IDR | 1,250,000,000 | | 101,652 |
Series FR40, 11.00%, 9/15/2025
| | IDR | 24,000,000,000 | | 1,668,481 |
| Security Description | | | Principal
Amount | | Value |
| Perusahaan Penerbit SBSN Indonesia: | | | | | |
Series PBS, 4.88%, 7/15/2026
| | IDR | 47,000,000,000 | | $ 2,941,083 |
Series PBS, 5.38%, 8/15/2025
| | IDR | 15,000,000,000 | | 955,572 |
Series PBS, 5.88%, 7/15/2028
| | IDR | 2,338,000,000 | | 148,582 |
Series PBS, 6.00%, 1/15/2027
| | IDR | 25,000,000,000 | | 1,593,874 |
Series PBS, 6.13%, 10/15/2025
| | IDR | 33,000,000,000 | | 2,125,984 |
Series PBS, 6.38%, 3/15/2034
| | IDR | 87,522,000,000 | | 5,588,818 |
Series PBS, 6.50%, 6/15/2039
| | IDR | 10,000,000,000 | | 630,913 |
6.63%, 9/15/2029
| | IDR | 10,000,000,000 | | 649,787 |
Series PBS, 6.75%, 6/15/2047
| | IDR | 56,875,000,000 | | 3,670,787 |
Series PBS, 7.75%, 10/15/2046
| | IDR | 23,000,000,000 | | 1,656,005 |
Series PBS, 8.88%, 11/15/2031
| | IDR | 64,200,000,000 | | 4,701,312 |
| | | | | | 143,451,856 |
| ISRAEL — 4.1% | | | |
| Israel Government Bonds - Fixed: | | | | | |
Series 0425, 0.50%, 4/30/2025
| | ILS | 23,300,000 | | 6,189,594 |
Series 0226, 0.50%, 2/27/2026
| | ILS | 36,000,000 | | 9,331,523 |
Series 0330, 1.00%, 3/31/2030
| | ILS | 29,500,000 | | 6,917,418 |
Series 0432, 1.30%, 4/30/2032
| | ILS | 26,000,000 | | 5,943,847 |
Series 0537, 1.50%, 5/31/2037
| | ILS | 26,600,000 | | 5,280,167 |
Series 0825, 1.75%, 8/31/2025
| | ILS | 29,135,000 | | 7,818,742 |
Series 0327, 2.00%, 3/31/2027
| | ILS | 28,250,000 | | 7,449,790 |
Series 0928, 2.25%, 9/28/2028
| | ILS | 32,836,000 | | 8,548,361 |
Series 1152, 2.80%, 11/29/2052
| | ILS | 12,000,000 | | 2,366,993 |
Series 0229, 3.75%, 2/28/2029
| | ILS | 13,600,000 | | 3,882,207 |
Series 0347, 3.75%, 3/31/2047
| | ILS | 28,712,000 | | 7,078,547 |
Series 0142, 5.50%, 1/31/2042
| | ILS | 22,310,000 | | 7,036,566 |
Series 1026, 6.25%, 10/30/2026
| | ILS | 10,025,000 | | 2,974,084 |
| | | | | | 80,817,839 |
See accompanying notes to financial statements.
20
SPDR BLOOMBERG EMERGING MARKETS LOCAL BOND ETF
SCHEDULE OF INVESTMENTS (continued)
December 31, 2023
| Security Description | | | Principal
Amount | | Value |
| MALAYSIA — 4.2% | | | |
| Malaysia Government Bonds: | | | | | |
Series 0220, 2.63%, 4/15/2031
| | MYR | 6,720,000 | | $ 1,350,833 |
Series 0307, 3.50%, 5/31/2027
| | MYR | 8,670,000 | | 1,881,140 |
Series 0223, 3.52%, 4/20/2028
| | MYR | 5,480,000 | | 1,188,975 |
Series 0122, 3.58%, 7/15/2032
| | MYR | 7,080,000 | | 1,511,712 |
Series 0513, 3.73%, 6/15/2028
| | MYR | 5,390,000 | | 1,176,476 |
Series 0519, 3.76%, 5/22/2040
| | MYR | 7,650,000 | | 1,592,433 |
Series 0419, 3.83%, 7/5/2034
| | MYR | 6,110,000 | | 1,320,472 |
Series 0413, 3.84%, 4/15/2033
| | MYR | 7,860,000 | | 1,710,190 |
Series 0118, 3.88%, 3/14/2025
| | MYR | 6,700,000 | | 1,467,421 |
Series 0212, 3.89%, 3/15/2027
| | MYR | 600,000 | | 131,722 |
Series 0219, 3.89%, 8/15/2029
| | MYR | 11,805,000 | | 2,588,977 |
Series 0316, 3.90%, 11/30/2026
| | MYR | 8,605,000 | | 1,892,785 |
Series 0417, 3.90%, 11/16/2027
| | MYR | 5,770,000 | | 1,268,038 |
Series 0119, 3.91%, 7/15/2026
| | MYR | 4,540,000 | | 998,148 |
Series 0115, 3.96%, 9/15/2025
| | MYR | 8,912,000 | | 1,954,998 |
Series 0217, 4.06%, 9/30/2024
| | MYR | 915,000 | | 199,986 |
Series 0120, 4.07%, 6/15/2050
| | MYR | 10,440,000 | | 2,228,955 |
Series 0412, 4.13%, 4/15/2032
| | MYR | 800,000 | | 177,846 |
Series 0415, 4.25%, 5/31/2035
| | MYR | 8,170,000 | | 1,822,218 |
Series 0123, 4.46%, 3/31/2053
| | MYR | 980,000 | | 220,249 |
Series 0322, 4.50%, 4/30/2029
| | MYR | 7,300,000 | | 1,651,870 |
Series 0310, 4.50%, 4/15/2030
| | MYR | 11,000,000 | | 2,495,935 |
Series 0318, 4.64%, 11/7/2033
| | MYR | 10,910,000 | | 2,548,239 |
Series 0222, 4.70%, 10/15/2042
| | MYR | 2,440,000 | | 571,072 |
Series 0216, 4.74%, 3/15/2046
| | MYR | 9,075,000 | | 2,116,605 |
Series 0317, 4.76%, 4/7/2037
| | MYR | 15,375,000 | | 3,605,728 |
4.84%, 7/15/2025
| | MYR | 170,000 | | 37,736 |
| Security Description | | | Principal
Amount | | Value |
Series 0418, 4.89%, 6/8/2038
| | MYR | 7,870,000 | | $ 1,879,157 |
Series 0518, 4.92%, 7/6/2048
| | MYR | 9,860,000 | | 2,369,490 |
Series 0713, 4.94%, 9/30/2043
| | MYR | 5,000,000 | | 1,187,719 |
| Malaysia Government Investment Issue: | | | | | |
Series 0120, 3.42%, 9/30/2027
| | MYR | 9,180,000 | | 1,982,500 |
Series 0121, 3.45%, 7/15/2036
| | MYR | 13,160,000 | | 2,707,924 |
Series 0220, 3.47%, 10/15/2030
| | MYR | 10,460,000 | | 2,228,879 |
Series 123, 3.60%, 7/31/2028
| | MYR | 7,660,000 | | 1,666,925 |
Series 0319, 3.73%, 3/31/2026
| | MYR | 10,800,000 | | 2,358,443 |
Series 0415, 3.99%, 10/15/2025
| | MYR | 8,420,000 | | 1,849,340 |
Series 0316, 4.07%, 9/30/2026
| | MYR | 9,365,000 | | 2,063,948 |
Series 0619, 4.12%, 11/30/2034
| | MYR | 5,000,000 | | 1,109,325 |
Series 0118, 4.13%, 8/15/2025
| | MYR | 5,000,000 | | 1,102,450 |
Series 0119, 4.13%, 7/9/2029
| | MYR | 8,500,000 | | 1,886,279 |
Series 0122, 4.19%, 10/7/2032
| | MYR | 7,000,000 | | 1,560,414 |
Series 0117, 4.26%, 7/26/2027
| | MYR | 4,680,000 | | 1,038,899 |
Series 0223, 4.29%, 8/14/2043
| | MYR | 3,580,000 | | 798,685 |
Series 0218, 4.37%, 10/31/2028
| | MYR | 14,500,000 | | 3,250,304 |
Series 0221, 4.42%, 9/30/2041
| | MYR | 9,280,000 | | 2,090,272 |
Series 0219, 4.47%, 9/15/2039
| | MYR | 8,800,000 | | 2,014,903 |
Series 0513, 4.58%, 8/30/2033
| | MYR | 3,400,000 | | 785,382 |
Series 0519, 4.64%, 11/15/2049
| | MYR | 10,000,000 | | 2,281,262 |
Series 0322, 4.66%, 3/31/2038
| | MYR | 940,000 | | 220,594 |
Series 0617, 4.72%, 6/15/2033
| | MYR | 5,200,000 | | 1,204,623 |
Series 0517, 4.76%, 8/4/2037
| | MYR | 3,300,000 | | 775,094 |
Series 0615, 4.79%, 10/31/2035
| | MYR | 810,000 | | 190,083 |
Series 0417, 4.90%, 5/8/2047
| | MYR | 1,750,000 | | 414,569 |
Series 0222, 5.36%, 5/15/2052
| | MYR | 7,000,000 | | 1,776,263 |
| | | | | | 82,504,485 |
See accompanying notes to financial statements.
21
SPDR BLOOMBERG EMERGING MARKETS LOCAL BOND ETF
SCHEDULE OF INVESTMENTS (continued)
December 31, 2023
| Security Description | | | Principal
Amount | | Value |
| MEXICO — 6.7% | | | |
| Mexico Bonos: | | | | | |
Series M, 5.00%, 3/6/2025
| | MXN | 53,000,000 | | $ 2,965,302 |
Series M, 5.50%, 3/4/2027
| | MXN | 280,909,300 | | 14,864,663 |
Series M, 5.75%, 3/5/2026
| | MXN | 318,557,200 | | 17,374,154 |
Series M, 7.00%, 9/3/2026
| | MXN | 80,000,000 | | 4,437,238 |
Series M 20, 7.50%, 6/3/2027
| | MXN | 267,660,700 | | 14,963,837 |
Series M, 7.50%, 5/26/2033
| | MXN | 66,760,000 | | 3,570,297 |
Series M, 7.75%, 5/29/2031
| | MXN | 304,716,800 | | 16,776,023 |
Series M, 7.75%, 11/23/2034
| | MXN | 28,508,100 | | 1,537,294 |
Series M, 7.75%, 11/13/2042
| | MXN | 198,089,600 | | 10,289,149 |
Series MS, 8.00%, 5/24/2035
| | MXN | 40,000,000 | | 2,193,432 |
Series M, 8.00%, 11/7/2047
| | MXN | 125,950,800 | | 6,645,653 |
Series M, 8.00%, 7/31/2053
| | MXN | 130,000,000 | | 6,812,324 |
Series M, 8.50%, 3/1/2029
| | MXN | 8,000,000 | | 461,227 |
Series M 20, 8.50%, 5/31/2029
| | MXN | 71,446,300 | | 4,126,921 |
Series M 30, 8.50%, 11/18/2038
| | MXN | 120,130,000 | | 6,764,721 |
Series M 20, 10.00%, 12/5/2024
| | MXN | 146,695,500 | | 8,617,305 |
Series M 30, 10.00%, 11/20/2036
| | MXN | 34,180,000 | | 2,173,799 |
| Mexico Cetes: | | | | | |
Series BI, Zero Coupon, 1/23/2025
| | MXN | 19,000,000 | | 1,002,427 |
Zero Coupon, 3/20/2025
| | MXN | 30,000,000 | | 1,557,037 |
Series BI, Zero Coupon, 5/15/2025
| | MXN | 50,000,000 | | 2,553,769 |
Series BI, Zero Coupon, 7/10/2025
| | MXN | 15,000,000 | | 753,993 |
| | | | | | 130,440,565 |
| PERU — 3.4% | | | |
| Peru Government Bonds: | | | | | |
5.35%, 8/12/2040
| | PEN | 5,500,000 | | 1,270,269 |
5.40%, 8/12/2034
| | PEN | 17,000,000 | | 4,146,175 |
5.70%, 8/12/2024
| | PEN | 5,700,000 | | 1,540,082 |
5.94%, 2/12/2029
| | PEN | 20,725,000 | | 5,597,004 |
6.15%, 8/12/2032
| | PEN | 33,257,000 | | 8,764,998 |
| Security Description | | | Principal
Amount | | Value |
6.35%, 8/12/2028
| | PEN | 38,400,000 | | $ 10,614,893 |
6.71%, 2/12/2055
| | PEN | 3,500,000 | | 934,754 |
6.85%, 2/12/2042
| | PEN | 9,200,000 | | 2,494,752 |
6.90%, 8/12/2037
| | PEN | 54,775,000 | | 14,896,066 |
6.95%, 8/12/2031
| | PEN | 27,420,000 | | 7,642,763 |
7.30%, 8/12/2033
| | PEN | 27,750,000 | | 7,851,432 |
Peru Government International Bonds 6.71%, 2/12/2055
| | PEN | 475,000 | | 126,859 |
| | | | | | 65,880,047 |
| PHILIPPINES — 4.5% | | | |
| Philippines Government Bonds: | | | | | |
Series 1065, 2.88%, 7/9/2030
| | PHP | 153,500,000 | | 2,306,326 |
Series 5-77, 3.38%, 4/8/2026
| | PHP | 270,000,000 | | 4,612,947 |
Series R105, 3.50%, 9/20/2026
| | PHP | 22,000,000 | | 373,690 |
Series 1060, 3.63%, 9/9/2025
| | PHP | 82,000,000 | | 1,426,197 |
Series 7-64, 3.63%, 4/22/2028
| | PHP | 70,000,000 | | 1,153,379 |
Series 2020, 3.63%, 3/21/2033
| | PHP | 43,150,000 | | 648,973 |
Series 7-65, 3.75%, 8/12/2028
| | PHP | 460,000,000 | | 7,599,945 |
Series 1066, 4.00%, 7/22/2031
| | PHP | 227,000,000 | | 3,604,813 |
Series 5-76, 4.25%, 10/17/2024
| | PHP | 50,000,000 | | 890,651 |
Series 3-27, 4.25%, 4/7/2025
| | PHP | 185,000,000 | | 3,270,409 |
Series 2511, 4.63%, 9/9/2040
| | PHP | 156,500,000 | | 2,351,513 |
Series 1061, 4.75%, 5/4/2027
| | PHP | 276,950,000 | | 4,821,677 |
Series 1067, 4.88%, 1/20/2032
| | PHP | 380,000,000 | | 6,353,774 |
Series 2024, 5.13%, 7/15/2041
| | PHP | 20,000,000 | | 317,132 |
Series 3-01, 5.25%, 2/4/2026
| | PHP | 30,000,000 | | 534,388 |
Series 2021, 5.25%, 5/18/2037
| | PHP | 48,800,000 | | 817,069 |
5.75%, 4/12/2025
| | PHP | 114,500,000 | | 2,061,261 |
Series 7-69, 6.00%, 4/27/2030
| | PHP | 50,000,000 | | 905,706 |
Series R251, 6.13%, 10/24/2037
| | PHP | 67,000,000 | | 1,214,771 |
6.25%, 2/14/2026
| | PHP | 105,000,000 | | 1,907,717 |
Series 1063, 6.25%, 3/22/2028
| | PHP | 127,700,000 | | 2,328,663 |
6.38%, 7/27/2030
| | PHP | 150,000,000 | | 2,763,138 |
Series 2022, 6.50%, 2/22/2038
| | PHP | 40,000,000 | | 750,284 |
See accompanying notes to financial statements.
22
SPDR BLOOMBERG EMERGING MARKETS LOCAL BOND ETF
SCHEDULE OF INVESTMENTS (continued)
December 31, 2023
| Security Description | | | Principal
Amount | | Value |
Series 1071, 6.63%, 8/17/2033
| | PHP | 250,000,000 | | $ 4,718,317 |
Series 1069, 6.75%, 9/15/2032
| | PHP | 380,000,000 | | 7,203,533 |
Series 2023, 6.75%, 1/24/2039
| | PHP | 52,700,000 | | 1,021,144 |
Series 1064, 6.88%, 1/10/2029
| | PHP | 293,000,000 | | 5,500,984 |
Series 7-68, 7.00%, 10/13/2029
| | PHP | 30,000,000 | | 567,470 |
Series 2017, 8.00%, 7/19/2031
| | PHP | 274,237,338 | | 5,541,703 |
Series 25-7, 8.00%, 9/30/2035
| | PHP | 108,000,000 | | 2,265,713 |
Series 25-8, 8.13%, 12/16/2035
| | PHP | 198,800,000 | | 4,205,872 |
8.13%, 11/24/2042
| | PHP | 95,000,000 | | 2,111,856 |
Series 25-6, 9.25%, 11/5/2034
| | PHP | 30,000,000 | | 675,888 |
Philippines Government International Bonds 6.25%, 1/14/2036
| | PHP | 20,000,000 | | 338,315 |
| | | | | | 87,165,218 |
| POLAND — 4.4% | | | |
| Republic of Poland Government Bonds: | | | | | |
Series 1026, 0.25%, 10/25/2026
| | PLN | 33,173,000 | | 7,413,593 |
Series 0425, 0.75%, 4/25/2025
| | PLN | 14,900,000 | | 3,585,329 |
Series 1030, 1.25%, 10/25/2030
| | PLN | 5,830,000 | | 1,172,544 |
Series 0432, 1.75%, 4/25/2032
| | PLN | 59,700,000 | | 11,798,806 |
Series 0726, 2.50%, 7/25/2026
| | PLN | 39,348,000 | | 9,418,564 |
Series 0727, 2.50%, 7/25/2027
| | PLN | 21,440,000 | | 5,038,341 |
Series 0428, 2.75%, 4/25/2028
| | PLN | 49,770,000 | | 11,601,292 |
Series 1029, 2.75%, 10/25/2029
| | PLN | 17,200,000 | | 3,905,359 |
Series 0725, 3.25%, 7/25/2025
| | PLN | 22,000,000 | | 5,444,777 |
Series 0527, 3.75%, 5/25/2027
| | PLN | 41,625,000 | | 10,196,588 |
Series 0447, 4.00%, 4/25/2047
| | PLN | 400,000 | | 82,904 |
Series 0429, 5.75%, 4/25/2029
| | PLN | 16,750,000 | | 4,398,615 |
Series 1033, 6.00%, 10/25/2033 (b)
| | PLN | 18,610,000 | | 5,017,679 |
Series 728, 7.50%, 7/25/2028
| | PLN | 26,040,000 | | 7,288,384 |
| | | | | | 86,362,775 |
| Security Description | | | Principal
Amount | | Value |
| ROMANIA — 3.8% | | | |
| Romania Government Bonds: | | | | | |
Series 7Y, 2.50%, 10/25/2027
| | RON | 21,100,000 | | $ 4,101,934 |
Series 5Y, 3.25%, 6/24/2026
| | RON | 26,450,000 | | 5,485,161 |
Series 4Y, 3.50%, 11/25/2025
| | RON | 13,600,000 | | 2,882,364 |
Series 5Y, 3.65%, 7/28/2025
| | RON | 16,100,000 | | 3,446,944 |
Series 15Y, 3.65%, 9/24/2031 (b)
| | RON | 12,300,000 | | 2,292,548 |
Series 8Y, 4.15%, 1/26/2028
| | RON | 15,750,000 | | 3,245,588 |
Series 10YR, 4.15%, 10/24/2030
| | RON | 20,930,000 | | 4,111,409 |
Series 5Y, 4.25%, 4/28/2036
| | RON | 16,600,000 | | 3,041,233 |
Series 10Y, 4.75%, 2/24/2025
| | RON | 13,025,000 | | 2,849,843 |
Series 15Y, 4.75%, 10/11/2034
| | RON | 27,900,000 | | 5,452,334 |
Series 7Y, 4.85%, 4/22/2026
| | RON | 15,725,000 | | 3,394,065 |
Series 8Y, 4.85%, 7/25/2029
| | RON | 14,500,000 | | 3,007,421 |
Series 10Y, 5.00%, 2/12/2029
| | RON | 22,185,000 | | 4,653,828 |
Series 15YR, 5.80%, 7/26/2027
| | RON | 17,810,000 | | 3,895,885 |
Series 10Y, 6.70%, 2/25/2032
| | RON | 18,900,000 | | 4,297,383 |
Series 4Y, 7.20%, 5/31/2027
| | RON | 6,000,000 | | 1,368,898 |
Series 10Y, 7.20%, 10/30/2033
| | RON | 5,000,000 | | 1,176,442 |
Series 8Y, 7.35%, 4/28/2031
| | RON | 3,500,000 | | 823,930 |
Series 15Y, 7.90%, 2/24/2038
| | RON | 9,200,000 | | 2,350,601 |
Series 7Y, 8.00%, 4/29/2030
| | RON | 15,800,000 | | 3,811,541 |
Series 10Y, 8.25%, 9/29/2032
| | RON | 15,600,000 | | 3,893,772 |
8.75%, 10/30/2028
| | RON | 21,700,000 | | 5,299,304 |
| | | | | | 74,882,428 |
| SOUTH AFRICA — 4.4% | | | |
| Republic of South Africa Government Bonds: | | | | | |
Series R209, 6.25%, 3/31/2036
| | ZAR | 13,241,000 | | 475,264 |
Series R214, 6.50%, 2/28/2041
| | ZAR | 8,330,000 | | 275,306 |
Series R213, 7.00%, 2/28/2031
| | ZAR | 144,667,000 | | 6,617,303 |
See accompanying notes to financial statements.
23
SPDR BLOOMBERG EMERGING MARKETS LOCAL BOND ETF
SCHEDULE OF INVESTMENTS (continued)
December 31, 2023
| Security Description | | | Principal
Amount | | Value |
Series 2030, 8.00%, 1/31/2030
| | ZAR | 221,125,000 | | $ 11,123,056 |
Series 2032, 8.25%, 3/31/2032
| | ZAR | 175,877,000 | | 8,410,359 |
Series 2037, 8.50%, 1/31/2037
| | ZAR | 178,927,000 | | 7,648,242 |
Series 2044, 8.75%, 1/31/2044
| | ZAR | 187,256,000 | | 7,592,636 |
Series 2048, 8.75%, 2/28/2048
| | ZAR | 256,885,000 | | 10,334,398 |
Series 2035, 8.88%, 2/28/2035
| | ZAR | 240,125,000 | | 11,075,622 |
Series 2040, 9.00%, 1/31/2040
| | ZAR | 210,590,000 | | 9,001,679 |
Series R186, 10.50%, 12/21/2026
| | ZAR | 221,980,000 | | 12,699,137 |
Series 2053, 11.63%, 3/31/2053
| | ZAR | 30,000,000 | | 1,562,793 |
| | | | | | 86,815,795 |
| SOUTH KOREA — 12.5% | | | |
| Korea Treasury Bonds: | | | | | |
Series 2509, 1.13%, 9/10/2025
| | KRW | 8,000,000,000 | | 5,993,515 |
Series 3909, 1.13%, 9/10/2039
| | KRW | 5,450,000,000 | | 3,171,349 |
Series 2603, 1.25%, 3/10/2026
| | KRW | 7,300,000,000 | | 5,435,821 |
Series 2912, 1.38%, 12/10/2029
| | KRW | 10,000,000,000 | | 6,996,115 |
Series 3006, 1.38%, 6/10/2030
| | KRW | 10,000,000,000 | | 6,929,155 |
Series 2503, 1.50%, 3/10/2025
| | KRW | 7,340,000,000 | | 5,578,132 |
Series 01500-2612, 1.50%, 12/10/2026
| | KRW | 4,344,000,000 | | 3,215,344 |
Series 3012, 1.50%, 12/10/2030
| | KRW | 9,500,000,000 | | 6,585,358 |
Series 3609, 1.50%, 9/10/2036
| | KRW | 6,003,000,000 | | 3,842,750 |
Series 4009, 1.50%, 9/10/2040
| | KRW | 6,000,000,000 | | 3,653,838 |
Series 5003, 1.50%, 3/10/2050
| | KRW | 16,730,000,000 | | 9,306,384 |
Series 7009, 1.63%, 9/10/2070
| | KRW | 7,050,000,000 | | 3,587,518 |
Series 2609, 1.75%, 9/10/2026
| | KRW | 7,200,000,000 | | 5,387,638 |
Series 2606, 1.88%, 6/10/2026
| | KRW | 3,959,000,000 | | 2,982,076 |
Series 2906, 1.88%, 6/10/2029
| | KRW | 7,280,000,000 | | 5,281,740 |
Series 4109, 1.88%, 9/10/2041
| | KRW | 5,000,000,000 | | 3,210,984 |
Series 5103, 1.88%, 3/10/2051
| | KRW | 17,000,000,000 | | 10,244,579 |
| Security Description | | | Principal
Amount | | Value |
Series 3106, 2.00%, 6/10/2031
| | KRW | 9,500,000,000 | | $ 6,787,816 |
Series 02000-4603, 2.00%, 3/10/2046
| | KRW | 1,370,000,000 | | 879,701 |
Series 4903, 2.00%, 3/10/2049
| | KRW | 10,835,000,000 | | 6,836,603 |
Series 2706, 2.13%, 6/10/2027
| | KRW | 6,282,000,000 | | 4,710,570 |
Series 4703, 2.13%, 3/10/2047
| | KRW | 5,812,000,000 | | 3,802,565 |
Series 2506, 2.25%, 6/10/2025
| | KRW | 30,000,000 | | 22,948 |
Series 3709, 2.25%, 9/10/2037
| | KRW | 3,570,000,000 | | 2,486,491 |
Series 2703, 2.38%, 3/10/2027
| | KRW | 7,000,000,000 | | 5,303,116 |
Series 2712, 2.38%, 12/10/2027
| | KRW | 5,600,000,000 | | 4,217,761 |
Series 2812, 2.38%, 12/10/2028
| | KRW | 1,839,000,000 | | 1,374,083 |
Series 3112, 2.38%, 12/10/2031
| | KRW | 7,500,000,000 | | 5,473,157 |
Series 3809, 2.38%, 9/10/2038
| | KRW | 4,409,000,000 | | 3,104,258 |
Series 5203, 2.50%, 3/10/2052
| | KRW | 10,000,000,000 | | 6,931,798 |
Series 2806, 2.63%, 6/10/2028
| | KRW | 2,000,000,000 | | 1,516,355 |
Series 3509, 2.63%, 9/10/2035
| | KRW | 870,000,000 | | 637,774 |
Series 4803, 2.63%, 3/10/2048
| | KRW | 6,754,000,000 | | 4,841,940 |
Series 4412, 2.75%, 12/10/2044
| | KRW | 5,000,000,000 | | 3,672,030 |
Series 4212, 3.00%, 12/10/2042
| | KRW | 6,265,000,000 | | 4,769,439 |
Series 2506, 3.13%, 6/10/2025
| | KRW | 7,000,000,000 | | 5,420,521 |
Series 2606, 3.13%, 6/10/2026
| | KRW | 5,500,000,000 | | 4,266,933 |
Series 2709, 3.13%, 9/10/2027
| | KRW | 5,000,000,000 | | 3,873,617 |
Series 5209, 3.13%, 9/10/2052
| | KRW | 6,000,000,000 | | 4,718,727 |
Series 2803, 3.25%, 3/10/2028
| | KRW | 10,000,000,000 | | 7,780,919 |
Series 3306, 3.25%, 6/10/2033
| | KRW | 8,000,000,000 | | 6,216,532 |
Series 4209, 3.25%, 9/10/2042
| | KRW | 6,000,000,000 | | 4,729,461 |
Series 5303, 3.25%, 3/10/2053
| | KRW | 12,000,000,000 | | 9,688,253 |
Series 2503, 3.38%, 3/10/2025
| | KRW | 4,000,000,000 | | 3,106,856 |
Series 3206, 3.38%, 6/10/2032
| | KRW | 8,000,000,000 | | 6,283,646 |
See accompanying notes to financial statements.
24
SPDR BLOOMBERG EMERGING MARKETS LOCAL BOND ETF
SCHEDULE OF INVESTMENTS (continued)
December 31, 2023
| Security Description | | | Principal
Amount | | Value |
Series 2809, 3.50%, 9/10/2028
| | KRW | 5,000,000,000 | | $ 3,935,835 |
Series 7209, 3.50%, 9/10/2072
| | KRW | 1,000,000,000 | | 874,728 |
Series 2509, 3.63%, 9/10/2025
| | KRW | 3,500,000,000 | | 2,732,527 |
Series 5309, 3.63%, 9/10/2053
| | KRW | 9,000,000,000 | | 7,725,349 |
Series 2612, 3.88%, 12/10/2026
| | KRW | 1,300,000,000 | | 1,028,885 |
Series 4309, 3.88%, 9/10/2043
| | KRW | 4,000,000,000 | | 3,446,259 |
Series 3112, 4.00%, 12/10/2031
| | KRW | 395,000,000 | | 322,923 |
Series 3312, 4.13%, 12/10/2033
| | KRW | 2,500,000,000 | | 2,090,314 |
Series 2512, 4.25%, 12/10/2025
| | KRW | 4,000,000,000 | | 3,163,478 |
Series 3212, 4.25%, 12/10/2032
| | KRW | 6,000,000,000 | | 5,028,136 |
| | | | | | 245,204,600 |
| THAILAND — 4.5% | | | |
| Thailand Government Bonds: | | | | | |
0.95%, 6/17/2025
| | THB | 153,800,000 | | 4,417,244 |
Series LB, 1.00%, 6/17/2027
| | THB | 140,000,000 | | 3,909,129 |
1.59%, 12/17/2035
| | THB | 122,000,000 | | 3,157,658 |
1.60%, 12/17/2029
| | THB | 178,400,000 | | 4,955,137 |
1.60%, 6/17/2035
| | THB | 97,700,000 | | 2,542,401 |
1.88%, 6/17/2049
| | THB | 59,000,000 | | 1,263,713 |
2.00%, 12/17/2031
| | THB | 175,000,000 | | 4,890,684 |
2.00%, 6/17/2042
| | THB | 19,000,000 | | 473,487 |
2.13%, 12/17/2026
| | THB | 99,380,000 | | 2,890,825 |
2.25%, 3/17/2027
| | THB | 73,817,000 | | 2,152,270 |
2.35%, 6/17/2026
| | THB | 95,000,000 | | 2,785,432 |
2.40%, 3/17/2029
| | THB | 70,000,000 | | 2,042,912 |
2.50%, 6/17/2071
| | THB | 59,000,000 | | 1,190,455 |
2.65%, 6/17/2028
| | THB | 61,000,000 | | 1,802,181 |
2.88%, 12/17/2028
| | THB | 97,510,000 | | 2,910,800 |
2.88%, 6/17/2046
| | THB | 143,955,000 | | 3,854,020 |
3.30%, 6/17/2038
| | THB | 31,936,000 | | 974,373 |
3.35%, 6/17/2033
| | THB | 167,000,000 | | 5,150,793 |
3.39%, 6/17/2037
| | THB | 215,000,000 | | 6,655,157 |
3.40%, 6/17/2036
| | THB | 51,940,000 | | 1,604,199 |
3.45%, 6/17/2043
| | THB | 140,000,000 | | 4,289,921 |
3.58%, 12/17/2027
| | THB | 4,650,000 | | 142,024 |
3.60%, 6/17/2067
| | THB | 62,200,000 | | 1,719,571 |
3.65%, 6/20/2031
| | THB | 86,575,000 | | 2,706,775 |
3.78%, 6/25/2032
| | THB | 121,120,000 | | 3,831,515 |
3.80%, 6/14/2041
| | THB | 12,750,000 | | 410,508 |
3.85%, 12/12/2025
| | THB | 88,882,000 | | 2,677,576 |
4.00%, 6/17/2066
| | THB | 163,080,000 | | 4,975,090 |
4.68%, 6/29/2044
| | THB | 78,400,000 | | 2,796,654 |
4.85%, 6/17/2061
| | THB | 53,195,000 | | 1,874,462 |
| Security Description | | | Principal
Amount | | Value |
4.88%, 6/22/2029
| | THB | 113,904,000 | | $ 3,734,876 |
5.67%, 3/13/2028
| | THB | 10,000,000 | | 330,545 |
| | | | | | 89,112,387 |
| TURKEY — 3.1% | | | |
| Turkiye Government Bonds: | | | | | |
9.10%, 2/16/2028
| | TRY | 110,000,000 | | 2,175,418 |
10.28%, 9/15/2027
| | TRY | 237,735,000 | | 4,849,845 |
10.40%, 10/13/2032
| | TRY | 255,000,000 | | 4,925,764 |
10.50%, 8/11/2027
| | TRY | 223,780,000 | | 5,125,861 |
10.60%, 2/11/2026
| | TRY | 89,224,000 | | 2,099,637 |
11.00%, 2/24/2027
| | TRY | 21,938,000 | | 482,823 |
11.70%, 11/13/2030
| | TRY | 43,733,739 | | 956,592 |
12.40%, 3/8/2028
| | TRY | 219,330,000 | | 5,043,090 |
12.60%, 10/1/2025
| | TRY | 143,000,000 | | 3,442,914 |
16.90%, 9/2/2026
| | TRY | 110,100,000 | | 2,879,808 |
17.30%, 7/19/2028
| | TRY | 255,000,000 | | 6,976,366 |
17.80%, 7/13/2033
| | TRY | 230,000,000 | | 6,097,718 |
20.20%, 6/9/2027
| | TRY | 136,500,000 | | 3,928,523 |
21.50%, 4/28/2032
| | TRY | 73,000,000 | | 2,324,660 |
26.20%, 10/5/2033
| | TRY | 145,000,000 | | 5,096,160 |
31.08%, 11/8/2028
| | TRY | 121,000,000 | | 4,527,155 |
| | | | | | 60,932,334 |
TOTAL FOREIGN GOVERNMENT OBLIGATIONS
(Cost $1,953,479,715)
| | | | | 1,915,489,485 |
| | | Shares | |
| SHORT-TERM INVESTMENTS — 1.9% | |
State Street Institutional U.S. Government Money Market Fund, Class G Shares 5.36% (c) (d)
| 15,698,100 | 15,698,100 |
State Street Navigator Securities Lending Portfolio II (e) (f)
| 21,260,045 | 21,260,045 |
TOTAL SHORT-TERM INVESTMENTS
(Cost $36,958,145)
| 36,958,145 |
TOTAL INVESTMENTS — 99.7%
(Cost $1,990,437,860)
| 1,952,447,630 |
OTHER ASSETS IN EXCESS OF
LIABILITIES — 0.3%
| 6,388,498 |
NET ASSETS — 100.0%
| $ 1,958,836,128 |
See accompanying notes to financial statements.
25
SPDR BLOOMBERG EMERGING MARKETS LOCAL BOND ETF
SCHEDULE OF INVESTMENTS (continued)
December 31, 2023
| (a) | Securities purchased pursuant to Rule 144A of the Securities Act of 1933, as amended. These securities, which represent 1.5% of net assets as of December 31, 2023, are considered liquid and may be resold in transactions exempt from registration, normally to qualified institutional buyers. |
| (b) | All or a portion of the shares of the security are on loan at December 31, 2023. |
| (c) | The Fund invested in certain money market funds managed by SSGA Funds Management, Inc. Amounts related to these transactions during the year ended December 31, 2023 are shown in the Affiliate Table below. |
| (d) | The rate shown is the annualized seven-day yield at December 31, 2023. |
| (e) | The Fund invested in an affiliated entity. Amounts related to these transactions during the year ended December 31, 2023 are shown in the Affiliate Table below. |
| (f) | Investment of cash collateral for securities loaned. |
| BRL | Brazilian Real |
| CLP | Chilean Peso |
| CNY | China Yuan Renminbi |
| COP | Colombian Peso |
| CZK | Czech Koruna |
| HUF | Hungary Forint |
| IDR | Indonesia Rupiah |
| ILS | Israeli New Shekel |
| KRW | South Korean Won |
| MXN | Mexican Peso |
| MYR | Malaysian Ringgit |
| PEN | Peru Nuevo Sol |
| PHP | Philippines Peso |
| PLN | Polish Zloty |
| RON | Romania New Leu |
| THB | Thai Baht |
| TRY | Turkish New Lira |
| ZAR | South African Rand |
At December 31, 2023, open forward foreign currency exchange contracts were as follows:
| Counterparty | | Amount Sold | | Amount Bought | | Settlement
Date | | Net Unrealized
Appreciation/
(Depreciation) |
| Barclays Capital PLC | | USD 51,730,147 | | MXN 903,000,000 | | 01/04/2024 | | $ 1,585,215 |
| Barclays Capital PLC | | USD 51,797,945 | | MYR 242,000,000 | | 01/04/2024 | | 893,060 |
| Barclays Capital PLC | | MYR 242,000,000 | | USD 51,925,759 | | 01/04/2024 | | (765,247) |
| Barclays Capital PLC | | USD 2,905,948 | | CZK 65,000,000 | | 02/06/2024 | | (456) |
| Barclays Capital PLC | | USD 2,862,622 | | HUF 1,000,000,000 | | 02/06/2024 | | 15,230 |
| Barclays Capital PLC | | USD 17,511,999 | | IDR 270,000,000,000 | | 02/06/2024 | | 32,203 |
| Barclays Capital PLC | | USD 44,892,149 | | MYR 205,000,000 | | 02/06/2024 | | 50,334 |
| Barclays Capital PLC | | USD 5,847,574 | | PLN 23,000,000 | | 02/06/2024 | | (283) |
| Barclays Capital PLC | | USD 4,642,258 | | RON 21,000,000 | | 02/06/2024 | | 20,018 |
| Barclays Capital PLC | | PLN 23,000,000 | | USD 5,825,728 | | 02/06/2024 | | (21,563) |
| Barclays Capital PLC | | CZK 65,000,000 | | USD 2,902,204 | | 02/06/2024 | | (3,287) |
| Barclays Capital PLC | | PHP 310,000,000 | | USD 5,573,535 | | 02/06/2024 | | (33,668) |
| Barclays Capital PLC | | COP 20,500,000,000 | | USD 5,321,911 | | 02/06/2024 | | 66,188 |
| Barclays Capital PLC | | HUF 1,000,000,000 | | USD 2,875,782 | | 02/06/2024 | | (2,070) |
| Barclays Capital PLC | | MXN 720,000,000 | | USD 42,276,421 | | 02/06/2024 | | (15,570) |
| Barclays Capital PLC | | RON 21,000,000 | | USD 4,659,975 | | 02/06/2024 | | (2,301) |
| Barclays Capital PLC | | IDR 270,000,000,000 | | USD 17,504,052 | | 02/06/2024 | | (40,150) |
| Deutsche Bank AG | | MXN 903,000,000 | | USD 51,980,198 | | 01/04/2024 | | (1,335,164) |
| Goldman Sachs Bank USA | | USD 4,016,982 | | COP 16,000,000,000 | | 02/06/2024 | | 85,046 |
| Goldman Sachs Bank USA | | USD 6,125,562 | | THB 210,000,000 | | 02/06/2024 | | 45,998 |
| Goldman Sachs Bank USA | | KRW 2,000,000,000 | | USD 1,550,508 | | 02/06/2024 | | 4,710 |
| Standard Chartered Bank | | KRW 4,000,000,000 | | USD 3,108,607 | | 01/04/2024 | | 5,667 |
| UBS AG | | USD 3,075,283 | | KRW 4,000,000,000 | | 01/04/2024 | | 27,657 |
| UBS AG | | USD 5,599,711 | | PHP 310,000,000 | | 02/06/2024 | | 7,492 |
| Westpac Banking Corp. | | THB 215,000,000 | | USD 6,271,406 | | 02/06/2024 | | (47,095) |
| Total | | | | | | | | $ 571,964 |
| |
See accompanying notes to financial statements.
26
SPDR BLOOMBERG EMERGING MARKETS LOCAL BOND ETF
SCHEDULE OF INVESTMENTS (continued)
December 31, 2023
| COP | Colombian Peso |
| CZK | Czech Koruna |
| HUF | Hungary Forint |
| IDR | Indonesia Rupiah |
| KRW | South Korean Won |
| MXN | Mexican Peso |
| MYR | Malaysian Ringgit |
| PHP | Philippines Peso |
| PLN | Polish Zloty |
| RON | Romania New Leu |
| THB | Thai Baht |
During the year ended December 31, 2023, average notional value related to forward foreign currency exchange contracts was $114,981,833.
The following table summarizes the value of the Fund's investments according to the fair value hierarchy as of December 31, 2023.
| Description | | Level 1 –
Quoted Prices | | Level 2 –
Other Significant
Observable Inputs | | Level 3 –
Significant
Unobservable Inputs | | Total |
| ASSETS: | | | | | | | | |
| INVESTMENTS: | | | | | | | | |
Foreign Government Obligations
| | $ — | | $1,915,489,485 | | $— | | $1,915,489,485 |
Short-Term Investments
| | 36,958,145 | | — | | — | | 36,958,145 |
TOTAL INVESTMENTS
| | $36,958,145 | | $1,915,489,485 | | $— | | $1,952,447,630 |
| OTHER FINANCIAL INSTRUMENTS: | | | | | | | | |
Forward Foreign Currency Exchange Contracts -
Unrealized Appreciation
| | $ — | | $ 2,838,818 | | $— | | $ 2,838,818 |
Forward Foreign Currency Exchange Contracts -
Unrealized Depreciation
| | — | | (2,266,854) | | — | | (2,266,854) |
TOTAL OTHER FINANCIAL INSTRUMENTS:
| | $ — | | $ 571,964 | | $— | | $ 571,964 |
Affiliate Table
| | Number of
Shares Held
at
12/31/22 | | Value at
12/31/22 | | Cost of
Purchases | | Proceeds
from
Shares Sold | | Realized
Gain (Loss) | | Change in
Unrealized
Appreciation/
Depreciation | | Number of
Shares Held
at
12/31/23 | | Value at
12/31/23 | | Dividend
Income |
State Street Institutional U.S. Government Money Market Fund, Class G Shares
| 6,612,110 | | $ 6,612,110 | | $251,993,402 | | $242,907,412 | | $— | | $— | | 15,698,100 | | $15,698,100 | | $188,602 |
State Street Navigator Securities Lending Portfolio II
| 36,893,506 | | 36,893,506 | | 176,815,173 | | 192,448,634 | | — | | — | | 21,260,045 | | 21,260,045 | | 148,229 |
Total
| | | $43,505,616 | | $428,808,575 | | $435,356,046 | | $— | | $— | | | | $36,958,145 | | $336,831 |
See accompanying notes to financial statements.
27
SPDR BLOOMBERG INTERNATIONAL CORPORATE BOND ETF
SCHEDULE OF INVESTMENTS
December 31, 2023
| Security Description | | | Principal
Amount | | Value |
| CORPORATE BONDS & NOTES — 98.3% | | | |
| AUSTRALIA — 1.1% | | | |
| Australia & New Zealand Banking Group Ltd.: | | | | | |
0.75%, 9/29/2026
| | EUR | 300,000 | | $ 310,981 |
Series EMTN, 3.65%, 1/20/2026
| | EUR | 200,000 | | 222,534 |
Series MTN, 4.05%, 5/12/2025
| | AUD | 100,000 | | 67,814 |
BHP Billiton Finance Ltd. Series 12, 4.30%, 9/25/2042
| | GBP | 200,000 | | 234,295 |
Commonwealth Bank of Australia Series MTN, 4.90%, 8/17/2028
| | AUD | 200,000 | | 138,212 |
| National Australia Bank Ltd.: | | | | | |
Series GMTN, 1.38%, 8/30/2028
| | EUR | 300,000 | | 306,257 |
Series GMTN, 2.13%, 5/24/2028
| | EUR | 300,000 | | 319,862 |
Series MTN, 2.90%, 2/25/2027
| | AUD | 250,000 | | 162,367 |
Series MTN, 3.90%, 5/30/2025
| | AUD | 220,000 | | 148,796 |
Sydney Airport Finance Co. Pty. Ltd. Series EMTN, 4.38%, 5/3/2033
| | EUR | 150,000 | | 174,430 |
Westpac Banking Corp. Series EMTN, 3.70%, 1/16/2026
| | EUR | 200,000 | | 222,842 |
| | | | | | 2,308,390 |
| AUSTRIA — 0.2% | | | |
OMV AG Series EMTN, 1.00%, 12/14/2026
| | EUR | 174,000 | | 182,791 |
Raiffeisen Bank International AG 3 mo. EUR EURIBOR + 1.95%, 4.75%, 1/26/2027 (a)
| | EUR | 200,000 | | 223,069 |
| | | | | | 405,860 |
| BELGIUM — 1.8% | | | |
| Anheuser-Busch InBev SA: | | | | | |
Series EMTN, 1.13%, 7/1/2027
| | EUR | 300,000 | | 312,739 |
Series EMTN, 1.15%, 1/22/2027
| | EUR | 300,000 | | 314,537 |
Series EMTN, 1.50%, 4/18/2030
| | EUR | 200,000 | | 203,172 |
Series EMTN, 1.65%, 3/28/2031
| | EUR | 100,000 | | 101,315 |
Series EMTN, 2.00%, 3/17/2028
| | EUR | 530,000 | | 568,469 |
Series EMTN, 2.13%, 12/2/2027
| | EUR | 300,000 | | 322,637 |
Series EMTN, 2.70%, 3/31/2026
| | EUR | 200,000 | | 219,127 |
| Security Description | | | Principal
Amount | | Value |
Series EMTN, 2.75%, 3/17/2036
| | EUR | 350,000 | | $ 368,428 |
Series EMTN, 2.88%, 4/2/2032
| | EUR | 350,000 | | 382,822 |
Series EMTN, 3.70%, 4/2/2040
| | EUR | 450,000 | | 507,919 |
| KBC Group NV: | | | | | |
Series EMTN, 3 mo. EUR EURIBOR + 1.38%, 4.38%, 4/19/2030 (a)
| | EUR | 300,000 | | 343,778 |
Series EMTN, 3 mo. EUR EURIBOR + 1.70%, 4.38%, 11/23/2027 (a)
| | EUR | 300,000 | | 339,085 |
| | | | | | 3,984,028 |
| CANADA — 0.7% | | | |
Royal Bank of Canada Series EMTN, 2.13%, 4/26/2029
| | EUR | 200,000 | | 208,063 |
| Toronto-Dominion Bank: | | | | | |
Series EMTN, 0.50%, 1/18/2027
| | EUR | 300,000 | | 306,704 |
Series EMTN, 1.95%, 4/8/2030
| | EUR | 500,000 | | 506,931 |
Series EMTN, 2.55%, 8/3/2027
| | EUR | 100,000 | | 108,047 |
Series EMTN, 2.88%, 4/5/2027
| | GBP | 200,000 | | 241,722 |
Series EMTN, 3.13%, 8/3/2032
| | EUR | 200,000 | | 215,943 |
| | | | | | 1,587,410 |
| CHINA — 0.1% | | | |
Prosus NV 1.29%, 7/13/2029
| | EUR | 200,000 | | 179,085 |
| DENMARK — 0.5% | | | |
| Danske Bank AS: | | | | | |
Series EMTN, 0.63%, 5/26/2025 (b)
| | EUR | 300,000 | | 318,498 |
1 yr. EUR Swap + 1.25%, 4.13%, 1/10/2031 (a)
| | EUR | 100,000 | | 114,400 |
1 yr. EUR Swap + 0.95%, 4.00%, 1/12/2027 (a)
| | EUR | 100,000 | | 111,284 |
Series EMTN, 1 yr. EURIBOR ICE Swap + 1.70%, 4.75%, 6/21/2030 (a)
| | EUR | 200,000 | | 232,807 |
Series EMTN, 1 yr. U.K. Government Bond + 1.65%, 2.25%, 1/14/2028 (a)
| | GBP | 200,000 | | 232,640 |
See accompanying notes to financial statements.
28
SPDR BLOOMBERG INTERNATIONAL CORPORATE BOND ETF
SCHEDULE OF INVESTMENTS (continued)
December 31, 2023
| Security Description | | | Principal
Amount | | Value |
Series EMTN, 1 yr. U.K. Government Bond + 1.70%, 4.63%, 4/13/2027 (a)
| | GBP | 100,000 | | $ 126,363 |
| | | | | | 1,135,992 |
| FINLAND — 1.1% | | | |
| Nordea Bank Abp: | | | | | |
Series EMTN, 0.50%, 5/14/2027
| | EUR | 400,000 | | 407,639 |
Series EMTN, 0.50%, 11/2/2028
| | EUR | 100,000 | | 96,942 |
Series EMTN, 1.13%, 2/12/2025
| | EUR | 300,000 | | 322,888 |
Series EMTN, 1.13%, 2/16/2027
| | EUR | 100,000 | | 103,697 |
Series EMTN, 2.50%, 5/23/2029 (b)
| | EUR | 200,000 | | 212,344 |
Series EMTN, 4.13%, 5/5/2028
| | EUR | 350,000 | | 399,107 |
Series EMTN, 3 mo. EUR EURIBOR + 0.48%, 3.63%, 2/10/2026 (a)
| | EUR | 300,000 | | 330,374 |
| OP Corporate Bank PLC: | | | | | |
Series EMTN, 0.10%, 11/16/2027
| | EUR | 200,000 | | 196,611 |
Series EMTN, 0.50%, 8/12/2025 (b)
| | EUR | 200,000 | | 210,866 |
Series EMTN, 2.88%, 12/15/2025
| | EUR | 200,000 | | 219,726 |
| | | | | | 2,500,194 |
| FRANCE — 20.3% | | | |
Air Liquide Finance SA Series EMTN, 1.25%, 6/13/2028
| | EUR | 200,000 | | 210,207 |
| Airbus SE: | | | | | |
Series EMTN, 1.63%, 6/9/2030
| | EUR | 300,000 | | 306,065 |
Series EMTN, 2.38%, 4/7/2032
| | EUR | 200,000 | | 210,498 |
Series EMTN, 2.38%, 6/9/2040
| | EUR | 200,000 | | 188,581 |
ALD SA Series EMTN, 4.88%, 10/6/2028
| | EUR | 200,000 | | 233,805 |
| Autoroutes du Sud de la France SA: | | | | | |
Series EMTN, 1.25%, 1/18/2027
| | EUR | 300,000 | | 316,217 |
Series EMTN, 1.38%, 1/22/2030
| | EUR | 100,000 | | 101,470 |
Series EMTN, 1.38%, 2/21/2031
| | EUR | 100,000 | | 99,222 |
| Banque Federative du Credit Mutuel SA: | | | | | |
Series EMTN, 0.01%, 3/7/2025
| | EUR | 400,000 | | 423,205 |
| Security Description | | | Principal
Amount | | Value |
Series EMTN, 0.01%, 5/11/2026
| | EUR | 200,000 | | $ 205,237 |
0.25%, 7/19/2028
| | EUR | 300,000 | | 286,734 |
Series EMTN, 0.63%, 11/3/2028
| | EUR | 300,000 | | 289,735 |
Series EMTN, 0.63%, 2/21/2031
| | EUR | 300,000 | | 271,028 |
Series EMTN, 0.75%, 7/17/2025
| | EUR | 200,000 | | 211,836 |
Series EMTN, 0.75%, 6/8/2026
| | EUR | 300,000 | | 311,791 |
0.75%, 1/17/2030
| | EUR | 400,000 | | 373,559 |
Series EMTN, 1.00%, 5/23/2025
| | EUR | 200,000 | | 213,427 |
Series EMTN, 1.13%, 1/19/2032
| | EUR | 100,000 | | 92,006 |
Series EMTN, 1.25%, 1/14/2025
| | EUR | 100,000 | | 107,643 |
Series EMTN, 1.25%, 5/26/2027
| | EUR | 400,000 | | 414,133 |
1.25%, 6/3/2030
| | EUR | 300,000 | | 286,555 |
Series EMTN, 1.38%, 7/16/2028
| | EUR | 300,000 | | 307,798 |
Series EMTN, 1.75%, 3/15/2029
| | EUR | 200,000 | | 202,111 |
Series EMTN, 2.63%, 11/6/2029
| | EUR | 400,000 | | 419,620 |
Series EMTN, 3.13%, 9/14/2027
| | EUR | 500,000 | | 550,210 |
Series EMTN, 3.75%, 2/1/2033
| | EUR | 300,000 | | 338,228 |
Series EMTN, 4.13%, 3/13/2029
| | EUR | 300,000 | | 343,762 |
Series EMTN, 4.13%, 6/14/2033
| | EUR | 100,000 | | 115,841 |
Series EMTN, 4.38%, 5/2/2030
| | EUR | 300,000 | | 344,235 |
| BNP Paribas SA: | | | | | |
Series EMTN, 0.13%, 9/4/2026
| | EUR | 100,000 | | 101,931 |
Series EMTN, 0.63%, 12/3/2032
| | EUR | 300,000 | | 257,943 |
Series EMTN, 1.13%, 6/11/2026
| | EUR | 300,000 | | 315,424 |
Series EMTN, 1.25%, 7/13/2031
| | GBP | 200,000 | | 198,290 |
Series EMTN, 1.38%, 5/28/2029
| | EUR | 300,000 | | 297,815 |
Series EMTN, 1.50%, 11/17/2025
| | EUR | 200,000 | | 214,035 |
Series EMTN, 1.50%, 5/23/2028
| | EUR | 100,000 | | 103,505 |
Series EMTN, 1.63%, 2/23/2026
| | EUR | 300,000 | | 321,242 |
1.88%, 12/14/2027
| | GBP | 100,000 | | 114,689 |
Series EMTN, 2.10%, 4/7/2032
| | EUR | 300,000 | | 295,795 |
See accompanying notes to financial statements.
29
SPDR BLOOMBERG INTERNATIONAL CORPORATE BOND ETF
SCHEDULE OF INVESTMENTS (continued)
December 31, 2023
| Security Description | | | Principal
Amount | | Value |
Series EMTN, 3.63%, 9/1/2029
| | EUR | 300,000 | | $ 332,502 |
Series EMTN, 4.13%, 5/24/2033
| | EUR | 100,000 | | 116,391 |
Series EMTN, 5.75%, 6/13/2032
| | GBP | 200,000 | | 268,491 |
Series EMTN, 3 mo. EUR EURIBOR - 0.70%, 0.25%, 4/13/2027 (a)
| | EUR | 100,000 | | 102,466 |
Series EMTN, 3 mo. EUR EURIBOR - 0.73%, 0.50%, 2/19/2028 (a)
| | EUR | 500,000 | | 502,447 |
Series EMTN, 3 mo. EUR EURIBOR - 0.83%, 0.50%, 1/19/2030 (a)
| | EUR | 400,000 | | 378,632 |
3 mo. EUR EURIBOR - 0.95%, 0.50%, 9/1/2028 (a)
| | EUR | 500,000 | | 495,258 |
Series EMTN, 3 mo. EUR EURIBOR - 1.35%, 1.13%, 4/17/2029 (a) (b)
| | EUR | 400,000 | | 398,668 |
Series EMTN, 3 mo. EUR EURIBOR + 0.78%, 3.88%, 2/23/2029 (a)
| | EUR | 400,000 | | 451,694 |
Series EMTN, 3 mo. EUR EURIBOR + 0.83%, 0.88%, 7/11/2030 (a)
| | EUR | 300,000 | | 285,483 |
Series EMTN, 3 mo. EUR EURIBOR + 0.92%, 3.88%, 1/10/2031 (a)
| | EUR | 400,000 | | 454,617 |
Series EMTN, 3 mo. EUR EURIBOR + 0.95%, 4.13%, 9/26/2032 (a)
| | EUR | 200,000 | | 231,354 |
Series EMTN, 3 mo. EUR EURIBOR + 1.37%, 2.75%, 7/25/2028 (a)
| | EUR | 300,000 | | 322,520 |
Series EMTN, 3 mo. EUR EURIBOR + 1.37%, 4.25%, 4/13/2031 (a)
| | EUR | 300,000 | | 342,979 |
Series EMTN, 3 mo. EUR EURIBOR + 1.80%, 2.13%, 1/23/2027 (a)
| | EUR | 600,000 | | 643,631 |
| Bouygues SA: | | | | | |
1.13%, 7/24/2028 (b)
| | EUR | 200,000 | | 205,616 |
1.38%, 6/7/2027
| | EUR | 300,000 | | 315,495 |
2.25%, 6/29/2029
| | EUR | 100,000 | | 106,789 |
3.25%, 6/30/2037
| | EUR | 100,000 | | 107,944 |
| Security Description | | | Principal
Amount | | Value |
3.88%, 7/17/2031
| | EUR | 200,000 | | $ 230,305 |
4.63%, 6/7/2032
| | EUR | 300,000 | | 363,653 |
5.38%, 6/30/2042
| | EUR | 300,000 | | 393,752 |
| BPCE SA: | | | | | |
0.25%, 1/15/2026
| | EUR | 400,000 | | 415,211 |
0.25%, 1/14/2031
| | EUR | 300,000 | | 266,505 |
Series EMTN, 0.38%, 2/2/2026
| | EUR | 300,000 | | 312,254 |
Series EMTN, 0.50%, 2/24/2027
| | EUR | 200,000 | | 202,213 |
0.63%, 4/28/2025
| | EUR | 200,000 | | 212,691 |
Series EMTN, 0.75%, 3/3/2031
| | EUR | 200,000 | | 183,276 |
Series EMTN, 1.00%, 4/1/2025
| | EUR | 100,000 | | 107,007 |
Series EMTN, 1.00%, 1/14/2032
| | EUR | 400,000 | | 364,175 |
Series EMTN, 1.75%, 4/26/2027
| | EUR | 400,000 | | 422,655 |
Series EMTN, 3.50%, 1/25/2028
| | EUR | 300,000 | | 334,926 |
Series EMTN, 4.00%, 11/29/2032
| | EUR | 300,000 | | 346,082 |
Series EMTN, 4.50%, 1/13/2033
| | EUR | 100,000 | | 116,080 |
Series DMTN, 3 mo. EUR EURIBOR - 1.00%, 0.50%, 9/15/2027 (a)
| | EUR | 200,000 | | 203,721 |
3 mo. EUR EURIBOR + 1.60%, 4.63%, 3/2/2030 (a)
| | EUR | 300,000 | | 346,142 |
| Capgemini SE: | | | | | |
2.00%, 4/15/2029
| | EUR | 200,000 | | 211,317 |
2.38%, 4/15/2032
| | EUR | 200,000 | | 209,527 |
Carrefour SA Series EMTN, 2.63%, 12/15/2027 (b)
| | EUR | 200,000 | | 216,559 |
Cie de Saint-Gobain SA Series EMTN, 1.88%, 3/15/2031
| | EUR | 300,000 | | 305,765 |
Cie Generale des Etablissements Michelin SCA 1.75%, 9/3/2030
| | EUR | 200,000 | | 206,300 |
| Credit Agricole SA: | | | | | |
Series EMTN, 0.13%, 12/9/2027
| | EUR | 200,000 | | 195,917 |
Series EMTN, 0.38%, 10/21/2025
| | EUR | 100,000 | | 105,262 |
Series EMTN, 0.38%, 4/20/2028
| | EUR | 200,000 | | 195,015 |
Series EMTN, 1.00%, 9/18/2025
| | EUR | 300,000 | | 319,960 |
Series EMTN, 1.00%, 7/3/2029
| | EUR | 300,000 | | 295,120 |
Series EMTN, 1.13%, 7/12/2032
| | EUR | 100,000 | | 92,564 |
See accompanying notes to financial statements.
30
SPDR BLOOMBERG INTERNATIONAL CORPORATE BOND ETF
SCHEDULE OF INVESTMENTS (continued)
December 31, 2023
| Security Description | | | Principal
Amount | | Value |
Series EMTN, 1.25%, 4/14/2026
| | EUR | 200,000 | | $ 211,635 |
Series EMTN, 1.38%, 3/13/2025
| | EUR | 200,000 | | 215,432 |
Series EMTN, 1.38%, 5/3/2027
| | EUR | 100,000 | | 104,641 |
Series EMTN, 1.75%, 3/5/2029
| | EUR | 200,000 | | 203,915 |
Series EMTN, 1.88%, 12/20/2026
| | EUR | 300,000 | | 318,814 |
Series EMTN, 2.50%, 8/29/2029
| | EUR | 200,000 | | 212,762 |
Series EMTN, 3.13%, 2/5/2026
| | EUR | 200,000 | | 220,972 |
Series EMTN, 3.38%, 7/28/2027
| | EUR | 300,000 | | 333,514 |
Series EMTN, 3.88%, 4/20/2031
| | EUR | 600,000 | | 684,656 |
Series EMTN, 3.88%, 11/28/2034
| | EUR | 300,000 | | 346,831 |
Series EMTN, 4.00%, 1/18/2033 (b)
| | EUR | 300,000 | | 348,112 |
Series EMTN, 4.13%, 3/7/2030
| | EUR | 100,000 | | 115,434 |
4.88%, 10/23/2029
| | GBP | 200,000 | | 260,992 |
1 yr. U.K. Government Bond + 2.60%, 5.75%, 11/29/2027 (a)
| | GBP | 200,000 | | 260,702 |
Series EMTN, 3 mo. EUR EURIBOR - 0.68%, 0.50%, 9/21/2029 (a)
| | EUR | 200,000 | | 192,614 |
Series EMTN, 3 mo. EUR EURIBOR - 1.25%, 1.00%, 4/22/2026 (a)
| | EUR | 300,000 | | 319,650 |
Series EMTN, 3 mo. EUR EURIBOR + 1.35%, 4.00%, 10/12/2026 (a)
| | EUR | 300,000 | | 334,000 |
3 mo. EUR EURIBOR + 1.45%, 4.25%, 7/11/2029 (a)
| | EUR | 300,000 | | 341,733 |
Credit Mutuel Arkea SA Series EMTN, 3.38%, 9/19/2027
| | EUR | 300,000 | | 332,433 |
| Danone SA: | | | | | |
Series EMTN, Zero Coupon, 12/1/2025
| | EUR | 300,000 | | 312,820 |
Series EMTN, 1.21%, 11/3/2028 (b)
| | EUR | 200,000 | | 205,892 |
Dassault Systemes SE 0.38%, 9/16/2029
| | EUR | 200,000 | | 194,569 |
| Engie SA: | | | | | |
Series EMTN, 2.38%, 5/19/2026 (b)
| | EUR | 300,000 | | 324,704 |
Series EMTN, 3.63%, 1/11/2030
| | EUR | 100,000 | | 113,396 |
| Security Description | | | Principal
Amount | | Value |
Series EMTN, 4.00%, 1/11/2035
| | EUR | 200,000 | | $ 229,619 |
Series EMTN, 5.00%, 10/1/2060
| | GBP | 250,000 | | 314,058 |
| EssilorLuxottica SA: | | | | | |
Series EMTN, 0.13%, 5/27/2025
| | EUR | 200,000 | | 211,140 |
Series EMTN, 0.38%, 1/5/2026
| | EUR | 300,000 | | 314,653 |
Series EMTN, 0.38%, 11/27/2027
| | EUR | 300,000 | | 303,108 |
Series EMTN, 0.50%, 6/5/2028
| | EUR | 200,000 | | 201,440 |
0.75%, 11/27/2031
| | EUR | 200,000 | | 190,442 |
Holding d'Infrastructures de Transport SASU Series EMTN, 1.48%, 1/18/2031
| | EUR | 200,000 | | 189,227 |
HSBC Continental Europe SA Series EMTN, 0.10%, 9/3/2027
| | EUR | 300,000 | | 297,089 |
| Kering SA: | | | | | |
Series EMTN, 3.63%, 9/5/2031
| | EUR | 200,000 | | 228,399 |
Series EMTN, 3.88%, 9/5/2035
| | EUR | 200,000 | | 231,530 |
| L'Oreal SA: | | | | | |
0.88%, 6/29/2026
| | EUR | 400,000 | | 421,274 |
Series EMTN, 2.88%, 5/19/2028
| | EUR | 100,000 | | 110,980 |
Series EMTN, 3.13%, 5/19/2025
| | EUR | 100,000 | | 110,265 |
| LVMH Moet Hennessy Louis Vuitton SE: | | | | | |
Series EMTN, Zero Coupon, 2/11/2026
| | EUR | 300,000 | | 312,290 |
0.13%, 2/11/2028
| | EUR | 500,000 | | 499,079 |
0.38%, 2/11/2031 (b)
| | EUR | 500,000 | | 471,136 |
Series EMTN, 0.75%, 4/7/2025
| | EUR | 400,000 | | 428,305 |
Series EMTN, 1.13%, 2/11/2027
| | GBP | 200,000 | | 234,321 |
Series EMTN, 3.50%, 9/7/2033
| | EUR | 100,000 | | 114,082 |
| Orange SA: | | | | | |
Series EMTN, 0.63%, 12/16/2033
| | EUR | 300,000 | | 265,232 |
Series EMTN, 1.38%, 3/20/2028
| | EUR | 100,000 | | 104,081 |
Series EMTN, 1.38%, 1/16/2030
| | EUR | 200,000 | | 202,971 |
Series EMTN, 1.88%, 9/12/2030
| | EUR | 100,000 | | 103,704 |
Series EMTN, 2.00%, 1/15/2029
| | EUR | 400,000 | | 424,343 |
Series EMTN, 3.25%, 1/15/2032
| | GBP | 200,000 | | 236,952 |
See accompanying notes to financial statements.
31
SPDR BLOOMBERG INTERNATIONAL CORPORATE BOND ETF
SCHEDULE OF INVESTMENTS (continued)
December 31, 2023
| Security Description | | | Principal
Amount | | Value |
Series EMTN, 8.13%, 1/28/2033
| | EUR | 300,000 | | $ 464,141 |
| Pernod Ricard SA: | | | | | |
1.13%, 4/7/2025
| | EUR | 200,000 | | 214,649 |
1.75%, 4/8/2030
| | EUR | 200,000 | | 205,085 |
| Societe Generale SA: | | | | | |
0.13%, 2/24/2026
| | EUR | 100,000 | | 103,430 |
Series EMTN, 0.13%, 2/18/2028
| | EUR | 100,000 | | 97,501 |
Series EMTN, 0.25%, 7/8/2027
| | EUR | 400,000 | | 397,606 |
Series EMTN, 0.75%, 1/25/2027
| | EUR | 300,000 | | 304,743 |
Series EMTN, 1.13%, 1/23/2025
| | EUR | 200,000 | | 214,642 |
Series EMTN, 1.75%, 3/22/2029
| | EUR | 300,000 | | 301,019 |
Series EMTN, 2.63%, 5/30/2029
| | EUR | 400,000 | | 429,385 |
Series EMTN, 4.00%, 11/16/2027
| | EUR | 200,000 | | 226,095 |
4.13%, 6/2/2027
| | EUR | 100,000 | | 113,269 |
4.25%, 9/28/2026
| | EUR | 100,000 | | 113,187 |
Series EMTN, 4.25%, 11/16/2032 (b)
| | EUR | 400,000 | | 469,443 |
3 mo. EUR EURIBOR - 0.38%, 0.13%, 11/17/2026 (a)
| | EUR | 400,000 | | 414,597 |
3 mo. EUR EURIBOR - 0.80%, 0.63%, 12/2/2027 (a)
| | EUR | 300,000 | | 303,671 |
3 mo. EUR EURIBOR - 0.95%, 0.50%, 6/12/2029 (a)
| | EUR | 400,000 | | 382,930 |
3 mo. EUR EURIBOR - 1.28%, 0.88%, 9/22/2028 (a)
| | EUR | 200,000 | | 200,471 |
3 mo. EUR EURIBOR + 1.50%, 4.75%, 9/28/2029 (a)
| | EUR | 100,000 | | 115,042 |
Series EMTN, 3 mo. EUR EURIBOR + 1.80%, 4.25%, 12/6/2030 (a)
| | EUR | 500,000 | | 560,933 |
Suez SACA Series EMTN, 2.88%, 5/24/2034
| | EUR | 200,000 | | 205,946 |
TotalEnergies Capital Canada Ltd. Series EMTN, 2.13%, 9/18/2029
| | EUR | 500,000 | | 528,317 |
| TotalEnergies Capital International SA: | | | | | |
Series EMTN, 1.38%, 10/4/2029
| | EUR | 200,000 | | 203,054 |
Series EMTN, 1.49%, 4/8/2027
| | EUR | 500,000 | | 527,948 |
Series EMTN, 1.62%, 5/18/2040
| | EUR | 300,000 | | 260,124 |
| Security Description | | | Principal
Amount | | Value |
Series EMTN, 1.99%, 4/8/2032
| | EUR | 200,000 | | $ 204,538 |
| Unibail-Rodamco-Westfield SE: | | | | | |
Series EMTN, 0.63%, 5/4/2027
| | EUR | 300,000 | | 302,766 |
Series EMTN, 1.38%, 12/4/2031
| | EUR | 100,000 | | 93,202 |
Vinci SA Series EMTN, 1.75%, 9/26/2030
| | EUR | 200,000 | | 205,270 |
| | | | | | 44,655,306 |
| GERMANY — 10.8% | | | |
Allianz Finance II BV Series 62, 4.50%, 3/13/2043
| | GBP | 100,000 | | 127,357 |
Amprion GmbH 3.97%, 9/22/2032
| | EUR | 200,000 | | 230,176 |
Aroundtown SA Series EMTN, 0.38%, 4/15/2027
| | EUR | 200,000 | | 177,400 |
| BASF SE: | | | | | |
Series EMTN, 0.25%, 6/5/2027
| | EUR | 300,000 | | 303,326 |
0.88%, 11/15/2027
| | EUR | 200,000 | | 204,354 |
1.50%, 3/17/2031
| | EUR | 200,000 | | 198,712 |
| Bayer AG: | | | | | |
0.05%, 1/12/2025
| | EUR | 100,000 | | 106,177 |
0.63%, 7/12/2031
| | EUR | 400,000 | | 348,715 |
0.75%, 1/6/2027
| | EUR | 400,000 | | 410,051 |
1.13%, 1/6/2030
| | EUR | 100,000 | | 95,077 |
1.38%, 7/6/2032
| | EUR | 400,000 | | 360,823 |
Series EMTN, 4.63%, 5/26/2033
| | EUR | 250,000 | | 288,151 |
| Bayer Capital Corp. BV: | | | | | |
1.50%, 6/26/2026
| | EUR | 300,000 | | 315,453 |
2.13%, 12/15/2029
| | EUR | 400,000 | | 404,786 |
| BMW Finance NV: | | | | | |
Series EMTN, 0.50%, 2/22/2025
| | EUR | 322,000 | | 343,719 |
Series EMTN, 1.50%, 2/6/2029
| | EUR | 400,000 | | 412,962 |
| Commerzbank AG: | | | | | |
Series EMTN, 0.50%, 12/4/2026
| | EUR | 350,000 | | 359,937 |
Series EMTN, 1.00%, 3/4/2026
| | EUR | 100,000 | | 105,487 |
| Deutsche Bank AG: | | | | | |
Series EMTN, 1.63%, 1/20/2027
| | EUR | 400,000 | | 414,765 |
3 mo. EUR EURIBOR - 1.50%, 1.38%, 2/17/2032 (a)
| | EUR | 100,000 | | 90,642 |
Series EMTN, 3 mo. EUR EURIBOR - 2.05%, 1.75%, 11/19/2030 (a)
| | EUR | 200,000 | | 191,870 |
See accompanying notes to financial statements.
32
SPDR BLOOMBERG INTERNATIONAL CORPORATE BOND ETF
SCHEDULE OF INVESTMENTS (continued)
December 31, 2023
| Security Description | | | Principal
Amount | | Value |
Series EMTN, 3 mo. EUR EURIBOR + 1.38%, 1.88%, 2/23/2028 (a)
| | EUR | 400,000 | | $ 415,029 |
3 mo. EUR EURIBOR + 2.95%, 5.00%, 9/5/2030 (a)
| | EUR | 400,000 | | 455,983 |
Series EMTN, Sterling Overnight Index Average + 2.62%, 6.13%, 12/12/2030 (a)
| | GBP | 300,000 | | 387,199 |
| Deutsche Boerse AG: | | | | | |
3.88%, 9/28/2026
| | EUR | 100,000 | | 112,842 |
3.88%, 9/28/2033
| | EUR | 300,000 | | 352,449 |
Deutsche Lufthansa AG Series EMTN, 3.00%, 5/29/2026
| | EUR | 200,000 | | 215,648 |
| Deutsche Telekom AG: | | | | | |
Series EMTN, 0.50%, 7/5/2027
| | EUR | 200,000 | | 205,975 |
Series EMTN, 1.75%, 3/25/2031 (b)
| | EUR | 200,000 | | 207,414 |
| Deutsche Telekom International Finance BV: | | | | | |
Series EMTN, 1.50%, 4/3/2028
| | EUR | 250,000 | | 261,962 |
Series EMTN, 2.00%, 12/1/2029 (b)
| | EUR | 170,000 | | 181,610 |
| E.ON International Finance BV: | | | | | |
Series EMTN, 1.50%, 7/31/2029
| | EUR | 150,000 | | 153,956 |
Series EMTN, 5.88%, 10/30/2037
| | GBP | 200,000 | | 272,286 |
Series EMTN, 6.13%, 7/6/2039
| | GBP | 100,000 | | 139,073 |
Series EMTN, 6.25%, 6/3/2030
| | GBP | 100,000 | | 138,102 |
Series EMTN, 6.38%, 6/7/2032
| | GBP | 190,000 | | 267,262 |
Series EMTN, 6.75%, 1/27/2039
| | GBP | 100,000 | | 147,184 |
| E.ON SE: | | | | | |
Series EMTN, 0.38%, 9/29/2027
| | EUR | 400,000 | | 403,355 |
Series EMTN, 3.88%, 1/12/2035
| | EUR | 200,000 | | 229,703 |
Grand City Properties SA Series EMTN, 0.13%, 1/11/2028
| | EUR | 200,000 | | 184,883 |
Heidelberg Materials AG Series EMTN, 1.50%, 2/7/2025
| | EUR | 100,000 | | 108,371 |
Heidelberg Materials Finance Luxembourg SA Series EMTN, 1.63%, 4/7/2026
| | EUR | 200,000 | | 214,520 |
| Security Description | �� | | Principal
Amount | | Value |
| Mercedes-Benz Group AG: | | | | | |
Series EMTN, 0.75%, 9/10/2030
| | EUR | 450,000 | | $ 430,845 |
Series EMTN, 0.75%, 3/11/2033
| | EUR | 200,000 | | 182,247 |
Series EMTN, 1.00%, 11/15/2027
| | EUR | 100,000 | | 103,257 |
Series EMTN, 1.13%, 11/6/2031
| | EUR | 225,000 | | 217,247 |
Series EMTN, 1.38%, 5/11/2028
| | EUR | 100,000 | | 104,181 |
Series EMTN, 1.50%, 7/3/2029 (b)
| | EUR | 325,000 | | 335,525 |
Series EMTN, 2.13%, 7/3/2037 (b)
| | EUR | 135,000 | | 134,820 |
| Mercedes-Benz International Finance BV: | | | | | |
Series EMTN, 0.63%, 5/6/2027 (b)
| | EUR | 216,000 | | 222,033 |
Series EMTN, 0.85%, 2/28/2025
| | EUR | 200,000 | | 214,525 |
Series EMTN, 1.00%, 11/11/2025
| | EUR | 200,000 | | 211,966 |
Series EMTN, 1.38%, 6/26/2026 (b)
| | EUR | 200,000 | | 212,065 |
Series EMTN, 1.50%, 3/9/2026
| | EUR | 100,000 | | 106,692 |
Series EMTN, 2.00%, 8/22/2026
| | EUR | 300,000 | | 324,254 |
Series EMTN, 2.63%, 4/7/2025
| | EUR | 400,000 | | 437,566 |
Series EMTN, 3.50%, 5/30/2026
| | EUR | 200,000 | | 223,220 |
Series EMTN, 3.70%, 5/30/2031
| | EUR | 300,000 | | 346,161 |
| Robert Bosch GmbH: | | | | | |
Series EMTN, 3.63%, 6/2/2030
| | EUR | 200,000 | | 226,870 |
Series EMTN, 4.00%, 6/2/2035
| | EUR | 100,000 | | 116,975 |
Series EMTN, 4.38%, 6/2/2043
| | EUR | 400,000 | | 473,697 |
| RWE AG: | | | | | |
Series EMTN, 2.13%, 5/24/2026 (b)
| | EUR | 300,000 | | 323,988 |
Series EMTN, 2.75%, 5/24/2030
| | EUR | 300,000 | | 320,682 |
| SAP SE: | | | | | |
1.25%, 3/10/2028
| | EUR | 400,000 | | 418,444 |
1.63%, 3/10/2031
| | EUR | 100,000 | | 103,058 |
Series EMTN, 1.75%, 2/22/2027 (b)
| | EUR | 150,000 | | 164,032 |
| Siemens Financieringsmaatschappij NV: | | | | | |
Series EMTN, Zero Coupon, 2/20/2026
| | EUR | 300,000 | | 311,990 |
See accompanying notes to financial statements.
33
SPDR BLOOMBERG INTERNATIONAL CORPORATE BOND ETF
SCHEDULE OF INVESTMENTS (continued)
December 31, 2023
| Security Description | | | Principal
Amount | | Value |
Series EMTN, 0.25%, 2/20/2029
| | EUR | 200,000 | | $ 195,116 |
Series EMTN, 0.38%, 6/5/2026
| | EUR | 200,000 | | 208,318 |
Series EMTN, 0.50%, 9/5/2034
| | EUR | 300,000 | | 257,719 |
Series EMTN, 1.00%, 2/20/2025
| | GBP | 200,000 | | 244,348 |
Series EMTN, 2.25%, 3/10/2025
| | EUR | 300,000 | | 326,952 |
Series EMTN, 3.00%, 9/8/2033
| | EUR | 300,000 | | 331,412 |
Series EMTN, 3.38%, 8/24/2031
| | EUR | 300,000 | | 341,646 |
| Traton Finance Luxembourg SA: | | | | | |
Series EMTN, 0.13%, 3/24/2025
| | EUR | 100,000 | | 105,562 |
Series EMTN, 0.75%, 3/24/2029
| | EUR | 300,000 | | 287,871 |
Volkswagen Bank GmbH Series EMTN, 4.25%, 1/7/2026
| | EUR | 200,000 | | 223,466 |
| Volkswagen Financial Services AG: | | | | | |
Series EMTN, 0.13%, 2/12/2027
| | EUR | 200,000 | | 200,445 |
Series EMTN, 0.25%, 1/31/2025
| | EUR | 200,000 | | 212,970 |
Series EMTN, 0.88%, 1/31/2028
| | EUR | 200,000 | | 199,815 |
| Volkswagen International Finance NV: | | | | | |
Series EMTN, 0.88%, 9/22/2028
| | EUR | 100,000 | | 98,765 |
Series EMTN, 1.63%, 1/16/2030 (b)
| | EUR | 400,000 | | 398,780 |
1.88%, 3/30/2027
| | EUR | 300,000 | | 316,615 |
3.25%, 11/18/2030 (b)
| | EUR | 300,000 | | 327,620 |
Series EMTN, 3.88%, 3/29/2026
| | EUR | 200,000 | | 222,476 |
Series EMTN, 4.13%, 11/15/2025
| | EUR | 100,000 | | 111,787 |
4.13%, 11/16/2038 (b)
| | EUR | 200,000 | | 228,641 |
| Volkswagen Leasing GmbH: | | | | | |
Series EMTN, 0.38%, 7/20/2026
| | EUR | 250,000 | | 255,983 |
Series EMTN, 1.38%, 1/20/2025
| | EUR | 200,000 | | 215,495 |
| Vonovia SE: | | | | | |
Series EMTN, Zero Coupon, 12/1/2025
| | EUR | 100,000 | | 102,897 |
Series EMTN, 0.25%, 9/1/2028
| | EUR | 100,000 | | 93,738 |
Series EMTN, 0.38%, 6/16/2027
| | EUR | 300,000 | | 295,877 |
| Security Description | | | Principal
Amount | | Value |
Series EMTN, 0.63%, 12/14/2029
| | EUR | 200,000 | | $ 181,836 |
Series EMTN, 0.75%, 9/1/2032
| | EUR | 100,000 | | 83,718 |
1.00%, 6/16/2033
| | EUR | 400,000 | | 335,333 |
| Wintershall Dea Finance BV: | | | | | |
0.84%, 9/25/2025
| | EUR | 200,000 | | 210,222 |
1.33%, 9/25/2028
| | EUR | 200,000 | | 197,213 |
1.82%, 9/25/2031
| | EUR | 200,000 | | 188,815 |
| | | | | | 23,812,537 |
| IRELAND — 0.4% | | | |
AIB Group PLC Series EMTN, 1 yr. EUR Swap + 1.30%, 2.25%, 4/4/2028 (a) (b)
| | EUR | 200,000 | | 211,757 |
Bank of Ireland Group PLC Series EMTN, 1 yr. EURIBOR ICE Swap + 1.10%, 1.88%, 6/5/2026 (a)
| | EUR | 200,000 | | 214,837 |
Ryanair DAC Series EMTN, 0.88%, 5/25/2026 (b)
| | EUR | 300,000 | | 312,786 |
Smurfit Kappa Acquisitions ULC 2.88%, 1/15/2026
| | EUR | 200,000 | | 217,528 |
| | | | | | 956,908 |
| ITALY — 5.1% | | | |
| ASTM SpA: | | | | | |
Series EMTN, 1.50%, 1/25/2030
| | EUR | 300,000 | | 288,013 |
Series EMTN, 2.38%, 11/25/2033
| | EUR | 100,000 | | 92,646 |
| Autostrade per l'Italia SpA: | | | | | |
2.00%, 12/4/2028
| | EUR | 100,000 | | 101,388 |
2.00%, 1/15/2030
| | EUR | 300,000 | | 293,576 |
| Enel Finance International NV: | | | | | |
Series EMTN, Zero Coupon, 5/28/2026
| | EUR | 100,000 | | 102,440 |
Series EMTN, Zero Coupon, 6/17/2027
| | EUR | 300,000 | | 298,504 |
0.25%, 11/17/2025
| | EUR | 100,000 | | 104,517 |
Series EMTN, 0.38%, 6/17/2027
| | EUR | 200,000 | | 201,132 |
Series EMTN, 0.38%, 5/28/2029
| | EUR | 250,000 | | 237,720 |
Series EMTN, 0.50%, 6/17/2030
| | EUR | 350,000 | | 323,735 |
Series EMTN, 0.88%, 9/28/2034
| | EUR | 150,000 | | 124,606 |
Series EMTN, 0.88%, 6/17/2036
| | EUR | 200,000 | | 157,763 |
Series EMTN, 1.13%, 9/16/2026
| | EUR | 350,000 | | 367,297 |
Series EMTN, 1.50%, 7/21/2025
| | EUR | 200,000 | | 214,517 |
See accompanying notes to financial statements.
34
SPDR BLOOMBERG INTERNATIONAL CORPORATE BOND ETF
SCHEDULE OF INVESTMENTS (continued)
December 31, 2023
| Security Description | | | Principal
Amount | | Value |
Series EMTN, 2.88%, 4/11/2029
| | GBP | 200,000 | | $ 233,571 |
Series EMTN, 5.75%, 9/14/2040
| | GBP | 350,000 | | 465,189 |
| Eni SpA: | | | | | |
Series EMTN, 0.38%, 6/14/2028
| | EUR | 100,000 | | 98,277 |
Series EMTN, 0.63%, 1/23/2030
| | EUR | 300,000 | | 285,285 |
Series EMTN, 1.25%, 5/18/2026
| | EUR | 100,000 | | 105,823 |
Series EMTN, 1.50%, 2/2/2026
| | EUR | 200,000 | | 212,491 |
Series EMTN, 2.00%, 5/18/2031
| | EUR | 350,000 | | 354,428 |
Series EMTN, 3.63%, 1/29/2029
| | EUR | 200,000 | | 226,737 |
Series EMTN, 3.75%, 9/12/2025
| | EUR | 150,000 | | 166,573 |
Series EMTN, 4.25%, 5/19/2033
| | EUR | 150,000 | | 173,788 |
| Intesa Sanpaolo SpA: | | | | | |
Series EMTN, 0.75%, 3/16/2028 (b)
| | EUR | 500,000 | | 496,763 |
Series EMTN, 1.00%, 11/19/2026
| | EUR | 300,000 | | 310,310 |
Series EMTN, 1.75%, 3/20/2028
| | EUR | 250,000 | | 257,707 |
Series EMTN, 1.75%, 7/4/2029
| | EUR | 300,000 | | 301,792 |
Series EMTN, 2.13%, 5/26/2025
| | EUR | 200,000 | | 216,443 |
Series EMTN, 4.75%, 9/6/2027
| | EUR | 200,000 | | 228,929 |
Series EMTN, 4.88%, 5/19/2030
| | EUR | 250,000 | | 290,366 |
Series EMTN, 6.63%, 5/31/2033
| | GBP | 200,000 | | 268,763 |
Series EMTN, 3 mo. EUR EURIBOR + 1.70%, 5.00%, 3/8/2028 (a)
| | EUR | 450,000 | | 514,145 |
Snam SpA Series EMTN, 0.88%, 10/25/2026
| | EUR | 200,000 | | 208,094 |
Terna - Rete Elettrica Nazionale Series EMTN, 1.38%, 7/26/2027
| | EUR | 200,000 | | 208,056 |
| UniCredit SpA: | | | | | |
Series EMTN, 0.33%, 1/19/2026
| | EUR | 100,000 | | 103,959 |
Series EMTN, 0.50%, 4/9/2025
| | EUR | 100,000 | | 106,123 |
Series EMTN, 0.85%, 1/19/2031
| | EUR | 100,000 | | 91,009 |
Series EMTN, 3 mo. EUR EURIBOR - 0.90%, 0.80%, 7/5/2029 (a) (b)
| | EUR | 300,000 | | 294,418 |
| Security Description | | | Principal
Amount | | Value |
Series EMTN, 3 mo. EUR EURIBOR - 1.35%, 1.20%, 1/20/2026 (a)
| | EUR | 250,000 | | $ 267,922 |
Series EMTN, 3 mo. EUR EURIBOR - 1.60%, 1.25%, 6/16/2026 (a)
| | EUR | 350,000 | | 372,972 |
Series EMTN, 3 mo. EUR EURIBOR - 2.55%, 2.20%, 7/22/2027 (a)
| | EUR | 250,000 | | 266,566 |
Series EMTN, 3 mo. EUR EURIBOR + 0.85%, 0.93%, 1/18/2028 (a)
| | EUR | 200,000 | | 205,021 |
Series EMTN, 3 mo. EUR EURIBOR + 1.60%, 4.45%, 2/16/2029 (a)
| | EUR | 350,000 | | 395,219 |
Series EMTN, 3 mo. EUR EURIBOR + 1.90%, 4.80%, 1/17/2029 (a)
| | EUR | 100,000 | | 115,445 |
Series EMTN, 3 mo. EUR EURIBOR + 2.85%, 5.85%, 11/15/2027 (a)
| | EUR | 300,000 | | 350,811 |
| | | | | | 11,100,849 |
| JAPAN — 2.2% | | | |
| Mizuho Financial Group, Inc.: | | | | | |
Series EMTN, 0.69%, 10/7/2030
| | EUR | 300,000 | | 275,886 |
3 mo. EUR EURIBOR - 0.72%, 0.47%, 9/6/2029 (a)
| | EUR | 100,000 | | 95,339 |
| NTT Finance Corp.: | | | | | |
0.01%, 3/3/2025
| | EUR | 200,000 | | 211,952 |
0.34%, 3/3/2030
| | EUR | 300,000 | | 284,312 |
Series 18, 0.38%, 9/20/2030
| | JPY | 100,000,000 | | 692,537 |
Series 26, 0.84%, 6/20/2033
| | JPY | 100,000,000 | | 694,314 |
Seven & i Holdings Co. Ltd. Series 14, 0.19%, 12/19/2025
| | JPY | 100,000,000 | | 707,782 |
| Sumitomo Mitsui Financial Group, Inc.: | | | | | |
Series EMTN, 0.63%, 10/23/2029
| | EUR | 100,000 | | 94,464 |
1.55%, 6/15/2026
| | EUR | 400,000 | | 423,476 |
| Takeda Pharmaceutical Co. Ltd.: | | | | | |
1.38%, 7/9/2032
| | EUR | 500,000 | | 472,589 |
2.00%, 7/9/2040
| | EUR | 200,000 | | 175,200 |
2.25%, 11/21/2026
| | EUR | 190,000 | | 204,953 |
See accompanying notes to financial statements.
35
SPDR BLOOMBERG INTERNATIONAL CORPORATE BOND ETF
SCHEDULE OF INVESTMENTS (continued)
December 31, 2023
| Security Description | | | Principal
Amount | | Value |
3.00%, 11/21/2030
| | EUR | 400,000 | | $ 435,619 |
| | | | | | 4,768,423 |
| MEXICO — 0.1% | | | |
America Movil SAB de CV 4.38%, 8/7/2041
| | GBP | 100,000 | | 118,356 |
| NETHERLANDS — 6.3% | | | |
| ABN AMRO Bank NV: | | | | | |
Series EMTN, 0.50%, 9/23/2029
| | EUR | 400,000 | | 375,152 |
0.60%, 1/15/2027
| | EUR | 400,000 | | 407,649 |
Series EMTN, 1.00%, 4/16/2025
| | EUR | 218,000 | | 233,647 |
Series EMTN, 1.25%, 5/28/2025
| | EUR | 200,000 | | 214,106 |
Series EMTN, 1.25%, 1/20/2034
| | EUR | 100,000 | | 89,426 |
Series EMTN, 3.88%, 12/21/2026
| | EUR | 300,000 | | 338,073 |
Series EMTN, 4.00%, 1/16/2028
| | EUR | 100,000 | | 113,258 |
Series EMTN, 4.25%, 2/21/2030
| | EUR | 400,000 | | 458,786 |
4.38%, 10/20/2028
| | EUR | 300,000 | | 343,508 |
4.50%, 11/21/2034
| | EUR | 100,000 | | 118,527 |
Series EMTN, 5.25%, 5/26/2026
| | GBP | 200,000 | | 256,849 |
| ASML Holding NV: | | | | | |
1.38%, 7/7/2026
| | EUR | 200,000 | | 212,916 |
Series EMTN, 3.50%, 12/6/2025
| | EUR | 150,000 | | 167,005 |
| Cooperatieve Rabobank UA: | | | | | |
Series GMTN, 1.13%, 5/7/2031
| | EUR | 200,000 | | 189,653 |
Series GMTN, 1.25%, 3/23/2026
| | EUR | 340,000 | | 361,767 |
Series GMTN, 1.38%, 2/3/2027 (b)
| | EUR | 200,000 | | 210,129 |
Series EMTN, 4.00%, 1/10/2030
| | EUR | 300,000 | | 342,102 |
4.13%, 7/14/2025 (b)
| | EUR | 450,000 | | 502,550 |
Series GMTN, 3 mo. EUR EURIBOR - 0.52%, 0.38%, 12/1/2027 (a)
| | EUR | 400,000 | | 405,210 |
Series GMTN, 3 mo. EUR EURIBOR - 1.18%, 0.88%, 5/5/2028 (a)
| | EUR | 200,000 | | 203,591 |
Series GMTN, 3 mo. EUR EURIBOR + 1.15%, 4.23%, 4/25/2029 (a)
| | EUR | 300,000 | | 340,936 |
| Security Description | | | Principal
Amount | | Value |
Series GMTN, 3 mo. EUR EURIBOR + 1.55%, 4.63%, 1/27/2028 (a)
| | EUR | 200,000 | | $ 228,687 |
Heineken NV Series EMTN, 1.00%, 5/4/2026
| | EUR | 200,000 | | 210,674 |
| ING Groep NV: | | | | | |
Series EMTN, 2.13%, 1/10/2026
| | EUR | 300,000 | | 324,428 |
Series EMTN, 2.50%, 11/15/2030
| | EUR | 200,000 | | 211,364 |
Series EMTN, 3.00%, 2/18/2026
| | GBP | 300,000 | | 368,596 |
3 mo. EUR EURIBOR - 0.68%, 0.25%, 2/18/2029 (a)
| | EUR | 300,000 | | 287,411 |
3 mo. EUR EURIBOR - 0.70%, 0.25%, 2/1/2030 (a)
| | EUR | 500,000 | | 465,466 |
3 mo. EUR EURIBOR - 0.70%, 0.38%, 9/29/2028 (a)
| | EUR | 400,000 | | 392,036 |
Series GMTN, 3 mo. EUR EURIBOR + 0.85%, 1.25%, 2/16/2027 (a) (b)
| | EUR | 400,000 | | 420,080 |
Series EMTN, 3 mo. EUR EURIBOR + 1.10%, 2.13%, 5/23/2026 (a)
| | EUR | 500,000 | | 540,201 |
3 mo. EUR EURIBOR + 1.15%, 1.75%, 2/16/2031 (a)
| | EUR | 400,000 | | 395,120 |
3 mo. EUR EURIBOR + 1.60%, 4.50%, 5/23/2029 (a)
| | EUR | 200,000 | | 227,598 |
Series EMTN, 3 mo. EUR EURIBOR + 1.85%, 4.88%, 11/14/2027 (a)
| | EUR | 200,000 | | 229,034 |
3 mo. EUR EURIBOR + 1.90%, 4.75%, 5/23/2034 (a)
| | EUR | 100,000 | | 117,431 |
3 mo. EUR EURIBOR + 2.15%, 5.25%, 11/14/2033 (a)
| | EUR | 400,000 | | 485,080 |
Series EMTN, Sterling Overnight Index Average + 0.91%, 1.13%, 12/7/2028 (a)
| | GBP | 100,000 | | 111,855 |
Koninklijke KPN NV Series GMTN, 5.75%, 9/17/2029
| | GBP | 120,000 | | 160,774 |
| LeasePlan Corp. NV: | | | | | |
Series EMTN, 0.25%, 2/23/2026
| | EUR | 350,000 | | 359,985 |
See accompanying notes to financial statements.
36
SPDR BLOOMBERG INTERNATIONAL CORPORATE BOND ETF
SCHEDULE OF INVESTMENTS (continued)
December 31, 2023
| Security Description | | | Principal
Amount | | Value |
Series EMTN, 0.25%, 9/7/2026
| | EUR | 100,000 | | $ 101,411 |
| Shell International Finance BV: | | | | | |
Series EMTN, 0.13%, 11/8/2027
| | EUR | 300,000 | | 299,495 |
Series EMTN, 0.50%, 11/8/2031
| | EUR | 100,000 | | 91,460 |
Series EMTN, 0.75%, 8/15/2028
| | EUR | 100,000 | | 100,516 |
Series EMTN, 0.88%, 11/8/2039
| | EUR | 100,000 | | 76,177 |
Series EMTN, 1.25%, 11/11/2032
| | EUR | 400,000 | | 379,545 |
Series EMTN, 1.50%, 4/7/2028
| | EUR | 400,000 | | 417,849 |
Series EMTN, 1.63%, 1/20/2027
| | EUR | 300,000 | | 318,864 |
Series EMTN, 1.88%, 9/15/2025
| | EUR | 200,000 | | 216,336 |
Series EMTN, 1.88%, 4/7/2032
| | EUR | 200,000 | | 202,323 |
Series EMTN, 2.50%, 3/24/2026 (b)
| | EUR | 200,000 | | 218,667 |
| | | | | | 13,843,303 |
| NORWAY — 0.9% | | | |
| DNB Bank ASA: | | | | | |
1 yr. U.K. Government Bond + 1.35%, 2.63%, 6/10/2026 (a)
| | GBP | 100,000 | | 122,928 |
Series EMTN, 1 yr. U.K. Government Bond + 2.15%, 4.00%, 8/17/2027 (a)
| | GBP | 200,000 | | 248,417 |
Series EMTN, 3 mo. EUR EURIBOR - 0.53%, 0.25%, 2/23/2029 (a)
| | EUR | 300,000 | | 290,531 |
Series EMTN, 3 mo. EUR EURIBOR + 0.32%, 0.38%, 1/18/2028 (a)
| | EUR | 200,000 | | 202,389 |
Series EMTN, 3 mo. EUR EURIBOR + 0.63%, 3.63%, 2/16/2027 (a)
| | EUR | 100,000 | | 110,769 |
Series EMTN, 3 mo. EUR EURIBOR + 0.65%, 4.00%, 3/14/2029 (a)
| | EUR | 200,000 | | 227,571 |
Series EMTN, 3 mo. EUR EURIBOR + 0.77%, 3.13%, 9/21/2027 (a)
| | EUR | 300,000 | | 330,187 |
| Security Description | | | Principal
Amount | | Value |
Series EMTN, 3 mo. EUR EURIBOR + 1.00%, 4.50%, 7/19/2028 (a)
| | EUR | 200,000 | | $ 228,278 |
SpareBank 1 SR-Bank ASA Series EMTN, 3.75%, 11/23/2027
| | EUR | 200,000 | | 224,581 |
| | | | | | 1,985,651 |
| PORTUGAL — 0.1% | | | |
EDP Finance BV Series EMTN, 1.88%, 9/21/2029
| | EUR | 200,000 | | 206,177 |
| SPAIN — 5.9% | | | |
| Abertis Infraestructuras SA: | | | | | |
Series EMTN, 2.38%, 9/27/2027
| | EUR | 200,000 | | 215,062 |
Series EMTN, 3.00%, 3/27/2031
| | EUR | 200,000 | | 210,431 |
| Banco Bilbao Vizcaya Argentaria SA: | | | | | |
Series GMTN, 0.38%, 11/15/2026
| | EUR | 200,000 | | 204,515 |
Series GMTN, 0.50%, 1/14/2027
| | EUR | 200,000 | | 203,695 |
Series GMTN, 0.75%, 6/4/2025
| | EUR | 400,000 | | 425,677 |
1.00%, 6/21/2026
| | EUR | 200,000 | | 209,716 |
Series GMTN, 1.38%, 5/14/2025
| | EUR | 100,000 | | 107,101 |
Series GMTN, 1.75%, 11/26/2025
| | EUR | 200,000 | | 214,839 |
Series GMTN, 3.38%, 9/20/2027
| | EUR | 300,000 | | 334,263 |
Series GMTN, 4.38%, 10/14/2029
| | EUR | 200,000 | | 234,654 |
Series GMTN, 3 mo. EUR EURIBOR - 0.52%, 0.13%, 3/24/2027 (a)
| | EUR | 300,000 | | 308,470 |
3 mo. EUR EURIBOR + 0.82%, 0.88%, 1/14/2029 (a) (b)
| | EUR | 200,000 | | 200,189 |
3 mo. EUR EURIBOR + 1.70%, 4.63%, 1/13/2031 (a) (b)
| | EUR | 200,000 | | 231,946 |
Banco de Sabadell SA Series EMTN, 0.88%, 7/22/2025
| | EUR | 100,000 | | 106,256 |
| Banco Santander SA: | | | | | |
Series EMTN, 0.20%, 2/11/2028
| | EUR | 100,000 | | 97,669 |
Series EMTN, 0.30%, 10/4/2026
| | EUR | 100,000 | | 102,601 |
Series EMTN, 0.50%, 2/4/2027
| | EUR | 300,000 | | 303,877 |
Series EMTN, 1.00%, 11/4/2031
| | EUR | 200,000 | | 189,087 |
See accompanying notes to financial statements.
37
SPDR BLOOMBERG INTERNATIONAL CORPORATE BOND ETF
SCHEDULE OF INVESTMENTS (continued)
December 31, 2023
| Security Description | | | Principal
Amount | | Value |
Series EMTN, 1.13%, 1/17/2025 (b)
| | EUR | 200,000 | | $ 214,886 |
Series EMTN, 1.13%, 6/23/2027
| | EUR | 200,000 | | 206,024 |
Series EMTN, 1.38%, 1/5/2026
| | EUR | 200,000 | | 211,758 |
Series EMTN, 3.75%, 1/16/2026
| | EUR | 400,000 | | 445,422 |
Series EMTN, 3.88%, 1/16/2028 (b)
| | EUR | 500,000 | | 565,201 |
Series EMTN, 4.25%, 6/12/2030
| | EUR | 100,000 | | 115,484 |
Series EMTN, 4.88%, 10/18/2031
| | EUR | 200,000 | | 235,127 |
Series EMTN, 1 yr. EUR Swap - 0.78%, 0.63%, 6/24/2029 (a)
| | EUR | 400,000 | | 391,005 |
Series EMTN, 1 yr. EUR Swap + 1.05%, 3.63%, 9/27/2026 (a)
| | EUR | 300,000 | | 331,803 |
Series EMTN, 3 mo. EUR EURIBOR - 0.85%, 0.50%, 3/24/2027 (a)
| | EUR | 300,000 | | 309,055 |
| CaixaBank SA: | | | | | |
Series EMTN, 1.13%, 3/27/2026
| | EUR | 200,000 | | 210,287 |
Series EMTN, 1.38%, 6/19/2026
| | EUR | 100,000 | | 104,856 |
Series EMTN, 3.75%, 9/7/2029
| | EUR | 200,000 | | 226,477 |
Series EMTN, 4.25%, 9/6/2030
| | EUR | 300,000 | | 343,955 |
Series EMTN, 3 mo. EUR EURIBOR - 0.85%, 0.38%, 11/18/2026 (a)
| | EUR | 400,000 | | 415,605 |
Series EMTN, 3 mo. EUR EURIBOR - 0.90%, 0.50%, 2/9/2029 (a)
| | EUR | 200,000 | | 194,669 |
Series EMTN, 3 mo. EUR EURIBOR - 1.00%, 0.75%, 5/26/2028 (a)
| | EUR | 200,000 | | 201,259 |
Series EMTN, 3 mo. EUR EURIBOR - 1.17%, 0.75%, 7/10/2026 (a)
| | EUR | 400,000 | | 424,323 |
Series EMTN, 3 mo. EUR EURIBOR + 0.62%, 0.63%, 1/21/2028 (a) (b)
| | EUR | 200,000 | | 203,744 |
Series GMTN, 3 mo. EUR EURIBOR + 0.80%, 1.63%, 4/13/2026 (a)
| | EUR | 400,000 | | 429,837 |
| Security Description | | | Principal
Amount | | Value |
Series EMTN, 3 mo. EUR EURIBOR + 2.40%, 5.38%, 11/14/2030 (a)
| | EUR | 300,000 | | $ 357,338 |
| Iberdrola Finanzas SA: | | | | | |
Series EMTN, 1.00%, 3/7/2025
| | EUR | 200,000 | | 214,622 |
Series EMTN, 1.38%, 3/11/2032
| | EUR | 200,000 | | 195,884 |
Iberdrola International BV Series EMTN, 1.13%, 4/21/2026
| | EUR | 100,000 | | 106,396 |
| Naturgy Finance BV: | | | | | |
Series EMTN, 1.25%, 1/15/2026
| | EUR | 200,000 | | 211,738 |
Series EMTN, 1.38%, 1/19/2027 (b)
| | EUR | 200,000 | | 209,402 |
Santander Consumer Finance SA Series EMTN, 0.38%, 1/17/2025 (b)
| | EUR | 200,000 | | 213,552 |
| Telefonica Emisiones SA: | | | | | |
Series EMTN, 0.66%, 2/3/2030
| | EUR | 200,000 | | 190,856 |
Series EMTN, 1.20%, 8/21/2027
| | EUR | 300,000 | | 309,293 |
Series EMTN, 1.45%, 1/22/2027
| | EUR | 200,000 | | 210,671 |
Series EMTN, 1.53%, 1/17/2025
| | EUR | 300,000 | | 324,100 |
Series EMTN, 1.72%, 1/12/2028
| | EUR | 400,000 | | 417,824 |
Series EMTN, 1.79%, 3/12/2029
| | EUR | 100,000 | | 103,965 |
Series EMTN, 2.59%, 5/25/2031
| | EUR | 200,000 | | 212,203 |
| | | | | | 12,958,669 |
| SWEDEN — 2.0% | | | |
| Skandinaviska Enskilda Banken AB: | | | | | |
Series EMTN, 0.38%, 2/11/2027
| | EUR | 200,000 | | 201,254 |
Series GMTN, 0.38%, 6/21/2028
| | EUR | 200,000 | | 193,013 |
Series EMTN, 0.63%, 11/12/2029
| | EUR | 200,000 | | 188,285 |
Series GMTN, 1.75%, 11/11/2026
| | EUR | 400,000 | | 424,055 |
Series GMTN, 3.25%, 11/24/2025
| | EUR | 200,000 | | 221,004 |
Series GMTN, 3.75%, 2/7/2028
| | EUR | 400,000 | | 446,469 |
Series EMTN, 3.88%, 5/9/2028 (b)
| | EUR | 150,000 | | 169,603 |
4.00%, 11/9/2026
| | EUR | 100,000 | | 112,310 |
See accompanying notes to financial statements.
38
SPDR BLOOMBERG INTERNATIONAL CORPORATE BOND ETF
SCHEDULE OF INVESTMENTS (continued)
December 31, 2023
| Security Description | | | Principal
Amount | | Value |
| Svenska Handelsbanken AB: | | | | | |
Series EMTN, 0.05%, 9/6/2028
| | EUR | 400,000 | | $ 384,058 |
Series EMTN, 0.13%, 11/3/2026
| | EUR | 200,000 | | 203,028 |
0.50%, 2/18/2030
| | EUR | 200,000 | | 187,004 |
Series EMTN, 1.00%, 4/15/2025
| | EUR | 400,000 | | 428,582 |
3.38%, 2/17/2028
| | EUR | 200,000 | | 222,903 |
| Swedbank AB: | | | | | |
Series GMTN, 0.25%, 11/2/2026
| | EUR | 200,000 | | 203,737 |
Series EMTN, 0.75%, 5/5/2025
| | EUR | 100,000 | | 106,474 |
Series EMTN, 2.10%, 5/25/2027 (b)
| | EUR | 300,000 | | 318,886 |
Series EMTN, 3.75%, 11/14/2025
| | EUR | 200,000 | | 222,738 |
1 yr. EUR Swap - 0.57%, 0.30%, 5/20/2027 (a)
| | EUR | 200,000 | | 204,018 |
| | | | | | 4,437,421 |
| SWITZERLAND — 4.0% | | | |
| Credit Suisse AG: | | | | | |
Series EMTN, 0.25%, 1/5/2026
| | EUR | 200,000 | | 207,215 |
Series EMTN, 0.25%, 9/1/2028
| | EUR | 100,000 | | 95,910 |
Series EMTN, 1.13%, 12/15/2025
| | GBP | 200,000 | | 236,348 |
Series EMTN, 1.50%, 4/10/2026
| | EUR | 350,000 | | 369,762 |
| Holcim Finance Luxembourg SA: | | | | | |
Series EMTN, 0.50%, 9/3/2030
| | EUR | 200,000 | | 183,412 |
Series EMTN, 2.25%, 5/26/2028
| | EUR | 200,000 | | 214,037 |
Novartis Finance SA Zero Coupon, 9/23/2028
| | EUR | 300,000 | | 293,058 |
| Richemont International Holding SA: | | | | | |
1.00%, 3/26/2026
| | EUR | 100,000 | | 105,878 |
1.50%, 3/26/2030
| | EUR | 300,000 | | 306,497 |
2.00%, 3/26/2038
| | EUR | 300,000 | | 286,956 |
Sika Capital BV 3.75%, 11/3/2026
| | EUR | 200,000 | | 224,536 |
| UBS AG: | | | | | |
Series EMTN, 0.01%, 3/31/2026
| | EUR | 300,000 | | 308,592 |
Series EMTN, 0.50%, 3/31/2031
| | EUR | 200,000 | | 180,522 |
| UBS Group AG: | | | | | |
Series EMTN, 0.63%, 1/18/2033
| | EUR | 263,000 | | 219,082 |
0.63%, 2/24/2033
| | EUR | 300,000 | | 254,068 |
| Security Description | | | Principal
Amount | | Value |
0.88%, 11/3/2031
| | EUR | 200,000 | | $ 178,232 |
Series EMTN, 1.25%, 9/1/2026
| | EUR | 300,000 | | 314,858 |
1 yr. EUR Swap - 0.48%, 0.25%, 11/3/2026 (a)
| | EUR | 400,000 | | 414,283 |
Series EMTN, 1 yr. EUR Swap - 0.77%, 0.25%, 11/5/2028 (a)
| | EUR | 350,000 | | 339,997 |
1 yr. EUR Swap + 1.60%, 2.13%, 10/13/2026 (a)
| | EUR | 200,000 | | 214,628 |
1 yr. EUR Swap + 1.95%, 2.88%, 4/2/2032 (a)
| | EUR | 200,000 | | 206,280 |
Series EMTN, 1 yr. EURIBOR ICE Swap - 0.55%, 0.25%, 1/29/2026 (a)
| | EUR | 200,000 | | 211,652 |
Series EMTN, 1 yr. EURIBOR ICE Swap - 1.05%, 1.00%, 6/24/2027 (a)
| | EUR | 500,000 | | 518,098 |
Series EMTN, 1 yr. EURIBOR ICE Swap - 3.50%, 3.25%, 4/2/2026 (a)
| | EUR | 400,000 | | 437,695 |
Series EMTN, 1 yr. EURIBOR ICE Swap + 1.15%, 4.63%, 3/17/2028 (a)
| | EUR | 200,000 | | 227,158 |
Series EMTN, 1 yr. EURIBOR ICE Swap + 1.35%, 3.13%, 6/15/2030 (a)
| | EUR | 400,000 | | 429,687 |
Series EMTN, 1 yr. EURIBOR ICE Swap + 1.55%, 4.38%, 1/11/2031 (a)
| | EUR | 200,000 | | 227,911 |
1 yr. EURIBOR ICE Swap + 4.95%, 7.75%, 3/1/2029 (a)
| | EUR | 400,000 | | 508,944 |
Series EMTN, 1 yr. U.K. Government Bond + 2.23%, 2.25%, 6/9/2028 (a)
| | GBP | 300,000 | | 346,495 |
1 yr. U.K. Government Bond + 4.20%, 7.00%, 9/30/2027 (a)
| | GBP | 100,000 | | 132,660 |
1 yr. U.K. Government Bond + 4.55%, 7.38%, 9/7/2033 (a)
| | GBP | 100,000 | | 146,665 |
Series EMTN, 1 yr. EUR Swap - 0.77%, 0.65%, 1/14/2028 (a)
| | EUR | 350,000 | | 353,184 |
| | | | | | 8,694,300 |
See accompanying notes to financial statements.
39
SPDR BLOOMBERG INTERNATIONAL CORPORATE BOND ETF
SCHEDULE OF INVESTMENTS (continued)
December 31, 2023
| Security Description | | | Principal
Amount | | Value |
| UNITED KINGDOM — 9.1% | | | |
Annington Funding PLC Series EMTN, 3.94%, 7/12/2047
| | GBP | 200,000 | | $ 197,984 |
| Barclays PLC: | | | | | |
Series EMTN, 3.25%, 2/12/2027
| | GBP | 300,000 | | 361,169 |
Series EMTN, 3.25%, 1/17/2033
| | GBP | 150,000 | | 163,173 |
1 yr. EUR Swap - 1.26%, 0.58%, 8/9/2029 (a)
| | EUR | 300,000 | | 285,079 |
Series EMTN, 1 yr. EUR Swap + 0.78%, 1.38%, 1/24/2026 (a)
| | EUR | 100,000 | | 107,222 |
Series EMTN, 1 yr. EUR Swap + 1.75%, 4.92%, 8/8/2030 (a) (b)
| | EUR | 150,000 | | 172,526 |
Series EMTN, 1 yr. EUR Swap + 2.55%, 5.26%, 1/29/2034 (a)
| | EUR | 400,000 | | 472,681 |
1 yr. EURIBOR ICE Swap + 0.85%, 0.88%, 1/28/2028 (a)
| | EUR | 500,000 | | 506,881 |
Series EMTN, 1 yr. EURIBOR ICE Swap + 1.68%, 2.89%, 1/31/2027 (a)
| | EUR | 150,000 | | 162,869 |
Series EMTN, 1 yr. U.K. Government Bond + 2.80%, 6.37%, 1/31/2031 (a)
| | GBP | 250,000 | | 330,422 |
1 yr. EUR Swap + 1.00%, 1.11%, 5/12/2032 (a)
| | EUR | 300,000 | | 269,980 |
BAT International Finance PLC Series EMTN, 2.25%, 1/16/2030
| | EUR | 200,000 | | 196,386 |
BG Energy Capital PLC Series EMTN, 5.13%, 12/1/2025
| | GBP | 200,000 | | 257,984 |
| BP Capital Markets PLC: | | | | | |
Series EMTN, 1.23%, 5/8/2031
| | EUR | 200,000 | | 192,749 |
Series EMTN, 2.52%, 4/7/2028
| | EUR | 300,000 | | 325,078 |
2.82%, 4/7/2032
| | EUR | 100,000 | | 107,368 |
| British Telecommunications PLC: | | | | | |
Series EMTN, 1.50%, 6/23/2027
| | EUR | 350,000 | | 365,446 |
Series EMTN, 1.75%, 3/10/2026
| | EUR | 100,000 | | 107,070 |
| Cadent Finance PLC: | | | | | |
Series EMTN, 2.13%, 9/22/2028
| | GBP | 100,000 | | 114,237 |
Series EMTN, 2.63%, 9/22/2038
| | GBP | 100,000 | | 92,107 |
| Security Description | | | Principal
Amount | | Value |
Series EMTN, 2.75%, 9/22/2046
| | GBP | 200,000 | | $ 168,445 |
CCEP Finance Ireland DAC 0.88%, 5/6/2033
| | EUR | 200,000 | | 178,594 |
Centrica PLC Series EMTN, 7.00%, 9/19/2033
| | GBP | 100,000 | | 146,402 |
CK Hutchison Group Telecom Finance SA 0.75%, 4/17/2026
| | EUR | 300,000 | | 311,955 |
Connect Plus M25 Issuer PLC 2.61%, 3/31/2039
| | GBP | 86,355 | | 93,526 |
Diageo Finance PLC Series EMTN, 2.50%, 3/27/2032 (b)
| | EUR | 200,000 | | 211,990 |
easyJet FinCo BV Series EMTN, 1.88%, 3/3/2028
| | EUR | 200,000 | | 206,231 |
| GlaxoSmithKline Capital PLC: | | | | | |
Series EMTN, 1.25%, 5/21/2026
| | EUR | 300,000 | | 318,850 |
Series EMTN, 1.38%, 12/2/2024
| | EUR | 200,000 | | 216,255 |
Series EMTN, 1.63%, 5/12/2035
| | GBP | 100,000 | | 97,223 |
| Heathrow Funding Ltd.: | | | | | |
Series EMTN, 4.63%, 10/31/2048 (b)
| | GBP | 200,000 | | 234,077 |
Series EMTN, 5.88%, 5/13/2043
| | GBP | 200,000 | | 274,868 |
6.45%, 12/10/2033
| | GBP | 100,000 | | 141,134 |
Series EMTN, 6.75%, 12/3/2028
| | GBP | 100,000 | | 133,986 |
| HSBC Holdings PLC: | | | | | |
Series EMTN, 2.50%, 3/15/2027
| | EUR | 300,000 | | 324,762 |
1 yr. GBP SONIA ICE Swap + 1.32%, 2.26%, 11/13/2026 (a)
| | GBP | 100,000 | | 120,756 |
1 yr. GBP Swap + 1.65%, 3.00%, 7/22/2028 (a)
| | GBP | 400,000 | | 474,591 |
1 yr. GBP Swap + 1.77%, 3.00%, 5/29/2030 (a)
| | GBP | 100,000 | | 114,531 |
3 mo. EUR EURIBOR - 0.78%, 0.64%, 9/24/2029 (a) (b)
| | EUR | 200,000 | | 193,730 |
3 mo. EUR EURIBOR - 0.81%, 0.31%, 11/13/2026 (a)
| | EUR | 200,000 | | 208,113 |
3 mo. EUR EURIBOR - 1.03%, 0.77%, 11/13/2031 (a) (b)
| | EUR | 400,000 | | 370,122 |
See accompanying notes to financial statements.
40
SPDR BLOOMBERG INTERNATIONAL CORPORATE BOND ETF
SCHEDULE OF INVESTMENTS (continued)
December 31, 2023
| Security Description | | | Principal
Amount | | Value |
Series EMTN, 3 mo. EUR EURIBOR + 1.29%, 4.75%, 3/10/2028 (a)
| | EUR | 300,000 | | $ 343,638 |
3 mo. EUR EURIBOR + 1.45%, 3.02%, 6/15/2027 (a)
| | EUR | 300,000 | | 327,202 |
Series EMTN, 3 mo. EUR EURIBOR + 1.55%, 4.79%, 3/10/2032 (a)
| | EUR | 300,000 | | 350,245 |
Series EMTN, 3 mo. EUR EURIBOR + 1.94%, 4.86%, 5/23/2033 (a)
| | EUR | 110,000 | | 128,889 |
Sterling Overnight Index Average + 1.31%, 1.75%, 7/24/2027 (a)
| | GBP | 100,000 | | 117,050 |
Sterling Overnight Index Average + 2.12%, 6.80%, 9/14/2031 (a)
| | GBP | 200,000 | | 274,699 |
Imperial Brands Finance Netherlands BV Series EMTN, 1.75%, 3/18/2033
| | EUR | 200,000 | | 172,672 |
Lloyds Bank Corporate Markets PLC Series EMTN, 2.38%, 4/9/2026
| | EUR | 100,000 | | 108,422 |
Lloyds Bank PLC Series EMTN, 6.50%, 9/17/2040
| | GBP | 140,000 | | 212,808 |
| Lloyds Banking Group PLC: | | | | | |
Series EMTN, 1.50%, 9/12/2027
| | EUR | 100,000 | | 104,312 |
Series EMTN, 1 yr. EUR Swap - 3.75%, 3.50%, 4/1/2026 (a)
| | EUR | 300,000 | | 330,248 |
Series EMTN, 1 yr. EUR Swap + 1.50%, 3.13%, 8/24/2030 (a)
| | EUR | 450,000 | | 483,978 |
1 yr. U.K. Government Bond + 1.30%, 1.88%, 1/15/2026 (a)
| | GBP | 300,000 | | 367,311 |
National Grid Electricity Distribution West Midlands PLC Series EMTN, 5.75%, 4/16/2032
| | GBP | 200,000 | | 270,990 |
National Grid PLC Series EMTN, 4.28%, 1/16/2035
| | EUR | 200,000 | | 228,394 |
| Nationwide Building Society: | | | | | |
0.25%, 7/22/2025
| | EUR | 400,000 | | 420,390 |
Series EMTN, 6.13%, 8/21/2028
| | GBP | 100,000 | | 136,033 |
| Security Description | | | Principal
Amount | | Value |
3 mo. EUR EURIBOR + 0.93%, 1.50%, 3/8/2026 (a)
| | EUR | 200,000 | | $ 214,937 |
| NatWest Group PLC: | | | | | |
Series EMTN, 1 yr. GBP Swap + 1.49%, 2.88%, 9/19/2026 (a)
| | GBP | 300,000 | | 366,198 |
Series EMTN, 1 yr. U.K. Government Bond + 2.10%, 3.62%, 3/29/2029 (a)
| | GBP | 200,000 | | 238,785 |
3 mo. EUR EURIBOR - 0.89%, 0.67%, 9/14/2029 (a)
| | EUR | 200,000 | | 191,868 |
Series EMTN, 3 mo. EUR EURIBOR - 0.95%, 0.78%, 2/26/2030 (a)
| | EUR | 200,000 | | 190,224 |
Series EMTN, 3 mo. EUR EURIBOR + 1.08%, 1.75%, 3/2/2026 (a)
| | EUR | 275,000 | | 295,697 |
Series EMTN, 3 mo. EUR EURIBOR + 1.91%, 4.07%, 9/6/2028 (a)
| | EUR | 400,000 | | 449,722 |
| NatWest Markets PLC: | | | | | |
Series EMTN, 0.13%, 11/12/2025
| | EUR | 250,000 | | 260,064 |
Series EMTN, 0.13%, 6/18/2026
| | EUR | 100,000 | | 102,312 |
Series EMTN, 1.38%, 3/2/2027
| | EUR | 200,000 | | 207,812 |
Series EMTN, 2.75%, 4/2/2025
| | EUR | 100,000 | | 109,392 |
Santander U.K. Group Holdings PLC Series EMTN, 1 yr. GBP Swap + 2.87%, 7.10%, 11/16/2027 (a)
| | GBP | 100,000 | | 132,492 |
Sky Ltd. Series EMTN, 2.50%, 9/15/2026
| | EUR | 330,000 | | 358,695 |
Standard Chartered PLC 1 yr. EUR Swap + 1.85%, 4.87%, 5/10/2031 (a)
| | EUR | 200,000 | | 231,235 |
Thames Water Utilities Finance PLC Series EMTN, 4.38%, 1/18/2031
| | EUR | 200,000 | | 208,295 |
THFC Funding No. 3 PLC Series EMTN, 5.20%, 10/11/2045
| | GBP | 250,000 | | 323,487 |
| Unilever Finance Netherlands BV: | | | | | |
Series EMTN, 1.25%, 3/25/2025
| | EUR | 200,000 | | 215,386 |
1.75%, 3/25/2030
| | EUR | 200,000 | | 207,236 |
See accompanying notes to financial statements.
41
SPDR BLOOMBERG INTERNATIONAL CORPORATE BOND ETF
SCHEDULE OF INVESTMENTS (continued)
December 31, 2023
| Security Description | | | Principal
Amount | | Value |
University of Oxford 2.54%, 12/8/2117
| | GBP | 140,000 | | $ 104,440 |
| Vodafone Group PLC: | | | | | |
Series EMTN, 1.13%, 11/20/2025
| | EUR | 300,000 | | 318,769 |
Series EMTN, 1.60%, 7/29/2031
| | EUR | 100,000 | | 98,906 |
Series EMTN, 1.63%, 11/24/2030
| | EUR | 200,000 | | 200,323 |
Series EMTN, 1.88%, 9/11/2025
| | EUR | 150,000 | | 161,356 |
Series EMTN, 2.20%, 8/25/2026
| | EUR | 428,000 | | 463,396 |
Series EMTN, 3.00%, 8/12/2056
| | GBP | 100,000 | | 81,522 |
Series EMTN, 3.38%, 8/8/2049
| | GBP | 200,000 | | 183,647 |
| Wellcome Trust Ltd.: | | | | | |
1.50%, 7/14/2071
| | GBP | 200,000 | | 113,990 |
2.52%, 2/7/2118
| | GBP | 100,000 | | 75,153 |
Yorkshire Water Finance PLC Series EMTN, 2.75%, 4/18/2041
| | GBP | 130,000 | | 114,271 |
| | | | | | 19,925,443 |
| UNITED STATES — 25.6% | | | |
Abbott Ireland Financing DAC 1.50%, 9/27/2026
| | EUR | 150,000 | | 159,849 |
| Altria Group, Inc.: | | | | | |
2.20%, 6/15/2027
| | EUR | 200,000 | | 212,642 |
3.13%, 6/15/2031
| | EUR | 200,000 | | 200,213 |
American Honda Finance Corp. 0.30%, 7/7/2028
| | EUR | 150,000 | | 146,629 |
American Medical Systems Europe BV 0.75%, 3/8/2025
| | EUR | 250,000 | | 266,883 |
Amgen, Inc. 4.00%, 9/13/2029
| | GBP | 100,000 | | 125,409 |
| Apple, Inc.: | | | | | |
Zero Coupon, 11/15/2025
| | EUR | 250,000 | | 261,775 |
0.50%, 11/15/2031
| | EUR | 200,000 | | 188,201 |
0.88%, 5/24/2025
| | EUR | 200,000 | | 214,013 |
1.38%, 5/24/2029
| | EUR | 100,000 | | 103,705 |
1.63%, 11/10/2026
| | EUR | 290,000 | | 310,998 |
2.00%, 9/17/2027
| | EUR | 200,000 | | 216,184 |
3.05%, 7/31/2029
| | GBP | 100,000 | | 123,572 |
| AT&T, Inc.: | | | | | |
0.25%, 3/4/2026
| | EUR | 200,000 | | 207,350 |
0.80%, 3/4/2030
| | EUR | 300,000 | | 287,927 |
1.60%, 5/19/2028
| | EUR | 200,000 | | 207,300 |
1.80%, 9/5/2026
| | EUR | 100,000 | | 106,621 |
2.35%, 9/5/2029
| | EUR | 200,000 | | 211,649 |
2.45%, 3/15/2035
| | EUR | 200,000 | | 196,441 |
2.90%, 12/4/2026
| | GBP | 300,000 | | 364,243 |
3.15%, 9/4/2036
| | EUR | 303,000 | | 311,480 |
3.50%, 12/17/2025
| | EUR | 300,000 | | 332,142 |
| Security Description | | | Principal
Amount | | Value |
3.55%, 12/17/2032
| | EUR | 350,000 | | $ 387,741 |
3.95%, 4/30/2031
| | EUR | 200,000 | | 229,168 |
4.25%, 6/1/2043
| | GBP | 100,000 | | 109,885 |
4.30%, 11/18/2034
| | EUR | 300,000 | | 350,006 |
4.38%, 9/14/2029
| | GBP | 250,000 | | 314,258 |
4.88%, 6/1/2044
| | GBP | 150,000 | | 177,357 |
Series EMTN, 7.00%, 4/30/2040
| | GBP | 300,000 | | 445,662 |
| Bank of America Corp.: | | | | | |
Series EMTN, 2.30%, 7/25/2025
| | GBP | 100,000 | | 122,258 |
Series EMTN, 7.00%, 7/31/2028
| | GBP | 100,000 | | 140,621 |
Series EMTN, 1 yr. U.K. Government Bond + 1.10%, 1.67%, 6/2/2029 (a)
| | GBP | 250,000 | | 279,932 |
Series EMTN, 3 mo. EUR EURIBOR - 0.76%, 0.58%, 8/24/2028 (a)
| | EUR | 150,000 | | 149,227 |
Series EMTN, 3 mo. EUR EURIBOR - 0.79%, 0.69%, 3/22/2031 (a)
| | EUR | 500,000 | | 461,785 |
Series EMTN, 3 mo. EUR EURIBOR - 0.94%, 0.65%, 10/26/2031 (a)
| | EUR | 500,000 | | 452,132 |
Series EMTN, 3 mo. EUR EURIBOR - 3.67%, 3.65%, 3/31/2029 (a)
| | EUR | 300,000 | | 333,489 |
Series EMTN, 3 mo. EUR EURIBOR + 0.75%, 0.81%, 5/9/2026 (a)
| | EUR | 500,000 | | 530,656 |
Series EMTN, 3 mo. EUR EURIBOR + 0.89%, 1.66%, 4/25/2028 (a)
| | EUR | 150,000 | | 156,568 |
Series EMTN, 3 mo. EUR EURIBOR + 0.91%, 1.38%, 5/9/2030 (a)
| | EUR | 200,000 | | 197,409 |
Series EMTN, 3 mo. EUR EURIBOR + 0.91%, 1.95%, 10/27/2026 (a)
| | EUR | 300,000 | | 321,584 |
Series EMTN, 3 mo. EUR EURIBOR + 0.95%, 1.10%, 5/24/2032 (a)
| | EUR | 450,000 | | 413,904 |
Series EMTN, 3 mo. EUR EURIBOR + 1.20%, 1.78%, 5/4/2027 (a)
| | EUR | 250,000 | | 265,136 |
See accompanying notes to financial statements.
42
SPDR BLOOMBERG INTERNATIONAL CORPORATE BOND ETF
SCHEDULE OF INVESTMENTS (continued)
December 31, 2023
| Security Description | | | Principal
Amount | | Value |
Series EMTN, 3 mo. EUR EURIBOR + 1.20%, 2.82%, 4/27/2033 (a)
| | EUR | 200,000 | | $ 207,287 |
| Berkshire Hathaway Finance Corp.: | | | | | |
2.38%, 6/19/2039
| | GBP | 200,000 | | 189,296 |
2.63%, 6/19/2059
| | GBP | 200,000 | | 162,281 |
| Berkshire Hathaway, Inc.: | | | | | |
Zero Coupon, 3/12/2025
| | EUR | 150,000 | | 159,355 |
1.13%, 3/16/2027
| | EUR | 200,000 | | 208,172 |
1.63%, 3/16/2035
| | EUR | 450,000 | | 419,352 |
| Booking Holdings, Inc.: | | | | | |
1.80%, 3/3/2027
| | EUR | 100,000 | | 106,292 |
4.13%, 5/12/2033
| | EUR | 300,000 | | 353,494 |
4.50%, 11/15/2031
| | EUR | 200,000 | | 240,356 |
4.75%, 11/15/2034
| | EUR | 200,000 | | 249,135 |
BorgWarner, Inc. 1.00%, 5/19/2031
| | EUR | 163,000 | | 148,133 |
Celanese U.S. Holdings LLC 4.78%, 7/19/2026
| | EUR | 200,000 | | 224,491 |
| Citigroup, Inc.: | | | | | |
Series EMTN, 1.25%, 4/10/2029
| | EUR | 300,000 | | 297,797 |
Series EMTN, 1.50%, 10/26/2028
| | EUR | 100,000 | | 101,646 |
1.75%, 1/28/2025
| | EUR | 150,000 | | 162,034 |
Series EMTN, 3 mo. EUR EURIBOR - 0.96%, 0.50%, 10/8/2027 (a)
| | EUR | 250,000 | | 255,111 |
Series EMTN, 3 mo. EUR EURIBOR - 1.66%, 1.25%, 7/6/2026 (a)
| | EUR | 400,000 | | 425,246 |
Series EMTN, 3 mo. EUR EURIBOR + 1.07%, 1.50%, 7/24/2026 (a)
| | EUR | 500,000 | | 533,042 |
3 mo. EUR EURIBOR + 1.25%, 3.71%, 9/22/2028 (a)
| | EUR | 100,000 | | 112,034 |
3 mo. EUR EURIBOR + 1.60%, 4.11%, 9/22/2033 (a)
| | EUR | 156,000 | | 177,687 |
| Coca-Cola Co.: | | | | | |
0.13%, 3/15/2029
| | EUR | 300,000 | | 288,940 |
1.13%, 3/9/2027
| | EUR | 200,000 | | 208,330 |
1.63%, 3/9/2035
| | EUR | 200,000 | | 191,014 |
| Comcast Corp.: | | | | | |
Zero Coupon, 9/14/2026
| | EUR | 150,000 | | 152,759 |
0.75%, 2/20/2032
| | EUR | 200,000 | | 185,710 |
1.88%, 2/20/2036
| | GBP | 225,000 | | 215,908 |
| DH Europe Finance II SARL: | | | | | |
0.20%, 3/18/2026
| | EUR | 300,000 | | 311,094 |
0.45%, 3/18/2028
| | EUR | 200,000 | | 199,586 |
| Security Description | | | Principal
Amount | | Value |
0.75%, 9/18/2031
| | EUR | 250,000 | | $ 232,753 |
1.35%, 9/18/2039
| | EUR | 200,000 | | 166,805 |
Digital Euro Finco LLC 2.50%, 1/16/2026
| | EUR | 300,000 | | 322,527 |
Digital Intrepid Holding BV 0.63%, 7/15/2031
| | EUR | 100,000 | | 86,595 |
Dow Chemical Co. 0.50%, 3/15/2027
| | EUR | 200,000 | | 202,187 |
Eli Lilly & Co. 1.70%, 11/1/2049
| | EUR | 200,000 | | 166,570 |
| Exxon Mobil Corp.: | | | | | |
0.52%, 6/26/2028
| | EUR | 150,000 | | 149,989 |
0.84%, 6/26/2032
| | EUR | 250,000 | | 228,605 |
1.41%, 6/26/2039
| | EUR | 200,000 | | 163,663 |
FedEx Corp. 1.63%, 1/11/2027
| | EUR | 300,000 | | 316,950 |
| Fidelity National Information Services, Inc.: | | | | | |
1.50%, 5/21/2027
| | EUR | 300,000 | | 313,433 |
2.00%, 5/21/2030
| | EUR | 100,000 | | 102,411 |
Ford Motor Credit Co. LLC 4.87%, 8/3/2027
| | EUR | 200,000 | | 226,989 |
| Goldman Sachs Group, Inc.: | | | | | |
Series EMTN, 0.25%, 1/26/2028
| | EUR | 30,000 | | 29,342 |
Series EMTN, 0.75%, 3/23/2032
| | EUR | 200,000 | | 176,500 |
Series EMTN, 0.88%, 5/9/2029
| | EUR | 450,000 | | 432,060 |
Series EMTN, 0.88%, 1/21/2030
| | EUR | 300,000 | | 285,096 |
Series EMTN, 1.00%, 3/18/2033
| | EUR | 275,000 | | 241,215 |
Series EMTN, 1.25%, 5/1/2025
| | EUR | 300,000 | | 320,716 |
Series EMTN, 1.25%, 2/7/2029
| | EUR | 350,000 | | 345,892 |
Series EMTN, 1.50%, 12/7/2027
| | GBP | 100,000 | | 113,849 |
Series EMTN, 1.63%, 7/27/2026
| | EUR | 300,000 | | 318,452 |
Series EMTN, 2.00%, 11/1/2028
| | EUR | 277,000 | | 289,128 |
Series EMTN, 3.00%, 2/12/2031
| | EUR | 117,000 | | 127,106 |
Series EMTN, 3.13%, 7/25/2029
| | GBP | 300,000 | | 353,791 |
3.38%, 3/27/2025
| | EUR | 400,000 | | 440,838 |
Series EMTN, 4.25%, 1/29/2026
| | GBP | 150,000 | | 189,305 |
Series EMTN, 1 yr. U.K. Government Bond + 1.95%, 3.63%, 10/29/2029 (a)
| | GBP | 200,000 | | 241,076 |
See accompanying notes to financial statements.
43
SPDR BLOOMBERG INTERNATIONAL CORPORATE BOND ETF
SCHEDULE OF INVESTMENTS (continued)
December 31, 2023
| Security Description | | | Principal
Amount | | Value |
Honeywell International, Inc. 4.13%, 11/2/2034
| | EUR | 200,000 | | $ 234,539 |
| International Business Machines Corp.: | | | | | |
0.30%, 2/11/2028
| | EUR | 200,000 | | 198,978 |
0.65%, 2/11/2032
| | EUR | 400,000 | | 365,320 |
Series EMTN, 0.88%, 1/31/2025
| | EUR | 100,000 | | 107,269 |
Series EMTN, 0.88%, 2/9/2030
| | EUR | 100,000 | | 97,731 |
0.95%, 5/23/2025
| | EUR | 100,000 | | 106,806 |
1.25%, 1/29/2027
| | EUR | 150,000 | | 157,414 |
Series EMTN, 1.25%, 2/9/2034
| | EUR | 200,000 | | 184,851 |
1.50%, 5/23/2029
| | EUR | 100,000 | | 102,827 |
1.75%, 1/31/2031
| | EUR | 200,000 | | 202,770 |
Series EMTN, 2.88%, 11/7/2025
| | EUR | 300,000 | | 329,175 |
3.38%, 2/6/2027
| | EUR | 300,000 | | 335,194 |
3.63%, 2/6/2031
| | EUR | 300,000 | | 341,728 |
3.75%, 2/6/2035
| | EUR | 200,000 | | 230,607 |
4.00%, 2/6/2043
| | EUR | 200,000 | | 229,791 |
4.88%, 2/6/2038
| | GBP | 200,000 | | 252,369 |
Johnson & Johnson 1.65%, 5/20/2035
| | EUR | 200,000 | | 198,322 |
| JPMorgan Chase & Co.: | | | | | |
Series EMTN, 1.50%, 1/27/2025
| | EUR | 100,000 | | 107,769 |
Series EMTN, 1.50%, 10/29/2026
| | EUR | 300,000 | | 317,439 |
Series EMTN, 2.88%, 5/24/2028
| | EUR | 100,000 | | 108,637 |
Series EMTN, 3.00%, 2/19/2026
| | EUR | 280,000 | | 306,887 |
Series EMTN, 3 mo. EUR EURIBOR - 0.65%, 0.39%, 2/24/2028 (a)
| | EUR | 450,000 | | 452,550 |
Series EMTN, 3 mo. EUR EURIBOR - 0.65%, 0.60%, 2/17/2033 (a)
| | EUR | 300,000 | | 266,196 |
Series EMTN, 3 mo. EUR EURIBOR + 0.76%, 1.09%, 3/11/2027 (a)
| | EUR | 400,000 | | 419,748 |
Series EMTN, 3 mo. EUR EURIBOR + 0.84%, 1.64%, 5/18/2028 (a)
| | EUR | 400,000 | | 417,151 |
Series EMTN, 3 mo. EUR EURIBOR + 0.85%, 1.00%, 7/25/2031 (a)
| | EUR | 300,000 | | 282,607 |
| Security Description | | | Principal
Amount | | Value |
Series EMTN, 3 mo. EUR EURIBOR + 0.87%, 1.05%, 11/4/2032 (a)
| | EUR | 500,000 | | $ 462,091 |
Series EMTN, 3 mo. EUR EURIBOR + 0.95%, 1.81%, 6/12/2029 (a)
| | EUR | 300,000 | | 309,735 |
Series EMTN, 3 mo. EUR EURIBOR + 1.13%, 1.96%, 3/23/2030 (a)
| | EUR | 500,000 | | 513,907 |
Sterling Overnight Index Average + 0.68%, 0.99%, 4/28/2026 (a)
| | GBP | 100,000 | | 120,326 |
Series EMTN, Sterling Overnight Index Average + 1.13%, 1.90%, 4/28/2033 (a)
| | GBP | 200,000 | | 208,459 |
Kraft Heinz Foods Co. 2.25%, 5/25/2028
| | EUR | 200,000 | | 213,394 |
| Medtronic Global Holdings SCA: | | | | | |
Zero Coupon, 10/15/2025
| | EUR | 200,000 | | 208,803 |
0.25%, 7/2/2025
| | EUR | 200,000 | | 210,726 |
0.38%, 10/15/2028
| | EUR | 200,000 | | 196,323 |
1.13%, 3/7/2027
| | EUR | 300,000 | | 313,166 |
1.38%, 10/15/2040
| | EUR | 250,000 | | 202,385 |
1.50%, 7/2/2039
| | EUR | 350,000 | | 294,904 |
1.63%, 3/7/2031
| | EUR | 200,000 | | 200,271 |
1.63%, 10/15/2050
| | EUR | 150,000 | | 112,585 |
1.75%, 7/2/2049
| | EUR | 100,000 | | 77,495 |
2.25%, 3/7/2039
| | EUR | 100,000 | | 94,090 |
3.00%, 10/15/2028
| | EUR | 100,000 | | 110,698 |
3.13%, 10/15/2031
| | EUR | 250,000 | | 277,071 |
3.38%, 10/15/2034
| | EUR | 400,000 | | 445,620 |
Merck & Co., Inc. 1.88%, 10/15/2026
| | EUR | 200,000 | | 214,803 |
Microsoft Corp. 3.13%, 12/6/2028
| | EUR | 400,000 | | 454,093 |
| Morgan Stanley: | | | | | |
Series GMTN, 1.38%, 10/27/2026
| | EUR | 250,000 | | 262,220 |
Series GMTN, 1.75%, 1/30/2025
| | EUR | 200,000 | | 216,283 |
Series GMTN, 1.88%, 4/27/2027
| | EUR | 300,000 | | 315,971 |
Series GMTN, 2.63%, 3/9/2027
| | GBP | 100,000 | | 120,421 |
3 mo. EUR EURIBOR - 0.70%, 0.41%, 10/29/2027 (a)
| | EUR | 100,000 | | 101,390 |
3 mo. EUR EURIBOR - 0.72%, 0.50%, 2/7/2031 (a)
| | EUR | 150,000 | | 137,241 |
See accompanying notes to financial statements.
44
SPDR BLOOMBERG INTERNATIONAL CORPORATE BOND ETF
SCHEDULE OF INVESTMENTS (continued)
December 31, 2023
| Security Description | | | Principal
Amount | | Value |
3 mo. EUR EURIBOR - 0.87%, 0.50%, 10/26/2029 (a)
| | EUR | 500,000 | | $ 476,569 |
Series GMTN, 3 mo. EUR EURIBOR + 0.83%, 1.10%, 4/29/2033 (a)
| | EUR | 400,000 | | 358,410 |
Series EMTN, 3 mo. EUR EURIBOR + 0.83%, 1.34%, 10/23/2026 (a)
| | EUR | 250,000 | | 264,921 |
3 mo. EUR EURIBOR + 0.90%, 2.10%, 5/8/2026 (a)
| | EUR | 300,000 | | 323,824 |
Series GMTN, 3 mo. EUR EURIBOR + 1.25%, 2.95%, 5/7/2032 (a)
| | EUR | 200,000 | | 208,955 |
3 mo. EUR EURIBOR + 1.30%, 4.66%, 3/2/2029 (a)
| | EUR | 700,000 | | 802,540 |
3 mo. EUR EURIBOR + 1.76%, 4.81%, 10/25/2028 (a)
| | EUR | 100,000 | | 115,557 |
Series GMTN, 3 mo. EUR EURIBOR + 1.95%, 5.15%, 1/25/2034 (a)
| | EUR | 500,000 | | 606,275 |
Sterling Overnight Index Average + 2.25%, 5.79%, 11/18/2033 (a)
| | GBP | 200,000 | | 271,137 |
| Nestle Finance International Ltd.: | | | | | |
Series EMTN, 1.13%, 4/1/2026
| | EUR | 300,000 | | 319,950 |
Series EMTN, 1.50%, 4/1/2030
| | EUR | 450,000 | | 462,316 |
| Netflix, Inc.: | | | | | |
3.63%, 5/15/2027
| | EUR | 300,000 | | 335,153 |
3.63%, 6/15/2030
| | EUR | 200,000 | | 224,500 |
4.63%, 5/15/2029
| | EUR | 400,000 | | 471,457 |
| PepsiCo, Inc.: | | | | | |
Series EMTN, 0.50%, 5/6/2028
| | EUR | 200,000 | | 200,984 |
0.75%, 10/14/2033
| | EUR | 200,000 | | 180,720 |
Pfizer, Inc. 2.74%, 6/15/2043
| | GBP | 300,000 | | 288,689 |
Philip Morris International, Inc. Series EMTN, 2.88%, 3/3/2026
| | EUR | 200,000 | | 218,778 |
Procter & Gamble Co. 4.88%, 5/11/2027
| | EUR | 200,000 | | 235,058 |
Roche Finance Europe BV Series EMTN, 0.88%, 2/25/2025
| | EUR | 200,000 | | 215,423 |
| Sanofi SA: | | | | | |
Series EMTN, 1.00%, 4/1/2025
| | EUR | 400,000 | | 429,184 |
| Security Description | | | Principal
Amount | | Value |
Series 8, 1.00%, 3/21/2026
| | EUR | 200,000 | | $ 212,227 |
Series 12FX, 1.38%, 3/21/2030
| | EUR | 600,000 | | 611,526 |
Series EMTN, 1.50%, 4/1/2030
| | EUR | 300,000 | | 308,030 |
Series EMTN, 1.75%, 9/10/2026
| | EUR | 300,000 | | 322,282 |
Series 20FX, 1.88%, 3/21/2038
| | EUR | 100,000 | | 97,300 |
| Schlumberger Finance BV: | | | | | |
1.38%, 10/28/2026
| | EUR | 200,000 | | 210,944 |
2.00%, 5/6/2032
| | EUR | 200,000 | | 202,748 |
| Stellantis NV: | | | | | |
Series EMTN, 0.63%, 3/30/2027
| | EUR | 200,000 | | 203,523 |
Series EMTN, 0.75%, 1/18/2029
| | EUR | 400,000 | | 392,345 |
Series EMTN, 1.25%, 6/20/2033
| | EUR | 200,000 | | 177,780 |
2.75%, 5/15/2026
| | EUR | 100,000 | | 109,200 |
Series EMTN, 2.75%, 4/1/2032
| | EUR | 400,000 | | 412,951 |
3.88%, 1/5/2026
| | EUR | 200,000 | | 222,775 |
Series EMTN, 4.25%, 6/16/2031
| | EUR | 200,000 | | 229,033 |
Series EMTN, 4.38%, 3/14/2030
| | EUR | 300,000 | | 349,896 |
| Thermo Fisher Scientific Finance I BV: | | | | | |
0.80%, 10/18/2030
| | EUR | 400,000 | | 383,370 |
1.13%, 10/18/2033
| | EUR | 250,000 | | 229,417 |
1.63%, 10/18/2041
| | EUR | 200,000 | | 166,556 |
Thermo Fisher Scientific, Inc. Series EMTN, 1.88%, 10/1/2049
| | EUR | 100,000 | | 78,947 |
| Toyota Motor Credit Corp.: | | | | | |
Series EMTN, 0.13%, 11/5/2027
| | EUR | 200,000 | | 198,198 |
Series EMTN, 4.05%, 9/13/2029
| | EUR | 300,000 | | 347,617 |
Upjohn Finance BV 1.91%, 6/23/2032
| | EUR | 300,000 | | 278,526 |
| Verizon Communications, Inc.: | | | | | |
0.88%, 4/8/2027
| | EUR | 300,000 | | 309,545 |
1.25%, 4/8/2030
| | EUR | 450,000 | | 442,447 |
1.30%, 5/18/2033
| | EUR | 300,000 | | 276,615 |
1.38%, 10/27/2026
| | EUR | 400,000 | | 422,530 |
1.38%, 11/2/2028
| | EUR | 200,000 | | 204,591 |
2.63%, 12/1/2031
| | EUR | 200,000 | | 211,392 |
Series 20Y, 2.88%, 1/15/2038
| | EUR | 300,000 | | 305,708 |
Series EMTN, 3.25%, 2/17/2026
| | EUR | 350,000 | | 387,749 |
3.38%, 10/27/2036
| | GBP | 200,000 | | 217,993 |
4.25%, 10/31/2030
| | EUR | 100,000 | | 117,052 |
See accompanying notes to financial statements.
45
SPDR BLOOMBERG INTERNATIONAL CORPORATE BOND ETF
SCHEDULE OF INVESTMENTS (continued)
December 31, 2023
| Security Description | | | Principal
Amount | | Value |
4.75%, 10/31/2034
| | EUR | 300,000 | | $ 367,204 |
Visa, Inc. 1.50%, 6/15/2026
| | EUR | 450,000 | | 480,157 |
| Walmart, Inc.: | | | | | |
4.88%, 9/21/2029
| | EUR | 151,000 | | 185,483 |
5.25%, 9/28/2035
| | GBP | 228,000 | | 318,493 |
5.63%, 3/27/2034
| | GBP | 100,000 | | 142,518 |
| Wells Fargo & Co.: | | | | | |
Series EMTN, 0.63%, 3/25/2030
| | EUR | 300,000 | | 277,146 |
0.63%, 8/14/2030
| | EUR | 100,000 | | 91,382 |
Series EMTN, 1.00%, 2/2/2027
| | EUR | 500,000 | | 512,564 |
Series EMTN, 1.38%, 10/26/2026
| | EUR | 400,000 | | 417,085 |
Series EMTN, 1.50%, 5/24/2027
| | EUR | 200,000 | | 207,307 |
Series EMTN, 2.00%, 7/28/2025
| | GBP | 200,000 | | 242,561 |
Series EMTN, 2.00%, 4/27/2026
| | EUR | 300,000 | | 320,098 |
4.63%, 11/2/2035
| | GBP | 50,000 | | 62,083 |
Series EMTN, 3 mo. EUR EURIBOR - 1.85%, 1.74%, 5/4/2030 (a)
| | EUR | 400,000 | | 401,515 |
| | | | | | 56,089,384 |
TOTAL CORPORATE BONDS & NOTES
(Cost $222,296,903)
| | | | | 215,653,686 |
| | | Shares | |
| SHORT-TERM INVESTMENTS — 4.1% | |
State Street Institutional U.S. Government Money Market Fund, Class G Shares 5.36% (c) (d)
| 1,708 | 1,708 |
| Security Description | | | Shares | | Value |
State Street Navigator Securities Lending Portfolio II (e) (f)
| | 8,990,962 | | $ 8,990,962 |
TOTAL SHORT-TERM INVESTMENTS
(Cost $8,992,670)
| | 8,992,670 | |
TOTAL INVESTMENTS — 102.4%
(Cost $231,289,573)
| | 224,646,356 | |
LIABILITIES IN EXCESS OF OTHER
ASSETS — (2.4)%
| | (5,162,566) | |
NET ASSETS — 100.0%
| | $ 219,483,790 | |
| (a) | Variable Rate Security - Interest rate shown is rate in effect at December 31, 2023. For securities based on a published reference rate and spread, the reference rate and spread are indicated in the description above. |
| (b) | All or a portion of the shares of the security are on loan at December 31, 2023. |
| (c) | The Fund invested in certain money market funds managed by SSGA Funds Management, Inc. Amounts related to these transactions during the year ended December 31, 2023 are shown in the Affiliate Table below. |
| (d) | The rate shown is the annualized seven-day yield at December 31, 2023. |
| (e) | The Fund invested in an affiliated entity. Amounts related to these transactions during the year ended December 31, 2023 are shown in the Affiliate Table below. |
| (f) | Investment of cash collateral for securities loaned. |
| DMTN | Domestic Medium - Term Note |
| EMTN | Euro Medium Term Note |
| GMTN | Global Medium Term Note |
| MTN | Medium Term Note |
| SONIA | Sterling Overnight Index Average |
| AUD | Australian Dollar |
| EUR | Euro |
| GBP | British Pound |
| JPY | Japanese Yen |
The following table summarizes the value of the Fund's investments according to the fair value hierarchy as of December 31, 2023.
| Description | | Level 1 –
Quoted Prices | | Level 2 –
Other Significant
Observable Inputs | | Level 3 –
Significant
Unobservable Inputs | | Total |
| ASSETS: | | | | | | | | |
| INVESTMENTS: | | | | | | | | |
Corporate Bonds & Notes
| | $ — | | $215,653,686 | | $— | | $215,653,686 |
Short-Term Investments
| | 8,992,670 | | — | | — | | 8,992,670 |
TOTAL INVESTMENTS
| | $8,992,670 | | $215,653,686 | | $— | | $224,646,356 |
See accompanying notes to financial statements.
46
SPDR BLOOMBERG INTERNATIONAL CORPORATE BOND ETF
SCHEDULE OF INVESTMENTS (continued)
December 31, 2023
Sector Breakdown as of December 31, 2023
| | |
| | | % of Total Investments |
| | Financial | 52.6% |
| | Consumer, Non-cyclical | 11.9 |
| | Communications | 8.7 |
| | Consumer, Cyclical | 7.5 |
| | Utilities | 4.2 |
| | Energy | 3.7 |
| | Industrial | 3.5 |
| | Technology | 3.2 |
| | Basic Materials | 0.7 |
| | Short-Term Investments | 4.0 |
| | TOTAL | 100.0% |
(The sector breakdown is expressed as a percentage of total investments and may change over time.)
Affiliate Table
| | Number of
Shares Held
at
12/31/22 | | Value at
12/31/22 | | Cost of
Purchases | | Proceeds
from
Shares Sold | | Realized
Gain (Loss) | | Change in
Unrealized
Appreciation/
Depreciation | | Number of
Shares Held
at
12/31/23 | | Value at
12/31/23 | | Dividend
Income |
State Street Institutional U.S. Government Money Market Fund, Class G Shares
| 126,467 | | $ 126,467 | | $ 61,540,156 | | $ 61,664,915 | | $— | | $— | | 1,708 | | $ 1,708 | | $13,007 |
State Street Navigator Securities Lending Portfolio II
| 8,734,973 | | 8,734,973 | | 46,011,125 | | 45,755,136 | | — | | — | | 8,990,962 | | 8,990,962 | | 26,900 |
Total
| | | $8,861,440 | | $107,551,281 | | $107,420,051 | | $— | | $— | | | | $8,992,670 | | $39,907 |
See accompanying notes to financial statements.
47
SPDR BLOOMBERG INTERNATIONAL TREASURY BOND ETF
SCHEDULE OF INVESTMENTS
December 31, 2023
| Security Description | | | Principal
Amount | | Value |
| FOREIGN GOVERNMENT OBLIGATIONS — 99.1% | | | |
| AUSTRALIA — 4.6% | | | |
| Australia Government Bonds: | | | | | |
Series 161, 0.25%, 11/21/2025
| | AUD | 3,548,000 | | $ 2,269,704 |
Series 164, 0.50%, 9/21/2026
| | AUD | 3,886,000 | | 2,439,705 |
Series 160, 1.00%, 12/21/2030
| | AUD | 3,870,000 | | 2,190,294 |
Series 163, 1.00%, 11/21/2031
| | AUD | 2,848,000 | | 1,566,499 |
Series 158, 1.25%, 5/21/2032
| | AUD | 4,036,000 | | 2,234,835 |
Series 157, 1.50%, 6/21/2031
| | AUD | 3,794,000 | | 2,197,553 |
Series 165, 1.75%, 11/21/2032
| | AUD | 1,598,000 | | 912,800 |
Series 162, 1.75%, 6/21/2051
| | AUD | 2,693,000 | | 1,084,276 |
Series 149, 2.25%, 5/21/2028
| | AUD | 3,223,000 | | 2,077,542 |
Series 155, 2.50%, 5/21/2030
| | AUD | 3,773,000 | | 2,391,271 |
Series 148, 2.75%, 11/21/2027
| | AUD | 3,228,000 | | 2,134,067 |
Series 152, 2.75%, 11/21/2028
| | AUD | 3,478,000 | | 2,278,890 |
Series 154, 2.75%, 11/21/2029
| | AUD | 3,654,000 | | 2,365,571 |
Series 145, 2.75%, 6/21/2035
| | AUD | 852,000 | | 514,190 |
Series 156, 2.75%, 5/21/2041
| | AUD | 1,372,000 | | 764,220 |
Series 166, 3.00%, 11/21/2033
| | AUD | 2,710,000 | | 1,704,336 |
Series 150, 3.00%, 3/21/2047
| | AUD | 1,491,000 | | 821,052 |
Series 139, 3.25%, 4/21/2025
| | AUD | 4,781,000 | | 3,236,829 |
Series 138, 3.25%, 4/21/2029
| | AUD | 4,102,000 | | 2,740,956 |
Series 147, 3.25%, 6/21/2039
| | AUD | 1,647,000 | | 1,005,121 |
Series 168, 3.50%, 12/21/2034
| | AUD | 2,178,000 | | 1,421,354 |
Series 167, 3.75%, 5/21/2034
| | AUD | 2,653,000 | | 1,775,555 |
3.75%, 4/21/2037
| | AUD | 1,469,000 | | 967,656 |
Series 142, 4.25%, 4/21/2026
| | AUD | 4,117,000 | | 2,846,002 |
Series 140, 4.50%, 4/21/2033
| | AUD | 2,713,000 | | 1,929,589 |
Series 136, 4.75%, 4/21/2027
| | AUD | 3,470,000 | | 2,450,677 |
| | | | | | 48,320,544 |
| Security Description | | | Principal
Amount | | Value |
| AUSTRIA — 2.7% | | | |
| Republic of Austria Government Bonds: | | | | | |
Zero Coupon, 4/20/2025 (a)
| | EUR | 635,000 | | $ 676,714 |
Zero Coupon, 10/20/2028 (a)
| | EUR | 936,000 | | 925,026 |
Zero Coupon, 2/20/2030 (a)
| | EUR | 1,171,000 | | 1,117,649 |
Zero Coupon, 2/20/2031 (a)
| | EUR | 1,383,000 | | 1,283,151 |
Zero Coupon, 10/20/2040 (a)
| | EUR | 604,000 | | 416,705 |
0.25%, 10/20/2036 (a)
| | EUR | 781,000 | | 632,296 |
0.50%, 4/20/2027 (a)
| | EUR | 1,712,000 | | 1,782,919 |
0.50%, 2/20/2029 (a)
| | EUR | 1,337,000 | | 1,346,801 |
0.70%, 4/20/2071 (a)
| | EUR | 299,000 | | 156,724 |
0.75%, 10/20/2026 (a)
| | EUR | 1,473,000 | | 1,556,251 |
0.75%, 2/20/2028 (a)
| | EUR | 1,340,000 | | 1,389,173 |
0.75%, 3/20/2051 (a)
| | EUR | 670,000 | | 449,702 |
0.85%, 6/30/2120 (a)
| | EUR | 400,000 | | 205,642 |
0.90%, 2/20/2032 (a)
| | EUR | 1,134,000 | | 1,101,561 |
1.20%, 10/20/2025 (a)
| | EUR | 1,217,000 | | 1,313,767 |
1.50%, 2/20/2047 (a)
| | EUR | 1,152,000 | | 975,262 |
1.50%, 11/2/2086 (a)
| | EUR | 317,000 | | 218,927 |
1.85%, 5/23/2049 (a)
| | EUR | 400,000 | | 360,293 |
2.00%, 7/15/2026 (a)
| | EUR | 489,000 | | 535,104 |
2.10%, 9/20/2117 (a)
| | EUR | 625,000 | | 545,766 |
2.40%, 5/23/2034 (a)
| | EUR | 929,000 | | 1,003,857 |
2.90%, 5/23/2029 (a)
| | EUR | 700,000 | | 795,911 |
2.90%, 2/20/2033 (a)
| | EUR | 1,342,000 | | 1,519,501 |
3.15%, 6/20/2044 (a)
| | EUR | 1,056,000 | | 1,214,337 |
3.15%, 10/20/2053 (a)
| | EUR | 303,000 | | 349,830 |
3.80%, 1/26/2062 (a)
| | EUR | 665,000 | | 878,198 |
4.15%, 3/15/2037 (a)
| | EUR | 1,843,000 | | 2,331,511 |
4.85%, 3/15/2026 (a)
| | EUR | 1,396,000 | | 1,618,450 |
6.25%, 7/15/2027
| | EUR | 1,098,000 | | 1,371,522 |
| | | | | | 28,072,550 |
| BELGIUM — 4.0% | | | |
| Kingdom of Belgium Government Bonds: | | | | | |
Series 91, Zero Coupon, 10/22/2027 (a)
| | EUR | 1,184,000 | | 1,202,716 |
Series 92, Zero Coupon, 10/22/2031 (a)
| | EUR | 1,249,000 | | 1,141,420 |
Series 89, 0.10%, 6/22/2030 (a)
| | EUR | 1,410,200 | | 1,350,599 |
Series 94, 0.35%, 6/22/2032 (a)
| | EUR | 1,119,000 | | 1,033,805 |
See accompanying notes to financial statements.
48
SPDR BLOOMBERG INTERNATIONAL TREASURY BOND ETF
SCHEDULE OF INVESTMENTS (continued)
December 31, 2023
| Security Description | | | Principal
Amount | | Value |
Series 93, 0.65%, 6/22/2071 (a)
| | EUR | 551,000 | | $ 272,909 |
Series 74, 0.80%, 6/22/2025 (a)
| | EUR | 2,192,000 | | 2,355,876 |
Series 81, 0.80%, 6/22/2027 (a)
| | EUR | 1,738,000 | | 1,828,384 |
Series 85, 0.80%, 6/22/2028 (a)
| | EUR | 1,375,000 | | 1,428,161 |
Series 87, 0.90%, 6/22/2029 (a)
| | EUR | 1,952,000 | | 2,005,200 |
Series 77, 1.00%, 6/22/2026 (a)
| | EUR | 1,889,000 | | 2,019,526 |
Series 75, 1.00%, 6/22/2031 (a)
| | EUR | 1,767,000 | | 1,763,147 |
Series 86, 1.25%, 4/22/2033 (a)
| | EUR | 597,000 | | 590,247 |
Series 95, 1.40%, 6/22/2053 (a)
| | EUR | 973,000 | | 720,126 |
Series 84, 1.45%, 6/22/2037 (a)
| | EUR | 925,000 | | 862,819 |
Series 78, 1.60%, 6/22/2047 (a)
| | EUR | 1,133,000 | | 941,034 |
Series 88, 1.70%, 6/22/2050 (a)
| | EUR | 1,093,000 | | 899,265 |
Series 76, 1.90%, 6/22/2038 (a)
| | EUR | 982,000 | | 957,458 |
Series 80, 2.15%, 6/22/2066 (a)
| | EUR | 1,096,000 | | 956,535 |
Series 83, 2.25%, 6/22/2057 (a)
| | EUR | 594,000 | | 537,859 |
Series 96, 2.75%, 4/22/2039 (a)
| | EUR | 578,000 | | 623,256 |
Series 97, 3.00%, 6/22/2033 (a)
| | EUR | 1,964,000 | | 2,241,396 |
Series 73, 3.00%, 6/22/2034 (a)
| | EUR | 1,192,000 | | 1,355,079 |
Series 98, 3.30%, 6/22/2054 (a)
| | EUR | 1,124,000 | | 1,266,956 |
Series 99, 3.45%, 6/22/2043 (a)
| | EUR | 621,000 | | 723,509 |
Series 71, 3.75%, 6/22/2045
| | EUR | 1,093,000 | | 1,334,468 |
Series 66, 4.00%, 3/28/2032
| | EUR | 1,253,000 | | 1,539,877 |
Series 60, 4.25%, 3/28/2041 (a)
| | EUR | 2,154,000 | | 2,778,540 |
Series 64, 4.50%, 3/28/2026 (a)
| | EUR | 899,000 | | 1,037,674 |
Series 44, 5.00%, 3/28/2035 (a)
| | EUR | 2,460,000 | | 3,306,754 |
Series 31, 5.50%, 3/28/2028
| | EUR | 2,277,000 | | 2,843,523 |
| | | | | | 41,918,118 |
| CANADA — 4.6% | | | |
| Canada Government Bonds: | | | | | |
0.25%, 3/1/2026
| | CAD | 2,682,000 | | 1,892,580 |
| Security Description | | | Principal
Amount | | Value |
0.50%, 9/1/2025
| | CAD | 3,302,000 | | $ 2,367,656 |
0.50%, 12/1/2030
| | CAD | 2,419,000 | | 1,540,646 |
1.00%, 9/1/2026
| | CAD | 1,712,000 | | 1,217,307 |
1.00%, 6/1/2027
| | CAD | 905,000 | | 636,632 |
1.25%, 3/1/2025
| | CAD | 1,423,000 | | 1,042,192 |
1.25%, 3/1/2027
| | CAD | 1,472,000 | | 1,045,294 |
1.25%, 6/1/2030
| | CAD | 3,691,000 | | 2,500,715 |
1.50%, 4/1/2025
| | CAD | 885,000 | | 648,543 |
1.50%, 6/1/2026
| | CAD | 903,000 | | 652,527 |
1.50%, 6/1/2031
| | CAD | 3,125,000 | | 2,118,080 |
1.50%, 12/1/2031
| | CAD | 2,656,000 | | 1,787,885 |
1.75%, 12/1/2053
| | CAD | 2,619,000 | | 1,491,448 |
2.00%, 6/1/2028
| | CAD | 1,103,000 | | 797,832 |
2.00%, 6/1/2032
| | CAD | 2,098,000 | | 1,461,394 |
2.00%, 12/1/2051
| | CAD | 4,155,000 | | 2,536,248 |
2.25%, 6/1/2025
| | CAD | 910,000 | | 672,905 |
2.25%, 6/1/2029
| | CAD | 979,000 | | 712,497 |
2.25%, 12/1/2029
| | CAD | 358,000 | | 259,834 |
2.50%, 12/1/2032
| | CAD | 1,318,000 | | 952,727 |
2.75%, 9/1/2027
| | CAD | 1,319,000 | | 980,813 |
2.75%, 6/1/2033
| | CAD | 1,625,000 | | 1,197,437 |
2.75%, 12/1/2048
| | CAD | 1,302,000 | | 936,780 |
2.75%, 12/1/2055
| | CAD | 770,000 | | 550,293 |
2.75%, 12/1/2064
| | CAD | 671,000 | | 482,417 |
3.00%, 10/1/2025
| | CAD | 525,000 | | 391,928 |
3.00%, 4/1/2026
| | CAD | 778,000 | | 581,557 |
3.25%, 8/24/2027
| | CAD | 1,000,000 | | 756,346 |
3.25%, 9/1/2028
| | CAD | 1,720,000 | | 1,308,764 |
3.25%, 12/1/2033
| | CAD | 2,048,000 | | 1,573,003 |
3.50%, 8/1/2025
| | CAD | 2,090,000 | | 1,571,394 |
3.50%, 3/1/2028
| | CAD | 1,000,000 | | 766,232 |
3.50%, 12/1/2045
| | CAD | 1,497,000 | | 1,211,667 |
3.75%, 2/1/2025
| | CAD | 1,039,000 | | 782,035 |
3.75%, 5/1/2025
| | CAD | 1,418,000 | | 1,069,016 |
4.00%, 3/1/2029
| | CAD | 1,000,000 | | 789,281 |
4.00%, 6/1/2041
| | CAD | 1,560,000 | | 1,324,818 |
4.50%, 11/1/2025
| | CAD | 1,350,000 | | 1,034,760 |
4.50%, 2/1/2026
| | CAD | 1,150,000 | | 885,314 |
5.00%, 6/1/2037
| | CAD | 1,020,000 | | 931,252 |
Series WL43, 5.75%, 6/1/2029
| | CAD | 1,172,000 | | 1,005,676 |
5.75%, 6/1/2033
| | CAD | 1,356,000 | | 1,248,304 |
Series VW17, 8.00%, 6/1/2027
| | CAD | 370,000 | | 322,919 |
Series A-76, 9.00%, 6/1/2025
| | CAD | 330,000 | | 266,871 |
| | | | | | 48,303,819 |
| CHILE — 0.4% | | | |
| Bonos de la Tesoreria de la Republica en pesos: | | | | | |
Zero Coupon, 6/19/2024
| | CLP | 135,000,000 | | 148,827 |
2.30%, 10/1/2028 (a)
| | CLP | 120,000,000 | | 119,919 |
2.50%, 3/1/2025
| | CLP | 160,000,000 | | 175,644 |
See accompanying notes to financial statements.
49
SPDR BLOOMBERG INTERNATIONAL TREASURY BOND ETF
SCHEDULE OF INVESTMENTS (continued)
December 31, 2023
| Security Description | | | Principal
Amount | | Value |
4.50%, 3/1/2026
| | CLP | 410,000,000 | | $ 460,725 |
4.70%, 9/1/2030 (a)
| | CLP | 330,000,000 | | 363,389 |
5.00%, 10/1/2028 (a)
| | CLP | 150,000,000 | | 169,090 |
5.00%, 3/1/2035
| | CLP | 540,000,000 | | 605,706 |
5.10%, 7/15/2050
| | CLP | 240,000,000 | | 266,866 |
5.30%, 11/1/2037
| | CLP | 140,000,000 | | 162,686 |
5.80%, 10/1/2034
| | CLP | 95,000,000 | | 114,329 |
6.00%, 4/1/2033 (a)
| | CLP | 315,000,000 | | 384,065 |
Series 30YR, 6.00%, 1/1/2043
| | CLP | 330,000,000 | | 409,158 |
7.00%, 5/1/2034 (a)
| | CLP | 360,000,000 | | 472,599 |
| | | | | | 3,853,003 |
| CHINA — 4.6% | | | |
| China Government Bonds: | | | | | |
2.00%, 6/15/2025
| | CNY | 7,750,000 | | 1,089,297 |
2.18%, 8/25/2025
| | CNY | 15,900,000 | | 2,241,070 |
2.18%, 8/15/2026
| | CNY | 7,000,000 | | 984,217 |
2.22%, 9/25/2025
| | CNY | 10,850,000 | | 1,530,293 |
2.24%, 5/25/2025
| | CNY | 5,550,000 | | 782,484 |
2.26%, 2/24/2025
| | CNY | 2,700,000 | | 381,034 |
2.28%, 11/25/2025
| | CNY | 13,500,000 | | 1,905,492 |
2.30%, 5/15/2026
| | CNY | 9,000,000 | | 1,269,158 |
2.35%, 3/15/2025
| | CNY | 5,000,000 | | 706,155 |
2.37%, 1/20/2027
| | CNY | 1,400,000 | | 197,474 |
2.40%, 7/15/2028
| | CNY | 3,000,000 | | 423,181 |
2.44%, 10/15/2027
| | CNY | 6,050,000 | | 855,031 |
2.46%, 2/15/2026
| | CNY | 5,890,000 | | 834,418 |
2.48%, 4/15/2027
| | CNY | 6,500,000 | | 919,585 |
2.48%, 9/25/2028
| | CNY | 5,750,000 | | 813,317 |
Series 2216, 2.50%, 7/25/2027
| | CNY | 7,500,000 | | 1,061,759 |
2.52%, 8/25/2033
| | CNY | 8,000,000 | | 1,122,709 |
Series INBK, 2.55%, 10/15/2028
| | CNY | 4,870,000 | | 691,483 |
2.60%, 9/15/2030
| | CNY | 7,300,000 | | 1,032,051 |
2.60%, 9/1/2032
| | CNY | 7,500,000 | | 1,057,232 |
2.62%, 4/15/2028
| | CNY | 4,450,000 | | 633,407 |
2.62%, 6/25/2030
| | CNY | 7,000,000 | | 991,555 |
2.64%, 1/15/2028
| | CNY | 5,500,000 | | 782,646 |
2.67%, 5/25/2033
| | CNY | 5,400,000 | | 765,234 |
2.69%, 8/15/2032
| | CNY | 8,000,000 | | 1,135,828 |
2.75%, 6/15/2029
| | CNY | 2,550,000 | | 364,404 |
2.75%, 2/17/2032
| | CNY | 8,150,000 | | 1,163,365 |
2.76%, 5/15/2032
| | CNY | 2,650,000 | | 378,199 |
2.79%, 12/15/2029
| | CNY | 2,000,000 | | 285,966 |
2.80%, 3/24/2029
| | CNY | 4,000,000 | | 573,129 |
2.80%, 3/25/2030
| | CNY | 3,600,000 | | 514,942 |
2.80%, 11/15/2032
| | CNY | 7,750,000 | | 1,110,571 |
2.85%, 6/4/2027
| | CNY | 9,700,000 | | 1,389,504 |
2.88%, 2/25/2033
| | CNY | 3,850,000 | | 555,585 |
2.89%, 11/18/2031
| | CNY | 6,400,000 | | 922,810 |
3.00%, 10/15/2053
| | CNY | 4,250,000 | | 618,703 |
3.12%, 10/25/2052
| | CNY | 3,500,000 | | 513,277 |
3.19%, 4/15/2053
| | CNY | 5,500,000 | | 826,799 |
| Security Description | | | Principal
Amount | | Value |
Series 1907, 3.25%, 6/6/2026
| | CNY | 14,600,000 | | $ 2,111,649 |
Series 1827, 3.25%, 11/22/2028
| | CNY | 20,950,000 | | 3,083,028 |
3.27%, 11/19/2030
| | CNY | 8,350,000 | | 1,234,856 |
3.27%, 3/25/2073
| | CNY | 4,500,000 | | 689,644 |
3.32%, 4/15/2052
| | CNY | 6,000,000 | | 910,255 |
3.39%, 3/16/2050
| | CNY | 6,050,000 | | 926,915 |
3.76%, 3/22/2071
| | CNY | 4,000,000 | | 683,622 |
3.81%, 9/14/2050
| | CNY | 2,500,000 | | 411,096 |
Series 1824, 4.08%, 10/22/2048
| | CNY | 26,830,000 | | 4,564,854 |
Series 1417, 4.63%, 8/11/2034
| | CNY | 500,000 | | 83,958 |
| | | | | | 48,123,241 |
| COLOMBIA — 0.7% | | | |
| Colombia TES: | | | | | |
Series B, 5.75%, 11/3/2027
| | COP | 1,690,000,000 | | 386,117 |
Series B, 6.00%, 4/28/2028
| | COP | 2,664,000,000 | | 605,967 |
Series B, 6.25%, 7/9/2036
| | COP | 500,000,000 | | 94,089 |
Series B, 7.00%, 3/26/2031
| | COP | 3,262,000,000 | | 726,049 |
Series B, 7.00%, 6/30/2032
| | COP | 6,590,000,000 | | 1,422,447 |
Series B, 7.25%, 10/18/2034
| | COP | 2,024,000,000 | | 428,990 |
Series B, 7.25%, 10/26/2050
| | COP | 2,162,000,000 | | 404,887 |
Series B, 7.50%, 8/26/2026
| | COP | 4,186,000,000 | | 1,032,777 |
Series B, 9.25%, 5/28/2042
| | COP | 4,880,000,000 | | 1,143,444 |
Series B, 13.25%, 2/9/2033
| | COP | 2,982,400,000 | | 914,025 |
| | | | | | 7,158,792 |
| CROATIA — 0.3% | | | |
Croatia Government Bonds 2.13%, 7/15/2026
| | EUR | 150,000 | | 158,636 |
| Croatia Government International Bonds: | | | | | |
1.13%, 6/19/2029
| | EUR | 391,000 | | 391,426 |
1.50%, 6/17/2031
| | EUR | 400,000 | | 394,912 |
2.88%, 4/22/2032
| | EUR | 1,050,000 | | 1,132,753 |
3.00%, 3/20/2027
| | EUR | 900,000 | | 992,950 |
| | | | | | 3,070,677 |
| CYPRUS — 0.1% | | | |
| Cyprus Government International Bonds: | | | | | |
Series EMTN, 0.63%, 1/21/2030
| | EUR | 125,000 | | 121,288 |
See accompanying notes to financial statements.
50
SPDR BLOOMBERG INTERNATIONAL TREASURY BOND ETF
SCHEDULE OF INVESTMENTS (continued)
December 31, 2023
| Security Description | | | Principal
Amount | | Value |
Series EMTN, 0.95%, 1/20/2032
| | EUR | 150,000 | | $ 142,102 |
Series EMTN, 1.25%, 1/21/2040
| | EUR | 100,000 | | 79,656 |
Series EMTN, 1.50%, 4/16/2027
| | EUR | 150,000 | | 159,003 |
Series EMTN, 2.38%, 9/25/2028
| | EUR | 250,000 | | 270,318 |
Series EMTN, 2.75%, 2/26/2034
| | EUR | 100,000 | | 103,713 |
Series EMTN, 2.75%, 5/3/2049
| | EUR | 250,000 | | 228,899 |
Series EMTN, 4.25%, 11/4/2025
| | EUR | 170,000 | | 191,874 |
| | | | | | 1,296,853 |
| CZECH REPUBLIC — 1.0% | | | |
| Czech Republic Government Bonds: | | | | | |
Series 130, 0.05%, 11/29/2029
| | CZK | 8,480,000 | | 305,930 |
Series 100, 0.25%, 2/10/2027
| | CZK | 13,160,000 | | 525,173 |
Series 94, 0.95%, 5/15/2030
| | CZK | 14,680,000 | | 554,237 |
Series 95, 1.00%, 6/26/2026
| | CZK | 10,690,000 | | 443,119 |
Series 121, 1.20%, 3/13/2031
| | CZK | 14,350,000 | | 539,852 |
Series 120, 1.25%, 2/14/2025
| | CZK | 5,950,000 | | 255,900 |
Series 125, 1.50%, 4/24/2040
| | CZK | 7,600,000 | | 243,388 |
Series 138, 1.75%, 6/23/2032
| | CZK | 11,300,000 | | 434,363 |
Series 142, 1.95%, 7/30/2037
| | CZK | 3,500,000 | | 125,493 |
Series 103, 2.00%, 10/13/2033
| | CZK | 17,080,000 | | 655,013 |
Series 89, 2.40%, 9/17/2025
| | CZK | 17,190,000 | | 742,683 |
Series 78, 2.50%, 8/25/2028
| | CZK | 15,700,000 | | 665,520 |
Series 105, 2.75%, 7/23/2029
| | CZK | 17,700,000 | | 751,412 |
Series 145, 3.50%, 5/30/2035
| | CZK | 9,400,000 | | 409,654 |
Series 49, 4.20%, 12/4/2036
| | CZK | 8,690,000 | | 403,791 |
Series 154, 4.50%, 11/11/2032
| | CZK | 5,000,000 | | 235,015 |
Series 53, 4.85%, 11/26/2057
| | CZK | 1,750,000 | | 88,011 |
Series 11Y, 4.90%, 4/14/2034
| | CZK | 3,850,000 | | 188,714 |
Series 150, 5.00%, 9/30/2030
| | CZK | 17,600,000 | | 845,603 |
| Security Description | | | Principal
Amount | | Value |
Series 149, 5.50%, 12/12/2028
| | CZK | 11,400,000 | | $ 552,413 |
Series 153, 5.75%, 3/29/2029
| | CZK | 5,950,000 | | 291,196 |
Series 148, 6.00%, 2/26/2026
| | CZK | 15,050,000 | | 700,864 |
Series 152, 6.20%, 6/16/2031
| | CZK | 3,700,000 | | 192,006 |
| | | | | | 10,149,350 |
| DENMARK — 0.7% | | | |
| Denmark Government Bonds: | | | | | |
Series 10Y, Zero Coupon, 11/15/2031
| | DKK | 8,996,000 | | 1,128,223 |
Series 30Y, 0.25%, 11/15/2052
| | DKK | 5,917,000 | | 497,911 |
Series 10Y, 0.50%, 11/15/2027
| | DKK | 6,682,000 | | 932,429 |
Series 10YR, 0.50%, 11/15/2029
| | DKK | 4,390,000 | | 594,066 |
1.75%, 11/15/2025
| | DKK | 6,128,000 | | 896,307 |
2.25%, 11/15/2033
| | DKK | 2,925,000 | | 433,161 |
4.50%, 11/15/2039
| | DKK | 13,359,000 | | 2,526,338 |
| | | | | | 7,008,435 |
| ESTONIA — 0.0% (b) | | | |
| Estonia Government International Bonds: | | | | | |
0.13%, 6/10/2030
| | EUR | 188,000 | | 172,110 |
4.00%, 10/12/2032
| | EUR | 175,000 | | 206,894 |
| | | | | | 379,004 |
| FINLAND — 1.2% | | | |
| Finland Government Bonds: | | | | | |
Zero Coupon, 9/15/2026 (a)
| | EUR | 196,000 | | 202,971 |
Zero Coupon, 9/15/2030 (a)
| | EUR | 225,000 | | 212,092 |
0.13%, 9/15/2031 (a)
| | EUR | 646,000 | | 597,305 |
0.13%, 4/15/2036 (a)
| | EUR | 521,000 | | 420,201 |
0.13%, 4/15/2052 (a)
| | EUR | 534,000 | | 289,780 |
0.25%, 9/15/2040 (a)
| | EUR | 365,000 | | 266,953 |
0.50%, 4/15/2026 (a)
| | EUR | 724,000 | | 765,106 |
0.50%, 9/15/2027 (a)
| | EUR | 726,000 | | 751,920 |
0.50%, 9/15/2028 (a)
| | EUR | 619,000 | | 628,611 |
0.50%, 9/15/2029 (a)
| | EUR | 748,000 | | 746,400 |
0.50%, 4/15/2043
| | EUR | 442,000 | | 319,236 |
0.75%, 4/15/2031 (a)
| | EUR | 696,000 | | 684,117 |
0.88%, 9/15/2025 (a)
| | EUR | 226,000 | | 242,535 |
1.13%, 4/15/2034 (a)
| | EUR | 716,000 | | 685,819 |
1.38%, 4/15/2027 (a)
| | EUR | 408,000 | | 436,185 |
Series 30Y, 1.38%, 4/15/2047 (a)
| | EUR | 665,000 | | 557,019 |
1.50%, 9/15/2032 (a)
| | EUR | 595,000 | | 605,312 |
See accompanying notes to financial statements.
51
SPDR BLOOMBERG INTERNATIONAL TREASURY BOND ETF
SCHEDULE OF INVESTMENTS (continued)
December 31, 2023
| Security Description | | | Principal
Amount | | Value |
2.63%, 7/4/2042 (a)
| | EUR | 735,000 | | $ 788,665 |
2.75%, 7/4/2028 (a)
| | EUR | 515,000 | | 579,419 |
2.75%, 4/15/2038 (a)
| | EUR | 350,000 | | 384,765 |
2.88%, 4/15/2029 (a)
| | EUR | 500,000 | | 567,125 |
3.00%, 9/15/2033 (a)
| | EUR | 635,000 | | 726,214 |
4.00%, 7/4/2025 (a)
| | EUR | 792,000 | | 891,261 |
| | | | | | 12,349,011 |
| FRANCE — 4.9% | | | |
| French Republic Government Bonds OAT: | | | | | |
Zero Coupon, 2/25/2025
| | EUR | 152,000 | | 162,450 |
Zero Coupon, 3/25/2025
| | EUR | 1,082,000 | | 1,154,144 |
Zero Coupon, 2/25/2026
| | EUR | 1,228,000 | | 1,289,762 |
Zero Coupon, 2/25/2027
| | EUR | 1,078,000 | | 1,110,121 |
Zero Coupon, 11/25/2029
| | EUR | 1,502,000 | | 1,455,297 |
Zero Coupon, 11/25/2030
| | EUR | 1,462,000 | | 1,380,501 |
Zero Coupon, 11/25/2031
| | EUR | 1,022,000 | | 937,848 |
Zero Coupon, 5/25/2032
| | EUR | 924,000 | | 835,379 |
0.25%, 11/25/2026
| | EUR | 1,027,000 | | 1,071,059 |
0.50%, 5/25/2025
| | EUR | 1,016,000 | | 1,088,608 |
0.50%, 5/25/2026
| | EUR | 1,253,000 | | 1,325,188 |
0.50%, 5/25/2029
| | EUR | 1,491,000 | | 1,502,957 |
0.50%, 5/25/2040 (a)
| | EUR | 666,000 | | 509,478 |
0.50%, 6/25/2044 (a)
| | EUR | 414,000 | | 286,420 |
0.50%, 5/25/2072 (a)
| | EUR | 317,000 | | 146,447 |
0.75%, 2/25/2028
| | EUR | 1,483,000 | | 1,543,538 |
0.75%, 5/25/2028
| | EUR | 1,786,000 | | 1,852,609 |
0.75%, 11/25/2028
| | EUR | 1,601,000 | | 1,649,097 |
0.75%, 5/25/2052
| | EUR | 802,000 | | 507,714 |
0.75%, 5/25/2053 (a)
| | EUR | 700,000 | | 434,323 |
1.00%, 11/25/2025
| | EUR | 866,000 | | 930,994 |
1.00%, 5/25/2027
| | EUR | 1,299,000 | | 1,376,820 |
1.25%, 5/25/2034
| | EUR | 1,253,000 | | 1,215,954 |
1.25%, 5/25/2036 (a)
| | EUR | 1,132,000 | | 1,057,970 |
1.25%, 5/25/2038
| | EUR | 344,000 | | 309,443 |
1.50%, 5/25/2031
| | EUR | 1,543,000 | | 1,609,055 |
1.50%, 5/25/2050 (a)
| | EUR | 792,000 | | 635,478 |
1.75%, 6/25/2039 (a)
| | EUR | 665,000 | | 638,606 |
1.75%, 5/25/2066 (a)
| | EUR | 350,000 | | 275,731 |
2.00%, 11/25/2032
| | EUR | 300,000 | | 319,552 |
2.00%, 5/25/2048 (a)
| | EUR | 576,000 | | 526,136 |
2.50%, 9/24/2026
| | EUR | 1,460,000 | | 1,619,353 |
2.50%, 5/25/2030
| | EUR | 1,895,000 | | 2,121,136 |
2.50%, 5/25/2043 (a)
| | EUR | 186,000 | | 191,132 |
2.75%, 10/25/2027
| | EUR | 1,343,000 | | 1,510,768 |
2.75%, 2/25/2029
| | EUR | 1,067,000 | | 1,206,615 |
| Security Description | | | Principal
Amount | | Value |
3.00%, 5/25/2033
| | EUR | 1,460,000 | | $ 1,677,649 |
3.00%, 5/25/2054 (a)
| | EUR | 565,000 | | 612,963 |
3.25%, 5/25/2045
| | EUR | 1,191,000 | | 1,372,342 |
3.50%, 4/25/2026
| | EUR | 1,771,000 | | 2,005,112 |
3.50%, 11/25/2033
| | EUR | 400,000 | | 477,941 |
4.00%, 10/25/2038
| | EUR | 956,000 | | 1,207,630 |
4.00%, 4/25/2055 (a)
| | EUR | 906,000 | | 1,180,215 |
4.00%, 4/25/2060
| | EUR | 699,000 | | 922,687 |
4.50%, 4/25/2041
| | EUR | 1,330,000 | | 1,790,672 |
4.75%, 4/25/2035
| | EUR | 966,000 | | 1,283,948 |
5.50%, 4/25/2029
| | EUR | 707,000 | | 905,090 |
5.75%, 10/25/2032
| | EUR | 1,104,000 | | 1,532,066 |
6.00%, 10/25/2025
| | EUR | 1,170,000 | | 1,370,894 |
| | | | | | 52,126,892 |
| GERMANY — 4.5% | | | |
| Bundesobligation: | | | | | |
Series 181, Zero Coupon, 4/11/2025
| | EUR | 629,000 | | 670,987 |
Series 182, Zero Coupon, 10/10/2025
| | EUR | 1,066,000 | | 1,129,364 |
Series 183, Zero Coupon, 4/10/2026
| | EUR | 744,000 | | 781,912 |
Series 184, Zero Coupon, 10/9/2026
| | EUR | 501,000 | | 522,106 |
Series 186, 1.30%, 10/15/2027
| | EUR | 1,157,000 | | 1,247,373 |
Series 187, 2.20%, 4/13/2028
| | EUR | 950,000 | | 1,059,230 |
Series 188, 2.40%, 10/19/2028
| | EUR | 925,000 | | 1,042,824 |
| Bundesrepublik Deutschland Bundesanleihe: | | | | | |
Zero Coupon, 8/15/2026
| | EUR | 559,000 | | 584,335 |
Zero Coupon, 11/15/2027
| | EUR | 819,000 | | 838,846 |
Zero Coupon, 11/15/2028
| | EUR | 542,000 | | 546,263 |
Zero Coupon, 8/15/2029
| | EUR | 929,000 | | 924,380 |
Zero Coupon, 2/15/2030
| | EUR | 484,000 | | 477,082 |
Zero Coupon, 8/15/2030
| | EUR | 1,142,000 | | 1,114,988 |
Zero Coupon, 2/15/2031
| | EUR | 845,000 | | 816,402 |
Zero Coupon, 8/15/2031
| | EUR | 1,159,000 | | 1,108,354 |
Zero Coupon, 2/15/2032
| | EUR | 760,000 | | 718,127 |
See accompanying notes to financial statements.
52
SPDR BLOOMBERG INTERNATIONAL TREASURY BOND ETF
SCHEDULE OF INVESTMENTS (continued)
December 31, 2023
| Security Description | | | Principal
Amount | | Value |
Zero Coupon, 5/15/2036
| | EUR | 680,000 | | $ 575,922 |
Zero Coupon, 8/15/2050
| | EUR | 1,744,000 | | 1,073,891 |
Zero Coupon, 8/15/2052
| | EUR | 925,000 | | 544,428 |
0.25%, 2/15/2027
| | EUR | 1,472,000 | | 1,539,182 |
0.25%, 8/15/2028
| | EUR | 713,000 | | 730,835 |
0.25%, 2/15/2029
| | EUR | 120,000 | | 122,131 |
0.50%, 2/15/2025
| | EUR | 541,000 | | 581,940 |
0.50%, 2/15/2026
| | EUR | 862,000 | | 917,192 |
0.50%, 8/15/2027
| | EUR | 763,000 | | 799,910 |
0.50%, 2/15/2028
| | EUR | 787,000 | | 820,750 |
1.00%, 8/15/2025
| | EUR | 944,000 | | 1,017,304 |
1.00%, 5/15/2038
| | EUR | 593,000 | | 556,864 |
1.25%, 8/15/2048
| | EUR | 686,000 | | 615,521 |
1.70%, 8/15/2032
| | EUR | 750,000 | | 811,216 |
1.80%, 8/15/2053
| | EUR | 1,014,000 | | 1,010,742 |
2.10%, 11/15/2029
| | EUR | 824,000 | | 919,243 |
2.30%, 2/15/2033
| | EUR | 1,411,000 | | 1,598,455 |
Series 7Y, 2.40%, 11/15/2030
| | EUR | 332,000 | | 377,570 |
2.50%, 7/4/2044
| | EUR | 844,000 | | 962,924 |
2.50%, 8/15/2046
| | EUR | 789,000 | | 904,919 |
Series 10Y, 2.60%, 8/15/2033
| | EUR | 874,000 | | 1,013,687 |
3.25%, 7/4/2042
| | EUR | 972,000 | | 1,226,183 |
Series 05, 4.00%, 1/4/2037
| | EUR | 1,179,000 | | 1,567,045 |
Series 2007, 4.25%, 7/4/2039
| | EUR | 1,155,000 | | 1,605,548 |
Series 98, 4.75%, 7/4/2028
| | EUR | 1,082,000 | | 1,337,289 |
Series 03, 4.75%, 7/4/2034
| | EUR | 932,000 | | 1,287,817 |
Series 08, 4.75%, 7/4/2040
| | EUR | 946,000 | | 1,397,906 |
5.50%, 1/4/2031
| | EUR | 1,263,000 | | 1,716,991 |
Series 98, 5.63%, 1/4/2028
| | EUR | 1,319,000 | | 1,658,789 |
6.25%, 1/4/2030
| | EUR | 1,059,000 | | 1,452,730 |
Series 97, 6.50%, 7/4/2027
| | EUR | 1,043,000 | | 1,322,567 |
| Bundesschatzanweisungen: | | | | | |
2.50%, 3/13/2025
| | EUR | 533,000 | | 586,423 |
2.80%, 6/12/2025
| | EUR | 179,000 | | 198,032 |
Series 2Y, 3.10%, 9/18/2025
| | EUR | 700,000 | | 780,527 |
| | | | | | 47,215,046 |
| HONG KONG — 0.1% | | | |
| Hong Kong Government Bonds Programme: | | | | | |
1.25%, 6/29/2027
| | HKD | 1,800,000 | | 216,971 |
1.59%, 3/4/2036
| | HKD | 200,000 | | 21,082 |
1.68%, 1/21/2026
| | HKD | 1,950,000 | | 241,641 |
1.79%, 4/14/2025
| | HKD | 800,000 | | 100,038 |
| Security Description | | | Principal
Amount | | Value |
1.89%, 3/2/2032
| | HKD | 800,000 | | $ 94,068 |
1.97%, 1/17/2029
| | HKD | 600,000 | | 73,290 |
2.02%, 3/7/2034
| | HKD | 300,000 | | 34,332 |
2.13%, 7/16/2030
| | HKD | 500,000 | | 60,847 |
| | | | | | 842,269 |
| HUNGARY — 0.5% | | | |
| Hungary Government Bonds: | | | | | |
Series 25/C, 1.00%, 11/26/2025
| | HUF | 91,180,000 | | 239,568 |
Series 26/E, 1.50%, 4/22/2026
| | HUF | 57,700,000 | | 150,284 |
Series 26/F, 1.50%, 8/26/2026
| | HUF | 65,000,000 | | 167,070 |
Series 29/A, 2.00%, 5/23/2029
| | HUF | 100,000,000 | | 241,152 |
Series 33/A, 2.25%, 4/20/2033
| | HUF | 101,720,000 | | 222,075 |
Series 34/A, 2.25%, 6/22/2034
| | HUF | 40,000,000 | | 83,698 |
Series 26/D, 2.75%, 12/22/2026
| | HUF | 92,780,000 | | 243,638 |
Series 27/A, 3.00%, 10/27/2027
| | HUF | 156,260,000 | | 411,156 |
Series 30/A, 3.00%, 8/21/2030
| | HUF | 129,210,000 | | 319,947 |
Series 38/A, 3.00%, 10/27/2038
| | HUF | 103,500,000 | | 208,704 |
Series 41/A, 3.00%, 4/25/2041
| | HUF | 45,000,000 | | 86,331 |
Series 31/A, 3.25%, 10/22/2031
| | HUF | 135,000,000 | | 331,727 |
Series 28/B, 4.50%, 3/23/2028
| | HUF | 151,000,000 | | 415,056 |
4.50%, 5/27/2032
| | HUF | 71,000,000 | | 185,766 |
Series 32/A, 4.75%, 11/24/2032
| | HUF | 196,000,000 | | 521,631 |
Series 25/B, 5.50%, 6/24/2025
| | HUF | 122,940,000 | | 351,188 |
Series 28/A, 6.75%, 10/22/2028
| | HUF | 228,870,000 | | 686,042 |
| | | | | | 4,865,033 |
| INDONESIA — 2.7% | | | |
| Indonesia Treasury Bonds: | | | | | |
Series FR90, 5.13%, 4/15/2027
| | IDR | 15,506,000,000 | | 968,156 |
Series FR86, 5.50%, 4/15/2026
| | IDR | 13,255,000,000 | | 843,466 |
Series FR64, 6.13%, 5/15/2028
| | IDR | 39,671,000,000 | | 2,541,345 |
Series FR88, 6.25%, 6/15/2036
| | IDR | 13,438,000,000 | | 846,663 |
Series FR95, 6.38%, 8/15/2028
| | IDR | 19,328,000,000 | | 1,251,016 |
See accompanying notes to financial statements.
53
SPDR BLOOMBERG INTERNATIONAL TREASURY BOND ETF
SCHEDULE OF INVESTMENTS (continued)
December 31, 2023
| Security Description | | | Principal
Amount | | Value |
Series FR91, 6.38%, 4/15/2032
| | IDR | 18,992,000,000 | | $ 1,218,759 |
Series FR93, 6.38%, 7/15/2037
| | IDR | 5,605,000,000 | | 358,571 |
Series FR81, 6.50%, 6/15/2025
| | IDR | 15,990,000,000 | | 1,038,639 |
Series FR87, 6.50%, 2/15/2031
| | IDR | 24,990,000,000 | | 1,614,117 |
Series FR65, 6.63%, 5/15/2033
| | IDR | 40,445,000,000 | | 2,632,379 |
Series 100, 6.63%, 2/15/2034
| | IDR | 11,950,000,000 | | 776,051 |
Series FR89, 6.88%, 8/15/2051
| | IDR | 8,315,000,000 | | 537,610 |
Series FR59, 7.00%, 5/15/2027
| | IDR | 44,850,000,000 | | 2,956,948 |
Series FR82, 7.00%, 9/15/2030
| | IDR | 11,000,000,000 | | 729,213 |
Series FR96, 7.00%, 2/15/2033
| | IDR | 16,205,000,000 | | 1,088,946 |
Series FR98, 7.13%, 6/15/2038
| | IDR | 5,250,000,000 | | 356,132 |
Series FR92, 7.13%, 6/15/2042
| | IDR | 21,230,000,000 | | 1,427,155 |
Series FR97, 7.13%, 6/15/2043
| | IDR | 8,000,000,000 | | 538,209 |
Series FR76, 7.38%, 5/15/2048
| | IDR | 10,875,000,000 | | 741,509 |
Series FR75, 7.50%, 5/15/2038
| | IDR | 44,206,000,000 | | 3,070,504 |
Series FR83, 7.50%, 4/15/2040
| | IDR | 5,000,000,000 | | 346,373 |
| Perusahaan Penerbit SBSN Indonesia: | | | | | |
Series PBS, 5.38%, 8/15/2025
| | IDR | 17,053,000,000 | | 1,086,357 |
Series PBS, 6.50%, 6/15/2039
| | IDR | 2,814,000,000 | | 177,539 |
Series PBS, 6.75%, 6/15/2047
| | IDR | 7,500,000,000 | | 484,060 |
Series PBS, 6.88%, 3/15/2036
| | IDR | 10,000,000,000 | | 655,865 |
| | | | | | 28,285,582 |
| IRELAND — 1.3% | | | |
| Ireland Government Bonds: | | | | | |
Zero Coupon, 10/18/2031
| | EUR | 763,000 | | 705,144 |
0.20%, 5/15/2027
| | EUR | 371,000 | | 383,128 |
0.20%, 10/18/2030
| | EUR | 1,003,000 | | 962,918 |
0.35%, 10/18/2032
| | EUR | 692,000 | | 643,202 |
0.40%, 5/15/2035
| | EUR | 519,900 | | 454,539 |
0.55%, 4/22/2041
| | EUR | 319,000 | | 246,467 |
0.90%, 5/15/2028
| | EUR | 1,105,000 | | 1,156,700 |
1.00%, 5/15/2026
| | EUR | 985,000 | | 1,055,181 |
1.10%, 5/15/2029
| | EUR | 1,105,000 | | 1,151,739 |
| Security Description | | | Principal
Amount | | Value |
1.30%, 5/15/2033
| | EUR | 531,000 | | $ 532,018 |
1.35%, 3/18/2031
| | EUR | 687,000 | | 713,970 |
1.50%, 5/15/2050
| | EUR | 952,000 | | 788,926 |
1.70%, 5/15/2037
| | EUR | 813,000 | | 800,208 |
2.00%, 2/18/2045
| | EUR | 1,160,000 | | 1,104,810 |
2.40%, 5/15/2030
| | EUR | 939,000 | | 1,045,925 |
3.00%, 10/18/2043
| | EUR | 400,000 | | 458,315 |
5.40%, 3/13/2025
| | EUR | 1,309,000 | | 1,484,355 |
| | | | | | 13,687,545 |
| ISRAEL — 0.7% | | | |
| Israel Government Bonds - Fixed: | | | | | |
Series 0425, 0.50%, 4/30/2025
| | ILS | 2,260,000 | | 600,364 |
Series 0226, 0.50%, 2/27/2026
| | ILS | 2,250,000 | | 583,220 |
Series 0330, 1.00%, 3/31/2030
| | ILS | 3,380,000 | | 792,572 |
Series 0432, 1.30%, 4/30/2032
| | ILS | 1,400,000 | | 320,053 |
Series 0537, 1.50%, 5/31/2037
| | ILS | 3,255,000 | | 646,126 |
Series 0825, 1.75%, 8/31/2025
| | ILS | 2,404,000 | | 645,144 |
Series 0327, 2.00%, 3/31/2027
| | ILS | 2,940,000 | | 775,306 |
Series 0928, 2.25%, 9/28/2028
| | ILS | 2,585,000 | | 672,966 |
Series 1152, 2.80%, 11/29/2052
| | ILS | 1,937,000 | | 382,072 |
Series 0229, 3.75%, 2/28/2029
| | ILS | 1,025,000 | | 292,593 |
Series 0347, 3.75%, 3/31/2047
| | ILS | 2,045,000 | | 504,166 |
Series 0142, 5.50%, 1/31/2042
| | ILS | 2,948,000 | | 929,798 |
Series 1026, 6.25%, 10/30/2026
| | ILS | 1,490,000 | | 442,033 |
| | | | | | 7,586,413 |
| ITALY — 4.5% | | | |
| Italy Buoni Poliennali Del Tesoro: | | | | | |
Series 5Y, Zero Coupon, 4/1/2026
| | EUR | 567,000 | | 588,067 |
Series 5Y, Zero Coupon, 8/1/2026
| | EUR | 500,000 | | 514,475 |
Series 6Y, 0.35%, 2/1/2025
| | EUR | 71,000 | | 76,046 |
Series 5Y, 0.50%, 2/1/2026
| | EUR | 500,000 | | 526,266 |
Series 10Y, 0.60%, 8/1/2031 (a)
| | EUR | 272,000 | | 245,498 |
Series 8Y, 0.85%, 1/15/2027
| | EUR | 698,000 | | 728,145 |
Series 11Y, 0.90%, 4/1/2031
| | EUR | 365,000 | | 340,962 |
See accompanying notes to financial statements.
54
SPDR BLOOMBERG INTERNATIONAL TREASURY BOND ETF
SCHEDULE OF INVESTMENTS (continued)
December 31, 2023
| Security Description | | | Principal
Amount | | Value |
Series 7Y, 0.95%, 9/15/2027
| | EUR | 460,000 | | $ 474,966 |
Series 10Y, 0.95%, 8/1/2030
| | EUR | 735,000 | | 702,111 |
Series 10Y, 0.95%, 12/1/2031 (a)
| | EUR | 265,000 | | 243,458 |
Series 10Y, 0.95%, 6/1/2032
| | EUR | 414,000 | | 374,504 |
Series 16Y, 0.95%, 3/1/2037 (a)
| | EUR | 186,000 | | 143,931 |
Series 3Y, 1.20%, 8/15/2025
| | EUR | 464,000 | | 498,257 |
Series 10Y, 1.25%, 12/1/2026
| | EUR | 738,000 | | 780,808 |
Series 11Y, 1.35%, 4/1/2030
| | EUR | 1,118,000 | | 1,107,033 |
Series 7Y, 1.45%, 5/15/2025
| | EUR | 400,000 | | 432,493 |
Series 16Y, 1.45%, 3/1/2036 (a)
| | EUR | 518,000 | | 440,351 |
Series 10Y, 1.50%, 6/1/2025
| | EUR | 405,000 | | 437,881 |
Series 34Y, 1.50%, 4/30/2045 (a)
| | EUR | 150,000 | | 104,936 |
Series 10Y, 1.60%, 6/1/2026
| | EUR | 598,000 | | 642,329 |
Series 10Y, 1.65%, 12/1/2030 (a)
| | EUR | 669,000 | | 664,303 |
Series 17Y, 1.65%, 3/1/2032 (a)
| | EUR | 627,000 | | 605,649 |
Series 31Y, 1.70%, 9/1/2051 (a)
| | EUR | 450,000 | | 305,453 |
Series 5Y, 1.85%, 7/1/2025 (a)
| | EUR | 253,000 | | 274,676 |
Series 10Y, 2.00%, 12/1/2025
| | EUR | 508,000 | | 552,110 |
Series 10Y, 2.00%, 2/1/2028
| | EUR | 576,000 | | 615,090 |
Series 10Y, 2.05%, 8/1/2027
| | EUR | 503,000 | | 541,192 |
Series 7Y, 2.10%, 7/15/2026
| | EUR | 477,000 | | 518,224 |
Series 30Y, 2.15%, 9/1/2052 (a)
| | EUR | 159,000 | | 116,724 |
Series 50Y, 2.15%, 3/1/2072 (a)
| | EUR | 190,000 | | 127,895 |
Series 10Y, 2.20%, 6/1/2027
| | EUR | 750,000 | | 812,357 |
Series 20Y, 2.25%, 9/1/2036 (a)
| | EUR | 645,000 | | 597,503 |
Series 15Y, 2.45%, 9/1/2033 (a)
| | EUR | 975,000 | | 977,925 |
2.45%, 9/1/2050 (a)
| | EUR | 200,000 | | 161,371 |
Series 7Y, 2.50%, 11/15/2025
| | EUR | 843,000 | | 925,195 |
Series 5Y, 2.65%, 12/1/2027
| | EUR | 435,000 | | 476,775 |
| Security Description | | | Principal
Amount | | Value |
Series 31Y, 2.70%, 3/1/2047 (a)
| | EUR | 537,000 | | $ 467,653 |
Series 10Y, 2.80%, 12/1/2028
| | EUR | 1,302,000 | | 1,427,367 |
Series 7Y, 2.80%, 6/15/2029
| | EUR | 633,000 | | 689,130 |
Series 50Y, 2.80%, 3/1/2067 (a)
| | EUR | 245,000 | | 198,603 |
Series 20Y, 2.95%, 9/1/2038 (a)
| | EUR | 658,000 | | 644,028 |
Series 10Y, 3.00%, 8/1/2029
| | EUR | 972,000 | | 1,069,661 |
Series 21Y, 3.10%, 3/1/2040 (a)
| | EUR | 205,000 | | 200,539 |
Series 16Y, 3.25%, 3/1/2038 (a)
| | EUR | 287,000 | | 291,112 |
Series 31Y, 3.25%, 9/1/2046 (a)
| | EUR | 706,000 | | 677,071 |
Series 26Y, 3.35%, 3/1/2035 (a)
| | EUR | 794,000 | | 843,693 |
3.40%, 3/28/2025
| | EUR | 421,000 | | 466,242 |
Series 5Y, 3.40%, 4/1/2028
| | EUR | 569,000 | | 640,237 |
Series 31Y, 3.45%, 3/1/2048 (a)
| | EUR | 741,000 | | 732,026 |
Series 16Y, 3.50%, 3/1/2030 (a)
| | EUR | 886,000 | | 997,077 |
Series 2Y, 3.60%, 9/29/2025
| | EUR | 300,000 | | 334,813 |
3.70%, 6/15/2030
| | EUR | 604,000 | | 684,347 |
3.80%, 4/15/2026
| | EUR | 600,000 | | 677,173 |
Series 5Y, 3.80%, 8/1/2028
| | EUR | 816,000 | | 932,518 |
Series 3Y, 3.85%, 9/15/2026
| | EUR | 300,000 | | 340,214 |
Series 30Y, 3.85%, 9/1/2049 (a)
| | EUR | 394,000 | | 411,604 |
Series 7Y, 4.00%, 11/15/2030
| | EUR | 317,000 | | 365,092 |
Series 8Y, 4.00%, 10/30/2031 (a)
| | EUR | 250,000 | | 287,734 |
Series 13Y, 4.00%, 4/30/2035 (a)
| | EUR | 571,000 | | 644,033 |
Series 31Y, 4.00%, 2/1/2037 (a)
| | EUR | 1,219,000 | | 1,362,744 |
4.10%, 2/1/2029
| | EUR | 200,000 | | 231,658 |
Series 10Y, 4.20%, 3/1/2034
| | EUR | 500,000 | | 577,168 |
4.35%, 11/1/2033
| | EUR | 175,000 | | 204,702 |
4.45%, 9/1/2043 (a)
| | EUR | 250,000 | | 284,707 |
Series 16Y, 4.50%, 3/1/2026 (a)
| | EUR | 1,157,000 | | 1,321,805 |
Series 30Y, 4.50%, 10/1/2053 (a)
| | EUR | 300,000 | | 341,883 |
Series 15Y, 4.75%, 9/1/2028 (a)
| | EUR | 1,041,000 | | 1,238,141 |
See accompanying notes to financial statements.
55
SPDR BLOOMBERG INTERNATIONAL TREASURY BOND ETF
SCHEDULE OF INVESTMENTS (continued)
December 31, 2023
| Security Description | | | Principal
Amount | | Value |
Series 31Y, 4.75%, 9/1/2044 (a)
| | EUR | 781,000 | | $ 928,432 |
Series 16Y, 5.00%, 3/1/2025 (a)
| | EUR | 550,000 | | 619,801 |
Series 31Y, 5.00%, 8/1/2034 (a)
| | EUR | 906,000 | | 1,114,219 |
Series 32Y, 5.00%, 8/1/2039 (a)
| | EUR | 753,000 | | 918,802 |
Series 31Y, 5.00%, 9/1/2040 (a)
| | EUR | 808,000 | | 985,990 |
Series 31Y, 5.25%, 11/1/2029
| | EUR | 731,000 | | 899,410 |
Series 31Y, 5.75%, 2/1/2033
| | EUR | 617,000 | | 795,671 |
Series 31Y, 6.00%, 5/1/2031
| | EUR | 1,112,000 | | 1,444,820 |
Series 30Y, 6.50%, 11/1/2027
| | EUR | 1,116,000 | | 1,394,428 |
Series 30Y, 7.25%, 11/1/2026
| | EUR | 755,000 | | 934,421 |
| | | | | | 47,295,728 |
| JAPAN — 23.2% | | | |
| Japan Government Five Year Bonds: | | | | | |
Series 147, 0.01%, 3/20/2026
| | JPY | 309,350,000 | | 2,192,988 |
Series 148, 0.01%, 6/20/2026
| | JPY | 343,000,000 | | 2,431,071 |
Series 149, 0.01%, 9/20/2026
| | JPY | 313,900,000 | | 2,223,863 |
Series 150, 0.01%, 12/20/2026
| | JPY | 296,350,000 | | 2,098,540 |
Series 151, 0.01%, 3/20/2027
| | JPY | 269,000,000 | | 1,904,008 |
Series 153, 0.01%, 6/20/2027
| | JPY | 340,000,000 | | 2,404,310 |
Series 143, 0.10%, 3/20/2025
| | JPY | 242,500,000 | | 1,722,527 |
0.10%, 6/20/2025
| | JPY | 392,850,000 | | 2,790,578 |
Series 145, 0.10%, 9/20/2025
| | JPY | 300,000,000 | | 2,131,132 |
Series 146, 0.10%, 12/20/2025
| | JPY | 267,700,000 | | 1,901,737 |
Series 152, 0.10%, 3/20/2027
| | JPY | 119,950,000 | | 851,604 |
Series 154, 0.10%, 9/20/2027
| | JPY | 300,000,000 | | 2,126,727 |
Series 158, 0.10%, 3/20/2028
| | JPY | 208,200,000 | | 1,472,877 |
Series 159, 0.10%, 6/20/2028
| | JPY | 112,000,000 | | 791,571 |
Series 156, 0.20%, 12/20/2027
| | JPY | 238,000,000 | | 1,692,268 |
Series 157, 0.20%, 3/20/2028
| | JPY | 135,000,000 | | 959,038 |
Series 160, 0.20%, 6/20/2028
| | JPY | 150,000,000 | | 1,064,747 |
| Security Description | | | Principal
Amount | | Value |
Series 155, 0.30%, 12/20/2027
| | JPY | 148,000,000 | | $ 1,056,597 |
Series 161, 0.30%, 6/20/2028
| | JPY | 120,500,000 | | 859,056 |
Series 162, 0.30%, 9/20/2028
| | JPY | 100,000,000 | | 711,945 |
Series 163, 0.40%, 9/20/2028
| | JPY | 225,500,000 | | 1,613,066 |
| Japan Government Forty Year Bonds: | | | | | |
Series 9, 0.40%, 3/20/2056
| | JPY | 128,450,000 | | 622,388 |
Series 12, 0.50%, 3/20/2059
| | JPY | 92,000,000 | | 445,467 |
Series 13, 0.50%, 3/20/2060
| | JPY | 125,600,000 | | 602,182 |
Series 14, 0.70%, 3/20/2061
| | JPY | 123,250,000 | | 629,914 |
Series 11, 0.80%, 3/20/2058
| | JPY | 81,350,000 | | 443,507 |
Series 10, 0.90%, 3/20/2057
| | JPY | 112,750,000 | | 640,055 |
Series 15, 1.00%, 3/20/2062
| | JPY | 180,050,000 | | 1,012,829 |
Series 16, 1.30%, 3/20/2063
| | JPY | 109,000,000 | | 670,894 |
Series 8, 1.40%, 3/20/2055
| | JPY | 75,750,000 | | 501,482 |
Series 7, 1.70%, 3/20/2054
| | JPY | 103,900,000 | | 743,374 |
Series 6, 1.90%, 3/20/2053
| | JPY | 61,350,000 | | 459,877 |
Series 5, 2.00%, 3/20/2052
| | JPY | 60,700,000 | | 465,123 |
Series 2, 2.20%, 3/20/2049
| | JPY | 76,750,000 | | 613,222 |
Series 3, 2.20%, 3/20/2050
| | JPY | 31,250,000 | | 249,495 |
Series 4, 2.20%, 3/20/2051
| | JPY | 62,500,000 | | 498,763 |
Series 1, 2.40%, 3/20/2048
| | JPY | 43,950,000 | | 365,080 |
| Japan Government Ten Year Bonds: | | | | | |
Series 342, 0.10%, 3/20/2026
| | JPY | 273,450,000 | | 1,942,566 |
Series 343, 0.10%, 6/20/2026
| | JPY | 297,600,000 | | 2,114,231 |
Series 344, 0.10%, 9/20/2026
| | JPY | 314,550,000 | | 2,234,202 |
Series 345, 0.10%, 12/20/2026
| | JPY | 311,250,000 | | 2,210,453 |
Series 346, 0.10%, 3/20/2027
| | JPY | 311,050,000 | | 2,208,481 |
Series 347, 0.10%, 6/20/2027
| | JPY | 366,750,000 | | 2,602,083 |
See accompanying notes to financial statements.
56
SPDR BLOOMBERG INTERNATIONAL TREASURY BOND ETF
SCHEDULE OF INVESTMENTS (continued)
December 31, 2023
| Security Description | | | Principal
Amount | | Value |
Series 348, 0.10%, 9/20/2027
| | JPY | 314,000,000 | | $ 2,226,130 |
Series 349, 0.10%, 12/20/2027
| | JPY | 278,550,000 | | 1,973,105 |
Series 350, 0.10%, 3/20/2028
| | JPY | 406,750,000 | | 2,877,486 |
Series 351, 0.10%, 6/20/2028
| | JPY | 279,250,000 | | 1,973,449 |
Series 352, 0.10%, 9/20/2028
| | JPY | 343,000,000 | | 2,419,831 |
Series 353, 0.10%, 12/20/2028
| | JPY | 279,300,000 | | 1,968,908 |
Series 354, 0.10%, 3/20/2029
| | JPY | 259,050,000 | | 1,824,485 |
Series 355, 0.10%, 6/20/2029
| | JPY | 314,600,000 | | 2,214,362 |
Series 356, 0.10%, 9/20/2029
| | JPY | 255,950,000 | | 1,800,092 |
Series 357, 0.10%, 12/20/2029
| | JPY | 316,000,000 | | 2,219,890 |
Series 358, 0.10%, 3/20/2030
| | JPY | 351,500,000 | | 2,465,137 |
Series 359, 0.10%, 6/20/2030
| | JPY | 304,450,000 | | 2,131,344 |
Series 360, 0.10%, 9/20/2030
| | JPY | 302,650,000 | | 2,113,505 |
Series 361, 0.10%, 12/20/2030
| | JPY | 488,200,000 | | 3,401,090 |
Series 362, 0.10%, 3/20/2031
| | JPY | 439,350,000 | | 3,051,765 |
Series 363, 0.10%, 6/20/2031
| | JPY | 345,650,000 | | 2,393,831 |
Series 364, 0.10%, 9/20/2031
| | JPY | 337,500,000 | | 2,330,493 |
Series 365, 0.10%, 12/20/2031
| | JPY | 455,000,000 | | 3,132,910 |
Series 366, 0.20%, 3/20/2032
| | JPY | 303,000,000 | | 2,098,433 |
Series 367, 0.20%, 6/20/2032
| | JPY | 399,150,000 | | 2,757,414 |
Series 368, 0.20%, 9/20/2032
| | JPY | 476,150,000 | | 3,280,835 |
Series 341, 0.30%, 12/20/2025
| | JPY | 284,500,000 | | 2,028,995 |
Series 338, 0.40%, 3/20/2025
| | JPY | 338,650,000 | | 2,414,292 |
Series 339, 0.40%, 6/20/2025
| | JPY | 346,700,000 | | 2,473,527 |
Series 340, 0.40%, 9/20/2025
| | JPY | 297,150,000 | | 2,121,720 |
Series 371, 0.40%, 6/20/2033
| | JPY | 497,550,000 | | 3,463,298 |
Series 369, 0.50%, 12/20/2032
| | JPY | 423,000,000 | | 2,985,603 |
Series 370, 0.50%, 3/20/2033
| | JPY | 320,000,000 | | 2,252,983 |
| Security Description | | | Principal
Amount | | Value |
Series 372, 0.80%, 9/20/2033
| | JPY | 375,000,000 | | $ 2,704,293 |
| Japan Government Thirty Year Bonds: | | | | | |
Series 51, 0.30%, 6/20/2046
| | JPY | 93,000,000 | | 509,890 |
Series 64, 0.40%, 9/20/2049
| | JPY | 80,250,000 | | 426,387 |
Series 65, 0.40%, 12/20/2049
| | JPY | 72,850,000 | | 385,876 |
Series 66, 0.40%, 3/20/2050
| | JPY | 80,350,000 | | 423,556 |
Series 52, 0.50%, 9/20/2046
| | JPY | 85,500,000 | | 489,954 |
Series 62, 0.50%, 3/20/2049
| | JPY | 67,050,000 | | 368,970 |
Series 53, 0.60%, 12/20/2046
| | JPY | 87,650,000 | | 512,421 |
Series 67, 0.60%, 6/20/2050
| | JPY | 98,000,000 | | 544,457 |
Series 68, 0.60%, 9/20/2050
| | JPY | 90,000,000 | | 498,134 |
Series 59, 0.70%, 6/20/2048
| | JPY | 57,000,000 | | 334,407 |
Series 61, 0.70%, 12/20/2048
| | JPY | 70,000,000 | | 407,299 |
Series 69, 0.70%, 12/20/2050
| | JPY | 99,900,000 | | 567,123 |
Series 70, 0.70%, 3/20/2051
| | JPY | 65,000,000 | | 367,763 |
Series 71, 0.70%, 6/20/2051
| | JPY | 90,500,000 | | 510,210 |
Series 72, 0.70%, 9/20/2051
| | JPY | 85,450,000 | | 480,534 |
Series 73, 0.70%, 12/20/2051
| | JPY | 147,000,000 | | 824,923 |
Series 50, 0.80%, 3/20/2046
| | JPY | 108,650,000 | | 671,306 |
Series 54, 0.80%, 3/20/2047
| | JPY | 85,750,000 | | 523,240 |
Series 55, 0.80%, 6/20/2047
| | JPY | 96,500,000 | | 586,988 |
Series 56, 0.80%, 9/20/2047
| | JPY | 89,650,000 | | 543,693 |
Series 57, 0.80%, 12/20/2047
| | JPY | 89,250,000 | | 539,558 |
Series 58, 0.80%, 3/20/2048
| | JPY | 102,400,000 | | 617,305 |
Series 60, 0.90%, 9/20/2048
| | JPY | 71,650,000 | | 439,317 |
Series 74, 1.00%, 3/20/2052
| | JPY | 123,350,000 | | 748,902 |
Series 79, 1.20%, 6/20/2053
| | JPY | 190,000,000 | | 1,205,512 |
Series 75, 1.30%, 6/20/2052
| | JPY | 150,000,000 | | 980,756 |
See accompanying notes to financial statements.
57
SPDR BLOOMBERG INTERNATIONAL TREASURY BOND ETF
SCHEDULE OF INVESTMENTS (continued)
December 31, 2023
| Security Description | | | Principal
Amount | | Value |
Series 48, 1.40%, 9/20/2045
| | JPY | 84,350,000 | | $ 590,450 |
Series 49, 1.40%, 12/20/2045
| | JPY | 91,550,000 | | 639,824 |
Series 76, 1.40%, 9/20/2052
| | JPY | 145,600,000 | | 974,130 |
Series 78, 1.40%, 3/20/2053
| | JPY | 175,000,000 | | 1,168,185 |
Series 45, 1.50%, 12/20/2044
| | JPY | 90,050,000 | | 645,335 |
Series 46, 1.50%, 3/20/2045
| | JPY | 69,650,000 | | 498,295 |
Series 47, 1.60%, 6/20/2045
| | JPY | 102,850,000 | | 747,702 |
Series 77, 1.60%, 12/20/2052
| | JPY | 100,000,000 | | 700,596 |
Series 11, 1.70%, 6/20/2033
| | JPY | 73,200,000 | | 571,737 |
Series 41, 1.70%, 12/20/2043
| | JPY | 143,000,000 | | 1,066,384 |
Series 42, 1.70%, 3/20/2044
| | JPY | 56,750,000 | | 422,831 |
Series 43, 1.70%, 6/20/2044
| | JPY | 100,550,000 | | 747,856 |
Series 44, 1.70%, 9/20/2044
| | JPY | 71,000,000 | | 527,882 |
Series 38, 1.80%, 3/20/2043
| | JPY | 64,000,000 | | 487,059 |
Series 40, 1.80%, 9/20/2043
| | JPY | 70,000,000 | | 531,152 |
Series 80, 1.80%, 9/20/2053
| | JPY | 170,000,000 | | 1,245,397 |
Series 37, 1.90%, 9/20/2042
| | JPY | 97,300,000 | | 753,692 |
Series 39, 1.90%, 6/20/2043
| | JPY | 79,500,000 | | 613,607 |
Series 13, 2.00%, 12/20/2033
| | JPY | 87,900,000 | | 704,883 |
Series 33, 2.00%, 9/20/2040
| | JPY | 110,200,000 | | 872,556 |
Series 35, 2.00%, 9/20/2041
| | JPY | 132,450,000 | | 1,044,333 |
Series 36, 2.00%, 3/20/2042
| | JPY | 131,750,000 | | 1,037,954 |
Series 34, 2.20%, 3/20/2041
| | JPY | 101,400,000 | | 823,190 |
Series 21, 2.30%, 12/20/2035
| | JPY | 42,000,000 | | 347,651 |
Series 25, 2.30%, 12/20/2036
| | JPY | 46,400,000 | | 384,757 |
Series 30, 2.30%, 3/20/2039
| | JPY | 99,350,000 | | 822,072 |
Series 32, 2.30%, 3/20/2040
| | JPY | 104,650,000 | | 864,012 |
2.40%, 3/20/2034
| | JPY | 50,000,000 | | 415,112 |
2.40%, 12/20/2034
| | JPY | 50,000,000 | | 416,552 |
| Security Description | | | Principal
Amount | | Value |
Series 26, 2.40%, 3/20/2037
| | JPY | 69,300,000 | | $ 580,733 |
Series 29, 2.40%, 9/20/2038
| | JPY | 54,000,000 | | 452,278 |
2.50%, 6/20/2034
| | JPY | 60,000,000 | | 502,910 |
Series 16, 2.50%, 9/20/2034
| | JPY | 20,000,000 | | 167,898 |
Series 20, 2.50%, 9/20/2035
| | JPY | 33,000,000 | | 278,272 |
Series 22, 2.50%, 3/20/2036
| | JPY | 43,750,000 | | 369,582 |
Series 24, 2.50%, 9/20/2036
| | JPY | 32,000,000 | | 270,636 |
Series 27, 2.50%, 9/20/2037
| | JPY | 71,550,000 | | 606,196 |
| Japan Government Twenty Year Bonds: | | | | | |
Series 157, 0.20%, 6/20/2036
| | JPY | 124,650,000 | | 813,921 |
Series 169, 0.30%, 6/20/2039
| | JPY | 122,450,000 | | 767,627 |
Series 170, 0.30%, 9/20/2039
| | JPY | 47,750,000 | | 297,657 |
Series 171, 0.30%, 12/20/2039
| | JPY | 70,400,000 | | 436,966 |
Series 156, 0.40%, 3/20/2036
| | JPY | 113,900,000 | | 765,759 |
Series 168, 0.40%, 3/20/2039
| | JPY | 114,000,000 | | 729,089 |
Series 172, 0.40%, 3/20/2040
| | JPY | 95,150,000 | | 597,283 |
Series 173, 0.40%, 6/20/2040
| | JPY | 123,850,000 | | 773,496 |
Series 174, 0.40%, 9/20/2040
| | JPY | 146,200,000 | | 908,892 |
Series 177, 0.40%, 6/20/2041
| | JPY | 176,400,000 | | 1,080,547 |
Series 158, 0.50%, 9/20/2036
| | JPY | 134,050,000 | | 906,021 |
Series 164, 0.50%, 3/20/2038
| | JPY | 171,550,000 | | 1,133,267 |
Series 165, 0.50%, 6/20/2038
| | JPY | 149,000,000 | | 980,231 |
Series 167, 0.50%, 12/20/2038
| | JPY | 134,800,000 | | 879,527 |
Series 175, 0.50%, 12/20/2040
| | JPY | 259,600,000 | | 1,633,060 |
Series 176, 0.50%, 3/20/2041
| | JPY | 168,600,000 | | 1,055,598 |
Series 178, 0.50%, 9/20/2041
| | JPY | 139,000,000 | | 863,086 |
Series 179, 0.50%, 12/20/2041
| | JPY | 139,050,000 | | 859,283 |
Series 159, 0.60%, 12/20/2036
| | JPY | 90,050,000 | | 614,362 |
Series 161, 0.60%, 6/20/2037
| | JPY | 216,000,000 | | 1,462,910 |
See accompanying notes to financial statements.
58
SPDR BLOOMBERG INTERNATIONAL TREASURY BOND ETF
SCHEDULE OF INVESTMENTS (continued)
December 31, 2023
| Security Description | | | Principal
Amount | | Value |
Series 162, 0.60%, 9/20/2037
| | JPY | 107,850,000 | | $ 727,846 |
Series 163, 0.60%, 12/20/2037
| | JPY | 96,000,000 | | 645,450 |
Series 160, 0.70%, 3/20/2037
| | JPY | 119,650,000 | | 824,098 |
Series 166, 0.70%, 9/20/2038
| | JPY | 104,800,000 | | 707,151 |
Series 180, 0.80%, 3/20/2042
| | JPY | 205,000,000 | | 1,333,431 |
Series 181, 0.90%, 6/20/2042
| | JPY | 160,250,000 | | 1,057,277 |
Series 155, 1.00%, 12/20/2035
| | JPY | 159,900,000 | | 1,156,320 |
Series 182, 1.10%, 9/20/2042
| | JPY | 210,900,000 | | 1,436,777 |
Series 184, 1.10%, 3/20/2043
| | JPY | 160,350,000 | | 1,086,486 |
Series 185, 1.10%, 6/20/2043
| | JPY | 240,000,000 | | 1,621,796 |
Series 151, 1.20%, 12/20/2034
| | JPY | 177,000,000 | | 1,316,464 |
Series 152, 1.20%, 3/20/2035
| | JPY | 173,100,000 | | 1,286,230 |
Series 154, 1.20%, 9/20/2035
| | JPY | 104,950,000 | | 777,075 |
Series 153, 1.30%, 6/20/2035
| | JPY | 210,000,000 | | 1,574,047 |
Series 150, 1.40%, 9/20/2034
| | JPY | 172,500,000 | | 1,309,595 |
Series 183, 1.40%, 12/20/2042
| | JPY | 245,900,000 | | 1,757,789 |
1.50%, 3/20/2033
| | JPY | 86,200,000 | | 661,884 |
Series 148, 1.50%, 3/20/2034
| | JPY | 157,950,000 | | 1,212,242 |
Series 149, 1.50%, 6/20/2034
| | JPY | 180,000,000 | | 1,380,234 |
Series 186, 1.50%, 9/20/2043
| | JPY | 185,000,000 | | 1,335,207 |
Series 136, 1.60%, 3/20/2032
| | JPY | 112,600,000 | | 870,026 |
Series 139, 1.60%, 6/20/2032
| | JPY | 75,000,000 | | 579,822 |
Series 143, 1.60%, 3/20/2033
| | JPY | 29,850,000 | | 231,097 |
Series 147, 1.60%, 12/20/2033
| | JPY | 176,000,000 | | 1,363,320 |
Series 135, 1.70%, 3/20/2032
| | JPY | 50,000,000 | | 389,169 |
Series 137, 1.70%, 6/20/2032
| | JPY | 50,000,000 | | 389,428 |
Series 140, 1.70%, 9/20/2032
| | JPY | 84,000,000 | | 654,757 |
Series 141, 1.70%, 12/20/2032
| | JPY | 100,000,000 | | 780,189 |
Series 145, 1.70%, 6/20/2033
| | JPY | 193,050,000 | | 1,508,523 |
| Security Description | | | Principal
Amount | | Value |
Series 146, 1.70%, 9/20/2033
| | JPY | 177,650,000 | | $ 1,387,958 |
Series 122, 1.80%, 9/20/2030
| | JPY | 95,050,000 | | 739,877 |
Series 130, 1.80%, 9/20/2031
| | JPY | 152,100,000 | | 1,189,213 |
Series 133, 1.80%, 12/20/2031
| | JPY | 86,550,000 | | 677,470 |
Series 134, 1.80%, 3/20/2032
| | JPY | 75,000,000 | | 588,052 |
Series 142, 1.80%, 12/20/2032
| | JPY | 33,450,000 | | 263,071 |
1.90%, 3/20/2025
| | JPY | 50,000,000 | | 362,888 |
Series 108, 1.90%, 12/20/2028
| | JPY | 52,350,000 | | 402,012 |
Series 109, 1.90%, 3/20/2029
| | JPY | 54,300,000 | | 418,316 |
Series 121, 1.90%, 9/20/2030
| | JPY | 88,200,000 | | 690,666 |
Series 77, 2.00%, 3/20/2025
| | JPY | 34,000,000 | | 247,053 |
2.00%, 6/20/2025
| | JPY | 40,000,000 | | 292,007 |
Series 93, 2.00%, 3/20/2027
| | JPY | 30,000,000 | | 225,936 |
2.10%, 3/20/2025
| | JPY | 50,000,000 | | 363,743 |
2.10%, 6/20/2025
| | JPY | 30,000,000 | | 219,316 |
Series 82, 2.10%, 9/20/2025
| | JPY | 45,000,000 | | 330,599 |
Series 92, 2.10%, 12/20/2026
| | JPY | 83,800,000 | | 630,230 |
Series 94, 2.10%, 3/20/2027
| | JPY | 179,250,000 | | 1,354,051 |
Series 96, 2.10%, 6/20/2027
| | JPY | 47,800,000 | | 362,555 |
Series 99, 2.10%, 12/20/2027
| | JPY | 92,250,000 | | 705,054 |
Series 105, 2.10%, 9/20/2028
| | JPY | 82,550,000 | | 637,253 |
Series 107, 2.10%, 12/20/2028
| | JPY | 50,000,000 | | 387,449 |
Series 113, 2.10%, 9/20/2029
| | JPY | 125,250,000 | | 981,504 |
Series 117, 2.10%, 3/20/2030
| | JPY | 161,450,000 | | 1,273,781 |
Series 90, 2.20%, 9/20/2026
| | JPY | 82,550,000 | | 619,652 |
Series 97, 2.20%, 9/20/2027
| | JPY | 136,800,000 | | 1,045,271 |
Series 100, 2.20%, 3/20/2028
| | JPY | 83,000,000 | | 638,920 |
Series 106, 2.20%, 9/20/2028
| | JPY | 58,000,000 | | 449,654 |
Series 115, 2.20%, 12/20/2029
| | JPY | 75,000,000 | | 592,861 |
Series 125, 2.20%, 3/20/2031
| | JPY | 56,650,000 | | 453,300 |
See accompanying notes to financial statements.
59
SPDR BLOOMBERG INTERNATIONAL TREASURY BOND ETF
SCHEDULE OF INVESTMENTS (continued)
December 31, 2023
| Security Description | | | Principal
Amount | | Value |
Series 95, 2.30%, 6/20/2027
| | JPY | 70,000,000 | | $ 534,364 |
Series 102, 2.40%, 6/20/2028
| | JPY | 105,800,000 | | 824,336 |
| Japan Government Two Year Bonds: | | | | | |
Series 444, 0.01%, 1/1/2025
| | JPY | 69,000,000 | | 489,588 |
Series 445, 0.01%, 2/1/2025
| | JPY | 113,000,000 | | 801,829 |
Series 446, 0.01%, 3/1/2025
| | JPY | 118,750,000 | | 842,621 |
Series 447, 0.01%, 4/1/2025
| | JPY | 87,000,000 | | 617,269 |
Series 448, 0.01%, 5/1/2025
| | JPY | 110,500,000 | | 783,917 |
Series 449, 0.01%, 6/1/2025
| | JPY | 147,500,000 | | 1,046,415 |
Series 450, 0.01%, 7/1/2025
| | JPY | 128,950,000 | | 914,751 |
Series 451, 0.01%, 8/1/2025
| | JPY | 125,000,000 | | 886,784 |
Series 452, 0.01%, 9/1/2025
| | JPY | 103,500,000 | | 734,081 |
Series 453, 0.01%, 10/1/2025
| | JPY | 115,000,000 | | 815,449 |
0.01%, 12/1/2025
| | JPY | 50,000,000 | | 354,515 |
Series 454, 0.10%, 11/1/2025
| | JPY | 196,000,000 | | 1,392,687 |
| | | | | | 243,877,926 |
| LATVIA — 0.1% | | | |
| Latvia Government International Bonds: | | | | | |
0.38%, 10/7/2026
| | EUR | 200,000 | | 204,979 |
Series GMTN, 1.38%, 9/23/2025
| | EUR | 100,000 | | 107,180 |
1.38%, 5/16/2036
| | EUR | 350,000 | | 303,122 |
Series 7, 2.25%, 2/15/2047
| | EUR | 100,000 | | 85,915 |
Series GMTN, 3.50%, 1/17/2028
| | EUR | 380,000 | | 427,701 |
Series GMTN, 3.88%, 3/25/2027
| | EUR | 200,000 | | 226,732 |
| | | | | | 1,355,629 |
| LITHUANIA — 0.1% | | | |
| Lithuania Government International Bonds: | | | | | |
Series EMTN, 0.50%, 7/28/2050
| | EUR | 150,000 | | 82,077 |
Series EMTN, 0.75%, 5/6/2030
| | EUR | 150,000 | | 141,779 |
Series EMTN, 0.95%, 5/26/2027
| | EUR | 70,000 | | 71,664 |
Series EMTN, 1.25%, 10/22/2025
| | EUR | 150,000 | | 159,570 |
| Security Description | | | Principal
Amount | | Value |
Series EMTN, 2.10%, 5/26/2047
| | EUR | 255,000 | | $ 222,729 |
Series EMTN, 2.13%, 10/29/2026
| | EUR | 100,000 | | 107,451 |
Series EMTN, 2.13%, 10/22/2035
| | EUR | 272,000 | | 263,313 |
Series EMTN, 3.88%, 6/14/2033
| | EUR | 250,000 | | 288,477 |
Series EMTN, 4.13%, 4/25/2028
| | EUR | 150,000 | | 170,891 |
| | | | | | 1,507,951 |
| LUXEMBOURG — 0.2% | | | |
| Luxembourg Government Bonds: | | | | | |
Zero Coupon, 11/13/2026
| | EUR | 154,000 | | 159,038 |
0.63%, 2/1/2027
| | EUR | 488,000 | | 510,128 |
2.25%, 3/19/2028
| | EUR | 80,000 | | 88,057 |
| State of the Grand-Duchy of Luxembourg: | | | | | |
1.38%, 5/25/2029
| | EUR | 100,000 | | 105,204 |
3.00%, 3/2/2033
| | EUR | 600,000 | | 693,589 |
3.25%, 3/2/2043
| | EUR | 250,000 | | 292,662 |
| | | | | | 1,848,678 |
| MALAYSIA — 2.2% | | | |
| Malaysia Government Bonds: | | | | | |
Series 0220, 2.63%, 4/15/2031
| | MYR | 1,250,000 | | 251,271 |
Series 0223, 3.52%, 4/20/2028
| | MYR | 2,560,000 | | 555,434 |
Series 0122, 3.58%, 7/15/2032
| | MYR | 1,700,000 | | 362,982 |
Series 0513, 3.73%, 6/15/2028
| | MYR | 5,050,000 | | 1,102,264 |
Series 0519, 3.76%, 5/22/2040
| | MYR | 1,650,000 | | 343,466 |
Series 0419, 3.83%, 7/5/2034
| | MYR | 2,000,000 | | 432,233 |
Series 0413, 3.84%, 4/15/2033
| | MYR | 3,875,000 | | 843,128 |
Series 0219, 3.89%, 8/15/2029
| | MYR | 2,260,000 | | 495,645 |
Series 0316, 3.90%, 11/30/2026
| | MYR | 2,000,000 | | 439,927 |
Series 0417, 3.90%, 11/16/2027
| | MYR | 2,820,000 | | 619,734 |
Series 0119, 3.91%, 7/15/2026
| | MYR | 2,600,000 | | 571,627 |
Series 0115, 3.96%, 9/15/2025
| | MYR | 2,550,000 | | 559,386 |
Series 0120, 4.07%, 6/15/2050
| | MYR | 3,175,000 | | 677,867 |
Series 0411, 4.23%, 6/30/2031
| | MYR | 1,720,000 | | 384,094 |
See accompanying notes to financial statements.
60
SPDR BLOOMBERG INTERNATIONAL TREASURY BOND ETF
SCHEDULE OF INVESTMENTS (continued)
December 31, 2023
| Security Description | | | Principal
Amount | | Value |
Series 0415, 4.25%, 5/31/2035
| | MYR | 1,350,000 | | $ 301,101 |
Series 0311, 4.39%, 4/15/2026
| | MYR | 300,000 | | 66,535 |
Series 0123, 4.46%, 3/31/2053
| | MYR | 2,500,000 | | 561,861 |
Series 0322, 4.50%, 4/30/2029
| | MYR | 4,375,000 | | 989,991 |
Series 0222, 4.70%, 10/15/2042
| | MYR | 3,110,000 | | 727,882 |
Series 0216, 4.74%, 3/15/2046
| | MYR | 2,670,000 | | 622,737 |
Series 0317, 4.76%, 4/7/2037
| | MYR | 3,870,000 | | 907,588 |
Series 0713, 4.94%, 9/30/2043
| | MYR | 1,910,000 | | 453,709 |
| Malaysia Government Investment Issue: | | | | | |
Series 0120, 3.42%, 9/30/2027
| | MYR | 3,205,000 | | 692,147 |
Series 0121, 3.45%, 7/15/2036
| | MYR | 2,000,000 | | 411,539 |
Series 0220, 3.47%, 10/15/2030
| | MYR | 1,800,000 | | 383,555 |
Series 123, 3.60%, 7/31/2028
| | MYR | 2,710,000 | | 589,735 |
Series 0319, 3.73%, 3/31/2026
| | MYR | 4,625,000 | | 1,009,981 |
Series 0113, 3.87%, 8/8/2028
| | MYR | 1,250,000 | | 273,694 |
Series 0415, 3.99%, 10/15/2025
| | MYR | 1,250,000 | | 274,546 |
Series 0316, 4.07%, 9/30/2026
| | MYR | 3,900,000 | | 859,519 |
Series 0619, 4.12%, 11/30/2034
| | MYR | 2,275,000 | | 504,743 |
Series 0122, 4.19%, 10/7/2032
| | MYR | 3,850,000 | | 858,227 |
Series 0315, 4.25%, 9/30/2030
| | MYR | 1,000,000 | | 223,238 |
Series 0117, 4.26%, 7/26/2027
| | MYR | 1,220,000 | | 270,824 |
Series 0223, 4.29%, 8/14/2043
| | MYR | 1,600,000 | | 356,954 |
Series 0221, 4.42%, 9/30/2041
| | MYR | 1,500,000 | | 337,867 |
Series 0219, 4.47%, 9/15/2039
| | MYR | 2,950,000 | | 675,450 |
Series 0513, 4.58%, 8/30/2033
| | MYR | 2,978,000 | | 687,902 |
Series 0617, 4.72%, 6/15/2033
| | MYR | 1,600,000 | | 370,653 |
Series 0517, 4.76%, 8/4/2037
| | MYR | 2,100,000 | | 493,242 |
Series 0615, 4.79%, 10/31/2035
| | MYR | 2,520,000 | | 591,369 |
| Security Description | | | Principal
Amount | | Value |
Series 0417, 4.90%, 5/8/2047
| | MYR | 2,530,000 | | $ 599,348 |
Series 0913, 4.94%, 12/6/2028
| | MYR | 725,000 | | 166,120 |
Series 0222, 5.36%, 5/15/2052
| | MYR | 1,650,000 | | 418,691 |
| | | | | | 23,319,806 |
| MEXICO — 1.9% | | | |
| Mexico Bonos: | | | | | |
Series M, 5.00%, 3/6/2025
| | MXN | 14,050,000 | | 786,085 |
Series M, 5.50%, 3/4/2027
| | MXN | 37,780,000 | | 1,999,175 |
Series M, 5.75%, 3/5/2026
| | MXN | 38,822,000 | | 2,117,357 |
Series M, 7.00%, 9/3/2026
| | MXN | 12,560,000 | | 696,646 |
Series M 20, 7.50%, 6/3/2027
| | MXN | 41,077,000 | | 2,296,450 |
Series M, 7.50%, 5/26/2033
| | MXN | 23,372,000 | | 1,249,925 |
Series M, 7.75%, 5/29/2031
| | MXN | 44,729,000 | | 2,462,532 |
Series M, 7.75%, 11/23/2034
| | MXN | 6,327,000 | | 341,182 |
Series M, 7.75%, 11/13/2042
| | MXN | 33,975,000 | | 1,764,726 |
Series M, 8.00%, 11/7/2047
| | MXN | 24,858,000 | | 1,311,605 |
Series M, 8.00%, 7/31/2053
| | MXN | 21,280,000 | | 1,115,125 |
Series M, 8.50%, 3/1/2029
| | MXN | 6,000,000 | | 345,920 |
Series M 20, 8.50%, 5/31/2029
| | MXN | 32,070,000 | | 1,852,445 |
Series M 30, 8.50%, 11/18/2038
| | MXN | 26,713,000 | | 1,504,254 |
Series M 30, 10.00%, 11/20/2036
| | MXN | 12,030,000 | | 765,091 |
| | | | | | 20,608,518 |
| NETHERLANDS — 3.4% | | | |
| Netherlands Government Bonds: | | | | | |
Zero Coupon, 1/15/2026 (a)
| | EUR | 1,400,000 | | 1,472,844 |
Zero Coupon, 1/15/2027 (a)
| | EUR | 1,589,900 | | 1,644,232 |
Zero Coupon, 1/15/2029 (a)
| | EUR | 1,144,000 | | 1,135,586 |
Zero Coupon, 7/15/2030 (a)
| | EUR | 1,262,000 | | 1,212,619 |
Zero Coupon, 7/15/2031 (a)
| | EUR | 1,438,000 | | 1,348,292 |
Zero Coupon, 1/15/2038 (a)
| | EUR | 1,167,000 | | 910,734 |
See accompanying notes to financial statements.
61
SPDR BLOOMBERG INTERNATIONAL TREASURY BOND ETF
SCHEDULE OF INVESTMENTS (continued)
December 31, 2023
| Security Description | | | Principal
Amount | | Value |
Zero Coupon, 1/15/2052 (a)
| | EUR | 1,798,000 | | $ 1,018,980 |
0.25%, 7/15/2025 (a)
| | EUR | 1,839,000 | | 1,961,132 |
0.25%, 7/15/2029 (a)
| | EUR | 1,312,000 | | 1,308,593 |
0.50%, 7/15/2026 (a)
| | EUR | 1,665,000 | | 1,760,707 |
0.50%, 7/15/2032 (a)
| | EUR | 1,134,000 | | 1,081,725 |
0.50%, 1/15/2040 (a)
| | EUR | 1,672,000 | | 1,366,943 |
0.75%, 7/15/2027 (a)
| | EUR | 1,812,000 | | 1,907,786 |
0.75%, 7/15/2028 (a)
| | EUR | 2,230,000 | | 2,317,661 |
2.00%, 1/15/2054 (a)
| | EUR | 937,000 | | 932,411 |
2.50%, 1/15/2030 (a)
| | EUR | 824,000 | | 927,221 |
2.50%, 1/15/2033 (a)
| | EUR | 1,502,000 | | 1,688,784 |
2.50%, 7/15/2033 (a)
| | EUR | 1,258,000 | | 1,409,942 |
2.75%, 1/15/2047 (a)
| | EUR | 2,283,000 | | 2,637,859 |
3.75%, 1/15/2042 (a)
| | EUR | 2,153,000 | | 2,802,277 |
4.00%, 1/15/2037 (a)
| | EUR | 2,210,000 | | 2,848,013 |
5.50%, 1/15/2028 (a)
| | EUR | 1,470,000 | | 1,830,261 |
| | | | | | 35,524,602 |
| NEW ZEALAND — 0.8% | | | |
| New Zealand Government Bonds: | | | | | |
0.25%, 5/15/2028
| | NZD | 1,250,000 | | 668,187 |
0.50%, 5/15/2026
| | NZD | 690,000 | | 398,892 |
Series 0531, 1.50%, 5/15/2031
| | NZD | 1,242,000 | | 649,834 |
Series 0541, 1.75%, 5/15/2041
| | NZD | 545,000 | | 227,116 |
Series 0532, 2.00%, 5/15/2032
| | NZD | 754,000 | | 400,888 |
Series 0425, 2.75%, 4/15/2025
| | NZD | 1,615,000 | | 994,069 |
Series 0437, 2.75%, 4/15/2037
| | NZD | 801,000 | | 417,083 |
Series 0551, 2.75%, 5/15/2051
| | NZD | 730,000 | | 329,710 |
Series 0429, 3.00%, 4/20/2029
| | NZD | 1,508,000 | | 902,830 |
Series 0433, 3.50%, 4/14/2033
| | NZD | 2,051,000 | | 1,216,844 |
Series 534, 4.25%, 5/15/2034
| | NZD | 900,000 | | 563,772 |
Series 0427, 4.50%, 4/15/2027
| | NZD | 1,238,000 | | 789,209 |
Series 0530, 4.50%, 5/15/2030
| | NZD | 725,000 | | 466,295 |
| | | | | | 8,024,729 |
| NORWAY — 0.4% | | | |
| Norway Government Bonds: | | | | | |
Series 483, 1.25%, 9/17/2031 (a)
| | NOK | 3,498,000 | | 298,145 |
Series 482, 1.38%, 8/19/2030 (a)
| | NOK | 4,913,000 | | 428,934 |
Series 478, 1.50%, 2/19/2026 (a)
| | NOK | 5,163,000 | | 486,687 |
| Security Description | | | Principal
Amount | | Value |
Series 477, 1.75%, 3/13/2025 (a)
| | NOK | 6,770,000 | | $ 650,191 |
Series 479, 1.75%, 2/17/2027 (a)
| | NOK | 4,655,000 | | 436,728 |
Series 481, 1.75%, 9/6/2029 (a)
| | NOK | 4,245,000 | | 385,125 |
Series 480, 2.00%, 4/26/2028 (a)
| | NOK | 4,734,000 | | 442,928 |
Series 484, 2.13%, 5/18/2032 (a)
| | NOK | 4,440,000 | | 400,741 |
Series 486, 3.00%, 8/15/2033 (a)
| | NOK | 5,200,000 | | 500,575 |
Series 485, 3.50%, 10/6/2042 (a)
| | NOK | 2,525,000 | | 261,462 |
| | | | | | 4,291,516 |
| PERU — 0.3% | | | |
| Peru Government Bonds: | | | | | |
5.35%, 8/12/2040
| | PEN | 800,000 | | 184,766 |
5.40%, 8/12/2034
| | PEN | 1,495,000 | | 364,619 |
5.94%, 2/12/2029
| | PEN | 955,000 | | 257,908 |
6.15%, 8/12/2032
| | PEN | 1,340,000 | | 353,162 |
6.35%, 8/12/2028
| | PEN | 2,125,000 | | 587,413 |
6.90%, 8/12/2037
| | PEN | 3,450,000 | | 938,228 |
7.30%, 8/12/2033
| | PEN | 2,190,000 | | 619,626 |
8.20%, 8/12/2026
| | PEN | 1,650,000 | | 472,794 |
| | | | | | 3,778,516 |
| POLAND — 1.2% | | | |
| Republic of Poland Government Bonds: | | | | | |
Series 1025, Zero Coupon, 10/25/2025
| | PLN | 2,350,000 | | 547,668 |
Series 1026, 0.25%, 10/25/2026
| | PLN | 2,974,000 | | 664,638 |
Series 0425, 0.75%, 4/25/2025
| | PLN | 1,450,000 | | 348,908 |
Series 1030, 1.25%, 10/25/2030
| | PLN | 3,899,000 | | 784,177 |
Series 0432, 1.75%, 4/25/2032
| | PLN | 3,925,000 | | 775,717 |
Series 0726, 2.50%, 7/25/2026
| | PLN | 5,975,000 | | 1,430,210 |
Series 0727, 2.50%, 7/25/2027
| | PLN | 3,581,000 | | 841,525 |
Series 0428, 2.75%, 4/25/2028
| | PLN | 4,876,000 | | 1,136,586 |
Series 1029, 2.75%, 10/25/2029
| | PLN | 5,550,000 | | 1,260,159 |
Series 0725, 3.25%, 7/25/2025
| | PLN | 4,278,000 | | 1,058,762 |
Series 0527, 3.75%, 5/25/2027
| | PLN | 4,309,000 | | 1,055,546 |
Series 0447, 4.00%, 4/25/2047
| | PLN | 315,000 | | 65,287 |
See accompanying notes to financial statements.
62
SPDR BLOOMBERG INTERNATIONAL TREASURY BOND ETF
SCHEDULE OF INVESTMENTS (continued)
December 31, 2023
| Security Description | | | Principal
Amount | | Value |
Series 0429, 5.75%, 4/25/2029
| | PLN | 885,000 | | $ 232,404 |
Series 1033, 6.00%, 10/25/2033
| | PLN | 3,675,000 | | 990,864 |
Series 728, 7.50%, 7/25/2028
| | PLN | 4,942,000 | | 1,383,226 |
| | | | | | 12,575,677 |
| PORTUGAL — 1.5% | | | |
| Portugal Obrigacoes do Tesouro OT: | | | | | |
0.30%, 10/17/2031 (a)
| | EUR | 996,000 | | 925,898 |
0.48%, 10/18/2030 (a)
| | EUR | 1,100,000 | | 1,066,213 |
0.70%, 10/15/2027 (a)
| | EUR | 544,000 | | 567,167 |
0.90%, 10/12/2035 (a)
| | EUR | 813,000 | | 718,195 |
1.00%, 4/12/2052 (a)
| | EUR | 441,000 | | 281,018 |
1.15%, 4/11/2042 (a)
| | EUR | 262,000 | | 208,622 |
1.65%, 7/16/2032 (a)
| | EUR | 544,000 | | 555,259 |
1.95%, 6/15/2029 (a)
| | EUR | 1,053,400 | | 1,140,796 |
2.13%, 10/17/2028 (a)
| | EUR | 1,581,000 | | 1,734,020 |
Series 15Y, 2.25%, 4/18/2034 (a)
| | EUR | 858,000 | | 903,299 |
2.88%, 10/15/2025 (a)
| | EUR | 1,337,000 | | 1,485,300 |
2.88%, 7/21/2026 (a)
| | EUR | 1,101,000 | | 1,236,599 |
3.50%, 6/18/2038 (a)
| | EUR | 430,000 | | 496,107 |
3.88%, 2/15/2030 (a)
| | EUR | 1,031,000 | | 1,232,481 |
4.10%, 4/15/2037 (a)
| | EUR | 1,358,000 | | 1,670,410 |
4.10%, 2/15/2045 (a)
| | EUR | 695,000 | | 869,932 |
4.13%, 4/14/2027 (a)
| | EUR | 819,000 | | 956,747 |
| | | | | | 16,048,063 |
| ROMANIA — 0.6% | | | |
| Romania Government Bonds: | | | | | |
Series 7Y, 2.50%, 10/25/2027
| | RON | 1,525,000 | | 296,467 |
Series 5Y, 3.25%, 6/24/2026
| | RON | 1,880,000 | | 389,872 |
Series 4Y, 3.50%, 11/25/2025
| | RON | 1,225,000 | | 259,625 |
Series 5Y, 3.65%, 7/28/2025
| | RON | 1,475,000 | | 315,791 |
Series 15Y, 3.65%, 9/24/2031
| | RON | 1,600,000 | | 298,218 |
Series 8Y, 4.15%, 1/26/2028
| | RON | 2,300,000 | | 473,959 |
Series 10YR, 4.15%, 10/24/2030
| | RON | 1,225,000 | | 240,634 |
Series 5Y, 4.25%, 4/28/2036
| | RON | 475,000 | | 87,023 |
Series 10Y, 4.75%, 2/24/2025
| | RON | 1,380,000 | | 301,941 |
| Security Description | | | Principal
Amount | | Value |
Series 15Y, 4.75%, 10/11/2034
| | RON | 900,000 | | $ 175,882 |
Series 7Y, 4.85%, 4/22/2026
| | RON | 1,600,000 | | 345,342 |
Series 8Y, 4.85%, 7/25/2029
| | RON | 1,715,000 | | 355,705 |
Series 10Y, 5.00%, 2/12/2029
| | RON | 3,430,000 | | 719,523 |
Series 10Y, 6.70%, 2/25/2032
| | RON | 2,745,000 | | 624,144 |
Series 15Y, 7.90%, 2/24/2038
| | RON | 1,300,000 | | 332,150 |
Series 7Y, 8.00%, 4/29/2030
| | RON | 400,000 | | 96,495 |
Series 10Y, 8.25%, 9/29/2032
| | RON | 2,775,000 | | 692,642 |
| | | | | | 6,005,413 |
| SINGAPORE — 1.0% | | | |
| Singapore Government Bonds: | | | | | |
0.50%, 11/1/2025
| | SGD | 789,000 | | 568,838 |
1.25%, 11/1/2026
| | SGD | 702,000 | | 507,967 |
1.63%, 7/1/2031
| | SGD | 550,000 | | 385,888 |
1.88%, 3/1/2050
| | SGD | 409,000 | | 260,140 |
1.88%, 10/1/2051
| | SGD | 470,000 | | 299,156 |
2.13%, 6/1/2026
| | SGD | 875,000 | | 648,605 |
2.25%, 8/1/2036
| | SGD | 712,000 | | 511,694 |
2.38%, 6/1/2025
| | SGD | 1,473,000 | | 1,099,809 |
2.38%, 7/1/2039
| | SGD | 615,000 | | 442,869 |
2.63%, 5/1/2028
| | SGD | 715,000 | | 541,061 |
2.63%, 8/1/2032
| | SGD | 985,000 | | 741,121 |
2.75%, 4/1/2042
| | SGD | 1,086,000 | | 822,095 |
2.75%, 3/1/2046
| | SGD | 985,000 | | 743,361 |
2.88%, 9/1/2027
| | SGD | 138,000 | | 105,161 |
2.88%, 7/1/2029
| | SGD | 720,000 | | 549,647 |
2.88%, 9/1/2030
| | SGD | 1,225,000 | | 935,628 |
3.00%, 8/1/2072
| | SGD | 600,000 | | 486,241 |
3.38%, 9/1/2033
| | SGD | 1,055,000 | | 844,712 |
3.50%, 3/1/2027
| | SGD | 730,000 | | 563,535 |
| | | | | | 11,057,528 |
| SLOVAKIA — 0.5% | | | |
| Slovakia Government Bonds: | | | | | |
0.13%, 6/17/2027
| | EUR | 200,000 | | 201,453 |
Series 238, 0.25%, 5/14/2025
| | EUR | 200,000 | | 212,126 |
Series 242, 0.38%, 4/21/2036
| | EUR | 250,000 | | 190,527 |
Series 234, 1.00%, 6/12/2028
| | EUR | 319,000 | | 325,144 |
Series 237, 1.00%, 10/9/2030
| | EUR | 286,000 | | 277,734 |
Series 239, 1.00%, 5/14/2032
| | EUR | 150,000 | | 139,650 |
See accompanying notes to financial statements.
63
SPDR BLOOMBERG INTERNATIONAL TREASURY BOND ETF
SCHEDULE OF INVESTMENTS (continued)
December 31, 2023
| Security Description | | | Principal
Amount | | Value |
Series 228, 1.38%, 1/21/2027
| | EUR | 334,000 | | $ 353,169 |
Series 229, 1.63%, 1/21/2031
| | EUR | 589,000 | | 594,703 |
Series 232, 1.88%, 3/9/2037
| | EUR | 214,000 | | 194,565 |
Series 233, 2.00%, 10/17/2047
| | EUR | 380,000 | | 309,446 |
Series 235, 2.25%, 6/12/2068
| | EUR | 71,000 | | 55,772 |
Series 227, 3.63%, 1/16/2029
| | EUR | 584,000 | | 666,953 |
Series 247, 3.63%, 6/8/2033
| | EUR | 150,000 | | 171,289 |
3.75%, 2/23/2035
| | EUR | 100,000 | | 113,525 |
4.00%, 10/19/2032
| | EUR | 1,086,000 | | 1,276,480 |
Series 246, 4.00%, 2/23/2043
| | EUR | 225,000 | | 257,523 |
Series 216, 4.35%, 10/14/2025
| | EUR | 255,000 | | 286,893 |
| | | | | | 5,626,952 |
| SLOVENIA — 0.3% | | | |
| Slovenia Government Bonds: | | | | | |
Series RS89, Zero Coupon, 2/13/2026
| | EUR | 75,000 | | 77,812 |
Series RS82, 0.28%, 1/14/2030
| | EUR | 200,000 | | 190,453 |
Series RS80, 1.00%, 3/6/2028
| | EUR | 254,000 | | 262,327 |
1.18%, 2/13/2062
| | EUR | 185,000 | | 124,694 |
Series RS81, 1.19%, 3/14/2029
| | EUR | 220,000 | | 224,773 |
Series RS79, 1.25%, 3/22/2027
| | EUR | 362,000 | | 380,969 |
Series RS74, 1.50%, 3/25/2035
| | EUR | 225,000 | | 209,375 |
Series RS78, 1.75%, 11/3/2040
| | EUR | 234,000 | | 209,126 |
Series RS75, 2.13%, 7/28/2025
| | EUR | 201,000 | | 219,088 |
Series RS77, 2.25%, 3/3/2032
| | EUR | 564,000 | | 595,189 |
Series RS76, 3.13%, 8/7/2045
| | EUR | 498,000 | | 542,740 |
Series RS70, 5.13%, 3/30/2026
| | EUR | 375,000 | | 433,781 |
| | | | | | 3,470,327 |
| SOUTH KOREA — 4.7% | | | |
| Korea Treasury Bonds: | | | | | |
Series 2509, 1.13%, 9/10/2025
| | KRW | 430,800,000 | | 322,751 |
Series 2603, 1.25%, 3/10/2026
| | KRW | 1,053,000,000 | | 784,098 |
| Security Description | | | Principal
Amount | | Value |
Series 3006, 1.38%, 6/10/2030
| | KRW | 1,610,000,000 | | $ 1,115,594 |
Series 2503, 1.50%, 3/10/2025
| | KRW | 1,242,000,000 | | 943,875 |
Series 01500-2612, 1.50%, 12/10/2026
| | KRW | 939,150,000 | | 695,141 |
Series 3012, 1.50%, 12/10/2030
| | KRW | 1,150,000,000 | | 797,175 |
Series 3609, 1.50%, 9/10/2036
| | KRW | 685,690,000 | | 438,936 |
Series 4009, 1.50%, 9/10/2040
| | KRW | 550,000,000 | | 334,935 |
Series 5003, 1.50%, 3/10/2050
| | KRW | 3,450,000,000 | | 1,919,129 |
Series 7009, 1.63%, 9/10/2070
| | KRW | 1,000,000,000 | | 508,868 |
Series 2606, 1.88%, 6/10/2026
| | KRW | 866,000,000 | | 652,306 |
Series 5103, 1.88%, 3/10/2051
| | KRW | 3,780,000,000 | | 2,277,912 |
Series 3106, 2.00%, 6/10/2031
| | KRW | 814,000,000 | | 581,609 |
Series 02000-4603, 2.00%, 3/10/2046
| | KRW | 975,000,000 | | 626,065 |
Series 4903, 2.00%, 3/10/2049
| | KRW | 2,089,000,000 | | 1,318,105 |
Series 2706, 2.13%, 6/10/2027
| | KRW | 1,157,870,000 | | 868,231 |
Series 4703, 2.13%, 3/10/2047
| | KRW | 1,770,330,000 | | 1,158,258 |
Series 2506, 2.25%, 6/10/2025
| | KRW | 1,301,940,000 | | 995,882 |
Series 2512, 2.25%, 12/10/2025
| | KRW | 921,000,000 | | 701,791 |
Series 3709, 2.25%, 9/10/2037
| | KRW | 500,000,000 | | 348,248 |
Series 2703, 2.38%, 3/10/2027
| | KRW | 1,500,000,000 | | 1,136,382 |
Series 5203, 2.50%, 3/10/2052
| | KRW | 2,335,000,000 | | 1,618,575 |
Series 3509, 2.63%, 9/10/2035
| | KRW | 839,210,000 | | 615,203 |
Series 4803, 2.63%, 3/10/2048
| | KRW | 1,740,000,000 | | 1,247,405 |
Series 4412, 2.75%, 12/10/2044
| | KRW | 1,248,000,000 | | 916,539 |
Series 4212, 3.00%, 12/10/2042
| | KRW | 1,921,780,000 | | 1,463,019 |
Series 2506, 3.13%, 6/10/2025
| | KRW | 1,384,000,000 | | 1,071,714 |
Series 2606, 3.13%, 6/10/2026
| | KRW | 1,148,500,000 | | 891,013 |
Series 2709, 3.13%, 9/10/2027
| | KRW | 858,000,000 | | 664,713 |
Series 5209, 3.13%, 9/10/2052
| | KRW | 1,100,000,000 | | 865,100 |
See accompanying notes to financial statements.
64
SPDR BLOOMBERG INTERNATIONAL TREASURY BOND ETF
SCHEDULE OF INVESTMENTS (continued)
December 31, 2023
| Security Description | | | Principal
Amount | | Value |
Series 2803, 3.25%, 3/10/2028
| | KRW | 1,172,000,000 | | $ 911,924 |
Series 3306, 3.25%, 6/10/2033
| | KRW | 1,238,000,000 | | 962,008 |
Series 4209, 3.25%, 9/10/2042
| | KRW | 1,000,000,000 | | 788,244 |
Series 5303, 3.25%, 3/10/2053
| | KRW | 2,700,000,000 | | 2,179,857 |
Series 2503, 3.38%, 3/10/2025
| | KRW | 487,500,000 | | 378,648 |
Series 3206, 3.38%, 6/10/2032
| | KRW | 2,079,000,000 | | 1,632,962 |
Series 2809, 3.50%, 9/10/2028
| | KRW | 1,000,000,000 | | 787,167 |
Series 2509, 3.63%, 9/10/2025
| | KRW | 707,000,000 | | 551,970 |
Series 5309, 3.63%, 9/10/2053
| | KRW | 1,250,000,000 | | 1,072,965 |
Series 3312, 3.75%, 12/10/2033
| | KRW | 1,936,250,000 | | 1,570,688 |
Series 4309, 3.88%, 9/10/2043
| | KRW | 450,000,000 | | 387,704 |
Series 3112, 4.00%, 12/10/2031
| | KRW | 1,622,640,000 | | 1,326,553 |
Series 2512, 4.25%, 12/10/2025
| | KRW | 1,038,000,000 | | 820,922 |
Series 3212, 4.25%, 12/10/2032
| | KRW | 1,313,000,000 | | 1,100,324 |
Series 04750-3012, 4.75%, 12/10/2030
| | KRW | 3,095,050,000 | | 2,627,059 |
Series 05500-2803, 5.50%, 3/10/2028
| | KRW | 4,937,000,000 | | 4,176,661 |
| | | | | | 49,154,228 |
| SPAIN — 4.5% | | | |
| Spain Government Bonds: | | | | | |
Zero Coupon, 5/31/2025
| | EUR | 752,000 | | 797,100 |
Zero Coupon, 1/31/2027
| | EUR | 771,000 | | 787,856 |
Zero Coupon, 1/31/2028
| | EUR | 912,000 | | 909,802 |
0.10%, 4/30/2031 (a)
| | EUR | 779,000 | | 711,461 |
0.50%, 4/30/2030 (a)
| | EUR | 913,000 | | 882,629 |
0.50%, 10/31/2031 (a)
| | EUR | 834,000 | | 775,099 |
0.60%, 10/31/2029 (a)
| | EUR | 1,050,000 | | 1,034,352 |
0.70%, 4/30/2032 (a)
| | EUR | 716,000 | | 667,307 |
0.80%, 7/30/2027 (a)
| | EUR | 798,000 | | 829,502 |
0.80%, 7/30/2029
| | EUR | 1,104,000 | | 1,105,483 |
0.85%, 7/30/2037 (a)
| | EUR | 315,000 | | 256,084 |
1.00%, 7/30/2042 (a)
| | EUR | 399,000 | | 294,795 |
1.00%, 10/31/2050 (a)
| | EUR | 700,000 | | 436,348 |
| Security Description | | | Principal
Amount | | Value |
1.20%, 10/31/2040 (a)
| | EUR | 500,000 | | $ 395,322 |
1.25%, 10/31/2030 (a)
| | EUR | 1,078,000 | | 1,083,316 |
1.30%, 10/31/2026 (a)
| | EUR | 1,151,000 | | 1,228,159 |
1.40%, 4/30/2028 (a)
| | EUR | 1,171,000 | | 1,233,928 |
1.40%, 7/30/2028 (a)
| | EUR | 1,082,000 | | 1,137,036 |
1.45%, 10/31/2027 (a)
| | EUR | 1,035,000 | | 1,098,849 |
1.45%, 4/30/2029 (a)
| | EUR | 895,000 | | 933,791 |
1.45%, 10/31/2071 (a)
| | EUR | 169,000 | | 94,438 |
1.50%, 4/30/2027 (a)
| | EUR | 1,147,000 | | 1,225,128 |
1.60%, 4/30/2025 (a)
| | EUR | 515,000 | | 558,477 |
1.85%, 7/30/2035 (a)
| | EUR | 968,000 | | 938,300 |
1.90%, 10/31/2052 (a)
| | EUR | 650,000 | | 496,125 |
1.95%, 4/30/2026 (a)
| | EUR | 926,000 | | 1,006,936 |
1.95%, 7/30/2030 (a)
| | EUR | 1,376,000 | | 1,453,505 |
2.15%, 10/31/2025 (a)
| | EUR | 1,308,000 | | 1,430,383 |
2.35%, 7/30/2033 (a)
| | EUR | 587,000 | | 616,176 |
2.55%, 10/31/2032 (a)
| | EUR | 1,042,000 | | 1,122,822 |
Series 30Y, 2.70%, 10/31/2048 (a)
| | EUR | 865,000 | | 820,844 |
2.80%, 5/31/2026
| | EUR | 969,000 | | 1,074,593 |
2.90%, 10/31/2046 (a)
| | EUR | 906,000 | | 904,018 |
3.15%, 4/30/2033 (a)
| | EUR | 1,082,000 | | 1,215,017 |
3.45%, 7/30/2043 (a)
| | EUR | 444,000 | | 486,028 |
3.45%, 7/30/2066 (a)
| | EUR | 497,000 | | 511,898 |
3.50%, 5/31/2029
| | EUR | 200,000 | | 230,759 |
3.55%, 10/31/2033
| | EUR | 559,000 | | 646,596 |
3.90%, 7/30/2039 (a)
| | EUR | 500,000 | | 584,979 |
4.20%, 1/31/2037 (a)
| | EUR | 1,673,000 | | 2,042,761 |
4.65%, 7/30/2025 (a)
| | EUR | 1,320,000 | | 1,496,688 |
4.70%, 7/30/2041 (a)
| | EUR | 1,060,000 | | 1,368,465 |
4.90%, 7/30/2040 (a)
| | EUR | 1,237,000 | | 1,617,469 |
5.15%, 10/31/2028 (a)
| | EUR | 1,016,000 | | 1,253,648 |
5.15%, 10/31/2044 (a)
| | EUR | 992,000 | | 1,362,534 |
5.75%, 7/30/2032
| | EUR | 1,466,000 | | 1,976,194 |
5.90%, 7/30/2026 (a)
| | EUR | 1,604,000 | | 1,913,664 |
6.00%, 1/31/2029
| | EUR | 1,678,000 | | 2,154,072 |
| | | | | | 47,200,736 |
| SWEDEN — 0.5% | | | |
| Sweden Government Bonds: | | | | | |
Series 1062, 0.13%, 5/12/2031
| | SEK | 4,855,000 | | 420,354 |
Series 1063, 0.50%, 11/24/2045
| | SEK | 2,155,000 | | 150,837 |
See accompanying notes to financial statements.
65
SPDR BLOOMBERG INTERNATIONAL TREASURY BOND ETF
SCHEDULE OF INVESTMENTS (continued)
December 31, 2023
| Security Description | | | Principal
Amount | | Value |
Series 1060, 0.75%, 5/12/2028
| | SEK | 7,940,000 | | $ 745,131 |
Series 1061, 0.75%, 11/12/2029
| | SEK | 6,815,000 | | 629,893 |
Series 1059, 1.00%, 11/12/2026
| | SEK | 8,890,000 | | 851,082 |
Series 1064, 1.38%, 6/23/2071
| | SEK | 1,455,000 | | 98,132 |
Series 1065, 1.75%, 11/11/2033
| | SEK | 2,700,000 | | 261,096 |
Series 1056, 2.25%, 6/1/2032
| | SEK | 6,030,000 | | 609,961 |
Series 1058, 2.50%, 5/12/2025
| | SEK | 9,255,000 | | 913,388 |
Series 1053, 3.50%, 3/30/2039
| | SEK | 4,545,000 | | 526,922 |
Sweden Government International Bonds 0.13%, 9/9/2030
| | SEK | 2,000,000 | | 175,605 |
| | | | | | 5,382,401 |
| SWITZERLAND — 0.9% | | | |
| Swiss Confederation Government Bonds: | | | | | |
Zero Coupon, 6/22/2029
| | CHF | 427,000 | | 487,457 |
Zero Coupon, 6/26/2034
| | CHF | 200,000 | | 221,004 |
Zero Coupon, 7/24/2039
| | CHF | 220,000 | | 235,072 |
0.25%, 6/23/2035
| | CHF | 259,000 | | 292,515 |
0.50%, 5/27/2030
| | CHF | 577,000 | | 676,163 |
0.50%, 6/27/2032
| | CHF | 395,000 | | 461,081 |
0.50%, 6/28/2045
| | CHF | 445,000 | | 513,771 |
0.50%, 5/24/2055
| | CHF | 130,000 | | 152,359 |
0.50%, 5/30/2058
| | CHF | 184,000 | | 218,522 |
1.25%, 5/28/2026
| | CHF | 430,000 | | 514,412 |
1.25%, 6/27/2037
| | CHF | 166,000 | | 211,923 |
1.25%, 6/28/2043
| | CHF | 191,000 | | 252,094 |
1.50%, 7/24/2025
| | CHF | 225,000 | | 268,864 |
1.50%, 10/26/2038
| | CHF | 170,000 | | 225,544 |
1.50%, 4/30/2042
| | CHF | 385,000 | | 523,238 |
2.00%, 6/25/2064
| | CHF | 519,000 | | 966,469 |
2.25%, 6/22/2031
| | CHF | 625,000 | | 825,334 |
2.50%, 3/8/2036
| | CHF | 385,000 | | 554,113 |
3.25%, 6/27/2027
| | CHF | 270,000 | | 347,109 |
3.50%, 4/8/2033
| | CHF | 449,000 | | 667,084 |
4.00%, 4/8/2028
| | CHF | 620,000 | | 835,246 |
4.00%, 1/6/2049
| | CHF | 275,000 | | 581,809 |
| | | | | | 10,031,183 |
| THAILAND — 1.8% | | | |
| Thailand Government Bonds: | | | | | |
0.95%, 6/17/2025
| | THB | 10,450,000 | | 300,131 |
Series LB, 1.00%, 6/17/2027
| | THB | 12,850,000 | | 358,802 |
| Security Description | | | Principal
Amount | | Value |
1.59%, 12/17/2035
| | THB | 21,750,000 | | $ 562,943 |
1.60%, 6/17/2035
| | THB | 11,225,000 | | 292,103 |
1.88%, 6/17/2049
| | THB | 4,500,000 | | 96,385 |
2.00%, 12/17/2031
| | THB | 28,900,000 | | 807,662 |
2.00%, 6/17/2042
| | THB | 16,600,000 | | 413,678 |
2.13%, 12/17/2026
| | THB | 37,825,000 | | 1,100,276 |
2.25%, 3/17/2027
| | THB | 18,000,000 | | 524,823 |
2.35%, 6/17/2026
| | THB | 24,620,000 | | 721,867 |
2.40%, 3/17/2029
| | THB | 12,350,000 | | 360,428 |
2.65%, 6/17/2028
| | THB | 33,850,000 | | 1,000,063 |
2.88%, 12/17/2028
| | THB | 33,000,000 | | 985,093 |
2.88%, 6/17/2046
| | THB | 25,850,000 | | 692,066 |
3.14%, 6/17/2047
| | THB | 13,900,000 | | 395,737 |
3.30%, 6/17/2038
| | THB | 39,300,000 | | 1,199,049 |
3.35%, 6/17/2033
| | THB | 18,600,000 | | 573,681 |
3.39%, 6/17/2037
| | THB | 17,100,000 | | 529,317 |
3.40%, 6/17/2036
| | THB | 17,710,000 | | 546,984 |
3.45%, 6/17/2043
| | THB | 16,500,000 | | 505,598 |
3.58%, 12/17/2027
| | THB | 16,000,000 | | 488,685 |
3.60%, 6/17/2067
| | THB | 16,750,000 | | 463,068 |
3.78%, 6/25/2032
| | THB | 25,250,000 | | 798,760 |
3.85%, 12/12/2025
| | THB | 35,350,000 | | 1,064,921 |
4.00%, 6/17/2066
| | THB | 16,920,000 | | 516,179 |
4.00%, 6/17/2072
| | THB | 17,000,000 | | 516,882 |
4.26%, 12/12/2037
| | THB | 32,100,000 | | 1,054,988 |
4.68%, 6/29/2044
| | THB | 18,340,000 | | 654,217 |
4.85%, 6/17/2061
| | THB | 19,010,000 | | 669,866 |
4.88%, 6/22/2029
| | THB | 41,255,000 | | 1,352,739 |
| | | | | | 19,546,991 |
| UNITED KINGDOM — 4.9% | | | |
| U.K. Gilts: | | | | | |
0.13%, 1/30/2026
| | GBP | 563,000 | | 667,401 |
0.13%, 1/31/2028
| | GBP | 754,000 | | 843,423 |
0.25%, 7/31/2031
| | GBP | 768,000 | | 773,960 |
0.38%, 10/22/2026
| | GBP | 837,000 | | 977,895 |
0.50%, 1/31/2029
| | GBP | 645,000 | | 713,685 |
0.50%, 10/22/2061
| | GBP | 550,000 | | 237,266 |
0.63%, 6/7/2025
| | GBP | 600,000 | | 728,436 |
0.63%, 7/31/2035
| | GBP | 593,000 | | 537,485 |
0.63%, 10/22/2050
| | GBP | 258,000 | | 145,077 |
0.88%, 10/22/2029
| | GBP | 862,000 | | 959,210 |
0.88%, 7/31/2033
| | GBP | 250,000 | | 249,479 |
0.88%, 1/31/2046
| | GBP | 275,000 | | 187,309 |
1.00%, 1/31/2032
| | GBP | 834,000 | | 881,060 |
1.13%, 1/31/2039
| | GBP | 325,000 | | 281,669 |
1.13%, 10/22/2073
| | GBP | 329,000 | | 175,338 |
1.25%, 7/22/2027
| | GBP | 975,000 | | 1,153,901 |
1.25%, 10/22/2041
| | GBP | 605,000 | | 500,621 |
1.25%, 7/31/2051
| | GBP | 579,000 | | 392,822 |
1.50%, 7/22/2026
| | GBP | 920,000 | | 1,114,999 |
1.50%, 7/22/2047
| | GBP | 369,000 | | 285,298 |
1.50%, 7/31/2053
| | GBP | 225,000 | | 159,784 |
1.63%, 10/22/2028
| | GBP | 854,000 | | 1,007,855 |
1.63%, 10/22/2054
| | GBP | 538,000 | | 392,157 |
1.63%, 10/22/2071
| | GBP | 772,000 | | 509,787 |
See accompanying notes to financial statements.
66
SPDR BLOOMBERG INTERNATIONAL TREASURY BOND ETF
SCHEDULE OF INVESTMENTS (continued)
December 31, 2023
| Security Description | | | Principal
Amount | | Value |
1.75%, 9/7/2037
| | GBP | 786,000 | | $ 777,145 |
1.75%, 1/22/2049
| | GBP | 653,000 | | 526,105 |
1.75%, 7/22/2057
| | GBP | 644,000 | | 478,318 |
2.00%, 9/7/2025
| | GBP | 975,000 | | 1,205,244 |
2.50%, 7/22/2065
| | GBP | 575,000 | | 512,302 |
3.25%, 1/31/2033
| | GBP | 1,135,000 | | 1,415,189 |
3.25%, 1/22/2044
| | GBP | 809,000 | | 908,484 |
3.50%, 10/22/2025
| | GBP | 1,276,000 | | 1,613,018 |
3.50%, 1/22/2045
| | GBP | 896,000 | | 1,040,220 |
3.50%, 7/22/2068
| | GBP | 866,000 | | 992,172 |
3.75%, 1/29/2038
| | GBP | 546,000 | | 682,955 |
3.75%, 7/22/2052
| | GBP | 1,034,000 | | 1,237,591 |
3.75%, 10/22/2053
| | GBP | 547,000 | | 651,049 |
4.00%, 1/22/2060
| | GBP | 795,000 | | 1,002,910 |
4.00%, 10/22/2063
| | GBP | 400,000 | | 505,025 |
4.13%, 1/29/2027
| | GBP | 2,138,000 | | 2,766,951 |
4.25%, 12/7/2027
| | GBP | 1,452,000 | | 1,907,873 |
4.25%, 6/7/2032
| | GBP | 1,228,000 | | 1,657,330 |
4.25%, 3/7/2036
| | GBP | 715,000 | | 956,418 |
4.25%, 9/7/2039
| | GBP | 745,000 | | 979,072 |
4.25%, 12/7/2040
| | GBP | 842,000 | | 1,102,655 |
4.25%, 12/7/2046
| | GBP | 1,488,000 | | 1,927,442 |
4.25%, 12/7/2049
| | GBP | 765,000 | | 991,435 |
4.25%, 12/7/2055
| | GBP | 789,000 | | 1,031,066 |
4.50%, 6/7/2028
| | GBP | 1,070,000 | | 1,421,598 |
4.50%, 9/7/2034
| | GBP | 2,255,000 | | 3,089,124 |
4.50%, 12/7/2042
| | GBP | 931,000 | | 1,251,402 |
4.75%, 12/7/2030
| | GBP | 1,377,000 | | 1,900,693 |
4.75%, 12/7/2038
| | GBP | 821,000 | | 1,141,224 |
5.00%, 3/7/2025
| | GBP | 1,128,000 | | 1,450,226 |
6.00%, 12/7/2028
| | GBP | 445,000 | | 634,702 |
| | | | | | 51,632,855 |
TOTAL FOREIGN GOVERNMENT OBLIGATIONS
(Cost $1,155,361,060)
| | | | | 1,043,778,130 |
| | | Shares | |
| SHORT-TERM INVESTMENT — 3.0% | |
State Street Institutional U.S. Government Money Market Fund, Class G Shares 5.36% (c) (d)
(Cost $31,458,759)
| 31,458,759 | 31,458,759 |
TOTAL INVESTMENTS — 102.1%
(Cost $1,186,819,819)
| 1,075,236,889 |
LIABILITIES IN EXCESS OF OTHER
ASSETS — (2.1)%
| (22,610,277) |
NET ASSETS — 100.0%
| $ 1,052,626,612 |
| (a) | Securities purchased pursuant to Rule 144A of the Securities Act of 1933, as amended. These securities, which represent 18.7% of net assets as of December 31, 2023, are considered liquid and may be resold in transactions exempt from registration, normally to qualified institutional buyers. |
| (b) | Amount is less than 0.05% of net assets. |
| (c) | The Fund invested in certain money market funds managed by SSGA Funds Management, Inc. Amounts related to these transactions during the year ended December 31, 2023 are shown in the Affiliate Table below. |
| (d) | The rate shown is the annualized seven-day yield at December 31, 2023. |
| EMTN | Euro Medium Term Note |
| GMTN | Global Medium Term Note |
| AUD | Australian Dollar |
| CAD | Canadian Dollar |
| CHF | Swiss Franc |
| CLP | Chilean Peso |
| CNY | China Yuan Renminbi |
| COP | Colombian Peso |
| CZK | Czech Koruna |
| DKK | Danish Krone |
| EUR | Euro |
| GBP | British Pound |
| HKD | Hong Kong Dollar |
| HUF | Hungary Forint |
| IDR | Indonesia Rupiah |
| ILS | Israeli New Shekel |
| JPY | Japanese Yen |
| KRW | South Korean Won |
| MXN | Mexican Peso |
| MYR | Malaysian Ringgit |
| NOK | Norwegian Krone |
| NZD | New Zealand Dollar |
| PEN | Peru Nuevo Sol |
| PLN | Polish Zloty |
| RON | Romania New Leu |
| SEK | Swedish Krona |
| SGD | Singapore Dollar |
| THB | Thai Baht |
See accompanying notes to financial statements.
67
SPDR BLOOMBERG INTERNATIONAL TREASURY BOND ETF
SCHEDULE OF INVESTMENTS (continued)
December 31, 2023
The following table summarizes the value of the Fund's investments according to the fair value hierarchy as of December 31, 2023.
| Description | | Level 1 –
Quoted Prices | | Level 2 –
Other Significant
Observable Inputs | | Level 3 –
Significant
Unobservable Inputs | | Total |
| ASSETS: | | | | | | | | |
| INVESTMENTS: | | | | | | | | |
Foreign Government Obligations
| | $ — | | $1,043,778,130 | | $— | | $1,043,778,130 |
Short-Term Investment
| | 31,458,759 | | — | | — | | 31,458,759 |
TOTAL INVESTMENTS
| | $31,458,759 | | $1,043,778,130 | | $— | | $1,075,236,889 |
Affiliate Table
| | Number of
Shares Held
at
12/31/22 | | Value at
12/31/22 | | Cost of
Purchases | | Proceeds
from
Shares Sold | | Realized
Gain (Loss) | | Change in
Unrealized
Appreciation/
Depreciation | | Number of
Shares Held
at
12/31/23 | | Value at
12/31/23 | | Dividend
Income |
State Street Institutional U.S. Government Money Market Fund, Class G Shares
| 311,474 | | $311,474 | | $122,332,612 | | $91,185,327 | | $— | | $— | | 31,458,759 | | $31,458,759 | | $49,832 |
State Street Navigator Securities Lending Portfolio II
| — | | — | | 3,180,703 | | 3,180,703 | | — | | — | | — | | — | | 491 |
Total
| | | $311,474 | | $125,513,315 | | $94,366,030 | | $— | | $— | | | | $31,458,759 | | $50,323 |
See accompanying notes to financial statements.
68
SPDR BLOOMBERG SHORT TERM INTERNATIONAL TREASURY BOND ETF
SCHEDULE OF INVESTMENTS
December 31, 2023
| Security Description | | | Principal
Amount | | Value |
| FOREIGN GOVERNMENT OBLIGATIONS — 98.9% | | | |
| AUSTRALIA — 4.5% | | | |
| Australia Government Bonds: | | | | | |
Series 161, 0.25%, 11/21/2025
| | AUD | 2,450,000 | | $ 1,567,299 |
Series 164, 0.50%, 9/21/2026
| | AUD | 2,790,000 | | 1,751,615 |
Series 139, 3.25%, 4/21/2025
| | AUD | 3,075,000 | | 2,081,834 |
Series 142, 4.25%, 4/21/2026
| | AUD | 3,675,000 | | 2,540,456 |
| | | | | | 7,941,204 |
| AUSTRIA — 2.9% | | | |
| Republic of Austria Government Bonds: | | | | | |
Zero Coupon, 4/20/2025 (a)
| | EUR | 515,000 | | 548,831 |
0.75%, 10/20/2026 (a)
| | EUR | 700,000 | | 739,563 |
1.20%, 10/20/2025 (a)
| | EUR | 1,325,000 | | 1,430,354 |
2.00%, 7/15/2026 (a)
| | EUR | 125,000 | | 136,785 |
4.85%, 3/15/2026 (a)
| | EUR | 2,025,000 | | 2,347,680 |
| | | | | | 5,203,213 |
| BELGIUM — 3.0% | | | |
| Kingdom of Belgium Government Bonds: | | | | | |
Series 74, 0.80%, 6/22/2025 (a)
| | EUR | 1,725,000 | | 1,853,963 |
Series 77, 1.00%, 6/22/2026 (a)
| | EUR | 1,500,000 | | 1,603,647 |
Series 64, 4.50%, 3/28/2026 (a)
| | EUR | 1,670,000 | | 1,927,604 |
| | | | | | 5,385,214 |
| CANADA — 4.6% | | | |
| Canada Government Bonds: | | | | | |
0.25%, 3/1/2026
| | CAD | 2,300,000 | | 1,623,017 |
0.50%, 9/1/2025
| | CAD | 1,653,000 | | 1,185,262 |
1.00%, 9/1/2026
| | CAD | 650,000 | | 462,178 |
1.50%, 6/1/2026
| | CAD | 410,000 | | 296,275 |
2.25%, 6/1/2025
| | CAD | 550,000 | | 406,700 |
3.00%, 10/1/2025
| | CAD | 650,000 | | 485,244 |
3.00%, 4/1/2026
| | CAD | 1,000,000 | | 747,503 |
3.50%, 8/1/2025
| | CAD | 725,000 | | 545,101 |
3.75%, 2/1/2025
| | CAD | 655,000 | | 493,006 |
3.75%, 5/1/2025
| | CAD | 1,425,000 | | 1,074,293 |
4.50%, 11/1/2025
| | CAD | 1,100,000 | | 843,138 |
| | | | | | 8,161,717 |
| CHILE — 0.5% | | | |
| Bonos de la Tesoreria de la Republica en pesos: | | | | | |
2.50%, 3/1/2025
| | CLP | 320,000,000 | | 351,288 |
| Security Description | | | Principal
Amount | | Value |
4.50%, 3/1/2026
| | CLP | 475,000,000 | | $ 533,767 |
| | | | | | 885,055 |
| CHINA — 4.6% | | | |
| China Government Bonds: | | | | | |
1.99%, 4/9/2025
| | CNY | 1,000,000 | | 140,571 |
2.18%, 8/25/2025
| | CNY | 1,650,000 | | 232,564 |
2.18%, 8/15/2026
| | CNY | 820,000 | | 115,294 |
2.26%, 2/24/2025
| | CNY | 2,550,000 | | 359,865 |
2.28%, 11/25/2025
| | CNY | 2,200,000 | | 310,525 |
2.30%, 5/15/2026
| | CNY | 6,250,000 | | 881,360 |
2.33%, 12/15/2025
| | CNY | 1,150,000 | | 162,515 |
2.35%, 3/15/2025
| | CNY | 4,000,000 | | 564,924 |
2.46%, 2/15/2026
| | CNY | 10,050,000 | | 1,423,752 |
Series 1610, 2.90%, 5/5/2026
| | CNY | 1,600,000 | | 229,209 |
3.02%, 10/22/2025
| | CNY | 6,250,000 | | 894,795 |
3.03%, 3/11/2026
| | CNY | 800,000 | | 114,871 |
Series 1907, 3.25%, 6/6/2026
| | CNY | 7,800,000 | | 1,128,141 |
Series 1813, 3.61%, 6/7/2025
| | CNY | 10,850,000 | | 1,568,587 |
| | | | | | 8,126,973 |
| COLOMBIA — 0.6% | | | |
| Colombia TES: | | | | | |
Series B, 6.25%, 11/26/2025
| | COP | 1,542,000,000 | | 377,499 |
Series B, 7.50%, 8/26/2026
| | COP | 2,844,000,000 | | 701,677 |
| | | | | | 1,079,176 |
| CROATIA — 0.3% | | | |
Croatia Government International Bonds 3.00%, 3/11/2025
| | EUR | 475,000 | | 521,592 |
| CYPRUS — 0.2% | | | |
| Cyprus Government International Bonds: | | | | | |
Series EMTN, Zero Coupon, 2/9/2026
| | EUR | 125,000 | | 129,741 |
Series EMTN, 4.25%, 11/4/2025
| | EUR | 150,000 | | 169,300 |
| | | | | | 299,041 |
| CZECH REPUBLIC — 1.1% | | | |
| Czech Republic Government Bonds: | | | | | |
Series 95, 1.00%, 6/26/2026
| | CZK | 13,850,000 | | 574,106 |
Series 120, 1.25%, 2/14/2025
| | CZK | 6,780,000 | | 291,597 |
Series 89, 2.40%, 9/17/2025
| | CZK | 12,850,000 | | 555,176 |
See accompanying notes to financial statements.
69
SPDR BLOOMBERG SHORT TERM INTERNATIONAL TREASURY BOND ETF
SCHEDULE OF INVESTMENTS (continued)
December 31, 2023
| Security Description | | | Principal
Amount | | Value |
Series 148, 6.00%, 2/26/2026
| | CZK | 12,550,000 | | $ 584,442 |
| | | | | | 2,005,321 |
| DENMARK — 0.5% | | | |
Denmark Government Bonds 1.75%, 11/15/2025
| | DKK | 6,025,000 | | 881,242 |
| FINLAND — 1.3% | | | |
| Finland Government Bonds: | | | | | |
Zero Coupon, 9/15/2026 (a)
| | EUR | 300,000 | | 310,670 |
0.50%, 4/15/2026 (a)
| | EUR | 825,000 | | 871,841 |
0.88%, 9/15/2025 (a)
| | EUR | 350,000 | | 375,607 |
4.00%, 7/4/2025 (a)
| | EUR | 600,000 | | 675,197 |
| | | | | | 2,233,315 |
| FRANCE — 5.2% | | | |
| French Republic Government Bonds OAT: | | | | | |
Zero Coupon, 2/25/2025
| | EUR | 275,000 | | 293,906 |
Zero Coupon, 3/25/2025
| | EUR | 1,150,000 | | 1,226,678 |
Zero Coupon, 2/25/2026
| | EUR | 1,000,000 | | 1,050,295 |
0.25%, 11/25/2026
| | EUR | 800,000 | | 834,320 |
0.50%, 5/25/2025
| | EUR | 1,425,000 | | 1,526,836 |
0.50%, 5/25/2026
| | EUR | 1,000,000 | | 1,057,612 |
1.00%, 11/25/2025
| | EUR | 1,250,000 | | 1,343,814 |
2.50%, 9/24/2026
| | EUR | 950,000 | | 1,053,689 |
3.50%, 4/25/2026
| | EUR | 775,000 | | 877,449 |
| | | | | | 9,264,599 |
| GERMANY — 4.6% | | | |
| Bundesobligation: | | | | | |
Series 181, Zero Coupon, 4/11/2025
| | EUR | 535,000 | | 570,712 |
Series 182, Zero Coupon, 10/10/2025
| | EUR | 700,000 | | 741,614 |
Series 183, Zero Coupon, 4/10/2026
| | EUR | 650,000 | | 683,122 |
Series 184, Zero Coupon, 10/9/2026
| | EUR | 925,000 | | 963,967 |
| Bundesrepublik Deutschland Bundesanleihe: | | | | | |
Zero Coupon, 8/15/2026
| | EUR | 750,000 | | 783,992 |
0.50%, 2/15/2025
| | EUR | 865,000 | | 930,459 |
0.50%, 2/15/2026
| | EUR | 900,000 | | 957,625 |
1.00%, 8/15/2025
| | EUR | 760,000 | | 819,016 |
| Bundesschatzanweisungen: | | | | | |
2.50%, 3/13/2025
| | EUR | 600,000 | | 660,139 |
2.80%, 6/12/2025
| | EUR | 200,000 | | 221,265 |
| Security Description | | | Principal
Amount | | Value |
Series 2Y, 3.10%, 9/18/2025
| | EUR | 475,000 | | $ 529,644 |
3.10%, 12/12/2025
| | EUR | 300,000 | | 335,664 |
| | | | | | 8,197,219 |
| HONG KONG — 0.1% | | | |
| Hong Kong Government Bonds Programme: | | | | | |
1.68%, 1/21/2026
| | HKD | 1,500,000 | | 185,878 |
1.79%, 4/14/2025
| | HKD | 650,000 | | 81,281 |
| | | | | | 267,159 |
| HUNGARY — 0.9% | | | |
| Hungary Government Bonds: | | | | | |
Series 25/C, 1.00%, 11/26/2025
| | HUF | 127,000,000 | | 333,682 |
Series 26/E, 1.50%, 4/22/2026
| | HUF | 139,000,000 | | 362,037 |
Series 26/F, 1.50%, 8/26/2026
| | HUF | 51,000,000 | | 131,086 |
Series 26/D, 2.75%, 12/22/2026
| | HUF | 104,000,000 | | 273,101 |
Series 25/B, 5.50%, 6/24/2025
| | HUF | 95,000,000 | | 271,375 |
Series 26/H, 9.50%, 10/21/2026
| | HUF | 64,500,000 | | 201,660 |
| | | | | | 1,572,941 |
| INDONESIA — 2.2% | | | |
| Indonesia Treasury Bonds: | | | | | |
Series FR86, 5.50%, 4/15/2026
| | IDR | 15,550,000,000 | | 989,506 |
Series FR81, 6.50%, 6/15/2025
| | IDR | 10,550,000,000 | | 685,281 |
Series FR84, 7.25%, 2/15/2026
| | IDR | 3,080,000,000 | | 202,601 |
Series FR56, 8.38%, 9/15/2026
| | IDR | 11,190,000,000 | | 761,010 |
| Perusahaan Penerbit SBSN Indonesia: | | | | | |
Series PBS, 4.88%, 7/15/2026
| | IDR | 3,670,000,000 | | 229,655 |
Series PBS, 5.38%, 8/15/2025
| | IDR | 6,192,000,000 | | 394,460 |
Series PBS, 6.13%, 10/15/2025
| | IDR | 8,904,000,000 | | 573,629 |
| | | | | | 3,836,142 |
| IRELAND — 1.3% | | | |
| Ireland Government Bonds: | | | | | |
1.00%, 5/15/2026
| | EUR | 800,000 | | 857,000 |
5.40%, 3/13/2025
| | EUR | 1,240,000 | | 1,406,112 |
| | | | | | 2,263,112 |
See accompanying notes to financial statements.
70
SPDR BLOOMBERG SHORT TERM INTERNATIONAL TREASURY BOND ETF
SCHEDULE OF INVESTMENTS (continued)
December 31, 2023
| Security Description | | | Principal
Amount | | Value |
| ISRAEL — 1.2% | | | |
| Israel Government Bonds - Fixed: | | | | | |
Series 0425, 0.50%, 4/30/2025
| | ILS | 2,255,000 | | $ 599,036 |
Series 0226, 0.50%, 2/27/2026
| | ILS | 2,365,000 | | 613,029 |
Series 0825, 1.75%, 8/31/2025
| | ILS | 2,200,000 | | 590,397 |
Series 1026, 6.25%, 10/30/2026
| | ILS | 1,000,000 | | 296,667 |
| | | | | | 2,099,129 |
| ITALY — 4.8% | | | |
| Italy Buoni Poliennali Del Tesoro: | | | | | |
Series 5Y, Zero Coupon, 4/1/2026
| | EUR | 500,000 | | 518,578 |
Series 5Y, Zero Coupon, 8/1/2026
| | EUR | 500,000 | | 514,475 |
Series 6Y, 0.35%, 2/1/2025
| | EUR | 325,000 | | 348,097 |
Series 5Y, 0.50%, 2/1/2026
| | EUR | 375,000 | | 394,700 |
Series 3Y, 1.20%, 8/15/2025
| | EUR | 250,000 | | 268,458 |
Series 10Y, 1.25%, 12/1/2026
| | EUR | 825,000 | | 872,855 |
Series 7Y, 1.45%, 5/15/2025
| | EUR | 775,000 | | 837,954 |
Series 10Y, 1.60%, 6/1/2026
| | EUR | 100,000 | | 107,413 |
Series 5Y, 1.85%, 7/1/2025 (a)
| | EUR | 225,000 | | 244,277 |
Series 10Y, 2.00%, 12/1/2025
| | EUR | 775,000 | | 842,293 |
Series 7Y, 2.10%, 7/15/2026
| | EUR | 460,000 | | 499,755 |
Series 7Y, 2.50%, 11/15/2025
| | EUR | 400,000 | | 439,001 |
Series 3Y, 3.50%, 1/15/2026
| | EUR | 125,000 | | 139,838 |
Series 2Y, 3.60%, 9/29/2025
| | EUR | 75,000 | | 83,703 |
3.80%, 4/15/2026
| | EUR | 500,000 | | 564,311 |
Series 3Y, 3.85%, 9/15/2026
| | EUR | 450,000 | | 510,320 |
Series 16Y, 4.50%, 3/1/2026 (a)
| | EUR | 575,000 | | 656,904 |
Series 16Y, 5.00%, 3/1/2025 (a)
| | EUR | 700,000 | | 788,838 |
| | | | | | 8,631,770 |
| JAPAN — 23.2% | | | |
| Japan Government Five Year Bonds: | | | | | |
Series 147, 0.01%, 3/20/2026
| | JPY | 293,000,000 | | 2,077,083 |
| Security Description | | | Principal
Amount | | Value |
Series 148, 0.01%, 6/20/2026
| | JPY | 321,500,000 | | $ 2,278,687 |
Series 149, 0.01%, 9/20/2026
| | JPY | 336,500,000 | | 2,383,975 |
Series 150, 0.01%, 12/20/2026
| | JPY | 272,000,000 | | 1,926,110 |
Series 143, 0.10%, 3/20/2025
| | JPY | 525,000,000 | | 3,729,183 |
0.10%, 6/20/2025
| | JPY | 387,000,000 | | 2,749,023 |
Series 145, 0.10%, 9/20/2025
| | JPY | 365,000,000 | | 2,592,877 |
Series 146, 0.10%, 12/20/2025
| | JPY | 534,700,000 | | 3,798,502 |
| Japan Government Ten Year Bonds: | | | | | |
Series 342, 0.10%, 3/20/2026
| | JPY | 250,000,000 | | 1,775,979 |
Series 343, 0.10%, 6/20/2026
| | JPY | 375,000,000 | | 2,664,101 |
Series 344, 0.10%, 9/20/2026
| | JPY | 275,000,000 | | 1,953,284 |
Series 345, 0.10%, 12/20/2026
| | JPY | 300,000,000 | | 2,130,558 |
Series 341, 0.30%, 12/20/2025
| | JPY | 260,000,000 | | 1,854,266 |
Series 338, 0.40%, 3/20/2025
| | JPY | 250,000,000 | | 1,782,292 |
Series 339, 0.40%, 6/20/2025
| | JPY | 250,000,000 | | 1,783,622 |
Series 340, 0.40%, 9/20/2025
| | JPY | 190,000,000 | | 1,356,644 |
| Japan Government Two Year Bonds: | | | | | |
Series 444, 0.01%, 1/1/2025
| | JPY | 39,000,000 | | 276,724 |
Series 445, 0.01%, 2/1/2025
| | JPY | 125,000,000 | | 886,979 |
Series 447, 0.01%, 4/1/2025
| | JPY | 125,800,000 | | 892,557 |
Series 449, 0.01%, 6/1/2025
| | JPY | 125,000,000 | | 886,792 |
Series 450, 0.01%, 7/1/2025
| | JPY | 69,500,000 | | 493,022 |
Series 452, 0.01%, 9/1/2025
| | JPY | 100,000,000 | | 709,257 |
Series 453, 0.01%, 10/1/2025
| | JPY | 41,000,000 | | 290,725 |
| | | | | | 41,272,242 |
| MALAYSIA — 2.1% | | | |
| Malaysia Government Bonds: | | | | | |
Series 0118, 3.88%, 3/14/2025
| | MYR | 1,575,000 | | 344,954 |
Series 0119, 3.91%, 7/15/2026
| | MYR | 1,380,000 | | 303,402 |
Series 0115, 3.96%, 9/15/2025
| | MYR | 2,800,000 | | 614,227 |
See accompanying notes to financial statements.
71
SPDR BLOOMBERG SHORT TERM INTERNATIONAL TREASURY BOND ETF
SCHEDULE OF INVESTMENTS (continued)
December 31, 2023
| Security Description | | | Principal
Amount | | Value |
| Malaysia Government Investment Issue: | | | | | |
Series 0319, 3.73%, 3/31/2026
| | MYR | 4,840,000 | | $ 1,056,932 |
Series 0415, 3.99%, 10/15/2025
| | MYR | 3,260,000 | | 716,015 |
Series 0316, 4.07%, 9/30/2026
| | MYR | 3,425,000 | | 754,834 |
| | | | | | 3,790,364 |
| MEXICO — 2.1% | | | |
| Mexico Bonos: | | | | | |
Series M, 5.00%, 3/6/2025
| | MXN | 10,965,000 | | 613,482 |
Series M, 5.75%, 3/5/2026
| | MXN | 49,430,000 | | 2,695,919 |
Series M, 7.00%, 9/3/2026
| | MXN | 6,880,000 | | 381,602 |
| | | | | | 3,691,003 |
| NETHERLANDS — 3.0% | | | |
| Netherlands Government Bonds: | | | | | |
Zero Coupon, 1/15/2026 (a)
| | EUR | 1,075,000 | | 1,130,933 |
0.25%, 7/15/2025 (a)
| | EUR | 2,148,000 | | 2,290,653 |
0.50%, 7/15/2026 (a)
| | EUR | 1,775,000 | | 1,877,030 |
| | | | | | 5,298,616 |
| NEW ZEALAND — 0.7% | | | |
| New Zealand Government Bonds: | | | | | |
0.50%, 5/15/2026
| | NZD | 625,000 | | 361,315 |
Series 0425, 2.75%, 4/15/2025
| | NZD | 1,595,000 | | 981,759 |
| | | | | | 1,343,074 |
| NORWAY — 0.5% | | | |
| Norway Government Bonds: | | | | | |
Series 478, 1.50%, 2/19/2026 (a)
| | NOK | 4,075,000 | | 384,127 |
Series 477, 1.75%, 3/13/2025 (a)
| | NOK | 5,525,000 | | 530,621 |
| | | | | | 914,748 |
| PERU — 0.1% | | | |
Peru Government Bonds 8.20%, 8/12/2026
| | PEN | 665,000 | | 190,550 |
| POLAND — 2.1% | | | |
| Republic of Poland Government Bonds: | | | | | |
Series 1025, Zero Coupon, 10/25/2025
| | PLN | 1,225,000 | | 285,487 |
Series 1026, 0.25%, 10/25/2026
| | PLN | 4,500,000 | | 1,005,672 |
Series 0425, 0.75%, 4/25/2025
| | PLN | 1,995,000 | | 480,049 |
| Security Description | | | Principal
Amount | | Value |
Series 0726, 2.50%, 7/25/2026
| | PLN | 4,075,000 | | $ 975,415 |
Series 0725, 3.25%, 7/25/2025
| | PLN | 3,750,000 | | 928,087 |
| | | | | | 3,674,710 |
| PORTUGAL — 1.4% | | | |
| Portugal Obrigacoes do Tesouro OT: | | | | | |
2.88%, 10/15/2025 (a)
| | EUR | 1,175,000 | | 1,305,331 |
2.88%, 7/21/2026 (a)
| | EUR | 1,120,000 | | 1,257,939 |
| | | | | | 2,563,270 |
| ROMANIA — 0.7% | | | |
| Romania Government Bonds: | | | | | |
Series 5Y, 3.25%, 6/24/2026
| | RON | 850,000 | | 176,272 |
Series 4Y, 3.50%, 11/25/2025
| | RON | 975,000 | | 206,640 |
Series 5Y, 3.65%, 7/28/2025
| | RON | 1,050,000 | | 224,801 |
Series 10Y, 4.75%, 2/24/2025
| | RON | 1,135,000 | | 248,336 |
Series 7Y, 4.85%, 4/22/2026
| | RON | 1,350,000 | | 291,382 |
Series 4Y, 7.20%, 10/28/2026
| | RON | 700,000 | | 159,109 |
| | | | | | 1,306,540 |
| SINGAPORE — 1.3% | | | |
| Singapore Government Bonds: | | | | | |
0.50%, 11/1/2025
| | SGD | 790,000 | | 569,559 |
1.25%, 11/1/2026
| | SGD | 650,000 | | 470,340 |
2.13%, 6/1/2026
| | SGD | 665,000 | | 492,940 |
2.38%, 6/1/2025
| | SGD | 1,095,000 | | 817,577 |
| | | | | | 2,350,416 |
| SLOVAKIA — 0.5% | | | |
| Slovakia Government Bonds: | | | | | |
Series 238, 0.25%, 5/14/2025
| | EUR | 140,000 | | 148,489 |
Series 231, 0.63%, 5/22/2026
| | EUR | 300,000 | | 314,003 |
Series 216, 4.35%, 10/14/2025
| | EUR | 350,000 | | 393,775 |
| | | | | | 856,267 |
| SLOVENIA — 0.3% | | | |
| Slovenia Government Bonds: | | | | | |
Series RS89, Zero Coupon, 2/13/2026
| | EUR | 230,000 | | 238,622 |
Series RS75, 2.13%, 7/28/2025
| | EUR | 250,000 | | 272,497 |
| | | | | | 511,119 |
See accompanying notes to financial statements.
72
SPDR BLOOMBERG SHORT TERM INTERNATIONAL TREASURY BOND ETF
SCHEDULE OF INVESTMENTS (continued)
December 31, 2023
| Security Description | | | Principal
Amount | | Value |
| SOUTH KOREA — 4.6% | | | |
| Korea Treasury Bonds: | | | | | |
Series 2509, 1.13%, 9/10/2025
| | KRW | 770,000,000 | | $ 576,876 |
Series 2603, 1.25%, 3/10/2026
| | KRW | 1,679,000,000 | | 1,250,239 |
Series 2503, 1.50%, 3/10/2025
| | KRW | 900,000,000 | | 683,967 |
Series 01500-2612, 1.50%, 12/10/2026
| | KRW | 465,000,000 | | 344,184 |
Series 2609, 1.75%, 9/10/2026
| | KRW | 798,000,000 | | 597,130 |
Series 2506, 2.25%, 6/10/2025
| | KRW | 1,790,000,000 | | 1,369,211 |
Series 2512, 2.25%, 12/10/2025
| | KRW | 1,500,000,000 | | 1,142,983 |
Series 2506, 3.13%, 6/10/2025
| | KRW | 1,343,000,000 | | 1,039,966 |
Series 2606, 3.13%, 6/10/2026
| | KRW | 730,000,000 | | 566,338 |
Series 2503, 3.38%, 3/10/2025
| | KRW | 825,000,000 | | 640,789 |
| | | | | | 8,211,683 |
| SPAIN — 4.6% | | | |
| Spain Government Bonds: | | | | | |
Zero Coupon, 1/31/2025
| | EUR | 214,000 | | 228,776 |
Zero Coupon, 5/31/2025
| | EUR | 625,000 | | 662,483 |
Zero Coupon, 1/31/2026
| | EUR | 500,000 | | 522,486 |
1.30%, 10/31/2026 (a)
| | EUR | 1,050,000 | | 1,120,388 |
1.60%, 4/30/2025 (a)
| | EUR | 950,000 | | 1,030,201 |
1.95%, 4/30/2026 (a)
| | EUR | 800,000 | | 869,923 |
2.15%, 10/31/2025 (a)
| | EUR | 1,175,000 | | 1,284,939 |
2.80%, 5/31/2026
| | EUR | 750,000 | | 831,729 |
4.65%, 7/30/2025 (a)
| | EUR | 775,000 | | 878,738 |
5.90%, 7/30/2026 (a)
| | EUR | 600,000 | | 715,834 |
| | | | | | 8,145,497 |
| SWEDEN — 0.8% | | | |
| Sweden Government Bonds: | | | | | |
Series 1059, 1.00%, 11/12/2026
| | SEK | 7,850,000 | | 751,518 |
Series 1058, 2.50%, 5/12/2025
| | SEK | 7,110,000 | | 701,695 |
| | | | | | 1,453,213 |
| SWITZERLAND — 0.4% | | | |
| Swiss Confederation Government Bonds: | | | | | |
1.25%, 5/28/2026
| | CHF | 335,000 | | 400,763 |
1.50%, 7/24/2025
| | CHF | 320,000 | | 382,384 |
| | | | | | 783,147 |
| Security Description | | | Principal
Amount | | Value |
| THAILAND — 1.5% | | | |
| Thailand Government Bonds: | | | | | |
0.95%, 6/17/2025
| | THB | 7,525,000 | | $ 216,123 |
2.13%, 12/17/2026
| | THB | 22,000,000 | | 639,949 |
2.35%, 6/17/2026
| | THB | 14,475,000 | | 424,412 |
3.85%, 12/12/2025
| | THB | 43,600,000 | | 1,313,453 |
| | | | | | 2,593,937 |
| UNITED KINGDOM — 4.6% | | | |
| U.K. Gilts: | | | | | |
0.13%, 1/30/2026
| | GBP | 1,575,000 | | 1,867,062 |
0.25%, 1/31/2025
| | GBP | 185,000 | | 225,669 |
0.38%, 10/22/2026
| | GBP | 825,000 | | 963,875 |
0.63%, 6/7/2025
| | GBP | 1,295,000 | | 1,572,208 |
1.50%, 7/22/2026
| | GBP | 500,000 | | 605,978 |
2.00%, 9/7/2025
| | GBP | 1,050,000 | | 1,297,955 |
3.50%, 10/22/2025
| | GBP | 450,000 | | 568,854 |
5.00%, 3/7/2025
| | GBP | 800,000 | | 1,028,529 |
| | | | | | 8,130,130 |
TOTAL FOREIGN GOVERNMENT OBLIGATIONS
(Cost $173,262,143)
| | | | | 175,935,660 |
| | | Shares | |
| SHORT-TERM INVESTMENT — 0.0% (b) | |
State Street Institutional U.S. Government Money Market Fund, Class G Shares 5.36% (c) (d)
(Cost $27,095)
| 27,095 | 27,095 |
TOTAL INVESTMENTS — 98.9%
(Cost $173,289,238)
| 175,962,755 |
OTHER ASSETS IN EXCESS OF
LIABILITIES — 1.1%
| 2,001,447 |
NET ASSETS — 100.0%
| $ 177,964,202 |
| (a) | Securities purchased pursuant to Rule 144A of the Securities Act of 1933, as amended. These securities, which represent 16.4% of net assets as of December 31, 2023, are considered liquid and may be resold in transactions exempt from registration, normally to qualified institutional buyers. |
| (b) | Amount is less than 0.05% of net assets. |
| (c) | The Fund invested in certain money market funds managed by SSGA Funds Management, Inc. Amounts related to these transactions during the year ended December 31, 2023 are shown in the Affiliate Table below. |
| (d) | The rate shown is the annualized seven-day yield at December 31, 2023. |
| EMTN | Euro Medium Term Note |
| AUD | Australian Dollar |
| CAD | Canadian Dollar |
| CHF | Swiss Franc |
| CLP | Chilean Peso |
See accompanying notes to financial statements.
73
SPDR BLOOMBERG SHORT TERM INTERNATIONAL TREASURY BOND ETF
SCHEDULE OF INVESTMENTS (continued)
December 31, 2023
| CNY | China Yuan Renminbi |
| COP | Colombian Peso |
| CZK | Czech Koruna |
| DKK | Danish Krone |
| EUR | Euro |
| GBP | British Pound |
| HKD | Hong Kong Dollar |
| HUF | Hungary Forint |
| IDR | Indonesia Rupiah |
| ILS | Israeli New Shekel |
| JPY | Japanese Yen |
| KRW | South Korean Won |
| MXN | Mexican Peso |
| MYR | Malaysian Ringgit |
| NOK | Norwegian Krone |
| NZD | New Zealand Dollar |
| PEN | Peru Nuevo Sol |
| PLN | Polish Zloty |
| RON | Romania New Leu |
| SEK | Swedish Krona |
| SGD | Singapore Dollar |
| THB | Thai Baht |
The following table summarizes the value of the Fund's investments according to the fair value hierarchy as of December 31, 2023.
| Description | | Level 1 –
Quoted Prices | | Level 2 –
Other Significant
Observable Inputs | | Level 3 –
Significant
Unobservable Inputs | | Total |
| ASSETS: | | | | | | | | |
| INVESTMENTS: | | | | | | | | |
Foreign Government Obligations
| | $ — | | $175,935,660 | | $— | | $175,935,660 |
Short-Term Investment
| | 27,095 | | — | | — | | 27,095 |
TOTAL INVESTMENTS
| | $27,095 | | $175,935,660 | | $— | | $175,962,755 |
Affiliate Table
| | Number of
Shares Held
at
12/31/22 | | Value at
12/31/22 | | Cost of
Purchases | | Proceeds
from
Shares Sold | | Realized
Gain (Loss) | | Change in
Unrealized
Appreciation/
Depreciation | | Number of
Shares Held
at
12/31/23 | | Value at
12/31/23 | | Dividend
Income |
State Street Institutional U.S. Government Money Market Fund, Class G Shares
| — | | $— | | $17,355,265 | | $17,328,170 | | $— | | $— | | 27,095 | | $27,095 | | $8,704 |
State Street Navigator Securities Lending Portfolio II
| — | | — | | 2,037,488 | | 2,037,488 | | — | | — | | — | | — | | 184 |
Total
| | | $— | | $19,392,753 | | $19,365,658 | | $— | | $— | | | | $27,095 | | $8,888 |
See accompanying notes to financial statements.
74
SPDR FTSE INTERNATIONAL GOVERNMENT INFLATION-PROTECTED BOND ETF
SCHEDULE OF INVESTMENTS
December 31, 2023
| Security Description | | | Principal
Amount | | Value |
| FOREIGN GOVERNMENT OBLIGATIONS — 99.3% | | | |
| AUSTRALIA — 4.7% | | | |
| Australia Government Bonds: | | | | | |
Series CAIN416, 0.25%, 11/21/2032
| | AUD | 2,777,595 | | $ 1,718,823 |
Series 27CI, 0.75%, 11/21/2027
| | AUD | 4,737,365 | | 3,209,590 |
Series 50CI, 1.00%, 2/21/2050
| | AUD | 2,936,080 | | 1,743,303 |
Series 40CI, 1.25%, 8/21/2040
| | AUD | 3,533,718 | | 2,311,240 |
Series CAIN410, 2.00%, 8/21/2035
| | AUD | 3,419,172 | | 2,477,246 |
Series CAIN408, 2.50%, 9/20/2030
| | AUD | 5,877,902 | | 4,341,180 |
Series 25CI, 3.00%, 9/20/2025
| | AUD | 7,120,848 | | 5,042,874 |
| | | | | | 20,844,256 |
| BRAZIL — 8.7% | | | |
| Brazil Notas do Tesouro Nacional: | | | | | |
6.00%, 5/15/2025
| | BRL | 24,670,660 | | 5,107,363 |
6.00%, 8/15/2026
| | BRL | 20,593,729 | | 4,314,769 |
6.00%, 5/15/2027
| | BRL | 13,673,400 | | 2,876,577 |
6.00%, 8/15/2028
| | BRL | 10,767,280 | | 2,284,038 |
6.00%, 8/15/2030
| | BRL | 17,102,204 | | 3,670,863 |
6.00%, 8/15/2032
| | BRL | 5,854,055 | | 1,260,654 |
6.00%, 5/15/2035
| | BRL | 18,189,383 | | 3,953,576 |
6.00%, 8/15/2040
| | BRL | 12,335,330 | | 2,705,972 |
6.00%, 5/15/2045
| | BRL | 13,547,956 | | 2,973,953 |
6.00%, 8/15/2050
| | BRL | 24,252,514 | | 5,353,839 |
6.00%, 5/15/2055
| | BRL | 13,966,103 | | 3,098,717 |
6.00%, 8/15/2060
| | BRL | 4,808,688 | | 1,069,402 |
| | | | | | 38,669,723 |
| CANADA — 4.6% | | | |
| Canada Government Real Return Bonds: | | | | | |
0.25%, 12/1/2054
| | CAD | 709,694 | | 393,938 |
0.50%, 12/1/2050
| | CAD | 3,459,522 | | 2,084,371 |
1.25%, 12/1/2047
| | CAD | 4,052,065 | | 2,895,909 |
1.50%, 12/1/2044
| | CAD | 4,390,208 | | 3,279,771 |
2.00%, 12/1/2041
| | CAD | 3,564,978 | | 2,858,876 |
3.00%, 12/1/2036
| | CAD | 3,179,894 | | 2,836,245 |
4.00%, 12/1/2031
| | CAD | 3,644,615 | | 3,313,266 |
4.25%, 12/1/2026
| | CAD | 3,521,329 | | 2,894,535 |
| | | | | | 20,556,911 |
| CHILE — 4.5% | | | |
| Bonos de la Tesoreria de la Republica: | | | | | |
Zero Coupon, 3/1/2025
| | CLP | 956,523,360 | | 1,060,341 |
| Security Description | | | Principal
Amount | | Value |
Zero Coupon, 10/1/2028
| | CLP | 1,342,821,415 | | $ 1,366,932 |
Zero Coupon, 10/1/2033
| | CLP | 1,545,153,120 | | 1,396,459 |
1.50%, 3/1/2026
| | CLP | 3,200,674,320 | | 3,567,050 |
1.90%, 9/1/2030
| | CLP | 2,317,729,680 | | 2,590,278 |
2.00%, 3/1/2035
| | CLP | 2,759,202,000 | | 3,036,310 |
2.10%, 7/15/2050
| | CLP | 2,023,414,800 | | 2,203,052 |
Series 30YR, 3.00%, 1/1/2044
| | CLP | 3,697,330,680 | | 4,642,775 |
| | | | | | 19,863,197 |
| COLOMBIA — 4.7% | | | |
| Colombia TES: | | | | | |
2.25%, 4/18/2029
| | COP | 10,448,700,240 | | 2,520,299 |
3.00%, 3/25/2033
| | COP | 7,335,560,100 | | 1,748,663 |
3.30%, 3/17/2027
| | COP | 6,262,063,500 | | 1,608,768 |
3.50%, 5/7/2025
| | COP | 9,579,167,994 | | 2,478,999 |
3.75%, 2/25/2037
| | COP | 17,354,861,700 | | 4,294,118 |
3.75%, 6/16/2049
| | COP | 12,625,393,513 | | 3,128,334 |
4.75%, 4/4/2035
| | COP | 18,525,330,826 | | 5,076,859 |
| | | | | | 20,856,040 |
| FRANCE — 7.8% | | | |
| French Republic Government Bonds OAT: | | | | | |
Series OATI, 0.10%, 3/1/2025
| | EUR | 1,332,183 | | 1,450,111 |
0.10%, 3/1/2026 (a)
| | EUR | 1,820,044 | | 1,989,000 |
Series OATI, 0.10%, 3/1/2028
| | EUR | 2,823,237 | | 3,074,403 |
0.10%, 3/1/2029
| | EUR | 1,755,743 | | 1,923,190 |
0.10%, 7/25/2031 (a)
| | EUR | 1,847,705 | | 2,008,207 |
Series OATI, 0.10%, 3/1/2032 (a)
| | EUR | 733,954 | | 791,872 |
Series OATI, 0.10%, 3/1/2036 (a)
| | EUR | 1,244,142 | | 1,297,653 |
0.10%, 7/25/2036 (a)
| | EUR | 1,685,752 | | 1,757,327 |
0.10%, 7/25/2038 (a)
| | EUR | 929,160 | | 959,270 |
0.10%, 7/25/2047 (a)
| | EUR | 1,910,949 | | 1,856,141 |
0.10%, 7/25/2053 (a)
| | EUR | 959,358 | | 917,747 |
Series OATI, 0.55%, 3/1/2039
| | EUR | 2,073 | | 2,254 |
0.70%, 7/25/2030 (a)
| | EUR | 3,355,371 | �� | 3,815,853 |
1.80%, 7/25/2040 (a)
| | EUR | 2,483,775 | | 3,251,013 |
1.85%, 7/25/2027
| | EUR | 3,633,871 | | 4,241,759 |
3.15%, 7/25/2032
| | EUR | 1,830,967 | | 2,491,816 |
Series OATI, 3.40%, 7/25/2029
| | EUR | 2,129,781 | | 2,744,852 |
| | | | | | 34,572,468 |
| GERMANY — 4.5% | | | |
| Deutsche Bundesrepublik Bonds Inflation-Linked: | | | | | |
Series I/L, 0.10%, 4/15/2026
| | EUR | 5,179,307 | | 5,615,592 |
See accompanying notes to financial statements.
75
SPDR FTSE INTERNATIONAL GOVERNMENT INFLATION-PROTECTED BOND ETF
SCHEDULE OF INVESTMENTS (continued)
December 31, 2023
| Security Description | | | Principal
Amount | | Value |
Series I/L, 0.10%, 4/15/2033
| | EUR | 2,921,736 | | $ 3,220,459 |
Series I/L, 0.10%, 4/15/2046
| | EUR | 4,115,899 | | 4,491,751 |
Series I/L, 0.50%, 4/15/2030
| | EUR | 6,138,532 | | 6,917,770 |
| | | | | | 20,245,572 |
| ISRAEL — 4.6% | | | |
| Israel Government Bonds CPI-Linked: | | | | | |
Series 0726, 0.10%, 7/31/2026
| | ILS | 7,276,894 | | 1,965,240 |
Series 1131, 0.10%, 11/30/2031
| | ILS | 10,315,903 | | 2,574,748 |
Series 0529, 0.50%, 5/31/2029
| | ILS | 7,583,583 | | 2,019,240 |
Series 1151, 0.50%, 11/30/2051
| | ILS | 6,127,659 | | 1,221,111 |
Series 1025, 0.75%, 10/31/2025
| | ILS | 10,692,058 | | 2,941,635 |
Series 0527, 0.75%, 5/31/2027
| | ILS | 9,208,198 | | 2,519,351 |
Series 0545, 1.00%, 5/31/2045
| | ILS | 7,924,917 | | 1,912,425 |
Series 0841, 2.75%, 8/30/2041
| | ILS | 8,352,279 | | 2,691,220 |
Series 0536, 4.00%, 5/30/2036
| | ILS | 7,190,055 | | 2,545,277 |
| | | | | | 20,390,247 |
| ITALY — 4.6% | | | |
| Italy Buoni Poliennali Del Tesoro: | | | | | |
Series CPI, 0.10%, 5/15/2033 (a)
| | EUR | 2,443,413 | | 2,307,627 |
Series CPI, 0.15%, 5/15/2051 (a)
| | EUR | 1,115,804 | | 777,178 |
Series CPI, 0.40%, 5/15/2030 (a)
| | EUR | 2,004,164 | | 2,066,496 |
Series CPI, 0.65%, 5/15/2026
| | EUR | 1,654,912 | | 1,799,111 |
Series CPI, 1.25%, 9/15/2032 (a)
| | EUR | 2,755,632 | | 2,951,699 |
Series CPI, 1.30%, 5/15/2028 (a)
| | EUR | 1,497,520 | | 1,652,439 |
Series CPI, 1.50%, 5/15/2029
| | EUR | 514,035 | | 568,992 |
Series CPI, 2.35%, 9/15/2035 (a)
| | EUR | 2,844,442 | | 3,331,841 |
Series CPI, 2.55%, 9/15/2041 (a)
| | EUR | 2,398,027 | | 2,832,206 |
Series CPI, 3.10%, 9/15/2026 (a)
| | EUR | 2,069,947 | | 2,409,880 |
| | | | | | 20,697,469 |
| Security Description | | | Principal
Amount | | Value |
| JAPAN — 4.6% | | | |
| Japan Government CPI-Linked Bonds: | | | | | |
Series 26, 0.01%, 3/10/2031
| | JPY | 134,176,250 | | $ 1,017,362 |
Series 27, 0.01%, 3/10/2032
| | JPY | 359,929,860 | | 2,731,285 |
Series 28, 0.01%, 3/10/2033
| | JPY | 305,976,000 | | 2,295,840 |
Series 20, 0.10%, 3/10/2025
| | JPY | 563,332,000 | | 4,095,725 |
Series 21, 0.10%, 3/10/2026
| | JPY | 405,285,174 | | 2,990,164 |
Series 22, 0.10%, 3/10/2027
| | JPY | 210,628,491 | | 1,591,307 |
Series 23, 0.10%, 3/10/2028
| | JPY | 384,189,355 | | 2,864,797 |
Series 24, 0.10%, 3/10/2029
| | JPY | 392,239,295 | | 2,933,003 |
| | | | | | 20,519,483 |
| MEXICO — 4.7% | | | |
| Mexico Udibonos: | | | | | |
Series S, 2.75%, 11/27/2031
| | MXN | 50,251,559 | | 2,613,366 |
Series S, 3.00%, 12/3/2026
| | MXN | 33,501,040 | | 1,837,749 |
Series S, 4.00%, 11/30/2028
| | MXN | 45,864,518 | | 2,644,566 |
Series S, 4.00%, 11/15/2040
| | MXN | 52,253,641 | | 2,950,883 |
Series S, 4.00%, 11/8/2046
| | MXN | 45,465,697 | | 2,599,474 |
Series S, 4.00%, 11/3/2050
| | MXN | 63,412,679 | | 3,559,865 |
Series S, 4.50%, 12/4/2025
| | MXN | 29,831,878 | | 1,711,416 |
Series S, 4.50%, 11/22/2035
| | MXN | 47,778,864 | | 2,840,521 |
| | | | | | 20,757,840 |
| NEW ZEALAND — 3.3% | | | |
| New Zealand Government Bonds Inflation-Linked: | | | | | |
Series 0925, 2.00%, 9/20/2025
| | NZD | 4,604,601 | | 2,942,637 |
Series 0935, 2.50%, 9/20/2035
| | NZD | 8,202,882 | | 5,274,873 |
Series 0940, 2.50%, 9/20/2040
| | NZD | 6,371,700 | | 4,006,833 |
Series 0930, 3.00%, 9/20/2030
| | NZD | 3,991,087 | | 2,665,432 |
| | | | | | 14,889,775 |
See accompanying notes to financial statements.
76
SPDR FTSE INTERNATIONAL GOVERNMENT INFLATION-PROTECTED BOND ETF
SCHEDULE OF INVESTMENTS (continued)
December 31, 2023
| Security Description | | | Principal
Amount | | Value |
| SOUTH AFRICA — 4.5% | | | |
| Republic of South Africa Government Bond CPI-Linked: | | | | | |
Series 2029, 1.88%, 3/31/2029
| | ZAR | 34,612,519 | | $ 1,696,387 |
Series 2033, 1.88%, 2/28/2033
| | ZAR | 51,759,367 | | 2,247,958 |
Series 2025, 2.00%, 1/31/2025
| | ZAR | 55,931,211 | | 2,991,696 |
Series 2038, 2.25%, 1/31/2038
| | ZAR | 70,461,701 | | 2,832,346 |
Series 2046, 2.50%, 3/31/2046
| | ZAR | 75,513,120 | | 2,804,056 |
Series 2050, 2.50%, 12/31/2050
| | ZAR | 89,782,845 | | 3,171,986 |
Series R210, 2.60%, 3/31/2028
| | ZAR | 30,711,349 | | 1,585,103 |
Series R202, 3.45%, 12/7/2033
| | ZAR | 54,247,965 | | 2,663,711 |
Republic of South Africa Government Bonds CPI-Linked Series 2031, 4.25%, 1/31/2031
| | ZAR | 1,862,023 | | 101,678 |
| | | | | | 20,094,921 |
| SOUTH KOREA — 1.2% | | | |
| Korea Treasury Bonds Inflation-Linked: | | | | | |
Series 01000-2606, 1.00%, 6/10/2026
| | KRW | 1,667,797,200 | | 1,320,524 |
Series 01125-3006, 1.13%, 6/10/2030
| | KRW | 1,213,721,460 | | 966,928 |
Series 3206, 1.63%, 6/10/2032
| | KRW | 1,546,309,000 | | 1,281,350 |
Series 01750-2806, 1.75%, 6/10/2028
| | KRW | 1,954,117,550 | | 1,608,015 |
| | | | | | 5,176,817 |
| SPAIN — 4.5% | | | |
| Spain Government Bonds Inflation-Linked: | | | | | |
0.65%, 11/30/2027 (a)
| | EUR | 4,481,210 | | 4,934,435 |
0.70%, 11/30/2033 (a)
| | EUR | 7,652,260 | | 8,159,187 |
1.00%, 11/30/2030 (a)
| | EUR | 5,245,932 | | 5,843,429 |
1.80%, 11/30/2024 (a)
| | EUR | 254 | | 281 |
2.05%, 11/30/2039
| | EUR | 1,043,760 | | 1,257,958 |
| | | | | | 20,195,290 |
| SWEDEN — 4.6% | | | |
| Sweden Bonds Inflation-Linked: | | | | | |
Series 3112, 0.13%, 6/1/2026
| | SEK | 35,890,872 | | 3,491,020 |
Series 3113, 0.13%, 12/1/2027
| | SEK | 27,459,804 | | 2,657,045 |
| Security Description | | | Principal
Amount | | Value |
Series 3114, 0.13%, 6/1/2030
| | SEK | 23,232,943 | | $ 2,228,647 |
Series 3111, 0.13%, 6/1/2032
| | SEK | 32,847,927 | | 3,182,391 |
Series 3109, 1.00%, 6/1/2025
| | SEK | 44,646,371 | | 4,398,943 |
Series 3104, 3.50%, 12/1/2028
| | SEK | 41,390,548 | | 4,667,031 |
| | | | | | 20,625,077 |
| TURKEY — 4.5% | | | |
| Turkiye Government Bonds: | | | | | |
Series CPI, Zero Coupon, 2/11/2032
| | TRY | 35,239,442 | | 1,193,182 |
Series CPI, Zero Coupon, 8/4/2032
| | TRY | 18,284,679 | | 612,734 |
1.50%, 6/18/2025
| | TRY | 184,273,319 | | 6,546,481 |
2.36%, 1/29/2025
| | TRY | 35,926,874 | | 1,295,178 |
Series CPI, 2.70%, 1/14/2026
| | TRY | 68,083,559 | | 2,460,675 |
Series CPI, 2.90%, 7/7/2027
| | TRY | 65,373,874 | | 2,534,604 |
Series CPI, 2.90%, 1/12/2028
| | TRY | 54,205,655 | | 2,093,217 |
Series CPI, 3.00%, 5/28/2031
| | TRY | 40,950,291 | | 1,664,852 |
Series CPI, 3.30%, 6/28/2028
| | TRY | 45,509,733 | | 1,802,858 |
| | | | | | 20,203,781 |
| UNITED KINGDOM — 18.7% | | | |
| U.K. Inflation-Linked Gilts: | | | | | |
0.13%, 3/22/2026
| | GBP | 2,202,035 | | 2,794,297 |
0.13%, 8/10/2028
| | GBP | 3,903,578 | | 5,038,456 |
0.13%, 3/22/2029
| | GBP | 2,466,592 | | 3,172,876 |
0.13%, 8/10/2031
| | GBP | 2,444,996 | | 3,162,075 |
0.13%, 11/22/2036
| | GBP | 2,528,304 | | 3,110,510 |
0.13%, 3/22/2039
| | GBP | 1,909,935 | | 2,247,550 |
0.13%, 8/10/2041
| | GBP | 3,676,270 | | 4,222,489 |
0.13%, 3/22/2044
| | GBP | 2,766,373 | | 3,041,478 |
0.13%, 3/22/2046
| | GBP | 2,491,537 | | 2,666,036 |
0.13%, 8/10/2048
| | GBP | 1,498,663 | | 1,567,169 |
0.13%, 3/22/2051
| | GBP | 1,477,313 | | 1,509,259 |
0.13%, 11/22/2056
| | GBP | 1,404,965 | | 1,387,692 |
0.13%, 3/22/2058
| | GBP | 2,207,382 | | 2,144,979 |
0.13%, 11/22/2065
| | GBP | 819,673 | | 777,847 |
0.13%, 3/22/2068
| | GBP | 2,345,292 | | 2,225,244 |
0.13%, 3/22/2073
| | GBP | 796,517 | | 807,344 |
0.25%, 3/22/2052
| | GBP | 2,263,320 | | 2,386,664 |
0.38%, 3/22/2062
| | GBP | 2,763,605 | | 2,906,801 |
0.50%, 3/22/2050
| | GBP | 2,390,134 | | 2,725,989 |
0.63%, 3/22/2040
| | GBP | 2,791,904 | | 3,522,507 |
0.63%, 11/22/2042
| | GBP | 1,742,742 | | 2,163,643 |
0.63%, 3/22/2045
| | GBP | 1,038,140 | | 1,257,117 |
0.75%, 11/22/2033
| | GBP | 608,994 | | 821,684 |
0.75%, 3/22/2034
| | GBP | 3,764,718 | | 5,042,919 |
See accompanying notes to financial statements.
77
SPDR FTSE INTERNATIONAL GOVERNMENT INFLATION-PROTECTED BOND ETF
SCHEDULE OF INVESTMENTS (continued)
December 31, 2023
| Security Description | | | Principal
Amount | | Value |
0.75%, 11/22/2047
| | GBP | 2,391,330 | | $ 2,927,541 |
1.13%, 11/22/2037
| | GBP | 2,559,447 | | 3,533,837 |
1.25%, 11/22/2027
| | GBP | 3,212,296 | | 4,318,567 |
1.25%, 11/22/2032
| | GBP | 3,372,035 | | 4,753,971 |
1.25%, 11/22/2055
| | GBP | 2,712,755 | | 3,751,508 |
Series 8MO, 2.00%, 1/26/2035
| | GBP | 1,385,756 | | 2,062,849 |
Series 8MO, 4.13%, 7/22/2030
| | GBP | 833,383 | | 1,341,073 |
| | | | | | 83,391,971 |
TOTAL FOREIGN GOVERNMENT OBLIGATIONS
(Cost $495,117,692)
| | | | | 442,550,838 |
| | | Shares | |
| SHORT-TERM INVESTMENT — 0.0% (b) | |
State Street Institutional U.S. Government Money Market Fund, Class G Shares 5.36% (c) (d)
(Cost $125,453)
| 125,453 | 125,453 |
TOTAL INVESTMENTS — 99.3%
(Cost $495,243,145)
| 442,676,291 |
OTHER ASSETS IN EXCESS OF
LIABILITIES — 0.7%
| 2,987,652 |
NET ASSETS — 100.0%
| $ 445,663,943 |
| (a) | Securities purchased pursuant to Rule 144A of the Securities Act of 1933, as amended. These securities, which represent 12.5% of net assets as of December 31, 2023, are considered liquid and may be resold in transactions exempt from registration, normally to qualified institutional buyers. |
| (b) | Amount is less than 0.05% of net assets. |
| (c) | The Fund invested in certain money market funds managed by SSGA Funds Management, Inc. Amounts related to these transactions during the year ended December 31, 2023 are shown in the Affiliate Table below. |
| (d) | The rate shown is the annualized seven-day yield at December 31, 2023. |
| AUD | Australian Dollar |
| BRL | Brazilian Real |
| CAD | Canadian Dollar |
| CLP | Chilean Peso |
| COP | Colombian Peso |
| EUR | Euro |
| GBP | British Pound |
| ILS | Israeli New Shekel |
| JPY | Japanese Yen |
| KRW | South Korean Won |
| MXN | Mexican Peso |
| NZD | New Zealand Dollar |
| SEK | Swedish Krona |
| TRY | Turkish New Lira |
| ZAR | South African Rand |
The following table summarizes the value of the Fund's investments according to the fair value hierarchy as of December 31, 2023.
| Description | | Level 1 –
Quoted Prices | | Level 2 –
Other Significant
Observable Inputs | | Level 3 –
Significant
Unobservable Inputs | | Total |
| ASSETS: | | | | | | | | |
| INVESTMENTS: | | | | | | | | |
Foreign Government Obligations
| | $ — | | $442,550,838 | | $— | | $442,550,838 |
Short-Term Investment
| | 125,453 | | — | | — | | 125,453 |
TOTAL INVESTMENTS
| | $125,453 | | $442,550,838 | | $— | | $442,676,291 |
Affiliate Table
| | Number of
Shares Held
at
12/31/22 | | Value at
12/31/22 | | Cost of
Purchases | | Proceeds
from
Shares Sold | | Realized
Gain (Loss) | | Change in
Unrealized
Appreciation/
Depreciation | | Number of
Shares Held
at
12/31/23 | | Value at
12/31/23 | | Dividend
Income |
State Street Institutional U.S. Government Money Market Fund, Class G Shares
| 367,253 | | $367,253 | | $45,936,138 | | $46,177,938 | | $— | | $— | | 125,453 | | $125,453 | | $26,160 |
See accompanying notes to financial statements.
78
[This Page Intentionally Left Blank]
SPDR SERIES TRUST
STATEMENTS OF ASSETS AND LIABILITIES
December 31, 2023
| | SPDR Bloomberg Emerging Markets Local Bond ETF | | SPDR Bloomberg International Corporate Bond ETF |
| ASSETS | | | |
Investments in unaffiliated issuers, at value*
| $1,915,489,485 | | $215,653,686 |
Investments in affiliated issuers, at value
| 36,958,145 | | 8,992,670 |
Total Investments
| 1,952,447,630 | | 224,646,356 |
Foreign currency, at value
| 14,089,950 | | 1,479,743 |
Net cash at broker
| 150,000 | | — |
Cash
| 1,911,487 | | — |
Receivable for investments sold
| 19,342,645 | | 125,533 |
Unrealized appreciation on forward foreign currency exchange contracts
| 2,838,818 | | — |
Dividends receivable — affiliated issuers
| 20,230 | | 1,151 |
Interest receivable — unaffiliated issuers
| 30,735,617 | | 2,581,599 |
Securities lending income receivable — unaffiliated issuers
| 1,722 | | — |
Securities lending income receivable — affiliated issuers
| 5,818 | | 2,841 |
Receivable for foreign taxes recoverable
| 289,140 | | 3,290 |
TOTAL ASSETS
| 2,021,833,057 | | 228,840,513 |
| LIABILITIES | | | |
Due to custodian
| — | | — |
Payable upon return of securities loaned
| 21,260,045 | | 8,990,962 |
Payable for investments purchased
| 38,685,899 | | 275,800 |
Payable for fund shares repurchased
| — | | — |
Unrealized depreciation on forward foreign currency exchange contracts
| 2,266,854 | | — |
Deferred foreign taxes payable
| 295,683 | | — |
Advisory fee payable
| 487,945 | | 89,938 |
Trustees’ fees and expenses payable
| 503 | | 23 |
TOTAL LIABILITIES
| 62,996,929 | | 9,356,723 |
NET ASSETS
| $1,958,836,128 | | $219,483,790 |
| NET ASSETS CONSIST OF: | | | |
Paid-in capital
| $2,127,381,421 | | $228,081,684 |
Total distributable earnings (loss)**
| (168,545,293) | | (8,597,894) |
NET ASSETS
| $1,958,836,128 | | $219,483,790 |
| NET ASSET VALUE PER SHARE | | | |
Net asset value per share
| $ 21.31 | | $ 29.86 |
Shares outstanding (unlimited amount authorized, $0.01 par value)
| 91,900,000 | | 7,350,000 |
| COST OF INVESTMENTS: | | | |
Investments in unaffiliated issuers
| $1,953,479,715 | | $222,296,903 |
Investments in affiliated issuers
| 36,958,145 | | 8,992,670 |
Total cost of investments
| $1,990,437,860 | | $231,289,573 |
Foreign currency, at cost
| $ 13,977,461 | | $ 1,430,772 |
* Includes investments in securities on loan, at value
| $ 20,170,920 | | $ 8,812,096 |
** Includes deferred foreign taxes
| $ 295,855 | | $ — |
See accompanying notes to financial statements.
80
| SPDR Bloomberg International Treasury Bond ETF | | SPDR Bloomberg Short Term International Treasury Bond ETF | | SPDR FTSE International Government Inflation-Protected Bond ETF |
| | | | | |
| $1,043,778,130 | | $175,935,660 | | $442,550,838 |
| 31,458,759 | | 27,095 | | 125,453 |
| 1,075,236,889 | | 175,962,755 | | 442,676,291 |
| — | | 387,125 | | 1,541,627 |
| — | | — | | — |
| — | | — | | 624 |
| 43,992,701 | | 8,335,498 | | 5,175,627 |
| — | | — | | — |
| 16,907 | | 358 | | 2,590 |
| 8,528,847 | | 1,163,450 | | 2,323,994 |
| — | | — | | — |
| 21 | | — | | — |
| 475,733 | | 70,468 | | — |
| 1,128,251,098 | | 185,919,654 | | 451,720,753 |
| | | | | |
| 27,304,995 | | — | | — |
| — | | — | | — |
| 1,255,918 | | 7,903,246 | | 5,835,717 |
| 46,623,198 | | — | | — |
| — | | — | | — |
| 110,227 | | 132 | | 33,730 |
| 329,803 | | 52,033 | | 187,203 |
| 345 | | 41 | | 160 |
| 75,624,486 | | 7,955,452 | | 6,056,810 |
| $1,052,626,612 | | $177,964,202 | | $445,663,943 |
| | | | | |
| $1,181,608,159 | | $179,389,254 | | $525,924,391 |
| (128,981,547) | | (1,425,052) | | (80,260,448) |
| $1,052,626,612 | | $177,964,202 | | $445,663,943 |
| | | | | |
| $ 23.24 | | $ 27.38 | | $ 42.04 |
| 45,300,038 | | 6,500,000 | | 10,600,483 |
| | | | | |
| $1,155,361,060 | | $173,262,143 | | $ 495,117,692 |
| 31,458,759 | | 27,095 | | 125,453 |
| $1,186,819,819 | | $173,289,238 | | $495,243,145 |
| $ — | | $ 390,300 | | $ 1,548,810 |
| $ — | | $ — | | $ — |
| $ 90,019 | | $ 132 | | $ 31,803 |
SPDR SERIES TRUST
STATEMENTS OF OPERATIONS
For the Year Ended December 31, 2023
| | SPDR Bloomberg Emerging Markets Local Bond ETF | | SPDR Bloomberg International Corporate Bond ETF |
| INVESTMENT INCOME | | | |
Interest income — unaffiliated issuers
| $ 114,712,658 | | $ 5,317,080 |
Dividend income — affiliated issuers
| 188,602 | | 13,007 |
Unaffiliated securities lending income
| 933 | | — |
Affiliated securities lending income
| 148,229 | | 26,900 |
Foreign taxes withheld
| (2,705,896) | | — |
TOTAL INVESTMENT INCOME (LOSS)
| 112,344,526 | | 5,356,987 |
| EXPENSES | | | |
Advisory fee
| 5,620,099 | | 972,715 |
Trustees’ fees and expenses
| 21,513 | | 1,937 |
Miscellaneous expenses
| 1,477 | | 132 |
TOTAL EXPENSES
| 5,643,089 | | 974,784 |
NET INVESTMENT INCOME (LOSS)
| $106,701,437 | | $ 4,382,203 |
| REALIZED AND UNREALIZED GAIN (LOSS) | | | |
| Net realized gain (loss) on: | | | |
Investments — unaffiliated issuers*
| (71,890,575) | | (2,895,666) |
In-kind redemptions — unaffiliated issuers
| 7,664,931 | | (3,021,936) |
Forward foreign currency exchange contracts
| 259,930 | | — |
Foreign currency transactions
| (6,361,066) | | (169,964) |
Net realized gain (loss)
| (70,326,780) | | (6,087,566) |
| Net change in unrealized appreciation/depreciation on: | | | |
Investments — unaffiliated issuers**
| 149,246,973 | | 20,443,855 |
Forward foreign currency exchange contracts
| 501,459 | | — |
Foreign currency translations
| 359,387 | | 50,340 |
Net change in unrealized appreciation/depreciation
| 150,107,819 | | 20,494,195 |
NET REALIZED AND UNREALIZED GAIN (LOSS)
| 79,781,039 | | 14,406,629 |
NET INCREASE (DECREASE) IN NET ASSETS FROM OPERATIONS
| $186,482,476 | | $18,788,832 |
* Includes foreign capital gain taxes
| $ (153,616) | | $ — |
** Includes foreign deferred taxes
| $ (295,855) | | $ — |
See accompanying notes to financial statements.
82
| SPDR Bloomberg International Treasury Bond ETF | | SPDR Bloomberg Short Term International Treasury Bond ETF | | SPDR FTSE International Government Inflation-Protected Bond ETF |
| | | | | |
| $ 22,945,622 | | $ 3,557,167 | | $ 34,055,078 |
| 49,832 | | 8,704 | | 26,160 |
| — | | — | | — |
| 491 | | 184 | | — |
| (345,251) | | (39,509) | | (3,584) |
| 22,650,694 | | 3,526,546 | | 34,077,654 |
| | | | | |
| 3,550,331 | | 600,965 | | 2,365,220 |
| 11,168 | | 1,785 | | 5,385 |
| 16,018 | | 10,121 | | 372 |
| 3,577,517 | | 612,871 | | 2,370,977 |
| $ 19,073,177 | | $ 2,913,675 | | $ 31,706,677 |
| | | | | |
| | | | | |
| (18,861,531) | | (8,503,453) | | (22,030,768) |
| (4,310,253) | | (2,367,916) | | (3,192,437) |
| — | | — | | — |
| (1,448,293) | | (102,189) | | (586,488) |
| (24,620,077) | | (10,973,558) | | (25,809,693) |
| | | | | |
| 75,520,082 | | 13,864,739 | | 33,345,659 |
| — | | — | | — |
| 32,528 | | 23,421 | | 85,718 |
| 75,552,610 | | 13,888,160 | | 33,431,377 |
| 50,932,533 | | 2,914,602 | | 7,621,684 |
| $ 70,005,710 | | $ 5,828,277 | | $ 39,328,361 |
| $ (64,352) | | $ (839) | | $ (752) |
| $ (90,019) | | $ (132) | | $ (31,803) |
SPDR SERIES TRUST
STATEMENTS OF CHANGES IN NET ASSETS
| | SPDR Bloomberg Emerging Markets Local Bond ETF |
| | Year Ended
12/31/23 | | Year Ended
12/31/22 |
| INCREASE (DECREASE) IN NET ASSETS FROM OPERATIONS: | | | |
Net investment income (loss)
| $ 106,701,437 | | $ 98,759,769 |
Net realized gain (loss)
| (70,326,780) | | (197,884,844) |
Net change in unrealized appreciation/depreciation
| 150,107,819 | | (76,033,218) |
Net increase (decrease) in net assets resulting from operations
| 186,482,476 | | (175,158,293) |
Distributions to shareholders
| (64,472,196) | | (3,714,999) |
Return of capital
| (34,621,000) | | (86,940,908) |
Total Distributions to shareholders
| (99,093,196) | | (90,655,907) |
| FROM BENEFICIAL INTEREST TRANSACTIONS: | | | |
Proceeds from shares sold
| 320,399,516 | | 1,604,488,801 |
Cost of shares redeemed
| (602,280,159) | | (370,867,980) |
Other capital
| 1,843,086 | | 3,574,214 |
Net increase (decrease) in net assets from beneficial interest transactions
| (280,037,557) | | 1,237,195,035 |
Contribution from Affiliate (Note 4)
| — | | 534,103 |
Net increase (decrease) in net assets during the period
| (192,648,277) | | 971,914,938 |
Net assets at beginning of period
| 2,151,484,405 | | 1,179,569,467 |
NET ASSETS AT END OF PERIOD
| $1,958,836,128 | | $2,151,484,405 |
| SHARES OF BENEFICIAL INTEREST: | | | |
Shares sold
| 15,400,000 | | 74,600,000 |
Shares redeemed
| (28,500,000) | | (18,000,000) |
Net increase (decrease) from share transactions
| (13,100,000) | | 56,600,000 |
See accompanying notes to financial statements.
84
| SPDR Bloomberg International Corporate Bond ETF | | SPDR Bloomberg International Treasury Bond ETF | | SPDR Bloomberg Short Term International Treasury Bond ETF |
Year Ended
12/31/23 | | Year Ended
12/31/22 | | Year Ended
12/31/23 | | Year Ended
12/31/22 | | Year Ended
12/31/23 | | Year Ended
12/31/22 |
| | | | | | | | | | | |
| $ 4,382,203 | | $ 924,776 | | $ 19,073,177 | | $ 12,417,484 | | $ 2,913,675 | | $ 716,345 |
| (6,087,566) | | (4,585,386) | | (24,620,077) | | (33,111,730) | | (10,973,558) | | (15,252,526) |
| 20,494,195 | | (23,193,521) | | 75,552,610 | | (155,034,071) | | 13,888,160 | | (6,716,636) |
| 18,788,832 | | (26,854,131) | | 70,005,710 | | (175,728,317) | | 5,828,277 | | (21,252,817) |
| (4,375,760) | | (628,666) | | (17,121,791) | | (10,363,828) | | — | | (665,086) |
| — | | — | | — | | — | | (2,886,161) | | — |
| (4,375,760) | | (628,666) | | (17,121,791) | | (10,363,828) | | (2,886,161) | | (665,086) |
| | | | | | | | | | | |
| 165,969,923 | | 35,563,928 | | 431,595,476 | | 471,484,457 | | 69,937,787 | | 18,163,682 |
| (101,190,806) | | (19,639,302) | | (548,098,418) | | (121,779,953) | | (40,190,928) | | (21,099,179) |
| 186,249 | | 22,126 | | 879,542 | | 175,444 | | 39,005 | | (46,964) |
| 64,965,366 | | 15,946,752 | | (115,623,400) | | 349,879,948 | | 29,785,864 | | (2,982,461) |
| — | | — | | — | | — | | — | | 2,298 |
| 79,378,438 | | (11,536,045) | | (62,739,481) | | 163,787,803 | | 32,727,980 | | (24,898,066) |
| 140,105,352 | | 151,641,397 | | 1,115,366,093 | | 951,578,290 | | 145,236,222 | | 170,134,288 |
| $ 219,483,790 | | $140,105,352 | | $1,052,626,612 | | $1,115,366,093 | | $177,964,202 | | $145,236,222 |
| | | | | | | | | | | |
| 5,850,000 | | 1,300,000 | | 19,600,000 | | 20,600,000 | | 2,600,000 | | 600,000 |
| (3,600,000) | | (600,000) | | (24,200,000) | | (4,500,000) | | (1,500,000) | | (800,000) |
| 2,250,000 | | 700,000 | | (4,600,000) | | 16,100,000 | | 1,100,000 | | (200,000) |
SPDR SERIES TRUST
STATEMENTS OF CHANGES IN NET ASSETS (continued)
| | SPDR FTSE International Government Inflation-Protected Bond ETF |
| | Year Ended
12/31/23 | | Year Ended
12/31/22 |
| INCREASE (DECREASE) IN NET ASSETS FROM OPERATIONS: | | | |
Net investment income (loss)
| $ 31,706,677 | | $ 51,795,927 |
Net realized gain (loss)
| (25,809,693) | | (41,175,258) |
Net change in unrealized appreciation/depreciation
| 33,431,377 | | (97,436,182) |
Net increase (decrease) in net assets resulting from operations
| 39,328,361 | | (86,815,513) |
Distributions to shareholders
| (18,628,462) | | (37,295,303) |
Return of capital
| (12,655,664) | | (11,096,490) |
Total Distributions to shareholders
| (31,284,126) | | (48,391,793) |
| FROM BENEFICIAL INTEREST TRANSACTIONS: | | | |
Proceeds from shares sold
| — | | 237,160,404 |
Cost of shares redeemed
| (83,245,671) | | (34,725,536) |
Other capital
| 90,623 | | 267,829 |
Net increase (decrease) in net assets from beneficial interest transactions
| (83,155,048) | | 202,702,697 |
Contribution from Affiliate (Note 4)
| — | | 51,944 |
Net increase (decrease) in net assets during the period
| (75,110,813) | | 67,547,335 |
Net assets at beginning of period
| 520,774,756 | | 453,227,421 |
NET ASSETS AT END OF PERIOD
| $445,663,943 | | $520,774,756 |
| SHARES OF BENEFICIAL INTEREST: | | | |
Shares sold
| — | | 4,900,000 |
Shares redeemed
| (2,000,000) | | (700,000) |
Net increase (decrease) from share transactions
| (2,000,000) | | 4,200,000 |
See accompanying notes to financial statements.
86
SPDR SERIES TRUST
FINANCIAL HIGHLIGHTS
Selected data for a share outstanding throughout each period
| | SPDR Bloomberg Emerging Markets Local Bond ETF |
| | Year Ended
12/31/23 | | Year Ended
12/31/22 | | Year Ended
12/31/21 | | Year Ended
12/31/20 | | Six-month Period
Ended
12/31/19(a) | | Year Ended
6/30/19 |
Net asset value, beginning of period
| $ 20.49 | | $ 24.37 | | $ 28.00 | | $ 27.83 | | $ 27.76 | | $ 27.08 |
| Income (loss) from investment operations: | | | | | | | | | | | |
Net investment income (loss) (b)
| 1.18 | | 1.13 | | 1.01 | | 1.13 | | 0.65 | | 1.51 |
Net realized and unrealized gain (loss) (c)
| 0.74 | | (4.08) | | (3.72) | | 0.05 | | 0.15 | | 0.45 |
Total from investment operations
| 1.92 | | (2.95) | | (2.71) | | 1.18 | | 0.80 | | 1.96 |
Contribution from Affiliate (Note 4)
| — | | 0.01 | | — | | — | | — | | 0.01 |
Other capital (b)
| 0.02 | | 0.04 | | 0.02 | | 0.02 | | 0.01 | | 0.02 |
| Distributions to shareholders from: | | | | | | | | | | | |
Net investment income
| (0.73) | | (0.04) | | (0.81) | | (0.22) | | (0.07) | | (0.79) |
Return of Capital
| (0.39) | | (0.94) | | (0.13) | | (0.81) | | (0.67) | | (0.52) |
Total distributions
| (1.12) | | (0.98) | | (0.94) | | (1.03) | | (0.74) | | (1.31) |
Net asset value, end of period
| $ 21.31 | | $ 20.49 | | $ 24.37 | | $ 28.00 | | $ 27.83 | | $ 27.76 |
Total return (d)
| 9.79% | | (11.89)%(e) | | (9.74)% | | 4.59% | | 2.94% | | 7.70%(f) |
| Ratios and Supplemental Data: | | | | | | | | | | | |
Net assets, end of period (in 000s)
| $1,958,836 | | $2,151,484 | | $1,179,569 | | $1,013,443 | | $1,015,629 | | $810,738 |
| Ratios to average net assets: | | | | | | | | | | | |
Total expenses
| 0.30% | | 0.31% | | 0.30% | | 0.30% | | 0.30%(g) | | 0.39% |
Net expenses
| 0.30% | | 0.31% | | 0.30% | | 0.30% | | 0.30%(g) | | 0.38% |
Net investment income (loss)
| 5.70% | | 5.45% | | 3.86% | | 4.26% | | 4.69%(g) | | 5.68% |
Portfolio turnover rate (h)
| 52% | | 39% | | 22% | | 50% | | 18%(i) | | 43% |
| (a) | Effective November 12, 2019, the Board of Trustees approved a change in fiscal year end for the Fund from June 30 to December 31. |
| (b) | Per share numbers have been calculated using average shares outstanding, which more appropriately presents the per share data for the year. |
| (c) | Amounts shown in this caption for a share outstanding may not accord with the change in aggregate gains and losses in securities for the fiscal period because of the timing of sales and repurchases of Fund shares in relation to fluctuating market values for the Fund. |
| (d) | Total return is calculated assuming a purchase of shares at net asset value on the first day and a sale at net asset value on the last day of each period reported. Distributions are assumed, for the purpose of this calculation, to be reinvested at net asset value per share on the respective payment dates of each distribution. Total returns for periods of less than one year are not annualized. Broker commission charges are not included in this calculation. |
| (e) | If an Affiliate had not made a contribution during the year ended December 31, 2022, the total return would have been (11.93)%. |
| (f) | If an Affiliate had not made a contribution during the year ended June 30, 2019, the total return would have been 7.66%. |
| (g) | Annualized. |
| (h) | Portfolio turnover rate excludes securities received or delivered from in-kind processing of creations or redemptions. |
| (i) | Not annualized. |
See accompanying notes to financial statements.
87
SPDR SERIES TRUST
FINANCIAL HIGHLIGHTS (continued)
Selected data for a share outstanding throughout each period
| | SPDR Bloomberg International Corporate Bond ETF |
| | Year Ended
12/31/23 | | Year Ended
12/31/22 | | Year Ended
12/31/21 | | Year Ended
12/31/20 | | Six-month Period
Ended
12/31/19(a) | | Year Ended
6/30/19 |
Net asset value, beginning of period
| $ 27.47 | | $ 34.46 | | $ 37.76 | | $ 33.98 | | $ 34.15 | | $ 33.87 |
| Income (loss) from investment operations: | | | | | | | | | | | |
Net investment income (loss) (b)
| 0.63 | | 0.23 | | 0.12 | | 0.18 | | 0.14 | | 0.29 |
Net realized and unrealized gain (loss) (c)
| 2.35 | | (7.08) | | (3.30) | | 3.74 | | (0.20) | | 0.23 |
Total from investment operations
| 2.98 | | (6.85) | | (3.18) | | 3.92 | | (0.06) | | 0.52 |
Other capital (b)
| 0.03 | | 0.01 | | 0.01 | | 0.02 | | 0.02 | | 0.00(d) |
| Distributions to shareholders from: | | | | | | | | | | | |
Net investment income
| (0.62) | | (0.15) | | (0.13) | | (0.04) | | (0.10) | | — |
Return of Capital
| — | | — | | — | | (0.12) | | (0.03) | | (0.24) |
Total distributions
| (0.62) | | (0.15) | | (0.13) | | (0.16) | | (0.13) | | (0.24) |
Net asset value, end of period
| $ 29.86 | | $ 27.47 | | $ 34.46 | | $ 37.76 | | $ 33.98 | | $ 34.15 |
Total return (e)
| 11.13% | | (19.86)% | | (8.41)% | | 11.69% | | (0.15)% | | 1.59% |
| Ratios and Supplemental Data: | | | | | | | | | | | |
Net assets, end of period (in 000s)
| $219,484 | | $140,105 | | $151,641 | | $260,546 | | $190,273 | | $167,358 |
| Ratios to average net assets: | | | | | | | | | | | |
Total expenses
| 0.50% | | 0.51% | | 0.50% | | 0.50% | | 0.50%(f) | | 0.51% |
Net investment income (loss)
| 2.25% | | 0.78% | | 0.32% | | 0.54% | | 0.81%(f) | | 0.88% |
Portfolio turnover rate (g)
| 14% | | 14% | | 14% | | 23% | | 5%(h) | | 16% |
| (a) | Effective November 12, 2019, the Board of Trustees approved a change in fiscal year end for the Fund from June 30 to December 31. |
| (b) | Per share numbers have been calculated using average shares outstanding, which more appropriately presents the per share data for the year. |
| (c) | Amounts shown in this caption for a share outstanding may not accord with the change in aggregate gains and losses in securities for the fiscal period because of the timing of sales and repurchases of Fund shares in relation to fluctuating market values for the Fund. |
| (d) | Amount is less than $0.005 per share. |
| (e) | Total return is calculated assuming a purchase of shares at net asset value on the first day and a sale at net asset value on the last day of each period reported. Distributions are assumed, for the purpose of this calculation, to be reinvested at net asset value per share on the respective payment dates of each distribution. Total returns for periods of less than one year are not annualized. Broker commission charges are not included in this calculation. |
| (f) | Annualized. |
| (g) | Portfolio turnover rate excludes securities received or delivered from in-kind processing of creations or redemptions. |
| (h) | Not annualized. |
See accompanying notes to financial statements.
88
SPDR SERIES TRUST
FINANCIAL HIGHLIGHTS (continued)
Selected data for a share outstanding throughout each period
| | SPDR Bloomberg International Treasury Bond ETF |
| | Year Ended
12/31/23 | | Year Ended
12/31/22 | | Year Ended
12/31/21 | | Year Ended
12/31/20 | | Six-month Period
Ended
12/31/19(a) | | Year Ended
6/30/19 |
Net asset value, beginning of period
| $ 22.35 | | $ 28.15 | | $ 31.22 | | $ 28.74 | | $ 28.87 | | $ 27.88 |
| Income (loss) from investment operations: | | | | | | | | | | | |
Net investment income (loss) (b)
| 0.42 | | 0.34 | | 0.28 | | 0.35 | | 0.19 | | 0.39 |
Net realized and unrealized gain (loss) (c)
| 0.83 | | (5.87) | | (3.10) | | 2.42 | | (0.13) | | 0.92 |
Total from investment operations
| 1.25 | | (5.53) | | (2.82) | | 2.77 | | 0.06 | | 1.31 |
Contribution from Affiliate
| — | | — | | — | | 0.00(d) | | — | | — |
Other capital (b)
| 0.02 | | 0.00(d) | | 0.01 | | 0.01 | | 0.00(d) | | 0.01 |
| Distributions to shareholders from: | | | | | | | | | | | |
Net investment income
| (0.38) | | (0.27) | | (0.26) | | (0.30) | | (0.19) | | (0.33) |
Net asset value, end of period
| $ 23.24 | | $ 22.35 | | $ 28.15 | | $ 31.22 | | $ 28.74 | | $ 28.87 |
Total return (e)
| 5.73% | | (19.66)% | | (9.01)% | | 9.73%(f) | | 0.20% | | 4.78% |
| Ratios and Supplemental Data: | | | | | | | | | | | |
Net assets, end of period (in 000s)
| $1,052,627 | | $1,115,366 | | $951,578 | | $1,011,547 | | $1,028,855 | | $1,122,866 |
| Ratios to average net assets: | | | | | | | | | | | |
Total expenses
| 0.35% | | 0.36% | | 0.35% | | 0.35% | | 0.35%(g) | | 0.38% |
Net investment income (loss)
| 1.88% | | 1.43% | | 0.95% | | 1.19% | | 1.31%(g) | | 1.42% |
Portfolio turnover rate (h)
| 20% | | 14% | | 15% | | 16% | | 7%(i) | | 18% |
| (a) | Effective November 12, 2019, the Board of Trustees approved a change in fiscal year end for the Fund from June 30 to December 31. |
| (b) | Per share numbers have been calculated using average shares outstanding, which more appropriately presents the per share data for the year. |
| (c) | Amounts shown in this caption for a share outstanding may not accord with the change in aggregate gains and losses in securities for the fiscal period because of the timing of sales and repurchases of Fund shares in relation to fluctuating market values for the Fund. |
| (d) | Amount is less than $0.005 per share. |
| (e) | Total return is calculated assuming a purchase of shares at net asset value on the first day and a sale at net asset value on the last day of each period reported. Distributions are assumed, for the purpose of this calculation, to be reinvested at net asset value per share on the respective payment dates of each distribution. Total returns for periods of less than one year are not annualized. Broker commission charges are not included in this calculation. |
| (f) | If an affiliate had not made a contribution during the year ended December 31, 2020, the total return would have remained 9.73%. |
| (g) | Annualized. |
| (h) | Portfolio turnover rate excludes securities received or delivered from in-kind processing of creations or redemptions. |
| (i) | Not annualized. |
See accompanying notes to financial statements.
89
SPDR SERIES TRUST
FINANCIAL HIGHLIGHTS (continued)
Selected data for a share outstanding throughout each period
| | SPDR Bloomberg Short Term International Treasury Bond ETF |
| | Year Ended
12/31/23 | | Year Ended
12/31/22 | | Year Ended
12/31/21 | | Year Ended
12/31/20 | | Six-month Period
Ended
12/31/19(a) | | Year Ended
6/30/19 |
Net asset value, beginning of period
| $ 26.90 | | $ 30.38 | | $ 32.84 | | $ 30.88 | | $ 31.05 | | $ 31.38 |
| Income (loss) from investment operations: | | | | | | | | | | | |
Net investment income (loss) (b)
| 0.45 | | 0.12 | | (0.03) | | 0.05 | | 0.07 | | 0.16 |
Net realized and unrealized gain (loss) (c)
| 0.47 | | (3.47) | | (2.26) | | 1.94 | | (0.17) | | (0.10) |
Total from investment operations
| 0.92 | | (3.35) | | (2.29) | | 1.99 | | (0.10) | | 0.06 |
Contribution from Affiliate (Note 4)
| — | | 0.00(d) | | — | | 0.00(d) | | — | | — |
Other capital (b)
| 0.01 | | (0.01) | | 0.01 | | 0.01 | | 0.00(d) | | 0.00(d) |
| Distributions to shareholders from: | | | | | | | | | | | |
Net investment income
| — | | (0.12) | | (0.18) | | (0.04) | | — | | (0.33) |
Return of Capital
| (0.45) | | — | | — | | — | | (0.07) | | (0.06) |
Total distributions
| (0.45) | | (0.12) | | (0.18) | | (0.04) | | (0.07) | | (0.39) |
Net asset value, end of period
| $ 27.38 | | $ 26.90 | �� | $ 30.38 | | $ 32.84 | | $ 30.88 | | $ 31.05 |
Total return (e)
| 3.49% | | (11.07)%(f) | | (6.91)% | | 6.49%(g) | | (0.36)% | | 0.21% |
| Ratios and Supplemental Data: | | | | | | | | | | | |
Net assets, end of period (in 000s)
| $177,964 | | $145,236 | | $170,134 | | $213,429 | | $299,496 | | $298,118 |
| Ratios to average net assets: | | | | | | | | | | | |
Total expenses
| 0.36% | | 0.36% | | 0.35% | | 0.35% | | 0.35%(h) | | 0.36% |
Net investment income (loss)
| 1.70% | | 0.45% | | (0.09)% | | 0.16% | | 0.43%(h) | | 0.51% |
Portfolio turnover rate (i)
| 51% | | 56% | | 64% | | 67% | | 31%(j) | | 66% |
| (a) | Effective November 12, 2019, the Board of Trustees approved a change in fiscal year end for the Fund from June 30 to December 31. |
| (b) | Per share numbers have been calculated using average shares outstanding, which more appropriately presents the per share data for the year. |
| (c) | Amounts shown in this caption for a share outstanding may not accord with the change in aggregate gains and losses in securities for the fiscal period because of the timing of sales and repurchases of Fund shares in relation to fluctuating market values for the Fund. |
| (d) | Amount is less than $0.005 per share. |
| (e) | Total return is calculated assuming a purchase of shares at net asset value on the first day and a sale at net asset value on the last day of each period reported. Distributions are assumed, for the purpose of this calculation, to be reinvested at net asset value per share on the respective payment dates of each distribution. Total returns for periods of less than one year are not annualized. Broker commission charges are not included in this calculation. |
| (f) | If an affiliate had not made a contribution during the year ended ended December 31, 2022, the total return would have remained (11.07)% |
| (g) | If an affiliate had not made a contribution during the year ended ended December 31, 2020, the total return would have remained 6.49%. |
| (h) | Annualized. |
| (i) | Portfolio turnover rate excludes securities received or delivered from in-kind processing of creations or redemptions. |
| (j) | Not annualized. |
See accompanying notes to financial statements.
90
SPDR SERIES TRUST
FINANCIAL HIGHLIGHTS (continued)
Selected data for a share outstanding throughout each period
| | SPDR FTSE International Government Inflation-Protected Bond ETF |
| | Year Ended
12/31/23 | | Year Ended
12/31/22 | | Year Ended
12/31/21 | | Year Ended
12/31/20 | | Six-month Period
Ended
12/31/19(a) | | Year Ended
6/30/19 |
Net asset value, beginning of period
| $ 41.33 | | $ 53.95 | | $ 58.57 | | $ 55.28 | | $ 55.31 | | $ 54.63 |
| Income (loss) from investment operations: | | | | | | | | | | | |
Net investment income (loss) (b)
| 2.77 | | 4.91 | | 2.56 | | 1.02 | | 0.66 | | 1.92 |
Net realized and unrealized gain (loss) (c)
| 0.67 | | (12.97) | | (4.71) | | 3.17 | | 0.19 | | 0.57 |
Total from investment operations
| 3.44 | | (8.06) | | (2.15) | | 4.19 | | 0.85 | | 2.49 |
Contribution from Affiliate (Note 4)
| — | | 0.00(d) | | — | | — | | — | | — |
Other capital (b)
| 0.01 | | 0.03 | | 0.02 | | 0.03 | | 0.01 | | 0.03 |
| Distributions to shareholders from: | | | | | | | | | | | |
Net investment income
| (1.63) | | (3.53) | | (2.49) | | (0.93) | | (0.87) | | — |
Return of Capital
| (1.11) | | (1.06) | | — | | — | | (0.02) | | (1.84) |
Total distributions
| (2.74) | | (4.59) | | (2.49) | | (0.93) | | (0.89) | | (1.84) |
Net asset value, end of period
| $ 42.04 | | $ 41.33 | | $ 53.95 | | $ 58.57 | | $ 55.28 | | $ 55.31 |
Total return (e)
| 8.74% | | (15.41)%(f) | | (3.68)% | | 7.76% | | 1.58% | | 4.78% |
| Ratios and Supplemental Data: | | | | | | | | | | | |
Net assets, end of period (in 000s)
| $445,664 | | $520,775 | | $453,227 | | $380,717 | | $431,216 | | $475,714 |
| Ratios to average net assets: | | | | | | | | | | | |
Total expenses
| 0.50% | | 0.51% | | 0.50% | | 0.50% | | 0.50%(g) | | 0.50% |
Net investment income (loss)
| 6.70% | | 10.68% | | 4.57% | | 1.90% | | 2.39%(g) | | 3.60% |
Portfolio turnover rate (h)
| 22% | | 37% | | 20% | | 28% | | 8%(i) | | 37% |
| (a) | Effective November 12, 2019, the Board of Trustees approved a change in fiscal year end for the Fund from June 30 to December 31. |
| (b) | Per share numbers have been calculated using average shares outstanding, which more appropriately presents the per share data for the year. |
| (c) | Amounts shown in this caption for a share outstanding may not accord with the change in aggregate gains and losses in securities for the fiscal period because of the timing of sales and repurchases of Fund shares in relation to fluctuating market values for the Fund. |
| (d) | Amount is less than $0.005 per share. |
| (e) | Total return is calculated assuming a purchase of shares at net asset value on the first day and a sale at net asset value on the last day of each period reported. Distributions are assumed, for the purpose of this calculation, to be reinvested at net asset value per share on the respective payment dates of each distribution. Total returns for periods of less than one year are not annualized. Broker commission charges are not included in this calculation. |
| (f) | If an Affiliate had not made a contribution during the year ended December 31 2022, the total return would have remained (15.41)%. |
| (g) | Annualized. |
| (h) | Portfolio turnover rate excludes securities received or delivered from in-kind processing of creations or redemptions. |
| (i) | Not annualized. |
See accompanying notes to financial statements.
91
SPDR SERIES TRUST
NOTES TO FINANCIAL STATEMENTS
December 31, 2023
1. Organization
SPDR Series Trust (the “Trust”), a Massachusetts business trust, registered under the Investment Company Act of 1940, as amended (“1940 Act”), is an open-end management investment company.
As of December 31, 2023, the Trust consists of eighty-four (84) series, each of which represents a separate series of beneficial interest in the Trust. The Declaration of Trust permits the Board of Trustees of the Trust (the “Board”) to authorize the issuance of an unlimited number of shares of beneficial interest at $0.01 par value. The financial statements herein relate to the following series (each a “Fund”, and collectively, the “Funds”):
| SPDR Bloomberg Emerging Markets Local Bond ETF |
| SPDR Bloomberg International Corporate Bond ETF |
| SPDR Bloomberg International Treasury Bond ETF |
| SPDR Bloomberg Short Term International Treasury Bond ETF |
| SPDR FTSE International Government Inflation-Protected Bond ETF |
Each Fund, except for SPDR Bloomberg International Corporate Bond ETF, is classified as a non-diversified investment company under the 1940 Act. SPDR Bloomberg International Corporate Bond ETF is classified as a diversified investment company under the 1940 Act.
2. Summary of Significant Accounting Policies
The following is a summary of significant accounting policies followed by the Trust in the preparation of its financial statements:
The preparation of financial statements in accordance with U.S. generally accepted accounting principles (“U.S. GAAP”) requires management to make estimates and assumptions that affect the reported amounts and disclosures in the financial statements. Actual results could differ from those estimates. Each Fund is an investment company under U.S. GAAP and follows the accounting and reporting guidance applicable to investment companies.
Security Valuation
Each Fund's investments are valued at fair value each day that the New York Stock Exchange (“NYSE”) is open and, for financial reporting purposes, as of the report date should the reporting period end on a day that the NYSE is not open. Fair value is generally defined as the price a fund would receive to sell an asset or pay to transfer a liability in an orderly transaction between market participants at the measurement date. By its nature, a fair value price is a good faith estimate of the valuation in a current sale and may not reflect an actual market price. The investments of each Fund are valued pursuant to the policy and procedures developed by the Oversight Committee (the “Committee”) and approved by the Board. The Committee provides oversight of the valuation of investments for the Funds. The Board has responsibility for overseeing the determination of the fair value of investments.
Valuation techniques used to value each Fund’s investments by major category are as follows:
• Investments in registered investment companies (including money market funds) or other unitized pooled investment vehicles that are not traded on an exchange are valued at that day’s published net asset value (“NAV”) per share or unit.
• Government and municipal fixed income securities are generally valued using quotations from independent pricing services or brokers. Certain government inflation-indexed securities may require a calculated fair valuation as the cumulative inflation is contained within the price provided by the pricing service or broker. For these securities, the inflation component of the price is “cleaned” from the pricing service or broker price utilizing the published inflation factors in order to ensure proper accrual of income.
• Debt obligations (including short-term investments and convertible debt securities) are valued using quotations from independent pricing services or brokers or are generally valued at the last reported evaluated prices.
• Forward foreign currency exchange contracts are valued based on that day’s prevailing forward exchange rate for the underlying currencies. The rates are obtained from independent pricing services in accordance with the valuation policy and procedures approved by the Board.
SPDR SERIES TRUST
NOTES TO FINANCIAL STATEMENTS (continued)
December 31, 2023
In the event prices or quotations are not readily available or that the application of these valuation methods results in a price for an investment that is deemed to be not representative of the fair value of such investment, fair value will be determined in good faith by the Committee, in accordance with the valuation policy and procedures approved by the Board.
Various inputs are used in determining the value of the Funds' investments.
The Funds value their assets and liabilities at fair value using a fair value hierarchy consisting of three broad levels that prioritize the inputs to valuation techniques giving the highest priority to readily available unadjusted quoted prices in active markets for identical assets or liabilities (Level 1 measurements) and the lowest priority to unobservable inputs (Level 3 measurements) when market prices are not readily available or reliable. The categorization of a value determined for an investment within the hierarchy is based upon the pricing transparency of the investment and is not necessarily an indication of the risk associated with investing in it.
The three levels of the fair value hierarchy are as follows:
• Level 1 – Unadjusted quoted prices in active markets for an identical asset or liability;
• Level 2 – Inputs other than quoted prices included within Level 1 that are observable for the asset or liability either directly or indirectly, including quoted prices for similar assets or liabilities in active markets, quoted prices for identical or similar assets or liabilities in markets that are not considered to be active, inputs other than quoted prices that are observable for the asset or liability (such as exchange rates, financing terms, interest rates, yield curves, volatilities, prepayment speeds, loss severities, credit risks and default rates) or other market-corroborated inputs; and
• Level 3 – Unobservable inputs for the asset or liability, including the Committee’s assumptions used in determining the fair value of investments.
The value of each Fund’s investments according to the fair value hierarchy as of December 31, 2023 is disclosed in each Fund’s respective Schedule of Investments.
Investment Transactions and Income Recognition
Investment transactions are accounted for on trade date for financial reporting purposes. Realized gains and losses from the sale or disposition of investments and foreign exchange transactions, if any, are determined using the identified cost method.
Dividend income and capital gain distributions, if any, are recognized on the ex-dividend date, or when the information becomes available, net of any foreign taxes withheld at source, if any. Non-cash dividends, if any, received in the form of stock are recorded as dividend income at fair value. Distributions received by the Funds may include a return of capital that is estimated by management. Such amounts are recorded as a reduction of the cost of investments or reclassified to capital gains.
Expenses
Certain expenses, which are directly identifiable to a specific Fund, are applied to that Fund within the Trust. Other expenses which cannot be attributed to a specific Fund are allocated in such a manner as deemed equitable, taking into consideration the nature and type of expense and the relative net assets of the Funds within the Trust.
Foreign Currency Translation
The accounting records of the Funds are maintained in U.S. dollars. Foreign currencies as well as investment securities and other assets and liabilities denominated in a foreign currency are translated to U.S. dollars using exchange rates at period end. Purchases and sales of securities, income receipts and expense payments denominated in foreign currencies are translated into U.S. dollars at the prevailing exchange rate on the respective dates of the transactions.
The effects of exchange rate fluctuations on investments are included with the net realized and unrealized gain (loss) on investment securities. Other foreign currency transactions resulting in realized and unrealized gain (loss) are disclosed separately.
SPDR SERIES TRUST
NOTES TO FINANCIAL STATEMENTS (continued)
December 31, 2023
Foreign Taxes
The Funds may be subject to foreign taxes (a portion of which may be reclaimable) on income, stock dividends, realized and unrealized capital gains on investments or certain foreign currency transactions. Foreign taxes are recorded in accordance with SSGA FM understanding of the applicable foreign tax regulations and rates that exist in the foreign jurisdictions in which the Funds invest. These foreign taxes, if any, are paid by the Funds and are reflected in the Statements of Operations, if applicable. Foreign taxes payable or deferred as of December 31, 2023, if any, are disclosed in the Funds' Statements of Assets and Liabilities.
Distributions
Distributions from net investment income, if any, are declared and paid monthly. Net realized capital gains, if any, are distributed annually. Dividends may be declared and paid more frequently or at any other times to improve Index tracking or to comply with the distribution requirements of the Internal Revenue Code of 1986, as amended (the “Internal Revenue Code”). The amount and character of income and capital gains to be distributed are determined in accordance with applicable tax regulations which may differ from net investment income and realized gains recognized for U.S. GAAP purposes.
3. Derivative Financial Instruments
Forward Foreign Currency Exchange Contracts
Certain Funds may engage in forward foreign currency contracts to acquire exposure to foreign currencies or to hedge the Fund’s investments against currency fluctuations. A forward foreign currency exchange contract is a commitment to purchase or sell a foreign currency at the settlement date at a negotiated rate. Non-deliverable forward foreign currency exchange contracts are settled with the counterparty in cash without the delivery of foreign currency. The contract is marked-to-market daily and the change in market value is recorded by the Fund as an unrealized gain or loss. When the contract is closed, a Fund recognizes a realized gain or loss equal to the difference between the value of the contract at the time it was opened and the value at the time it was closed.
Certain risks may arise upon entering into forward foreign currency exchange contracts from the potential inability of counterparties to meet the terms of their contracts and are generally limited to the amount of unrealized gains on appreciated contracts, if any. Additionally, when utilizing forward foreign currency exchange contracts to hedge, the Funds give up the opportunity to profit from favorable exchange rate movements during the term of the contract.
For the year ended December 31, 2023, the SPDR Bloomberg Emerging Markets Local Bond ETF entered into forward foreign currency exchange contracts to manage currency exposure.
The following tables summarize the value of the Funds' derivative instruments as of December 31, 2023, and the related location in the accompanying Statement of Assets and Liabilities and Statement of Operations, presented by primary underlying risk exposure:
| | Asset Derivatives |
| | Interest
Rate
Risk | | Foreign
Exchange
Risk | | Credit
Risk | | Equity
Risk | | Commodity
Risk | | Total |
| SPDR Bloomberg Emerging Markets Local Bond ETF | | | | | | | | | | | |
Forward Foreign Currency Exchange Contracts
| $— | | $2,838,818 | | $— | | $— | | $— | | $2,838,818 |
| | Liability Derivatives |
| | Interest
Rate
Risk | | Foreign
Exchange
Risk | | Credit
Risk | | Equity
Risk | | Commodity
Risk | | Total |
| SPDR Bloomberg Emerging Markets Local Bond ETF | | | | | | | | | | | |
Forward Foreign Currency Exchange Contracts
| $— | | $2,266,854 | | $— | | $— | | $— | | $2,266,854 |
SPDR SERIES TRUST
NOTES TO FINANCIAL STATEMENTS (continued)
December 31, 2023
| | Net Realized Gain (Loss) |
| | Interest
Rate
Risk | | Foreign
Exchange
Risk | | Credit
Risk | | Equity
Risk | | Commodity
Risk | | Total |
| SPDR Bloomberg Emerging Markets Local Bond ETF | | | | | | | | | | | |
Forward Foreign Currency Exchange Contracts
| $— | | $259,930 | | $— | | $— | | $— | | $259,930 |
| | Net Change in Unrealized Appreciation/Depreciation |
| | Interest
Rate
Risk | | Foreign
Exchange
Risk | | Credit
Risk | | Equity
Risk | | Commodity
Risk | | Total |
| SPDR Bloomberg Emerging Markets Local Bond ETF | | | | | | | | | | | |
Forward Foreign Currency Exchange Contracts
| $— | | $501,459 | | $— | | $— | | $— | | $501,459 |
For financial reporting purposes, the Funds do not offset derivative assets or liabilities, including those that may be subject to an enforceable Foreign Exchange Master Agreement that allows for net settlement between counterparties, on their Statements of Assets and Liabilities. The following tables set forth the Funds’ net exposure to derivative assets and liabilities available for offset and net of collateral at December 31, 2023:
| Offsetting of Financial Assets and Derivative Assets |
| | | Forward Foreign Currency Exchange Contracts |
| Counterparty | | Gross Amounts
of Assets | | Amount
Eligible
to Offset | | Collateral
(Received)
Pledged | | Net
Amount |
Barclays Capital PLC
| | $2,662,248 | | $(884,594) | | $— | | $1,777,654 |
Goldman Sachs Bank USA
| | 135,754 | | — | | — | | 135,754 |
Standard Chartered Bank
| | 5,667 | | — | | — | | 5,667 |
UBS AG
| | 35,149 | | — | | — | | 35,149 |
| | | $2,838,818 | | $(884,594) | | $— | | $1,954,224 |
| Offsetting of Financial Liabilities and Derivative Liabilities |
| | | Forward Foreign Currency Exchange Contracts |
| Counterparty | | Gross Amounts
of Liabilities | | Amount
Eligible
to Offset | | Collateral
(Received)
Pledged | | Net
Amount |
Barclays Capital PLC
| | $ (884,594) | | $884,594 | | $— | | $ — |
Deutsche Bank AG
| | (1,335,164) | | — | | — | | (1,335,164) |
Westpac Banking Corp.
| | (47,095) | | — | | — | | (47,095) |
| | | $(2,266,853) | | $884,594 | | $— | | $(1,382,259) |
Amounts presented on the Schedules of Investments and Statements of Assets and Liabilities are not net settlement amounts but gross.
4. Fees and Transactions with Affiliates
Advisory Fee
The Trust, on behalf of each Fund, has entered into an Investment Advisory Agreement with SSGA Funds Management, Inc. (the "Adviser" or "SSGA FM"). For its advisory services to the Funds, facilities furnished and expenses borne by the Adviser, each Fund pays the Adviser a fee (“Management/Advisory fee”) accrued daily and
SPDR SERIES TRUST
NOTES TO FINANCIAL STATEMENTS (continued)
December 31, 2023
paid monthly, based on a percentage of each Fund’s average daily net assets as shown in the following table:
| | Annual Rate |
SPDR Bloomberg Emerging Markets Local Bond ETF
| 0.30% |
SPDR Bloomberg International Corporate Bond ETF
| 0.50 |
SPDR Bloomberg International Treasury Bond ETF
| 0.35 |
SPDR Bloomberg Short Term International Treasury Bond ETF
| 0.35 |
SPDR FTSE International Government Inflation-Protected Bond ETF
| 0.50 |
From time to time, the Adviser may waive all or a portion of its Management fee. The Adviser has contractually agreed to waive a portion of its Management fee and/or reimburse expenses in an amount equal to any acquired fund fees and expenses (excluding holdings in acquired funds for cash management purposes, if any) for each Fund until April 30, 2024.
This waiver and/or reimbursement does not provide for the recoupment by the Adviser of any amounts waived or reimbursed. This waiver and/or reimbursement may not be terminated prior to April 30, 2024 except with the approval of the Funds’ Board of Trustees.
The Adviser pays all expenses of each Fund other than the Management fee, brokerage expenses, taxes, interest, fees and expenses of the Trust’s Trustees, who are not “interested persons” of the Trust, as defined in the 1940 Act (“Independent Trustees”) (including any Trustee’s counsel fees), litigation expenses, acquired fund fees and expenses and other extraordinary expenses.
State Street Global Advisors Limited receives fees from the Adviser for its services as the sub-adviser to the SPDR Bloomberg International Corporate Bond ETF and SPDR Bloomberg Emerging Markets Local Bond ETF.
Administrator, Custodian, Sub-Administrator and Transfer Agent Fees
SSGA FM serves as administrator and State Street Bank and Trust Company (“State Street”), an affiliate of the Adviser, serves as custodian, sub-administrator and transfer agent. State Street receives fees for its services as custodian, sub-administrator and transfer agent from the Adviser.
Distributor
State Street Global Advisors Funds Distributors, LLC (“SSGA FD” or the “Distributor”), an affiliate of the Adviser, serves as the Distributor of the Trust.
Other Transactions with Affiliates - Securities Lending
State Street, an affiliate of the Funds, acts as the securities lending agent for the Funds, pursuant to an amended and restated securities lending authorization agreement dated January 6, 2017, as amended.
Net proceeds collected by State Street on investment of cash collateral or any fee income less rebates payable to borrowers are paid as follows: If the calendar year to date net proceeds are below a specified threshold across SPDR ETFs each Fund retains eighty five percent (85%) of the net proceeds and fifteen percent (15%) of such net proceeds is payable to State Street. Starting the business day following the date that calendar year to date net proceeds exceeds a specified threshold, each Fund retains ninety percent (90%) of the net proceeds and ten percent (10%) of such net proceeds is payable to State Street.
In addition, cash collateral from lending activities is invested in the State Street Navigator Securities Lending Portfolio II, an affiliated fund, for which SSGA FM serves as investment adviser. See Note 9 for additional information regarding securities lending.
Other Transactions with Affiliates
The Funds may invest in affiliated entities, including securities issued by State Street Corporation, affiliated funds, or entities deemed to be affiliates as a result of the Funds owning more than five percent of the entity’s voting securities or outstanding shares. Amounts relating to these transactions during the year ended December 31, 2023 are disclosed in the Schedules of Investments.
SPDR SERIES TRUST
NOTES TO FINANCIAL STATEMENTS (continued)
December 31, 2023
During the fiscal year ended December 31, 2022, State Street made contributions of $489,633, $2,298 and $51,944 to the SPDR Bloomberg Emerging Markets Local Bond ETF, SPDR Bloomberg Short Term International Treasury Bond ETF and SPDR FTSE International Government Inflation-Protected Bond ETF, respectively, related to an accounting matter.
During the fiscal year ended December 31, 2022, the Adviser agreed to make a contribution $44,470 to the SPDR Bloomberg Emerging Markets Local Bond ETF related to a trade processing matter.
Due to Custodian
In certain circumstances, the Funds may have cash overdrafts with the Custodian due to expense payments, capital transactions, trading of securities, investment operations or derivative transactions. The Due to Custodian amount, if any, reflects cash overdrawn with State Street, as custodian, who is an affiliate of the Funds.
5. Trustees’ Fees
The fees and expenses of the Independent Trustees and one interested, non-management Trustee are paid directly by the Funds. The Independent Trustees and one interested, non-management Trustee are reimbursed for travel and other out-of-pocket expenses in connection with meeting attendance and industry seminars.
6. Investment Transactions
Purchases and sales of investments (excluding in-kind transactions and short term investments) for the year ended December 31, 2023, were as follows:
| | Purchases | | Sales |
SPDR Bloomberg Emerging Markets Local Bond ETF
| $950,685,664 | | $1,043,122,860 |
SPDR Bloomberg International Corporate Bond ETF
| 80,456,581 | | 26,493,199 |
SPDR Bloomberg International Treasury Bond ETF
| 253,938,727 | | 198,041,536 |
SPDR Bloomberg Short Term International Treasury Bond ETF
| 88,452,997 | | 85,028,609 |
SPDR FTSE International Government Inflation-Protected Bond ETF
| 103,174,892 | | 135,998,485 |
For the year ended December 31, 2023, the following Funds had in-kind contributions, redemptions and net realized gains/losses in the amounts as follows:
| | In-kind
Contributions | | In-kind
Redemptions | | In-kind Net
Realized
Gains/(Losses) |
SPDR Bloomberg Emerging Markets Local Bond ETF
| $ 88,842,725 | | $292,344,738 | | $ 7,664,931 |
SPDR Bloomberg International Corporate Bond ETF
| 104,305,243 | | 96,077,206 | | (3,021,936) |
SPDR Bloomberg International Treasury Bond ETF
| 265,462,785 | | 434,875,905 | | (4,310,253) |
SPDR Bloomberg Short Term International Treasury Bond ETF
| 58,337,732 | | 33,065,977 | | (2,367,916) |
SPDR FTSE International Government Inflation-Protected Bond ETF
| — | | 75,155,190 | | (3,192,437) |
7. Shareholder Transactions
Each Fund issues and redeems its shares, at NAV, by each Fund only in aggregations of a specified number of shares or multiples thereof (“Creation Units”). Except when aggregated in Creation Units, shares of each Fund are not redeemable. Transactions in capital shares for each Fund are disclosed in detail in the Statements of Changes in Net Assets.
The consideration for the purchase of Creation Units of a Fund may consist of the in-kind deposit of a designated portfolio of securities and a specified amount of cash. Investors purchasing and redeeming Creation Units may pay a purchase transaction fee and a redemption transaction fee directly to the Trust and/or custodian, to offset transfer and other transaction costs associated with the issuance and redemption of Creation Units, including Creation Units for cash. An additional variable fee may be charged for certain transactions. Such variable charges, if any, are included in “Other Capital” on the Statements of Changes in Net Assets.
SPDR SERIES TRUST
NOTES TO FINANCIAL STATEMENTS (continued)
December 31, 2023
8. Income Tax Information
The Funds have qualified and intend to continue to qualify as regulated investment companies under Subchapter M of the Internal Revenue Code. Each Fund will not be subject to federal income taxes to the extent it distributes its taxable income, including any net realized capital gains, for each fiscal year. Therefore, no provision for federal income tax is required.
The Funds file federal and various state and local tax returns as required. No income tax returns are currently under examination. Generally, the federal returns are subject to examination by the Internal Revenue Service for a period of three years from date of filing, while the state returns may remain open for an additional year depending upon jurisdiction. SSGA FM has analyzed each Fund's tax positions taken on tax returns for all open years and does not believe there are any uncertain tax positions that would require recognition of a tax liability.
Certain capital accounts in the financial statements have been adjusted for permanent book-tax differences. These adjustments have no impact on NAV or results of operations. Temporary book-tax differences will reverse in the future. These book-tax differences are primarily due to differing treatments for character of distributions, in-kind transactions, foreign currencies, premium amortization, net operating losses, wash sale loss deferrals, TIPS adjustments, forward contracts and distributions in excess of current earnings.
Distributions to shareholders are recorded on ex-dividend date. Income dividends and gain distributions are determined in accordance with income tax rules and regulations, which may differ from generally accepted accounting principles.
The tax character of distributions paid during the year ended December 31, 2023, was as follows:
| | Ordinary
Income | | Long-Term
Capital Gains | | Tax Return
of Capital | | Total |
SPDR Bloomberg Emerging Markets Local Bond ETF
| $64,472,196 | | $— | | $34,621,000 | | $99,093,196 |
SPDR Bloomberg International Corporate Bond ETF
| 4,375,760 | | — | | — | | 4,375,760 |
SPDR Bloomberg International Treasury Bond ETF
| 17,121,791 | | — | | — | | 17,121,791 |
SPDR Bloomberg Short Term International Treasury Bond ETF
| — | | — | | 2,886,161 | | 2,886,161 |
SPDR FTSE International Government Inflation-Protected Bond ETF
| 18,628,462 | | — | | 12,655,664 | | 31,284,126 |
The tax character of distributions paid during the fiscal period ended December 31, 2022 was as follows:
| | Ordinary
Income | | Long-Term
Capital Gains | | Tax Return
of Capital | | Total |
SPDR Bloomberg Emerging Markets Local Bond ETF
| $ 3,714,999 | | $ — | | $ 86,940,908 | | $ 90,655,907 |
SPDR Bloomberg International Corporate Bond ETF
| 628,666 | | — | | — | | 628,666 |
SPDR Bloomberg International Treasury Bond ETF
| 10,363,828 | | — | | — | | 10,363,828 |
SPDR Bloomberg Short Term International Treasury Bond ETF
| 526,121 | | 138,965 | | — | | 665,086 |
SPDR FTSE International Government Inflation-Protected Bond ETF
| 37,295,303 | | — | | 11,096,490 | | 48,391,793 |
At December 31, 2023, the components of distributable earnings on a tax basis were as follows:
| | Undistributed
Ordinary Income | | Capital Loss
Carryforwards | | Undistributed
Long-Term
Capital Gains | | Net Unrealized
Gains (Losses) | | Qualified
Late-Year
Losses | | Total |
SPDR Bloomberg Emerging Markets Local Bond ETF
| $— | | $(123,344,586) | | $— | | $ (44,844,415) | | $(356,292) | | $(168,545,293) |
SPDR Bloomberg International Corporate Bond ETF
| — | | (1,916,240) | | — | | (6,681,654) | | — | | (8,597,894) |
SPDR Bloomberg International Treasury Bond ETF
| — | | (15,818,682) | | — | | (113,162,865) | | — | | (128,981,547) |
SPDR Bloomberg Short Term International Treasury Bond ETF
| — | | (3,982,711) | | — | | 2,557,659 | | — | | (1,425,052) |
SPDR FTSE International Government Inflation-Protected Bond ETF
| — | | (18,848,677) | | — | | (60,721,225) | | (690,546) | | (80,260,448) |
SPDR SERIES TRUST
NOTES TO FINANCIAL STATEMENTS (continued)
December 31, 2023
As of December 31, 2023, the following Funds had capital loss carryforwards available to offset future realized capital gains as follows:
| | Non-Expiring
Short Term | | Non-Expiring
Long Term |
SPDR Bloomberg Emerging Markets Local Bond ETF
| $38,655,101 | | $84,689,485 |
SPDR Bloomberg International Corporate Bond ETF
| 235,183 | | 1,681,057 |
SPDR Bloomberg International Treasury Bond ETF
| 2,256,636 | | 13,562,046 |
SPDR Bloomberg Short Term International Treasury Bond ETF
| 1,111,172 | | 2,871,539 |
SPDR FTSE International Government Inflation-Protected Bond ETF
| 8,188,952 | | 10,659,725 |
As of December 31, 2023, gross unrealized appreciation and gross unrealized depreciation of investments and other financial instruments based on cost for federal income tax purposes were as follows:
| | Tax
Cost | | Gross
Unrealized
Appreciation | | Gross
Unrealized
Depreciation | | Net Unrealized
Appreciation
(Depreciation) |
SPDR Bloomberg Emerging Markets Local Bond ETF
| $1,998,143,259 | | $64,765,843 | | $ 110,461,472 | | $ (45,695,629) |
SPDR Bloomberg International Corporate Bond ETF
| 231,427,967 | | 4,933,611 | | 11,715,222 | | (6,781,611) |
SPDR Bloomberg International Treasury Bond ETF
| 1,188,529,227 | | 17,353,504 | | 130,645,842 | | (113,292,338) |
SPDR Bloomberg Short Term International Treasury Bond ETF
| 173,432,133 | | 4,842,125 | | 2,311,503 | | 2,530,622 |
SPDR FTSE International Government Inflation-Protected Bond ETF
| 503,417,805 | | 8,957,716 | | 69,699,230 | | (60,741,514) |
9. Securities Lending
Each Fund may lend securities to qualified broker-dealers or institutional investors. The loans are secured at all times by cash, cash equivalents or U.S. government securities in an amount at least equal to the market value of the securities loaned, plus accrued interest and dividends, determined on a daily basis and adjusted accordingly. The value of the collateral with respect to a loaned security may be temporarily more or less than the value of a security due to market fluctuations of securities values. With respect to each loan, if on any U.S. business day the aggregate market value of securities collateral plus cash collateral is less than the aggregate market value of the securities which are subject to the loan, the borrower will be notified to provide additional collateral on the next business day.
The Funds will regain record ownership of loaned securities to exercise certain beneficial rights; however, the Funds may bear the risk of delay in recovery of, or even loss of rights in the securities loaned should the borrower fail financially. In addition, a Fund will bear the risk of loss of any cash collateral that it may invest. Each Fund receives compensation for lending its securities from interest or dividends earned on the cash, cash equivalents or U.S. government securities held as collateral, net of fee rebates paid to the borrower and net of fees paid to State Street as the lending agent. Additionally, a Fund will receive a fee from the borrower for non-cash collateral equal to a percentage of the market value of the loaned securities.
The market value of securities on loan as of December 31, 2023, and the value of the invested cash collateral are disclosed in the Funds' Statements of Assets and Liabilities. Non-cash collateral is not disclosed in the Funds' Statements of Assets and Liabilities as it is held by the lending agent on behalf of the Funds and the Funds do not have the ability to re-hypothecate those securities. Securities lending income, as disclosed in the Funds' Statements of Operations, represents the income earned from the non-cash collateral and the investment of cash collateral, net of fee rebates paid to the borrower and net of fees paid to State Street as lending agent.
The following is a summary of each Fund's securities lending agreements and related cash and non-cash collateral received as of December 31, 2023:
| Fund | | Market Value of
Securities on Loan | | Cash
Collateral
Received | | Total
Collateral
Received |
SPDR Bloomberg Emerging Markets Local Bond ETF
| | $ 20,170,920 | | $ 21,260,045 | | $ 21,260,045 |
SPDR Bloomberg International Corporate Bond ETF
| | 8,812,096 | | 8,990,962 | | 8,990,962 |
SPDR SERIES TRUST
NOTES TO FINANCIAL STATEMENTS (continued)
December 31, 2023
| | | | | Remaining Contractual Maturity of the Agreements
as of December 31, 2023 |
| Fund | | Securities
Lending
Transactions | | Overnight
and
Continuous | | <30 Days | | Between
30 & 90
Days | | >90 Days | | Total
Borrowings | | Gross Amount
of Recognized
Liabilities for
Securities Lending Transactions |
SPDR Bloomberg Emerging Markets Local Bond ETF
| | Foreign Government Obligations | | $21,260,045 | | $— | | $— | | $— | | $21,260,045 | | $21,260,045 |
SPDR Bloomberg International Corporate Bond ETF
| | Corporate Bonds & Notes | | 8,990,962 | | — | | — | | — | | 8,990,962 | | 8,990,962 |
10. Line of Credit
The Funds and other affiliated funds (each, a “Participant” and collectively, the “Participants”) have access to $180 million of a $960 million ($200 million of $1.275 billion prior to October 5, 2023) revolving credit facility, provided by a syndication of banks under which the Participants may borrow to fund shareholder redemptions. This agreement expires in October 2024 unless extended or renewed.
The Participants are charged an annual commitment fee which is calculated based on the unused portion of the shared credit line. Commitment fees are allocated among each of the Participants based on relative net assets. Commitment fees are ordinary fund operating expenses paid by the Adviser. A Participant incurs and pays the interest expense related to its borrowing. Interest is calculated at a rate per annum equal to the sum of 1.00% plus the greater of the New York Fed Bank Rate.
The Fund had no outstanding loans as of December 31, 2023.
11. Risks
Concentration Risk
As a result of the Funds’ ability to invest a large percentage of their assets in obligations of issuers within the same country, state, region, currency or economic sector, an adverse economic, business or political development may affect the value of the Funds’ investments more than if the Funds were more broadly diversified.
Foreign and Emerging Markets Risk
Investing in foreign markets involves risks and considerations not typically associated with investing in the U.S. Foreign securities may be subject to risk of loss because of government regulation, economic, political and social instability in the countries in which the Funds' invest. Foreign markets may be less liquid than investments in the U.S. and may be subject to the risks of currency fluctuations. To the extent that a Fund invests in securities of issuers located in emerging markets, these risks may be even more pronounced.
Credit Risk
A Fund may be exposed to credit risk in the event that an issuer or guarantor fails to perform or that an institution or entity with which the Fund has unsettled or open transactions defaults.
Market Risk
Each Fund’s investments are subject to changes in general economic conditions, general market fluctuations and the risks inherent in investment in securities markets. Investment markets can be volatile and prices of investments can change substantially due to various factors including, but not limited to, economic growth or recession, changes in interest rates, changes in the actual or perceived creditworthiness of issuers, and general market liquidity. The Funds are subject to the risk that geopolitical events will disrupt securities markets and adversely affect global economies and markets. Local, regional, or global events such as war, acts of terrorism, the spread of infectious illness, such as COVID-19, or other public health issues, or other events could have a significant impact on a Fund and its investments.
SPDR SERIES TRUST
NOTES TO FINANCIAL STATEMENTS (continued)
December 31, 2023
Russian Sanctions Risk
Sanctions threatened or imposed by a number of jurisdictions, including the United States, the European Union and the United Kingdom, and other intergovernmental actions that have been or may be undertaken in the future, against Russia, Russian entities or Russian individuals, may result in the devaluation of Russian currency, a downgrade in the country’s credit rating, an immediate freeze of Russian assets, a decline in the value and liquidity of Russian securities, property or interests, and/or other adverse consequences to the Russian economy or a Fund. The scope and scale of sanctions in place at a particular time may be expanded or otherwise modified in a way that have negative effects on a Fund. Sanctions, or the threat of new or modified sanctions, could impair the ability of a Fund to buy, sell, hold, receive, deliver or otherwise transact in certain affected securities or other investment instruments. Sanctions could also result in Russia taking counter measures or other actions in response, which may further impair the value and liquidity of Russian securities. These sanctions, and the resulting disruption of the Russian economy, may cause volatility in other regional and global markets and may negatively impact the performance of various sectors and industries, as well as companies in other countries, which could have a negative effect on the performance of a Fund, even if a Fund does not have direct exposure to securities of Russian issuers. As a collective result of the imposition of sanctions, Russian government countermeasures and the impact that they have had on the trading markets for Russian securities, certain Funds have used, and may in the future use, fair valuation procedures approved by the Fund’s Board to value certain Russian securities, which could result in such securities being deemed to have a zero value.
12. Recent Accounting Pronouncement
In December 2022, the Financial Accounting Standards Board (FASB) issued Accounting Standards Update (ASU) No. 2206 Reference Rate Reform (Topic 848). ASU No. 2022-06 updates and clarifies ASU No. 2020-04, which provides optional, temporary relief with respect to the financial reporting of contracts subject to certain types of modifications due to the planned discontinuation of LIBOR and other interbank-offered reference rates. The temporary relief provided by ASU No. 2022-06 is effective immediately for certain reference rate-related contract modifications that occur through December 31, 2024. Management does not expect ASU No. 2022-06 to have a material impact on the financial statements.
13. Subsequent Events
Management has evaluated the impact of all subsequent events on the Funds through the date the financial statements were issued and has determined that there were no subsequent events requiring adjustment or disclosure in the financial statements.
SPDR SERIES TRUST
REPORT OF INDEPENDENT REGISTERED PUBLIC
ACCOUNTING FIRM
To the Shareholders of SPDR Bloomberg Emerging Markets Local Bond ETF, SPDR Bloomberg International Corporate Bond ETF, SPDR Bloomberg International Treasury Bond ETF, SPDR Bloomberg Short Term International Treasury Bond ETF and SPDR FTSE International Government Inflation-Protected Bond ETF and the Board of Trustees of SPDR® Series Trust
Opinion on the Financial Statements
We have audited the accompanying statements of assets and liabilities of SPDR Bloomberg Emerging Markets Local Bond ETF, SPDR Bloomberg International Corporate Bond ETF, SPDR Bloomberg International Treasury Bond ETF, SPDR Bloomberg Short Term International Treasury Bond ETF and SPDR FTSE International Government Inflation-Protected Bond (collectively referred to as the “Funds”) (five of the series constituting SPDR® Series Trust (the “Trust”)), including the schedules of investments, as of December 31, 2023, and the related statements of operations and changes in net assets, and the financial highlights for each of the periods indicated in the table below and the related notes (collectively referred to as the “financial statements”). In our opinion, the financial statements present fairly, in all material respects, the financial position of each of the Funds (five of the series constituting SPDR® Series Trust) at December 31, 2023, the results of their operations for the year then ended, the changes in their net assets and financial highlights for each of the periods indicated in the table below, in conformity with U.S. generally accepted accounting principles.
| Individual series constituting SPDR Series Trust | Statement of operations | Statements of changes in net assets | Financial highlights |
SPDR Bloomberg Emerging Markets Local Bond ETF (formerly, SPDR Bloomberg Barclays Emerging Markets Local Bond ETF)
SPDR Bloomberg International Corporate Bond ETF (formerly, SPDR Bloomberg Barclays International Corporate Bond ETF)
SPDR Bloomberg International Treasury Bond ETF (formerly, SPDR Bloomberg Barclays International Treasury Bond ETF)
SPDR Bloomberg Short Term International Treasury Bond ETF (formerly, SPDR Bloomberg Barclays Short Term International Treasury Bond ETF)
SPDR FTSE International Government Inflation-Protected Bond | For the year ended
December 31, 2023 | For the each of
the two years in
the period ended
December 31, 2023
| For each of the two years
in the period ended
December 31, 2023,
the period from July 1,
2019 to December 31, 2019 and each
of the two years in the
period ended June 30, 2019 |
Basis for Opinion
These financial statements are the responsibility of the Trust's management. Our responsibility is to express an opinion on the Funds' financial statements based on our audits. We are a public accounting firm registered with the Public Company Accounting Oversight Board (United States) (“PCAOB”) and are required to be independent with respect to the Trust in accordance with the U.S. federal securities laws and the applicable rules and regulations of the Securities and Exchange Commission and the PCAOB.
We conducted our audits in accordance with the standards of the PCAOB. Those standards require that we plan and perform the audit to obtain reasonable assurance about whether the financial statements are free of material misstatement, whether due to error or fraud. The Trust is not required to have, nor were we engaged to perform, an audit of the Trust's internal control over financial reporting. As part of our audits we are required to obtain an understanding of internal control over financial reporting, but not for the purpose of expressing an opinion on the effectiveness of the Trust's internal control over financial reporting. Accordingly, we express no such opinion.
SPDR SERIES TRUST
REPORT OF INDEPENDENT REGISTERED PUBLIC
ACCOUNTING FIRM
Our audits included performing procedures to assess the risks of material misstatement of the financial statements, whether due to error or fraud, and performing procedures that respond to those risks. Such procedures included examining, on a test basis, evidence regarding the amounts and disclosures in the financial statements. Our procedures included confirmation of securities owned as of December 31, 2023, by correspondence with the custodian, brokers and others; when replies were not received from brokers and others, we performed other auditing procedures. Our audits also included evaluating the accounting principles used and significant estimates made by management, as well as evaluating the overall presentation of the financial statements. We believe that our audits provide a reasonable basis for our opinion.
We have served as the auditor of one or more State Street Global Advisors investment companies since 2000.
Boston, Massachusetts
February 23, 2024
SPDR SERIES TRUST
OTHER INFORMATION
December 31, 2023 (Unaudited)
Expense Example
As a shareholder of a Fund, you incur two types of costs: (1) transaction costs, including sales charges (loads), if applicable, on purchase payments, reinvested dividends, or other distributions and (2) ongoing costs, including advisory fees and other Fund expenses. This example is intended to help you understand your ongoing costs (in dollars) of investing in the Fund and to compare these costs with the ongoing costs of investing in other mutual funds. It is based on an investment of $1,000 made at the beginning of the period shown and held for the entire period from July 1, 2023 to December 31, 2023.
The table below illustrates your Fund’s cost in two ways:
Based on actual fund return ——This section helps you to estimate the actual expenses that you paid over the period. The “Ending Account Value” shown is derived from each Fund's actual return, and the third column shows the dollar amount that would have been paid by an investor who started with $1,000 in each Fund. You may use the information here, together with the amount you invested, to estimate the expenses that you paid over the period. To do so, simply divide your account value by $1,000 (for example, an $8,600 account value divided by $1,000 = 8.6), then multiply the result by the number given for the Fund under the heading “Expenses Paid During Period”.
Based on hypothetical 5% return ——This section is intended to help you compare your Fund’s costs with those of other mutual funds. It assumes that the Fund had a yearly return of 5% before expenses, but that the expense ratio is unchanged. In this case, because the return used is not the Fund’s actual return, the results do not apply to your investment. The example is useful in making comparisons because the U.S. Securities and Exchange Commission (the “SEC”) requires all mutual funds to calculate expenses based on a 5% return. You can assess your Fund’s costs by comparing this hypothetical example with the hypothetical examples that appear in shareholder reports of other funds.
Please note that the expenses shown in the table are meant to highlight your ongoing costs only and do not reflect any transaction costs, such as sales load charges (loads). Therefore, the hypothetical 5% return section of the table is useful in comparing ongoing costs only, and will not help you determine the relative total costs of owning different funds. In addition, if these transaction costs were included, your costs would have been higher.
| | | | Actual | | Hypothetical (assuming a 5%
return before expenses) |
| | Annualized
Expense Ratio | | Ending Account
Value | | Expenses Paid
During Period(a) | | Ending Account
Value | | Expenses Paid
During Period(a) |
SPDR Bloomberg Emerging Markets Local Bond ETF
| 0.30% | | $1,044.30 | | $1.55 | | $1,023.70 | | $1.53 |
SPDR Bloomberg International Corporate Bond ETF
| 0.50 | | 1,071.90 | | 2.61 | | 1,022.70 | | 2.55 |
SPDR Bloomberg International Treasury Bond ETF
| 0.35 | | 1,044.50 | | 1.80 | | 1,023.40 | | 1.79 |
SPDR Bloomberg Short Term International Treasury Bond ETF
| 0.35 | | 1,038.20 | | 1.80 | | 1,023.40 | | 1.79 |
SPDR FTSE International Government Inflation-Protected Bond ETF
| 0.50 | | 1,042.50 | | 2.57 | | 1,022.70 | | 2.55 |
| (a) | Expenses are equal to the Fund's annualized net expense ratio multiplied by the average account value of the period, multiplied by 184, then divided by 365. |
SPDR SERIES TRUST
OTHER INFORMATION (continued)
December 31, 2023 (Unaudited)
Tax Information
For federal income tax purposes, the following information is furnished with respect to the distributions of the Funds for their fiscal year ended December 31, 2023.
Qualified Interest Income
Each Fund reports the maximum amount allowable of its net taxable income and short-term capital gain as qualified interest income.
Foreign Tax Credit
The Funds have made an election under the Internal Revenue Code Section 853 to pass through foreign taxes paid by the Funds to its shareholders. For the year ended December 31, 2023, the total amount of foreign taxes that will be passed through are:
| | Amount |
SPDR Bloomberg Emerging Markets Local Bond ETF
| $3,086,978 |
The amount of foreign source income earned on the Fund during the year ended December 31, 2023 was as follows:
| | Amount |
SPDR Bloomberg Emerging Markets Local Bond ETF
| $113,057,352 |
SPDR Bloomberg International Treasury Bond ETF
| 20,259,602 |
Proxy Voting Policies and Procedures and Records
A description of the Trust's proxy voting policies and procedures that are used by the Funds’ investment adviser to vote proxies relating to the Funds’ portfolio of securities are available (i) without charge, upon request by calling 1-866-787-2257 (toll free) or (ii) on the SEC's website at www.sec.gov.
Information regarding how the investment adviser voted for the 12-month period ended June 30 is available by August 31 of each year by calling the same number, on the SEC’s website, at www.sec.gov and on the Funds’ website at https://www.ssga.com/spdrs.
Quarterly Portfolio Schedule
Following the Funds’ first and third fiscal quarter-ends, complete Schedules of Investments are filed with the SEC as exhibits on Form N-PORT, which can be found on the Funds' website at https://www.ssga.com/spdrs and on the SEC's website at www.sec.gov. The Funds’ Schedules of Investments are available upon request, without charge, by calling 1-866-787-2257 (toll free).
SPDR SERIES TRUST
OTHER INFORMATION (continued)
December 31, 2023 (Unaudited)
TRUSTEES AND OFFICERS INFORMATION
Name, Address
and Year of Birth | | Position(s)
with Funds | | Term of
Office and
Length of
Time Served | | Principal
Occupation(s)
During Past
5 Years | | Number of
Portfolios
in Fund
Complex
Overseen
by Trustee† | | Other
Directorships
Held by Trustee
During the
Past 5 Years |
| Trustees | | | | | | | | | | |
| Independent Trustees | | | | | | | | | | |
CARL G. VERBONCOEUR
c/o SPDR Series Trust
One Iron Street
Boston, MA 02210
1952 | | Independent
Trustee,
Chairman,
Trustee
Committee
Chair | | Term: Unlimited
Served: since
April 2010 | | Self-employed
consultant since 2009. | | 121 | | None |
DWIGHT D. CHURCHILL
c/o SPDR Series Trust
One Iron Street
Boston, MA 02210
1953 | | Independent
Trustee,
Audit
Committee
Chair | | Term: Unlimited
Served: since
April 2010 | | Self-employed
consultant since 2010;
CEO and President,
CFA Institute (June
2014 - January 2015). | | 121 | | Affiliated
Managers Group, Inc
(Director) (2010 - present). |
CLARE S. RICHER
c/o SPDR Series Trust
One Iron Street
Boston, MA 02210
1958 | | Independent
Trustee | | Term: Unlimited
Served: since
July 2018 | | Retired. Chief Financial
Officer, Putnam
Investments LLC
(December 2008 -
May 2017). | | 121 | | Principal Financial
Group (Director and Financial Committee Chair); (2020 - present)
Bain CapitalSpecialtyFinance
(Director) (2019 - present); University of Notre Dame (Trustee) (2015 - present). |
SANDRA G. SPONEM
c/o SPDR Series Trust
One Iron Street
Boston, MA 02210
1958 | | Independent
Trustee | | Term: Unlimited
Served: since
July 2018 | | Retired. Chief Financial
Officer, M.A.
Mortenson
Companies, Inc.(construction and real estate company)
(February 2007 -
April 2017). | | 121 | | Rydex Series Funds (52 portfolios), Rydex Dynamic Funds (8 portfolios) and Rydex Variable Trust (49 portfolios) (Trustee) (2016 - present); Guggenheim Strategy Funds Trust (3 portfolios), Guggenheim Funds Trust (18 portfolios), Guggenheim Taxable Municipal Bond & Investment Grade Debt Trust, Guggenheim Strategic Opportunities Fund, Guggenheim Variable Funds Trust (14 portfolios), and Transparent Value Trust (5 portfolios) (Trustee) (2019 - present); Guggenheim Active Allocation Fund (Trustee) (2021 - present); Fiduciary/Claymore Energy Infrastructure Fund (Trustee) (2019 - 2022); Guggenheim Enhanced Equity Income Fund and Guggenheim Credit Allocation Fund (Trustee) (2019 - 2021); and Guggenheim Energy & Income Fund (Trustee) (2015 - 2023). |
CAROLYN M. CLANCY
c/o SPDR Index Shares Funds
One Iron Street
Boston, MA 02210
1960 | | Independent
Trustee | | Term: Unlimited
Served: since
October 2022 | | Retired.
Executive Vice President,
Head of Strategy,
Analytics and Market Readiness,
Fidelity Investments
(April 2020 - June 2021);
Executive Vice President,
Head of Broker Dealer Business,
Fidelity Investments
(July 2017 - March 2020). | | 121 | | Assumption University (Trustee)
(2011 - 2021) and (2022 - present); Big Sister Association of Greater Boston (Director) (2016 - 2023). |
KRISTI L. ROWSELL
c/o SPDR Index Shares Funds
One Iron Street
Boston, MA 02210
1966 | | Independent
Trustee | | Term: Unlimited
Served: since
October 2022 | | Partner and President,
Harris Associates
(2010 - 2021). | | 121 | | Harris Associates Investment Trust (8 portfolios) (Trustee) (2010 - present);
Board of Governors,
Investment Company Institute
(Member) (2018 - Present);
Habitat for Humanity Chicago (Director) (2015 - present). |
SPDR SERIES TRUST
OTHER INFORMATION (continued)
December 31, 2023 (Unaudited)
Name, Address
and Year of Birth | | Position(s)
with Funds | | Term of
Office and
Length of
Time Served | | Principal
Occupation(s)
During Past
5 Years | | Number of
Portfolios
in Fund
Complex
Overseen
by Trustee† | | Other
Directorships
Held by Trustee
During the
Past 5 Years |
| Interested Trustee | | | | | | | | | | |
JAMES E. ROSS*
c/o SPDR Series Trust
One Iron Street
Boston, MA 02210
1965 | | Interested
Trustee | | Term: Unlimited
Served as
Trustee: since
April 2010 | | President, Winnisquam Capital LLC (December 2022 - present); Non-Executive Chairman,
Fusion Acquisition Corp II. (February
2020 - Present);
Non-Executive Chairman,
Fusion Acquisition Corp.
(June 2020 - September 2021);
Retired Chairman and Director,
SSGA Funds Management, Inc.
(2005 - March 2020); Retired
Executive Vice President, State
Street Global Advisors (2012 -
March 2020); Retired Chief
Executive Officer and Manager,
State Street Global Advisors
Funds Distributors, LLC (May
2017 - March 2020); Director,
State Street Global Markets,
LLC (2013 - April 2017);
President, SSGA Funds
Management, Inc. (2005 - 2012);
Principal, State Street
Global Advisors (2000 - 2005). | | 132 | | Investment Managers Series Trust (50 portfolios) (2022 - present); The Select Sector SPDR Trust (11 Portfolios) (2005 - Present); SSGA SPDRETFs Europe I PLC (Director)
(2016 - 2020); SSGA SPDR ETFs Europe II PLC (Director) (2016 - 2020); State Street Navigator Securities Lending Trust (2016 - 2020); SSGAFunds (2014 - 2020); State Street Institutional Investment Trust (2007 - 2020); Street Master Funds (2007 - 2020); Elfun Funds (2016 - 2018) |
GUNJAN CHAUHAN**
c/o SPDR Index Shares Funds
One Iron Street
Boston, MA 02210
1982 | | Interested
Trustee | | Term: Unlimited
Served: Since
October 2022 | | Senior Managing Director,
State Street Global Advisors
(April 2018 - Present);
Managing Director,
State Street Global Advisors
(June 2015 - March 2018). | | 121 | | State Street ICAV (Director) (2018 - 2022). |
| † For the purpose of determining the number of portfolios overseen by the Trustees, “Fund Complex” comprises registered investment companies for which SSGA Funds Management, Inc. serves as investment adviser, which includes series of SPDR Series Trust, SPDR Index Shares Funds and SSGA Active Trust. |
| * Mr. Ross is an Interested Trustee because of his ownership interest in an affiliate of the Adviser. Mr. Ross previously served as an Interested Trustee from November 2005 to December 2009. |
| ** Ms. Chauhan is an Interested Trustee because of her position with an affiliate of the Adviser. |
SPDR SERIES TRUST
OTHER INFORMATION (continued)
December 31, 2023 (Unaudited)
Name, Address
and Year of Birth | | Position(s)
with Funds | | Term of
Office and
Length of
Time Served | | Principal Occupation(s) During the Past 5 Years |
| Officers | | | | | | |
ANN M. CARPENTER
SSGA Funds Management Inc.
One Iron Street
Botson,MA 02210
1966 | | President
and Principal
Executive
Officer;
Deputy
Treasurer | | Term: Unlimited
Served: since May 2023
(with respect
to President
and Principal
Executive Officer);
Term: Unlimited
Served: since
February 2016
(with respect
to Deputy Treasurer) | | Chief Operating Officer, SSGA Funds Management, Inc. (April 2005 - present)*; Managing Direct Street Global Advisors (April 2005 - present).* |
BRUCE S. ROSENBERG
SSGA Funds Management, Inc.
One Iron Street
Boston, MA 02210
1961 | | Treasurer
and Principal
Financial Officer | | Term: Unlimited
Served: since
February 2016 | | Managing Director, State Street Global Advisors and SSGA Funds Management, Inc. (July 2015 - present); Director, Credit Suisse (April 2008 - July 2015). |
CHAD C. HALLETT
SSGA Funds Management, Inc.
One Iron Street
Boston, MA 02210
1969 | | Deputy
Treasurer | | Term: Unlimited
Served: since
February 2016 | | Vice President, State Street Global Advisors and SSGA Funds Management, Inc. (November 2014 - present). |
ANDREW J. DELORME
SSGA Funds Management, Inc.
One Iron Street
1975 | | Chief Legal Officer | | Term: Unlimited
Served: since
February 2024 | | Managing Director and Managing Counsel, State Street Global Advisors (March 2023 - present); Counsel, K&L Gates (February 2021 - March 2023); Vice President and Senior Counsel, State Street Global Advisors (August 2014 - February 2021). |
DAVID URMAN
SSGA Funds Management, Inc
One Iron Street
Boston, MA 02210
1985 | | Secretary | | Term: Unlimited
Served: since
August 2019 | | Vice President and Senior Counsel, State Street Global Advisors (April 2019 - present); Vice President and Counsel, State Street Global Advisors (August 2015 - April 2019); Associate, Ropes & Gray LLP (November 2012 - August 2015). |
DAVID BARR
SSGA Funds Management, Inc
One Iron Street
Boston, MA 02210
1974 | | Assistant
Secretary | | Term: Unlimited
Served: since
November 2020 | | Vice President and Senior Counsel, State Street Global Advisors (October 2019 - present); Vice President at Eaton Vance Corp. (October 2010 - October 2019). |
E. GERARD MAIORANA, JR.
SSGA Funds Management, Inc.
One Iron Street
Boston, MA 02210
1971 | | Assistant
Secretary | | Term: Unlimited
Served: since May 2023 | | Assistant Vice President, State Street Global Advisors (July 2014 - present). |
DARLENE ANDERSON-VASQUEZ
SSGA Funds Management, Inc.
One Iron Street
Boston, MA 02210
1968 | | Deputy
Treasurer | | Term: Unlimited
Served: since
November 2016 | | Managing Director, State Street Global Advisors and SSGA Funds Management, Inc. (May 2016 - present); Senior Vice President, John Hancock Investments (September 2007 - May 2016). |
ARTHUR A. JENSEN
SSGA Funds Management, Inc.
1600 Summer Street
Stamford, CT 06905
1966 | | Deputy
Treasurer | | Term: Unlimited
Served: Since
August 2017 | | Vice President, State Street Global Advisors and SSGA Funds Management, Inc. (July 2016 - present); Mutual Funds Controller, GE Asset Management Incorporated (April 2011 - July 2016). |
SPDR SERIES TRUST
OTHER INFORMATION (continued)
December 31, 2023 (Unaudited)
Name, Address
and Year of Birth | | Position(s)
with Funds | | Term of
Office and
Length of
Time Served | | Principal Occupation(s) During the Past 5 Years |
DAVID LANCASTER
SSGA Funds Management, Inc.
One Iron Street
Boston, MA 02210
1971 | | Assistant
Treasurer | | Term: Unlimited
Served: since
November 2020 | | Vice President, State Street Global Advisors and SSGA Funds Management, Inc. (July 2017 - present); Assistant Vice President, State Street Bank and Trust Company (November 2011 - July 2017).* |
JOHN BETTENCOURT
SSGA Funds Management, Inc.
One Iron Street
Boston, MA 02210
1976 | | Assistant
Treasurer | | Term: Unlimited
Served: since
May 2022 | | Vice President, State Street Global Advisors and SSGA Funds Management Inc. (March 2020 - present); Assistant Vice President, State Street Global Advisors (June 2007 - March 2020). |
VEDRAN VUKOVIC
SSGA Funds Management, Inc. One Iron Street
Boston, MA 02210
1985 | | Assistant Treasurer | | Term: Unlimited
Served: since
February 2024 | | Vice President, State Street Global Advisors (2023 - present); Assistant Vice President, Brown Brothers Harriman & Co. (2011 - 2023). |
BRIAN HARRIS
SSGA Funds Management, Inc.
One Iron Street
Boston, MA 02210
1973 | | Chief Compliance
Officer; Anti-Money
Laundering
Officer; Code of
Ethics
Compliance
Officer | | Term: Unlimited
Served: since
November
2013 | | Managing Director, State Street Global Advisors and SSGA Funds Management, Inc. (June 2013 - present).* |
| * Served in various capacities and/or with various affiliated entities during noted time period. |
| The Statement of Additional Information (SAI) includes additional information about the Funds' trustees and is available, without charge, upon request and by calling 1-866-787-2257. |
[This Page Intentionally Left Blank]
Trustees
Gunjan Chauhan, Interested Trustee
Dwight D. Churchill
Carolyn M. Clancy
Clare S. Richer
James E. Ross, Interested Non-management Trustee
Kristi L. Rowsell
Sandra G. Sponem
Carl G. Verboncoeur, Chairman
Investment Manager and Administrator
SSGA Funds Management, Inc.
One Iron Street
Boston, MA 02210
Distributor
State Street Global Advisors Funds Distributors, LLC
One Iron Street
Boston, MA 02210
Custodian, Sub-Administrator
and Transfer Agent
State Street Bank and Trust Company
One Congress Street
Boston, MA 02114
Legal Counsel
Morgan, Lewis & Bockius LLP
1111 Pennsylvania Avenue, NW
Washington, DC 20004
Independent Registered Public Accounting Firm
Ernst & Young LLP
200 Clarendon Street
Boston, MA 02116
The information contained in this report is intended for the general information of shareholders of the Trust. This report is not authorized for distribution to prospective investors unless preceded or accompanied by a current Trust prospectus which contains important information concerning the Trust. You may obtain a current prospectus and SAI from the Distributor by calling 1-866-787-2257 or visiting https://www.ssga.com/spdrs. Please read the prospectus carefully before you invest.
SPDR® Series Trust - Fixed Income Funds
For more complete information, please call 1.866.787.2257 or visit https://www.ssga.com/spdrs today.
State Street Global Advisors
One Iron Street
Boston, MA 02210
ETFs trade like stocks, are subject to investment risk, fluctuate in market value and may trade at prices above or below the ETFs net asset value. Brokerage commissions and ETF expenses will reduce returns.
Bonds generally present less short-term risk and volatility than stocks, but contain interest rate risk (as interest rates rise bond prices usually fall); issuer default risk; issuer credit risk; liquidity risk; and inflation risk. These effects are usually pronounced for longer-term securities. Any fixed income security sold or redeemed prior to maturity may be subject to a substantial gain or loss.
BLOOMBERG®, a trademark and service mark of Bloomberg Finance L.P. and its affiliates, has been licensed for use in connection with the listing and trading of the SPDR Bloomberg ETFs.
London Stock Exchange Group plc and its group undertakings (collectively, the "LSE Group"). © LSE Group 2020. FTSE Russell is a trading name of certain of the LSE Group companies. "FTSE®" is a trade mark(s) of
the relevant LSE Group companies and is/are used by any other LSE Group company under license. All rights in the FTSE Russell indexes or data vest in the relevant LSE Group company which owns the index or the data. Neither LSE Group nor its licensors accept any liability for any errors or omissions in the indexes or data and no party may rely on any indexes or data contained in this communication. No further distribution of data from the LSE Group is permitted without the relevant LSE Group company's express written consent. The LSE Group does not promote, sponsor or endorse the content of this communication.
Distributor: State Street Global Advisors Funds Distributors, LLC, member FINRA, SIPC, an indirect wholly owned subsidiary of State Street Corporation. References to State Street may include State Street Corporation and its affiliates. Certain State Street affiliates provide services and receive fees from the SPDR ETFs.
Before investing, consider a Fund's investment objectives, risks, charges and expenses. To obtain a prospectus or summary prospectus which contains this and other information, call 1.866.787.2257 or visit www.sssga.com/spdrs. Read it carefully.
Not FDIC Insured. No Bank Guarantee. May Lose Value.
The information contained in this report is intended for the general information of shareholders of the Trust. This report is not authorized for distribution to prospective investors unless preceded or accompanied by a current Trust prospectus which contains important information concerning the Trust. You may obtain a current prospectus and SAI from the Distributor by calling 1-866-787-2257 or visiting https://www.ssga.com/spdrs. Please read the prospectus carefully before you invest.
© 2022 State Street Corporation - All Rights Reserved
SPDRSERTRYEAR
Item 2. Code of Ethics.
As of the end of the period covered by this report, the registrant has adopted a code of ethics that applies to the registrant’s principal executive officer, principal financial officer, principal accounting officer or controller, or persons performing similar functions, regardless of whether these individuals are employed by the registrant or a third party (the “Code of Ethics”). During the period covered by this report, no substantive amendments were made to the Code of Ethics. During the period covered by this report, the registrant did not grant any waivers, including any implicit waivers, from any provision of the Code of Ethics.
The Code of Ethics is attached hereto as Exhibit 13(a)(1).
Item 3. Audit Committee Financial Expert.
| (a)(1) | The Board of Trustees of the registrant has determined that the registrant has five Board members serving on the Audit Committee that possess the attributes identified in Instructions 2(b) of Item 3 to Form N-CSR to qualify as an “audit committee financial expert.” |
| (2) | Dwight Churchill, Clare Richer, Kristi Rowsell, Sandra Sponem and Carl Verboncoeur are the registrant’s audit committee financial experts. The Board also determined that each of the foregoing persons are not “interested person(s)” of the registrant as that term is defined in Section 2(a)(19) of the Investment Company Act of 1940, as amended (the “1940 Act”). |
Item 4. Principal Accountant Fees and Services.
For the fiscal years ending December 31, 2023 and December 31, 2022, the aggregate audit fees billed for professional services rendered by the principal accountant were $123,675 and $123,675, respectively. Audit fees include the performance of the annual audits, security counts performed during the course of the period for each series of the registrant and routine regulatory filings (one for each SEC registrant).
For the fiscal years ending December 31, 2023 and December 31, 2022, the principal accountant did not bill the registrant any fees for assurances and related services that are reasonably related to the performance of the audit of the registrant’s financial statements and are not reported under paragraph (a) of this Item.
For the fiscal years ending December 31, 2023 and December 31, 2022 the aggregate tax fees billed for professional services rendered by E&Y for the review of year-end distribution requirements were $13,890 and $13,890, respectively.
For the fiscal years ended December 31, 2023 and December 31, 2022, there were no fees billed for professional services rendered by E&Y for products and services provided by E&Y to the Trust, other than the services reported in paragraphs (a) through (c).
For the fiscal years ended December 31, 2023 and December 31, 2022, the aggregate fees for professional services rendered by E&Y for products and services provided by E&Y to the Adviser and any entity controlling, controlled by, or under common control with the Adviser that provides ongoing services to the Trust that (i) relate directly to the operations and financial reporting of the Trust and (ii) were pre-approved by the Audit Committee were approximately $9,540,002 and $ 9,327,125, respectively.
| (e)(1) | Audit Committee Pre-Approval Policies and Procedures. |
The registrant’s Audit Committee Charter states the following with respect to pre-approval procedures:
Before the independent auditors are engaged by the Trust to render audit, audit-related or permissible non-audit services, either:
| | (a) | The Audit Committee shall pre-approve all audit, audit-related and permissible non-audit services provided to the Trust. The Audit Committee may delegate to one or more of its members the authority to grant pre-approvals. Any decision of any member to whom authority is delegated under this section shall be presented to the full Audit Committee at its next regularly scheduled meeting; |
or
| | (b) | The engagement to render the audit, audit-related or permissible non-audit service is entered into pursuant to pre-approval policies and procedures established by the Audit Committee. Any such policies and procedures must (1) be detailed as to the particular service and (2) not involve any delegation of the Audit Committee’s responsibilities to the investment adviser. The Audit Committee must be informed of each service entered into pursuant to the policies and procedures. A copy of any such policies and procedures shall be attached as an exhibit to the Audit Committee Charter. |
| | (c) | Pre-Approval for a service provided to the Trust other than audit or audit-related services is not required if: (1) the aggregate amount of all such permissible non-audit services provided to the Trust constitutes not more than five percent (5%) of the total amount of revenues paid by the Trust to the independent auditors during the fiscal year in which the permissible non-audit services are provided; (2) such services were not recognized by the Trust at the time of the engagement to be permissible non-audit services; and (3) such services are promptly brought to the attention of the Audit Committee and are approved by the Audit Committee or by one or more members of the Audit Committee to whom authority to grant such approvals has been delegated by the Audit Committee prior to the completion of the audit. |
| | (d) | The Audit Committee shall pre-approve any permissible non-audit services proposed to be provided by the independent auditors to (a) the investment adviser and (b) any entity controlling, controlled by, or under common control with the investment adviser that provides ongoing services to the Trust, if the independent auditors’ engagement with the investment adviser or any such control persons relates directly to the operations and financial reporting of the Trust. It shall be the responsibility of the independent auditors to notify the Audit Committee of any permissible non-audit services that need to be pre-approved. |
Notwithstanding the above, Pre-Approval for any permissible non-audit services under this Sub-section is not required if: (1) the aggregate amount of all such permissible non-audit services constitutes not more than five percent (5%) of the total amount of revenues paid to the independent auditors by the Trust and any other entity that has its services approved under this Section (i.e., the investment adviser or any control person) during the fiscal year in which the permissible non-audit services are provided; (2) such services were not recognized by the Trust at the time of the engagement to be permissible non-audit services; and (3) such services are promptly brought to the attention of the Audit Committee and are approved by the Audit Committee or by one or more members of the Audit Committee to whom authority to grant such approvals has been delegated by the Audit Committee prior to the completion of the audit.
| (e)(2) | Percentage of Services. |
One hundred percent of the services described in each of paragraphs (b) through (d) of this Item were approved by the registrant’s Audit Committee pursuant to paragraph (c)(7)(i)(C) of Rule 2-01 of Regulation S-X.
| (g) | The aggregate non-audit fees billed for by the registrant’s accountant for services rendered to the registrant, and rendered to the registrant’s investment adviser (not including any sub-adviser whose role is primarily portfolio management and is subcontracted with or overseen by another investment adviser), and any entity controlling, controlled by, or under common control with the adviser were as follows: |
| | | | | | | | |
| | | FY 2023
(in millions) | | | FY 2022
(in millions) | |
Non audit services billed to: | | | | | | | | |
Registrant: | | | See Item 4(c) | | | | See Item 4(c) | |
Investment Adviser: | | | — | | | | — | |
| | |
Other entities in the Investment Company
Complex (1)(2): | | | | | | | | |
Audit Related Fees | | $ | 17.9 | | | $ | 18.1 | |
Tax Fees | | $ | 5.6 | | | $ | 5.4 | |
All Other Fees | | $ | 15.5 | | | $ | 14.5 | |
| (1) | Information is for the calendar years 2023 and 2022, respectively. |
| (2) | Services under the caption Audit-Related Fees consisted principally of reports on the processing of transactions by servicing organizations, audits of employee benefit plan, non-statutory audits and due diligence procedures. Services under the caption Tax Fees consisted principally of expatriate, compliance and corporate tax advisory services. Services under the caption All Other Fees primarily related to statutory and financial statement audits and the requirement to opine on the design and operating effectiveness of internal control over financial reporting. |
| (h) | The registrant’s principal accountant notified the registrant’s Audit Committee of all non-audit services that were rendered by the principal accountant to the Adviser and any entity controlling, controlled by, or under common control with the Adviser that provides services to the registrant, which services were not required to be pre-approved pursuant to paragraph (c)(7)(ii) of Rule 2-01 of Regulation S-X, allowing the registrant’s Audit Committee to consider whether such services were compatible with maintaining the principal accountant’s independence. |
Item 5. Audit Committees of Listed Registrants.
The registrant has an audit committee which was established by the Board of Trustees of the Trust in accordance with Section 3(a)(58)(A) of the Securities Exchange Act of 1934, as amended (the “1934 Act”). The members of the registrant’s Audit Committee are Dwight Churchill, Carolyn Clancy, Clare Richer, Kristi Rowsell, Sandra Sponem and Carl Verboncoeur.
Item 6. Investments.
| (a) | Schedules of Investments are included as part of the report to shareholders filed under Item 1 of this Form N-CSR. |
| (b) | Not applicable to the registrant. |
Item 7. Disclosure of Proxy Voting Policies and Procedures for Closed-End Management Investment Companies.
Not applicable to the registrant.
Item 8. Portfolio Managers of Closed-End Management Investment Companies.
Not applicable to the registrant.
Item 9. Purchases of Equity Securities by Closed-End Management Investment Company and Affiliated Purchasers.
Not applicable to the registrant.
Item 10. Submission of Matters to a Vote of Security Holders.
The registrant has not adopted any material changes to the procedures by which shareholders may recommend nominees to the registrant’s Board.
Item 11. Controls and Procedures.
| (a) | Within 90 days of the filing date of this Form N-CSR, Ann M. Carpenter, the registrant’s President and Principal Executive Officer, and Bruce S. Rosenberg, the registrant’s Treasurer and Principal Financial Officer, reviewed the registrant’s disclosure controls and procedures (as defined in Rule 30a-3(c) under the 1940 Act) and evaluated their effectiveness. Based on their review, Ms. Carpenter and Mr. Rosenberg determined that the disclosure controls and procedures adequately ensure that information required to be disclosed by the registrant in its periodic reports is recorded, processed, summarized and reported within the time periods required by the U.S. Securities and Exchange Commission. |
| (b) | There were no changes in the registrant’s internal control over financial reporting (as defined in Rule 30a-3(d) under the 1940 Act) that occurred during the period covered by this report that have materially affected, or are reasonably likely to materially affect, the registrant’s internal control over financial reporting. |
Item 12. Disclosure of Securities Lending Activities for Closed-End Management Investment Companies.
| (a) | Not applicable to the registrant. |
| (b) | Not applicable to the registrant. |
Item 13. Exhibits.
| (a)(3) | Not applicable to the registrant. |
SIGNATURES
Pursuant to the requirements of the Securities Exchange Act of 1934, as amended, and the Investment Company Act of 1940, as amended, the registrant has duly caused this report to be signed on its behalf by the undersigned, thereunto duly authorized.
SPDR® Series Trust
| | |
| By: | | /s/ Ann M. Carpenter |
| | Ann M. Carpenter |
| | President and Principal Executive Officer |
| |
| Date: | | March 7, 2024 |
Pursuant to the requirements of the Securities Exchange Act of 1934, as amended, and the Investment Company Act of 1940, as amended, this report has been signed below by the following persons on behalf of the registrant and in the capacities and on the dates indicated.
| | |
| By: | | /s/ Ann M. Carpenter |
| | Ann M. Carpenter |
| | President and Principal Executive Officer |
| |
| Date: | | March 7, 2024 |
| | |
| By: | | /s/ Bruce S. Rosenberg |
| | Bruce S. Rosenberg |
| | Treasurer and Principal Financial Officer |
| |
| Date: | | March 7, 2024 |