
| VIA EDGAR | August 7, 2012 |
Ms. Tia L. Jenkins
Senior Assistant Chief Accountant
Office of Beverages, Apparel, and Mining
Division of Corporation Finance
Securities and Exchange Commission
100 F Street NE
Washington, D.C. 20549
United States of America
| Re : | Comment Letter – AngloGold Ashanti Limited Annual Report on Form 20-F for the Fiscal Year Ended December 31, 2011 - File No. 001-14846 |
Response to the Securities and Exchange Commission comment letter dated July 26, 2012
Dear Ms. Jenkins,
We, AngloGold Ashanti Limited, a company incorporated under the laws of the Republic of South Africa (“AngloGold Ashanti”), are pleased to respond to the comments received from the Staff of the Securities and Exchange Commission (the “SEC”) in its comment letter dated July 26, 2012, with respect to our Annual Report on Form 20-F for the fiscal year ended December 31, 2011 (the “20-F”).
To facilitate the Staff’s review, we have reproduced the captions and numbered comments from the Staff’s comment letter in bold text below and have provided our responses immediately following the numbered comments.
As requested by the Staff, we acknowledge that:
| · | AngloGold Ashanti is responsible for the adequacy and accuracy of the disclosure in its 20-F; |
| · | Staff comments or changes to disclosure in response to Staff comments do not foreclose the SEC from taking any action with respect to the 20-F; and |
| · | AngloGold Ashanti may not assert Staff comments as a defense in any proceeding initiated by the SEC or any person under the federal securities laws of the United States. |
| Directors: | T T Mboweni (Chairman) \ M Cutifani (Australian) (Chief Executive Officer) \ FB Arisman (American) \ R Gasant \ NP January-Bardill MJ Kirkwood (British) \ WA Nairn \ Prof LW Nkuhlu \ F Ohene-Kena (Ghanaian) \ SM Pityana \ RJ Ruston (Australian) \ S Venkatakrishnan (British) |
Company Secretary: L Eatwell |
Financial Statements
Report of the Independent Registered Accounting Firm, page 253
1. We note that the reports of your independent registered public accounting firms are not signed. Please confirm that (i) you had obtained manually signed copies of such reports when your Form 10-K was filed and (ii) amend to file signed reports in accordance with Item 302 of Regulation S-T.
AngloGold Ashanti can confirm that it obtained the manually signed copies of its independent registered public accounting firms’ reports when its 20-F was filed. Copies of these reports are included in Appendix I to this letter.
We believe that the “signature” required by Item 302(a) has been provided in the 20-F as filed. Item 302(a) provides, in part, “When used in connection with an electronic filing, the term ‘signature’ means an electronic entry in the form of a magnetic impulse or other form of computer data compilation of any letters or series of letters or characters comprising a name, executed, adopted or authorized as a signature.” The signature for the respective reports of Ernst & Young Inc. and KPMG Inc. included in the electronic filing of our 20-F each constituted a series of letters comprising the names of Ernst & Young Inc. and KPMG Inc. Ernst & Young Inc. and KPMG Inc. have confirmed that they authorized the filing of the reports included in the 20-F. Therefore, the electronic signatures were authorized by Ernst & Young Inc. and KPMG Inc. Thus, the signature requirements of Item 302(a) were met. For these reasons, we do not believe an amendment to the 20-F is required.
We acknowledge that the more common method of complying with the requirements of Item 302(a) employs an “/s/” before the printed name to connote authorization of the signature and will use this method in all future filings that include reports of independent registered public accounting firms.
Notes to Financial Statements
Note 5 – Costs and Expenses, page F-22
2. Please provide us additional detail regarding your basis for the use in 2011 of a $1,530 per ounce static estimated long-term gold price (from $1,113 in 2010) to estimate future revenues as part of your impairment analysis. In your response, ensure you (i) discuss why you believe such a price would be appropriate for the next several decades, and (ii) provide us with a sensitivity analysis of the impact of a decrease in the price assumption (e.g. 10%) to your 2011 impairment analysis.
Response to question 2(i):
We have applied our business planning assumptions in the annual impairment analysis of goodwill and other long-lived assets. These assumptions are used by the Chief Operating Decision Maker (‘CODM’) in making decisions, including but not limited to, operating plans with respect to developing and producing minerals, portfolio analysis, capital investments / disinvestments and strategic reviews. The assumptions are reviewed and updated at least annually.
AngloGold Ashanti’s long term real gold-price assumption of US$1,530 per ounce represented the CODM’s best estimate of the future long term price of gold and formed the basis of its business planning. In arriving at the estimated long term gold price, the CODM considered all available information as outlined below, including current prices as well as historical and forward pricing information and data. The gold prices underlying the business plans are based on a range of economic and market conditions expected to exist over the remaining useful lives of mines. The CODM considered, amongst other things, the following factors:
a) Relevant literature ASC 930-360 – Property, plant and equipment – Extractive Activities - Mining
In accordance with ASC 930-360, our determination of the gold price assumptions to be used included a detailed consideration of the historic, current and future prices of gold and other data that a market participant would consider. ASC 930-360-35-2 states “Generally, an entity shall consider all available information including current prices, historical averages, and forward pricing curves. … It generally would be inappropriate for an entity to use a single factor, such as the current price or a historical average, as a surrogate for estimating future prices without considering other information that a market participant would consider”.
Relevant guidance in ASC 930-805-30-2 states that: “an entity shall include the effects of anticipated fluctuations in the future market price of minerals in determining the fair value of mining assets in a purchase price allocation in a manner that is consistent with the expectations of marketplace participants. Generally, an entity should consider all available information including current prices, historical averages, and forward pricing curves. Those marketplace assumptions typically should be consistent with the acquiring enterprise’s operating plans with respect to developing and producing minerals. It generally would be inappropriate for an entity to use a single factor, such as the current price or a historical average, as a surrogate for estimating future prices without considering other information that a market participant would consider.”
b) Historical, current and forward pricing of gold
We believe that gold is unique in that it trades as a precious metal, commodity, currency, investment, hedge against inflation and as a safe haven asset. These characteristics have had a considerable impact on gold prices in recent years. In 2009 the gold price averaged US$974/oz, in 2010 it averaged US$1,227/oz and in 2011 it averaged US$1,572/oz.
We considered the historical rally in gold prices and then compared the current spot price, forward pricing curve and the Reuters market consensus curve to our business planning assumptions. The resultant comparison is shown below and demonstrates the correlation between these price lines (at nominal values), noting that the business planning assumptions are below the Reuters market consensus forecast.

nominal gold forecasts $2,400 $2,300 $2,200 $2,100 $2,000 $1,900 $1,800 $1,700 $1,600 $1,500 2012 2013 2014 2015 2016 2017 2018 2019 2020 Anglogold Ashanti Business Plan Market Gold Forward Curve Reuters Market Consesus Forecast
c) Portfolio diversification and increased investment in gold
In contrast to the perception of gold that prevailed in the last decade, gold today is increasingly seen as a store of value, as evidenced by the investment in Exchange Traded Funds (“ETFs”) which have significantly grown and held their volumes despite short term volatility in prices. In addition, several investment fund managers, financial institutions and pension funds have changed their investment policies to include exposure to gold within their portfolios. ETFs in particular have helped to facilitate a relatively simple and reliable vehicle for investors to participate in gold as an asset class. Since the effective trading of the first gold ETF in 2003, the amount of gold contained within ETFs has risen to 78 million ounces. As at December 31, 2011 combined ETFs ranked sixth behind official disclosed sector holdings of the United States (267 million ounces), Germany (109 million ounces), the IMF (91 million ounces), Italy (79 million ounces) and France (78 million ounces). Whilst in theory this gold can return to the market, we believe that gold tends to be used as an “insurance policy” within a diversified portfolio so is likely to remain within the portfolio, regardless of global economic conditions and outlook. We believe that the more important driver is gold’s accessibility to a wide range of investors.
On balance, we believe that gold plays an ever increasing role as part of a diversified investment portfolio to global investors, thus allowing the volume of gold within ETFs to grow over the longer term. For example, HSBC Global Research in its report “Gold Outlook” (“HSBC Report”) notes that “Although jewellery still accounts for about 50% of physical bullion consumption, investment demand is the main driver of gold pricing. The gold exchange-traded funds (ETFs) account for the bulk of investment demand and hold huge amounts of bullion”.1 The HSBC Report goes on to add that “The 10 largest ETFs hold … equivalent to more than 80% of annual global mine production. Modest amounts of liquidation earlier this year coincided with temporary price weakness and raised concerns that investors may begin to liquidate gold ETF holdings. Rather than retreating, however, it appears that investors were merely shifting between gold investment products. Growth in investor demand also is evident from the rise in net long speculative positions on the Comex. At about 21moz as of this writing, net long positions were c10moz below all-time highs. This argues against the notion that at record-high prices, the gold market has become overbought.”2
d) Favorable macro-environment
Gold is a safe-haven asset and is used as a hedge against inflation. When we formulated our business planning assumptions in 2011, we noted the far reaching impact created by the 2008/2009 global financial crisis. We took into account the multiple government deficits running into trillions of dollars and the need for governments to resort to major bail-outs in the medium to long term, and we took the view that the crisis was far from over. We concluded that these factors would likely increase global uncertainty in the medium to long term and cause currencies to re-base downwards in the long term, which would support the gold price. Furthermore, we believe that when eventually the true long term cost of quantitative easing (i.e. inflation) sets in, gold prices could rise to even higher levels. We note that at the time of responding to this letter, the economic crisis in the Eurozone continues, with a number of countries seeking bail-outs, various sovereign ratings being reduced and credit ratings of financial institutions being down-graded. We believe that together, these factors point to a favorable gold price environment for the foreseeable future.
1 SOURCE: “Gold Outlook – Lifting our forecasts again; USD 2,025/oz for 2012” – HSBC Global Research – September 14, 2011, page 4 (hereinafter “HSBC Report”).
2 SOURCE: HSBC Report, pages 4 and 5.
The HSBC Report notes that “Gold is benefiting from growing investor anxiety about ineffective government policies, unsustainable government debt levels, and the potential for a further global slowdown. As central bankers and other policymakers run out of options, investor disquiet is increasing and paper markets look increasingly uncertain. The possibility that government remedies for debt problems will indirectly lead to higher gold prices through inflation is also encouraging investment in gold. The paucity of suitable alternative safe havens, following recent interventions in the currency markets, has further elevated gold’s status.”3
Bank of America Merrill Lynch in its report “Global Energy Weekly” (the “BoAML Report”) notes that “With inflation expectations anchored by high energy prices, real interest rates should remain low and provide support to gold prices going forward.”4
e) Gold mine production unlikely to be able to meet increases in gold demand
Gold grades contained in ore bodies continue to decline as ore bodies mature. This is evidenced in regions like Southern Africa and the Americas, which historically have accounted for a significant proportion of global production. New higher grade deposits are increasingly harder to find, and if found come at a significantly higher cost of exploration and development. The Standard Chartered Bank in its report “In gold we trust” (the “SCB Report”) points out that “…we go beyond this to examine future mine supply which we regard as an equally important driver. In our study of 375 global gold mines and projects we note that after 10 years of a bull market, the gold mining industry has done little to bring on new supply.”5
Furthermore, the volume of gold currently mined is falling behind the growth in nominal global GDP. In the last ten years, the industry has been unable to lift the volume of gold mined by any significant level, so this trend is unlikely to change in the foreseeable future. In summary, the role that gold plays as a store of value is undiminished, yet its portion of global value is reducing. In our view, this supports an assumption that the gold price will rise.
3 SOURCE: HSBC Report, page 1.
4 SOURCE: “Global Energy Weekly - Downgrading oil to AA+, upgrading gold to AAAA” – Bank of America Merrill Lynch, August 9, 2011, page 7 (hereinafter “BoAML Report”).
5 SOURCE: “In gold we trust – A definitive study of gold mine production from 2011 to 2015”- Standard Chartered Bank, June 14, 2011, page 1 (hereinafter “SCB Report”).
f) Total cost of producing gold continues to increase
The factors that contribute to a rise in gold prices also historically tend to contribute to an increase in the cost of developing and producing gold. These include US dollar denominated inputs and capital goods, fuel, energy and labor, the latter often being influenced by inflation. Given trends over the last decade, we do not anticipate that these cost pressures will ease, and we therefore believe that marginal pricing should provide continued support for the gold price. The SCB Report points out that “Our IRR analysis of the major gold projects under construction globally reveals that the long term gold price will need to be US$1,400 per ounce to justify capital cost. For Greenfield projects the gold price would need to be closer to US$2,000 per ounce to generate the minimum required return. Escalating costs of building gold mines could result in delays at many projects.”6
g) Change in official sector’s view to gold
While central banks were net sellers of gold in previous decades, they have resumed an upward trend of being net buyers. In the last ten years, countries such as China (+659t), Russia (+473t), India (+200t) and Saudi Arabia (+180t) have led this resumption in buying, as central banks choose to diversify national savings into a wider spread of assets, in particular diversifying away from currencies.
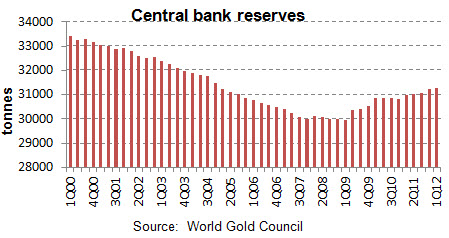
central bank reserves 34000 33000 32000 31000 30000 29000 28000 10q00 4q00 3q01 2q02 1q03 4q03 3Q04 2Q05 1Q06 4Q06 3Q07 2Q08 1Q09 4Q09 3Q10 2Q11 1Q12 source: world gold council
6 SOURCE: SCB Report, page 1.
As developed economies such as the USA, the UK and the Eurozone expand their balance sheets in an attempt to restart economic growth, we believe the central banks throughout the world are more likely than not to continue to diversify into gold, maintaining the recent trend in net gold buying in the official sector.
The SCB Report points out that “the limited new supply comes at a time when central banks have turned from being net sellers to significant net buyers of gold. The result in our view will be a gold market in deficit, and even assuming flat growth in demand.”7
The BoAML Report notes that “Having accumulated claims exceeding $6.5tn in the last 10 years in pursuit of mercantilist policies, EM Central Banks are now being forced to diversify their FX reserves as a result of the deteriorating credit quality in Europe and the United States. Central Banks moved from being net gold sellers in the last two decades to being net buyers after the 2008/09 recession, and the S&P downgrade of US debt will likely reaffirm this trend.”8 This report goes on to say that “Physical gold is the ultimate collateral because it has no credit risk, so EM Central Banks have been diversifying their foreign exchange reserves into gold and other non-dollar, non-euro assets…”9
The HSBC Report similarly notes that “After many years as contributors to the supply of gold, central banks have swung to being net buyers. We believe this is an important bullish development in the gold market. The signatories of the third Central Bank Gold Agreement (CBGA), which are Western European central banks, sold little bullion in the compact’s second year through September 2011. Meanwhile, purchases by emerging-market central banks have increased.”10
10 SOURCE: HSBC Report, page 5.
h) Increasing emerging market demand
Over the past 10 years, investment and jewelry demand from emerging markets has grown from c1700t (in 2001) to c2400t (in 2011), a compounded annual growth rate (“CAGR”) of 4%. In absolute terms, the biggest increases in demand have come from China, India, and emerging countries in Europe. Within the past five years the share of the emerging markets in terms of total gold demand increased to 70%, with China and India accounting for more than half of that as indicated below:
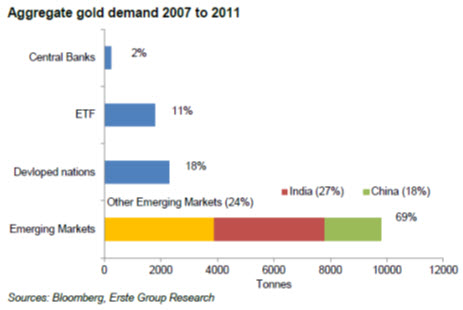
Citi, in its report “Commodities”, notes that “While jewellery demand in the West is expected to be poor, we expect demand in the east to be stronger. We are expecting 5% growth in jewellery demand in each of India and China in 2011. For 2012 and through to 2014 we expect Indian demand to grow in the region of 5% p.a. and Chinese demand to grow in the region of 8% p.a.”11
11 SOURCE: “Commodities – Gold Update” – Citigroup Global Markets Inc. – August 22, 2011, page 9.
Response to question 2(ii):
AngloGold Ashanti confirms the following:
| · | A decrease of 10% in the gold price assumption does not result in an impairment of goodwill associated with any reporting units. In addition, sufficient headroom remains between the fair value of the reporting units and the respective carrying amounts, including goodwill; |
| · | There were no impairment indicators in the 2011 financial year that required AngloGold Ashanti to test other long-lived assets for impairment other than for certain assets disclosed in footnote 5 to the consolidated financial statements, appearing on page F-23. These impairments were driven by specific reasons and aggregated to US$17m; |
| · | In response to the Staff’s request, we have tested the other long-lived assets, over and above those assets disclosed in footnote 5 to the consolidated financial statements, appearing on page F-23, that were fully impaired, for impairment, based on the following assumptions: |
| o | impairment indicators exist for all other assets warranting an impairment test; and |
| o | a decrease in gold price assumption of 10% is applied. |
We can confirm that none of the other long-lived assets are impaired based on a 10% reduced gold price assumption. In addition, sufficient headroom remains between the fair value of the other long-lived assets and their respective carrying amounts. By way of supplemental information the reporting unit with the least relative headroom may have been impaired if the gold price assumption was reduced by more than 19%.
Furthermore, should the gold price fall and remain at such lower levels, we will consider, in addition to other mitigating factors, reviewing and amending our life of mine plans to reduce expenditures, optimize costs and increase cash flows. This will, more likely than not, positively impact the headroom levels referred to above.
Note 8 – Income/(Loss) Per Common Share, page F-34
3. Please show us how you calculated basic and diluted net income per E Ordinary share for the fiscal year ended December 31, 2011 based on the amounts presented herein.
AngloGold Ashanti uses the “two class method” under ASC 260 to calculate basic earnings per share as our Ordinary shares and E Ordinary shares both participate in dividends. The terms under which the E Ordinary shares participate in dividends are disclosed on page F-88 of the 20-F.
Under the two class method, Net Income attributable to AngloGold Ashanti is reduced by the amount of dividends declared in the current period for each share, and by the contractual amount of dividends that must be paid for the current period that has not already been declared. These amounts are disclosed as “Distributed Income” in the table below, and in footnote 8 to the consolidated financial statements, appearing on page F-34.
The remaining “undistributed” earnings are allocated to the Ordinary Shares and the E Ordinary shares based on the contractual participating rights of each of the shares, as if all of the earnings for the current period had been distributed, as required by ASC 260-10-45-65 and 66. This amount is reflected as “Undistributed Income” in the table below and footnote 8 to the consolidated financial statements, appearing on page F-34.
The aggregate of distributed and undistributed earnings for each type of share is equal to the Basic earnings numerator for the basic earnings per share calculation. This is referred to as “Numerator-Net income” in the table below and in footnote 8 to the consolidated financial statements, appearing on page F-34.
The “if converted” method is used to calculate the diluted earnings per share for the Ordinary shares. The diluted earnings per share for the E Ordinary shares is computed using the “two class method”, as if all of the earnings were distributed, unless the “two class method” is more dilutive than the “if-converted method” for the Ordinary shares. The impact of the dilutive instruments on the earnings and weighted average number of Ordinary shares is disclosed in footnote 8 to the consolidated financial statements, appearing on page F-34.
The table below illustrates how we calculated basic and diluted net income per E Ordinary share for the fiscal year ended December 31, 2011. The right hand column reflects the rounded amounts as disclosed in footnote 8 to the consolidated financial statements, appearing on page F-34, and the left hand column reflects the actual numbers as per our general ledger that are not rounded to the nearest million. We respectfully point out to the Staff that our basic and diluted net income per ordinary share is calculated using actual amounts in our general ledger rather than the rounded numbers disclosed in the financial statements, therefore it is not possible to directly compute the earnings per share amounts based on the rounded numbers disclosed in the consolidated financial statements. We have disclosed on page 9 of the 20-F that “Rounding of figures in this report may result in computational discrepancies”.
| INCOME PER COMMON SHARE | ||||||||||||
| Actual numbers | As Disclosed | |||||||||||
| 2011 | 2011 | |||||||||||
| $ | $mil | |||||||||||
The following table sets forth the computation of basic and diluted income per share: | ||||||||||||
| Ordinary shares undistributed income | 1,288,503,898 | 1,289 | ||||||||||
| E Ordinary shares undistributed income | 4,963,466 | 5 | ||||||||||
| Total undistributed income | 1,293,467,364 | 1,294 | ||||||||||
| Ordinary shares distributed income | 130,612,440 | 131 | ||||||||||
| E Ordinary shares distributed income | 502,501 | - | ||||||||||
| Total distributed income | 131,114,941 | 131 | ||||||||||
| Numerator - Net income | ||||||||||||
| Attributable to Ordinary shares | 1,419,116,338 | 1,420 | ||||||||||
| Attributable to E Ordinary shares | 5,465,967 | 5 | ||||||||||
| Total attributable to AngloGold Ashanti | 1,424,582,305 | 1,425 | ||||||||||
| Weighted average number of E Ordinary shares used in calculation of basic and diluted income per E Ordinary share | 2,950,804 | 2,950,804 | ||||||||||
| Income per share attributable to AngloGold Ashanti common stockholders (cents) | ||||||||||||
| Net income per share | ||||||||||||
| E Ordinary shares | 185(1) | 185(2) | ||||||||||
| E Ordinary shares – diluted | 171(3) | 171(4) | ||||||||||
(1) Basic earnings using whole numbers - Net income attributable to E ordinary shares / Weighted average number of E ordinary shares or $5,465,967/2,950,804 = 185c
(2) Basic earnings as above calculated using disclosed rounded numbers - $5 mil / 2,950,804 = 169c
(3) Diluted earnings - Numerator for basic earnings ($5,465,967) adjusted for the impact of the potential dilutive ordinary shares on the allocation of undistributed earnings (-$415,177) - ($5,465,967-$415,177) / 2,950,804 = 171c
(4) Diluted earnings as above calculated using disclosed rounded numbers - $5 mil / 2,950,804 = 169c
General
As customary, we have discussed the contents of our response with our auditors, Ernst & Young Inc., South Africa.
If you have any questions, please contact me at +27 11 637 6717 or Mr. Lance Tomlinson of Ernst & Young Inc. at +27 11 772 3547.
Yours sincerely,
/s/ Srinivasan Venkatakrishnan
Srinivasan Venkatakrishnan
Chief Financial Officer
AngloGold Ashanti Limited
cc:
Mr. Lance Tomlinson, Ernst & Young Inc., Wanderers Office Park, 52 Corlett Drive, Illovo, Johannesburg, South Africa
Mr. George Stephanakis, Cravath, Swaine & Moore LLP, CityPoint, One Ropemaker Street, London EC2Y 9HR, United Kingdom
Ms. Maria Sanz, Group General Counsel, AngloGold Ashanti Limited, 76 Jeppe Street, Johannesburg, South Africa
Mr. John Staples, Chief Accounting Officer, AngloGold Ashanti Limited, 76 Jeppe Street, Johannesburg, South Africa
APPENDIX I

ERNST &YOUNG Report of the independent registered public accounting firm The board of directors and stockholders of AngloGold Ashanti Limited We have audited the accompanying consolidated balance sheets of AngloGold Ashanti Limited (the “Company”) as of December 31, 2011 and 2010 and the related consolidated statements of income, stockholders’ equity and cash flows for each of the three years in the period ended December 31, 2011. These financial statements are the responsibility of the Company’s management. Our responsibility is to express an opinion on these financial statements based on our audits. The financial statements of Societe d’Exploitation des Mines d’Or de Sadiola S.A. (“Sadiola”), a corporation in which the Company has a 41 percent interest at December 31, 2010, have been audited by other auditors as at December 31, 2010 and for the period then ended, whose report has been furnished to us, and our opinion on the consolidated financial statements, insofar as it relates to the amounts included for Sadiola, is based solely on the report of the other auditors. In the consolidated financial statements, the Company’s investment in Sadiola is stated at $99m at December 31, 2010, the Company’s equity in net income is stated at $35m for the period then ended. We conducted our audits in accordance with the standards of the Public Company Accounting Oversight Board (United States). Those standards require that we plan and perform the audit to obtain reasonable assurance about whether the financial statements are free of material misstatement. An audit includes examining, on a test basis, evidence supporting the amounts and disclosures in the financial statements. An audit also includes assessing the accounting principles used and significant estimates made by management, as well as evaluating the overall financial statement presentation. We believe that our audits and the reports of the other auditors provide a reasonable basis for our opinion. In our opinion, based on our audits and the reports of other auditors, the financial statements referred to above present fairly, in all material respects, the consolidated financial position of AngloGold Ashanti Limited at December 31, 2011 and 2010, and the consolidated results of its operations and its cash flows for each of the three years in the period ended December 31, 2011 in conformity with U.S generally accepted accounting principles. We have also audited, in accordance with the standards of the Public Company Accounting Oversight Board (United States), the effectiveness of AngloGold Ashanti Limited’s internal control over financial reporting as of December 31, 2011, based on criteria established in Internal Control-Integrated Framework issued by the Committee of Sponsoring Organizations of the Treadway Commission and our report dated April 23, 2012 expressed an unqualified opinion thereon. Ernst & Young Inc. Ernst & Young Inc. Registered Auditor Johannesburg, Republic of South Africa April 23, 2012

ERNST &YOUNG Report of the independent registered public accounting firm - Internal controls over financial statement reporting The board of directors and stockholders of AngloGold Ashanti Limited We have audited AngloGold Ashanti Limited’s internal control over financial reporting as of December 31, 2011, based on criteria established in Internal Control—Integrated Framework issued by the Committee of Sponsoring Organizations of the Treadway Commission (the COSO criteria). AngloGold Ashanti Limited’s management is responsible for maintaining effective internal control over financial reporting, and for its assessment of the effectiveness of internal control over financial reporting included in the accompanying management certification. Our responsibility is to express an opinion on the Company’s internal control over financial reporting based on our audit. We conducted our audit in accordance with the standards of the Public Company Accounting Oversight Board (United States). Those standards require that we plan and perform the audit to obtain reasonable assurance about whether effective internal control over financial reporting was maintained in all material respects. Our audit included obtaining an understanding of internal control over financial reporting, assessing the risk that a material weakness exists, testing and evaluating the design and operating effectiveness of internal control based on the assessed risk, and performing such other procedures as we considered necessary in the circumstances. We believe that our audit provides a reasonable basis for our opinion. A company’s internal control over financial reporting is a process designed to provide reasonable assurance regarding the reliability of financial reporting and the preparation of financial statements for external purposes in accordance with generally accepted accounting principles. A company’s internal control over financial reporting includes those policies and procedures that (1) pertain to the maintenance of records that, in reasonable detail, accurately and fairly reflect the transactions and dispositions of the assets of the company; (2) provide reasonable assurance that transactions are recorded as necessary to permit preparation of financial statements in accordance with generally accepted accounting principles and that receipts and expenditures of the company are being made only in accordance with authorizations of management and directors of the company; and (3) provide reasonable assurance regarding prevention or timely detection of unauthorized acquisition, use or disposition of the company’s assets that could have a material effect on the financial statements. Because of its inherent limitations, internal control over financial reporting may not prevent or detect misstatements. Also, projections of any evaluation of effectiveness to future periods are subject to the risk that controls may become inadequate because of changes in conditions, or that the degree of compliance with the policies or procedures may deteriorate. In our opinion, AngloGold Ashanti Limited maintained, in all material respects, effective internal control over financial reporting as of December 31, 2011, based on the COSO criteria. We also have audited, in accordance with the standards of the Public Company Accounting Oversight Board (United States), the 2011 consolidated financial statements of AngloGold Ashanti Limited and our report dated April 23, 2012 expressed an unqualified opinion thereon. Ernst & Young Inc. Ernst & Young Inc. Registered Auditor Johannesburg, Republic of South Africa April 23, 2012

KPMG KPMG Inc. Dynarc House 200 Nelson Mandela Drive, Brandwag, 9301 PO Box 12060, Brandhof, 9324, South Africa Telephone +27 (0)51 403 2700 Fax +27 (0)11 647 6124 Docex 38 Bloemfontein Internet http://www.kpmg.co.za/ Report of Independent Registered Public Accounting Firm The board of directors and stockholders of Societe d’Exploitation des Mines d’Or de Sadiola S.A.: We have audited the balance sheet of Societe d’Exploitation des Mines d’Or de Sadiola S.A. (the company) as of December 31, 2010, and the related statement of income, changes in stockholders’ equity and cash flows for the year then ended. These financial statements are the responsibility of the Company’s management. Our responsibility is to express an opinion on these financial statements based on our audit. We conducted our audit in accordance with the standards of the Public Company Accounting Oversight Board (United States). Those standards require that we plan and perform the audit to obtain reasonable assurance about whether the financial statements are free of material misstatement. An audit includes examining, on a test basis, evidence supporting the amounts and disclosures in the financial statements. An audit also includes assessing the accounting principles used and significant estimates made by management, as well as evaluating the overall financial statement presentation. We believe that our audit provides a reasonable basis for our opinion. In our opinion, the financial statements referred to above present fairly, in all material respects, the financial position of Societe d’Exploitation des Mines d’Or de Sadiola S.A. as of December 31, 2010, and the results of its operations and its cash flows for the year ended December 31, 2010 in conformity with International Financial Reporting Standards as issued by the International Accounting Standards Board. KPMG Inc. Registered Auditor Bloemfontein, South Africa May 26, 2011 KPMG Inc is a company incorporated under the South African Companies Act and a member firm of the KPMG network of independent member firms affiliated with KPMG International Cooperative (“KPMG International”), a Swiss entity. KPMG Inc. is a Registered Auditor, in public practice, in terms of the Auditing Profession Act of 2005. Registration number 1999/021543/21 Policy Board Chief Executive RM Kgosana Executive Directors DC Duffield, A. Han, AM Mokgabudi, D van Heerden Other Directors LP Foune, N. Fubu, T. Fubu, TH Hoole, A. Jaffer, M. Letsitsi, E. Magondo, A Masemola, JS McIntosh, CAT Smit, Y Suleman (Chairman of the Board), A Thunström The company’s principal place of business is at KPMG Crescent, 85 Empire Road, Parktown, where a list of the directors’ names is available for inspection.