UNITED STATES
SECURITIES AND EXCHANGE COMMISSION
Washington, D.C. 20549
Form 10-K
(Mark One)
| |
☒ | ANNUAL REPORT PURSUANT TO SECTION 13 OR 15(d) OF THE SECURITIES EXCHANGE ACT OF 1934 |
For the fiscal year ended December 31, 2024
| |
☐ | TRANSITION REPORT PURSUANT TO SECTION 13 OR 15(d) OF THE SECURITIES EXCHANGE ACT OF 1934 |
For the transition period from to
Commission file number: 001-14649

Trex Company, Inc.
(Exact name of registrant as specified in its charter)
| |
Delaware | 54-1910453 |
(State or other jurisdiction of incorporation or organization) | (I.R.S. Employer Identification No.) |
|
|
2500 Trex Way, Winchester, Virginia | 22601 |
(Address of principal executive offices) | (Zip Code) |
(540) 542-6300
Registrant’s telephone number, including area code:
Securities registered pursuant to Section 12(b) of the Act:
Securities registered pursuant to Section 12(b) of the Act:
| | | | |
Title of each class | | Trading Symbol(s) | | Name of each exchange on which registered |
Common stock | | TREX | | New York Stock Exchange |
Securities registered pursuant to Section 12(g) of the Act:
None
Indicate by check mark if the registrant is a well-known seasoned issuer, as defined in Rule 405 of the Securities Act. Yes☐ No☒
Indicate by check mark if the registrant is not required to file reports pursuant to Section 13 or Section 15(d) of the Exchange Act. Yes☐ No☒
Indicate by check mark whether the registrant (1) has filed all reports required to be filed by Section 13 or 15(d) of the Securities Exchange Act of 1934 during the preceding 12 months (or for such shorter period that the registrant was required to file such reports), and (2) has been subject to such filing requirements for the past 90 days. Yes☒ No☐
Indicate by check mark whether the registrant has submitted electronically every Interactive Data File required to be submitted pursuant to Rule 405 of Regulation S-T (§ 232.405 of this chapter) during the preceding 12 months (or for such shorter period that the registrant was required to submit such files). Yes☒ No☐
Indicate by check mark whether the registrant is a large accelerated filer, an accelerated filer, a non-accelerated filer, a smaller reporting Company, or an emerging growth company. See the definitions of “large accelerated filer,” “accelerated filer,” “smaller reporting company,” and “or an emerging growth company” in Rule 12b-2 of the Exchange Act.
| | | |
Large accelerated filer ☒ |
| Accelerated filer | ☐ |
|
|
|
|
Non-accelerated filer ☐ |
| Smaller reporting company | ☐ |
|
|
|
|
|
| Emerging growth company | ☐ |
If an emerging growth company, indicate by check mark if the registrant has elected not to use the extended transition period for complying with any new or revised financial accounting standards provided pursuant to Section 13(a) of the Exchange Act ☐
Indicate by check mark whether the registrant has filed a report on and attestation to its management’s assessment of the effectiveness of its internal control over financial reporting under Section 404(b) of the Sarbanes-Oxley Act (15 U.S.C. 762(b)) by the registered public accounting firm that prepared or issued its audit report. ☒
If securities are registered pursuant to Section 12(b) of the Act, indicate by check mark whether the financial statements of the registrant included in the filing reflect the correction of an error to previously issued financial statements. ☐
Indicate by check mark whether any of those error corrections are restatements that required a recovery analysis of incentive-based compensation received by any of the registrant’s executive officers during the relevant recovery period pursuant to §240.10D-1(b). ☐
Indicate by check mark whether the registrant is a shell Company (as defined in Rule 12b-2 of the Exchange Act). Yes☐ No☒
The aggregate market value of the registrant’s common equity held by non-affiliates of the registrant at June 28, 2024, which was the last business day of the registrant’s most recently completed second fiscal quarter, was approximately $8.0 billion based on the closing price of the common stock as reported on the New York Stock Exchange on such date and assuming, for purposes of this computation only, that the registrant’s directors, executive officers and beneficial owners of 10% or more of the registrant’s common stock are affiliates.
The number of shares of the registrant’s common stock outstanding on February 10, 2025 was 107,159,866.
DOCUMENTS INCORPORATED BY REFERENCE
Portions of the following documents are incorporated by reference in this Form 10-K as indicated herein:
| | |
Document | | Part of 10-K into which incorporated |
Proxy Statement relating to Registrant’s 2025 Annual Meeting of Stockholders | | Corporate governance (under Part I, Item 1) and Part III |
NOTE ON FORWARD-LOOKING STATEMENTS
This report, including the information it incorporates by reference, contains forward-looking statements within the meaning of Section 27A of the Securities Act of 1933 and Section 21E of the Securities Exchange Act of 1934. We intend our forward-looking statements to be covered by the safe harbor provisions for forward-looking statements in these sections. All statements regarding our expected financial position and operating results, our business strategy, our financing plans, forecasted demographic and economic trends relating to our industry and similar matters are forward-looking statements. These statements can sometimes be identified by our use of forward-looking words such as “believe,” “may,” “will,” “anticipate,” “estimate,” “expect,” “intend” or similar expressions. We cannot promise you that our expectations in such forward-looking statements will turn out to be correct. Our actual results could be materially different from our expectations because of various factors, including the factors discussed under “Item 1A. Risk Factors” in this report.
PART I
Some of the information contained in this report concerning the markets and industry in which we operate is derived from publicly available information and from industry sources. Although we believe that this publicly available information and the information provided by these industry sources are reliable, we have not independently verified the accuracy of any of this information.
Item 1. Business
General
Trex Company, Inc. (Trex), was incorporated as a Delaware corporation in 1998. Through December 30, 2022, Trex had one wholly-owned subsidiary, Trex Commercial Products, Inc. Together, Trex and Trex Commercial Products, Inc. are referred to as the Company, we or our. The Company is the world’s largest manufacturer of composite decking and railing products, which are marketed under the brand name Trex® and manufactured in the United States. Our principal executive offices are located at 2500 Trex Way, Winchester, Virginia 22601, and our telephone number at that address is (540) 542-6300.
Business and Growth Strategies
More than 30 years ago, Trex invented the composite decking category. Today, Trex continues to reinvent and redefine outdoor living with a commitment to innovation and growth that has made Trex the world’s #1 brand of sustainably made wood-alternative decking and deck railing, along with a comprehensive portfolio of sustainable, high performance, low-maintenance outdoor living products including fencing, cladding, fasteners, and outdoor lighting. Helping homeowners design outdoor spaces that reflect their individual styles and budgets, coupled with Performance- Engineered™ products at various price points makes Trex the leading brand for homeowners seeking to invest in their outdoor living spaces. Trex’s ability to leverage strong brand awareness and a product offering with the advantages of sustainability, low-maintenance, and durability to help fuel conversion from wood decking and railing to Trex positions our Company well within the large and expanding Outdoor Living market.
Key to Trex’s leadership and growth is the strength of the Trex brand. Marketing investments focused on homeowners’ needs and wants continued to drive brand awareness to its highest level in a decade, with Trex consistently being the leading brand in both unaided and aided brand recognition, while products for every price point help drive profitable growth and wood conversion. Brand strength coupled with an unparalleled distribution and pro-channel dealer network and a leading brand presence at major home improvement retailers ensures that homeowners can find Trex products wherever and whenever they choose.
As the inventor of composite decking, Trex is known for delivering innovative products leveraging the proprietary and skill-based advantages in our eco-friendly manufacturing process. We continue to extract value from the materials by broadening our material streams, implementing new material processes, and developing the next generation of low-cost materials. Our growth and margin expansion strategy positions us well to expand our leadership position in the category with beautiful, high performance, low-maintenance products and includes the following initiatives:
•Accelerate material conversion from wood.
•Expand our market by introducing new products that are innovative, eco-friendly and durable.
•Leverage brand leadership to drive customer demand.
•Increase the number of stocking dealers and retailers by leveraging our market-leading channel relationships.
•Drive margin expansion by continually improving our polyethylene recycling capabilities and manufacturing productivity.
•Execute strategic acquisitions that expand our product offerings and/or enrich our manufacturing process.
Products
Operations and Products: The Company operated in one reportable segment during the years ended December 31, 2024 and December 31, 2023: Trex Residential. The Company operated in two reportable segments during the year ended December 31, 2022: Trex Residential Products (Trex Residential), the Company’s principal business based on net sales, and Trex Commercial Products (Trex Commercial). On December 30, 2022, the Company sold substantially all of the assets of its wholly-owned subsidiary and reportable segment, Trex Commercial Products, Inc. See related information in Note 3 to the Consolidated Financial Statements to this Form 10-K.
Trex Residential is the world’s largest manufacturer of high-performance, low-maintenance, eco-friendly wood-alternative composite decking and railing and a leader in outdoor living products, with more than 30 years of product experience. Trex products are marketed under the brand name Trex® and manufactured in the United States. Stocked in more than 6,700 retail locations worldwide, Trex Residential offers a comprehensive set of aesthetically appealing and durable, low-maintenance product offerings in the decking, railing, fencing, cladding and outdoor lighting categories. A majority of the products are eco-friendly and leverage recycled and reclaimed materials to the extent possible. Trex Residential decking is made in a proprietary process that combines reclaimed wood fibers and recycled polyethylene film, making Trex Residential one of the largest recyclers of waste polyethylene plastic film in North America. Our composite deck boards do not rot, warp, or splinter and the versatile colors feature a refined wood grain that adds depth and luxury to any backyard. Trex Residential products are sold to distributors and home centers for final resale primarily to the residential market.
Trex offers the following products through Trex Residential:
| |
Decking and Accessories | Our principal decking products are Trex Signature®, Trex Transcend® Lineage™, Trex Transcend®, Trex Select®, and Trex Enhance®. In addition, our Trex Transcend decking product can also be used as cladding. Our high-performance, low-maintenance, eco-friendly composite decking products are comprised of a blend of 95 percent reclaimed wood fibers and recycled polyethylene film and feature a protective polymer shell for enhanced protection against fading, staining, mold, and scratching. Trex Signature decking offers realistic woodgrain aesthetics that raise the bar for beauty, performance, and sustainability and is available in two luxurious hues inspired by stunning natural settings. Trex Transcend Lineage is the next generation of design and performance in composite decking and is available in seven luxurious, on-trend hues inspired by some of the most picturesque locales in the United States. Our Trex Transcend decking provides elevated aesthetics paired with the highest level of performance and is available in six multi-tonal monochromatic classical earth tones and premium tropical colors. Trex Select decking offers the perfect pairing of price and minimal maintenance and is available in two nature-inspired earth tone colors. Our Trex Enhance boards pair the beauty of authentic wood-grain appearance with the durability of composite with minimal maintenance and the affordability of wood and is available in natural and basic colors.
We also offer accessories to our decking products. The Trex Hideaway® Fastener Collection , offers solutions for every composite deck fastening and finishing need, featuring color-matched screws and plugs, specially engineered bits, depth setters, and clips, designed to make installation easier and more efficient while delivering a clean, cohesive aesthetic. Trex DeckLighting™, an outdoor lighting system, is a line of energy-efficient LED dimmable deck lighting designed to use 75% less energy compared to incandescent lighting. It can be installed into the railing, stair risers, or the deck itself. The line includes a post cap light, deck rail light, riser light, a soffit light, and a recessed deck light.
|
Railing | Our railing products are Trex Signature® X-Series™ Railing, Trex Signature® aluminum railing, Trex Transcend Railing, Trex Select® Railing, Trex Select® T-Rail, and Trex Enhance™ Railing. Our high-performance cable rail, frameless glass rail, composite, and aluminum-deck railing kits and systems are sustainably manufactured, easy to install, and durable. Trex railing systems are built with the same durability as Trex decking and will not rot, warp, peel, or splinter and resist fading and corrosion. Trex Signature X-Series, made from approximately 30 percent recycled materials, is available in Charcoal Black with stainless steel or glass infill. Trex Signature aluminum railing, made from a minimum of 40 percent recycled content, is available in three colors and designed for consumers who want a sleek, contemporary look. Trex Transcend Railing, made from approximately 40 percent recycled content, is available in four colors that complement our Trex decking products. Trex Select® Railing, made from approximately 40 percent recycled content, is offered in a white finish and is ideal for consumers who desire a simple clean finished look for their deck. Trex Select® T-Rail, made from a minimum of 40 percent recycled materials, is available in square composite balusters in Classic White for a cohesive, coordinated look, or round aluminum balusters in Charcoal Black for a more modern contrast. Trex Enhance™ railing is available in four composite colors, and an Enhance Steel line was recently introduced in Charcoal Black, to expand the Trex addressable market.
|
Fencing | Our Trex Seclusions® composite fencing product is offered through two specialty distributors. This product consists of structural posts, bottom rails, pickets, top rails, and decorative post caps. The top and bottom rails of Trex fencing are designed to provide a “picture frame’ element and the deep rich colors have a matte surface to prevent harsh sunlight reflections.
|
Trex Residential products offer a number of significant aesthetic advantages over wood while eliminating many of wood’s major functional disadvantages, which include warping, splitting, and other damage from moisture. In addition to resisting fading and
surface staining, Trex Residential products require no sanding, staining, or sealing, resist moisture damage, provide a splinter-free surface and do not require chemical treatment against rot or insect infestation. Special characteristics (including resistance to splitting, the ability to bend, and ease and consistency of machining and finishing) facilitate installation, reduce contractor call-backs, and afford consumers a wide range of design options. Combined, these aspects yield significant aesthetic advantages and lower maintenance than wood decking and railing and ultimately render Trex Residential products less costly than wood over the life of the deck.
We have received product building code listings from the major U.S. building code listing agencies for decking and railing and from the major Canadian building code listing agency for decking. The listings facilitate the acquisition of building permits by deck builders and promote consumer and industry acceptance of our products as an alternative to wood decking.
We are a licensor in a number of licensing agreements with third parties to manufacture and sell products under the Trex trademark. Our licensed products are:
| |
Trex® Outdoor Furniture™ | A line of outdoor furniture products manufactured and sold by PolyWood, Inc.
|
Trex® RainEscape®, Trex® Protect, Trex® RainEscape® Soffit Light, and Trex® Seal™ Ledger Flashing Tape | An above joist deck drainage system manufactured and sold by IBP, LLC. Trex Protect Joist, Beam and Rim tape is a self-adhesive butyl tape that protects wooden deck framing/substructure elements. Trex RainEscape Soffit Light is a plug-and-play LED Soffit light that is installed in the under-deck ceiling of a two-story deck. Trex Seal Ledger Flashing tape is butyl flashing tape with an aluminum liner.
|
Trex® Pergola | Pergolas made from low maintenance cellular PVC and all-aluminum product, manufactured by Home & Leisure, Inc. dba Structureworks Fabrication.
|
Trex® Lattice | Outdoor lattice boards manufactured and sold by Structureworks Fabrication.
|
Trex® Cornhole | Cornhole boards manufactured and sold by Johnson Enterprises, LLC. under a Trademark License Agreements with Trex Company, Inc.
|
Trex® Blade | A specialty saw blade for wood-alternative composite decking manufactured and sold by Freud America, Inc.
|
Trex® Spiral Stairs | A staircase alternative for use with all deck substructures manufactured and sold by SS Industries dba Paragon Stairs.
|
Trex® Outdoor Kitchens | Outdoor kitchen cabinetry manufactured and sold by Danver Outdoor Kitchens.
|
Trex Commercial designed and engineered custom railing solutions prevalent in professional and collegiate sports facilities, standardized architectural and aluminum railing systems targeted at commercial and high-rise applications, and custom staging systems for the performing arts, sports, and event production and rental market. Trex Commercial marketed to architects, specifiers, contractors, and building owners.
Through the date of sale of Trex Commercial on December 30, 2022, Trex offered the following products through Trex Commercial:
•Architectural railing systems;
•Aluminum railing systems; and
•Staging equipment and accessories.
Customers and Distribution
We are committed to conducting business activities with the highest standards of business ethics and in accordance with all applicable laws and regulations. Our Vendor and Customer Code of Conduct and Ethics (Code), available at www.trex.com/our-company, applies to all parties providing goods and services to the Company, and all channel partners who distribute, sell and/or install our products (collectively, Business Partners). We expect all Business Partners, and all of their employees, agents and subcontractors to follow our high ethical standards set forth in the Code while they are conducting business with us or on our behalf. In addition, we expect our Business Partners to understand and comply with the Trex Company Code of Conduct and Ethics, available at www.trex.com/our-company, to do business with Business Partners who share the same commitment to human rights that we have and as set forth in our Human Rights Policy, available at www.trex.com/our-company.
Trex Residential: Wholesale Distributors/Retail Lumber Dealers. We generate most of our sales for our composite decking and railing products through our wholesale distribution network by selling Trex Residential products to wholesale distributors, who in turn, sell our products to retail lumber outlets. These retail dealers market to both homeowners and contractors, but they emphasize sales to professional contractors, remodelers, and homebuilders. Contractor-installed decks generally are larger installations with professional craftsmanship. Our retail dealers generally provide sales personnel trained in Trex Residential products, contractor training, inventory commitment, and point-of-sale display support. We believe that attracting wholesale distributors, who are committed to our products and marketing approach and can effectively sell higher value products to contractor-oriented lumber yards and other retail outlets, is important to our future growth. Our distributors provide value-added service in marketing our products because they sell premium wood decking products and other innovative building materials that typically require product training and personal selling efforts. We typically appoint two to three distributors within a specified area to sell only Trex Residential decking products on an exclusive basis. The distributor purchases our products at prices in effect at the time we ship the product to the distributor.
Home Depot and Lowe’s. We sell our products through Home Depot and Lowe’s stores. Home Depot and Lowe’s purchase products directly from us for stocking on their shelves. They also purchase product through our wholesale distributors for special orders placed by consumers. Home Depot and Lowe’s serve both the contractor market and the “do-it-yourself” market. We believe that brand exposure through Home Depot and Lowe’s promotes consumer acceptance of our products.
For the years ended December 31, 2024, 2023, and 2022, three customers of Trex Residential represented approximately 81%, 72%, and 64%, respectively, of the Company’s total net sales. No other customer represented 10% or more of the Company’s total net sales.
Trex Commercial: Prior to the sale of Trex Commercial on December 30, 2022, we sold modular and architectural railing and staging systems to the commercial and multifamily market, including sports stadiums and performing arts venues, primarily to facility owners and general contractors throughout the country. We marketed these products through direct sales staff, independent sales representatives, and bidding on projects.
Manufacturing Process
Products manufactured at our Trex Residential manufacturing facilities in Virginia and Nevada are primarily manufactured from reclaimed wood fiber and scrap polyethylene. Our primary manufacturing process for the products involves mixing wood particles with plastic, heating and then extruding, or forcing, the highly viscous and abrasive material through a profile die. We use many proprietary and skill-based advantages in our eco-friendly manufacturing process. We use Six Sigma and Lean Manufacturing methodologies throughout our Company within our plant operations and in the planning and execution of certain projects.
Our manufacturing processes require significant capital investment, expertise, and time to develop. We have continuously invested the capital necessary to expand our manufacturing throughput and improve our manufacturing processes.
In October 2021, the Company announced plans to add a third manufacturing facility located in Little Rock, Arkansas (Little Rock). that will sit on approximately 300 acres of land. Construction began on the new facility in 2022. The development approach for the new campus will be modular and calibrated to demand trends for Trex Outdoor Living Products.
In addition, we prioritize cost reduction projects and continuous improvement opportunities, primarily related to automation, modernization, energy efficiency, and raw material processing, and remain focused on innovation and new product development. We have also broadened the range of raw materials that we can use to produce a consistent and high-quality finished product. In connection with national building code listings, we maintain a quality control testing program.
Suppliers
We conduct supply chain assessments when considered necessary in relation to the significance of the purchase and business opportunity for the Company. Assessments include in-person reviews and tours of operating facilities. The Company is committed to conducting business activities with the highest standards of business ethics and in accordance with all applicable laws and regulations. As stated above, our Vendor and Customer Code of Conduct and Ethics, our Company Code of Conduct and Ethics, and our Human Rights Policy apply to all suppliers of the Company.
The production of most of our decking products requires a supply of reclaimed wood fiber and scrap polyethylene. We fulfill requirements for raw materials under both purchase orders and supply contracts. In the year ended December 31, 2024, we purchased our reclaimed wood fiber requirements under purchase orders and long-term supply commitments. All of our polyethylene purchases are under short-term supply contracts that generally have a term of approximately one year for which pricing is negotiated as needed, or under purchase orders that do not involve long-term supply commitments.
•Reclaimed Wood Fiber: Most of our reclaimed wood supply originates in North America through relationships with cabinet makers, wood flooring manufacturers, sawmills, lumberyards and other entities that generate and collect wood byproducts in their operations. In addition, we purchase scrap select wood chips generated from various farming operations. If the reclaimed wood fiber meets our specifications, our reclaimed wood fiber supply agreements generally require us to purchase at least a specified minimum and at most a specified maximum amount of reclaimed wood fiber. Depending on our needs, the amount of reclaimed wood fiber that we actually purchase within the specified range under any supply agreement may vary significantly from year to year.
•Scrap Polyethylene: The polyethylene we consume is primarily composed of scrap plastic film and plastic bags. We will continue to seek to meet our future needs for scrap polyethylene from the expansion of our existing supply sources and the development of new sources. We believe our use of multiple sources provides us with a cost advantage and facilitates an environmentally responsible approach to our procurement of polyethylene. Our ability to source and use a wide variety of polyethylene from third party distribution and manufacturing operations is important to our cost strategy. We maintain this ability through the continued expansion of our plastic reprocessing operations in combination with the advancement of our proprietary material preparation and extrusion processes.
In addition, we outsource the production of certain products to third-party manufacturers.
Training
Trex University is our state-of-the-art training facility located near our Virginia manufacturing plant designed to educate and train retailers, contractors and other partners on the benefits of Trex Residential aesthetically pleasing, high-performance, low-maintenance, eco-friendly outdoor living products. In addition, Trex Academy is an online multimedia content hub dedicated to helping the Trex Residential Do-It-Yourself customer bring their deck dreams to life by providing how-to content.
Competition
Our primary competition for our composite decking and residential railing products consists of wood products, which constitute a substantial majority of decking and railing sales, as measured by linear feet of lumber. Many of the conventional lumber suppliers with which we compete have established ties to the building and construction industry and have well-accepted products. A majority of the lumber used in wood decks is pressure-treated lumber. Southern yellow pine and fir have a porosity that readily allows the chemicals used in the pressure treating process to be absorbed. The same porosity makes southern yellow pine susceptible to absorbing moisture, which causes the lumber to warp, crack, splinter and expel fasteners. In addition to pine and fir, other segments of wood material for decking include redwood, cedar and tropical hardwoods, such as ipe, teak and mahogany. These products are often significantly more expensive than pressure-treated lumber, but do not eliminate some of the disadvantages of other wood products.
In addition to wood, we also compete with other manufacturers of wood-alternative products. Industry studies indicate that we have the leading market share of the wood-alternative segment of the decking and railing market. Our principal competitors include The Azek Company Inc., and Fiberon (a division of Fortune Brands, Inc.).
Our ability to compete depends, in part, on a number of factors outside our control, including the ability of our competitors to develop new wood-alternative decking and railing products that are competitive with our products. We believe that the principal competitive factors in the decking and railing market include product quality, price, aesthetics, maintenance cost, distribution and brand strength. We believe we compete favorably with respect to these factors. We believe that our products offer aesthetic and cost advantages over the life of a deck when compared to other types of decking and railing materials. Although a contractor-installed deck built with Trex products using a pressure-treated wood substructure generally costs more than a deck made entirely from
pressure-treated wood, Trex products are low maintenance compared to the on-going maintenance required for a pressure-treated deck and are therefore, less costly over the life of the deck. We believe that our manufacturing process and utilization of relatively low-cost raw material sources provide us with a competitive cost advantage relative to other manufacturers of wood-alternative decking and railing products. The scale of our operations also confers cost efficiencies in manufacturing, sales and marketing.
Seasonality
Our operating results for Trex Residential have historically varied from quarter to quarter. Seasonal, erratic or prolonged adverse weather conditions may reduce the level of home improvement and construction activity and can shift demand for our products to a later period. As part of its normal business practice and consistent with industry practice, Trex Residential Products has historically offered incentive programs to its distributors and dealers to build inventory levels before the start of the prime deck-building season in order to ensure adequate availability of its product to meet anticipated seasonal consumer demand. The seasonal effects are often offset by the positive effect of the incentive programs.
Government Regulation
Our business activities are subject to various federal, state and local laws and regulations. Costs and accruals incurred to comply with these governmental regulations are presently not material to our capital expenditures, results of operations and competitive position. Although there is no assurance that existing or future government laws applicable to our operations or products will not have a material adverse effect on our capital expenditures, results of operations and competitive position, we do not currently anticipate material expenditures for government regulations.
We are also subject to federal, state and local environmental regulation. The emissions of particulates and other substances from our manufacturing facilities must meet federal and state air quality standards implemented through air permits issued to us by the Department of Environmental Quality of the Commonwealth of Virginia, the Division of Environmental Protection of Nevada’s Department of Conservation and Natural Resources, and the Division of Environmental Quality of Arkansas’ Department of Energy and Environment. Our facilities are regulated by federal and state laws governing the disposal of solid waste and by state and local permits and requirements with respect to wastewater and storm water discharge. Compliance with environmental laws and regulations has not had a material adverse effect on our business, operating results or financial condition.
Our operations also are subject to workplace safety regulation by the U.S. Occupational Safety and Health Administration, the Commonwealth of Virginia, and the States of Nevada and Arkansas. Our compliance efforts include safety awareness and training programs for our production and maintenance employees.
Intellectual Property
Our success depends, in part, upon our intellectual property rights relating to our products, production processes and other operations. We rely upon a combination of trade secret, nondisclosure and other contractual arrangements, and patent, copyright and trademark laws, to protect our proprietary rights. We have made substantial investments in manufacturing process improvements that have enabled us to increase manufacturing line production rates, facilitate our development of new products, and produce improvements in our existing products’ dimensional consistency, surface texture and color uniformity.
Intellectual property rights may be challenged by third parties and may not exclude competitors from using the same or similar technologies, brands or works. We seek to secure effective rights for our intellectual property but cannot provide assurance that third parties will not successfully challenge, or avoid infringing, our intellectual property rights.
We consider our trademarks to be of material importance to our business plans. The U.S. Patent and Trademark Office has granted us federal registrations for many of our trademarks. Federal registration of trademarks is effective for as long as we continue to use the trademarks and renew their registrations. We do not generally register any of our copyrights with the U.S. Copyright Office but rely on the protection afforded to such copyrights by the U.S. Copyright Act. This law provides protection to authors of original works, whether published or unpublished, and whether registered or unregistered.
We have two current U.S. Patents for decking technology. We intend to maintain our existing patents in effect until they expire on January 15, 2038 and May 23, 2038, respectively, as well as to seek additional patents as we consider appropriate.
We enter into confidentiality agreements with our employees and limit access to and distribution of our proprietary information. If it is necessary to disclose proprietary information to third parties for business reasons, we require that such third parties sign a confidentiality agreement prior to any disclosure.
Human Capital
Overview As of December 31, 2024, Trex employed 1,838 full-time employees. Our people are what have fueled our growth as the world’s #1 brand of sustainably made, wood-alternative decking and deck railing for nearly three decades. As we look to the future, Trex is poised for growth and innovation and that growth is dependent upon our people’s talent and commitment. We continue to invest in our people as we execute on our strategic talent management plan which aims to support our employees in gaining the competencies needed to advance and enjoy long-lasting careers at Trex.
Pay Equity As an equal opportunity employer, Trex is committed to providing fair and equitable pay for all employees across the Company. We have a strong track record as an industry leader in terms of hourly wages, salary and total compensation. We use a compensation grade structure as part of our process to determine the appropriate grade level for each position at Trex. As a result, we set the pay range for each position before considering who we might hire to fill that role. In addition, we regularly review our compensation structures for signs of emerging inequities along gender or ethnicity lines as well as market competitiveness. Our employees are not covered by collective bargaining agreements, and we believe that our relationships with our employees are favorable. Our Human Rights Policy sets forth our values related to working conditions and human rights, and it underscores our philosophy about the way we conduct our business. The policy is available at www.trex.com/our-company.
Development and Recruiting Developing internal talent is another key multi-year infrastructure investment for Trex. To help support our strategic talent development, we continue to invest in enabling tools, systems, and training to strengthen our decision making and accelerate progress. This includes new training for managers in the areas of team development, performance reviews, and recognition. In addition, the Trex Leadership Academy, a 12-month program, continues to develop and refine the competencies and leadership skills of high potential team members. Trex’s tuition reimbursement policy assists team members in achieving their full potential by furthering their education, affording them opportunities to grow their skills set and favorably impact the business. Safety remains a core value at Trex and in 2024 hourly manufacturing onboarding was enhanced to include more time for new team members to learn the process and incorporate additional safety best practices.
While significant investments have been made in internal development, wide-net recruiting outside talent continues to infuse the Company with new and diverse perspectives. Our summer intern program continues to grow and welcomes students from both universities and vocational schools across the mid-Atlantic. This program along with an aggressive campus recruitment has created a pipeline of young talent, while at the same time we continue to attract some of the most talented senior leaders from around the country to fill key leadership positions.
Engagement and Culture We continue to invest in employee engagement and related action planning by conducting Gallup surveys. Our people managers use the results to develop specific action plans to drive engagement throughout our organization. We also evolved our approach to curation of culture, providing training through an internal trainer to hourly employees in addition to leaders. This multi-year roll out of culture training targets all Trex team members to create shared understanding and expectations.
Trex is committed to building a workforce that is reflective of the communities in which we operate. Embracing diverse perspectives and fostering a culture of inclusion and belonging are at the core of what has fueled Trex’s legacy of innovation. We continue to find new ways to increase opportunities for underrepresented team members, including offering English language classes for non-native speakers and partnering with local agencies to provide employment opportunities to neuro-diverse candidates.
At Trex, our people fuel our growth and innovation. We are committed to reinvesting in our team and executing our strategic talent management plan at the highest level.
Corporate Governance
Information related to the Company’s governance and related activities and programs may be found in the Company’s Definitive Proxy Statement filed on March 25, 2024 in Schedule 14A. Also, a copy of the Company’s Code of Conduct and Ethics (Code) is maintained on the Company’s web site at www.trex.com/our-company/corporate-governance/. The Company has a whistle-blowing policy included in its Code that encourages reporting by employees of activities the employee considers illegal or dishonest. Each employee is notified of the whistle-blower policy and a toll-free hotline is provided for reporting issues directly to the Board of Directors and the Company’s Senior Vice President, Chief Legal Officer and Secretary.
Environmental and Occupational Safety
Environmental
The Company has been committed to sustainability since our inception more than 30 years ago, creating eco-friendly products from reclaimed and recycled materials. Trex Residential’s high-performance, low-maintenance composite decking is made from 95% recycled and reclaimed materials. The Company’s commitment to improving our environmental footprint includes developing and offering more sustainable products to the market as well as advancing sustainability and efficiency in our operations. From continuous improvement in our manufacturing practices that reduce the use of energy to making products using industry leading high levels of reclaimed and recycled materials, the Company is able to improve the use of resources, greenhouse gas emissions, and waste streams. The foundation for our commitment to sustainability includes, but is not limited to:
•Using recycled, reclaimed and other waste resources whenever possible in our manufacturing process;
•Preventing pollution by maintaining environmental management as a core value;
•Reducing waste generated in our manufacturing and business operations;
•Developing and using environmentally acceptable, safe and efficient production methods; and
•Identifying and complying with all legal and statutory requirements.
Our Environmental Policy, located on our web site at www.trex.com/our-company, outlines our commitment to conducting business in an ethical and socially responsible manner that respects the environment.
The Nominating / Corporate Governance Committee of the Board of Directors oversees the Company’s sustainability matters that are significant to the Company. Periodically, the Committee reviews the Company’s sustainability strategy, initiatives and policies and receives updates from the Senior Vice President, Chief Legal Officer and Secretary, who oversees the Company’s sustainability initiatives. Also, environmental matters relevant to the Company’s operations are the responsibility of the President and Chief Executive Officer, the Executive Vice President and Chief Operating Officer, and the Senior Vice President and Chief Financial Officer.
Trex Residential’s bi-coastal factories reduce fuel consumption and CO2 emissions by reducing transit distance. We strive to reduce energy use and associated greenhouse gas emissions in Trex manufacturing operations by designing our facilities to run efficiently. In addition, almost 100 percent of our factory runoff and refuse are recycled back into the manufacturing line. Any product that does not meet quality specifications is reprocessed, which eliminates the need for landfill for product waste.
The Company’s primary resource usage consists of water, natural gas and electricity. The Company develops budgets and plans that improve shareholder return by ensuring the optimal use of each resource, which promotes resource efficiency and minimal waste of the resource. Water management is of critical importance to us. Our Virginia and Nevada manufacturing facilities have closed-loop recirculation systems that run water through multiple cycles of re-use before being returned to the municipal wastewater stream. We prioritize energy savings as part of our ongoing evaluation and optimization of business operations and manufacturing processes. We regularly assess environmental impacts at each stage of our manufacturing process and seek to continually improve our performance. We ensure that all manufacturing facilities meet emission standards for the locality in which they operate and certify to applicable authorities that our emissions are within the relevant locality’s standards.
Market Recognition of Trex Brand’s Environmental Characteristics
The Company’s internal standards for environmental stewardship and product integrity are recognized year-over-year in the marketplace. Trex was named to the Barron’s “100 Most Sustainable Companies” list for 2024. Trex Transcend® Lineage™ won Good Housekeeping’s 2024 Sustainable Innovation Award. In addition, Trex was also recognized as Sustainable Brand Leader in the decking category of Green Builder’s annual Reader’s Choice Survey for the 14th consecutive year. Trex was ranked by Newsweek magazine as one of America’s Most Responsible Companies 2024.
Trex environmental benefits are recognized by the receipt of the Leadership in Energy and Environmental Design (LEED) certification by the United States Green Building Council. Trex Residential decking products meet LEED requirements for builders and our commercial products have contributed to the LEED certifications of some high-profile venues. LEED is a point-based system designed to reward points to building projects that incorporate efficient, and safe eco-friendly products, leading to a building’s designation as LEED Silver, Gold or Platinum. Trex Residential decking can add up to four points to a project — four points in the Materials and Resources category for being composed of 95% recycled and reclaimed materials. As a U.S. Green Building Council member, Trex works along with council members to transform the way buildings and communities are designed, built and operated with the goal of creating environmentally and socially responsible spaces that improve the quality of life.
Occupational Health and Safety
The health and safety of our employees is our highest priority. We have a strong Environmental, Health and Safety program that focuses on developing and implementing policies and effective safety training programs, as well as performing internal safety assessments to ensure a company-wide culture of safety and accountability.
The Trex Occupational Health and Safety Policy, located on our website at www.trex.com/our-company, sets forth our commitment to sustaining a compliant and safety-conscious work environment, keeping safety at the forefront of our business, and is based on:
•Compliance with statutory, regulatory and other legal requirements;
•A comprehensive understanding of worker expectations;
•Demonstrating employee safety leadership in all processes while striving to consistently improve performance; and
•Tracking company and site level safety performance metrics including common lagging indicators, such as injury rates, but also leading indicators such as safety observations, near-misses, and proactive actions taken at the sites to ensure worker safety.
Each of our manufacturing sites have dedicated health and safety (EHS) professionals and safety committees. In 2024, several changes to the EHS organization were made to better support the business and align resources. These changes include the addition of an EHS Specialist to our distribution and transportation department, and a Corporate Health and Safety Manager to focus on advancing our health and safety programs. This position is a counterpart to our Corporate Environmental Manager role which has been in place for several years. All EHS professionals are required to complete continuing education courses to build internal expertise and capacity.
In 2024, Trex launched numerous health and safety initiatives such as FAST Response, Safety Steering Committee, Rules to Live By, and the inaugural Safety Pulse Survey. FAST response is a weekly meeting of frontline leaders and support personnel focused on identifying and correcting safety non-compliance on the production floor to prevent incidents from occurring. The Safety Steering Committee’s charter is to create a forum for managers and leaders from all functional areas to discuss health and safety. This includes reviewing incidents and corrective actions from across the organization, sharing information related to safety improvements, and providing transparency to health and safety performance monthly.
Rules to Live By outline expectations of employee compliance with safety rules related to high-risk activities such as powered industrial trucks, lockout/tagout and control of hazardous energy, confined spaces, machine guarding, working at height and hoisting and rigging.
Websites and Additional Information
The U.S. Securities and Exchange Commission (SEC) maintains an Internet web site at www.sec.gov that contains reports, proxy statements, and other information regarding our Company. Our website is www.trex.com. In addition, we maintain an Internet corporate web site at www.trex.com/our-company/investor-relations. We make available through our web site our annual reports on Form 10-K, quarterly reports on Form 10-Q, current reports on Form 8-K, and all amendments to those reports, as soon as reasonably practicable after we electronically file with or furnish such material to the SEC. We do not charge any fees to view, print, or access these reports on our web site. The contents of our web site are not a part of this report.
Item 1A. Risk Factors
Our business operates in one reportable segment, Trex Residential, and is subject to a number of risks, including the following.
Risks Related to the Distribution and Sale of Our Product
| |
| |
Risk
|
Discussion
|
Description
We may not be able to grow unless we increase market acceptance of our products, compete effectively and develop new products and applications. Impact
Our failure to compete successfully could have a material adverse effect on our ability to replace wood products or increase our market share amongst wood-alternative products.
•If our products do not meet emerging demands and preferences, we could lose market share, which could have a material adverse effect on our business. •In addition, substantially all of our revenues are derived from sales of our proprietary wood/polyethylene composite material. Although we have developed, and continue to develop, new products made from other materials, if we should experience significant problems, real or perceived, with acceptance of the Trex wood/polyethylene composite material, our lack of product diversification could have a significant adverse impact on our net sales levels. | Our primary competition consists of wood products, which constitute a substantial majority of decking, railing, fencing, and deck framing sales. Since composite products were introduced to the market in the late 1980s, their market acceptance has increased. Our ability to grow depends, in part, on our success in continuing to convert demand for wood products into demand for our composite products. Many of the conventional lumber suppliers with which we compete have established ties to the building and construction industry and have well-accepted products. Our ability to compete depends, in part, upon a number of factors outside our control, including the ability of competitors to develop new alternatives that are more competitive with Trex products. Our ability to identify and respond to emerging consumer demands and preferences for our products depends, in part, on how successfully we develop, manufacture and market new products. To increase our market share, we must overcome:
•Lack of awareness of the enhanced value of composite products in general and our products in particular; |
|
•Resistance of many consumers and contractors to change from well-established wood products; •Consumer lack of awareness that the greater initial expense of our products compared to wood is a one-time cost that is reduced over time as our products have lower maintenance costs and a longer life span than wood; •Established relationships existing between suppliers of wood products and contractors and homebuilders; •Actual and perceived quality issues with first generation composite products; and •Competition from other wood-alternative manufacturers. |
| |
| |
Risk
|
Discussion
|
Description
The demand for our products is influenced by the home improvement market and could be adversely affected by conditions that negatively impact this market. Impact
We cannot predict conditions that may negatively impact the home remodeling and new home construction environment. Any economic downturn or adverse changes in the home improvement market could reduce consumer income or equity capital available for spending on discretionary items, which could adversely affect the demand for our products. | The demand for our composite decking and railing products is influenced by the general health of the economy, the level of home improvement activity and, to a much lesser extent, new home construction. These factors are affected by home equity values, credit availability and interest rates, consumer confidence, income and spending habits, employment, inflation, and general economic conditions. |
| |
| |
Risk
|
Discussion
|
Description
We may not be able to fully maintain or expand our wholesaler and dealer channels. Impact
If we fail to compete successfully for wholesale distributors and dealers, our business could experience material adverse effects, which could negatively impact profitability and cash flows. | We sell most of our composite decking and railing products through our network of wholesale distributors who, in turn, sell to retail lumber outlets. Our growth strategy depends on maintaining and expanding this network and on our ability to compete with other entities for these channels. In order to successfully compete for wholesaler distributors, dealers and retail lumber outlets, we must accurately assess their customers’ needs and preferences. |
| |
| |
Risk
|
Discussion
|
Description
Certain of our customers account for a significant portion of our sales, and the loss of one or more of these customers could have an adverse effect on our business. Impact
The loss of a significant customer could have a significant negative impact on our business, results of operations and financial condition. | A limited number of our customers account for a significant percentage of our sales. For the years ended December 31, 2024, 2023, and 2022, three customers of Trex Residential represented approximately 81%, 72%, and 64%, respectively, of the Company’s total net sales. We expect that a significant portion of our sales will continue to be sold through a small number of customers, and certain customers will continue to account for a significant portion of our sales. |
| |
| |
Risk
|
Discussion
|
Description
Our operating results may vary quarter to quarter due to the level of inventory maintained in our distribution channel. Impact
We have limited visibility to project inventory levels in our two-step distribution channel. Any sudden fluctuation in demand from our distribution partners may require us to quickly increase or decrease our manufacturing inputs and outputs. If we are unable to effectively respond in a timely manner our short-term results of operations may be negatively impacted. | We sell our composite decking and railing products through our distribution channel who, in turn, sell to end-use consumers. Our distribution partners manage their inventory levels by forecasting demand for our products, placing orders for the products, and maintaining product inventories in order to meet consumer demand. Inventory levels respond to a number of factors, including, without limitation, changes in product price, the number of competitors, product innovation, and the level of discretionary spending by consumers. Therefore, our operating results are subject to inventory stocking decisions made by our distribution partners and may vary quarter to quarter. Past performance will not necessarily indicate future performance. |
| |
| |
Risk
|
Discussion
|
Description
The demand for our outdoor living products may be negatively affected by erratic, or prolonged adverse weather conditions, and our operating results may vary quarter to quarter due to seasonality. Impact
Seasonal, erratic, or prolonged adverse weather conditions may reduce the level of home improvement and construction activity and can shift sales of our products to a later period or decrease overall sales in affected locations, which could have a negative impact on our results of operations and liquidity.
| Our products are generally purchased shortly before installation and used in outdoor environments. As a result, there is a correlation between the amount of product we sell and weather conditions during the time they are to be installed. Erratic or prolonged adverse weather conditions may interfere with home improvement or ordinary construction, delay projects, or lead to cessation of construction involving our products. In addition, our operating results have historically varied from quarter to quarter due to seasonality. As part of normal business practice and consistent with industry practice, we have historically offered incentive programs to our distributors and dealers to build inventory before the start of the prime deck-building season in order to ensure adequate availability of our products to meet anticipated seasonal consumer demand. The seasonal effects are often offset by the positive effect of the incentive programs. |
| |
Risk
|
Discussion
|
Description
We depend on third parties for transportation services and the lack of availability of transportation and/or increases in cost could materially adversely affect our business and operations. Impact
If the required supply of third-party transportation services is unavailable when needed, we may be unable to deliver our products in a timely manner and, therefore, unable to sell our products at full value, or at all. Similarly, if any of these providers were unavailable to deliver raw materials to us in a timely manner, we may be unable to manufacture our products in response to customer demand. This could harm our reputation, negatively impact our customer relationships and have a material adverse effect on our financial condition and results of operations. In addition, a material increase in transportation rates or fuel surcharges could have a material adverse effect on our profitability.
| Our business depends on the transportation by third parties of both raw materials to us and finished goods to our customers. In particular, a significant portion of our finished goods are transported by flatbed trucks, which are occasionally in high demand (especially at the end of calendar quarters) and/or subject to price fluctuations based on market conditions and the price of fuel. |
Risks Related to the Manufacture of Our Product
| |
| |
Risk
|
Discussion
|
Description
Our business is dependent on consistently producing a product which is available when needed to meet the demands of our customers. As our business grows, we must adjust capacity to meet customer needs and provide increased throughput on our existing capacity. Impact
Our sales growth and profitability could suffer from our failure to effectively pair supply and demand for our products. Our customers’ demands for varying quantities of products and delivery items throughout the year, and increased demand year to year, require monitoring and the ability to adjust production in accordance with these demands. Failure to do so can lead to lost or reduced sales and have a negative effect on earnings.
| In order to meet customer demand in a timely manner, we must adjust capacity to meet customer needs and provide increased throughput on our existing capacity. Our sourcing team must obtain raw materials on a timely basis at an appropriate volume. |
| |
| |
Risk
|
Discussion
|
Description
We have made and may continue to make significant capital investments in new and existing manufacturing facilities, that may become impaired or obsolete and result in a charge to our earnings. In addition, underutilization of any such investments may result in reduced profitability through reduced gross profit and lower gross margins. Impact
Our ability to achieve the expected benefits and returns from our capital investments, such as increased production, improved efficiency, cost savings, or diversification into new product markets, is subject to estimates, assumptions, and market risks. If the actual results differ from our estimates and assumptions, we may not achieve the benefits from the investments within the estimated time frame, if at all, which could adversely affect our financial condition and results of operations.
| We have made and may continue to make significant investments in new manufacturing facilities, upgrading our existing facilities and acquiring businesses or operations. These investments sometimes involve the implementation of new technologies and replacement of existing equipment. While we anticipate that these investments will increase production, improve efficiency, achieve cost savings, or allow us to diversify into new product markets, we cannot be certain we will realize the benefits of these initiatives when anticipated or at all. Failure to achieve the expected benefits from our investments may result in reduced cash flows in future periods, obsolete or impaired assets, and charges to our earnings. |
| |
| |
Risk
|
Discussion
|
Description
Our prospects for sales growth and profitability may be adversely affected if we fail to maintain product quality and product performance at an acceptable cost. Impact
If we are unable to produce high-quality products at standard manufacturing rates and yields, unit costs may be higher. A lack of product performance could impede acceptance of our products in the marketplace and negatively affect our profitability. Future material increases to our warranty reserve could have a significant adverse effect on our profitability and cash flows. In the event lawsuits relating to alleged product quality issues are brought against us in the future, such lawsuits may be costly and could cause adverse publicity, which in turn could result in a loss of consumer confidence in our products and reduce our sales. Product quality claims could increase our expenses, have a material adverse effect on demand for our products and decrease net sales, net income and liquidity.
| In order to expand our net sales and sustain profitable operations we must maintain the quality and performance of our products. We continue to receive and settle claims and maintain a warranty reserve related to decking product produced at our Nevada facility prior to 2007 that exhibits surface flaking. We have limited our financial exposure by settling a nationwide class action lawsuit that provides that a consumer’s remedy is limited to the replacement of product and a partial labor reimbursement. However, because the establishment of reserves is an inherently uncertain process involving estimates of the number of future claims and the average cost of claims, our ultimate losses may differ from our warranty reserve. Increases to the warranty reserve and payments for related claims have had a material adverse effect on our profitability and cash flows. A number of class action lawsuits alleging defects in our products have been brought against us, all of which have been settled. |
| |
| |
Risk
|
Discussion
|
Description
Our business is subject to risks in obtaining the raw materials we use. In addition, to the extent we source raw materials internationally, changes in trade policies, including the imposition of tariffs, could negatively impact our business, financial condition, and results of operations. Impact
Our business could suffer from the termination of significant sources of raw materials, the payment of higher prices for raw materials, the quality of available raw materials, or from the failure to obtain sufficient additional raw materials to meet planned increases in production. | The manufacture of our composite decking and railing products requires substantial amounts of wood fiber and scrap polyethylene. Our business strategy is to create a substantial cost advantage over our competitors by using scrap polyethylene. Our ability to obtain adequate supplies of wood fiber and scrap polyethylene depends on our success in developing new sources that meet our quality requirements, maintaining favorable relationships with suppliers and managing the collection of supplies from geographically dispersed locations. In addition to wood fiber and scrap polyethylene, we also use a small percentage of other materials in making our products, which are sometimes subject to volatility in supply and could negatively affect our profitability. We procure certain of the raw materials we use in the manufacturing of our products from suppliers located outside of the United States. The imposition of tariffs and other potential changes in U.S. trade policy could increase the cost and/or limit the availability of raw materials, which could hurt our competitive position and adversely impact our business, financial condition and results of operations. |
| |
| |
Risk
|
Discussion
|
Description
Periods of significant or prolonged inflation could affect our ability to obtain manufacturing inputs at acceptable prices and may negatively impact our profitability. Impact
In a competitive environment, we may be unable to increase prices of our products to offset higher costs resulting from significant or prolonged inflationary pressures, which could have a material adverse effect on our business, financial condition, and operating results. In addition, periods of sustained or rapidly increasing inflation may result in decreased spending in the residential and commercial markets and reduce demand for our products, which could further adversely impact our business. | Our business may be directly affected by significant or prolonged inflationary pressures on raw materials and transportation. We will look to offset increased input costs through cost reduction projects, purchasing strategies, and increased production efficiencies and improvement opportunities to enhance our margins. Specifically, our efforts would primarily center on increased automation, modernization, enhanced energy efficiency and improvements to raw material processing. To the extent that these actions would not offset the impact of inflation we would seek to increase the price of our products to our customers. At the same time, we would expand our marketing campaigns, including campaigns to highlight the advantages of our decking over wood, as well as campaigns focused on innovation and new product development that further strengthens our consumer brand and distribution advantages. |
| In general, we believe that an effect of inflation would be a short-term disruption and that, over time, we would offset increased input costs through cost reduction projects, purchasing strategies, and increased production efficiencies and improvement opportunities to enhance our margins. In addition, we would be able to increase prices to counteract the majority of any inflationary effects of increasing costs and to generate sufficient cash flows to maintain our productive capability. |
| |
| |
Risk
|
Discussion
|
Description
Labor shortages or increases in labor costs could adversely impact our business and results of operations. Impact
We rely heavily on our employees and any shortage of qualified labor could adversely affect our business. If we are not successful in our recruiting and retention efforts, we could encounter a shortage of qualified employees in future periods. Any such shortage would decrease our ability to produce sufficient quantities of our product to serve our customers effectively. Such a shortage may also require us to pay higher wages for employees and incur a corresponding reduction in our profitability.
| Labor is one of the primary components of our production process. Our success is dependent upon recruiting qualified employees to manufacture our product. Our future success depends on, among other things, our ability to identify, attract, hire, train, retain and motivate operational personnel on a timely basis as we continue our pace of growth. If we fail to do so, our ability to maintain and grow our business could be adversely impacted. Further, improvements in the economy and labor markets could impact our ability to attract and retain key personnel. |
Risks Related to the Availability of Capital
| |
| |
Risk
|
Discussion
|
Description
Our ability to continue to obtain financing on favorable terms, and the level of any outstanding indebtedness, could adversely affect our financial condition and ability to compete. Impact
Our ability to make future principal and interest payments, borrow and repay amounts under our senior credit facility and continue to comply with our loan covenants will depend primarily on our ability to generate sufficient cash flow from operations. Our failure to comply with our loan covenants might cause our lenders to accelerate our repayment obligations under our senior credit facility, which may be declared payable immediately based on a default. | Our ability to continue to obtain financing on favorable terms may limit our discretion on some business matters, which could make it more difficult for us to expand, finance our operations and engage in other business activities that may be in our interest. In addition, our senior credit facility may impose operating and financial restrictions. At certain periods during the year, we may borrow significant amounts on our senior credit facility for working capital purposes. In addition, we may borrow on the senior credit facility to pursue strategic opportunities or other general business matters. Accordingly, our future level of indebtedness and the terms of our borrowings could have important consequences.
|
Risks Related to Other Matters
| |
| |
Risk
|
Discussion
|
Description
Our business, results of operations and financial condition may be disrupted and adversely affected by global public health pandemics or geopolitical conflicts. Impact
If our employees or the employees of our suppliers or transportation providers are unable to work because of illness related to a global public health pandemic, or if we or our suppliers or transportation providers are forced to temporarily cease operations, either on a voluntary or mandatory basis, then we may have a period of reduced operations and be unable to supply our customers in a timely manner, which could have a material negative impact on our business. If geopolitical conflicts disrupt the operations of our distributors and retail outlets or negatively impacts economies in the United States, Canada and the rest of the world, our business, results of operations and financial condition may be adversely affected.
| Our business, results of operations and financial condition may be adversely affected if a global public health pandemic interferes with the ability of our employees, suppliers and other business partners to perform their respective responsibilities and obligations relative to the conduct of our business. We monitor the outbreak of any global public health pandemic or global political conflicts and evaluate the impact on our business as information emerges. The extent to which the impact of a global public health pandemic or a continuing global political conflict may have on our business, supply chains, commodity and fuel prices, and prices of raw materials will depend on future developments, which may be highly uncertain and cannot be predicted. |
| |
| |
Risk
|
Discussion
|
Description
Climate change and legal or regulatory responses thereto may have a long-term adverse impact on our business and results of operations. Impact
There is increasing concern that a gradual increase in global average temperatures due to increased concentration of carbon dioxide and other greenhouse gases in the atmosphere could cause significant changes in weather patterns and an increase in the frequency, duration, and severity of natural disasters. In addition, the increasing concern over climate change may result in additional laws or regulations designed to reduce or mitigate the effects of carbon dioxide and other greenhouse gas emissions on the environment. Compliance with newly enacted laws and regulations could impose operational and compliance burdens which may negatively impact our financial condition and results of operations. | We continue to strive to minimize the environmental impact of Trex operations, remain one of the largest recyclers of polyethylene in the U.S. and continue to benefit from increasing consumer interest in our environmentally friendly composite product offerings that leverage recycled and reclaimed materials. Any significant changes in weather patterns or increases in the frequency, duration and severity of natural disasters are beyond our control and could disrupt our supply chain, increase our product costs, impact demand for our product, or impair our ability to deliver product to our customers. In addition, we cannot predict what environmental legislation or regulations will be enacted in the future related to climate issues, or how existing or future laws or regulations will be administered or interpreted. Compliance with more stringent laws or regulations, or stricter interpretation of existing laws, may require additional expenditures. Any increased energy or compliance costs and expenses may cause disruptions in, or an increase in the costs associated with, the manufacturing and distribution of our products.
|
| |
| |
Risk
|
Discussion
|
Description
Cyberattacks and other security breaches could compromise our proprietary and confidential information which could harm our business and reputation. Impact
While we have certain safeguards in place to reduce the risk of and detect cyber-attacks, our information technology networks and infrastructure may be vulnerable to unpermitted access by hackers or other breaches, or employee error or malfeasance. Any such compromise of our data security and access to, or public disclosure or loss of, confidential business or proprietary information could disrupt our operations, damage our reputation, provide our competitors with valuable information and subject us to additional costs, which could adversely affect our business. | In the ordinary course of our business, we generate, collect and store confidential and proprietary information, including intellectual property, business information and employee data. The secure storage, maintenance, and transmission of and access to this information is important to our operations and reputation. Computer hackers may attempt to penetrate our computer systems and, if successful, misappropriate our proprietary and confidential information including e-mails and other electronic communications. In addition, an employee, contractor, competitor, or other third party with whom we do business may attempt to obtain such information and may purposefully or inadvertently cause a breach involving such information. We also collect limited information on consumers. Although we do not collect any highly sensitive information, there is a risk that a cybersecurity attack could compromise consumer’s names, addresses and other personal information. Proactive measures that reduce our risk of a cybersecurity incident include:
•Maintaining cybersecurity insurance to protect against risks related to cyber-attacks and other security breaches. •Partnering with an enterprise grade security solutions integrator (SSI) that leverages deep industry expertise to help us build and run holistic cybersecurity programs designed to reduce our overall risk profile. The SSI performs regular audits to evaluate our current security posture and prioritize our improvement plans. •Implementing an information security training and compliance program for employees. We test our employees monthly with simulated “phishing” attacks. Additionally, we run annual security awareness video training programs and occasional ad hoc awareness sessions as needed. Despite these proactive measures, there is no guarantee that these measures will prevent a cybersecurity incident that could have a material adverse effect on the Company.
|
None.
Item 1C. Cybersecurity
Cybersecurity Risk Management
The Company has systems and processes for identification, assessment, and management of material risks from cybersecurity threats, as such term is defined in Item 106(a) of Regulation S-K. The Company’s multi-faceted approach includes deploying applications and control activities to actively monitor and mitigate potential threats to the Company’s IT environment.
These activities include, but are not limited to, engaging an external third-party to monitor information systems security events, conducting annual security training of employees, testing employees via periodic phishing campaigns, conducting system vulnerability scanning, utilizing a patching program to remediate critical patches, and utilizing an external third-party to perform testing to identify gaps in the Company’s security program. The Company also performs third-party risk management to identify and mitigate risks from third parties such as vendors, suppliers, and other business partners. Additionally, for providers of software-as-a-service and other services that hold Company data, the Company reviews and assesses industry standard certifications such as System and Organization Controls (SOC) 1 or SOC 2 reports and cybersecurity preparedness questionnaires. Mitigation of risk efforts are coordinated by the Company’s Director of Information Security, utilizing internal resources and third-party providers.
The Company has not had any cybersecurity risks that have materially affected the Company, including its business strategy, results of operations, or financial condition. Cybersecurity risks are disclosed in Part I Item 1A. Risk Factors, incorporated herein by reference.
Cybersecurity Governance
Our cybersecurity programs, including the cross-functional management committees responsible for identifying, assessing, and mitigating cybersecurity risks and incidents, are overseen by our Vice President and Chief Information Officer. Day-to-day administration of the cybersecurity programs are led by our Director of Information Security, a direct report to the Vice President and Chief Information Officer. Our Vice President and Chief Information Officer has 27 years of technology leadership experience and a Doctor of Business Administration. Our Director of Information Security has 27 years of experience in infrastructure and security operations and a degree in Information Technology Management. Our Director of Information Security is the chair of the Company’s Information Security Committee. The activities of the Information Security Committee are reviewed by the Executive Information Security Oversight Committee, which is comprised of members of our senior leadership team including our Vice President and Chief Information Officer, Senior Vice President, Chief Financial Officer, Senior Vice President, Chief Legal Officer and Secretary and Senior Vice President, Chief Human Resources Officer. The Executive Information Security Oversight Committee facilitates notification to the Audit Committee of emerging cybersecurity risks, and threats, the status of projects to strengthen the Company’s information security systems, and updates on any cybersecurity incidents.
The Audit Committee of the Board of Directors oversees cybersecurity related risks. Members of the Audit Committee receive the above referenced notifications and updates on a quarterly basis from the Company’s Chief Information Officer as the designated representative of the Executive Information Security Oversight Committee.
Additionally, the Company has a written Information Security Policy and a Cybersecurity Incident Response Plan that provides the above-referenced processes by which such committees are informed of and monitor the prevention, detection, mitigation, and remediation of cybersecurity incidents and material risks from cybersecurity threats.
Item 2. Properties
We own and lease certain properties, as noted in the below table:
| | | | | |
| Square
Footage/
Acres | Leased /
Owned | Lease
Expiration
Dates | Location | Purpose |
| | | | | |
Corporate Headquarters | 62,210 SF | Owned | N/A | Virginia | Office Space |
| | | | | |
Corporate Headquarters | 8 Acres | Owned | N/A | Virginia | Land |
| | | | | |
Trex Residential | 2,421,733 SF | Leased | 2024 – 2035 | Virginia / West Virginia /
Nevada/
Arkansas | Warehouse, Research and
Development, Storage,
Training and
Manufacturing Facilities |
| | | | | |
Trex Residential | 1,525,254 SF /
473 Acres | Owned | N/A | Virginia /
Nevada /
Arkansas | Manufacturing Facilities,
Storage and Office Space |
We regularly evaluate our various facilities and equipment and make capital investments where necessary. In 2024, we spent a total of $232.3 million on capital expenditures, primarily at our Trex Residential facilities, including $174.8 million related to construction of our Arkansas facility, $14.7 million related to capacity expansion at our Virginia facilities, $14.5 million related to general plant cost reduction initiatives at our Virginia and Nevada facilities, and $17.0 million for general support, safety and environmental initiatives.
In October 2021, the Company announced plans to add a third manufacturing facility located in Little Rock, Arkansas (Little Rock). Construction on the new facility began in the second quarter of 2022. In connection with the construction of the new facility, during 2024 the Company and Little Rock entered into an agreement in which Little Rock agreed to issue up to $450 million of its industrial revenue bonds (IRBs) for the purpose of constructing a manufacturing facility. Under the agreement, the Company transferred ownership of the facility to Little Rock and simultaneously leased the related asset from Little Rock. The Company is also the purchaser of the IRBs and, therefore, is the bondholder as well as the lessee of the Little Rock facility purchased with the IRB proceeds. As a result of the agreement, the Company was able to reduce the cost of certain state and local tax expenditures for twenty years. The Company has a purchase option included in the lease agreement for below the fair value of the asset, which prevents the transfer of the asset to Little Rock from being recognized as a sale. Furthermore, the Company has not derecognized the transferred asset and continues to recognize it in property, plant and equipment in the Consolidated Balance Sheets. The Company has the right and intends to set-off any obligations to make payments under the finance liability, with proceeds due from the IRBs. The liability and IRB asset are equal and are reported net in the Consolidated Balance Sheets.
For information about our leases, see Note 10 to our Consolidated Financial Statements appearing elsewhere in this report. The equipment and machinery we use in our operations consist principally of plastic and wood conveying and processing equipment. We own all of our manufacturing equipment. We lease some equipment, primarily forklifts, at our facilities under operating leases.
Item 3. Legal Proceedings
The Company has lawsuits, as well as other claims, pending against it which are ordinary routine litigation and claims incidental to the business. Management has evaluated the merits of these lawsuits and claims and believes that their ultimate resolution will not have a material effect on the Company’s consolidated financial condition, results of operations, liquidity or competitive position.
Item 4. Mine Safety Disclosures.
Not applicable.
PART II
Item 5. Market for Registrant’s Common Equity, Related Stockholder Matters and Issuer Purchases of Equity Securities
Market for Common Stock
Our common stock has been listed on the New York Stock Exchange (NYSE) since April 8, 1999. Effective November 23, 2009, our common stock is listed under the symbol “TREX”.
Dividend Policy
We have never paid cash dividends on our common stock and our credit agreement places limitations on our ability to pay cash dividends. We intend to retain future earnings to finance the development and expansion of our business or the repurchase of our common shares and, therefore, have no current intention to pay cash dividends. However, we reconsider our dividend policy on a regular basis and may determine to pay dividends in the future.
Issuer Purchases of Equity Securities
The following table provides information relating to the purchases of our common stock during the three months ended December 31, 2024 in accordance with Item 703 of Regulation S-K:
| | | | | | | | | | | | | | | | |
Period | | (a)
Total Number of
Shares (or Units)
Purchased (1) | | | (b)
Average Price Paid
per Share (or Unit)
($) | | | (c)
Total Number of
Shares (or Units)
Purchased as Part of
Publicly Announced
Plans or Programs (2) | | | (d)
Maximum number of
Shares (or Units) that
May Yet Be
Purchased Under the
Plan or Program | |
October 1, 2024 – October 31, 2024 | | | 758,782 | | | $ | 65.94 | | | | 758,240 | | | | 8,954,464 | |
November 1, 2024 – November 30, 2024 | | | 3,677 | | | $ | 70.21 | | | | — | | | | 8,954,464 | |
December 1, 2024 – December 31, 2024 | | | — | | | $ | — | | | | — | | | | 8,954,464 | |
Quarter ended December 31, 2024 | | | 762,459 | | | | | | | 758,240 | | | | |
(1)During the three months ended December 31, 2024, 4,219 shares of common stock were withheld by, or delivered to, the Company pursuant to provisions in agreements with recipients of restricted stock granted under the Company’s 2014 and 2023 Stock Incentive Plan allowing the Company to withhold, or the recipient to deliver to the Company, the number of shares having the fair value equal to the tax withholding due.
(2)On May 4, 2023, the Trex Board of Directors adopted a stock repurchase program (2023 Stock Repurchase Program) of up to 10.8 million shares of the Company's outstanding common stock. The 2023 Stock Repurchase Program has no set expiration date and 758,240 shares were repurchased under the program during the three months ended December 31, 2024.
Stockholder Return Performance Graph
The following graph and table show the cumulative total stockholder return on the Company’s common stock for the last five fiscal years compared to the Russell 2000 Index and the Standard and Poor’s 600 Building Products Index (S&P 600 Building Products). The graph assumes $100 was invested on December 31, 2019, in (1) the Company’s common stock, (2) the Russell 2000 Index and (3) the S&P 600 Building Products and assumes reinvestment of dividends and market capitalization weighting as of December 31, 2020, 2021, 2022, 2023 and 2024.
Comparison of Cumulative Total Return
Among Trex Company, Inc., Russell 2000 Index, and S&P 600 Building Products Index
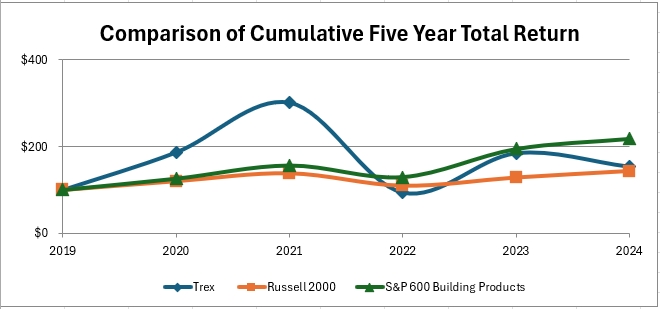
| | | | | | | | | | | | | | | | | | | | | | | | |
| | 12/31/2019 | | | 12/31/2020 | | | 12/31/2021 | | | 12/31/2022 | | | 12/31/2023 | | | 12/31/2024 | |
Trex Company, Inc. | | $ | 100.00 | | | $ | 186.29 | | | $ | 300.46 | | | $ | 94.19 | | | $ | 184.22 | | | $ | 153.60 | |
Russell 2000 Index | | $ | 100.00 | | | $ | 119.96 | | | $ | 137.94 | | | $ | 109.74 | | | $ | 128.33 | | | $ | 143.14 | |
S&P 600 Building Products | | $ | 100.00 | | | $ | 126.06 | | | $ | 156.56 | | | $ | 129.71 | | | $ | 194.49 | | | $ | 218.00 | |
Other Stockholder Matters
As of February 10, 2025, there were approximately 130 holders of record of our common stock, although we believe that there are a significantly larger number of beneficial owners of our common stock.
In 2024, we submitted to the NYSE in a timely manner the annual certification that our Chief Executive Officer was not aware of any violation by us of the NYSE corporate governance listing standards.
Item 6. [Reserved]
Item 7. Management’s Discussion and Analysis of Financial Condition and Results of Operations
This Management’s Discussion and Analysis of Financial Condition and Results of Operations (MD&A) contains forward-looking statements within the meaning of Section 27A of the Securities Act of 1933 and Section 21E of the Securities Exchange Act of 1934. All statements regarding our expected financial position and operating results, our business strategy, our financing plans, forecasted demographic and economic trends relating to our industry and similar matters are forward-looking statements. These statements can sometimes be identified by our use of forward-looking words such as “may,” “will,” “anticipate,” “estimate,” “expect,” “intend” or similar expressions. We cannot promise you that our expectations in such forward-looking statements will turn out to be correct. Our actual results could be materially different from our expectations because of various factors, including the factors discussed under “Item 1A. Risk Factors.” These statements are also subject to risks and uncertainties that could cause the Company’s actual operating results to differ materially. Such risks and uncertainties include, but are not limited to, the extent of market acceptance of the Company’s current and newly developed products; the costs associated with the development and launch of new products and the market acceptance of such new products; the sensitivity of the Company’s business to general economic conditions; the impact of seasonal and weather-related demand fluctuations on inventory levels in the distribution channel and sales of the Company’s products; the availability and cost of third-party transportation services for the Company’s products and raw materials; the Company’s ability to obtain raw materials, including scrap polyethylene, wood fiber and other materials used in making our products, at acceptable prices; increasing inflation in the macro-economic environment; the Company’s ability to maintain product quality and product performance at an acceptable cost; the Company’s ability to increase throughput and capacity to adequately match supply with demand; the level of expenses associated with warranty claims, product replacement and consumer relations expenses related to product quality; the highly competitive markets in which the Company operates; cyber-attacks, security breaches or other security vulnerabilities; the impact of current and upcoming data privacy laws and the EU General Data Protection Regulation and the related actual or potential costs and consequences; material adverse impacts from global public health pandemics and geopolitical conflicts; and material adverse impacts related to labor shortages or increases in labor costs.
OVERVIEW
The following MD&A is intended to help the reader understand the operations and current business environment of the Company. The MD&A is provided as a supplement to — and should be read in conjunction with — our Consolidated Financial Statements and the accompanying notes thereto contained in “Item 8. Financial Statements and Supplementary Data” of this report. MD&A includes the following sections:
•Our Business — a general description of our business, a brief overview of our products, and highlights for the twelve months ended December 31, 2024.
•Critical Accounting Estimates — a discussion of accounting policies that require critical judgments and estimates.
•Results of Operations — an analysis of our consolidated results of operations for 2024 and 2023 and year-to-year comparisons. An analysis of our consolidated results of operations for 2023 and 2022 and year-to-year comparisons between 2023 and 2022 can be found in MD&A in Part II, Item 7 of the Company’s Form 10-K for the year ended December 31, 2023.
•Liquidity and Capital Resources — an analysis of cash flows, contractual obligations, and a discussion of our capital and other cash requirements.
•New Accounting Standards — a general description of new accounting standards applicable to our business and a discussion of their expected impact.
OUR BUSINESS
General. The Company is the world’s largest manufacturer of high-performance, low-maintenance wood-alternative decking and residential railing and outdoor living products and accessories, marketed under the brand name Trex®, with more than 30 years of product experience. A majority of our products are manufactured in a proprietary process that combines reclaimed wood fibers and recycled polyethylene. The Company is focused on using renewable resources within our Trex Residential segment. Also, through December 30, 2022, the Company provided custom-engineered commercial railing and staging systems for the commercial and multi-family market, including sports stadiums and performing arts venues. During the year ended December 31, 2022, the Company operated in two reportable segments: Trex Residential Products (Trex Residential), the Company’s principal business based on net sales, and Trex Commercial Products (Trex Commercial). On December 30, 2022, we completed the sale of substantially all of the assets of our wholly-owned subsidiary and reportable segment, Trex Commercial. Subsequent to the sale of Trex Commercial, the Company operates in one reportable segment, Trex Residential.
Outdoor living remains one of the fastest growing categories within the repair and remodel sector, and the strength of the Trex Residential brand coupled with our expanded manufacturing capacity, our key competitive advantages, help us to effectively unlock potential market share and drive long term growth. We continue to benefit from increasing consumer interest in our environmentally friendly, low maintenance product portfolio that transforms and enhances the outdoor living experience.
We continue to focus on cost reduction projects and identifying continuous improvement opportunities to enhance our margins. Specifically, our efforts are primarily centered on increased automation, modernization, enhanced energy efficiency and improvements to raw material processing. At the same time, we intend to expand our marketing campaigns, continue highlighting the advantages of Trex Residential decking over wood, as well as focusing on innovation and new product development to further strengthen our consumer brand and distribution advantages. These initiatives should help drive continued topline and profit growth and accelerated market share conversion.
Trex Residential is the world’s largest manufacturer of wood-alternative composite decking and railing products marketed under the brand name Trex® and manufactured in the United States. We offer a comprehensive set of aesthetically pleasing, high-performance, low maintenance, eco-friendly products in the decking, railing, fencing, cladding and outdoor lighting categories. We believe that the range and variety of our products allow consumers to design much of their outdoor living space using Trex brand products.
We offer the following composite decking and railing products through Trex Residential:
| |
Decking and Accessories | Trex Signature® decking Trex Transcend® Lineage™ decking Trex Transcend® decking Trex Select® decking Trex Enhance® decking Trex Hideaway® Fastener Collection Trex DeckLighting™ outdoor lighting system |
Railing | Trex Signature® X-Series™ railing Trex Signature® Aluminum railing Trex Transcend railing Trex Select® railing Trex Select® T-Rail Trex Enhance™ railing |
Fencing | Trex Seclusions® fencing |
Trex Commercial offered modular and architectural railing and staging systems and solutions for the commercial and multifamily market, including sports stadiums and performing arts venues, through the date of divesture on December 30, 2022.
Highlights:
•Trex tops the Rankings of BUILDER magazine’s annual Brand Use Study. Trex received the highest scores for brand awareness, emerged as the #1 brand used most by Pro Builders and Pro Remodel Contractors in both the Composite/PVC Decking and Deck Railings categories.
•Trex Expands Canadian Reach by partnering with Alexandria Moulding. The leading North American manufacturer and distributor will bring Trex’s premium decking and railing products to a broader range of Canadian retailers, homeowners, and contractors.
•Trex Team with Weyerhaeuser to Expand Distribution across California, Nevada, Arizona, and New Mexico, significantly expanding Trex’s presence across the Southwest Region.
•Trex Expands Distribution with International Wood Products (IWP) strengthening presence in Northern California and Northern Nevada. As part of this move IWP will exclusively stock Trex decking and railing at all of its distribution facilities in the Western United States.
•Trex Launches National Drop Off Directory for Plastic Bag and Film Recycling. The directory is the only online searchable platform dedicated to connecting Americans with Trex recycling partners in their local community.
•Trex Adds Two New Enhance® Decking Hues with heat mitigating technology.
•Trex Launches New Trex Signature® X-Series™ Railing. Trex has expanded its popular Trex Signature® Railing line with the introduction of X-Series™ Cable Rail and X-Series™ Frameless Glass Rail.
•Trex's 2023 Sustainability Report Showcases Ongoing Progress across the broad spectrum of Company activities.
•Trex Named Most Sustainable Decking Brand by Green Builder Media for 14th Consecutive Year and the only brand to be recognized as a sustainability leader for all 14 years of the program.
•Trex Expands Railing Portfolio with Launch of Trex Signature® X-Series™. Trex has launched two new specialty railing offerings with Trex Signature® X-Series™ Cable Rail and Trex Signature® X-Series™ Frameless Glass Rail.
•Trex Transcend® Lineage recognized by Good Housekeeping as a winner in their 2024 Sustainable Innovation Awards.
•Trex Ranked Among Barron’s 100 Most Sustainable Companies for 2024. Trex was honored by Baron’s for outstanding leadership in environmental, social, and governance practices and was the only decking brand to be included on this year’s list.
•Trex awarded Morris Tolly National Supplier of the Year by Builders FirstSource, and Supplier of the Year for the Northeast Region.
•Trex Launches Comprehensive Fastener Collection. In February 2024, Trex launched its Hideaway® Fastener Collection, providing solutions for every composite deck fastening and finishing need.
•Trex Celebrated with Six Awards for Product Excellence and Innovation for decking and railing products from organizations representing audiences and input from across the building industry.
Financial Performance Highlights for the Twelve Months Ended December 31, 2024:
| | | | | | | | | | | | | | | | |
| | Year Ended
December 31, | | | | | | | |
| | 2024 | | | 2023 | | | $ Change | | | % Change | |
(000s omitted, except per share data) | | | | | | | | | | | | |
Net sales | | $ | 1,151,449 | | | $ | 1,094,837 | | | $ | 56,612 | | | | 5.2 | % |
Gross profit | | $ | 485,668 | | | $ | 452,407 | | | $ | 33,261 | | | | 7.4 | % |
Net income | | $ | 226,392 | | | $ | 205,384 | | | $ | 21,008 | | | | 10.2 | % |
EBITDA* | | $ | 360,343 | | | $ | 326,393 | | | $ | 33,950 | | | | 10.4 | % |
Diluted earnings per share | | $ | 2.09 | | | $ | 1.89 | | | $ | 0.20 | | | | 10.6 | % |
*A reconciliation of Net Income to EBITDA is presented on pages 31 of this document under “Net Income and Earnings Before Interest, Taxes, Depreciation and Amortization (EBITDA).”
Capital expenditures. In 2024, we spent a total of $232.3 million on capital expenditures, primarily at our Trex Residential facilities, including $174.8 million related to construction of our Arkansas facility, $14.7 million related to capacity expansion at our Virginia facilities, $14.5 million related to general plant cost reduction initiatives at our Virginia and Nevada facilities, and $17.0 million for general support, safety and environmental initiatives.
Repurchase of common shares. We repurchased 1,580,640 shares of our outstanding common stock in 2024 under our stock repurchase programs.
CRITICAL ACCOUNTING ESTIMATES
Our significant accounting policies are described in Note 2 to our Consolidated Financial Statements appearing elsewhere in this report. Our critical accounting estimates include the areas where we have made what we consider to be particularly difficult, subjective or complex judgments in making estimates, and where these estimates can significantly affect our financial results under different assumptions and conditions. We prepare our financial statements in conformity with accounting principles generally accepted in the United States. As a result, we are required to make estimates, judgments, and assumptions that we believe are reasonable based upon the information available. These estimates, judgments and assumptions affect the reported amounts of assets and liabilities at the date of the financial statements and the reported amounts of revenue and expenses during the periods presented. Actual results could be different from these estimates.
Product Warranty. We warrant that for the applicable warranty period our Trex Residential products, when properly installed, used and maintained, will be free from material defects in workmanship and materials and our decking, cladding, fascia and railing products will not split, splinter, rot or suffer structural damage from termites or fungal decay.
Products sold on or after January 1, 2023: The warranty period for residential use is 50 years for Transcend® decking, 35 years for Select® decking and Universal Fascia, and 25 years for Enhance® decking and Transcend, Select, Enhance and Signature® railing. The warranty period for commercial use is 10 years, excluding Signature railing and Transcend cladding, which each have a warranty period of 25 years. We further warrant that Trex Transcend, Trex Enhance and Trex Select decking and cladding and Universal Fascia products will not fade in color from light and weathering exposure more than a certain amount and will be resistant to permanent staining from food and beverage substances or mold and mildew, provided the stain is cleaned within seven days of appearance, for the warranty period referred to above. If there is a breach of such warranties, we have an obligation either to replace the defective product or refund the purchase price.
Products sold prior to January 1, 2023: The warranty period is 25 years for residential use and 10 years for commercial use. With respect to Trex Signature railing, the warranty period is 25 years for both residential and commercial use. We further warrant that Trex Transcend, Trex Enhance, Trex Select and Universal Fascia products will not fade in color more than a certain amount and will be resistant to permanent staining from food substances or mold, provided the stain is cleaned within seven days of appearance, for the warranty period referred to above. If there is a breach of such warranties, we have an obligation either to replace the defective product or refund the purchase price. We maintain a warranty reserve for the settlement of our product warranty claims. We accrue for the estimated cost of product warranty claims at the time revenue is recognized based on such factors as historical claims experience and future claims experience. We review and adjust these estimates, if necessary, based on the differences between actual experience and historical estimates. Additionally, we accrue for warranty costs associated with occasional or unanticipated product quality issues if a loss is probable and can be reasonably estimated.
We continue to receive and settle claims for Trex Residential products manufactured at our Nevada facility prior to 2007 that exhibit surface flaking and maintain a warranty reserve to provide for the settlement of these claims. Estimating the warranty reserve for surface flaking claims requires management to estimate (1) the number of claims to be settled with payment and (2) the average cost to settle each claim.
To estimate the number of surface flaking claims to be settled with payment, we utilize actuarial techniques to quantify both the expected number of claims to be received and the percentage of those claims that will ultimately require payment (collectively, elements). Estimates for these elements are quantified using a range of assumptions derived from claim count history and the identification of factors influencing the claim counts. The cost per claim varies due to a number of factors, including the size of affected decks, the availability and type of replacement material used, the cost of production of replacement material and the method of claim settlement.
We monitor surface flaking claims activity each quarter for indications that our estimates require revision. Typically, a majority of surface flaking claims received in a year are received during the summer outdoor season, which spans the second and third quarters. It has been our practice to utilize the actuarial techniques discussed above during the third quarter, after a significant portion of all claims has been received for the fiscal year and variances to annual claims expectations are more meaningful.
Average cost per claim experienced in the year ended December 31, 2024, was lower than that experienced in the year ended December 31, 2023, and lower than our expectations for 2024. The number of incoming claims received in the year ended December 31, 2024, was lower than the number of claims received in the year ended December 31, 2023, and higher than our expectations for 2024. After evaluating trends in incoming claims and closures in its actuarial analysis and combining these factors with future cost estimates, the Company recorded a reduction of $1.5 million to its warranty reserve for the future settlement of Surface Flaking claims in 2024. We believe the reserve at December 31, 2024 is sufficient to cover future surface flaking obligations.
Our analysis is based on currently known facts and a number of assumptions, as discussed above, and current expectations. Projecting future events such as the number of claims to be received, the number of claims that will require payment and the average cost of claims could cause the actual warranty liabilities to be higher or lower than those projected, which could materially affect our financial condition, results of operations or cash flows. We estimate that the annual number of claims received will continue to decline over time and that the average cost per claim will increase slightly, primarily due to inflation. If the level of claims received or average cost per claim differs materially from expectations, it could result in additional increases or decreases to the warranty reserve and a decrease or increase in earnings and cash flows in future periods. We estimate that a 10% change in the expected number of remaining claims to be settled with payment or the expected cost to settle claims may result in approximately a $0.6 million change in the estimate of the surface flaking warranty reserve.
The following table details surface flaking warranty claims activity:
| | | | | | | | | | | | |
| | Year Ended December 31, | |
| | 2024 | | | 2023 | | | 2022 | |
Claims unresolved beginning of period | | | 1,695 | | | | 1,729 | | | | 1,759 | |
Claims received (1) | | | 457 | | | | 521 | | | | 592 | |
Claims resolved (2) | | | (478 | ) | | | (555 | ) | | | (622 | ) |
Claims unresolved end of period | | | 1,674 | | | | 1,695 | | | | 1,729 | |
Average cost per claim (3) | | $ | 3,281 | | | $ | 4,221 | | | $ | 4,987 | |
(1)Claims received include new claims received or identified during the period.
(2)Claims resolved include all claims settled with or without payment and closed during the period.
(3)Average cost per claim represents the average settlement cost of claims closed with payment during the period.
For additional information about product warranties, see Notes 2 and 19 to the Consolidated Financial Statements appearing elsewhere in this report.
Goodwill. We evaluate the recoverability of goodwill in accordance with Accounting Standard Codification (ASC) Topic 350, “Intangibles—Goodwill and Other,” annually or more frequently if an event occurs or circumstances change in the interim that would more likely than not reduce the fair value of the asset below its carrying amount. We evaluate the recoverability of goodwill at the reporting unit level. During the year ended December 31, 2022, we determined that the Company had three reporting units: a residential reporting unit in the Trex Residential reportable segment, and a commercial railing reporting unit and a staging reporting unit in the Trex Commercial reportable segment. On December 30, 2022, we completed the sale of substantially all of the assets of our wholly-owned subsidiary and reportable segment, Trex Commercial. Subsequent to the sale of Trex Commercial, the Company has one reporting unit in Trex Residential reportable segment. Goodwill is considered impaired when the carrying amount of a reporting unit exceeds its fair value, and an impairment loss is recognized in an amount equal to that excess but limited to the total amount of goodwill allocated to that reporting unit. We first assess qualitative factors to determine if it is more likely than not that the fair value of the reporting unit is less than its carrying amount, including goodwill. Qualitative factors we consider include events and circumstances such as macroeconomic conditions, industry and market considerations, cost factors, overall financial performance, and other relevant Company-specific events. We evaluate, based on the weight of evidence, the significance of all identified events and circumstances in the context of determining whether it is more likely than not that the fair value of a reporting unit is less than its carrying amount. Weighing the effect of various positive and negative factors is challenging and requires the use of significant judgment. The weight we place on each factor depends on certain conditions, including uncertainty about future events. If different conditions exist in future periods, future impairment charges could result.
If the qualitative assessment indicates that the carrying amount of the reporting unit exceeds its fair value, including goodwill, we are then required to perform a quantitative goodwill impairment test. The quantitative goodwill impairment test, used to identify both the existence of impairment and the amount of impairment loss, compares the fair value of a reporting unit with its carrying amount, including goodwill. The fair value of a reporting unit refers to the price that would be received to sell the unit as a whole in an orderly transaction between market participants at the measurement date. If the carrying amount of a reporting unit is in excess of the estimated fair value of that reporting unit, a goodwill impairment charge is recognized in the amount by which the reporting unit’s carrying amount exceeds its fair value, but not to exceed the total goodwill assigned to the reporting unit.
Revenue Recognition
Trex Residential Products
Trex Residential principally generates revenue from the manufacture and sale of its high-performance, low-maintenance, eco-friendly outdoor living products, consisting of composite decking and railing products, hidden fasteners, and a broad offering of outdoor living accessories. Substantially all of its revenues are from contracts with customers, which are individual customer purchase orders of short-term duration of less than one year. Trex Residential satisfies its performance obligations at a point in time. The shipment of each product is a separate performance obligation as the customer is able to derive benefit from each product shipped and no performance obligation remains after shipment. Upon shipment of the product, the customer obtains control over the distinct product and Trex Residential satisfies its performance obligation. Any performance obligation that remains unsatisfied at the end of a reporting period is part of a contract that has an original expected duration of one year or less. Any variable consideration related to the unsatisfied performance obligation is allocated wholly to the unsatisfied performance obligation and recognized when the product ships and the performance obligation is satisfied and is included in “Accrued expenses and other liabilities, Sales and marketing” in Note 8 to the Consolidated Financial Statements presented in this Form 10-K.
Trex Residential may offer various sales incentive programs throughout the year. It estimates the amount of sales incentive to allocate to each performance obligation, or product shipped, based on direct sales to the customer. The estimate is updated each reporting period and any changes are allocated to the performance obligations on the same basis as at inception. Changes in estimate allocated to a previously satisfied performance obligation are recognized as a reduction of revenue in the period in which the change occurs under the cumulative catch-up method. Should estimates change or prove to have been incorrect, it could negatively affect our results of operations and financial condition. In addition to sales incentive programs, Trex Residential may offer payment discounts. It estimates the payment discount that it believes will be taken by the customer based on prior history using the most-likely-amount method of estimation.
Trex Commercial Products
Trex Commercial generated revenue from the manufacture and sale of its custom, modular and architectural railing and staging systems. All of its revenues were from fixed-price contracts with customers. Trex Commercial contracts had a single performance obligation as the promise to transfer the individual goods or services was not separately identifiable from other promises in the contract and was, therefore, not distinct.
Trex Commercial satisfied its performance obligation over time as work progressed because control was transferred continuously to its customers. Revenue and estimated profit were recognized over time based on the proportion of actual costs incurred to date relative to total estimated costs at completion to measure progress toward satisfying the performance obligation. Incurred costs represent work performed, which corresponds with, and thereby best depicts, the transfer of control to the customer. Incurred costs included all direct material, labor, subcontract and certain indirect costs. The Company reviewed and updated its estimates regularly and recognized adjustments in estimated profit on contracts under the cumulative catch-up method. Under this method, the impact of the adjustment on revenue and estimated profit to date on a contract is recognized in the period the adjustment is identified. If at any time the estimate of contract profitability indicated an anticipated loss on the contract, the Company recognized the total loss in the period it was identified. During the year ended December 31, 2022, no adjustment to any one contract was material to the Company’s Consolidated Financial Statements and no material impairment loss on any contract was recorded.
RESULTS OF OPERATIONS
General. Our results of operations are affected by a number of factors, including, but not limited to, the cost to manufacture and distribute products, cost of raw materials, inflation, interest rates, tariffs, consumer spending and preferences, the impact of any supply chain disruptions, economic conditions, and any adverse effects from global health pandemics and geopolitical conflicts.
Net Sales. Net sales consist of sales, net of discounts. The level of net sales is principally affected by sales volume and the prices paid for Trex products. The operating results for Trex Residential have historically varied from quarter to quarter, often due to seasonal trends in the demand for outdoor living products. Seasonal, erratic, or prolonged adverse weather conditions in certain geographic regions reduce the level of home improvement and construction activity and can shift demand for its products to a later period. As part of its normal business practice and consistent with industry practices, Trex Residential has historically offered incentive programs to its distributors and dealers to build inventory levels before the start of the prime deck-building season to ensure adequate availability of its product to meet anticipated seasonal consumer demand and to enable production planning. These incentives include prompt payment discounts and favorable payment terms. In addition, we offer price discounts or volume rebates on specified products and other incentives based on increases in purchases as part of specific promotional programs. The timing of sales incentive programs can impact sales, receivables and inventory levels during the offering period. In addition, the operating results for Trex Commercial have not historically varied from quarter to quarter as a result of seasonality, but are driven by the timing of individual projects, which may vary significantly each period.
Gross Profit. Gross profit represents the difference between net sales and cost of sales. Cost of sales consists of raw materials costs, direct labor costs, manufacturing costs, warranty costs, and freight. Raw materials costs generally include the costs to purchase and transport reclaimed wood fiber, scrap polyethylene and pigmentation for coloring Trex products. Direct labor costs include wages and benefits of personnel engaged in the manufacturing process. Manufacturing costs consist of costs of depreciation, utilities, maintenance supplies and repairs, indirect labor, including wages and benefits, and warehouse and equipment rental activities.
Selling, General and Administrative Expenses. The largest component of selling, general and administrative expenses is personnel related costs, which include salaries, commissions, incentive compensation, and benefits of personnel engaged in sales and marketing, accounting, information technology, corporate operations, research and development, and other business functions. Another component of selling, general and administrative expenses is branding and other sales and marketing costs, which are used to build brand awareness of Trex. These costs consist primarily of advertising, merchandising, and other promotional costs. Other general and administrative expenses include professional fees, office occupancy costs attributable to the business functions previously referenced, and consumer relations expenses. As a percentage of net sales, selling, general and administrative expenses have varied from quarter to quarter due, in part, to the seasonality of our business.
Below we have included a discussion of our operating results and material changes in our operating results for the year ended December 31, 2024, compared to the year ended December 31, 2023.
Year Ended December 31, 2024 Compared To Year Ended December 31, 2023
Net Sales
| | | | | | | | | | | | | | | | |
| | Year Ended December 31, | | | | | | | |
| | 2024 | | | 2023 | | | $ Change | | | % Change | |
| | (dollars in thousands) | |
Total net sales | | $ | 1,151,449 | | | $ | 1,094,837 | | | $ | 56,612 | | | | 5.2 | % |
Total net sales in 2024 increased $56.6 million, or 5.2%, compared to total net sales in 2023, primarily due to the changes to our early-buy program running January to March, rather than our historical December to March timeframe.
Gross Profit
| | | | | | | | | | | | | | | | |
| | Year Ended December 31, | | | | | | | |
| | 2024 | | | 2023 | | | $ Change | | | % Change | |
| | (dollars in thousands) | |
Cost of sales | | $ | 665,781 | | | $ | 642,430 | | | $ | 23,351 | | | | 3.6 | % |
% of total net sales | | | 57.8 | % | | | 58.7 | % | | | | | | |
Gross profit | | $ | 485,668 | | | $ | 452,407 | | | $ | 33,261 | | | | 7.4 | % |
Gross margin | | | 42.2 | % | | | 41.3 | % | | | | | | |
Gross profit as a percentage of net sales, gross margin, was 42.2% in 2024 compared to 41.3% in 2023. The increase was primarily due to efficiencies resulting from cost saving initiatives. The increase was partially offset by higher labor costs and overhead expenses.
Selling, General and Administrative Expenses
| | | | | | | | | | | | | | | | |
| | Year Ended December 31, | | | | | | | |
| | 2024 | | | 2023 | | | $ Change | | | % Change | |
| | (dollars in thousands) | |
Selling, general and administrative expenses | | $ | 179,995 | | | $ | 176,203 | | | $ | 3,792 | | | | 2.2 | % |
% of total net sales | | | 15.6 | % | | | 16.1 | % | | | | | | |
Selling, general and administrative expenses decreased slightly year over year as a percentage of net sales, primarily as a result of increased sales offset by a $3.8 million increase in expense. The increase was due to a $4.7 million increase in branding expenses, a $1.2 million increase in facilities and support, and a $1.0 million increase in depreciation and amortization, partially offset by a decrease of $3.3 million in personnel expenses, due to lower incentive compensation.
Provision for Income Taxes
| | | | | | | | | | | | | | | | |
| | Year Ended December 31, | | | | | | | |
| | 2024 | | | 2023 | | | $ Change | | | % Change | |
| | (dollars in thousands) | |
Provision for income taxes | | $ | 79,292 | | | $ | 70,815 | | | $ | 8,477 | | | | 12.0 | % |
Effective tax rate | | | 25.9 | % | | | 25.6 | % | | | | | | |
The effective tax rate for 2024 of 25.9% was comparable to the effective tax rate for 2023 of 25.6%.
Net Income and Earnings Before Interest, Taxes, Depreciation and Amortization (EBITDA)1 (dollars in thousands)
Reconciliation of net income (GAAP) to EBITDA (non-GAAP):
| | | | |
| | Year Ended
December 31, 2024 | |
Net income | | $ | 226,392 | |
Interest (income), net | | | (11 | ) |
Income tax expense | | | 79,292 | |
Depreciation and amortization | | | 54,670 | |
EBITDA | | $ | 360,343 | |
| | | | |
| | Year Ended December 31, 2023 | |
Net income (loss) | | $ | 205,384 | |
Interest expense, net | | | 5 | |
Income tax expense (benefit) | | | 70,815 | |
Depreciation and amortization | | | 50,189 | |
EBITDA | | $ | 326,393 | |
1.EBITDA represents net income before interest, income taxes, depreciation and amortization. EBITDA is not a measurement of financial performance under accounting principles generally accepted in the United States (GAAP). We have included data with respect to EBITDA because management believes the measures facilitate performance comparison between the Company and its competitors. Management considers EBITDA to be important supplemental indicators of our core operating performance because the measures eliminate interest, income taxes, and depreciation and amortization charges to net income. In relation to its competitors, EBITDA eliminates differences among companies in capitalization and tax structures, capital investment cycles and ages of related assets, especially when comparing financial results to prior periods. For these reasons, management believes that EBITDA provides important information regarding the operating performance of the Company. Non-GAAP measures are not meant to be considered superior to or a substitute for our GAAP results.
| | | | | | | | | | | | | | | | |
| | Year Ended December 31, | | | | | | | |
| | 2024 | | | 2023 | | | $ Change | | | % Change | |
| | (dollars in thousands) | |
EBITDA | | $ | 360,343 | | | $ | 326,393 | | | $ | 33,950 | | | | 10.4 | % |
Total EBITDA increased 10.4% to $360.3 million for 2024 compared to $326.4 million for 2023. The increase was driven by an increase in net sales and gross profit.
Year Ended December 31, 2023 Compared To Year Ended December 31, 2022
The Company hereby incorporates by reference the financial results from fiscal year 2022 and the comparison of financial results from fiscal year 2023 to fiscal year 2022 as set forth in the Company’s Management’s Discussion and Analysis of Financial Condition and Results of Operation in the Annual Report on Form 10-K for the year ended December 31, 2023 and filed with the U.S. Securities and Exchange Commission on February 26, 2024.
LIQUIDITY AND CAPITAL RESOURCES
We finance operations and growth primarily with cash flow from operations, borrowings, operating leases, and normal trade credit terms from operating activities.
Sources and Uses of Cash. The following table summarizes our cash flows from operating, investing and financing activities for the years ended December 31, 2024, 2023, and 2022 (in thousands):
| | | | | | | | | | | | |
| | Year Ended December 31, | |
| | 2024 | | | 2023 | | | 2022 | |
Net cash provided by operating activities | | $ | 143,929 | | | $ | 389,420 | | | $ | 216,220 | |
Net cash used in investing activities | | | (236,535 | ) | | | (166,089 | ) | | | (168,884 | ) |
Net cash provided by (used in) financing activities | | | 91,939 | | | | (233,697 | ) | | | (176,064 | ) |
Net decrease in cash and cash equivalents | | $ | (667 | ) | | $ | (10,366 | ) | | $ | (128,728 | ) |
Operating Activities
Cash provided by operating activities in 2024 was $143.9 million compared to cash provided by operating activities of $389.4 million in 2023. The $216.2 million decrease in cash provided by operating activities was primarily a result of an increase in inventories, and to a lesser extent, impacted by increases in accounts receivable. The increase in inventories is the result of increased production in 2024 compared to 2023 as we prepare for our 2025 early buy program, the launch of new products, and to ensure appropriate product availability during the peak of the season.
Investing Activities
In 2024, cash used in investing activities for capital expenditures was $232.2 million, primarily at our Trex Residential facilities, including $174.8 million related to construction of our Arkansas facility, $14.7 million related to capacity expansion at our Virginia facilities, $14.5 million related to general plant cost reduction initiatives at our Virginia and Nevada facilities, and $17.0 million for general support, safety, and environmental initiatives.
Financing Activities
Net cash provided by financing activities in 2024 consisted primarily of borrowings under our revolving credit facility used to fund our capital expenditures and to a lesser extent share repurchases.
Stock Repurchase Program. On February 16, 2018, the Trex Board of Directors adopted a stock repurchase program of up to 11.6 million shares of its outstanding common stock (Stock Repurchase Program). The Company repurchased 10.1 million shares under the Stock Repurchase Program. On May 4, 2023, the Trex Board of Directors adopted a new stock repurchase program (2023 Stock Repurchase Program) of up to 10.8 million shares of its outstanding common stock, and terminated the existing Stock Repurchase Program. The 2023 Stock Repurchase Program has no set expiration date and during 2024 the Company repurchased 1,580,640 shares of its common stock under the 2023 Stock Repurchase Program.
Inventory in Distribution Channels. We sell our Trex Residential decking and railing products through a tiered distribution system. We have over 50 distributors worldwide and two national retail merchandisers to which we sell our products. The distributors in turn sell the products to dealers and retail locations who in turn sell the products to end users. Significant increases in inventory levels in the distribution channel without a corresponding change in end-use demand could have an adverse effect on future sales.
Seasonality. The operating results for Trex Residential have historically varied from quarter to quarter. Seasonal, erratic or prolonged adverse weather conditions may reduce the level of home improvement and construction activity and can shift demand for its products to a later period. As part of its normal business practice and consistent with industry practice, Trex Residential has historically offered incentive programs to its distributors and dealers to build inventory levels before the start of the prime deck-building season in order to ensure adequate availability of its product to meet anticipated seasonal consumer demand. The seasonal effects are often offset by the positive effect of the incentive programs.
Indebtedness prior to October 10, 2024. On May 18, 2022, the Company entered into a Credit Agreement (Credit Agreement) with certain lending parties thereto (Lenders) to amend and restate the Fourth Amended and Restated Credit Agreement dated as of November 5, 2019. Under the Credit Agreement, the Lenders agreed to provide the Company with one or more Revolving Loans in a collective maximum principal amount of $400,000,000 (Loan Limit) throughout the term, which ends May 18, 2027 (Term). Included within the Loan Limit are sublimits for a Letter of Credit facility in an amount not to exceed $60,000,000; and Swing Line Loans in an aggregate principal amount at any time outstanding not to exceed $20,000,000. The Revolving Loans, the Letter of Credit facility and the Swing Line Loans are for the purpose of raising working capital and supporting general business operations.
On December 22, 2022, the Company entered into a First Amendment to the Credit Agreement (First Amendment). As a part of the First Amendment, the Credit Agreement was amended and restated to provide for an additional Revolving B Loan (as hereinafter
defined). Under the First Amendment, the Lenders agreed to provide the Company with a Revolving B Loan consisting of one or more revolving loans in a collective maximum principal amount of $150,000,000 (Revolving B Loan Limit) throughout the term, which ended December 22, 2024 (Revolving B Loan Term). Previously, under the Credit Agreement, there was no Revolving B Loan. The First Amendment also provided that TD Bank, N.A. would serve as Syndication Agent.
In conjunction with the First Amendment, on December 22, 2022, the Credit Agreement was amended and restated to refer to the original loan as the Revolving A Loan. The amended and restated Credit Agreement was made an Exhibit A to the First Amendment. All of the terms of the Credit Agreement apply to the Revolving B Loan.
The amended Credit Agreement provides the Company, in the aggregate, the ability to borrow an amount up to the Revolving A Loan Limit during the Revolving A Loan Term (which ends May 18, 2027) and Revolving B Loan Limit during the Revolving B Loan Term. The Company is not obligated to borrow any amount under the revolving loans. Within the respective loan limit, the Company may borrow, repay and reborrow at any time or from time to time while the notes issued pursuant to the Credit Agreement are in effect.
Base Rate Loans (as defined in the Credit Agreement) under the Revolving A Loan and the Swing Line Loans accrue interest at the Base Rate plus the Applicable Rate (as defined in the Credit Agreement) and Term SOFR Loans for the Revolving Loans accrue interest at the rate per annum equal to the sum of Term SOFR for such interest period plus the Applicable Rate (as defined in the Credit Agreement). The Base Rate for any day is a fluctuating rate per annum equal to the highest of (a) the Federal Funds Rate plus 0.50%, (b) the rate of interest in effect for such day as publicly announced from time to time by BOA as its prime rate, and (c) the Term SOFR plus 1.0% subject to certain interest rate floors. Repayment of all then outstanding principal, interest, fees and costs is due at the end of the Term.
With respect to Revolving B Loans (as defined in the First Amendment), for any day, the rate per annum is a tiered pricing based upon the Consolidated Debt to Consolidated EBITDA Ratio. The applicable rate for Revolving B Loans that are Base Rate Loans range between 1.20% and 2.15% and the applicable rate for Revolving B Loans that are Term SOFR/Term SOFR Daily Floating Rate range between 0.20% and 1.15%.
Under the terms of the Security and Pledge Agreement, the Company, subject to certain permitted encumbrances, as collateral security for the above-stated loans and all other present and future indebtedness of the Company owing to the Lenders grants a continuing security interest in certain collateral described and defined in the Security and Pledge Agreement but excluding the Excluded Property (as defined in the Security and Pledge Agreement).
Indebtedness on and after October 10, 2024. On October 10, 2024, Trex entered into a Second Amendment to the Credit Agreement (Second Amendment) with certain lending parties thereto (Lenders) to amend that Credit Agreement dated as of May 18, 2022, as amended by that certain First Amendment dated as of December 22, 2022.
The Second Amendment provides us with Revolving A Loans in the maximum principal amount of $400,000,000 (Revolving A Loans), Revolving B Loans in the maximum principal amount of $150,000,000 (Revolving B Loans), and Letters of Credit and Swing Line Loans (as defined in the Credit Agreement). The Second Amendment extends the maturity date of the Revolving B Loans from December 22, 2024 to December 22, 2026.
Base Rate Loans (as defined in the Credit Agreement) under the Revolving A Loan and the Swing Line Loans accrue interest at the Base Rate plus the Applicable Rate (as defined in the Credit Agreement) and Term SOFR Loans for the Revolving Loans accrue interest at the rate per annum equal to the sum of Term SOFR for such interest period plus the Applicable Rate (as defined in the Credit Agreement). The Base Rate for any day is a fluctuating rate per annum equal to the highest of (a) the Federal Funds Rate plus 0.50%, (b) the rate of interest in effect for such day as publicly announced from time to time by BOA as its prime rate, and (c) the Term SOFR plus 1.0% subject to certain interest rate floors. Repayment of all then outstanding principal, interest, fees and costs is due at the end of the Term (as defined in the Credit Agreement).
With respect to Revolving B Loans (as defined in the Credit Agreement), for any day, the rate per annum is a tiered pricing based upon the Consolidated Debt to Consolidated EBITDA Ratio. The applicable rate for Revolving B Loans that are Base Rate Loans range between 0.20% and 1.15%. and the applicable rate for Revolving B Loans that are Term SOFR/Term SOFR Daily Floating Rate range between 1.20% and 2.15%.
At December 31, 2024, we had $202.6 million in outstanding borrowings under the revolving credit facility and borrowing capacity under the facility of $347.4 million.
Compliance with Debt Covenants and Restrictions. Pursuant to the terms of the Credit Agreement, the Company, is subject to certain loan compliance covenants. The Company was in compliance with all covenants at December 31, 2024. Failure to comply with
the financial covenants could be considered a default of repayment obligations and, among other remedies, could accelerate payment of any amounts outstanding.
Industrial Revenue Bonds. In October 2021, the Company announced plans to add a third manufacturing facility located in Little Rock, Arkansas (Little Rock). Construction on the new facility began in the second quarter of 2022. In connection with the construction of the new facility, during 2024 the Company and Little Rock entered into an agreement in which Little Rock agreed to issue up to $450 million of its industrial revenue bonds (IRBs) for the purpose of constructing a manufacturing facility. Under the agreement, the Company transferred ownership of the facility to Little Rock and simultaneously leased the related asset from Little Rock. The Company is also the purchaser of the IRBs and, therefore, is the bondholder as well as the borrower/lessee of the Little Rock facility purchased with the IRB proceeds. As a result of the agreement, the Company was able to reduce the cost of certain state and local tax expenditures for twenty years. The Company has a purchase option included in the lease agreement for below the fair value of the asset, which prevents the transfer of the asset to Little Rock from being recognized as a sale. Furthermore, the Company has not derecognized the transferred asset and continues to recognize it in property, plant and equipment in the Consolidated Balance Sheets. The Company has the right and intends to set-off any obligations to make payments under the finance liability, with proceeds due from the IRBs. The liability and IRB asset are equal and are reported net in the Consolidated Balance Sheets. As of December 31, 2024, the gross asset and liability associated with the IRBs was $100 million.
Contractual Obligations. Our contractual obligations consist primarily of purchase commitments and operating leases.
Purchase obligations represent supply contracts with raw material vendors and service contracts for hauling raw materials. Open purchase orders written in the normal course of business for goods or services that are provided on demand have been excluded as the timing of which is not certain. As of December 31, 2024, we have purchase obligations under material supply contracts of $50.7 million for the year ending December 31, 2025, $38.5 million in 2026, $27.4 million in 2027, and $20.3 million in 2028. Please refer to Note 19 to the Consolidated Financial Statements in this filing for additional information on our purchase commitments.
Operating leases represent office space, storage warehouses, manufacturing facilities and certain office and plant equipment under various operating leases, and include operating leases accounted for under Financial Accounting Standards Board Accounting Standards Codification Topic 842 and short-term leases. As of December 31, 2024, we have operating lease liabilities of $11.1 million for the year ending December 31, 2025, $35.7 million for the years 2026 through 2029 and $15.8 million thereafter. Please refer to Note 10 to the Consolidated Financial Statements in this filing for additional information on our operating leases.
The Company believes that its cash on hand and cash generated through operating activities, both over the next 12 months and beyond the next 12 months, should be sufficient to cover purchase obligations and operating leases.
Off-Balance Sheet Arrangements. We do not have off-balance sheet financing arrangements.
Capital and Other Cash Requirements. Our capital expenditure guidance for 2025 is $190 million to $210 million. In addition to the construction of the Arkansas facility, our capital allocation priorities for 2025 include expenditures for internal growth opportunities, manufacturing cost reductions, upgrading equipment and support systems, and acquisitions which fit our long-term growth strategy as we continue to evaluate opportunities that would be a good strategic fit for Trex, and return of capital to shareholders.
We believe that cash on hand, cash flows from operations and borrowings expected to be available under our revolving credit facility will provide sufficient funds to enable us to fund planned capital expenditures, make scheduled principal and interest payments, fund the warranty reserve, meet other cash requirements, and maintain compliance with terms of our debt agreements for at least the next 12 months. We currently expect to fund future capital expenditures from operations and borrowings under the revolving credit facility. The actual amount and timing of future capital requirements may differ materially from our estimate depending on the demand for Trex products and new market developments and opportunities. Our ability to meet our cash needs during the next 12 months and thereafter could be adversely affected by various circumstances, including increases in the cost of raw materials and product replacement costs, quality control problems, higher than expected product warranty claims, service disruptions and lower than expected collections of accounts receivable. In addition, any failure to negotiate amendments to our existing debt agreements to resolve any future noncompliance with financial covenants could adversely affect our liquidity by reducing access to revolving credit borrowings needed primarily to fund seasonal borrowing needs. We may determine that it is necessary or desirable to obtain financing through bank borrowings or the issuance of debt or equity securities to address such contingencies or changes to our business plan. Debt financing would increase our level of indebtedness, while equity financing would dilute the ownership of our stockholders. There can be no assurance as to whether, or as to the terms on which, we would be able to obtain such financing, which would be restricted by covenants contained in our existing debt agreements.
NEW ACCOUNTING STANDARDS
New Accounting Standards Recently Adopted. In November 2023, the Financial Accounting Standards Board (FASB) issued Accounting Standards Update (ASU) No. 2023-07, “Segment Reporting (Topic 280): Improvements to Reportable Segment Disclosures.” The guidance requires disclosure of significant segment expenses which are regularly provided to the chief operating decision maker (CODM), the composition of and amount of other segment items, the CODM’s title and position within the organization, and how the CODM uses the reported measure(s) of segment’s profit or loss to assess the performance of the segment. In addition, on an interim basis, all segment profit or loss and asset disclosures currently required on an annual basis must be reported, as well as those required by Topic 280. The guidance allows for multiple measure of a segment’s profit or loss to be reported. Entities which have a single reportable segment must apply Topic 280 in its entirety. The guidance was effective for fiscal years beginning after December 15, 2023, and for interim periods beginning after December 15, 2024. Early adoption was permitted. Entities are required to apply the amendments of this update retrospectively for all prior periods presented in the financial statements. The Company adopted the standard in the quarterly period ended December 31, 2024. The Company applied the standard retrospectively and accordingly, prior periods were adjusted. Adoption of this guidance did not impact consolidated results of operations and financial position.
New Accounting Standards Not Yet Adopted. In November 2024, the FASB issued ASU No. 2024-03, “Income Statement – Reporting Comprehensive Income – Disaggregation Disclosures.” This guidance requires more detailed disclosure about the types of expenses presented within the expense captions of the financial statements. Specifically, disclosure of purchases of inventory, employee compensation, depreciation, and intangible asset amortization are required on both an interim and annual basis. In addition, a qualitative description of remaining amounts in relevant expense captions which have not separately been disaggregated will be required on an interim and annual basis. On an annual basis, disclosure of an entity’s definition of selling expenses and the amount of selling expenses is required. The amendments to this update are effective for annual reporting periods beginning after December 15, 2026, and interim periods beginning after December 15, 2027. Early adoption of this update is permitted. The amendments to this update should be applied prospectively to financial statements issued for reporting periods after the effective date of the update or retrospectively to any or all prior periods presented in the financial statements. The Company believes adoption will result in expanded financial statement footnote disclosure but does not believe adoption of this update will have a material impact on its consolidated results of operations. The Company is continuing to evaluate the impacts of the pending adoption. As such, the Company’s preliminary assessments are subject to change.
In December 2023, the FASB issued ASU No. 2023-09, “Income Taxes (Topic 740): Improvements to Income Tax Disclosures.” The guidance requires public entities to disclose additional categories of information related to federal, state, and foreign income taxes and additional details related to reconciling items should they meet a quantitative threshold. The guidance requires disclosure of income taxes paid (net of refunds received) disaggregated by federal, state, and foreign taxes and to disaggregate the information by jurisdiction based on quantitative thresholds. The guidance is effective for fiscal year beginning after December 15, 2024. Early adoption is permitted. The guidance should be applied on a prospective basis, retrospective application is permitted. The Company does not expect adoption of the guidance to have a material effect on its consolidated results of operations and financial position.
Item 7A. Quantitative and Qualitative Disclosures About Market Risk
We are subject to market risks from changing interest rates associated with our borrowings. To meet our seasonal working capital needs, we borrow periodically on our variable rate revolving line of credit. At December 31, 2024, we had $202.6 million in debt outstanding under our revolving line of credit. While variable rate debt obligations expose us to the risk of rising interest rates, an increase of 1% in interest rates would not have a material adverse effect on our overall financial position, results of operations or liquidity.
In certain instances, we may use interest rate swap agreements to modify fixed rate obligations to variable rate obligations, thereby adjusting the interest rates to current market rates and ensuring that the debt instruments are always reflected at fair value. We had no interest rate swap agreements outstanding as of December 31, 2024.
Item 8. Financial Statements and Supplementary Data
The financial statements listed in Item 15 of this Form 10-K are incorporated by reference in this Item 8 and are filed as part of this report.
Item 9. Changes in and Disagreements with Accountants on Accounting and Financial Disclosure
None.
Item 9A. Controls and Procedures
Evaluation of Disclosure Controls and Procedures
The Company’s management, with the participation of its President and Chief Executive Officer, who is the Company’s principal executive officer, and its Senior Vice President and Chief Financial Officer, who is the Company’s principal financial officer, has evaluated the effectiveness of the Company’s disclosure controls and procedures as of December 31, 2024. Based on this evaluation, the President and Chief Executive Officer and the Senior Vice President and Chief Financial Officer have concluded that the Company’s disclosure controls and procedures are effective.
Management’s Report on Internal Control Over Financial Reporting
We, as members of management of Trex Company, Inc. (Company), are responsible for establishing and maintaining adequate internal control over financial reporting. The Company’s internal control over financial reporting is a process designed to provide reasonable assurance regarding the reliability of financial reporting and the preparation of financial statements for external purposes in accordance with U.S. generally accepted accounting principles. Internal control over financial reporting includes those policies and procedures that (1) pertain to the maintenance of records that, in reasonable detail, accurately and fairly reflect the transactions and dispositions of the assets of the Company; (2) provide reasonable assurance that transactions are recorded as necessary to permit preparation of financial statements in accordance with U.S. generally accepted accounting principles, and that receipts and expenditures of the Company are being made only in accordance with authorizations of management and directors of the Company; and (3) provide reasonable assurance regarding prevention or timely detection of unauthorized acquisition, use, or disposition of the Company’s assets that could have a material effect on the financial statements.
Because of its inherent limitations, internal control over financial reporting may not prevent or detect misstatements. Also, projections of any evaluation of effectiveness to future periods are subject to the risk that controls may become inadequate because of changes in conditions, or that the degree of compliance with the policies and procedures may deteriorate.
We assessed the Company’s internal control over financial reporting as of December 31, 2024, based on criteria for effective internal control over financial reporting established in “Internal Control-Integrated Framework (2013)” issued by the Committee of Sponsoring Organizations of the Treadway Commission (COSO Framework). Based on this assessment, we concluded that, as of December 31, 2024, our internal control over financial reporting was effective, based on the COSO Framework.
The effectiveness of our internal control over financial reporting as of December 31, 2024, has been audited by Ernst & Young LLP, an independent registered public accounting firm, as stated in their report, which follows hereafter.
| | |
| | TREX COMPANY, INC. |
| | |
February 24, 2025 | By: | /S/ BRYAN H. FAIRBANKS |
| | Bryan H. Fairbanks President and Chief Executive Officer (Principal Executive Officer) |
| | |
February 24, 2025 | By: | /S/ BRENDA K. LOVCIK |
| | Brenda K. Lovcik Senior Vice President and Chief Financial Officer (Principal Financial Officer) |
Changes in Internal Control Over Financial Reporting
There have been no changes in the Company’s internal control over financial reporting identified in connection with the evaluation described above in “Management’s Report on Internal Control Over Financial Reporting” that occurred during the Company’s fourth fiscal quarter that have materially affected, or are reasonably likely to materially affect, the Company’s internal control over financial reporting.
Report of Independent Registered Public Accounting Firm
To the Stockholders and the Board of Directors of Trex Company, Inc.
Opinion on Internal Control Over Financial Reporting
We have audited Trex Company, Inc.’s internal control over financial reporting as of December 31, 2024, based on criteria established in Internal Control—Integrated Framework issued by the Committee of Sponsoring Organizations of the Treadway Commission (2013 framework) (the COSO criteria). In our opinion, Trex Company, Inc. (the Company) maintained, in all material respects, effective internal control over financial reporting as of December 31, 2024, based on the COSO criteria.
We also have audited, in accordance with the standards of the Public Company Accounting Oversight Board (United States) (PCAOB), the 2024 consolidated financial statements of the Company and our report dated February 24, 2025 expressed an unqualified opinion thereon.
Basis for Opinion
The Company’s management is responsible for maintaining effective internal control over financial reporting and for its assessment of the effectiveness of internal control over financial reporting included in the accompanying Management’s Report on Internal Control Over Financial Reporting. Our responsibility is to express an opinion on the Company’s internal control over financial reporting based on our audit. We are a public accounting firm registered with the PCAOB and are required to be independent with respect to the Company in accordance with the U.S. federal securities laws and the applicable rules and regulations of the Securities and Exchange Commission and the PCAOB.
We conducted our audit in accordance with the standards of the PCAOB. Those standards require that we plan and perform the audit to obtain reasonable assurance about whether effective internal control over financial reporting was maintained in all material respects.
Our audit included obtaining an understanding of internal control over financial reporting, assessing the risk that a material weakness exists, testing and evaluating the design and operating effectiveness of internal control based on the assessed risk, and performing such other procedures as we considered necessary in the circumstances. We believe that our audit provides a reasonable basis for our opinion.
Definition and Limitations of Internal Control Over Financial Reporting
A company’s internal control over financial reporting is a process designed to provide reasonable assurance regarding the reliability of financial reporting and the preparation of financial statements for external purposes in accordance with generally accepted accounting principles. A company’s internal control over financial reporting includes those policies and procedures that (1) pertain to the maintenance of records that, in reasonable detail, accurately and fairly reflect the transactions and dispositions of the assets of the company; (2) provide reasonable assurance that transactions are recorded as necessary to permit preparation of financial statements in accordance with generally accepted accounting principles, and that receipts and expenditures of the company are being made only in accordance with authorizations of management and directors of the company; and (3) provide reasonable assurance regarding prevention or timely detection of unauthorized acquisition, use, or disposition of the company’s assets that could have a material effect on the financial statements.
Because of its inherent limitations, internal control over financial reporting may not prevent or detect misstatements. Also, projections of any evaluation of effectiveness to future periods are subject to the risk that controls may become inadequate because of changes in conditions, or that the degree of compliance with the policies or procedures may deteriorate.
/s/ Ernst & Young LLP
Baltimore, Maryland
February 24, 2025
Item 9B. Other Information
Insider Trading Arrangements. During the quarter ended December 31, 2024, none of our directors or officers (as defined in Rule 16a-1(f) of the Exchange Act) adopted, modified or terminated any contract, instruction or written plan for the purchase or sale of our securities that was intended to satisfy the affirmative defense conditions of Rule 10b5-1(c) of the Exchange Act or any non-Rule 10b5-1 trading arrangement (as identified in Item 408(c) of Regulation S-K).
Item 9C. Disclosure Regarding Foreign Jurisdictions that Prevent Inspections
None.
PART III
Item 10. Directors, Executive Officers and Corporate Governance
Information responsive to this Item 10 is incorporated herein by reference to the sections titled “Information About Nominating and Continuing Directors,” “Named Executive Officers,” and “Corporate Governance” that will be included in our definitive proxy statement for our 2025 annual meeting of stockholders, which we will file with the U.S. Securities and Exchange Commission (SEC) on or before 120 days after our 2024 fiscal year-end.
We have adopted a Code of Conduct and Ethics, which is applicable to all directors, officers and employees, including our Chief Executive Officer and Chief Financial Officer. The code is available on our corporate web site and in print to any stockholder who requests a copy. We also make available on our web site, at www.trex.com/our-company/corporate-governance, and in print to any stockholder who requests them, copies of our corporate governance principles and the charters of each standing committee of our board of directors. Requests for copies of these documents should be directed to Corporate Secretary, Trex Company, Inc., 2500 Trex Way, Winchester, Virginia 22601. To the extent required by SEC rules, we intend to disclose any amendments to our code of conduct and ethics, and any waiver of a provision of the code with respect to our principal executive officer, principal financial officer, principal accounting officer or controller, or persons performing similar functions, on our web site referred to above within four business days following any such amendment or waiver, or within any other period that may be required under SEC rules from time to time.
We have adopted an Insider Trading Policy that governs the purchase or sale of securities by employees, directors, officers, and any other company including customers or suppliers of Trex Company, Inc. A copy of our insider trading policy is filed as Exhibit 19.1 to this Annual Report.
Item 11. Executive Compensation
Information responsive to this Item 11 is incorporated herein by reference to the sections titled “Non-Employee Director Compensation,” “2024 Non-Employee Director Compensation,” “2024 Non-Employee Director Equity Awards,” “Compensation Discussion and Analysis,” “Report of the Compensation Committee of the Board of Directors of Trex Company, Inc.,” “Summary Compensation Table,” “All Other Compensation Table,” “Grants of Plan-Based Awards,” “Outstanding Equity Awards at Fiscal-Year End,” “2024 Option / SAR Exercises and Stock Vested,” “Retention, Severance and Change in Control Agreements,” “Severance and Change in Control Compensation as of December 31, 2024,” “The Company’s Compensation Policies and Practices as They Relate to Risk,” “Corporate Governance – Compensation Committee Interlocks and Insider Participation” that will be included in our definitive proxy statement for our 2025 annual meeting of stockholders, which we will file with the SEC on or before 120 days after our 2024 fiscal year-end.
Item 12. Security Ownership of Certain Beneficial Owners and Management and Related Stockholder Matters
Information responsive to this Item 12 is incorporated herein by reference to the sections titled “Security Ownership” and “Equity Compensation Plan Information” that will be included in our definitive proxy statement for our 2025 annual meeting of stockholders, which we will file with the SEC on or before 120 days after our 2024 fiscal year-end.
Item 13. Certain Relationships and Related Transactions, and Director Independence
Information responsive to this Item 13 is incorporated herein by reference to the sections titled “Corporate Governance – Board Leadership Structure – Director Independence” and “Transactions with Related Persons” that will be included in our definitive proxy statement for our 2025 annual meeting of stockholders, which we will file with the SEC on or before 120 days after our 2024 fiscal year-end.
Item 14. Principal Accounting Fees and Services
Information responsive to this Item 14 is incorporated herein by reference to the section titled “Independent Registered Public Accounting Firm” that will be included in our definitive proxy statement for our 2025 annual meeting of stockholders, which we will file with the SEC on or before 120 days after our 2024 fiscal year-end.
PART IV
Item 15. Exhibits and Financial Statement Schedules
(a)(1) The following Consolidated Financial Statements of the Company are incorporated by reference in Part II, Item 8 of this Form 10-K:
(a)(2) The following financial statement schedule is filed as part of this report:
All other schedules for which provision is made in the applicable accounting regulations of the SEC are not required under the related instructions or are inapplicable or not material and, therefore, have been omitted.
(a)(3) See Exhibit Index at the end of the Annual Report on Form 10-K for the information required by this Item.
Item 16. Form 10-K Summary
None.
EXHIBIT INDEX
| | | | | | | | | | |
| |
| | Incorporated by reference |
Exhibit Number | | Description | | Form | | Exhibit | | Filing Date | | File No. |
| |
| |
| |
| |
| |
|
3.1 | | Restated Certificate of Incorporation of Trex Company, Inc. dated July 28, 2021. | | 10-Q | | 3.6 | | August 2, 2021 | | 001-14649 |
| |
| |
| |
| |
| |
|
3.2 | | First Certificate of Amendment to the Restated Certificate of Incorporation of Trex Company, Inc. dated May 5, 2022 | | 10-Q | | 3.2 | | May 9, 2022 | | 001-14649 |
| |
| |
| |
| |
| |
|
3.3 | | Amended and Restated By-Laws of the Company dated February 21, 2024. | | 10-K | | 3.3 | | February 26, 2024 | | 001-14649 |
| |
| |
| |
| |
| |
|
4.1 | | Specimen certificate representing the Company’s common stock. | | S-1/A | | 4.1 | | March 24, 1999 | | 333-63287 |
| |
| |
| |
| |
| |
|
4.2 | | First Amendment to Credit Agreement dated as of December 22, 2022 to the Credit Agreement dated May 18, 2022 by and among the Company, as borrower; the guarantors party thereto; Bank of America, N.A. (BOA), as a Lender, Administrative Agent, Swing Line Lender and L/C Issuer; TD Bank, N.A. as lender and Syndication Agent; Regions Bank, PNC Bank, National Association, and Wells Fargo Bank, National Association (each, a Lender and collectively, the Lenders), arranged by BofA Securities, Inc. as Sole Lead Arranger and Sole Bookrunner. | | 8-K | | 4.1 | | December 23, 2022 | | 001-14649 |
| |
| |
| |
| |
| |
|
4.3 | | Credit Agreement dated as of May 18, 2022 between the Company, as borrower; Trex Commercial Products, Inc., as guarantor, Bank of America, N.A., as a Lender, Administrative Agent, Swing Line Lender and L/C Issuer; Wells Fargo Bank, National Association, as lender and Syndication Agent, Regions Bank, PNC Bank, National Association, and TD Bank, N.A., arranged by BofA Securities, Inc. as Sole Lead Arranger and Sole Bookrunner. | | 8-K | | 4.1 | | May 20, 2022 | | 001-14649 |
| |
| |
| |
| |
| |
|
4.4 | | Note dated May 18, 2022 payable by the Company to Bank of America, N.A. in the amount of the lesser of $180,000,000 or the outstanding revolver advances made by Bank of America, N.A. | | 8-K | | 4.2 | | May 20, 2022 | | 001-14649 |
| |
| |
| |
| |
| |
|
4.5 | | Note dated May 18, 2022 payable by the Company to Wells Fargo Bank, National Association in the amount of the lesser of $120,000,000 or the outstanding revolver advances made by Wells Fargo Bank, N.A. | | 8-K | | 4.3 | | May 20, 2022 | | 001-14649 |
| |
| |
| |
| |
| |
|
4.6 | | Note dated May 18, 2022 payable by the Company to Regions Bank in the amount of the lesser of $40,000,000 or the outstanding revolver advances made by Regions Bank. | | 8-K | | 4.4 | | May 20, 2022 | | 001-14649 |
| |
| |
| |
| |
| |
|
4.7 | | Note dated May 18, 2022 payable by the Company to PNC Bank, National Association in the amount of the lesser of $30,000,000 or the outstanding revolver advances made by PNC Bank, National Association. | | 8-K | | 4.5 | | May 20, 2022 | | 001-14649 |
| |
| |
| |
| |
| |
|
4.8 | | Note dated May 18, 2022 payable by the Company to TD Bank, N.A. in the amount of the lesser of $30,000,000 or the outstanding revolver advances made by TD Bank, N.A. | | 8-K | | 4.6 | | May 20, 2022 | | 001-14649 |
| |
| |
| |
| |
| |
|
4.9 | | Security and Pledge Agreement dated as of May 18, 2022 between the Company, as debtor, Trex Commercial Products, Inc., as additional obligor; and Bank of America, N.A. as Administrative Agent (including Notices of Grant of Security Interest in Copyrights and Trademarks). | | 8-K | | 4.7 | | May 20, 2022 | | 001-14649 |
| |
| |
| |
| |
| |
|
| | | | | | | | | | |
| |
| | Incorporated by reference |
Exhibit Number | | Description | | Form | | Exhibit | | Filing Date | | File No. |
4.10 | | Fourth Amended and Restated Credit Agreement dated as of November 5, 2019 between the Company, as borrower; Trex Commercial Products, Inc., as guarantor, Bank of America, N.A., as a Lender, Administrative Agent, Swing Line Lender and L/C Issuer; and certain other lenders including Wells Fargo Bank, N.A., who is also Syndication Agent, SunTrust Bank, and Branch Banking and Trust Company arranged by BofA Securities, Inc. as Sole Lead Arranger and Sole Bookrunner. | | 8-K | | 4.1 | | November 6, 2019 | | 001-14649 |
| |
| |
| |
| |
| |
|
4.11 | | First Amendment to the Credit Agreement by and among Trex Company, Inc. as borrower; Trex Commercial Products, Inc. as guarantor; Bank of America, N.A. as a Lender, Administrative Agent, Swing Line Lender and L/C Issuer; and certain other lenders including Wells Fargo Bank, N.A., who is also Syndication Agent; Truist Bank; and Regions Bank, arranged by BofA Securities, Inc. as Sole Lead Arranger and Sole Bookrunner dated May 26, 2020. | | 8-K | | 4.1 | | May 28, 2020 | | 001-14649 |
| |
| |
| |
| |
| |
|
4.12 | | Fourth Amended and Restated Credit Agreement between the Company, as borrower; Trex Commercial Products, Inc., as guarantor, Bank of America, N.A., as a Lender, Administrative Agent, Swing Line Lender and L/C Issuer; and certain other lenders including Wells Fargo Bank, N.A., who is also Syndication Agent, Truist Bank; and Regions Bank, arranged by BofA Securities, Inc. as Sole Lead Arranger and Sole Bookrunner, dated May 26, 2020. | | 8-K | | 4.2 | | May 28, 2020 | | 001-14649 |
| |
| |
| |
| |
| |
|
4.13 | | Note dated November 5, 2019 payable by the Company to Bank of America, N.A. in the amount of the lesser of $125,000,000 or the outstanding revolver advances made by Bank of America, N.A. | | 8-K | | 4.2 | | November 6, 2019 | | 001-14649 |
| |
| |
| |
| |
| |
|
4.14 | | Note dated November 5, 2019 payable by the Company to Wells Fargo Bank, N.A. in the amount of the lesser of $70,000,000 or the outstanding revolver advances made by Wells Fargo Bank, N.A. | | 8-K | | 4.3 | | November 6, 2019 | | 001-14649 |
| |
| |
| |
| |
| |
|
4.15 | | Note dated November 5, 2019 payable by the Company to SunTrust Bank in the amount of the lesser of $30,000,000 or the outstanding revolver advances made by SunTrust Bank. | | 8-K | | 4.4 | | November 6, 2019 | | 001-14649 |
| |
| |
| |
| |
| |
|
4.16 | | Note dated November 5, 2019 payable by the Company to Branch Banking and Trust Company in the amount of the lesser of $25,000,000 or the outstanding revolver advances made by Branch Banking and Trust Company. | | 8-K | | 4.5 | | November 6, 2019 | | 001-14649 |
| |
| |
| |
| |
| |
|
4.17 | | Note dated May 26, 2020 payable by the Company to Regions Bank. | | 8-K | | 4.6 | | May 28, 2020 | | 001-14649 |
| |
| |
| |
| |
| |
|
4.18 | | Fourth Amended and Restated Security and Pledge Agreement dated as of November 5, 2019 between the Company, as debtor, Trex Commercial Products, Inc., as additional obligor; and Bank of America, N.A. as Administrative Agent (including Notices of Grant of Security Interest in Copyrights and Trademarks). | | 8-K | | 4.6 | | November 6, 2019 | | 001-14649 |
| |
| |
| |
| |
| |
|
4.19 | | Description of Securities registered pursuant to Section 12 of the Securities Exchange Act of 1934. | | 10-K | | 4.19 | | February 22, 2021 | | 001-14649 |
| |
| |
| |
| |
| |
|
4.20 | | Second Amendment to Credit Agreement dated as of October 10, 2024 by and among the Company, as borrower; the guarantors party thereto; Bank of America, N.A. (BOA), as a Lender, Administrative Agent, Swing Line Lender and L/C Issuer; TD Bank, N.A. Syndication Agent, arranged by BofA Securities, Inc. as Sole Lead Arranger and Sole Bookrunner. | | 8-K | | 4.1 | | October 11, 2024 | | 001-14649 |
| | | | | | | | | | |
| | | | | | | | | | |
| |
| | Incorporated by reference |
Exhibit Number | | Description | | Form | | Exhibit | | Filing Date | | File No. |
10.1** | | Trex Company, Inc. 2023 Stock Incentive Plan. | | 10-Q | | 10.1 | | May 8, 2023 | | 001-14649 |
| |
| |
| |
| |
| |
|
10.2** | | Trex Company, Inc. Amended and Restated 1999 Incentive Plan for Outside Directors as amended on July 26, 2023. | | 10-Q | | 10.2 | | July 31, 2023 | | 001-14649 |
| |
| |
| |
| |
| |
|
10.3** | | Form of Trex Company, Inc. 2023 Stock Incentive Plan Stock Appreciation Rights Agreement. | | 10-Q | | 10.3 | | October 28, 2024 | | 001-14649 |
| |
| |
| |
| |
| |
|
10.4** | | Form of Trex Company, Inc. 2023 Stock Incentive Plan Time-Based Restricted Stock Unit Agreement. | | 10-Q | | 10.4 | | October 28, 2024 | | 001-14649 |
| |
| |
| |
| |
| |
|
10.5** | | Form of Trex Company, Inc. 2023 Stock Incentive Plan Performance-Based Restricted Stock Unit Agreement. | | 10-Q | | 10.5 | | October 28, 2024 | | 001-14649 |
| |
| |
| |
| |
| |
|
10.6** | | Form of Trex Company, Inc. Amended and Restated 1999 Incentive Plan for Outside Directors Restricted Stock Unit Agreement. | | 10-Q | | 10.6 | | July 31, 2023 | | 001-14649 |
| |
| |
| |
| |
| |
|
10.7** | | Amended and Restated Severance Agreement dated July 31, 2023 by and between Trex Company, Inc. and Bryan H. Fairbanks. | | 10-Q | | 10.7 | | July 31, 2023 | | 001-14649 |
| |
| |
| |
| |
| |
|
10.8** | | Form of Severance Agreement between Trex Company, Inc. and Officers other than the Chief Executive Officer. | | 10-Q | | 10.8 | | July 31, 2023 | | 001-14649 |
| |
| |
| |
| |
| |
|
10.9 | | AIA document A141 – 2014 Agreement dated July 7, 2022 by and between Trex Company, Inc. and Gray Construction, Inc. | | 8-K | | 10.1 | | July 12, 2022 | | 001-14649 |
| |
| |
| |
| |
| |
|
10.10 | | Form of Indemnity Agreement for Directors. | | 10-K | | 10.19 | | March 12, 2009 | | 001-14649 |
| |
| |
| |
| |
| |
|
10.11 | | Form of Indemnity Agreement for Officers. | | 10-K | | 10.20 | | March 12, 2009 | | 001-14649 |
| |
| |
| |
| |
| |
|
10.12 | | Form of Indemnity Agreement for Director/Officers. | | 10-K | | 10.21 | | March 12, 2009 | | 001.14649 |
| |
| |
| |
| |
| |
|
10.13 | | Form of Distributor Agreement of Trex Company, Inc. | | 10-K | | 10.23 | | March 12, 2009 | | 001-14649 |
| |
| |
| |
| |
| |
|
10.14 | | Form of Trex Company, Inc. Fencing Agreement for Installers/Retailers. | | 10-Q | | 10.4 | | November 9, 2006 | | 001-14649 |
| |
| |
| |
| |
| |
|
10.15 | | Asset Purchase Agreement dated as of December 30, 2022 by and between Trex Commercial Products, Inc., Trex Company, Inc. and Sightline Commercial Solutions, LLC. | | 8-K | | 10.1 | | December 30, 2022 | | 001-14649 |
| |
| |
| |
| |
| |
|
19.1 | | Insider Trading Policy | | 10-K | | 19.1 | | February 26, 2024 | | 001-14649 |
| |
| |
| |
| |
| |
|
21* | | Subsidiaries of the Company. | |
| |
| |
| |
|
| |
| |
| |
| |
| |
|
23* | | Consent of Ernst & Young LLP, Independent Registered Public Accounting Firm. | |
| |
| |
| |
|
| |
| |
| |
| |
| |
|
31.1* | | Certification of Chief Executive Officer of the Company pursuant to Rule 13a-14(a) under the Securities Exchange Act of 1934. | |
| |
| |
| |
|
| |
| |
| |
| |
| |
|
31.2* | | Certification of Chief Financial Officer of the Company pursuant to Rule 13a-14(a) under the Securities Exchange Act of 1934. | |
| |
| |
| |
|
| |
| |
| |
| |
| |
|
32*** | | Certifications of Chief Executive Officer and Chief Financial Officer pursuant to Section 906 of the Sarbanes-Oxley Act of 2002 (18 U.S.C. § 1350). | |
| |
| |
| |
|
| |
| |
| |
| |
| |
|
97.1 | | Recovery of Compensation for Accounting Restatements Policy | | 10-K | | 97.1 | | February 26, 2024 | | 001-14649 |
| |
| |
| |
| |
| |
|
101.INS* | | Inline XBRL Instance Document—the instance document does not appear in the Interactive Data File because its XBRL tags are embedded within the Inline XBRL document. | |
| |
| |
| |
|
| |
| |
| |
| |
| |
|
101.SCH* | | Inline XBRL Taxonomy Extension Schema With Embedded Linkbase Documents. | |
| |
| |
| |
|
| | | | | | | | | | |
| |
| | Incorporated by reference |
Exhibit Number | | Description | | Form | | Exhibit | | Filing Date | | File No. |
| |
| |
| |
| |
| |
|
104.1 | | Cover Page Interactive Data File—The cover page interactive data file does not appear in the interactive data file because its XBRL tags are embedded within the inline XBRL document. | |
| |
| |
| |
|
* Filed herewith.
** Management contract or compensatory plan or agreement.
*** Furnished herewith.
SIGNATURES
Pursuant to the requirements of Section 13 or 15(d) of the Securities Exchange Act of 1934, the registrant has duly caused this report to be signed on its behalf by the undersigned, thereunto duly authorized.
| | | |
| | | |
|
| Trex Company, Inc. |
|
|
|
|
Date: February 24, 2025 |
| By: | /S/ BRYAN H. FAIRBANKS |
|
|
| Bryan H. Fairbanks President and Chief Executive Officer (Duly Authorized Officer) |
Pursuant to the requirements of the Securities Exchange Act of 1934, this report has been signed as of February 24, 2025 by the following persons on behalf of the registrant and in the capacities indicated.
| |
| |
Signature | Title |
|
|
/S/ Bryan H. Fairbanks Bryan H. Fairbanks | President and Chief Executive Officer (Principal Executive Officer); Director |
| |
/S/ Brenda K. Lovcik Brenda K. Lovcik | Senior Vice President and Chief Financial Officer (Principal Financial Officer and Principal Accounting Officer) |
| |
/S/ James E. Cline James E. Cline | Chairman |
| |
/S/ Ronald W. Kaplan Ronald W. Kaplan | Vice Chairman |
| |
/S/ Jay M. Gratz Jay M. Gratz | Director |
| |
/S/ Kristine L. Juster Kristine L. Juster | Director |
| |
/S/ D. Christian Keffer D. Christian Keffer | Director |
| |
/S/ Gena C. Lovett Gena C. Lovett | Director |
| |
/S/ Melkeya Mcduffie Melkeya McDuffie | Director |
| |
/S/ Patricia B. Robinson Patricia B. Robinson | Director |
| |
/S/ Gerald Volas Gerald Volas | Director |
| |
TREX COMPANY, INC.
Index to Consolidated Financial Statements
The following Consolidated Financial Statement Schedule of the Registrant is filed as part of this Report as required to be included in Item 15(a)(2):
Report of Independent Registered Public Accounting Firm
To the Stockholders and the Board of Directors of Trex Company, Inc.
Opinion on the Financial Statements
We have audited the accompanying consolidated balance sheets of Trex Company, Inc. (the Company) as of December 31, 2024 and 2023, the related consolidated statements of comprehensive income, changes in stockholders’ equity and cash flows for each of the three years in the period ended December 31, 2024, and the related notes and financial statement schedule listed in the Index at Item 15(a)(2) (collectively referred to as the “consolidated financial statements”). In our opinion, the consolidated financial statements present fairly, in all material respects, the financial position of the Company at December 31, 2024 and 2023, and the results of its operations and its cash flows for each of the three years in the period ended December 31, 2024, in conformity with U.S. generally accepted accounting principles.
We also have audited, in accordance with the standards of the Public Company Accounting Oversight Board (United States) (PCAOB), the Company’s internal control over financial reporting as of December 31, 2024, based on criteria established in Internal Control—Integrated Framework issued by the Committee of Sponsoring Organizations of the Treadway Commission (2013 framework), and our report dated February 24, 2025 expressed an unqualified opinion thereon.
Basis for Opinion
These financial statements are the responsibility of the Company’s management. Our responsibility is to express an opinion on the Company’s financial statements based on our audits. We are a public accounting firm registered with the PCAOB and are required to be independent with respect to the Company in accordance with the U.S. federal securities laws and the applicable rules and regulations of the Securities and Exchange Commission and the PCAOB.
We conducted our audits in accordance with the standards of the PCAOB. Those standards require that we plan and perform the audit to obtain reasonable assurance about whether the financial statements are free of material misstatement, whether due to error or fraud. Our audits included performing procedures to assess the risks of material misstatement of the financial statements, whether due to error or fraud, and performing procedures that respond to those risks. Such procedures included examining, on a test basis, evidence regarding the amounts and disclosures in the financial statements. Our audits also included evaluating the accounting principles used and significant estimates made by management, as well as evaluating the overall presentation of the financial statements. We believe that our audits provide a reasonable basis for our opinion.
Critical Audit Matter
The critical audit matter communicated below is a matter arising from the current period audit of the financial statements that was communicated or required to be communicated to the audit committee and that: (1) relates to accounts or disclosures that are material to the financial statements and (2) involved our especially challenging, subjective or complex judgments. The communication of the critical audit matter does not alter in any way our opinion on the consolidated financial statements, taken as a whole, and we are not, by communicating the critical audit matter below, providing a separate opinion on the critical audit matter or on the accounts or disclosures to which it relates.
| | |
|
| Surface Flaking Warranty Reserve |
Description of the Matter |
| At December 31, 2024, the Company’s surface flaking warranty reserve was $7.2 million. As discussed in Note 19 of the consolidated financial statements, the Company continues to receive and settle claims for decking products manufactured at its Nevada facility prior to 2007 that exhibit surface flaking and maintains a warranty reserve to provide for the settlement of these claims. The Company’s surface flaking warranty reserve is based on management’s estimate of the number of claims to be settled with payment and the average cost to settle each claim. Auditing the surface flaking warranty reserve is complex because it involves the estimation of the number of claims to be settled with payment and requires the use of actuarial specialists. This estimate has a significant effect on the surface flaking warranty reserve. |
| | |
How We Addressed the Matter in Our Audit
|
| We obtained an understanding, evaluated the design and tested the operating effectiveness of the controls over the Company’s process to estimate the number of claims to be settled with payment. To test the estimated number of claims to be settled with payment, our audit procedures included, among others, evaluating the methodology and the significant assumptions used by management. We also involved an actuarial specialist to assist us in independently calculating a range of the expected number of claims to be settled with payment and compared that to the Company’s range. |
/s/ Ernst & Young LLP
We have served as the Company’s auditor since 1995.
Baltimore, Maryland
February 24, 2025
TREX COMPANY, INC.
CONSOLIDATED STATEMENTS OF COMPREHENSIVE INCOME
| | | | | | | | | | | | |
| | Year Ended December 31, | |
| | 2024 | | | 2023 | | | 2022 | |
| | (In thousands, except share and per share data) | |
Net sales | | $ | 1,151,449 | | | $ | 1,094,837 | | | $ | 1,106,043 | |
Cost of sales | | | 665,781 | | | | 642,430 | | | | 702,054 | |
Gross profit | | | 485,668 | | | | 452,407 | | | | 403,989 | |
Selling, general and administrative expenses | | | 179,995 | | | | 176,203 | | | | 141,831 | |
Loss on sale | | | — | | | | — | | | | 15,423 | |
Income from operations | | | 305,673 | | | | 276,204 | | | | 246,735 | |
Interest (income) expense, net | | | (11 | ) | | | 5 | | | | (103 | ) |
Income before income taxes | | | 305,684 | | | | 276,199 | | | | 246,838 | |
Provision for income taxes | | | 79,292 | | | | 70,815 | | | | 62,212 | |
Net income | | $ | 226,392 | | | $ | 205,384 | | | $ | 184,626 | |
Basic earnings per common share | | $ | 2.09 | | | $ | 1.89 | | | $ | 1.65 | |
Basic weighted average common shares outstanding | | | 108,191,635 | | | | 108,680,459 | | | | 111,710,676 | |
Diluted earnings per common share | | $ | 2.09 | | | $ | 1.89 | | | $ | 1.65 | |
Diluted weighted average common shares outstanding | | | 108,322,576 | | | | 108,809,403 | | | | 111,880,488 | |
Comprehensive income | | $ | 226,392 | | | $ | 205,384 | | | $ | 184,626 | |
See Notes to Consolidated Financial Statements.
TREX COMPANY, INC.
CONSOLIDATED BALANCE SHEETS
| | | | | | | | |
| | December 31, | |
| | 2024 | | | 2023 | |
| | (In thousands) | |
ASSETS | | | | | | |
Current Assets: | | | | | | |
Cash and cash equivalents | | $ | 1,292 | | | $ | 1,959 | |
Accounts receivable, net | | | 88,356 | | | | 41,136 | |
Inventories | | | 207,282 | | | | 107,089 | |
Prepaid expenses and other assets | | | 21,978 | | | | 22,070 | |
Total current assets | | | 318,908 | | | | 172,254 | |
Property, plant and equipment, net | | | 922,868 | | | | 709,402 | |
Operating lease assets | | | 52,195 | | | | 26,233 | |
Goodwill and other intangible assets, net | | | 22,048 | | | | 18,163 | |
Other assets | | | 8,279 | | | | 6,833 | |
Total Assets | | $ | 1,324,298 | | | $ | 932,885 | |
LIABILITIES AND STOCKHOLDERS’ EQUITY | | | | | | |
Current Liabilities: | | | | | | |
Accounts payable | | $ | 61,272 | | | $ | 23,963 | |
Accrued expenses and other liabilities | | | 72,879 | | | | 56,734 | |
Accrued warranty | | | 5,726 | | | | 4,865 | |
Line of credit | | | 202,600 | | | | 5,500 | |
Total current liabilities | | | 342,477 | | | | 91,062 | |
Deferred income taxes | | | 56,032 | | | | 72,439 | |
Operating lease liabilities | | | 41,979 | | | | 18,840 | |
Non-current accrued warranty | | | 17,109 | | | | 17,313 | |
Other long-term liabilities | | | 16,559 | | | | 16,560 | |
Total Liabilities | | | 474,156 | | | | 216,214 | |
Commitments and contingencies | | | — | | | | — | |
Stockholders’ Equity: | | | | | | |
Preferred stock, $0.01 par value, 3,000,000 shares authorized; none issued and
outstanding | | | — | | | | — | |
Common stock, $0.01 par value, 360,000,000 shares authorized; 141,098,251 and 140,974,843 shares issued and 107,154,305 and 108,611,537 shares outstanding at December 31, 2024 and December 31, 2023, respectively | | | 1,411 | | | | 1,410 | |
Additional paid-in capital | | | 148,153 | | | | 140,157 | |
Retained earnings | | | 1,562,450 | | | | 1,336,058 | |
Treasury stock, at cost, 33,943,946 and 32,363,306 shares at December 31, 2024 and December 31, 2023, respectively | | | (861,872 | ) | | | (760,954 | ) |
Total Stockholders’ Equity | | | 850,142 | | | | 716,671 | |
Total Liabilities and Stockholders’ Equity | | $ | 1,324,298 | | | $ | 932,885 | |
See Notes to Consolidated Financial Statements.
TREX COMPANY, INC.
CONSOLIDATED STATEMENTS OF CHANGES IN STOCKHOLDERS’ EQUITY
(In thousands, except share data)
| | | | | | | | | | | | | | | | | | | | | | | | | | | | |
| | Common Stock | | | Additional
Paid-In | | | Retained | | | Treasury Stock | | | | |
| | Shares | | | Amount | | | Capital | | | Earnings | | | Shares | | | Amount | | | Total | |
Balance, December 31, 2021 | | | 115,148,152 | | | $ | 1,407 | | | $ | 127,787 | | | $ | 946,048 | | | | 25,586,601 | | | $ | (350,208 | ) | | $ | 725,034 | |
Net income | | | — | | | | — | | | | — | | | | 184,626 | | | | — | | | | — | | | | 184,626 | |
Employee stock plans | | | 38,320 | | | | — | | | | 1,742 | | | | — | | | | — | | | | — | | | | 1,742 | |
Shares withheld for taxes on awards | | | (45,834 | ) | | | 1 | | | | (3,319 | ) | | | — | | | | — | | | | — | | | | (3,318 | ) |
Stock-based compensation | | | 114,594 | | | | — | | | | 5,329 | | | | — | | | | — | | | | — | | | | 5,329 | |
Repurchases of common stock | | | (6,511,809 | ) | | | — | | | | — | | | | — | | | | 6,511,809 | | | | (395,064 | ) | | | (395,064 | ) |
Balance, December 31, 2022 | | | 108,743,423 | | | $ | 1,408 | | | $ | 131,539 | | | $ | 1,130,674 | | | | 32,098,410 | | | $ | (745,272 | ) | | $ | 518,349 | |
Net income | | | — | | | | — | | | | — | | | | 205,384 | | | | — | | | | — | | | | 205,384 | |
Employee stock plans | | | 27,620 | | | | — | | | | 1,223 | | | | — | | | | — | | | | — | | | | 1,223 | |
Shares withheld for taxes on awards | | | (48,736 | ) | | | 2 | | | | (2,769 | ) | | | — | | | | — | | | | — | | | | (2,767 | ) |
Stock-based compensation | | | 154,126 | | | | — | | | | 10,164 | | | | — | | | | — | | | | — | | | | 10,164 | |
Repurchases of common stock | | | (264,896 | ) | | | — | | | | — | | | | — | | | | 264,896 | | | | (15,682 | ) | | | (15,682 | ) |
Balance, December 31, 2023 | | | 108,611,537 | | | $ | 1,410 | | | $ | 140,157 | | | $ | 1,336,058 | | | | 32,363,306 | | | $ | (760,954 | ) | | $ | 716,671 | |
Net income | | | — | | | | — | | | | — | | | | 226,392 | | | | — | | | | — | | | | 226,392 | |
Employee stock plans | | | 20,604 | | | | — | | | | 1,281 | | | | — | | | | — | | | | — | | | | 1,281 | |
Shares withheld for taxes on awards | | | (65,081 | ) | | | 1 | | | | (5,920 | ) | | | — | | | | — | | | | — | | | | (5,919 | ) |
Stock-based compensation | | | 167,885 | | | | — | | | | 12,635 | | | | — | | | | — | | | | — | | | | 12,635 | |
Repurchases of common stock | | | (1,580,640 | ) | | | — | | | | — | | | | — | | | | 1,580,640 | | | | (100,918 | ) | | | (100,918 | ) |
Balance, December 31, 2024 | | | 107,154,305 | | | $ | 1,411 | | | $ | 148,153 | | | $ | 1,562,450 | | | | 33,943,946 | | | $ | (861,872 | ) | | $ | 850,142 | |
See Notes to Consolidated Financial Statements.
TREX COMPANY, INC.
CONSOLIDATED STATEMENTS OF CASH FLOWS
| | | | | | | | | | | | |
| | Year Ended December 31, | |
| | 2024 | | | 2023 | | | 2022 | |
| | (In thousands) | |
Operating Activities | | | | | | | | | |
Net income | | $ | 226,392 | | | $ | 205,384 | | | $ | 184,626 | |
Adjustments to reconcile net income to net cash provided by operating
activities: | | | | | | | | | |
Depreciation and amortization | | | 54,670 | | | | 50,189 | | | | 44,298 | |
Deferred income taxes | | | (16,407 | ) | | | 4,215 | | | | 24,256 | |
Loss on sale | | | — | | | | — | | | | 15,423 | |
Stock-based compensation | | | 12,635 | | | | 10,164 | | | | 5,329 | |
Loss (gain) on disposal of property, plant and equipment | | | 2,644 | | | | 3,140 | | | | (27 | ) |
Other non-cash adjustments | | | 187 | | | | (48 | ) | | | (117 | ) |
Changes in operating assets and liabilities: | | | | | | | | | |
Accounts receivable | | | (47,220 | ) | | | 56,921 | | | | 42,513 | |
Inventories | | | (100,193 | ) | | | 34,266 | | | | (64,454 | ) |
Prepaid expenses and other assets | | | (10,650 | ) | | | (750 | ) | | | 7,925 | |
Accounts payable | | | (819 | ) | | | 2,697 | | | | (5,595 | ) |
Accrued expenses and other liabilities | | | 12,162 | | | | 8,875 | | | | (14,385 | ) |
Income taxes receivable/payable | | | 10,528 | | | | 14,367 | | | | (23,572 | ) |
Net cash provided by operating activities | | | 143,929 | | | | 389,420 | | | | 216,220 | |
Investing Activities | | | | | | | | | |
Expenditures for property, plant and equipment | | | (232,337 | ) | | | (166,089 | ) | | | (176,228 | ) |
Purchased intangibles | | | (4,304 | ) | | | — | | | | — | |
Proceeds from sale of assets | | | — | | | | — | | | | 7,290 | |
Proceeds from sales of property, plant and equipment | | | 106 | | | | — | | | | 54 | |
Net cash used in investing activities | | | (236,535 | ) | | | (166,089 | ) | | | (168,884 | ) |
Financing Activities | | | | | | | | | |
Borrowings under line of credit | | | 842,300 | | | | 593,500 | | | | 425,000 | |
Principal payments under line of credit | | | (645,200 | ) | | | (810,000 | ) | | | (203,000 | ) |
Repurchases of common stock | | | (105,940 | ) | | | (18,450 | ) | | | (398,382 | ) |
Proceeds from employee stock purchase and option plans | | | 1,282 | | | | 1,223 | | | | 1,742 | |
Financing costs | | | (503 | ) | | | 30 | | | | (1,424 | ) |
Net cash provided by (used in) financing activities | | | 91,939 | | | | (233,697 | ) | | | (176,064 | ) |
Net decrease in cash and cash equivalents | | | (667 | ) | | | (10,366 | ) | | | (128,728 | ) |
Cash and cash equivalents at beginning of year | | | 1,959 | | | | 12,325 | | | | 141,053 | |
Cash and cash equivalents at end of year | | $ | 1,292 | | | $ | 1,959 | | | $ | 12,325 | |
Supplemental disclosures of cash flow information: | | | | | | | | | |
Cash paid for interest, net of capitalized interest | | $ | — | | | $ | 51 | | | $ | — | |
Cash paid for income taxes, net | | $ | 85,171 | | | $ | 52,340 | | | $ | 59,934 | |
Supplemental non-cash investing and financing disclosure: | | | | | | | | | |
Capital expenditures in accounts payable | | $ | 38,129 | | | $ | 1,332 | | | $ | 1,814 | |
See Notes to Consolidated Financial Statements.
TREX COMPANY, INC.
NOTES TO CONSOLIDATED FINANCIAL STATEMENTS
1.BUSINESS AND ORGANIZATION
Trex Company, Inc. (Trex), a Delaware corporation, was incorporated on September 4, 1998. Through December 30, 2022, Trex had one wholly-owned subsidiary, Trex Commercial Products, Inc. Together, Trex and Trex Commercial Products, Inc. are referred to as the Company. Through December 30, 2022, the Company operated in two reportable segments, Trex Residential Products (Trex Residential) and Trex Commercial Products (Trex Commercial). On December 30, 2022, the Company completed the sale of substantially all of the assets of its wholly-owned subsidiary and reportable segment, Trex Commercial. Refer to Note 3 below for more information on the sale. Subsequent to December 30, 2022, the Company operates in one reportable segment, Trex Residential.
The Company’s principal business based on net sales is the manufacture and distribution of Trex Residential high-performance, low-maintenance wood-alternative decking and residential railing and outdoor living products and accessories, marketed under the brand name Trex®. A majority of its products are manufactured in a proprietary process that combines reclaimed wood fibers and recycled polyethylene. Trex Commercial designed, engineered and marketed modular and architectural railing and staging systems for the commercial and multi-family market, including sports stadiums and performing arts venues. The principal executive offices are located at 2500 Trex Way, Winchester, Virginia 22601, and the telephone number at that address is (540) 542-6300.
2.SUMMARY OF SIGNIFICANT ACCOUNTING POLICIES
Basis of Accounting
The accompanying consolidated financial statements have been prepared in accordance with accounting principles generally accepted in the United States. The consolidated financial statements include the accounts of the Company. Intercompany accounts and transactions have been eliminated in consolidation.
The Company’s results of operations are affected by a number of factors, including, but not limited to, the cost to manufacture and distribute products, cost of raw materials, inflation, tariffs, consumer spending and preferences, interest rates, the impact of any supply chain disruptions, economic conditions, and/or any adverse effects from global health pandemics and geopolitical conflicts.
Use of Estimates
The preparation of financial statements in conformity with accounting principles generally accepted in the United States requires management to make estimates and assumptions that affect the amounts reported in the consolidated financial statements and the accompanying notes. Actual results could differ from those estimates.
Cash and Cash Equivalents
Cash equivalents consist of highly liquid investments purchased with original maturities of three months or less.
Concentrations and Credit Risk
The Company’s financial instruments that are exposed to concentrations of credit risk consist primarily of cash and cash equivalents and trade accounts receivable. The Company from time to time may have bank deposits in excess of insurance limits of the Federal Deposit Insurance Corporation. As of December 31, 2024, substantially all deposits are maintained in one financial institution. The Company has not experienced any losses in such accounts and believes it is not exposed to any significant credit risk related to its cash and cash equivalents.
The Company routinely assesses the financial strength of its customers and believes that its trade receivables credit risk exposure is limited. Trade receivables are recognized at the amount of revenue recognized on each shipment for Trex Residential products as the Company has an unconditional right to consideration from the customer and payment is due based solely on the passage of time. An estimate of expected credit losses is recognized as a valuation allowance and adjusted each reporting period. The estimate is based on the current expected credit loss model and is determined using an aging schedule, including past events, current conditions and reasonable and supportable forecasts about the future. There was no material valuation allowance recorded as of December 31, 2024 and December 31, 2023.
In the years ended December 31, 2024, 2023, and 2022, sales to certain customers of Trex Residential accounted for 10% or more of the Company’s total net sales. For the year ended December 31, 2024, three customers of Trex Residential represented approximately 81% of the Company’s total net sales. For the year ended December 31, 2023, three customers of Trex Residential represented 72% of the Company’s total net sales. For the year ended December 31, 2022, three customers of Trex Residential
represented approximately 64% of the Company’s total net sales. No other customer represented 10% or more of the Company’s total net sales. At December 31, 2024, two customers represented 33%, and 32%, respectively, of the Company’s total accounts receivable balance. At December 31, 2023, three customers represented 27%, 23% and 20%, respectively, of the Company’s total accounts receivable balance.
For each year ended December 31, 2024, 2023, and 2022, approximately 21.4%, 26.7%, and 17.5%, respectively, of the Company’s materials purchases at Trex Residential were purchased from its four largest suppliers.
Inventories
Inventories for the composite decking and railing products at Trex Residential are valued at the lower of cost (last-in, first-out, or LIFO, method) and market as this method results in a better matching of costs and revenues. The Company periodically reviews its inventory for slow moving or obsolete items and writes down the related products to the lower of cost or market. The Company’s reserves for estimated slow moving products or obsolescence are not material. At December 31, 2024, the excess of the replacement cost of inventory over the LIFO value of inventory was approximately $49.7 million. Due to the nature of the LIFO valuation methodology, liquidations of inventories result in a portion of the Company's cost of sales being based on historical rather than current year costs. There were no LIFO liquidations or related impact on cost of sales in 2024.
A majority of the products at Trex Residential are made in a proprietary process that combines reclaimed wood fibers and scrap polyethylene. Trex Residential grinds up scrap materials generated from its manufacturing process and inventories deemed no longer salable and reintroduces the reclaimed material into the manufacturing process as a substitute for raw materials. The reclaimed material is valued at the costs of the raw material components of the material.
Property, Plant and Equipment
Property, plant and equipment are stated at historical cost. The costs of additions and improvements are capitalized, while maintenance and repairs are expensed as incurred. Cash flows for capital expenditures as reported in cash flows from investing activities in the Consolidated Statements of Cash Flows are adjusted to exclude unpaid amounts accrued at period end. Depreciation is provided using the straight-line method generally over the following estimated useful lives:
| |
Buildings | 40 years |
Machinery and equipment | 3-11 years |
Furniture and fixtures | 10 years |
Forklifts and tractors | 5 years |
Computer equipment and software | 5 years |
Leasehold improvements are amortized over the shorter of the lease term or 15 years.
The Company reviews its long-lived assets, including property, plant and equipment, whenever events or changes in circumstances indicate that the carrying amount of the assets may not be fully recoverable. To determine the recoverability of its long-lived assets, the Company evaluates the probability that future estimated undiscounted net cash flows will be less than the carrying amount of the long-lived assets. If the estimated cash flows are less than the carrying amount of the long-lived assets, the assets are written down to their fair value. The Company’s estimates of anticipated cash flows and the remaining estimated useful lives of long-lived assets could be reduced in the future. As a result, the carrying amount of long-lived assets could be reduced in the future. Long-lived assets held for sale are stated at the lower of cost or fair value less cost to sell.
Leases
The Company leases office space, storage warehouses, training and manufacturing facilities, and certain office and plant equipment under various operating leases. At inception of an arrangement, the Company evaluates, among other things, whether it has the right to control the use of an identified asset in order to determine if the arrangement is or contains a lease. Operating leases are included in operating lease right-of-use (ROU) assets, accrued expenses and other current liabilities, and operating lease liabilities in the consolidated balance sheets. Operating leases with an initial term of 12 months or less are not included in the consolidated balance sheet. The Company recognizes lease expense for these leases on a straight-line basis over the lease term. ROU assets represent the right to use an underlying asset for the lease term and operating lease liabilities represent the obligation to make lease payments arising from the lease. Operating lease ROU assets and liabilities are recognized at commencement date based on the present value of lease payments over the lease term. As the implicit rates of the Company’s leases are not readily determinable, the Company uses its incremental borrowing rate based on the information available at the commencement date in determining the present value of lease
payments. The Company considers instruments with similar characteristics when calculating its incremental borrowing rate. Certain events, such as a modification to the arrangement or a change in the lease term, are assessed by the Company to determine if it is required to reassess estimates and judgments and remeasure the lease liability and ROU asset. The Company reviews its ROU asset for impairment whenever events or changes in circumstances indicate that the carrying amount of the asset may not be fully recoverable. The carrying amount of the ROU asset is not recoverable if it exceeds the sum of the undiscounted cash flows expected to result from the use of the asset. An impairment loss is measured as the amount by which the carrying amount of the ROU asset exceeds its fair value. The Company’s operating leases have remaining lease terms up to 11 years. Lease terms may include options to extend or terminate the lease when the Company determines that it is reasonably certain it will exercise the option. Lease expense for operating lease payments is recognized on a straight-line basis over the lease term. The Company has lease agreements with lease and non-lease components, which are accounted for separately. Consideration for non-lease components is stated on a stand-alone basis in the applicable agreements.
Fair Value Measurement
Assets and liabilities measured at fair value are measured at the amount that would be received for selling an asset or paid to transfer a liability in an orderly transaction between market participants at the measurement date and classified into one of the following fair value hierarchies:
•Level 1 – Quoted prices for identical instruments in active markets.
•Level 2 – Quoted prices for similar instruments in active markets; quoted prices for identical or similar instruments in markets that are not active; and model derived valuations in which all significant inputs and significant value drivers are observable in active markets.
•Level 3 – Valuations derived from management’s best estimate of what market participants would use in pricing the asset or liability at the measurement date. Consideration is given to the risk inherent in the valuation technique and the risk inherent in the inputs to the model.
Goodwill
Goodwill represents the excess of cost over net assets acquired resulting from the Company’s 1996 purchase of the Mobil Composite Products Division, the 2011 purchase of the assets of the Iron Deck Corporation, and the 2017 purchase of certain assets and the assumption of certain liabilities of SC Company. The Company evaluates the recoverability of goodwill in accordance with Accounting Standard Codification Topic 350, “Intangibles – Goodwill and Other,” annually or more frequently if an event occurs or circumstances change in the interim that would more likely than not reduce the fair value of the asset below its carrying amount. Goodwill is considered to be impaired when the net book value of the reporting unit exceeds its estimated fair value.
The Company assigned its goodwill to reporting units and tests each reporting unit’s goodwill for impairment at least on an annual basis, or more frequently if an event occurs or circumstances change in the interim that indicate the carrying amount of reporting unit goodwill exceeds the implied fair value of that goodwill. The Company identified its reporting units based on the way it manages its operating segments. Prior to December 30, 2022, the Company had three reporting units: a residential reporting unit in the Trex Residential reportable segment, and a commercial railing reporting unit and a staging reporting unit in the Trex Commercial reportable segment. Subsequent to the sale of Trex Commercial on December 30, 2022, the Company has one reporting unit in the Trex Residential reportable segment. Each reporting unit constitutes a business with discrete financial information and operating segment management, at a level below the Company’s chief operating decision maker regularly reviews the operating results of the reporting unit. The Company assigned goodwill to the reporting units based on the excess of the fair values acquired over the fair value of the sum of the individual assets acquired and liabilities assumed that were assigned to the reporting units.
In testing for goodwill impairment, the Company first assesses qualitative factors to determine whether it is more likely than not that the fair value of a reporting unit is less than its carrying amount, including goodwill. If the qualitative assessment indicates that the carrying amount of the reporting unit exceeds its fair value, including goodwill, the Company is then required to perform a quantitative goodwill impairment test. The quantitative goodwill impairment test, used to identify both the existence of impairment and the amount of impairment loss, compares the fair value of a reporting unit with its carrying amount, including goodwill. The fair value of a reporting unit refers to the price that would be received to sell the unit as a whole in an orderly transaction between market participants at the measurement date. If the carrying amount of a reporting unit exceeds its fair value, an impairment loss is recognized in an amount equal to that excess, limited to the total amount of goodwill allocated to that reporting unit.
The Company performs the annual impairment testing of its goodwill as of October 31 of each year. For fiscal years 2024, 2023 and 2022, the Company completed its annual impairment test of goodwill for its Trex Residential reporting segment residential reporting unit utilizing the qualitative assessment and concluded it was not more likely than not that the fair value of the residential
reporting unit was less than its carrying amount. Qualitative factors the Company considered include events and circumstances such as macroeconomic conditions, industry and market considerations, cost factors, overall financial performance, and other relevant Company-specific events, as applicable.
Product Warranty
The Company warrants that for the applicable warranty period its Trex Residential products, when properly installed, used and maintained, will be free from material defects in workmanship and materials and its decking, cladding, fascia and railing products will not split, splinter, rot or suffer structural damage from termites or fungal decay.
Products sold on or after January 1, 2023: The warranty period for residential use is 50 years for Transcend® decking, 35 years for Select® decking and Universal Fascia, and 25 years for Enhance® decking and Transcend, Select, Enhance and Signature® railing. The warranty period for commercial use is 10 years, excluding Signature railing and Transcend cladding, which each have a warranty period of 25 years. The Company further warrants that Trex Transcend, Trex Enhance and Trex Select decking and cladding and Universal Fascia products will not fade in color from light and weathering exposure more than a certain amount and will be resistant to permanent staining from food and beverage substances or mold and mildew, provided the stain is cleaned within seven days of appearance, for the warranty period referred to above. If there is a breach of such warranties, the Company has an obligation either to replace the defective product or refund the purchase price.
Products sold prior to January 1, 2023: The warranty period is 25 years for residential use and 10 years for commercial use. With respect to Trex Signature railing, the warranty period is 25 years for both residential and commercial use. The Company further warrants that Trex Transcend, Trex Enhance, Trex Select and Universal Fascia products will not fade in color more than a certain amount and will be resistant to permanent staining from food substances or mold, provided the stain is cleaned within seven days of appearance, for the warranty period referred to above. If there is a breach of such warranties, the Company has an obligation either to replace the defective product or refund the purchase price.
The Company maintains a warranty reserve for the settlement of its product warranty claims. The Company accrues for the estimated cost of product warranty claims at the time revenue is recognized based on such factors as historical claims experience and expected future claims experience. Management reviews and adjusts these estimates, if necessary, based on the differences between actual experience and historical estimates. Additionally, the Company accrues for warranty costs associated with occasional or unanticipated product quality issues if a loss is probable and can be reasonably estimated, as necessary.
Treasury Stock
The Company records the repurchase of shares of its common stock at cost. These shares are considered treasury stock, which is a reduction to stockholders’ equity. Treasury stock is included in authorized and issued shares but excluded from outstanding shares.
Revenue Recognition
Trex Residential Products. Trex Residential principally generates revenue from the manufacture and sale of its high-performance, low-maintenance, eco-friendly composite decking and railing products and accessories. Substantially all of its revenues are from contracts with customers, which are individual customer purchase orders of short-term duration of less than one year. Trex Residential satisfies its performance obligations at a point in time. The shipment of each product is a separate performance obligation as the customer is able to derive benefit from each product shipped and no performance obligation remains after shipment. Upon shipment of the product, the customer obtains control over the distinct product and Trex Residential satisfies its performance obligation. Any performance obligation that remains unsatisfied at the end of a reporting period is part of a contract that has an original expected duration of one year or less. Any variable consideration related to the unsatisfied performance obligation is allocated wholly to the unsatisfied performance obligation and recognized when the product ships and the performance obligation is satisfied and is included in “Accrued expenses and other liabilities, Sales and marketing” in Note 8 to these Consolidated Financial Statements.
Trex Commercial Products. Trex Commercial generated revenue from the manufacture and sale of its modular and architectural railing and staging systems. All of its revenues were from fixed-price contracts with customers. Trex Commercial contracts had a single performance obligation as the promise to transfer the individual goods or services was not separately identifiable from other promises in the contract and was, therefore, not distinct. On December 30, 2022, the Company sold substantially all of the assets of its wholly-owned subsidiary and reportable segment Trex Commercial.
Trex Commercial satisfied its performance obligation over time as work progressed because control transferred continuously to its customers. Revenue and estimated profit were recognized over time based on the proportion of actual costs incurred to date relative to total estimated costs at completion to measure progress toward satisfying the performance obligation. Incurred costs represent work
performed, which corresponds with, and thereby best depicts, the transfer of control to the customer. Incurred costs included all direct material, labor, subcontract and certain indirect costs. The Company reviewed and updated its estimates regularly and recognized adjustments in estimated profit on contracts under the cumulative catch-up method. Under this method, the impact of the adjustment on revenue and estimated profit to date on a contract is recognized in the period the adjustment is identified. If at any time the estimate of contract profitability indicated an anticipated loss on the contract, the Company recognized the total loss in the period it was identified. During the year ended December 31, 2022, no adjustment to any one contract was material to the Company’s Consolidated Financial Statements and no material impairment loss on any contract was recorded.
Stock-Based Compensation
The Company measures stock-based compensation at the grant date of the award based on the fair value. For stock options, stock appreciation rights and time-based restricted stock and time-based restricted stock units, stock-based compensation is recognized on a straight-line basis over the vesting periods of the award. The Company recognizes forfeitures as they occur. For performance-based restricted stock and performance-based restricted stock units, expense is recognized ratably over the performance and vesting period of each tranche based on management’s judgment of the ultimate award that is probable to be paid out based on the achievement of predetermined performance measures. Stock-based compensation expense is included in “Selling, general and administrative expenses” in the accompanying Consolidated Statements of Comprehensive Income.
Income Taxes
The Company recognizes deferred tax assets and liabilities based on the difference between the financial statement basis and tax basis of assets and liabilities using enacted tax laws and statutory tax rates. The Company assesses the likelihood that its deferred tax assets will be realized. Deferred tax assets are reduced by a valuation allowance when, after considering all available positive and negative evidence, it is determined that it is more likely than not that some portion, or all, of the deferred tax asset will not be realized. As of December 31, 2024, the Company has a valuation allowance of $2.6 million against these deferred tax assets related to certain state tax credits. The Company analyzes its position in subsequent reporting periods, considering all available positive and negative evidence, in determining the expected realization of its deferred tax assets.
Research and Development Costs
Research and development costs are expensed as incurred. For the years ended December 31, 2024, 2023, and 2022, research and development costs were $3.5 million, $3.3 million, and $0.5 million, respectively, and have been included in “Selling, general and administrative expenses” in the accompanying Consolidated Statements of Comprehensive Income.
Advertising Costs
The Company expenses its branding and advertising communication costs as incurred. Production costs are deferred and recognized as expense in the period that the related advertisement is first used. For the years ended December 31, 2024, 2023, and 2022, branding expenses, including advertising expenses, were $53.5 million, $48.8 million, and $43.3 million, respectively.
Fair Value of Financial Instruments
The Company considers the recorded value of its financial assets and liabilities, consisting primarily of cash and cash equivalents, accounts receivable, accounts payable, accrued expenses and other current liabilities, and debt to approximate the fair value of the respective assets and liabilities on the Consolidated Balance Sheets at December 31, 2024 and 2023.
New Accounting Standards Recently Adopted
In November 2023, the Financial Accounting Standards Board (FASB) issued Accounting Standards Update (ASU) No. 2023-07, “Segment Reporting (Topic 280): Improvements to Reportable Segment Disclosures.” The guidance requires disclosure of significant segment expenses which are regularly provided to the chief operating decision maker (CODM), the composition of and amount of other segment items, the CODM’s title and position within the organization, and how the CODM uses the reported measure(s) of segment’s profit or loss to assess the performance of the segment. In addition, on an interim basis, all segment profit or loss and asset disclosures currently required on an annual basis must be reported, as well as those required by Topic 280. The guidance allows for multiple measure of a segment’s profit or loss to be reported. Entities which have a single reportable segment must apply Topic 280 in its entirety. The guidance was effective for fiscal years beginning after December 15, 2023, and for interim periods beginning after December 15, 2024. Early adoption was permitted. Entities are required to apply the amendments of this update retrospectively for all prior periods presented in the financial statements. The Company adopted the standard in the quarterly period ended December 31, 2024. The Company applied the standard retrospectively and accordingly, prior periods were adjusted. Adoption of this guidance did not impact consolidated results of operations and financial position.
New Accounting Standards Not Yet Adopted
In November 2024, the FASB issued ASU No. 2024-03, “Income Statement – Reporting Comprehensive Income – Disaggregation Disclosures.” This guidance requires more detailed disclosure about the types of expenses presented within the expense captions of the financial statements. Specifically, disclosure of purchases of inventory, employee compensation, depreciation, and intangible asset amortization are required on both an interim and annual basis. In addition, a qualitative description of remaining amounts in relevant expense captions which have not separately been disaggregated will be required on an interim and annual basis. On an annual basis, disclosure of an entity’s definition of selling expenses and the amount of selling expenses is required. The amendments to this update are effective for annual reporting periods beginning after December 15, 2026, and interim periods beginning after December 15, 2027. Early adoption of this update is permitted. The amendments to this update should be applied prospectively to financial statements issued for reporting periods after the effective date of the update or retrospectively to any or all prior periods presented in the financial statements. The Company believes adoption will result in expanded financial statement footnote disclosure but does not believe adoption of this update will have a material impact on its consolidated results of operations. The Company is continuing to evaluate the impacts of the pending adoption. As such, the Company’s preliminary assessments are subject to change.
In December 2023, the FASB issued ASU No. 2023-09, “Income Taxes (Topic 740): Improvements to Income Tax Disclosures.” The guidance requires public entities to disclose additional categories of information related to federal, state, and foreign income taxes and additional details related to reconciling items should they meet a quantitative threshold. The guidance requires disclosure of income taxes paid (net of refunds received) disaggregated by federal, state, and foreign taxes and to disaggregate the information by jurisdiction based on quantitative thresholds. The guidance is effective for fiscal year beginning after December 15, 2024. Early adoption is permitted. The guidance should be applied on a prospective basis, retrospective application is permitted. The Company does not expect adoption of the guidance to have a material effect on its consolidated results of operations and financial position.
3.SALE OF TREX COMMERCIAL PRODUCTS, INC.
On December 30, 2022, the Company completed the sale of substantially all of the assets of its wholly-owned subsidiary and reportable segment, Trex Commercial, for net proceeds of $7.3 million. The divestiture reflected the Company’s decision to focus on driving the most profitable growth strategy for the Company and its shareholders through the execution of its outdoor living strategy. With the sale complete, the Company has dedicated its resources to accelerating conversion to composites from wood and further strengthen its leadership position in the outdoor living category. The sale resulted in a loss on sale of $15.4 million and is reported in the Consolidated Statements of Comprehensive Income. The divestiture did not represent a strategic shift with a major effect on the Company’s operations and financial results and, therefore, was not reported as a discontinued operation. As such, the results of operations of Trex Commercial are consolidated in the Company’s results of operations for the year ended December 31, 2022. Refer to Note 17, Segment Information, for additional information on the Trex Commercial segment.
Inventories at LIFO value consist of the following as of December 31 (in thousands):
| | | | | | | | |
| | 2024 | | | 2023 | |
Finished goods | | $ | 183,670 | | | $ | 88,840 | |
Raw materials | | | 73,281 | | | | 51,688 | |
Total FIFO (first-in, first-out) inventories | | | 256,951 | | | | 140,528 | |
Reserve to adjust inventories to LIFO value | | | (49,669 | ) | | | (33,439 | ) |
Total LIFO inventories | | $ | 207,282 | | | $ | 107,089 | |
Inventory related to Trex Residential composite decking and railing products is stated at the lower of LIFO cost or market. The Company periodically reviews its inventory for slow moving or obsolete items and writes down the related products to estimated market. During the year ended December 31, 2024 the Company adjusted reserves for estimated slow moving products or obsolescence. These reserves are not material.
Under the LIFO method, reductions in inventory cause a portion of the Company’s cost of sales to be based on historical costs rather than current year costs. There was no inventory reduction in 2024. During the year ended December 31, 2023, the Company had a liquidation of inventories produced in the prior year ended December 31, 2022. As a result, a portion of the Company’s cost of sales in 2023 was based on prior year costs rather than on current year costs. However, the prior year cost of inventory closely approximated the current year cost of inventory and the resulting effect of the liquidation of inventories on the Company’s cost of sales was immaterial in the year ended December 31, 2023.
5.PREPAID EXPENSES AND OTHER ASSETS
Prepaid expenses and other assets consist of the following as of December 31 (in thousands):
| | | | | | | | |
| | 2024 | | | 2023 | |
Prepaid expenses | | $ | 21,353 | | | $ | 11,830 | |
Income tax receivable | | | — | | | | 9,611 | |
Other | | | 625 | | | | 629 | |
Total prepaid expenses and other assets | | $ | 21,978 | | | $ | 22,070 | |
6.GOODWILL AND OTHER INTANGIBLE ASSETS, NET
The carrying amount of goodwill at December 31, 2024, and December 31, 2023, was $14.2 million for Trex Residential. For fiscal years 2024, 2023 and 2022, the Company completed its annual impairment test of goodwill for its residential reporting unit in Trex Residential utilizing the qualitative assessment and concluded it was not more likely than not that the fair value of the residential reporting unit was less than its carrying amount.
The Company’s intangible assets, purchased in 2018 and 2024, consist of domain names and internal use software for Trex Residential. At December 31, 2024, and December 31, 2023, intangible assets were $10.6 million and $6.3 million and accumulated amortization was $2.8 million and $2.4 million, respectively. Intangible asset amounts were determined based on the estimated economics of the asset and are amortized over the estimated useful lives on a straight-line basis over 15 years for domain names and 10 years for internal use software, which approximates the pattern in which the economic benefits are expected to be received. The Company evaluates the recoverability of intangible assets periodically and considers events or circumstances that may warrant revised estimates of useful lives or that may indicate an impairment. Intangible asset amortization expense for the year ended December 31, 2024, December 31, 2023, and December 31, 2022, was $0.4 million, $0.4 million, and $0.4 million, respectively.
7.PROPERTY, PLANT AND EQUIPMENT
Property, plant and equipment consist of the following as of December 31 (in thousands):
| | | | | | | | |
| | 2024 | | | 2023 | |
Machinery and equipment | | $ | 573,954 | | | $ | 545,037 | |
Building and improvements | | | 152,023 | | | | 145,821 | |
Forklifts and tractors | | | 24,403 | | | | 24,646 | |
Computer equipment | | | 18,103 | | | | 18,497 | |
Furniture and fixtures | | | 9,473 | | | | 9,489 | |
Construction in process | | | 463,235 | | | | 247,659 | |
Land | | | 29,976 | | | | 29,143 | |
Total property, plant and equipment | | | 1,271,167 | | | | 1,020,292 | |
Accumulated depreciation | | | (348,299 | ) | | | (310,890 | ) |
Total property, plant and equipment, net | | $ | 922,868 | | | $ | 709,402 | |
The Company had construction in process as of December 31, 2024, of approximately $463 million. The Company expects that substantially all of the construction in process will be completed and put into service before or during the year ending December 31, 2027.
Depreciation expense for the years ended December 31, 2024, 2023, and 2022, was $54.3 million, $49.8 million, and $43.9 million, respectively.
8.ACCRUED EXPENSES AND OTHER LIABILITIES
Accrued expenses and other liabilities consist of the following as of December 31 (in thousands):
| | | | | | | | |
| | 2024 | | | 2023 | |
Sales and marketing | | $ | 22,874 | | | $ | 15,496 | |
Compensation and benefits | | | 16,132 | | | $ | 25,859 | |
Capital Projects | | | 13,274 | | | | — | |
Operating lease liabilities | | | 10,800 | | | | 7,663 | |
Manufacturing costs | | | 2,904 | | | | 3,382 | |
Income Taxes | | | 917 | | | | — | |
Other | | | 5,978 | | | | 4,334 | |
Total accrued expenses and other liabilities | | $ | 72,879 | | | $ | 56,734 | |
Revolving Credit Facility
Indebtedness prior to October 10, 2024. On May 18, 2022, the Company entered into a Credit Agreement (Credit Agreement) with certain lending parties thereto (Lenders) to amend and restate the Fourth Amended and Restated Credit Agreement dated as of November 5, 2019. Under the Credit Agreement, the Lenders agreed to provide the Company with one or more Revolving Loans in a collective maximum principal amount of $400,000,000 (Loan Limit) throughout the term, which ends May 18, 2027 (Term). Included within the Loan Limit are sublimits for a Letter of Credit facility in an amount not to exceed $60,000,000; and Swing Line Loans in an aggregate principal amount at any time outstanding not to exceed $20,000,000. The Revolving Loans, the Letter of Credit facility and the Swing Line Loans are for the purpose of raising working capital and supporting general business operations.
On December 22, 2022, the Company entered into a First Amendment to the Credit Agreement (First Amendment). As a part of the First Amendment, the Credit Agreement was amended and restated to provide for an additional Revolving B Loan (as hereinafter defined). Under the First Amendment, the Lenders agreed to provide the Company with a Revolving B Loan consisting of one or more revolving loans in a collective maximum principal amount of $150,000,000 (Revolving B Loan Limit) throughout the term, which ended December 22, 2024 (Revolving B Loan Term). Previously, under the Credit Agreement, there was no Revolving B Loan. The First Amendment also provided that TD Bank, N.A. would serve as Syndication Agent.
In conjunction with the First Amendment, on December 22, 2022, the Credit Agreement was amended and restated to refer to the original loan as the Revolving A Loan. The amended and restated Credit Agreement was made an Exhibit A to the First Amendment. All of the terms of the Credit Agreement apply to the Revolving B Loan.
The amended Credit Agreement provides the Company, in the aggregate, the ability to borrow an amount up to the Revolving A Loan Limit during the Revolving A Loan Term (which ends May 18, 2027) and Revolving B Loan Limit during the Revolving B Loan Term. The Company is not obligated to borrow any amount under the revolving loans. Within the respective loan limit, the Company may borrow, repay and reborrow at any time or from time to time while the notes issued pursuant to the Credit Agreement are in effect.
Base Rate Loans (as defined in the Credit Agreement) under the Revolving A Loan and the Swing Line Loans accrue interest at the Base Rate plus the Applicable Rate (as defined in the Credit Agreement) and Term SOFR Loans for the Revolving Loans accrue interest at the rate per annum equal to the sum of Term SOFR for such interest period plus the Applicable Rate (as defined in the Credit Agreement). The Base Rate for any day is a fluctuating rate per annum equal to the highest of (a) the Federal Funds Rate plus 0.50%, (b) the rate of interest in effect for such day as publicly announced from time to time by BOA as its prime rate, and (c) the Term SOFR plus 1.0% subject to certain interest rate floors. Repayment of all then outstanding principal, interest, fees and costs is due at the end of the Term.
With respect to Revolving B Loans (as defined in the First Amendment), for any day, the rate per annum is a tiered pricing based upon the Consolidated Debt to Consolidated EBITDA Ratio. The applicable rate for Revolving B Loans that are Base Rate Loans range between 1.20% and 2.15% and the applicable rate for Revolving B Loans that are Term SOFR/Term SOFR Daily Floating Rate range between 0.20% and 1.15%.
Under the terms of the Security and Pledge Agreement, the Company, subject to certain permitted encumbrances, as collateral security for the above-stated loans and all other present and future indebtedness of the Company owing to the Lenders grants a continuing security interest in certain collateral described and defined in the Security and Pledge Agreement but excluding the Excluded Property (as defined in the Security and Pledge Agreement).
Indebtedness on and after October 10, 2024. On October 10, 2024, the Company, entered into a Second Amendment to the Credit Agreement (Second Amendment) with certain lending parties thereto (Lenders) to amend that Credit Agreement dated as of May 18, 2022, as amended by that certain First Amendment dated as of December 22, 2022.
The Second Amendment provides the Company with Revolving A Loans in the maximum principal amount of $400,000,000 (Revolving A Loans), Revolving B Loans in the maximum principal amount of $150,000,000 (Revolving B Loans), and Letters of Credit and Swing Line Loans (as defined in the Credit Agreement). The Second Amendment extends the maturity date of the Revolving B Loans from December 22, 2024 to December 22, 2026.
Base Rate Loans (as defined in the Credit Agreement) under the Revolving A Loan and the Swing Line Loans accrue interest at the Base Rate plus the Applicable Rate (as defined in the Credit Agreement) and Term SOFR Loans for the Revolving Loans accrue interest at the rate per annum equal to the sum of Term SOFR for such interest period plus the Applicable Rate (as defined in the Credit Agreement). The Base Rate for any day is a fluctuating rate per annum equal to the highest of (a) the Federal Funds Rate plus 0.50%, (b) the rate of interest in effect for such day as publicly announced from time to time by BOA as its prime rate, and (c) the Term SOFR plus 1.0% subject to certain interest rate floors. Repayment of all then outstanding principal, interest, fees and costs is due at the end of the Term (as defined in the Credit Agreement).
With respect to Revolving B Loans (as defined in the Credit Agreement), for any day, the rate per annum is a tiered pricing based upon the Consolidated Debt to Consolidated EBITDA Ratio. The applicable rate for Revolving B Loans that are Base Rate Loans range between 0.20% and 1.15%. and the applicable rate for Revolving B Loans that are Term SOFR/Term SOFR Daily Floating Rate range between 1.20% and 2.15%.
The Company had $202.6 million in borrowings outstanding under its revolving credit facility and available borrowing capacity of $347.4 million at December 31, 2024. The weighted average interest rate on the revolving credit facility was 5.26% as of December 31, 2024.
Compliance with Debt Covenants and Restrictions
Pursuant to the terms of the Credit Agreement, the Company is subject to certain loan compliance covenants. The Company was in compliance with all covenants as of December 31, 2024. Failure to comply with the financial covenants could be considered a default of repayment obligations and, among other remedies, could accelerate payment of any amounts outstanding.
For the years ended December 31, 2024, and December 31, 2023, total operating lease cost was $10.4 million and $8.0 million, respectively. The weighted average remaining lease term at December 31, 2024 and December 31, 2023 was 6.3 years and 4.4 years, respectively. The weighted average discount rate at December 31, 2024 and December 31, 2023 was 4.57% and 2.32%, respectively.
The following table includes supplemental cash flow information for the years ended December 31, 2024, December 31, 2023, and December 31, 2022 and supplemental balance sheet information at December 31, 2024 and December 31, 2023 related to operating leases (in thousands):
| | | | | | | | | | | | |
Supplemental Cash Flow Information | | For the Year Ended December 31, | |
| | 2024 | | | 2023 | | | 2022 | |
Cash paid for amounts included in the measurement of
operating lease liabilities | | $ | 10,361 | | | $ | 8,176 | | | $ | 8,688 | |
Operating ROU assets obtained in exchange for lease liabilities | | $ | 35,704 | | | $ | 2,559 | | | $ | 8,064 | |
| | | | | | | | |
Supplemental Balance Sheet Information | | December 31,
2024 | | | December 31,
2023 | |
Operating lease ROU assets | | $ | 52,195 | | | $ | 26,233 | |
Operating lease liabilities: | | | | | | |
Accrued expenses and other current liabilities | | $ | 10,800 | | | $ | 7,663 | |
Operating lease liabilities | | | 41,979 | | | | 18,840 | |
Total operating lease liabilities | | $ | 52,779 | | | $ | 26,503 | |
The following table summarizes maturities of operating lease liabilities at December 31, 2024 (in thousands):
| | | | |
Maturities of operating lease liabilities | | | |
2025 | | $ | 11,057 | |
2026 | | | 11,065 | |
2027 | | | 10,575 | |
2028 | | | 9,618 | |
2029 | | | 4,434 | |
Thereafter | | | 15,798 | |
Total lease payments | | $ | 62,547 | |
Less imputed interest | | | (9,768 | ) |
Total operating liabilities | | $ | 52,779 | |
The Company considers the recorded value of its financial assets and liabilities, consisting primarily of cash and cash equivalents, accounts receivable, accounts payable, accrued expenses and other current liabilities, and debt to approximate the fair value of the respective assets and liabilities on the Consolidated Balance Sheets at December 31, 2024 and 2023.
Earnings Per Share
The following table sets forth the computation of basic and diluted earnings per share (in thousands, except share and per share data):
| | | | | | | | | | | | |
| | Year Ended December 31, | |
| | 2024 | | | 2023 | | | 2022 | |
Numerator: | | | | | | | | | |
Net income | | $ | 226,392 | | | $ | 205,384 | | | $ | 184,626 | |
Denominator: | | | | | | | | | |
Basic weighted average shares outstanding | | | 108,191,635 | | | | 108,680,459 | | | | 111,710,676 | |
Effect of dilutive securities: | | | | | | | | | |
Stock appreciation rights | | | 51,097 | | | | 71,406 | | | | 94,859 | |
Restricted stock | | | 79,844 | | | | 57,538 | | | | 74,953 | |
Diluted weighted average shares outstanding | | | 108,322,576 | | | | 108,809,403 | | | | 111,880,488 | |
Basic earnings per share | | $ | 2.09 | | | $ | 1.89 | | | $ | 1.65 | |
Diluted earnings per share | | $ | 2.09 | | | $ | 1.89 | | | $ | 1.65 | |
Diluted earnings per share is computed using the weighted average number of shares determined for the basic earnings per share computation plus the dilutive effect of common stock equivalents using the treasury stock method. The computation of diluted earnings per share excludes the following potentially dilutive securities because the effect would be anti-dilutive:
| | | | | | | | | | | | |
| | Year Ended December 31, | |
| | 2024 | | | 2023 | | | 2022 | |
Restricted stock | | | 35,575 | | | | 52,323 | | | | 48,851 | |
Stock appreciation rights | | | 67,017 | | | | 93,163 | | | | 52,107 | |
Stock Repurchase Program
On May 4, 2023, the Trex Board of Directors adopted a new stock repurchase program (2023 Stock Repurchase Program) of up to 10.8 million shares of its outstanding common stock, and terminated the existing Stock Repurchase Program. The 2023 Stock Repurchase Program has no set expiration date. The Company repurchased 1,580,640 shares of its outstanding common stock under the 2023 Stock Repurchase Program during 2024.
13.REVENUE FROM CONTRACTS WITH CUSTOMERS
Topic 606 provides a single, comprehensive model for revenue recognition arising from contracts with customers. A performance obligation is a promise in a contract to transfer a distinct good or service to the customer and is the unit of account in Topic 606. A contract’s transaction price is allocated to each distinct performance obligation and revenue is recognized when or as the Company satisfies the performance obligation. Revenue is recognized at an amount that reflects the consideration to which the entity expects to be entitled in exchange for transferring control of the goods or services to a customer.
Trex Residential Products
Trex Residential principally generates revenue from the manufacture and sale of its high-performance, low-maintenance, eco-friendly wood-alternative composite decking and residential railing products and accessories. Substantially all of its revenues are from contracts with customers, which are purchase orders of short-term duration of less than one year. Its customers, in turn, sell primarily to the residential market, which includes replacement, remodeling and new construction related to outdoor living products. Trex Residential satisfies its performance obligations at a point in time. The shipment of each product is a separate performance obligation as the customer is able to derive benefit from each product shipped and no performance obligation remains after shipment. Upon shipment of the product, the customer obtains control over the distinct product and Trex Residential satisfies its performance obligation. Any performance obligation that remains unsatisfied at the end of a reporting period is part of a contract that has an original expected duration of one year or less. Any variable consideration related to the unsatisfied performance obligation is allocated wholly to the unsatisfied performance obligation and recognized when the product ships and the performance obligation is satisfied and is included in “Accrued expenses and other liabilities, Sales and marketing” in Note 8 to the Consolidated Financial Statements.
For each product shipped, the transaction price by product is specified in the purchase order. The Company recognizes revenue on the transaction price less any amount offered under a sales incentive program. The Company recognizes an account receivable for the amount of revenue recognized as it has an unconditional right to consideration at the time of shipment and payment from the customer is due based solely on the passage of time. The Company receives payments from its customers based on the payment terms applicable to each individual contract and the customer pays in accordance with the billing terms specified in the purchase order, which is less than one year. The related accounts receivables are included in “Accounts receivable, net” in the Consolidated Balance Sheets.
Trex Residential may offer various sales incentive programs throughout the year. It estimates the amount of sales incentive to allocate to each performance obligation, or product shipped, based on direct sales to the customer. The estimate is updated each reporting period, and any changes are allocated to the performance obligations on the same basis as at inception. Changes in estimate allocated to a previously satisfied performance obligation are recognized as a reduction of revenue in the period in which the change occurs under the cumulative catch-up method. In addition to sales incentive programs, Trex Residential may offer payment discounts. It estimates the payment discount that it believes will be taken by the customer based on prior history using the most-likely-amount method of estimation.
Trex Residential pays commissions to certain employees. However, the sales commissions are not directly attributable to identifiable contracts, are discretionary in nature and are based on other factors not related to obtaining a contract, such as individual performance, profitability of the entity, annual sales targets, etc. These costs are included in selling, general and administrative expenses as incurred. Trex Residential does not grant contractual product return rights to customers other than pursuant to its assurance product warranty (see related disclosure on product warranties in Note 19, “Commitments and Contingencies”). Trex Residential accounts for all shipping and handling fees invoiced to the customer in net sales and the related costs in cost of sales.
Trex Commercial Products
On December 30, 2022, the Company completed the sale of its wholly-owned subsidiary and reportable segment, Trex Commercial. Prior to December 30, 2022, Trex Commercial generated revenue from the manufacture and sale of its modular and architectural railing and staging systems. All of its revenues were from fixed-price contracts with customers. Trex Commercial contracts had a single performance obligation as the promise to transfer the individual goods or services was not separately identifiable from other promises in the contract and was, therefore, not distinct.
Trex Commercial satisfied its performance obligation over time as work progressed because control transferred continuously to its customers. Revenue and estimated profit was recognized over time based on the proportion of actual costs incurred to date relative to total estimated costs at completion to measure progress toward satisfying the performance obligation. Incurred costs represent work performed, which corresponds with, and thereby best depicts, the transfer of control to the customer. Incurred costs included all direct material, labor, subcontract and certain indirect costs. The Company reviewed and updated its estimates regularly and recognized adjustments in estimated profit on contracts under the cumulative catch-up method. Under this method, the impact of the adjustment
on revenue and estimated profit to date on a contract is recognized in the period the adjustment is identified. Revenues and profits in future periods are recognized using the adjusted estimate. If at any time the estimate of contract profitability indicated an anticipated loss on the contract, the Company recognized the total loss in the period it is identified. During the year ended December 31, 2022, no adjustment to any one contract was material to the Company’s Consolidated Financial Statements.
For each year in the three years ended December 31, 2024, net sales are disaggregated in the following tables by (1) market (2) timing of revenue recognition, and (3) type of contract. The tables also include a reconciliation of the respective disaggregated net sales with the Company’s reportable segments (in thousands):
| | | | | | | | |
Year Ended December 31, 2024 | | Reportable Segment | |
| | Trex
Residential | | | Total | |
Timing of Revenue Recognition and Type of Contract | | | | | | |
Products transferred at a point in time and variable
consideration contracts | | $ | 1,151,449 | | | $ | 1,151,449 | |
| | | | | | | | |
Year Ended December 31, 2023 | | Reportable Segment | |
| | Trex
Residential | | | Total | |
Timing of Revenue Recognition and Type of Contract | | | | | | |
Products transferred at a point in time and variable
consideration contracts | | $ | 1,094,837 | | | $ | 1,094,837 | |
| | | | | | | | | | | | |
Year Ended December 31, 2022 | | Reportable Segment | |
| | Trex
Residential | | | Trex
Commercial | | | Total | |
Timing of Revenue Recognition and Type of Contract | | | | | | | | | |
Products transferred at a point in time and variable
consideration contracts | | $ | 1,059,536 | | | $ | — | | | $ | 1,059,536 | |
Products transferred over time and fixed price contracts | | | — | | | | 46,507 | | | | 46,507 | |
| | $ | 1,059,536 | | | $ | 46,507 | | | $ | 1,106,043 | |
14.STOCK-BASED COMPENSATION
At the annual meeting of stockholders of the Company held on May 4, 2023, the Company’s stockholders approved the Trex Company, Inc. 2023 Stock Incentive Plan (Plan). The Company’s board of directors unanimously approved the Plan on April 10, 2023, subject to stockholder approval. The Plan amends and restates in its entirety the Trex Company, Inc. 2014 Stock Incentive Plan (2014 Plan), which was last approved by the Company’s stockholders at the annual meeting held on April 30, 2014. The Plan, which will be administered by the compensation committee of the board of directors, provides for the grant of stock options, restricted stock, restricted stock units, stock appreciation rights and unrestricted stock, which are referred to collectively as “awards.” Awards may be granted under the Plan to officers, directors (including non-employee directors) and other employees of the Company or any subsidiary thereof, to any adviser, consultant, or other provider of services to the Company (and any employee thereof), and to any other individuals who are approved by the board of directors as eligible to participate in the Plan. Only employees of the Company or any subsidiary thereof are eligible to receive incentive stock options. Subject to certain adjustments as provided in the Plan, the total aggregate number of shares of common stock that may be granted under the Plan is 4,000,000 shares. As of December 31, 2024, the total number of shares available for future grants was 3,832,112.
The Company recognizes stock-based compensation expense ratably over the period from grant date to the earlier of (1) the vesting date of the award, or (2) the date the grantee is eligible to retire without forfeiting the award. For performance-based restricted stock units, expense is recognized ratably over the performance and vesting period of each tranche based on management’s judgment of the ultimate award that is probable to be paid out based on the achievement of the predetermined performance measures. For the
employee stock purchase plan, compensation expense is recognized related to the discount on purchases. The following table summarizes the Company’s stock-based compensation expense (in thousands):
| | | | | | | | | | | | |
| | Year Ended December 31, | |
| | 2024 | | | 2023 | | | 2022 | |
Time-based restricted stock units | | $ | 5,059 | | | $ | 3,897 | | | $ | 3,783 | |
Performance-based restricted stock units | | | 5,888 | | | | 4,836 | | | | 540 | |
Stock appreciation rights | | | 1,359 | | | | 908 | | | | 792 | |
Employee stock purchase plan | | | 329 | | | | 523 | | | | 214 | |
Total stock-based compensation | | $ | 12,635 | | | $ | 10,164 | | | $ | 5,329 | |
Stock-based compensation expense is included in “Selling, general and administrative expenses” in the accompanying Consolidated Statements of Comprehensive Income.
Time-Based Restricted Stock Units
The fair value of time-based restricted stock units is determined based on the closing price of Trex shares on the grant date. Time-based restricted stock units vest based on the terms of the awards. Unvested time-based restricted stock units are generally forfeitable upon the resignation of employment or termination of employment with cause. The total fair value of vested time-based restricted stock units granted in the years ended December 31, 2024, 2023, and 2022 was $4.6 million, $4.7 million, and $3.7 million, respectively. At December 31, 2024, there was $5.0 million of total compensation expense related to unvested time-based restricted stock units remaining to be recognized over a weighted-average period of approximately 1.7 years.
Time-based restricted stock unit activity under the Plan and all predecessor stock incentive plans is as follows:
| | | | | | | | |
| | Time-based
Restricted Stock
Unit | | | Weighted-
Average
Grant Price
Per Share | |
Nonvested at December 31, 2021 | | | 111,546 | | | $ | 52.91 | |
Granted | | | 57,094 | | | $ | 75.06 | |
Vested | | | (56,719 | ) | | $ | 58.13 | |
Forfeited | | | (1,286 | ) | | $ | 86.84 | |
Nonvested at December 31, 2022 | | | 110,635 | | | $ | 61.28 | |
Granted | | | 97,177 | | | $ | 58.50 | |
Vested | | | (81,080 | ) | | $ | 56.52 | |
Forfeited | | | (10,228 | ) | | $ | 66.19 | |
Nonvested at December 31, 2023 | | | 116,504 | | | $ | 65.00 | |
Granted | | | 62,348 | | | $ | 87.53 | |
Vested | | | (64,261 | ) | | $ | 71.29 | |
Forfeited | | | (396 | ) | | $ | 75.72 | |
Nonvested at December 31, 2024 | | | 114,195 | | | $ | 74.03 | |
Performance-based Restricted Stock Units
The fair value of performance-based restricted stock units is determined based on the closing price of Trex shares on the grant date. Unvested performance-based restricted stock units are generally forfeitable upon the resignation of employment or termination of employment with cause. The performance-based restricted shares units have a three-year vesting period, vesting one-third each year based on target earnings before interest, taxes, depreciation, and amortization (EBITDA) for 1 year, cumulative 2 years and cumulative 3 years, respectively. The number of shares that will vest, with respect to each vesting, will be between 0% and 200% of the target number of shares. At December 31, 2024, 2023, and 2022 there was $3.6 million, $4.3 million, $0.3 million, respectively, of total compensation expense related to unvested performance-based restricted stock units remaining to be recognized over a weighted-average period of approximately 1.8 years.
Performance-based restricted stock unit activity under the Plan is as follows:
| | | | | | | | |
| | Performance-
based
Restricted Stock
Units | | | Weighted-
Average
Grant Price
Per Share | |
Nonvested at December 31, 2021 | | | 57,768 | | | $ | 71.21 | |
Granted | | | 72,152 | | | $ | 76.14 | |
Vested | | | (57,875 | ) | | $ | 64.43 | |
Forfeited | | | (562 | ) | | $ | 82.95 | |
Nonvested at December 31, 2022 | | | 71,483 | | | $ | 81.57 | |
Granted | | | 96,103 | | | $ | 56.79 | |
Vested | | | (30,038 | ) | | $ | 66.26 | |
Forfeited | | | (28,163 | ) | | $ | 74.39 | |
Nonvested at December 31, 2023 | | | 109,385 | | | $ | 65.92 | |
Granted | | | 80,159 | | | $ | 81.23 | |
Vested | | | (67,710 | ) | | $ | 63.83 | |
Forfeited | | | (13,390 | ) | | $ | 104.56 | |
Nonvested at December 31, 2024 | | | 108,444 | | | $ | 75.57 | |
Stock Appreciation Rights
SARs are granted with a grant price equal to the closing market price of the Company’s common stock on the date of grant. These awards expire ten years after the date of grant and vest based on the terms of the individual awards. The SARs are generally forfeitable upon the resignation of employment or termination of employment with cause. The Company recognizes forfeitures as they occur. The Company recognizes compensation cost on a straight-line basis over the vesting period for the award.
As of December 31, 2024, there was $1.5 million of unrecognized compensation cost related to SARs. The fair value of each SAR is estimated on the date of grant using a Black-Scholes option-pricing model. For SARs issued in the years ended December 31, 2024, December 31, 2023, and December 31, 2022, respectively, the assumptions shown in the following table were used:
| | | | | | | | | | | | |
| | Year Ended December 31, | |
| | 2024 | | | 2023 | | | 2022 | |
Dividend yield | | | 0 | % | | | 0 | % | | | 0 | % |
Average risk-free interest rate | | | 4.3 | % | | | 4.0 | % | | | 1.9 | % |
Expected term (years) | | | 5 | | | | 5 | | | | 5 | |
Expected volatility | | | 51.2 | % | | | 49.5 | % | | | 44.9 | % |
Dividend Yield. Trex has never paid cash dividends on its common stock.
Average Risk-Free Interest Rate. The Company uses the U.S. Treasury rate having a term that most closely resembles the expected term of the option.
Expected Term. The expected term is the period of time that the SARs granted are expected to remain unexercised. SARs granted during the years ended December 31, 2024, December 31, 2023, and December 31, 2022, had a maximum term of ten years. The Company used historical exercise behavior with further consideration given to the class of employees to whom the equity awards were granted to estimate the expected term of the SAR.
Expected Volatility. Volatility is a measure of the amount by which a financial variable such as a share price has fluctuated (historical volatility) or is expected to fluctuate (expected volatility) during a period. The Company has used the historical volatility over the average expected term of the options granted as the expected volatility.
The weighted-average grant date fair value of SARs granted during the years ended December 31, 2024, December 31, 2023, and December 31, 2022, was $44.83, $27.19, and $33.90, respectively.
SAR activity under the Plan and all predecessor stock incentive plans is as follows:
| | | | | | | | | | | | | | | | |
| | SARs | | | Weighted-
Average
Grant Price
Per Share | | | Weighted-
Average
Remaining
Contractual
Life (Years) | | | Aggregate
Intrinsic
Value as of
December 31,
2024 | |
Outstanding at December 31, 2021 | | | 200,998 | | | $ | 33.86 | | | | | | | |
Granted | | | 32,971 | | | $ | 82.01 | | | | | | | |
Exercised | | | — | | | $ | — | | | | | | | |
Canceled | | | — | | | $ | — | | | | | | | |
Outstanding at December 31, 2022 | | | 233,969 | | | $ | 40.64 | | | | | | | |
Granted | | | 51,916 | | | $ | 56.80 | | | | | | | |
Exercised | | | (53,036 | ) | | $ | 11.95 | | | | | | | |
Canceled | | | (12,969 | ) | | $ | 75.25 | | | | | | | |
Outstanding at December 31, 2023 | | | 219,880 | | | $ | 49.34 | | | | | | | |
Granted | | | 33,277 | | | $ | 90.86 | | | | | | | |
Exercised | | | (58,767 | ) | | $ | 35.77 | | | | | | | |
Canceled | | | (4,142 | ) | | $ | 89.99 | | | | | | | |
Outstanding at December 31, 2024 | | | 190,248 | | | $ | 59.91 | | | | 6.3 | | | $ | 3,145,845 | |
Vested at December 31, 2024 | | | 122,598 | | | $ | 51.41 | | | | 5.1 | | | $ | 2,794,991 | |
Exercisable at December 31, 2024 | | | 122,598 | | | $ | 51.41 | | | | 5.1 | | | $ | 2,794,991 | |
Employee Stock Purchase Plan
The Company has an employee stock purchase plan (ESPP) that permits eligible employees to purchase shares of common stock of the Company at a purchase price which is the lesser of 85% of the market price on either the first day of the calendar quarter or the last day of the calendar quarter. Eligible employees may elect to participate in the plan by authorizing payroll deductions of up to 15% of gross compensation for each payroll period. On the last day of each quarter, each participant’s contribution account is used to purchase the maximum number of whole shares of common stock determined by dividing the contribution account balance by the purchase price. The aggregate number of shares of common stock that may be purchased under the plan is 2,400,000. Through December 31, 2024, employees had purchased approximately 1,918,375 shares under the plan.
15.EMPLOYEE BENEFIT PLANS
At December 31, 2024 the Company has a 401(k) Profit Sharing Plan for the benefit of its employees who meet certain eligibility requirements and it matches qualifying employee contributions. The Company’s contributions to the plans totaled $8.6 million, $6.8 million, and $8.1 million, for the years ended December 31, 2024, 2023, and 2022, respectively.
Income tax provision (benefit) consists of the following (in thousands):
| | | | | | | | | | | | |
| | Year Ended December 31, | |
| | 2024 | | | 2023 | | | 2022 | |
Current income tax provision: | | | | | | | | | |
Federal | | $ | 75,552 | | | $ | 52,634 | | | $ | 28,830 | |
State | | | 20,147 | | | | 13,966 | | | | 9,126 | |
| | | 95,699 | | | | 66,600 | | | | 37,956 | |
Deferred income tax provision: | | | | | | | | | |
Federal | | | (14,907 | ) | | | 2,869 | | | | 20,000 | |
State | | | (1,500 | ) | | | 1,346 | | | | 4,256 | |
| | | (16,407 | ) | | | 4,215 | | | | 24,256 | |
Total income tax provision | | $ | 79,292 | | | $ | 70,815 | | | $ | 62,212 | |
The Company’s effective tax rate for the year ended December 31, 2024, was 25.9% and was comparable to the effective tax rate for the year ended December 31, 2023, of 25.6%, which resulted in income tax expense of $79.3 million and $70.8 million, respectively.
The income tax provision differs from the amount of income tax determined by applying the U.S. Federal statutory rate to income before taxes as a result of the following (in thousands):
| | | | | | | | | | | | |
| | Year Ended December 31, | |
| | 2024 | | | 2023 | | | 2022 | |
U.S. Federal statutory taxes | | $ | 64,194 | | | $ | 58,002 | | | $ | 51,836 | |
State and local taxes, net of U.S. Federal benefit | | | 13,890 | | | | 12,296 | | | | 10,608 | |
Permanent items | | | 948 | | | | 1,320 | | | | (208 | ) |
Excess tax benefits from vesting or settlement of stock
compensation awards | | | (756 | ) | | | (656 | ) | | | (11 | ) |
Federal credits | | | (636 | ) | | | (755 | ) | | | (598 | ) |
Other | | | 1,652 | | | | 608 | | | | 585 | |
Total income tax provision | | $ | 79,292 | | | $ | 70,815 | | | $ | 62,212 | |
Deferred tax assets and liabilities consist of the following (in thousands):
| | | | | | | | |
| | As of December 31, | |
| | 2024 | | | 2023 | |
Deferred tax assets: | | | | | | |
Operating lease liability | | | 13,632 | | | | 6,886 | |
Product and surface flaking warranty reserves | | | 5,833 | | | | 5,645 | |
State tax credit carryforwards | | | 3,621 | | | | 4,250 | |
Deferred revenue | | | 4,230 | | | | 4,215 | |
Tax Cut and Jobs Act capitalization of research and
development costs | | | 5,397 | | | | 3,956 | |
Stock-based compensation | | | 1,828 | | | | 2,361 | |
Inventories | | | 3,342 | | | | 639 | |
Gross deferred tax assets, before valuation allowance | | | 37,883 | | | | 27,952 | |
Valuation allowance | | | (2,638 | ) | | | (3,307 | ) |
Gross deferred tax assets, after valuation allowance | | | 35,245 | | | | 24,645 | |
Deferred tax liabilities: | | | | | | |
Depreciation | | | (70,572 | ) | | | (74,794 | ) |
Inventories | | | (2,150 | ) | | | (10,627 | ) |
Operating lease right-of-use asset | | | (13,332 | ) | | | (6,677 | ) |
Goodwill amortization | | | (3,584 | ) | | | (3,536 | ) |
Other | | | (1,639 | ) | | | (1,450 | ) |
Gross deferred tax liabilities | | | (91,277 | ) | | | (97,084 | ) |
Net deferred tax liability | | $ | (56,032 | ) | | $ | (72,439 | ) |
The Company recognizes deferred tax assets and liabilities based on the difference between the financial statement basis and tax basis of assets and liabilities using enacted tax laws and statutory tax rates. In accordance with accounting standards, the Company assesses the likelihood that its deferred tax assets will be realized. Deferred tax assets are reduced by a valuation allowance when, after considering all available positive and negative evidence, it is determined that it is more likely than not that some portion, or all, of the deferred tax asset will not be realized, primarily certain state income tax credits. As of December 31, 2024, the Company had a valuation allowance of $2.6 million against deferred tax assets it estimates will not be realized. The Company will analyze its position in subsequent reporting periods, considering all available positive and negative evidence, in determining the expected realization of its deferred tax assets.
The Company recognizes interest and penalties related to tax matters as a component of “Selling, general and administrative expenses” in the accompanying Consolidated Statements of Comprehensive Income. As of December 31, 2024, the Company has identified no uncertain tax position and, accordingly, has not recorded any unrecognized tax benefits or associated interest and penalties.
The Company operates in multiple tax jurisdictions and, in the normal course of business, its tax returns are subject to examination by various taxing authorities. Such examinations may result in future assessments by these taxing authorities, and the Company has accrued a liability when it believes that it is not more likely than not that it will realize the benefits of tax positions that it has taken or for the amount of any tax benefit that exceeds the cumulative probability threshold in accordance with accounting
standards. As of December 31, 2024, for certain tax jurisdictions, tax years 2020 through 2024 remain subject to examination. The Company believes that adequate provisions have been made for all tax returns subject to examination. Sales made to foreign distributors are not taxable in any foreign jurisdictions as the Company does not have a taxable presence.
Through December 30, 2022, the Company operated in two reportable segments. On December 30, 2022, the Company completed the sale of its wholly-owned subsidiary and reportable segment, Trex Commercial. Subsequent to the sale of Trex Commercial, the Company operates in one reportable segment, Trex Residential, with resource allocation and assessment of financial performance based on a consolidated basis.
•Trex Residential manufactures composite decking and railing and related outdoor living products marketed under the brand name Trex®. The products are sold to its distributors and two national retailers who, in turn, sell primarily to the residential market, which includes replacement, remodeling and new construction.
•Trex Commercial designed, engineered, and marketed modular and architectural railing and staging systems for the commercial and multi-family market, including sports stadiums and performing arts venues. The segment’s products were sold through architects, specifiers, contractors, and others doing business within the segment’s commercial market. On December 30, 2022, the Company completed the sale of Trex Commercial. Refer to Note 3 to these consolidated financial statements for additional information on the sale of Trex Commercial.
The Company’s reportable segments are determined in accordance with its internal management structure, which, through December 30, 2022, was based on residential and commercial operations. The Company has identified its President and Chief Executive Officer as the Chief Operating Decision Maker (CODM). The Company’s CODM has final authority over resource allocation decisions and performance assessments and makes key operating decisions. The primary objective of the CODM is to optimize positive Company-wide performance and financial results. The CODM evaluates segment performance primarily based on net income and net sales. The CODM uses net income to assess performance and allocate resources as this measure provides insight into all aspects of the segment’s operations and overall success of the segment for a given period. The CODM also uses net sales to assess performance and allocate resources as this measure represents the amount of business the segment engaged in during a given period of time, is an indicator of market growth and acceptance of segment products, and represents the segment’s customers’ spending habits along with the amount of product the segment sells relative to its competitors.
Segment Data (in thousands):
| | | | | | | | | | | | | | | | | | | | |
| | Year Ended December 31, 2024 | | | Year Ended December 31, 2023 | | | Year Ended December 31, 2022 | |
| | Consolidated | | | Consolidated | | | Trex Residential | | | Trex Commercial | | | Consolidated | |
| | | | | | | | | | | | | | | |
Net Sales (1) | | $ | 1,151,449 | | | $ | 1,094,837 | | | $ | 1,059,536 | | | $ | 46,507 | | | $ | 1,106,043 | |
Cost of Sales | | | 665,781 | | | | 642,430 | | | | 659,689 | | | | 42,365 | | | | 702,054 | |
Selling, General, and Administrative Expenses | | | 179,995 | | | | 176,203 | | | | 131,761 | | | | 10,070 | | | | 141,831 | |
Loss on Sale (2) | | | - | | | | - | | | | - | | | | 15,423 | | | | 15,423 | |
Depreciation and Amortization | | | 54,670 | | | | 50,189 | | | | 43,173 | | | | 1,125 | | | | 44,298 | |
Interest Revenue | | | 11 | | | | 73 | | | | 103 | | | | - | | | | 103 | |
Interest Expense | | | - | | | | 78 | | | | - | | | | - | | | | - | |
Income Tax Expense (Benefit), Net | | | 79,292 | | | | 70,815 | | | | 67,313 | | | | (5,101 | ) | | | 62,212 | |
Net Income (Loss) (3) | | | 226,392 | | | | 205,384 | | | | 200,876 | | | | (16,250 | ) | | | 184,626 | |
Capital Expenditures | | | 232,337 | | | | 166,089 | | | | 175,904 | | | | 324 | | | | 176,228 | |
Total Assets (4) | | | 1,324,298 | | | | 932,885 | | | | 933,705 | | | | - | | | | 933,705 | |
(1)For the year ended December 31, 2022, Trex Residential net sales excludes $485k of intercompany net sales.
(2)On December 30, 2022, the Company sold the assets of it wholly owned subsidiary, Trex Commercial, resulting in a loss of $15.4 million.
(3)For the year ended December 31, 2022, Consolidated net income and Trex Commercial net loss includes a loss on sale of Trex Commercial on December 30, 2022, of $15.4 million.
(4)The assets of Trex Commercial were sold on December 30, 2022.
The operating results for Trex Residential have historically varied from quarter to quarter. Seasonal, erratic, or prolonged adverse weather conditions may reduce the level of home improvement and construction activity and can shift demand for its products to a later period. As part of its normal business practice and consistent with industry practice, Trex Residential has historically offered incentive programs to its distributors and dealers to build inventory levels before the start of the prime deck-building season in order to ensure adequate availability of its product to meet anticipated seasonal consumer demand. The seasonal effects are often offset by the positive effect of the incentive programs.
19.COMMITMENTS AND CONTINGENCIES
Legal Matters
The Company has lawsuits, as well as other claims, pending against it which are ordinary routine litigation and claims incidental to the business. Management has evaluated the merits of these lawsuits and claims and believes that their ultimate resolution will not have a material effect on the Company’s consolidated financial condition, results of operations, liquidity, or competitive position.
Purchase Commitments
The Company fulfills requirements for raw materials under both purchase orders and supply contracts. In the year ended December 31, 2024, the Company purchased reclaimed wood fiber requirements under purchase orders and long-term supply commitments. All of the Company’s scrap polyethylene, aluminum and stainless-steel purchases are under short-term supply contracts that may average approximately one year, for which pricing is negotiated as needed, or under purchase orders that do not involve long-term supply commitments.
The wood and polyethylene supply contracts generally provide that the Company is obligated to purchase all wood or polyethylene a supplier provides, if the wood or polyethylene meets certain specifications. The amount of wood and polyethylene the Company is required to purchase under these contracts varies with the production of its suppliers and, accordingly, is not fixed or determinable. As of December 31, 2024, the Company has purchase commitments under material supply contracts of $50.7 million for the year ending December 31, 2025, and a total of $86.2 million for the years ending December 31, 2026 through 2028.
Product Warranty
The Company warrants that for the applicable warranty period its Trex Residential products, when properly installed, used and maintained, will be free from material defects in workmanship and materials and its decking, cladding, fascia and railing products will not split, splinter, rot or suffer structural damage from termites or fungal decay.
Products sold on or after January 1, 2023: The warranty period for residential use is 50 years for Transcend® decking, 35 years for Select® decking and Universal Fascia, and 25 years for Enhance® decking and Transcend, Select, Enhance and Signature® railing. The warranty period for commercial use is 10 years, excluding Signature railing and Transcend cladding, which each have a warranty period of 25 years. The Company further warrants that Trex Transcend, Trex Enhance and Trex Select decking and cladding and Universal Fascia products will not fade in color from light and weathering exposure more than a certain amount and will be resistant to permanent staining from food and beverage substances or mold and mildew, provided the stain is cleaned within seven days of appearance, for the warranty period referred to above. If there is a breach of such warranties, the Company has an obligation either to replace the defective product or refund the purchase price.
Products sold prior to January 1, 2023: The warranty period is 25 years for residential use and 10 years for commercial use. With respect to Trex Signature railing, the warranty period is 25 years for both residential and commercial use. The Company further warrants that Trex Transcend, Trex Enhance, Trex Select and Universal Fascia products will not fade in color more than a certain amount and will be resistant to permanent staining from food substances or mold, provided the stain is cleaned within seven days of appearance, for the warranty period referred to above. If there is a breach of such warranties, the Company has an obligation either to replace the defective product or refund the purchase price.
The Company maintains a warranty reserve for the settlement of its product warranty claims. The Company accrues for the estimated cost of product warranty claims at the time revenue is recognized based on such factors as historical claims experience and future claims experience. Management reviews and adjusts these estimates, if necessary, based on the differences between actual experience and historical estimates. Additionally, the Company accrues for warranty costs associated with occasional or unanticipated product quality issues if a loss is probable and can be reasonably estimated, as necessary.
Trex Residential continues to receive and settle claims for decking products manufactured at its Nevada facility prior to 2007 that exhibit surface flaking and maintains a warranty reserve to provide for the settlement of these claims. Estimating the warranty reserve for surface flaking claims requires management to estimate (1) the number of claims to be settled with payment and (2) the average cost to settle each claim.
To estimate the number of claims to be settled with payment, the Company utilizes actuarial techniques to determine a reasonable possible range of claims to be received and the percentage of those claims that will ultimately require payment (collectively, elements). Estimates for these elements are quantified using a range of assumptions derived from claim count history and the identification of factors influencing the claim counts to determine its best estimate of future claims for which to record a related liability. The cost per claim varies due to a number of factors, including the size of affected decks, the availability and type of replacement material used, the cost of production of replacement material and the method of claim settlement.
The Company monitors surface flaking claims activity each quarter for indications that its estimates require revision. Typically, a majority of surface flaking claims received in a year are received during the summer outdoor season, which spans the second and third quarters. It has been the Company’s practice to utilize the actuarial techniques discussed above during the third quarter, after a significant portion of all claims has been received for the fiscal year and variances to annual claims expectations are more meaningful.
Average cost per claim experienced in the year ended December 31, 2024, was lower than that experienced in the year ended December 31, 2023, and lower than the Company’s expectations for 2024. The number of incoming claims received in the year ended December 31, 2024, was lower than the number of claims received in the year ended December 31, 2023, and higher than the Company’s expectations for 2024. After evaluating trends in incoming claims and closures in its actuarial analysis and combining these factors with future cost estimates, the Company recorded a reduction of $1.5 million to its warranty reserve for the future settlement of surface flaking claims in 2024. The Company believes the reserve at December 31, 2024 is sufficient to cover future surface flaking obligations.
The Company’s analysis is based on currently known facts and a number of assumptions, as discussed above, and current expectations. Projecting future events such as the number of claims to be received, the number of claims that will require payment and the average cost of claims could cause the actual warranty liabilities to be higher or lower than those projected, which could materially affect the Company’s financial condition, results of operations or cash flows. The Company estimates that the annual number of claims received will continue to decline over time and that the average cost per claim will increase slightly, primarily due to inflation. If the level of claims received or average cost per claim differs materially from expectations, it could result in additional increases or decreases to the warranty reserve and a decrease or increase in earnings and cash flows in future periods. The Company estimates that a 10% change in the expected number of remaining claims to be settled with payment or the expected cost to settle claims may result in approximately a $0.6 million change in the estimate of the surface flaking warranty reserve.
The Trex Residential product warranty and surface flaking reserves activity consisted of the following, and is included in Accrued warranty and Non-current accrued warranty in the Consolidated Balance Sheets (in thousands):
| | | | | | | | | | | | |
| | Year Ended December 31, 2024 | |
| | Product
Warranty | | | Surface
Flaking | | | Total | |
Beginning balance, January 1 | | $ | 12,066 | | | $ | 10,112 | | | $ | 22,178 | |
Provisions and changes in estimates | | | 11,211 | | | | (1,486 | ) | | | 9,725 | |
Settlements made during the period | | | (7,681 | ) | | | (1,387 | ) | | | (9,068 | ) |
Ending balance, December 31 | | $ | 15,596 | | | $ | 7,239 | | | $ | 22,835 | |
| | | | | | | | | | | | |
| | Year Ended December 31, 2023 | |
| | Product
Warranty | | | Surface
Flaking | | | Total | |
Beginning balance, January 1 | | $ | 9,694 | | | $ | 15,905 | | | $ | 25,599 | |
Provisions and changes in estimates | | | 7,308 | | | | (3,800 | ) | | | 3,508 | |
Settlements made during the period | | | (4,936 | ) | | | (1,993 | ) | | | (6,929 | ) |
Ending balance, December 31 | | $ | 12,066 | | | $ | 10,112 | | | $ | 22,178 | |
Industrial Revenue Bonds
In October 2021, the Company announced plans to add a third manufacturing facility located in Little Rock, Arkansas (Little Rock). Construction on the new facility began in the second quarter of 2022. In connection with the construction of the new facility, during 2024 the Company and Little Rock entered into an agreement in which Little Rock agreed to issue up to $450 million of its industrial revenue bonds (IRBs) for the purpose of constructing a manufacturing facility. Under the agreement, the Company transferred ownership of the facility to Little Rock and simultaneously leased the related asset from Little Rock. The Company is also the purchaser of the IRBs and, therefore, is the bondholder as well as the borrower/lessee of the Little Rock facility purchased with the IRB proceeds. As a result of the agreement, the Company was able to reduce the cost of certain state and local tax expenditures for twenty years. The Company has a purchase option included in the lease agreement for below the fair value of the asset, which prevents the transfer of the asset to Little Rock from being recognized as a sale. Furthermore, the Company has not derecognized the
transferred asset and continues to recognize it in property, plant and equipment in the Consolidated Balance Sheets. The Company has the right and intends to set-off any obligations to make payments under the finance liability, with proceeds due from the IRBs. The liability and IRB asset are equal and are reported net in the Consolidated Balance Sheets. As of December 31, 2024, the gross asset and liability associated with the IRBs was $100 million.
TREX COMPANY, INC.
SCHEDULE II—VALUATION AND QUALIFYING ACCOUNTS AND RESERVES
(In thousands)
| | | | | | | | | | | | | | | | |
Descriptions | | Balance at
Beginning
of Period | | | Additions
Charged to
Cost and
Expenses | | | Deductions | | | Balance
at End
of Period | |
Year ended December 31, 2024: | | | | | | | | | | | | |
Trex Residential product warranty reserve | | $ | 22,178 | | | $ | 9,725 | | | $ | (9,068 | ) | | $ | 22,835 | |
Income tax valuation allowance | | $ | 3,307 | | | $ | (669 | ) | | $ | — | | | $ | 2,638 | |
Year ended December 31, 2023: | | | | | | | | | | | | |
Trex Residential product warranty reserve | | $ | 25,599 | | | $ | 3,508 | | | $ | (6,929 | ) | | $ | 22,178 | |
Income tax valuation allowance | | $ | 3,026 | | | $ | 281 | | | $ | — | | | $ | 3,307 | |
Year ended December 31, 2022: | | | | | | | | | | | | |
Trex Residential product warranty reserve | | $ | 28,595 | | | $ | 1,914 | | | $ | (4,910 | ) | | $ | 25,599 | |
Income tax valuation allowance | | $ | 2,232 | | | $ | 794 | | | $ | — | | | $ | 3,026 | |