UNITED STATES
SECURITIES AND EXCHANGE COMMISSION
WASHINGTON, D.C. 20549
FORM 10-K
| x | ANNUAL REPORT PURSUANT TO SECTION 13 OR 15(d) OF THE SECURITIES EXCHANGE ACT OF 1934 |
For the fiscal year ended December 31, 2008
or
¨ TRANSITION REPORT UNDER SECTION 13 OR 15(d) OF THE SECURITIES EXCHANGE ACT OF 1934
For the transition period from __________ to ____________.
Commission file number 000-30248
JACKSONVILLE BANCORP, INC.
(Exact name of registrant as specified in its charter)
| Florida | | 59-3472981 |
| (State or other jurisdiction of | | (IRS Employer |
| incorporation or organization) | | Identification No.) |
100 North Laura Street, Suite 1000, Jacksonville, Florida 32202
(Address of principal executive offices)
(904) 421-3040
(Registrant’s telephone number, including area code)
Securities registered pursuant to Section 12(b) of the Act:
| Title of Each Class | Name of Each Exchange on which Registered |
| Common Stock, $.01 par value | The Nasdaq Stock Market (Nasdaq Global Market) |
Securities registered under Section 12(g) of the Exchange Act: None.
Indicate by check mark if the registrant is a well-known seasoned issuer as defined in Rule 405 of the Securities Act.
Yes ¨ No x
Indicate by check mark if the registrant is not required to file reports pursuant to Section 13 or Section 15(d) of the Act.
Yes ¨ No x
Indicate by check mark whether the registrant (1) has filed all reports required to be filed by Section 13 or 15(d) of the Securities Exchange Act of 1934 during the preceding 12 months (or for such shorter period that the registrant was required to file such reports), and (2) has been subject to such filing requirements for the past 90 days. Yes x No ¨
Indicate by check mark if disclosure of delinquent filers pursuant to Item 405 of Regulation S-K (§229.405 of this chapter) is not contained herein, and will not be contained, to the best of registrant's knowledge, in definitive proxy or information statements incorporated by reference in Part III of this Form 10-K or any amendment to this Form 10-K. ¨
Indicate by check mark whether the registrant is a large accelerated filer, an accelerated filer, a non-accelerated filer or a smaller reporting company. See the definitions of “large accelerated filer,” “accelerated filer” and “smaller reporting company” in Rule 12b-2 of the Exchange Act.
| Large accelerated filer | ¨ | Accelerated filer | ¨ |
| Non-accelerated filer | x | Smaller reporting company | ¨ |
Indicate by check mark whether the registrant is a shell company (as defined in Rule 12b-2 of the Act).
Yes ¨ No x
The aggregate market value of the registrant’s voting stock held by non-affiliates of the registrant (based upon the per share closing sale price of $15.90 on June 30, 2008) was approximately $27,805,904.
There were 1,748,799 outstanding shares of common stock as of March 18, 2009.
DOCUMENTS INCORPORATED BY REFERENCE
Portions of the registrant’s Definitive Proxy Statement for the 2009 Annual Meeting of
Shareholders are incorporated by reference in Part III of this Annual Report.
TABLE OF CONTENTS
| Description | | | | Page |
| | | | | |
| | | Forward-Looking Statements | | 3 |
| PART I | | | | |
| Item 1. | | Business | | 3 |
| | | General | | 3 |
| | | Market Area and Competition | | 4 |
| | | Deposits | | 4 |
| | | Lending Activities | | 4 |
| | | Investments | | 6 |
| | | Employees | | 6 |
| | | Data Processing | | 6 |
| | | Regulation and Supervision | | 6 |
| | | | | |
| Item 1A. | | Risk Factors | | 9 |
| | | | | |
| Item 1B. | | Unresolved Staff Comments | | 13 |
| | | | | |
| Item 2. | | Properties | | 13 |
| | | | | |
| Item 3. | | Legal Proceedings | | 14 |
| | | | | |
| Item 4. | | Submission of Matters to a Vote of Security Holders | | 14 |
| | | | | |
| PART II | | | | |
| Item 5. | | Market for Registrant’s Common Equity and Related Stockholder Matters and Issuer Purchases of Equity Securities | | 14 |
| | | | | |
| Item 6. | | Selected Financial Data | | 16 |
| | | | | |
| Item 7. | | Management’s Discussion and Analysis of Financial Condition and Results of Operations | | 17 |
| | | | | |
| Item 7A. | | Quantitative and Qualitative Disclosures about Market Risk | | 33 |
| | | | | |
| Item 8. | | Financial Statements and Supplementary Data | | 35 |
| | | | | |
| Item 9. | | Changes in and Disagreements with Accountants on Accounting and Financial Disclosure | | 36 |
| | | | | |
| Item 9A. | | Controls and Procedures | | 36 |
| | | | | |
| Item 9B. | | Other Information | | 37 |
| | | | | |
| PART III | | | | |
| Item 10. | | Directors, Executive Officers and Corporate Governance | | 37 |
| | | | | |
| Item 11. | | Executive Compensation | | 39 |
| | | | | |
| Item 12. | | Security Ownership of Certain Beneficial Owners and Management and Related Stockholder Matters | | 39 |
| | | | | |
| Item 13. | | Certain Relationships and Related Transactions, and Director Independence | | 40 |
| | | | | |
| Item 14. | | Principal Accounting Fees and Services | | 40 |
| | | | | |
| PART IV | | | | |
| Item 15. | | Exhibits, Financial Statement Schedules | | 40 |
| | | | | |
| | | Signatures | | 42 |
Notice Regarding Forward-Looking Statements
This Annual Report on Form 10-K contains certain forward-looking statements. Assumptions relating to forward-looking statements involve judgments with respect to, among other things, future economic, competitive, and market conditions, and future business decisions, all of which are difficult or impossible to predict accurately and many of which are beyond our control. When used in this report, the words “estimate,” “project,” “anticipate,” “intend,” “believe,” “expect” and similar expressions are intended to identify forward-looking statements. Although we believe that assumptions underlying the forward-looking statements are reasonable, any of the assumptions could prove inaccurate, and we may not realize the results contemplated by these statements. Management decisions are subjective in many respects and susceptible to interpretations and periodic revisions based on actual experience and business developments, the impact of which may cause us to alter our business strategy or capital expenditure plans and may, in turn, affect our results of operations. In light of the significant uncertainties inherent in the forward-looking information included in this report, you should not regard the inclusion of such information as our representation that we will achieve any strategy, objectives or other plans. Readers are cautioned not to place undue reliance on these forward-looking statements, which speak only as of the date hereof. The Company does not undertake any obligation to publicly release any revisions to these forward-looking statements to reflect events or circumstances after the date hereof or to reflect the occurrence of unanticipated events.
PART I
Unless the context requires otherwise, references in this report to “the Company,” “we,” “us,” or “our” refer to Jacksonville Bancorp, Inc., its wholly owned subsidiary, The Jacksonville Bank, and the Bank’s wholly owned subsidiary, Fountain Financial, Inc., on a consolidated basis. References to “Bancorp” denote Jacksonville Bancorp, Inc., and The Jacksonville Bank is referred to as the “Bank.”
ITEM 1. BUSINESS
General
Bancorp was incorporated under the laws of the State of Florida on October 24, 1997 for the purpose of organizing the Bank. Bancorp is a one-bank holding company owning 100% of the outstanding shares of the Bank. Bancorp’s only business is the ownership and operation of the Bank. The Bank is a Florida state-chartered commercial bank, and its deposits are insured by the Federal Deposit Insurance Corporation (“FDIC”). The Bank opened for business on May 28, 1999 and currently provides a variety of community banking services to businesses and individuals through its five offices in Jacksonville, Duval County, Florida.
We offer a variety of competitive commercial and retail banking services. In order to compete with the financial institutions in the market, we use our independent status to the fullest extent. This includes an emphasis on specialized services for small business owners with a particular focus on the medical and legal sectors. Additionally, we rely on the professional and personal relationships of our officers, directors and employees. Loan participations are arranged for customers whose loan demands exceed legal lending limits. Our product lines include personal and business online banking and sweep accounts tied to Goldman Sachs proprietary funds, in addition to our traditional banking products. Furthermore, through the Bank’s subsidiary, Fountain Financial, Inc., and our marketing agreement with New England Financial (an affiliate of MetLife), we are able to meet the investment and insurance needs of our customers.
Substantial consolidation of the Florida banking market has occurred since the early 1980’s. As more out-of-state bank holding companies enter the Florida market, we believe that the number of depository institutions headquartered and operating in Florida will continue to decline. Our marketing programs focus on the advantages of local ownership and management, personal service and customer relationships. Particular emphasis is placed on building personal face-to-face relationships. Our management and business development teams have extensive experience with individuals and companies within our targeted market segments in the Jacksonville area. Based on our experience, we believe that we have been and will continue to be effective in gaining market share. The Bank now has five full-service branches in Jacksonville, currently employing 58 bankers. We are focused on small business, professionals and commercial real estate. Over the past three years, the Company’s Board of Directors (also referred to herein as the “Board”) has granted every employee (excluding executive officers) of the Company restricted stock.
Market Area and Competition
Our primary market area is all of Duval County (primarily in the Southside, Westside, Arlington, Mandarin, Beaches and Downtown areas of Jacksonville). Jacksonville is the largest city in the United States covering 841 square miles and is a leading financial and insurance center. Jacksonville is home to the Jacksonville Jaguars and is the corporate headquarters to a number of regional and national companies. Duval County has a strong commercial and industrial base, which has been steadily expanding in recent years.
Financial institutions primarily compete with one another for deposits. In turn, a bank’s deposit base directly affects such bank’s loan activities and general growth. Primary competitive factors include interest rates on deposits and loans, service charges on deposit accounts, the availability of unique financial services products, a high level of personal service, and personal relationships between our officers and customers. We compete with financial institutions that have greater resources, and that may be able to offer more services, unique services, or possibly better terms to their customers. We believe, however, that we will be able to continue to attract sufficient loans and deposits to effectively compete with other area financial institutions.
We are in competition with existing area financial institutions, including commercial banks and savings institutions, insurance companies, consumer finance companies, brokerage houses, mortgage banking companies, credit unions, and other business entities which target traditional banking markets. We face increased competition due to the Gramm-Leach-Bliley Act (the “GLB Act”), discussed under Regulation and Supervision, which allows insurance firms, securities firms, and other non-traditional financial companies to provide traditional banking services. Due to the growth of the Jacksonville area, we anticipate that significant competition will continue from existing financial services providers, as well as new entrants to the market. There are 28 separate financial institutions located in Duval County, of which seven are considered community banks with their headquarters located in Northeast Florida.
Funding Sources
Deposits
We offer a wide range of deposit accounts, including commercial and retail checking, money market, individual retirement and statement savings accounts, and certificates of deposit with fixed rates and a range of maturity options. Our sources of deposits are primarily residents, businesses, and employees of businesses within our market areas, obtained through personal solicitation by our officers and directors, direct mail solicitation, and advertisements published in the local media. We also have the ability to obtain deposits from the “national and brokered CD markets” as an additional source of funding. We pay competitive interest rates on interest-bearing deposits. In addition, our service charge schedule is competitive with other area financial institutions, covering such matters as maintenance and per item processing fees on deposit accounts and special handling charges. We are also part of the Star, Cirrus, Presto and Plus ATM networks, and a member of VISA.
Borrowings
Additional sources of funds are available to the Bank by borrowing from the Federal Home Loan Bank (“FHLB”) and Federal Reserve Bank (“FRB”). Our lending capacity with these institutions provides credit availability based on qualifying collateral from the investment and loan portfolios. See “Note 5-Deposits” and “Note 6-Short-term borrowings and Federal Home Loan Bank Advances” of the Notes to the Consolidated Financial Statements for further information on our funding sources.
Lending Activities
Our Board has adopted certain policies and procedures to guide individual loan officers in carrying out lending functions. The Board has formed a Directors’ Loan Committee and appointed six directors to provide the following oversight:
| | · | ensure compliance with loan policy, procedures and guidelines as well as appropriate regulatory requirements; |
| | · | approve secured loans above an aggregate amount of $500,000 and unsecured loans above an aggregate amount of $100,000 to any entity and/or related interests; |
| | · | monitor overall loan quality through review of information relative to all new loans; |
| | · | approve lending authority for individual officers; |
| | · | monitor our loan review systems; |
| | · | review the adequacy of the loan loss reserve; and |
| | · | approve any additional advances to any borrower whose loan or line of credit has been adversely classified Substandard. |
The Board realizes that occasionally loans need to be made which fall outside the typical policy guidelines. Consequently, the Chief Executive Officer and Chief Lending Officer have the authority to make certain policy exceptions on secured loans up to $500,000 and unsecured loans up to $100,000. Policy exceptions on secured and unsecured loans greater than $500,000 and $100,000, respectively, must be approved by the Directors’ Loan Committee, and the full Board reviews reports of all loans and policy exceptions at its regular meetings. Additionally, the Bank has an independent company that also evaluates the quality of loans and determines if loans are originated in accordance with the guidelines established by the Board.
We recognize that credit losses will be experienced and the risk of loss will vary with, among other things, the type of loan being made, the creditworthiness of the borrower over the term of the loan and, in the case of a collateralized loan, the quality of the collateral, as well as general economic conditions. We intend to maintain an adequate allowance for loan losses based on, among other things, industry standards, management’s experience, historical loan loss experience, evaluation of economic conditions, and regular reviews of delinquencies and loan portfolio quality. We follow a conservative lending policy, but one which permits prudent risks to assist businesses and consumers primarily in our principal market areas. Interest rates vary depending on our cost of funds, the loan maturity, the degree of risk and other loan terms. As appropriate, some interest rates are adjustable with fluctuations in the “prime” rate.
Loan Portfolio Composition
The composition of the Bank’s loan portfolio at December 31, 2008 and 2007 is indicated below, along with the growth from the prior year.
| (dollars in thousands) | | Total Loans December 31, 2008 | | | % of Total Loans | | | Total Loans December 31, 2007 | | | % of Total Loans | | | % Increase (Decrease) from December 31, 2007 to 2008 | |
| Real estate mortgage loans: | | | | | | | | | | | | | | | |
| Commercial | | $ | 224,677 | | | | 59.1 | % | | $ | 210,614 | | | | 61.4 | % | | | 6.7 | % |
| Residential | | | 81,152 | | | | 21.3 | % | | | 75,141 | | | | 21.9 | % | | | 8.0 | % |
| Construction | | | 41,759 | | | | 11.0 | % | | | 29,737 | | | | 8.7 | % | | | 40.4 | % |
| Farmland | | | — | | | | — | | | | 2,325 | | | | 0.7 | % | | | (100.0 | )% |
| Commercial loans | | | 28,445 | | | | 7.5 | % | | | 20,291 | | | | 5.9 | % | | | 40.2 | % |
| Consumer loans | | | 4,070 | | | | 1.1 | % | | | 4,631 | | | | 1.4 | % | | | (12.1 | )% |
| TOTAL | | $ | 380,103 | | | | 100.0 | % | | $ | 342,739 | | | | 100.0 | % | | | 10.9 | % |
Our nonperforming loans as a percentage of gross loans increased from 0.20% at December 31, 2007 to 3.27% at December 31, 2008.
Commercial Real Estate
Commercial real estate loans are typically segmented into three categories: owner occupied commercial properties, properties used by non-profit organizations (i.e., churches and schools) and commercial properties leased to third parties for investment purposes. Commercial real estate loans are secured by the subject property and are underwritten based upon standards set forth in the policy as approved by the Board. Such standards include, among other factors, loan to value limits, cash flow coverage and general creditworthiness of the obligors.
Residential Real Estate
Residential real estate loans include loans secured by first or second mortgages and home equity loans on one-to-four family residential properties. Loans in the residential real estate portfolio are underwritten in accordance with policies set forth and approved by the Board, including repayment capacity and source, value of the underlying property, credit history and stability.
Construction Loans
The Bank provides construction permanent loans to borrowers to finance the construction of owner occupied and lease properties. These loans are categorized as construction loans during the construction period, later converting to commercial or residential real estate loans after the construction is complete and amortization of the loan begins. Real estate development and construction loans are approved based on an analysis of the borrower and guarantor, the viability of the project and are also based on an acceptable percentage of the appraised value of the property securing the loan. Real estate development and construction loan funds are disbursed periodically based on the percentage of construction completed. The Bank carefully monitors these loans with on-site inspections and requires the receipt of lien waivers on funds advanced. Development and construction loans are typically secured by the properties under development or construction, and personal guarantees are typically obtained. Further, to assure that reliance is not placed solely on the value of the underlying property, the Bank considers the market conditions and feasibility of proposed projects, the financial condition and reputation of the borrower and guarantors, the amount of the borrower’s equity in the project, independent appraisals, costs estimates and pre-construction sale information.
Commercial Loans
Commercial loans are primarily underwritten on the basis of the borrowers’ ability to service such debt from income. As a general practice, we take as collateral a security interest in any available real estate, equipment, or other chattel, although loans may also be made on an unsecured basis. Collateralized working capital loans typically are secured by short-term assets whereas long-term loans are primarily secured by long-term assets.
Other
Consumer loans are extended for various purposes, including purchases of automobiles, recreational vehicles, and boats. We also offer home improvement loans, lines of credit, personal loans, and deposit account collateralized loans. Loans to consumers are extended after a credit evaluation, including the creditworthiness of the borrower(s), the purpose of the credit, and the secondary source of repayment. Consumer loans are made at fixed and variable interest rates and may be made on terms of up to ten years.
Loan Referral Programs
The Bank entered into a loan referral agreement with a third party lender whereby we could offer an unsecured line of credit up to $100,000 to small business customers. The product, which was branded by the Bank, was underwritten and closed by a third party. During 2008, the third party lender made a decision to exit this line of business; as a result, the Bank ceased offering this product in August 2008.
Investments
The primary objective of the investment portfolio is to develop a mixture of investments with maturities and compositions so as to earn an acceptable rate of return while meeting liquidity requirements. We invest primarily in obligations guaranteed by the U.S. government and government-sponsored agencies. We also enter into federal funds transactions through our principal correspondent banks. Investments with maturities in excess of one year are generally readily salable on the open market.
Employees
As of February 27, 2009, the Bank had 58 employees. Except for certain officers of the Bank who presently serve as officers of the Company, the Company does not have any employees. Management believes Company relations with its employees have been good.
Data Processing
We currently have an agreement with Metavante Corporation, formerly known as M & I Data Services, to provide our core processing and support certain customer products and delivery systems. We believe that Metavante Corporation will continue to be able to provide state of the art data processing and customer service related processing at a competitive price to support our future growth.
Regulation and Supervision
We operate in a highly regulated environment, where statutes, regulations, and administrative policies govern our business activities. We are supervised by, examined by, and submit reports to, a number of regulatory agencies, including the Federal Reserve Board, the FDIC, and the Florida Department of Financial Services.
We are regulated by the Federal Reserve Board under the Federal Bank Holding Company Act (“BHC Act”), which requires every bank holding company to obtain the prior approval of the Federal Reserve Board before acquiring more than 5% of the voting shares of any bank or all or substantially all of the assets of a bank, and before merging or consolidating with another bank holding company. The Federal Reserve Board, under its regulations and published policy statements, has maintained that a bank holding company must serve as a source of financial strength to its subsidiary bank(s). In adhering to the Federal Reserve Board policy, Bancorp may be required to provide financial support for the Bank at a time when, absent such policy, Bancorp may not otherwise deem it advisable to provide such assistance.
At one time, a bank holding company was generally prohibited from acquiring control of any company which was not a bank and from engaging in any business other than the business of banking or managing and controlling banks. In April 1997, the Federal Reserve Board revised and expanded the list of permissible non-banking activities in which a bank holding company could engage; however, limitations continue to exist under certain laws and regulations. The GLB Act repeals certain regulations pertaining to bank holding companies and eliminates many of the previous prohibitions. Specifically, Title I of the GLB Act repeals Sections 20 and 32 of the Glass-Steagall Act and is intended to facilitate affiliations among banks, securities firms, insurance firms, and other financial companies. To further this goal, the GLB Act amends Section 4 of the BHC Act to authorize bank holding companies that qualify as “financial holding companies” to engage in securities, insurance and other activities that are financial in nature or incidental to a financial activity. The activities of bank holding companies that are not financial holding companies continue to be limited to activities authorized under the BHC Act, such as activities that the Federal Reserve Board previously has determined to be closely related to banking and permissible for bank holding companies.
With respect to expansion, we may establish branch offices anywhere within the State of Florida with regulatory approval. We are also subject to the Florida banking and usury laws limiting the amount of interest that can be charged when making loans or other extensions of credit. In addition, the Bank, as a subsidiary of Bancorp, is subject to restrictions under federal law in dealing with Bancorp and other affiliates. These restrictions apply to extensions of credit to an affiliate, investments in the securities of an affiliate, and the purchase of assets from an affiliate.
The primary source of Bancorp’s income is expected to be dividends from the Bank. A Florida state-chartered commercial bank may not pay cash dividends that would cause the bank’s capital to fall below the minimum amount required by federal or state law. Accordingly, commercial banks may only pay dividends out of the total of current net profits plus retained net profits of the preceding two years to the extent it deems expedient, except as follows. No bank may pay a dividend at any time that the total of net income for the current year when combined with retained net income from the preceding two years produces a loss. The future ability of the Bank to pay dividends to Bancorp will also depend in part on the FDIC capital requirements in effect at such time and our ability to comply with such requirements.
Loans and extensions of credit by all banks are subject to legal lending limitations. Under state law, a state bank may generally grant unsecured loans and extensions of credit in an amount up to 15% of its unimpaired capital and surplus to any person. In addition, a state bank may grant additional loans and extensions of credit to the same person of up to 10% of its unimpaired capital and surplus, provided that the transactions are fully secured. This 10% limitation is separate from, and in addition to, the 15% limitation for unsecured loans. Loans and extensions of credit may exceed these general lending limits only if they qualify under one of several exceptions.
We are subject to regulatory capital requirements imposed by the Federal Reserve Board and the FDIC. Both the Federal Reserve Board and the FDIC have established risk-based capital guidelines for bank holding companies and banks which make regulatory capital requirements more sensitive to differences in risk profiles of various banking organizations. The capital adequacy guidelines issued by the Federal Reserve Board are applied to bank holding companies on a consolidated basis with the banks owned by the holding company. The FDIC’s risk-based capital guidelines apply directly to state banks regardless of whether they are a subsidiary of a bank holding company. Both agencies’ requirements (which are substantially similar) provide that banking organizations must have minimum capital equivalent to 8% of risk-weighted assets to be considered adequately capitalized. The risk weights assigned to assets are based primarily on the perceived levels of risk to capital. For example, securities with an unconditional guarantee by the United States government are assigned the lowest risk weighting. A risk weight of 50% is assigned to loans secured by owner-occupied one-to-four family residential properties. The aggregate amount of assets assigned to each risk category is multiplied by the risk weight assigned to that category to determine the weighted values, which are added together to determine total risk weighted assets.
The Federal Deposit Insurance Corporation Improvement Act of 1991 (“FDICIA”) created and defined five capital categories (well capitalized, adequately capitalized, undercapitalized, significantly undercapitalized, and critically undercapitalized), which are used to determine the nature of any corrective action the appropriate regulator may take in the event an institution reaches a given level of undercapitalization. For example, an institution which becomes undercapitalized must submit a capital restoration plan to the appropriate regulator outlining the steps it will take to become adequately capitalized. Upon approving the plan, the regulator will monitor the institution’s compliance. Before a capital restoration plan will be approved, an entity controlling a bank (i.e., the holding company) must guarantee compliance with the plan until the institution has been adequately capitalized for four consecutive calendar quarters. The liability of the holding company is limited to the lesser of 5% of the institution’s total assets at the time it became undercapitalized or the amount necessary to bring the institution into compliance with all capital standards. Further, in the event of the bankruptcy of the parent holding company, such guarantee would take priority over the parent’s general unsecured creditors. Undercapitalized institutions also will be restricted from paying management fees, dividends, and other capital distributions, will be subject to certain asset growth restrictions, and will be required to obtain prior approval from the appropriate regulator to open new branches or expand into new lines of business. As an institution drops to lower capital levels, the extent of action to be taken by the appropriate regulator increases, restricting the types of transactions in which the institution may engage and ultimately providing for the appointment of a receiver for certain institutions deemed to be critically undercapitalized.
The FDICIA also requires each federal banking agency to prescribe, and the Federal Reserve Board and the FDIC have adopted, for all insured depository institutions and their holding companies, safety and soundness standards relating to such items as: internal controls, information and audit systems, asset quality, loan documentation, classified assets, credit underwriting, interest-rate risk exposure, asset growth, earnings, compensation, fees and benefits, valuation of publicly traded shares, and such other operational and managerial standards as the agency deems appropriate. Finally, each federal banking agency was required to prescribe standards for employment contracts and other compensation arrangements with executive officers, employees, directors, and principal shareholders of insured depository institutions that would prohibit compensation and benefits and other arrangements that are excessive or that could lead to a material financial loss. If an insured depository institution or its holding company fails to meet any of the standards described above, it will be required to submit to the appropriate federal banking agency a plan specifying the steps that will be taken to cure the deficiency. If an institution fails to submit an acceptable plan or fails to implement a plan, the appropriate federal banking agency will require the institution or holding company to correct the deficiency and, until corrected, may impose further restrictions on the institution or holding company, including any of the restrictions applicable under the prompt corrective action provisions of the FDICIA. Both the capital standards and the safety and soundness standards that the FDICIA implements were designed to bolster and protect the deposit insurance fund.
In response to the directives issued under the FDICIA, the regulators have adopted regulations that, among other things, prescribe the capital thresholds for each of five established capital categories. The following table reflects these capital thresholds:
| | | Total Risk-Based Capital Ratio | | | Tier 1 Risk-Based
Capital Ratio | | | | |
Well capitalized (1) | | | 10% | | | | 6% | | | 5% | |
Adequately capitalized (1) | | | 8% | | | | 4% | | | 4%(2) | |
Undercapitalized (3) | | Less than 8% | | | Less than 4% | | | Less than 4% | |
| Significantly undercapitalized | | Less than 6% | | | Less than 3% | | | Less than 3% | |
| Critically undercapitalized | | | — | | | | — | | | Less than 2% | |
| (1) | An institution must meet all three minimums. |
| (2) | 3% for CAMELS composite 1 rated institutions, subject to appropriate federal banking agency guidelines. |
| (3) | An institution falls into this category if it is below the adequately capitalized level for any of the three capital measures. |
Under these capital categories, the Company is classified as well capitalized. At December 31, 2008, the Company’s total risk-based capital and Tier 1 risk-based capital ratios were 11.93% and 9.23%, respectively. The Tier 1 leverage ratio was 8.26% as of the same date. In addition to maintaining all capital levels at or above well-capitalized levels, the Company is committed to maintaining a Tier 1 leverage ratio above 8% at all times.
Under federal law and regulations and subject to certain exceptions, the addition or replacement of any director, or the employment, dismissal, or reassignment of a senior executive officer at any time that the Bank is not in compliance with applicable minimum capital requirements, or otherwise in a troubled condition, or when the FDIC has determined that such prior notice is appropriate, is subject to prior notice to, and potential disapproval by, the FDIC.
Proposals to change the laws and regulations governing the banking industry are frequently introduced in Congress, in the state legislatures and by the various bank regulatory agencies. Accordingly, the scope of regulation and permissible activities of Bancorp and the Bank are subject to change by future federal and state legislation or regulation.
Substantially all of our revenues from external customers, long-lived assets, long-term customer relationships, mortgage and other servicing rights, deferred policy acquisition costs, and deferred tax assets are attributed to the United States.
For Additional Information
We are required to comply with the informational requirements of the Securities Exchange Act of 1934, as amended, and, accordingly, we file annual reports, quarterly reports, current reports, proxy statements and other information with the SEC. You may read or obtain a copy of these reports at the SEC’s public reference room at 100 F. Street, N.E., Room 1580, Washington, D.C. 20549. You may obtain information on the operation of the public reference room and their copy charges by calling the SEC at 1-800-SEC-0330. The SEC maintains a website that contains registration statements, reports, proxy information statements and other information regarding registrants that file electronically with the SEC. The address of the website is http://www.sec.gov.
ITEM 1A. RISK FACTORS
An investment in our common stock involves a number of risks. Before making an investment decision, you should carefully consider all of the risks. If any of the events contemplated by the risk factors discussed below actually impact us, our business, financial condition and results of operations could be materially adversely affected. If this were to occur, the trading price of our common stock could decline.
RISKS RELATED TO OUR BUSINESS
Since we commenced operations in 1999, we have had a relatively short history of experiencing profits.
We rely on the profitability of the Bank to provide funding for our operations. We cannot assure you that we will consistently operate profitably in the future. While we project that the Bank will be profitable in all future periods, we are unable to assure you that we will earn profits as projected, that we will be able to maintain profitability, or that the Bank will be able to consistently fund our ongoing operations.
We are not certain that our capital will be adequate to continue to support the current rate of growth.
Future capital requirements depend on many factors, including the ability to successfully attract new customers and provide additional services, the timing of opening new branch locations, and our profitability levels. If adequate capital is not available, we will be subject to an increased level of regulatory supervision, we may not be able to expand our operations, and our business operating results and financial condition could be adversely affected.
We may require additional capital in the future, which could result in dilution of your ownership interest.
Any capital that is likely to be generated by our operations over the next several years is expected to be needed to continue expanding our operations. Additionally, our board of directors may determine from time to time that, in order to support our strategic objectives, there is a need to obtain additional capital through the issuance of additional shares of our common stock or other securities. These issuances would dilute the ownership interest of current shareholders in the Company and may dilute the per share book value of our common stock.
Our business may face risks with respect to future expansion.
We may acquire other financial institutions or parts of financial institutions in the future and we may engage in additional de novo branch expansion. Acquisitions and mergers involve a number of risks, including:
| | · | the time and costs associated with identifying and evaluating potential acquisitions and merger partners; |
| | · | the estimates and judgments used to evaluate credit, operations, management and market risks with respect to the target institution may not be accurate; |
| | · | the time and costs of evaluating new markets, hiring experienced local management and opening new offices, and the time lags between these activities and the generation of sufficient assets and deposits to support the costs of the expansion; |
| | · | our ability to finance an acquisition and possible dilution to our existing shareholders; |
| | · | the diversion of our management’s attention to the negotiation of a transaction, and the integration of the operations and personnel of the combining businesses; |
| | · | entry into new markets where we lack experience; |
| | · | the introduction of new products and services into our business; |
| | · | the incurrence and possible impairment of goodwill associated with an acquisition and possible adverse short-term effects on our results of operations; and |
| | · | the risk of loss of key employees and customers. |
We may incur substantial costs to expand and can give no assurance such expansion will result in the levels of profits we would expect. There can be no assurance that integration efforts for future mergers or acquisitions will be successful. We may issue equity securities, including common stock, in connection with future acquisitions, which could cause ownership and economic dilution to our shareholders. There is no assurance that, following any future mergers or acquisitions, our integration efforts will be successful or, after giving effect to the acquisition, that we will achieve profits comparable to, or better than, our historical experience.
Customers may not repay their loans, which could have a material adverse effect on our profitability.
The risk that customers may fail to repay their loans is inherent in any bank lending relationship. If our loans are not repaid in accordance with the loan terms, it could have a material adverse effect on our earnings and overall financial condition as well as the value of our common stock. We focus our lending activity in commercial, commercial real estate, residential, home equity and consumer loans.
Our management attempts to minimize credit exposure by carefully monitoring the concentration of loans within specific industries and through loan application and approval procedures. However, we are unable to assure you that such monitoring and procedures will reduce lending risks. Credit losses can cause insolvency and failure of a financial institution and, in such event, shareholders could lose their entire investment.
Our business focus in the Jacksonville area of Florida could make us vulnerable to adverse economic conditions in the area.
Our operations are materially affected by and sensitive to the economy of our market areas in northeastern Florida, and are particularly impacted by the economic conditions in Duval County and the Jacksonville metropolitan area. Because our business is focused in the Jacksonville area, we could be more affected by a weakening of the Jacksonville area economy than banking institutions with operations in diverse geographical areas.
Current economic conditions and industry developments may adversely affect our business and financial results.
If the current U.S. recession continues for a long period of time or the economy and industry experience further deterioration, there can be no assurance that our business, our industry or results of operations will not be significantly adversely impacted. We may have further increases in loan losses, deterioration of capital or limitations on our access to funding or capital. A prolonged recession could also cause further deterioration in real estate values which could drive foreclosures and higher losses than we have historically experienced.
Our location on the east coast of Florida makes us susceptible to weather-related problems.
We rely on our ongoing operations to sustain profitability. Although we have a disaster recovery plan in place, we cannot ensure that severe weather conditions will not have a material adverse effect on our financial condition, results of operations, or cash flows.
We are subject to government regulation and monetary policies that could constrain our growth and profitability.
Bank regulators have imposed various conditions on us. The conditions include, among other things, that: (1) we would not assume additional debt without prior approval by the Federal Reserve Board; (2) we will remain well-capitalized at all times; (3) we will make appropriate filings with the regulatory agencies; and (4) the Bank will meet all regulatory requirements. The regulatory capital requirements imposed on the Bank could have the effect of constraining growth.
We are subject to extensive state and federal government supervision and regulations that impose substantial limitations with respect to loans, purchase of securities, payment of dividends, and many other aspects of the banking business. Regulators include the Board of Governors of the Federal Reserve System (the "Federal Reserve Board"), the FDIC, and the Florida Department of Banking and Finance (the "Florida DBF"). Applicable laws, regulations, interpretations, assessments and enforcement policies have been subject to significant and sometimes retroactively applied changes and may be subject to significant future changes. Regulatory agencies are funded, in part, by assessments imposed upon banks. The FDIC Board of Directors has approved a new system for risk-based assessments effective January 1, 2007 which resulted in additional cost to the Bank in support of a designated reserve ratio. Additional assessments could occur in the future which could impact our financial condition. Many of these regulations are intended to protect depositors, the public, and the FDIC, not shareholders. Future legislation or government policy could adversely affect the banking industry, our operations, or our shareholders. The burden imposed by federal and state regulations may place banks, in general, and us, specifically, at a competitive disadvantage compared to less regulated competitors. Federal economic and monetary policy may affect our ability to attract deposits, make loans, and achieve satisfactory operating results.
We could be negatively impacted by changes in interest rates and economic conditions.
Our results of operations may be materially and adversely affected by changes in prevailing economic conditions, including declines in real estate market values, rapid changes in interest rates, and the monetary and fiscal policies of the federal government. Our profitability is partly a function of the spread between the interest rates earned on investments and loans and those paid on deposits and other liabilities. As with most banking institutions, our net interest spread is affected by general economic conditions and other factors that influence market interest rates. Changes in interest rates may negatively affect our earnings and the value of our assets. Changes in interest rates may affect our level of interest income, the primary component of our gross revenue, as well as the level of our interest expense, our largest recurring expenditure. In a period of rising interest rates, our interest expense could increase in different amounts and at different rates while the interest that we earn on our assets may not change in the same amounts or at the same rates. Accordingly, increases in interest rates could decrease our net interest income. At any given time, our assets and liabilities may be affected differently by a given change in interest rates. As a result, an increase or decrease in rates could have a material adverse effect on our net income, capital and liquidity. While we take measures to reduce interest-rate risk, these measures may not adequately minimize exposure to interest-rate risk.
Bancorp is dependent on the operating performance of the Bank to provide Bancorp with operating funds.
Bancorp is a bank holding company and is dependent upon dividends from the Bank for funds to pay expenses and any cash dividends to shareholders. The Bank is subject to regulatory limitations regarding the payment of dividends. Therefore, the Bank may not be able to provide us with adequate funds to conduct our ongoing operations.
We face competition from a variety of competitors.
We face competition for deposits, loans and other financial services from other community banks, regional banks, out-of-state and in-state national banks, savings banks, thrifts, credit unions and other financial institutions as well as other entities that provide financial services, including consumer finance companies, securities brokerage firms, mortgage brokers, insurance companies, mutual funds, and other lending sources and alternative investment providers. Some of these financial institutions and financial services organizations are not subject to the same degree of regulation as we are. We face increased competition due to the GLB Act which allows insurance firms, securities firms, and other non-traditional financial companies to provide traditional banking services. Due to the growth of the Jacksonville area, it can be expected that significant competition will continue from existing financial services providers, as well as new entrants to the market. Many of these competitors have been in business for many years, have established customers, are larger, have substantially higher lending limits than we do, and are able to offer certain services that we do not provide, such as certain loan products and international banking services. In addition, many of these entities have greater capital resources than we have, which among other things may allow them to price their services at levels more favorable to the customer or to provide larger credit facilities. If we are unable to attract and retain customers with personal services, attractive product offerings and competitive rates, our business, results of operations, future growth and operational results will be adversely affected.
Our lending limit restricts our ability to compete with larger financial institutions.
Our per customer lending limit is approximately $9.0 million, subject to further reduction based on regulatory criteria relevant to any particular loan. Accordingly, the size of loans which we can offer to potential customers is less than the size that many of our competitors with larger lending limits are able to offer. This limit has affected and will continue to affect our ability to seek relationships with larger businesses in the market. We accommodate loans in excess of our lending limit through the sale of portions of such loans to other banks. However, we may not be successful in attracting or maintaining customers seeking larger loans or in selling portions of such larger loans on terms that are favorable to us.
We may need to spend significant money to keep up with technology so we can remain competitive.
The banking industry continues to undergo rapid technological changes with frequent introduction of new technology-driven products and services. In addition to providing better service to customers, the effective use of technology increases efficiency and enables us to reduce costs. Our future success depends in part upon our ability to address the needs of our customers by using technology to provide products and services that will satisfy customer demands for convenience as well as to create additional operating efficiencies. Many of our competitors have substantially greater resources to invest in technological improvements. Such technology may permit competitors to perform certain functions at a lower cost than we can. We may not be able to effectively implement new technology-driven products and services or be successful in marketing these to our customers.
We are dependent on the experience and expertise of our current management and their departure may impair our operations.
Bancorp and the Bank are primarily dependent upon the services of Gilbert J. Pomar, III, Chief Executive Officer and President; Valerie A. Kendall, Executive Vice President and Chief Financial Officer; and Scott M. Hall, Executive Vice President and Chief Lending Officer. If the services of these individuals were to become unavailable for any reason, or if we were unable to hire highly qualified and experienced personnel to replace them, our operating results could be adversely affected. While we have an employment agreement with each of Mr. Pomar and Mr. Hall, we do not have an agreement with Ms. Kendall.
RISKS RELATED TO OUR COMMON STOCK
Our common stock is thinly traded and, therefore, you may have difficulty selling shares.
Our common stock is traded on the NASDAQ Global Market; however, we are unable to provide assurance that an active market will exist in the future or that shares can be liquidated without delay. The average daily trading volume in Bancorp stock was 1,774 in 2008.
We do not anticipate paying dividends for the foreseeable future.
We do not anticipate that dividends will be paid on our common stock for the foreseeable future. It is the policy of our Board to reinvest earnings for such period of time as is necessary to ensure our successful operations. There are no current plans to initiate payment of cash dividends, and future dividend policy will depend on our earnings, capital and regulatory requirements, financial conditions and other factors considered relevant by our Board. Bancorp is largely dependent upon dividends paid by the Bank to provide funds to pay cash dividends if and when the Board may declare such dividends. No assurance can be given that future earnings will be sufficient to satisfy regulatory requirements and permit the legal payment of dividends to shareholders at any time in the future. Even if we could legally declare dividends, the amount and timing of such dividends would be at the discretion of our Board. The Board may in its sole discretion decide not to declare dividends.
The market price of our common stock may be volatile.
The market price of our common stock is subject to fluctuations as a result of a variety of factors, including the following:
| | · | quarterly variations in our operating results or those of other banking institutions; |
| | · | changes in national and regional economic conditions, financial markets or the banking industry; and |
| | · | other developments affecting us or other financial institutions. |
The trading volume of our common stock is limited, which may increase the volatility of the market price for our stock. In addition, the stock market has experienced significant price and volume fluctuations in recent years. This volatility has had a significant effect on the market prices of securities issued by many companies for reasons not necessarily related to the operating performance of these companies.
Our articles of incorporation and bylaws, and certain laws that we are subject to, contain provisions that may delay or prevent a change of control.
Sections 607.0901 through 607.0908 of the Florida Business Corporation Act (the "FBCA") provide for supermajority voting and impose other requirements on certain business combinations with interested shareholders and limit voting rights of certain acquirers of control shares. Federal law requires the approval of the Federal Reserve Board before acquisition or "control" of a bank holding company. Our articles of incorporation provide that the FBCA's control shares statute applies to acquisitions of our shares unless the acquirer has acquired the shares (1) for others in good faith and not to circumvent the control shares statute and requires instruction from others to vote the shares, or (2) through a distribution conducted by us in a private or public offering or under a warrant, option or employee benefit plan, under the laws of descent and distribution, from a donee of a lifetime gift, through a transfer between immediate family members or through satisfaction of a pledge or security interest.
Our articles of incorporation also (1) provide for a board of directors that is divided into three classes of directors; (2) require the shareholders to take action at a duly called meeting and not by written consent; (3) limit the Board's ability to increase the number of directors; (4) require the affirmative vote of holders of two-thirds of our voting stock for certain affiliated transactions such as mergers, consolidations, sales, leases, pledges, transfers, dissolutions, reclassifications with or loans to shareholders owning more than 10% of our shares or their affiliates unless the transaction is approved by the disinterested directors and certain other conditions are met; (5) require the Board to consider a variety of factors when evaluating any proposal involving a potential tender or exchange offer, merger, sale or business combination, including the social and economic impact of such a proposal on customers, employees, and the communities in which we operate or are located, and on our ability to fulfill our corporate objectives and perform under applicable statutes and regulations; and (6) require the affirmative vote of holders of at least 66% of the voting stock to change any provisions of the articles of incorporation relating to the right of shareholders to act by consent, the classification of the board, affiliated transactions or control share acquisitions. These provisions may have the effect of delaying or preventing a change in control. As a result, these provisions could adversely affect the price of our common stock by reducing the gain which could potentially be realized by a shareholder in a change of control.
ITEM 1B. UNRESOLVED STAFF COMMENTS
None.
ITEM 2. PROPERTIES
| Property Location | | Year Location Established | | Approximate Square Footage | | Owned / Leased |
Headquarters (1) 100 North Laura Street | | 2004 | | | 14,815 | | Leased |
| | | | | | | | |
Branch Office 10325 San Jose Boulevard | | 1998 | | | 3,567 | | Owned |
| | | | | | | | |
Branch Office 12740-200 Atlantic Boulevard | | 2000 | | | 3,080 | | Owned |
| | | | | | | | |
Branch Office (2) 4343 Roosevelt Boulevard | | 2005 | | | 3,127 | | Leased |
| | | | | | | | |
Branch Office (3) 7880 Gate Parkway | | 2006 | | | 9,372 | | Leased |
| | (1) | The Bank has a 10-year lease that expires September 30, 2014 for our headquarters location which specifies rent of $20.00 per square foot and is subject to annual increases of $0.50 per square foot on October 1st of each year through September 30, 2014. The Bank has five renewal options, each to extend the term of the lease for five years, the first option term commencing on October 1, 2014, and the last option term ending on September 30, 2039. |
| | (2) | The Bank took occupancy of this branch on November 1, 2005 and opened for business on February 6, 2006. The Bank has a 10-year lease that expires November 1, 2015 for this branch, which specifies rent of $90,000 per annum and is subject to annual increases of 3% on November 1 of each year through November 1, 2015. The Bank has four renewal options, each to extend the term of the lease for five years, the first option term commencing on November 1, 2015, and the last option term ending on November 1, 2035. |
| | (3) | The Bank took occupancy of this branch on January 13, 2006 and opened for business on June 9, 2006. The Bank has a 10-year lease that expires January 13, 2016 for this branch, which specifies rent of $210,870 per annum and is subject to annual increases on the anniversary date to the extent of any percentage change that occurs in the consumer price index for all urban consumers. The Bank has two renewal options, each to extend the term of the lease for five years, the first option term commencing on January 13, 2016, and the last option term ending on January 13, 2026. |
ITEM 3. LEGAL PROCEEDINGS
From time to time, as a normal incident of the nature and kind of business in which we are engaged, various claims or charges are asserted against us and/or our directors, officers or affiliates. In the ordinary course of business, the Company is also subject to regulatory examinations, information gathering requests, inquiries and investigations. Other than ordinary routine litigation incidental to our business, management believes after consultation with legal counsel that there are no pending legal proceedings against Bancorp or the Bank that will, individually or in the aggregate, have a material adverse effect on the consolidated results of operations or financial condition of the Company.
ITEM 4. SUBMISSION OF MATTERS TO A VOTE OF SECURITY HOLDERS
There were no matters submitted to a vote of security holders during the fourth quarter of 2008.
PART II
| ITEM 5. | MARKET FOR REGISTRANT’S COMMON EQUITY AND RELATED STOCKHOLDER MATTERS AND ISSUER PURCHASES OF EQUITY SECURITIES |
Our common stock is traded on NASDAQ under the symbol JAXB. The following table shows the high and low sale prices of our common stock for each quarter of 2007 and 2008.
| Year | | Quarter | | High | | | Low | |
| 2007 | | First | | $ | 35.99 | | | $ | 31.16 | |
| | | Second | | $ | 35.93 | | | $ | 26.95 | |
| | | Third | | $ | 32.21 | | | $ | 27.00 | |
| | | Fourth | | $ | 27.95 | | | $ | 18.29 | |
| 2008 | | First | | $ | 27.54 | | | $ | 18.50 | |
| | | Second | | $ | 24.50 | | | $ | 15.75 | |
| | | Third | | $ | 16.07 | | | $ | 11.60 | |
| | | Fourth | | $ | 13.00 | | | $ | 10.92 | |
As of March 18, 2009, Bancorp had 1,748,799 outstanding shares of common stock, par value $.01 per share, held by approximately 155 registered shareholders of record.
It is the policy of our board of directors to reinvest earnings for such period of time as is necessary to ensure our successful operations. There are no current plans to initiate payment of cash dividends, and future dividend policy will depend on our earnings, capital and regulatory requirements, financial condition, and other factors considered relevant by our board of directors. For more information regarding Bancorp’s ability to pay dividends, please refer to the section captioned “Regulation and Supervision” under Item 1 of this Annual Report on Form 10-K, which information is hereby incorporated by reference.
Equity Compensation Plans Information
The following table sets forth information about the Jacksonville Bancorp, Inc. Stock Option Plan, as amended, and the 2008 Amendment and Restatement of the Jacksonville Bancorp, Inc. 2006 Stock Incentive Plan, as of December 31, 2008:
| Plan Category | | Number of securities to be issued upon exercise of outstanding options, warrants and rights | | | Weighted average exercise price of
outstanding options, warrants and rights | | | Number of securities remaining available for future issuance | |
| Equity compensation plans approved by security holders | | | 158,942 | | | $ | 14.62 | | | | 68,233 | |
| Equity compensation plans not approved by security holders | | | — | | | | — | | | | — | |
| Total | | | 158,942 | | | $ | 14.62 | | | | 68,233 | |
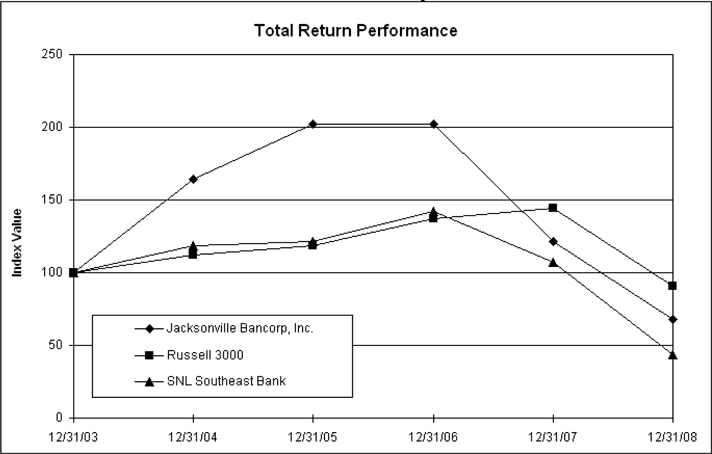
Shareholder Return Performance
A five-year comparison of shareholder return performance of the Company with the Russell 3000 Index and the SNL Southeast Bank Index is shown on the graph below. This graph assumes that $100 was invested on December 31, 2002 and all dividends were reinvested in the Company and other indices. The Russell 3000 index is a broad equity market index which measures the performance of the largest 3,000 U.S. companies representing approximately 98% of the U.S. equity market. The SNL Southeast Bank Index is a published industry index which represents publicly-traded banks and bank holding companies located in the southeastern United States.
Jacksonville Bancorp, Inc.
| | | Period Ending | |
| Index | | 12/31/03 | | | 12/31/04 | | | 12/31/05 | | | 12/31/06 | | | 12/31/07 | | | 12/31/08 | |
| Jacksonville Bancorp, Inc. | | | 100.00 | | | | 164.35 | | | | 202.13 | | | | 201.83 | | | | 121.34 | | | | 67.68 | |
| Russell 3000 | | | 100.00 | | | | 111.95 | | | | 118.80 | | | | 137.47 | | | | 144.54 | | | | 90.61 | |
| SNL Southeast Bank | | | 100.00 | | | | 118.59 | | | | 121.39 | | | | 142.34 | | | | 107.23 | | | | 43.41 | |
COMPANY PURCHASES OF EQUITY SECURITIES
Following approval by the shareholders at the 2003 Annual Meeting, the Company established the Directors’ Stock Purchase Plan for nonemployee directors. Under this plan, directors may elect to receive shares of the Company’s common stock as an alternative to the equivalent of cash for directors’ fees. All transactions executed under the Director’s Stock Purchase Plan were open-market purchases and were accounted for as treasury stock on the date of purchase. The Company repurchased an aggregate of 1,379 shares of its common stock during the last quarter for issuance under this Plan.
| Period | | Total number of shares purchased | | | Average price paid per share | | | Total number of shares purchased as part of publicly announced plans or programs | | | Maximum number (or approximate dollar value) of shares that may yet be purchased under the plans or programs | |
| October 1 – October 31, 2008 | | | 1,179 | | | $ | 12.10 | | | | — | | | | — | |
| November 1 – November 30, 2008 | | | — | | | | — | | | | — | | | | — | |
| December 1 – December 31, 2008 | | | 200 | | | $ | 11.72 | | | | — | | | | — | |
| Total | | | 1,379 | | | | — | | | | — | | | | — | |
ITEM 6. SELECTED FINANCIAL DATA
The selected consolidated financial data presented below as of and for the years ended December 31, 2008, 2007, 2006, 2005 and 2004 have been derived from our Consolidated Financial Statements. The ratios and other data are unaudited and have been derived from our records. The information presented below should be read in conjunction with the Consolidated Financial Statements and related notes and “Management’s Discussion and Analysis of Financial Condition and Results of Operations.”
At or for the Year Ended December 31,
(Dollars in thousands, except per share figures)
| | 2008 | | | 2007 | | | 2006 | | | 2005 | | | 2004 | |
| Cash and cash equivalents | | $ | 10,148 | | | $ | 6,035 | | | $ | 4,478 | | | $ | 4,767 | | | $ | 6,735 | |
| Securities, available for sale and held to maturity | | | 29,734 | | | | 29,777 | | | | 26,109 | | | | 24,261 | | | | 23,175 | |
| Loans, net | | | 374,993 | | | | 339,265 | | | | 281,006 | | | | 232,031 | | | | 188,137 | |
| All other assets | | | 19,124 | | | | 16,885 | | | | 13,982 | | | | 11,985 | | | | 5,697 | |
| | | | | | | | | | | | | | | | | | | | | |
| Total assets | | $ | 433,999 | | | $ | 391,962 | | | $ | 325,575 | | | $ | 273,044 | | | $ | 223,744 | |
| | | | | | | | | | | | | | | | | | | | | |
| Deposit accounts | | | 345,544 | | | | 288,893 | | | | 282,626 | | | | 234,211 | | | | 201,188 | |
| Other borrowings | | | 60,550 | | | | 74,830 | | | | 18,832 | | | | 17,650 | | | | 4,000 | |
| All other liabilities | | | 1,060 | | | | 1,610 | | | | 979 | | | | 1,337 | | | | 752 | |
| Shareholders' equity | | | 26,845 | | | | 26,629 | | | | 23,138 | | | | 19,846 | | | | 17,804 | |
| | | | | | | | | | | | | | | | | | | | | |
| Total liabilities and shareholders' equity | | $ | 433,999 | | | $ | 391,962 | | | $ | 325,575 | | | $ | 273,044 | | | $ | 223,744 | |
| | | | | | | | | | | | | | | | | | | | | |
| Operations Data: | | 2008 | | | 2007 | | | 2006 | | | 2005 | | | 2004 | |
| Total interest income | | $ | 25,563 | | | $ | 26,808 | | | $ | 22,017 | | | $ | 15,748 | | | $ | 10,858 | |
| Total interest expense | | | 13,560 | | | | 14,419 | | | | 10,945 | | | | 6,529 | | | | 3,928 | |
| | | | | | | | | | | | | | | | | | | | | |
| Net interest income | | | 12,003 | | | | 12,389 | | | | 11,072 | | | | 9,219 | | | | 6,930 | |
| Provision for loan losses | | | 3,570 | | | | 542 | | | | 546 | | | | 481 | | | | 282 | |
| | | | | | | | | | | | | | | | | | | | | |
| Net interest income after provision for loan losses | | | 8,433 | | | | 11,847 | | | | 10,526 | | | | 8,738 | | | | 6,648 | |
| | | | | | | | | | | | | | | | | | | | | |
| Noninterest income | | | 1,178 | | | | 1,184 | | | | 1,047 | | | | 964 | | | | 767 | |
| Noninterest expenses | | | 9,805 | | | | 8,485 | | | | 7,573 | | | | 6,287 | | | | 5,274 | |
| | | | | | | | | | | | | | | | | | | | | |
| Income before income taxes | | | (194 | ) | | | 4,546 | | | | 4,000 | | | | 3,415 | | | | 2,141 | |
| Income taxes | | | (229 | ) | | | 1,588 | | | | 1,477 | | | | 1,242 | | | | 806 | |
| | | | | | | | | | | | | | | | | | | | | |
| Net income | | $ | 35 | | | $ | 2,958 | | | $ | 2,523 | | | $ | 2,173 | | | $ | 1,335 | |
| | | | | | | | | | | | | | | | | | | | | |
| Per Share Data: | | | | | | | | | | | | | | | | | | | | |
| Basic earnings per share | | $ | .02 | | | $ | 1.70 | | | $ | 1.46 | | | $ | 1.27 | | | $ | .86 | |
| Diluted earnings per share | | | .02 | | | | 1.63 | | | | 1.39 | | | | 1.21 | | | | .79 | |
| Dividends declared per share | | | — | | | | — | | | | — | | | | — | | | | — | |
| Total shares outstanding at end of year | | | 1,748,599 | | | | 1,746,331 | | | | 1,741,688 | | | | 1,714,716 | | | | 1,708,366 | |
| | | | | | | | | | | | | | | | | | | | | |
| Ratios and Other Data: | | | | | | | | | | | | | | | | | | | | |
| Book value per share at end of year | | $ | 15.35 | | | $ | 15.25 | | | $ | 13.28 | | | $ | 11.57 | | | $ | 10.42 | |
| Return on average assets | | | 0.01 | % | | | 0.82 | % | | | 0.83 | % | | | 0.88 | % | | | 0.66 | % |
| Return on average equity | | | 0.13 | % | | | 12.08 | % | | | 11.92 | % | | | 11.69 | % | | | 8.84 | % |
| Average equity to average assets | | | 6.40 | % | | | 6.76 | % | | | 6.95 | % | | | 7.49 | % | | | 7.46 | % |
| Interest rate spread during the period | | | 2.46 | % | | | 2.90 | % | | | 3.15 | % | | | 3.27 | % | | | 3.14 | % |
| Net yield on average interest-earning assets | | | 2.97 | % | | | 3.56 | % | | | 3.81 | % | | | 3.88 | % | | | 3.53 | % |
| Noninterest expenses to average assets | | | 2.33 | % | | | 2.34 | % | | | 2.49 | % | | | 2.53 | % | | | 2.60 | % |
| Average interest-earning assets to average interest-bearing liabilities | | | 1.15 | | | | 1.16 | | | | 1.17 | | | | 1.22 | | | | 1.19 | |
| Nonperforming loans and foreclosed assets as a percentage of total assets at end of year | | | 2.89 | % | | | 0.18 | % | | | 0.26 | % | | | 0.28 | % | | | 0.29 | % |
| Allowance for loan losses as a percentage of total loans at end of year | | | 1.24 | % | | | 0.91 | % | | | 0.92 | % | | | 0.94 | % | | | 0.97 | % |
Total number of banking offices1 | | | 5 | | | | 5 | | | | 5 | | | | 3 | | | | 3 | |
(1) Amount represents banking offices operating at December 31 of each year. The Bank currently has five operating offices.
ITEM 7.
MANAGEMENT'S DISCUSSION AND ANALYSIS
OF FINANCIAL CONDITION AND RESULTS OF OPERATIONS
Years Ended December 31, 2008, 2007 and 2006
General
Jacksonville Bancorp, Inc. (“Bancorp”) was incorporated on October 24, 1997 and was organized to conduct the operations of The Jacksonville Bank (the “Bank”). The Bank is a Florida state-chartered commercial bank that opened for business on May 28, 1999, and its deposits are insured by the Federal Deposit Insurance Corporation. The Bank provides a variety of community banking services to businesses and individuals in Duval County, Florida. During 2000, the Bank formed Fountain Financial, Inc., a wholly owned subsidiary. The primary business activities of Fountain Financial, Inc. consist of the referral of our customers to third parties for the sale of insurance and investment products.
Business Strategy
Our primary business segment is community banking and consists of attracting deposits from the general public and using such deposits and other sources of funds to originate commercial business loans, commercial real estate loans, residential mortgage loans and a variety of consumer loans. We also invest in mortgage-backed securities and securities backed by the United States Government, and agencies thereof, as well as other securities.
Our goal is to sustain profitable, controlled growth by focusing on increasing our loan and deposit market share in the Northeast Florida market by developing new financial products, services and delivery channels; closely managing yields on earning assets and rates on interest-bearing liabilities; focusing on noninterest income opportunities, controlling the growth of noninterest expenses and maintaining strong asset quality. Our current strategy is to grow organically and through acquisition if price, culture and market fit within our strategies.
On January 28, 2008, Bancorp entered into an Agreement and Plan of Merger (the “Merger Agreement”) with Heritage Bancshares, Inc. (“Heritage”) pursuant to which, subject to the satisfaction or waiver of the conditions contained therein, Heritage would merge with and into Bancorp (the “Merger”), with Bancorp remaining as the surviving entity.
On June 24, 2008, Bancorp announced that, through mutual agreement, the Merger Agreement with Heritage had been terminated. Both companies attributed the amicable termination of the deal to the current economic climate in the banking industry which changed the benefits of the merger for their respective shareholders.
2008 Executive Overview
The following were significant factors related to 2008 results as compared to 2007. The 2008 performance is reflective of the successful execution of our strategy to focus on organic growth within the Northeast Florida market. During 2008, we recorded growth in commercial real estate, construction and commercial loans. During the year, commercial real estate loans increased by $14.1 million, or 6.7%, construction loans increased by $12.0 million, or 40.4%, and commercial loans increased by $8.2 million, or 40.2%. Total loans increased by $37.4 million, or 10.9%.
Total deposits increased by $57.7 million, or 19.6%, during 2008. The following are changes in the deposit categories:
| | o | Noninterest-bearing deposits increased $5.5 million, or 15.5%. |
| | o | Money market savings and NOW deposits decreased by $28.4 million, or 24.5%. The decline was due to the run-off in one money market product which is tied to the prime lending rate (which declined rapidly during 2008). The Bank adjusted the spread on this product to be more competitive in October 2008 which slowed this run-off substantially. |
| | o | The certificate of deposit portfolio increased by $79.6 million, or 58.0%. The Company’s management pursued local deposits more aggressively by offering competitive deposit products in an effort to attract core deposits and utilized the National and Brokered CD markets as an additional source of funding the asset growth. |
| | o | Borrowed funds, consisting of Federal Home Loan Bank (FHLB) advances¸ Federal Reserve borrowings, and subordinated debentures, totaled $60.6 million at year end 2008 compared to $74.8 million at the end of 2007. During 2008, we decreased our FHLB advances by $47.8 million, increased our borrowing by $26.0 million from the Federal Reserve and increased subordinated debentures by $7.6 million as a result of a private placement offering of trust preferred securities. |
Total shareholders’ equity increased $216,000, or 0.8%, during 2008. Management remains committed to retaining sufficient equity to protect shareholders and depositors, provide for reasonable growth and fully comply with regulatory requirements.
The allowance for loan loss as a percentage of total loans outstanding was 1.24% at December 31, 2008, compared to 0.91% at December 31, 2007. During 2008, the Company had charge-offs of $2.1 million, recoveries of $114,000 and recorded a provision for loan loss of $3.6 million, compared to charge-offs of $71,000, recoveries of $24,000 and provision for loan losses of $542,000 in 2007.
Our net income was $35,000 in 2008 as compared to $3.0 million in 2007. Our diluted earnings per share were $0.02 in 2008 as compared to $1.63 in 2007. Return on average assets and return on average equity were 0.01% and 0.13%, respectively, in 2008 compared to 0.82% and 12.08%, respectively, in 2007.
Interest income was $25.6 million in 2008 as compared to $26.8 million in 2007, a decrease of $1.2 million, or 4.6%, primarily as a result of the ongoing reduction in short-term rates by the Federal Reserve in 2008 as well as $12.4 million added to nonperforming assets offset by an average earnings asset growth of $55.4 million.
Basic average shares outstanding increased to 1,748,295 in 2008 from 1,744,512 in 2007. The diluted weighted average shares outstanding decreased to 1,791,342 from 1,816,149 in the same periods.
Noninterest income remained flat at $1.2 million for 2008 and 2007. In 2008, there was a reduction in mortgage origination referral income due to the slow real estate market, partially offset by income earned on an additional $3.5 million BOLI contract entered into by the Bank during the second quarter.
Critical Accounting Policies
A critical accounting policy is one that is both very important to the portrayal of the Company's financial condition and requires management's most difficult, subjective or complex judgments. The circumstances that make these judgments difficult, subjective or complex have to do with the need to make estimates about the effect of matters that are inherently uncertain. Based on this definition, the Company's primary critical accounting policy is the establishment and maintenance of an allowance for loan loss.
The allowance for loan loss is established through a provision for loan loss charged to expense. Loans are charged against the allowance for loan loss when management believes that the collectability of the principal is unlikely. The allowance is an amount that management believes will be adequate to absorb probable incurred losses on existing loans that may become uncollectible based on evaluations of the collectability of the loans. The evaluations take into consideration such objective factors as changes in the nature and volume of the loan portfolio and historical loss experience. The evaluation also considers certain subjective factors such as overall portfolio quality, review of specific problem loans and current economic conditions that may affect the borrowers' ability to pay. The level of the allowance for loan loss is also impacted by increases and decreases in loans outstanding, because either more or less allowance is required as the amount of the Company's credit exposure changes. To the extent actual loan losses differ materially from management's estimate of these subjective factors, loan growth/run-off accelerates, or the mix of loan types changes, the level of the provision for loan loss, and related allowance can, and will, fluctuate.
Recent Accounting Pronouncements
Please refer to Note 1 to the accompanying Consolidated Financial Statements for information related to the adoption of new accounting standards and the effect of newly issued but not yet effective accounting standards.
FDIC Insurance Assessments
The FDIC is an independent federal agency established originally to insure the deposits, up to prescribed statutory limits, of federally insured banks and to preserve the safety and soundness of the banking industry. The FDIC has adopted a risk-based assessment system for insured depository institutions that takes into account the risks attributable to different categories and concentrations of assets and liabilities.
The Bank’s deposit accounts are insured by the FDIC to the maximum extent permitted by law. The Bank pays deposit insurance premiums to the FDIC based on a risk-based assessment system established by the FDIC for all insured institutions. Institutions considered well-capitalized and financially sound pay the lowest premiums, while those institutions that are less than adequately capitalized and of substantial supervisory concern pay the highest premiums. During 2008, assessment rates for insured institutions ranged from 5 cents per $100 of assessable deposits for well-capitalized institutions with minor supervisory concerns to 43 cents per $100 of assessable deposits for undercapitalized institutions with substantial supervisory concerns. In 2009, assessment rates are expected to range between 12 and 50 cents per $100 of assessable deposits for the first quarter and 8 and 77.5 cents per $100 of assessable deposits for the remainder of the year. The large premium increase is due to the Emergency Economic Stabilization Act of 2008 and the Temporary Liquidity Guarantee Program, both of which increased the deposit insurance coverage available to the Bank’s depositors.
In October 2008, the Emergency Economic Stabilization Act of 2008 (EESA) was signed into law. The EESA temporarily revises the federal deposit insurance laws by increasing the basic deposit insurance coverage from $100,000 to $250,000 per depositor. This revision is currently effective through December 31, 2009.
In order to promote financial stability in the economy, the FDIC adopted the Temporary Liquidity Guarantee Program (TLGP) on October 13, 2008. Participation in the program is voluntary; however, once participation is elected, it cannot be revoked. The Bank elected to participate in the Transaction Account Guarantee Program component of the TLGP. Under the Transaction Account Guarantee Program, the FDIC will fully insure funds held in noninterest-bearing transaction accounts. Noninterest-bearing transaction accounts are ones that do not accrue or pay interest and for which the institution does not require an advance notice of withdrawal. Also covered are interest on lawyers’ trust accounts (IOLTA) and negotiable order of withdrawal (NOW) accounts with interest rates lower than 50 basis points. These revisions are only effective through December 31, 2009.
In February 2006, the Federal Deposit Insurance Reform Act of 2005 and the Federal Deposit Insurance Reform Conforming Amendments Act of 2005 (collectively, the Reform Act) were signed into law. The Reform Act revised the laws concerning federal deposit insurance by making the following changes: (i) merging the Bank Insurance Fund and the Savings Association Insurance Fund into a new fund, the Deposit Insurance Fund (DIF), effective March 31, 2006; (ii) increasing the deposit insurance coverage for certain retirement accounts to $250,000 effective April 1, 2006; (iii) beginning in 2010, deposit insurance coverage on individual accounts may be indexed for inflation; (iv) the FDIC will have more discretion in managing deposit insurance assessments; and (v) eligible institutions will receive a one-time initial assessment credit.
The Reform Act authorized the FDIC to revise the risk-based assessment system. Accordingly, insurance premiums are based on a number of factors, including the risk of loss that insured institutions pose to the DIF. The Reform Act replaced the minimum reserve ratio of 1.25% with a range of between 1.15% and 1.50% for the DIF, depending on projected losses, economic changes and assessment rates at the end of each calendar year. In addition, the FDIC is no longer prohibited from charging banks in the lowest risk category when the reserve ratio premium is greater than 1.25%.
In November 2006, the FDIC adopted changes to its risk-based assessment system. Under the new system, the FDIC will evaluate an institution’s risk base on supervisory ratings for all insured institutions, financial ratios for most institutions and long-term debt issuer ratings for certain large institutions.
Securities
The securities portfolio is categorized as either "held to maturity," "available for sale," or "trading." Securities held to maturity represent those securities which the Bank has the intent and ability to hold to maturity. Securities available for sale represent those investments which may be sold for various reasons, including changes in interest rates and liquidity considerations. These securities are reported at fair market value and unrealized gains and losses are excluded from earnings and reported in accumulated other comprehensive income (loss). Trading securities are held primarily for resale and are recorded at their fair values. Gains or losses on trading securities are included immediately in earnings. During 2008, 2007 and 2006, the Bank had no trading securities.
The following table sets forth the amortized costs and fair value of our securities portfolio (dollars in thousands):
| | | At December 31, 2008 | | | At December 31, 2007 | | | At December 31, 2006 | |
| | | Amortized | | | Fair | | | Amortized | | | Fair | | | Amortized | | | Fair | |
| | | Cost | | | Value | | | Cost | | | Value | | | Cost | | | Value | |
| Securities available for sale: | | | | | | | | | | | | | | | | | | |
| U.S. Government agency securities | | $ | 8,204 | | | $ | 8,284 | | | $ | 7,981 | | | $ | 8,000 | | | $ | 10,473 | | | $ | 10,280 | |
| Mortgage-backed securities | | | 10,483 | | | | 10,622 | | | | 10,796 | | | | 10,768 | | | | 8,995 | | | | 8,829 | |
| State and municipal securities | | | 10,918 | | | | 10,778 | | | | 10,939 | | | | 10,959 | | | | 7,060 | | | | 6,950 | |
| Total | | $ | 29,605 | | | $ | 29,684 | | | $ | 29,716 | | | $ | 29,727 | | | $ | 26,528 | | | $ | 26,059 | |
| Security held to maturity: | | | | | | | | | | | | | | | | | | | | | | | | |
| State of Israel bond | | $ | 50 | | | $ | 50 | | | $ | 50 | | | $ | 50 | | | $ | 50 | | | $ | 50 | |
The following table sets forth, by maturity distribution, certain information pertaining to the securities (dollars in thousands):
| | | | | | | | | After 1 Year | | | After 5 Years | | | | | | | |
| | | Within 1 Year | | | Within 5 Years | | | Within 10 Years | | | After 10 Years | |
| | | Amount | | | Yield | | | Amount | | | Yield | | | Amount | | | Yield | | | Amount | | | Yield | |
| At December 31, 2008: | | | | | | | | | | | | | | | | | | | | | | | | |
| Securities available for sale: | | | | | | | | | | | | | | | | | | | | | | | | |
| U.S. Government agency securities | | $ | - | | | | - | | | $ | 2,992 | | | | 4.11 | % | | $ | 3,976 | | | | 4.96 | % | | $ | 1,235 | | | | 5.37 | % |
| Mortgage-backed securities | | | 625 | | | | 3.92 | % | | | 667 | | | | 4.14 | % | | | 1,530 | | | | 4.38 | % | | | 7,661 | | | | 4.34 | % |
| State and municipal securities | | | 104 | | | | 3.60 | % | | | 675 | | | | 3.23 | % | | | 5,226 | | | | 3.68 | % | | | 4,914 | | | | 4.02 | % |
| Total | | $ | 729 | | | | 3.84 | % | | $ | 4,334 | | | | 3.86 | % | | $ | 10,732 | | | | 4.03 | % | | $ | 13,810 | | | | 4.28 | % |
| Security held to maturity: | | | | | | | | | | | | | | | | | | | | | | | | | | | | | | | | |
| State of Israel bond | | $ | 50 | | | | 7.50 | % | | | | | | | | | | | | | | | | | | | | | | | | |
| Total | | $ | 50 | | | | 7.50 | % | | | | | | | | | | | | | | | | | | | | | | | | |
| | | Totals | |
| | | Amount | | | Yield | |
| At December 31, 2008: | | | | | | |
| Securities available for sale: | | | | | | |
| U.S. Government agency securities | | $ | 8,203 | | | | 4.79 | % |
| Mortgage-backed securities | | | 10,483 | | | | 4.30 | % |
| State and municipal securities | | | 10,919 | | | | 3.79 | % |
| Total | | $ | 29,605 | | | | 4.14 | % |
| Security held to maturity: | | | | | | | | |
| State of Israel bond | | $ | 50 | | | | 7.50 | % |
| Total | | $ | 50 | | | | 7.50 | % |
Loan Portfolio Composition
Commercial real estate loans comprise the largest group of loans in our portfolio amounting to $266.4 million, or 70.1% of the total loan portfolio, at December 31, 2008, compared to $242.7 million, or 70.8%, at December 31, 2007. Residential real estate loans comprise the second largest group of loans in the portfolio, amounting to $81.2 million, or 21.3% of the total loan portfolio, at December 31, 2008, as compared to $75.1 million, or 21.9%, at December 31, 2007. As of December 31, 2008, commercial loans amounted to $28.4 million, or 7.5% of total loans, which were $20.3 million, or 5.9%, at December 31, 2007. The following table sets forth the composition of our loan portfolio (dollars in thousands) over the last five fiscal years:
| | | At December 31, | |
| | | 2008 | | | 2007 | | | 2006 | | | 2005 | | | 2004 | |
| | | | | | % of | | | | | | % of | | | | | | % of | | | | | | % of | | | | | | % of | |
| | | Amount | | | Total | | | Amount | | | Total | | | Amount | | | Total | | | Amount | | | Total | | | Amount | | | Total | |
| | | | | | | | | | | | | | | | | | | | | | | | | | | | | | | |
Commercial real estate (1) | | $ | 266,436 | | | | 70.1 | % | | $ | 242,676 | | | | 70.8 | % | | $ | 198,041 | | | | 69.7 | % | | $ | 156,260 | | | | 66.7 | % | | $ | 121,542 | | | | 63.9 | % |
| Commercial | | | 28,445 | | | | 7.5 | | | | 20,291 | | | | 5.9 | | | | 18,903 | | | | 6.7 | | | | 16,681 | | | | 7.1 | | | | 15,855 | | | | 8.3 | |
| Residential real estate | | | 81,152 | | | | 21.3 | | | | 75,141 | | | | 21.9 | | | | 62,270 | | | | 21.9 | | | | 57,985 | | | | 24.7 | | | | 46,663 | | | | 24.6 | |
| Consumer and other | | | 4,070 | | | | 1.1 | | | | 4,631 | | | | 1.4 | | | | 4,693 | | | | 1.7 | | | | 3,461 | | | | 1.5 | | | | 6,013 | | | | 3.2 | |
| | | | | | | | | | | | | | | | | | | | | | | | | | | | | | | | | | | | | | | | | |
| | | $ | 380,103 | | | | 100.0 | % | | $ | 342,739 | | | | 100.0 | % | | $ | 283,907 | | | | 100.0 | % | | $ | 234,387 | | | | 100.0 | % | | $ | 190,073 | | | | 100.0 | % |
| | | | | | | | | | | | | | | | | | | | | | | | | | | | | | | | | | | | | | | | | |
| Add (deduct): | | | | | | | | | | | | | | | | | | | | | | | | | | | | | | | | | | | | | | | | |
| Allowance for loan losses | | | (4,705 | ) | | | | | | | (3,116 | ) | | | | | | | (2,621 | ) | | | | | | | (2,207 | ) | | | | | | | (1,843 | ) | | | | |
| Net deferred (fees) costs | | | (405 | ) | | | | | | | (358 | ) | | | | | | | (280 | ) | | | | | | | (149 | ) | | | | | | | (93 | ) | | | | |
| | | | | | | | | | | | | | | | | | | | | | | | | | | | | | | | | | | | | | | | | |
| Loans, net | | $ | 374,993 | | | | | | | $ | 339,265 | | | | | | | $ | 281,006 | | | | | | | $ | 232,031 | | | | | | | $ | 188,137 | | | | | |
The following table reflects the contractual principal repayments by period of our loan portfolio at December 31, 2008 (in thousands):
| | | | | | Commercial | | | | | | | | | | |
| | | | | | Real | | | Residential | | | | | | | |
| Years Ending | | Commercial | | | Estate | | | Mortgage | | | Consumer | | | | |
| December 31, | | Loans | | | Loans (1) | | | Loans | | | Loans | | | Total | |
| | | | | | | | | | | | | | | | |
| Less than 1 year | | $ | 22,870 | | | $ | 70,907 | | | $ | 27,864 | | | $ | 1,738 | | | $ | 123,379 | |
| 1-5 years | | | 5,348 | | | | 133,129 | | | | 31,376 | | | | 1,950 | | | | 171,803 | |
| Greater than 5 years | | | 227 | | | | 62,400 | | | | 21,912 | | | | 382 | | | | 84,921 | |
| | | | | | | | | | | | | | | | | | | | | |
| Total | | $ | 28,445 | | | $ | 266,436 | | | $ | 81,152 | | | $ | 4,070 | | | $ | 380,103 | |
(1) For presentation purposes, construction and farmland loans have been classified as commercial real estate loans.
| | | Loans Maturing | |
| (in thousands) | | Within 1 Year | | | 1-5 Years | | | After 5 Years | | | Total | |
| Loans with: | | | | | | | | | | | | |
| Fixed interest rates | | $ | 38,145 | | | $ | 147,977 | | | $ | 66,298 | | | $ | 252,420 | |
| Variable interest rates | | | 85,234 | | | | 23,826 | | | | 18,623 | | | | 127,683 | |
| Total Loans | | $ | 123,379 | | | $ | 171,803 | | | $ | 84,921 | | | $ | 380,103 | |
Scheduled contractual principal repayments of loans do not reflect the actual life of such assets. The average life of loans is substantially less than their average contractual terms due to prepayments. In addition, due-on-sale clauses on loans generally give us the right to declare a conventional loan immediately due and payable in the event, among other things, that the borrower sells real property subject to a mortgage and the loan is not repaid. The average life of mortgage loans tends to increase, however, when current mortgage loan rates are substantially higher than rates on existing mortgage loans and, conversely, decrease when rates on existing mortgages are substantially higher than current mortgage loan rates.
Credit Risk
Our primary business is making commercial, real estate, business and consumer loans. That activity entails potential loan losses, the magnitude of which depends on a variety of economic factors affecting borrowers which are beyond our control. While the Company has instituted underwriting guidelines and credit review procedures to protect it from avoidable credit losses, some losses will inevitably occur. At December 31, 2008, the Company had nonperforming assets of $12.4 million that were not accruing interest. In addition, the Company had net loan charge-offs totaling $2.0 million in 2008.
Loans are placed on nonaccrual status when management has concerns relating to the ability to collect the loan principal and interest and generally when such loans are 90 days or more past due. A loan is considered impaired when it is probable that not all principal and interest amounts will be collected according to the loan contract. The following table sets forth certain information regarding nonaccrual loans, including the ratio of such loans to total assets as of the dates indicated (dollars in thousands):
| | | At December 31, | |
| | | 2008 | | | 2007 | | | 2006 | | | 2005 | | | 2004 | |
| Nonperforming loans: | | | | | | | | | | | | | | | |
| Commercial real estate | | $ | 9,011 | | | $ | — | | | $ | 432 | | | $ | 529 | | | $ | 153 | |
| Residential real estate loans | | | 3,013 | | | | — | | | | — | | | | — | | | | 33 | |
| Commercial loans | | | 412 | | | | 680 | | | | 407 | | | | 224 | | | | 413 | |
| Consumer loans and other | | | — | | | | 10 | | | | 12 | | | | 13 | | | | 55 | |
| | | | | | | | | | | | | | | | | | | | | |
| Total nonperforming loans | | $ | 12,436 | | | $ | 690 | | | $ | 851 | | | $ | 766 | | | $ | 654 | |
| | | | | | | | | | | | | | | | | | | | | |
| Total nonperforming loans to total assets | | | 2.87 | % | | | 0.18 | % | | | 0.26 | % | | | 0.28 | % | | | 0.29 | % |
On January 9, 2009, one of the nonperforming loans in the amount of $2 million was paid in full. $281,000 of this loan was charged off on December 29, 2008.
On January 22, 2009, the Bank foreclosed on a commercial property located in downtown Jacksonville. The loan, which was originally made on February 15, 2005, had ceased accruing interest on May 8, 2008. On February 28, 2009, the property was sold for $3.7 million. A charge-off in the amount of $368,000 was recorded at the time of foreclosure, of which the full amount had previously been reserved through the Allowance for Loan Losses.
Allowance and Provision for Loan Losses
The allowance for loan losses is a valuation allowance for credit losses in the loan portfolio. Management has adopted a methodology to properly analyze and determine an adequate loan loss allowance. The analysis is based on sound, reliable and well documented information and is designed to support an allowance that is adequate to absorb all estimated losses in the Company’s loan and lease portfolio.
Due to their similarities, the Company has grouped the loan portfolio into four components. The components are commercial real estate loans, residential real estate loans, commercial loans and consumer loans. The Company has created a loan classification system to properly calculate the allowance for loan losses. Commercial and commercial real estate loans and certain residential real estate loans over $100,000 are individually evaluated for impairment. If a loan is impaired, a portion of the allowance is allocated so that the loan is reported, net, at the present value of estimated future cash flows using the loan’s existing rate or at the fair value of collateral if repayment is expected solely from the sale of the collateral. Large groups of smaller balance homogeneous loans, such as consumer and residential real estate loans, are collectively evaluated for impairment and, accordingly, they are not separately identified for impairment disclosures.
In estimating the overall exposure to loss on impaired loans, the Company has considered a number of factors, including the borrower’s character, overall financial condition, resources and payment record, the prospects for support from any financially responsible guarantors and the realizable value of any collateral.
The Company also considers other internal and external factors when determining the allowance for loan losses. These factors include, but are not limited to, changes in national and local economic conditions, commercial lending staff limitations, impact from lengthy commercial loan workout and charge-off period, loan portfolio concentrations and trends in the loan portfolio.
Senior management reviews this calculation and the underlying assumptions on a routine basis not less frequently than quarterly.
The allowance for loan losses amounted to $4.7 million and $3.1 million at December 31, 2008 and December 31, 2007, respectively. Based on an analysis performed by management at December 31, 2008, the allowance for loan losses is considered to be adequate to cover probable incurred loan losses in the portfolio as of that date. However, management’s judgment is based upon a number of assumptions about future events, which are believed to be reasonable, but which may or may not prove valid. Thus, there can be no assurance that charge-offs in future periods will not exceed the allowance for loan losses or that significant additional increases in the allowance for loan losses will not be required.
The Bank has experienced an increase in adversely classified loans from $1.2 million at December 31, 2007 to $29.6 million at December 31, 2008, while nonperforming loans as a percentage of total assets were 2.87% at December 31, 2008 compared to 0.18% at December 31, 2007. All adversely classified loans are monitored closely and the majority of these loans are collateralized by real estate and are well secured based on recent appraisal information. Management has analyzed its collateral position and is comfortable that the loan loss reserve at December 31, 2008 is sufficient.
The following table sets forth information with respect to activity in the allowance for loan losses for the periods indicated (dollars in thousands):
| | | Year Ended December 31, | |
| | | 2008 | | | 2007 | | | 2006 | | | 2005 | | | 2004 | |
| Allowance at beginning of year | | $ | 3,116 | | | $ | 2,621 | | | $ | 2,207 | | | $ | 1,843 | | | $ | 1,679 | |
| | | | | | | | | | | | | | | | | | | | | |
| Charge-offs: | | | | | | | | | | | | | | | | | | | | |
| Consumer and other loans | | | 46 | | | | 59 | | | | 16 | | | | 15 | | | | — | |
| Commercial real estate | | | 33 | | | | — | | | | — | | | | — | | | | — | |
| Commercial loans | | | 1,137 | | | | 12 | | | | 124 | | | | 102 | | | | 130 | |
| Residential real estate | | | 879 | | | | - | | | | - | | | | - | | | | - | |
| Total Charge-offs | | | 2,095 | | | | 71 | | | | 140 | | | | 117 | | | | 130 | |
| Recoveries: | | | | | | | | | | | | | | | | | | | | |
| Consumer loans | | | 3 | | | | 20 | | | | 3 | | | | - | | | | - | |
| Commercial real estate | | | - | | | | - | | | | - | | | | - | | | | - | |
| Commercial loans | | | 111 | | | | 4 | | | | 5 | | | | - | | | | 12 | |
| Residential real estate | | | - | | | | - | | | | - | | | | - | | | | - | |
| Total Recoveries | | | 114 | | | | 24 | | | | 8 | | | | - | | | | 12 | |
| | | | | | | | | | | | | | | | | | | | | |
| Net charge-offs | | | 1,981 | | | | 47 | | | | 132 | | | | 117 | | | | 118 | |
| Provision for loan losses charged to operating expenses | | | 3,570 | | | | 542 | | | | 546 | | | | 481 | | | | 282 | |
| | | | | | | | | | | | | | | | | | | | | |
| Allowance at end of year | | $ | 4,705 | | | $ | 3,116 | | | $ | 2,621 | | | $ | 2,207 | | | $ | 1,843 | |
| Ratio of net charge-offs to average loans outstanding | | | 0.57 | % | | | 0.01 | % | | | 0.05 | % | | | 0.06 | % | | | 0.07 | % |
| | | | | | | | | | | | | | | | | | | | | |
| Allowance as a percent of total loans | | | 1.24 | % | | | 0.91 | % | | | 0.92 | % | | | 0.94 | % | | | 0.97 | % |
The following table presents information regarding the total allowance for loan losses as well as the allocation of such amounts to the various categories of loans (dollars in thousands):
| | | At December 31, | |
| | | 2008 | | | 2007 | | | 2006 | | | 2005 | | | 2004 | |
| | | | | | % of | | | | | | % of | | | | | | % of | | | | | | % of | | | | | | % of | |
| | | | | | Loans | | | | | | Loans | | | | | | Loans | | | | | | Loans | | | | | | Loans | |
| | | | | | to Total | | | | | | to Total | | | | | | to Total | | | | | | to Total | | | | | | to Total | |
| | | Amount | | | Loans | | | Amount | | | Loans | | | Amount | | | Loans | | | Amount | | | Loans | | | Amount | | | Loans | |
Commercial real estate (1) | | $ | 2,885 | | | | 70.1 | % | | $ | 2,171 | | | | 70.8 | % | | $ | 1,689 | | | | 69.7 | % | | $ | 1,286 | | | | 66.7 | % | | $ | 979 | | | | 63.9 | % |
| Commercial | | | 879 | | | | 7.5 | | | | 232 | | | | 5.9 | | | | 225 | | | | 6.7 | | | | 268 | | | | 7.1 | | | | 380 | | | | 8.3 | |
| Residential real estate | | | 896 | | | | 21.3 | | | | 672 | | | | 21.9 | | | | 667 | | | | 21.9 | | | | 621 | | | | 24.7 | | | | 425 | | | | 24.6 | |
| Consumer and other | | | 45 | | | | 1.1 | | | | 41 | | | | 1.4 | | | | 40 | | | | 1.7 | | | | 32 | | | | 1.5 | | | | 59 | | | | 3.2 | |
| Total allowance for loan losses | | $ | 4,705 | | | | 100 | % | | $ | 3,116 | | | | 100.0 | % | | $ | 2,621 | | | | 100.0 | % | | $ | 2,207 | | | | 100.0 | % | | $ | 1,843 | | | | 100.0 | % |
| Allowance for loan losses as a percentage of total loans outstanding | | | | | | |
1.24 | % | | | | | | | 0.91 | % | | | | | | | 0.92 | % | | | | | | | 0.94 | % | | | | | | | 0.97 | % |
(1) Construction and farmland loans have been classified as commercial real estate loans.
Deposits and Other Sources of Funds
General. In addition to deposits, the sources of funds available for lending and other business purposes include loan repayments, loan sales, Federal Home Loan Bank (FHLB) advances, Federal Reserve borrowings, federal funds purchased lines of credit, and securities sold under agreements to repurchase. Loan repayments are a relatively stable source of funds, while deposit inflows and outflows are influenced significantly by general interest rates and market conditions. Borrowings may be used to compensate for reductions in other sources, such as deposits, or due to favorable differentials in rates and other costs.
Deposits. Deposits are attracted principally from our primary geographic market areas in Duval County, Florida. The Bank also enhanced its geographical diversity by offering certificates of deposits through brokered markets and nationally to other financial institutions. The Bank offers a broad selection of deposit products, including demand deposit accounts, NOW accounts, money market accounts, regular savings accounts, term certificates of deposit and retirement savings plans (such as IRAs). Certificate of deposit rates are set to encourage maturities based on current market conditions. Deposit account terms vary, with the primary differences being the minimum balance required, the time period the funds must remain on deposit, and the associated interest rates. The Company holds quarterly Asset Liability Committee (ALCO) meetings, comprised of members of the Board of Directors and management. In addition, pricing meetings are held by members of management on a monthly basis or more frequently if economic conditions dictate. The Bank emphasizes commercial banking and small business relationships in an effort to increase demand deposits as a percentage of total deposits.
The following table shows the distribution of, and certain other information relating to, our deposit accounts by type (dollars in thousands):
| | | At December 31, | |
| | | 2008 | | | 2007 | | | 2006 | |
| | | Average | | | Average | | | Average | | | Average | | | Average | | | Average | |
| | | Balance | | | Rate Paid | | | Balance | | | Rate Paid | | | Balance | | | Rate Paid | |
| | | | | | | | | | | | | | | | | | | |
| Demand deposits | | $ | 41,580 | | | | 0.00 | % | | $ | 35,433 | | | | 0.00 | % | | $ | 34,585 | | | | 0.00 | % |
| NOW deposits | | | 6,513 | | | | 0.18 | | | | 6,919 | | | | 0.17 | | | | 7,804 | | | | 0.21 | |
| Money market deposits | | | 81,517 | | | | 2.51 | | | | 118,689 | | | | 4.45 | | | | 132,206 | | | | 4.45 | |
| Savings deposits | | | 14,588 | | | | 2.91 | | | | 10,336 | | | | 3.11 | | | | 10,737 | | | | 3.01 | |
| Time deposits | | | 194,568 | | | | 4.55 | | | | 122,077 | | | | 5.26 | | | | 74,280 | | | | 4.57 | |
| | | | | | | | | | | | | | | | | | | | | | | | | |
| Total deposits | | $ | 338,766 | | | | 3.81 | % | | $ | 293,454 | | | | 4.10 | % | | $ | 259,612 | | | | 3.70 | % |
The following table presents maturity of our time deposits at December 31, 2008:
| | | Deposits | | | Deposits | | | | |
| | | $100,000 | | | Less Than | | | | |
| | | and Greater | | | $100,000 | | | Total | |
| Due three months or less | | $ | 19,770 | | | $ | 44,870 | | | $ | 64,640 | |
| Due more than three months to six months | | | 9,413 | | | | 17,493 | | | | 26,906 | |
| More than six months to one year | | | 38,381 | | | | 44,778 | | | | 83,159 | |
| One to five years | | | 6,709 | | | | 35,528 | | | | 42,237 | |
| More than five years | | | - | | | | - | | | | - | |
| | | $ | 74,273 | | | $ | 142,669 | | | $ | 216,942 | |
Liquidity and Capital Resources
The Company’s liquidity is its ability to maintain a steady flow of funds to support its ongoing operating, investing and financing activities. Our Board establishes policies and analyzes and manages liquidity to ensure that adequate funds are available to meet normal operating requirements in addition to unexpected customer demands for funds, such as high levels of deposit withdrawals or loan demand, in a timely and cost-effective manner. The most important factor in the preservation of liquidity is maintaining public confidence that facilitates the retention and growth of a large, stable supply of core deposits and wholesale funds. Ultimately, public confidence is generated through profitable operations, sound credit quality and a strong capital position. Liquidity management is viewed from a long-term and a short-term perspective as well as from an asset and liability management perspective. We monitor liquidity through a regular review of loan and deposit maturities and loan and deposit forecasts to minimize funding risk.
As discussed above, sources of liquidity include principal paydowns of loans and investment securities, customer deposits and borrowings. The Bank has an unsecured federal funds purchased accommodation with its main correspondent bank totaling $5.3 million at December 31, 2008, all of which was available as of that date. In addition, the Company has invested in FHLB stock for the purpose of establishing credit lines with FHLB. This line is collateralized by a lien arrangement on the Company’s first mortgage loans, second mortgage loans and commercial real estate loans. Based on this collateral and the Company’s holdings of FHLB stock, the Company had a line of credit availability of $54.7 million from this credit line, of which it had borrowed $20.0 million at December 31, 2008. Additionally, during the year, the Company established a “Borrower in Custody” line of credit with the Federal Reserve Bank utilizing excess collateral. The amount of this line at December 31, 2008 was $45.6 million, of which it had borrowed $19.6 million. In addition, the Company had available credit lines with other correspondent banks totaling $9.7 million.
Scheduled maturities and paydowns of the Company’s investment securities are an additional source of liquidity. During 2008, the Company had received approximately $6.2 million from maturities and paydowns of investment securities. The Bank also has the ability to convert marketable securities into cash or access new or existing sources of incremental funds if the need should arise. Additionally, the Bank has access to the national and brokered deposit markets to supplement liquidity needs.
At December 31, 2008, the Bank had outstanding commitments to borrowers for available lines of credit and standby letters of credit totaling $35.4 million and $543,000, respectively. Based on the sources of liquidity discussed above, the Company believes that it has access to sufficient funds to cover such commitments, should the need arise.
Regulatory Capital Requirements
The Bank is required to meet certain minimum regulatory capital requirements. Quantitative measures established by regulation to ensure capital adequacy require us to maintain minimum amounts and percentages of total and Tier 1 capital (as defined in the regulations) to risk weighted assets (as defined), and of Tier 1 capital (as defined) to average assets (as defined). As of December 31, 2008, the Bank and Company met all capital adequacy requirements to which they were subject. The regulatory capital minimums and the Company’s and Bank's actual data for the indicated periods are set forth in the table below (dollars in thousands).
| | | | | | | | | | | | | | | To Be Well | |
| | | | | | | | | | | | | | | Capitalized Under | |
| | | | | | | | | For Capital | | | Prompt Corrective | |
| | | Actual | | | Adequacy Purposes | | | Action Provisions | |
| | | Amount | | | Ratio | | | Amount | | | Ratio | | | Amount | | | Ratio | |
| 2008 | | | | | | | | | | | | | | | | | | |
| Total Capital to risk weighted assets | | | | | | | | | | | | | | | | | | |
| Consolidated | | $ | 46,051 | | | | 11.93 | % | | $ | 30,874 | | | | 8.00 | % | | | N/A | | | | N/A | |
| Bank | | | 40,719 | | | | 10.58 | | | | 30,795 | | | | 8.00 | | | $ | 38,494 | | | | 10.00 | % |
| Tier 1 (Core) Capital to risk weighted assets | | | | | | | | | | | | | | | | | | | | | | | | |
| Consolidated | | | 35,638 | | | | 9.23 | | | | 15,437 | | | | 4.00 | | | | N/A | | | | N/A | |
| Bank | | | 36,014 | | | | 9.36 | | | | 15,397 | | | | 4.00 | | | | 23,096 | | | | 6.00 | |
| Tier 1 (Core) Capital to average assets | | | | | | | | | | | | | | | | | | | | | | | | |
| Consolidated | | | 35,638 | | | | 8.26 | | | | 17,264 | | | | 4.00 | | | | N/A | | | | N/A | |
| Bank | | | 36,014 | | | | 8.36 | | | | 17,228 | | | | 4.00 | | | | 21,535 | | | | 5.00 | |
| | | | | | | | | | | | | | | | | | | | | | | | | |
| 2007 | | | | | | | | | | | | | | | | | | | | | | | | |
| Total Capital to risk weighted assets | | | | | | | | | | | | | | | | | | | | | | | | |
| Consolidated | | $ | 36,739 | | | | 10.60 | % | | $ | 27,715 | | | | 8.00 | % | | | N/A | | | | N/A | |
| Bank | | | 35,313 | | | | 10.16 | | | | 27,819 | | | | 8.00 | | | $ | 34,774 | | | | 10.00 | % |
| Tier 1 (Core) Capital to risk weighted assets | | | | | | | | | | | | | | | | | | | | | | | | |
| Consolidated | | | 33,623 | | | | 9.70 | | | | 13,858 | | | | 4.00 | | | | N/A | | | | N/A | |
| Bank | | | 32,197 | | | | 9.26 | | | | 13,910 | | | | 4.00 | | | | 20,864 | | | | 6.00 | |
| Tier 1 (Core) Capital to average assets | | | | | | | | | | | | | | | | | | | | | | | | |
| Consolidated | | | 33,623 | | | | 8.68 | | | | 15,487 | | | | 4.00 | | | | N/A | | | | N/A | |
| Bank | | | 32,197 | | | | 8.31 | | | | 15,496 | | | | 4.00 | | | | 19,370 | | | | 5.00 | |
Under Federal Reserve policy, the Company is expected to act as a source of financial strength to, and to commit resources to support, the Bank. Management actively manages capital levels in conjunction with asset growth plans, creating a positive impact on shareholder value.
Off-Balance-Sheet Arrangements and Contractual Obligations
The Company is a party to financial instruments with off-balance-sheet risk in the normal course of business to meet the financing needs of its customers. These financial instruments are commitments to extend credit, unused lines of credit, and standby letters of credit, and may involve, to varying degrees, elements of credit and interest-rate risk in excess of the amount recognized in the consolidated balance sheet. The contract amounts of these instruments reflect the extent of involvement the Company has.
The Company's exposure to credit loss in the event of nonperformance by the other party to the financial instrument for commitments to extend credit is represented by the contractual amount of those instruments. The Company uses the same credit policies in making commitments as for on-balance-sheet instruments.
Commitments to extend credit are agreements to lend to a customer as long as there is no violation of any condition established in the contract. Commitments generally have fixed expiration dates or other termination clauses and may require payment of a fee. Since some of the commitments are expected to expire without being drawn upon, the total commitment amounts do not necessarily represent future cash requirements. The Company evaluates each customer's credit worthiness on a case-by-case basis. The amount of collateral obtained, if deemed necessary by the Company upon extension of credit, is based on management's credit evaluation of the counterparty.
Standby letters of credit are conditional commitments issued by the Company to guarantee the performance of a customer to a third party. The credit risk involved in issuing letters of credit is essentially the same as that involved in extending loans to customers.
The following is a summary of the Company's contractual obligations, including certain on-balance-sheet obligations, at December 31, 2008 (in thousands):
| | | Payments Due by Period | |
| | | | | | | | | | | | | | | | |
| | | | | | Less than | | | 1-3 | | | 3-5 | | | More than | |
| Contractual Obligations | | Total | | | 1 Year | | | Years | | | Years | | | 5 Years | |
| | | | | | | | | | | | | | | | | | |
| Certificates of deposit | | $ | 216,942 | | | $ | 174,704 | | | $ | 40,869 | | | $ | 1,369 | | | $ | - | |
| FHLB advances | | | 20,000 | | | | - | | | | 15,000 | | | | 5,000 | | | | - | |
| Discount window | | | 26,000 | | | | 26,000 | | | | - | | | | - | | | | - | |
| Subordinated debt | | | 14,550 | | | | - | | | | - | | | | - | | | | 14,550 | |
| Operating leases | | | 4,502 | | | | 682 | | | | 1,397 | | | | 1,443 | | | | 980 | |
| Standby letters of credit | | | 543 | | | | 543 | | | | - | | | | - | | | | - | |
| Unused line of credit loans | | | 35,364 | | | | 35,364 | | | | - | | | | - | | | | - | |
| | | | | | | | | | | | | | | | | | | | | |
| Total | | $ | 317,901 | | | $ | 237,294 | | | $ | 57,266 | | | $ | 7,811 | | | $ | 15,530 | |
Asset - - Liability Structure
As part of its asset and liability management, the Bank has emphasized establishing and implementing internal asset-liability decision processes as well as communications and control procedures to aid in enhancing its earnings. It is believed that these processes and procedures provide the Bank with better capital planning, asset mix and volume controls, loan pricing guidelines, and deposit interest rate guidelines, which should result in tighter controls and less exposure to interest-rate risk.
The matching of assets and liabilities may be analyzed by examining the extent to which such assets and liabilities are interest-rate sensitive and by monitoring an institution's interest-rate sensitivity gap. An asset or liability is said to be interest-rate sensitive within a specific time period if it will mature or reprice within that time period. The interest-rate sensitivity gap is defined as the difference between interest-earning assets and interest-bearing liabilities maturing or repricing within a given time period. The gap ratio is computed as rate-sensitive assets less rate-sensitive liabilities as a percentage of total assets. A gap is considered positive when the total of rate-sensitive assets exceeds rate-sensitive liabilities. A gap is considered negative when the amount of rate-sensitive liabilities exceeds rate-sensitive assets. During a period of rising interest rates, a negative gap would be expected to adversely affect net interest income, while a positive gap should result in an increase in net interest income. During a period of falling interest rates, a negative gap would be expected to result in an increase in net interest income, while a positive gap should adversely affect net interest income.
In order to minimize the potential for adverse effects of material and prolonged changes in interest rates on the results of operations, the Bank continues to monitor asset and liability management policies to appropriately match the maturities and repricing terms of interest-earning assets and interest-bearing liabilities. Such policies have consisted primarily of: (1) emphasizing the origination of variable-rate loans; (2) maintaining a stable core deposit base; and (3) maintaining a sound level of liquid assets (cash and securities).
The following table sets forth certain information relating to our interest-earning assets and interest-bearing liabilities at December 31, 2008 that are estimated to mature or are scheduled to reprice within the period shown (dollars in thousands):
| | | | | | Over 3 | | | | | | | | | | | | | |
| | | | | | Months | | | Over 6 | | | Over 1 | | | | | | | |
| | | 3 Months | | | to 6 | | | Months | | | Year to | | | Over 5 | | | | |
| | | or Less | | | Months | | | to 1 Year | | | 5 Years | | | Years | | | Total | |
Loans (1) | | $ | 165,111 | | | $ | 11,804 | | | $ | 25,599 | | | $ | 154,586 | | | $ | 17,893 | | | $ | 374,993 | |
| Securities | | | 7,636 | | | | 2,862 | | | | 2,583 | | | | 10,221 | | | | 6,432 | | | | 29,734 | |
| Overnight investments | | | 1,483 | | | | - | | | | - | | | | - | | | | 171 | | | | 1,654 | |
| FHLB & correspondent bank stock | | | 1,705 | | | | - | | | | - | | | | - | | | | 285 | | | | 1,990 | |
| Other | | | 8,773 | | | | - | | | | - | | | | - | | | | - | | | | 8,773 | |
| Total rate-sensitive assets | | $ | 184,708 | | | $ | 14,666 | | | $ | 28,182 | | | $ | 164,807 | | | $ | 24,781 | | | $ | 417,144 | |
| | | | | | | | | | | | | | | | | | | | | | | | | |
| Deposit accounts: | | | | | | | | | | | | | | | | | | | | | | | | |
| NOW deposits | | | 6,028 | | | | - | | | | - | | | | - | | | | - | | | | 6,028 | |
| Money market accounts | | | 69,252 | | | | - | | | | - | | | | - | | | | - | | | | 69,252 | |
| Savings deposits | | | 12,470 | | | | - | | | | - | | | | - | | | | - | | | | 12,470 | |
| Time deposits | | | 64,640 | | | | 26,906 | | | | 83,159 | | | | 42,237 | | | | - | | | | 216,942 | |
Total deposit accounts (2) | | | 152,390 | | | | 26,906 | | | | 83,159 | | | | 42,237 | | | | - | | | | 304,692 | |
| FHLB advances | | | - | | | | - | | | | - | | | | 20,000 | | | | - | | | | 20,000 | |
| FRB BIC Line/Discount window | | | 26,000 | | | | - | | | | - | | | | - | | | | - | | | | 26,000 | |
| Subordinated debt | | | - | | | | - | | | | - | | | | - | | | | 14,550 | | | | 14,550 | |
| Total rate-sensitive liabilities | | $ | 178,390 | | | $ | 26,906 | | | $ | 83,159 | | | $ | 62,237 | | | $ | 14,550 | | | $ | 365,242 | |
| | | | | | | | | | | | | | | | | | | | | | | | | |
| Gap repricing difference | | $ | 6,318 | | | $ | ( 12,240 | ) | | $ | ( 54,977 | ) | | $ | 102,570 | | | $ | 10,231 | | | $ | 51,902 | |
| | | | | | | | | | | | | | | | | | | | | | | | | |
| Cumulative gap | | $ | 6,318 | | | $ | (5,922 | ) | | $ | ( 60,899 | ) | | $ | 41,671 | | | $ | 51,902 | | | | | |
| | | | | | | | | | | | | | | | | | | | | | | | | |
| Cumulative gap to total rate-sensitive assets | | | 1.5 | % | | | (1.4 | )% | | | (14.6 | )% | | | 10.0 | % | | | 12.4 | % | | | | |
| (1) | Variable rate loans are included in the period in which the interest rates are next scheduled to adjust rather than in the period in which the loans mature. Fixed rate loans are scheduled, including repayments, according to their contractual maturities. |
| (2) | Certain liabilities such as NOW accounts, while technically are subject to immediate repricing in response to changing market rates, historically have shown little volatility. Conversely, many of the money market and savings accounts float with the prime lending rate and, therefore, are assumed to reprice within a three-month horizon. Management subjectively sets rates on all accounts. |
Results of Operations
Our operating results depend primarily on our net interest income, which is the difference between interest income on interest-earning assets and interest expense on interest-bearing liabilities, consisting primarily of deposits. Net interest income is determined by the difference between yields earned on interest-earning assets and rates paid on interest-bearing liabilities ("interest rate spread") and the relative amounts of interest-earning assets and interest-bearing liabilities. Our interest rate spread is affected by regulatory, economic and competitive factors that influence interest rates, loan demand and deposit flows. In addition, our net earnings are also affected by the level of nonperforming loans and foreclosed assets, as well as the level of noninterest income and noninterest expense, such as salaries and employee benefits, occupancy and equipment costs, and income taxes.
The following table sets forth, for the periods indicated, information regarding: (1) the total dollar amount of interest and dividend income from interest-earning assets and the resultant average yield; (2) the total dollar amount of interest expense on interest-bearing liabilities and the resultant average costs; (3) net interest/dividend income; (4) interest rate spread; and (5) net interest margin. Average balances are based on average daily balances (dollars in thousands).
| | | Year Ended December 31, | |
| | | 2008 | | | 2007 | | | 2006 | |
| | | | | | Interest | | | Average | | | | | | Interest | | | Average | | | | | | Interest | | | Average | |
| | | Average | | | and | | | Yield/ | | | Average | | | and | | | Yield/ | | | Average | | | and | | | Yield/ | |
| | | Balance | | | Dividends | | | Rate | | | Balance | | | Dividends | | | Rate | | | Balance | | | Dividends | | | Rate | |
| Interest-earning assets: | | | | | | | | | | | | | | | | | | | | | �� | | | | | | |
Loans (1) | | $ | 370,320 | | | $ | 24,109 | | | | 6.51 | % | | $ | 317,409 | | | $ | 25,349 | | | | 7.99 | % | | $ | 260,318 | | | $ | 20,654 | | | | 7.93 | % |
Securities (2) | | | 31,891 | | | | 1,435 | | | | 4.50 | | | | 30,183 | | | | 1,399 | | | | 4.64 | | | | 27,435 | | | | 1,201 | | | | 4.38 | |
Other interest-earning assets (3) | | | 1,607 | | | | 19 | | | | 1.18 | | | | 841 | | | | 60 | | | | 7.13 | | | | 3,227 | | | | 161 | | | | 4.99 | |
| Total interest-earning assets | | $ | 403,818 | | | $ | 25,563 | | | | 6.33 | | | $ | 348,433 | | | $ | 26,808 | | | | 7.69 | | | $ | 290,980 | | | $ | 22,016 | | | | 7.57 | |
| | | | | | | | | | | | | | | | | | | | | | | | | | | | | | | | | | | | | |
Noninterest-earning assets (4) | | | 16,606 | | | | | | | | | | | | 13,808 | | | | | | | | | | | | 13,604 | | | | | | | | | |
| Total assets | | $ | 420,424 | | | | | | | | | | | $ | 362,241 | | | | | | | | | | | $ | 304,584 | | | | | | | | | |
| | | | | | | | | | | | | | | | | | | | | | | | | | | | | | | | | | | | | |
| Interest-bearing liabilities: | | | | | | | | | | | | | | | | | | | | | | | | | | | | | | | | | | | | |
| Savings deposits | | | 14,588 | | | | 425 | | | | 2.91 | | | | 10,336 | | | | 321 | | | | 3.11 | | | | 10,737 | | | | 323 | | | | 3.01 | |
| NOW deposits | | | 6,513 | | | | 12 | | | | 0.18 | | | | 6,919 | | | | 12 | | | | 0.17 | | | | 7,804 | | | | 16 | | | | 0.21 | |
| Money market deposits | | | 81,517 | | | | 2,049 | | | | 2.51 | | | | 118,689 | | | �� | 5,276 | | | | 4.45 | | | | 132,206 | | | | 5,885 | | | | 4.45 | |
| Time deposits | | | 194,568 | | | | 8,851 | | | | 4.55 | | | | 122,077 | | | | 6,421 | | | | 5.26 | | | | 74,280 | | | | 3,398 | | | | 4.57 | |
| FHLB advances | | | 40,285 | | | | 1,519 | | | | 3.77 | | | | 35,712 | | | | 1,816 | | | | 5.09 | | | | 18,362 | | | | 969 | | | | 5.28 | |
| Federal Reserve borrowing | | | 2,063 | | | | 23 | | | | 1.11 | | | | — | | | | — | | | | — | | | | — | | | | — | | | | — | |
| Subordinated debentures | | | 11,023 | | | | 675 | | | | 6.12 | | | | 7,000 | | | | 559 | | | | 7.99 | | | | 4,156 | | | | 335 | | | | 8.06 | |
Other interest-bearing liabilities (5) | | | 243 | | | | 6 | | | | 2.47 | | | | 270 | | | | 14 | | | | 5.19 | | | | 323 | | | | 19 | | | | 5.88 | |
| Total interest-bearing liabilities | | | 350,800 | | | | 13,560 | | | | 3.87 | | | | 301,003 | | | | 14,419 | | | | 4.79 | | | | 247,868 | | | | 10,945 | | | | 4.42 | |
| | | | | | | | | | | | | | | | | | | | | | | | | | | | | | | | | | | | | |
| Noninterest-bearing liabilities | | | 42,720 | | | | | | | | | | | | 36,749 | | | | | | | | | | | | 35,558 | | | | | | | | | |
| Shareholders' equity | | | 26,904 | | | | | | | | | | | | 24,489 | | | | | | | | | | | | 21,158 | | | | | | | | | |
| Total liabilities and shareholders' equity | | $ | 420,424 | | | | | | | | | | | $ | 362,241 | | | | | | | | | | | $ | 304,584 | | | | | | | | | |
| | | | | | | | | | | | | | | | | | | | | | | | | | | | | | | | | | | | | |
| Net interest/dividend income | | | | | | $ | 12,003 | | | | | | | | | | | $ | 12,389 | | | | | | | | | | | $ | 11,071 | | | | | |
| | | | | | | | | | | | | | | | | | | | | | | | | | | | | | | | | | | | | |
Interest rate spread (6) | | | | | | | | | | | 2.46 | % | | | | | | | | | | | 2.90 | % | | | | | | | | | | | 3.15 | % |
| | | | | | | | | | | | | | | | | | | | | | | | | | | | | | | | | | | | | |
Net interest margin (7) | | | | | | | | | | | 2.97 | % | | | | | | | | | | | 3.56 | % | | | | | | | | | | | 3.80 | % |
| | | | | | | | | | | | | | | | | | | | | | | | | | | | | | | | | | | | | |
| Ratio of average interest-earning assets to average interest-bearing liabilities | | | 1.15 | | | | | | | | | | | | 1.16 | | | | | | | | | | | | 1.17 | | | | | | | | | |
| (1) | Average loans include nonperforming loans. Interest on loans includes loan fees of $408 in 2008, $436 in 2007 and $298 in 2006. |
| (2) | Interest income and rates include the effects of a tax equivalent adjustment using a federal tax rate of 34% in adjusting tax-exempt interest on tax-exempt investment securities to a fully taxable basis. |
| (3) | Includes federal funds sold. |
| (4) | For presentation purposes, the BOLI acquired by the Bank has been included in noninterest-earning assets. |
| (5) | Includes federal funds purchased. |
| (6) | Interest rate spread represents the difference between the average yield on interest-earning assets and the average cost of interest-bearing liabilities. |
| (7) | Net interest margin is net interest income divided by average interest-earning assets. |
Rate/Volume Analysis
The following table sets forth certain information regarding changes in interest income and interest expense for the periods indicated. For each category of interest-earning assets and interest-bearing liabilities, information is provided on changes attributable to (1) changes in rate (change in rate multiplied by prior volume); (2) changes in volume (change in volume multiplied by prior rate); and (3) changes in rate-volume (change in rate multiplied by change in volume). Dollars are in thousands.
Years Ended December 31, 2008 vs. 2007:
| | | Increase (Decrease) Due to (1) | |
| | | Rate | | | Volume | | | Total | |
| Interest-earning assets: | | | | | | | | | |
| Loans | | $ | ( 5,095 | ) | | $ | 3,855 | | | $ | (1,240 | ) |
| Securities | | | (42 | ) | | | 78 | | | | 36 | |
| Other interest-earning assets | | | (72 | ) | | | 31 | | | | (41 | ) |
| | | | | | | | | | | | | |
| Total | | | (5,209 | ) | | | 3,964 | | | | ( 1,245 | ) |
| | | | | | | | | | | | | |
| Interest-bearing liabilities: | | | | | | | | | | | | |
| Savings deposits | | | (21 | ) | | | 125 | | | | 104 | |
| NOW deposits | | | 1 | | | | (1 | ) | | | — | |
| Money market deposits | | | (1,875 | ) | | | (1,352 | ) | | | (3,227 | ) |
| Time deposits | | | (963 | ) | | | 3,393 | | | | 2,430 | |
| FHLB advances | | | (510 | ) | | | 213 | | | | (297 | ) |
| Federal Reserve borrowing | | | — | | | | 23 | | | | 23 | |
| Subordinated debentures | | | (152 | ) | | | 268 | | | | 116 | |
| Other interest-bearing liabilities | | | (7 | ) | | | (1 | ) | | | (8 | ) |
| | | | | | | | | | | | | |
| Total | | | (3,527 | ) | | | 2,668 | | | | (859 | ) |
| | | | | | | | | | | | | |
| Net change in net interest income | | $ | ( 1,682 | ) | | $ | 1,296 | | | $ | ( 386 | ) |
Years Ended December 31, 2007 vs. 2006:
| | | Increase (Decrease) Due to (1) | |
| | | Rate | | | Volume | | | Total | |
| Interest-earning assets: | | | | | | | | | |
| Loans | | $ | 136 | | | $ | 4,559 | | | $ | 4,695 | |
| Securities | | | 73 | | | | 125 | | | | 198 | |
| Other interest-earning assets | | | 50 | | | | (151 | ) | | | (101 | ) |
| | | | | | | | | | | | | |
| Total | | | 259 | | | | 4,533 | | | | 4,792 | |
| | | | | | | | | | | | | |
| Interest-bearing liabilities: | | | | | | | | | | | | |
| Savings deposits | | | 10 | | | | (12 | ) | | | (2 | ) |
| NOW deposits | | | (2 | ) | | | (2 | ) | | | (4 | ) |
| Money market deposits | | | (8 | ) | | | (601 | ) | | | (609 | ) |
| Time deposits | | | 571 | | | | 2,452 | | | | 3,023 | |
| FHLB advances | | | (37 | ) | | | 884 | | | | 847 | |
| Subordinated debentures | | | (3 | ) | | | 227 | | | | 224 | |
| Other interest-bearing liabilities | | | (2 | ) | | | (3 | ) | | | (5 | ) |
| | | | | | | | | | | | | |
| Total | | | 529 | | | | 2,945 | | | | 3,474 | |
| | | | | | | | | | | | | |
| Net change in net interest income | | $ | (270 | ) | | $ | 1,588 | | | $ | 1,318 | |
| (1) | The change in interest due to both rate and volume has been allocated to the volume and rate components in proportion to the relationship of the dollar amounts of the absolute change in each. |
Year Ended December 31, 2008 Compared to Year Ended December 31, 2007
General. Net earnings for the year ended December 31, 2008 were $35,000, or $0.02 per basic share and $0.02 per diluted share, compared to a net earnings of $3.0 million, or $1.70 per basic and $1.63 per diluted share in 2007.
Interest Income and Expense. Interest income decreased $1.2 million from $26.8 million for the year ended December 31, 2007, compared to $25.6 million in 2008. Interest earned on loans was $24.1 million in 2008, compared to $25.3 million in 2007. This decrease resulted from a decrease in the average yield on loans from 7.99% in 2007 to 6.51% in 2008, offset by an increase in the average loan portfolio balance from $317.4 million for the year ended December 31, 2007 to $370.3 million for the year ended December 31, 2008.
The average security balance was $31.9 million in 2008, compared to $30.2 million in 2007. The interest on securities remained relatively flat at $1.4 million for 2008 and 2007. The average yield on securities decreased 14 basis points from 4.64% in 2007 to 4.50% in 2008.
Interest expense on deposit accounts amounted to $11.3 million for the year ended December 31, 2008, compared to $12.0 million in 2007. The decrease resulted from a decrease in the weighted average cost of interest-bearing deposits from 4.66% in 2007 to 3.81% in 2008, offset by an increase in the average balance of interest-bearing deposits from $258.0 million in 2007 to $297.2 million in 2008. Interest on FHLB advances, subordinated debt, Federal Reserve borrowing and other borrowings amounted to $2.2 million for the year ended December 31, 2008, with a weighted average cost of 4.15%. In July 2008, the Company issued an additional $7.6 million of trust preferred securities priced at three-month LIBOR plus 375 basis points.
Provision for Loan Losses. The provision for loan losses is charged to earnings to bring the total allowance to a level deemed appropriate by management and is based upon the volume and type of lending conducted by the Company, the amount of nonperforming loans, and general economic conditions, particularly as they relate to the Company's market areas, and other factors related to the collectability of the Company's loan portfolio. The provision for the year ended December 31, 2008 was $3.6 million, compared to $542,000 in 2007. The provision expense was necessitated primarily by an increase in net charge-offs and the Bank’s aggressive efforts to identify any potential losses in the portfolio. The Company had net loan charge-offs of $2.0 million in 2008 compared to $47,000 during 2007. Management believes that the allowance for loan losses of $4.7 million at December 31, 2008 is adequate.
Noninterest Income. Noninterest income remained relatively flat at $1.2 million for the years ended December 31, 2008 and 2007.
Noninterest Expense. Noninterest expense totaled $9.8 million for the year ended December 31, 2008, compared to $8.5 million in 2007. Compensation expenses, professional fees, data processing fees, FDIC assessments, a one-time charge of $38,000 for the disposal of fixed assets no longer in use and a $468,000 charge for expenses related to the termination of the merger agreement with Heritage Bancshares, Inc. accounted for the majority of noninterest expense increasing $1.3 million.
Income Taxes (Benefit). The income tax benefit for the year ended December 31, 2008 was $229,000 (an effective rate of 118.0%) compared to an income tax expense of $1,588,000 in 2007 (an effective rate of 34.9%).
Year Ended December 31, 2007 Compared to Year Ended December 31, 2006
General. Net earnings for the year ended December 31, 2007 were $3.0 million, or $1.70 per basic share and $1.63 per diluted share, compared to a net earnings of $2.5 million, or $1.46 per basic and $1.39 per diluted share in 2006.
Interest Income and Expense. Interest income totaled $26.8 million for the year ended December 31, 2007, compared to $22.0 million in 2006. Interest earned on loans was $25.3 million in 2007, compared to $20.7 million in 2006. This increase resulted from an increase in the average loan portfolio balance from $260.3 million for the year ended December 31, 2006 to $317.4 million for the year ended December 31, 2007, combined with an increase in the average yield on loans from 7.93% in 2006 to 7.99% in 2007.
Interest on securities was $1.4 million for the year ended December 31, 2007, compared to $1.2 million for the year ended December 31, 2006. The Company invested approximately $8.5 million in new securities in the current year, of which $3.8 million was invested in municipal securities.
Interest expense on deposit accounts amounted to $12.0 million for the year ended December 31, 2007, compared to $9.6 million in 2006. The increase resulted from an increase in the average balance of interest-bearing deposits from $225.0 million in 2006 to $258.0 million in 2007, combined with an increase in the weighted average cost of interest-bearing deposits from 4.27% in 2006 to 4.66% in 2007 due to increased competitive pressure in the local and national markets. Interest on FHLB advances, subordinated debt and other borrowings amounted to $2.4 million for the year ended December 31, 2007, with a weighted average cost of 5.56%.
Provision for Loan Losses. The provision for loan losses is charged to earnings to bring the total allowance to a level deemed appropriate by management and is based upon the volume and type of lending conducted by the Company, the amount of nonperforming loans, and general economic conditions, particularly as they relate to the Company's market areas, and other factors related to the collectability of the Company's loan portfolio. The provision for the year ended December 31, 2007 was $542,000, compared to $546,000 in 2006. Although the Company experienced an increase in average loans outstanding during 2007, credit quality remained healthy with nonperforming loans at 0.18% of total loans outstanding at year-end and net charge-offs at 0.01% of average loans for the year. Management believes that the allowance for loan losses of $3.1 million at December 31, 2007 is adequate.
Noninterest Income. Noninterest income increased to $1.2 million for the year ended December 31, 2007, compared to $1.0 million for the year ended December 31, 2006. This increase is mainly the result of an $84,000 increase in service charges and a $47,000 gain on sale of loans.
Noninterest Expense. Noninterest expense totaled $8.5 million for the year ended December 31, 2007, compared to $7.6 million in 2006. Salaries and employee benefits and occupancy and equipment accounted for an increase of $733,000 as well as an increase in FDIC insurance as discussed below. The increase in salaries and employee benefits and occupancy and equipment is a result of the full absorption of additional staffing, rent and equipment expense related to the Company’s two newest locations. The Company opened its fourth location in February 2006 and its fifth location in June 2006. Additionally, the implementation of the Federal Deposit Insurance Reform Act of 2005 (effective January 1, 2007), a new system for risk-based assessments, and setting the designated reserve ratio at 1.25 percent resulted in an increase of $171,000. The new assessment rates, which took effect on January 1, 2007, primarily impact financial institutions not in existence on December 31, 1996.
Income Taxes (Benefit). Income taxes for the year ended December 31, 2007 were $1,588,000 (an effective rate of 34.9%) compared to $1,477,000 in 2006 (an effective rate of 36.9%).
ITEM 7A. QUANTITATIVE AND QUALITATIVE DISCLOSURES ABOUT MARKET RISK
Market Risk
Market risk is the risk of loss from adverse changes in market prices and rates. Our market risk arises primarily from interest-rate risk inherent in lending and deposit-taking activities. To that end, we actively monitor and manage interest-rate risk exposure. There are three primary committees that are responsible for monitoring and managing risk exposure:
The ALCO Committee of the Board meets quarterly to review a summary reporting package along with strategies proposed by management.
The Executive ALCO Committee, which consists of the Chairman of the ALCO Committee of the Board, Chief Executive Officer, Chief Financial Officer, Chief Lending Officer, and Senior Vice President of Community Banking meets quarterly to review the liquidity position and earnings simulation reports and to ensure there is adequate capital to meet growth strategies. Strategy development is structured to mitigate any exposure that is indicated through the modeling.
The Liquidity and Pricing Committee meets monthly to execute the strategies set forth by the preceding two committees. Senior management and select members from other departments comprise this committee.
Disclosures about the fair value of financial instruments, which reflect changes in market prices and rates, can be found in Note 14 to the Consolidated Financial Statements.
The Company utilizes a third party and its proprietary simulation model to assist in identifying and managing interest-rate risk. The December 31, 2008 analysis of the Company’s sensitivity to changes in net interest income under varying assumptions for changes in market interest rates is presented below. Specifically, the model derives expected interest income and interest expense resulting from an immediate and parallel shift in the yield curve in the amounts shown.
The starting balances in the Asset/Liability model reflect actual balances on the “as of” date, adjusted for material and significant transactions. Pro forma balances remain static unless otherwise noted by management. This enables interest-rate risk embedded within the existing balance sheet structure to be isolated (growth assumptions can mask interest-rate risk). Management believes, under normal economic conditions, the most indicative indicator of risk is the +/- 200 basis point “shock” (parallel shift) scenario. However, due to the current rate environment, management believes a more reasonable shock in the down scenario is 100 basis points. To provide further exposure to the level of risk/volatility, a “ramping” (gradual increase over 12 months) of rates is modeled as well.
Rate changes are matched with known repricing intervals and assumptions about new growth and expected prepayments. Assumptions are based on the Company’s experience as well as industry standards under varying market and interest-rate environments. The measurement of market risk associated with financial instruments is meaningful only when all related and offsetting on- and off-balance-sheet transactions are aggregated and the resulting net positions are identified.
The analysis exaggerates the sensitivity to changes in key interest rates by assuming an immediate change in rates with no management intervention to change the composition of the balance sheet. The Bank’s primary objective in managing interest-rate risk is to minimize the adverse impact of changes in interest rates on net interest income and capital, while adjusting our asset-liability structure to obtain the maximum yield-cost spread on that structure. However, a sudden and substantial change in interest rates may adversely impact earnings to the extent that the interest rates borne by assets and liabilities do not change at the same speed, to the same extent or on the same basis. The Bank does not engage in trading activities.
| | | Interest Rates | | | | | | Interest Rates | |
| | | Decrease 100 BP | | | Base | | | Increase 200 BP | |
| | | | | | | | | | |
| Hypothetical Net Interest Income | | $ | 13,203 | | | $ | 13,156 | | | $ | 13,290 | |
| | | | | | | | | | | | | |
| Net Interest Income ($ change) | | | 47 | | | | — | | | | 134 | |
| | | | | | | | | | | | | |
| Net Interest Income (% change) | | | 0.4 | % | | | — | | | | (1.0 | )% |
| | | | | | | | | | | | | |
| Hypothetical Market Value of Equity | | $ | 38,653 | | | $ | 34,849 | | | $ | 31,238 | |
| | | | | | | | | | | | | |
| Market Value ($ Change) | | | 3,804 | | | | — | | | | (3,611 | ) |
| | | | | | | | | | | | | |
| Market Value (% Change) | | | 10.9 | % | | | — | | | | (10.4 | )% |
The interest rate risk position of the Company is slightly asset sensitive. Under the simulation modeling, the base is projected to increase over the first year; similarly, as rates fall, net interest income trends upward along with the base although not as rapidly. The floating rate non-maturity deposits and the short-term CD portfolio is overshadowed by the large base of floating rate loans.
While management carefully monitors the exposure to changes in interest rates and takes necessary actions as warranted to decrease any adverse impact, there can be no assurance on the actual effect on net interest income as a result of rate changes.
Impact of Inflation and Changing Prices
The financial statements and related data presented herein have been prepared in accordance with generally accepted accounting principles, which require the measurement of financial position and operating results in terms of historical dollars, without considering changes in the relative purchasing power of money over time due to inflation. Unlike most industrial companies, substantially all of our assets and liabilities are monetary in nature. As a result, interest rates have a more significant impact on our performance than the effects of general levels of inflation. Interest rates do not necessarily move in the same direction or in the same magnitude as the prices of goods and services, since such prices are affected by inflation to a larger extent than interest rates.
ITEM 8. FINANCIAL STATEMENTS AND SUPPLEMENTARY DATA
JACKSONVILLE BANCORP, INC. AND SUBSIDIARY
Index to Consolidated Financial Statements
| | Page |
| | |
| Report of Independent Registered Public Accounting Firm | F-1 |
| | |
| Consolidated Balance Sheets, December 31, 2008 and 2007 | F-2 |
| | |
| Consolidated Statements of Income for the Years Ended | |
| December 31, 2008, 2007 and 2006 | F-3 |
| | |
| Consolidated Statements of Changes in Shareholders' Equity for the | |
| Years Ended December 31, 2008, 2007 and 2006 | F-4 |
| | |
| Consolidated Statements of Cash Flows for the Years Ended | |
| December 31, 2008, 2007 and 2006 | F-5 |
| | |
| Notes to Consolidated Financial Statements | F-6 |
All schedules are omitted because of the absence of the conditions under which they are required or because the required information is included in the Consolidated Financial Statements and related Notes.
REPORT OF INDEPENDENT REGISTERED PUBLIC ACCOUNTING FIRM
Jacksonville Bancorp, Inc.
Jacksonville, Florida
We have audited the accompanying consolidated balance sheets of Jacksonville Bancorp, Inc. as of December 31, 2008 and 2007, and the related consolidated statements of income, changes in shareholders’ equity and cash flows for each of the years in the three-year period ended December 31, 2008. These financial statements are the responsibility of the Company's management. Our responsibility is to express an opinion on these financial statements based on our audits.
We conducted our audits in accordance with the standards of the Public Company Accounting Oversight Board (United States). Those standards require that we plan and perform the audit to obtain reasonable assurance about whether the financial statements are free of material misstatement. The Company is not required to have, nor were we engaged to perform, an audit of its internal control over financial reporting. Our audit included consideration of internal control over financial reporting as a basis for designing audit procedures that are appropriate in the circumstances, but not for the purpose of expressing an opinion on the effectiveness of the Company’s internal control over financial reporting. Accordingly, we express no such opinion. An audit includes examining, on a test basis, evidence supporting the amounts and disclosures in the financial statements. An audit also includes assessing the accounting principles used and significant estimates made by management, as well as evaluating the overall financial statement presentation. We believe that our audits provide a reasonable basis for our opinion.
In our opinion, the financial statements referred to above present fairly, in all material respects, the financial position of the Company as of December 31, 2008 and 2007, and the results of its operations and its cash flows for each of the years in the three-year period ended December 31, 2008, in conformity with accounting principles generally accepted in the United States of America.
Fort Lauderdale, Florida
March 20, 2009
JACKSONVILLE BANCORP, INC.
CONSOLIDATED BALANCE SHEETS
December 31,
(Dollar amounts in thousands except per share data)
| | | 2008 | | | 2007 | |
| ASSETS | | | | | | |
| Cash and due from financial institutions | | $ | 8,665 | | | $ | 5,584 | |
| Federal funds sold | | | 1,483 | | | | 451 | |
| | | | | | | | | |
| Cash and cash equivalents | | | 10,148 | | | | 6,035 | |
| | | | | | | | | |
| Securities available for sale | | | 29,684 | | | | 29,727 | |
| Securities held to maturity (fair value 2008—$50, 2007—$50) | | | 50 | | | | 50 | |
| Loans, net of allowance for loan losses of $4,705 | | | | | | | | |
| in 2008 and $3,116 in 2007 | | | 374,993 | | | | 339,265 | |
| Bank owned life insurance | | | 8,773 | | | | 5,010 | |
| Federal Home Loan Bank stock, at cost | | | 1,705 | | | | 3,638 | |
| Premises and equipment, net | | | 3,940 | | | | 4,342 | |
| Accrued interest receivable | | | 2,027 | | | | 2,275 | |
| Real estate owned, net | | | 89 | | | | — | |
| Deferred income taxes | | | 1,502 | | | | 807 | |
| Other assets | | | 1,088 | | | | 813 | |
| | | | | | | | | |
| Total assets | | $ | 433,999 | | | $ | 391,962 | |
| | | | | | | | | |
| LIABILITIES AND SHAREHOLDERS’ EQUITY | | | | | | | | |
| Deposits | | | | | | | | |
| Noninterest-bearing | | $ | 40,851 | | | $ | 35,382 | |
| Money market, NOW and savings deposits | | | 87,751 | | | | 116,181 | |
| Time deposits | | | 216,942 | | | | 137,330 | |
| Total deposits | | | 345,544 | | | | 288,893 | |
| Federal Home Loan Bank advances | | | 20,000 | | | | 67,830 | |
| Federal Reserve Borrowing | | | 26,000 | | | | - | |
| Subordinated debentures | | | 14,550 | | | | 7,000 | |
| Other liabilities | | | 1,060 | | | | 1,610 | |
| | | | | | | | | |
| Total liabilities | | | 407,154 | | | | 365,333 | |
| | | | | | | | | |
| Shareholders’ equity | | | | | | | | |
| Preferred stock, $.01 par value; 2,000,000 shares | | | | | | | | |
| authorized; none issued or outstanding | | | - | | | | - | |
| Common stock, $.01 par value; 8,000,000 shares | | | | | | | | |
| authorized; 1,748,799 and 1,747,981 shares issued | | | | | | | | |
| in 2008 and 2007 | | | 17 | | | | 17 | |
| Additional paid-in capital | | | 18,568 | | | | 18,459 | |
| Retained earnings | | | 8,213 | | | | 8,186 | |
| Treasury stock, at cost (2008—200 shares, 2007—1,650 shares) | | | (2 | ) | | | (40 | ) |
| Accumulated other comprehensive income | | | 49 | | | | 7 | |
| | | | | | | | | |
| Total shareholders’ equity | | | 26,845 | | | | 26,629 | |
| | | | | | | | | |
| Total liabilities and shareholders’ equity | | $ | 433,999 | | | $ | 391,962 | |
See accompanying notes to consolidated financial statements.
JACKSONVILLE BANCORP, INC.
CONSOLIDATED STATEMENTS OF INCOME
Years ended December 31,
(Dollar amounts in thousands except per share data)
| | | 2008 | | | 2007 | | | 2006 | |
| Interest and dividend income | | | | | | | | | |
| Loans, including fees | | $ | 24,109 | | | $ | 25,349 | | | $ | 20,654 | |
| Taxable securities | | | 1,021 | | | | 1,082 | | | | 979 | |
| Tax-exempt securities | | | 414 | | | | 317 | | | | 223 | |
| Federal funds sold and other | | | 19 | | | | 60 | | | | 161 | |
| Total interest income | | | 25,563 | | | | 26,808 | | | | 22,017 | |
| | | | | | | | | | | | | |
| Interest expense | | | | | | | | | | | | |
| Deposits | | | 11,336 | | | | 12,029 | | | | 9,622 | |
| Federal Home Loan Bank advances | | | 1,520 | | | | 1,817 | | | | 969 | |
| Subordinated debentures | | | 675 | | | | 559 | | | | 335 | |
| Federal Reserve borrowing | | | 23 | | | | - | | | | - | |
| Federal funds purchased and repurchase agreements | | | 6 | | | | 14 | | | | 19 | |
| Total interest expense | | | 13,560 | | | | 14,419 | | | | 10,945 | |
| | | | | | | | | | | | | |
| Net interest income | | | 12,003 | | | | 12,389 | | | | 11,072 | |
| | | | | | | | | | | | | |
| Provision for loan losses | | | 3,570 | | | | 542 | | | | 546 | |
| | | | | | | | | | | | | |
| Net interest income after provision for loan losses | | | 8,433 | | | | 11,847 | | | | 10,526 | |
| | | | | | | | | | | | | |
| Noninterest income | | | | | | | | | | | | |
| Service charges on deposit accounts | | | 678 | | | | 639 | | | | 555 | |
| Net gain on sales of loans | | | - | | | | 47 | | | | - | |
| Net loss on disposal of premises and equipment | | | - | | | | - | | | | (9 | ) |
| Other | | | 500 | | | | 498 | | | | 501 | |
| Total noninterest income | | | 1,178 | | | | 1,184 | | | | 1,047 | |
| | | | | | | | | | | | | |
| Noninterest expense | | | | | | | | | | | | |
| Salaries and employee benefits | | | 4,514 | | | | 4,281 | | | | 3,754 | |
| Occupancy and equipment | | | 1,653 | | | | 1,674 | | | | 1,468 | |
| Data processing | | | 794 | | | | 595 | | | | 501 | |
| Regulatory assessment | | | 417 | | | | 259 | | | | 88 | |
| Advertising and business development | | | 504 | | | | 517 | | | | 408 | |
| Professional fees | | | 626 | | | | 326 | | | | 372 | |
| Merger related costs | | | 468 | | | | - | | | | - | |
| Telephone | | | 128 | | | | 124 | | | | 98 | |
| Director fees | | | 92 | | | | 192 | | | | 268 | |
| Courier, freight and postage | | | 165 | | | | 158 | | | | 170 | |
| Other | | | 444 | | | | 359 | | | | 446 | |
| Total noninterest expense | | | 9,805 | | | | 8,485 | | | | 7,573 | |
| | | | | | | | | | | | | |
| Income before income taxes | | | (194 | ) | | | 4,546 | | | | 4,000 | |
| | | | | | | | | | | | | |
| Income tax expense | | | (229 | ) | | | 1,588 | | | | 1,477 | |
| | | | | | | | | | | | | |
| Net income | | $ | 35 | | | $ | 2,958 | | | $ | 2,523 | |
| | | | | | | | | | | | | |
| Earnings per share: | | | | | | | | | | | | |
| Basic | | $ | .02 | | | $ | 1.70 | | | $ | 1.46 | |
| Diluted | | $ | .02 | | | $ | 1.63 | | | $ | 1.39 | |
See accompanying notes to consolidated financial statements.
JACKSONVILLE BANCORP, INC.
CONSOLIDATED STATEMENTS OF CHANGES IN SHAREHOLDERS’ EQUITY
Years ended December 31,
(Dollar amounts in thousands except per share data)
| | | | | | | | | | | | | | | Accumulated | | | | |
| | | | | | Additional | | | | | | | | | Other | | | | |
| | | Common Stock | | | Paid-In | | | Retained | | | Treasury | | | Comprehensive | | | | |
| | | Shares | | | Amount | | | Capital | | | Earnings | | | Stock | | | Income (Loss) | | | Total | |
| Balance at December 31, 2005 | | | 1,714,716 | | | $ | 17 | | | $ | 17,526 | | | $ | 2,718 | | | $ | (54 | ) | | $ | (361 | ) | | $ | 19,846 | |
| Comprehensive income: | | | | | | | | | | | | | | | | | | | | | | | | | | | | |
| Net income | | | | | | | | | | | | | | | 2,523 | | | | | | | | | | | | 2,523 | |
| Change in unrealized gain (loss) on | | | | | | | | | | | | | | | | | | | | | | | | | | | | |
| securities available for sale, net of | | | | | | | | | | | | | | | | | | | | | | | | | | | | |
| sale, net of tax benefit | | | | | | | | | | | | | | | | | | | | | | | 68 | | | | 68 | |
| Total comprehensive income | | | | | | | | | | | | | | | | | | | | | | | | | | | 2,591 | |
| Share-based compensation | | | 6,900 | | | | | | | | 153 | | | | | | | | 228 | | | | | | | | 381 | |
| Purchase of treasury stock | | | (6,900 | ) | | | | | | | | | | | | | | | (231 | ) | | | | | | | (231 | ) |
| Exercise of common stock options, | | | | | | | | | | | | | | | | | | | | | | | | | | | | |
| including tax benefit of $212 | | | 26,972 | | | | | | | | 551 | | | | | | | | | | | | | | | | 551 | |
| | | | | | | | | | | | | | | | | | | | | | | | | | | | | |
| Balance at December 31, 2006 | | | 1,741,668 | | | | 17 | | | | 18,230 | | | | 5,241 | | | | (57 | ) | | | (293 | ) | | | 23,138 | |
| Comprehensive income: | | | | | | | | | | | | | | | | | | | | | | | | | | | | |
| Net income | | | | | | | | | | | | | | | 2,958 | | | | | | | | | | | | 2,958 | |
| Change in unrealized gain (loss) on | | | | | | | | | | | | | | | | | | | | | | | | | | | | |
| securities available for sale, net of | | | | | | | | | | | | | | | | | | | | | | | | | | | | |
| tax benefit | | | | | | | | | | | | | | | | | | | | | | | 300 | | | | 300 | |
| Total comprehensive income | | | | | | | | | | | | | | | | | | | | | | | | | | | 3,258 | |
| Share-based compensation | | | 6,600 | | | | | | | | 152 | | | | (13 | ) | | | 211 | | | | | | | | 350 | |
| Purchase of treasury stock | | | (6,600 | ) | | | | | | | | | | | | | | | (194 | ) | | | | | | | (194 | ) |
| Exercise of common stock options, | | | | | | | | | | | | | | | | | | | | | | | | | | | | |
| including tax benefit of $31 | | | 4,643 | | | | | | | | 77 | | | | | | | | | | | | | | | | 77 | |
| | | | | | | | | | | | | | | | | | | | | | | | | | | | | |
| Balance at December 31, 2007 | | | 1,746,331 | | | | 17 | | | | 18,459 | | | | 8,186 | | | | (40 | ) | | | 7 | | | | 26,629 | |
| Comprehensive income: | | | | | | | | | | | | | | | | | | | | | | | | | | | | |
| Net income | | | | | | | | | | | | | | | 35 | | | | | | | | | | | | 35 | |
| Change in unrealized gain (loss) on | | | | | | | | | | | | | | | | | | | | | | | | | | | | |
| securities available for sale, net of | | | | | | | | | | | | | | | | | | | | | | | | | | | | |
| tax benefits | | | | | | | | | | | | | | | | | | | | | | | 42 | | | | 42 | |
| Total comprehensive income | | | | | | | | | | | | | | | | | | | | | | | | | | | 77 | |
| Share-based compensation | | | 5,847 | | | | | | | | 106 | | | | (8 | ) | | | 117 | | | | | | | | 215 | |
| Purchase of treasury stock | | | (4,397 | ) | | | | | | | | | | | | | | | (79 | ) | | | | | | | (79 | ) |
| Issuance of common stock | | | 618 | | | | | | | | | | | | | | | | | | | | | | | | - | |
| Exercise of common stock options, | | | | | | | | | | | | | | | | | | | | | | | | | | | | |
| including tax benefit of $1 | | | 200 | | | | | | | | 3 | | | | | | | | | | | | | | | | 3 | |
| | | | | | | | | | | | | | | | | | | | | | | | | | | | | |
| Balance at December 31, 2008 | | | 1,748,599 | | | $ | 17 | | | $ | 18,568 | | | $ | 8,213 | | | $ | (2 | ) | | $ | 49 | | | $ | 26,845 | |
JACKSONVILLE BANCORP, INC.
CONSOLIDATED STATEMENTS OF CASH FLOWS
Years ended December 31,
(Dollar amounts in thousands except per share data)
| | | 2008 | | | 2007 | | | 2006 | |
| Cash flows from operating activities | | | | | | | | | |
| Net income | | $ | 35 | | | $ | 2,958 | | | $ | 2,523 | |
| Adjustments to reconcile net income to net cash from operating activities | | | | | | | | | | | | |
| Provision for loan losses | | | 3,570 | | | | 542 | | | | 546 | |
| Depreciation and amortization | | | 515 | | | | 553 | | | | 526 | |
| Earnings on Bank owned life insurance | | | (263 | ) | | | (173 | ) | | | (202 | ) |
| Share-based compensation | | | 215 | | | | 350 | | | | 381 | |
| Loss on disposal of premises and equipment | | | 38 | | | | — | | | | 9 | |
| Deferred income tax (benefit) expense | | | (720 | ) | | | (317 | ) | | | (306 | ) |
| Net gain on sale of loan | | | — | | | | (47 | ) | | | — | |
| Net amortization of deferred loan fees | | | 47 | | | | 79 | | | | (199 | ) |
| Net amortization (accretion) of securities | | | (16 | ) | | | 16 | | | | 37 | |
| Net change in: | | | | | | | | | | | | |
| Other assets | | | (254 | ) | | | (330 | ) | | | (856 | ) |
| Accrued expenses and other liabilities | | | (550 | ) | | | 631 | | | | (300 | ) |
| Net cash from operating activities | | | 2,617 | | | | 4,262 | | | | 2,159 | |
| | | | | | | | | | | | | |
| Cash flows from investing activities | | | | | | | | | | | | |
| Available for sale securities: | | | | | | | | | | | | |
| Sales | | | — | | | | — | | | | — | |
| Maturities, prepayments and calls | | | 6,228 | | | | 5,293 | | | | 3,427 | |
| Purchases | | | (6,102 | ) | | | (8,496 | ) | | | (5,203 | ) |
| Loan originations and payments, net | | | (39,256 | ) | | | (58,880 | ) | | | (49,322 | ) |
| Purchase of Bank owned life insurance | | | (3,500 | ) | | | — | | | | — | |
| Additions to premises and equipment | | | (102 | ) | | | (203 | ) | | | (1,258 | ) |
Purchase of Federal Home Loan Bank stock, net of redemptions | | | 1,933 | | | | (2,567 | ) | | | (9 | ) |
| Net cash from investing activities | | | (40,799 | ) | | | (64,853 | ) | | | (52,365 | ) |
| | | | | | | | | | | | | |
| Cash flows from financing activities | | | | | | | | | | | | |
| Net change in deposits | | | 56,651 | | | | 6,267 | | | | 48,415 | |
| Net change in federal funds purchased | | | — | | | | (182 | ) | | | 182 | |
| Net change in short-term Federal Home Loan Bank advances | | | (28,830 | ) | | | 20,180 | | | | (2,000 | ) |
| Net change in Federal Reserve borrowing | | | 26,000 | | | | — | | | | — | |
| Proceeds from issuance of subordinated debt | | | 7,550 | | | | — | | | | 3,000 | |
| Net change in fixed rate Federal Home Loan Bank advances | | | (19,000 | ) | | | 16,000 | | | | — | |
| Proceeds from convertible Federal Home Loan Bank accounts | | | — | | | | 20,000 | | | | — | |
| Proceeds from exercise of common stock options | | | 3 | | | | 46 | | | | 339 | |
| Excess tax benefits from share-based payment arrangements | | | — | | | | 31 | | | | 212 | |
| Purchase of treasury stock | | | (79 | ) | | | (194 | ) | | | (231 | ) |
| Net cash from financing activities | | | 42,295 | | | | 62,148 | | | | 49,917 | |
| | | | | | | | | | | | | |
| Net change in cash and cash equivalents | | | 4,113 | | | | 1,557 | | | | (289 | ) |
| | | | | | | | | | | | | |
| Beginning cash and cash equivalents | | | 6,035 | | | | 4,478 | | | | 4,767 | |
| | | | | | | | | | | | | |
| Ending cash and cash equivalents | | $ | 10,148 | | | $ | 6,035 | | | $ | 4,478 | |
| | | | | | | | | | | | | |
| Supplemental disclosure of cash flow information: | | | | | | | | | | | | |
| Interest paid | | $ | 13,700 | | | $ | 13,970 | | | $ | 10,849 | |
| Income taxes paid | | | 835 | | | | 1,620 | | | | 2,162 | |
| | | | | | | | | | | | | |
| Supplemental schedule of noncash investing activities: | | | | | | | | | | | | |
| Acquisition of real estate | | $ | 89 | | | $ | — | | | $ | — | |
See accompanying notes to consolidated financial statements.
NOTE 1 - SUMMARY OF SIGNIFICANT ACCOUNTING POLICIES
(Dollar amounts in thousands except per share data)
Nature of Operations and Principles of Consolidation: Jacksonville Bancorp, Inc. (“Bancorp”) is a financial holding company headquartered in Jacksonville, Florida. The consolidated financial statements include the accounts of Jacksonville Bancorp, Inc. and its wholly owned, primary operating subsidiary, The Jacksonville Bank, and The Jacksonville Bank’s wholly owned subsidiary, Fountain Financial, Inc. The consolidated entity is referred to as the “Company,” and The Jacksonville Bank and its subsidiary are collectively referred to as the “Bank.” The Company’s financial condition and operating results principally reflect those of the Bank. All intercompany transactions and balances are eliminated in consolidation.
The Company currently provides financial services through its five offices in Jacksonville, Duval County, Florida. Our primary business segment is community banking and consists of attracting deposits from the general public and using such deposits and other sources of funds to originate commercial business loans, commercial real estate loans, residential mortgage loans and a variety of consumer loans. Substantially all loans are secured by specific items of collateral, including business assets, consumer assets, and commercial and residential real estate. Commercial loans are expected to be repaid from cash flow from operations of businesses. There are no significant concentrations of loans to any one industry or customer. However, the customers’ ability to repay their loans is dependent on the real estate and general economic conditions in the area.
Use of Estimates: To prepare financial statements in conformity with U.S. generally accepted accounting principles, management makes estimates and assumptions based on available information. These estimates and assumptions affect the amounts reported in the financial statements and the disclosures provided, and actual results could differ from those estimates. Changes in assumptions or in market conditions could significantly affect the estimates. The allowance for loan losses and fair values of financial instruments are particularly subject to change.
Cash Flows: For the purposes of the consolidated statements of cash flows, cash and cash equivalents include cash on hand, noninterest-bearing deposits with other financial institutions under 90 days and federal funds sold. Net cash flows are reported for customer loan and deposit transactions, interest-bearing deposits in other financial institutions, short-term Federal Home Loan Bank (FHLB) advances, federal funds purchased, Federal Reserve discount window and other borrowings.
Advertising Costs: Advertising costs are expensed as incurred.
Securities: Debt securities are classified as held to maturity and carried at amortized cost when management has the positive intent and ability to hold them to maturity. Debt securities are classified as available for sale when they might be sold before maturity. Equity securities with readily determinable fair values are classified as available for sale. Securities available for sale are carried at fair value, with unrealized holding gains and losses reported in other comprehensive income, net of tax. Other securities, such as FHLB stock, are carried at cost.
Interest income includes amortization of purchase premiums and accretion of purchase discounts. Premiums and discounts on securities are amortized on the level yield without anticipating prepayments, except for mortgage-backed securities where prepayments are anticipated. Gains and losses are recorded on the trade date and determined using the specific identification method.
Declines in the fair value of securities below their cost that are other-than-temporary are reflected as realized losses. In estimating other-than-temporary losses, management considers: the length of time and extent that fair value has been less than cost; the financial condition and near term prospects of the issuer; and the Company’s ability and intent to hold the security for a period sufficient to allow for any anticipated recovery in fair value.
Loans: Loans that management has the intent and ability to hold for the foreseeable future or until maturity or payoff are reported at the principal balance outstanding, net of deferred loan fees and costs, and allowance for loan losses. Interest income is accrued on the unpaid principal balance. Loan origination fees, net of certain direct origination costs, are deferred and recognized in interest income using the level-yield method without anticipating prepayments.
NOTE 1 - SUMMARY OF SIGNIFICANT ACCOUNTING POLICIES (Continued)
(Dollar amounts in thousands except per share data)
Interest income on mortgage and commercial loans is discontinued at the time the loan is 90 days delinquent unless the loan is well secured and in process of collection. Unsecured consumer loans are typically charged off when the loan becomes 90 days past due. Consumer loans secured by collateral other than real estate are charged off after a review of all factors affecting the ability to collect on the loan, including the borrower’s character, overall financial condition, resources and payment record, the prospects for support from any financially responsible guarantors, and the realizable value of any collateral. Past due status is based on the contractual terms of the loan. In all cases, loans are placed on nonaccrual or charged off at an earlier date if collection of principal or interest is considered doubtful.
All interest accrued but not received for loans placed on nonaccrual is reversed against interest income. Interest received on such loans is accounted for on the cash-basis or cost-recovery method, until qualifying for return to accrual. Loans are returned to accrual status when all the principal and interest amounts contractually due are brought current and future payments are reasonably assured.
Overdrawn customer checking accounts are reclassified as consumer loans and are evaluated on an individual basis for collectability. The balances, which totaled $198,000 and $377,000 at December 31, 2008 and 2007, respectively, are included in the estimate of allowance for loan losses and are charged off when collectability is considered doubtful.
Most of the Company’s business activity is with customers located in Duval County. Therefore, the Company’s exposure to credit risk is significantly affected by changes in the economy in Duval County.
Allowance for Loan Losses: The allowance for loan losses is a valuation allowance for probable incurred credit losses. Loan losses are charged against the allowance when management believes the uncollectibility of a loan balance is confirmed. Subsequent recoveries, if any, are credited to the allowance. Management estimates the allowance balance required using past loan loss experience, the nature and volume of the portfolio, information about specific borrower situations and estimated collateral values, economic conditions, and other factors. Allocations of the allowance may be made for specific loans, but the entire allowance is available for any loan that, in management’s judgment, should be charged off.
The allowance consists of specific and general components. The specific component relates to loans that are individually classified as impaired or loans otherwise classified as special mention, substandard or doubtful. The general component covers non-classified loans by loan type and is based on historical loss experience for each loan type adjusted for current factors.
A loan is impaired when full payment under the loan terms is not expected. Commercial and commercial real estate loans and certain residential real estate loans above $100,000 are individually evaluated for impairment. If a loan is impaired, a portion of the allowance may be allocated so that the loan is reported, net, at the present value of estimated future cash flows using the loan’s existing rate or at the fair value of collateral if repayment is expected solely from the sale of the collateral. Large groups of smaller balance homogeneous loans, such as consumer and residential real estate loans, are collectively evaluated for impairment and, accordingly, they are not separately identified for impairment disclosures.
Foreclosed Assets: Assets acquired through or in place of loan foreclosure are initially recorded at fair value less estimated costs to sell when acquired, establishing a new cost basis. If fair value declines subsequent to foreclosure, a valuation allowance is recorded through expense. Costs incurred after acquisition are expensed.
Premises and Equipment: Land is carried at cost. Premises and equipment are stated at cost less accumulated depreciation. Buildings and related components are depreciated using the straight-line method with useful lives ranging from 5 to 40 years. Furniture, fixtures and equipment are depreciated using the straight-line method with useful lives ranging from 3 to 10 years.
NOTE 1 - SUMMARY OF SIGNIFICANT ACCOUNTING POLICIES (Continued)
(Dollar amounts in thousands except per share data)
Other Real Estate Owned: Other real estate owned includes real estate acquired through foreclosure or deed taken in lieu of foreclosure. These amounts are recorded at estimated fair value, less costs to sell the property, with any difference between the fair value of the property and the carrying value of the loan being charged to the allowance for loan losses. Subsequent changes in fair value are reported as adjustments to the carrying amount, not to exceed the initial carrying value of the assets at the time of transfer. Those subsequent changes, as well as any gains or losses recognized on the sale of these properties, are included in noninterest expense.
Federal Home Loan (FHLB) Stock: The Bank is a member of the FHLB system. Members are required to own a certain amount of stock based on the level of borrowings and other factors, and may invest in additional amounts. FHLB stock is carried at cost, classified as a restricted security and periodically evaluated for impairment based on ultimate recovery of par value. Both cash and stock dividends are reported as income.
Long-term Assets: Premises and equipment and other long-term assets are reviewed for impairment when events indicate their carrying amount may not be recoverable from future undiscounted cash flows. If impaired, the assets are recorded at fair value.
Loan Commitments and Related Financial Instruments: Financial instruments include off-balance-sheet credit instruments, such as commitments to make loans and commercial letters of credit, issued to meet customer financing needs. The face amount for these items represents the exposure to loss, before considering customer collateral or ability to repay. Such financial instruments are recorded when they are funded.
Bank Owned Life Insurance: The Bank has purchased life insurance policies on certain key employees. Bank owned life insurance is recorded at its cash surrender value or its realizable value. Changes in cash surrender value are recognized as tax-free noninterest income and are included in other income on the Consolidated Statements of Income. In accordance with EITF 06-05, bank owned life insurance is recorded at the amount that can be realized under the insurance contract at the balance sheet date, which is the cash surrender value adjusted for other charges or other amounts due that are probable at settlement.
Stock Compensation: Compensation cost is recognized for stock options and restricted stock awards issued to employees, based on the fair value of these awards at the date of grant. A Black-Scholes model is utilized to estimate the fair value of stock options, while the market price of the Corporation’s common stock at the date of grant is used for restricted stock awards. Compensation cost is recognized over the required service period, generally defined as the vesting period. For awards with graded vesting, compensation cost is recognized on a straight-line basis over the requisite service period for the entire award.
Income Taxes: Income tax expense is the total of the current year income tax due or refundable and the change in deferred tax assets and liabilities. Deferred tax assets and liabilities are the expected future tax amounts for the temporary differences between carrying amounts and tax bases of assets and liabilities, computed using enacted tax rates. A valuation allowance, if needed, reduces deferred tax assets to the amount expected to be realized. The Company adopted FASB Interpretation 48, Accounting for Uncertainty in Income Taxes (“FIN 48”), as of January 1, 2007. A tax position is recognized as a benefit only if it is “more likely than not” that the tax position would be sustained in a tax examination, with a tax examination being presumed to occur. The amount recognized is the largest amount of tax benefit that is greater than 50% likely of being realized on examination. For tax positions not meeting the “more likely than not” test, no tax benefit is recorded. The adoption had no effect on the Company’s financial statements. These returns are subject to examination by taxing authorities for all years after 2002.
Earnings Per Common Share: Basic earnings per common share is net income divided by the weighted average number of common shares outstanding during the period. Diluted earnings per common share includes the dilutive effect of additional potential common shares issuable under stock options.
The effect of stock options and warrants is the sole common stock equivalent for the purposes of calculating diluted earnings per common share.
NOTE 1 - SUMMARY OF SIGNIFICANT ACCOUNTING POLICIES (Continued)
(Dollar amounts in thousands except per share data)
Comprehensive Income: Comprehensive income consists of net income and other comprehensive income. Other comprehensive income includes unrealized gains and losses on securities available for sale which are also recognized as separate components of equity.
Treasury Stock: Treasury stock is carried at cost. Gains and losses on issuances are based on the market price of the underlying common stock at the date of issuance and are determined using the first-in, first-out (FIFO) method. Gains on issuances are credited to additional paid-in capital while losses are charged to additional paid-in capital to the extent that previous net gains from issuances are included therein, otherwise to retained earnings. Gains or losses on the issuances of treasury stock are not credited or charged to income.
Loss Contingencies: Loss contingencies, including claims and legal actions arising in the ordinary course of business, are recorded as liabilities when the likelihood of loss is probable and an amount or range of loss can be reasonably estimated. Management does not believe there now are such matters that will have a material effect on the financial statements.
Restrictions on Cash: Cash on hand or on deposit with the Federal Reserve Bank was required to meet regulatory reserve and clearing requirements.
Dividend Restrictions: Bank regulations require maintaining certain capital levels and may limit the dividends paid by the Bank to the holding company or by the holding company to the shareholders.
Fair Value of Financial Instruments: Fair values of financial instruments are estimated using relevant market information and other assumptions, as more fully disclosed in a separate note. Fair value estimates involve uncertainties and matters of significant judgment regarding interest rates, credit risk, prepayments, and other factors, especially in the absence of broad markets for particular items. Changes in assumptions or in market conditions could significantly affect the estimates.
Operating Segments: While the chief decision makers monitor the revenue streams of the various products and services, operations are managed and financial performance is evaluated on a Company-wide basis. Accordingly, all of the financial service operations are considered by management to be aggregated into one reportable operating segment.
Reclassifications: Some items in the prior year financial statements were reclassified to conform to the current presentation.
Adoption of New Accounting Standards:
In September 2006, the FASB issued Statement No. 157, Fair Value Measurements, which defines fair value, establishes a framework for measuring fair value and expands disclosures about fair value measurements. This statement establishes a fair value hierarchy about the assumptions used to measure fair value and clarifies assumptions about risk and the effect of a restriction on the sale or use of an asset. The standard is effective for fiscal years beginning after November 15, 2007. In February 2008, the FASB issued Staff Position (FSP) 157-2, Effective Date of FASB Statement No. 157. This FSP delays the effective date of FAS 157 for all nonfinancial assets and nonfinancial liabilities, except those that are recognized or disclosed at fair value on a recurring basis (at least annually) to fiscal years beginning after November 15, 2008, and interim periods within those fiscal years. The impact of adoption was not material. In October 2008, the FASB issued Staff Position (FSP) 157-3, Determining the Fair Value of a Financial Asset when the Market for That Asset Is Not Active. This FSP clarifies the application of FAS 157 in a market that is not active. The impact of adoption was not material.
In February 2007, the FASB issued Statement No. 159, The Fair Value Option for Financial Assets and Financial Liabilities. The standard provides companies with an option to report selected financial assets and liabilities at fair value and establishes presentation and disclosure requirements designed to facilitate comparisons between companies that choose different measurement attributes for similar types of assets and liabilities. The new standard is effective for the Company on January 1, 2008. The Company did not elect the fair value option for any financial assets or financial liabilities as of January 1, 2008.
NOTE 1 - SUMMARY OF SIGNIFICANT ACCOUNTING POLICIES (Continued)
(Dollar amounts in thousands except per share data)
In December 2007, the SEC issued SAB No. 110, which expresses the views of the SEC regarding the use of a “simplified” method, as discussed in SAB No. 107, in developing an estimate of expected term of “plain vanilla” share options in accordance with SFAS No. 123(R), Share-Based Payment. The SEC concluded that a company could, under certain circumstances, continue to use the simplified method for share option grants after December 31, 2007. The Company does not use the simplified method for share options and, therefore, SAB No. 110 has no impact on the Company’s consolidated financial statements.
NOTE 2 - SECURITIES
(Dollar amounts in thousands except per share data)
The fair value of available for sale securities and the related gross unrealized gains and losses recognized in accumulated other comprehensive income (loss) were as follows:
| | | | | | Gross | | | Gross | |
| | | Fair | | | Unrealized | | | Unrealized | |
| | | Value | | | Gains | | | Losses | |
| | | | | | | | | | |
| 2008 | | | | | | | | | |
| U.S. Treasury and federal agency | | $ | 8,284 | | | $ | 91 | | | $ | (11 | ) |
| Mortgage-backed | | | 10,622 | | | | 199 | | | | (60 | ) |
| State and county municipal | | | 10,778 | | | | 121 | | | | (262 | ) |
| | | | | | | | | | | | | |
| Total | | $ | 29,684 | | | $ | 411 | | | $ | (333 | ) |
| | | | | | | | | | | | | |
| 2007 | | | | | | | | | | | | |
| U.S. Treasury and federal agency | | $ | 8,000 | | | $ | 68 | | | $ | (49 | ) |
| Mortgage-backed | | | 10,768 | | | | 50 | | | | (78 | ) |
| State and county municipal | | | 10,959 | | | | 58 | | | | (38 | ) |
| | | | | | | | | | | | | |
| Total | | $ | 29,727 | | | $ | 176 | | | $ | (165 | ) |
The carrying amount, unrecognized gains and losses, and fair value of securities held to maturity were as follows:
| | | | | | Gross | | | Gross | | | | |
| | | Carrying | | | Unrecognized | | | Unrecognized | | | Fair | |
| | | Amount | | | Gains | | | Losses | | | Value | |
| | | | | | | | | | | | | |
| 2008 | | | | | | | | | | | | |
| Other | | $ | 50 | | | $ | - | | | $ | - | | | $ | 50 | |
| | | | | | | | | | | | | | | | | |
| 2007 | | | | | | | | | | | | | | | | |
| Other | | $ | 50 | | | $ | - | | | $ | - | | | $ | 50 | |
There were no sales of available for sale securities in 2008, 2007 and 2006.
NOTE 2 – SECURITIES (Continued)
(Dollar amounts in thousands except per share data)
The fair value of debt securities and carrying amount, if different, at year end 2008 by contractual maturity were as follows. Securities not due at a single maturity date, primarily mortgage-backed securities, are shown separately.
| | | | | | | | | Available | |
| | | Held-to-maturity | | | for sale | |
| | | Carrying | | | Fair | | | Fair | |
| | | Amount | | | Value | | | Value | |
| | | | | | | | | | |
| Due in one year or less | | $ | 50 | | | $ | 50 | | | $ | - | |
| Due from one to five years | | | - | | | | - | | | | 3,703 | |
| Due from five to ten years | | | - | | | | - | | | | 9,375 | |
| Due after ten years | | | - | | | | - | | | | 5,984 | |
| Mortgage-backed | | | - | | | | - | | | | 10,622 | |
| | | | | | | | | | | | | |
| Total | | $ | 50 | | | $ | 50 | | | $ | 29,684 | |
There were no securities pledged at year end 2008 and 2007 nor were there any holdings of securities of any one issuer, other than the U.S. Government and its agencies, in an amount greater than 10% of shareholders’ equity.
Securities with unrealized losses at year end 2008 and 2007, aggregated by investment category and length of time that individual securities have been in a continuous unrealized loss position, are as follows:
| | | Less than 12 Months | | | 12 Months or More | | | Total | |
| | | Fair | | | Unrealized | | | Fair | | | Unrealized | | | Fair | | | Unrealized | |
| | | Value | | | Loss | | | Value | | | Loss | | | Value | | | Loss | |
| 2008 | | | | | | | | | | | | | | | | | | |
| | | | | | | | | | | | | | | | | | | |
| U.S. Treasury and federal agency | | $ | 739 | | | $ | (11 | ) | | $ | — | | | $ | — | | | $ | 739 | | | $ | (11 | ) |
| Mortgage-backed | | | 1,953 | | | | (58 | ) | | | 723 | | | | (2 | ) | | | 2,676 | | | | (60 | ) |
| State and county municipal | | | 5,487 | | | | (262 | ) | | | — | | | | — | | | | 5,487 | | | | (262 | ) |
| | | | | | | | | | | | | | | | | | | | | | | | | |
| Total temporarily impaired | | $ | 8,179 | | | $ | (331 | ) | | $ | 723 | | | $ | (2 | ) | | $ | 8,902 | | | $ | (333 | ) |
| | | | | | | | | | | | | | | | | | | | | | | | | |
| 2007 | | | | | | | | | | | | | | | | | | | | | | | | |
| | | | | | | | | | | | | | | | | | | | | | | | | |
| U.S. Treasury and federal agency | | $ | 500 | | | $ | — | | | $ | 3,948 | | | $ | (49 | ) | | $ | 4,448 | | | $ | (49 | ) |
| Mortgage-backed | | | 3,483 | | | | (20 | ) | | | 3,675 | | | | (58 | ) | | | 7,158 | | | | (78 | ) |
| State and county municipal | | | 1,809 | | | | (25 | ) | | | 2,691 | | | | (13 | ) | | | 4,500 | | | | (38 | ) |
| | | | | | | | | | | | | | | | | | | | | | | | | |
| Total temporarily impaired | | $ | 5,792 | | | $ | (45 | ) | | $ | 10,314 | | | $ | (120 | ) | | $ | 16,106 | | | $ | (165 | ) |
The Company evaluates securities for other-than-temporary impairment at least on a quarterly basis, and more frequently when economic or market concerns warrant such evaluation. Consideration is given to the length of time and the extent to which the fair value has been less than cost, the financial condition and near-term prospects of the issuer, and the intent and ability of the Company to retain its investment in the issuer for a period of time sufficient to allow for any anticipated recovery in fair value. In analyzing an issuer’s financial condition, the Company may consider whether the securities are issued by the federal government or its agencies, whether downgrades by bond rating agencies have occurred, and the results of reviews of the issuer’s financial condition.
The Company views these unrealized losses to be temporary in nature. The driving factor behind the reduction in fair value below cost is the increase in market interest rates, not the credit quality of the debt securities, most of which are rated Aaa or higher and have not been downgraded. The Company’s portfolio value has increased 0.27% over its amortized cost which is consistent with normal fluctuations of value due to changes in interest rates. The Company expects that the value of its portfolio will recover over time as the debt securities approach maturity. As management has the ability to hold these securities for the foreseeable future as they are classified as available for sale, no declines are deemed to be other-than-temporary.
NOTE 3 – LOANS
(Dollar amounts in thousands except per share data)
Loans at year end were as follows:
| | | 2008 | | | 2007 | |
| | | | | | | |
| Commercial | | $ | 28,445 | | | $ | 20,291 | |
| Real estate: | | | | | | | | |
| Residential | | | 81,152 | | | | 75,141 | |
| Commercial | | | 224,677 | | | | 210,614 | |
| Construction | | | 41,759 | | | | 29,737 | |
| Farmland | | | — | | | | 2,325 | |
| Consumer | | | 4,070 | | | | 4,631 | |
| Subtotal | | | 380,103 | | | | 342,739 | |
| Less: Net deferred loan fees | | | (405 | ) | | | (358 | ) |
| Allowance for loan losses | | | (4,705 | ) | | | (3,116 | ) |
| | | | | | | | | |
| Loans, net | | $ | 374,993 | | | $ | 339,265 | |
Activity in the allowance for loan losses was as follows:
| | | 2008 | | | 2007 | | | 2006 | |
| | | | | | | | | | |
| Beginning balance | | $ | 3,116 | | | $ | 2,621 | | | $ | 2,207 | |
| Provision for loan losses | | | 3,570 | | | | 542 | | | | 546 | |
| Loans charged off | | | (2,095 | ) | | | (71 | ) | | | (140 | ) |
| Recoveries | | | 114 | | | | 24 | | | | 8 | |
| Ending balance | | $ | 4,705 | | | $ | 3,116 | | | $ | 2,621 | |
Impaired loans were as follows:
| | | 2008 | | | 2007 | |
| Year-end loans with no allocated allowance for loan losses | | $ | 12,931 | | | $ | 567 | |
| Year-end loans with allocated allowance for loan losses | | | 4,352 | | | | 100 | |
| | | | | | | | | |
| Total | | $ | 17,283 | | | $ | 667 | |
| | | | | | | | | |
| Amount of the allowance for loan losses allocated | | $ | 618 | | | $ | 50 | |
| | | 2008 | | | 2007 | | | 2006 | |
| | | | | | | | | | |
| Average of impaired loans during the year | | $ | 7,295 | | | $ | 566 | | | $ | 408 | |
| Interest income recognized during impairment | | | 136 | | | | 2 | | | | 25 | |
| Cash-basis interest income recognized | | | 116 | | | | 2 | | | | 23 | |
Nonaccrual loans and loans past due 90 days still on accrual were as follows:
| | | 2008 | | | 2007 | |
| | | | | | | |
| Loans past due over 90 days still on accrual | | $ | — | | | $ | — | |
| Nonaccrual loans | | | 12,436 | | | | 690 | |
Nonaccrual loans and loans past due 90 days still on accrual include both smaller balance homogeneous loans that are collectively evaluated for impairment and individually classified impaired loans.
NOTE 4 - PREMISES AND EQUIPMENT
(Dollar amounts in thousands except per share data)
Year-end premises and equipment were as follows:
| | | 2008 | | | 2007 | |
| | | | | | | |
| Land | | $ | 1,075 | | | $ | 1,075 | |
| Buildings | | | 1,356 | | | | 1,383 | |
| Furniture, fixtures and equipment | | | 1,784 | | | | 1,904 | |
| Leasehold improvements | | | 1,939 | | | | 1,924 | |
| Construction in process | | | 9 | | | | — | |
| | | | | | | | | |
| Total | | | 6,163 | | | | 6,286 | |
| | | | | | | | | |
| Less: Accumulated depreciation | | | (2,223 | ) | | | (1,944 | ) |
| | | | | | | | | |
| Net Premises and equipment | | $ | 3,940 | | | $ | 4,342 | |
Depreciation expense, including amortization of leasehold improvements, was $457, $466 and $418 for the years ended December 31, 2008, 2007 and 2006, respectively.
Operating Leases: The Company leases certain office facilities under operating leases that generally contain annual escalation clauses and renewal options. Rent expense was $689, $674 and $670 for 2008, 2007 and 2006, respectively. Rent commitments under noncancelable operating leases, before considering renewal options that generally are present, were as follows:
| 2009 | | $ | 682 | |
| 2010 | | | 693 | |
| 2011 | | | 704 | |
| 2012 | | | 716 | |
| 2013 | | | 727 | |
| Thereafter | | | 980 | |
| Total | | $ | 4,502 | |
NOTE 5 - DEPOSITS
(Dollar amounts in thousands except per share data)
Time deposits of $100,000 or more were $74,273 and $43,370 at year end 2008 and 2007.
Scheduled maturities of time deposits for the next five years were as follows:
| 2009 | | $ | 174,704 | |
| 2010 | | | 30,149 | |
| 2011 | | | 10,720 | |
| 2012 | | | 657 | |
| 2013 | | | 712 | |
| Thereafter | | | — | |
NOTE 6 – SHORT-TERM BORROWINGS AND FEDERAL HOME LOAN BANK ADVANCES
(Dollar amounts in thousands except per share data)
At year end, advances from FHLB were as follows:
| | | 2008 | | | 2007 | |
| | | | | | | |
| Overnight advance maturing daily at a daily variable interest rate of 4.40% at December 31, 2007 | | $ | — | | | $ | 28,830 | |
| Advances maturing January 11, 2008 at a fixed rate of 5.26% | | | — | | | | 6,000 | |
| Advances maturing January 26, 2008 at a fixed rate of 4.65% | | | — | | | | 5,000 | |
| Advances maturing April 11, 2008 at a fixed rate of 4.36% | | | — | | | | 3,000 | |
| Advances maturing July 26, 2008 at a fixed rate of 4.59% | | | — | | | | 5,000 | |
| Convertible advances maturing June 8, 2012 with a quarterly call option beginning September 10, 2007 at a fixed rate of 4.68% | | | 5,000 | | | | 5,000 | |
| Convertible advances maturing June 8, 2010 with a quarterly call option beginning June 9, 2008 at a fixed rate of 4.99% | | | 5,000 | | | | 5,000 | |
| Convertible advances maturing August 13, 2010 with a quarterly call option beginning August 13, 2008 at a fixed rate of 4.51% | | | 5,000 | | | | 5,000 | |
| Convertible advances maturing October 4, 2010 with a quarterly call option beginning October 6, 2008 at a fixed rate of 4.15% | | | 5,000 | | | | 5,000 | |
| | | $ | 20,000 | | | $ | 67,830 | |
Each advance is payable at its maturity date, with a prepayment penalty. The advances were collateralized by a blanket lien arrangement of the Company’s first mortgage loans, second mortgage loans and commercial real estate loans.
During the year, the Company established a “Borrower in Custody” line of credit with the Federal Reserve Bank by pledging excess collateral. The amount of this line at December 31, 2008 was $45.6 million, of which it had borrowed $26.0 million.
NOTE 7 – SUBORDINATED DEBENTURES
(Dollar amounts in thousands except per share data)
On June 17, 2004, the Company participated in a pooled offering of trust preferred securities. Bancorp formed Jacksonville Statutory Trust I (the "Trust I"), a wholly owned statutory trust subsidiary for the purpose of issuing the trust preferred securities. The Trust I used the proceeds from the issuance of $4 million in trust preferred securities to acquire junior subordinated debentures of Bancorp. The trust preferred securities essentially mirror the debt securities, carrying a cumulative preferred dividend at a variable rate equal to the interest rate on the debt securities (three-month LIBOR plus 263 basis points). The initial rate in effect at the time of issuance was 4.06% and is subject to change quarterly. The rate in effect at December 31, 2008 was 4.50%.
On December 14, 2006, the Company participated in a pooled offering of trust preferred securities. Bancorp formed Jacksonville Statutory Trust II (the "Trust II"), a wholly owned statutory trust subsidiary for the purpose of issuing the trust preferred securities. The Trust II used the proceeds from the issuance of $3 million in trust preferred securities to acquire junior subordinated debentures of Bancorp. The trust preferred securities essentially mirror the debt securities, carrying a cumulative preferred dividend at a variable rate equal to the interest rate on the debt securities (three-month LIBOR plus 173 basis points). The initial rate in effect at the time of issuance was 7.08% and is subject to change quarterly. The rate in effect at December 31, 2008 was 3.73%.
NOTE 7 – SUBORDINATED DEBENTURES (Continued)
(Dollar amounts in thousands except per share data)
On June 20, 2008, the Company participated in a pooled offering of trust preferred securities. Bancorp formed Jacksonville Bancorp, Inc. Statutory Trust III (the "Trust III"), a wholly owned statutory trust subsidiary for the purpose of issuing the trust preferred securities. The Trust III used the proceeds from the issuance of $7.6 million in trust preferred securities to acquire junior subordinated debentures of Bancorp. The trust preferred securities essentially mirror the debt securities, carrying a cumulative preferred dividend at a variable rate equal to the interest rate on the debt securities (three-month LIBOR plus 375 basis points). The initial rate in effect at the time of issuance was 6.55% and is subject to change quarterly. The rate in effect at December 31, 2008 was 5.75%.
The debt securities and the trust preferred securities under the three offerings each have 30-year lives. The trust preferred securities and the debt securities are callable by Bancorp or the trust, at their respective option after five years, and at varying premiums and sooner upon the occurrence of specific events, subject to prior approval by the Federal Reserve Board, if then required. In addition, the debt securities and trust preferred securities allow the deferral of interest payments for up to 5 years. The Company has treated the trust preferred securities as Tier 1 capital up to the maximum amount allowed, and the remainder as Tier 2 capital for federal regulatory purposes (see Note 12).
Under FASB Interpretation No. 46, the trusts are not consolidated with the Company. Accordingly, the Company does not report the securities issued by the trust as liabilities, and instead reports as liabilities the subordinated debentures issued by the Company and held by the trusts.
There are no required principal payments on subordinated debentures over the next five years.
NOTE 8 - BENEFIT PLANS
(Dollar amounts in thousands except per share data)
Profit Sharing Plan: The Company sponsors a 401(k) profit sharing plan which is available to all employees electing to participate after meeting certain length-of-service requirements. The plan allows contributions by employees up to 15% of their compensation, which are matched equal to 100% of the first 6% of the compensation contributed. Expense for 2008, 2007 and 2006 was $174, $148 and $129, respectively.
Directors’ Stock Purchase Plan: Following approval by the shareholders at the 2003 Annual Meeting, the Company established the Directors’ Stock Purchase Plan for nonemployee directors. Under this Plan, directors may elect to receive shares of the Company’s common stock as an alternative to the equivalent amounts of cash for directors’ fees. A total of 100,000 shares of the Company’s common stock were made available for issuance, all of which remained available for issuance at December 31, 2008 and 2007, as all transactions executed to date were open market purchases. The Company’s expense in connection with this plan was $83, $176 and $241 in 2008, 2007 and 2006, respectively, which is included in director fees in the accompanying Consolidated Statements of Income.
NOTE 9 - INCOME TAXES
(Dollar amounts in thousands except per share data)
Income tax expense (benefit) was as follows:
| | | 2008 | | | 2007 | | | 2006 | |
| Current federal | | $ | 404 | | | $ | 1,610 | | | $ | 1,522 | |
| Current state | | | 88 | | | | 237 | | | | 261 | |
| Deferred federal | | | (616 | ) | | | (221 | ) | | | (261 | ) |
| Deferred state | | | (105 | ) | | | (38 | ) | | | (45 | ) |
| Total | | $ | (229 | ) | | $ | 1,588 | | | $ | 1,477 | |
Effective tax rates differ from federal statutory rate of 34% applied to income before income taxes due to the following:
NOTE 9 - INCOME TAXES (Continued)
(Dollar amounts in thousands except per share data)
| | | 2008 | | | 2007 | | | 2006 | |
| Federal statutory rate times financial statement income | | $ | (66 | ) | | $ | 1,546 | | | $ | 1,360 | |
| Effect of: | | | | | | | | | | | | |
| Tax-exempt income | | | (202 | ) | | | (145 | ) | | | (130 | ) |
| State taxes, net of federal benefit | | | (11 | ) | | | 132 | | | | 142 | |
Other, net | | | 50 | | | | 55 | | | | 105 | |
| Total | | $ | (229 | ) | | $ | 1,588 | | | $ | 1,477 | |
The tax effects of temporary differences that give rise to significant portions of the deferred tax assets and deferred tax liabilities are as follows:
| | | 2008 | | | 2007 | |
| Deferred tax assets: | | | | | | |
| Allowance for loan losses | | $ | 1,632 | | | $ | 1,016 | |
| Other | | | 161 | | | | 111 | |
| | | | 1,793 | | | | 1,127 | |
| Deferred tax liabilities: | | | | | | | | |
| Depreciation | | | 205 | | | | 260 | |
| Net unrealized gain on securities available for sale | | | 30 | | | | 4 | |
| Other | | | 56 | | | | 56 | |
| | | | 291 | | | | 320 | |
| | | | | | | | | |
| Net deferred tax asset | | $ | 1,502 | | | $ | 807 | |
NOTE 10 - RELATED PARTY TRANSACTIONS
(Dollar amounts in thousands except per share data)
Loans to principal officers, directors and their affiliates in 2008 were as follows:
| Beginning balance | | $ | 5,810 | |
| New loans | | | 3,781 | |
| Repayments and transfer out of related party | | | (1,388 | ) |
| Ending balance | | $ | 8,203 | |
Deposits from principal officers, directors and their affiliates at year end 2008 and 2007 were $3,927 and $5,801, respectively.
NOTE 11 - - SHARE-BASED COMPENSATION
(Dollar amounts in thousands except per share data)
On April 25, 2006, Bancorp’s shareholders approved the Jacksonville Bancorp, Inc. 2006 Stock Incentive Plan (the “2006 Plan”). Under the 2006 Plan, up to 20,000 shares of Bancorp’s common stock were made available for issuance for awards in the form of incentive stock options, restricted stock, restricted stock units, performance grants or stock appreciation rights. Any award that expires or is forfeited for any reason is returned to the 2006 Plan.
The 2006 Plan was a new plan and did not supersede the Company’s original Stock Option Plan, adopted by the Company’s shareholders on April 26, 2000, which continues to govern awards made under it. Under the Company’s original Stock Option Plan, options to buy stock are granted to directors, officers and employees. Options available to be issued under the original Stock Option Plan are 220,099.
NOTE 11 - - SHARE-BASED COMPENSATION (Continued)
(Dollar amounts in thousands except per share data)
On April 29, 2008, the shareholders approved a 2008 Amendment and Restatement of the 2006 Stock Incentive Plan. Under this amendment and restatement, there is reserved for issuance under the plan an aggregate of 70,000 shares of Bancorp common stock. No more than 15,000 shares may be allocated to incentive awards, including the maximum shares payable under a performance grant, that are granted during any single taxable year to any individual participant who is an employee of Bancorp or any subsidiary of Bancorp.
Stock options are granted under both stock option plans with an exercise price equal to or greater than the stock fair market value at the date of grant. All stock options granted have ten-year lives, generally containing vesting terms of three to five years. Certain grants have been made that vest immediately. Common stock issued upon exercise of stock options are newly-issued shares.
The fair value of each option award is estimated on the date of grant using a closed form option valuation (Black-Scholes option-pricing model) that uses the assumptions noted in the table below. Expected volatilities are based on historical volatilities of the Company’s common stock. The Company uses historical data to estimate option exercise and post-vesting termination behavior. The expected term of options granted is based on historical data and represents the period of time that options granted are expected to be outstanding, which takes into account that the options are not transferable. The risk-free interest rate for the expected term of the option is based on the U.S. Treasury yield curve in effect at the time of the grant.
Total share-based compensation costs that have been charged against income for those plans were $110, 147 and $151 for 2008, 2007 and 2006.
The fair value of options granted was determined using the following weighted-average assumptions as of grant date.
| | | 2008 | | | 2007 | | | 2006 | |
| | | | | | | | | | |
| Risk-free interest rate | | | N/A | | | | 4.53 | % | | | 5.03 | % |
| Expected term | | | N/A | | | 8.71 years | | | 7.50 years | |
| Expected stock price volatility | | | N/A | | | | 27.39 | % | | | 27.22 | % |
| Dividend yield | | | N/A | | | | 0.00 | % | | | 0.00 | % |
A summary of the activity in the stock option plans for 2008 follows:
| | | | | | | | | Weighted | | | | |
| | | | | | Weighted | | | Average | | | | |
| | | | | | Average | | | Remaining | | | Aggregate | |
| | | Number | | | Exercise | | | Contractual | | | Intrinsic | |
| | | of Options | | | Price | | | Term | | | Value | |
| | | | | | | | | | | | | |
| Outstanding at beginning of year | | | 160,942 | | | $ | 14.70 | | | | — | | | | — | |
| Granted | | | — | | | | — | | | | — | | | | — | |
| Exercised | | | (200 | ) | | | 12.55 | | | | — | | | | — | |
| Forfeited | | | (1,800 | ) | | | 22.06 | | | | — | | | | — | |
| Outstanding at end of year | | | 158,942 | | | $ | 14.62 | | | | 3.18 | | | $ | 99 | |
| Vested or expected to vest | | | 154,008 | | | $ | 14.57 | | | | 6.45 | | | $ | 191 | |
| Exercisable at end of year | | | 146,442 | | | $ | 13.54 | | | | 2.92 | | | $ | 99 | |
Information related to the stock option plans during each year follows:
| | | 2008 | | | 2007 | | | 2006 | |
| | | | | | | | | | |
| Intrinsic value of options exercised | | $ | 2 | | | $ | 82 | | | $ | 583 | |
| Cash received from option exercises | | | 3 | | | | 46 | | | | 339 | |
| Tax benefit realized from option exercises | | | 1 | | | | 31 | | | | 212 | |
| Weighted average fair value of options granted | | $ | — | | | $ | 15.68 | | | $ | 14.01 | |
NOTE 11 - - SHARE-BASED COMPENSATION (Continued)
(Dollar amounts in thousands except per share data)
As of December 31, 2008, there was $79 of total unrecognized compensation cost related to unvested stock options granted. The cost is expected to be recognized over a remaining weighted average period of 2.26 years.
The following table reports restricted stock activity during the 12 months ended December 31, 2008:
| | | | | | Weighted Average | |
| | | Number of | | | Grant Date | |
| | | Shares | | | Fair Value | |
| | | | | | | |
| Unvested shares at January 1, 2008 | | | 3,017 | | | $ | 32.30 | |
| Shares granted | | | 1,600 | | | $ | 23.05 | |
| Shares vested and distributed | | | (618 | ) | | $ | 31.72 | |
| Shares forfeited | | | (808 | ) | | $ | 29.64 | |
| Unvested shares at December 31, 2008 | | | 3,191 | | | $ | 28.45 | |
As of December 31, 2008, there was $41 of total unrecognized compensation cost related to unvested restricted stock awards granted. The cost is expected to be recognized over a remaining weighted average period of 1.69 years.
NOTE 12 - CAPITAL REQUIREMENTS AND RESTRICTIONS ON RETAINED EARNINGS
(Dollar amounts in thousands except per share data)
Banks and bank holding companies are subject to regulatory capital requirements administered by federal banking agencies. Capital adequacy guidelines and, additionally for banks, prompt corrective action regulations involve quantitative measures of assets, liabilities and certain off-balance-sheet items calculated under regulatory accounting practices. Capital amounts and classifications are also subject to qualitative judgments by regulators. Failure to meet capital requirements can initiate regulatory action.
Prompt corrective action regulations provide five classifications: well capitalized, adequately capitalized, undercapitalized, significantly undercapitalized, and critically undercapitalized, although these terms are not used to represent overall financial condition. If adequately capitalized, regulatory approval is required to accept brokered deposits. If undercapitalized, capital distributions are limited, as is asset growth and expansion, and capital restoration plans are required. At year end 2008 and 2007, the most recent regulatory notifications categorized the Bank and the Company as well capitalized under the regulatory framework for prompt corrective action. There are no conditions or events since that notification that management believes have changed the institution's category. Management and the Board of Directors have committed to maintain Total Risk-Based Capital at 10% and Tier 1 Capital to Average Assets at 8%.
NOTE 12 - CAPITAL REQUIREMENTS AND RESTRICTIONS ON RETAINED EARNINGS (Continued)
(Dollar amounts in thousands except per share data)
Actual and required capital amounts and ratios are presented below at year end.
| | | | | | | | | | | | | | | To Be Well | |
| | | | | | | | | | | | | | | Capitalized Under | |
| | | | | | | | | For Capital | | | Prompt Corrective | |
| | | Actual | | | Adequacy Purposes | | | Action Provisions | |
| | | Amount | | | Ratio | | | Amount | | | Ratio | | | Amount | | | Ratio | |
| 2008 | | | | | | | | | | | | | | | | | | |
Total Capital to risk weighted assets
Consolidated | | $ | 46,051 | | | | 11.93 | % | | $ | 30,874 | | | | 8.00 | % | | | N/A | | | | N/A | |
| Bank | | | 40,719 | | | | 10.58 | | | | 30,795 | | | | 8.00 | | | $ | 38,494 | | | | 10.00 | % |
Tier 1 (Core) Capital to risk weighted assets
Consolidated | | | 35,638 | | | | 9.23 | | | | 15,437 | | | | 4.00 | | | | N/A | | | | N/A | |
| Bank | | | 36,014 | | | | 9.36 | | | | 15,397 | | | | 4.00 | | | | 23,096 | | | | 6.00 | |
Tier 1 (Core) Capital to average assets
Consolidated | | | 35,638 | | | | 8.26 | | | | 17,264 | | | | 4.00 | | | | N/A | | | | N/A | |
| Bank | | | 36,014 | | | | 8.36 | | | | 17,228 | | | | 4.00 | | | | 21,535 | | | | 5.00 | |
| | | | | | | | | | | | | | | | | | | | | | | | | |
| 2007 | | | | | | | | | | | | | | | | | | | | | | | | |
Total Capital to risk weighted assets
Consolidated | | $ | 36,739 | | | | 10.60 | % | | $ | 27,715 | | | | 8.00 | % | | | N/A | | | | N/A | |
| Bank | | | 35,313 | | | | 10.16 | | | | 27,819 | | | | 8.00 | | | $ | 34,774 | | | | 10.00 | % |
Tier 1 (Core) Capital to risk weighted assets
Consolidated | | | 33,623 | | | | 9.70 | | | | 13,858 | | | | 4.00 | | | | N/A | | | | N/A | |
| Bank | | | 32,197 | | | | 9.26 | | | | 13,910 | | | | 4.00 | | | | 20,864 | | | | 6.00 | |
Tier 1 (Core) Capital to average assets
Consolidated | | | 33,623 | | | | 8.68 | | | | 15,847 | | | | 4.00 | | | | N/A | | | | N/A | |
| Bank | | | 32,197 | | | | 8.31 | | | | 15,496 | | | | 4.00 | | | | 19,370 | | | | 5.00 | |
The Company’s principal source of funds for dividend payments is dividends received from the Bank. Banking regulations require maintaining certain capital levels and restrict the payment of dividends by the Bank to the Company or by the Company to shareholders. Specifically, a Florida state-chartered commercial bank may not pay cash dividends that would cause its capital to fall below the minimum amount required by federal or state law. Accordingly, commercial banks may only pay dividends out of the total of current net profits plus retained net profits of the preceding two years to the extent it deems expedient, except that no bank may pay a dividend at any time that the total of net income for the current year when combined with retained net income from the preceding two years produces a loss. The future ability of the Bank to pay dividends to the Company also depends in part on the FDIC capital requirements in effect and the Company's ability to comply with such requirements.
NOTE 13 – LOAN COMMITMENTS AND OTHER RELATED ACTIVITIES
(Dollar amounts in thousands except per share data)
Some financial instruments, such as loan commitments, credit lines, letters of credit and overdraft protection, are issued to meet customer financing needs. These are agreements to provide credit or to support the credit of others, as long as conditions established in the contract are met, and usually have expiration dates. Commitments may expire without being used. Off-balance-sheet risk to credit loss exists up to the face amount of these instruments, although material losses are not anticipated. The same credit policies are used to make such commitments as are used for loans, including obtaining collateral at exercise of the commitment.
NOTE 13 – LOAN COMMITMENTS AND OTHER RELATED ACTIVITIES (Continued)
(Dollar amounts in thousands except per share data)
The contractual amount of variable and fixed rate financial instruments with off-balance-sheet risk was as follows at year end:
| | | 2008 | | | 2007 | |
| | | Fixed Rates | | | Variable Rates | | | Fixed Rates | | | Variable Rates | |
| | | | | | | | | | | | | |
| Unused lines of credit | | $ | 5,026 | | | $ | 30,338 | | | $ | 8,777 | | | $ | 32,070 | |
| Standby letters of credit | | | — | | | | 543 | | | | — | | | | 692 | |
NOTE 14 – FAIR VALUE
(Dollar amounts in thousands except per share data)
Statement 157 establishes a fair value hierarchy which requires an entity to maximize the use of observable inputs and minimize the use of unobservable inputs when measuring fair value. The standard describes three levels of inputs that may be used to measure fair value:
Level 1: Quoted prices (unadjusted) for identical assets or liabilities in active markets that the entity has the ability to access as of the measurement date.
Level 2: Significant other observable inputs other than Level 1 prices such as quoted prices for similar assets or liabilities; quoted prices in markets that are not active; or other inputs that are observable or can be corroborated by observable market data.
Level 3: Significant unobservable inputs that reflect a reporting entity’s own assumptions about the assumptions that market participants would use in pricing an asset or liability.
The fair values of securities available for sale are determined by obtaining quoted prices on nationally recognized securities exchanges (Level 1 inputs) or matrix pricing, which is a mathematical technique widely used in the industry to value debt securities without relying exclusively on quoted prices for the specific securities but rather by relying on the securities’ relationship to other benchmark quoted securities (Level 2 inputs).
The fair value of impaired loans with specific allocations of the allowance for loan losses is generally based on recent real estate appraisals. These appraisals may utilize a single valuation approach or a combination of approaches including comparable sales and the income approach. Adjustments are routinely made in the appraisal process by the appraisers to adjust for differences between the comparable sales and income data available. Such adjustments are typically significant and result in a Level 3 classification of the inputs for determining fair value.
NOTE 14 – FAIR VALUE (Continued)
(Dollar amounts in thousands except per share data)
Assets and Liabilities Measured on a Recurring Basis
Assets and liabilities measured at fair value on a recurring basis are summarized below:
| | | Fair Value Measurements | |
| | | at December 31, 2008 Using | |
| | | Quoted Prices in | | | Significant | | | | |
| | | Active Markets | | | Other | | | Significant | |
| | | for Identical | | | Observable | | | Unobservable | |
| | | Assets | | | Inputs | | | Inputs | |
| | | (Level 1) | | | (Level 2) | | | (Level 3) | |
| Assets: | | | | | | | | | |
| Available for sale securities | | | - | | | | 29,684 | | | | - | |
Assets and Liabilities Measured on a Non-Recurring Basis
Assets and liabilities measured at fair value on a non-recurring basis are summarized below:
| | | Fair Value Measurements | |
| | | at December 31, 2008 Using | |
| | | Quoted Prices in | | | Significant | | | | |
| | | Active Markets | | | Other | | | Significant | |
| | | for Identical | | | Observable | | | Unobservable | |
| | | Assets | | | Inputs | | | Inputs | |
| | | (Level 1) | | | (Level 2) | | | (Level 3) | |
| Assets: | | | | | | | | | |
| Impaired loans | | | - | | | | - | | | | 3,734 | |
The following represent impairment charges recognized during the period:
Impaired loans, which are measured for impairment using discounted cash flows or the fair value of the collateral for collateral dependent loans, had a carrying amount of $4,352, with a valuation allowance of $618, resulting in an additional provision for loan loss of $618 for the period. Additional impaired loans, not measured using levels of inputs to measure fair value, had a carrying amount of $12,931. Collateral dependent impaired loans, valued under Level 3, were measured using current appraised values along with information on recent market transactions as well as management’s assumptions about the criteria that market participants would use in pricing the asset.
Fair Value of Financial Instruments
Carrying amount and estimated fair values of financial instruments, not previously presented, at year end were as follows:
| | | 2008 | | | 2007 | |
| | | Carrying | | | Fair | | | Carrying | | | Fair | |
| | | Amount | | | Value | | | Amount | | | Value | |
| Financial assets | | | | | | | | | | | | |
| Cash and cash equivalents | | $ | 10,148 | | | $ | 10,148 | | | $ | 6,035 | | | $ | 6,035 | |
| Securities held to maturity | | | 50 | | | | 50 | | | | 50 | | | | 50 | |
| Loans, net | | | 374,993 | | | | 374,454 | | | | 339,265 | | | | 348,122 | |
| Federal Home Loan Bank stock | | | 1,705 | | | | n/a | | | | 3,638 | | | | n/a | |
| Accrued interest receivable | | | 2,027 | | | | 2,027 | | | | 2,275 | | | | 2,275 | |
| | | | | | | | | | | | | | | | | |
| Financial liabilities | | | | | | | | | | | | | | | | |
| Deposits | | $ | 345,544 | | | $ | 345,100 | | | $ | 288,893 | | | $ | 289,491 | |
| Federal funds purchased | | | — | | | | — | | | | — | | | | — | |
| Federal Home Loan Bank advances | | | 20,000 | | | | 21,233 | | | | 67,830 | | | | 68,297 | |
| Subordinated debentures | | | 14,550 | | | | 10,613 | | | | 7,000 | | | | 7,000 | |
| Accrued interest payable | | | 568 | | | | 568 | | | | 707 | | | | 707 | |
NOTE 14 – FAIR VALUE (Continued)
(Dollar amounts in thousands except per share data)
The methods and assumptions used to estimate fair value are described as follows:
Carrying amount is the estimated fair value for cash and cash equivalents, interest-bearing deposits, accrued interest receivable and payable, demand deposits, short-term debt, subordinated debentures and variable rate loans or deposits that reprice frequently and fully. Security fair values are based on market prices or dealer quotes and, if no such information is available, on the rate and term of the security and information about the issuer. For fixed rate loans or deposits, including FHLB advances, and for variable rate loans or deposits with infrequent repricing or repricing limits, fair value is based on discounted cash flows using current market rates applied to the estimated life and credit risk. Fair values for impaired loans are estimated using discounted cash flow analysis or underlying collateral values. Fair value of loans held for sale is based on market quotes. Fair value of debt is based on current rates for similar financing. Accrued interest receivable and accrued interest payable approximate their fair values. It was not practicable to determine fair value of FHLB stock due to restrictions placed on its transferability. The fair value of off-balance-sheet items is considered nominal.
NOTE 15 - PARENT COMPANY ONLY CONDENSED FINANCIAL INFORMATION
(Dollar amounts in thousands except per share data)
Condensed financial information of Jacksonville Bancorp, Inc. follows:
CONDENSED BALANCE SHEETS
December 31,
| | | 2008 | | | 2007 | |
| ASSETS | | | | | | |
| Cash and cash equivalents | | $ | 4,163 | | | $ | 1,343 | |
| Investment in banking subsidiaries | | | 36,063 | | | | 32,204 | |
| Other assets | | | 1,420 | | | | 174 | |
| | | | | | | | | |
| Total assets | | $ | 41,646 | | | $ | 33,721 | |
| | | | | | | | | |
| LIABILITIES AND EQUITY | | | | | | | | |
| Subordinated debt | | $ | 14,550 | | | $ | 7,000 | |
| Accrued expenses and other liabilities | | | 251 | | | | 92 | |
| Shareholders’ equity | | | 26,845 | | | | 26,629 | |
| | | | | | | | | |
| Total liabilities and shareholders’ equity | | $ | 41,646 | | | $ | 33,721 | |
CONDENSED STATEMENTS OF INCOME
Years ended December 31,
| | | 2008 | | | 2007 | | | 2006 | |
| | | | | | | | | | |
| Other income | | $ | (15 | ) | | $ | 15 | | | $ | 10 | |
| Interest expense | | | (675 | ) | | | (559 | ) | | | (335 | ) |
| Other expense | | | (622 | ) | | | (626 | ) | | | (724 | ) |
| Merger and acquisition cost | | | (468 | ) | | | — | | | | — | |
| | | | | | | | | | | | | |
| Income (loss) before income tax and undistributed subsidiary income | | | (1,780 | ) | | | (1,170 | ) | | | (1,049 | ) |
| Income tax expense (benefit) | | | (637 | ) | | | (372 | ) | | | (347 | ) |
| Equity in undistributed subsidiary income | | | 1,178 | | | | 3,756 | | | | 3,225 | |
| | | | | | | | | | | | | |
| Net income | | $ | 35 | | | $ | 2,958 | | | $ | 2,523 | |
NOTE 15 - PARENT COMPANY ONLY CONDENSED FINANCIAL INFORMATION (Continued)
(Dollar amounts in thousands except per share data)
CONDENSED STATEMENTS OF CASH FLOWS
Years ended December 31,
| | | 2008 | | | 2007 | | | 2006 | |
Cash flows from operating activities | | | | | | | | | |
| Net income | | $ | 35 | | | $ | 2,958 | | | $ | 2,523 | |
| Adjustments: | | | | | | | | | | | | |
| Equity in undistributed subsidiary income | | | (1,178 | ) | | | (3,756 | ) | | | (3,225 | ) |
| Amortization | | | - | | | | - | | | | 1 | |
| Share-based compensation | | | 215 | | | | 350 | | | | 381 | |
| Change in other assets | | | (1,246 | ) | | | 916 | | | | (633 | ) |
| Change in other liabilities | | | 159 | | | | (146 | ) | | | 19 | |
| Net cash from operating activities | | | (2,015 | ) | | | 322 | | | | (934 | ) |
| | | | | | | | | | | | | |
| Cash flows from investing activities | | | | | | | | | | | | |
| Investments in subsidiaries | | | (2,639 | ) | | | (1,467 | ) | | | (1,450 | ) |
| Net cash from investing activities | | | (2,639 | ) | | | (1,467 | ) | | | (1,450 | ) |
| | | | | | | | | | | | | |
| Cash flows from financing activities | | | | | | | | | | | | |
| Proceeds from issuance of subordinated debt | | | 7,550 | | | | - | | | | 3,000 | |
| Proceeds from exercise of stock options | | | 3 | | | | 46 | | | | 339 | |
| Excess tax benefits from share-based payment | | | - | | | | 31 | | | | 212 | |
| Purchase of treasury stock | | | (79 | ) | | | (194 | ) | | | (231 | ) |
| Net cash from financing activities | | | 7,474 | | | | (117 | ) | | | 3,320 | |
| | | | | | | | | | | | | |
| Net change in cash and cash equivalents | | | 2,820 | | | | (1,262 | ) | | | 936 | |
| | | | | | | | | | | | | |
| Beginning cash and cash equivalents | | | 1,343 | | | | 2,605 | | | | 1,669 | |
| | | | | | | | | | | | | |
| Ending cash and cash equivalents | | $ | 4,163 | | | $ | 1,343 | | | $ | 2,605 | |
NOTE 16 – EARNINGS PER SHARE
(Dollar amounts in thousands except per share data)
The factors used in the earnings per share computation follow:
| | | 2008 | | | 2007 | | | 2006 | |
| Basic | | | | | | | | | |
| Net income | | $ | 35 | | | $ | 2,958 | | | $ | 2,523 | |
| Weighted average common shares outstanding | | | 1,748,295 | | | | 1,744,512 | | | | 1,726,350 | |
| | | | | | | | | | | | | |
| Basic earnings per common share | | $ | .02 | | | $ | 1.70 | | | $ | 1.46 | |
| Diluted | | | | | | | | | | | | |
| Net income | | $ | 35 | | | $ | 2,958 | | | $ | 2,523 | |
| Weighted average common shares outstanding for basic earnings per common share | | | 1,748,295 | | | | 1,744,512 | | | | 1,726,350 | |
| Add: Dilutive effects of assumed exercises of stock options and warrants | | | 43,047 | | | | 71,637 | | | | 86,540 | |
| | | | | | | | | | | | | |
| Average shares and dilutive potential common shares | | | 1,791,342 | | | | 1,816,149 | | | | 1,812,890 | |
| | | | | | | | | | | | | |
| Diluted earnings per common share | | $ | .02 | | | $ | 1.63 | | | $ | 1.39 | |
No stock options were anti-dilutive for 2008, 2007 and 2006.
NOTE 17 - OTHER COMPREHENSIVE INCOME (LOSS)
(Dollar amounts in thousands except per share data)
Other comprehensive income (loss) components and related tax effects were as follows:
| | | 2008 | | | 2007 | | | 2006 | |
| | | | | | | | | | |
| Unrealized holding gains (losses) on available for sale securities | | $ | 67 | | | $ | 481 | | | $ | 109 | |
| Reclassification adjustment for (gains) losses realized in income | | | — | | | | — | | | | — | |
| Net unrealized gains (losses) | | | 67 | | | | 481 | | | | 109 | |
| Tax effect | | | (25 | ) | | | (181 | ) | | | (41 | ) |
| | | | | | | | | | | | | |
| Other comprehensive income (loss) | | $ | 42 | | | $ | 300 | | | $ | 68 | |
NOTE 18 – QUARTERLY FINANCIAL DATA (UNAUDITED)
(Dollar amounts in thousands except per share data)
| | | | | | Net Interest | | | | | | | | | | |
| | | | | | Income after | | | | | | | | | | |
| | | Interest | | | Provision for | | | Net | | | Earnings per Share | |
| | | Income | | | Loan Loss | | | Income | | | Basic | | | Diluted | |
| 2008 | | | | | | | | | | | | | | | |
| First Quarter | | | 6,793 | | | | 2,862 | | | | 537 | | | | .31 | | | | .30 | |
| Second Quarter | | | 6,209 | | | | 1,172 | | | | (840 | ) | | | (.48 | ) | | | (.47 | ) |
| Third Quarter | | | 6,457 | | | | 2,383 | | | | 267 | | | | .15 | | | | .15 | |
| Fourth Quarter | | | 6,104 | | | | 2,016 | | | | 71 | | | | .04 | | | | .04 | |
| | | | | | | | | | | | | | | | | | | | | |
| 2007 | | | | | | | | | | | | | | | | | | | | |
| First Quarter | | | 6,043 | | | | 2,685 | | | | 543 | | | | .31 | | | | .30 | |
| Second Quarter | | | 6,612 | | | | 2,788 | | | | 694 | | | | .40 | | | | .38 | |
| Third Quarter | | | 7,134 | | | | 3,171 | | | | 781 | | | | .45 | | | | .43 | |
| Fourth Quarter | | | 7,019 | | | | 3,203 | | | | 940 | | | | .54 | | | | .52 | |
During the second quarter of 2008, the Company had a $430,000 merger-related expense for the termination of the agreement to acquire Heritage Bancshares, Inc. on June 24, 2008.
During the second, third, and fourth quarters of 2008, the Bank had a provision for loan loss of $1.8 million, $665,000 and $787,000, respectively. In addition, the Company experienced a decline in the net interest margin in each of the four quarters of 2008 due to the reduction in short-term rates by the Federal Reserve, an increase in nonperforming assets, and a transition from low-cost core deposits into more expensive time deposits and wholesale funding.
| ITEM 9. | CHANGES IN AND DISAGREEMENTS WITH ACCOUNTANTS ON ACCOUNTING AND FINANCIAL DISCLOSURE |
None.
ITEM 9A. CONTROLS AND PROCEDURES
(a) Evaluation of Disclosure Controls and Procedures
The Company maintains controls and procedures designed to ensure that information required to be disclosed in the reports that the Company files or submits under the Securities Exchange Act of 1934 is recorded, processed, summarized and reported within the time periods specified in the rules and forms of the Securities and Exchange Commission. Based upon management’s evaluation of those controls and procedures as of December 31, 2008 performed within the 90 days preceding the filing of this Annual Report on Form 10-K, the Chief Executive Officer and Chief Financial Officer of the Company concluded that, subject to the limitations noted below, the Company’s disclosure controls and procedures (as defined in Rules 13a-15(e) under the Securities Exchange Act of 1934) are effective to ensure that the information required to be disclosed by the Company in the reports that it files or submits under the Securities Exchange Act of 1934 is recorded, processed, summarized and reported within the time periods specified in the U.S. Securities and Exchange Commission’s rules and forms.
(b) Management’s Report on Internal Control Over Financial Reporting
Our management is responsible for establishing and maintaining adequate internal control over financial reporting, as such term is defined in Exchange Act Rule 13a-15(f). Such internal controls over financial reporting were designed to provide reasonable assurance regarding the reliability of financial reporting and the preparation of financial statements for external purposes in accordance with generally accepted accounting principles.
The Company’s management assessed the effectiveness of the Company’s internal control over financial reporting as of December 31, 2008. In making this assessment, the Company used the criteria set forth in Internal Control-Integrated Framework issued by the Committee of Sponsoring Organizations of the Treadway Commission.
Based upon our evaluation under the framework in Internal Control-Integrated Framework, our management concluded that our internal control over financial reporting was effective as of December 31, 2008.
Crowe Horwath LLP, the independent registered public accounting firm that audited the consolidated financial statements included in this Annual Report on Form 10-K, has also audited the effectiveness of our internal control over financial reporting as of December 31, 2008, as stated in their report which appears in this Annual Report on Form 10-K.
(c) Changes in Internal Controls
The Company has made no significant changes in its internal controls over financial reporting during the quarter ended December 31, 2008 that have materially affected or are reasonably likely to materially affect our internal control over financial reporting.
(d) Limitations on the Effectiveness of Controls
Our management, including our Chief Executive Officer and Chief Financial Officer, does not expect that our disclosure controls and internal controls will prevent all error and all fraud. A control system, no matter how well conceived and operated, can provide only reasonable, not absolute, assurance that the objectives of the control system are met. Further, the design of a control system must reflect the fact that there are resource constraints, and the benefits of controls must be considered relative to their costs. Because of the inherent limitations in all control systems, no evaluation of controls can provide absolute assurance that all control issues and instances of fraud, if any, within the Company have been detected. These inherent limitations include the realities that judgments in decision-making can be faulty and that breakdowns can occur because of simple error or mistake. Additionally, controls can be circumvented by the individual acts of some persons, by collusion of two or more people, or by management override of the control.
The design of any system of controls also is based in part upon certain assumptions about the likelihood of future events, and there can be no assurance that any design will succeed in achieving its stated goals under all potential future conditions; over time, controls may become inadequate because of changes in conditions, or the degree of compliance with the policies or procedures may deteriorate. Because of the inherent limitations in a cost-effective control system, misstatements due to error or fraud may occur and not be detected.
None.
PART III
| ITEM 10. | DIRECTORS, EXECUTIVE OFFICERS AND CORPORATE GOVERNANCE |
The information regarding our directors and executive officers contained under the captions “Proposal 1: Election of Directors,” “Board of Directors, Governance and Committees” “Executive Officers of the Company,” and “Section 16(a) Beneficial Ownership Reporting Compliance” in our Definitive Proxy Statement for the 2009 Annual Meeting of Shareholders is incorporated herein by reference.
We have adopted a code of ethics which is applicable to our principal executive officer, principal financial officer, principal accounting officer or controller, or persons performing similar functions. The full text of our code of ethics is available on our website (www.jaxbank.com).
Below is biographical information on our directors:
| | | | Positions Held and Principal Occupations During the Past Five Years |
| James M. Healey | | 51 | | Director and Partner of Mint Magazine, Inc. Before his association with Mint Magazine in 1985, Mr. Healey worked with Carnation Food Products, Inc. and International Harvester. Mr. Healey attended Purdue University where he received a Bachelor of Arts degree from Purdue’s Business School with special studies in Marketing and Personnel. Mr. Healey has been a resident and active member of the Jacksonville community since 1984. |
| | | | | |
| John C. Kowkabany | | 66 | | Jacksonville-based real estate investor and consultant. Mr. Kowkabany has significant private and public sector experience. A resident of the city of Neptune Beach, he has been active in local government, serving as the city’s Mayor from 1989 to 1997, and Councilman from 1985 to 1989. The Honorable John C. Kowkabany’s public sector experience has provided him with experience and knowledge regarding the local business and civic communities. For many years, Mr. Kowkabany has served with various civic and charitable organizations as an officer or director. Mr. Kowkabany graduated with a Bachelor of Arts degree from Jacksonville University. |
| | | | | |
| R.C. Mills | | 71 | | Retired and former President of Heritage Propane Partners, L.P., a national distributor of propane gas. Mr. Mills is a graduate of the University of Sarasota and resides in the Jacksonville area. Mr. Mills has an extensive business background and is experienced in business mergers and acquisitions, corporate finance and personnel management, having served in several executive management positions with a vertically integrated oil and gas company for over 25 years. |
| | | | | |
| Gilbert J. Pomar, III | | 49 | | President and Chief Executive Officer for both Bancorp and the Bank, Mr. Pomar joined Bancorp in March 1999, having been employed by First Union National Bank in Jacksonville since 1991. During his tenure with First Union, he was Senior Portfolio Manager and Senior Vice President/Commercial Banking Manager. Mr. Pomar has more than 25 years of banking experience, including Southeast Bank, First National Bank of Chicago, Barnett Bank and Florida Coast Bank. Mr. Pomar is active in various community efforts, including Board positions of the American Cancer Society, University of North Florida, College of Business, and the Florida Bankers Association. He is a graduate of the University of Florida, where he earned his Bachelor of Science degree in Finance. |
| | | | Positions Held and Principal Occupations During the Past Five Years |
| Donald E. Roller | | 71 | | Chairman of our Board of Directors. President and Chief Executive Officer of U.S. Gypsum Company from 1993 through 1996. He was also Executive Vice President of USG Corporation. Mr. Roller has had extensive experience in directorship positions; he serves as a member of the Board and President of Glenmoor at St. Johns, a not for profit CCRC, located in St. Augustine, Florida, and has served as acting Chief Executive Officer and Chairman of the Audit Committee for Payless Cashways, Inc. |
| | | | | |
| John W. Rose | | 59 | | A financial services executive, advisor and investor for over 30 years. Mr. Rose is a Principal of CapGen Financial Advisors, a New York City-based private equity fund established in 2007, which specializes in bank and thrift investments. Prior to that, and since 1991, he was President of McAllen Capital Partners, a financial advisory firm. Mr. Rose earned his undergraduate degree from Case Western Reserve University and his M.B.A. from Columbia University. |
| | | | | |
| John R. Schultz | | 45 | | A fourth generation native of Jacksonville, Florida. Mr. Schultz is Vice President of Schultz Investments, Inc., an investment management company primarily involved in real estate investments. Mr. Schultz attended The Bolles School (Jacksonville, Florida) and the University of Florida. Mr. Schultz is a director of numerous companies and community organizations, including Metro YMCA, Daniel Properties, Inc. (Chairman), Trust for Public Land North Florida Advisory Council and The Schultz Foundation, Inc. |
| | | | | |
Price W. Schwenck | | 66 | | Chairman of the Board of Directors for the Bank and former Chief Executive Officer of Bancorp until April 26, 2000. From May 2000 to February 2003, Mr. Schwenck was President and Chief Executive Officer of P.C.B. Bancorp, Inc., n/k/a Colonial BancGroup Inc., a multi-bank holding company located in Clearwater, Florida. Mr. Schwenck served as Regional President for First Union National Bank in Ft. Lauderdale, Florida, from 1988 to 1994 and in Jacksonville, Florida, from 1994 until he retired in 1999. Mr. Schwenck is currently a director of Freedom Bank of America in St. Petersburg, Florida. Mr. Schwenck received his Bachelors degree and M.B.A. from the University of South Florida and his M.S. from the University of Miami. |
| | | | | |
| Charles F. Spencer | | 66 | | President of INOC LLC, a real estate management development company, and Cottage Street Land Trust, Inc., a real estate holding company, in Jacksonville, Florida. Mr. Spencer is a member of the International Longshoremen’s Association’s AFL-CIO Executive Council where he serves as an International Vice President representing members from Maine to Texas. In addition, Mr. Spencer is Executive Vice President of the South Atlantic and Gulf Coast District of I.L.A. and Vice President of the Florida AFL-CIO. He serves on the Board of Trustees of Edward Waters College; the Board of the Jacksonville Airport Authority; and Board of Governors of the Jacksonville Chamber of Commerce. Mr. Spencer is the former Chairman of the Board of the Jacksonville Sports Authority and former Board member of the I.M. Sulzbacher Center for the Homeless; United Way of Northeast Florida; and the foundation board of Florida Community College at Jacksonville. |
| | | | | |
| Gary L. Winfield, M.D. | | 52 | | A medical director since November 2005 and a consultant since June 2000 at Memorial Hospital. From 1991 through 2007, Dr. Winfield had an active family practice in Jacksonville Beach, Florida, operating as Sandcastle Family Practice, P.A. Dr. Winfield has served as Vice President of Medical Affairs for Anthem Health Plans of Florida, a provider of health insurance. Dr. Winfield received his undergraduate degree from the University of Oklahoma and is a graduate of the College of Medicine at the University of Oklahoma. |
Below is biographical information on our executive officers:
| | | | Positions Held and Principal Occupations During the Past Five Years |
| Scott M. Hall | | 44 | | Executive Vice President and Chief Lending Officer of Bancorp and Bank since February 2008 and previously Executive Vice President and Senior Loan Officer of the Bank since 2000. Mr. Hall has over 20 years of experience in the financial services industry. Before joining the Bank in 1999 as Senior Vice President, he was employed with First Union National Bank in Jacksonville for eight years as Vice President/Commercial Banking Relationship Manager. His community activities include serving on the Board of The National Association of Industrial and Office Properties (NAIOP) and as a committee member of the Gator Bowl Association. Mr. Hall is a graduate of the University of North Florida, where he received his Bachelor of Business Administration degree in Finance. |
| | | | | |
| Valerie A. Kendall | | 56 | | Executive Vice President and Chief Financial Officer of Bancorp and Bank. Ms. Kendall’s banking career spans more than 20 years. Prior to joining the Bank in 2004, she served from 2000 as Executive Vice President and Chief Financial Officer of P.C.B. Bancorp, Inc., n/k/a Colonial BancGroup Inc., a $650 million multi-bank holding company based in Clearwater, Florida. She also held senior finance positions with AmSouth Bank, Barnett Bank (Bank of America) and SunTrust. Ms. Kendall received her Bachelor of Science degree in Accounting from Florida Southern College and is a Certified Public Accountant. |
| | | | | |
| Gilbert J. Pomar, III | | 49 | | President and Chief Executive Officer for both Bancorp and the Bank, Mr. Pomar joined Bancorp in March 1999, having been employed by First Union National Bank in Jacksonville since 1991. During his tenure with First Union, he was Senior Portfolio Manager and Senior Vice President/Commercial Banking Manager. Mr. Pomar has more than 25 years of banking experience, including Southeast Bank, First National Bank of Chicago, Barnett Bank and Florida Coast Bank. Mr. Pomar is active in various community efforts, including Board positions of the American Cancer Society, University of North Florida, College of Business, and the Florida Bankers Association. He is a graduate of the University of Florida, where he earned his Bachelor of Science degree in Finance. |
| ITEM 11. | EXECUTIVE COMPENSATION |
The information contained under the captions “Executive Compensation” and “Organization and Compensation Committee Interlocks and Insider Participation” in our Definitive Proxy Statement for the 2009 Annual Meeting of Shareholders is incorporated herein by reference.
| ITEM 12. | SECURITY OWNERSHIP OF CERTAIN BENEFICIAL OWNERS AND MANAGEMENT AND RELATED STOCKHOLDER MATTERS |
The information contained under the captions “Security Ownership of Directors and Officers and Certain Beneficial Owners” and “Equity Compensation Plans Information” in our Definitive Proxy Statement for the 2009 Annual Meeting of Shareholders is incorporated herein by reference. This matter is further discussed in Item 5 of this Annual Report on Form 10-K.
| ITEM 13. | CERTAIN RELATIONSHIPS, RELATED TRANSACTIONS AND DIRECTOR INDEPENDENCE |
The information contained under the captions “Certain Relationships and Related Transactions” and “Board of Directors, Governance and Committees” in our Definitive Proxy Statement for the 2009 Annual Meeting of Shareholders is incorporated herein by reference.
| ITEM 14. | PRINCIPAL ACCOUNTING FEES AND SERVICES |
The information contained under the caption “Principal Accountant Fees and Services” in our Definitive Proxy Statement for the 2009 Annual Meeting of Shareholders is incorporated herein by reference.
PART IV
| ITEM 15. | EXHIBITS, FINANCIAL STATEMENT SCHEDULES |
Exhibit No. | | Description of Exhibit |
| | | |
| 2.1 | | Agreement and Plan of Merger by and between Jacksonville Bancorp, Inc. and Heritage Bancshares, Inc. (incorporated herein by reference to Exhibit 2.1 of the Company’s Current Report on Form 8-K filed on January 29, 2008, File No. 000-30248). |
| | | |
| 3.1 | | Articles of Incorporation of Registrant (incorporated herein by reference to Appendix A of the Company’s Registration Statement on Form SB-2, as effective with the Securities and Exchange Commission on September 30, 1998, Registration No. 333-64815). |
| | | |
| 3.2 | | Amended and Restated Bylaws of Registrant, as amended to date.* |
| | | |
| 4.1 | | Specimen Common Stock Certificate of Registrant (incorporated herein by reference to Exhibit 4.0 of the Company’s Registration Statement on Form SB-2, as effective with the Securities and Exchange Commission on September 30, 1998, Registration No. 333-64815). |
| | | |
| 10.1 | | Jacksonville Bancorp, Inc. Stock Option Plan (incorporated herein by reference to Exhibit 99.1 to the Company’s Registration Statement on Form S-8 filed on November 9, 1999, File No. 333-90609). |
| | | |
| 10.2 | | Amendment No. 1 to Stock Option Plan (incorporated by reference herein to Exhibit 10.2 of the Company’s Quarterly Report on Form 10-QSB for the period ended June 30, 2002 filed on August 14, 2002, File No. 000-30248). |
| | | |
| 10.3 | | Jacksonville Bancorp, Inc., Directors’ Stock Purchase Plan (incorporated herein by reference to Appendix A of the Company’s Proxy Statement filed on April 10, 2003, File No. 000-30248). |
| | | |
| 10.4 | | Outsourcing Agreement with M & I Data Services (now known as Metavante Corporation) (incorporated herein by reference to Exhibit 10.4 to the Company’s Registration Statement on Form SB-2/A, as filed with the Securities and Exchange Commission on January 5, 1999, Registration No. 333-64815). |
| | | |
| 10.5 | | Employment Agreement with Gilbert J. Pomar, III (incorporated herein by reference to Exhibit 10.5 to the Company’s Form 10-QSB for the period ended June 30, 1999, filed on August 13, 1999, File No. 000-30248). |
| | | |
| 10.6 | | Lease Agreement between The Jacksonville Bank and ABS Laura Street, LLC (incorporated herein by reference to Exhibit 10.1 to Form 10-QSB for the period ended September 30, 2004 filed on November 15, 2004, File No. 000-30248.) |
| | | |
| 10.7 | | Amendment to Lease Agreement between The Jacksonville Bank and ABS Laura Street, LLC (incorporated herein by reference to Exhibit 10.2 to Form 10-QSB for the period ended September 30, 2004 filed on November 15, 2004, File No. 000-30248). |
| | | |
| 10.8 | | Second Amendment to Lease Agreement between The Jacksonville Bank and ABS Laura Street, LLC (incorporated herein by reference to Exhibit 10.3 to Form 10-QSB for the period ended September 30, 2004 filed on November 15, 2004, File No. 000-30248). |
| 10.9 | | Stockholders Agreement by and between Jacksonville Bancorp, Inc. and each of the directors of Heritage Bancshares, Inc. and Heritage Bank of North Florida (incorporated herein by reference to Exhibit 10.1 of the Company’s Current Report on Form 8-K filed on January 29, 2008, File No. 000-30248). |
| | | |
| 10.10 | | Non-Competition Agreement Related to the Sale of Goodwill by and between Jacksonville Bancorp, Inc. and each of the directors of Heritage Bancshares, Inc. and Heritage Bank of North Florida (incorporated herein by reference to Exhibit 10.2 of the Company’s Current Report on Form 8-K filed on January 29, 2008, File No. 000-30248). |
| | | |
| 10.11 | | 2008 Amendment and Restatement of Jacksonville Bancorp, Inc. 2006 Stock Incentive Plan (incorporated herein by reference to Appendix A of the Company’s Definitive Proxy Statement filed on March 28, 2008, File No. 000-30248). |
| | | |
| 21 | | Subsidiaries of the Registrant.* |
| | | |
| 23.1 | | Consent of Crowe Horwath LLP, Independent Registered Public Accounting Firm.* |
| | | |
| 31.1 | | Certification of Chief Executive Officer required by Rule 13a-14(a)/15d-14(a) of the Exchange Act.* |
| | | |
| 31.2 | | Certification of Chief Financial Officer required by Rule 13a-14(a)/15d-14(a) of the Exchange Act.* |
| | | |
| 32.1 | | Certification of Chief Executive Officer pursuant to 18 U.S.C. Section 1350, as adopted pursuant to Section 906 of the Sarbanes-Oxley Act of 2002.* |
| | | |
| 32.2 | | Certification of Chief Financial Officer pursuant to 18 U.S.C. Section 1350, as adopted pursuant to Section 906 of the Sarbanes-Oxley Act of 2002.* |
*Filed herewith
SIGNATURES
Pursuant to the requirements of Sections 13 or 15(d) of the Securities Exchange Act of 1934, the Registrant has duly caused this report to be signed on its behalf by the undersigned, thereunto duly authorized.
| | JACKSONVILLE BANCORP, INC. |
| | | |
| Dated: March 20, 2009 | By: | /s/ Gilbert J. Pomar, III |
| | | Gilbert J. Pomar, III |
| | | President and Chief Executive Officer |
| | | (Principal executive officer) |
| Dated: March 20, 2009 | By: | /s/ Valerie A. Kendall |
| | | Valerie A. Kendall |
| | | Executive Vice President and Chief Financial Officer |
| | | Principal financial officer and principal accounting officer |
Pursuant to the requirements of the Securities Act of 1934, this Form 10-K has been signed by the following persons in the capacities and as of the dates indicated:
| Signature | | Title | | Date |
| | | | | |
| | | Director | | March 20, 2009 |
| James M. Healey | | | | |
| | | Director | | March 20, 2009 |
| John C. Kowkabany | | | | |
| | | Director | | March 20, 2009 |
| R.C. Mills | | | | |
| | | Director | | March 20, 2009 |
| Gilbert J. Pomar, III | | | | |
| | | Chairman of the Board | | March 20, 2009 |
| Donald E. Roller | | of Directors | | |
| | | Director | | March 20, 2009 |
| John W. Rose | | | | |
| | | Director | | March 20, 2009 |
| John R. Schultz | | | | |
| | | Director | | March 20, 2009 |
| Price W. Schwenck | | | | |
| | | Director | | March 20, 2009 |
| Charles F. Spencer | | | | |
| | | Director | | March 20, 2009 |
| Gary L. Winfield, M.D. | | | | |
EXHIBIT INDEX
Exhibit No. | | Description of Exhibit |
| | | |
| 2.1 | | Agreement and Plan of Merger by and between Jacksonville Bancorp, Inc. and Heritage Bancshares, Inc. (incorporated herein by reference to Exhibit 2.1 of the Company’s Current Report on Form 8-K filed on January 29, 2008, File No. 000-30248). |
| | | |
| 3.1 | | Articles of Incorporation of Registrant (incorporated herein by reference to Appendix A of the Company’s Registration Statement on Form SB-2, as effective with the Securities and Exchange Commission on September 30, 1998, Registration No. 333-64815). |
| | | |
| 3.2 | | Amended and Restated Bylaws of Registrant, as amended to date. * |
| | | |
| 4.1 | | Specimen Common Stock Certificate of Registrant (incorporated herein by reference to Exhibit 4.0 of the Company’s Registration Statement on Form SB-2, as effective with the Securities and Exchange Commission on September 30, 1998, Registration No. 333-64815). |
| | | |
| 10.1 | | Jacksonville Bancorp, Inc. Stock Option Plan (incorporated herein by reference to Exhibit 99.1 to the Company’s Registration Statement on Form S-8 filed on November 9, 1999, File No. 333-90609). |
| | | |
| 10.2 | | Amendment No. 1 to Stock Option Plan (incorporated by reference herein to Exhibit 10.2 of the Company’s Quarterly Report on Form 10-QSB for the period ended June 30, 2002 filed on August 14, 2002, File No. 000-30248). |
| | | |
| 10.3 | | Jacksonville Bancorp, Inc., Directors’ Stock Purchase Plan (incorporated herein by reference to Appendix A of the Company’s Proxy Statement filed on April 10, 2003, File No. 000-30248). |
| | | |
| 10.4 | | Outsourcing Agreement with M & I Data Services (now known as Metavante Corporation) (incorporated herein by reference to Exhibit 10.4 to the Company’s Registration Statement on Form SB-2/A, as filed with the Securities and Exchange Commission on January 5, 1999, Registration No. 333-64815). |
| | | |
| 10.5 | | Employment Agreement with Gilbert J. Pomar, III (incorporated herein by reference to Exhibit 10.5 to the Company’s Form 10-QSB for the period ended June 30, 1999, filed on August 13, 1999, File No. 000-30248). |
| | | |
| 10.6 | | Lease Agreement between The Jacksonville Bank and ABS Laura Street, LLC (incorporated herein by reference to Exhibit 10.1 to Form 10-QSB for the period ended September 30, 2004 filed on November 15, 2004, File No. 000-30248). |
| | | |
| 10.7 | | Amendment to Lease Agreement between The Jacksonville Bank and ABS Laura Street, LLC (incorporated herein by reference to Exhibit 10.2 to Form 10-QSB for the period ended September 30, 2004 filed on November 15, 2004, File No. 000-30248). |
| | | |
| 10.8 | | Second Amendment to Lease Agreement between The Jacksonville Bank and ABS Laura Street, LLC (incorporated herein by reference to Exhibit 10.3 to Form 10-QSB for the period ended September 30, 2004 filed on November 15, 2004, File No. 000-30248). |
| | | |
| 10.9 | | Stockholders Agreement by and between Jacksonville Bancorp, Inc. and each of the directors of Heritage Bancshares, Inc. and Heritage Bank of North Florida (incorporated herein by reference to Exhibit 10.1 of the Company’s Current Report on Form 8-K filed on January 29, 2008, File No. 000-30248). |
| | | |
| 10.10 | | Non-Competition Agreement Related to the Sale of Goodwill by and between Jacksonville Bancorp, Inc. and each of the directors of Heritage Bancshares, Inc. and Heritage Bank of North Florida (incorporated herein by reference to Exhibit 10.2 of the Company’s Current Report on Form 8-K filed on January 29, 2008, File No. 000-30248). |
| 10.11 | | 2008 Amendment and Restatement of Jacksonville Bancorp, Inc. 2006 Stock Incentive Plan (incorporated herein by reference to Appendix A of the Company’s Definitive Proxy Statement filed on March 28, 2008, File No. 000-30248). |
| | | |
| 21 | | Subsidiaries of the Registrant.* |
| | | |
| 23.1 | | Consent of Crowe Horwath LLP, Independent Registered Public Accounting Firm.* |
| | | |
| 31.1 | | Certification of Chief Executive Officer required by Rule 13a-14(a)/15d-14(a) of the Exchange Act.* |
| | | |
| 31.2 | | Certification of Chief Financial Officer required by Rule 13a-14(a)/15d-14(a) of the Exchange Act.* |
| | | |
| 32.1 | | Certification of Chief Executive Officer pursuant to 18 U.S.C. Section 1350, as adopted pursuant to Section 906 of the Sarbanes-Oxley Act of 2002.* |
| | | |
| 32.2 | | Certification of Chief Financial Officer pursuant to 18 U.S.C. Section 1350, as adopted pursuant to Section 906 of the Sarbanes-Oxley Act of 2002.* |
*Filed herewith