UNITED STATES SECURITIES AND EXCHANGE COMMISSION
Washington D.C. 20549
FORM 10-K
| ý | Annual Report Pursuant to Section 13 or 15(d) of the Securities Exchange Act of 1934 for the Fiscal Year Ended June 30, 2007 |
OR
| o | Transition Report Pursuant to Section 13 or 15(d) of the Securities Exchange Act of 1934 |
Commission File Number 0-25509
FIRST FEDERAL BANKSHARES, INC.
(Exact name of registrant as specified in its charter)
Delaware | 42-1485449 |
| (State or other jurisdiction of | (I.R.S. employer |
| incorporation or organization) | identification number) |
| | |
329 Pierce Street, Sioux City, Iowa | 51101 |
| (Address of principal executive offices) | Zip code |
(712) 277-0200
(Registrant’s telephone number)
Securities Registered Pursuant to Section 12(b) of the Act:
| Title of each class | Name of exchange on which registered |
Common Stock, par value $0.01 per share | The NASDAQ Stock Market LLC |
| | |
Securities Registered Pursuant to Section 12(g) of the Act: None
Indicate by check mark if the Registrant is a well-known seasoned issuer, as defined in Rule 405 of the Securities Act. YES o. NO ý.
Indicate by check mark if the Registrant is not required to file reports pursuant to Section 13 or Section 15(d) of the Act. YES o. NO ý.
Indicate by check mark whether the Registrant (1) has filed all reports required to be filed by Section 13 or 15(d) of the Securities Exchange Act of 1934 during the preceding twelve months (or for such shorter period that the Registrant was required to file such reports) and (2) has been subject to such filing requirements for the past 90 days. YES ý. NO o.
Indicate by check mark if disclosure of delinquent filers pursuant to Item 405 of Regulation S-K is not contained herein, and will not be contained, to the best of Registrant’s knowledge, in definitive proxy or information statements incorporated by reference in Part III of this Form 10-K or any amendment to this Form 10-K. o.
Indicate by check mark whether the Registrant is a large accelerated filer, an accelerated filer, or a non-accelerated filer. See definition of “accelerated filer and large accelerated filer” in Rule 12b-2 of the Exchange Act. (Check One)
Large Accelerated Filer o | Accelerated Filer ý | Non-Accelerated Filer o |
Indicate by check mark whether the Registrant is a shell company (as defined in Rule 12b-2 of the Securities Exchange Act of 1934). YES o. NO ý.
The aggregate market value of the voting stock held by non-affiliates of the Registrant, computed by reference to the last sale price, as reported by the NASDAQ Global Market, on December 31, 2006 was $64,426,215. This amount does not include shares held by the Company’s Employee Stock Ownership Plan and by officers and directors.
As of August 31, 2007, there were issued and outstanding 3,302,971 shares of the Registrant’s Common Stock.
DOCUMENTS INCORPORATED BY REFERENCE
Part II and III of Form 10K – Portions of Registrant’s definitive proxy statement for the 2007 annual stockholders meeting.
Forward-Looking Statements
This report may contain certain forward-looking statements within the meaning of Section 27A of the Securities Act of 1933, as amended (the “Securities Act”), and Section 21E of the Securities Exchange Act of 1934, as amended (the “Exchange Act”), that involve substantial risks and uncertainties. When used in this report, or in the documents incorporated by reference herein, the words “anticipate”, “believe”, “estimate”, “expect”, “intend”, “may”, and similar expressions identify such forward-looking statements. Actual results, performance or achievements could differ materially from those contemplated, expressed or implied by the forward-looking statements contained herein. These forward-looking statements are based largely on the expectations of the Company’s management and are subject to a number of risks and uncertainties, including but not limited to economic, competitive, regulatory, and other factors affecting the Company’s operations, markets, products and services, as well as strategies and other factors discussed elsewhere in this report. Many of these factors are beyond the Company’s control.
PART I
First Federal Bankshares, Inc.
First Federal Bankshares, Inc. (the “Company”) is a Delaware corporation that serves as the holding company for Vantus Bank (formerly known as “First Federal Bank”), a federally-chartered stock savings bank headquartered in Sioux City, Iowa (the “Bank”). Included in this section is information regarding the Company’s significant operating and accounting policies, practices and procedures, its competitive and regulatory markets, and its business environment. Information regarding the Company’s current financial condition and results of operations is included in Part II, Item 7, “Management’s Discussion and Analysis of Financial Condition and Results of Operations”, Part II, Item 7A, “Quantitative and Qualitative Disclosures about Market Risk”, and Part II, Item 8, “Financial Statements and Supplementary Data.” This section should be read in conjunction with those sections.
As of June 30, 2007, the Company owned 100% of the Bank’s common stock, and currently engages in no substantial activities other than its ownership of such common stock. Consequently, its net income is derived primarily from the Bank’s operation. At June 30, 2007, the Company had total assets of $645.8 million, net loans of $430.1 million, total deposits of $507.9 million, and stockholders’ equity of $70.3 million. Both the Company and the Bank report the results of their operations on a fiscal year basis ending June 30th.
The Company’s principal executive office is located at 329 Pierce Street, Sioux City, Iowa, 51101, and its telephone number at that address is (712) 277-0200. The Company’s website is www.vantusbank.com. The Company will make available on its website, free of charge, its Annual Report on Form 10-K, Quarterly Reports on Form 10-Q, Current Reports on Form 8-K, and amendments to those reports filed pursuant to Section 13(a) or 15(d) of the Exchange Act as soon as reasonably practicable after they are filled with the Securities and Exchange Commission (“SEC”). Also available on the Company’s website are various documents relating to the corporate governance of the Company, including its Code of Ethics and Business Conduct.
Vantus Bank
The Bank is a federally-chartered stock savings bank headquartered in Sioux City, Iowa. Founded in 1923, the Bank’s deposits are federally insured by the Deposit Insurance Fund (“DIF”). The Bank is also a member of the Federal Home Loan Bank System (“FHLB”).
Effective September 4, 2007, the Bank changed its name from “First Federal Bank” to “Vantus Bank.” This change recognizes the Bank’s evolution over the past few years from a traditional savings and loan to a full-service community bank. Management believes the new name will also differentiate the Bank from its competitors and will eliminate confusion with other “First Federals” in the Bank’s current and future markets.
The Bank’s primary business is community banking, which is attracting retail and commercial deposits from the general public and originating mortgage, consumer, commercial, and other loans within its primary market areas. The Bank’s primary lending area includes northwest and central Iowa and contiguous portions of Nebraska and South Dakota. The Bank also purchases and/or participates in loans from third-party financial institutions. In general these loans are underwritten according to the same standards as those used for the Bank’s own originations and are secured by property and/or collateral located within 300 miles of Sioux City, Iowa. The Bank also invests in
mortgage-backed and related securities, securities issued by the U.S. government or government-sponsored entities, local governments, and private entities. In addition to customer deposits, the Bank obtains funding from the FHLB of Des Moines as well as certain other borrowing sources.
The Bank conducts operations through its 14 full-service offices in northwest Iowa, central Iowa, and northeast Nebraska. Of the branches located in northwest Iowa, five are located in Sioux City, one in Le Mars, and one in Onawa. In central Iowa, the Company has two locations in West Des Moines (the Company’s Jordan Creek branch opened in September 2007), and one location in Grinnell, Johnston, Monroe, and Newton. The Company also operates one branch in South Sioux City, Nebraska. The Company’s business and operating results are significantly affected by the general economic conditions prevalent in its primary market area. The Company’s primary market area is projected to experience low population growth in northwest Iowa, central Iowa, and northeast Nebraska, but strong growth in the Des Moines market area.
The Bank’s principal executive office is located at 329 Pierce Street, Sioux City, Iowa 51101, and its telephone number at that address is (712) 277-0200. The Bank’s internet site is www.vantusbank.com.
Lending Activities
General The principal lending activities of the Company are the origination or purchase of mortgage loans secured by one-to-four family residential properties, loans secured by multifamily and non-residential real estate, secured and unsecured loans to consumers, and loans and lines of credit to business entities. As of June 30, 2007, loans held for investment purposes were $430.1 million or 67 % of the Company’s total assets.
The Company has sought to make its interest earning assets more rate sensitive by actively originating variable-rate loans, such as adjustable-rate residential mortgage loans, variable-rate home equity lines of credit, shorter-term and/or variable-rate commercial real estate and commercial business loans, and medium-term second mortgages and other consumer loans.
The Company actively originates fixed-rate mortgage loans, generally with 10 to 30 year terms to maturity secured by one-to-four family residential properties. However, these loans generally are originated and underwritten for resale in the secondary mortgage market on a servicing-retained basis. The Company also actively originates loans insured or guaranteed by the U.S. Government and Iowa State Government or agencies thereof, such as Veterans Administration, Iowa Rural Development, and Federal Housing Authority loans. The Company also originates interim construction loans on one-to-four family residential properties, multi-family units, and non-residential properties.
Residential Real Estate Loans The Company originates one-to-four family, owner-occupied, residential mortgage loans secured by property located in its primary market area. As of June 30, 2007, the Company had $126.3 million, or 29% of its total loan portfolio invested in first mortgage loans secured by one-to-four family residences.
The Company currently offers residential mortgage loans for terms ranging from 10 to 30 years, and with adjustable or fixed interest rates. Origination of fixed-rate mortgage loans versus adjustable-rate mortgages (“ARM”) loans is significantly affected by the level of market interest rates, customer preference, the Company’s interest rate risk position, and loan products offered by the Company’s competitors.
The Company’s long-term fixed-rate loans generally are originated and underwritten for resale in the secondary mortgage market. Prior to the current fiscal year, these loans were generally sold on a servicing-released basis. Beginning in the current fiscal year, however, the Company began to sell a majority of these loans on a servicing-retained basis. This decision was made to provide customers with the opportunity for better service and provide future cross-sell opportunities. The retention of servicing entails certain risks and obligations outlined in a subsequent paragraph.
The Company’s ARM loans are typically retained and serviced by the Company. These loans generally adjust annually with interest rate adjustment limitations ranging from one to two percentage points per year and with a cap on total rate increases over the life of the loan. A portion of these loans may guarantee borrowers a fixed rate of interest for the first one to five years of the loan’s term. While the company has used different interest indexes over the years, the primary index for ARM loans is the one-year Treasury Constant Maturity. The Company also has purchased ARM loans with various interest rate indexes, but at terms that are otherwise similar to the loans originated by the Company.
Regulations limit the amount that a savings bank may lend relative to the appraised value of the real estate securing the loan, as determined by an appraisal at the time of loan origination. Such regulations permit a maximum loan-to-value ratio of 100% for residential property and 90% for all other real estate loans. If the loan-to-value ratio is in excess of 80%, private mortgage insurance is generally required to limit the Company’s exposure to loss. The Company also requires fire and casualty insurance, as well as title insurance or an opinion of counsel regarding good title, on all properties securing real estate loans made by the Company. The Company also purchases blanket insurance coverage to protect its interests in one-to-four family residential property collateral to the extent that the borrower lets such insurance lapse.
The Company also originates loans to finance the construction of one-to-four family residential property. However, construction lending is not a significant part of the Company’s overall lending activities because of the low level of new home construction in the Company’s primary market areas. Loans for construction of single family residential property are made with either adjustable- or fixed-rate terms. Loan proceeds are disbursed in increments as construction progresses and as inspections warrant. Construction loans are structured to be converted to permanent loans originated by the Company at the end of the construction period, which is generally six months, but not to exceed 12 months.
In addition to servicing the loans in its own portfolio, the Company services loans that it sells to third-party investors, (commonly referred to as “loans serviced for others”). Servicing mortgage loans, whether for its own portfolio or for others, includes such functions as collecting monthly principal and interest payments from borrowers, maintaining escrow accounts for real estate taxes and insurance, and making such payments on behalf of borrowers when they are due. When necessary, servicing of mortgage loans also includes functions related to the collection of delinquent principal and interest payments, loan foreclosure proceedings and disposition of foreclosed real estate. As of June 30, 2007, mortgage loans serviced for others amounted to $41.9 million.
When the Company services loans for others, it is compensated for these services through the retention of a servicing fee from borrowers’ monthly payments. The Company pays the third-party investors an agreed upon yield on the loans, which is generally less than the interest agreed to be paid by the borrowers. The difference, typically 25 basis points, is retained by the Company and recognized as servicing fee income. The Company also receives fees and interest income from ancillary sources such as delinquency charges and float on escrow and other funds.
Management believes that servicing mortgage loans for third parties provides a natural hedge against other risks inherent in the Company’s operations. That is, fluctuations in volumes of mortgage loan originations and resulting gains on sales of such loans caused by changes in market interest rates will generally be offset in part by an opposite change in the value of the Company’s mortgage servicing asset. These fluctuations are usually the result of actual loan prepayment activity that is different from that which was anticipated when the mortgage servicing rights were originally recorded. For example, if interest rates increase, the volume of mortgage originations will generally decrease and the gain on sales of such loans will decline. However, the value of the mortgage servicing rights will generally increase as the income stream from servicing extends in response to lower estimates for future prepayment activity. Mortgage servicing rights are particularly susceptible to unfavorable valuation adjustments during periods of declining interest rates during which prepayment activity typically accelerates to levels above that which had been anticipated when the servicing rights were originally recorded. For additional discussion, refer to Notes 1 and 3 of the Company’s Audited Financial Statements included herein and under Part II, Item 8, “Financial Statements and Supplementary Data” as well as Part II Item 7 “Management’s Discussion and Analysis of Financial Condition and Results of Operations”.
Multi-Family Residential Real Estate Loans The Company’s multi-family real estate loans are secured by structures such as apartment buildings and condominiums. At June 30, 2007, the Company had $47.1 million or 11% of its total loan portfolio in multi-family residential real estate loans. The terms of each multi-family residential real estate loan are negotiated on a case by case basis, although such loans typically have adjustable interest rates tied to a market index or the interest rate is fixed and the loan amortizes over 10 to 20 years with a three to ten year balloon payment.
Loans secured by multi-family residential real estate generally involve a greater degree of credit risk than one-to-four family residential mortgage loans and carry larger loan balances. This increased credit risk is a result of several factors, including the concentration of principal in a limited number of loans and borrowers, the effects of general economic conditions on income-producing properties, and the increased difficulty of evaluating and monitoring these types of loans. Furthermore, the repayment of loans secured by multi-family real estate is typically
dependent upon the successful operation of the related real estate property. If the cash flow from the project is reduced, the borrower’s ability to repay the loan may be impaired.
When making multi-family residential real estate loans, the Company considers the financial statements of the borrower, the Company’s lending history with the borrower, the debt service capabilities of the borrower, the projected cash flows of the business and the value of the collateral. These types of loans are generally supported by personal guarantees. The borrower must provide proof of the necessary insurance on the property serving as collateral. Title insurance or an attorney’s opinion based on a title search of the property is required on all first lien loans secured by real property.
The Company’s commercial loan department also originates loans for construction of multi-family properties. Construction loans generally have adjustable rates and proceeds are disbursed in increments as construction progresses subject to inspections. Construction loans on multi-family real estate are often structured to convert to permanent loans originated by the Company at the end of the construction period, which is generally 12 to 24 months.
Non-Residential Real Estate Loans The Company’s non-residential real estate loans are secured by improved property such as office buildings, industrial facilities, warehouses, retail/shopping structures, and other non-residential buildings. Loans secured by non-residential real estate constituted $150.8 million, or 35%, of the Company’s total loan portfolio at June 30, 2007. Fixed-rate non-residential real estate loans are offered with amortizations up to 20 years with balloon terms up to five years. Adjustable-rate non-residential real estate loans also have amortizations up to 20 years and the rate typically adjusts with changes in the Prime Rate as published daily in the Wall Street Journal.
When making non-residential real estate loans, the Company considers the financial statements of the borrower, the Company’s lending history with the borrower, the debt service capabilities of the borrower, the projected cash flows of the business, and the value of the collateral. These types of loans are generally supported by personal guarantees. The borrower must provide proof of the necessary insurance on the property serving as collateral. Title insurance or an attorney’s opinion based on a title search of the property is required on all first lien loans secured by real property. Insurance coverage for non-residential properties is required and monitored throughout the term of the loan.
Loans secured by non-residential real estate generally involve a greater degree of credit risk than residential mortgage loans and carry larger loan balances. This increased credit risk is a result of several factors, including the concentration of principal in a limited number of loans and borrowers, the effects of general economic conditions on income producing properties, and the increased difficulty of evaluating and monitoring these types of loans. Furthermore, the repayment of loans secured by non-residential real estate is typically dependent upon the successful operation of the related real estate project and/or the underlying business in the case of owner-occupied structures. If the cash flow from the project or underlying business is reduced, the borrower’s ability to repay the loan may be impaired.
The Company’s also originates loans for construction of non-residential properties. Construction loans generally have adjustable rates and proceeds are disbursed in increments as construction progresses subject to inspections. Construction loans on non-residential real estate are often structured to convert to permanent loans originated by the Company at the end of the construction period, which is generally 12 to 24 months.
Commercial Business Loans The Company makes commercial business loans primarily in its market area to a variety of professionals, sole proprietorships, and small- to medium-sized businesses. The Company offers term loans for fixed assets and working capital, revolving lines of credit, letters of credit, and Small Business Administration (“SBA”) guaranteed loans. At June 30, 2007, commercial business loans constituted $50.4 million, or 12%, of the Company’s total loan portfolio. Commercial business term loans are generally offered with initial fixed rates of interest for the first one to three years and with terms of up to ten years. Business lines of credit have floating rates of interest and are payable on demand, subject to annual review and renewal. Commercial business loans with variable rates of interest are generally indexed to the highest Prime Rate as published daily in the Wall Street Journal.
When making commercial business loans, the Company considers the financial statements of the borrower, the Company’s lending history with the borrower, the debt service capabilities of the borrower, the projected cash flows of the business, and the value of the collateral, if any. Commercial business loans are generally secured by a
variety of collateral including accounts receivable, inventory, and equipment, and are generally supported by personal guarantees.
Commercial business loans are considered to involve more risk than loans secured by real estate. Because commercial business loans often depend on the successful operation or management of the business, repayment of such loans may be affected by adverse conditions in the economy. Moreover, commercial business loans typically are made on the basis of the borrower’s ability to make repayment from the cash flow of the borrower’s business, and, therefore, depend substantially on the success of the business itself. Any collateral securing commercial business loans may depreciate over time, may be difficult to appraise and to liquidate, and may fluctuate in value.
Consumer Loans The Company offers consumer loans in order to provide a full range of financial services to its customers. Consumer loans totaled $57.6 million and accounted for approximately 13% of total loans as of June 30, 2007. Most of the consumer loans that the Company originates include home equity mortgage loans, home equity lines of credit, automobile loans, recreational vehicle loans, loans secured by deposit accounts and unsecured loans. Consumer loans are offered primarily on a fixed rate basis and for terms up to 180 months based on the type of collateral. The Company’s home equity loans and home improvement loans, are generally secured by the borrower’s principal residence.
The underwriting standards employed by the Company for consumer loans include a determination of the applicant’s credit history and an assessment of ability to meet existing obligations and payments on the proposed loan. Creditworthiness of the applicant is of primary consideration; however, the underwriting process also includes a comparison of the value of the collateral in relation to the proposed loan amount. The Company also requires fire and casualty insurance, as well as, title insurance or an opinion of counsel regarding good title, on all properties securing real estate loans made by the Company. The Company also purchases blanket insurance coverage to protect its interests in consumer real estate and personal property collateral to the extent that the borrower lets such insurance lapse.
Consumer loans generally have shorter terms and higher rates of interest than first mortgage real estate loans, but typically involve more credit risk than such loans because of the nature of the collateral and, in some instances, the absence of collateral. In general, consumer loans are more dependent upon the borrower's continuing financial stability, are more likely to be affected by adverse personal circumstances, and are often secured by rapidly depreciating personal property such as automobiles. In addition, various laws, including bankruptcy and insolvency laws, may limit the amount that may be recovered from a borrower. However, such risks are mitigated to some extent in the case of home equity loans and home-equity lines of credit. These types of loans are secured by a lien of the borrower's residence for which the total principal balance outstanding (including the first mortgage) does not generally exceed 100% of the property's value, although exceptions are sometimes made for high net worth or other qualifying borrowers. Home equity loans are generally fixed-rate and may have terms of up to thirty years and may include a balloon payment.
The Company believes that the higher yields earned on consumer loans compensate for the increased risk associated with such loans and that consumer loans are important to the Company's efforts to increase the interest rate sensitivity and shorten the average maturity of its loan portfolio. In conjunction with its consumer lending activities, the Company offers customers credit life and disability insurance products underwritten and administered by an independent insurance provider. The Company receives commission revenue related to the sales of these products.
Loan Solicitation and Processing Loan originations are derived from a number of sources such as walk in traffic, third-party referrals, existing customers, and calling programs. Upon receipt of a loan application, a credit report is obtained to verify specific information relating to the applicant’s credit standing. In the case of a real estate loan, an appraisal of the real estate intended to secure the proposed loan is made by an independent appraiser approved by the Company. For those loans that are sold to investors, an automated underwriting system provided by either Federal National Mortgage Association (“FNMA”) or the Federal Home Loan Mortgage Corporation (“FHLMC”) is used in many cases. Frequently, a private mortgage insurance contract underwriter approved by the investor is used. Loans that are not sold or loans that are not underwritten by a contract underwriter are reviewed by an underwriter in the Company’s loan department and/or at least one member of the Company’s internal loan committee. One-to-four family residential mortgage loans and commercial business loans with principal balances in excess of $1.0 million must be submitted by the loan department directly to a committee of the Board of Directors for approval. Multi-family and non-residential real estate loans with principal balances in excess of $3.0 million must be submitted by the loan department directly to a committee of the Board of Directors for approval. Approvals
subsequently are ratified by the full Board of Directors. Once the loan is approved, a loan commitment is promptly issued to the borrower. If the loan is approved, the commitment letter specifies the terms and conditions of the proposed loan including the amount of the loan, interest rate, amortization term, a brief description of the required collateral, and required insurance coverage.
Loan Commitments The Company issues standby loan origination commitments to qualified borrowers primarily for the construction and purchase of residential and non-residential real estate. Such commitments are made on specified terms and conditions and are made for periods of up to 90 days, during which time the interest rate is locked-in. The Company generally charges a loan fee based on a percentage of the loan amount. The Company also charges a commitment fee for single-family residential properties if the borrower receives the loan from the Company. Commitment fees are generally not charged for multi-family, non-residential real estate, and commercial business loans. The Company’s experience has been that few commitments for loans on one-to-four family residential properties expire without being funded by the Company. However, commitments to originate multi-family, non-residential real estate, and commercial business loans may not be funded.
Loan Origination and Other Fees In addition to interest earned on loans, the Company generally receives loan origination fees. To the extent that loans are originated or acquired for the Company’s portfolio, the Company defers loan origination fees and costs and amortizes such amounts as yield adjustments over the life of the loans using the interest method of amortization. Fees and costs deferred are recognized into income immediately upon the sale of the related loan. In addition to loan origination fees, the Company also receives other fees and service charges that consist primarily of late charges and loan servicing fees on loans sold. Loan origination and commitment fees are volatile sources of income. Such fees vary with the volume and type of loans and commitments made and purchased and with competitive conditions in the Company’s mortgage markets, which in turn respond to the demand for and availability of money.
Non-Performing Loans Loans are generally placed on non-accrual status and considered "non-performing" when, in the judgment of management, the probability of collection of principal or interest is deemed to be insufficient to warrant further accrual of interest. As of June 30, 2007, $1.2 million or 0.27% of gross loans were considered non-performing. When a loan is placed on non-accrual and/or non-performing status, previously accrued but unpaid interest is deducted from interest income. In general, the Company does not record accrued interest on loans 90 or more days past due. Refer to Notes 1, 3, and 4 of the Company's Audited Consolidated Financial Statements, included herein under Part II, Item 8, "Financial Statements and Supplementary Data".
When a loan is placed on non-accrual and/or non-performing status, the Company reviews the borrower’s ability to repay the debt and determines the best course of action. Actions include foreclosure, restructuring of the debt or other collection proceedings. Real estate property acquired by the Company as a result of foreclosure or deed-in-lieu of foreclosure is classified as "real estate" and is considered "non-performing" until it is sold. In addition, real estate property that in the redemption period is considered “real estate in judgment” and also considered as “real estate” and “non-performing” until it is sold. Other property acquired through adverse judgment, such as automobiles, equipment, and other depreciable assets, are classified as a "repossessed assets." Restructured loans are included in loans receivable and may or may not be included in non-performing assets depending on if the borrower can adhere to the terms of the restructure for a period of time.
Adversely Classified Loans Federal regulations require thrift institutions to classify their loans on a regular basis. Accordingly, the Company has internal policies and procedures in place to evaluate risk ratings on all loans. In addition, in connection with examinations of thrift institutions, federal examiners have authority to classify problem assets as "Substandard", "Doubtful", or "Loss". As of June 30, 2007, $2.8 million or 0.65% of gross loans was adversely classified, which includes non-performing loans. A loan is classified as "Substandard" if it is determined to involve a distinct possibility that the Company could sustain some loss if deficiencies associated with the loan are not corrected. A loan is classified as "Doubtful" if full collection is highly questionable or improbable. A loan is classified as "Loss" if it is considered uncollectible, even if a partial recovery could be expected in the future. If a loan or portion thereof is classified as "Loss", the Company must either establish a specific allowance for the portion of the asset classified as "Loss" or charge off such amount. Refer to Part II, Item 7, "Management's Discussion and Analysis of Financial Condition and Results of Operations", for additional discussion.
Allowances for Losses on Loans and Real Estate The Company's policy is to establish allowances for estimated losses on specific loans and real estate when it determines that losses are probable and estimable. In addition, the Company maintains a general loss allowance against its loan and real estate portfolios that is based on its own loss experience, management's ongoing assessment of current economic conditions, the credit risk inherent
in the portfolios, and the experience of the financial services industry. For additional information, refer to Part II, Item 7, "Management's Discussion and Analysis of Financial Condition and Results of Operations" and Notes 1, 3 and 4 of the Company's Audited Consolidated Financial Statements, included herein under Part II, Item 8, "Financial Statements and Supplementary Data."
Management of the Company believes that the current allowances established by the Company are adequate to cover probable and estimable losses in the Company's loan and real estate portfolios. However, future adjustments to these allowances may be necessary and the Company's results of operations could be adversely affected if circumstances differ substantially from the assumptions used by management in making its determinations in this regard.
Investment and Mortgage-Related Securities
The Company periodically invests in collateralized mortgage obligations (“CMOs”) and mortgage backed securities (“MBSs”) (collectively “mortgage-backed and related securities”) and other types of investment securities, including U.S. and state government obligations, securities of various federal agencies, and debt issues by various corporations, including collateralized debt obligations (“CDOs”). As of June 30, 2007, total investment securities represented $131.9 million or 20% of total assets.
The Company’s MBS portfolio is primarily issued or guaranteed by FNMA, FHLMC, and the Government National Mortgage Association (“GNMA”). The Company’s objective in investing in mortgage-backed and related securities varies from time to time depending upon market interest rates, local mortgage loan demand, and the Company’s level of liquidity. The Company’s fixed-rate MBSs are primarily held for investment and management has the intent and ability to hold such securities on a long-term basis or to maturity. Adjustable-rate MBSs are available for sale and are carried at estimated fair value. MBSs have lower credit risk than direct loans because principal and interest on the securities are either insured or guaranteed by the U.S. Government or agencies thereof.
Management believes CMOs represent attractive investment alternatives relative to other investment vehicles, due to the variety of maturity and repayment options available through such investments and due to the limited credit risk associated with such securities. CMOs purchased by the Company represent a participation interest in a pool of single-family residential mortgage loans and are generally rated “triple-A” by independent credit-rating agencies. In addition, such investments are secured by credit enhancements and/or subordinated tranches or are collateralized by U.S. government agency MBSs. The Company generally invests only in sequential-pay, planned amortization class ("PAC"), and targeted amortization class ("TAC") tranches that, at the time of their purchase, are not considered to be high-risk derivative securities, as defined in applicable regulations. The Company does not invest in support-, companion-, or residual-type tranches. Furthermore, the Company does not invest in interest-only, principal-only, inverse-floating-rate CMO tranches, or similar complex securities.
The Company’s CDO portfolio consists solely of trust preferred CDOs. Trust preferred CDOs represent a participation interest in a pool of trust preferred debt or subordinated notes of banks, thrifts, insurance companies and real estate investment trusts (“REITS”). The collateral of the CDOs purchased by the Company are typically 60%-70% banks, 20%-30% insurance companies, and 0%-10% REITS. Such investments are generally rated “A” or “triple-B” by independent rating agencies at the time of purchase.
Other securities held by the Company that are not guaranteed by the federal government or a government sponsored agency are limited to the four highest credit categories as established by the major independent credit rating agencies. From time to time the Company will also purchase securities issued by local governments in order to support the primary market area of the Company.
Sources of Funds
General Customer deposits are the major source of the Company’s funds for lending and other investment purposes. In addition to deposits, the Company derives funds from the amortization and prepayment of loans and mortgage-related securities, the sale or maturity of investment securities, operations and, if needed, borrowings from the FHLB and other sources. Scheduled loan principal repayments are a relatively stable source of funds, while deposit inflows and outflows and loan and security prepayments are influenced significantly by general interest rates and market conditions. FHLB and other borrowings may be used on a short-term basis to compensate for reductions in the availability of funds from other sources or on a longer term basis for general business purposes.
Deposits Consumer and commercial deposits are attracted principally from within the Company’s primary market area through the offering of a broad selection of deposit instruments including checking, regular savings, money market deposits, term certificate accounts, and individual retirement accounts. On a limited basis, the Company will negotiate interest rates to attract jumbo certificates and institutional deposits. Deposit account terms vary according to the minimum balance required, the time periods the funds must remain on deposit and the interest rate, among other factors. The Company regularly evaluates the internal cost of funds, surveys rates offered by its competitors, and its internal requirements for lending and liquidity, and executes rate changes as deemed appropriate. As of June 30 2007, deposits accounted for $507.9 million or 79% of total liabilities and equity.
From time to time, the Company has also used certificates of deposits sold through third-party brokers (brokered deposits) as an alternative to borrowings from the FHLB. FDIC regulations govern the acceptance of brokered deposits by insured depository institutions. As of June 30, 2007, the Company had $50.0 million in brokered deposits outstanding.
FHLB Advances and Other Borrowings The Company may rely upon borrowings from the FHLB to supplement its supply of lendable funds and to meet deposit withdrawal requirements. Borrowings from the FHLB are secured by a certain portion of the Company’s home mortgage loans and its mortgage-related securities, as well as stock in the FHLB, a minimum amount of which the Company is required to own. The Company’s other borrowings consist of repurchase agreements made with its commercial business customers and repurchase agreements made between the Bank and other financial institutions. As of June 30, 2007, FHLB advances and other borrowings were $62.2 million and accounted for approximately 10% of the Company’s total liabilities and equity. Borrowings from the FHLB are made pursuant to several different programs. Each credit program has its own interest rate and range of maturities.
The Company also has a $5.0 million line of credit with another financial institution to provide liquidity at the holding company level. The purpose of this line of credit is to provide cash for stock buybacks or to provide the holding company the ability to inject capital into the Bank. As of June 30, 2007, the balance on the line of credit was zero and the line has not been drawn on during fiscal year 2007. The line of credit matures on November 1, 2007.
Subsidiary Activities
The Company has two wholly-owned subsidiaries: Vantus Bank and Equity Services, Inc (“ESI”). Since the Company engages in no other significant activities beyond its ownership of the Bank, the description of the Company’s activities in this Form 10-K effectively represents a description of the activities of the Bank. ESI is in the business of developing residential lots and dwellings in the Company’s primary market area. ESI has completed construction and sale of a 20-unit condominium in Dakota Dunes, South Dakota. It is anticipated that this is the last project for ESI and it will cease operations in fiscal year 2008. Net income (loss) from ESI was $37,000 in fiscal 2007, ($185,000) in fiscal 2006, and $9,000 in fiscal 2005. Net income (loss) includes management fees paid to the Company of $28,000 in fiscal 2007 and $24,000 in fiscal years 2006 and 2005.
The Bank has one wholly-owned subsidiary. First Financial Corporation (“FFC”), an Iowa corporation, formerly operated a title search and abstract continuation business through its wholly-owned Iowa subsidiary, Sioux Financial Company (“SFC”). During fiscal year 2007, SFC sold substantially all of the assets of its title search and abstract continuation business and ceased operations. The after tax gain on the sale of these assets was $510,000. SFC’s financial information was classified as discontinued operations in the Company’s 2007, 2006, and 2005 financial statements. FFC is also a majority owner of United Escrow, Inc. (“UEI”), which serves as an escrow agent in Woodbury County, Iowa. FFC’s net income for fiscal years 2007, 2006 and 2005 was $596,000, $124,000, and $77,000, respectively. Net income includes management fees paid to the Company of $13,000 in fiscal 2007, $108,000 in fiscal 2006 and $134,000 in fiscal 2005.
Personnel
As of June 30, 2007, the Company and its wholly-owned subsidiaries had 192 full-time equivalent employees. None of the Company’s employees is represented by a collective bargaining group. The Company believes its relationship with its employees to be good.
Competition
The Company faces significant competition both in attracting deposits and in originating loans. Its most direct competition for deposits has come historically from commercial banks, other savings associations, credit unions, brokerage houses, and insurance companies in its market area. Iowa has one of the highest concentrations of bank and thrift charters in the nation. The Company’s market area includes branches of several financial institutions that are substantially larger than the Company in terms of deposits. In addition, a growing number of the Company’s competitors are utilizing the internet to attract deposits both locally and nationwide. The Company competes for savings by offering depositors personal service and expertise together with a wide range of financial services. This competition for loans has increased substantially in recent years as a result of the large number of institutions choosing to compete in the Company’s market area. An increasing number of these institutions are using the internet to originate and underwrite loans. The Company offers a competitive internet banking product to its retail and business customers. The Company competes for loans primarily through the interest rates and loan fees it charges and the efficiency and quality of services it provides borrowers, real estate brokers, and builders. Competition for deposits, for the origination of loans, and the provision of other financial services may limit the Company’s growth and adversely impact its profitability in the future.
Regulation
As a federally-chartered, FDIC-insured, savings association, the Bank is subject to examination, supervision, and extensive regulation by the Office of Thrift Supervision (“OTS”) and the Federal Deposit Insurance Corporation (“FDIC”). This regulation and supervision establishes a comprehensive framework of activities in which an institution can engage and is intended primarily for the protection of the insurance fund and depositors. The Bank also is subject to regulation issued by the Board of Governors of the Federal Reserve System (the “Federal Reserve Board”) governing reserves to be maintained against deposits and certain other matters. The OTS examines the Bank and prepares reports for the consideration of the Bank’s Board of Directors on any deficiencies that they may find in the Bank’s operations. The FDIC also regulates the Bank in its role as the administrator of the DIF. The Bank’s relationship with its depositors and borrowers also is affected by other federal and state laws especially in such matters as the ownership of savings accounts and the form and content of the Bank’s mortgage documents. Any change in such regulation, whether by the FDIC, OTS, or the U.S. Congress, could have a material adverse impact on the Company and the Bank and their operations.
The description of certain statutory provisions and regulations applicable to savings associations set forth in the following paragraphs does not purport to be a complete description of such statutes and regulations and their effect on the Bank.
Qualified Thrift Lender Test The HOLA requires savings institutions to meet a qualified thrift lender (“QTL”) test. Under the QTL test, a savings association is required to maintain at least 65% of its “portfolio assets” (total assets less (i) specified liquid assets up to 20% of total assets, (ii) intangibles, including goodwill, and (iii) the value of property used to conduct business) in certain “qualified thrift investments,” primarily residential mortgages and related investments, including certain mortgage-backed and related securities on a monthly average basis in 9 out of every 12 months. A savings association that fails the QTL test must either convert to a bank charter or operate under certain restrictions. As of June 30, 2007, the Bank’s assets invested in qualifying investments exceeded the percentage required to qualify the Bank under the QTL Test.
Limitation on Capital Distributions OTS regulations impose limitations upon all capital distributions by savings institutions, such as cash dividends, payments to repurchase or otherwise acquire its shares, payments to stockholders of another institution in a cash-out merger and other distributions charged against capital. An institution, such as the Bank, that exceeds all capital requirements before and after a proposed capital distribution (“Tier 1 Association”) and has not been advised by the OTS that it is in need of more than normal supervision, could, after prior notice but without the approval of the OTS, make capital distributions during a calendar year equal to its net income year-to-date plus its net income for the prior two years that is still available for dividend
Loans to One Borrower Under federal law, savings associations are subject to the same limits as those applicable to national banks, which limit loans to one borrower to the greater of $500,000 or 15% of unimpaired capital and unimpaired surplus and an additional amount equal to 10% of unimpaired capital and unimpaired surplus if the loan is secured by readily marketable collateral (generally, financial instruments and bullion, but not real estate). As of June 30, 2007, the Bank’s loan to one borrower limit was $7.6 million.
Community Reinvestment Act and Fair Lending Laws Savings associations share a responsibility under the Community Reinvestment Act (“CRA”) and related regulations of the OTS to help meet the credit needs of their communities, including low- and moderate-income neighborhoods. In addition, the Equal Credit Opportunity Act and the Fair Housing Act (together, the “Fair Lending Laws”) prohibit lenders from discriminating in their lending practices on the basis of characteristics specified in those statutes. An institution’s failure to comply with the provisions of CRA could, at a minimum, result in regulatory restrictions on its activities, and failure to comply with the Fair Lending Laws could result in enforcement actions by the OTS, as well as other federal regulatory agencies and the Department of Justice. The Bank received a satisfactory CRA rating under the current CRA regulations in its most recent federal examination by the OTS.
Transactions with Related Parties The Bank’s authority to engage in transactions with related parties or “affiliates” (i.e., any company that controls or is under common control with an institution, including the Company and its non-savings institution subsidiaries) or to make loans to certain insiders, is limited by Sections 23A and 23B of the Federal Reserve Act (“FRA”). Section 23A limits the aggregate amount of transactions with any individual affiliate to 10% of the capital and surplus of the savings institution and also limits the aggregate amount of transactions with all affiliates to 20% of the savings institution’s capital and surplus. Certain transactions with affiliates are required to be secured by collateral in an amount and of a type described in Section 23A and the purchase of low-quality assets from affiliates is prohibited. Section 23B provides that certain transactions with affiliates, including loans and asset purchases, must be on terms and under circumstances, including credit standards, that are substantially the same or at least as favorable to the institution as those prevailing at the time for comparable transactions with non-affiliated companies. In addition, savings institutions are prohibited from lending to any affiliate that is engaged in activities that are not permissible for bank holding companies and no savings institution may purchase the securities of any affiliate other than a subsidiary.
The Bank’s authority to extend credit to executive officers, directors and 10% stockholders, as well as entities controlled by such persons, is currently governed by Sections 22(g) and 22(h) of the FRA, and Regulation O thereunder. Among other things, these regulations generally requires such loans to be made on terms substantially the same as those offered to unaffiliated individuals and do not involve more than the normal risk of repayment. However, the regulation permits executive officers and directors to receive the same terms through benefit or compensation plans that are widely available to other employees, as long as the director or executive officer is not given preferential treatment compared to other participating employees. Regulation O also places individual and aggregate limits on the amount of loans the Bank may make to such persons based, in part, on the Bank’s capital position, and requires certain approval procedures to be followed. At June 30, 2007, the Bank was in compliance with the regulations.
Standards for Safety and Soundness The FDI Act requires each federal banking agency to prescribe for all insured depository institutions standards relating to, among other things, internal controls, information systems and audit systems, loan documentation, credit underwriting, interest rate risk exposure, asset growth, compensation, and such other operational and managerial standards as the agency deems appropriate. The federal banking agencies adopted Interagency Guidelines Prescribing Standards for Safety and Soundness (“Guidelines”) to implement the safety and soundness standards required under the FDI Act. The Guidelines set forth the safety and soundness standards that the federal banking agencies use to identify and address problems at insured depository institutions before capital becomes impaired. The Guidelines address internal controls and information systems; internal audit systems; credit underwriting; loan documentation; interest rate risk exposure; asset growth; and compensation, fees and benefits. If the appropriate federal banking agency determines that an institution fails to meet any standard prescribed by the Guidelines, the agency may require the institution to submit to the agency an acceptable plan to achieve compliance with the standard, as required by the FDI Act. If an institution fails to meet these standards, the appropriate federal banking agency may require the institution to submit a compliance plan.
Capital Requirements The OTS capital regulations require savings institutions to meet three capital standards: a 1.5% tangible capital standard, a 4.0% leverage ratio (or core capital ratio) if not assigned a supervisory rating of “1” by the OTS, and an 8.0% risk-based capital standard. Core capital is defined as common stockholders’ equity (including retained earnings), certain non-cumulative perpetual preferred stock and related surplus, minority interests in equity accounts of consolidated subsidiaries less intangibles other than certain qualifying supervisory goodwill and certain mortgage servicing rights (“MSRs”). Tangible capital is defined as core capital less all intangible assets (including supervisory goodwill) plus a specified amount of MSRs. The OTS regulations also require that, in meeting the tangible, leverage and risk-based capital standards, institutions must deduct investments in and loans to subsidiaries engaged in activities not permissible for a national bank, and unrealized gains (losses) on certain available for sale securities.
The risk-based capital standard for savings institutions requires the maintenance of Tier 1 (core) and total capital (which is defined as core capital and supplementary capital) to risk-weighted assets of 4.0% and 8.0%, respectively. In determining the amount of risk-weighted assets, all assets, including certain off-balance sheet assets, are multiplied by a risk-weight of 0% to 100%, as assigned by the OTS capital regulation based on the risks the OTS believes are inherent in the type of asset. The components of Tier 1 (core) capital are equivalent to those discussed earlier under the 3.0% leverage ratio standard. The components of supplementary capital currently include cumulative preferred stock, long-term perpetual preferred stock, mandatory convertible securities, subordinated debt and intermediate preferred stock and allowance for loan and lease losses. Allowance for loan and lease losses includable in supplementary capital is limited to a maximum of 1.25% of risk-weighted assets. Overall, the amount of supplementary capital included as part of total capital cannot exceed 100% of core capital. As of June 30, 2007, the Bank exceeded all minimum regulatory capital requirements as specified by the FDIC. For additional discussion, refer to Note 13 of the Company’s Audited Consolidated Financial Statements, included herein under Part II, Item 8, "Financial Statements and Supplementary Data."
Insurance of Deposit Accounts The FDIC has adopted a risk-based deposit insurance assessment system. Assessments rates are based (1) the Bank’s regulatory ratings, and (2) the Bank’s financial ratios including capital ratios, credit quality issues and earning ratios, Based on the Bank’s March 31, 2007 assessment the Bank would pay an annual deposit insurance assessment of approximately 6.5 basis points or $320,000 per year. When the new assessment was adopted, the Bank received a one time assessment credit to offset costs associated with the new assessment. As of June 30, 2007, the Bank had $580,000 of assessment credit remaining.
Federal Reserve System The Federal Reserve Board regulations require savings institutions to maintain non-interest-earning reserves against their transaction accounts, such as negotiable order of withdrawal and regular checking accounts. At June 30, 2007, the Bank was in compliance with these reserve requirements. The balances maintained to meet the reserve requirements imposed by the Federal Reserve Board may be used to satisfy liquidity requirements imposed by the Office of Thrift Supervision.
Miscellaneous Business Activities The activities of savings institutions are governed by the Home Owners’ Loan Act, as amended (the “HOLA”) and, in certain respects, the Federal Deposit Insurance Act (the “FDI Act”). The federal banking statutes, as amended, (1) restrict the solicitation of brokered deposits by savings institutions that are troubled or not well-capitalized, (2) prohibit the acquisition of any corporate debt security that is not rated in one of the four highest rating categories, (3) restrict the aggregate amount of loans secured by non-residential real estate property to 400% of capital, (4) permit savings and loan holding companies to acquire up to 5% of the voting shares of non-subsidiary savings institutions or savings and loan holding companies without prior approval, and (5) permit bank holding companies to acquire healthy savings institutions.
Holding Company Regulation The Company is a non-diversified savings and loan holding company within the meaning of the HOLA. As such, the Company is registered with the OTS and is subject to OTS regulations, examinations, supervision and reporting requirements. In addition, the OTS has enforcement authority over the Company and its non-savings institution subsidiaries. Among other things, this authority permits the OTS to restrict or prohibit activities that are determined to be a serious risk to the subsidiary savings institution. The Bank must notify the OTS 30 days before declaring any dividend to the Company.
As a unitary savings and loan holding company, the Company generally will not be restricted under existing laws as to the types of business activities in which it may engage, provided that the Bank continues to be a QTL. Upon any non-supervisory acquisition by the Company of another savings association or savings bank that meets the QTL test and is deemed to be a savings institution by the OTS, the Company would become a multiple savings and loan holding company (if the acquired institution is held as a separate subsidiary) and would be subject to extensive limitations on the types of business activities in which it could engage. The HOLA limits the activities of a multiple savings and loan holding company and its non-insured institution subsidiaries primarily to activities permissible for bank holding companies under Section 4(c)(8) of the Bank Holding Company Act, subject to the prior approval of the OTS, and activities authorized by OTS regulation. The OTS is prohibited from approving any acquisition that would result in a multiple savings and loan holding company controlling savings institutions in more than one state, subject to two exceptions: (i) the approval of interstate supervisory acquisitions by savings and loan holding companies, and (ii) the acquisition of a savings institution in another state if the laws of the state of the target savings institution specifically permit such acquisitions.
The HOLA prohibits a savings and loan holding company, directly or indirectly, or through one or more subsidiaries, from acquiring another savings institution or holding company thereof, without prior written approval of the OTS. It also prohibits the acquisition or retention of, with certain exceptions, more than 5% of a non-subsidiary savings institution, a non-subsidiary holding company, or a non-subsidiary company engaged in activities other than those permitted by the HOLA; or acquiring or retaining control of an institution that is not federally insured. In evaluating applications by holding companies to acquire savings institutions, the OTS must consider the financial and managerial resources, future prospects of the company and institution involved, the effect of the acquisition on the risk to the insurance fund, the convenience and needs of the community and competitive factors.
Federal law generally provides that no “person,” acting directly or indirectly or through or in concert with one or more other persons, may acquire “control,” as that term is defined in OTS regulations, of a federally-insured savings institution without giving at least 60 days written notice to the OTS and providing the OTS an opportunity to disapprove of the proposed acquisition. Such acquisitions of control may be disapproved if it is determined, among other things, that (i) the acquisition would substantially lessen competition; (ii) the financial condition of the acquiring person might jeopardize the financial stability of the savings institution or prejudice the interests of its depositors; or (iii) the competency, experience or integrity of the acquiring person or the proposed management personnel indicates that it would not be in the interest of the depositors or the public to permit the acquisition of control by such person.
Sarbanes-Oxley Act of 2002 The Sarbanes-Oxley Act of 2002 was enacted in response to public concerns regarding corporate accountability in connection with recent accounting scandals. The stated goals of the Sarbanes-Oxley Act are to increase corporate responsibility, to provide for enhanced penalties for accounting and auditing improprieties at publicly traded companies, and to protect investors by improving the accuracy and reliability of corporate disclosures pursuant to the securities laws. The Sarbanes-Oxley Act generally applies to all companies that file or are required to file periodic reports with the SEC, under the Exchange Act.
The Sarbanes-Oxley Act includes very specific additional disclosure requirements and new corporate governance rules requiring the SEC and securities exchanges to adopt extensive additional disclosure, corporate governance and other related rules, and mandates further studies of certain issues by the SEC. The Sarbanes-Oxley Act represents significant federal involvement in matters traditionally left to state regulatory systems, such as the regulation of the accounting profession, and to state corporate law, such as the relationship between a board of directors and management and between a board of directors and its committees.
The USA Patriot Act The USA Patriot Act gave the federal government new powers to address terrorist threats through enhanced domestic security measures, expanded surveillance powers, increased information sharing and broadened anti-money laundering requirements. Certain provisions of the Act impose affirmative obligations on a broad range of financial institutions, including thrifts, like the Bank. These obligations include enhanced anti-money laundering programs, customer identification programs and regulations relating to private banking accounts or correspondence accounts in the United States for non-United States persons or their representatives (including foreign individuals visiting the United States).
The federal banking agencies have implemented regulations pursuant to the USA Patriot Act. These regulations require financial institutions to adopt the policies and procedures contemplated by the USA Patriot Act. The Bank believes it is in compliance with the requests of the law.
Federal Securities Law Shares of the Company’s common stock are registered with the SEC under Section 12(g) of the Exchange Act. The Company is also subject to the proxy rules, tender offer rules, insider trading restrictions, annual and periodic reporting, and other requirements of the Exchange Act.
Federal and State Taxation
Federal Taxation The Company is subject to those rules of federal income taxation generally applicable to Companies under the Internal Revenue Code of 1986, as amended (the "IRC"). The Company, the Bank, and the Bank’s wholly owned subsidiaries file a consolidated federal income tax return The consolidated entity pays taxes at the federal statutory rate of 35% of its taxable income, as defined in the IRC. Refer to Notes 1 and 10 of the Company’s Audited Consolidated Financial Statements, included herein under Part II, Item, 8, "Financial Statements and Supplemental Data," for additional discussion. As of June 30, 2007, the Company had no material disputes outstanding with the Internal Revenue Service.
Iowa Taxation The Bank currently files an Iowa franchise tax return. The state of Iowa imposes a tax on the Iowa franchise taxable income of savings institutions at the rate of 5%. Iowa franchise taxable income is generally similar to federal taxable income except that interest from state and municipal obligations is taxable, and no deduction is allowed for state franchise taxes. The Company and the Bank’s wholly-owned subsidiaries currently file a combined Iowa Corporation income tax return on a fiscal year basis. The state corporation income tax ranges from 6% to 12% depending upon Iowa corporation taxable income. Interest from federal securities is not taxable for purposes of the Iowa corporation income tax.
Delaware Taxation Delaware franchise taxes are imposed on the Company. This tax is based on computations involving the Company’s number of authorized shares outstanding or assumed par value of its capital. The tax is not based on the Company’s earnings.
Nebraska Taxation Nebraska franchise taxes are imposed on the Bank. The tax is calculated based on the dollar amount of deposits located in the branches in Nebraska. The amount of tax paid to the state of Nebraska on an annual basis is not significant.
The Company’s earnings are significantly affected by general business and economic conditions, including credit risk and interest rate risk.
The Company’s business and earnings are sensitive to general business and economic conditions in the United States and, in particular, the states where it has significant operations. These conditions include short-term and long-term interest rates, inflation, monetary supply, fluctuations in both debt and equity capital markets, the strength of the U.S. and local economies, consumer spending, borrowing and saving habits, and fluctuations in the housing market. For example, an economic downturn, increase in unemployment or higher interest rates could decrease the demand for loans and other products and services and/or result in a deterioration in credit quality and/or loan performance and collectability. Nonpayment of loans, if it occurs, could have an adverse effect on the Company’s financial condition and results of operations. Higher interest rates also could increase the Company’s cost to borrow funds and increase the rate the Company pays on deposits.
The banking and financial services industry is highly competitive, which could adversely affect the Company’s financial condition and results of operations.
The Company operates in a highly competitive environment in the products and services the Company offers and the markets in which the Company serves. Iowa has one of the highest concentrations of bank and thrift charters in the nation. As a result, the competition among financial services providers to attract and retain customers is intense in the Company’s market areas. Customer loyalty can be easily influenced by a competitor’s new products, especially offerings that provide cost savings to the customer. Some of Company’s competitors may be better able to provide a wider range of products and services over a greater geographic area.
The Company believes the banking and financial services industry will become even more competitive as a result of legislative, regulatory and technological changes and the continued consolidation of the industry. Technology has lowered barriers to entry and made it possible for non-banks to offer products and services traditionally provided by banks, such as automatic funds transfer and automatic payment systems. Also, investment banks and insurance companies are competing in more banking businesses such as syndicated lending and consumer banking. Many of the Company’s competitors are subject to fewer regulatory constraints and have lower cost structures. The Company expects the consolidation of the banking and financial services industry to result in larger, better-capitalized companies offering a wide array of financial services and products.
Federal and state agency regulation could increase the Company’s cost structures, or have other negative effects on the Corporation.
The Company and the Bank are heavily regulated at the federal and state levels. This regulation is designed primarily to protect consumers, depositors and the banking system as a whole, not stockholders. Congress and state legislatures and federal and state regulatory agencies continually review banking laws, regulations and policies for possible changes. Changes to statutes, regulations or regulatory policies, including changes in interpretation or implementation of statutes, regulations or policies, could affect the Company in substantial and unpredictable ways including limiting the types of financial services and products the Company may offer, increasing the ability of non-banks to offer competing financial services and products and/or increasing the Company’s cost structures. Also, the Company’s failure to comply with laws, regulations or policies could result in sanctions by regulatory agencies and damage to its reputation.
The Company is dependent on senior management, and the loss of service of any of the Company’s senior executive officers could cause the Company’s business to suffer.
The Company’s continued success depends to a significant extent upon the continued services of its senior management. The loss of services of any of The Company’s senior executive officers could cause The Company’s business to suffer. In addition, The Company’s success depends in part upon senior management’s ability to implement The Company’s business strategy.
The Company’s stock price can be volatile.
The Company’s stock price can fluctuate widely in response to a variety of factors including actual or anticipated variations in the Company’s quarterly results; new technology or services by the Company’s competitors; unanticipated losses or gains due to unexpected events, including losses or gains on securities held for investment purposes; significant acquisitions or business combinations, strategic partnerships, joint ventures or capital commitments by or involving the Company’s or its competitors; changes in accounting policies; failure to integrate the Company’s acquisitions or realize anticipated benefits from the Company’s acquisitions; or changes in government regulations.
General market fluctuations, industry factors and general economic and political conditions, such as economic slowdowns or recessions, interest rate changes, credit loss trends or currency fluctuations, also could cause the Company’s stock price to decrease regardless of its operating results.
ITEM 1B | UNRESOLVED STAFF COMMENTS |
The Company does not have any unresolved comments from the Securities and Exchange Commission.
The Company conducts its business through its main office located in Sioux City, Iowa, and 14 branch offices located in northwest and central Iowa. As of June 30, 2007, the Company owned the building and land for 13 of its offices and leased the building of one of its properties. The aggregate net book value of the Company’s premises and equipment was $16.2 million at June 30, 2007.
There are various claims and lawsuits in which the Company is periodically involved incident to the Company’s business. In the opinion of management, no material loss is expected from any of such pending claims or lawsuits.
ITEM 4 | SUBMISSION OF MATTERS TO A VOTE OF SECURITY HOLDERS |
No matters were submitted during the fourth quarter of fiscal 2007 to a vote of security holders.
PART II
| ITEM 5 | MARKET FOR REGISTRANT’S COMMON EQUITY, RELATED STOCKHOLDER MATTERS AND ISSUER PURCHASES OF EQUITY SECURITIES |
The Company’s common stock is listed on the NASDAQ Global Market under the symbol “FFSX.” As of August 31, 2007, the Company had 1,728 stockholders of record (excluding the number of persons or entities holding stock in nominee or “street” name through various brokerage firms), and 3,302,971 shares outstanding. The following table sets forth market price and dividend information for the Company’s common stock. Information is presented for each quarter of the previous two fiscal years.
Fiscal Year Ended June 30, 2007 | | High | | | Low | | | Closing Price | | | Cash Dividends Declared | |
| | | | | | | | | | | | | |
| First quarter | | $ | 22.00 | | | $ | 21.50 | | | $ | 21.70 | | | $ | 0.100 | |
| Second quarter | | | 22.51 | | | | 21.40 | | | | 21.70 | | | | 0.105 | |
| Third quarter | | | 22.22 | | | | 21.31 | | | | 21.31 | | | | 0.105 | |
| Fourth quarter | | | 21.55 | | | | 18.50 | | | | 19.44 | | | | 0.105 | |
Fiscal Year Ended June 30, 2006 | | High | | | Low | | | Closing Price | | | Cash Dividends Declared | |
| | | | | | | | | | | | | | | | | |
| First quarter | | $ | 20.75 | | | $ | 19.25 | | | $ | 19.25 | | | $ | 0.10 | |
| Second quarter | | | 20.50 | | | | 17.30 | | | | 19.45 | | | | 0.10 | |
| Third quarter | | | 22.90 | | | | 19.11 | | | | 22.60 | | | | 0.10 | |
| Fourth quarter | | | 22.75 | | | | 21.00 | | | | 21.70 | | | | 0.10 | |
Payment of dividends on the Common Stock is subject to determination and declaration by the Board of Directors and will depend upon a number of factors, including capital requirements, regulatory limitations on the payment of dividends, the Company’s results of operations and financial condition, tax considerations and general economic conditions. No assurance can be given that dividends will be declared or, if declared, what the amount of dividends will be, or whether such dividends, once declared, will continue.
In December 2005, the Company announced a share repurchase plan that allows the Company to purchase 346,000 shares or 10% of the then-issued and outstanding stock. The plan was extended in October 2006 and expires October 2007. The table below describes the repurchase activity for the quarter ended June 30, 2007.
Period | | Total Number of Shares Purchased | | | Average Price Paid Per Share | | | Total Number of Shares Purchased as Part of Publicly Announced Program | | | Maximum Number of Shares that May Yet Be Purchased Under the Program | |
| April 1 through April 30, 2007 | | | - | | | | - | | | | - | | | | 186,495 | |
| May 1 through May 31, 2007 | | | - | | | | - | | | | - | | | | 186,495 | |
| June 1 through June 30, 2007 | | | 6,400 | | | $ | 18.84 | | | | 6,400 | | | | 180,095 | |
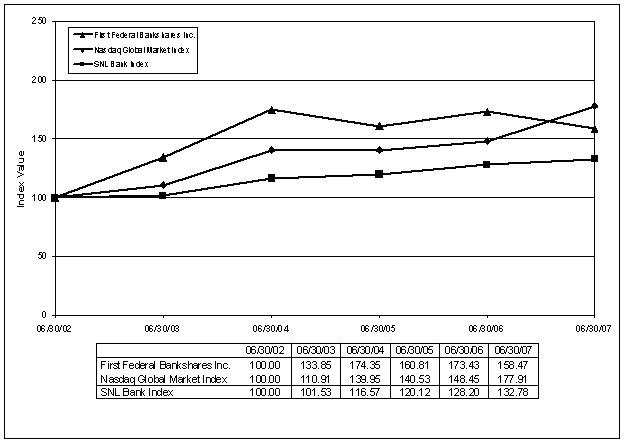
Set forth below is a stock performance graph comparing the yearly cumulative total return on the Company’s Common Stock with (a) the yearly cumulative total return on stocks included in the Nasdaq Global market Index, and (b) the yearly cumulative return on stocks included in the SNL Bank Index. The cumulative total return on the Company’s common stock was computed assuming the reinvestment of dividends at the frequency rate which dividends were paid during the period shown, and reflects the exchange of 1.64696 shares of Company Common Stock for each share of Bank Common Stock in April 1999. The information presented below is for the period beginning on June 30, 2002 and ending June 30, 2007.
There can be no assurances that the Company’s stock performance will continue in the future with the same or similar trend depicted in the graph. The Company will not make or endorse any predictions as to future stock performance.
Please refer to item 12, “Security Ownership of Certain Beneficial Owners and Related Stockholder Matters” for discussion of the Company’s equity-based compensation plans.
ITEM 6 SELECTED CONSOLIDATED FINANCIAL AND OTHER DATA
The following table sets forth certain selected consolidated financial and other data of the Company at the dates and for the periods indicated. For additional financial information about the Company, reference is made to Item 7, "Management's Discussion and Analysis of Financial Condition and Results of Operations" and the Consolidated Financial Statements of the Company and related notes included elsewhere herein.
(Dollars in thousands, except per share amounts) | | | | | | | | | | | | | | | |
Financial Condition at June 30 | | 2007 | | | 2006 | | | 2005 | | | 2004 | | | 2003 | |
| | | | | | | | | | | | | | | | |
| Total assets | | $ | 645,817 | | | $ | 612,535 | | | $ | 586,813 | | | $ | 615,522 | | | $ | 627,879 | |
| Securities available-for-sale, at market | | | 122,309 | | | | 47,320 | | | | 49,559 | | | | 84,276 | | | | 78,112 | |
| Securities held-to-maturity, at cost | | | 9,549 | | | | 13,077 | | | | 18,197 | | | | 23,186 | | | | 44,505 | |
| Loans receivable, net | | | 430,085 | | | | 457,029 | | | | 433,447 | | | | 431,857 | | | | 415,267 | |
| Office property and equipment, net | | | 16,205 | | | | 12,545 | | | | 13,109 | | | | 13,277 | | | | 13,166 | |
| Federal Home Loan Bank (FHLB) stock, at cost | | | 3,560 | | | | 5,162 | | | | 5,762 | | | | 6,096 | | | | 5,707 | |
| Goodwill | | | 18,417 | | | | 18,417 | | | | 18,417 | | | | 18,524 | | | | 18,524 | |
| Deposits liabilities | | | 507,865 | | | | 446,056 | | | | 407,562 | | | | 429,209 | | | | 448,944 | |
| Advances from FHLB and other borrowings | | | 62,202 | | | | 92,754 | | | | 104,564 | | | | 109,886 | | | | 102,387 | |
| Stockholders’ equity | | | 70,255 | | | | 68,324 | | | | 70,295 | | | | 71,458 | | | | 69,661 | |
| | | | | | | | | | | | | | | | | | | | | |
Operations Data for Years Ended June 30 | | 2007 | | | 2006 | | | 2005 | | | 2004 | | | 2003 | |
| Total interest income | | $ | 35,775 | | | $ | 32,294 | | | $ | 29,190 | | | $ | 30,489 | | | $ | 35,117 | |
| Total interest expense | | | 19,879 | | | | 15,096 | | | | 11,839 | | | | 12,666 | | | | 16,122 | |
| Net interest income | | | 15,896 | | | | 17,198 | | | | 17,351 | | | | 17,823 | | | | 18,995 | |
| Provision for losses on loans | | | 547 | | | | 1,920 | | | | 2,985 | | | | 1,225 | | | | 1,730 | |
| Net interest income after provision for loan losses | | | 15,349 | | | | 15,278 | | | | 14,366 | | | | 16,598 | | | | 17,265 | |
| Non-interest income: | | | | | | | | | | | | | | | | | | | | |
| Service charges on deposit accounts | | | 3,078 | | | | 3,116 | | | | 3,585 | | | | 3,931 | | | | 3,702 | |
| Service charges on loans | | | 305 | | | | 365 | | | | 466 | | | | 670 | | | | 940 | |
| Gain on sale of bank branch offices | | | - | | | | - | | | | 2,185 | | | | - | | | | - | |
| Gain (loss) on sale of real estate held for development | | | 105 | | | | (222 | ) | | | 60 | | | | 150 | | | | 19 | |
| Net gain (loss) on sale of securities | | | 14 | | | | 203 | | | | (121 | ) | | | (65 | ) | | | 309 | |
| Gain on sale of loans | | | 619 | | | | 658 | | | | 760 | | | | 1,612 | | | | 1,544 | |
| Real estate related activities | | | - | | | | - | | | | - | | | | 325 | | | | 363 | |
| Other income | | | 1,675 | | | | 1,659 | | | | 1,581 | | | | 1,829 | | | | 1,773 | |
| Total non-interest income | | | 5,796 | | | | 5,779 | | | | 8,516 | | | | 8,452 | | | | 8,650 | |
| Non-interest expense: | | | | | | | | | | | | | | | | | | | | |
| Compensation and benefits | | | 10,226 | | | | 9,646 | | | | 9,763 | | | | 9,976 | | | | 9,805 | |
| Office property and equipment | | | 2,851 | | | | 2,821 | | | | 2,557 | | | | 2,510 | | | | 2,633 | |
| Other non-interest expense | | | 4,850 | | | | 4,254 | | | | 4,742 | | | | 4,529 | | | | 5,636 | |
| Total non-interest expense | | | 17,927 | | | | 16,721 | | | | 17,062 | | | | 17,015 | | | | 18,074 | |
| Income before income taxes and discontinued operations | | | 3,218 | | | | 4,336 | | | | 5,820 | | | | 8,035 | | | | 7,841 | |
| Income taxes | | | 739 | | | | 1,147 | | | | 1,762 | | | | 2,678 | | | | 2,616 | |
| Income from continuing operations | | | 2,479 | | | | 3,189 | | | | 4,058 | | | | 5,357 | | | | 5,225 | |
| Income from discontinued operations, net of tax | | | 590 | | | | 143 | | | | 155 | | | | 261 | | | | 380 | |
| Net income | | $ | 3,069 | | | $ | 3,332 | | | $ | 4,213 | | | $ | 5,618 | | | $ | 5,605 | |
| | | | | | | | | | | | | | | | | | | | | |
| Per share information: | | | | | | | | | | | | | | | | | | | | |
| Basic earnings from continuing operations | | $ | 0.75 | | | $ | 0.95 | | | $ | 1.15 | | | $ | 1.47 | | | $ | 1.34 | |
| Basic earnings from discontinued operations | | | 0.18 | | | | 0.04 | | | | 0.04 | | | | 0.07 | | | | 0.10 | |
| Basic earnings per share | | $ | 0.93 | | | $ | 0.99 | | | $ | 1.19 | | | $ | 1.54 | | | $ | 1.44 | |
| | | | | | | | | | | | | | | | | | | | | |
| Diluted earnings from continuing operations | | $ | 0.74 | | | $ | 0.94 | | | $ | 1.12 | | | $ | 1.43 | | | $ | 1.31 | |
| Diluted earnings from discontinued operations | | | 0.18 | | | | 0.04 | | | | 0.04 | | | | 0.07 | | | | 0.10 | |
| Diluted earnings per share | | $ | 0.92 | | | $ | 0.98 | | | $ | 1.16 | | | $ | 1.50 | | | $ | 1.41 | |
| | | | | | | | | | | | | | | | | | | | | |
| Cash dividends declared per common share | | $ | 0.415 | | | $ | 0.400 | | | $ | 0.400 | | | $ | 0.350 | | | $ | 0.320 | |
Selected Consolidated Financial and Other Data (Continued) | | | | | | | | | | | | | | | |
| | | | | | | | | | | | | | | | |
Key Financial Ratios and Other Data at or for the Years Ended June 30 | | | | | | | | | | | | | |
| | | | | | | | | | | | | | | | |
| | | 2007 | | | 2006 | | | 2005 | | | 2004 | | | 2003 | |
Performance Ratios: | | | | | | | | | | | | | | | |
| Return on average assets | | | 0.50 | % | | | 0.57 | % | | | 0.72 | % | | | 0.89 | % | | | 0.88 | % |
| Return on average equity | | | 4.39 | % | | | 4.75 | % | | | 5.87 | % | | | 7.93 | % | | | 7.91 | % |
| Average net interest rate spread (1) | | | 2.46 | % | | | 2.89 | % | | | 3.06 | % | | | 3.06 | % | | | 3.27 | % |
| Net yield on average interest-earning assets (2) | | | 2.90 | % | | | 3.28 | % | | | 3.34 | % | | | 3.24 | % | | | 3.42 | % |
| Average interest-earning assets to | | | | | | | | | | | | | | | | | | | | |
| average interest-bearing liabilities | | | 112.15 | % | | | 113.36 | % | | | 112.45 | % | | | 107.96 | % | | | 105.21 | % |
| Efficiency ratio (3) | | | 79.43 | % | | | 73.46 | % | | | 71.64 | % | | | 64.68 | % | | | 65.59 | % |
| | | | | | | | | | | | | | | | | | | | | |
Asset Quality Ratios: | | | | | | | | | | | | | | | | | | | | |
| Nonperforming loans to total loans | | | 0.29 | % | | | 1.41 | % | | | 0.37 | % | | | 0.99 | % | | | 1.13 | % |
| Nonperforming assets as a percentage of total assets (4) | | | 0.53 | % | | | 1.08 | % | | | 0.30 | % | | | 0.81 | % | | | 0.81 | % |
| Allowance for loan losses to total loans | | | 0.42 | % | | | 1.18 | % | | | 1.53 | % | | | 0.99 | % | | | 1.10 | % |
| Allowance for loan losses to total non-performing loans | | | 144.69 | % | | | 83.54 | % | | | 410.89 | % | | | 99.84 | % | | | 98.44 | % |
| | | | | | | | | | | | | | | | | | | | | |
Capital, Equity and Dividend Ratios: | | | | | | | | | | | | | | | | | | | | |
| Tangible capital | | | 7.83 | % | | | 7.66 | % | | | 8.38 | % | | | 8.01 | % | | | 7.65 | % |
| Core capital | | | 7.83 | % | | | 7.66 | % | | | 8.38 | % | | | 8.01 | % | | | 7.65 | % |
| Risk-based capital | | | 10.50 | % | | | 10.83 | % | | | 12.24 | % | | | 11.92 | % | | | 12.64 | % |
| Average equity to average assets ratio | | | 11.42 | % | | | 11.98 | % | | | 12.30 | % | | | 11.26 | % | | | 11.50 | % |
| Dividend payout ratio | | | 45.11 | % | | | 40.82 | % | | | 34.48 | % | | | 23.33 | % | | | 22.70 | % |
| | | | | | | | | | | | | | | | | | | | | |
Other Data: | | | | | | | | | | | | | | | | | | | | |
| Book value per common share | | $ | 20.72 | | | $ | 20.21 | | | $ | 19.81 | | | $ | 19.10 | | | $ | 18.29 | |
| Number of full-service banking offices | | | 13 | | | | 14 | | | | 14 | | | | 15 | | | | 15 | |
| | | | | | | | | | | | | | | | | | | | | |
| (1) Difference between the average tax-equivalent yield on interest-earning assets and the average cost of interest-bearing liabilities. | |
(2) Net interest income, tax-effected, as a percentage of average interest-earning assets. |
(3) Non-interest expense divided by net interest income plus non-interest income, less gain (loss) on sale of other real estate owned, investments, fixed assets and sale of bank branch offices. |
(4) Non-performing assets include non-accruing loans, accruing loans delinquent 90 days or more and foreclosed assets, but do not include restructured loans. |
| |
Selected Consolidated Financial and Other Data (Continued) | | | | | | | | | | | | |
| | | | | | | | | | | | | |
Quarterly Financial Data: | Three Months Ended |
| | | June | | | March | | | December | | | September | |
| | | 2007 | | | 2007 | | | 2006 | | | 2006 | |
| Interest income | | $ | 9,617 | | | $ | 8,945 | | | $ | 8,649 | | | $ | 8,564 | |
| Interest expense | | | 5,531 | | | | 5,102 | | | | 4,787 | | | | 4,459 | |
| Net interest income | | | 4,086 | | | | 3,843 | | | | 3,862 | | | | 4,105 | |
| Provision for loan losses | | | 13 | | | | 31 | | | | 403 | | | | 100 | |
| Net interest income after provision | | | 4,073 | | | | 3,812 | | | | 3,459 | | | | 4,005 | |
| Non-interest income | | | 1,477 | | | | 1,299 | | | | 1,471 | | | | 1,549 | |
| Non-interest expense | | | 4,703 | | | | 4,485 | | | | 4,472 | | | | 4,267 | |
| Income from continuing operations before income taxes | | | 847 | | | | 626 | | | | 458 | | | | 1,287 | |
| Income tax expense | | | 178 | | | | 120 | | | | 77 | | | | 364 | |
| Income from continuing operations | | | 669 | | | | 506 | | | | 381 | | | | 923 | |
| Income from discontinued operations, net of tax (including gain | | | | | | | | | | | | | | | | |
| on disposal of $510, net of tax, in March 2007) | | | - | | | | 514 | | | | 32 | | | | 44 | |
| Net income | | $ | 669 | | | $ | 1,020 | | | $ | 413 | | | $ | 967 | |
| Per share information: | | | | | | | | | | | | | | | | |
| Basic earnings per share: | | | | | | | | | | | | | | | | |
| Income from continuing operations | | $ | 0.20 | | | $ | 0.15 | | | $ | 0.11 | | | $ | 0.28 | |
| Income from discontinued operations | | | - | | | | 0.16 | | | | 0.01 | | | | 0.01 | |
| Net icome per share | | $ | 0.20 | | | $ | 0.31 | | | $ | 0.12 | | | $ | 0.29 | |
| Diluted earnings per share: | | | | | | | | | | | | | | | | |
| Income from continuing operations | | $ | 0.20 | | | $ | 0.15 | | | $ | 0.11 | | | $ | 0.29 | |
| Income from discontinued operations | | | - | | | | 0.15 | | | | 0.01 | | | | 0.01 | |
| Net income per share | | $ | 0.20 | | | $ | 0.30 | | | $ | 0.12 | | | $ | 0.30 | |
| | | | | | | | | | | | | | | | | |
| | | | | | | | | | | | | | | | | |
| | Three Months Ended |
| | | June | | | March | | | December | | | September | |
| | | 2006 | | | 2006 | | | 2005 | | | 2005 | |
| Interest income | | $ | 8,486 | | | $ | 8,253 | | | $ | 7,971 | | | $ | 7,585 | |
| Interest expense | | | 4,139 | | | | 3,892 | | | | 3,656 | | | | 3,409 | |
| Net interest income | | | 4,347 | | | | 4,361 | | | | 4,315 | | | | 4,176 | |
| Provision for loan losses | | | 850 | | | | 320 | | | | 510 | | | | 240 | |
| Net interest income after provision | | | 3,497 | | | | 4,041 | | | | 3,805 | | | | 3,936 | |
| Non-interest income | | | 1,551 | | | | 1,245 | | | | 1,643 | | | | 1,339 | |
| Non-interest expense | | | 4,139 | | | | 4,300 | | | | 4,126 | | | | 4,155 | |
| Income from continuing operations before income taxes | | | 909 | | | | 986 | | | | 1,322 | | | | 1,120 | |
| Income tax expense | | | 211 | | | | 248 | | | | 356 | | | | 332 | |
| Income from continuing operations | | | 698 | | | | 738 | | | | 966 | | | | 788 | |
| Income from discontinued operations, net of tax | | | 45 | | | | 28 | | | | 32 | | | | 37 | |
| Net income | | $ | 743 | | | $ | 766 | | | $ | 998 | | | $ | 825 | |
| Per share information: | | | | | | | | | | | | | | | | |
| Basic earnings per share: | | | | | | | | | | | | | | | | |
| Income from continuing operations | | $ | 0.22 | | | $ | 0.22 | | | $ | 0.28 | | | $ | 0.23 | |
| Income from discontinued operations | | | 0.01 | | | | 0.01 | | | | 0.01 | | | | 0.01 | |
| Net income per share | | $ | 0.23 | | | $ | 0.23 | | | $ | 0.29 | | | $ | 0.24 | |
| Diluted earnings per share: | | | | | | | | | | | | | | | | |
| Income from continuing operations | | $ | 0.21 | | | $ | 0.22 | | | $ | 0.28 | | | $ | 0.23 | |
| Income from discontinued operations | | | 0.01 | | | | 0.01 | | | | 0.01 | | | | 0.01 | |
| Net income per share | | $ | 0.22 | | | $ | 0.23 | | | $ | 0.29 | | | $ | 0.24 | |
| | | | | | | | | | | | | | | | | |
ITEM 7 | MANAGEMENT’S DISCUSSION AND ANALYSIS OF FINANCIAL CONDITION AND RESULTS OF OPERATIONS |
The discussion and analysis in this section should be read in conjunction with Item 8, "Financial Statements and Supplementary Data", as well as Item 7A, "Quantitative and Qualitative Disclosures about Market Risk", and Part I, Item 1, "Business".
Critical Judgments and Estimates The Company describes all of its significant accounting policies in Note 1, of the Company's Audited Consolidated Financial Statements, included herein under Item 8. Particular attention should be paid to the Company’s allowance for losses on loans, which require significant management judgments and estimates because of the inherent uncertainties surrounding this area and the subjective nature of the area. For a discussion of the judgments and estimates relating to allowances for losses on loans, refer to the appropriate section in Note 1 of the Company's Audited Consolidated Financial Statements. Additional discussion is also available in the “Non-Performing Loans”, "Adversely Classified Loans" and "Allowances for Losses on Loans" in sections of Part I, Item 1, "Business". Finally, information on the impact loss allowances have had on the Company's financial condition and results of operations for the years ending June 30, 2007, 2006, and 2005, can be found, below, in the sections entitled "Financial Condition--Non-Performing Assets" and "Results of Operations--Provisions for Loan Losses".
In addition, significant judgments and estimates are made in the valuation of the Company’s goodwill. For a discussion of the judgments and estimates relating to goodwill, refer to the appropriate section in Note 1 of the Company’s Audited Consolidated Financial Statements.
Results of Operations
Overview The Company’s earnings for the years ended June 30, 2007, 2006, and 2005, were $3.1 million, $3.3 million, and $4.2 million, respectively. These amounts represented returns on average assets of 0.50%, 0.57%, and 0.72%, respectively, and returns on average equity of 4.39%, 4.75%, and 5.87%, respectively. Diluted earnings per share during these periods were $0.92, $0.98, and $1.16, respectively. Income from continuing operations for the years ended June 30, 2007, 2006, and 3005 were $2.5 million, $3.2 million, and $4.1 million, respectively. Diluted earnings per share from continuing operations during these periods were $0.74, $0.95, and $1.12, respectively.
The change in net income from fiscal 2006 to fiscal 2007 was impacted by a decline in net interest income of $1.3 million and an increase in non-interest expense of $1.2 million. These two factors were partially offset by a $1.4 million decline in provision for loan losses. Included in net income in fiscal 2007 was a $510,000 after-tax gain on the sale of the Company’s abstract continuation and title search business.
Earnings declined in fiscal 2006 compared to fiscal 2005 because the Company sold two branch offices in fiscal 2005 which resulted in a gain of $2.2 million in that period. Partially offsetting this development was a $1.1 million decline in provision for loan losses in fiscal 2006 as compared to fiscal 2005.
The following paragraphs discuss the aforementioned changes in greater detail along with other changes in the components of net income during the fiscal years ended June 30, 2007, 2006, and 2005.
Net Interest Income Net interest income decreased by approximately $1.3 million or 7.5% and $152,000 or 0.9% during the fiscal years ended June 30, 2007 and 2006, respectively. The decrease in fiscal years 2007 and 2006 were primarily due to declines in the Company’s interest rate spread. The Company’s interest rate spread decline was due to its liabilities repricing faster than its assets during a period of rising interest rates. In addition, in fiscal 2007, loan growth slowed dramatically relative to the previous year, which had an adverse impact on asset mix and overall yield on earning assets. The decline in the Company’s interest rate spread was offset by modest increases in the Company’s earning assets.
The following table sets forth certain information relating to the Company's average balance sheet and reflects the average yield on assets and average cost of liabilities for the periods indicated and the average yields earned and rates paid. Such yields and costs are derived by dividing income or expense by the average balance of assets or liabilities, respectively, for the periods presented. Average balances are daily averages.
| | | Years ended June 30, |
| | | 2007 | | | 2006 | | | 2005 | |
| | | Average | | | | | | Average | | | Average | | | | | | Average | | | Average | | | | | | Average | |
(Dollars in thousands) | | Balance | | | Interest | | | Yield/Cost | | | Balance | | | Interest | | | Yield/Cost | | | Balance | | | Interest | | | Yield/Cost | |
| Interest-earning assets: | | | | | | | | | | | | | | | | | | | | | | | | | | | |
| Loans receivable (1) | | $ | 448,511 | | | $ | 29,845 | | | | 6.65 | % | | $ | 459,239 | | | $ | 29,252 | | | | 6.37 | % | | $ | 434,029 | | | $ | 25,845 | | | | 5.95 | % |
| Investment securities (2) | | | 97,849 | | | | 5,681 | | | | 5.80 | % | | | 65,751 | | | | 2,982 | | | | 4.55 | % | | | 87,157 | | | | 3,431 | | | | 3.94 | % |
| Short-term investments and other | | | | | | | | | | | | | | | | | | | | | | | | | | | | | | | | | | | | |
| interest-earning assets (3) | | | 9,055 | | | | 465 | | | | 5.14 | % | | | 7,146 | | | | 300 | | | | 4.19 | % | | | 6,956 | | | | 173 | | | | 2.49 | % |
| Total interest-earning assets | | | 555,415 | | | | 35,991 | | | | 6.48 | % | | | 532,136 | | | | 32,534 | | | | 6.11 | % | | | 528,142 | | | | 29,449 | | | | 5.58 | % |
| Non-interest-earning assets | | | 56,547 | | | | | | | | | | | | 52,986 | | | | | | | | | | | | 55,737 | | | | | | | | | |
| Total assets | | $ | 611,962 | | | | | | | | | | | $ | 585,122 | | | | | | | | | | | $ | 583,879 | | | | | | | | | |
| | | | | | | | | | | | | | | | | | | | | | | | | | | | | | | | | | | | | |
| Interest-bearing liabilities: | | | | | | | | | | | | | | | | | | | | | | | | | | | | | | | | | | | | |
| Deposit liabilities | | $ | 417,685 | | | $ | 16,059 | | | | 3.85 | % | | $ | 369,819 | | | $ | 10,591 | | | | 2.86 | % | | $ | 362,351 | | | $ | 7,231 | | | | 2.00 | % |
| Borrowings | | | 77,556 | | | | 3,819 | | | | 4.92 | % | | | 99,584 | | | | 4,504 | | | | 4.52 | % | | | 107,315 | | | | 4,608 | | | | 4.29 | % |
| Total interest-bearing liabilities | | | 495,241 | | | | 19,878 | | | | 4.02 | % | | | 469,403 | | | | 15,095 | | | | 3.22 | % | | | 469,666 | | | | 11,839 | | | | 2.52 | % |
| Non-interest-bearing: | | | | | | | | | | | | | | | | | | | | | | | | | | | | | | | | | | | | |
| Deposit liabilities | | | 42,055 | | | | | | | | | | | | 41,626 | | | | | | | | | | | | 38,055 | | | | | | | | | |
| Other liabilities | | | 4,801 | | | | | | | | | | | | 4,100 | | | | | | | | | | | | 4,351 | | | | | | | | | |
| Total Liabilities | | | 542,097 | | | | | | | | | | | | 515,129 | | | | | | | | | | | | 512,072 | | | | | | | | | |
| Stockholders’ equity | | | 69,865 | | | | | | | | | | | | 69,993 | | | | | | | | | | | | 71,807 | | | | | | | | | |
| Total liabilities and stockholders equity | $ | 611,962 | | | | | | | | | | | $ | 585,122 | | | | | | | | | | | $ | 583,879 | | | | | | | | | |
| | | | | | | | | | | | | | | | | | | | | | | | | | | | | | | | | | | | | |
| Net interest income (2) | | | | | | $ | 16,113 | | | | | | | | | | | $ | 17,439 | | | | | | | | | | | $ | 17,610 | | | | | |
| Interest rate spread (4) | | | | | | | | | | | 2.46 | % | | | | | | | | | | | 2.89 | % | | | | | | | | | | | 3.06 | % |
| Net yield on average | | | | | | | | | | | | | | | | | | | | | | | | | | | | | | | | | | | | |
| interest-earning assets (5) | | | | | | | | | | | 2.90 | % | | | | | | | | | | | 3.28 | % | | | | | | | | | | | 3.34 | % |
| Ratio of average interest -earning assets | | | | | | | | | | | | | | | | | | | | | | | | | | | | | | | | | |
| to average interest-bearing liabilities | | | | | | | | 112.15 | % | | | | | | | | | | | 113.36 | % | | | | | | | | | | | 112.45 | % |
| | | | | | | | | | | | | | | | | | | | | | | | | | | | | | | | | | | | | |
| | | | | | | | | | | | | | | | | | | | | | | | | | | | | | | | | | | | | |
| (1) Average balances include nonaccrual loans. Interest income includes amortization of deferred loan fees which are not material. | |
| (2) Investment securities income and yields are tax-effected. | | | | | | | | | | | | | | | | | | | | | | | | | |
| (3) Includes interest-earning deposits in other financial insttitutions. | | | | | | | | | | | | | | | | | | | | | |
(4) Interest rate spread represents the difference between the average tax-equivalent yield on interest-earning assets and the average cost of interest bearing liabilities. | |
| (5) Net yield on average interest-earning assets represents net interest income, tax-effected, as a percentage of average interest-earning assets. | |
The table below sets forth certain information regarding changes in interest income and interest expense of the Company for the periods indicated. For each category of interest-earning assets and interest-bearing liabilities, information is provided on changes attributable to (i) changes in average volume (changes in average volume multiplied by old rate); (ii) changes in rates (change in rate multiplied by old average volume); (iii) changes in rate-volume (changes in rate multiplied by the change in average volume); and (iv) the net change.
| | | Years Ended June 30, | | | | | | | | | | | | | |
| | | 2007 compared to 2006 | | | 2006 compared to 2005 |
| | | Increase (Decrease) Due To | | | Increase (Decrease) Due To |
(In thousands) | | Rate | | | Volume | | | Rate/ Volume | | | Net | | | Rate | | | Volume | | | Rate/ Volume | | | Net | |
| Interest-earning assets: | | | | | | | | | | | | | | | | | | | | | | | | |
| Loans receivable | | $ | 1,286 | | | $ | (683 | ) | | $ | (10 | ) | | $ | 593 | | | $ | 1,823 | | | $ | 1,500 | | | $ | 84 | | | $ | 3,407 | |
| Investment securities | | | 822 | | | | 1,460 | | | | 417 | | | | 2,699 | | | | 512 | | | | (831 | ) | | | (130 | ) | | | (449 | ) |
| Other interest-earning assets | | | 68 | | | | 80 | | | | 17 | | | | 165 | | | | 118 | | | | 5 | | | | 4 | | | | 127 | |
| Change in interest income | | | 2,176 | | | | 857 | | | | 424 | | | | 3,457 | | | | 2,453 | | | | 674 | | | | (42 | ) | | | 3,085 | |
| | | | | | | | | | | | | | | | | | | | | | | | | | | | | | | | | |
| Interest-bearing liabilities: | | | | | | | | | | | | | | | | | | | | | | | | | | | | | | | | |
| Deposit liabilities | | | 3,661 | | | | 1,369 | | | | 438 | | | | 5,468 | | | | 3,116 | | | | 149 | | | | 95 | | | | 3,360 | |
| Borrowings | | | 398 | | | | (996 | ) | | | (87 | ) | | | (685 | ) | | | 247 | | | | (332 | ) | | | (19 | ) | | | (104 | ) |
| Change in interest expense | | | 4,059 | | | | 373 | | | | 351 | | | | 4,783 | | | | 3,363 | | | | (183 | ) | | | 76 | | | | 3,256 | |
| Change in net interest income | | $ | (1,883 | ) | | $ | 484 | | | $ | 73 | | | $ | (1,326 | ) | | $ | (910 | ) | | $ | 857 | | | $ | (118 | ) | | $ | (171 | ) |
| | | | | | | | | | | | | | | | | | | | | | | | | | | | | | | | | |
Provision for Loan Losses Provision for loan losses was $0.5 million, $1.9 million, and $3.0 million during the years ended June 30, 2007, 2006, and 2005, respectively. Three significant events affected the Bank’s provision for loan losses during fiscal 2007: (1) the Bank entered into an agreement with a third party to market and sell $11.6 million of non-performing and classified loans, which represented a significant portion of the Bank’s non-performing and classified loans and resulted in a $1.3 million loss; (2) the Bank recorded a $1.0 million loss on the final liquidation of a loan to a construction contractor and manufacturer and a number of other credits; and (3) the Bank reduced specific and other loans loss allowances of $1.8 million as a result of these developments. The Bank’s methodology for establishing allowance for loan losses is heavily influenced by the level of the Bank’s non-performing and classified loans. As a result of the aforementioned developments, the Bank’s non-performing and classified loans declined substantially in fiscal 2007, which warranted the decline in the allowance for loan losses. Fiscal 2006 included a $0.9 million provision related to a construction contractor/manufacturer that began to experience significant cash flow problems during the period. Fiscal 2005 includes a $2.3 million provision related to an electrical contractor that experienced significant operating problems on certain large projects during the period. Both loans are no longer on the Company’s books.
As of June 30, 2007, 2006, and 2005, the Company’s allowance for loan losses was $1.8 million, $5.5 million, and $6.7 million, respectively, or 0.42%, 1.18%, and 1.53% of loans receivable, respectively. The allowance for loan losses was 145%, 83%, and 411% of non-performing loans as of the same dates, respectively. The following table summarizes the activity in the Company's allowance for loan losses during each of years indicated.
| | | At June 30, | |
(Dollars in thousands) | | 2007 | | | 2006 | | | 2005 | | | 2004 | | | 2003 | |
| Allowance for loan losses at beginning of period | | $ | 5,466 | | | $ | 6,718 | | | $ | 4,316 | | | $ | 4,615 | | | $ | 4,584 | |
| Provision charged to operations | | | 547 | | | | 1,920 | | | | 2,985 | | | | 1,225 | | | | 1,730 | |
| Charge-offs: | | | | | | | | | | | | | | | | | | | | |
| One- to four-family residential | | | (93 | ) | | | (36 | ) | | | (90 | ) | | | (109 | ) | | | (115 | ) |
| Multi-family and non-residential real estate | | | (41 | ) | | | (264 | ) | | | (8 | ) | | | (229 | ) | | | (721 | ) |
| Commercial business | | | (2,694 | ) | | | (2,516 | ) | | | (115 | ) | | | (691 | ) | | | (131 | ) |
| Consumer | | | (284 | ) | | | (457 | ) | | | (473 | ) | | | (624 | ) | | | (1,098 | ) |
| Total loans charged-off | | | (3,112 | ) | | | (3,273 | ) | | | (686 | ) | | | (1,653 | ) | | | (2,065 | ) |
| Loans transferred to held for sale | | | (1,300 | ) | | | - | | | | - | | | | - | | | | - | |
| Recoveries | | | 196 | | | | 101 | | | | 103 | | | | 129 | | | | 366 | |
| Charge-offs net of recoveries | | | (4,216 | ) | | | (3,172 | ) | | | (583 | ) | | | (1,524 | ) | | | (1,699 | ) |
| Balance at end of period | | $ | 1,797 | | | $ | 5,466 | | | $ | 6,718 | | | $ | 4,316 | | | $ | 4,615 | |
| | | | | | | | | | | | | | | | | | | | | |
| Allowance for loan losses to total loans outstanding | | | 0.42 | % | | | 1.18 | % | | | 1.53 | % | | | 0.99 | % | | | 1.10 | % |
| Allowance for loan losses to non-performing loans | | | 144.69 | % | | | 83.54 | % | | | 410.89 | % | | | 99.84 | % | | | 98.44 | % |
| Net loans charged off to average loans outstanding | | | 0.94 | % | | | 0.69 | % | | | 0.13 | % | | | 0.34 | % | | | 0.41 | % |
The following table summarizes the allocation of the Company’s allowance for loan losses and the percentage of loans in each category to total loans.
| | | |
| | | At June 30, &# 160; |
(Dollars in thousands) | | 2007 | | | 2006 | | | 2005 | | | 2004 | | | 2003 | |
| | | Amount | | | % | | | Amount | | | % | | | Amount | | | % | | | Amount | | | % | | | Amount | | | % | |
| Balance at end of period applicable to: | | | | | | | | | | | | | | | | | | | | | | | | | | | | |
| One- to four-family residential | | $ | 115 | | | | 29.23 | % | | $ | 302 | | | | 28.87 | % | | $ | 441 | | | | 32.78 | % | | $ | 457 | | | | 37.73 | % | | $ | 490 | | | | 45.68 | % |
| Multi-family and non-residential real estate | | | 428 | | | | 45.79 | % | | | 1,804 | | | | 45.17 | % | | | 1,727 | | | | 40.84 | % | | | 1,827 | | | | 33.57 | % | | | 2,377 | | | | 26.92 | % |
| Commercial business | | | 742 | | | | 11.67 | % | | | 2,597 | | | | 11.79 | % | | | 3,576 | | | | 8.50 | % | | | 970 | | | | 6.74 | % | | | 674 | | | | 3.87 | % |
| Consumer | | | 512 | | | | 13.31 | % | | | 763 | | | | 14.17 | % | | | 974 | | | | 17.88 | % | | | 1,062 | | | | 21.96 | % | | | 1,075 | | | | 23.53 | % |
| Total allowance for loan losses | | $ | 1,797 | | | | 100.00 | % | | $ | 5,466 | | | | 100.00 | % | | $ | 6,717 | | | | 100.00 | % | | $ | 4,316 | | | | 100.00 | % | | $ | 4,615 | | | | 100.00 | % |
Non-Interest Income Non-interest income for the years ended June 30, 2007, 2006, and 2005, was $5.8 million, $5.8 million, and $8.5 million, respectively. These amounts represented 27%, 25%, and 33% of the Company’s total revenue during such periods, respectively. The following paragraphs discuss the principal components of non-interest income and the primary reasons for their changes from 2006 to 2007 and 2005 to 2006.
Service Charges on Deposit Accounts Service charges on deposit accounts were $3.1 million, $3.1 million, and $3.6 million for the fiscal years ended June 30, 2007, 2006, and 2005, respectively. In fiscal 2007, the Company eliminated fees charged for use of internet banking and implemented an overdraft protection product. These changes were driven by competitive forces in the Company’s market areas. These items were offset by an increase in the per item charge of overdrafts. The declines in fiscal 2006 were be attributed to the reduction in the number of transaction accounts subject to service charges. The reduction of the accounts was largely due to the transfer of accounts in the sale of the two northwest Iowa branch offices.
Service Charges on Loans Services charges on loans totaled $305,000, $365,000, and $466,000, for the fiscal years 2007, 2006, and 2005, respectively. The declines in loan service charges were primarily due to declines in prepayment penalties due to a rising interest rate environment.
Gain on Sale of Bank Branch Offices In fiscal 2005, the Company sold two bank branch offices in northwest Iowa for a gain of $2.2 million. Management does not anticipate the Company selling any additional branches, although there can be no assurances.
Gain (Loss) on Sale of Real Estate Held for Investment In fiscal 2007, fiscal 2006, and fiscal 2005, the gain (loss) on the sale of real estate held for investment was $105,000, ($222,000), and $60,000 respectively. In fiscal 2007 the Company recognized gains on a condominium project in Dakota Dunes, South Dakota. The loss in fiscal year 2006 was due to cost overruns on a different condominium project located in Sioux City, Iowa. Management anticipates that the Dakota Dunes project will be completed in the first quarter of fiscal
2008. Once this project is completed, it is expected that no other real estate development projects will be undertaken.
Gain (loss) on Sale of Securities Gain (loss) on sale of securities in fiscal 2007, fiscal 2006, and fiscal 2005 was $14,000, $203,000, and ($121,000), respectively. The gain in fiscal 2007 was due to the sale of one trust preferred CDO. The gain in fiscal 2006 was due to the sale of another financial institution’s bank stock that was held by the holding company. Losses in fiscal 2005 were due to redemption of mutual funds from the Bank’s investment portfolio.
Gain on Sale of Loans Gain on sale of loans was $619,000, $658,000, and $760,000, for the years ended June 30, 2007, 2006, and 2005. The decrease in the gain on sale of loans was attributable to the decrease in fixed rate mortgage origination volumes. Volumes declined as interest rates increased, which in turn, reduced customer demand for mortgage loans.
Other Income Other income totaled $1.7 million in fiscal 2007 and 2006, and $1.6 million in fiscal 2005. Other income represented income primarily derived from the sale of fixed annuities and mutual funds; rental income; and income from the Company’s majority-owned escrow subsidiary, UEI.
Non-interest Expense Non-interest expense for the years ended June 30, 2007, 2006, and 2005, was $18.0 million, $16.7 million, $17.1 million, respectively. Non-interest expense as a percentage of average assets during these periods was 2.93%, 2.86%, and 2.92%, respectively. The following paragraphs discuss the principal components of non-interest expense and the primary reasons for their changes from 2006 to 2007 and 2005 to 2006.
Compensation and Benefits For fiscal years 2007, 2006, and 2005, compensation and benefits totaled $10.2 million, $9.6 million, and $9.8 million, respectively. The increase in expense in fiscal 2007 was due to annual merit increases and an increase in the number of individuals in executive management. The decrease in expense for fiscal 2006 was primarily due to the decrease the number of employees at the Company. The number of full-time-equivalent employees declined from 207 in fiscal 2005 to 198 in fiscal 2006 then decreased again to 192 in fiscal 2007. The decline in fiscal 2007 was related to the aforementioned sale of the Company’s abstract continuation business.
Office Property and Equipment In fiscal year 2007, 2006, and 2005, office property and equipment expense totaled $2.9 million, $2.8 million, and $2.6 million, respectively. The increase in fiscal 2007 was due to increases in software maintenance expense. The increase in fiscal 2006 was attributable to expenses related to the opening of a branch in Johnston, Iowa and increases in software maintenance expense. Management expects this expense item to increase next fiscal year due to the opening of two new branches in Des Moines and Ankeny, Iowa.
Data Processing, ATM and Debit Card Transaction Costs, and Other Item Processing Expense In fiscal 2007, 2006, and 2005 data processing, ATM, and other item processing expense totaled $1.0 million. No significant changes have occurred in this line item over the past three fiscal years.
Professional, Insurance, and Regulatory Professional, insurance and regulatory expense for the years ended June 30, 2007, 2006, and 2005, was $1.2 million, $1.0 million and $1.1 million, respectively. The increase from fiscal 2006 to fiscal 2007 was primarily due to increased consulting costs resulting from the Bank’s name change. The decline from fiscal 2005 to 2006 was due to expenses in 2005 related to initial set-up work regarding Sarbanes-Oxley compliance.
Advertising, Donations, and Public Relations Advertising, donations and public relations for fiscal 2007, 2006, and 2005 totaled $0.7 million. Management expects this expense to increase significantly in fiscal 2008 due to advertising related to the Bank’s brand, image and name change.
Communications, Postage, and Office Supplies Communications, postage and office supplies for fiscal 2007, and 2006, totaled $0.8 million. For fiscal 2005 this expense totaled $0.9 million. The decrease from fiscal 2005 to 2006 was primarily due to decreases in the amount of full time employees.
Other Expenses Other expenses for the years ended June 30, 2007, 2006, and 2005, were $1.2 million, $0.7 million, and $1.0 million, respectively. The increase from fiscal 2006 to 2007 was due to increased
personnel recruiting fees. The Company also expensed an employment and non-compete contract to a former executive manager. The decline in fiscal 2006 from fiscal 2005 was due to the recognition of losses from fraud and repossessed assets in fiscal 2005.
Income Tax Expense Income tax expense for the years ended June 30, 2007, 2006, and 2005, was $0.7 million, $1.1 million, and $1.8 million, respectively, or 23.0%, 26.5%, and 30.3% of pretax income, respectively. The decline in the tax rates was due to tax exempt income comprising a larger percentage of pretax income for the last three fiscal years.
Income from Discontinued Operations Income from discontinued operations represented income from the Company’s title search and abstract continuation business. Income from discontinued operations for fiscal 2007, 2006, and 2005, totaled $590,000, $142,000, and $155,000, respectively. Fiscal 2007 included a $510,000 gain on sale on substantially all of the assets related to the discontinued operation.
Financial Condition
Overview The Company’s total assets increased $33.3 million or 5.4% during fiscal year 2007. The increase was primarily due to the Company’s purchase of $50.0 million of floating-rate trust preferred securities. These assets were funded by $50.0 million in short-term brokered certificates of deposit at an after-tax annualized return on assets of approximately 1.00%. The purchase of securities was partially offset by the aforementioned sale of $11.6 million of non-performing and classified loans. Loan repayments also outpaced loan originations which resulted in total loans declining an additional $19.0 million. Cash flow from loan payments were invested into securities. Including the aforementioned $50.0 million in brokered certificates of deposit, deposit liabilities increased $61.8 million, or 13.9%. This increase was partially offset by a decrease of $30.5 million of FHLB and other borrowings.
Interest-Bearing Deposits with Banks Interest-bearing deposits with banks, which consisted of overnight investments at the FHLB, decreased by $10.6 million from $24.7 million at June 30, 2006, to $14.1 million at June 30, 2007. The decrease was principally due to excess cash being used to payoff maturing FHLB borrowings.
Securities Available-for-Sale and Held-to-Maturity Total securities increased from $60.4 at the end of fiscal year 2006 to $131.9 million at the end of fiscal year 2006. The increase was primarily due to the aforementioned $50.0 million purchase of trust preferred CDOs. Trust preferred CDOs represent a participation interest in a pool of trust preferred debt or subordinated notes of banks, thrifts, insurance companies and REITS. The collateral of the CDOs purchased by the Company are typically 60%-70% bank, 20%-30% insurance companies, and 0%-10% REITS. Such investments are generally rated “A” or “triple-B” by independent rating agencies at the time of purchase.
In recent months, volatility in world credit markets has resulted in significant price fluctuations in certain debt securities, including trust preferred CDOs. In the opinion of management, this volatility is due to market perceptions of credit risk. It does not reflect the underlying credit quality or performance of the banks, thrifts, insurance companies, or REITS, that secure the Company’s trust preferred CDOs. There has been no defaults, payment deferrals or other financial difficulties reported by the firms that secure the Company’s trust preferred CDOs. Regardless, continued volatility in the market value of these securities could result in significant fluctuations in the value of these securities. This could have an adverse effect on the Company’s comprehensive income and accumulated other comprehensive income.
The following table sets forth the carrying value of the Company’s investment securities portfolio.
| | | At June 30, | |
(Dollars in thousands) | | 2007 | | | 2006 | | | 2005 | |
| Investment securities - available-for-sale: | | | | | | | | | |
| U.S. Government and agency securities | | $ | 12,856 | | | $ | 12,662 | | | $ | 16,492 | |
| Mortgage-backed securities | | | 8,800 | | | | 13,221 | | | | 20,176 | |
| Collateralized mortgage obligations | | | 22,448 | | | | 2,331 | | | | 3,146 | |
| Collateralized debt obligations | | | 65,308 | | | | - | | | | - | |
| Other securities | | | 12,897 | | | | 19,106 | | | | 9,745 | |
| Total fair value and carrying value | | $ | 122,309 | | | $ | 47,320 | | | $ | 49,559 | |
| Total amortized cost | | $ | 122,595 | | | $ | 47,840 | | | $ | 49,305 | |
| | | | | | | | | | | | | |
| Investment securities - held to maturity: | | | | | | | | | | | | |
| Mortgage-backed securities | | $ | 4,097 | | | $ | 5,809 | | | $ | 8,331 | |
| Other securities | | | 5,452 | | | | 7,268 | | | | 9,866 | |
| Total amortized cost and carrying value | | $ | 9,549 | | | $ | 13,077 | | | $ | 18,197 | |
| Total fair value | | $ | 9,473 | | | $ | 12,972 | | | $ | 18,611 | |
The table below sets forth the scheduled maturities, carrying values, and average yields for the Company’s investment securities at June 30, 2007.
| | | One Year or Less | | | One to Five Years | | | Five to Ten Years | | | More than Ten Years | | | Total | |
| | | Carrying | | | Average | | | Carrying | | | Average | | | Carrying | | | Average | | | Carrying | | | Average | | | Carrying | | | Average | |
(Dollars in thousands) | | Value | | | Yield | | | Value | | | Yield | | | Value | | | Yield | | | Value | | | Yield | | | Value | | | Yield | |
| Investment securities available-for-sale: | | | | | | | | | | | | | | | | | | | | | | | | | | | | |
| U.S. Government and agency securities | | $ | 2,967 | | | | 3.75 | % | | $ | 9,889 | | | | 4.49 | % | | | - | | | | - | | | | - | | | | - | | | $ | 12,856 | | | | 4.32 | % |
| Mortgage-backed securities | | | - | | | | - | | | | 1,375 | | | | 4.15 | % | | $ | 146 | | | | 6.09 | % | | $ | 7,279 | | | | 5.34 | % | | | 8,800 | | | | 5.17 | % |
| Collateralized mortgage obligations | | | - | | | | - | | | | - | | | | - | | | | 1,796 | | | | 4.39 | % | | | 20,652 | | | | 5.50 | % | | | 22,448 | | | | 5.41 | % |
| Collateralized debt obligations (1) | | | - | | | | - | | | | - | | | | - | | | | - | | | | - | | | | 65,308 | | | | 7.09 | % | | | 65,308 | | | | 7.09 | % |
| Other securities | | | 4,996 | | | | 5.35 | % | | | 1,500 | | | | 8.09 | % | | | 1,077 | | | | 5.76 | % | | | 5,324 | | | | 7.66 | % | | | 12,897 | | | | 6.66 | % |
| Total available-for-sale | | $ | 7,963 | | | | 4.75 | % | | $ | 12,764 | | | | 4.88 | % | | $ | 3,019 | | | | 4.96 | % | | $ | 98,563 | | | | 6.66 | % | | $ | 122,309 | | | | 6.31 | % |
| | | | | | | | | | | | | | | | | | | | | | | | | | | | | | | | | | | | | | | | | |
| Investment securities held-to-maturity: | | | | | | | | | | | | | | | | | | | | | | | | | | | | | | | | | | | | | |
| Mortgage-backed securities | | $ | 32 | | | | 6.50 | % | | $ | 3,062 | | | | 5.73 | % | | $ | 118 | | | | 6.83 | % | | $ | 885 | | | | 6.20 | % | | $ | 4,097 | | | | 5.87 | % |
| Other securities | | | 686 | | | | 4.64 | % | | | 2,240 | | | | 6.58 | % | | | 1,005 | | | | 5.96 | % | | | 1,521 | | | | 6.30 | % | | | 5,452 | | | | 6.14 | % |
| Total held-to-maturity | | $ | 718 | | | | 4.72 | % | | $ | 5,302 | | | | 6.09 | % | | $ | 1,123 | | | | 6.05 | % | | $ | 2,406 | | | | 6.26 | % | | $ | 9,549 | | | | 6.03 | % |
| | | | | | | | | | | | | | | | | | | | | | | | | | | | | | | | | | | | | | | | | |
| Total investment securities | | $ | 8,681 | | | | 4.75 | % | | $ | 18,066 | | | | 5.23 | % | | $ | 4,142 | | | | 5.26 | % | | $ | 100,969 | | | | 6.65 | % | | $ | 131,858 | | | | 6.29 | % |
| | | | | | | | | | | | | | | | | | | | | | | | | | | | | | | | | | | | | | | | | |
| (1) Collateralized debt obligations reprice quarterly. | | | | | | | | | | | | | | | | | | | | | | | | | | | | | | | | | |
Loans Receivable Loans receivable decreased $30.6 million or 7.1% from June 30, 2006, to June 30, 2007. This decrease in multi-family real estate, non-residential real estate, and commercial business loans was partially due to the aforementioned sale of $11.6 million of classified and non-performing loans. In addition, one-to-four family, home equity and second mortgages, and automobile loans also declined. Decreases in the one-to-four family residential loans was attributed to customers preference for fixed-rate loans which the Company generally sells in the secondary market. Decreases in other non-mortgage loans were primarily due to paydowns of the Company’s indirect consumer portfolio.
The following table sets forth information regarding the Company's loan portfolio, by type of loan on the dates indicated.
(Dollars in thousands) | | 2007 | | | 2006 | | | 2005 | | | 2004 | | | 2003 | |
| One- to four-family residential (1) | | $ | 126,360 | | | | 29.38 | % | | $ | 133,630 | | | | 29.25 | % | | $ | 144,238 | | | | 33.28 | % | | $ | 164,579 | | | | 38.15 | % | | $ | 191,890 | | | | 46.21 | % |
| Multi-family residential (1) | | | 47,113 | | | | 10.95 | % | | | 51,984 | | | | 11.37 | % | | | 46,070 | | | | 10.63 | % | | | 45,156 | | | | 10.46 | % | | | 35,051 | | | | 8.44 | % |
| Non-residential real estate (1) | | | 150,839 | | | | 35.07 | % | | | 157,099 | | | | 34.38 | % | | | 133,626 | | | | 30.83 | % | | | 101,297 | | | | 23.48 | % | | | 78,064 | | | | 18.80 | % |
| Commercial business loans | | | 50,439 | | | | 11.73 | % | | | 54,586 | | | | 11.94 | % | | | 37,396 | | | | 8.63 | % | | | 29,416 | | | | 6.82 | % | | | 16,256 | | | | 3.91 | % |
| Home equity and second mortgage | | | 28,594 | | | | 6.65 | % | | | 29,850 | | | | 6.53 | % | | | 32,134 | | | | 7.41 | % | | | 38,377 | | | | 8.89 | % | | | 36,962 | | | | 8.90 | % |
| Auto loans | | | 4,054 | | | | 0.94 | % | | | 5,404 | | | | 1.18 | % | | | 9,611 | | | | 2.22 | % | | | 17,755 | | | | 4.11 | % | | | 26,292 | | | | 6.33 | % |
| Other non-mortgage loans (2) | | | 24,942 | | | | 5.80 | % | | | 30,320 | | | | 6.63 | % | | | 36,940 | | | | 8.52 | % | | | 39,651 | | | | 9.19 | % | | | 35,588 | | | | 8.57 | % |
| Loans in process, unearned | | | | | | | | | | | | | | | | | | | | | | | | | | | | | | | | | | | | | | | | |
| discounts and premiums, and net | | | | | | | | | | | | | | | | | | | | | | | | | | | | | | | | | | | | | |
| deferred loan fees and costs | | | (459 | ) | | | -0.11 | % | | | (378 | ) | | | -0.08 | % | | | 150 | | | | 0.03 | % | | | (410 | ) | | | -0.10 | % | | | (221 | ) | | | -0.05 | % |
| Subtotal | | | 431,882 | | | | 100.42 | % | | | 462,495 | | | | 101.20 | % | | | 440,165 | | | | 101.55 | % | | | 435,821 | | | | 101.00 | % | | | 419,882 | | | | 101.11 | % |
| Allowance for loan losses | | | (1,797 | ) | | | -0.42 | % | | | (5,466 | ) | | | -1.20 | % | | | (6,718 | ) | | | -1.55 | % | | | (4,316 | ) | | | -1.00 | % | | | (4,615 | ) | | | -1.11 | % |
| Total loans, net | | $ | 430,085 | | | | 100.00 | % | | $ | 457,029 | | | | 100.00 | % | | $ | 433,447 | | | | 100.00 | % | | $ | 431,505 | | | | 100.00 | % | | $ | 415,267 | | | | 100.00 | % |
| | | | | | | | | | | | | | | | | | | | | | | | | | | | | | | | | | | | | | | | | |
| (1) Includes construction loans. | | | | | | | | | | | | | | | | | | | | | | | | | | | | | | | | | | | | | | | | |
| (2) Includes other secured non-mortgage loans, unsecured personal loans and loans on deposits. | | | | | | | | | | | | | |
The following table sets forth the maturity schedule for real estate construction and commercial business loans as of June 30, 2007.
| | | | | | | | | One | | | | | | Three | | | | | | | | | | | | | | | | |
| | | Within | | | Weighted | | | Through | | | Weighted | | | Through | | | Weighted | | | Beyond | | | Weighted | | | Weighted | |
(Dollars in thousands) | | One Year | | | Rate | | | Three Years | | | Rate | | | Five Years | | | Rate | | | Five Years | | | Rate | | | Total | | | Rate | |
| Real estate construction loans: | | | | | | | | | | | | | | | | | | | | | | | | | | | | | | |
| One- to four- family properties | | | | | | | | | | | | | | | | | | | | | | | | | | | | | | |
| Adjustable | | $ | 4,471 | | | | 8.43 | % | | | - | | | | - | | | | - | | | | - | | | | - | | | | - | | | $ | 4,471 | | | | 8.43 | % |
| Fixed | | | 1,954 | | | | 7.63 | % | | | - | | | | - | | | | - | | | | - | | | | - | | | | - | | | | 1,954 | | | | 7.63 | % |
| Total one- to four-family construction | | | 6,425 | | | | 7.26 | % | | | - | | | | - | | | | - | | | | - | | | | - | | | | - | | | | 6,425 | | | | 7.26 | % |
| Multi-family properties: | | | | | | | | | | | | | | | | | | | | | | | | | | | | | | | | | | | | | | | | |
| Adjustable | | | 9,341 | | | | 8.46 | % | | | - | | | | - | | | | - | | | | - | | | | - | | | | - | | | | 9,341 | | | | 8.46 | % |
| Fixed | | | - | | | | - | | | | - | | | | - | | | | - | | | | - | | | | - | | | | - | | | | - | | | | - | |
| Total multi-family construction | | | 9,341 | | | | 8.46 | % | | | - | | | | - | | | | - | | | | - | | | | - | | | | - | | | | 9,341 | | | | 8.46 | % |
| Nonresidential properties: | | | | | | | | | | | | | | | | | | | | | | | | | | | | | | | | | | | | | | | | |
| Adjustable | | | 9,311 | | | | 8.52 | % | | | - | | | | - | | | | - | | | | - | | | | - | | | | - | | | | 9,311 | | | | 8.52 | % |
| Fixed | | | 53 | | | | 7.25 | % | | | - | | | | - | | | | - | | | | - | | | | - | | | | - | | | | 53 | | | | 7.25 | % |
| Total non-residential construction | | | 9,364 | | | | 8.25 | % | | | - | | | | - | | | | - | | | | - | | | | - | | | | - | | | | 9,364 | | | | 8.25 | % |
| Commercial business loans: | | | | | | | | | | | | | | | | | | | | | | | | | | | | | | | | | | | | | | | | |
| Adjustable | | | 19,594 | | | | 8.24 | % | | $ | 4,960 | | | | 6.11 | % | | $ | 6,942 | | | | 8.03 | % | | | - | | | | - | | | | 31,496 | | | | 7.86 | % |
| Fixed | | | 448 | | | | 8.07 | % | | | 6,459 | | | | 5.62 | % | | | 9,968 | | | | 7.19 | % | | | 2,068 | | | | 7.82 | % | | | 18,943 | | | | 6.74 | % |
| Total commercial business loans | | | 20,042 | | | | 8.82 | % | | | 11,419 | | | | 6.47 | % | | | 16,910 | | | | 7.28 | % | | | 2,068 | | | | 6.90 | % | | | 50,439 | | | | 7.69 | % |
Total real estate construction and commercial business loans | | $ | 45,172 | | | | 8.26 | % | | $ | 11,419 | | | | 7.74 | % | | $ | 16,910 | | | | 7.28 | % | | $ | 2,068 | | | | 6.90 | % | | $ | 75,569 | | | | 7.92 | % |
The Company has $30.4 million of commercial business loans that are due after June 30, 2008. Of the $30.4 million, $18.5 has fixed rates while $11.9 million have rates that are adjustable or are floating. The Company does not have any real estate construction loans that are due after June 30, 2008.
The following table sets forth the Company’s gross loan originations, loans purchased, and loans sold for the periods indicated.
| | | At June 30, | |
(Dollars in thousands) | | 2007 | | | 2006 | | | 2005 | |
| Loans originated: (1) | | | | | | | | | |
| Conventional one- to four-family real estate loans: | | | | | | | | | |
| Construction loans | | $ | 18,917 | | | $ | 16,091 | | | $ | 12,661 | |
| Loans on existing properties | | | 50,379 | | | | 54,549 | | | | 69,213 | |
| Multifamily and non-residential real estate: | | | | | | | | | | | | |
| Construction loans | | | 11,282 | | | | 21,785 | | | | 28,768 | |
| Loans on existing properties | | | 45,306 | | | | 53,825 | | | | 41,073 | |
| Commercial loans | | | 52,679 | | | | 56,811 | | | | 47,031 | |
| Consumer loans | | | 20,283 | | | | 17,165 | | | | 10,692 | |
| Total loans originated | | $ | 198,846 | | | $ | 220,226 | | | $ | 209,438 | |
| Loans purchased: | | | | | | | | | | | | |
| One- to four-family | | | - | | | $ | 239 | | | $ | 1,542 | |
| Multifamily and non-residential real estate | | $ | 15,024 | | | | 26,541 | | | | 30,606 | |
| Total loans purchased | | $ | 15,024 | | | $ | 26,780 | | | $ | 32,148 | |
| Loans sold: | | | | | | | | | | | | |
| One- to four-family | | $ | 40,658 | | | $ | 36,286 | | | $ | 34,547 | |
| Multifamily and non-residential real estate | | | 12,557 | | | | 6,831 | | | | 6,556 | |
| Commercial business loans | | | 1,039 | | | | - | | | | - | |
| Total loans sold | | $ | 54,254 | | | $ | 43,117 | | | $ | 41,103 | |
| Loans transferred on sale of branch offices | | | - | | | | - | | | $ | 17,029 | |
| (1) Originations may include draws on loans originated in prior fiscal years. | | | | | | | | | | | | |
Federal Home Loan Bank Stock The Company’s FHLB stock decreased from $5.2 million at June 30, 2006 to $3.6 million at June 30, 2007. The decrease was a direct result of reduced borrowings from the FHLB.
Goodwill The Company’s goodwill remained at by $18.4 million at June 30, 2007. The Company’s goodwill was created primarily as a result of the purchases of two other financial institutions in 1998 and 1999.
Deposit Liabilities The Company’s deposit liabilities increased by $61.8 million or 14% from $446.1 million at June 30, 2006 to $507.9 million at June 20, 2007. The increase was primarily due to the aforementioned purchase of $50.0 million of brokered certificates of deposit. In addition, the Company’s interest-bearing checking accounts increased $24.3 million. The increase in interest-bearing checking accounts was attributed to growth associated with the Company’s business checking accounts.
The following table sets forth a breakdown of the Company’s deposits at June 30, 2007.
(Dollars in thousands) | | 2007 | | | 2006 | | | 2005 | |
| | | Average Amount | | | Percent of total deposits | | | Weighted Average Rate | | | Average Amount | | | Percent of total deposits | | | Weighted Average Rate | | | Average Amount | | | Percent of total deposits | | | Weighted Average Rate | |
| Noninterest-bearing checking | | $ | 42,055 | | | | 9.15 | % | | | - | | | $ | 41,626 | | | | 10.12 | % | | | - | | | $ | 38,055 | | | | 9.50 | % | | | - | |
| | | | | | | | | | | | | | | | | | | | | | | | | | | | | | | | | | | | | |
| Interest-bearing deposit liabilities: | | | | | | | | | | | | | | | | | | | | | | | | | | | | | | | | | | | | |
| Interest-bearing checking | | | 74,852 | | | | 16.28 | % | | | 2.70 | % | | | 55,021 | | | | 13.37 | % | | | 1.57 | % | | | 46,583 | | | | 11.63 | % | | | 0.52 | % |
| Money market accounts | | | 59,330 | | | | 12.90 | % | | | 3.38 | % | | | 66,253 | | | | 16.10 | % | | | 2.65 | % | | | 75,559 | | | | 18.87 | % | | | 1.31 | % |
| Savings accounts | | | 25,782 | | | | 5.61 | % | | | 0.50 | % | | | 28,569 | | | | 6.94 | % | | | 0.50 | % | | | 33,320 | | | | 8.32 | % | | | 0.37 | % |
| Certificates of deposit | | | 257,721 | | | | 56.06 | % | | | 4.62 | % | | | 219,976 | | | | 53.47 | % | | | 3.56 | % | | | 206,889 | | | | 51.68 | % | | | 2.84 | % |
| Total interest-bearing | | | 417,685 | | | | 90.85 | % | | | 3.85 | % | | | 369,819 | | | | 89.88 | % | | | 2.86 | % | | | 362,351 | | | | 90.50 | % | | | 2.00 | % |
| Total deposit liabilities | | $ | 459,740 | | | | 100.00 | % | | | | | | $ | 411,445 | | | | 100.00 | % | | | | | | $ | 400,406 | | | | 100.00 | % | | | | |
| | | | | | | | | | | | | | | | | | | | | | | | | | | | | | | | | | | | | |
The following table sets forth the certificates of deposit in the Company classified by rates as of the dates indicated.
| | | At June 30, | |
(Dollars in thousands) | | 2007 | | | 2006 | | | 2005 | |
| Certificates of deposit classified by rate: | | | | | | | | | |
| 2% or less | | $ | 197 | | | $ | 6,011 | | | $ | 32,783 | |
| 2.01% - 3.00% | | | 3,970 | | | | 20,668 | | | | 63,147 | |
| 3.01% - 4.00% | | | 25,996 | | | | 62,573 | | | | 80,235 | |
| 4.01% - 5.00% | | | 159,774 | | | | 119,027 | | | | 27,378 | |
| over 5.00% | | | 99,226 | | | | 22,656 | | | | 8,780 | |
| Total certificates of deposit | | $ | 289,163 | | | $ | 230,935 | | | $ | 212,323 | |
The following table sets forth the amount and maturities of certificates of deposit at June 30, 2007.
| | | Amount Due |
| | | One Year | | | Over One to | | | Over Two to | | | After | | | | |
(In thousands) | | and Less | | | Two Years | | | Three Years | | | Three Years | | | Total | |
| Certificates of deposit classified by rate: | | | | | | | | | | | | | | | |
| 2% or less | | $ | 196 | | | $ | 1 | | | | - | | | | - | | | $ | 197 | |
| 2.01% - 3.00% | | | 3,111 | | | | 797 | | | $ | 12 | | | $ | 50 | | | | 3,970 | |
| 3.01% - 4.00% | | | 20,346 | | | | 3,448 | | | | 1,863 | | | | 339 | | | | 25,996 | |
| 4.01% - 5.00% | | | 130,849 | | | | 18,060 | | | | 6,869 | | | | 3,996 | | | | 159,774 | |
| over 5.00% | | | 91,317 | | | | 3,833 | | | | 632 | | | | 3,444 | | | | 99,226 | |
| Total certificates of deposit | | $ | 245,819 | | | $ | 26,139 | | | $ | 9,376 | | | $ | 7,829 | | | $ | 289,163 | |
The following table indicates the amount of the Company’s certificates of deposit and other time deposits of $100,000 or more by time remaining until maturity as of June 30, 2007.
| | | | | | Weighted | |
| | | | | | Average | |
(Dollars in thousands) | | Amount | | | Stated Rate | |
| Time remaining until maturity: | | | | | | |
| Three months or less | | $ | 58,273 | | | | 4.94 | % |
| Over three through six months | | | 10,102 | | | | 5.11 | % |
| Over six through twelve months | | | 11,390 | | | | 4.90 | % |
| Over twelve months | | | 4,750 | | | | 4.67 | % |
| Total certificates of deposit $100,000 and over | | $ | 84,515 | | | | 4.94 | % |
FHLB Advances and Other Borrowings The Company’s FHLB advances and other borrowings declined $30.5 million from $92.8 million at fiscal year-end 2006 to $62.2 million at fiscal year-end 2007. During fiscal year 2007, the Company used existing excess cash and cash generated by deposit growth to repay maturing FHLB advances.
Non-Performing and Adversely Classified Assets
The Company’s non-performing assets (consisting of non-accrual loans, real estate acquired through foreclosure or deed-in-lieu thereof, and other repossessed property) amounted to $3.4 million or 0.53% of total assets at June 30, 2007, compared to $6.6 million or 1.08% at June 30 2006. The decrease was primarily due to the aforementioned sale of non-performing and classified loans.
The following table sets forth information regarding non-accrual loans, loans past due 90 days or more and still accruing and other non-performing assets at the dates indicated.
| | | At June 30, | |
(Dollars in thousands) | | 2007 | | | 2006 | | | 2005 | | | 2004 | | | 2003 | |
| | | (Dollars in Thousands) | |
| Loans accounted for on a non-accrual basis: | | | | | | | | | | | | | | | |
| One- to four-family residential | | $ | 405 | | | $ | 1,104 | | | $ | 496 | | | $ | 966 | | | $ | 335 | |
| Multi-family residential | | | - | | | | - | | | | - | | | | - | | | | 2,426 | |
| Non-residential real estate | | | 732 | | | | 346 | | | | 143 | | | | 1,645 | | | | 628 | |
| Commercial business | | | - | | | | 4,835 | | | | 227 | | | | 113 | | | | - | |
| Consumer | | | 105 | | | | 258 | | | | 301 | | | | 267 | | | | 302 | |
| Total | | | 1,242 | | | | 6,543 | | | | 1,167 | | | | 2,991 | | | | 3,691 | |
| Loans accounted for on an accrual basis (1): | | | - | | | | - | | | | 468 | | | | 1,332 | | | | 997 | |
| Total non-performing loans | | | 1,242 | | | | 6,543 | | | | 1,635 | | | | 4,323 | | | | 4,688 | |
| Other non-performing assets (2) | | | 2,156 | | | | 73 | | | | 142 | | | | 693 | | | | 412 | |
| Total non-performing assets | | $ | 3,398 | | | $ | 6,616 | | | $ | 1,777 | | | $ | 5,016 | | | $ | 5,100 | |
| Restructured loans not included in | | | | | | | | | | | | | | | | | | | | |
| other non-performing categories above (3) | | $ | 2,827 | | | $ | 2,126 | | | $ | 7,517 | | | $ | 3,691 | | | $ | 3,005 | |
| | | | | | | | | | | | | | | | | | | | | |
| Non-performing loans as a percentage of total loans | | | 0.29 | % | | | 1.41 | % | | | 0.37 | % | | | 0.99 | % | | | 1.13 | % |
| Non-performing assets as a percentage of total assets | | | 0.19 | % | | | 1.08 | % | | | 0.30 | % | | | 0.81 | % | | | 0.81 | % |
| | | | | | | | | |
(1) Includes loans 90 days or more contractually delinquent. For fiscal years prior to 2006, delinquent FHA/VA guaranteed loans and delinquent loans with past due interest that, in the opinion of management, was collectible, were not placed on non-accrual status. |
(2) Includes the net book value of real property acquired by the Company through foreclosure or deed in lieu of foreclosure. Upon acquisition, this property is carried at the lower of cost or fair market value less estimated costs of disposition. Includes repossessed automobiles, boats and trailers carried at the lower of cost or fair market value less estimated costs of disposition. Total carrying amount was $0, $3,000 and $73,000, respectively, at June 30, 2007, 2006 and 2005. |
(3) Restructured lonas have had amounts added to the principal balance and/or the terms of the debt modified. Modification terms include payment extensions, interest only payments, and longer amortization periods, among other possible concessions. |
As of June 30, 2007, the Company’s adversely classified assets were $4.9 million compared to $7.4 million at June 30, 2006. Adversely classified assets include assets characterized as non-performing above. The decline in adversely classified assets during fiscal 2007 was primarily due to aforementioned sale of non-performing and classified loans.
The Company was closely monitoring four classified assets totaling $3.4 million that are included in the $4.9 million total. These four loans were classified “Substandard” as of that date. The following paragraphs contain a brief discussion of each relationship.
In 2005, the Bank purchased a $1.75 million participation in a $19.3 million loan for construction of a senior housing facility in Brooklyn Park, Minnesota. At the time of closing a significant portion of the units in the project were pre-sold with valid purchase agreements and escrowed deposits. The loan was paying as agreed until December of 2006. At that time the borrower started accepting requests for cancellation of the original purchase agreements based on accusations of fraud on the part of an unrelated third party responsible for marketing the project. As a result, the bank group was forced to commence foreclosure proceedings against the borrower. The loan was transferred to other assets in the fourth quarter of this fiscal year. Management believes this asset is adequately secured and no loss is expected at this time. However, there can be no assurances.
In 2002, the Bank purchased a $0.5 million participation of a $3.2 million loan to a private golf and social club. The loan was paying as agreed until December 2006. At that time the borrower notified the bank group of a significant operating shortfall. Management believes this loan is adequately secured by the underlying collateral, which consists primarily of real estate and to a lesser degree accounts receivable and equipment. No loss is expected at this time. However, there can be no assurances.
In 1999 and 2000 the Bank originated loans to an educational toy retailer. The current balance of these loans totaled $0.5 million. The borrower has experienced several years of operating losses and cash flow from that business is not sufficient to service the debt. Despite the lack of cash flow, the loan is paying as agreed due to the guarantor injecting cash into the business. Management believes this loan is adequately secured by the underlying collateral which consists of real estate and to a lesser degree inventory and equipment. No loss is expected at this time. However, there can be no assurances.
In 1999 and subsequent years the Bank originated loans to a local restaurant. The current balance of these loans totaled $0.6 million. The borrower has experienced several years of operating losses and cash flow from the business is not sufficient to service the debt. Despite the lack of cash flow, the loan is paying as agreed due to guarantor cash injections. Management does not expect a loss at this time. However, there can be no assurances.
The Bank is also monitoring four other credits that are not adversely classified, but are experiencing operating difficulty that could affect the future classification of these loans. The following paragraphs contain a brief discussion of each relationship.
In 2004, the Bank purchased $1.7 million participation of a $5.6 million tax increment financing note on a condominium project in Richfield, Minnesota. In June of 2007, the Bank was informed that the tax increment collections on the project were significantly below what was expected. The loan is current and has never been past due. The bank group is currently meeting with borrower and the city to determine the best course of action. Management does not expect a loss at this time. However, there can be no assurances.
In January of 2006 the Bank purchased $1.4 million participation of a $5.3 million loan to a concrete pumping business in Englewood, Colorado. In November 2006, the Bank was notified that the borrower was having cash flow problems stemming from the slow down in residential construction and a slower than expected ramp up of business in a new market that the borrower expanded into. In June of 2007, the borrower stated they intended to sell certain excess equipment in order to provide cash to maintain operations. In addition, the owner of the company injected additional capital into the business to keep the loans current. No loss is expected at this time. However, there can be no assurances.
In 2005 and 2006 the Bank originated loans to a real estate developer in Des Moines Iowa. The current balance of these loans was $1.3 million. Prior to June 2006, the borrower was in development and construction of real estate properties. However, a large increase in inventory has created a drain on cash and is affecting the ability
of the borrower to remain current with its debt obligations. Management is closely watching the situation and does not expect a loss at this time. However, there can be no assurances.
In 2004, the Bank originated loans to a small manufacturer. The current balance of these loans total $0.6 million. The manufacturer’s difficulties started when the owner and founder of the business passed away. The loans are current; however, capital injections will be required from the new owners in order to continue operations. The Bank is working with the borrowers to determine the ability and the level of capital they can inject into the business. Management does not expect a loss at this time. However, there can be no assurances.
Liquidity and Capital Resources
The Company's primary sources of funds are deposits obtained through its branch office network, borrowings from the FHLB and other sources, amortization, maturity, and prepayment of outstanding loans and investments, and sales of loans and other assets. During 2007, 2006, and 2005, the Company used these sources of funds to fund loan commitments, purchase loans, and cover maturing liabilities and deposit withdrawals. The Company had a total of $57.5 million of loan commitments outstanding as of June 30, 2007. In addition, at June 30, 2007, the Company had $245.8 million in certificates of deposits, $27.0 million in FHLB advances, and $6.8 million in other borrowings that were scheduled to mature within one year. Management believes that the Company has adequate resources to fund all of these obligations as well as the loan commitments it makes in the normal course of its business. The Company also believes it can adjust the rates it offers on certificates of deposit and other customer deposits to retain these deposits in changing interest rate environments. Under FHLB lending and collateralization guidelines, the Company had approximately $43.0 million in unused borrowing capacity at the FHLB as of June 30, 2007. In addition, the Company has $15.0 million in fed funds lines available with three correspondent banks.
The Bank is also required to maintain specified amounts of capital pursuant to regulations promulgated by the OTS and the FDIC. The Bank's objective is to maintain its regulatory capital in an amount sufficient to be classified in the highest regulatory capital category (i.e., as a "well-capitalized" institution). At June 30, 2007, the Bank's regulatory capital exceeded all regulatory minimum requirements, as well as the amount required to be classified as a "well-capitalized" institution. For additional discussion, refer to Note 13 of the Company's Consolidated Financial Statements, included herein under Part II, Item 8, "Financial Statements and Supplementary Data".
The Company paid cash dividends of $1.4 million, $1.3 million, and $1.4 million during the years ended June 30, 2007, 2006, and 2005, respectively. These amounts equated to dividend payout ratios of 45.1%, 40.8%, and 34.5% of the net income in such periods, respectively
The following table presents, as of June 30, 2007, the expected future payments of the Bank’s contractual obligations.
| | | Payments Due in: | |
(In thousands) | | Less than One Year | | | One Year to Less Than Three Years | | | Three Years to Less Than Five Years | | | Five Years or Greater | | | Total | |
| FHLB Advances | | $ | 27,000 | | | $ | 17,500 | | | $ | 8,000 | | | | - | | | $ | 52,500 | |
| Other borrowings (1) | | | 6,702 | | | | - | | | | - | | | $ | 3,000 | | | | 9,702 | |
| Operating lease | | | 127 | | | | 263 | | | | 283 | | | | 405 | | | | 1,078 | |
| Data Processing | | | 215 | | | | 215 | | | | 201 | | | | | | | | | |
| Off-balance-sheet (2) | | | 57,513 | | | | - | | | | - | | | | - | | | | 57,513 | |
| Total | | $ | 91,557 | | | $ | 17,978 | | | $ | 8,484 | | | $ | 3,405 | | | $ | 120,793 | |
| (1) Includes securities sold under repurchase agreements. | | | | | | | | | | | | | |
| (2) Includes commitments to extend credit, net of commitments to sell loans. | | | | | | | | | |
| ITEM 7A | QUANTITATIVE AND QUALITATIVE DISCLOSURE ABOUT MARKET RISK |
The Company has utilized the following strategies in recent years in an effort to manage interest rate risk: (a) the Company seeks to originate commercial and consumer loans; (b) the Company closely manages the extent to which fixed-rate residential mortgage loans are held in portfolio; (c) the Company seeks to lengthen the maturity of deposits, when cost effective, through the pricing and promotion of certificates of deposit; (d) the Company seeks to attract checking and other transaction accounts, which generally have a lower interest cost and tend to be less interest rate sensitive when interest rates rise; (e) the Company seeks to originate and hold in portfolio adjustable rate loans which have annual interest rate adjustments; (f) the Company uses Federal Home Loan Bank advances, within approved limits, to fund the origination of fixed rate loans; (g) the Company utilizes various investment portfolio strategies to manage the investment portfolio within the context of the entire balance sheet; and (h) the Company also uses brokered deposits and retail repurchase agreements, within approved limits, to fund loan production.
The Company has an Asset/Liability Management Committee (the “ALCO”), which includes the Company’s President, Chief Financial Officer and other senior Company officers. The ALCO meets monthly to review loan pricing and production, deposit pricing and production, interest rate risk analysis, investment portfolio activities, liquidity position and compliance with the Asset Liability Management (“ALM”) Policy and Investment Policy of the Company. The ALM Policy and the Investment Policy were established by the ALCO and approved by the Company’s Board of Directors. These policies contain specific guidance regarding balance sheet and investment portfolio management. ALCO reports are provided to the Board of Directors on a monthly basis detailing asset/liability management performance measurements.
Market Risk Management
Market risk is the risk of loss arising from adverse changes in market prices and rates. The Company's market risk is comprised primarily of interest rate risk resulting from its core banking activities of lending and deposit taking. Interest rate risk is the risk that changes in market interest rates might adversely affect the Company's net interest income or the economic value of its portfolio of assets, liabilities, and off-balance sheet contracts. Management continually develops and applies strategies to mitigate this risk. Management does not believe that the Company's primary market risk exposures and how those exposures were managed in fiscal 2007 have changed significantly when compared to prior years.
Management uses a Net Portfolio Value (“NPV”) model to monitor the interest rate risk of the Company. NPV is defined as the market value of the Company’s assets less the market value of the Company’s liabilities. The NPV of the Company, assuming no change in interest rates (the “Base Case Scenario”), was $67.4 million and $61.3 million, respectively, at June 30, 2007 and 2006. The NPV Ratio (defined as NPV divided by the market value of the Company’s assets) in the Base Case Scenario was 10.48% and 10.13%, respectively, at June 30, 2007 and 2006. The Board of Directors has established market risk limits for various interest-rate scenarios based on the Company's tolerance for risk. At June 30, 2007, the NPV Ratio was inside the board limits in all measured rate-change scenarios. The Company primarily relies on the OTS’s Net Portfolio Value Model (the “Model”) to measure its susceptibility to interest rate changes. The Model estimates the market value of each type of asset, liability, and off-balance sheet contract after various assumed instantaneous, parallel shifts in the Treasury yield curve both upward and downward.
The Model uses an option-based pricing approach to value one-to-four family mortgages, mortgages serviced by or for others, and firm commitments to buy, sell, or originate mortgages. This approach makes use of an interest rate simulation program to generate numerous random interest rate paths that, in conjunction with a prepayment model, are used to estimate mortgage cash flows. Prepayment options and interest rate caps and floors contained in mortgages and mortgage-related securities introduce significant uncertainty in estimating the timing of cash flows for these instruments that warrants the use of this sophisticated methodology. All other financial instruments are valued using a static discounted cash flow method. Under this approach, the present value is determined by discounting the cash flows the instrument is expected to generate by the yields currently available to investors from an instrument of comparable risk and duration.
The following table sets forth the market value estimates for major categories of financial instruments of the Company at June 30, 2007, as calculated by the Model. The table shows the present value of the instruments in the Base Case Scenario (no change in interest rates) and under an interest rate shock scenario of +/- 200 basis points. As illustrated in the table, the Company’s NPV decreases in the rising rate scenario. As market interest rates increase, the market values of the Company’s portfolio of loans and securities decrease and prepayments slow. Interest rate risk limits established by ALCO include: (a) a post-shock NPV ratio of 4.0% or greater; (b) the interest rate sensitivity measure resulting from an adverse rate shock of 200 basis points either up or down should not exceed 200 basis points; and (c) the OTS “level of risk” should be “minimal” or “moderate”. As of June 30, 2007 the Company’s interest rate risk, as measured by the Model, was within ALCO guidelines and the OTS “level of risk” was reported as “minimal”.
| | | Present Value Estimates by Interest Rate ScenariO | |
| | | Calculated at June 30, 2007 | |
(Dollars in thousands) | | -200 bp | | | 0 bp | | | +200 bp | | | +300 bp | |
| Net portfolio value | | $ | 74,217 | | | $ | 67,439 | | | $ | 57,819 | | | $ | 52,613 | |
| Net portfolio value ratio | | | 11.35 | % | | | 10.48 | % | | | 9.16 | % | | | 8.42 | % |
| Interest rate sensitivity | | +87bp | | | NA | | | -132bp | | | -206bp | |
ITEM 8 | FINANCIAL STATEMENTS AND SUPPLEMENTARY DATA |
First Federal Bankshares, Inc. and Subsidiaries | | | | | | |
| | | | | | | |
Consolidated Statements of Financial Condition | | | | | | |
June 30, 2007, and 2006 | | | | | | |
| | | 2007 | | | 2006 | |
| ASSETS | | | | | | |
| Cash and due from banks | | $ | 11,613,908 | | | $ | 15,157,203 | |
| Interest-bearing deposits in other financial institutions | | | 14,124,559 | | | | 24,747,546 | |
| Cash and cash equivalents | | | 25,738,467 | | | | 39,904,749 | |
| | | | | | | | | |
| Securities available-for-sale (amortized cost $122,595,377 and $47,839,382, respectively) | | | 122,309,017 | | | | 47,319,732 | |
| Securities held-to-maturity (fair value $9,472,865 and $12,971,633, respectively) | | | 9,549,072 | | | | 13,077,053 | |
| | | | | | | | | |
| Loans receivable | | | 431,882,051 | | | | 462,494,813 | |
| Less allowance for loan losses | | | 1,797,393 | | | | 5,465,563 | |
| Net loans | | | 430,084,658 | | | | 457,029,250 | |
| | | | | | | | | |
| Office property and equipment, net | | | 16,204,913 | | | | 12,545,414 | |
| Federal Home Loan Bank ("FHLB") stock, at cost | | | 3,559,600 | | | | 5,161,600 | |
| Accrued interest receivable | | | 2,939,993 | | | | 2,627,980 | |
| Goodwill | | | 18,417,040 | | | | 18,417,040 | |
| Other assets | | | 17,013,750 | | | | 16,452,441 | |
| Total assets | | $ | 645,816,510 | | | $ | 612,535,259 | |
| | | | | | | | | |
| LIABILITIES AND STOCKHOLDERS’ EQUITY | | | | | | | | |
| | | | | | | | | |
| LIABILITIES | | | | | | | | |
| Deposit liabilities | | $ | 507,865,063 | | | $ | 446,056,388 | |
| Advances from FHLB and other borrowings | | | 62,202,229 | | | | 92,753,665 | |
| Advance payments by borrowers for taxes and insurance | | | 916,021 | | | | 976,658 | |
| Accrued interest payable | | | 2,690,658 | | | | 2,037,740 | |
| Accrued expenses and other liabilities | | | 1,887,317 | | | | 2,386,914 | |
| Total liabilities | | | 575,561,288 | | | | 544,211,365 | |
| | | | | | | | | |
| COMMITMENTS AND CONTINGENCIES | | | | | | | | |
| | | | | | | | | |
| STOCKHOLDERS’ EQUITY | | | | | | | | |
| Preferred stock, $.01 par value, authorized 1,000,000 shares; issued none | | | - | | | | - | |
| Common stock, $.01 par value, authorized 12,000,000 shares; | | | | | | | | |
| issued 5,067,226 shares and 5,012,375 shares, respectively | | | 50,604 | | | | 50,109 | |
| Additional paid-in capital | | | 39,230,016 | | | | 38,293,233 | |
| Retained earnings, substantially restricted | | | 58,704,525 | | | | 57,013,427 | |
| Treasury stock, at cost, 1,677,255 shares and 1,632,266 shares, respectively | | | (26,885,723 | ) | | | (25,920,685 | ) |
| Accumulated other comprehensive income (loss) | | | (179,360 | ) | | | (325,650 | ) |
| Unearned ESOP | | | (664,840 | ) | | | (786,540 | ) |
| Total stockholders’ equity | | | 70,255,222 | | | | 68,323,894 | |
| Total liabilities and stockholders’ equity | | $ | 645,816,510 | | | $ | 612,535,259 | |
See Notes to Consolidated Financial Statements.
First Federal Bankshares, Inc. and Subsidiaries | | | | | | | | | |
| | | | | | | | | | |
Consolidated Statements of Income | | | | | | | | | |
Years Ended June 30, 2007, 2006, and 2005 | | | | | | | | | |
| | | | | | | | | | |
| | | 2007 | | | 2006 | | | 2005 | |
| Interest income: | | | | | | | | | |
| Loans receivable | | $ | 29,844,908 | | | $ | 29,251,932 | | | $ | 25,845,134 | |
| Investment securities | | | 5,465,051 | | | | 2,741,977 | | | | 3,171,618 | |
| Other interest-earning assets | | | 464,971 | | | | 299,641 | | | | 173,172 | |
| Total interest income | | | 35,774,930 | | | | 32,293,550 | | | | 29,189,924 | |
| Interest expense: | | | | | | | | | | | | |
| Deposits | | | 16,059,115 | | | | 10,591,016 | | | | 7,231,553 | |
| Advances from FHLB and other borrowings | | | 3,819,417 | | | | 4,504,441 | | | | 4,607,828 | |
| Total interest expense | | | 19,878,532 | | | | 15,095,457 | | | | 11,839,381 | |
| Net interest income | | | 15,896,398 | | | | 17,198,093 | | | | 17,350,543 | |
| Provision for loan losses | | | 546,949 | | | | 1,920,000 | | | | 2,985,000 | |
| Net interest income after provision for loan losses | | | 15,349,449 | | | | 15,278,093 | | | | 14,365,543 | |
| Non-interest income: | | | | | | | | | | | | |
| Service charges on deposit accounts | | | 3,078,427 | | | | 3,116,221 | | | | 3,585,448 | |
| Service charges on loans | | | 305,200 | | | | 364,633 | | | | 466,288 | |
| Gain on sale of bank branch offices | | | - | | | | - | | | | 2,185,284 | |
| Gain (loss) on sale of real estate held for development | | | 105,000 | | | | (221,649 | ) | | | 60,000 | |
| Gain (loss) on sale of securities | | | 14,400 | | | | 202,944 | | | | (121,209 | ) |
| Gain on sale of loans | | | 618,855 | | | | 657,714 | | | | 760,065 | |
| Earnings from Bank Owned Life Insurance | | | 531,748 | | | | 509,753 | | | | 490,517 | |
| Other income | | | 1,142,049 | | | | 1,149,348 | | | | 1,089,715 | |
| Total non-interest income | | | 5,795,679 | | | | 5,778,964 | | | | 8,516,108 | |
| Non-interest expense: | | | | | | | | | | | | |
| Compensation and benefits | | | 10,226,313 | | | | 9,645,576 | | | | 9,762,519 | |
| Office property and equipment | | | 2,851,281 | | | | 2,820,991 | | | | 2,557,317 | |
| Data processing, ATM and debit card transaction costs, | | | | | | | | | | | | |
| and other item processing expense | | | 1,005,532 | | | | 981,811 | | | | 986,452 | |
| Professional, insurance and regulatory expense | | | 1,150,247 | | | | 1,025,657 | | | | 1,080,681 | |
| Advertising, donations and public relations | | | 718,530 | | | | 717,983 | | | | 744,872 | |
| Communications, postage and office supplies | | | 814,726 | | | | 790,320 | | | | 880,886 | |
| Other expense | | | 1,160,320 | | | | 738,567 | | | | 1,048,684 | |
| Total non-interest expense | | | 17,926,949 | | | | 16,720,905 | | | | 17,061,411 | |
| Income before income taxes and discontinued operations | | | 3,218,179 | | | | 4,336,152 | | | | 5,820,240 | |
| Income taxes | | | 739,000 | | | | 1,147,000 | | | | 1,762,000 | |
| Income from continuing operations | | | 2,479,179 | | | | 3,189,152 | | | | 4,058,240 | |
| Income from discontinued operations, net of tax of $371,000, $88,000, | | | | | | | | | | | | |
| and $93,000, respectively (including gain on disposal of $510,000, | | | | | | | | | | | | |
| net of tax of $311,000, in 2007) | | | 589,679 | | | | 142,813 | | | | 155,134 | |
| Net income | | $ | 3,068,858 | | | $ | 3,331,965 | | | $ | 4,213,374 | |
| | | | | | | | | | | | | |
| Per share information: | | | | | | | | | | | | |
| Basic earnings per share from continuing operations | | $ | 0.75 | | | $ | 0.95 | | | $ | 1.15 | |
| Basic earnings per share from discontinued operations | | | 0.18 | | | | 0.04 | | | | 0.04 | |
| Basic earnings per share | | $ | 0.93 | | | $ | 0.99 | | | $ | 1.19 | |
| | | | | | | | | | | | | |
| Diluted earnings per share from continuing operations | | $ | 0.74 | | | $ | 0.94 | | | $ | 1.12 | |
| Diluted earnings per share from discontinued operations | | | 0.18 | | | | 0.04 | | | | 0.04 | |
| Diluted earnings per share | | $ | 0.92 | | | $ | 0.98 | | | $ | 1.16 | |
| | | | | | | | | | | | | |
| See Notes to Consolidated Financial Statements. | | | | | | | | | | | | |
First Federal Bankshares, Inc. and Subsidiaries | | | | | | | | | | | | | | | | | | | | | | | | | | | |
| | | | | | | | | | | | | | | | | | | | | | | | | | | | |
Consolidated Statements of Stockholders' Equity | | | | | | | | | | | | | | | | | | | | | | | | | | | |
Years Ended June 30, 2007, 2006, and 2005 | | | | | | | | | | | | | | | | | | | | | | | | | | | |
| | | | | | | | | | | | | | | | | | Accumulated Other | | | | | | | |
| | | Comprehensive | | | Common | | | Additional | | | Retained | | | Treasury | | | Comprehensive | | | Unearned | | | Unearned | | | | |
| | | Income | | | Stock | | | Paid-in Capital | | | Earnings | | | Stock | | | Income (Loss) | | | ESOP | | | RRP | | | Total | |
| Balance at June 30, 2004 | | | | | $ | 49,393 | | | $ | 37,086,235 | | | $ | 52,240,273 | | | $ | (16,519,093 | ) | | $ | (329,644 | ) | | $ | (1,044,710 | ) | | $ | (24,732 | ) | | $ | 71,457,722 | |
| Net income | | $ | 4,213,374 | | | | - | | | | - | | | | 4,213,374 | | | | - | | | | - | | | | - | | | | - | | | | 4,213,374 | |
| Net change in unrealized gains on securities | | | | | | | | | | | | | | | | | | | | | | | | | | | | | | | | | | | | |
| available-for-sale, net of tax of $245,000 | | | 412,216 | | | | - | | | | - | | | | - | | | | - | | | | 412,216 | | | | - | | | | - | | | | 412,216 | |
| Less reclassification adjustment for net realized losses | | | | | | | | | | | | | | | | | | | | | | | | | | | | | | | | | | | | |
| included in net income, net of tax of $45,000 | | | 75,998 | | | | - | | | | - | | | | - | | | | - | | | | 75,998 | | | | - | | | | - | | | | 75,998 | |
| Total comprehensive income | | $ | 4,701,588 | | | | | | | | | | | | | | | | | | | | | | | | | | | | | | | | | |
| Stock options exercised - 37,767 shares | | | | | | | 377 | | | | 392,667 | | | | - | | | | - | | | | - | | | | - | | | | - | | | | 393,044 | |
| Treasury stock acquired - 229,836 shares | | | | | | | - | | | | - | | | | - | | | | (5,306,158 | ) | | | - | | | | - | | | | - | | | | (5,306,158 | ) |
| RRP (award) forfeiture | | | | | | | - | | | | 124,530 | | | | - | | | | 77,508 | | | | - | | | | - | | | | (202,038 | ) | | | - | |
| Amortization of RRP | | | | | | | - | | | | - | | | | - | | | | - | | | | - | | | | - | | | | 184,948 | | | | 184,948 | |
| ESOP shares allocated | | | | | | | - | | | | - | | | | - | | | | - | | | | - | | | | 130,820 | | | | - | | | | 130,820 | |
| Stock appreciation of allocated ESOP shares | | | | | | | - | | | | 158,155 | | | | - | | | | - | | | | - | | | | - | | | | - | | | | 158,155 | |
| Dividends on common stock at $0.40 per share | | | | | | | - | | | | - | | | | (1,424,914 | ) | | | - | | | | - | | | | - | | | | - | | | | (1,424,914 | ) |
| Balance at June 30, 2005 | | | | | | | 49,770 | | | | 37,761,587 | | | | 55,028,733 | | | | (21,747,743 | ) | | | 158,570 | | | | (913,890 | ) | | | (41,822 | ) | | | 70,295,205 | |
| Net income | | $ | 3,331,965 | | | | - | | | | - | | | | 3,331,965 | | | | - | | | | - | | | | - | | | | - | | | | 3,331,965 | |
| Net change in unrealized losses on securities | | | | | | | | | | | | | | | | | | | | | | | | | | | | | | | | | | | | |
| available-for-sale, net of tax of $212,000 | | | (356,974 | ) | | | - | | | | - | | | | - | | | | - | | | | (356,974 | ) | | | - | | | | - | | | | (356,974 | ) |
| Less reclassification adjustment for net realized gains | | | | | | | | | | | | | | | | | | | | | | | | | | | | | | | | | | | | |
| included in net income, net of tax of $76,000 | | | (127,246 | ) | | | - | | | | - | | | | - | | | | - | | | | (127,246 | ) | | | - | | | | - | | | | (127,246 | ) |
| Total comprehensive income | | $ | 2,847,745 | | | | | | | | | | | | | | | | | | | | | | | | | | | | | | | | | |
| Stock options exercised - 36,200 shares | | | | | | | 354 | | | | 342,708 | | | | - | | | | - | | | | - | | | | - | | | | - | | | | 343,062 | |
| Treasury stock acquired - 203,440 shares | | | | | | | - | | | | - | | | | - | | | | (4,172,942 | ) | | | - | | | | - | | | | - | | | | (4,172,942 | ) |
| Reclassification due to adoption of SFAS123(R) | | | | | | | (112 | ) | | | (41,710 | ) | | | - | | | | - | | | | - | | | | - | | | | 41,822 | | | | - | |
| Amortization of RRP | | | | | | | 97 | | | | 39,123 | | | | - | | | | - | | | | - | | | | - | | | | - | | | | 39,220 | |
| Stock compensation expense | | | | | | | - | | | | 55,404 | | | | - | | | | - | | | | - | | | | - | | | | - | | | | 55,404 | |
| ESOP shares allocated | | | | | | | - | | | | - | | | | - | | | | - | | | | - | | | | 127,350 | | | | - | | | | 127,350 | |
| Stock appreciation of allocated ESOP shares | | | | | | | - | | | | 136,121 | | | | - | | | | - | | | | - | | | | - | | | | - | | | | 136,121 | |
| Dividends on common stock at $0.40 per share | | | | | | | - | | | | - | | | | (1,347,271 | ) | | | - | | | | - | | | | - | | | | - | | | | (1,347,271 | ) |
| Balance at June 30, 2006 | | | | | | | 50,109 | | | | 38,293,233 | | | | 57,013,427 | | | | (25,920,685 | ) | | | (325,650 | ) | | | (786,540 | ) | | | - | | | | 68,323,894 | |
| Net income | | $ | 3,068,858 | | | | - | | | | - | | | | 3,068,858 | | | | - | | | | - | | | | - | | | | - | | | | 3,068,858 | |
| Net change in unrealized losses on securities | | | | | | | | | | | | | | | | | | | | | | | | | | | | | | | | | | | | |
| available-for-sale, net of tax of $92,000 | | | 155,319 | | | | - | | | | - | | | | - | | | | - | | | | 155,319 | | | | - | | | | - | | | | 155,319 | |
| Less reclassification adjustment for net realized gains | | | | | | | | | | | | | | | | | | | | | | | | | | | | | | | | | | | | |
| included in net income, net of tax of $5,000 | | | (9,029 | ) | | | - | | | | - | | | | - | | | | - | | | | (9,029 | ) | | | - | | | | - | | | | (9,029 | ) |
| Total comprehensive income | | $ | 3,215,148 | | | | | | | | | | | | | | | | | | | | | | | | | | | | | | | | | |
| Stock options exercised - 51,611 shares | | | | | | | 495 | | | | 664,535 | | | | - | | | | - | | | | - | | | | - | | | | - | | | | 665,030 | |
| Treasury stock acquired - 44,989 shares | | | | | | | - | | | | - | | | | - | | | | (970,780 | ) | | | - | | | | - | | | | - | | | | (970,780 | ) |
| Amortization of RRP | | | | | | | - | | | | 36,599 | | | | - | | | | - | | | | - | | | | - | | | | - | | | | 36,599 | |
| Stock grants awarded | | | | | | | - | | | | (5,742 | ) | | | - | | | | 5,742 | | | | - | | | | - | | | | - | | | | - | |
| Stock compensation expense | | | | | | | - | | | | 105,769 | | | | - | | | | - | | | | - | | | | - | | | | - | | | | 105,769 | |
| ESOP shares allocated | | | | | | | - | | | | - | | | | - | | | | - | | | | - | | | | 121,700 | | | | - | | | | 121,700 | |
| Stock appreciation of allocated ESOP shares | | | | | | | - | | | | 135,622 | | | | - | | | | - | | | | - | | | | - | | | | - | | | | 135,622 | |
| Dividends on common stock at $0.415 per share | | | | | | | - | | | | - | | | | (1,377,760 | ) | | | - | | | | - | | | | - | | | | - | | | | (1,377,760 | ) |
| Balance at June 30, 2007 | | | | | | $ | 50,604 | | | $ | 39,230,016 | | | $ | 58,704,525 | | | $ | (26,885,723 | ) | | $ | (179,360 | ) | | $ | (664,840 | ) | | | - | | | $ | 70,255,222 | |
| | | | | | | | | | | | | | | | | | | | | | | | | | | | | | | | | | | | | |
| | | | | | | | | | | | | | | | | | | | | | | | | | | | | | | | | | | | | |
| See Notes to Consolidated Financial Statements. | | | | | | | | | | | | | | | | | | | | | | | | | | | | | | | | | | | | |
First Federal Bankshares, Inc. and Subsidiaries |
| | | | | | | | | | | | | |
Consolidated Statements of Cash Flows | | | | | | | | | | | | |
Years Ended June 30, 2007, 2006 and 2005 | | | | | | | | | | | | |
| | | | | | | | | | | | | |
| | | | 2007 | | | | 2006 | | | | 2005 | |
| Cash flows from continuing operating activities: | | | | | | | | | | | | |
| Net income | | $ | 3,068,858 | | | $ | 3,331,965 | | | $ | 4,213,374 | |
| Income from discontinued operations | | | (589,679 | ) | | | (142,813 | ) | | | (155,134 | ) |
| Adjustments to reconcile net income from continuing operations to | | | | | | | | | | | | |
| net cash provided by continuing operating activities: | | | | | | | | | | | | |
| Loans originated for sale to investors | | | (43,697,000 | ) | | | (36,286,000 | ) | | | (40,721,000 | ) |
| Proceeds from sale of loans originated for sale | | | 44,270,534 | | | | 34,999,892 | | | | 41,103,187 | |
| Provision for losses on loans | | | 546,949 | | | | 1,920,000 | | | | 2,985,000 | |
| Depreciation and amortization | | | 1,160,575 | | | | 1,268,448 | | | | 1,217,492 | |
| Provision for deferred taxes | | | 548,000 | | | | (30,000 | ) | | | 172,000 | |
| Equity-based compensation | | | 399,690 | | | | 358,095 | | | | 473,923 | |
| Tax benefit resulting from stock options exercised | | | (151,000 | ) | | | (26,000 | ) | | | - | |
| Net gain on sale of loans | | | (618,855 | ) | | | (657,714 | ) | | | (760,065 | ) |
| Net (gain) loss on sale of securities available-for-sale | | | (14,400 | ) | | | (202,944 | ) | | | 121,209 | |
| Net gain on sale of bank branch offices | | | - | | | | - | | | | (2,185,284 | ) |
| Net loss on sale of office property and equipment | | | 38,091 | | | | 6,235 | | | | 16,459 | |
| Net (gain) loss on sale of real estate held for development | | | (105,000 | ) | | | 221,649 | | | | (60,000 | ) |
| Amortization of premiums and discounts on loans, | | | | | | | | | | | | |
| mortgage-backed securities and investment securities | | | (357,529 | ) | | | (257,376 | ) | | | 129,533 | |
| Increase in accrued interest receivable | | | (312,013 | ) | | | (334,665 | ) | | | (88,418 | ) |
| Decrease (increase) in other assets | | | 357,758 | | | | (1,392,512) | | | | 628,377 | |
| Increase in accrued interest payable | | | 652,918 | | | | 726,016 | | | | 229,646 | |
| Increase (decrease) in accrued expenses and other liabilities | | | 11,627 | | | | (230,872 | ) | | | (484,364 | ) |
| Increase (decrease) in accrued taxes on income | | | (443,404 | ) | | | 784,321 | | | | (287,278 | ) |
| Net cash provided by continuing operating activities | | | 4,766,120 | | | | 4,055,725 | | | | 6,548,657 | |
| | | | | | | | | | | | | |
| Cash flows from continuing investing activities: | | | | | | | | | | | | |
| Purchase of securities held-to-maturity | | | - | | | | - | | | | (1,297,010 | ) |
| Proceeds from maturities of securities held-to-maturity | | | 3,535,704 | | | | 5,096,667 | | | | 6,254,621 | |
| Purchase of securities available-for-sale | | | (89,490,572 | ) | | | (59,803,325 | ) | | | (5,389,323 | ) |
| Proceeds from sale of securities available-for-sale | | | 4,014,400 | | | | 264,466 | | | | 30,226,184 | |
| Proceeds from maturities of securities available-for-sale | | | 10,757,659 | | | | 61,023,212 | | | | 10,097,391 | |
| Redemption of FHLB stock | | | 1,602,000 | | | | 600,800 | | | | 333,700 | |
| Loans purchased | | | (15,024,000 | ) | | | (26,780,000 | ) | | | (32,148,000 | ) |
| Proceeds from sale of loans | | | 10,556,665 | | | | - | | | | - | |
| Cash effect of bank branch office sales | | | - | | | | - | | | | (9,753,387 | ) |
| Decrease in loans receivable | | | 28,592,263 | | | | 3,323,485 | | | | 10,111,996 | |
| Proceeds from sale of office property and equipment | | | 65,116 | | | | 155 | | | | 4,125 | |
| Purchase of office property and equipment | | | (4,899,869 | ) | | | (628,153 | ) | | | (1,426,290 | ) |
| Proceeds from sale of foreclosed real estate | | | 532,285 | | | | 371,597 | | | | 1,196,270 | |
| Proceeds from sale of real estate held for development | | | 2,383,431 | | | | 1,160,513 | | | | 1,490,537 | |
| Expenditures on real estate held for development | | | (1,807,564 | ) | | | (1,760,867 | ) | | | (1,322,440 | ) |
| Net cash provided by (used in) continuing investing activities | | | (49,182,482 | ) | | | (17,131,450 | ) | | | 8,378,374 | |
| | | | | | | | | | | | | |
| | | | | | | | | | | | | |
| (Continued) |
First Federal Bankshares, Inc. and Subsidiaries | | | | | | | | | |
| | | | | | | | | | |
Consolidated Statements of Cash Flows (Continued) | | | | | | | | | |
Years Ended June 30, 2007, 2006 and 2005 | | | | | | | | | |
| | | | | | | | | | |
| | | 2007 | | | 2006 | | | 2005 | |
| Cash flows from continuing financing activities: | | | | | | | | | |
| Increase in deposits | | $ | 61,808,675 | | | $ | 38,493,983 | | | $ | 7,632,216 | |
| Proceeds from advances from FHLB and other borrowings | | | 5,948,564 | | | | 10,189,403 | | | | 7,178,001 | |
| Repayment of advances from FHLB and other borrowings | | | (36,500,000 | ) | | | (22,000,000 | ) | | | (12,500,000 | ) |
| Net increase (decrease) in advance payments by borrowers | | | | | | | | | | | | |
| for taxes and insurance | | | (60,637 | ) | | | 23,377 | | | | (166,205 | ) |
| Issuance of common stock under stock options exercised | | | 514,030 | | | | 317,062 | | | | 393,044 | |
| Tax benefit resulting from stock options exercised | | | 151,000 | | | | 26,000 | | | | - | |
| Repurchase of common stock | | | (970,780 | ) | | | (4,172,942 | ) | | | (5,306,158 | ) |
| Cash dividends paid | | | (1,377,760 | ) | | | (1,347,271 | ) | | | (1,424,914 | ) |
| Net cash provided by (used in) continuing financing activities | | | 29,513,092 | | | | 21,529,612 | | | | (4,194,016 | ) |
| | | | | | | | | | | | | |
| Cash flows from discontinued operations: | | | | | | | | | | | | |
| Net cash provided by (used in) operating activities | | | | | | | | | | | | |
| of discontinued operations | | | (290,179 | ) | | | 115,155 | | | | 165,902 | |
| Net cash provided by (used in) investing activities | | | | | | | | | | | | |
| of discontinued operations | | | 1,027,167 | | | | - | | | | (22,937 | ) |
| Net cash used in financing activities of discontinued operations | | | - | | | | - | | | | - | |
| Net cash provided by (used in) discontinued operations | | | 736,988 | | | | 115,155 | | | | 142,965 | |
| | | | | | | | | | | | | |
| Net increase (decrease) in cash and cash equivalents | | | (14,166,282 | ) | | | 8,569,042 | | | | 10,875,980 | |
| | | | | | | | | | | | | |
| CASH AND CASH EQUIVALENTS | | | | | | | | | | | | |
| Beginning of year | | | 39,904,749 | | | | 31,335,707 | | | | 20,459,727 | |
| End of year | | $ | 25,738,467 | | | $ | 39,904,749 | | | $ | 31,335,707 | |
| | | | | | | | | | | | | |
| SUPPLEMENTAL DISCLOSURES | | | | | | | | | | | | |
| Cash paid during the year for: | | | | | | | | | | | | |
| Interest | | $ | 19,225,614 | | | $ | 14,369,442 | | | $ | 11,734,651 | |
| Income taxes | | | 1,043,279 | | | | 435,622 | | | | 1,876,382 | |
| | | | | | | | | | | | | |
| | | | | | | | | | | | | |
| See Notes to Consolidated Financial Statements. | | | | | | | | | | | | |
| First Federal Bankshares, Inc. and Subsidiaries |
| |
| |
| Notes to Consolidated Financial Statements |
Note 1. | Summary of Significant Accounting Policies and Practices |
Organization: First Federal Bankshares, Inc. (the “Company”) is the holding company for Vantus Bank (the “Bank”). Prior to September 4, 2007, the Bank was known as First Federal Bank. The Company’s primary activity is its ownership of 100% of the Bank’s common stock and that of a real estate development subsidiary. The Company’s net income is derived primarily from the Bank. The Bank is organized as a federally-chartered stock savings bank engaging in retail and commercial banking and related financial services in northwest and central Iowa and contiguous portions of Nebraska and South Dakota. The Bank provides traditional products and services of banking, such as deposits and mortgage, consumer, and commercial loans.
Principles of presentation: The accompanying consolidated financial statements include the accounts of First Federal Bankshares, Inc., and its wholly-owned subsidiaries, Equity Services Inc., a real estate development company, and the Bank and its wholly-owned subsidiary, First Financial Corporation of Sioux City (“FFC”). FFC is a majority owner of United Escrow, Inc. which serves as an escrow agent in Woodbury County, Iowa. FFC formerly operated a title search and abstract continuation business through its subsidiary, Sioux Financial Company (“SFC”). Substantially all the assets of SFC were sold in March 2007, and the Company is no longer involved in the title search and abstract continuation business. The results of operations of SFC are presented as discontinued operations in the accompanying consolidated financial statements. The assets of SFC as of June 30, 2006 have not been separately presented due to insignificance. All significant inter-company accounts and transactions have been eliminated in consolidation.
Use of estimates: The preparation of financial statements in conformity with generally accepted accounting principles (“GAAP”) requires management to make estimates and assumptions that affect the reported amounts of assets and liabilities and disclosure of contingent assets and liabilities at the date of the financial statements and the reported amounts of revenues and expenses during the reporting period. Actual results could differ from those estimates. Material estimates that are particularly susceptible to change relate to the determination of the allowance for loan losses, the fair value of financial instruments and impairment of intangible assets.
Segment reporting: An operating segment is defined as a component of a business for which separate financial information is available that is evaluated regularly by the chief operating decision maker in deciding how to allocate resources and evaluate performance. The Company has two operating segments, Community Banking and Other.
Cash flow statement and cash and cash equivalents: For purposes of reporting cash flows, the Company includes cash and due from other financial institutions and interest-bearing deposits with original maturities of three months or less in cash and cash equivalents. The Bank is required to maintain a certain amount of cash on hand and a non-interest-bearing account balance at the Federal Reserve Bank of Chicago to meet specific reserve requirements. These requirements approximated $0.6 million and $1.6 million at June 30, 2007 and 2006, respectively. In conjunction with the sale of the net assets of two bank branch offices in fiscal 2005, the Company divested non-cash assets (primarily loans) with book values of $17.5 million, including goodwill of $107,000, and liabilities with book values of $27.3 million, resulting in a net cash outlay of $9.8 million.
Earnings per share: Basic earnings per share computations for the years ended June 30, 2007, 2006 and 2005 were determined by dividing net earnings by the weighted average number of common shares outstanding during the years then ended. Diluted net earnings per common share amounts are computed by dividing net income by the weighted average number of common shares and all dilutive potential common shares outstanding during the year. Shares owned by the ESOP that have not been committed to be released are not considered to be outstanding for the purposes of computing earnings per share.
| First Federal Bankshares, Inc. and Subsidiaries |
| |
| |
| Notes to Consolidated Financial Statements |
| |
The following information was used in the computation of net income per common share on both a basic and diluted basis for the years ended June 30, 2007, 2006 and 2005:
| | | 2007 | | | 2006 | | | 2005 | |
| Basic EPS computation: | | | | | | | | | |
| Income from continuing operations | | $ | 2,479,179 | | | $ | 3,189,152 | | | $ | 4,058,240 | |
| Income from discontinued operations | | | 589,679 | | | | 142,813 | | | | 155,134 | |
| Net income | | $ | 3,068,858 | | | $ | 3,331,965 | | | $ | 4,213,374 | |
| Weighted average common shares outstanding | | | 3,316,774 | | | | 3,366,086 | | | | 3,552,072 | |
| Basic EPS from continuing operations | | $ | 0.75 | | | $ | 0.95 | | | $ | 1.15 | |
| Basic EPS from discontinued operations | | | 0.18 | | | | 0.04 | | | | 0.04 | |
| Basic EPS | | $ | 0.93 | | | $ | 0.99 | | | $ | 1.19 | |
| | | | | | | | | | | | | |
| Diluted EPS computation: | | | | | | | | | | | | |
| Income from continuing operations | | $ | 2,479,179 | | | $ | 3,189,152 | | | $ | 4,058,240 | |
| Income from discontinued operations | | | 589,679 | | | | 142,813 | | | | 155,134 | |
| Net income | | $ | 3,068,858 | | | $ | 3,331,965 | | | $ | 4,213,374 | |
| Weighted average common shares outstanding | | | 3,316,774 | | | | 3,366,086 | | | | 3,552,072 | |
| Incremental option and RRP shares using | | | | | | | | | | | | |
| treasury stock method | | | 26,758 | | | | 51,281 | | | | 73,336 | |
| Diluted shares outstanding | | | 3,343,532 | | | | 3,417,367 | | | | 3,625,408 | |
| Diluted EPS from continuing operations | | $ | 0.74 | | | $ | 0.94 | | | $ | 1.12 | |
| Diluted EPS from discontinued operations | | | 0.18 | | | | 0.04 | | | | 0.04 | |
| Diluted EPS | | $ | 0.92 | | | $ | 0.98 | | | $ | 1.16 | |
Securities: Securities which the Company has the positive intent and ability to hold to maturity are classified as held-to-maturity and carried at cost, adjusted for unamortized premiums and unearned discounts. Premiums are amortized and discounts are accreted using the interest method over the remaining period to contractual maturity, adjusted in the case of mortgage-backed securities and collateralized mortgage obligations for actual prepayments. Original issue discounts on short-term securities are accreted as accrued interest receivable over the lives of such securities. Securities which the Company intends to hold indefinitely, but not necessarily to maturity, are classified as available-for-sale and carried at estimated fair value. Unrealized gains and losses on such securities are reported as a separate component of stockholders’ equity, net of deferred taxes. A decision to sell a security classified as available-for-sale would be based on various factors, including significant movements in market interest rates, changes in the maturity of the Company’s assets and liabilities, liquidity needs, regulatory capital considerations and other similar factors.
Realized gains and losses from the sale of securities are recognized in earnings using the specific identification method based on amortized cost. Unrealized losses on securities, determined to be other-than-temporary, are charged to operations. In estimating other-than-temporary impairment losses on securities management considers (a) the length of time and the extent to which the fair value has been less than cost, (b) the financial condition and near-term prospects of the issuer, and (c) the intent and ability of the Company to retain the security for a period of time sufficient to allow for an anticipated recovery in fair value.
Loans receivable: Loans receivable are carried at the outstanding principal amount plus unamortized premiums less net deferred fees, loans in process and the allowance for loan losses. Interest is calculated using the simple interest method on the daily balance of the outstanding principal amount. Accrued interest receivable in arrears which management believes is doubtful of collection (generally when a loan becomes 90 days delinquent) is charged against operations. Subsequent interest income is not recognized on such loans until collected or until the obligation is brought current and the collectibility of the total contractual principal and interest is no longer in doubt.
| First Federal Bankshares, Inc. and Subsidiaries |
| |
| |
| Notes to Consolidated Financial Statements |
| |
Allowances for losses on loans: The allowance for losses on loans is based on management’s current judgments about the credit quality of individual loans and segments of the loan portfolio. The allowance for losses on loans is established through a provision for loan losses based on management’s evaluation of the risk inherent in the loan portfolio, and considers all known internal and external factors that affect loan collectibility as of the reporting date. Such evaluation, which includes a review of all loans on which full collectibility may not be reasonably assured, considers among other matters, the estimated net realizable value or the fair value of the underlying collateral, economic conditions, historical loan loss experience, management’s knowledge of inherent risks in the portfolio that are probable and reasonably estimable and other factors that warrant recognition in providing an appropriate loan loss allowance.
The allowance consists of specific, general and unallocated components. The specific component relates to loans that are adversely classified. For such loans that are also considered impaired, an allowance is established when the discounted cash flows (or collateral value or observable market price) of the impaired loan is lower than the carrying value of that loan. The general component covers non-classified loans and is based on historical loss experience adjusted for qualitative factors. An unallocated component is maintained to cover uncertainties that could affect management’s estimate of probable losses. The unallocated component of the allowance reflects the margin of imprecision inherent in the underlying assumptions used in the methodologies for estimating specific and general losses in the portfolio.
A loan is considered impaired when it is probable the Company will be unable to collect all contractual principal and interest payments due in accordance with the terms of the loan agreement. Under the Company’s credit policies, loans with interest more than 90 days in arrears and restructured loans are generally considered impaired loans. Loan impairment is measured based on the present value of expected future cash flows discounted at the loan’s effective interest rate, except where more practical, at the observable market price of the loan or the fair value of the collateral if the loan is collateral dependent.
Other real estate owned: Real estate acquired through foreclosure is carried at the lower of cost or fair value less estimated costs of disposition. When a property is acquired through foreclosure any excess of the loan balance over fair value of the property is charged to the allowance for losses on loans. When circumstances indicate additional loss on the property, a direct charge to operations is made, and the real estate is written down to fair value less estimated costs of disposition.
Real estate held for development: Real estate held for development includes land acquired for the development and sale of single-family residential building lots or for the construction and sale of condominiums. The properties are recorded at cost and are generally sold shortly after completion. The Company evaluates the recoverability of the carrying value on a regular basis and, if recoverability were determined to be in doubt, a valuation allowance would be established by a charge to expense.
Financial instruments with off-balance sheet risk: In the normal course of business to meet the financing needs of its customers, the Company is a party to financial instruments with off-balance sheet risk, which include commitments to extend credit. The Company’s exposure to credit loss in the event of nonperformance by the other party to the commitments to extend credit is represented by the contractual amount of those instruments. The Company uses the same credit policies in making commitments as it does for on-balance sheet instruments.
Commitments to extend credit are agreements to lend to a customer as long as there are no violations of any conditions established in the contract. Commitments generally have fixed expiration dates or other termination clauses and may require payment of a fee. Since certain of the commitments are expected to expire without being drawn upon, the total commitment amounts do not necessarily represent future cash requirements. The Company evaluates each customer’s creditworthiness on a case-by-case basis. The amount of collateral obtained upon extension of credit is based on management’s credit evaluation of the borrower.
| First Federal Bankshares, Inc. and Subsidiaries |
| |
| |
| Notes to Consolidated Financial Statements |
| |
Deferred loan fees and costs: Certain fees and direct expenses incurred in the loan origination process are deferred, with recognition thereof over the contractual life of the related loan as a yield adjustment using the interest method of amortization. Any unamortized fees or costs on loans sold are taken to income in the year such loans are sold.
Office property and equipment: Office property and equipment are recorded at cost, and depreciation is provided primarily on a straight-line basis over the estimated useful lives of the related assets, which range from 15 to 40 years for office buildings and from 3 to 10 years for furniture, fixtures, automobiles, software, and equipment.
Maintenance and repairs are charged against income. Improvements are capitalized and subsequently depreciated. The cost and accumulated depreciation of properties retired or otherwise disposed of are eliminated from the asset and accumulated depreciation accounts. The related gain or loss from such transactions is credited or charged to income.
Goodwill: Goodwill is not amortized and is evaluated for impairment annually or whenever events or changes in circumstances indicate that the carrying amount of the asset may not be recoverable based on facts and circumstances related to the value of net assets acquired that gave rise to the asset. The Company performed their annual impairment analysis during fiscal 2007 and determined the recorded goodwill of $18,417,040 was not impaired.
Loans held for sale: Loans held for sale are those loans the Company has the intent to sell in the foreseeable future. They are carried at the lower of aggregate cost or market value. Net unrealized losses, if any, are recognized through a valuation allowance by changes to income. Gains and losses on sales of loans are recognized at settlement dates and are determined by the difference between the sale proceeds and the carrying value of the loans after allocating cost to any servicing rights retained.
Transfers and servicing of financial assets: The Company accounts for transfers and servicing of financial assets by recognizing the financial and servicing assets it controls and the liabilities it has incurred, derecognizing financial assets when control has been surrendered, and derecognizing liabilities when extinguished. The Company distinguishes transfers of financial assets that are sales from transfers of financial assets that are secured borrowings.
The Company generally retains the right to service mortgage loans sold to others. The cost allocated to the mortgage servicing rights retained has been recognized as a separate asset and is being amortized in proportion to and over the period of estimated net servicing income. Mortgage servicing rights are periodically evaluated for impairment based on the fair value of those rights. Fair values are estimated using discounted cash flows based on current market rates of interest and current expected future prepayment rates. For purposes of measuring impairment, the rights must be stratified by one or more predominant risk characteristics of the underlying loans. The Company stratifies its capitalized mortgage servicing rights based on the product type, interest rate and balances of the underlying loans. The amount of impairment recognized is the amount, if any, by which the amortized cost of the rights for each stratum exceed their fair value.
Comprehensive income: Comprehensive income includes net income, as well as other changes in stockholders’ equity that result from transactions and economic events other than those with stockholders. The Company’s only element of other comprehensive income is unrealized gains and losses on available-for-sale investment securities.
Income Taxes: The Company files a consolidated Federal income tax return. Federal income taxes are allocated based on taxable income or loss included on the consolidated return. For state tax purposes, the Bank files a franchise tax return, while the Company, its other subsidiaries and the Bank’s subsidiaries file a consolidated corporate income tax return.
The Company utilizes the asset and liability method for taxes on income, and deferred tax assets and liabilities are recognized for the future tax consequences attributable to differences between the financial statement carrying amounts of existing assets and liabilities and their respective tax bases. Deferred tax assets and liabilities are measured using enacted tax rates expected to apply to taxable income in the years in which those temporary
| First Federal Bankshares, Inc. and Subsidiaries |
| |
| |
| Notes to Consolidated Financial Statements |
| |
differences are expected to be recovered or settled. The effect of a change in tax rates on deferred tax assets and liabilities is recognized in income in the period that includes the enactment date.
Stock option plan: The Company adopted Statement No. 123 (Revised 2004), Share-Based Payment (“SFAS 123(R)”) which replaces SFAS NO. 123, Accounting for Stock-Based Compensation and supersedes APB Opinion No. 25, Accounting for Stock Issued to Employees, effective July 1, 2005. SFAS123(R) requires all share-based payments to employees, including grants of employee stock options, to be recognized in the financial statements based on their fair values. The pro forma disclosures previously permitted under SFAS No. 123 are no longer an alternative to financial statement recognition. Upon adoption, the Company used the modified prospective transition method. Under that transition method, compensation cost recognized in fiscal 2006 and 2007 includes: compensation cost for current-year vesting for all share-based payments granted prior to, but not yet vested as of July 1, 2005, based on the grant date fair value estimated in accordance with the original provisions of SFAS No. 123; and, compensation cost for current-year vesting for all share-based payments granted subsequent to July 1, 2005, based on the grant date fair value in accordance with SFAS 123(R). Results for prior periods have not been restated. Additional information about the Company’s share-based payment plans is presented in Note 11. Previously, the Company applied APB Opinion No. 25 and related interpretations in accounting for these plans. Accordingly, prior to July 1, 2005, no compensation cost had been recognized for its stock options in the consolidated financial statements. The following table illustrates the effect on net income and earnings per share if the Company had applied the fair value recognition provisions of SFAS 123(R) to options granted under the Company’s stock option plans for the year ended June 30, 2005.
| | | 2005 | |
| Net income, as reported | | $ | 4,213,374 | |
| Deduct: total stock-based employee compensation | | | | |
| expense determined under fair value based method | | | | |
| for all awards, net of related tax effects | | | (61,507 | ) |
| Pro forma net income | | $ | 4,151,867 | |
| | | | | |
| Earnings per share: | | | | |
| Basic, as reported | | $ | 1.19 | |
| Basic, pro forma | | $ | 1.17 | |
| | | | | |
| Diluted, as reported | | $ | 1.16 | |
| Diluted, pro forma | | $ | 1.15 | |
The fair value of each option grant was estimated using the Black-Scholes option pricing model with the following weighted average assumptions used for grants in fiscal year 2005: dividend yield of 2.44%; expected volatility of 24.26%; risk free interest rate of 4.54%; and expected life of 7.5 years.
Prior to the adoption of SFAS 123(R), the Company presented all tax benefits of deductions resulting from the exercise of stock options as operating cash flows in the Statement of Cash Flows. SFAS 123(R) requires that cash flows for tax benefits resulting from tax deductions in excess of the compensation cost recognized for those options (excess tax benefits) be classified as financing cash flows. The $151,000 and $26,000 excess tax benefit classified as financing cash inflows in 2007 and 2006, respectively, would have been classified as operating cash inflows if the Company had not adopted FAS 123(R).
As a result of adopting SFAS 123(R) on July 1, 2005, the Company’s pre-tax income and net income for fiscal 2006 were $55,000 and $35,000 lower, respectively, and basic and diluted earnings per share for fiscal 2006 were each lower by $0.01 for fiscal 2006 than if the Company had continued to account for stock-based compensation under the provisions of APB 25. For fiscal 2007, the Company’s pre-tax income and net income were $106,000 and $66,000 lower, respectively, and basic and diluted earnings per share for fiscal 2007 were each lower by $0.02 for
| First Federal Bankshares, Inc. and Subsidiaries |
| |
| |
| Notes to Consolidated Financial Statements |
| |
fiscal 2007 than if the Company had continued to account for stock-based compensation under the provisions of APB 25.
Reclassifications: Certain amounts previously reported have been reclassified to conform to the presentation in these consolidated financial statements. These reclassifications did not affect previously reported net income or stockholders’ equity.
Fair value of financial instruments: The Company’s fair value estimates, methods, and assumptions for its financial instruments are set forth below:
Cash and cash equivalents: The recorded amount of cash and cash equivalents approximates fair value.
Securities: The fair value of securities is estimated based on pricing quotations or estimates provided by a third party source.
Loans: Fair values are estimated for portfolios of loans with similar financial characteristics. Loans are segregated by type such as real estate, consumer, and commercial. The fair value of loans is calculated by discounting scheduled cash flows through the estimated maturity using estimated market discount rates that reflect the credit and interest rate risk inherent in the loan. The estimate of maturity is based on the Company’s historical experience with repayments for each loan classification, modified, as required, by an estimate of the effect of current economic and lending conditions. The effect of nonperforming loans is considered in assessing the credit risk inherent in the fair value estimate.
Federal Home Loan Bank stock: The fair value of Federal Home Loan Bank (FHLB) stock is equivalent to its carrying value because it is redeemable at par value and there is no quoted market value.
Accrued interest receivable: The recorded amount of accrued interest receivable approximates fair value.
Deposits: The fair value of deposits with no stated maturity, such as checking, money market and savings accounts, is equal to the amount payable on demand. The fair value of certificates of deposit is based on the discounted value of contractual cash flows. The discount rate is estimated using the rates currently offered for deposits of similar remaining maturities. The fair value estimates do not include the benefit that results from the low-cost funding provided by the deposit liabilities compared to the cost of borrowing funds in the market.
Advances from Federal Home Loan Bank and other borrowings: The fair value of advances from FHLB and other borrowings is based on the discounted value of contractual cash flows.
Advance payments by borrowers for taxes and insurance: The recorded amount of advance payments by borrowers for taxes and insurance approximates fair value.
Accrued interest payable: The recorded amount of accrued interest payable approximates fair value.
Off-balance-sheet items: Off-balance-sheet items have a fair value of zero since there is no expected gain or loss.
Limitations: Fair value estimates are made at a specific point in time, based on relevant market information and information about the financial instrument. Because no market exists for a significant portion of the Company’s financial instruments, fair value estimates are based on judgments regarding future expected loss experience, current economic conditions, risk characteristics of various financial instruments, and other factors. These estimates are subjective in nature and involve uncertainties and matters of significant judgment and, therefore, cannot be determined with precision. Changes in assumptions could significantly affect these estimates.
Effect of New Accounting Standards: In March 2006, the Financial Accounting Standards Board (“FASB”) issued Statement of Financial Accounting Standards No. 156, Accounting for Servicing of Financial Assets (as Amended)
| First Federal Bankshares, Inc. and Subsidiaries |
| |
| |
| Notes to Consolidated Financial Statements |
| |
(“SFAS 156”). This Statement amends Statement of Financial Accounting Standards No. 140, Accounting for Transfers and Servicing of Financial Assets and Extinguishments of Liabilities (“SFAS 140”), with respect to the accounting for separately recognized servicing assets and servicing liabilities. SFAS 156 requires the separate accounting for servicing assets and servicing liabilities which arise from the sale of financial assets; requires all separately recognized servicing assets and servicing liabilities to be initially measured at fair value; permits the choice of an amortization method or fair value method for subsequent measurements; and requires separate presentation of servicing assets and servicing liabilities subsequently measured at fair value in the statement of financial position and additional disclosures for all separately recognized servicing assets and servicing liabilities. SFAS 156 is effective July 1, 2007, for the Company. The Company has chosen to use the fair value method in measuring its servicing asset beginning on July 1, 2007. The Company has determined that the adoption of SFAS 156 will result in an increase to stockholders' equity approximately $200,000.
FASB Interpretation No. 48, Accounting for Uncertainty in Income Taxes (“FIN 48”) clarifies the accounting for uncertainty in income taxes recognized in financial statements in accordance with Statement of Financial Accounting Standards No. 109, Accounting for Income Taxes (“SFAS 109”). FIN 48 prescribes a recognition threshold and measurement attribute for the financial statement recognition and measurement of a tax position taken or expected to be taken in a tax return. FIN 48 also provides guidance on de-recognition, classification, interest and penalties, interim period accounting, disclosure and transition for tax positions. FIN 48 is effective for the Company on July 1, 2007. The Company is currently evaluating the impact that the adoption of FIN 48 will have on its financial position, results of operations and cash flows.
In September 2006, the Emerging Issues Task Force ("EITF") reached a final consensus on Issue 06-04, Accounting for Deferred Compensation and Postretirement Benefit Aspects of Endorsement Split-Dollar Life Insurance Arrangements. In March 2007, the EITF reached a final conclusion on Issue 06−10, Accounting for Collateral Assignment Split-Dollar Life Insurance Arrangements. The consensus stipulates that an agreement by an employer to share a portion of the proceeds of a life insurance policy with an employee during the postretirement period is a postretirement benefit arrangement required to be accounted for under SFAS No. 106 or Accounting Principles Board Opinion ("APB") No. 12, Omnibus Opinion - 1967. The consensus concludes that the purchase of a split-dollar life insurance policy does not constitute a settlement under SFAS No. 106 and, therefore, a liability for the postretirement obligation must be recognized under SFAS No. 106 if the benefit is offered under an arrangement that constitutes a plan or under APB No. 12 if it is not part of a plan. Issue 06-04 is effective for annual or interim reporting periods beginning after December 15, 2007. The Company has endorsement split-dollar life insurance policies and is currently assessing the financial statement impact of implementing EITF 06-04.
In September 2006, the FASB issued Statement No. 157, (“SFAS 157”), Fair Value Measurements. SFAS 157 defines fair value, establishes a framework for measuring fair value, and expands disclosures about fair value measurements. It clarifies that fair value is the price that would be received to sell and asset or paid to transfer a liability in an orderly transaction between market participants in the market in ehich the reporting entity transacts. This Statement does ot require any new fair value measurements, but rather, it provides enhanced guidance to other pronouncements that require or permit assets or liabilities to be measured at fair value This Statement is effective for fiscal years beginning November 15, 2007, with earlier adoption permitted. At this time, the Company does not expect that the adoption of this Statement will have a material impact on its financial position, results of operations, and cash flows.
In February 2007, the FASB issued Statement No. 159, (“SFAS 159”) The Fair Value Option for Financial Assets and Financial Liabilities – Including an amendment of FASB Statement No. 115. This Statement provides entities with an option to report selected financial assets at fair value. The objective of the Statement is to improve financial reporting by providing entities with the opportunity to mitigate volatility in earnings caused by measuring rlatd assets and liabilities differently without having to apply the complex provisions of hedge accounting. SFAS 159 is effective as of the beginning of an entity’s first fiscal year after November 15, 2007. Early adoption is permitted as of the beginning of a fiscal year that begins on or before November 15, 2007 provided the entity also elects to apply the provisions of SFAS 157. At this time, the Company does not expect that the adoption of this Statement will have a material impact on its financial position, results of operations, and cash flows.
| First Federal Bankshares, Inc. and Subsidiaries |
| |
| |
| Notes to Consolidated Financial Statements |
In September 2006, the FASB issued Statement No. 158, (“SFAS 158”), Employers’ Accounting for Defined Benefit Pension and Other Postretirement Plans – an amendment of FASB Statements No. 87, 88, 106 and 132(R). SFAS 158 requires a company that sponsors a postretirement benefit plan (other than a multi-employer plan) to fully recognize, as an asset or liability, the over-funded or under-funded status of its benefit plan in its balance sheet. The funded status is measured as the difference between the fair value of the plan’s assets and its benefit obligation (projected benefit obligation for pension plans and accumulated postretirement benefit obligation for other postretirement benefit plans). Currently, the funded status of such plans is reported in the notes to the financial statements. This provision was effective for the Company on July 1, 2006. In addition, SFAS No. 158 also requires a company to measure its plan assets and benefit obligations as of its year end balance sheet date. Currently, a company is permitted to choose a measurement date up to three months prior to its year end to measure the plan assets and obligations. This provision is effective for the Company on July 1, 2008. Since the Company participates in a multi-employer pension plan, it expects that the adoption of SFAS 158 will not have a material impact on its financial position, results of operation and cash flows.
Following is a schedule of amortized costs and estimated fair values as of June 30, 2007, and 2006:
| | | 2007 | |
| | | | | | Gross | | | Gross | | | | |
| | | Amortized | | | Unrealized | | | Unrealized | | | | |
| | | Cost | | | Gains | | | (Losses) | | | Fair Value | |
| Available-for-sale: | | | | | | | | | | | | |
| Mortgage-backed securities: | | | | | | | | | | | | |
| Governmental National Mortgage | | | | | | | | | | | | |
| Association (GNMA) | | $ | 3,486,433 | | | $ | 13,045 | | | $ | (10,698 | ) | | $ | 3,488,780 | |
| Federal Home Loan Mortgage | | | | | | | | | | | | | | | | |
| Association (FHLMC) | | | 3,056,608 | | | | 9,335 | | | | (40,337 | ) | | | 3,025,606 | |
| Federal National Mortgage | | | | | | | | | | | | | | | | |
| Association (FNMA) | | | 2,333,607 | | | | 2,139 | | | | (49,834 | ) | | | 2,285,912 | |
| United States treasury securities | | | 5,939,925 | | | | - | | | | (37,125 | ) | | | 5,902,800 | |
| United States government agency securities | | | 7,002,001 | | | | - | | | | (48,501 | ) | | | 6,953,500 | |
| Local government securities | | | 3,470,000 | | | | 10,356 | | | | (12,833 | ) | | | 3,467,523 | |
| Collateralized mortgage obligations | | | 22,613,486 | | | | - | | | | (165,630 | ) | | | 22,447,856 | |
| Collateralized debt obligations | | | 65,273,328 | | | | 34,245 | | | | - | | | | 65,307,573 | |
| Commercial paper | | | 4,996,292 | | | | - | | | | - | | | | 4,996,292 | |
| Other investment securities | | | 4,423,697 | | | | 9,478 | | | | - | | | | 4,433,175 | |
| Total available-for-sale securities | | $ | 122,595,377 | | | $ | 78,598 | | | $ | (364,958 | ) | | $ | 122,309,017 | |
| | | | | | | | | | | | | | | | | |
| Held-to-maturity: | | | | | | | | | | | | | | | | |
| Mortgage-backed securities: | | | | | | | | | | | | | | | | |
| GNMA | | $ | 107,572 | | | $ | 5,195 | | | | - | | | $ | 112,767 | |
| FHLMC | | | 1,042,926 | | | | 1,581 | | | $ | (7,264 | ) | | | 1,037,243 | |
| FNMA | | | 2,946,909 | | | | 5,426 | | | | (7,621 | ) | | | 2,944,714 | |
| Local government securities | | | 5,451,665 | | | | 22,104 | | | | (95,628 | ) | | | 5,378,141 | |
| Total held-to-maturity securities | | $ | 9,549,072 | | | $ | 34,306 | | | $ | (110,513 | ) | | $ | 9,472,865 | |
| First Federal Bankshares, Inc. and Subsidiaries |
| |
| |
| Notes to Consolidated Financial Statements |
| | | | | | | | | | | | | |
| | | 2006 | |
| | | | | | Gross | | | Gross | | | | |
| | | Amortized | | | Unrealized | | | Unrealized | | | | |
| | | Cost | | | Gains | | | (Losses) | | | Fair Value | |
| Available-for-sale: | | | | | | | | | | | | |
| Mortgage-backed securities: | | | | | | | | | | | | |
| GNMA | | $ | 5,732,564 | | | $ | 978 | | | $ | (75,351 | ) | | $ | 5,658,191 | |
| FHLMC | | | 4,778,490 | | | | 9,434 | | | | (66,877 | ) | | | 4,721,047 | |
| FNMA | | | 2,913,792 | | | | 411 | | | | (72,142 | ) | | | 2,842,061 | |
| United States treasury securities | | | 5,887,729 | | | | - | | | | (101,929 | ) | | | 5,785,800 | |
| United States government agency securities | | | 7,011,238 | | | | - | | | | (135,038 | ) | | | 6,876,200 | |
| Local government securities | | | 3,470,000 | | | | 7,197 | | | | (24,557 | ) | | | 3,452,640 | |
| Commercial paper | | | 9,986,875 | | | | - | | | | - | | | | 9,986,875 | |
| Other investment securities | | | 8,058,694 | | | | 23,137 | | | | (84,913 | ) | | | 7,996,918 | |
| Total available-for-sale securities | | $ | 47,839,382 | | | $ | 41,157 | | | $ | (560,807 | ) | | $ | 47,319,732 | |
| | | | | | | | | | | | | | | | | |
| Held-to-maturity: | | | | | | | | | | | | | | | | |
| Mortgage-backed securities: | | | | | | | | | | | | | | | | |
| GNMA | | $ | 144,088 | | | $ | 5,289 | | | | - | | | $ | 149,377 | |
| FHLMC | | | 1,282,938 | | | | 971 | | | $ | (20,749 | ) | | | 1,263,160 | |
| FNMA | | | 4,381,759 | | | | 5,671 | | | | (39,513 | ) | | | 4,347,917 | |
| Local government securities | | | 7,268,268 | | | | 64,336 | | | | (121,425 | ) | | | 7,211,179 | |
| Total held-to-maturity securities | | $ | 13,077,053 | | | $ | 76,267 | | | $ | (181,687 | ) | | $ | 12,971,633 | |
Following is a schedule of the fair value and gross unrealized losses, aggregated by investment category and length of time that individual securities have been in a continuous loss position, at June 30, 2007, and 2006.
| | | 2007 | |
| | | Less than 12 months | | | 12 months or longer | | | Total | |
| | | Fair | | | Unrealized | | | Fair | | | Unrealized | | | Fair | | | Unrealized | |
| | | Value | | | (Losses) | | | Value | | | (Losses) | | | Value | | | (Losses) | |
| Mortgage-backed securities: | | | | | | | | | | | | | | | | | | |
| GNMA | | | - | | | | - | | | $ | 1,184,508 | | | $ | (10,698 | ) | | $ | 1,184,508 | | | $ | (10,698 | ) |
| FHLMC | | $ | 77,647 | | | $ | (50 | ) | | | 2,507,407 | | | | (47,551 | ) | | | 2,585,054 | | | | (47,601 | ) |
| FNMA | | | 8,070 | | | | (4 | ) | | | 4,546,981 | | | | (57,451 | ) | | | 4,555,051 | | | | (57,455 | ) |
| United States treasury | | | | | | | | | | | | | | | | | | | | | | | | |
| securities | | | - | | | | - | | | | 5,902,800 | | | | (37,125 | ) | | | 5,902,800 | | | | (37,125 | ) |
| United States government | | | | | | | | | | | | | | | | | | | | | | | | |
| agency securities | | | 2,979,900 | | | | (20,100 | ) | | | 3,973,600 | | | | (28,401 | ) | | | 6,953,500 | | | | (48,501 | ) |
| Local government securities | | | - | | | | - | | | | 4,530,194 | | | | (108,461 | ) | | | 4,530,194 | | | | (108,461 | ) |
| Collateralized mortgage obligations | | | 16,742,146 | | | | (118,809 | ) | | | 1,796,358 | | | | (46,821 | ) | | | 18,538,504 | | | | (165,630 | ) |
| Total securities in loss position | | $ | 19,807,763 | | | $ | (138,963 | ) | | $ | 24,441,848 | | | $ | (336,508 | ) | | $ | 44,249,611 | | | $ | (475,471 | ) |
| First Federal Bankshares, Inc. and Subsidiaries |
| |
| |
| Notes to Consolidated Financial Statements |
| | | 2006 | |
| | | Less than 12 months | | | 12 months or longer | | | Total |
| | | Fair | | | Unrealized | | | Fair | | | Unrealized | | | Fair | | | Unrealized | |
| | | Value | | | (Losses) | | | Value | | | (Losses) | | | Value | | | (Losses) | |
| Mortgage-backed securities: | | | | | | | | | | | | | | | | | | |
| GNMA | | $ | 3,407,721 | | | $ | (24,332 | ) | | $ | 2,009,880 | | | $ | (51,019 | ) | | $ | 5,417,601 | | | $ | (75,351 | ) |
| FHLMC | | | 2,023,573 | | | | (21,918 | ) | | | 3,132,522 | | | | (65,708 | ) | | | 5,156,095 | | | | (87,626 | ) |
| FNMA | | | 4,472,362 | | | | (41,940 | ) | | | 2,157,646 | | | | (69,715 | ) | | | 6,630,008 | | | | (111,655 | ) |
| United States treasury | | | | | | | | | | | | | | | | | | | | | | | | |
| securities | | | 5,785,800 | | | | (101,929 | ) | | | - | | | | - | | | | 5,785,800 | | | | (101,929 | ) |
| United States government | | | | | | | | | | | | | | | | | | | | | | | | |
| agency securities | | | 3,927,200 | | | | (76,159 | ) | | | 2,949,000 | | | | (58,879 | ) | | | 6,876,200 | | | | (135,038 | ) |
| Local government securities | | | 4,542,096 | | | | (73,119 | ) | | | 1,106,344 | | | | (72,863 | ) | | | 5,648,440 | | | | (145,982 | ) |
| Other investment securities | | | - | | | | - | | | | 2,331,424 | | | | (84,913 | ) | | | 2,331,424 | | | | (84,913 | ) |
| Total securities in loss position | | $ | 24,158,752 | | | $ | (339,397 | ) | | $ | 13,686,816 | | | $ | (403,097 | ) | | $ | 37,845,568 | | | $ | (742,494 | ) |
For the investment securities in the schedule of the fair value and gross unrealized losses above, the unrealized losses are generally due to increases in the market interest rate environment and, as such, are considered to be temporary by the Company. In addition, the Company has the intent and ability to hold these investment securities for a period of time sufficient to allow for an anticipated recovery in fair value.
The amortized cost and fair value at June 30, 2007, are shown below by contractual maturity. Expected maturities will differ from contractual maturities because issuers may have the right to call or prepay obligations with or without call or prepayment penalties.
| | | | | | | | | | | | | |
| | | Available-for-sale | | | Held to-maturity | |
| | | Amortized | | | Estimated | | | Amortized | | | Estimated | |
| | | Cost | | | Fair Value | | | Cost | | | Fair Value | |
| Due in 1 year or less | | $ | 7,980,345 | | | $ | 7,963,592 | | | $ | 686,228 | | | $ | 679,698 | |
| Due after 1 year through 5 years | | | 11,457,872 | | | | 11,389,000 | | | | 2,239,567 | | | | 2,241,500 | |
| Due after 5 years through 10 years | | | 1,083,220 | | | | 1,077,356 | | | | 1,004,794 | | | | 959,733 | |
| Due after 10 years | | | 5,310,478 | | | | 5,323,342 | | | | 1,521,076 | | | | 1,497,210 | |
| Investments with fixed maturities | | | 25,831,915 | | | | 25,753,290 | | | | 5,451,665 | | | | 5,378,141 | |
| Collateralized mortgage obligations | | | 22,613,486 | | | | 22,447,856 | | | | - | | | | - | |
| Collateralized debt obligations | | | 65,273,328 | | | | 65,307,573 | | | | - | | | | - | |
| Mortgage-backed securities | | | 8,876,648 | | | | 8,800,298 | | | | 4,097,407 | | | | 4,094,724 | |
| Total investment securities | | $ | 122,595,377 | | | $ | 122,309,017 | | | $ | 9,549,072 | | | $ | 9,472,865 | |
Proceeds from the sale of securities available for sale were approximately $4.0 million, $0.3 million and $30.2 million during 2007, 2006 and 2005, respectively. Gross realized gains on these sales were approximately $14,000, $203,000 and zero and gross realized losses on these sales were zero, zero and $121,000 in 2007, 2006 and 2005, respectively.
Securities with an amortized cost of $16.5 million and an estimated fair value of approximately $16.3 million and securities with an amortized cost of $10.1 million and an estimated fair value of approximately $9.9 million were pledged to various entities and depositors at June 30, 2007 and 2006, respectively.
| First Federal Bankshares, Inc. and Subsidiaries |
| |
| |
| Notes to Consolidated Financial Statements |
Loans receivable at June 30, 2007, and 2006 are summarized as follows:
| | | 2007 | | | 2006 | |
| First mortgage loans: | | | | | | |
| Secured by one to four family residences | | $ | 126,360,093 | | | $ | 133,629,679 | |
| Secured by multi-family and non-residential properties | | | 197,952,105 | | | | 209,082,846 | |
| Home equity and second mortgage loans | | | 28,594,246 | | | | 29,849,778 | |
| Automobile loans | | | 4,053,913 | | | | 5,404,477 | |
| Commercial business loans | | | 50,438,852 | | | | 54,586,075 | |
| Other nonmortgage loans | | | 24,941,725 | | | | 30,320,025 | |
| Loans in process, unearned discounts, premiums and | | | | | | | | |
| net deferred loan fees and costs | | | (458,883 | ) | | | (378,067 | ) |
| Subtotal | | | 431,882,051 | | | | 462,494,813 | |
| Allowance for loan losses | | | (1,797,393 | ) | | | (5,465,563 | ) |
| Total loans receivable | | $ | 430,084,658 | | | $ | 457,029,250 | |
At June 30, 2007, and 2006, the Company had nonaccrual loans of $1.2 million and $6.5 million, respectively. In addition, restructured loans currently performing under the terms of restructure agreements, totaled $2.8 million and $2.1 million, respectively at June 30, 2007, and 2006. Interest income recorded during 2007, 2006, and 2005 on restructured loans was not materially different than interest income which would have been recorded if these loans had been current in accordance with their original terms. Interest forgone on nonaccrual loans was $48,000 in 2007, $228,000 in 2006, and $42,000 in 2005.
Loans are considered impaired when it is probable the company will be unable to collect all contractual principal and interest payments due in accordance with the terms of the loan agreement, including loans placed on nonaccrual. The following table sets forth information on impaired loans at June 30, 2007, and 2006.
| | | 2007 | | | 2006 | |
| | | Recorded | | | Valuation | | | Recorded | | | Valuation | |
| | | Investment | | | Allowance | | | Investment | | | Allowance | |
| Valuation allowance required | | $ | 724,114 | | | $ | 195,544 | | | $ | 5,228,230 | | | $ | 1,879,318 | |
| Valuation allowance not required | | | 1,202,962 | | | | - | | | | 1,624,077 | | | | - | |
| Total impaired loans and allowance | | $ | 1,927,076 | | | $ | 195,544 | | | $ | 6,852,307 | | | $ | 1,879,318 | |
At June 30, 2007, there were no material commitments to lend additional funds to borrowers whose existing loans were considered impaired at that date.
| First Federal Bankshares, Inc. and Subsidiaries |
| |
| |
| Notes to Consolidated Financial Statements |
| |
Loan servicing: The Company originates mortgage loans for portfolio investment or sale in the secondary market. During the period of origination, mortgage loans are designated as held either for sale or for investment purposes. Mortgage loans held for sale are carried at the lower of cost or market value, determined on an aggregate basis. Loans held for sale as of June 30, 2007 and 2006 were $2.1 million and zero.
One- to four-family residential mortgage loans serviced for others are not included in the accompanying consolidated statements of financial condition. The unpaid principal balance of these loans was $41.9 million, $39.6 million and $48.2 million at June 30, 2007, 2006 and 2005, respectively. Servicing loans for others generally consists of collecting mortgage payments, maintaining escrow accounts, disbursing payments to investors, and foreclosure processing.
Loan servicing income is recorded on the accrual basis and includes servicing fees from investors and certain charges collected from borrowers, such as late payment fees. In connection with these loans serviced for others, the Company held borrowers’ escrow balances of $352,000, $367,000 and $415,000 at June 30, 2007, 2006 and 2005, respectively.
Concentrations of credit risk: The Company conducts the majority of its loan origination activities in its market area, which includes northwest and central Iowa and portions of Nebraska and South Dakota. In addition to loan origination, the Company has purchased loans outside of its primary lending area. Although the Company has a diversified geographic loan portfolio, a substantial portion of its borrowers’ ability to repay their loans is dependent upon economic conditions in the Company’s market area.
Mortgage loans purchased outside the Company’s primary lending area totaled approximately $39.7 million and $47.2 million, respectively, at June 30, 2007 and 2006. At June 30, 2007, mortgage loans purchased outside the Company’s primary lending area included approximately $22.6 million in loans geographically located in the Midwestern United States, with the largest geographic concentration in Minnesota with $17.5 million. The remaining $17.1 million in loans were distributed throughout the United States, with the largest geographic concentration in Colorado with $15.0 million. At June 30, 2006, mortgage loans purchased outside the Company’s primary lending area included approximately $25.8 million in loans geographically located in the Midwestern United States, with the largest geographic concentration in Minnesota with $19.2 million. The remaining $21.4 million in loans were distributed throughout the United States, with the largest geographic concentration in Colorado with $19.6 million.
Commercial business loans purchased outside the Company‘s primary lending area totaled $4.3 million and $2.4 million, respectively, at June 30, 2007 and 2006.
The Company’s commercial real estate loan portfolio was made up of $125.1 million of nonresidential real estate loans, $37.8 million of multi-family residential loans, and $35.1 million of construction, land acquisition and development loans at June 30, 2007. The Company’s commercial real estate loan portfolio at June 30, 2006 was made up of $117.3 million of nonresidential real estate loans, $40.5 million of multi-family residential loans, and $51.3 million of construction, land acquisition and development loans.
| First Federal Bankshares, Inc. and Subsidiaries |
| |
| |
| Notes to Consolidated Financial Statements |
Note 4. | Allowance for Loan Losses |
A summary of the allowance for loan losses as of June 30, 2007, 2006 and 2005 follows:
| | | 2007 | | | 2006 | | | 2005 | |
| Balance, beginning of year | | $ | 5,465,563 | | | $ | 6,717,956 | | | $ | 4,316,286 | |
| Provision for losses | | | 546,949 | | | | 1,920,000 | | | | 2,985,000 | |
| Charge-offs | | | (4,411,598 | ) | | | (3,273,773 | ) | | | (685,852 | ) |
| Recoveries | | | 196,479 | | | | 101,380 | | | | 102,522 | |
| Balance, end of year | | $ | 1,797,393 | | | $ | 5,465,563 | | | $ | 6,717,956 | |
Note 5. | Office Property and Equipment |
At June 30, 2007, and 2006, the cost and accumulated depreciation of office property and equipment were as follows:
| | | 2007 | | | 2006 | |
| Land and improvements | | $ | 5,619,829 | | | $ | 3,631,775 | |
| Building and improvements | | | 13,871,685 | | | | 12,918,703 | |
| Furniture, fixtures, automobiles, software and equipment | | | 7,584,455 | | | | 7,775,928 | |
| Deposits on assets not in service | | | 1,213,458 | | | | 250,429 | |
| Total cost | | | 28,289,427 | | | | 24,576,835 | |
| Less accumulated depreciation | | | 12,084,514 | | | | 12,031,421 | |
| Total office property and equipment | | $ | 16,204,913 | | | $ | 12,545,414 | |
Depreciation expense on premises, furniture, fixtures, automobiles, software, and equipment was $1.1 million for fiscal 2007 and $1.2 million for both fiscal 2006 and 2005.
Note 6. | Accrued Interest Receivable |
Accrued interest receivable as of June 30, 2007, and 2006 is summarized as follows:
| | | 2007 | | | 2006 | |
| Loans receivable | | $ | 2,078,579 | | | $ | 2,238,001 | |
| Securities | | | 861,414 | | | | 389,979 | |
| Total accrued interest receivable | | $ | 2,939,993 | | | $ | 2,627,980 | |
| First Federal Bankshares, Inc. and Subsidiaries |
| |
| |
| Notes to Consolidated Financial Statements |
The gross carrying amount of intangible assets subject to amortization and the associated accumulated amortization at June 30, 2007 and 2006 is presented in the table below. Intangible assets’ balances are included in the line item ‘Other assets’ of the Consolidated Balance Sheets. Amortization expense for intangible assets was $92,000, $98,000 and $88,000 for fiscal 2007, 2006, and 2005, respectively.
| | | 2007 | |
| | | Gross | | | | | | Unamortized | |
| | | Carrying | | | Accumulated | | | Intangible | |
| | | Amount | | | Amortization | | | Assets | |
| Intangible assets: | | | | | | | | | |
| Core deposit premium | | $ | 690,140 | | | $ | 610,648 | | | $ | 79,492 | |
| Mortgage servicing rights | | | 400,235 | | | | 151,636 | | | | 248,599 | |
| | | $ | 1,090,375 | | | $ | 762,284 | | | $ | 328,091 | |
| | | | | | | | | | | | | |
| | | 2006 | |
| | | Gross | | | | | | | Unamortized | |
| | | Carrying | | | Accumulated | | | Intangible | |
| | | Amount | | | Amortization | | | Assets | |
| Intangible assets: | | | | | | | | | | | | |
| Core deposit premium | | $ | 690,140 | | | $ | 566,044 | | | $ | 124,096 | |
| Mortgage servicing rights | | | 268,379 | | | | 104,222 | | | | 164,157 | |
| | | $ | 958,519 | | | $ | 670,266 | | | $ | 288,253 | |
Projections of amortization expense are based on existing asset balances and the existing interest rate environment as of June 30, 2007. What the Company actually experiences may be significantly different depending upon changes in mortgage interest rates and market conditions. The unamortized expense for core deposit premium for June 30, 2008, and 2009 is projected to be $45,000 and $35,000 respectively.
Effective July 1, 2007, the Company adopted SFAS 156 and has chosen the fair value method in measuring the Company’s mortgage servicing rights.
| First Federal Bankshares, Inc. and Subsidiaries |
| |
| |
| Notes to Consolidated Financial Statements |
Note 8. | Deposit Liabilities |
At June 30, 2007, and 2006, deposits are summarized as follows:
| | | 2007 | | | 2006 | |
| Noninterest-bearing checking | | $ | 45,200,154 | | | $ | 46,889,517 | |
| Interest-bearing checking accounts | | | 91,723,299 | | | | 67,411,256 | |
| Money market accounts | | | 55,847,749 | | | | 72,964,544 | |
| Savings accounts | | | 25,931,213 | | | | 27,856,376 | |
| Certificates of deposit | | | 289,162,648 | | | | 230,934,695 | |
| Total deposit liabilities | | $ | 507,865,063 | | | $ | 446,056,388 | |
The aggregate amount of certificates of deposit with a minimum denomination of $100,000 was approximately $84.5 million and $38.4 million at June 30, 2007 and 2006, respectively. Brokered certificates of deposit totaled $50.0 million and $3.5 million at June 30, 2007 and 2006, respectively.
At June 30, 2007, the scheduled maturities of certificates of deposit were as follows:
| 2008 | | $ | 245,819,437 | |
| 2009 | | | 26,139,139 | |
| 2010 | | | 9,375,546 | |
| 2011 | | | 2,719,883 | |
| 2012 | | | 4,800,897 | |
| Thereafter | | | 307,746 | |
| Total certificates of deposit | | $ | 289,162,648 | |
Interest expense on deposits for the years ended June 30, 2007, 2006 and 2005 is summarized as follows:
| | | 2007 | | | 2006 | | | 2005 | |
| Interest-bearing checking accounts | | $ | 2,014,862 | | | $ | 863,147 | | | $ | 241,948 | |
| Money market accounts | | | 2,008,010 | | | | 1,752,832 | | | | 979,809 | |
| Savings accounts | | | 128,849 | | | | 142,806 | | | | 124,077 | |
| Certificates of deposit | | | 11,907,394 | | | | 7,832,231 | | | | 5,885,719 | |
| Total interest expense on deposits | | $ | 16,059,115 | | | $ | 10,591,016 | | | $ | 7,231,553 | |
| First Federal Bankshares, Inc. and Subsidiaries |
| |
| |
| Notes to Consolidated Financial Statements |
Note 9. | Advances from FHLB and other borrowings |
A summary at June 30, 2007, and 2006 follows:
| | | Weighted | | | | Weighted | | |
| | | Average | | | | Average | | |
| | | Interest | | | | Interest | | |
| | | Rate | 2007 | | | Rate | 2006 | |
| FHLB of Des Moines (1) | | | | | | | | | | | | |
| Stated maturity in fiscal year ending June 30: | | | | | | | | | | | | |
| 2007 | | | - | | | | - | | | | 3.39 | % | | $ | 25,500,000 | |
| 2008 (2) | | | 4.94 | % | | $ | 27,000,000 | | | | 4.98 | % | | | 32,000,000 | |
| 2009 (2) | | | 5.32 | % | | | 17,500,000 | | | | 5.25 | % | | | 23,500,000 | |
| 2010 (2) | | | 5.12 | % | | | 8,000,000 | | | | 5.12 | % | | | 8,000,000 | |
| Total advances from FHLB of Des Moines | | | | | | | 52,500,000 | | | | | | | | 89,000,000 | |
| Other borrowings (3) | | | 5.07 | % | | | 9,702,299 | | | | 4.93 | % | | | 3,753,665 | |
| Total advances from FHLB and other borrowings | | | | | | $ | 62,202,299 | | | | | | | $ | 92,753,665 | |
| (1) | Advances from the FHLB are secured by stock in the FHLB. In addition, the Company has agreed to maintain unencumbered additional security in the form of certain residential mortgage loans aggregating no less than 120% of outstanding balances. |
| (2) | Includes FHLB convertible advances. Convertible advances are advances that the FHLB may terminate and require the Company to repay prior to the stated maturity date. Usage of this type of advance is limited to a range of 10% to 20% of the Company’s total assets by the FHLB. At June 30, 2007 and 2006, respectively, $35.0 million and $51.0 million of convertible advances with a weighted average interest rate of 5.49% and 5.32% were callable quarterly. |
| (3) | Includes repurchase agreements with commercial banking customers totaling $6.7 million. Also includes a structured repurchase agreement for $3.0 million with a rate of 4.68% that matures on September 25, 2013. The agreement may be terminated on or after September 25, 2009 by the buyer. |
The Bank also has access to overnight advances from the FHLB which have no stated maturity and may be prepaid at will. Overnight borrowing rates are based on the Fed Funds rate at the time of the borrowing and automatically renew daily and reprice based on the the Fed Funds rate. During fiscal 2007, the Company’s average outstanding balance of overnight borrowings was $0.9 million and the weighted-average interest cost was 5.55%.
In addition the Holding Company has a $5 million line of credit with another financial institution. As of June 30, 2007, the current balance of that line of credit is zero and the line has not been drawn on all fiscal year. The line of credit matures November 1, 2007.
| First Federal Bankshares, Inc. and Subsidiaries |
| |
| |
| Notes to Consolidated Financial Statements |
Taxes on income from continuing operations for the years ended June 30, 2007, 2006 and 2005 were comprised as follows:
| | | Current | | | Deferred | | | Total | |
| 2007: | | | | | | | | | |
| Federal | | $ | 256,000 | | | $ | 438,000 | | | $ | 694,000 | |
| State | | | (65,000 | ) | | | 110,000 | | | | 45,000 | |
Total taxes on income | | $ | 191,000 | | | $ | 548,000 | | | $ | 739,000 | |
| | | | | | | | | | | | | |
| 2006: | | | | | | | | | | | | |
| Federal | | $ | 1,014,000 | | | $ | (24,000 | ) | | $ | 990,000 | |
| State | | | 163,000 | | | | (6,000 | ) | | | 157,000 | |
| Total taxes on income | | $ | 1,177,000 | | | $ | (30,000 | ) | | $ | 1,147,000 | |
| | | | | | | | | | | | | |
| 2005: | | | | | | | | | | | | |
| Federal | | $ | 1,359,000 | | | $ | 137,000 | | | $ | 1,496,000 | |
| State | | | 231,000 | | | | 35,000 | | | | 266,000 | |
| Total taxes on income | | $ | 1,590,000 | | | $ | 172,000 | | | $ | 1,762,000 | |
Taxes on income differ from the amounts computed by applying the Federal income tax rate of 35% to earnings from continuing operations before taxes on income for the years ended June 30, 2007, 2006, and 2005 for the following reasons:
| | | 2007 | | | 2006 | | | 2005 | |
| Computed "expected" tax expense | | $ | 1,126,363 | | | $ | 1,517,653 | | | $ | 2,037,084 | |
| Nontaxable income | | | (428,116 | ) | | | (424,444 | ) | | | (397,751 | ) |
| State income taxes | | | 29,250 | | | | 102,050 | | | | 127,759 | |
| Other, net | | | 11,503 | | | | (48,259 | ) | | | (5,092 | ) |
| Total taxes on income | | $ | 739,000 | | | $ | 1,147,000 | | | $ | 1,762,000 | |
| First Federal Bankshares, Inc. and Subsidiaries |
| |
| |
| Notes to Consolidated Financial Statements |
Tax effects of temporary differences that give rise to significant portions of the deferred tax assets and deferred tax liabilities at June 30, 2007, and 2006, are presented below:
| | | 2007 | | | 2006 | |
| Deferred tax assets: | | | | | | |
| Allowance for loan losses | | $ | 597,000 | | | $ | 1,223,000 | |
| ESOP | | | 56,000 | | | | 58,000 | |
| Accrued paid-time-off | | | 81,000 | | | | 75,000 | |
| Deferred directors fees | | | 203,000 | | | | 189,000 | |
| Unrealized loss on securities available-for-sale | | | 107,000 | | | | 194,000 | |
| Other | | | 40,000 | | | | 31,000 | |
| Total gross deferred tax assets | | | 1,084,000 | | | | 1,770,000 | |
| | | | | | | | | |
| Deferred tax liabilities: | | | | | | | | |
| FHLB stock dividends | | | (327,000 | ) | | | (347,000 | ) |
| Fixed assets | | | (157,000 | ) | | | (228,000 | ) |
| Loan origination costs | | | (145,000 | ) | | | (160,000 | ) |
| Prepaid expenses | | | (105,000 | ) | | | (105,000 | ) |
| Mortgage servicing rights | | | (93,000 | ) | | | (61,000 | ) |
| Purchase accounting adjustments | | | (30,000 | ) | | | (46,000 | ) |
| Other | | | (62,000 | ) | | | (23,000 | ) |
| Total gross deferred tax liabilities | | | (919,000 | ) | | | (970,000 | ) |
| | | | | | | | | |
| Net deferred tax asset | | $ | 165,000 | | | $ | 800,000 | |
Based upon the Company’s level of historical taxable income and anticipated future taxable income over the periods which the deferred tax assets are deductible, management believes it is more likely than not the Company will realize the benefits of these deductible differences.
Note 11. | Employee Benefit Plans |
Pension: The Bank is a participant in the Financial Institutions Retirement Fund (FIRF), a multi-employer defined benefit pension plan, and substantially all of its officers and employees are covered by the plan. FIRF does not segregate the assets, liabilities, or costs by participating employer. Pension expense for fiscal 2007, 2006 and 2005 totaled $677,000, $566,000 and $660,000, respectively. The defined benefit pension plan was frozen effective August 1, 2005. The Company does not expect any significant reduction in pension expense as a result of this change until fiscal 2009 due to continuing amortization charges for benefits in place prior to August 1, 2005.
Profit sharing plan: Bank employees participate in the First Federal Bank Employees’ Savings & Profit Sharing Plan and Trust (the Profit Sharing Plan). Employees who are at least 21 years of age become eligible for participation after 3 months of continuous employment (during which at least 250 hours of service are completed). Prior to August 1, 2005, the Bank matched an amount equal to 25% of the first 4% of the employee’s compensation. Effective August 1, 2005, the employer match increased to 50% of the first 6% of the employee’s compensation. The Profit Sharing Plan expense for the years ended June 30, 2007, 2006 and 2005 was $162,000, $144,000 and $59,000, respectively.
| First Federal Bankshares, Inc. and Subsidiaries |
| |
| |
| Notes to Consolidated Financial Statements |
ESOP: In April 1999, as part of the reorganization and conversion of First Federal Bankshares, M.H.C., the Bank’s ESOP purchased 184,450 shares of the Company’s common stock at $10 per share, which was funded by a 15-year, 7% loan from the Company. Quarterly principal payments of $30,742 commenced on June 30, 1999. All employees meeting the age and service requirements are eligible to participate in the ESOP. Contributions made by the Bank to the Plan are allocated to participants by using a formula based on compensation. Participant benefits become 100% vested after five years of service. The ESOP is accounted for under Employers’ Accounting for Employee Stock Ownership Plans (SOP 93-6). Dividends paid on unallocated shares reduce the Company’s cash contributions to the ESOP. The ESOP’s borrowing from the Company is eliminated in consolidation.
At June 30, 2007 and 2006, allocated shares were 130,065 and 143,959, respectively. Shares committed to be released were 5,998 and 6,278, respectively. The fair value of the 66,484 and 78,654 unallocated shares was approximately $1.3 million and $1.7 million, respectively.
Plan expense was $257,000, $263,000, and $289,000 for the years ended June 30, 2007, 2006, and 2005, respectively.
Stock options: As of June 30, 2007, the Company had two share-based compensation plans, which are described in this section. The compensation cost that was charged against income for those plans was $106,000 and $55,000, respectively, for fiscal 2007 and 2006 and the total income tax benefit recognized in the income statement for share-based compensation arrangements was $6,000 and $2,000, respectively, for 2007 and 2006. Prior to July 1, 2005, no compensation cost was recognized for share-based compensation in the Company’s financial statements since it applied APB Opinion No. 25 and related interpretations in accounting for these plans. The Company adopted SFAS 123(R) effective July 1, 2005.
In October 1999, the Company established the 1999 stock option plan (“1999 Plan”). The Company’s 1999 Plan permits the board of directors to grant options to purchase up to 263,500 shares of the Company’s $0.01 par value common stock. The options may be granted to directors and officers of the Company. Option awards are generally granted with an exercise price equal to the market price of the Company’s stock at the date of grant. They generally vest over 5 years and have 10-year contractual terms. Shares remaining available for grant under the 1999 Plan totaled 450 at June 30, 2007.
In October 2006, the Company established the 2006 Stock-Based Incentive Plan (“2006 Plan”). The Company’s 2006 Plan permits the board of directors to grant stock options, stock appreciation rights, or restricted stock to eligible directors and officers of the Company. Up to 300,000 shares are available for awards under the 2006 Plan. The exercise price of option awards will not be less than one hundred percent of the market price of the Company’s stock at the date of the grant and stock appreciation rights will entitle the participant to receive a payment in common stock equal to the excess of the fair market value of the common stock on the date of the exercise over the fair market value on the date of the grant. Shares remaining available for future grant under the 2006 Plan total 221,042 at June 30, 2007.
The Company uses the Black-Scholes option pricing model to estimate the fair value of share-based payments awards. Weighted-average assumptions used in the option pricing model for stock options granted during the years ended June 30, 2007, 2006 and 2005 are presented in the following table.
| | | 2007 | | | 2006 | | | 2005 | |
| Dividend yield | | | 2.17 | % | | | 2.17 | % | | | 2.44 | % |
| Expected volatility | | | 23.53 | % | | | 28.51 | % | | | 24.26 | % |
| Risk-free interest rate | | | 4.50 | % | | | 4.28 | % | | | 4.54 | % |
| Expected life of options (in years) | | | 6.50 | | | | 7.50 | | | | 7.50 | |
| Weighted-average grant date fair value of options | | | | | | | | | | | | |
| granted during the year | | $ | 5.49 | | | $ | 7.53 | | | $ | 6.64 | |
| First Federal Bankshares, Inc. and Subsidiaries |
| |
| |
| Notes to Consolidated Financial Statements |
Weighted-average assumptions used for stock appreciation rights granted in fiscal 2007 under the 2006 Plan were: dividend yield of 2.19%; expected volatility of 22.04%; risk-free interest rate of 4.57%; expected life of 6.0 years; and weighted-average grant date fair value of $4.55.
Expected volatilities are based on historical volatility of the Company’s stock, and other factors. The Company uses historical data to estimate exercise dates and employee termination in order to determine the expected life of options. The risk-free interest rates are based on U. S. Treasury constant maturity yields in effect at the time of each grant for treasury securities with maturities approximating the expected life of options granted.
A summary of option activity for the year ended June 30, 2007 is presented below:
| | | | | | | | | Weighted- | | | | |
| | | | | | Weighted- | | | Average | | | Aggregate | |
| | | | | | Average | | | Remaining | | | Intrinsic | |
| Options | | Shares | | | Exercise Price | | | Contractual Term | | | Value | |
| Outstanding at July 1, 2006 | | | 118,061 | | | $ | 14.10 | | | | | | | |
| Granted | | | 15,000 | | | | 19.58 | | | | | | | |
| Exercised | | | (51,611 | ) | | | 10.86 | | | | | | | |
| Forfeited | | | (450 | ) | | | 23.46 | | | | | | | |
| Outstanding at June 30, 2007 | | | 81,000 | | | $ | 17.49 | | | | 6.38 | | | $ | 275,310 | |
| Exercisable at June 30, 2007 | | | 53,600 | | | $ | 15.88 | | | | 5.27 | | | $ | 259,610 | |
Stock appreciation rights granted in fiscal 2007 under the 2006 Plan totaled 59,246 shares. At June 30, 2007, the stock appreciation rights had a weighted-average exercise price of $19.10, a weighted-average remaining contractual term of 9.87 years, and aggregate intrinsic value of $46,291 and none were exercisable.
The total intrinsic value of options exercised during fiscal 2007, 2006, and 2005 was $554,000, $421,000, and $474,000, respectively.
As of June 30, 2007, there was $364,000 of total unrecognized compensation cost related to non-vested share-based compensation arrangements granted under share-based payment arrangements. That cost is expected to be recognized over a weighted-average period of 3.0 years. The total fair value of shares vested during the years ended June 30, 2007, 2006, and 2005 was $106,000, $55,000 and $98,000, respectively.
Cash received from option exercises under share-based payment arrangements for the years ended June 30, 2007, 2006, and 2005 was $514,000, $317,000, and $393,000, respectively. The actual tax benefit realized for the tax deductions from option exercise of the share-based payment arrangements totaled $151,000, $26,000, and $23,000, respectively, for the years ended June 30, 2007, 2006, and 2005.
Recognition and retention plan and restricted stock: In October 1999, the Company established the 1999 Recognition and Retention Plan (RRP) for certain executive officers. The Company contributed funds to the RRP to acquire 79,050 or 3% of the shares of common stock sold in April 1999. The shares of stock vest over a five year period. RRP expense for the years ended June 30, 2007, 2006, and 2005 was $37,000, $39,000, and $185,000, respectively. No shares remain to be granted under the RRP. Restricted stock awards may be granted under the 2006 Stock-Based Incentive Plan.
| First Federal Bankshares, Inc. and Subsidiaries |
| |
| |
| Notes to Consolidated Financial Statements |
A summary of the status of the Company’s non-vested shares as of June 30, 2007, and changes during the year ended June 30, 2007 is as follows:
| | | | | | Weighted-Average | |
| | | | | | Grant-Date | |
| Non-vested restricted shares | | Shares | | | Fair Value | |
| Non-vested at July 1, 2006 | | | 1,500 | | | $ | 12.73 | |
| Granted under the 1999 Plan | | | 638 | | | | 21.50 | |
| Granted under the 2006 Plan | | | 5,362 | | | | 21.50 | |
| Vested | | | (1,100 | ) | | | 12.34 | |
| Non-vested at June 30, 2007 | | | 6,400 | | | $ | 21.02 | |
As of June 30, 2007 there was $95,000 of total unrecognized compensation cost related to non-vested RRP and restricted shares. The cost is expected to be recognized over a weighted-average period of 4.4 years. The total fair value of shares vested during the years ended June 30, 2007, 2006, and 2005 was $24,000, $188,000, and $272,000, respectively.
Note 12. | Related Party Transactions |
In the ordinary course of business, the Bank has granted loans to principal officers and directors and their affiliates. The aggregate outstanding balance of such loans totaled $1.3 million and $1.6 million, respectively, at June 30, 2007 and 2006. During the year ended June 30, 2007, total principal additions were $75,000, total principal payments were $96,000, and reductions due to change in status totaled $315,000.
Deposits from related parties held by the Bank at June 30, 2007 and 2006, amounted to $3.5 million and $5.5 million, respectively.
Note 13. | Stockholders’ Equity |
Regulatory capital requirements: The Financial Institution Reform, Recovery, and Enforcement Act of 1989 (FIRREA) and the capital regulations of the Office of Thrift Supervision (OTS) promulgated thereunder require institutions to have minimum regulatory tangible capital equal to 1.5% of total assets, a minimum 4% leverage capital ratio, and a minimum 8% risk-based capital ratio. These capital standards set forth in the capital regulations must generally be no less stringent than the capital standards applicable to national banks. FIRREA also specifies the required ratio of housing-related assets in order to qualify as a savings institution.
The Federal Deposit Insurance Corporation Improvement Act of 1991 (FDICIA) established additional capital requirements which require regulatory action against depository institutions in one of the undercapitalized categories defined in implementing regulations. Institutions such as the Bank, which are defined as well capitalized, must generally have a leverage capital (core) ratio of at least 5%, a tier risk-based capital ratio of at least 6%, and a total risk-based capital ratio of at least 10%. FDICIA also provides for increased supervision by federal regulatory agencies, increased reporting requirements for insured depository institutions, and other changes in the legal and regulatory environment for such institutions.
The Bank met all regulatory capital requirements and was categorized as “well capitalized” at June 30, 2007 and 2006. Management believes that no conditions or events have occurred since those dates that would have changed the Bank’s category.
| First Federal Bankshares, Inc. and Subsidiaries |
| |
| |
| Notes to Consolidated Financial Statements |
The Bank’s actual and required capital amounts and ratios as of June 30, 2007 and 2006, are presented in the following table:
| | | 2007 |
| | | | | | | | | | | | | | | To Be Well | |
| | | | | | | | | | | | | | | Capitalized Under | |
| | | | | | | | | For Capital | | | Prompt Corrective | |
| | | Actual | | | Adequacy Purposes | | | Action Provisions | |
| | | Amount | | | Ratio | | | Amount | | | Ratio | | | Amount | | | Ratio | |
| Tangible capital | | $ | 49,018,000 | | | | 7.83 | % | | $ | 9,395,000 | | | | 1.50 | % | | | - | | | | - | |
| Tier 1 leverage (core) | | | 49,018,000 | | | | 7.83 | | | | 25,054,000 | | | | 4.00 | | | $ | 31,317,000 | | | | 5.00 | % |
| Tier 1 risk-based capital | | | 49,018,000 | | | | 10.17 | | | | 19,280,000 | | | | 4.00 | | | | 28,920,000 | | | | 6.00 | |
| Total risk-based capital | | | 50,620,000 | | | | 10.50 | | | | 38,559,000 | | | | 8.00 | | | | 48,199,000 | | | | 10.00 | |
| | | 2006 |
| | | | | | | | | | | | | | | | | | | To Be Well | |
| | | | | | | | | | | | | | | | | | | Capitalized Under | |
| | | | | | | | | | | For Capital | | | Prompt Corrective | |
| | | Actual | | | Adequacy Purposes | | | Action Provisions | |
| | | Amount | | | Ratio | | | Amount | | | Ratio | | | Amount | | | Ratio | |
| Tangible capital | | $ | 45,386,000 | | | | 7.66 | % | | $ | 8,891,000 | | | | 1.50 | % | | | - | | | | - | |
| Tier 1 leverage (core) | | | 45,386,000 | | | | 7.66 | | | | 23,709,000 | | | | 4.00 | | | $ | 29,636,000 | | | | 5.00 | % |
| Tier 1 risk-based capital | | | 45,386,000 | | | | 10.04 | | | | 18,080,000 | | | | 4.00 | | | | 27,121,000 | | | | 6.00 | |
| Total risk-based capital | | | 48,972,000 | | | | 10.83 | | | | 36,161,000 | | | | 8.00 | | | | 45,201,000 | | | | 10.00 | |
Retained earnings at June 30, 2007 and 2006 included approximately $9,165,000, which constitute allocations to bad debt reserves for Federal income tax purposes and for which no provision for taxes on income has been made. If such allocations are charged for other than bad debt losses, taxable income is created to the extent of the charges.
Restrictions on stockholders’ equity: In July 1992, the Bank converted from a mutual to a stock organization through the formation of a Mutual Holding Company. In April 1999, the Mutual Holding Company converted to a stock organization.
The 1992 and 1999 Plans of Conversion provided for the establishment of a special “liquidation account” for the benefit of Eligible Account Holders and Supplemental Eligible Account Holders in an amount equal to the greater of:
| w | The sum of the Mutual Holding Company’s ownership interests in the surplus and reserves of the Bank as of the date of its latest balance sheet contained in the final offering circular, and the amount of any dividends waived by the Mutual Holding Company. |
| w | The retained earnings of the Bank at the time that the Bank reorganized into the Mutual Holding Company in July 1992. |
Each eligible Account Holder and Supplemental Eligible Account Holder, if such person were to continue to maintain such person’s deposit account at the Bank, would be entitled, upon a complete liquidation of the Bank after the conversion, to an interest in the liquidation account prior to any payment to the Company as the sole stockholder of the Bank.
| First Federal Bankshares, Inc. and Subsidiaries |
| |
| |
| Notes to Consolidated Financial Statements |
Federal regulations impose certain limitations on the payment of dividends and other capital distributions by the Bank. Under these regulations, a savings institution, such as the Bank, that will meet capital requirements (as defined by OTS regulations) subsequent to a capital distribution is generally permitted to make such a capital distribution without OTS approval, subject to certain limitations and restrictions as described in the regulations. A savings institution with total capital in excess of current minimum capital requirements is permitted to make, without OTS approval, capital distributions of between 25% and 75% of its net earnings for the previous four quarters less dividends already paid for such period. A savings institution that fails to meet current minimum capital requirements is prohibited from making any capital distributions without prior approval from the OTS. The Bank’s current compliance with fully phased-in capital requirements would permit payment of dividends upon notice to the OTS.
Note 14. | Financial Instruments with Off-balance Sheet Risk |
The Company is a party to various transactions with off-balance sheet risk in the normal course of business. These transactions are primarily commitments to extend credit. These instruments involve, to varying degrees, elements of credit and interest rate risk in excess of the amount recorded in the consolidated financial statements.
At June 30, 2007 and 2006, the Company had commitments to originate and purchase loans approximating $32.0 million and $33.8 million, respectively, excluding undisbursed portions of loans in process. Commitments, which are disbursed subject to certain limitations, extend over various periods of time. Generally, unused commitments are canceled upon expiration of the commitment term as outlined in each individual contract. Because the credit worthiness of each customer is reviewed prior to extension of the commitment, the Company adequately controls its credit risk on these commitments, as it does for loans recorded on the statement of financial condition.
The Company had approved, but unused, consumer lines of credit of approximately $8.0 million and $7.3 million at June 30, 2007 and 2006, respectively. The Company had approved, but unused, commercial lines of credit of approximately $20.6 million and $15.0 million at June 30, 2007 and 2006, respectively.
At June 30, 2007 and 2006, the Company had commitments to sell loans approximating $3.0 million and $1.5 million, respectively.
Note 15. | Fair Value of Financial Instruments |
The estimated fair values of Company’s financial instruments (as described in note 1) at June 30, 2007 and 2006 were as follows:
| First Federal Bankshares, Inc. and Subsidiaries |
| |
| |
| Notes to Consolidated Financial Statements |
| | | 2007 | | | 2006 | |
| | | Carrying | | | | | | Carrying | | | | |
| | | Amount | | | Fair Value | | | Amount | | | Fair Value | |
| Financial assets: | | | | | | | | | | | | |
| Cash and due from banks | | $ | 11,613,908 | | | $ | 11,613,908 | | | $ | 15,157,203 | | | $ | 15,157,203 | |
| Interest-bearing deposits in other | | | | | | | | | | | | | | | | |
| financial institutions | | | 14,124,559 | | | | 14,124,559 | | | | 24,747,546 | | | | 24,747,546 | |
| Investment securities available-for-sale | | | 122,309,017 | | | | 122,309,017 | | | | 47,319,732 | | | | 47,319,732 | |
| Investment securities held-to-maturity | | | 9,549,072 | | | | 9,472,865 | | | | 13,077,053 | | | | 12,971,633 | |
| Loans receivable, net | | | 430,084,658 | | | | 423,535,000 | | | | 457,029,250 | | | | 448,405,000 | |
| FHLB stock | | | 3,559,600 | | | | 3,559,600 | | | | 5,161,600 | | | | 5,161,600 | |
| Accrued interest receivable | | | 2,939,993 | | | | 2,939,993 | | | | 2,627,980 | | | | 2,627,980 | |
| | | | | | | | | | | | | | | | | |
| Financial liabilities: | | | | | | | | | | | | | | | | |
| Deposits | | $ | 507,865,063 | | | $ | 508,302,000 | | | $ | 446,056,388 | | | $ | 445,653,000 | |
| Advances from FHLB and other borrowings | | | 62,202,229 | | | | 62,075,000 | | | | 92,753,665 | | | | 92,096,000 | |
| Advance payments by borrowers for | | | | | | | | | | | | | | | | |
| taxes and insurance | | | 916,021 | | | | 916,021 | | | | 976,658 | | | | 976,658 | |
| Accrued interest payable | | | 2,690,658 | | | | 2,690,658 | | | | 2,037,740 | | | | 2,037,740 | |
| | | 2007 | | | 2006 | |
| | | Notional | | | Unrealized | | | Notional | | | Unrealized | |
| | | Amount | | | Gain (loss) | | | Amount | | | Gain (loss) | |
| Off-balance-sheet assets (liabilities): | | | | | | | | | | | | |
| Commitments to extend credit | | $ | 31,950,000 | | | | - | | | $ | 33,754,000 | | | | - | |
| Consumer lines of credit | | | 8,004,000 | | | | - | | | | 7,301,000 | | | | - | |
| Commercial lines of credit | | | 20,586,000 | | | | - | | | | 15,001,000 | | | | - | |
| Commitments to sell loans | | | (3,027,000 | ) | | | - | | | | (1,469,000 | ) | | | - | |
The Company is involved with various claims and legal actions arising in the ordinary course of business. In the opinion of management, the ultimate disposition of these matters will not have a material adverse effect on the Company’s financial position or results of its operations.
Note 17. | Operating Segments |
An operating segment is generally defined as a component of a business for which discrete financial information is available and the operating results of which are regularly reviewed by the chief operating decision-maker. The Company’s primary business segment is banking. The banking segment generates revenue through interest and fees on loans, service charges on deposit accounts and interest on investment securities. The banking segment includes the Bank and the Company and related elimination entries between the two; since the Company’s primary activity is its ownership of the common stock of the Bank. The “other” segment includes the Company’s real estate development subsidiary and a wholly-owned subsidiary of the Bank that operates a title search and abstract continuation business in Iowa which was sold during 2007. Selected financial information on the Company’s segments is presented below for the years ended June 30, 2007, 2006 and 2005.
| First Federal Bankshares, Inc. and Subsidiaries |
| |
| |
| Notes to Consolidated Financial Statements |
| | | 2007 Segments | |
| | | Banking | | | Other | | | Consolidated | |
| Interest income | | $ | 35,774,930 | | | | - | | | $ | 35,774,930 | |
| Interest expense | | | 19,878,532 | | | | - | | | | 19,878,532 | |
| Net interest income | | | 15,896,398 | | | | - | | | | 15,896,398 | |
| Provision for loan losses | | | 546,949 | | | | - | | | | 546,949 | |
| Net interest income after provision for loan losses | | | 15,349,449 | | | | - | | | | 15,349,449 | |
| | | | | | | | | | | | | |
| Non-interest income | | | 5,690,679 | | | $ | 105,000 | | | | 5,795,679 | |
| Non-interest expense | | | 17,883,968 | | | | 42,981 | | | | 17,926,949 | |
| | | | | | | | | | | | | |
| Income before income taxes and discontinued operations | | | 3,156,160 | | | | 62,019 | | | | 3,218,179 | |
| Income taxes | | | 732,000 | | | | 7,000 | | | | 739,000 | |
| Income from continuing operations | | | 2,424,160 | | | | 55,019 | | | | 2,479,179 | |
| Income from discontinued operations, net of tax | | | - | | | | 589,679 | | | | 589,679 | |
| Net income | | $ | 2,424,160 | | | $ | 644,698 | | | $ | 3,068,858 | |
| | | | | | | | | | | | | |
| Depreciation and amortization | | $ | 1,160,575 | | | | - | | | $ | 1,160,575 | |
| | | | | | | | | | | | | |
| Total assets | | $ | 645,034,067 | | | $ | 782,443 | | | $ | 645,816,510 | |
| | | 2006 Segments | |
| | | Banking | | | Other | | | Consolidated | |
| Interest income | | $ | 32,293,550 | | | | - | | | $ | 32,293,550 | |
| Interest expense | | | 15,095,457 | | | | - | | | | 15,095,457 | |
| Net interest income | | | 17,198,093 | | | | - | | | | 17,198,093 | |
| Provision for loan losses | | | 1,920,000 | | | | - | | | | 1,920,000 | |
| Net interest income after provision for loan losses | | | 15,278,093 | | | | - | | | | 15,278,093 | |
| | | | | | | | | | | | | |
| Non-interest income | | | 6,000,613 | | | $ | (221,649 | ) | | | 5,778,964 | |
| Non-interest expense | | | 16,670,285 | | | | 50,620 | | | | 16,720,905 | |
| | | | | | | | | | | | | |
| Income before income taxes and discontinued operations | | | 4,608,421 | | | | (272,269 | ) | | | 4,336,152 | |
| Income taxes | | | 1,249,000 | | | | (102,000 | ) | | | 1,147,000 | |
| Income from continuing operations | | | 3,359,421 | | | | (170,269 | ) | | | 3,189,152 | |
| Income from discontinued operations, net of tax | | | - | | | | 142,813 | | | | 142,813 | |
| Net income | | $ | 3,359,421 | | | $ | (27,456 | ) | | $ | 3,331,965 | |
| | | | | | | | | | | | | |
| Depreciation and amortization | | $ | 1,592,750 | | | | - | | | $ | 1,592,750 | |
| | | | | | | | | | | | | |
| Total assets | | $ | 610,995,048 | | | $ | 1,540,211 | | | $ | 612,535,259 | |
| First Federal Bankshares, Inc. and Subsidiaries |
| |
| |
| Notes to Consolidated Financial Statements |
| | | 2005 Segments | |
| | | Banking | | | Other | | | Consolidated | |
| Interest income | | $ | 29,189,924 | | | | - | | | $ | 29,189,924 | |
| Interest expense | | | 11,839,381 | | | | - | | | | 11,839,381 | |
| Net interest income | | | 17,350,543 | | | | - | | | | 17,350,543 | |
| Provision for loan losses | | | 2,985,000 | | | | - | | | | 2,985,000 | |
| Net interest income after provision for loan losses | | | 14,365,543 | | | | - | | | | 14,365,543 | |
| | | | | | | | | | | | | |
| Non-interest income | | | 8,456,108 | | | | 60,000 | | | | 8,516,108 | |
| Non-interest expense | | | 17,040,217 | | | | 21,194 | | | | 17,061,411 | |
| | | | | | | | | | | | | |
| Income before income taxes and discontinued operations | | | 5,781,434 | | | | 38,806 | | | | 5,820,240 | |
| Income taxes | | | 1,747,000 | | | | 15,000 | | | | 1,762,000 | |
| Income from continuing operations | | | 4,034,434 | | | | 23,806 | | | | 4,058,240 | |
| Income from discontinued operations, net of tax | | | - | | | | 155,134 | | | | 155,134 | |
| Net income | | $ | 4,034,434 | | | $ | 178,940 | | | $ | 4,213,374 | |
| | | | | | | | | | | | | |
| Depreciation and amortization | | $ | 1,517,492 | | | | - | | | $ | 1,517,492 | |
| | | | | | | | | | | | | |
| Total assets | | $ | 585,434,374 | | | $ | 1,378,517 | | | $ | 586,812,891 | |
| First Federal Bankshares, Inc. and Subsidiaries |
| |
| |
| Notes to Consolidated Financial Statements |
Note 18. | Parent Company Financial Information |
Condensed statements of financial condition at June 30, 2007 and 2006 and condensed statements of income and cash flows for the years ended June 30, 2007, 2006, and 2005 are shown below for First Federal Bankshares, Inc.:
CONDENSED STATEMENTS OF FINANCIAL CONDITION | | | | | | |
| | | | | | | |
| | | 2007 | | | 2006 | |
| ASSETS | | | | | | |
| Cash deposited at First Federal Bank | | $ | 1,368,274 | | | $ | 2,762,439 | |
| Interest-bearing deposits in other financial institutions | | | 70,559 | | | | 362,546 | |
| Cash and cash equivalents | | | 1,438,833 | | | | 3,124,985 | |
| | | | | | | | | |
| Loans receivable, net | | | 1,767,467 | | | | 1,460,743 | |
| Investment in subsidiaries | | | 67,248,119 | | | | 63,351,369 | |
| Refundable income taxes | | | - | | | | 59,836 | |
| Other assets | | | 21,684 | | | | 441,785 | |
| Total assets | | $ | 70,476,103 | | | $ | 68,438,718 | |
| | | | | | | | | |
| LIABILITIES AND STOCKHOLDERS’ EQUITY | | | | | | | | |
| | | | | | | | | |
| LIABILITIES | | | | | | | | |
| Accrued taxes payable | | $ | 117,443 | | | | - | |
| Accrued expenses and other liabilities | | | 103,438 | | | $ | 114,824 | |
| Total liabilities | | | 220,881 | | | | 114,824 | |
| | | | | | | | | |
| STOCKHOLDERS’ EQUITY | | | | | | | | |
| Preferred stock | | | - | | | | - | |
| Common stock | | | 50,604 | | | | 50,109 | |
| Additional paid-in capital | | | 39,230,016 | | | | 38,293,233 | |
| Retained earnings | | | 58,704,525 | | | | 57,013,427 | |
| Treasury stock | | | (26,885,723 | ) | | | (25,920,685 | ) |
| Accumulated other comprehensive income (loss), net unrealized | | | | | | | | |
| gain (loss) on securities available-for-sale | | | (179,360 | ) | | | (325,650 | ) |
| Unearned ESOP | | | (664,840 | ) | | | (786,540 | ) |
| Total stockholders’ equity | | | 70,255,222 | | | | 68,323,894 | |
| | | | | | | | | |
| Total liabilities and stockholders’ equity | | $ | 70,476,103 | | | $ | 68,438,718 | |
| First Federal Bankshares, Inc. and Subsidiaries |
| |
| |
| Notes to Consolidated Financial Statements |
CONDENSED STATEMENTS OF OPERATIONS | | | | | | | | | |
| | | | | | | | | | |
| | | 2007 | | | 2006 | | | 2005 | |
| Interest income: | | | | | | | | | |
| Loans receivable | | $ | 112,393 | | | $ | 90,047 | | | $ | 87,561 | |
| Investment securities | | | - | | | | 3,967 | | | | 14,364 | |
| Other interest-earning assets | | | 104,059 | | | | 72,333 | | | | 33,448 | |
| Gain on sale of investment securities | | | - | | | | 202,944 | | | | - | |
| Other income | | | 28,296 | | | | 73,691 | | | | 35,972 | |
| Other general and administrative expenses | | | (450,028 | ) | | | (527,620 | ) | | | (412,916 | ) |
| Losses before income taxes | | | (205,280 | ) | | | (84,638 | ) | | | (241,571 | ) |
| Tax benefit on losses | | | 107,000 | | | | 32,000 | | | | 94,000 | |
| Losses before subsidiary income | | | (98,280 | ) | | | (52,638 | ) | | | (147,571 | ) |
| Equity in earnings of subsidiaries | | | 3,167,138 | | | | 3,384,603 | | | | 4,360,945 | |
| Net income | | $ | 3,068,858 | | | $ | 3,331,965 | | | $ | 4,213,374 | |
CONDENSED STATEMENTS OF CASH FLOWS | | | | | | | | | |
| | | | | | | | | | |
| | | 2007 | | | 2006 | | | 2005 | |
| Cash flows from operating activiities: | | | | | | | | | |
| Net income | | $ | 3,068,858 | | | $ | 3,331,965 | | | $ | 4,213,374 | |
| Adjustments to net income: | | | | | | | | | | | | |
| Equity in earnings of subsidiaries | | | (3,167,138 | ) | | | (3,384,603 | ) | | | (4,360,945 | ) |
| Dividends received from subsidiaries | | | - | | | | 8,000,000 | | | | 3,250,000 | |
| Net gain on sale of securities available-for-sale | | | - | | | | (202,944 | ) | | | - | |
| Increase in other assets | | | (29,899 | ) | | | (4,101 | ) | | | (603 | ) |
| Increase (decrease) in accrued expense and other liabilities | | | (11,386 | ) | | | 48,431 | | | | (3,801 | ) |
| Increase (decrease) in accrued taxes on income | | | 177,279 | | | | (61,045 | ) | | | 51,580 | |
| Net cash provided by operating activities | | | 37,714 | | | | 7,727,703 | | | | 3,149,605 | |
| | | | | | | | | | | | | |
| Cash flows from investing activities: | | | | | | | | | | | | |
| Proceeds from sale of securities available-for-sale | | | - | | | | 264,466 | | | | 25,000 | |
| Decrease (increase) in loans receivable | | | (339,356 | ) | | | (358,968 | ) | | | 149,557 | |
| Proceeds from sale of other assets | | | 450,000 | | | | - | | | | - | |
| Net cash provided by (used in) investing activities | | | 110,644 | | | | (94,502 | ) | | | 174,557 | |
| | | | | | | | | | | | | |
| Cash flows from financing activities: | | | | | | | | | | | | |
| Issuance of common stock | | | 514,030 | | | | 343,062 | | | | 393,044 | |
| Repurchase of common stock | | | (970,780 | ) | | | (4,172,942 | ) | | | (5,306,158 | ) |
| Cash dividends paid | | | (1,377,760 | ) | | | (1,347,271 | ) | | | (1,424,914 | ) |
| Net cash used in financing activities | | | (1,834,510 | ) | | | (5,177,151 | ) | | | (6,338,028 | ) |
| Net increase (decrease) in cash and | | | | | | | | | | | | |
| cash equivalents | | | (1,686,152 | ) | | | 2,456,050 | | | | (3,013,866 | ) |
| CASH AND CASH EQUIVALENTS | | | | | | | | | | | | |
| Beginning | | | 3,124,985 | | | | 668,935 | | | | 3,682,801 | |
| Ending | | $ | 1,438,833 | | | $ | 3,124,985 | | | $ | 668,935 | |
MANAGEMENT’S REPORT ON INTERNAL CONTROL
OVER FINANCIAL REPORTING
The management of First Federal Bankshares, Inc. (the Company) is responsible for establishing and maintaining adequate internal control over financial reporting. The Company’s internal control system was designed to provide reasonable assurance to the Company’s management and board of directors regarding the preparation and fair presentation of published financial statements. All internal control systems, no matter how well designed, have inherent limitations. Therefore, even those systems determined to be effective can provide only reasonable assurance with respect to financial statement preparation and presentation.
The Company’s management assessed the effectiveness of the Company’s internal control over financial reporting as of June 30, 2007. In making this assessment, it used the criteria set forth by the Committee of Sponsoring Organizations of the Treadway Commission (COSO) in Internal Control - Integrated Framework. Based on our assessment we believe that, as of June 30, 2007, the Company’s internal control over financial reporting is effective based on those criteria. The independent registered public accounting firm that audited the financial statements included in the annual report has issued an audit report on management’s assessment of the Company’s internal control over financial reporting.
| /s/ Michael W. Dosland | |
| President and CEO | |
| | |
| | |
| | |
| /s/ Michael S. Moderski | |
| Michael S. Moderski | |
| Senior Vice President and CFO | |
Report of Independent Registered Public Accounting Firm
The Board of Directors
First Federal Bankshares, Inc.
Sioux City, Iowa
We have audited the consolidated statements of financial condition of First Federal Bankshares, Inc. and subsidiaries as of June 30, 2007 and 2006, and the related consolidated statements of income, stockholders’ equity and cash flows for each of the three years in the period ended June 30, 2007. These consolidated financial statements are the responsibility of the Company’s management. Our responsibility is to express an opinion on these consolidated financial statements based on our audits.
We conducted our audits in accordance with the standards of the Public Company Accounting Oversight Board (United States). Those standards require that we plan and perform the audit to obtain reasonable assurance about whether the financial statements are free of material misstatement. An audit includes examining, on a test basis, evidence supporting the amounts and disclosures in the financial statements. An audit also includes assessing the accounting principles used and significant estimates made by management, as well as evaluating the overall financial statement presentation. We believe that our audits provide a reasonable basis for our opinion.
In our opinion, the consolidated financial statements referred to above present fairly, in all material respects, the financial position of First Federal Bankshares, Inc. and subsidiaries as of June 30, 2007 and 2006 and the results of their operations and their cash flows for each of the three years in the period ended June 30, 2007 in conformity with U.S. generally accepted accounting principles.
We also have audited, in accordance with the standards of the Public Company Accounting Oversight Board (United States), the effectiveness of First Federal Bankshares, Inc.’s internal control over financial reporting as of June 30, 2007, based on criteria established in Internal Control – Integrated Framework issued by the Committee of Sponsoring Organizations of the Treadway Commission (COSO) and our report dated September 13, 2007 expressed an unqualified opinion on management’s assessment of the effectiveness of First Federal Bankshares, Inc.’s internal control over financial reporting and an unqualified opinion on the effectiveness of First Federal Bankshares, Inc.’s internal control over financial reporting.
/s/ MCGLADREY & PULLEN
Des Moines, Iowa
September 13, 2007
Report of Independent Registered Public Accounting Firm on Internal Control over Financial Reporting
To the Board of Directors
First Federal Bankshares, Inc.
Sioux City, Iowa
We have audited management’s assessment, included in the accompanying Management’s Report on Internal Control over Financial Reporting, that First Federal Bankshares, Inc. maintained effective internal control over financial reporting as of June 30, 2007, based on criteria established in Internal Control - Integrated Framework issued by the Committee of Sponsoring Organizations of the Treadway Commission (COSO). First Federal Bankshares, Inc.’s management is responsible for maintaining effective internal control over financial reporting and for its assessment of the effectiveness of internal control over financial reporting. Our responsibility is to express an opinion on management’s assessment and an opinion on the effectiveness of the company’s internal control over financial reporting based on our audit.
We conducted our audit in accordance with the standards of the Public Company Accounting Oversight Board (United States). Those standards require that we plan and perform the audit to obtain reasonable assurance about whether effective internal control over financial reporting was maintained in all material respects. Our audit included obtaining an understanding of internal control over financial reporting, evaluating management’s assessment, testing and evaluating the design and operating effectiveness of internal control, and performing such other procedures as we considered necessary in the circumstances. We believe that our audit provides a reasonable basis for our opinion.
A company’s internal control over financial reporting is a process designed to provide reasonable assurance regarding the reliability of financial reporting and the preparation of financial statements for external purposes in accordance with generally accepted accounting principles. A company’s internal control over financial reporting includes those policies and procedures that (1) pertain to the maintenance of records that, in reasonable detail, accurately and fairly reflect the transactions and dispositions of the assets of the company; (2) provide reasonable assurance that transactions are recorded as necessary to permit preparation of financial statements in accordance with generally accepted accounting principles, and that receipts and expenditures of the company are being made only in accordance with authorizations of management and directors of the company; and (3) provide reasonable assurance regarding prevention or timely detection of unauthorized acquisition, use or disposition of the company’s assets that could have a material effect on the financial statements.
Because of its inherent limitations, internal control over financial reporting may not prevent or detect misstatements. Also, projections of any evaluation of effectiveness to future periods are subject to the risk that controls may become inadequate because of changes in conditions, or that the degree of compliance with the policies or procedures may deteriorate.
In our opinion, management’s assessment that First Federal Bankshares, Inc. maintained effective internal control over financial reporting as of June 30, 2007 is fairly stated, in all material respects, based on criteria established in Internal Control - Integrated Framework issued by the Committee of Sponsoring Organizations of the Treadway Commission (COSO). Also in our opinion, First Federal Bankshares, Inc. maintained, in all material respects, effective internal control over financial reporting as of June 30, 2007, based on criteria established in Internal Control - Integrated Framework issued by the Committee of Sponsoring Organizations of the Treadway Commission (COSO).
We have also audited, in accordance with the standards of the Public Company Accounting Oversight Board (United States), the consolidated statements of financial condition of First Federal Bankshares, Inc. and subsidiaries as of June 30, 2007 and 2006 and the related consolidated statements of income, stockholders’ equity and cash flows for each of the three years in the period ended June 30, 2007, and our report dated September 13, 2007 expressed an unqualified opinion.
/s/ MCGLADREY & PULLEN
Des Moines, Iowa
September 13, 2007
| ITEM 9 | CHANGES IN AND DISAGREEMENTS WITH ACCOUNTANTS ON ACCOUNTING AND FINANCIAL DISCLOSURE |
Not applicable.
| ITEM 9A. | CONTROLS AND PROCEDURES |
Under the supervision and with the participation of management, including the Company’s Chief Executive Officer and Chief Financial Officer, the Company evaluated the effectiveness of the design and operation of its disclosure controls and procedures (as defined in Rule 13a-15(e) and 15d-15(e) under the Securities Exchange Act of 1934) at the end of the period covered by this report. Based upon that evaluation, the Chief Executive Officer and Chief Financial Officer concluded that, as of the end of the period covered by this report, the Company’s disclosure controls and procedures are effective to ensure that information required to be disclosed in the reports that the Company files or submits under the Securities Exchange Act of 1934, is recorded, processed, summarized and reported, within the time periods specified in the SEC’s rules and forms. There have been no significant changes in the Company’s internal control over financial reporting during the Company’s fourth quarter of fiscal year 2007 that have materially affected, or are reasonably likely to materially affect, the Company's internal control over financial reporting.
Management’s Report on Internal Control over Financial Reporting as of June 30, 2007 appears on page 70 of this Annual Report on Form 10-K.
The Attestation Report of the independent registered public accounting firm on management’s assessment of the Company’s internal control over financial reporting appears on pages 71-72 of this Annual Report on Form 10-K.
| ITEM 9B. | OTHER INFORMATION |
Not applicable.
PART III
ITEM 10 | DIRECTORS AND EXECUTIVE OFFICERS OF THE REGISTRANT |
The Company has adopted a Code of Ethics and Business Conduct policy that applies to the Company’s principal executive officer, principal financial officer, principal accounting officer, or controller or persons performing similar functions. The Code of Ethics and Business Conduct policy may be accessed on the Company’s website at www.vantusbank.com.
Information concerning Directors and Executive Officers of the Company is incorporated herein by reference from the Company’s definitive Proxy Statement dated September 20, 2007.
ITEM 11 | EXECUTIVE COMPENSATION |
Information concerning executive compensation is incorporated herein by reference from the Company’s definitive Proxy Statement dated September 20, 2007.
| ITEM 12 | SECURITY OWNERSHIP OF CERTAIN BENEFICIAL OWNERS AND MANAGEMENT AND RELATED STOCKHOLDER MATTERS |
Information concerning security ownership of certain owners and management is incorporated herein by reference from the Company’s definitive Proxy Statement dated September 20, 2007.
The Company has adopted five equity-based compensation plans: the First Federal Savings Bank of Siouxland 1992 Incentive Stock Option Plan (the “1992 Stock Option Plan”), the 1992 Stock Option Plan for Outside Directors (the “Directors’ Plan”), the 1999 Stock Option Plan (the “1999 Stock Option Plan”), the 1999 Recognition and Retention Plan (the “1999 Recognition Plan”)and the 2006 Stock-Based Incentive Plan ("the 2006 Stock-Based Incentive Plan"). All such plans have been approved by stockholders of the Company. The Equity Compensation Plan Table is incorporated herein by reference from the Company’s definitive proxy statement dated September 20, 2007.
ITEM 13 | CERTAIN RELATIONSHIPS AND RELATED TRANSACTIONS AND DIRECTOR INDEPENDENCE |
Information concerning relationships and transactions and director independence is incorporated herein by reference from the Company’s definitive Proxy Statement dated September 20, 2007.
ITEM 14 | PRINCIPAL ACCOUNTANT FEES AND SERVICES |
The “Proposal II - Ratification of Appointment of Independent Auditors” Section of the Company’s definitive Proxy Statement dated September 20, 2007 is incorporated herein by reference.
PART IV
ITEM 15. | EXHIBITS, AND FINANCIAL STATEMENT SCHEDULES |
(1) Financial Statements
The following information appearing in the Company’s Annual Report to Stockholders for the year ended June 30, 2007
Annual Report Section | Pages in the Annual Report on Form 10-K |
| | |
| Selected Financial Data | 19-21 |
| | |
| Management’s Discussion and Analysis | |
| of Financial Condition and Results | |
| of Operations | 22-36 |
| | |
| Consolidated Balance Sheets | 37 |
| | |
| Consolidated Statements of Income | 38 |
| | |
| Consolidated Statements of Stockholders’ Equity | |
| and Comprehensive Income | 39 |
| | |
| Consolidated Statements of Cash Flows | 40-41 |
| | |
| Notes to Consolidated Financial | 42-69 |
| Statements | |
| | |
| Management’s Report on Internal Control | |
| Over Financial Reporting | 70 |
| | |
| Reports of Independent Registered Public | 71-73 |
| Accounting Firms | |
| | |
With the exception of the aforementioned information, the Company’s Annual Report to Stockholders for the year ended June 30, 2007 is not deemed filed as part of this Annual Report on Form 10-K.
(2) Financial Statement Schedules
All financial statement schedules have been omitted as the required information is inapplicable or has been included in the Notes to Consolidated Financial Statements.
(3) Exhibits
| | | Sequential Page | |
| | | Reference to Prior | Number Where |
| | | Filing or Exhibit | Attached Exhibits |
| Regulation S-K | | Number Attached | Are Located in This |
Exhibit Number | Document | Hereto | Form 10-K Report |
| | | | |
| 3 | Articles of Incorporation | | Not Applicable |
| | | | |
| 3 | Bylaws | | Not Applicable |
| | | | |
| 4 | Instruments defining the | | Not Applicable |
| | rights of security holders, | | |
| | including debentures | | |
| | | | |
| 9 | Voting trust agreement | None | Not Applicable |
| | | | |
| 10 | Material contracts | None | Not Applicable |
| | | | |
| 11 | Statement re: computation | Not | Not Applicable |
| | of per share earnings | required | |
| | | | |
| 12 | Statement re: computation | Not | Not Applicable |
| | of ratios | required | |
| | | | |
| 13 | Annual Report to | None | Not Applicable |
| | Security Holders | | |
| | | | |
| | | |
| | | | |
| 16 | Letter re: change in | | |
| | certifying | | Not Applicable |
| | accountants | none | |
| | | | |
| 18 | Letter re: change in | | |
| | accounting principles | None | Not Applicable |
| | | | |
| | | |
| | | | |
| 22 | Published report regarding | None | Not Applicable |
| | matters submitted to vote of | | |
| | security holders | | |
| | | | |
| | | |
| | | | |
| | | | |
| 24 | Power of Attorney | Not | Not Applicable |
| | | Required | |
| | | | |
| | | |
| | | | |
| | | | |
| | | |
| | | | |
| | | | |
| | | |
| | | | |
| 99 | Additional Exhibits | None | Not Applicable |
SIGNATURES
Pursuant to the requirements of Section 13 or 15(d) of the Securities Exchange Act of 1934, the Company has duly caused this report to be signed on its behalf by the undersigned, thereunto duly authorized.
| | FIRST FEDERAL BANKSHARES, INC. |
| | | |
| Date: September 13, 2007 | By: | /s/ Michael W. Dosland |
| | | Michael W. Dosland President and Chief Executive Officer |
Pursuant to the requirements of the Securities Exchange Act of 1934, this report has been signed below by the following persons on behalf of the Company and in the capacities and on the dates indicated.
| By: | /s/ Michael W. Dosland | | By: | /s/ Michael S. Moderski |
| | Michael W. Dosland President and Chief Executive Officer | | | Michael S. Moderski Senior Vice President, Chief Financial Officer (Principal Financial and Accounting Officer) |
| | | | | |
| Date: | September 13, 2007 | | Date: | September 13, 2007 |
| By: | /s/ Arlene T. Curry | | By: | /s/ Charles D. Terlouw |
| | Arlene T. Curry Chairman of the Board | | | Charles D. Terlouw Director |
| | | | | |
| Date: | September 13, 2007 | | Date: | September 13, 2007 |
| By: | /s/ Gary L. Evans | | By: | /s/ Allen J. Johnson |
| | Gary L. Evans Director | | | Allen J. Johnson Director |
| | | | | |
| Date: | September 13, 2007 | | Date: | September 13, 2007 |
| By: | /s/ David Roederer | | By: | /s/ Barry E. Backhaus |
| | David Roederer Director | | | Barry E. Backhaus Director |
| | | | | |
| Date: | September 13, 2007 | | Date: | September 13, 2007 |
| By: | /s/ Jon G. Cleghorn | | By: | /s/ Ronald A. Jorgensen |
| | Jon G. Cleghorn Director | | | Ronald A. Jorgensen Director |
| | | | | |
| Date: | September 13, 2007 | | Date: | September 13, 2007 |
77