UNITED STATES
SECURITIES AND EXCHANGE COMMISSION
WASHINGTON, D.C. 20549
FORM 10-Q
|
| | |
| ☒ | QUARTERLY REPORT PURSUANT TO SECTION 13 OR 15(d) OF THE | |
| | SECURITIES EXCHANGE ACT OF 1934 | |
| | | |
| | For the quarterly period ended March 31, 2019 | |
| | | |
| | OR | |
| | | |
| ☐ | TRANSITION REPORT PURSUANT TO SECTION 13 OR 15(d) OF THE | |
| | SECURITIES EXCHANGE ACT OF 1934 | |
For the transition period from to
Commission file number: 001-33105
The Meet Group, Inc.
(Exact name of registrant as specified in its charter)
|
| |
| Delaware | 86-0879433 |
| (State or other jurisdiction of | (I.R.S. Employer |
| incorporation or organization) | Identification No.) |
| 100 Union Square Drive | |
| New Hope, Pennsylvania | 18938 |
| (Address of principal executive offices) | (Zip Code) |
Registrant’s telephone number: (215) 862-1162
Indicate by check mark whether the registrant (1) has filed all reports required to be filed by Section 13 or 15(d) of the Securities Exchange Act of 1934 during the preceding 12 months (or for such shorter period that the registrant was required to file such reports), and (2) has been subject to such filing requirements for the past 90 days.
Yes ☒ No ☐
Indicate by check mark whether the registrant has submitted electronically every Interactive Data File required to be submitted pursuant to Rule 405 of Regulation S-T during the preceding 12 months (or for such shorter period that the registrant was required to submit such files).
Yes ☒ No ☐
Indicate by check mark whether the registrant is a large accelerated filer, an accelerated filer, a non-accelerated filer, a smaller reporting company or an emerging growth company. See the definitions of “large accelerated filer,” “accelerated filer,” “smaller reporting company” and “emerging growth company” in Rule 12b-2 of the Exchange Act.
|
| |
| Large accelerated filer ☐ | Accelerated filer ☒ |
| | |
| Non-accelerated filer ☐ | Smaller reporting company ☐ |
| | |
| | Emerging growth company ☐ |
| | |
| If an emerging growth company, indicate by check mark if the registrant has elected not to use the extended transition period for comply with any new or revised financial accounting standards provided pursuant to Section 13(a) of the Exchange Act. | ☐ |
Indicate by check mark whether the registrant is a shell company (as defined in Rule 12b-2 of the Exchange Act).
Yes ☐ No ☒
|
| | | | |
| Class | | Outstanding as of May 6, 2019 |
| Common Stock, $0.001 par value per share | | 75,483,488 |
| shares |
Securities registered pursuant to Section 12(b) of the Exchange Act:
|
| | | | |
| Title of each class | | Trading Symbol(s) | | Name of each exchange on which registered |
| Common Stock | | MEET | | NASDAQ |
THE MEET GROUP, INC. AND SUBSIDIARIES
INDEX
|
| | |
| |
| | |
| | | |
| | | |
| | | |
| | | |
| | |
| | |
| | |
| |
| | |
| | |
| | |
| | |
| | |
| | |
| | |
| |
| CERTIFICATIONS |
| INDEX TO EXHIBITS |
PART I. FINANCIAL INFORMATION
Item 1. Financial Statements
THE MEET GROUP, INC. AND SUBSIDIARIES
CONDENSED CONSOLIDATED BALANCE SHEETS
|
| | | | | | | |
| | (Unaudited) | | |
| | March 31,
2019 | | December 31,
2018 |
| ASSETS | | | |
| CURRENT ASSETS: | | | |
| Cash and cash equivalents | $ | 19,811,733 |
| | $ | 28,365,725 |
|
| Accounts receivable, net of allowance of $708,385 and $383,579 at March 31, 2019 and December 31, 2018, respectively | 26,082,600 |
| | 27,148,484 |
|
| Prepaid expenses and other current assets | 5,928,680 |
| | 4,911,057 |
|
| Total current assets | 51,823,013 |
| | 60,425,266 |
|
| Goodwill | 156,698,026 |
| | 148,132,873 |
|
| Property and equipment, net | 4,262,868 |
| | 4,633,764 |
|
| Operating lease right-of-use assets, net | 3,362,781 |
| | — |
|
| Intangible assets, net | 37,240,026 |
| | 36,558,439 |
|
| Deferred taxes | 15,825,171 |
| | 15,648,572 |
|
| Other assets | 2,172,713 |
| | 2,453,255 |
|
| Total assets | $ | 271,384,598 |
| | $ | 267,852,169 |
|
| LIABILITIES AND STOCKHOLDERS’ EQUITY | | | |
| CURRENT LIABILITIES: | | | |
| Accounts payable | $ | 5,414,478 |
| | $ | 9,071,193 |
|
| Accrued liabilities | 19,250,505 |
| | 19,112,303 |
|
| Current portion of long-term debt | 15,000,000 |
| | 18,566,584 |
|
| Current portion of capital lease obligations | 133,442 |
| | 134,067 |
|
| Current portion of operating lease liabilities | 1,432,077 |
| | — |
|
| Deferred revenue | 4,736,808 |
| | 4,620,690 |
|
| Total current liabilities | 45,967,310 |
| | 51,504,837 |
|
| Long-term capital lease obligations, less current portion | 15,100 |
| | 58,683 |
|
| Long-term debt, less current portion, net | 21,375,996 |
| | 18,087,956 |
|
| Long-term operating lease liabilities, less current portion | 1,974,827 |
| | — |
|
| Long-term derivative liability | — |
| | 940,216 |
|
| Other liabilities | 825,584 |
| | 39,651 |
|
| Total liabilities | 70,158,817 |
| | 70,631,343 |
|
| Commitments and contingencies (see Note 7) | — |
| | — |
|
| STOCKHOLDERS’ EQUITY: | | | |
| Preferred stock, $.001 par value; authorized - 5,000,000 shares; no shares issued and outstanding at March 31, 2019 and December 31, 2018 | — |
| | — |
|
| Common stock, $.001 par value; authorized - 100,000,000 shares; 75,270,035 and 74,697,526 shares issued and outstanding at March 31, 2019 and December 31, 2018, respectively | 75,272 |
| | 74,700 |
|
| Additional paid-in capital | 422,471,569 |
| | 419,455,818 |
|
| Accumulated deficit | (219,018,426 | ) | | (220,276,025 | ) |
| Accumulated other comprehensive loss | (2,302,634 | ) | | (2,033,667 | ) |
| Total stockholders’ equity | 201,225,781 |
| | 197,220,826 |
|
| Total liabilities and stockholders’ equity | $ | 271,384,598 |
| | $ | 267,852,169 |
|
See notes to condensed consolidated financial statements.
THE MEET GROUP, INC. AND SUBSIDIARIES
CONDENSED CONSOLIDATED STATEMENTS OF OPERATIONS AND COMPREHENSIVE INCOME (LOSS)
THREE MONTHS ENDED MARCH 31, 2019 AND 2018
(UNAUDITED)
|
| | | | | | | |
| | Three Months Ended March 31, |
| | 2019 | | 2018 |
| Revenues | $ | 49,513,237 |
| | $ | 37,637,793 |
|
| Operating costs and expenses: | | | |
| Sales and marketing | 7,840,866 |
| | 7,047,993 |
|
| Product development and content | 31,123,375 |
| | 22,101,537 |
|
| General and administrative | 4,927,782 |
| | 5,469,178 |
|
| Depreciation and amortization | 3,198,104 |
| | 3,629,603 |
|
| Acquisition and restructuring | 478,995 |
| | 3,349,951 |
|
| Total operating costs and expenses | 47,569,122 |
| | 41,598,262 |
|
| Income (loss) from operations | 1,944,115 |
| | (3,960,469 | ) |
| Other income (expense): | | | |
| Interest income | 32,389 |
| | 7,208 |
|
| Interest expense | (402,864 | ) | | (607,686 | ) |
| Gain (loss) on foreign currency transactions | (65,209 | ) | | 103,043 |
|
| Other | 3,549 |
| | (6,944 | ) |
| Total other expense | (432,135 | ) | | (504,379 | ) |
| Income (loss) before income tax benefit (expense) | 1,511,980 |
| | (4,464,848 | ) |
| Income tax benefit (expense) | (254,381 | ) | | 252,187 |
|
| Net income (loss) | $ | 1,257,599 |
| | $ | (4,212,661 | ) |
| | | | |
| Basic and diluted net income (loss) per common stockholder: | | | |
| Basic net income (loss) per common stockholder | $ | 0.02 |
| | $ | (0.06 | ) |
| Diluted net income (loss) per common stockholder | $ | 0.02 |
| | $ | (0.06 | ) |
| | | | |
| Weighted average shares outstanding: | | | |
| Basic | 74,848,080 |
| | 71,981,487 |
|
| Diluted | 78,799,248 |
| | 71,981,487 |
|
| | | | |
| Comprehensive income (loss): | | | |
| Net income (loss) | $ | 1,257,599 |
| | $ | (4,212,661 | ) |
| Other comprehensive income (loss): | | | |
| Reclassification of gains (losses) on derivative financial instruments, net of tax benefit (expense) of $346,475 and ($324,303), respectively | (775,837 | ) | | 778,143 |
|
| Unrealized gains (losses) on derivative financial instruments, net of tax (benefit) expense of ($385,922) and $417,896, respectively | 827,668 |
| | (761,126 | ) |
| Foreign currency translation adjustment | (320,798 | ) | | 368,355 |
|
| Other comprehensive income (loss) | (268,967 | ) | | 385,372 |
|
| Comprehensive income (loss) | $ | 988,632 |
| | $ | (3,827,289 | ) |
See notes to condensed consolidated financial statements.
THE MEET GROUP, INC. AND SUBSIDIARIES
CONDENSED CONSOLIDATED STATEMENTS OF CHANGES IN STOCKHOLDERS’ EQUITY
THREE MONTHS ENDED MARCH 31, 2019 AND 2018
(UNAUDITED)
|
| | | | | | | | | | | | | | | | | | | | | | |
| | Common Stock | | Additional Paid-in Capital | | Accumulated Deficit | | Accumulated Other Comprehensive Loss | | Total Stockholders’ Equity |
| | Shares | | Amount | | | | |
| Balance-December 31, 2017 | 71,915,018 |
| | $ | 71,918 |
| | $ | 408,029,068 |
| | $ | (221,435,888 | ) | | $ | (1,124,538 | ) | | $ | 185,540,560 |
|
| Adoption of ASC Topic 606 | — |
| | — |
| | — |
| | 16,475 |
| | — |
| | 16,475 |
|
| Stock-based compensation expense | — |
| | — |
| | 2,168,925 |
| | — |
| | — |
| | 2,168,925 |
|
| Issuance of common stock for vested RSAs | 191,979 |
| | 186 |
| | (186 | ) | | — |
| | — |
| | — |
|
| RSAs withheld to cover taxes | — |
| | — |
| | (92,600 | ) | | — |
| | — |
| | (92,600 | ) |
| Other comprehensive income | — |
| | — |
| | — |
| | — |
| | 385,372 |
| | 385,372 |
|
| Net loss | — |
| | — |
| | — |
| | (4,212,661 | ) | | — |
| | (4,212,661 | ) |
| Balance-March 31, 2018 | 72,106,997 |
| | $ | 72,104 |
| | $ | 410,105,207 |
| | $ | (225,632,074 | ) | | $ | (739,166 | ) | | $ | 183,806,071 |
|
| | | | | | | | | | | | |
| Balance-December 31, 2018 | 74,697,526 |
| | $ | 74,700 |
| | $ | 419,455,818 |
| | $ | (220,276,025 | ) | | $ | (2,033,667 | ) | | $ | 197,220,826 |
|
| Stock-based compensation expense | — |
| | — |
| | 2,424,717 |
| | — |
| | — |
| | 2,424,717 |
|
| Exercise of stock options | 151,737 |
| | 152 |
| | 680,837 |
| | — |
| | — |
| | 680,989 |
|
| Issuance of common stock for vested RSAs | 420,772 |
| | 420 |
| | (420 | ) | | — |
| | — |
| | — |
|
| RSAs withheld to cover taxes | — |
| | — |
| | (89,383 | ) | | — |
| | — |
| | (89,383 | ) |
| Other comprehensive loss | — |
| | — |
| | — |
| | — |
| | (268,967 | ) | | (268,967 | ) |
| Net income | — |
| | — |
| | — |
| | 1,257,599 |
| | — |
| | 1,257,599 |
|
| Balance-March 31, 2019 | 75,270,035 |
| | $ | 75,272 |
| | $ | 422,471,569 |
| | $ | (219,018,426 | ) | | $ | (2,302,634 | ) | | $ | 201,225,781 |
|
See notes to condensed consolidated financial statements.
THE MEET GROUP, INC. AND SUBSIDIARIES
CONDENSED CONSOLIDATED STATEMENTS OF CASH FLOWS
THREE MONTHS ENDED MARCH 31, 2019 AND 2018
(UNAUDITED)
|
| | | | | | | |
| | Three Months Ended March 31, |
| | 2019 | | 2018 |
| Cash flows from operating activities: | | | |
| Net income (loss) | $ | 1,257,599 |
| | $ | (4,212,661 | ) |
| Adjustments to reconcile net income (loss) to net cash provided by operating activities: | | | |
| Depreciation and amortization | 3,198,104 |
| | 3,629,603 |
|
| Amortization right-of-use assets | 695,327 |
| | — |
|
| Stock-based compensation expense | 2,424,717 |
| | 2,168,925 |
|
| Deferred taxes | (146,956 | ) | | (539,231 | ) |
| (Gain) loss on foreign currency transactions | 65,209 |
| | (103,043 | ) |
| Bad debt expense | 325,045 |
| | 213,598 |
|
| Amortization of loan origination costs | 38,040 |
| | 86,527 |
|
| Change in contingent consideration obligations | 15,915 |
| | — |
|
| Changes in operating assets and liabilities: | | | |
| Accounts receivable | 1,187,419 |
| | 5,988,039 |
|
| Prepaid expenses, other current assets and other assets | (773,988 | ) | | (793,908 | ) |
| Accounts payable and accrued liabilities | (5,008,559 | ) | | 273,716 |
|
| Deferred revenue | 85,043 |
| | 723,907 |
|
| Net cash provided by operating activities | 3,362,915 |
| | 7,435,472 |
|
| Cash flows from investing activities: | | | |
| Purchase of property and equipment | (282,641 | ) | | (172,642 | ) |
| Acquisition of business, net of cash and restricted cash acquired | (11,807,925 | ) | | — |
|
| Net cash used in investing activities | (12,090,566 | ) | | (172,642 | ) |
| Cash flows from financing activities: | | | |
| Proceeds from exercise of stock options | 680,989 |
| | — |
|
| Payments of capital leases | (40,885 | ) | | (73,317 | ) |
| Proceeds from borrowings of debt | 7,000,000 |
| | — |
|
| Payments for restricted stock awards withheld for taxes | (89,383 | ) | | (92,600 | ) |
| Payments on long-term debt | (7,316,584 | ) | | (3,750,000 | ) |
| Net cash provided by (used in) financing activities | 234,137 |
| | (3,915,917 | ) |
| Change in cash, cash equivalents, and restricted cash prior to effects of foreign currency exchange rate | (8,493,514 | ) | | 3,346,913 |
|
| Effect of foreign currency exchange rate (translation) | (60,478 | ) | | 69,548 |
|
| Net increase (decrease) in cash, cash equivalents, and restricted cash | (8,553,992 | ) | | 3,416,461 |
|
| Cash, cash equivalents, and restricted cash at beginning of period | 28,365,725 |
| | 25,052,995 |
|
| Cash, cash equivalents, and restricted cash at end of period | $ | 19,811,733 |
| | $ | 28,469,456 |
|
| Supplemental disclosure of cash flow information: | | | |
| Cash paid for interest | $ | 361,303 |
| | $ | 516,940 |
|
See notes to condensed consolidated financial statements.
THE MEET GROUP, INC. AND SUBSIDIARIES
NOTES TO CONDENSED CONSOLIDATED FINANCIAL STATEMENTS
Note 1— Description of Business, Basis of Presentation and Summary of Significant Accounting Policies
The Meet Group, Inc. (the “Company,” “The Meet Group,” “us,” or “we”) is a portfolio of mobile social entertainment apps designed to meet the universal need for human connection. We leverage a powerful live-streaming video platform, empowering our global community to forge meaningful connections. Our primary apps are MeetMe®, LOVOO®, Skout®, Tagged® and, as of March 5, 2019, Growlr®.
We operate location-based social networks for meeting new people, primarily on mobile platforms, including on iPhone, Android, iPad and other tablets, that facilitate interactions among users and encourage users to connect, communicate and engage with each other. Over the past two years, we have transformed our business from an advertising based revenue model to one where the majority of our revenue is derived from user pay monetization and subscriptions. The fastest growing component of user pay monetization comes from in-app purchases, including virtual gifts associated with our live video product.
We began developing our live video platform in 2016 with the belief that we could successfully pair live-streaming and dating – a model that we had seen work effectively for Asian dating app providers. We first launched video on MeetMe early in 2017, and, in October of 2017, we began to monetize the feature by enabling gifting within the video streams. During this time period, we also executed on our strategy of acquiring other properties: Skout, Inc. (“Skout”), Ifwe Inc. (“if(we)”) and Lovoo GmbH (“Lovoo”) – where we believed our live-streaming platform would fit naturally. We then integrated live video into each app. We launched the monetized video platform on Skout in the fourth quarter of 2017, Tagged in the second quarter of 2018 and Lovoo beginning in the second quarter of 2018. We have also continued to add features and enhancements intended to drive video engagement and increase monetization for all the apps. Live video has become the fastest growing revenue product in our history.
We also offer online marketing capabilities, which enable marketers to display their advertisements on our apps. We offer significant scale to our advertising partners, with hundreds of millions of daily impressions across our active global user base, and sophisticated data science for effective targeting. We work with our advertisers and advertising networks to maximize the effectiveness of their campaigns by optimizing advertisement formats and placements.
Just as Facebook has established itself as the social network of friends and family, and LinkedIn as the social network of colleagues and business professionals, The Meet Group is creating the social entertainment network not of the people you know, but of the people you want to know. Nimble, fast-moving and already in more than 100 countries, we are challenging the dominant player in our space, Match Group, Inc., and differentiating ourselves with live video, which is not offered by many of our direct competitors. Modeled after the video products offered by Asian dating app providers, but enhanced in order to appeal to Western audiences, our live video product is aimed at the nexus of entertainment and community, where we believe our apps exhibit natural strength.
Our vision extends beyond dating and entertainment. We focus on building quality products to satisfy the universal need for human connection among all people, everywhere – not just paying subscribers. We believe meeting new people is a basic human need, especially for users aged 18-34, when so many long-lasting relationships are made. We use advanced technology to engineer serendipitous connections among people who otherwise might never have met – a sort of digital coffeehouse where everyone belongs. Over the years, The Meet Group’s apps have originated untold numbers of chats, shares, good friendships, dates, romantic relationships – even marriages.
We believe that we have significant growth opportunities enabled through our social entertainment platform. We believe our scale provides unique advantages to grow video monetization, while also establishing a high density of users within the geographic regions we serve. As The Meet Group’s networks grow and the number of users in a location increases, we believe that users who are seeking to meet new people will incrementally benefit from the quantity of relevant connections.
Basis of Presentation
The Company’s unaudited condensed consolidated financial statements are prepared in accordance with accounting principles generally accepted in the U.S. (“GAAP”). The condensed consolidated financial statements include the accounts of all subsidiaries and affiliates in which the Company holds a controlling financial interest as of the date of the condensed consolidated financial statements.
The condensed consolidated financial statements include the accounts of The Meet Group and its wholly-owned subsidiaries. All intercompany accounts and transactions have been eliminated in consolidation.
Unaudited Interim Financial Information
The unaudited condensed consolidated financial statements have been prepared by the Company and reflect all normal, recurring adjustments that, in the opinion of management, are necessary for a fair presentation of the interim financial information. The results of operations for the interim periods presented are not necessarily indicative of the results to be expected for any subsequent quarter or for the year ending December 31, 2019. Certain information and footnote disclosures normally included in financial statements prepared in accordance with GAAP have been condensed or omitted under the rules and regulations of the Securities and Exchange Commission (“SEC”). These unaudited condensed consolidated financial statements and notes included herein should be read in conjunction with the audited consolidated financial statements and notes included in the Company’s Annual Report on Form 10-K for the year ended December 31, 2018, filed with the SEC on March 8, 2019.
Use of Estimates
The preparation of the Company’s consolidated financial statements in conformity with GAAP requires the Company to make estimates and assumptions that affect the reported amounts of assets and liabilities and disclosure of contingent assets and liabilities at the date of the condensed consolidated financial statements and the reported amounts of revenues and expenses during the reporting period. Significant estimates and assumptions are required in revenue recognition, accounting for business combinations, accounts receivable valuation, the fair value of financial instruments, the valuation of long-lived assets, valuation of deferred tax assets, income taxes, contingencies, goodwill and intangible assets, and stock-based compensation. Some of these judgments can be subjective and complex and, consequently, actual results may differ from these estimates. The Company’s estimates often are based on complex judgments, probabilities and assumptions that it believes to be reasonable but that are inherently uncertain and unpredictable. For any given individual estimate or assumption made by the Company, there may also be other estimates or assumptions that are reasonable.
The Company regularly evaluates its estimates and assumptions using historical experience and other factors, including the economic environment. As future events and their effects cannot be determined with precision, the Company’s estimates and assumptions may prove to be incomplete or inaccurate, or unanticipated events and circumstances may occur that might cause it to change those estimates and assumptions. Market conditions, such as illiquid credit markets, volatile equity markets, dramatic fluctuations in foreign currency rates and economic downturn, can increase the uncertainty already inherent in its estimates and assumptions. The Company adjusts its estimates and assumptions when facts and circumstances indicate the need for change. Those changes generally will be reflected in the Company’s condensed consolidated financial statements on a prospective basis unless they are required to be treated retrospectively under the relevant accounting standard. It is possible that other professionals, applying reasonable judgment to the same facts and circumstances, could develop and support a range of alternative estimated amounts. The Company is also subject to other risks and uncertainties that may cause actual results to differ from estimated amounts, such as changes in competition, litigation, legislation and regulations.
Fair Value Measurements
The fair values of the Company’s financial instruments reflect the amounts that would be received to sell an asset or paid to transfer a liability in an orderly transaction between market participants at the measurement date (exit price).
The carrying amounts of the Company’s financial instruments of cash, cash equivalents, restricted cash, accounts receivable, accounts payable, accrued liabilities and deferred revenue approximate fair value due to their short maturities. The Company has evaluated the estimated fair value of financial instruments using available market information and management’s estimates. The use of different market assumptions and/or estimation methodologies could have a significant effect on the estimated fair value amounts.
In addition, the Company carries its contingent consideration liabilities related to acquisitions at fair value. In accordance with the three-tier fair value hierarchy, the Company determined the fair value of its contingent consideration liabilities using the income approach with assumed discount rates and payment probabilities. The income approach uses Level 3, or unobservable inputs as defined under the accounting guidance for fair value measurements. At March 31, 2019, the Company’s contingent consideration liability had a fair value of $1.7 million. See Note 2— Acquisitions for more information regarding the Company’s contingent consideration liability.
The Company carries a term loan facility with an outstanding balance at March 31, 2019 and December 31, 2018 of $29.6 million and $36.9 million, respectively. As part of the Growlr Acquisition (as defined in Note 2— Acquisitions), the Company drew down $7.0 million on its revolving credit facility. The outstanding balance on the Company’s revolving credit facility at March 31, 2019 was $7.0 million. The outstanding balances of the Company’s term loan and revolving credit facilities as of March 31, 2019 and
December 31, 2018 approximate fair value due to the variable market interest rates and relatively short maturity associated with them. See Note 6— Long-Term Debt for more information regarding the Company’s credit facilities.
The Company leases its operating facilities in the U.S. and Germany under certain noncancelable operating leases that expire through 2022. The Company also leases certain fixed assets under capital leases that expire through 2021. The capital leases are for the Company's data centers, printers and other furniture in the Company's German offices. The outstanding balance of operating and finance leases as of March 31, 2019 and December 31, 2018 approximates fair value due to their relatively short maturities.
The Company records all derivatives on the balance sheet at fair value. The accounting for changes in the fair value of derivatives depends on the intended use of the derivative, whether the Company has elected to designate a derivative in a hedging relationship and apply hedge accounting and whether the hedging relationship has satisfied the criteria necessary to apply hedge accounting. Derivatives designated and qualifying as a hedge of the exposure to changes in the fair value of an asset, liability, or firm commitment attributable to a particular risk, such as interest rate risk, are considered fair value hedges. Derivatives designated and qualifying as a hedge of the exposure to variability in expected future cash flows, or other types of forecasted transactions, are considered cash flow hedges. Derivatives may also be designated as hedges of the foreign currency exposure of a net investment in a foreign operation. Hedge accounting generally provides for the matching of the timing of gain or loss recognition on the hedging instrument with the recognition of the changes in the fair value of the hedged asset or liability that are attributable to the hedged risk in a fair value hedge or the earnings effect of the hedged forecasted transactions in a cash flow hedge. The Company may enter into derivative contracts that are intended to economically hedge certain of its risk, even though hedge accounting does not apply or the Company elects not to apply hedge accounting.
The Company is measuring the credit risk of its derivative financial instruments that are subject to master netting agreements on a net basis by counterparty portfolio. See Note 10— Derivatives and Hedging Activities for further details.
Foreign Currency
The functional currency of our foreign subsidiaries is the local currency. The financial statements of these subsidiaries are translated to U.S. dollars using period-end rates of exchange for assets and liabilities and average quarterly rates of exchange for revenues and expenses. Translation gains (losses) are recorded in accumulated other comprehensive income (loss) as a component of stockholders’ equity. Net gains and losses resulting from foreign exchange transactions are included in other income (expense).
Net Income (Loss) per Share
Basic net income (loss) per share is computed by dividing net income (loss) attributable to common stockholders by the weighted average number of common shares outstanding. Diluted net income (loss) per share is computed by dividing net income (loss) attributable to common stockholders by the weighted average number of common shares and common stock equivalents outstanding, calculated under the treasury stock method for options, unvested restricted stock awards (“RSAs”), unvested in-the-money performance share units (“PSUs”) and warrants using the average market prices during the period.
The following table shows the computation of basic and diluted net income (loss) per share for the following:
|
| | | | | | | |
| | Three Months Ended March 31, |
| | 2019 | | 2018 |
| Numerator: | | | |
| Net income (loss) | $ | 1,257,599 |
| | $ | (4,212,661 | ) |
| | | | |
| Denominator: | | | |
| Weighted-average shares outstanding— basic | 74,848,080 |
| | 71,981,487 |
|
| Effect of dilutive securities | 3,951,168 |
| | — |
|
| Weighted-average shares outstanding— diluted | 78,799,248 |
| | 71,981,487 |
|
| | | | |
| Basic income (loss) per share | $ | 0.02 |
| | $ | (0.06 | ) |
| Diluted income (loss) per share | $ | 0.02 |
| | $ | (0.06 | ) |
The following table summarizes the number of dilutive securities, which may dilute future earnings per share, outstanding for each of the periods presented, but not included in the calculation of diluted earnings per share:
|
| | | | | |
| | Three Months Ended March 31, |
| | 2019 | | 2018 |
| Stock options | 2,537,778 |
| | 5,394,809 |
|
| Unvested RSAs | 1,436,457 |
| | 3,403,617 |
|
| Unvested PSUs | 248,350 |
| | — |
|
| Total | 4,222,585 |
| | 8,798,426 |
|
Significant Customers and Concentration of Credit Risk
Financial instruments that potentially subject the Company to significant concentrations of credit risk consist primarily of cash, cash equivalents, restricted cash and accounts receivable. The Company invests its excess cash in high-quality, liquid money market funds maintained by major U.S. banks and financial institutions. The Company has not experienced any losses on its cash and cash equivalents, including restricted cash or money market funds.
The Company performs ongoing credit evaluations of its customers and generally does not require collateral. The Company has no recent history of significant losses from uncollectible accounts. During the three months ended March 31, 2019 and 2018, two customers, both of which were advertising aggregators (which represent thousands of advertisers) and customer payment processors, comprised approximately 61% and 47% of total revenues, respectively. Two and three customers, which were advertising aggregators and customer payment processors, comprised approximately 42% and 36% of accounts receivable as of March 31, 2019 and December 31, 2018, respectively.
The Company does not expect its current or future credit risk exposure to have a significant impact on its operations, however, there can be no assurance that the Company’s business will not experience any adverse impact from credit risk in the future.
Reclassifications
In the statement of comprehensive income (loss) for the three months ended March 31, 2018, approximately $1.7 million was reclassified from unrealized gain (loss) on derivative instruments to foreign currency translation adjustment. This reclassification had no impact on net other comprehensive income (loss) for the three months ended March 31, 2018 or accumulated comprehensive loss as of March 31, 2018.
Recent Issued Accounting Standards
In February 2016, the Financial Accounting Standards Board (“FASB”) issued Accounting Standards Update (“ASU”) No. 2016-02, Leases (Topic 842). The new standard establishes a right-of-use (“ROU”) model that requires a lessee to record a ROU asset and a lease liability on the balance sheet for all leases with terms longer than 12 months. Leases will be classified as either finance or operating, with classification affecting the pattern of expense recognition in the income statement. ASU No. 2016-02 is effective for annual periods beginning after December 15, 2018, and annual and interim periods thereafter, with early adoption permitted. A modified retrospective transition approach is an option for lessees for capital and operating leases existing at, or entered into after, the beginning of the earliest comparative period presented in the financial statements, with certain practical expedients available. In July 2018, the FASB issued ASU No. 2018-11, Leases (Topic 842), which adds an optional transition method allowing entities to apply the new lease accounting rules through a cumulative-effect adjustment to the opening balance of retained earnings in the initial year of adoption.
The Company adopted ASU No. 2016-02 as of January 1, 2019, using the transition method per ASU No. 2018-11 issued in July 2018 wherein entities were allowed to initially apply the new leases standard at adoption date and recognize a cumulative effect adjustment to the opening balance of retained earnings in the period of adoption. Accordingly, all periods prior to January 1, 2019 were presented in accordance with the previous ASC Topic 840, Leases, and no retrospective adjustments were made to the comparative periods presented. Finance leases were not impacted by the adoption of ASC 842, as finance lease liabilities and the corresponding ROU assets were already recorded in the balance sheet under the previous guidance, ASC 840.
The Company elected the package of practical expedients permitted under the new standard which, among other things, allowed the Company to not reassess the lease classification, the lease identification and the initial direct costs for any existing leases. Further, as permitted by the standard, the Company made an accounting policy election not to record ROU assets or lease liabilities for leases with a term of 12 months or less. Instead, consistent with legacy accounting guidance, the Company will recognize payments for such leases in the consolidated statement of operations on a straight-line basis over the lease term. Upon adoption on January 1, 2019, this standard resulted in the recognition of additional assets of $3.2 million and liabilities of $3.3 million on its accompanying condensed consolidated balance sheet. The new standard did not have a material impact on the Company’s results of operations or cash flows.
In August 2018, the FASB issued ASU 2018-13, Disclosure Framework—Changes to the Disclosure Requirements for Fair Value Measurement. This amendment removes, modifies, and makes certain additions to the disclosure requirements on fair value measurement. The amendments in ASU 2018-13 are effective for fiscal years beginning after on December 15, 2019 and interim periods within those fiscal years. The Company is currently evaluating the impact that the adoption of this new standard will have on its consolidated financial statements.
Note 2— Acquisitions
Growlr
On March 5, 2019, the Company acquired 100% of the issued and outstanding units of Initech, LLC, a privately held company that owns and operates Growlr (“Growlr”), a leading same-sex social app, for cash consideration of $11.8 million, plus an earnout of up to $2.0 million (the “Growlr Acquisition”). The Growlr Acquisition was funded by $4.8 million of cash on hand and a draw down of $7.0 million from the Company’s Revolving Credit Facility. See Note 6— Long-Term Debt for further details on the Revolving Credit Facility. The earnout of $2.0 million is to be paid in annual $1.0 million installments over the next two years if certain revenue metrics are achieved in each year. The Company expects goodwill to be deductible for tax purposes.
The acquisition-date fair value of the consideration transferred is as follows:
|
| | | |
| | At March 5, 2019 |
| | |
Cash consideration (1) | $ | 11,807,925 |
|
| Contingent consideration | 1,718,000 |
|
| Total consideration | $ | 13,525,925 |
|
(1) Cash consideration includes a $1.0 million escrow payment to be paid out 18 months from the date of the transaction.
The following is the preliminary purchase price allocation as of the March 5, 2019 acquisition date:
|
| | | |
| | At March 5, 2019 |
| Accounts receivable | 544,632 |
|
| Intangible assets | 3,480,000 |
|
| Accrued expenses and other current liabilities | (10,000 | ) |
| Deferred revenue | (102,058 | ) |
| Net assets acquired | 3,912,574 |
|
| Goodwill | 9,613,351 |
|
| Total consideration | $ | 13,525,925 |
|
The preliminary fair values of the Growlr trademarks were determined using an income approach. The preliminary fair value of software acquired, which represents the primary platform on which the Growlr apps operate, was determined using a cost approach. The preliminary fair value of customer relationships was determined using an excess earnings approach. The amounts assigned to the identifiable intangible assets are as follows:
|
| | | | | |
| | Fair Value | | Weighted Average
Amortization Period
(Years) |
| Trademark | $ | 1,200,000 |
| | 10.0 |
| Software | 865,000 |
| | 3.0 |
| Customer relationships | 1,415,000 |
| | 3.6 |
| Total identifiable intangible assets | $ | 3,480,000 |
| | 5.7 |
The operating results of Growlr for the period from March 5, 2019 to March 31, 2019, including revenues of $0.2 million and net loss of approximately $0.03 million, have been included in the Company’s consolidated statements of operations and comprehensive income (loss) for the three months ended March 31, 2019. The Company incurred a total of $0.3 million in transaction costs in connection with the Growlr Acquisition, which were included in acquisition and restructuring costs within the consolidated statement of operations and comprehensive income (loss) for the three months ended March 31, 2019.
The following pro forma information shows the results of the Company’s operations for the three months ended March 31, 2019 and 2018 as if the Growlr Acquisition had occurred on January 1, 2018. The pro forma information is presented for informational purposes only and is not necessarily indicative of what would have occurred if the Growlr Acquisition had been made as of that date.
|
| | | | | | | |
| | Three Months Ended March 31, |
| | 2019 | | 2018 |
| Revenues | $ | 50,337,825 |
| | $ | 38,809,705 |
|
| Net income (loss) | $ | 3,393,954 |
| | $ | (3,531,303 | ) |
Note 3—Fair Value Measurements
Accounting Standards Codification (“ASC”) Topic 820, Fair Value Measurement establishes a fair value hierarchy for instruments measured at fair value that distinguishes between assumptions based on market data (observable inputs) and the Company’s own assumptions (unobservable inputs). Observable inputs are inputs that market participants would use in pricing the asset or liability based on market data obtained from sources independent of the Company. Unobservable inputs are inputs that reflect the Company’s assumptions about the inputs that market participants would use in pricing the asset or liability, and are developed based on the best information available in the circumstances.
ASC 820 identifies fair value as the exchange price, or exit price, representing the amount that would be received to sell an asset or paid to transfer a liability in an orderly transaction between market participants. As a basis for considering market participant assumptions in fair value measurements, ASC 820 establishes a three-tier fair value hierarchy that distinguishes among the following:
Level 1—Valuations based on unadjusted quoted prices in active markets for identical assets or liabilities that the Company has the ability to access.
Level 2—Valuations based on quoted prices for similar assets or liabilities in active markets, quoted prices for identical or similar assets or liabilities in markets that are not active and models for which all significant inputs are observable, either directly or indirectly.
Level 3—Valuations based on inputs that are unobservable and significant to the overall fair value measurement.
To the extent that the valuation is based on models or inputs that are less observable or unobservable in the market, the determination of fair value requires more judgment. Accordingly, the degree of judgment exercised by the Company in determining fair value
is greatest for instruments categorized in Level 3. A financial instrument’s level within the fair value hierarchy is based on the lowest level of any input that is significant to the fair value measurement.
Derivative Financial Instruments
Currently, the Company uses an interest rate swap, interest rate cap and a cross currency swap to manage its interest rate risk. The valuation of these instruments is determined using widely accepted valuation techniques, including discounted cash flow analysis on the expected cash flows of each derivative. This analysis reflects the contractual terms of the derivatives, including the period to maturity, and uses observable market-based inputs, including interest rate curves and implied volatilities. The fair values of the interest rate swap and the cross currency swap are determined using the market standard methodology of netting the discounted future fixed cash receipts (or payments) and the discounted expected variable cash payments (or receipts). The variable cash payments (or receipts) are based on an expectation of future interest rates (forward curves) derived from observable market interest rate curves.
The fair value of the interest rate cap is determined using the market standard methodology of discounting the future expected cash receipts that would occur if variable interest rates rise above the strike rate of the cap. The variable interest rates used in the calculation of projected receipts on the cap are based on an expectation of future interest rates derived from observable market interest rate curves and volatilities.
To comply with the provisions of ASC 820, the Company incorporates credit valuation adjustments to appropriately reflect both its nonperformance risk and the respective counterparty’s nonperformance risk in the fair value measurements. In adjusting the fair value of the Company’s derivative contracts for the effect of nonperformance risk, the Company has considered the impact of netting and any applicable credit enhancements, such as collateral postings, thresholds, mutual puts and guarantees. The Company made an accounting policy election to measure the credit risk of its derivative financial instruments that are subject to master netting agreements on a net basis by counterparty portfolio.
Although the Company has determined that the majority of the inputs used to value its derivatives fall within Level 2 of the fair value hierarchy, the credit valuation adjustments associated with its derivatives utilize Level 3 inputs, such as estimates of current credit spreads to evaluate the likelihood of default by the Company and its counterparties. The Company has determined that the impact of the credit valuation adjustments made to its derivative contracts, which determination was based on the fair value of each individual contract, was not significant to the overall valuation. As a result, all of the Company’s derivatives held as of March 31, 2019 and December 31, 2018 were classified as Level 2 of the fair value hierarchy. See Note 10— Derivatives and Hedging Activities for further discussion on derivative financial instruments.
Recurring Fair Value Measurements
Items measured at fair value on a recurring basis include money market mutual funds, derivatives and hedging instruments and contingent consideration. During the periods presented, the Company has not changed the manner in which it values assets and liabilities that are measured at fair value using Level 3 inputs. The following fair value hierarchy table presents information about each major category of the Company’s financial assets and liabilities measured at fair value on a recurring basis:
|
| | | | | | | | | | | | | | | |
| | Quoted Prices in Active Markets for Identical Items (Level 1) | | Significant Other Observable Inputs (Level 2) | | Significant Unobservable Inputs (Level 3) | | Total |
| March 31, 2019 | | | | | | | |
| Assets | | | | | | | |
| Money market | $ | 6,638,808 |
| | $ | — |
| | $ | — |
| | $ | 6,638,808 |
|
| Derivative assets | — |
| | 957,380 |
| | — |
| | 957,380 |
|
| Total assets | $ | 6,638,808 |
| | $ | 957,380 |
| | $ | — |
| | $ | 7,596,188 |
|
| Liabilities | | | | | | | |
| Contingent consideration | $ | — |
| | $ | — |
| | $ | 1,733,917 |
| | $ | 1,733,917 |
|
| Total liabilities | $ | — |
| | $ | — |
| | $ | 1,733,917 |
| | $ | 1,733,917 |
|
| December 31, 2018 | | | | | | | |
| Assets | | | | | | | |
| Money market | $ | 7,639,866 |
| | $ | — |
| | $ | — |
| | $ | 7,639,866 |
|
| Derivative asset | — |
| | 972,784 |
| | — |
| | 972,784 |
|
| Total assets | $ | 7,639,866 |
| | $ | 972,784 |
| | $ | — |
| | $ | 8,612,650 |
|
| Liabilities | | | | | | | |
| Derivative liability | $ | — |
| | $ | 940,216 |
| | $ | — |
| | $ | 940,216 |
|
| Total liabilities | $ | — |
| | $ | 940,216 |
| | $ | — |
| | $ | 940,216 |
|
The following table sets forth a summary of changes in the fair value of the Company’s contingent consideration liability, which represents a recurring measurement that is classified within Level 3 of the fair value hierarchy, wherein fair value is estimated using significant unobservable inputs:
|
| | | |
| Contingent
Consideration |
| Balance as of December 31, 2018 | $ | — |
|
| Amounts acquired | 1,718,000 |
|
| Accretion | 15,917 |
|
| Balance as of March 31, 2019 | $ | 1,733,917 |
|
The Company determined the fair value of its contingent consideration liabilities using the income approach with assumed discount rates and payment probabilities. The income approach uses Level 3, or unobservable inputs, as defined under the accounting guidance, for fair value measurements. Based on the Company’s projected results, the Company estimated the probability of success to be 100% for the contingent consideration related to the Growlr Acquisition as of March 31, 2019. The contingent consideration is recorded in accrued expenses on the accompanying condensed consolidated balance sheet as of December 31, 2018.
The Company recognizes transfers between levels of the fair value hierarchy as of the end of the reporting period. There were no transfers within the levels of the fair value hierarchy during the three months ended March 31, 2019 and as of the year ended December 31, 2018.
Note 4— Intangible Assets and Goodwill
Intangible assets consist of the following:
|
| | | | | | | | | | | |
| | March 31, 2019 |
| | Gross Carrying Amount | | Accumulated Amortization | | Net Carrying Amount |
| Trademarks and domain names | $ | 35,604,415 |
| | $ | (14,380,989 | ) | | $ | 21,223,426 |
|
| Customer relationships | 15,248,318 |
| | (7,793,201 | ) | | 7,455,117 |
|
| Software | 19,561,581 |
| | (11,000,098 | ) | | 8,561,483 |
|
| Total | $ | 70,414,314 |
| | $ | (33,174,288 | ) | | $ | 37,240,026 |
|
|
| | | | | | | | | | | |
| | December 31, 2018 |
| | Gross Carrying Amount | | Accumulated Amortization | | Net Carrying Amount |
| Trademarks and domain names | $ | 34,636,802 |
| | $ | (13,406,226 | ) | | $ | 21,230,576 |
|
| Customer relationships | 13,901,313 |
| | (7,130,285 | ) | | 6,771,028 |
|
| Software | 18,722,187 |
| | (10,165,352 | ) | | 8,556,835 |
|
| Total | $ | 67,260,302 |
| | $ | (30,701,863 | ) | | $ | 36,558,439 |
|
Amortization expense was approximately $2.6 million and $3.1 million for the three months ended March 31, 2019 and 2018, respectively.
Annual future amortization expense for the Company’s intangible assets is as follows:
|
| | | |
| Year ending December 31, | Amortization Expense |
| Remaining in 2019 | $ | 7,940,552 |
|
| 2020 | 8,557,575 |
|
| 2021 | 7,087,546 |
|
| 2022 | 4,146,250 |
|
| 2023 | 2,746,555 |
|
| Thereafter | 6,761,548 |
|
| Total | $ | 37,240,026 |
|
The changes in the carrying amount of goodwill for the three months ended March 31, 2019 are as follows:
|
| | | |
| | March 31, 2019 |
| Balance at December 31, 2018 | $ | 148,132,873 |
|
| Goodwill acquired from Growlr Acquisition | 9,613,351 |
|
| Foreign currency translation adjustments | (1,048,198 | ) |
| Balance at March 31, 2019 | $ | 156,698,026 |
|
Note 5— Property and Equipment
Property and equipment consist of the following:
|
| | | | | | | |
| | March 31,
2019 | | December 31,
2018 |
| Servers, computer equipment and software | $ | 13,894,736 |
| | $ | 13,656,176 |
|
| Office furniture and equipment | 594,501 |
| | 574,559 |
|
| Leasehold improvements | 644,303 |
| | 646,123 |
|
| | 15,133,540 |
| | 14,876,858 |
|
| Less accumulated depreciation | (10,870,672 | ) | | (10,243,094 | ) |
| Property and equipment - net | $ | 4,262,868 |
| | $ | 4,633,764 |
|
Property and equipment depreciation expense was approximately $0.6 million for each of the three months ended March 31, 2019 and 2018, respectively.
Note 6— Long-Term Debt
Credit Facilities
On September 18, 2017, in connection with the Company’s acquisition of all of the outstanding shares of Lovoo (the “Lovoo Acquisition”), the Company entered into an amended and restated credit agreement (the “Amended and Restated Credit Agreement”) with the several banks and other financial institutions party thereto and JPMorgan Chase Bank, N.A., as administrative agent (the “Agent”), amending and restating the Credit Agreement, dated March 3, 2017. The Amended and Restated Credit Agreement provides for a $20.0 million revolving credit facility (the “Revolving Credit Facility”) and a $60.0 million delayed draw term loan facility (the “Term Loan Facility,” and together with the “Revolving Credit Facility”, the “Credit Facilities”). On October 18, 2017, the Company drew down $60.0 million from its Term Loan Facility in connection with the Lovoo Acquisition. Fees and direct costs incurred when the Company entered into the Credit Facilities were $0.6 million. Fees and direct costs incurred are offset against long-term debt on the accompanying condensed consolidated balance sheets.
On March 7, 2018, the Company entered into an amendment to the Amended and Restated Credit Agreement, that among other things, amends the definition of “Applicable Rate” and “EBITDA” and makes certain changes to the financial covenants. On July 27, 2018, the Company entered into an amendment to the Amended and Restated Credit Agreement that amends the Company’s obligation to use certain of its excess cash flow to prepay its obligations under the Credit Agreement by limiting the applicable period for the fiscal year ended December 31, 2017 to the period commencing October 31, 2017 and ended December 31, 2017. The Company made an excess cash flow payment of approximately $4.3 million in the third quarter of 2018.
In March 2019, the Company made an excess cash flow payment of $3.6 million related to the fiscal year end December 31, 2018. On March 5, 2019, in connection with the Growlr Acquisition, as discussed in Note 2— Acquisitions, the Company drew down $7.0 million from its Revolving Credit Facility. Borrowings on the Revolving Credit Facility are included in long-term debt, less current portion, net, on the accompanying condensed consolidated balance sheets.
The Company intends to use the remaining proceeds of the Revolving Credit Facility to finance working capital needs and for general corporate purposes. Amounts under the Revolving Credit Facility may be borrowed, repaid and re-borrowed from time to time until the maturity date of the Credit Agreement on September 18, 2020. The Term Loan Facility is subject to quarterly payments of principal in an amount equal to $3,750,000 commencing December 31, 2017 and continuing through maturity. At the Company’s election, loans made under the Credit Facilities will bear interest at either (i) a base rate (“Base Rate”) plus an applicable margin or (ii) a London interbank offered rate (“LIBO Rate”) plus an applicable margin, subject to adjustment if an event of default under the Amended and Restated Credit Agreement has occurred and is continuing. The Base Rate means the highest of (a) the Agent’s “prime rate,” (b) the federal funds effective rate plus 0.50% and (c) the LIBO Rate for an interest period of one month plus 1%. The Company’s present and future domestic subsidiaries (the “Guarantors”) will guarantee the obligations of the Company and its subsidiaries under the Credit Facilities. The obligations of the Company and its subsidiaries under the Credit Facilities are secured by all of the assets of the Company and the Guarantors, subject to certain exceptions and exclusions as set forth in the Amended and Restated Credit Agreement and other loan documents.
The Credit Facilities consist of the following:
|
| | | | | | | |
| | March 31, 2019 | | December 31, 2018 |
| Credit Facilities | | | |
| Term Loan Facility | $ | 29,623,574 |
| | $ | 36,940,158 |
|
| Revolving Credit Facility | 7,000,000 |
| | — |
|
| Total Credit Facilities | 36,623,574 |
| | 36,940,158 |
|
| Less: Debt discount, net | (247,578 | ) | | (285,618 | ) |
| Net carrying amount | $ | 36,375,996 |
| | $ | 36,654,540 |
|
| Less: current portion | 15,000,000 |
| | 18,566,584 |
|
| Long-term debt, net | $ | 21,375,996 |
| | $ | 18,087,956 |
|
The weighted average interest rate on the Credit Facilities at March 31, 2019 was 6.31%.
Note 7— Commitments and Contingencies
Cloud Data Storage
The Company stores a portion of its user and business data using Amazon Web Services in the U.S. with a minimum commitment agreement that expires in 2021. Lovoo stores a majority of its user and business data in the Google Cloud Platform in Germany under a noncancelable minimum commitment agreement that expires in 2023.
A summary of minimum future commitments required under the Company’s cloud data storage contracts as of March 31, 2019 are as follows:
|
| | | | |
| For the Years Ending December 31, | | Cloud Data Storage |
| Remaining in 2019 | | $ | 3,765,808 |
|
| 2020 | | 5,617,502 |
|
| 2021 | | 6,802,793 |
|
| 2022 | | 1,043,337 |
|
| 2023 | | 1,147,670 |
|
| Thereafter | | — |
|
| Total minimum lease payments | | $ | 18,377,110 |
|
Credit Facility
A summary of minimum future principal payments under our Credit Facilities as of March 31, 2019 are as follows:
|
| | | | |
| For the Years Ending December 31, | | Credit Facilities(1) |
| Remaining in 2019 | | $ | 11,250,000 |
|
| 2020 | | 25,373,574 |
|
| Total minimum loan payments | | $ | 36,623,574 |
|
| |
| (1) | Interest rates on the Credit Facilities are variable in nature, however, the Company is party to a fixed-pay amortizing interest rate swap having a remaining notional amount of $22.5 million and a non-amortizing interest rate cap with a notional amount of $10.7 million. If interest rates were to remain at the March 31, 2019 level, we would receive interest payments of $0.1 million in 2019 and $0.04 million in 2020 of net settlements on the fixed-pay amortizing interest rate swap and non-amortizing interest rate cap. |
Litigation
From time to time, we are party to certain legal proceedings that arise in the ordinary course and are incidental to our business. We operate our business online, which is subject to extensive regulation by federal and state governments. Future events or circumstances, currently unknown to management, will determine whether the resolution of pending or threatened litigation or claims will ultimately have a material effect on our consolidated financial position, liquidity or results of operations in any future reporting periods.
Retirement Plan
The Company maintains The Meet Group, Inc. 401(k) Retirement Plan (the “Plan”), which is a savings and investment plan intended to be qualified under the Internal Revenue Code. The Plan covers the majority of the employees of the Company. In January 2014, the Company began providing matching contributions to the Plan, based on a participant’s contribution. The Company’s 401(k) match expense totaled $0.2 million for each of the three months ended March 31, 2019 and 2018, respectively. The expense is included in sales and marketing, product development and content, and general and administrative expenses in the condensed consolidated statements of operations and comprehensive income (loss).
Note 8— Stockholders’ Equity
Preferred Stock
The total number of shares of preferred stock, $.001 par value, that the Company is authorized to issue is 5,000,000.
The Board of Directors may, without further action by the stockholders, issue a series of preferred stock and fix the rights and preferences of those shares, including the dividend rights, dividend rates, conversion rights, exchange rights, voting rights, terms of redemption, redemption price or prices, liquidation preferences, the number of shares constituting any series and the designation of such series.
As of March 31, 2019 and December 31, 2018 there were no shares of preferred stock issued and outstanding.
Common Stock
The total number of shares of common stock, $0.001 par value, that the Company is authorized to issue is 100,000,000.
The Company issued shares of common stock of 151,737 and 1,079,496 related to exercises of stock options and 420,772 and 1,591,662 related to restricted stock awards in the three months ended March 31, 2019 and the year ended December 31, 2018, respectively.
Stock-Based Compensation
The fair value of stock options is estimated on the date of grant using the Black-Scholes option pricing model, based on weighted average assumptions. Expected volatility is based on historical volatility of the Company’s common stock. The risk-free rate is based on the U.S. Treasury yield curve in effect over the expected term at the time of grant. Compensation expense is recognized on a straight-line basis over the requisite service period of the award. The Company uses the simplified method to determine the expected option term since the Company’s stock option exercise experience does not provide a reasonable basis upon which to estimate the expected option term.
The Company began granting RSAs to its employees in April 2013. The fair value of RSAs is determined using the fair value of the Company’s common stock on the date of grant. Stock-based compensation expense for RSAs is amortized on a straight-line basis over the requisite service period. RSAs generally vest over a three-year period with 33% vesting at the end of one year and the remaining vesting annually thereafter.
The Company began granting PSUs to certain employees in April and July 2018. PSUs are based on a relative Total Shareholder Return (“TSR”) metric over a performance period spanning three years from the grant date of the PSU. PSU awards will vest at the end of the performance period and will be paid immediately in shares of common stock. Stock-based compensation expense for PSUs is amortized on a straight-line basis over the performance period. PSU awards are forfeited if the participant is no longer employed on the third anniversary of the grant date, except in the event of an involuntary termination, death, disability or change in control. The Company estimated the fair value of the PSU awards using a Monte-Carlo simulation model utilizing several key assumptions including expected Company and Russell 2000 Peer Group share price volatility, correlation coefficients between peers, the risk-free rate of return, the expected dividend yield and other award design features.
The assumptions used in calculating the fair value of stock-based awards represent the Company’s best estimates, but these estimates involve inherent uncertainties and the application of management judgment. As a result, if factors change and the Company uses different assumptions, the Company’s stock-based compensation expense could be materially different in the future.
Stock-based compensation expense is recognized on a straight-line basis over the requisite service period of all awards given by the Company. Stock-based compensation expense includes incremental stock-based compensation expense and is allocated on the condensed consolidated statements of operations and comprehensive income (loss) as follows:
|
| | | | | | | |
| | Three Months Ended March 31, |
| | 2019 | | 2018 |
| Sales and marketing | $ | 70,175 |
| | $ | 118,547 |
|
| Product development and content | 1,499,393 |
| | 1,114,067 |
|
| General and administrative | 855,149 |
| | 936,311 |
|
| Total stock-based compensation expense | $ | 2,424,717 |
| | $ | 2,168,925 |
|
As of March 31, 2019, there was approximately $1.4 million, $10.6 million and $1.3 million of total unrecognized compensation cost which is expected to be recognized over a weighted-average vesting period of approximately of 1.0 year, 1.7 years and 2.1 years relating to stock options, RSAs and PSUs, respectively.
Stock Compensation Plans
2018 Omnibus Incentive Plan
On June 1, 2018, the Company’s stockholders approved the 2018 Omnibus Incentive Plan (the “2018 Plan”), providing for the issuance of up to 8.8 million shares of the Company’s common stock, including approximately 0.3 million shares previously approved by the Company’s stockholders under the Company’s Amended and Restated 2012 Omnibus Incentive Plan (the “2012 Plan”), minus one share of common stock for every one share of common stock that was subject to an option granted after April 9, 2018 but before June 1, 2018 under the 2012 Plan, plus an additional number of shares of common stock equal to the number of options previously granted under the 2012 Plan and the Amended and Restated 2006 Stock Incentive Plan (the “2006 Stock Plan”) that either terminate, expire, or are forfeited after April 9, 2018 and any restricted stock awards that either terminate, expire, or are forfeited equal to the number of awards granted under the 2012 Plan and 2006 Stock Plan multiplied by the fungible ratio of 1.4. As of March 31, 2019, there were approximately 6.7 million shares of common stock available for grant.
Restricted Stock Awards Under 2018 Plan
A summary of RSA activity under the 2018 Plan during the three months ended March 31, 2019 is as follows:
|
| | | | | | | |
| RSAs | | Number of RSAs | | Weighted-Average Stock Price |
| Outstanding at December 31, 2018 | | 1,677,227 |
| | $ | 4.18 |
|
| Granted | | 597,016 |
| | 5.55 |
|
| Vested | | — |
| | — |
|
| Forfeited or expired | | (20,736 | ) | | 4.36 |
|
| Outstanding and unvested at March 31, 2019 | | 2,253,507 |
| | $ | 4.54 |
|
Shares are forfeited if not vested within three years from the date of grant and vest in three equal annual increments. The Company recorded stock-based compensation expense related to RSAs under the 2018 Plan of approximately $1.0 million for the three months ended March 31, 2019.
Performance Share Awards Under 2018 Omnibus Incentive Plan
PSU share payouts range from a threshold of 33% to a maximum of 170% based on the relative ranking of the Company’s TSR as compared to the TSR of the companies in the Russell 2000 Peer Group. The PSU award stipulates certain limitations to the payout in the event the payout reaches a defined ceiling level or the Company’s TSR is negative. The Company estimated the fair value of the PSU awards using a Monte-Carlo simulation model utilizing several key assumptions including expected Company and Russell 2000 Peer Group share price volatility, correlation coefficients between peers, the risk-free rate of return, the expected dividend yield and other award design features.
A summary of PSU awards under the 2018 Plan during the three months ended March 31, 2019 is as follows:
|
| | | | | | | |
| PSUs | | Number of
PSUs | | Weighted-Average
Stock Price |
| Outstanding at December 31, 2018 | | 60,000 |
| | $ | 4.65 |
|
| Granted | | — |
| | — |
|
| Vested | | — |
| | — |
|
| Forfeited or expired | | — |
| | — |
|
| Outstanding at March 31, 2019 | | 60,000 |
| | $ | 4.65 |
|
The Company recorded stock-based compensation expense related to PSUs under the 2018 Plan of approximately $0.02 million for the three months ended March 31, 2019.
Amended and Restated 2012 Omnibus Incentive Plan
On December 16, 2016, the Company’s stockholders approved the 2012 Plan, providing for the issuance of up to 10.5 million shares of the Company’s common stock, including approximately 2.1 million shares previously approved by the Company’s stockholders under the Company’s 2006 Stock Plan, less one share of common stock for every one share of common stock that was subject to an option or other award granted after December 31, 2011 under the 2006 Stock Plan, plus an additional number of shares of common stock equal to the number of shares previously granted under the 2006 Stock Plan that either terminate, expire, or are forfeited after December 31, 2011. As of June 1, 2018, grants are no longer issued from the 2012 Plan.
A summary of stock option activity under the 2012 Plan during the three months ended March 31, 2019 is as follows:
|
| | | | | | | | | | | | | |
| Options | | Number of Stock Options | | Weighted- Average Exercise Price | | Weighted Average Remaining Contractual Life | | Aggregate Intrinsic Value |
| Outstanding at December 31, 2018 | | 2,447,315 |
| | $ | 3.27 |
| | | | |
| Granted | | — |
| | — |
| | | | |
| Exercised | | (102,570 | ) | | 4.33 |
| | | | |
| Forfeited or expired | | — |
| | — |
| | | | |
| Outstanding at March 31, 2019 | | 2,344,745 |
| | $ | 3.23 |
| | 6.8 | | $ | 4,293,707 |
|
| Exercisable at March 31, 2019 | | 1,915,849 |
| | $ | 2.97 |
| | 6.5 | | $ | 3,992,364 |
|
The total intrinsic values of options exercised under the 2012 Plan were $0.2 million during the three months ended March 31, 2019. No options under the 2012 Plan were exercised during the three months ended March 31, 2018. The Company recorded stock-based compensation expense related to options under the 2012 Plan of approximately $0.3 million and $0.4 million for the three months ended March 31, 2019 and 2018, respectively.
Restricted Stock Awards Under Amended and Restated 2012 Omnibus Incentive Plan
A summary of RSA activity under the 2012 Plan during the three months ended March 31, 2019 is as follows:
|
| | | | | | | |
| RSAs | | Number of RSAs | | Weighted-Average Stock Price |
| Outstanding at December 31, 2018 | | 1,166,535 |
| | $ | 3.58 |
|
| Granted | | — |
| | — |
|
| Vested | | (386,498 | ) | | 2.53 |
|
| Forfeited or expired | | (4,933 | ) | | 3.86 |
|
| Outstanding and unvested at March 31, 2019 | | 775,104 |
| | $ | 4.11 |
|
Shares are forfeited if not vested within three years from the date of grant and vest in three equal annual increments. The Company recorded stock-based compensation expense related to RSAs under the 2012 Plan of approximately $0.7 million and $1.2 million for the three months ended March 31, 2019 and 2018, respectively.
Performance Share Awards Under Amended and Restated 2012 Omnibus Incentive Plan
PSU share payouts range from a threshold of 33% to a maximum of 170% based on the relative ranking of the Company’s TSR as compared to the TSR of the companies in the Russell 2000 Peer Group. The PSU award stipulates certain limitations to the payout in the event the payout reaches a defined ceiling level or the Company’s TSR is negative. The Company estimated the fair value of the PSU awards using a Monte-Carlo simulation model utilizing several key assumptions including expected Company and Russell 2000 Peer Group share price volatility, correlation coefficients between peers, the risk-free rate of return, the expected dividend yield and other award design features.
A summary of PSU awards under the 2012 Plan during the three months ended March 31, 2019 is as follows:
|
| | | | | | | |
| PSUs | | Number of
PSUs | | Weighted-Average
Stock Price |
| Outstanding at December 31, 2018 | | 550,000 |
| | $ | 2.94 |
|
| Granted | | — |
| | — |
|
| Vested | | — |
| | — |
|
| Forfeited or expired | | — |
| | — |
|
| Outstanding at March 31, 2019 | | 550,000 |
| | $ | 2.94 |
|
The Company recorded stock-based compensation expense related to PSUs under the 2012 Plan of approximately $0.1 million for the three months ended March 31, 2019, respectively.
Amended and Restated 2006 Stock Incentive Plan
On June 27, 2007, the Company’s stockholders approved the 2006 Stock Plan, providing for the issuance of up to 3.7 million shares of common stock plus an additional number of shares of common stock equal to the number of shares previously granted under the 1998 Stock Option Plan that either terminate, expire, or lapse after the date of the Board of Directors’ approval of the 2006 Stock Plan. All options granted and outstanding have been fully expensed prior to 2016.
A summary of stock option activity under the 2006 Stock Plan during the three months ended March 31, 2019 is as follows:
|
| | | | | | | | | | | | | |
| Options | | Number of Stock Options | | Weighted- Average Exercise Price | | Weighted Average Remaining Contractual Life | | Aggregate Intrinsic Value |
| Outstanding at December 31, 2018 | | 1,074,411 |
| | $ | 4.00 |
| | | | |
| Granted | | — |
| | — |
| | | | |
| Exercised | | (22,500 | ) | | 3.78 |
| | | | |
| Forfeited or expired | | — |
| | — |
| | | | |
| Outstanding at March 31, 2019 | | 1,051,911 |
| | $ | 4.00 |
| | 2.5 | | $ | 1,101,536 |
|
| Exercisable at March 31, 2019 | | 1,007,732 |
| | $ | 4.02 |
| | 2.6 | | $ | 1,042,778 |
|
The total intrinsic values of options exercised under the 2006 Stock Plan were $0.04 million during the three months ended March 31, 2019. No options under the 2006 Stock Plan were exercised during the three months ended March 31, 2018.
Amended and Restated 2016 Inducement Omnibus Incentive Plan
On October 3, 2016, in connection with the closing of the acquisition of Skout, the Company’s Board of Directors adopted the 2016 Inducement Omnibus Incentive Plan in accordance with NASDAQ Listing Rule 5635(c)(4). At the closing of the acquisition of Skout, the Company granted stock options to purchase an aggregate of up to 355,000 shares of its common stock to 25 former Skout employees as an inducement material to becoming non-executive employees of the Company. On February 27, 2017, the Company amended and restated the 2016 Inducement Omnibus Incentive Plan (as so amended and restated, the “2016 Stock Plan”) and authorized an additional 2,000,000 shares of common stock under the 2016 Stock Plan. At the closing of the if(we) Acquisition, the Company granted options to purchase an aggregate of up to 75,000 shares of its common stock and restricted stock awards representing an aggregate of 717,500 shares of common stock to 83 former if(we) employees as an inducement material to becoming non-executive employees of the Company. At the closing of the Lovoo Acquisition, the Company granted restricted stock awards representing an aggregate of 531,500 shares of common stock to 96 former Lovoo employees as an inducement material to becoming non-executive employees of the Company.
Options Under The 2016 Stock Plan
A summary of stock option activity under the 2016 Stock Plan during the three months ended March 31, 2019 is as follows:
|
| | | | | | | | | | | | | |
| Options | | Number of Stock Options | | Weighted- Average Exercise Price | | Weighted- Average Remaining Contractual Life | | Aggregate Intrinsic Value |
| Outstanding at December 31, 2018 | | 444,168 |
| | $ | 5.10 |
| | | | |
| Granted | | — |
| | — |
| | | | |
| Exercised | | (26,667 | ) | | 5.69 |
| | | | |
| Forfeited or expired | | (97,501 | ) | | 5.02 |
| | | | |
| Outstanding at March 31, 2019 | | 320,000 |
| | $ | 5.07 |
| | 7.8 | | $ | 50,000 |
|
| Exercisable at March 31, 2019 | | 213,333 |
| | $ | 5.07 |
| | 7.8 | | $ | 33,333 |
|
The total intrinsic values of options exercised under the 2016 Stock Plan were $0.01 million during the three months ended March 31, 2019. No options under the 2006 Stock Plan were exercised during the three months ended March 31, 2018. The Company recorded stock-based compensation expense related to options under the 2016 Stock Plan of approximately $0.1 million and $0.2 million for the three months ended March 31, 2019 and 2018, respectively.
Restricted Stock Awards Under The 2016 Stock Plan
A summary of RSA activity under the 2016 Stock Plan during the three months ended March 31, 2019 is as follows:
|
| | | | | | | |
| RSAs | | Number of RSAs | | Weighted-Average Stock Price |
| Outstanding at December 31, 2018 | | 474,686 |
| | $ | 4.25 |
|
| Granted | | — |
| | — |
|
| Vested | | (50,000 | ) | | 4.83 |
|
| Forfeited or expired | | (29,000 | ) | | 4.17 |
|
| Outstanding and unvested at March 31, 2019 | | 395,686 |
| | $ | 4.18 |
|
Shares are forfeited if not vested within three years from the date of grant, and vest in three equal annual increments. The Company recorded stock-based compensation expense related to RSAs under the 2016 Stock Plan of approximately $0.2 million and $0.4 million for the three months ended March 31, 2019 and 2018, respectively.
Note 9— Income Taxes
The Company recorded a net income tax expense of approximately $0.3 million and a benefit from income taxes of approximately $0.3 million for the three months ended March 31, 2019 and 2018, respectively. The net income tax expense recorded during the
three months ended March 31, 2019 is primarily related to the mix of earnings between the US and Germany and the estimated GILTI tax, partially offset by discrete tax benefits related to an excess benefit on stock-based compensation,.
For the three months ended March 31, 2019, the Company’s effective tax rate (“ETR”) from operations is 16.8%, compared to (5.6)% for the three months ended March 31, 2018. The difference between the Company’s ETR and the current U.S. statutory rate of 21%, as well as the difference in the ETR for the three months ended March 31, 2019 compared to the three months ended March 31, 2018, are primarily related to permanent addback items and the difference in tax rates between the U.S. and Germany, partially offset by excess benefits on stock-based compensation.
As of each reporting date, management considers new evidence, both positive and negative, that could affect its view of the future realization of deferred tax assets (primarily federal and state net operating losses (“NOLs”). As of March 31, 2019 and December 31, 2018, the Company has a valuation allowance related to acquired state NOLs that the Company believes it is not more likely than not will be realized.
During the three months ended March 31, 2019 and 2018, the Company had no material changes in uncertain tax positions.
Note 10— Derivatives and Hedging Activities
Risk Management Objective of Using Derivatives
The Company is exposed to certain risk arising from both its business operations and economic conditions. The Company principally manages its exposures to a wide variety of business and operational risks through management of its core business activities. The Company manages economic risks, including interest rate, liquidity, and credit risk primarily by managing the amount, sources, and duration of its assets and liabilities and the use of derivative financial instruments. Specifically, the Company enters into derivative financial instruments to manage exposures that arise from business activities that result in the receipt or payment of future known and uncertain cash amounts, the value of which are determined by interest rates. The Company’s derivative financial instruments are used to manage differences in the amount, timing, and duration of the Company’s known or expected cash receipts and its known or expected cash payments principally related to the Company’s borrowings.
Certain of the Company’s foreign operations expose the Company to fluctuations of foreign exchange rates. These fluctuations may impact the value of the Company’s cash receipts and payments in terms of the Company’s functional currency. The Company enters into derivative financial instruments to protect the value or fix the amount of certain liabilities in terms of its functional currency, the U.S. dollar.
Cash Flow Hedges of Interest Rate Risk
The Company’s objectives in using interest rate derivatives are to add stability to interest expense and to manage its exposure to interest rate movements. To accomplish this objective, the Company primarily uses interest rate swaps and caps as part of its interest rate risk management strategy. Interest rate swaps designated as cash flow hedges involve the receipt of variable amounts from a counterparty in exchange for the Company making fixed-rate payments over the life of the agreements without exchange of the underlying notional amount. Interest rate caps designated as cash flow hedges involve the receipt of variable amounts from a counterparty if interest rates rise above the strike rate on the contract in exchange for an up-front premium. During 2019 and 2018, such derivatives were used to hedge the variable cash flows associated with existing variable-rate debt.
For derivatives designated and that qualify as cash flow hedges of interest rate risk, the gain or loss on the derivative is recorded in accumulated other comprehensive income (loss) and subsequently reclassified into interest expense in the same period(s) during which the hedged transaction affects earnings. Gains and losses on the derivative representing hedge components excluded from the assessment of effectiveness are recognized over the life of the hedge on a systematic and rational basis, as documented at hedge inception in accordance with the Company’s accounting policy election. The earnings recognition of excluded components is presented in interest expense. Amounts reported in accumulated other comprehensive income (loss) related to derivatives will be reclassified to interest expense as interest payments are made on the Company’s variable-rate debt. Between March 31, 2019 and March 31, 2020, the Company estimates that an additional $0.1 million will be reclassified as a decrease to interest expense.
As of March 31, 2019, the Company had the following outstanding interest rate derivatives that were designated as cash flow hedges of interest rate risk:
|
| | | | | | |
| | | Number of | | At Inception | | At March 31, 2019 |
| Interest Rate Derivative | | Instruments | | Notional | | Notional |
| Interest rate swaps | | 1 | | $45,000,000 | | $22,500,000 |
| Interest rate caps | | 1 | | $15,000,000 | | $10,690,158 |
Cash Flow Hedges of Foreign Exchange Risk
The Company is exposed to fluctuations in various foreign currencies against its functional currency, the U.S. dollar. The Company uses foreign currency derivatives including cross-currency interest rate swaps to manage its exposure to fluctuations in the USD-EUR exchange rate. Cross-currency interest rate swaps involve exchanging fixed rate interest payments for fixed rate interest receipts both of which will occur at the USD-EUR forward exchange rates in effect upon entering into the instrument. The Company designates these derivatives as cash flow hedges of foreign exchange risks.
For derivatives designated and that qualify as cash flow hedges of foreign exchange risk, the gain or loss on the derivative is recorded in accumulated other comprehensive income (loss) and subsequently reclassified in the period(s) during which the hedged transaction affects earnings within the same income statement line item as the earnings effect of the hedged transaction. During the next 12 months, the Company estimates that an additional $0.8 million will be reclassified as a decrease to interest expense.
As of March 31, 2019, the Company had the following outstanding foreign currency derivatives that were used to hedge its foreign exchange risks:
|
| | | | | | |
| Foreign Currency Derivative | | Number of Instruments | | Pay Fixed Notional | | Receive Fixed Notional |
| Cross-currency interest rate swap | | 1 | | €42,000,517 | | $48,750,000 |
| | | | | (amortizing to €36,831,223 as of March 31, 2019) | | (amortizing to $42,750,000 as of March 31, 2019) |
The table below presents the fair value of the Company’s derivative financial instruments as well as their classification on the balance sheet as of March 31, 2019 and December 31, 2018.
|
| | | | | | | | | | | | | | | | | | |
| | | | | Fair Value of Derivative Instruments |
| | | | | Asset Derivatives | | Liability Derivatives |
| | | | | March 31, 2019 | | December 31, 2018 | | March 31, 2019 | | December 31, 2018 |
| Derivatives Designated as Hedging Instruments | | Balance Sheet Location | | Fair Value | | Fair Value | | Fair Value | | Fair Value |
| Interest rate products | | Prepaid expenses and other current assets | | $ | 90,779 |
| | $ | 166,058 |
| | $ | — |
| | $ | — |
|
| Interest rate products | | Other assets - non-current | | 11,764 |
| | 53,355 |
| | — |
| | — |
|
| Cross currency contract | | Prepaid expenses and other current assets | | 821,688 |
| | 753,371 |
| | — |
| | — |
|
| Cross currency contract | | Other assets - non-current / Long-term liability | | 33,149 |
| | — |
| | — |
| | (940,216 | ) |
| Total derivatives designated as hedging instruments | | | | $ | 957,380 |
| | $ | 972,784 |
| | $ | — |
| | $ | (940,216 | ) |
The tables below presents the effect of cash flow hedge accounting on accumulated other comprehensive income (loss) for the three months ended March 31, 2019 and 2018.
|
| | | | | | | | |
| Derivatives in Subtopic 815-20 Hedging Relationships | | Amount of Gain (Loss) Recognized in OCI on Derivatives |
| | | Three Months Ended March 31, |
| | | 2019 | | 2018 |
| Derivatives in Cash Flow Hedging Relationships | | | | |
| Interest rate products | | $ | (60,809 | ) | | $ | 268,549 |
|
| Cross currency contract | | 1,274,399 |
| | (1,447,571 | ) |
| Total | | $ | 1,213,590 |
| | $ | (1,179,022 | ) |
|
| | | | | | | | |
| Location of Gain (Loss) Reclassified from Accumulated OCI into Income | | Amount of Gain (Loss) Reclassified from Accumulated OCI into Income |
| | | Three Months Ended March 31, |
| | | 2019 | | 2018 |
| Interest expense | | $ | 52,541 |
| | $ | (38,279 | ) |
| Interest expense | | 202,825 |
| | 219,500 |
|
| Gain (loss) on foreign currency transactions | | 866,946 |
| | (1,283,667 | ) |
| Total | | $ | 1,122,312 |
| | $ | (1,102,446 | ) |
The table below presents the effect of the Company’s derivative financial instruments on the income statement for the three months ended March 31, 2019 and 2018.
|
| | | | | | | |
| | Three Months Ended March 31, |
| | 2019 |
| | Interest Expense | | Foreign Currency Adjustment |
| Total amounts of income and expense line items presented in the statement of financial performance in which the effects of fair value or cash flow hedges are recorded | $ | (402,864 | ) | | $ | (65,209 | ) |
| Gain (loss) on cash flow hedging relationships in Subtopic 815-20 | | | |
| Interest contracts | | | |
| Amount of gain (loss) reclassified from accumulated other comprehensive income (loss) into income | $ | 255,366 |
| | $ | 866,946 |
|
| Amount of gain (loss) reclassified from accumulated other comprehensive income (loss) into income as a result that a forecasted transaction is no longer probable of occurring | $ | — |
| | $ | — |
|
|
| | | | | | | |
| | Three Months Ended March 31, |
| | 2018 |
| | Interest Expense | | Foreign Currency Adjustment |
| Total amounts of income and expense line items presented in the statement of financial performance in which the effects of fair value or cash flow hedges are recorded | $ | (607,686 | ) | | $ | 103,043 |
|
| Gain or (loss) on cash flow hedging relationships in Subtopic 815-20 | | | |
| Interest contracts | | | |
| Amount of gain or (loss) reclassified from accumulated other comprehensive income into income | $ | 181,221 |
| | $ | (1,283,667 | ) |
| Amount of gain or (loss) reclassified from accumulated other comprehensive income into income as a result that a forecasted transaction is no longer probable of occurring | $ | — |
| | $ | — |
|
As of March 31, 2019, none of the Company’s derivatives had a fair value in a net liability position.
Note 11— Revenue
The Company recognizes revenue when control of the promised good or service is transferred to the customer in an amount that the Company expects to be entitled in exchange for the good or service.
The following table presents the Company’s revenues disaggregated by revenue source for the three months ended March 31, 2019 and 2018:
|
| | | | | | | | | | | | | |
| | Three Months Ended March 31, |
| | 2019 | | 2018 |
| | $ | | % | | $ | | % |
| User pay revenue | $ | 35,825,109 |
| | 72.4 | % | | $ | 22,405,530 |
| | 59.5 | % |
| Advertising | 13,688,128 |
| | 27.6 | % | | 15,232,263 |
| | 40.5 | % |
| Total revenue | $ | 49,513,237 |
| | 100.0 | % | | $ | 37,637,793 |
| | 100.0 | % |
User Pay Revenue
User pay revenue is earned from in-app purchase products and subscriptions sold to mobile application and website users. The Company offers in-app products such as Credits, Points, Gold and Icebreakers (collectively, the “In-App Products”). Users purchase the In-App Products to exchange for the Company’s virtual products. The In-App Products allow users to engage with other users on the applications and in live video. They also put users in the spotlight, helping them get more attention from the community in order to meet more people faster. Platform users do not own the In-App Products but have a limited right to use the In-App Products on virtual products offered for sale on the Company’s platforms. In-App Products may be used to purchase virtual gifts for other users. These virtual gifts are received by other users and converted into Diamonds. Diamonds represent an intermediary currency that the Company manages. Diamonds can either be converted back into credits or may be used to claim rewards, including in some instances cash rewards. The In-App Products are not transferable, cannot be sold or exchanged outside of our platforms, are not redeemable for any sum of money, cannot be gifted to other users and can only be used on our platforms. The In-App Products are recorded in deferred revenue when purchased and recognized as revenue over time when: (i) the In-App Products are used by the customer; or (ii) the Company determines the likelihood of the In-App Products being redeemed by the customer is remote (breakage) and there is not a legal obligation to remit the unredeemed In-App Products to the relevant jurisdiction. The breakage rate is based upon Company-specific historical redemption patterns. Breakage is recognized in revenue as the In-App Products are used on a pro rata basis over a three or six-month period (life of the user) beginning at the date of the sale and are included in revenue in the condensed consolidated statements of operations and comprehensive income (loss). Breakage recognized during the three months ended March 31, 2019 and 2018 was $0.8 million and $0.7 million, respectively. For MeetMe+, Tagged, Skout and Lovoo subscription based products, the Company recognizes revenue over the term of the subscription.
Under ASC 606, user pay revenue has a single performance obligation. Subscriptions provide customers with premium access to the application and include credits on MeetMe+, while In-App Product purchases are satisfied by standing ready to allow users to exchange the In-App Products for virtual products. The consideration received for these services is fixed at the time of purchase. The customer simultaneously receives and consumes the benefits of user pay features as the Company performs the services. Revenue is recorded in deferred revenue when purchased by customer and recognized as revenue over time as the performance obligation is satisfied.
Advertising Revenue
Advertising revenue is comprised of mobile and web advertising. Within each revenue stream, the Company has one performance obligation to publish advertisements as specified by the respective contracts. The amount of consideration that the Company expects to receive for the services is variable based on the volume of advertisement impressions. The Company does not offer any discounts or free impressions and has not historically experienced any collectability issues.
The Company also recognizes revenue from cross-platform/social theater and cost-per-action (“CPA”) offers. Each of these revenue streams has one performance obligation. For cross-platform/social theater contracts, the consideration promised is fixed per ad campaign and term, and required services to be delivered. However, the monthly revenue could vary depending on the actual delivery of impressions throughout the contract term. These contracts are typically based on cost per thousand rates and number of impressions served due to traffic volume and the specific ad campaign. For CPA offers, the consideration promised is variable based on a revenue share rate, and/or based on the number of actions delivered per the agreement. As such, the Company recognizes all actual advertising revenues from impressions or actions delivered on a monthly basis rather than estimating revenue at the beginning of the period.
The Company has transactions with several partners that qualify for principal agent considerations. The Company recognizes revenue, net of amounts retained by the third-party partners, pursuant to revenue sharing agreements with advertising networks. The form of the agreements is such that the Company provides services in exchange for a fee. The Company determines only the fee for providing its services to advertising agencies and has no latitude in establishing prices with third party advertisers.
In instances where the Company works directly with an advertiser, revenue is recognized on a gross basis. The Company is the primary obligor in arrangements made with direct advertisers, as there is no third-party facilitating or managing the sales process. The Company is solely responsible for determining price, product or service specifications, and which advertisers to use. The Company assumes all credit risk in the sales arrangements made with direct advertisers.
The Company has determined that the performance obligation under the advertising revenue streams is recognized ratably over time utilizing the “Right to Invoice” practical expedient as customers simultaneously consume and receive benefits of the advertisement impressions.
Deferred Revenue
The Company records deferred revenue when the consideration for a good or service is received in advance of its performing the obligation. The deferred revenue balance for the three months ended March 31, 2019 increased $35.9 million due to subscription and in-app purchases consideration received in advance of providing the good or service to the customers. This amount was offset by $35.8 million revenue recognized from deferred revenue due to performance obligations satisfied during the three months ended March 31, 2019.
Note 12— Leases
The Company has operating leases for its corporate offices and data centers in the U.S. and Germany, and finance leases for certain data centers, printers and other furniture in its German offices. The Company's lease terms include options to extend or terminate the lease and the Company includes these options in the lease term when it is reasonably certain to exercise that option.
The Company determines, at the inception of a contract, if the arrangement is a lease and whether it meets the classification criteria for a finance or operating lease. ROU assets represent the Company's right to use an underlying asset during the lease term and lease liabilities represent the Company's obligation to make lease payments arising from the lease. ROU assets and lease liabilities are recognized at commencement date based on the present value of fixed lease payments over the lease term. ROU assets also include any advance lease payments and exclude lease incentives. As most of the Company's operating leases do not provide an implicit rate, the Company uses its incremental borrowing rate based on information available at commencement date in determining the present value of lease payments. Finance lease agreements generally include an interest rate that is used to determine the
present value of future lease payments. Operating fixed lease expense and finance lease depreciation expense are recognized on a straight-line basis over the lease term.
Operating Leases
The Company leases its operating facilities, data center storage facilities and certain data storage equipment in the U.S. and Germany under certain noncancelable operating leases that expire at various times through 2022. These leases are renewable at the Company’s option.
Capital Leases
The Company leases certain fixed assets under capital leases that expire at various times through 2021. The capital leases are for the Company’s computer equipment and printers in its German offices. Principal and interest are payable monthly at interest rates ranging from 4.7% to 7.0% per annum, rates varying based on the type of leased asset. The Company did not enter into any new capital lease agreements during the three months ended March 31, 2019.
The following table presents the Company’s lease costs for the three months ended March 31, 2019:
|
| | | |
| | Three Months Ended |
|
| | March 31, 2019 |
| Lease Costs: | |
| Operating lease cost* | $ | 725,236 |
|
| | |
| Finance lease cost: | |
| Amortization of right-of-use assets | $ | 1,518 |
|
| Interest on lease liabilities | 2,302 |
|
| Total finance lease cost | $ | 3,820 |
|
* Short term lease costs were immaterial.
Supplemental cash flow information is as follows:
|
| | | |
| | Three Months Ended |
|
| | March 31, 2019 |
| Cash paid for amounts included in the measurement of lease liabilities: | |
| Operating cash flows from operating leases | $ | 737,956 |
|
| Operating cash flows from finance leases | $ | 2,302 |
|
| Financing cash flows from finance leases | $ | 40,885 |
|
| | |
| Right-of-use assets obtained in exchange for lease obligations: | |
| Operating leases | $ | 4,069,656 |
|
The aggregate future lease payments for ROU assets and finance leases as of March 31, 2019 are as follows:
|
| | | | | | | | |
| For the Years Ending December 31, | | ROU Assets | | Financing |
| Remaining in 2019 | | $ | 1,236,231 |
| | $ | 116,383 |
|
| 2020 | | 1,140,568 |
| | 31,644 |
|
| 2021 | | 853,870 |
| | 4,710 |
|
| 2022 | | 318,345 |
| | — |
|
| 2023 | | 43,559 |
| | — |
|
| Thereafter | | — |
| | — |
|
| Total minimum lease payments | | $ | 3,592,573 |
| | $ | 152,737 |
|
| Less: amount representing interest | | 185,669 |
| | 4,195 |
|
| Total present value of minimum payments | | 3,406,904 |
| | 148,542 |
|
| Less: current portion | | $ | 1,432,077 |
| | $ | 133,442 |
|
| Long-term obligations | | $ | 1,974,827 |
| | $ | 15,100 |
|
Weighted average remaining lease terms and discount rates were as follows:
|
| | |
| Weighted average remaining lease term (years) | March 31, 2019 |
| Operating leases | 2.75 |
|
| Finance leases | 1.00 |
|
| | |
| Weighted average discount rate | |
| Operating leases | 3.9 | % |
| Finance leases | 5.7 | % |
ITEM 2. MANAGEMENT’S DISCUSSION AND ANALYSIS OF FINANCIAL CONDITION AND RESULTS OF OPERATIONS.
Cautionary Note Regarding Forward-Looking Statements
Management’s Discussion and Analysis of Financial Condition and Results of Operations (“MD&A”) is set forth below. Certain statements in this report may be considered to be “forward-looking statements” as that term is defined in the U.S. Private Securities Litigation Reform Act of 1995. In particular, these forward-looking statements include, among others, statements about:
| |
| • | Opportunities for our business; |
| |
| • | Growth of our business; and |
| |
| • | Anticipations and expectations regarding mobile usage and monetization. |
All statements other than statements of historical facts contained in this report, including statements regarding our future financial position, liquidity, business strategy, plans and objectives of management for future operations, are forward-looking statements. The words “believe,” “may,” “estimate,” “continue,” “anticipate,” “intend,” “should,” “plan,” “could,” “target,” “potential,” “is likely,” “expect” and similar expressions, as they relate to us, are intended to identify forward-looking statements. We have based these forward-looking statements largely on our current expectations and projections about future events and financial trends that we believe may affect our financial condition, results of operations, business strategy and financial needs.
Important factors that could cause actual results to differ from those in the forward-looking statements include users’ willingness to try new product offerings and engage in our App upgrades and new features, the risk that unanticipated events affect the functionality of our App with popular mobile operating systems, any changes in such operating systems that degrade our App’s functionality and other unexpected issues which could adversely affect usage on mobile devices, the risk that the mobile advertising
market will not grow, the ongoing existence of such demand and the willingness of our users to complete mobile offers or pay for Credits, Points, Gold and Icebreakers. Any forward-looking statement made by us in this report speaks only as of the date on which it is made. Factors or events that could cause our actual results to differ may emerge from time to time, and it is not possible for us to predict all of them. We undertake no obligation to publicly update any forward-looking statement, whether as a result of new information, future developments or otherwise, except as may be required by law.
You should read the following discussion in conjunction with our audited historical consolidated financial statements. MD&A contains forward-looking statements that reflect our plans, estimates, and beliefs. Our actual results could differ materially from those discussed in the forward-looking statements. Factors that could cause or contribute to these differences include those discussed elsewhere in “Risk Factors,” located at Part II, Item 1A of this report and in our Form 10-K for the year ended December 31, 2018. Additional risks that we do not presently know or that we currently believe are immaterial could materially and adversely affect any of our business, financial position, future results or prospects.
MD&A is provided as a supplement to and should be read in conjunction with our audited consolidated financial statements, and the MD&A included in our Annual Report on Form 10-K for the year ended December 31, 2018 (“Annual Report”), as well as our condensed consolidated financial statements and the accompanying notes included in this report.
Company Overview
The Meet Group, Inc. (the “Company,” “The Meet Group,” “us,” or “we”) is a portfolio of mobile social entertainment apps designed to meet the universal need for human connection. We leverage a powerful live-streaming video platform, empowering our global community to forge meaningful connections. Our primary apps are MeetMe®, LOVOO®, Skout®, Tagged® and, as of March 5, 2019, Growlr®.
We operate location-based social networks for meeting new people, primarily on mobile platforms, including on iPhone, Android, iPad and other tablets, that facilitate interactions among users and encourage users to connect, communicate and engage with each other. Over the past two years, we have transformed our business from an advertising based revenue model to one where the majority of our revenue is derived from user pay monetization and subscriptions. The fastest growing component of user pay monetization comes from in-app purchases, including virtual gifts associated with our live video product.
We began developing our live video platform in 2016 with the belief that we could successfully pair live-streaming and dating – a model that we had seen work effectively for Asian dating app providers. We first launched video on MeetMe early in 2017, and, in October of 2017, we began to monetize the feature by enabling gifting within the video streams. During this time period, we also executed on our strategy of acquiring other properties: Skout, Inc. (“Skout”), Ifwe Inc. (“if(we)”) and Lovoo GmbH (“Lovoo”) – where we believed our live-streaming platform would fit naturally. We then integrated live video into each app. We launched the monetized video platform on Skout in the fourth quarter of 2017, Tagged in the second quarter of 2018 and Lovoo beginning in the second quarter of 2018. We have also continued to add features and enhancements intended to drive video engagement and increase monetization for all the apps. Live video has become the fastest growing revenue product in our history.
We also offer online marketing capabilities, which enable marketers to display their advertisements on our apps. We offer significant scale to our advertising partners, with hundreds of millions of daily impressions across our active global user base, and sophisticated data science for effective targeting. We work with our advertisers and advertising networks to maximize the effectiveness of their campaigns by optimizing advertisement formats and placements.
Just as Facebook has established itself as the social network of friends and family, and LinkedIn as the social network of colleagues and business professionals, The Meet Group is creating the social entertainment network not of the people you know, but of the people you want to know. Nimble, fast-moving and already in more than 100 countries, we are challenging the dominant player in our space, Match Group, Inc., and differentiating ourselves with live video, which is not offered by many of our direct competitors. Modeled after the video products offered by Asian dating app providers, but enhanced in order to appeal to Western audiences, our live video product is aimed at the nexus of entertainment and community, where we believe our apps exhibit natural strength.
Our vision extends beyond dating and entertainment. We focus on building quality products to satisfy the universal need for human connection among all people, everywhere – not just paying subscribers. We believe meeting new people is a basic human need, especially for users aged 18-34, when so many long-lasting relationships are made. We use advanced technology to engineer serendipitous connections among people who otherwise might never have met – a sort of digital coffeehouse where everyone belongs. Over the years, The Meet Group’s apps have originated untold numbers of chats, shares, good friendships, dates, romantic relationships – even marriages.
We believe that we have significant growth opportunities enabled through our social entertainment platform. We believe our scale provides unique advantages to grow video monetization, while also establishing a high density of users within the geographic regions we serve. As The Meet Group’s networks grow and the number of users in a location increases, we believe that users who are seeking to meet new people will incrementally benefit from the quantity of relevant connections.
Operating Metrics
We measure website and application activity in terms of monthly active users (“MAUs”) and daily active users (“DAUs”). We define a MAU as a registered user of one of our platforms who has logged in and visited within the last month of measurement. We define a DAU as a registered user of one of our platforms who has logged in and visited within the day of measurement. For the quarters ended March 31, 2019 and 2018, the total MAUs were approximately 17.59 million and 16.17 million, respectively, and total DAUs were approximately 4.93 million and 4.85 million, respectively.
|
| | | | | |
| | Monthly Average for the Quarter Ended |
| | March 31, |
| | 2019 | | 2018 |
| MAU | 17,585,487 |
| | 16,167,271 |
|
|
| | | | | |
| | For the Quarter Ended |
| | March 31, |
| | 2019 | | 2018 |
| DAU | 4,931,223 |
| | 4,848,392 |
|
First Quarter of 2019 Highlights
| |
| • | Total revenue was $49.5 million for the first quarter of 2019, up 31.6% from $37.6 million in the first quarter of 2018. |
| |
| • | Net income for the first quarter of 2019 was $1.3 million. Adjusted EBITDA was $8.1 million for the first quarter of 2019. (See the important discussion about the presentation of non-GAAP financial measures, and reconciliation from the most directly comparable GAAP financial measures, below.) |
| |
| • | Cash and cash equivalents totaled $19.8 million at March 31, 2019. |
Trends in Our Metrics
In addition to MAUs and DAUs, we measure activity on the Company’s apps in terms of average revenue per user (“ARPU”) and average daily revenue per daily active user (“ARPDAU”). We define ARPU as the quarterly revenue per average MAU. We define ARPDAU as the average daily revenue per DAU. We define mobile MAU as a user who accessed our sites by one of our mobile applications or by the mobile optimized version of our websites for MeetMe, Skout and Lovoo, whether on a mobile phone or tablet during the month of measurement. We define a mobile DAU as a user who accessed our sites by one of our mobile applications or by the mobile optimized version of our websites for MeetMe, Skout and Lovoo, whether on a mobile phone or tablet during the day of measurement.
In the quarter ended March 31, 2019, the Company averaged 15.18 million mobile MAUs and 17.59 million total MAUs, compared to 13.64 million mobile MAUs and 16.17 million total MAUs in the quarter ended March 31, 2018, a net increase of 1.54 million or 11% for mobile MAUs and a net increase of 1.42 million or 9% for total MAUs. Mobile DAUs were 4.35 million for the quarter ended March 31, 2019, compared to 4.21 million mobile DAUs for the quarter ended March 31, 2018, a net increase of approximately 0.14 million total MAUs, or 3%. For the quarter ended March 31, 2019, the Company averaged 4.93 million total DAUs, compared to 4.85 million total DAUs for the quarter ended March 31, 2018, a net increase of approximately 0.08 million total DAUs, or 2%.

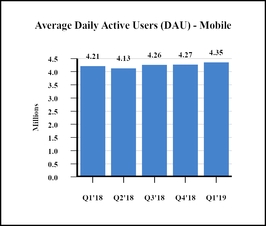
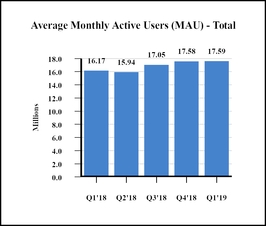
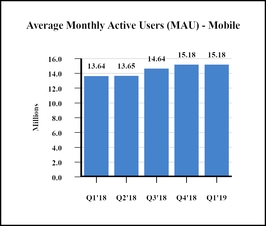
In the quarter ended March 31, 2019, the Company earned an average of $1.45 ARPU on the web and $2.89 ARPU on our mobile applications, compared to $1.55 ARPU on the web and $2.25 in mobile ARPU for the quarter ended March 31, 2018. In the quarter ended March 31, 2019, the Company earned an average of $0.084 in web ARPDAU and $0.112 in mobile ARPDAU, compared to $0.088 in web ARPDAU and $0.081 in mobile ARDAU for the quarter ended March 31, 2018.
Factors Affecting Our Performance
We believe the following factors affect our performance:
| |
| • | Number of MAUs and DAUs: We believe our ability to grow web and mobile MAUs and DAUs affects our revenue and financial results by influencing the number of advertisements we are able to show, the value of those advertisements, and the volume of subscriptions and in-app purchases, as well as our expenses and capital expenditures. |
| |
| • | User Engagement: We believe changes in user engagement patterns affect our revenue and financial performance. Specifically, the number of visits and the amount of time spent by each MAU or DAU generates affects the number of advertisements we are able to display and therefore the rate at which we are able to monetize our active user base. In addition, the number of users that make in-app purchases and the amounts that they purchase directly impact our revenue. We continue to create new features and enhance existing features to drive additional engagement. The percent of MAU and DAU that engage with our video products and their conversion to paying users also affects the amount of in-app purchase revenue we are able to earn. |
| |
| • | Advertising Rates: We believe our revenue and financial results are materially dependent on industry trends, and any changes to the revenue we earn per thousand advertising impressions could affect our revenue and financial results. In 2017 we experienced declining advertising rates, which negatively affected our revenue. In 2018, we saw some stabilization in advertising rates and a return to normal seasonality in advertising trends. We expect to continue investing in new types of advertising and new placements. Additionally, we are prioritizing initiatives that generate revenue directly from users, including new in-app purchases products and a premium subscription product, in part to reduce our dependency on advertising revenue. |
| |
| • | User Geography: The geography of our users influences our revenue and financial results because we currently monetize users in distinct geographies at varying average rates. For example, ARPU in the U.S. and Canada is significantly higher than in Latin America. |
| |
| • | New User Sources: The percentage of our new users that are acquired through inorganic, paid sources impacts our financial performance, specifically with regard to ARPU for web and mobile. Inorganically acquired users tend to have lower engagement rates, tend to generate fewer visits and ad impressions and tend to be less likely to make in-app purchases. When paid marketing campaigns are ongoing, our overall usage and traffic increases due to the influx of inorganically acquired users, but the rate at which we monetize the average active user overall declines as a result. |
| |
| • | Ad Inventory Management: Our revenue trends are affected by advertisement inventory management changes affecting the number, size, or prominence of advertisements we display. In general, more prominently displayed advertising units generate more revenue per impression. Our Social Theater campaign expenses are materially dependent on the percentage of Social Theater campaigns that run on MeetMe versus the percentage that run on other networks. We work to maximize the share of Social Theater campaigns that run on MeetMe and run campaigns on other networks only when necessary. |
| |
| • | Google Play Store and Apple App Store: Our mobile applications are distributed through the Google Play Store and the Apple App Store. Our business will suffer if we are unable to maintain good relationships with Google and Apple, if their terms and conditions or pricing change to our detriment, if we violate, or either company believes that we have violated, its terms and conditions, or if either of these platforms are unavailable for a prolonged period of time. |
| |
| • | Increased Social Theater Competition: A significant portion of the revenue generated by the Social Theater is derived from advertising campaigns, powered by Social Theater technology, that run on networks other than The Meet Group networks. A recent increase in competitors offering similar technology solutions, and in some cases their own cross-platform distribution networks, has made it more difficult to compete on price and win business. We expect this downward pressure on price to continue and impact our operating results in the future. |
| |
| • | Seasonality: Historically, advertising spending has traditionally been seasonal with a peak in the fourth quarter of each year. With the decline in advertising rates in 2017, we did not experience this seasonality consistent with prior years. In 2018, we saw some stabilization in advertising rates and a return to normal seasonality in advertising trends. We believe that this seasonality in advertising spending affects our quarterly results, which historically have reflected a growth in advertising revenue between the third and fourth quarters and a decline in advertising spending between the fourth and subsequent first and second quarters each year. Growth trends in web and mobile MAUs and DAUs affect our revenue and financial results by influencing the number of advertisements we are able to show, the value of those advertisements, the volume of payments transactions, as well as our expenses and capital expenditures. |
| |
| • | Business Combinations: Acquisitions have been an important part of our growth strategy. During the two years in the period ended December 31, 2017, we acquired three companies (Skout, if(we) and Lovoo), representing four significant brands for our portfolio (Skout, Tagged, Hi5 and Lovoo). We also acquired Growlr in March 2019. Our ability to integrate acquired apps into our portfolio will impact our financial performance. As a consequence of the contributions of these businesses and acquisition-related expenses, our consolidated results of operations may not be comparable between periods. |
Growth trends in web and mobile MAUs and DAUs affect our revenue and financial results by influencing the number of advertisements we are able to show, the value of those advertisements, the volume of payments transactions, as well as our expenses and capital expenditures.
Changes in user engagement patterns from web to mobile, international diversification and the rollout of our live video product also affect our revenue and financial performance. We believe that overall engagement as measured by the percentage of users who create content (such as video broadcasts, status posts, messages, or photos) or generate feedback increases as our user base grows. We continue to create new and improved features to drive social sharing and increase monetization.
We believe our revenue trends are also affected by advertisement inventory management changes affecting the number, size, or prominence of the advertisements we display and traditional seasonality. Social Theater is a revenue product for the MeetMe platform and on third-party sites. Social Theater growth may be affected by large brand penetration, the ability to grow the advertiser base, and advertiser spending budgets.
Critical Accounting Policies and Estimates
Our critical accounting policies and estimates are described in Part II, Item 7, “Management’s Discussion and Analysis of Financial Condition and Results of Operations” of our Annual Report, filed with the SEC on March 8, 2019. We believe there have been no new critical accounting policies or material changes to our existing critical accounting policies and estimates during the three months ended March 31, 2019, compared to those discussed in our Annual Report, except for our adoption of the new lease standard.
Leases
We determine, at the inception of a contract, if the arrangement is a lease and whether it meets the classification criteria for a finance or operating lease. Right-of-use (“ROU”) assets represent our right to use an underlying asset during the lease term and lease liabilities represent our obligation to make lease payments arising from the lease. ROU assets and lease liabilities are recognized at commencement date based on the present value of fixed lease payments over the lease term. ROU assets also include any advance lease payments and exclude lease incentives. As most of our operating leases do not provide an implicit rate, we use our incremental borrowing rate based on information available at commencement date in determining the present value of lease payments. Finance lease agreements generally include an interest rate that is used to determine the present value of future lease payments. Operating fixed lease expense and finance lease depreciation expense are recognized on a straight-line basis over the lease term.
Recent Accounting Pronouncements
For detailed information regarding recently issued accounting pronouncements and the expected impact on our financial statements, see Note 1— Description of Business, Basis of Presentation and Summary of Significant Accounting Policies in the accompanying notes to the condensed consolidated financial statements included in this Quarterly Report on Form 10-Q.
Results of Operations
Comparison of the three months ended March 31, 2019 and 2018
The following table sets forth our condensed consolidated statements of operations for the three months ended March 31, 2019 and 2018 that is used in the following discussions of our results of operations:
|
| | | | | | | | | | | | | | |
| | Three Months Ended March 31, | | Change From Prior Year |
| | 2019 | | 2018 | | ($) | | % |
| Revenues | $ | 49,513,237 |
| | $ | 37,637,793 |
| | $ | 11,875,444 |
| | 31.6 | % |
| Operating costs and expenses: | | | | | | | |
| Sales and marketing | 7,840,866 |
| | 7,047,993 |
| | 792,873 |
| | 11.2 | % |
| Product development and content | 31,123,375 |
| | 22,101,537 |
| | 9,021,838 |
| | 40.8 | % |
| General and administrative | 4,927,782 |
| | 5,469,178 |
| | (541,396 | ) | | (9.9 | )% |
| Depreciation and amortization | 3,198,104 |
| | 3,629,603 |
| | (431,499 | ) | | (11.9 | )% |
| Acquisition and restructuring | 478,995 |
| | 3,349,951 |
| | (2,870,956 | ) | | (85.7 | )% |
| Total operating costs and expenses | 47,569,122 |
| | 41,598,262 |
| | 5,970,860 |
| | 14.4 | % |
| Income (loss) from operations | 1,944,115 |
| | (3,960,469 | ) | | 5,904,584 |
| | 149.1 | % |
| Other income (expense): | | | | | | | |
| Interest income | 32,389 |
| | 7,208 |
| | 25,181 |
| | 349.3 | % |
| Interest expense | (402,864 | ) | | (607,686 | ) | | 204,822 |
| | 33.7 | % |
| Gain (loss) on foreign currency transactions | (65,209 | ) | | 103,043 |
| | (168,252 | ) | | (163.3 | )% |
| Other | 3,549 |
| | (6,944 | ) | | 10,493 |
| | 151.1 | % |
| Total other expense | (432,135 | ) | | (504,379 | ) | | 72,244 |
| | 14.3 | % |
| Income (loss) before income tax benefit (expense) | 1,511,980 |
| | (4,464,848 | ) | | 5,976,828 |
| | 133.9 | % |
| Income tax benefit (expense) | (254,381 | ) | | 252,187 |
| | (506,568 | ) | | (200.9 | )% |
| Net income (loss) | $ | 1,257,599 |
| | $ | (4,212,661 | ) | | $ | 5,470,260 |
| | 129.9 | % |
Revenues
Our revenues were approximately $49.5 million for the three months ended March 31, 2019, an increase of $11.9 million or 31.6% compared to $37.6 million for the three months ended March 31, 2018. The following table presents our revenues disaggregated by revenue source for the three months ended March 31, 2019 and 2018:
|
| | | | | | | | | | | | | |
| | Three Months Ended March 31, |
| | 2019 | | 2018 |
| | $ | | % | | $ | | % |
| User pay revenue | $ | 35,825,109 |
| | 72.4 | % | | $ | 22,405,530 |
| | 59.5 | % |
| Advertising | 13,688,128 |
| | 27.6 | % | | 15,232,263 |
| | 40.5 | % |
| Total revenue | $ | 49,513,237 |
| | 100.0 | % | | $ | 37,637,793 |
| | 100.0 | % |
The increase in revenue is attributable to a $13.4 million increase in user pay revenue, partially offset by a $1.5 million decrease in advertising revenue. The increase in user pay revenue is attributed to the adoption of Tagged Live at the end of the first quarter of 2018 and Lovoo Live starting to rollout in the second quarter of 2018. The increase in user pay revenue is also attributable to growth in revenue on MeetMe Live and Skout Live in the three months ended March 31, 2019 compared to the three months ended March 31, 2018. The decrease in ad revenue is primarily due to the decrease in the number of advertising impressions for the three months ended March 31, 2019 compared to the three months ended March 31, 2018.
Operating Costs and Expenses
Sales and Marketing: Sales and marketing expenses increased approximately $0.8 million, or 11.2%, to $7.8 million for the three months ended March 31, 2019 from $7.0 million for the three months ended March 31, 2018. The net increase in sales and marketing expenses is due to increased advertising spend of approximately $0.8 million to attract more users to the apps.
Product Development and Content: Product development and content expenses increased approximately $9.0 million, or 40.8%, to $31.1 million for the three months ended March 31, 2019 from $22.1 million for the three months ended March 31, 2018. The net increase in product development and content expense is attributable to increases in mobile content costs of $9.4 million, partially offset by a decrease in social theater expenses of $0.4 million. The increase in mobile content costs is due to the adoption of Tagged Live at the end of the first quarter of 2018 and Lovoo Live starting to rollout in the second quarter of 2018 as well as growth in revenue on MeetMe Live and Skout Live.
General and Administrative: General and administrative expenses decreased $0.6 million or 9.9%, to $4.9 million for the three months ended March 31, 2019 from $5.5 million for the three months ended March 31, 2018. The net decrease in general and administrative expense is primarily due to decreases in office related expenses of approximately $0.3 million, travel related costs of $0.1 million and employee expenses of $0.1 million. The decrease in office related expenses is mainly due to the lower facilities costs after closing one of our offices in San Francisco, CA at the end of March 2018.
Depreciation and Amortization: Depreciation and amortization expenses decreased $0.4 million or 11.9%, to $3.2 million for the three months ended March 31, 2019 from $3.6 million for the three months ended March 31, 2018. The decrease in depreciation and amortization expense is primarily attributable to lower amortization of intangibles related to the if(we) Acquisition and the Lovoo Acquisition, partially offset by the amortization of the intangibles related to the Growlr Acquisition.
Acquisition and Restructuring: Acquisition and restructuring expenses decreased $2.8 million or 85.7%, to $0.5 million for the three months ended March 31, 2019 from $3.3 million for the three months ended March 31, 2018. Acquisition and restructuring costs include the employee retention bonuses in connection with the acquisitions, employee related restructuring costs, the accrual of the exit cost of non-cancellable leases and employee exit and relocation costs. The decrease in acquisition and restructuring costs is mainly due to a decrease in severance costs, partially offset by transaction costs from the Growlr Acquisition of approximately $0.3 million.
Comparison of Stock-Based Compensation and Income Taxes
Stock Based Compensation
Stock-based compensation expense, included in the operating expense by category, increased approximately $0.2 million to $2.4 million for the three months ended March 31, 2019 from $2.2 million for the three months ended March 31, 2018. Stock-based compensation expense represented 5.1% and 5.2% of operating expenses for the three months ended March 31, 2019 and 2018, respectively.
As of March 31, 2019, there was approximately $1.4 million, $10.6 million and $1.3 million of total unrecognized compensation cost which is expected to be recognized over a weighted-average vesting period of approximately of 1.0 year, 1.7 years and 2.1 years relating to stock options, RSAs and PSUs, respectively.
|
| | | | | | | | | | | |
| | Three Months Ended March 31, | | Change from Prior Year |
| | 2019 | | 2018 | | ($) |
| Sales and marketing | $ | 70,175 |
| | $ | 118,547 |
| | $ | (48,372 | ) |
| Product development and content | 1,499,393 |
| | 1,114,067 |
| | 385,326 |
|
| General and administrative | 855,149 |
| | 936,311 |
| | (81,162 | ) |
| Total stock-based compensation expense | $ | 2,424,717 |
| | $ | 2,168,925 |
| | $ | 255,792 |
|
Interest Expense
Interest expense decreased approximately $0.2 million to $0.4 million for the three months ended March 31, 2019 from $0.6 million for the three months ended March 31, 2018. The decrease in interest expense is due to a lower debt balance, partially offset by a higher effective interest rate during the three months ended March 31, 2019.
Income Tax Benefit (Expense)
Income tax expense was $0.3 million for the three months ended March 31, 2019, compared to a benefit of $0.3 million for the three months ended March 31, 2018. For the three months ended March 31, 2019, our ETR from operations was 16.8%, compared to (5.6)% for the three months ended March 31, 2018. The difference between our ETR and the current U.S. statutory rate of 21%, as well as the difference in the ETR for the three months ended March 31, 2019 compared to the three months ended March 31, 2018, are primarily related to permanent addback items and the difference in tax rates between the U.S. and Germany, partially offset by excess benefits on stock-based compensation.
Liquidity and Capital Resources
|
| | | | | | | |
| | Three Months Ended March 31, |
| | 2019 | | 2018 |
| Net cash provided by operating activities | $ | 3,362,915 |
| | $ | 7,435,472 |
|
| Net cash used in investing activities | (12,090,566 | ) | | (172,642 | ) |
| Net cash provided by (used in) financing activities | 234,137 |
| | (3,915,917 | ) |
| | $ | (8,493,514 | ) | | $ | 3,346,913 |
|
Net cash provided by operations was approximately $3.4 million for the three months ended March 31, 2019 compared to approximately $7.4 million for the three months ended March 31, 2018.
For the three months ended March 31, 2019, net cash provided by operations consisted primarily of net income of approximately $1.3 million adjusted for certain non-cash expenses of approximately $3.2 million of depreciation and amortization expense, $2.4 million related to stock-based compensation expense, $0.7 million of amortization of right-of-use assets and $0.3 million of bad debt expense. Additionally, changes in working capital decreased net cash provided by operations. These changes included decreases in accounts payable and accrued liabilities of $5.0 million and increases of $0.8 million in prepaid expenses, other current assets and other assets, offset by a decrease in accounts receivable of approximately $1.2 million resulting from collections.
Net cash used in investing activities in the three months ended March 31, 2019 was primarily due to the Growlr Acquisition of approximately $11.8 million and $0.3 million of capital expenditures for computer equipment to increase capacity and improve performance.
Net cash provided by financing activities in the three months ended March 31, 2019 of approximately $0.2 million was due to $7.0 million of proceeds from borrowings from our Revolving Credit Facility and $0.7 million of proceeds from the exercise of stock options. These proceeds were partially offset by $7.3 million of debt payments and $0.1 million of payments for restricted stock awards withheld for taxes.
|
| | | | | | | |
| | March 31,
2019 | | December 31,
2018 |
| Cash and cash equivalents | $ | 19,811,733 |
| | $ | 28,365,725 |
|
| Total assets | $ | 271,384,598 |
| | $ | 267,852,169 |
|
| Percentage of total assets | 7.3 | % | | 10.6 | % |
Our cash balances are kept liquid to support our growing infrastructure needs for operational expansion. The majority of our cash is concentrated in two large financial institutions.
As of March 31, 2019, we had positive working capital of approximately $5.9 million.
On September 18, 2017, in connection with the Lovoo Acquisition, we entered into an Amended and Restated Credit Agreement with the several banks and other financial institutions party thereto and JPMorgan Chase Bank, N.A., as the Agent, amending and restating the Credit Agreement, dated March 3, 2017. The Amended and Restated Credit Agreement provides a Revolving Credit Facility for $20.0 million and a Term Loan Facility of $60.0 million. On October 18, 2017, we drew down $60.0 million from our Term Loan Facility in connection with the Lovoo Acquisition. Fees and direct costs incurred when the Company entered into the Credit Facilities were $0.6 million. Fees and direct costs incurred are offset against long-term debt on the accompanying condensed consolidated balance sheets.
On March 7, 2018, we entered into an amendment to the Amended and Restated Credit Agreement, that among other things, amends the definition of “Applicable Rate” and “EBITDA” and makes certain changes to the financial covenants. On July 27, 2018, we entered into an amendment to the Amended and Restated Credit Agreement that amends our obligation to use certain of our excess cash flow to prepay our obligations under the Credit Agreement by limiting the applicable period for the fiscal year ended December 31, 2017 to the period commencing October 31, 2017 and ended December 31, 2017. In conjunction with this amendment, we made an excess cash flow principal payment of approximately $4.3 million in the third quarter of 2018. See Note 6— Long-Term Debt for details on an amendment to the Amended and Restated Credit Agreement.
In March 2019, we made an excess cash flow payment of $3.6 million related to the fiscal year end December 31, 2018. On March 5, 2019, in connection with the Growlr Acquisition, as discussed in Note 2— Acquisitions, the Company drew down $7.0 million from our Revolving Credit Facility. Borrowings on the Revolving Credit Facility are included in long-term debt, less current portion, net on the accompanying condensed consolidated balance sheets.
We intend to use the remaining proceeds of the Revolving Credit Facility to finance working capital needs and for general corporate purposes. Amounts under the Revolving Credit Facility may be borrowed, repaid and re-borrowed from time to time until the maturity date of the Credit Agreement on September 18, 2020. The Term Loan Facility is subject to quarterly payments of principal in an amount equal to $3,750,000 commencing December 31, 2017 and continuing through maturity. At our election, loans made under the Credit Facilities will bear interest at either (i) Base Rate plus an applicable margin or (ii) LIBO Rate plus an applicable margin, subject to adjustment if an event of default under the Amended and Restated Credit Agreement has occurred and is continuing. The Base Rate means the highest of (a) the Agent’s “prime rate,” (b) the federal funds effective rate plus 0.50% and (c) the LIBO Rate for an interest period of one month plus 1%. The Company’s Guarantors will guarantee the obligations of the Company and its subsidiaries under the Credit Facilities. The obligations of us under the Credit Facilities are secured by all of the assets of us and the Guarantors, subject to certain exceptions and exclusions as set forth in the Amended and Restated Credit Agreement and other loan documents.
As of March 31, 2019, we had an outstanding balance of $29.6 million on our Term Loan Facility. The weighted average interest rate at March 31, 2019 was 6.31%. Remaining unamortized fees and direct costs incurred for our Credit Facilities were $0.2 million. As of March 31, 2019, we had an outstanding balance of $7.0 million on our Revolving Credit Facility.
We did not enter into any new capital lease agreements for the three months ended March 31, 2019. As of March 31, 2019, capital leases that were previously assumed in connection with the Lovoo Acquisition had approximately $0.1 million in principal amount of capital lease indebtedness, all of which are due by 2021.
We have budgeted capital expenditures of approximately $2.2 million for the remainder of 2019, which we believe will support our growth of domestic and international business through increased capacity, performance improvement and expanded content.
Off-Balance Sheet Arrangements
As of March 31, 2019, we did not have any relationships with unconsolidated entities or financial partners, such as entities often referred to as structured finance or special purpose entities, established for the purpose of facilitating off-balance sheet arrangements or other contractually narrow or limited purposes. As such, we are not materially exposed to any financing, liquidity, market or credit risk that could arise if we had engaged in such relationships.
Non-GAAP - Financial Measure
The following discussion and analysis includes both financial measures in accordance with GAAP, as well as Adjusted EBITDA, which is a non-GAAP financial measure. Generally, a non-GAAP financial measure is a numerical measure of a company’s performance, financial position or cash flows that either excludes or includes amounts that are not normally included or excluded in the most directly comparable measure calculated and presented in accordance with GAAP. Non-GAAP financial measures should be viewed as supplemental to, and should not be considered as alternatives to, net income, operating income and cash flow from operating activities, liquidity or any other financial measures. They may not be indicative of our historical operating results nor are they intended to be predictive of potential future results. Investors should not consider non-GAAP financial measures in isolation or as substitutes for performance measures calculated in accordance with GAAP.
We believe that both management and stockholders benefit from referring to Adjusted EBITDA in planning, forecasting and analyzing future periods. We use this non-GAAP financial measure in evaluating our financial and operational decision making and as a means to evaluate period-to-period comparison.
We define Adjusted EBITDA as earnings (or loss) from operations before interest expense, benefit or provision for income taxes, depreciation and amortization, stock-based compensation, changes in warrant obligations, nonrecurring acquisition, restructuring or other expenses, gain or loss on disposals of assets, gain or loss on foreign currency transactions and goodwill and long-lived asset impairment charges, if any. We exclude stock-based compensation because it is non-cash in nature. We believe Adjusted EBITDA is an important measure of our operating performance because it allows management, investors, and analysts to evaluate and assess our core operating results from period to period after removing the impact of acquisition related costs, and other items of a non-operational nature that affect comparability. We recognize that Adjusted EBITDA has inherent limitations because of the excluded items.
We have included a reconciliation of our net (loss) income, which is the most comparable financial measure calculated in accordance with GAAP, to Adjusted EBITDA. We believe that providing this non-GAAP financial measure, together with the reconciliation from GAAP, helps investors make comparisons between us and other companies. In making any comparisons to other companies, investors need to be aware that companies use different non-GAAP measures to evaluate their financial performance. Investors should pay close attention to the specific definition being used and to the reconciliation between such measure and the corresponding GAAP measure provided by each company under applicable SEC rules.
The following table presents a reconciliation of net income (loss), a GAAP financial measure, to Adjusted EBITDA:
|
| | | | | | | |
| | Three Months Ended March 31, |
| ADJUSTED EBITDA | 2019 | | 2018 |
| Net income (loss) | $ | 1,257,599 |
| | $ | (4,212,661 | ) |
| Interest expense | 402,864 |
| | 607,686 |
|
| Income tax (benefit) expense | 254,381 |
| | (252,187 | ) |
| Depreciation and amortization | 3,198,104 |
| | 3,629,603 |
|
| Stock-based compensation expense | 2,424,717 |
| | 2,168,925 |
|
| Acquisition and restructuring | 478,995 |
| | 3,349,951 |
|
| (Gain) loss on foreign currency transactions | 65,209 |
| | (103,043 | ) |
| ADJUSTED EBITDA | $ | 8,081,869 |
| | $ | 5,188,274 |
|
Item 3. QUANTITATIVE AND QUALITATIVE DISCLOSURES ABOUT MARKET RISK.
The primary objective of our investment activities is to preserve principal while at the same time maximizing yields without significantly increasing risk. Our cash balance as of March 31, 2019 was held in insured depository accounts, of which $14.3 million exceeded insurance limits.
Item 4. CONTROLS AND PROCEDURES
Evaluation of Disclosure Controls and Procedures.
With the participation of our Chief Executive Officer and Chief Financial Officer, we have evaluated the effectiveness of our disclosure controls and procedures (as such term is defined in Rules 13a-15(e) and 15d-15(e) under the Securities Exchange Act of 1934), as of the end of the period covered by this report. Based upon such evaluation, our Chief Executive Officer and Chief Financial Officer have concluded that our disclosure controls and procedures are effective as of the end of the period covered by this report.
Changes in Internal Controls Over Financial Reporting
There was no change in our internal control over financial reporting that occurred during the fiscal quarter ended March 31, 2019, noted during the evaluation of controls as of the end of the period covered by this report, that has materially affected, or is reasonably likely to materially affect, our internal control over financial reporting.
Limitations on the Effectiveness of Controls
A control system, no matter how well designed and operated, can provide only reasonable, not absolute, assurance that the control system’s objectives will be met. The Company’s management, including its Principal Executive Officer and its Principal Financial Officer, do not expect that the Company’s disclosure controls will prevent or detect all errors and all fraud. Further, the design of a control system must reflect the fact that there are resource constraints, and the benefits of controls must be considered relative to their costs. Because of the inherent limitations in all control systems, no evaluation of controls can provide absolute assurance that all control issues and instances of fraud, if any, within the Company have been detected. These inherent limitations include the realities that judgments in decision-making can be faulty, and that breakdowns can occur because of simple error or mistake. Controls can also be circumvented by the individual acts of some persons, by collusion of two or more people, or by management override of the controls. The design of any system of controls is based in part upon certain assumptions about the likelihood of future events, and there can be no assurance that any design will succeed in achieving its stated goals under all potential future conditions. Over time, controls may become inadequate because of changes in conditions or deterioration in the degree of compliance with associated policies or procedures. Because of the inherent limitations in a cost-effective control system, misstatements due to error or fraud may occur and not be detected.
PART II. OTHER INFORMATION
Item 1. Legal Proceedings
From time to time, we are party to certain legal proceedings that arise in the ordinary course and are incidental to our business. There are currently no such pending proceedings to which we are a party that our management believes will have a material adverse effect on the Company’s consolidated financial position or results of operations. However, future events or circumstances, currently unknown to management, will determine whether the resolution of pending or threatened litigation or claims will ultimately have a material effect on our consolidated financial position, liquidity or results of operations in any future reporting periods. See Note 7— Commitments and Contingencies to the unaudited condensed consolidated financial statements contained in this report for information on specific matters.
Item 1A. Risk Factors
Our Annual Report on Form 10-K for the year ended December 31, 2018 filed with the SEC on March 8, 2019 includes detailed discussions of our risk factors under the headings “Part I, Item 1A. Risk Factors” and “Part II, Item 1A. Risk Factors” respectively. You should carefully consider the risk factors discussed in our Annual Report on Form 10-K, as well as the other information in this report, which could materially harm our business, financial condition, results of operations or the value of our common shares.
Item 2. Unregistered Sales of Equity Securities and Use of Proceeds
Not applicable.
Item 3. Defaults upon Senior Securities
Not applicable.
Item 4. Mine Safety Disclosures.
Not applicable.
Item 5. Other Information
Acquisition of Podcoin Mobile Application
On April 1, 2019, a subsidiary of the Company acquired the Podcoin mobile application and related assets from Violet Moon, LLC. The purchase price was $0, and the Company assumed liabilities related to coin balances of the app's users of approximately $41,000. Podcoin offers loyalty points to podcast listeners and aims to foster community around shared interests by bringing social elements to podcast listening. Violet Moon is owned by Geoff Cook and his wife, Kerri Cook.
Item 6. EXHIBITS
|
| | | | | | | | | | |
| | | | | | | | | | | Filed or Furnished Herewith |
| | | | | Incorporated by Reference | |
| Exhibit No. | | Exhibit Description | | Form | | Date | | Number | |
| | Certification of Principal Executive Officer (Section 302) | | | | | | | | Filed |
| | Certification of Principal Financial Officer (Section 302) | | | | | | | | Filed |
| | Certification of Principal Executive Officer (Section 906) | | | | | | | | Furnished* |
| | Certification of Principal Financial Officer (Section 906) | | | | | | | | Furnished* |
| 101.INS | | XBRL Instance Document | | | | | | | | ** |
| 101.SCH | | XBRL Taxonomy Extension Schema Document | | | | | | | | ** |
| 101.CAL | | XBRL Taxonomy Extension Calculation Linkbase Document | | | | | | | | ** |
| 101.DEF | | XBRL Taxonomy Extension Definition Linkbase Document | | | | | | | | ** |
| 101.LAB | | XBRL Taxonomy Extension Label Linkbase Document | | | | | | | | ** |
| 101.PRE | | XBRL Taxonomy Extension Presentation Linkbase Document | | | | | | | | ** |
* This exhibit is being furnished rather than filed and shall not be deemed incorporated by reference into any filing, in accordance with Item 601 of Regulation S-K.
** Attached as Exhibit 101 to this report are the Company’s financial statements for the quarter ended March 31, 2019 formatted in XBRL (eXtensible Business Reporting Language). The XBRL-related information in Exhibit 101 in this report shall not be deemed “filed” or a part of a registration statement or prospectus for purposes of Sections 11 or 12 of the Securities Act of 1933, and is not filed for purposes of Section 18 of the Securities Exchange Act of 1934, or otherwise subject to the liabilities of those sections.
SIGNATURES
Pursuant to the requirements of the Securities Exchange Act of 1934, the registrant has duly caused this report to be signed on its behalf by the undersigned hereunto duly authorized.
|
| | |
| | THE MEET GROUP, INC. |
| | | |
| May 9, 2019 | By: | /s/Geoffrey Cook |
| | | Geoffrey Cook |
| | | Chief Executive Officer |
| | | (Principal Executive Officer) |
| | | |
| May 9, 2019 | By: | /s/ James Bugden |
| | | James Bugden |
| | | Chief Financial Officer |
| | | (Principal Financial Officer) |