UNITED STATES |
SECURITIES AND EXCHANGE COMMISSION |
WASHINGTON, DC 20549 |
| | | |
| |
Form 10-K |
| (Mark One) |
x | ANNUAL REPORT PURSUANT TO SECTION 13 OR 15(d) OF THE SECURITIES EXCHANGE ACT OF 1934 |
| | |
| | For the fiscal year ended June 30, 2013 |
or |
| | |
o | TRANSITION REPORT PURSUANT TO SECTION 13 OR 15(d) OF THE SECURITIES EXCHANGE ACT OF 1934 |
Commission file number: 001-35413 |
| | | |
| |
Greenway Medical Technologies, Inc. |
| (Exact name of registrant as specified in its charter) |
Delaware | | 58-2412516 |
| (State or Other Jurisdiction of | | (I.R.S. Employer |
| Incorporation or Organization) | | Identification No.) |
| | | |
100 Greenway Boulevard | | |
Carrollton, GA | | 30117 |
| (Address of Principal Executive Offices) | | (Zip Code) |
(770) 836-3100 |
| (Registrant’s telephone number, including area code) |
| |
Securities registered pursuant to Section 12(b) of the Act: |
| | | | | Name of Each Exchange on Which Registered |
| Common Stock, par value $0.0001 per share | | New York Stock Exchange |
Securities registered pursuant to Section 12(g) of the Act: |
None |
| | | |
Indicate by check mark if the registrant is a well-known seasoned issuer, as defined in Rule 405 of the Securities Act. YesoNox
Indicate by check mark if the registrant is not required to file reports pursuant to Section 13 or Section 15(d) of the Act. YesoNox
Indicate by check mark whether the registrant (1) has filed all reports required to be filed by Section 13 or 15(d) of the Securities Exchange Act of 1934 during the preceding 12 months (or for such shorter period that the registrant was required to file such reports), and (2) has been subject to such filing requirements for the past 90 days. YesxNoo
Indicate by check mark whether the registrant has submitted electronically and posted on its corporate Web site, if any, every Interactive Data File required to be submitted and posted pursuant to Rule 405 of Regulation S-T (Section 232.405 of this chapter) during the preceding 12 months (or for such shorter period that the registrant was required to submit and post such files). YesxNoo
Indicate by check mark if disclosure of delinquent filers pursuant to Item 405 of Regulation S-K (§229.405 of this chapter) is not contained herein, and will not be contained, to the best of the registrant’s knowledge, in definitive proxy or information statements incorporated by reference in Part III of this Form 10-K or any amendment to this Form 10-K.x
Indicate by check mark whether the registrant is a large accelerated filer, an accelerated filer, a non-accelerated filer, or a smaller reporting company. See the definitions of “large accelerated filer,” “accelerated filer” and “smaller reporting company” in Rule 12b-2 of the Exchange Act. (Check one):
| | | | | |
| Large accelerated filer | o | | Accelerated filer | x |
| | | | | |
| Non-accelerated filer | o | (Do not check if a smaller reporting company) | Smaller reporting company | o |
Indicate by check mark whether the registrant is a shell company (as defined in Rule 12b-2 of the Exchange Act). YesoNox
The aggregate market value of the voting stock held by non-affiliates of the registrant on December 31, 2012, the last business day of the registrant’s most recently completed second fiscal quarter was $221,838,000 based on the closing price on the New York Stock Exchange on December 31, 2012 of $15.36 per share.
The number of outstanding shares of the registrant’s common stock, par value $0.0001 per share, as of September 10, 2013 was 29,812,849.
| | | |
| |
DOCUMENTS INCORPORATED BY REFERENCE |
Items 10, 11, 12, 13 and 14 of Part III of this Annual Report on Form 10-K incorporate information by reference from the registrant’s definitive proxy statement to be filed in connection with the registrant’s 2013 Annual Meeting of Stockholders or an amendment to this Annual Report on Form 10-K to be filed with the Securities and Exchange Commission within 120 days after the close of the fiscal year covered by this Annual Report on Form 10-K.
GREENWAY MEDICAL TECHNOLOGIES, INC.
FORM 10-K—ANNUAL REPORT
For the Fiscal Year Ended June 30, 2013
Table of Contents
| | | |
| | | Page |
| | | |
PART I | | |
| Item 1. Business | | 3 |
| Item 1A. Risk Factors | | 19 |
| Item 1B. Unresolved Staff Comments | | |
| Item 2. Properties | | 30 |
| Item 3. Legal Proceedings | | 30 |
| Item 4. Mine Safety Disclosures | | 30 |
PART II | | |
| Item 5. Market for Registrant’s Common Equity, Related Stockholder Matters and Issuer Purchases of Equity Securities | | 31 |
| Item 6. Selected Financial Data | | 34 |
| Item 7. Management’s Discussion and Analysis of Financial Condition and Results of Operations | | 36 |
| Item 7A. Quantitative and Qualitative Disclosures about Market Risk | | 52 |
| Item 8. Financial Statements and Supplementary Data | | 52 |
| Item 9. Changes in and Disagreements with Accountants on Accounting and Financial Disclosure | | 52 |
| Item 9A. Controls and Procedures | | 52 |
| Item 9B. Other Information | | 53 |
PART III | | |
| Item 10. Directors, Executive Officers and Corporate Governance | | 53 |
| Item 11. Executive Compensation | | 53 |
| Item 12. Security Ownership of Certain Beneficial Owners and Management and Related Stockholder Matters | | 53 |
| Item 13. Certain Relationships and Related Transactions, and Director Independence | | 53 |
| Item 14. Principal Accountant Fees and Services | | 53 |
PART IV | | |
| Item 15. Exhibits and Financial Statement Schedules | | 53 |
SIGNATURES | | 56 |
Forward-Looking Statements:
This Form 10-K contains “forward-looking statements” about Greenway Medical Technologies, Inc. (also referred to herein as “we”, “our”, “us”, “Company”, “Greenway” or “Greenway Medical”) that involve risks and uncertainties, as well as assumptions that, if they never materialize or prove incorrect, could cause our results to differ materially and adversely from those expressed or implied by such forward-looking statements. The forward-looking statements are contained principally in “Part I, Item 1. - Business”, Part I, Item 1A—”Risk Factors” and Part II, Item 7—”Management’s Discussion and Analysis of Financial Condition and Results of Operations” but appear throughout this Form 10-K. Forward-looking statements may include, but are not limited to, statements relating to our outlook or expectations for earnings, revenues, expenses, asset quality, volatility of our common stock, financial condition or other future financial or business performance, strategies, expectations, or business prospects, or the impact of legal, regulatory or supervisory matters on our business, results of operations or financial condition.
Forward-looking statements can be identified by the use of words such as “estimate,” “plan,” “project,” “forecast,” “intend,” “expect,” “anticipate,” “believe,” “seek,” “target” or similar expressions. Forward-looking statements reflect our judgment based on currently available information and involve a number of risks and uncertainties that could cause actual results to differ materially from those described in the forward-looking statements.
The following uncertainties and factors, among others (including the factors described in the section entitled “Risk Factors” in this report), could affect our future performance and cause actual results to differ materially from those expressed or implied by forward-looking statements:
● our ability to adapt to evolving technology and industry standards;
● our ability to implement our growth strategy;
● our ability to retain management and other qualified personnel;
● reduced disclosures as an emerging growth company could make our common stock less attractive to investors;
● failure to prevent disruptions in service or damage to our third-party providers’ data centers;
● failure to avoid liability for the use of content we provide;
● accelerated transition to a subscription pricing model, which would reduce our near-term revenues;
● regulation of the healthcare information technology industry;
● our ability to ensure our solutions meet industry and government standards;
| ● | failure to maintain adequate security measures for our customers confidential information and personal identifiable information and patient’s protected health information; |
● our ability to obtain new provider customers;
● failure of the HITECH Act and other incentive programs to be fully implemented or funded by the government;
● our ability to capitalize on our strategic relationships as currently intended;
● failure to establish, protect or enforce our intellectual property; and
● restrictions in our credit facility and future indebtedness.
Additionally, there may be other factors that could preclude us from realizing the predictions made in the forward-looking statements. We operate in a continually changing business environment and new factors emerge from time to time. We cannot predict such factors or assess the impact, if any, of such factors on our financial position or results of operations. All forward-looking statements included in this Form 10-K speak only as of the date of this Form 10-K and you are cautioned not to place undue reliance on any such forward-looking statements. Except as required by law, we undertake no obligation to publicly update or release any revisions to these forward-looking statements to reflect any events or circumstances after the date of this Form 10-K or to reflect the occurrence of unanticipated events.
This report also contains statistical data and estimates, including those relating to market size and growth rates of the markets in which we participate, that we obtained from industry publications and generated with internal analysis and estimates. These publications include forward-looking statements made by the authors of such reports. These forward-looking statements are subject to a number of risks, uncertainties, and assumptions. Actual results could differ materially and adversely from those anticipated or implied in the forward-looking statements. Some data and information are also based on our good faith estimates, which are derived from our review of internal surveys as well as the independent sources listed above. Although we believe these sources are reliable, we have not independently verified the information and cannot assure you of its accuracy or completeness.
PART I
Overview
We are a leading provider of integrated information technology solutions and managed business services to Healthcare Providers (defined below) throughout the United States. We serve physician and midlevel providers, many of whom are organized in group practices that are independent, part of healthcare enterprises, or owned by hospitals, as well as retail and other ambulatory clinics, and alternate care venues (collectively, hereafter “Healthcare Providers”). At the core of our suite of solutions and services is the PrimeSUITE platform, our award-winning, innovative and flexible software and business services solutions for Healthcare Providers. PrimeSUITE integrates clinical, financial and administrative functionality; including electronic health record “EHR”, practice management “PM” and interoperability capabilities. We developed PrimeSUITE in a way that employs an efficient and effective database structure that gives providers a comprehensive view of the patient record. Thousands of care providers across primary care and more than 39 specialties and sub-specialties use cloud-based or on-premise Greenway® solutions to improve outcomes.
We believe that our approach supports efficient workflows throughout each patient encounter, reduces clinical and administrative errors and allows for the seamless exchange of data between our provider customers and the broader healthcare community. We augment our software solutions by offering an expanded array of integrated business and data services, including revenue cycle management (“RCM”) and EHR-enabled research services. By integrating clinical, financial and administrative data and processes, our solutions and services enable providers to deliver more advanced care and improve their efficiency and profitability. Based on our own internal tracking data, over 14,600 providers, which we define as physicians, nurses, nurse practitioners, and physician assistants, use our solutions and services to deliver care to and manage the clinical, financial and administrative information of over 25 million patients treated annually. Our technology solutions and services address the needs of providers in all ambulatory settings: independent physician practices, multi-specialty group practices, hospital-affiliated and hospital-owned clinics and practices, retail clinics, employer clinics, university and academic health centers, federally qualified health centers (“FQHCs”), community health centers (“CHCs”), integrated delivery networks (“IDNs”), patient-centered medical homes (“PCMHs”), accountable care communities (“ACCs”) and accountable care organizations (“ACOs”). Our technology platform, which reflects over 14 years of development, is available as either a remotely hosted cloud-based solution or a premise-based model, and is scalable to serve the needs of provider groups of any size. As providers’ needs evolve, our platform allows for the efficient development and integration of new solutions, which we refer to as our innovation platform.
The Healthcare Provider market for smaller physician practices has historically been underpenetrated and installed systems are often underutilized. Adoption of these technologies has been low for several reasons including resistance among providers to making the required investment, as well as concerns that creating and managing electronic records may disrupt clinical care and administrative workflows. The adoption rate of technology solutions for the ambulatory market is accelerating as more providers achieve benefits from these solutions, including increased efficiencies and associated return on investment from adoption of solutions such as PrimeSUITE. Through legislative and regulatory action, the government has provided additional financial incentives and implementation support for ambulatory providers to adopt EHR solutions, and providers have responded by seeking fully integrated EHR, practice management and associated technology and service solutions. Several emerging trends impacting consumers and providers, including increasing consumer involvement in clinical quality measures, more financial responsibility for care shifted to the consumer, as well as shifts in provider reimbursement to quality-based systems, an emerging focus on improving the coordination of care among providers and changing scope of practice among clinical professionals, are creating strong incentives for the adoption of technologies that meet the needs of a rapidly changing ambulatory healthcare environment.
We believe the Company’s technology solutions are competitively positioned to penetrate this market opportunity and to take advantage of emerging trends for Healthcare Providers. These market trends can be categorized into a demand for improved care coordination, interoperability, mobility, consumerism and data liquidity. Our integrated technology solution is consistently rated among the best in the industry. Since 2004, PrimeSUITE has received 13 “Best in KLAS” awards in ambulatory EHR and PM categories; the most amongst our competitors. KLAS is an independent body that measures healthcare technology vendor performance.
We maintain a customer retention rate of approximately 95% in a market in which 35% to as much as 50% of providers who have adopted technologies are considering replacing their current vendors, according to KLAS. We believe this success is a reflection of our historical and continuing focus on usability at the point of care as our foremost development priority and our commitment and dedication to customer service from initial implementation and training to on-going support.
During fiscal year ended June 30, 2013, our total revenue was $134.8 million and our operating loss was $6.9 million compared to $124.0 million and operating income of $4.9 million for the year ended June 30, 2012, and $89.8 million and operating income of $3.8 million for the year ended June 30, 2011.
Industry Overview
Healthcare in the United States has historically been provided through two different settings: ambulatory or outpatient care, which includes physician offices, outpatient surgery centers, employer and retail clinics; and acute, or inpatient care, which is primarily hospitals. There is an increasing focus on delivering high-quality care in the most cost-effective and convenient setting, which is causing a shift in care delivery from acute care to traditional ambulatory providers as well as from traditional ambulatory providers to retail clinics. This shift is increasing the volume and changing the types of care delivered by the provider. This pattern is expected to continue as a result of the availability of accountable care and value-based medicine care delivery and payment models, pressures to lower costs, demographic trends, increasing awareness of the effectiveness of preventive care and early diagnosis in ambulatory settings to avoid, or reduce hospital admissions, and the anticipated expanded health insurance coverage provided for by healthcare reform provisions. Healthcare Providers, in return, are responding to these trends by adding retail clinics and other, more convenient and lower cost options to their offerings.
In addition to increased ambulatory care volume, providers face financial and operating challenges related to pressure on reimbursement rates and intensifying documentation, administration and regulatory requirements. Over the past several years, reimbursement has not grown at the same rate as the underlying cost of delivering care. Furthermore, the increasing complexity of the reimbursement process, including the new claims coding standards, as well as the proliferation of consumer-oriented health plan designs have led to added administrative burdens for providers. In an effort to align provider incentives with improved quality of care and cost efficiencies, payers are introducing new payment methodologies that tie reimbursement to providers’ ability to coordinate care and to demonstrate improved patient outcomes.
The significant burdens created by this changing environment have created an opportunity in the marketplace for innovative software solutions critical to providers, as legacy systems may not adequately support their needs. Ambulatory providers have traditionally used practice management solutions to manage their financial and administrative functions, but have been slow to convert their clinical workflows from paper charts to digital systems. The use of paper records can restrict the throughput of the provider and prevent the efficient collection and sharing of critical information. This can cause clinical errors such as adverse drug interactions and result in failure to accurately document the clinical services provided, which leads to lower reimbursement for services rendered and a greater rate of denied claims. The ability for ambulatory providers to enter and store discrete clinical data in EHRs has become more important in recent years in order to address emerging industry trends including coordination of care and pay-for-performance, as well as community-wide quality reporting initiatives that require interoperable technology solutions. We believe the implementation of integrated EHR/PM solutions provides a compelling return on investment to providers by enhancing clinical and administrative workflow, improving the quality of care, reducing administrative staff, and increasing cash flow by tracking a medical procedure from claim submission to payment. Despite the clinical and financial advantages of EHR solutions, their adoption rates by ambulatory providers have been substantially lower than those of PM solutions. According to the U.S. Centers for Disease Control and Prevention, in 2012 approximately 70% of providers had implemented at least a basic EHR technology. It is estimated that a much smaller percentage of providers that have EHR systems fully utilize the technology in daily practice. Adoption of these technologies has been low for several reasons including the cost of acquiring, implementing and supporting the technology as well as the fear of disrupting clinical and administrative workflows. Further, many alternative systems in use today require keying in the same information multiple times. This results in low utilization and customer dissatisfaction with the product.
Market Opportunity
Our solutions and services are marketed to Healthcare Providers including independent physician practices, multi-specialty group practices, hospital-affiliated and hospital-owned clinics and practices, retail clinics, employer clinics, university and academic health centers, FQHCs, CHCs, IDNs, PCMHs, ACCs, and ACOs.
We estimate the current market for our solutions and services to be approximately $35 billion. We believe our potential customer base includes approximately 638,000 physicians at over 230,000 practices as well as approximately 3,500 retail and employer-based clinics that employ (or contract with) an additional 8,000 providers. These physician, practices, retail clinical numbers that are quoted necessarily exclude one significant customer that gives us access to over 8,000 retail pharmacies and that include 350 retail clinics throughout the United States. The Company is in production at approximately 7% of these stores and are expected to be active at all stores by the end of Fiscal 2014. Our core ambulatory solution, PrimeSUITE, services an estimated $10 billion market. While slightly more than 70% of the EHR/PM market is penetrated, only 10% of providers fully utilize their installed EHR solution. Further, we believe that the replacement market is large, and growing, as a number of provider groups are looking to migrate from legacy systems to solutions that offer a more efficient database structure, fully integrated technology and related business services that will comply with increasingly complex clinical and financial reporting requirements. The markets for certain of our other solutions include $16 billion for our RCM services, $3.5 billion for our data exchange solution, and $2 billion for our speech understanding solution. However, we operate in a competitive industry, and there is no guarantee that providers that have not implemented EHR/PM solutions or those that do not fully utilize their current solutions will choose to implement or fully utilize our products.
Several factors are encouraging adoption of EHR/PM solutions and related technologies and services by ambulatory providers and we believe will serve to drive the growth of our business.
| | ● | Compelling Return on Investment. We believe providers are becoming increasingly aware of and comfortable with the potential benefits of using integrated EHR/PM solutions including helping them practice more advanced medicine and deliver higher-quality care, while simultaneously improving revenue generation and operating and cost efficiency. These systems can help providers practice more advanced medicine and enhance the quality of the care they deliver, while increasing their efficiency and profitability. Through the adoption and proper use of these solutions, providers can increase revenue and reduce costs. Providers are recognizing the potential of EHR/PM solutions to significantly improve their operations and profitability. These providers are also demanding more convenient mobile solutions, speech recognition solutions, as well as fully-integrated, clinically driven RCM solutions. |
| | ● | Government Initiatives and Incentives. Over the last several years, the government has enacted initiatives to accelerate the adoption of certified EHR solutions. Most importantly, the enacted HITECH Act, part of the American Recovery and Reinvestment Act certified (“ARRA”), specifically targeted healthcare by providing a substantial amount of incentives to Healthcare Providers by Medicare and Medicaid programs to encourage the adoption of certified EHR products in the ambulatory market. Eligible professionals who qualify can receive financial incentives from Medicare or Medicaid. In order to qualify for these incentives, providers must achieve “meaningful use” of their certified EHR solutions. Meaningful use criteria have helped to establish standards for EHR products, resulting in higher adoption rates among providers. |
| | ● | Trends in the Evolving Ambulatory Market. Three major trends impacting ambulatory providers are: (i) greater electronification of health data, which includes adoption of ambulatory technology solutions and the inter-operability of solutions across the broader healthcare community; (ii) growing consumerism, including more consumer participation in reimbursing providers, and (iii) greater interest in measuring quality outcomes; and initiatives aimed at improving population health. The electronic capture and exchange of health information is becoming standardized within the ambulatory market, leading to heightened interest in and need for interoperable technology solutions that achieve data liquidity. Furthermore, as patients are increasingly responsible for paying for the care they receive, they are becoming more engaged in decisions about which providers to use. Similar to consumers in other industries, patients weigh factors such as cost, quality, convenience and overall experience when selecting where to receive their care. Finally, providers want to deliver the most advanced care possible and participate in the improvement of population health. This may include participation by Healthcare Providers in clinical trials or contributing to health surveillance initiatives. Ambulatory providers now understand that the adoption of integrated EHR/PM and related technology solutions can help them succeed in this evolving and complex market by taking advantage of these key trends. |
We believe that many existing EHR and PM technology vendors do not adequately meet the evolving needs of Healthcare Providers. EHR systems are often difficult to use and disrupt provider workflows, creating inefficiencies and ultimately leading to low adoption rates within provider groups. Additionally, many EHR/PM systems are not integrated, which creates inefficiencies in not only the delivery and documentation of patient care, but also through multiple keying of the same data, which raises the potential for errors and inefficiency and results in a lack of confidence with the system. Lack of interoperability with IT systems in other care settings prevents the exchange of clinical, financial and administrative data within the practice itself, or with the rest of the healthcare community. Finally, many vendors have multiple versions of their software installed across their customer bases, which reduces their ability to provide effective service and support to ambulatory providers. Due in part to these dynamics, 35% to as much as 50% of providers who have adopted EHR solutions indicated that they are considering replacing their EHR systems, according to surveys conducted by KLAS. Greenway Medical has consistently invested in innovation, constantly updating its PrimeSUITE platform, and delivering new versions to existing users. Substantially all of the Company’s customer base operate from the same version of PrimeSUITE which is periodically updated as new features and functionality is released.
Our Solutions
The foundation of our offering is an integrated suite of technology solutions designed for the unique needs and workflows of Healthcare Providers serving patients through multiple platforms. Provider usability, at the point of care, has been the foremost priority in the development, innovation and evolution of our solution. At the core of our solution and service is PrimeSUITE, our award-winning, innovative and flexible software and business services solution for Healthcare Providers. We believe our design and built-in clinical decision support capabilities help providers improve patient safety, quality of care and efficiency. PrimeSUITE has over 3,900 clinical templates, designed for the needs of over 39 specialties and subspecialties. This is a patented process that offers data capture layouts that are intuitive to providers and make it easier to enter patient health information at the point of care. We believe PrimeSUITE’s ease of use has led to more than 90% of our provider customers making full use of PrimeSUITE’s functionality, which we believe is substantially higher than industry averages. Through its design, PrimeSUITE’s functionality addresses the core, day-to-day operations of providers that include documenting clinical information about patients, conditions and treatments, managing revenue collection and finances and conducting necessary administrative tasks. Our fully integrated EHR and PM solutions incorporate clinical, financial, and administrative data within a streamlined database structure and removes the need to re-enter data as the information moves through the process from clinical to administrative to billing and finally, to collection. This allows the EHR and PM systems to operate seamlessly and creates efficiencies between the process of delivering and documenting care and the process of billing and collecting for those same services.
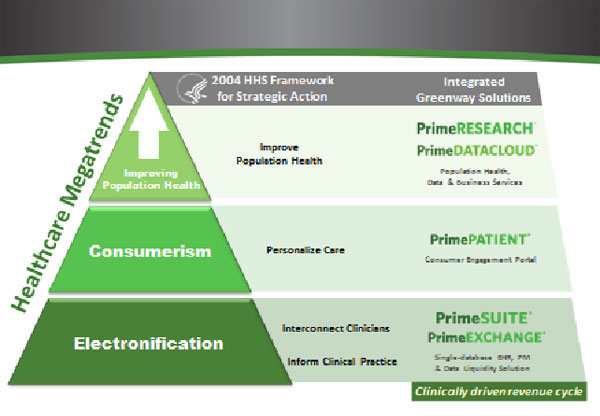
The Company’s product offering has been centered around customer solutions for the industry opportunities that have existed since we began developing our product 14 years ago. They are (i) electronification, which we define as digitizing the paper claims and paper charts from the past, (ii) consumerism, which includes increased patient engagement in managing their health, as well as increasing pressure from employers to make patients more responsible and more aware of their healthcare purchases, and (iii) population health-management, which consists of enormous amounts of data from healthcare providers that will result in a healthcare system that will be more accountable for quality of care and costs.
Since the initial release of PrimeSUITE, we have introduced additional solutions to enhance electronification, consumerism and population health for the Healthcare Providers. These solutions, which are offered in conjunction with the PrimeSUITE platform, include:
| | ● | PrimeEXCHANGE (Electronification), which facilitates data liquidity by enabling standards-based interoperability of clinical and financial data between providers and the broader healthcare community; |
| | ● | PrimePATIENT (Consumerism), a consumer-driven patient portal also enables web-enabled consultations between patients and physicians, often referred to as e-visits that can supplement or replace traditional in-person office visits, save time for both patients and provider, and increase revenue for physicians; |
| | ● | PrimeDATACLOUD (Population Health), a collaborative care portal that enables the aggregation of clinical, financial and administrative data across both related and disparate entities and electronic health record systems. The secure aggregation of data makes it possible for healthcare communities to manage population health, access longitudinal health records and report on quality outcomes. |
| | ● | PrimeMOBILE (Electronfication), allows providers to access PrimeSUITE from their mobile devices when working remotely; |
| | ● | PrimeSPEECH (Electronification), a sophisticated speech understanding solution that simplifies data entry into PrimeSUITE, improving workflow saving time and money that providers currently spend on transcription services; and |
● PrimeIMAGE (Electronification), a photo archive solution for providers.
● Greenway Clearinghouse (Electronification), an electronic clearinghouse for provider claims,
We have also developed several managed business service offerings that leverage our technology solutions and the integrated PrimeSUITE database. These include:
● PrimeRCM (Population Health), our clinically-driven revenue cycle management services; and
| | ● | PrimeRESEARCH (Population Health), our EHR-enabled research service that allows providers to participate in clinical research and contribute to population health initiatives. |
All of our technology solutions and services work together within the PrimeSUITE platform because of our data structure. Our providers achieve ”ease of use” because our data structure eliminates redundant entry of data when reviewing a record for clinical, administrative or financial functions.
We believe these innovative solutions and services enable us to act as long-term partners with our customers, helping them to achieve success by providing them the following key benefits:
| | ● | Enable the Delivery of Higher-Quality Care and More Advanced Medicine. Our provider customers can deliver higher-quality care and practice more advanced medicine using PrimeSUITE’s clinical decision support capabilities, clinical alerts and reminders, electronic order entry and tracking and active device controls that integrate data from peripheral medical devices directly into the patient’s record. PrimeSUITE’s clinical decision support capabilities assist providers in patient evaluation and diagnosis, evidence-based treatment, error reductions and proper data capture. Our clinical alerts and reminders ensure care is delivered to patients in a timely manner by notifying providers if a patient is due for an exam or test and identifying potential drug contra-indications based on the patient’s medical history. Our electronic order entry application increases the speed and accuracy of ordering, tracking and viewing results of prescriptions and lab tests. Active device controls capture data from peripheral medical devices, and integrate it directly into the patient’s record. Over time, clinical encounter data captured in PrimeSUITE creates a comprehensive electronic healthcare record that enables providers to more effectively identify and proactively address emerging trends in a patient’s health. |
| | ● | Deliver Improved Financial Performance. Our solutions enhance provider economics by increasing revenue, improving receivables collection, and reducing administrative costs. They enable increased revenue capture at the point of care, whether in the office or working remotely on a mobile device, and the ability to see more patients due to more efficient workflows. Automated reporting of key metrics, through practice management dashboards, supports the generation of additional revenue by helping the provider track progress towards qualification for available incentive payments, such as those based on improvement in quality measures or for demonstrating use of e-prescribing and certified EHR technology. Reduced administrative costs are realized through reduction or elimination of transcription, paper chart, administrative staff and other costs. Additionally, space currently used to store paper records can be repurposed for revenue-generating activities, including additional exam and procedure rooms. |
A series of case studies, conducted on our behalf, studied the return on investment a select group of customers can realize following the implementation of PrimeSUITE. Based on management’s review of these studies, we believe that customers can significantly increase revenue and cash flow from implementation and comprehensive use of the functionality within PrimeSUITE.
| | ● | Enhance the Workflow of the Provider. PrimeSUITE accommodates and supports the unique clinical workflows of providers in over 39 specialties and subspecialties and the financial and administrative workflows of their staff. Through our patented processes for specialty-specific templates, our suite of solutions delivered on the PrimeSUITE platform are adaptable to a provider’s workflow, which results in quick implementation and overcomes their aversion to switch to electronic systems from traditional paper-based records. |
The PrimeSUITE database captures and displays the relevant data to each provider or staff member during each step of a patient encounter. PrimeSUITE is designed to allow a patient’s clinical and administrative record to follow the patient from registration to the examination room to check-out and to be accessed and updated by multiple staff members simultaneously during the patient’s visit. Administrative staff use PrimeSUITE to schedule appointments and enter patient information at check-in. Alternatively, patients can use PrimePATIENT, our provider portal solution, to schedule appointments and enter their information online. All demographic, financial and clinical information identified during initial registration, check-in and triage are aggregated and presented to the provider at the point of care. A set of easy-to-use and highly customizable clinical templates capture the provider’s interaction with the patient. This information can be captured through a desktop or tablet when in the office or via a mobile device using PrimeMOBILE when working outside the office. PrimeSUITE enables providers to order prescriptions and lab tests electronically as well as track and view results, thus increasing the speed, quality and accuracy of the care delivered. Clinical information captured during the patient encounter automatically generates recommended evaluation, as well as procedural codes for billing purposes. The integration of clinical, financial and administrative information and its availability to all providers and staff before, during and after patient visits can help providers improve their efficiency.
| | ● | Position Providers for the Future of Healthcare. We believe the future of healthcare will require providers to deliver high-quality care in the most collaborative and cost-effective way possible, while dealing with increasing consumerism among patients and the desire to participate in the improvement of population health. We believe that in order to succeed in the future, providers will need an integrated and inter-operable ambulatory platform that allows them to connect, communicate and collaborate electronically with patients, other providers and the broader healthcare community. We believe providers will also need the ability to satisfy increasing consumer demands and contribute to the improvement of population health. In addition, the emergence of pay-for-performance and value-based reimbursement models will require that providers not only enhance the quality of care and patient experience but also be able to quantify and report on various measures and adapt quickly to changes in the healthcare market. |
Our vision of the future of a smarter healthcare system has guided the development and success of our scalable and flexible PrimeSUITE platform for the last 14 years. We believe our technology enables the seamless creation and addition of new innovations and functionality designed to respond to emerging trends, therefore enhancing the value of our solutions to our customers. Since the introduction of PrimeSUITE we have developed and integrated into PrimeSUITE new solutions to address new trends and advances in technology, including the need for data liquidity and interoperability, patient portal, speech understanding and mobile technology. We have also developed managed business services that leverage the power of our technology solutions to provide clinically-driven revenue cycle services and allow providers to participate in clinical research and contribute to population health initiatives. We believe these innovative solutions and services differentiate us from our competition and enable us to act as long-term partners in the success of our customers.
The following diagram visually represents our suite of technology solutions and managed business services centered on our core PrimeSUITE technology:
Our Strengths
We believe we have the following key competitive strengths:
| | ● | Proven, Long-Term Vision. We partner with Healthcare Providers to enable them to meet the changing needs of the ambulatory market. We have succeeded in developing innovative solutions and services to help providers respond to the key trends in the ambulatory market, which we identified early in our history as electronification, consumerism and improving population health. Our solutions rely on core EHR and PM capabilities, are interoperable and enable easy aggregation and sharing of patient information, enhance physician-patient relationships by providing online self-service options for patients and allowing providers to participate in improving population health through clinical research, health surveillance and disease registries. We continuously monitor themes that will shape the future for ambulatory care and develop innovative solutions and services to help providers succeed in an evolving market. |
| | | Integrated Technology Model. Our integrated, scalable and flexible technology provides a range of benefits to our customers while also providing us a strong foundation for a sustainable business model. Our architecture has proven to be secure, reliable and support mission-critical operations for over 14,600 providers. Our EHR is based on an individual, integrated database that contains clinical, financial and administrative data and supports exceptional interoperability, data analytics and reporting. We have and will continue to develop a technology model that supports rapid innovation. Using our Greenway Service Manager architecture, our centralized support team can easily update customers to new versions of our solutions and provide monitoring services remotely. Our technology architecture scales to support ambulatory providers ranging from single provider practices to large enterprises with hundreds of providers. Our technology allows customers the flexibility to choose the deployment option they prefer, including either a cloud-based or premise-based model. Furthermore, our cloud-based internal technologies enable us to focus on innovative product and service development while outsourcing non-core activities, such as server hosting, server maintenance, application security and our other IT services. We believe this technology model provides a distinct competitive advantage. We are able to focus resources on our innovative product and service development, our strong customer service and our efficient and centralized customer support model. |
| | | Superior Customer Service and Support. We believe that successful adoption of our solutions requires partnering with our customers to empower them to utilize our technology to its maximum capability. As such, customer service and support are one of our core priorities. Our commitment to our customers’ success starts during the sales process and continues throughout our relationship, including initial implementation, training, ongoing education and support, as well as continuous development of new functionalities, technology upgrades and business services. In addition to traditional training, we offer on-demand, web-based training options, webinars covering cutting-edge industry topics, such as how customers can meet “meaningful use” incentive criteria, and our annual user conference where customers meet one another, exchange ideas and learn how other customers have used our products and services to improve their businesses. We consider customer input critical to the development of new functionalities and a core part of customer service and support. We deliver a single version of our technology platform to all of our customers, which enable us to deliver “best-in-class” customer support. We offer phone, email and web-based technical and business support 24 hours a day and seven days a week, as well as remote monitoring and upgrade deployment services. We continuously improve our support processes, which leads to faster response and issue resolution times. Our high-quality customer service has contributed to our approximately 95% customer retention rate in a market where it is estimated that 35% to as many as 50% of providers who have adopted EHR technology are considering replacing it. |
| | | Trusted Brand. We have a trusted and recognized brand with our customers and within our industry. As ambulatory providers compare available EHR solutions across multiple vendors, our recognized brand and reputation for differentiated technology, solutions and services position us for success. Our PrimeSUITE solution has received 13 “Best in KLAS” awards since 2004. PrimseSUITE 2014 (17.0) is 2014 compliant and was certified as a Complete EHR on February 6, 2013 by the Certification Commission for Health Information Technology (CCHIT), an ONC-ATCB, in accordance with the applicable eligible provider certification criteria adopted by the Secretary of Health and Human Services. The ONC 2014 Edition criteria supports both the Stage 1 and Stage 2 meaningful use measures required to qualify eligible providers and hospitals for funding under the American Recovery and Reinvestment Act (“ARRA”). Furthermore, PrimeSUITE has been selected as a solution of choice or option by a substantial majority of regional extension centers (“RECs”) with established operations. We believe that word-of-mouth referrals are a significant source of bookings, showing that our customers trust our solutions and services and are willing to recommend us to colleagues. These accolades, combined with our continued involvement in industry initiatives, focus on innovation and high levels of customer service and support, drive increased brand recognition among customers and in our industry. |
| | | Attractive Business Model. Our broad range of solutions and services and our high customer retention rate provide us with a powerful business model. This model has driven our growth rate over the past several years due to our continued ability to sell our core PrimeSUITE solution to new customers and then build upon its success by providing complementary technology solutions and business services. Our high customer retention leads to a growing percentage of recurring revenue from support services, business services such as revenue cycle management and subscription revenue. Recurring revenue represented 55% of total revenue in 2013. The combination of this recurring revenue with our backlog of new business sold provides high revenue visibility. Our integrated technology solution provides operating leverage, allowing us to focus our research and development solely on innovation as opposed to integration of legacy technologies. Furthermore, our cost structure is also more efficient due to the ease of supporting and upgrading our technology platform. These factors help us drive predictable revenue growth and generate greater operating profit. |
| | | Experienced Management Team. Our management team has significant experience in our industry and a majority of our executives have worked together for more than a decade. In the late 1990s, our team worked with ambulatory providers to develop a vision of the future of the healthcare market, including electronification, increasing consumerism and improved population health. Our team’s vision is now coming to fruition and has driven the design of our innovative solution suite and business services. Our operational teams are organized to optimize our key areas of (i) growth, (ii) innovation and (iii) customer service. Furthermore, our management team has been and remains heavily involved in the industry organizations that set policy and standards for healthcare in general and, more specifically, healthcare information technology. Our leadership efforts have served to establish our reputation for a consistent focus on developing solutions to meet both the current and future needs of providers in an evolving healthcare system. |
Our Strategy
Our objective is to be the most trusted and effective provider of technology solutions and managed business services for ambulatory providers. Our principal strategies to meet our objective are:
| | | Increase our Share of the Expanding Market for Ambulatory Technology Solutions. We plan to capitalize on the large and growing ambulatory technology market opportunity by leveraging our targeted and multi-pronged sales strategy. We utilize a combination of direct, enterprise, indirect and small practice solutions sales teams, in addition to strategic partners, to attract new customers and drive penetration of PrimeSUITE. We believe our solutions address the most important clinical, financial and administrative needs of our large and growing customer base, and we are experiencing increasing demand for our solutions. Furthermore, as the ambulatory care market expands, we are offering our solutions to a wider range of customers, including FQHCs and employer and retail health clinics and other innovative delivery networks. Our market is underpenetrated and many customers are not satisfied with their current solutions. This dissatisfaction creates substantial opportunity to grow our business by attracting new customers and displacing existing and competitive products. |
| | | Generate Greater Revenue per Customer by Expanding Their Use of Our Suite of Solutions and Services. We will continue to cross-sell our integrated product and service offerings to customers already using PrimeSUITE. As our customers successfully implement and utilize PrimeSUITE to improve efficiency and profitability of their practices, they increasingly adopt our complementary technologies and managed business services. These technologies include PrimeEXCHANGE, PrimePATIENT, PrimeDATACLOUD, PrimeMOBILE, Greenway Clearinghouse, PrimeSPEECH and PrimeIMAGE, and managed business services include PrimeRCM and PrimeRESEARCH. These solutions fully integrate with PrimeSUITE and its data structure to provide additional technological capabilities, further positioning our customers at the forefront of technology innovation. These solutions are built to work seamlessly with PrimeSUITE. As our customers use more of our solutions and services, we become more critical to their operating infrastructure, further solidifying our partnership with them and generating increased revenue per customer. |
| | | Develop Innovative Solutions for the Evolving Needs of the Ambulatory Provider Market. We continuously monitor and work with our customers to understand the evolving technology needs of the ambulatory provider market. The insights we gather help drive our development of new and innovative solutions and services. Two recent and notable examples are our PrimeRESEARCH and PrimeDATACLOUD solutions. PrimeRESEARCH helps physicians identify opportunities to participate in clinical research studies which simultaneously increase revenue and provide access to cutting edge therapies for their patients. PrimeDATACLOUD is a collaborative care portal that securely and cost-effectively empowers population health through the sharing and aggregation of clinical, financial and administrative data across electronic health record systems in different provider settings. In both cases, these products are used in conjunction with PrimeSUITE and are highly complementary to one another. We will continue to work closely with customers to develop solutions that position them to succeed as the ambulatory care market evolves. |
| | | Expand Margins by Leveraging our Operating Platform. We expect operating margins to increase as we continue to grow revenue by substantially leveraging our existing infrastructure and operations. Our focused technology and business model enables us to efficiently deploy capital and resources in key areas such as sales and marketing and research and development. We have made, and will continue to make, investments in our technology infrastructure and processes, which we believe will allow us to profitably grow our business as we add new customers and solutions. |
| | | Pursue Targeted Acquisitions. We intend to pursue acquisitions on a targeted basis, seeking out complementary and innovative technologies and services that augment and differentiate our current solutions. |
Our Products and Services
Our technology solutions and services are fully integrated into PrimeSUITE to address the needs of providers in all ambulatory settings: independent physicians, group practices, hospital-affiliated and hospital-owned clinics and practices, retail clinics, employer clinics, university and academic health centers, FQHCs, CHCs, IDN’s, PCMHs, ACCs and ACOs. to better serve patients and communities, more efficiently manage their practice and increase profitability.
PrimeSUITE.At the core of our solution is PrimeSUITE, which is a single integrated application with electronic health record, practice management and interoperability functionality. PrimeSUITE is comprised of EHR functionality including a patient chart, e-prescribing, clinical decision support, orders management, as well as practice management functionality with, registration, scheduling, accounts receivable and financial reporting. PrimeSUITE is a web-based application used by organizations such as health system delivery networks seeking integrated care coordination and data sharing on an enterprise level, as well as management service organizations, billing services and ambulatory surgery centers that need autonomy and separation among practices, while managing operations from a centralized location. Other groups, such as independent physician associations, may also use this application to provide services, such as enterprise fee schedule updates, practice analysis, security configuration, master-file maintenance, broadcast reporting, clinical data sharing, and auditing. Our fully integrated set of ambulatory care technology solutions which build upon PrimeSUITE include the following:
PrimeEXCHANGE.Greenway’s standards-based interoperability engine facilitates secure data exchange between physician practices and the entire healthcare and stakeholder community. Supported transactions include patient demographics, patient insurance, charges, lab results, microbiology reports, prescriptions, clinical summaries, transcriptions and radiology reports.
PrimePATIENT.Greenway’s secure patient web portal enhances the patient-provider relationship through self-service clinical, financial and administrative options available online in place of office visits or phone calls. We believe PrimePATIENT will empower patients – the consumers of healthcare services – to more effectively engage with providers. PrimePATIENT improves office efficiencies and, we believe, increases patient satisfaction. Capabilities include appointment requests, on-line bill payment, on-line registration, prescription re-fills, secure messaging with care providers, clinical summary access and patient health record integration.
PrimeDATACLOUD.A collaborative care portal that empowers the aggregation of clinical, financial and administrative data across both related and disparate entities and electronic health record systems. This secure aggregation of data allows communities to manage population health, access longitudinal health records and report on quality outcomes.
PrimeMOBILE.Provides the information providers need most at their convenience. Providers can access schedule and patient data or capture charges using an iPhone®, iPad®, AndroidTMor MS Mobile phone.
Greenway Clearinghouse. Provides a clearinghouse for claims through a number of third party payors. Substantially all our customers use a clearinghouse to submit claims and have them paid. Greenway Clearinghouse will allow the Company to offer a seamless transition from billing and collection within PrimeSUITE through the clearinghouse services.
PrimeSPEECH.Provides embedded speech understanding and generates discrete data, in real time, that populates patient records. PrimeSPEECH replaces traditional voice recognition and transcription services, improving accuracy and efficiency.
PrimeIMAGE.Provides digital imagery and data capture within the patient’s chart. Compatible with ultrasound, endoscopies, laparoscopy, CT, MRI, NM, microscopy and surgical imagery to further streamline diagnostics and care coordination.
We also provide certain ancillary services such as an electronic data interchange (“EDI”) which includes electronic claims processing, statement processing, eligibility verification, and database access fees. These services are delivered through our technology solutions and through various third-parties.
We augment our innovative technology solutions with the following managed business services for ambulatory providers:
| | | PrimeRESEARCH. An EHR-enabled service that allows our customers to deliver the most advanced medicine possible and provides our customers with access to a vast network of clinical trials (Phase II, III, IV, post-market and observation), registries, pharmaceutical research, remote monitoring services, benchmarking services, EDC integration, and clinical trial management software. |
| | | PrimeRCM. A clinically-driven revenue cycle service that includes accounts receivable management, patient and insurance follow up, and financial performance benchmarking. PrimeRCM is driven to provide expertise and service to navigate our customers through the emerging changes in reimbursement models, quality care initiatives, and accountable care. |
In addition to our technology solutions and managed business services, we provide certain professional services to our customers. Our client services team consists of well-trained and qualified members experienced in, among other disciplines, registered nurse, licensed vocational nurse, practice management, certified coding, consulting, HIPAA compliance, project management and Practice Management Institute certification. These individuals work together along with dedicated members of our customers’ organizations to ensure the success of the implementation of their PrimeSUITE solution infrastructure and improve clinical, administrative or financial processes around our PrimeSUITE solution.
Our comprehensive technology solutions, managed business services and professional services competitively support improved patient care and efficiency for ambulatory providers.
Our Customers
Our customers include independent physician practices, multi-specialty group practices, hospital-affiliated and hospital-owned clinics and practices, retail clinics, employer clinics, university and academic health centers, FQHCs, CHCs, IDNs, PCMHs, ACCs, and ACOs.
We derive our revenue primarily from the sale of our PrimeSUITE software, related hardware and professional services to providers in ambulatory settings. While a sizable amount of the current revenue is made up of perpetual licenses to our customers, our software is easily deployable as a subscription service and many of our applications are currently marketed in that manner. We also derive substantial revenue from our software related services platform, which we believe is more robust than typical software maintenance, and another large percentage of our revenue from transaction processing services. These robust offerings yield a customer retention rate of approximately 95%. We have had no significant customer concentration up through the year ended June 30, 2012. For the year ended June 30, 2013, there was one customer that accounted for 12% of net revenue. There is no other customer that accounted for more than 5% of net revenue for the year ended June 30, 2013 and there is no individual customer that accounts for more than five percent of our revenue for the years ended June 30, 2012 and 2011.
All of our revenues are generated in the United States and 100% of our long-lived assets are located in the United States.
Sales and Marketing
We employ experienced and well-trained sales executives with extensive industry expertise. We primarily sell to our customers through our direct sales force. As of June 30, 2013, we employed approximately 130 sales and marketing employees. Given the experience of our sales team and the constant sharing of market data, competitive intelligence and other relevant information from around the industry, we believe our sales force provides us with a significant competitive advantage. Our sales force promotes and sells our services to new customers and expands the services we provide to our existing customer base. Our marketing efforts focus on creating a strong brand identity for Greenway through industry leadership, trade shows, web strategies, print media, social media and development of industry-related seminars.
To support our commitment to provide exemplary healthcare information technology services to our customers we work closely with several companies in our industry. Together, we deliver the solutions and integrate the tools our customers need to ensure data travels seamlessly throughout their healthcare community. These strategic alliances include relationships with industry leading companies such as Tech Data, CDW, Hewlett-Packard, Microsoft, and Dell.
We are in the process of rolling out our EHR technology solution in Walgreens stores nationwide as part of that Company’s strategy of developing robust ambulatory care. We believe our relationship with Walgreens presents a tremendous opportunity to expand into a market we have not traditionally served, and to partner with one of the leading companies in the industry. Under our agreement, we have granted Walgreens a perpetual, non-exclusive license to utilize our EHR technology in its stores.
We also have entered into an agreement with McGraw-Hill Higher Education forming McGraw Hill’s Integrated Electronic Health Records: An Online Course and Worktext for Greenway Medical Technologies PrimeSUITE. This product is a comprehensive learning resource offered through McGraw Hill’s Connect Plus. PrimeSUITE is used in conjunction with patient data and the corresponding workbook to gain a better understanding of health information management, practice management, and EHRs. The alliance with McGraw-Hill and academic institutions throughout the nation is part of Greenway’s effort to aid in the creation of a national healthcare education forum.
We pride ourselves on consistent industry leadership. Since our inception, our executives have filled leadership roles within industry trade groups and have supported public policy initiatives affecting the advancement and innovation of healthcare information technology. Highlights of these numerous executive positions include those within the national HIMSS Electronic Health Record Association (“EHR Association”), Health Information Management Systems Society (“HIMSS”), the CCHIT, Clinical Data Interchange Standards Consortium (“CDISC”), National Quality Forum (“NQF”), the CommonWell Health Alliance, the Accountable Care Community of Practice and the Integrating the Healthcare Enterprise (“IHE-USA”) Board of Directors. Additionally, since 2005, members of our leadership team have formally testified before Congress and the administration on numerous occasions and advised several presidential campaigns on healthcare information technology initiatives. This work has contributed to the advancement of critical industry initiatives such as the guidelines for EHR “meaningful use” and accountable care organizations. We believe that our involvement and contributions to these industry initiatives allow us to have relevant and important input in how technology will continue to impact healthcare in the future and is therefore critical to our product development efforts.
Customer Support
Our Customer Support offering is the centerpiece of our value proposition, enabling us to deliver differentiated support through our highly scalable platform. We strive to optimize our customers’ experience through our people and our innovative services, which we believe leads to a successful long-term partnership. We employ physicians who, along with other certified healthcare and technology professionals, are involved in the design, development, deployment and support of all of our services. This collaboration of clinical and technical professionals and our innovative Greenway Service Manager technology enables us to offer industry-leading service in a timely and efficient manner. Our customer support team currently has approximately 120 employees who support our customers through phone, email, and web-based interactions 24 hours a day, seven days a week.
Technology and Development
Our innovation platform utilizes the latest mobile, web and cloud computing technologies, including Microsoft .NET, Microsoft Azure, Force.com and Apple iOS. This platform ensures data flows seamlessly from mobile and remote environments to the integrated EHR/PM and to various health information exchanges. This innovation integrates all clinical, financial and administrative data to promote information sharing and ensure quick user adoption through simple, intuitive tools that optimize daily processes.
Greenway’s platform permits remote access, reduces support costs and ensures cross-platform, multi-location and organizational compatibility.
Throughout our history, we have invested to stay at the forefront of technological trends and changes. We have made the transition to a cloud platform that we believe this will provide the access, security and scalability needed for the future of ambulatory healthcare delivery and positions our Company and our customers well for the future.
Competition
The ambulatory EHR market is fragmented. Our primary competitors in EHR and PM include Allscripts, athenahealth, Cerner, eClinicalWorks, Epic, GE, Quality Systems, and Vitera Healthcare Solutions. Companies compete on factors including price, delivery of new technology, service, quality of implementation and training, on-time implementation, quality of support provided, product response time, ease of use, enhanced workflow and integration goals.
We believe we excel in customer service. Given the referral-based nature of the healthcare industry, we believe our long-term commitment to our customers has enabled us to build a strong reputation around integrity, trust, and innovation.
Intellectual Property
Our success and ability to compete in our industry depend in part on our ability to establish, protect and enforce our intellectual property rights. We rely on a combination of patent, copyright, trademark, trade secret and other related laws and confidentiality policies and contractual provisions to protect, maintain and enforce our proprietary technology and intellectual property rights. We are the owner of 23 registered United States trademarks/service marks. We also have 10 pending United States trademarks or service marks. Our intellectual property portfolio includes various unregistered copyrights and Internet domain names. We currently own five issued United States patents and we have 17 filed patent applications in various stages of examination.
Government Regulation
As a participant in the healthcare industry, our operations and relationships with our customers and other medical professionals are subject to a variety of government regulations. These laws and regulations are broad in scope and they are subject to evolving interpretations, which could require us to incur substantial costs associated with compliance and to alter one or more of our practices. We devote significant efforts to establish and maintain compliance with all regulatory requirements that we believe are applicable to our business and the services we offer. Specifically, but without limitation, the following laws and regulations may affect our operations and contractual relationships:
The HITECH Act
As discussed above, the HITECH Act provides funds to incentivize physician providers to adopt EHR products, which, beginning in 2011, were allocated to aid the development of an information technology (“IT”) infrastructure for healthcare and to assist providers and other entities in adopting and using healthcare information technology. CMS establishes and oversees the criteria that healthcare providers must meet to receive HITECH Act stimulus funding, while the Office of the National Coordinator for Health Information Technology (“ONC”) establishes and oversees the functionality that EHR products must meet. In order for our customers to qualify for funding under the HITECH Act, our technology must meet various requirements for product certification under the regulations, and must enable our customers to achieve “meaningful use,” as defined under CMS regulations. CMS regulations provide for a phased approach to implementation of the “meaningful use” standards. CMS has defined Stage 1 which focuses on electronically capturing health information in a coded format, implementing decision support, sharing information with patients, testing the ability to change information, and initiating the reporting of clinical quality measurement to CMS. CMS also defined Stage 2 criteria, which is scheduled to take effect in 2014. Stage 2 revises some Stage 1 criteria and builds on Stage 1 in various ways, including an increased focus on encouraging the use of IT for continuous quality improvement at the point of care, the standards-based exchange of information between providers as well as multiple patient engagement initiatives to improve care coordination . Stage 3 criteria, which is scheduled to take effect in 2016, would require eligible professionals to demonstrate the use of EHR technology that builds upon prior stages to demonstrate improvements in population health. For each stage a final rule has been implemented by the ONC to adopt an initial set of standards, implementation specifications and certification criteria to enhance the use of health information technology and support its “meaningful use.” For providers to receive “meaningful use” incentive funds, they must use EHRs that are certified according to regulations put forth by the ONC. Currently, ONC recognizes a variety of Authorized Testing and Certification Bodies (“ATCBs”) eligible to test for and designate that EHRs are certified for “meaningful use” quality reporting. These ONC-ATCBs are the only organizations capable of designating that an EHR is certified for “meaningful use” incentive capture. PrimeSUITE 2014 (v. 17.0) is 2014 compliant and was certified as a Complete EHR on February 6, 2013 by the Certification Commission for Health Information Technology (CCHIT), an ONC-ATCB, in accordance with the applicable eligible provider certification criteria adopted by the Secretary of Health and Human Services. The ONC 2014 Edition criteria supports both the Stage 1 and Stage 2 meaningful use measures required to qualify eligible providers and hospitals for funding under the American Recovery and Reinvestment Act (“ARRA”).
Privacy and Security Laws
HIPAA. The Health Insurance Portability and Accountability Act of 1996, as amended (including by the HITECH Act), including the regulations issued and effective thereunder, which we collectively refer to as HIPAA, contains substantial restrictions and requirements with respect to the use and disclosure of individuals’ protected health information. HIPAA applies to covered entities, such as certain healthcare providers and health plans, as well as business associates that perform functions on behalf of or provide services to covered entities.
As a result of our dealings with clients and others in the medical industry, which may be considered covered entities under or otherwise subject to the requirements of HIPAA, we are, in some circumstances, considered a business associate under HIPAA. As a business associate, we are subject to the HIPAA requirements relating to the privacy and security of protected health information. Among other things, HIPAA requires business associates to (i) maintain physical and technical and administrative safeguards to prevent protected health information from misuse, (ii) report security incidents and other inappropriate uses or disclosures of the information, including to individuals and governmental authorities, and (iii) assist covered entities from which we obtain health information with certain of their duties under HIPAA. Further, a limited portion of our business which operates a clearinghouse may be considered a covered entity under HIPAA. We have policies and safeguards in place intended to protect health information as required by HIPAA and have processes in place to assist us in complying with applicable laws and regulations regarding the protection of this data and responding to any security incidents.
In January of 2013, the Department of Health and Human Services provided final rule modifications and provisions as updates to HIPAA to reflect the requirements of the HITECH Act, expanding the applicability of HIPAA to our business and our physician practice customers through provisions, such as:
| | | Expanding the unintended disclosure of personal health records (PHI) defined as breach reporting, and the ability to submit a risk assessment matched to any breach incident; |
| | | Expands the definition of a “covered entity” (with a compliance date of September 23, 2013) to update business associate agreements; |
| | | Expands patient access to their health records; and |
| | | Establishes a HIPAA compliance and readiness audit program effective October 1, 2013. |
Other Laws. In addition to HIPAA, most states have enacted confidentiality laws that protect against the unauthorized disclosure of confidential health information, and many states have adopted or are considering further legislation in this area, including privacy safeguards, security standards and data security breach notification requirements. Such state laws, if more stringent than HIPAA requirements, are not preempted by the federal requirements, and we must comply with them even though they may be subject to different interpretations by various courts and other governmental authorities. In addition, numerous other state and federal laws govern the collection, dissemination, use, accesses to, confidentiality and retention of health information.
False or Fraudulent Claim Laws
There are numerous federal and state laws that forbid submission of false information or the failure to disclose information in connection with the submission and payment of physician claims for reimbursement. In some cases, these laws also forbid abuse of existing systems for such submission and payment, for example, by systematic over treatment or duplicate billing of the same services to collect increased or duplicate payments.
In particular, the federal False Claims Act, or the FCA, prohibits a person from: (i) knowingly presenting or causing to be presented a false or fraudulent claim for payment or approval by an officer, employee or agent of the United States, and (ii) conspiring to defraud the government by getting a false or fraudulent claim paid or approved by the government. In addition, the FCA prohibits a person from knowingly making, using, or causing to be made or used a false record or statement material to such a claim. The FCA’s “reverse false claim” provision also creates liability for persons who knowingly and improperly conceal the retention of an overpayment of government money. Violations of the FCA may result in treble damages, significant monetary penalties, and other collateral consequences including, potentially, exclusion from participation in federally funded healthcare programs. The scope and implications of the recent amendments to the FCA pursuant to the Fraud Enforcement and Recovery Act of 2009, or FERA, have yet to be fully determined or adjudicated and as a result it is difficult to predict how future enforcement initiatives may impact our business. Pursuant to the healthcare reform legislation enacted in March 2010, a claim that includes items or services resulting from a violation of the federal Anti-Kickback Law constitutes a false or fraudulent claim for purposes of the FCA. The scope and implications of the FERA amendments have yet to be fully determined or adjudicated and as a result it is difficult to predict how future enforcement initiatives may impact our business.
In addition, under the Civil Monetary Penalty Act of 1981, the HHS Office of Inspector General has the authority to impose administrative penalties and assessments against any person, including an organization or other entity, who, among other things, knowingly presents, or causes to be presented, to a state or federal government employee or agent certain false or otherwise improper claims.
Anti-Kickback Laws
There are numerous federal and state laws that govern patient referrals, physician financial relationships, and inducements to healthcare providers and patients. The federal healthcare Anti-Kickback Law prohibits any person or entity from offering, paying, soliciting or receiving anything of value, directly or indirectly, for the referral of patients covered by Medicare, Medicaid and other federal healthcare programs or the leasing, purchasing, ordering or arranging for or recommending the lease, purchase or order of any item, good, facility or service covered by these programs. Courts have interpreted the law to provide that a financial arrangement may violate this law if any one of the purposes of an arrangement is to encourage patient referrals or other federal healthcare program business, regardless of whether there are other legitimate purposes for the arrangement. There are several limited exclusions known as safe harbors that may protect some arrangements from enforcement penalties. Penalties for federal Anti-Kickback violations can be severe, and include imprisonment, criminal fines, civil money penalties with triple damages (when the FCA is implicated) and exclusion from participation in federal healthcare programs. Many states have similar anti-kickback laws, some of which are not limited to items or services for which payment is made by a federal healthcare program.
Stark Law and Similar State Laws
The Ethics in Patient Referrals Act, also known as the Stark Law, prohibits certain types of referral arrangements between physicians and healthcare entities. Physicians are prohibited from referring patients for certain designated health services reimbursed under federally funded programs to entities with which they or their immediate family members have a financial relationship or an ownership interest, unless such referrals fall within a specific exception. Violations of the statute can result in civil monetary penalties and/or exclusion from the Medicare and Medicaid programs. Furthermore, reimbursement claims for care rendered under forbidden referrals may be deemed false or fraudulent, resulting in liability under other fraud and abuse laws. Laws in many states (which can vary widely) similarly forbid billing based on referrals between individuals and/or entities that have various financial, ownership, or other business relationships.
Healthcare Reform Law
The Patient Protection and Affordable Care Act (ACA) was signed into law on March 23, 2010. It contains provisions directed at expanding individual access to insurance, increasing consumer protections, emphasizing prevention and wellness, improving quality and delivery system performance, expanding the health workforce, and curbing rising health care costs. The law helps achieve these goals through individual and employer requirements, expansion of public programs at the federal and state level, taxes and fees levied on various market participants, quality/health system reform, and investment in prevention/wellness and long-term care programs.
The ACA also relies heavily on state participation to achieve the goal of expanded access through high risk pools, state insurance marketplaces called exchanges, and most notably the expansion of Medicaid benefits to upwards of 20 million people nationwide who previously did not have access to the program. The law has numerous implementation phases related to various deadlines and requirements, and was originally predicted to cost nearly $1 trillion by the Congressional Budget Office. The ACA represents a significant shift in health care policy, and will continue to be closely watched as its many provisions and requirements are instituted in the marketplace.
Electronic Prescribing
States have differing prescription format and signature requirements, and many existing laws and regulations, when enacted, did not anticipate the methods of e-commerce now being developed. However, federal and state laws now allow the use of electronic prescriptions. On November 7, 2005, HHS published its final E-Prescribing and the Prescription Drug Program regulations, referred to herein as the E-Prescribing Regulations. These regulations are required by the Medicare Prescription Drug Improvement and Modernization Act of 2003 (“MMA”) and became effective beginning on January 1, 2006. The E-Prescribing Regulations consist of detailed standards and requirements, in addition to the HIPAA standards discussed previously, for prescription and other information transmitted electronically in connection with a drug benefit covered by the MMA’s Prescription Drug Benefit. These standards cover not only transactions between prescribers and dispensers for prescriptions but also electronic eligibility and benefits inquiries and drug formulary and benefit coverage information. The standards apply to prescription drug plans participating in the MMA’s Prescription Drug Benefit. Aspects of our services are affected by such regulation, as our customers need to comply with these requirements.
Anti-Tampering Laws
For certain prescriptions that cannot or may not be transmitted electronically from physician to pharmacy, both federal and state laws require that the written forms used exhibit anti-tampering features. For example, the U.S. Troop Readiness, Veterans’ Care, Katrina Recovery, and Iraq Accountability Appropriations Act of 2007 has since April 2008 required that most prescriptions covered by Medicaid must demonstrate security features that prevent copying, erasing, or counterfeiting of the written form. Because our customers will, on occasion, need to use printed forms, we must take these laws into consideration for purposes of the prescription functions of our solutions.
United States Food and Drug Administration
The U.S. Food and Drug Administration (“FDA”) has published draft guidance and other policy statements concerning its regulation of or authority over software products as medical devices. In 2011, the FDA finalized a rule classifying medical device data systems as a Class 1 device under the federal Food, Drug and Cosmetic Act, as amended (“FDCA”). The FDA has taken the position that health information technology software is a medical device under the FDCA, and we anticipate the FDA’s increased attempt to become involved in regulation of our industry. If any of our software products is considered a medical device under the FDCA, we could be subject to the FDA requirements discussed below.
Medical devices are subject to extensive regulation by the FDA under the FDCA. Under the FDCA, medical devices include any instrument, apparatus, implement, machine, contrivance, or other similar or related article, including a component part or accessory, that is intended for use in the diagnosis of disease or other conditions or in the cure, mitigation, treatment, or prevention of disease. FDA regulations govern, among other things, product development, testing, manufacture, packaging, labeling, storage, clearance or approval, advertising and promotion, sales and distribution, and import and export. FDA requirements with respect to devices that are determined to pose lesser risk to the public include:
| | | establishment registration and device listing with the FDA; |
| | | the Quality System Regulation (“QSR”), which requires manufacturers, including third-party or contract manufacturers, to follow stringent design, testing, control, documentation, and other quality assurance procedures during all aspects of manufacturing; |
| | | labeling regulations and FDA prohibitions against the advertising and promotion of products for uncleared, unapproved off-label uses and other requirements related to advertising and promotional activities; |
| | | medical device reporting regulations, which require that manufacturers report to the FDA if their device may have caused or contributed to a death or serious injury or malfunctioned in a way that would likely cause or contribute to a death or serious injury if the malfunction were to recur; |
| | | corrections and removal reporting regulations, which require that manufacturers report to the FDA any field corrections and product recalls or removals if undertaken to reduce a risk to health posed by the device or to remedy a violation of the FDCA that may present a risk to health; and |
| | | post-market surveillance regulations, which apply when necessary to protect the public health or to provide additional safety and effectiveness data for the device. |
FDA policy also requires software manufacturers and users to consider cybersecurity and data privacy issues.
Non-compliance with applicable FDA requirements can result in, among other things, public warning letters, fines, injunctions, civil penalties, recall or seizure of products, total or partial suspension of production, failure of the FDA to grant marketing approvals, withdrawal of marketing approvals, a recommendation by the FDA to disallow us from entering into government contracts, and criminal prosecutions. The FDA also has the authority to request repair, replacement, or refund of the cost of any device.
Corporate Practice of Medicine Laws, Fee-Splitting Laws, and Anti-Assignment Laws
In many states, there are laws that prohibit non-licensed practitioners from practicing medicine, prevent corporations from being licensed as practitioners, and prohibit licensed medical practitioners from practicing medicine in partnership with non-physicians, such as business corporations. In some states, these prohibitions take the form of laws or regulations forbidding the splitting of physician fees with non-physicians or others. In some cases, these laws have been interpreted to prevent business service providers from charging their physician customers on the basis of a percentage of collections or charges. There are also federal and state laws that forbid or limit assignment of claims for reimbursement from government-funded programs. Some of these laws limit the manner in which business service companies may handle payments for such claims and prevent such companies from charging their physician customers on the basis of a percentage of collections or charges. The Medicare and Medicaid programs impose specific requirements on billing agents who receive payments on behalf of medical care providers.
Employees
As of June 30, 2013, we had approximately 810 full-time employees. Approximately 600 of our employees are based at our Carrollton, Georgia headquarters. We also utilize approximately 200 independent contractors. None of our employees are represented by a union or are party to collective bargaining agreements. We believe our relationship with our employees is positive, which is a key component of our operating strategy.
Corporate Information
We were incorporated in Georgia on September 15, 1998. In connection with our initial public offering, we reincorporated in Delaware on February 7, 2012.
We have offices located at 100 Greenway Boulevard, Carrollton, Georgia 30117 and our telephone number at this location is (770) 836-3100. Our website address iswww.greenwaymedical.com.
Our annual reports on Form 10-K, including this Form 10-K, as well as our quarterly reports on Form 10-Q, current reports on Form 8-K and amendments to such reports are available, free of charge, on our website. These reports are available as soon as reasonably practicable after they are electronically filed with or furnished to the Securities and Exchange Commission (“SEC”). Information included or referred to on, or otherwise accessible through, our website is not intended to form a part of or be incorporated by reference into this report.
Our operations and financial results are subject to various risks and uncertainties, including without limitation those described below, that could materially and adversely affect our business, financial condition, results of operations, performance and the trading price of our common stock. You should carefully consider the following risks as well as the other information included in this Form 10-K, including “Management’s Discussion and Analysis of Financial Condition and Results of Operations” and our consolidated financial statements and related notes included elsewhere in this Form 10-K.
If we are unable to successfully introduce new technology solutions or services or fail to keep pace with advances in technology, our business, financial condition and results of operations will be adversely affected.
Our business depends on our ability to adapt to evolving technologies and industry standards and introduce new technology solutions and services accordingly. If we cannot adapt to changing technologies, our technology solutions and services may become obsolete, and our business would suffer. Because the healthcare information technology market is constantly evolving, our existing technology may become obsolete and fail to meet the requirements of current and potential customers. Our success will depend, in part, on our ability to continue to enhance our existing technology solutions and services, develop new technology that addresses the increasingly sophisticated and varied needs of our customers, license leading technologies and respond to technological advances and emerging industry standards and practices on a timely and cost-effective basis. The development of our proprietary technology entails significant technical and business risks. We may not be successful in developing, using, marketing, selling, or maintaining new technologies effectively or adapting our proprietary technology to evolving customer requirements or emerging industry standards, and, as a result, our business and reputation could suffer. We may not be able to introduce new technology solutions on schedule, or at all, or such solutions may not achieve market acceptance. Moreover, competitors may develop competitive products that could adversely affect our results of operations. A failure by us to introduce new products or to introduce these products on schedule could have an adverse effect on our business, financial condition and results of operations.
If we fail to implement our growth strategy or manage future growth effectively, our business would be harmed, and our recent growth rates may not be indicative of our future growth rates.
Our future success depends upon our ability to grow, and if we are unable to implement our growth strategy or manage our growth effectively, we may incur unexpected expenses and be unable to meet our customers’ requirements, all of which would negatively impact our ability to generate revenue as well as results of operations and financial condition.
To manage future growth, we will need to hire, train and retain highly skilled and motivated employees. We will also need to continue to improve our internal controls, reporting systems and procedures. If we do not effectively manage our growth, we may not be able to execute on our business plan, respond to competitive pressures, take advantage of market opportunities, satisfy customer requirements or maintain high-quality service offerings.
Our systems, procedures, controls and existing space may not be adequate to support expansion of our operations. Our future operating results will depend on the ability of our management to manage a business that operates in a constantly changing industry and regulatory environment with increasing government involvement. Our future results will also depend on the ability of our management team to implement and improve our technical, administrative, financial control and reporting systems. We may not be able to expand and upgrade our systems and infrastructure to accommodate future growth. Inability to effectively manage future growth would have a significant negative impact on our business, financial condition, and results of operations and profitability because we may incur unexpected expenses and be unable to meet our customers’ needs, expectations and requirements.
We are an emerging growth company (“EGC”) and we cannot be certain if the reduced disclosure and exemption from the auditor attestation requirements applicable to emerging growth companies may make our common stock less attractive to investors
We are an EGC as defined in the Jumpstart Our Business Startups Act of 2012 (the “JOBS Act”), and we may take advantage of certain exemptions from various reporting requirements that are applicable to other public companies that are not EGCs. We have decided to take advantage of certain of those exemptions as follows: we will not be required to comply with the auditor attestation requirements of Section 404 of the Sarbanes–Oxley Act of 2002 (Section 404”); we will not hold non–binding advisory votes on executive compensation or seek stockholder approval of any golden parachute payments not previously approved; and we may provide reduced disclosure regarding executive compensation in our periodic reports and proxy statements. While our independent auditors will not be required to formally attest to the effectiveness of our internal control over financial reporting pursuant to Section 404 until the date we are no longer an EGC, our management will be required to provide its assessment of the effectiveness of our internal control over financial reporting beginning with our annual report for the fiscal year ended June 30, 2013, and we will be required to disclose changes made in our internal control and procedures on a quarterly basis. We cannot predict if investors will find our common stock less attractive because we may rely on these exemptions. If some investors find our common stock less attractive as a result, there may be a less active trading market for our common stock and our stock price may be more volatile. We also cannot predict if the failure to seek independent auditor attestation of our internal controls over financial reporting pursuant to Section 404 will cause certain inadequacies or weaknesses in our internal controls to go undetected.
We will remain an EGC until earlier of (1) the last day of the fiscal year (a) following the fifth anniversary of the completion of our initial public offering in February 2012, (b) in which we have total annual gross revenue of at least $1.0 billion, or (c) in which we are deemed to be a large accelerated filer, which means the market value of our common stock that is held by non-affiliates exceeds $700 million as of the prior June 30th, and (2) the date on which we have issued more than $1.0 billion in non-convertible debt during the prior three-year period.
If we lose members of our management team or other employees or if we are unable to attract, hire, integrate and retain other necessary employees, our business would be harmed.
The future of our business is highly dependent on our ability to innovate. Further, our future success depends in part on our ability to attract, hire, integrate and retain the members of our management team and other qualified personnel, such as members of our innovation team. Our future success also depends on the continued contributions of our executive officers, each of whom may be difficult to replace. The loss of any of our executive officers or the inability to continue to attract qualified personnel could have a material adverse effect on our business. We do not have employment agreements with any of our executive officers. The replacement of any of these executives would involve significant time and expense and may significantly delay or prevent the achievement of our business objectives. Competition for the caliber and number of employees we require is intense. We may face difficulty identifying and hiring qualified personnel at compensation levels consistent with our existing compensation and salary structure. In addition, we invest significant time and expense in training each of our employees, which increases their value to competitors who may seek to recruit them. If we fail to retain our employees, we could incur significant expenses in hiring, integrating and training their replacements and the quality of our services and our ability to serve our customers could diminish, resulting in a material adverse effect on our business.
We may not be able to maintain or increase our profitability.
We may not succeed in maintaining or increasing our profitability on an annual basis and could incur quarterly or annual losses in future periods. We have and expect to continue to incur additional operating expenses associated with our new status as a public company and we intend to continue to increase our operating expenses as we grow our business. We also expect to continue to make investments in our proprietary technology solutions, sales and marketing, infrastructure, facilities and other resources as we seek to grow, thereby incurring additional costs. If our revenue does not increase to offset these increases in costs, our operating results would be negatively affected. You should not consider our historic revenue growth rates as indicative of future growth rates.
Disruptions in service or damage to our third-party providers’ data centers could adversely affect our business.
We rely on third parties who provide access to data centers. Our information technologies and systems are vulnerable to damage or interruption from various causes, including (i) acts of God and other natural disasters, war and acts of terrorism and (ii) power losses, computer systems failures, internet and telecommunications or data network failures, operator error, losses of and corruption of data and similar events. We conduct business continuity planning and work with our third-party providers to protect against fires, floods, other natural disasters and general business interruptions to mitigate the adverse effects of a disruption, relocation or change in operating environment at the data centers we utilize. The situations we plan for and the amount of insurance coverage we maintain may not be adequate in any particular case. In addition, the occurrence of any of these events could result in interruptions, delays or cessations in service to our customers. Any of these events could impair or prohibit our ability to provide our services, reduce the attractiveness of our services to current or potential customers and adversely impact our financial condition and results of operations.
In addition, despite the implementation of security measures, our infrastructure, data centers, or systems that we interface with, including the Internet and related systems, may be vulnerable to physical break-ins, hackers, improper employee or contractor access, computer viruses, programming errors, denial-of-service attacks or other attacks by third-parties seeking to disrupt operations or misappropriate information or similar physical or electronic breaches of security. Any of these can cause system failure, including network, software or hardware failure, which can result in service disruptions. As a result, we may be required to expend significant capital and other resources to protect against security breaches and hackers or to alleviate problems caused by such breaches.
We may be liable for use of content we provide.
We provide content for use by healthcare providers in treating patients. This content includes coding and drug databases developed by third-parties and prepopulated templates providers can use to document visits and record patient health information. If this content in the third-party databases is incorrect or incomplete, adverse consequences, including death, may occur and give rise to product liability and other claims against us. A court or government agency may take the position that our delivery of health information directly, including through licensed practitioners, or delivery of information by a third-party site that a consumer accesses through our websites, exposes us to personal injury liability, or other liability for wrongful delivery or handling of healthcare services or erroneous health information. While we maintain product liability insurance coverage in an amount that we believe is sufficient for our business, this coverage may not be adequate or continue to be available on acceptable terms, if at all. A claim brought against us that is uninsured or under-insured could harm our business, financial condition and results of operations. Even unsuccessful claims could result in substantial costs and diversion of management resources.
We operate in a highly competitive industry, and our competitors may be able to compete more efficiently or evolve more rapidly than we do, which could have a material adverse effect on our business, revenue, growth rates and market share.
The market for EHR, PM and other healthcare information technologies is highly competitive and we expect competition to increase in the future. We face competition from existing and new entrants. We believe our most significant competitors in EHR and PM are Allscripts, athenahealth, Cerner, eClinicalWorks, Epic, GE, Quality Systems, and Vitera Healthcare Solutions. Our competitors may be able to respond more quickly and effectively than we can to new or changing opportunities, technologies, standards, regulations or customer needs and requirements. Some of these competitors have longer operating histories, greater brand recognition and greater financial, marketing and other resources than us. Moreover, we expect that competition will continue to increase as a result of incentives provided by the HITECH Act, which was enacted in 2009 as part of the ARRA and consolidation in both the information technology and healthcare industries. Further, if one or more of our competitors or potential competitors were to merge or partner with another of our competitors, the change in the competitive landscape could adversely affect our ability to compete effectively. We may not be able to compete successfully with these companies, and these or other competitors may introduce technologies or services that render our technologies or services obsolete or less marketable. Even if our technology solutions and services are more effective than the offerings of our competitors, current or potential customers might prefer competitive technologies or services to our technology solutions and services. Increased competition could also result in pricing pressures, which would negatively impact our margins, growth rate or market share.
If providers do not purchase our technology solutions and services or delay in choosing our solutions or services, our business, financial condition and results of operations will be adversely affected.
Our business model depends on our ability to sell our technology solutions and services. Acceptance of our technology solutions and services may require providers to adopt different behavior patterns and new methods of conducting business and exchanging information. Providers may not integrate our technology solutions and services into their workflow and may not accept our solutions and services as a replacement for traditional methods of practicing medicine. Achieving market acceptance for our solutions and services will continue to require substantial sales and marketing efforts and the expenditure of significant financial and other resources to create awareness and demand by providers. If providers fail to broadly accept our technology solutions and services, or if we fail to position our technology solutions and services as a preferred method for information management and healthcare delivery, our business, financial condition and results of operations will be adversely affected.
Government programs in the United States initiated to accelerate the adoption and utilization of health information technology and to counter the effects of the current economic situation, may not be effective in changing the behavior of providers or may not be fully implemented or fully funded by the government.
While government programs have been initiated to improve the efficiency and quality of the healthcare sector and also counter the effects of the current economic situation, including expenditures to stimulate business and accelerate the adoption and utilization of health care technology, these programs may not be fully implemented or fully funded and there is no guarantee that our customers will receive any of these funds. For example, the passage of the HITECH Act authorizes more than $19 billion in expenditures to incentivize adoption of electronic health records. Although we believe that our technology solutions and services will meet the requirements of the HITECH Act, qualifying our customers for financial incentives, these financial incentives, may not apply to our technology solutions or services. Also, providers may be slow to adopt EHR systems in response to these government programs, may not select our technology solutions and services, or may decide not implement an EHR system at all. Any delay in the purchase of our EHR technology solutions and services in response to government programs, or the failure of providers to purchase an EHR system, could have an adverse effect on our business, growth rate, financial condition and results of operations. It is also possible that in light of the budget deficit and the increasing pressure to reduce federal government expenditures or for other economic or political reasons, Congress may repeal or not fund the HITECH Act as originally planned or otherwise amend it in a manner that have an adverse effect on our business.
We must ensure our EHR systems are certified pursuant to the HITECH Act standards, and failure to continue to provide solutions that are certified could put us at a competitive disadvantage.
The HITECH Act provides financial incentives for healthcare providers that demonstrate “meaningful use” of EHR and mandates use of health information technology systems that are certified according to technical standards developed under the supervision of the U.S. Department of Health and Human Services (“HHS”). The HITECH Act also imposes certain requirements upon governmental agencies to use, and requires health care providers, health plans, and insurers contracting with such agencies to use, systems that are certified according to such standards. Such standards and implementation specifications that are being developed under the HITECH Act includes named standards, architectures, and software schemes for the authentication and security of individually identifiable health information and the creation of common solutions across disparate entities.
The HITECH Act’s certification requirements affect our business because we have invested and continue to invest in conforming our technology solutions to these standards. HHS has contracted with CCHIT to develop certification programs for electronic health records and health information exchanges. PrimeSUITE 2014 has been certified as a complete EHR for eligible providers by CCHIT, which indicates that our EHR product meet the 2014 eligible provider criteria to support Stage 1 “meaningful use” as required by HHS to assist providers in their efforts to meet the goals and objectives of “meaningful use,” making such providers and hospitals eligible for funding under the HITECH Act if our EHR is used appropriately. However, Stage 1 only refers to the first set of “meaningful use” objectives that must be met to be eligible for incentive payments. Stage 2 criteria, which is set to begin in 2014 for eligible providers, expands upon the Stage 1 criteria while ensuring a focus on the meaningful use of EHRs. PrimeSUITE 2014 has been certified as a complete EHR product by CCHIT on substantially all the 2014 criteria available at this time, which supports both “Stage 1 and Stage 2 meaningful use measures”, Stage 3 requirements have yet to be defined. As the standards are developed, we may need to use additional resources to meet the newly defined requirements, which could lead to delays necessary to modify our technology solutions. We must ensure that our technology solutions are or will be certified according to applicable HITECH Act technical standards so that our customers have an opportunity to qualify for “meaningful use” incentive payments. Failure to comply could jeopardize our relationships with customers who are relying upon us to provide certified software. Lastly, if for some reason we are not able to comply with these applicable HITECH Act standards within the required timeframe, our products and services could be less attractive to customers than the offerings of other EHR vendors who have complied.
Our technology solutions are required to meet the standards for interoperability, which could require us to incur substantial additional development costs.
Our customers and the industry leaders enacting regulatory requirements are concerned with and often require that our technology solutions and healthcare devices be interoperable with other third party healthcare information technology suppliers. Market forces or regulatory authorities could create software interoperability standards that would apply to our solutions, and if our technology solutions are not consistent with those standards, we could be forced to incur substantial additional development costs. CCHIT has developed a comprehensive set of criteria for the functionality, interoperability and security of various software modules in the healthcare information technology industry. CCHIT, however, continues to modify and refine those standards. Achieving and maintaining CCHIT certification is a competitive imperative that could result in larger than expected software development expenses and administrative expenses in order to conform to these requirements. These standards and specifications, once finalized, will be subject to interpretation by the entities designated to certify such technology. We will incur increased development costs in delivering solutions if we need to change or enhance our technology solutions to be in compliance with these varying and evolving standards, and delays may result in connection therewith. If our technology solutions are not consistent with these evolving standards, our market position and sales could be impaired and we may have to invest significantly in changes to our technology solutions. In addition, HHS may require other additional certifications from additional certifying bodies. If we are required to obtain certification from additional bodies, it would be costly and outcomes are unknown.
If our security measures are breached or fail and unauthorized access is obtained to a customer’s data, our service may be perceived as insecure, the attractiveness of our services to current or potential customers may be reduced, and we may incur significant liabilities.
Our services involve the storage and transmission of customers’ proprietary information and patient information, including health, financial, payment and other personal or confidential information. We rely on proprietary and commercially available systems, software, tools and monitoring, as well as other processes, to provide security for processing, transmission and storage of such information. Because of the sensitivity of this information and due to requirements under applicable laws and regulations, the effectiveness of such security efforts is very important. If our security measures are breached or fail as a result of third-party action, employee error, malfeasance or otherwise, someone may be able to obtain unauthorized access to customer or patient data. Improper activities by third-parties, advances in computer and software capabilities and encryption technology, new tools and discoveries and other events or developments may facilitate or result in a compromise or breach of our computer systems. Techniques used to obtain unauthorized access or to sabotage systems change frequently and generally are not recognized until launched against a target, and we may be unable to anticipate these techniques or fail to implement adequate preventive measures. Our security measures may not be effective in preventing such unauthorized access. If a breach of our security occurs, we could face damages for contract breach, penalties for violation of applicable laws or regulations, possible lawsuits by individuals affected by the breach and significant remediation costs and efforts to prevent future occurrences. In addition, whether there is an actual or a perceived breach of our security, the market perception of the effectiveness of our security measures could be harmed and we could lose current or potential customers.
Our growth depends, in part, on establishing and maintaining strategic relationships.
We must continue to maintain our existing strategic relationships, such as we have with Walgreens and McGraw Hill. We also need to establish additional strategic relationships with leaders in a number of healthcare and health information technology industry segments. We believe that these relationships contribute towards our ability to increase exposure to our technology solutions to a larger number of healthcare providers and further enhance the Greenway brand. These relationships also assist us in developing and deploying new technology solutions and services, and generate sources of additional revenue and cash flows.
We must carefully manage these relationships as strategic partners may decide to compete with us in some or all of our markets. In addition, we may not be able to maintain or establish relationships with potential partners if we conduct business with their competitors. We depend, in part, on our strategic partners’ ability to generate increased acceptance and use of our technology and services. Many of these strategic relationships, such as Walgreens and McGraw Hill, are new and have yet to be fully developed. We may not fully realize the expected benefits of such relationships. Further, if we lose any of these strategic relationships or fail to establish additional relationships, or if our strategic relationships fail to benefit us as expected, we may not be able to execute our business plan, and our business, financial condition and results of operations may suffer.
We offer our services in many states and, therefore, may be subject to state and local taxes that could harm our business or that we may have inadvertently failed to pay.
We may lose sales or incur significant costs should various tax jurisdictions be successful in imposing taxes on a broader range of services. Imposition of such taxes on our services could result in substantial unplanned costs, would effectively increase the cost of such services to our customers and may adversely affect our ability to retain existing customers or to gain new customers in the areas in which such taxes are imposed.
Future acquisitions may result in potentially dilutive issuances of equity securities, the incurrence of indebtedness and increased amortization expense.
Future acquisitions may result in dilutive issuances of equity securities, the incurrence of debt, the assumption of known and unknown liabilities, the write-off of software development costs and the amortization of expenses related to intangible assets, all of which could have an adverse effect on our business, financial condition and results of operations.
We may have difficulty integrating future acquisitions into our business.
We may from time to time acquire other companies or their businesses. As a result, we may be exposed to several risks relating to integrating these additional businesses, including those risks listed below, any of which may adversely affect our business or operating results:
| | ● | inability to integrate new operations, products, services and personnel; |
| | ● | diversion of resources from our existing business; |
| | | failure in client communication and branding awareness; |
| | | inability to generate revenue from new products and services sufficient to offset associated acquisition costs; |
| | | inability to maintain uniform standards, controls and policies; |
| | | accounting issues that adversely affect our financial results; |
| | | impairment of employee and customer relations as a result of any integration of new management personnel; and |
| | | assumption of liabilities or other obligations associated with an acquired business. |
We may be unable to adequately establish, protect or enforce our intellectual property.
Our success depends, in part, upon our ability to establish, protect and enforce our intellectual property and other proprietary rights. If we fail to establish, protect or enforce our intellectual property rights, we may lose an important advantage in the market in which we compete. We rely on a combination of patent, trademark, copyright and trade secret law and contractual obligations to protect our key intellectual property rights, all of which provide only limited protection. Our intellectual property rights may not be sufficient to help us maintain our position in the market and our competitive advantages. Although we have filed 17 U.S. patent applications, some or all of these patents may not be issued and therefore, may not provide us with the protection that we seek. We have been issued five U.S. patents, however, any patents issued to us could be challenged, invalidated or circumvented. Legal standards relating to the validity, enforceability and scope of protection of intellectual property are uncertain. Any patents that may be issued in the future from pending or future patent applications or our five issued patents may not provide sufficiently broad protection or may not prove to be enforceable in actions against alleged infringers. Also, any other intellectual property registrations may not be issued for pending or future applications and may not be enforceable or provide adequate protection of our proprietary rights.
We also rely on trade secrets to protect our proprietary technology. Trade secrets may not be protectable if not properly kept confidential. We strive to enter into non-disclosure agreements with our employees, customers, contractors and business partners to limit access to and disclosure of our proprietary information. The steps we have taken, however, may not be sufficient to prevent unauthorized use of our technology, and adequate remedies may not be available in the event of unauthorized use or disclosure of our trade secrets and proprietary technology. Moreover, others may reverse engineer or independently develop technologies that are competitive to ours or infringe our intellectual property.
Accordingly, despite our efforts, we may be unable to prevent third parties from using our intellectual property or our technology for their competitive advantage. Any such use could have a material adverse effect on our business, results of operations and financial condition. Monitoring unauthorized uses of and enforcing our intellectual property rights can be difficult and costly. Legal intellectual property actions are inherently uncertain and may not be successful, and may require a substantial amount of resources and divert our management’s attention.
Claims by others that we infringe their intellectual property could force us to incur significant costs or revise the way we conduct our business.
Our competitors protect their proprietary rights by means of patents, trade secrets, copyrights, trademarks and other intellectual property. We have not conducted an independent review of patents and other intellectual property issued to third-parties. Because patent applications in the United States and many other jurisdictions are kept confidential for 18 months before they are published, we may be unaware of third parties’ patent applications, some which may relate to our proprietary technology. We may receive letters from third parties alleging, or inquiring about, possible infringement misappropriation or violation of their intellectual property rights. Any party asserting that we infringe, misappropriate or violate proprietary rights may force us to defend ourselves, and potentially our customers, against the alleged claim. These claims and any resulting lawsuit, if successful, could subject us to significant liability for damages and/or invalidation of our proprietary rights or interruption or cessation of our operations. The risk of such claims and lawsuits will likely increase as we increase in size, the scope of our services and technology platforms increase, our geographic presence and market share expand and the number of competitors in our market increases. Any such claims or lawsuit could:
| | ● | be time-consuming and expensive to defend, whether meritorious or not; |
| | ● | require us to stop providing products or services that use the technology that allegedly infringes the other party’s intellectual property; |
| | ● | divert the attention of our technical and managerial resources; |
| | ● | require us to enter into royalty or licensing agreements with third-parties, which may not be available on terms that we deem acceptable; |
| | ● | prevent us from operating all or a portion of our business or force us to redesign our products, services or technology platforms, which could be difficult and expensive and may make the performance or value of our product or service offerings less attractive; |
| | ● | subject us to significant liability for damages or result in significant settlement payments; or |
| | ● | require us to indemnify our customers, as certain of our customer contracts require us to indemnify the customer for certain claims of infringement or alleged infringement of third-party’s intellectual property rights resulting from customer’s use of our intellectual property. |
Furthermore, during the course of litigation, confidential information may be disclosed in the form of documents or testimony in connection with discovery requests, depositions or trial testimony. Disclosure of our confidential information and our involvement in intellectual property litigation could materially adversely affect our business. Some of our competitors may be able to sustain the costs of intellectual property litigation more effectively than we can because they have substantially greater resources. In addition, any litigation could significantly harm our relationships with current and prospective customers. Any of the foregoing could disrupt our business and have a material adverse effect on our business, operating results and financial condition.
We may need additional capital to fund our operations and finance our growth, and we may not be able to secure such capital on terms acceptable to us, or at all.
In order for us to grow and successfully execute our business plan, we may require additional financing which may not be available or may not be available on acceptable terms. If such financing is available, it may dilute the existing stockholders’ ownership interests in the Company. Failure to obtain financing may have a material adverse effect on our financial position and may cause you to lose your entire investment in the Company. In addition, if we are unable to secure additional financing on acceptable terms or at all, it will impact our ability to conduct acquisitions.
We depend upon third-party service providers for certain technologies. If these third-party providers fail to fulfill their contractual obligations to us, fail to maintain or support those technologies or choose not to sell them to us, our business and operations could be disrupted and our operating results would be harmed.
We have entered into certain arrangements with third-party service providers. Technologies provided by these providers support some of our solutions. If these technologies fail or are of poor quality, our business, reputation and operating results could be harmed. Failure of the service providers to perform satisfactorily could result in client dissatisfaction, disrupt our operations and adversely affect operating results. With respect to these service providers, we have significantly less control over the technologies they provide to us than if we maintained and operated them ourselves, which increases our risk. In some cases, functions necessary to some of our solutions are performed by these third-party technologies. If we need to find an alternative source for performing these functions, we may have to expend significant money, resources and time to develop the alternative, and if this development is not accomplished in a timely manner and without significant disruption to our business, we may be unable to fulfill our responsibilities to clients or the expectations of clients, with the attendant potential for liability claims and a loss of business reputation.
Demand by smaller providers could accelerate transition to a subscription pricing model which could reduce near-term revenue.
The adoption of EHRs by the large untapped market of smaller provider customers and their greater need to minimize capital outlays could accelerate adoption of subscription-based arrangements as opposed to perpetual licensing arrangements. Under subscription-based arrangements, providers pay a monthly fee over a 36 to 60 month term to utilize our software as compared to perpetual license arrangements, under which providers utilize our software in exchange for a one-time license fee. While an increased amount of subscription arrangements will result in increased recurring revenue over a longer period of time than we have achieved historically, near-term revenue would be reduced as a result, while costs associated with these sales would still be expensed currently. For comparable transactions entered into at the beginning of an annual period, the impact of subscription-based versus perpetual license arrangements would have the effect of reducing the license revenue to be recognized by 66% to 80% in the initial year which would then be made up over the remaining two to five years of the subscription arrangement. If we fail to appropriately price our subscription fees to account for the decrease in near-term revenue, it could have an adverse effect on our business.
The terms of our existing credit facility and future indebtedness could restrict our operations, particularly our ability to respond to changes in our business or to take specified actions.
Our existing credit facility contains, and any future indebtedness would likely contain, a number of restrictive covenants that impose significant operating and financial restrictions on us, including restrictions on our ability to take actions that may be in our best interests. The credit facility includes covenants, including requirements that:
| | ● | restrict our ability to pay dividends on, repurchase or make distributions in respect of our capital stock or make other restricted payments; |
| | ● | limit our ability to make certain investments or sell or transfer assets; |
| | ● | require us to obtain consent from our lenders with respect to acquisitions under certain circumstances; |
| | ● | restrict our ability to consolidate, merge, sell or otherwise dispose of our properties or assets; and |
| | ● | we do not impair our lenders’ security interests in our assets. |
Our credit facility requires us to satisfy and maintain specified financial ratios. Our ability to meet those financial ratios can be affected by events beyond our control, and we may not be able to continue to meet those ratios. A breach of any of these covenants could result in a default under the credit facility.
Upon the occurrence of an event of default, our lenders could elect to declare all amounts outstanding under the credit facility to be immediately due and payable and terminate all commitments to extend further credit. If we were unable to repay those amounts, the lenders under the credit facility could proceed against the collateral granted to them to secure such indebtedness. We have pledged all of our assets and personal property as collateral under the credit facility. If any of the lenders accelerate the repayment of borrowings, we may not have sufficient funds to repay our existing debt.
The healthcare industry is heavily regulated. Our failure to comply with regulatory requirements could create liability for us, result in adverse publicity and negatively affect our business.
The healthcare industry is heavily regulated and is constantly evolving due to the changing political, legislative, regulatory landscape and other factors. Many healthcare laws are complex, and their application to specific services and relationships may not be clear. In particular, many existing healthcare laws and regulations, when enacted, did not anticipate or address the services that we provide. Further, healthcare laws differ from state to state and it is difficult to ensure our business complies with evolving laws in all states. Our operations may be adversely affected by enforcement initiatives. Our failure to accurately anticipate the application of these laws and regulations to our business, or any other failure to comply with regulatory requirements, could create liability for us, result in adverse publicity and negatively affect our business. Federal and state legislatures and agencies periodically consider proposals to revise aspects of the healthcare industry or to revise or create additional statutory and regulatory requirements. Such proposals, if implemented, could impact our operations, the use of our services and our ability to market new services, or could create unexpected liabilities for us. We cannot predict what changes to laws or regulations might be made in the future or how those changes could affect our business or our operating costs.
For example, recently enacted public laws reforming the U.S. healthcare system may impact our business. The Patient Protection and Affordable Care Act (“PPACA”) and The Health Care and Education and Reconciliation Act of 2010 (the “Reconciliation Act”), which amends the PPACA (collectively the “Health Reform Laws”), were signed into law in March 2010. The Health Reform Laws contain various provisions which may impact the Company and our customers. Some of these provisions may have a positive impact, by expanding the use of electronic health records in certain federal programs, for example, while others, such as reductions in reimbursement for certain types of providers, may have a negative impact due to fewer available resources. Increases in fraud and abuse penalties may also adversely affect participants in the health care sector, including the Company.
If a breach of our measures protecting personal data covered by HIPAA or the HITECH Act occurs, we may incur significant liabilities.
The Health Insurance Portability and Accountability Act of 1996, as amended (“HIPAA”), and the regulations that have been issued under it contain substantial restrictions and requirements with respect to the use, collection, storage and disclosure of individuals’ protected health information. Under HIPAA, covered entities must establish administrative, physical and technical safeguards to protect the confidentiality, integrity and availability of electronic protected health information maintained or transmitted by them or by others on their behalf. In February 2009, HIPAA was amended by the HITECH Act to add provisions that impose certain of HIPAA’s privacy and security requirements directly upon business associates of covered entities. The HITECH Act transferred enforcement authority of the security rule from the Centers for Medicaid and Medicare Services (“CMS”) to the Office for Civil Rights of HHS, thereby consolidating authority over the privacy and security rules under a single office within HHS. Further, HITECH empowered state attorneys general to enforce HIPAA. In March 2013, the HIPAA Omnibus Final Rule took effect. It implements the HITECH Act and expands the reach of HIPAA by clarifying that those who “maintain and transmit” protected health information on behalf of covered entities are subject to many of those rules as business associates of those covered entities. Compliance with the final HIPAA omnibus rule is generally required by September 2013.
The HITECH Act heightened enforcement of privacy and security rules, indicating that the imposition of penalties will likely be more common in the future and such penalties will be more severe. For example, the HITECH Act requires that the HHS fully investigate all complaints if a preliminary investigation of the facts indicates a possible violation due to “willful neglect” and impose penalties if such neglect is found. Further, where our liability as a business associate to our clients was previously merely contractual in nature, the HITECH Act now treats the breach of duty under a business associate agreement to carry the same liability as if the covered entity engaged in the breach. In other words, as a business associate, we are now directly responsible for complying with HIPAA. While we strive to adhere to strict policies and procedures, we may find ourselves subject to increased liability as a possible liable party and we may incur increased costs as we implement the various obligations between clients through these agreements.
Finally, regulations also require business associates to notify covered entities, who in turn must notify affected individuals and government authorities of data security breaches involving unsecured protected health information. Our customers are covered entities and we are a business associate of our customers under HIPAA and the HITECH Act as a result of our contractual obligations to perform certain functions on behalf of and provide certain services to those customers. Further, a limited portion of our business which operates a clearinghouse may be considered a covered entity under HIPAA. We have performed an assessment of the potential risks and vulnerabilities to the confidentiality, integrity and availability of electronic health information. In response to this risk analysis, we implemented and maintain physical, technical and administrative safeguards intended to protect all personal data and have processes in place to assist us in complying with applicable laws and regulations regarding the protection of this data and properly responding to any security incidents. If we knowingly breach the HITECH Act’s requirements, we could be exposed to criminal liability. A breach of our safeguards and processes could expose us to civil penalties (up to $1.5 million for identical incidences) and the possibility of civil litigation.
If we or our customers fail to comply with federal and state laws governing submission of false or fraudulent claims to government healthcare programs and financial relationships among healthcare providers, we or our customers may be subject to civil and criminal penalties or loss of eligibility to participate in government healthcare programs.
As a participant in the healthcare industry, our operations and relationships, and those of our customers, are regulated by a number of federal, state and local governmental entities. The impact of these regulations can adversely affect us even though we may not be directly regulated by specific healthcare laws and regulations. We must ensure that our technology solutions can be used by our customers in a manner that complies with those laws and regulations. Inability of our customers to do so could affect the marketability of our technology solutions or our compliance with our customer contracts, or even expose us to direct liability under the theory that we had assisted our customers in a violation of healthcare laws or regulations. A number of federal and state laws, including anti-kickback restrictions and laws prohibiting the submission of false or fraudulent claims, apply to healthcare providers and others that make, offer, seek or receive referrals or payments for technology solutions or services that may be paid for through any federal or state healthcare program and, in some instances, any private program. These laws are complex and their application to our specific services and relationships may not be clear and may be applied to our business in ways that we do not anticipate. Federal and state regulatory and law enforcement authorities have recently increased enforcement activities with respect to Medicare and Medicaid fraud and abuse regulations and other healthcare reimbursement laws and rules. From time to time, participants in the healthcare industry receive inquiries or subpoenas to produce documents in connection with government investigations. We could be required to expend significant time and resources to comply with these requests, and the attention of our management team could be diverted by these efforts. The occurrence of any of these events could give our customers the right to terminate our contracts with us and result in significant harm to our business and financial condition.
These laws and regulations may change rapidly, and it is frequently unclear how they apply to our business. Any failure of our technology solutions or services to comply with these laws and regulations could result in substantial civil or criminal liability and could, among other things, adversely affect demand for our services, invalidate all or portions of some of our contracts with our customers, require us to change or terminate some portions of our business, require us to refund portions of our revenue, cause us to be disqualified from serving customers doing business with government payers, and give our customers the right to terminate our contracts with them, any one of which could have an adverse effect on our business.
The market price of our common stock may be volatile, which could cause the value of our common stock to decline.
The trading price of our common stock may be volatile and could be subject to wide fluctuations in response to various factors. In addition to the risks described in this section, factors that may cause the market price of our common stock to fluctuate include:
| | ● | fluctuations in our quarterly financial results or the quarterly financial results of companies perceived to be similar to us; |
| | ● | changes in estimates of our financial results or recommendations by securities analysts; |
| | ● | investors’ general perception of us; and |
| | ● | changes in general economic, industry and market conditions. |
In addition, if the stock market in general experiences a loss of investor confidence, the trading price of our common stock could decline for reasons unrelated to our business, financial condition or results of operations.
Some companies that have had volatile market prices for their securities have had securities class actions filed against them. If a suit were filed against us, regardless of its merits or outcome, it would likely result in substantial costs and divert management’s attention and resources. This could have a material adverse effect on our business, operating results and financial condition.
The requirements of being a public reporting company, including compliance with the reporting requirements of the Securities Exchange Act of 1934, the requirements of the Sarbanes-Oxley Act of 2002 and adoption of corporate governance practices that are customary for public companies, may strain our resources, increase our costs and distract management; and we may be unable to comply with these requirements in a timely or cost-effective manner.
As a public company, we are required to ensure that we have the ability to prepare consolidated financial statements that comply with SEC reporting requirements on a timely basis. We are also subject to other reporting and corporate governance requirements, including the New York Stock Exchange listing standards and certain provisions of the Sarbanes-Oxley Act of 2002 (the “Sarbanes-Oxley Act”) and the regulations promulgated thereunder, which impose significant compliance obligations upon us. Specifically, we are required to:
| | ● | prepare and distribute periodic reports and other stockholder communications in compliance with our obligations under the federal securities laws and applicable stock exchange rules; |
| | ● | create or expand the roles and duties of our Board of Directors and committees of the board; |
| | ● | institute compliance and internal audit functions that are more comprehensive; |
| | ● | evaluate and maintain our system of internal control over financial reporting, and, report on management’s assessment thereof, in compliance with the requirements of Section 404 of the Sarbanes-Oxley Act and the related rules and regulations of the SEC and the Public Company Accounting Oversight Board; |
| | ● | involve and retain outside legal counsel and accountants in connection with the activities listed above; |
| | ● | enhance our investor relations function; and |
| | ● | maintain internal policies, including those relating to disclosure controls and procedures. |
As a public company, we are required to commit significant resources and management time and attention to the above-listed requirements, which cause us to incur significant costs and which may place a strain on our systems and resources. As a result, our management’s attention might be diverted from other business concerns. In addition, we might not be successful in implementing these requirements. The cost of preparing and filing annual and quarterly reports, proxy statements and other information with the SEC and furnishing audited reports to stockholders cause our expenses to be higher than they would be if we had remained a privately-held company.
In addition, the Sarbanes-Oxley Act requires that we maintain effective disclosure controls and procedures and internal control over financial reporting. To maintain and improve the effectiveness of our disclosure controls and procedures, significant resources and management oversight are required. We are implementing additional procedures and processes for the purpose of addressing the standards and requirements applicable to public companies. We have and continue to incur significant additional annual expenses related to these activities and, among other things, additional directors’ and officers’ liability insurance, director fees, reporting requirements, transfer agent fees, hiring additional accounting, legal and administrative personnel, increased auditing and legal fees and similar expenses. We may not be able to conclude on an ongoing basis that we have effective internal control over financial reporting in accordance with Section 404 of the Sarbanes-Oxley Act or our independent registered public accounting firm may not issue a favorable assessment. If either we are unable to conclude that we have effective internal control over financial reporting or our independent registered public accounting firm are unable to provide us with an unqualified report, investors could lose confidence in our reported financial information, which could have a negative effect on the trading price of our stock.
Evolving regulation of corporate governance and public disclosure may result in additional expenses and continuing uncertainty.
Changing laws, regulations and standards relating to corporate governance and public disclosure, including the Sarbanes-Oxley Act, new SEC regulations, the Dodd–Frank Wall Street Reform and Consumer Protection Act and New York Stock Exchange rules are creating uncertainty for public companies. We continually evaluate and monitor developments with respect to new and proposed rules and cannot predict or estimate the amount of the additional costs we may incur or the timing of such costs. These new or changed laws, regulations and standards are subject to varying interpretations, in many cases due to their lack of specificity, and as a result, their application in practice may evolve over time as new guidance is provided by regulatory and governing bodies. This could result in continuing uncertainty regarding compliance matters and higher costs necessitated by ongoing revisions to disclosure and governance practices.
We are committed to maintaining high standards of corporate governance and public disclosure. If our efforts to comply with new or changed laws, regulations and standards differ from the activities intended by regulatory or governing bodies due to ambiguities related to practice, regulatory authorities may initiate legal proceedings against us and we may be harmed.
Future sales of shares by existing stockholders or the possibility or perception of such future sales could cause our stock price to decline.
Sales of a substantial number of shares of common stock in the public market, or the perception that these sales could occur, could substantially decrease the market price of our common stock. If our existing stockholders sell, or indicate an intention to sell, substantial amounts of our common stock in the public market, the trading price of our common stock could decline. Substantially all of the shares of our common stock are eligible for sale in the public market.
Your ability to influence corporate matters may be limited because a small number of stockholders beneficially own a substantial amount of our common stock and have substantial control over us.
As of September 10, 2013, our officers, directors and principal stockholders (greater than 5% stockholders) collectively beneficially own approximately 53% of our issued and outstanding common stock. As a result, these stockholders may be able to exertsignificant influence over all matters requiring stockholder approval, including the election of directors and approval of significant corporate transactions, such as a merger or other sale of our Company or its assets, and may have interests that are different from yours and may vote in a way with which you disagree and which may be adverse to your interests. In addition, this concentration of ownership may have the effect of preventing, discouraging or deferring a change of control, which could depress the market price of our common stock.
Transactions engaged in by our principal stockholders, our officers or directors involving our common stock may have an adverse effect on the price of our stock.
As described above, as of September 10, 2013, our officers, directors and principal stockholders (greater than 5% stockholders) collectively control approximately 53% of our issued and outstanding common stock. Subsequent sales of our shares by these stockholders could have the effect of lowering our stock price. The perceived risk associated with the possible sale of a large number of shares by these stockholders, or the adoption of significant short positions by hedge funds or other significant investors, could cause some of our stockholders to sell their stock, thus causing the price of our stock to decline. In addition, actual or anticipated downward pressure on our stock price due to actual or anticipated sales of stock by our directors or officers could cause other institutions or individuals to engage in short sales of our common stock, which may further cause the price of our stock to decline. From time to time our directors and executive officers may sell shares of our common stock on the open market. These sales will be publicly disclosed in filings made with the SEC. In the future, our directors and executive officers may sell a significant number of shares for a variety of reasons unrelated to the performance of our business. Our stockholders may perceive these sales as a reflection on management’s view of the business and result in some stockholders selling their shares of our common stock. These sales could cause the price of our stock to drop.
Provisions in our corporate governing documents and Delaware law may discourage a takeover attempt.
Provisions contained in our certificate of incorporation and Delaware law impose various procedural and other requirements, which could make it more difficult for a third party to acquire us or for stockholders to effect certain corporate actions. For example, our certificate of incorporation authorizes our Board of Directors to determine the rights, preferences, privileges and restrictions of unissued series of preferred stock, without any vote or action by our stockholders. Therefore, the Board of Directors can authorize and issue shares of preferred stock with voting or conversion rights that could adversely affect the voting or other rights of holders of our common stock. In addition, our certificate of incorporation and bylaws provide for a staggered, or classified Board of Directors consisting of three classes of directors, each serving staggered three-year terms. These rights may have the effect of delaying or deterring a change of control of our Company. These provisions could limit the price that certain investors may be willing to pay in the future for shares of our common stock.
Stockholders may be diluted by future issuances of capital stock or securities or instruments that are convertible into our capital stock.
Our Board of Directors has the authority, without action or vote of our stockholders, to issue all or any part of our authorized but unissued shares of common stock, including shares that may be issued to satisfy our obligations under our equity incentive plans, shares of our authorized but unissued preferred stock and securities and instruments that are convertible into our common stock. Issuances of common stock or voting preferred stock would reduce your influence over matters on which our stockholders vote and, in the case of issuances of preferred stock, likely would result in your interest in us being subject to the prior rights of holders of that preferred stock.
Further, we may need to raise additional funds in the future to finance our operations and/or acquire complementary businesses. If we obtain capital in future offerings, the value of the price per share of our stockholders’ common stock could be reduced. In addition, if we issue additional equity securities in a future offering and certain stockholders do not participate in such offering, there will effectively be dilution in their percentage ownership interest in the Company.
Under the Company’s 2011 Stock Plan and the Company’s previous incentive stock plans, the Company granted, and in the future intends to grant, awards of stock options to purchase common stock and other awards to our officers, directors, employees and consultants. We will in the future grant stock options and other awards to certain current or future officers, directors, employees and consultants of the Company under additional plans or individual agreements. The grant and exercise of these awards, as applicable, will have the effect of diluting our stockholders’ ownership interests in the Company. We may also issue additional equity securities in connection with other types of transactions, including shares issued as part of the purchase price for acquisitions of assets or other companies from time to time in connection with strategic partnerships or joint ventures, or as incentives to management or other providers of resources to the Company. Such additional issuances are likely to have the same dilutive effect.
We currently have no plans to pay dividends on our common stock.
We currently do not pay dividends on our common stock and we do not anticipate paying any dividends on our common stock in the foreseeable future. Any declaration and payment of future dividends to holders of our common stock may be limited by restrictive covenants of our debt agreements, and will be at the sole discretion of our Board of Directors and will depend on many factors, including our financial condition, results of operations, earnings, capital requirements, business expansion opportunities, level of indebtedness, statutory and contractual restrictions applying to the payment of dividends and other considerations that our Board of Directors deems relevant.
Further, we may not have sufficient surplus to be able to legally pay any dividends in the future. The absence of sufficient surplus may result from extraordinary cash expenses, actual expenses exceeding contemplated costs, funding of capital expenditures, or increases in reserves.
Our corporate headquarters, located at 100 Greenway Boulevard, Carrollton, Georgia 30117, comprises approximately 80,000 square feet. Construction on our corporate headquarters was completed earlier in 2013 and placed into service during Fiscal 2013. For our corporate headquarters, we entered into a sale-leaseback agreement with the Carroll County Payroll Development Authority (the “County”) and acquired an Industrial Revenue Bond (the “Bond”). The arrangement is structured so that our lease payments to the County equal and offset the County’s bond payments to the Company. The Bond is non-recourse to the County, our lease payments are pledged to secure repayment of the Bond, and the lease and bond provide for the legal right of offset. On our corporate campus, we also lease the building located at 121 Greenway Boulevard, Carrollton, Georgia 30117 and own the buildings located at 590 Hays Mill Road and 115 Greenway Boulevard, each in Carrollton, Georgia 30117. We also lease several other properties, most located adjacent to our corporate headquarters and in and around Carrollton for other business operations, such as research and development, client services, and network operations.
From time to time, we are involved in various legal proceedings arising from the normal course of business activities. We are not presently a party to any material litigation.
Item 4. | Mine Safety Disclosures |
Not Applicable.
PART II
Item 5. | Market for Registrant’s Common Equity, Related Stockholder Matters and Issuer Purchases of Equity Securities |
Market for Common Stock
Our common stock has traded on the New York Stock Exchange, or NYSE, under the symbol “GWAY” since February 2, 2012. Prior to that time, there was no public market for our common stock. The following table sets forth the high and low intraday sales prices per share of our common stock, as reported by the NYSE, for the periods indicated.
| | | | | | | | |
| | | Price Range | |
| | | High | | Low | |
2012 | | | | | | | |
Quarter ended March 31, 2012(1) | | | $ | 16.19 | | | $ | 10.10 | |
Quarter ended June 30, 2012 | | | $ | 17.50 | | | $ | 12.20 | |
| | | | | | | | | | |
| 2013 | | | | | | | | | |
Quarter ended September 30, 2012 | | | $ | 17.24 | | | $ | 12.92 | |
Quarter ended December 31, 2012 | | | $ | 19.65 | | | $ | 14.61 | |
Quarter ended March 31, 2013 | | | $ | 17.20 | | | $ | 13.57 | |
Quarter ended June 30, 2013 | | | $ | 16.16 | | | $ | 11.02 | |
| (1) | Our common stock began trading on February 2, 2012. |
Holders of Record
The number of record holders of our common stock as of September 10, 2013 was 294 (excluding individual participants in nominee security position listings).
Dividends
Since our incorporation, we have not declared or paid any dividends on our common stock. We currently intend to retain all of our future earnings, if any, to finance the growth and development of our business and do not anticipate paying cash dividends for the foreseeable future. Our existing credit facility prohibits us from paying cash dividends, and any future financing agreements may prohibit us from paying any type of dividends.
Equity Compensation Plan Information
The following table gives information about our common stock that may be issued upon the exercise of options, warrants and rights under all of our existing equity compensation plans at June 30, 2013, including the 1999 Option Plan, the 2004 Stock Plan, and the 2011 Stock Plan.
| | | | | | | | | | |
| | | Number of securities to be issued upon exercise of outstanding options, warrants and rights (A) | | | Weighted average exercise price of outstanding options, warrants and rights (B) | | | Number of securities remaining available for future issuance under equity compensation plans (excluding securities reflected in column (A)) (C) | |
| Equity compensation plans approved by stockholders | | | 3,759,585 | (1) | | $ | 7.33 | | | | 1,673,691 | (2) |
| Equity compensation plans not approved by stockholders | | | — | | | | — | | | | — | |
| Total | | | 3,759,585 | | | $ | 7.33 | | | | 1,673,691 | |
| | (1) | Includes options outstanding under the Company’s 1999 Option Plan, 2004 Stock Plan, and 2011 Stock Plan. |
| | (2) | Includes shares available for issuance under the Company’s 2004 Stock Plan and 2011 Stock Plan. |
Sales of Unregistered Securities
None.
Purchases of Equity Securities by the Issuer and Affiliated Purchasers
None.
Stock Performance Graph
The following graph compares the cumulative total return provided to holders of the common stock of Greenway Medical Technologies, Inc. relative to the cumulative total returns of the New York Stock Exchange Composite Index and the Standard & Poors 1500 Health Care Technology Index since the pricing of the initial public offering of Greenway’s common stock on February 1, 2012. An investment of $100 is assumed to have been made in our common stock and in each of the indexes on February 1, 2012, and its relative performance is tracked through June 30, 2013.
| | | | | | INDEXED RETURNS | |
| | | Base | | | Quarter Ending | |
| | | Period | | | | | | | | | | | | | | | | |
Company / Index | | 2/1/12 | | | 6/30/12 | | | 9/30/12 | | | 12/31/12 | | | 3/31/13 | | | 6/30/13 | |
Greenway Medical Technologies | | | 100 | | | | 163.10 | | | | 171.00 | | | | 153.60 | | | | 159.00 | | | | 123.40 | |
NYSE Composite Index | | | 100 | | | | 98.37 | | | | 104.03 | | | | 106.46 | | | | 114.82 | | | | 114.89 | |
S&P 1500 Health Care Technology Index | | | 100 | | | | 106.90 | | | | 102.38 | | | | 98.31 | | | | 119.89 | | | | 121.32 | |
Item 6. | Selected Financial Data |
The following selected historical consolidated financial data should be read in conjunction with“Management’s Discussion and Analysis of Financial Condition and Results of Operations” and the consolidated financial statements, related notes and other financial information included in this Form 10-K. We derived the balance sheet data as of June 30, 2009, from our audited financial statements, that were subsequently revised to conform to Regulation S-X and, as such, are now unaudited. The selected historical financial data in this section is not intended to replace our historical consolidated financial statements and the accompanying notes. Our historical results are not necessarily indicative of our future results.
| | | | | | | | | | | | | | | | |
| | | For the years ended June 30, | |
| | | 2009 | | | 2010 | | | 2011 | | | 2012 | | | 2013 | |
(in thousands) | | | |
| | | | |
Consolidated statements of operations data | | | | | | | | | | | | | | | |
| | | | | | | | | | | | | | | | |
Revenue: | | | | | | | | | | | | | | | |
| | | | | | | | | | | | | | | | |
| Systems sales | | $ | 20,650 | | | $ | 24,172 | | | $ | 31,726 | | | $ | 39,300 | | | $ | 40,975 | |
| Training and consulting services | | | 7,925 | | | | 11,863 | | | | 18,373 | | | | 27,816 | | | | 19,420 | |
| Support services | | | 11,421 | | | | 16,031 | | | | 22,401 | | | | 33,143 | | | | 44,553 | |
| Electronic data interchange and business services | | | 8,716 | | | | 12,576 | | | | 17,339 | | | | 23,754 | | | | 29,896 | |
| Total revenue | | | 48,712 | | | | 64,642 | | | | 89,839 | | | | 124,013 | | | | 134,844 | |
Cost of revenue: | | | | | | | | | | | | | | | | | | | | |
| | | | | | | | | | | | | | | | | | | | | |
Systems sales(1) | | | 6,500 | | | | 6,752 | | | | 7,522 | | | | 10,259 | | | | 18,420 | |
Training and consulting services(1) | | | 5,708 | | | | 8,152 | | | | 13,550 | | | | 18,881 | | | | 13,682 | |
Support services(1) | | | 3,279 | | | | 4,179 | | | | 7,059 | | | | 10,564 | | | | 13,092 | |
Electronic data interchange and business services(1) | | | 5,954 | | | | 8,713 | | | | 12,280 | | | | 16,197 | | | | 19,265 | |
Total cost of revenue(1) | | | 21,441 | | | | 27,796 | | | | 40,411 | | | | 55,901 | | | | 64,459 | |
| Gross profit | | | 27,271 | | | | 36,846 | | | | 49,428 | | | | 68,112 | | | | 70,385 | |
Operating expenses: | | | | | | | | | | | | | | | | | | | | |
| | | | | | | | | | | | | | | | | | | | | |
Sales, general and administrative(1) | | | 20,370 | | | | 27,727 | | | | 37,399 | | | | 47,565 | | | | 58,336 | |
Research and development(1) | | | 5,767 | | | | 5,991 | | | | 8,218 | | | | 15,696 | | | | 18,959 | |
Total operating expenses(1) | | | 26,137 | | | | 33,718 | | | | 45,617 | | | | 63,261 | | | | 77,295 | |
| Operating income (loss) | | | 1,134 | | | | 3,128 | | | | 3,811 | | | | 4,851 | | | | (6,910 | ) |
Interest (income) expense and other expense, net | | | 153 | | | | 115 | | | | 46 | | | | (14 | ) | | | (254 | ) |
Income (loss) before income taxes | | | 981 | | | | 3,013 | | | | 3,765 | | | | 4,865 | | | | (6,656 | ) |
Provision (benefit) for income taxes | | | 26 | | | | 148 | | | | (29,200 | ) | | | 1,955 | | | | (1,591 | ) |
| Net income (loss) | | | 955 | | | | 2,865 | | | | 32,965 | | | | 2,910 | | | | (5,065 | ) |
| | | | | | | | | | | | | | | | | | | | | |
Preferred stock dividends and accretion | | | (9,014 | ) | | | (8,038 | ) | | | (54,961 | ) | | | 28,395 | | | | — | |
Income (loss) available to common stockholders | | $ | (8,059 | ) | | $ | (5,173 | ) | | $ | (21,966 | ) | | $ | 31,305 | | | $ | (5,065 | ) |
| | | | | | | | | | | | | | | | | | | | | |
Per share data: | | | | | | | | | | | | | | | | | | | | |
| Net income (loss) available to common shareholders per share: | | | | | | | | | | | | | | | | | | | | |
| Basic | | $ | (0.81 | ) | | $ | (0.48 | ) | | $ | (1.90 | ) | | $ | 1.66 | | | $ | (.17 | ) |
| Diluted | | $ | (0.81 | ) | | $ | (0.48 | ) | | $ | (1.90 | ) | | $ | .11 | | | $ | (.17 | ) |
| Weighted average number of common shares outstanding: | | | | | | | | | | | | | | | | | | | | |
| Basic | | | 9,947 | | | | 10,684 | | | | 11,579 | | | | 18,809 | | | | 29,577 | |
| Diluted | | | 9,947 | | | | 10,684 | | | | 11,579 | | | | 25,369 | | | | 29,577 | |
Cost of revenue: | | | | | | | | | | | | | | | |
| | | | | | | | | | | | | | | | |
| System sales | | $ | — | | | $ | 8 | | | $ | 7 | | | $ | 11 | | | $ | 33 | |
| Training and consulting services | | | 57 | | | | 64 | | | | 74 | | | | 290 | | | | 192 | |
| Support services | | | 14 | | | | 23 | | | | 37 | | | | 112 | | | | 106 | |
| Electronic data interchange and business services | | | 1 | | | | 1 | | | | 9 | | | | 55 | | | | 19 | |
| Total cost of revenue | | $ | 72 | | | $ | 96 | | | $ | 127 | | | $ | 468 | | | $ | 350 | |
| | | | | | | | | | | | | | | | | | | | | |
Operating expenses: | | | | | | | | | | | | | | | | | | | | |
| | | | | | | | | | | | | | | | | | | | | |
| Sales, general and administrative | | $ | 482 | | | $ | 463 | | | $ | 1,118 | | | $ | 1,543 | | | $ | 3,394 | |
| Research and development | | | 11 | | | | 63 | | | | 154 | | | | 744 | | | | 679 | |
| Total operating expenses | | | 493 | | | | 526 | | | | 1,272 | | | | 2,287 | | | | 4,073 | |
| Total stock-compensation expense | | $ | 565 | | | $ | 622 | | | $ | 1,399 | | | $ | 2,755 | | | $ | 4,423 | |
| (1) Includes stock-based compensation in the following amounts (in thousands): |
| | As of June 30, | |
| | | 2009 | | | 2010 | | | 2011 | | | 2012 | | | 2013 | |
| (in thousands) | | | | | | | | | | | | | | | |
Consolidated balance sheet data: | | | | | | | | | | | | | | | |
| | | | | | | | | | | | | | | | |
| Cash, cash equivalents, and short-term investments | | $ | 9,711 | | | $ | 19,179 | | | $ | 16,168 | | | $ | 34,395 | | | $ | 11,227 | |
| Working capital | | | 9,861 | | | | 16,966 | | | | 14,446 | | | | 34,630 | | | | 14,347 | |
| Total assets | | | 22,210 | | | | 38,604 | | | | 82,156 | | | | 133,123 | | | | 126,129 | |
| Deferred revenue | | | 3,717 | | | | 4,320 | | | | 8,672 | | | | 12,192 | | | | 9,323 | |
| Long-term obligations | | | 1,904 | | | | — | | | | 349 | | | | 116 | | | | — | |
| Convertible preferred stock at fair value | | | 95,818 | | | | 103,855 | | | | 158,815 | | | | — | | | | — | |
| Accumulated deficit | | | (142,850 | ) | | | (148,024 | ) | | | (170,020 | ) | | | (138,715 | ) | | | (143,780 | ) |
| Total shareholders’ (deficit) equity | | | (84,539 | ) | | | (79,996 | ) | | | (99,484 | ) | | | 98,846 | | | | 101,675 | |
| | | | | | | | | | | | | | | | | | | | | |
| | For the years ended June 30, | |
Other Financial Data | | 2009 | | | 2010 | | | 2011 | | | 2012 | | | 2013 | |
| | (Unaudited) (in thousands) | |
| | | | | | | | | | | | | | | | |
Adjusted EBITDA(1) | | $ | 2,029 | | | $ | 4,144 | | | $ | 6,385 | | | $ | 12,061 | | | $ | 6,732 | |
| Net cash provided by (used in) operating activities | | | (2,070 | ) | | | 6,628 | | | | 6,243 | | | | 8,286 | | | | 4,646 | |
| Capital expenditures | | | 325 | | | | 2,784 | | | | 4,129 | | | | 8,041 | | | | 8,578 | |
| | (1) | Adjusted EBITDA, a non-GAAP measure, is an unaudited number and represents income (loss) before interest, income taxes, depreciation and amortization, acquisition-related transaction costs and stock-based compensation. See discussion and reconciliation of Adjusted EBITDA to net income (loss), the most comparable GAAP equivalent, in “Management’s Discussion and Analysis of Financial Conditions and Results of Operations.” |
Item 7. | Management’s Discussion and Analysis of Financial Condition and Results of Operations |
The following discussion and analysis of our financial condition and results of operations should be read in conjunction with our consolidated financial statements and related notes that appear elsewhere in this Report. In addition to historical financial information, the following discussion contains forward-looking statements that involve risks and uncertainties. Our actual results may differ materially from those discussed below. Factors that could cause or contribute to these differences include those discussed below and elsewhere in this Report, particularly in “Risk Factors.”
Business overview
We are a leading provider of integrated information technology solutions and managed business services to Healthcare Providers throughout the United States. At the core of our suite of solutions and services is PrimeSUITE, our award-winning, fully-integrated EHR, PM and interoperability solution. PrimeSUITE integrates clinical, financial and administrative data into, what is substantially, one database to enable comprehensive views of patient records and efficient workflow throughout each patient encounter, reduce clinical and administrative errors, and allow for the seamless exchange of data between our customers and the broader healthcare community. We augment our solutions by offering managed business services such as clinically driven revenue cycle and EHR-enabled research services. By integrating clinical, financial and administrative data processes, our solutions and services are designed to allow providers to deliver advanced care and improve their efficiency and profitability. Over 14,600 providers, which we define as physicians, nurses, nurse practioners, and physician assistants, use our solutions to deliver care to and capture the clinical, financial and administrative information of over 25 million patients treated annually.
Our technology solutions and services are designed to address the needs of providers in all ambulatory settings: independent physician practices, group practices, hospital-affiliated and hospital-owned clinics and practices, retail clinics, employer clinics, university and academic centers, federally-qualified health centers (“FQHCs”), community health centers (“CHCs”), accountable care communities (“ACCs”) and accountable care organizations (“ACOs”), and integrated delivery networks (“IDNs”). Our database platform is efficient and unique, which reflects over 14 years of development, and is scalable to serve the needs of ambulatory providers of any size. As providers’ needs evolve, our platform allows for the efficient development and integration of new solutions, which we refer to as our innovation platform. Our solutions are available on either a cloud-based or premise-based model.
The ambulatory EHR market has historically been underpenetrated and installed systems have been underutilized. Adoption of these technologies has been low for several reasons including providers’ resistance to making the required investment as well as concerns that electronic records would disrupt clinical and administrative workflows. Adoption of EHR solutions is accelerating as more providers realize the possible return on investment from adoption of solutions such as PrimeSUITE. Government initiatives and legislation have provided financial incentives and implementation support for ambulatory providers to adopt EHR solutions.
In order for us to continue to deliver on this commitment to our providers, we will continue to enhance our platform and align our business services to address the trends and challenges we believe will affect our providers now and in the future. We will invest in the development of new products and enhancements to existing products that we believe present opportunities for substantial efficiencies to ourselves and our providers’ businesses. In responding to the acceleration of EHR adoption, government regulations such as the HITECH Act and ARRA, and other market trends such as increasing consumerism, the shift to quality-based reimbursement and the focus on improving the coordination of care among providers, we also face the following opportunities, challenges and risks, which could impact our business:
Maintaining Adequate Capacity to Satisfy Potential Increased Demand. We have taken steps to position ourselves to take advantage of expected increased demand by increasing our direct sales force, enhancing our relationships with strategic alliance partners with established sales forces and increasing our systems installation capacity by utilizing third-party training and implementation specialists certified in PrimeSUITE deployment. While we believe these steps are sufficient to satisfy expected demand, additional investments and steps may be required.
Ensuring Continued Certification of Our Solutions. In order to qualify for government incentives for EHR adoption, our solutions must continue to meet various and changing requirements for product certification and must enable our eligible providers to achieve “meaningful use” as defined by existing and new regulations. We will continue to invest significant resources to ensure compliance of our solutions and to train and consult with our eligible providers to enable them to navigate “meaningful use” regulations. Our ability to achieve certification under applicable standards from time to time and the length and cost of related solutions development and enhancement could materially impact our ability to take advantage of increased demand and require larger research and development investments than anticipated.
Ensuring Our Ability to Address Emerging Demand Trends. Trends toward community-based purchasing decisions where individuals, hospitals, health systems and IDNs subsidize the purchase of EHR solutions for their affiliated physicians in order to expand connectivity within their provider community, and government-funded providers and initiatives, such as RECs, to encourage and support the implementation of EHR, could result in longer sales cycles and installation periods. This may also increase the need for additional training and implementation specialists because of the size and complexity of those sales. As a result, while we expect these trends to result in increased demand for our solutions and managed business services, they may require additional investment by us and may have unintended or unexpected consequences that could impact our business.
Demand by Smaller Providers Could Accelerate Transition to Subscription Pricing Model. The adoption of EHR by the large untapped market of smaller provider customers and their greater need to minimize capital outlays could accelerate adoption of subscription-based arrangements as opposed to perpetual licensing arrangements. While additional subscription arrangements will result in increased recurring revenue over a longer period of time than we have achieved historically, near-term revenue would be reduced as a result while costs associated with these sales would still be expensed currently.
Uncertain Impact of Recent Legislation. Recently enacted public laws reforming the U.S. healthcare system may impact our business. The Patient Protection and Affordable Care Act (“PPACA”) and The Health Care and Education and Reconciliation Act of 2010 (the “Reconciliation Act”), which amends the PPACA (collectively the “Health Reform Laws”), were signed into law in March 2010. The Health Reform Laws contain various provisions which may impact the Company and our customers. Some of these provisions may have a positive impact, by expanding the use of electronic health records in certain federal programs, for example, while others, such as reductions in reimbursement for certain types of providers, may have a negative impact due to fewer available resources. Increases in fraud and abuse penalties may also adversely affect participants in the health care sector, including the Company.
Sources of Revenue and Expenses
Revenue
We derive our revenue primarily from sales of our PrimeSUITE platform of proprietary solutions, related hardware and professional services to providers in independent physician practices, multi-specialty group practices, hospital-affiliated and hospital-owned clinics and practices, retail clinics, employer clinics, university and academic health centers, FQHCs, CHCs, IDNs, ACCs, and ACOs. Historically, a sizable percentage of our solution sales are made as perpetual licenses to our customers; however, our software is also available in a cloud-based model and those sales are rapidly expanding and accounting for a significant portion of new customer installations.
We classify our revenue as: (1) Systems Sales, (2) Training and Consulting Services, (3) Support Services, and (4) Electronic Data Interchange and Business Services. Systems Sales are products comprised of software licenses, primarily PrimeSUITE, and related hardware and third-party software. Training and Consulting Services include implementation, training and consulting associated with Systems Sales. Support Services includes solutions we offer on a per user or transaction basis, such as the PrimeSUITE platform deployed as a service and EXCHANGE services for connectivity to third-parties and third-party database charges. Electronic Data Interchange and Business Services include third-party charges for patient claims, statements and eligibility, and clinically driven RCM and EHR-enabled research services.
As our installed customer base continues to grow, we anticipate that Support Services and Electronic Data Interchange and Business Services, which are recurring in nature, will expand as a percentage of our total revenue. There is moderate seasonality to our annual revenue. Typically, the smallest percentage of sales occurs in the first fiscal quarter due primarily to provider purchasing patterns. This pattern is expected to lessen as more current sales are cloud-based rather than premise-based, reducing the amount of upfront investment that is required by our customers to engage our solution. See “Results of Operations” for more information.
Cost of Revenue
Cost of revenue for Systems Sales consists primarily of amortization of capitalized software development, third-party hardware and software costs. Cost of revenue for Training and Consulting Services consists primarily of compensation (including stock-based compensation) and benefits of our billable professionals and third-party specialists for deployment, implementation and training, and travel costs. Cost of revenue for Support Services consists primarily of compensation (including stock-based compensation) and benefits of support specialists, and fees to third parties for database and remote hosting services. Cost of revenue for Electronic Data Interchange consists primarily of fees to third parties for processing claims, statements and eligibility requests; cost of revenue for Business Services consists primarily of compensation (including stock-based compensation) and benefits of our personnel and various third-party costs associated with delivery of our clinically-driven revenue cycle management and EHR-enabled clinical research services. As higher-margin recurring revenue increases as a percentage of total revenue, we believe overall gross margin will also increase over time.
Sales, General and Administrative Expenses
Sales, general and administrative (“SG&A”) expenses consist primarily of compensation (including stock-based compensation) and benefits, commissions, travel, professional fees, advertising and other administrative and general expenses, including depreciation and amortization of equipment and leasehold improvements, for the Company’s sales and marketing functions; executive offices, administration, human resources, corporate information technology support, legal, finance and accounting, investor relations and other corporate services. We intend to invest in our infrastructure as appropriate to expand our market share and accommodate our growing customer base. In the future we expect to incur additional costs related to being a public company, including increased legal and accounting and compliance costs in connection with Section 404 of the Sarbanes-Oxley Act. As a result, we expect SG&A expenses to increase (in real dollars) as we grow. However, the Company will ultimately experience a decline in SG&A, as a percentage of revenue, as we achieve leverage from our infrastructure investments.
Research and Development Expenses
Research and development expenses consist primarily of compensation (including stock-based compensation) and benefits, third-party contractor costs and other facility and administrative costs, including depreciation of equipment directly related to development of new products and upgrading and enhancing existing products. In accordance with GAAP, research and development costs related to new application development and enhancements to existing products are expensed until technological feasibility is established. Once technological feasibility is established such costs are capitalized until the product or enhancement is ready for market, at which point capitalization ceases. We capitalize research and development costs under these criteria including the compensation-related costs of personnel and related third-party contractors working directly on specific projects. We intend to invest in our innovation platform to maintain cutting-edge technology for the benefit of our customers as well as to meet evolving requirements of the market, including certifications and standards. These costs have been extensive in the last two years with the evolving regulatory changes, impact of meaningful use funds on Healthcare Providers investing in PM, advances in the nature and extent of clinical technology (remote scheduling, mobile applications, online prescriptions, etc..), The research and development dollars invested in our technology will continue to grow over time in real dollars. However, research and development is expected to be lower, as a percent of revenue, in 2014.
Provision for Income Taxes
In preparing our consolidated financial statements, we estimate income taxes in each of the jurisdictions in which we operate. This process involves estimating actual current tax exposure together with assessing temporary differences resulting from differing treatment of items for tax and financial reporting purposes. These differences result in deferred income tax assets and liabilities.
Consolidated statement of Operations Data
The following tables set forth our statement of operations data for each period presented:
| | | | | | | | | | |
| | | For the years ended June 30, | |
| | | 2011 | | | 2012 | | | 2013 | |
| | | (in thousands) | |
Revenue: | | | | | | | | | |
| | | | | | | | | | |
| Systems sales | | $ | 31,726 | | | $ | 39,300 | | | $ | 40,975 | |
| Training and consulting services | | | 18,373 | | | | 27,816 | | | | 19,420 | |
| Support services | | | 22,401 | | | | 33,143 | | | | 44,553 | |
| Electronic data interchange and business services | | | 17,339 | | | | 23,754 | | | | 29,896 | |
| Total revenue | | | 89,839 | | | | 124,013 | | | | 134,844 | |
Cost of revenue: | | | | | | | | | | | | |
| | | | | | | | | | | | | |
Systems sales(1) | | | 7,522 | | | | 10,259 | | | | 18,420 | |
Training and consulting services(1) | | | 13,550 | | | | 18,881 | | | | 13,682 | |
Support services(1) | | | 7,059 | | | | 10,564 | | | | 13,092 | |
Electronic data interchange and business services(1) | | | 12,280 | | | | 16,197 | | | | 19,265 | |
| Total cost of revenue | | | 40,411 | | | | 55,901 | | | | 64,459 | |
| Gross profit | | | 49,428 | | | | 68,112 | | | | 70,385 | |
Operating expenses: | | | | | | | | | | | | |
| | | | | | | | | | | | | |
Sales, general and administrative(1) | | | 37,399 | | | | 47,565 | | | | 58,336 | |
Research and development(1) | | | 8,218 | | | | 15,696 | | | | 18,959 | |
| Total operating expenses | | | 45,617 | | | | 63,261 | | | | 77,295 | |
| Operating income (loss) | | | 3,811 | | | | 4,851 | | | | (6,910 | ) |
Interest (income) expense and other expense, net | | | 46 | | | | (14 | ) | | | (254 | ) |
Income (loss) before income taxes | | | 3,765 | | | | 4,865 | | | | (6,656 | ) |
Provision (benefit) for income taxes | | | (29,200 | ) | | | 1,955 | | | | (1,591 | ) |
| Net income (loss) | | $ | 32,965 | | | $ | 2,910 | | | $ | (5,065 | ) |
Other Financial Data: | | | | | | | | | | | | |
| | | | | | | | | | | | | |
Adjusted EBITDA(2) | | $ | 6,385 | | | $ | 12,061 | | | $ | 6,732 | |
(1) Includes stock-based compensation in the following amounts: |
Cost of revenue: | | | | | | | | | |
| | | | | | | | | | |
| System sales | | $ | 7 | | | $ | 11 | | | $ | 33 | |
| Training and consulting services | | | 74 | | | | 290 | | | | 192 | |
| Support services | | | 37 | | | | 112 | | | | 106 | |
| Electronic data interchange and business services | | | 9 | | | | 55 | | | | 19 | |
| Total cost of revenue | | | 127 | | | | 468 | | | | 350 | |
Operating expenses: | | | | | | | | | | | | |
| | | | | | | | | | | | | |
| Sales, general and administrative | | $ | 1,118 | | | $ | 1,543 | | | $ | 3,394 | |
| Research and development | | | 154 | | | | 744 | | | | 679 | |
| Total operating expenses | | | 1,272 | | | | 2,287 | | | | 4,073 | |
| Total stock-compensation expense | | $ | 1,399 | | | $ | 2,755 | | | $ | 4,423 | |
| (2) | Adjusted EBITDA is a non-GAAP measure that is described and reconciled to net income (loss) in the next section and is not a substitute for net income (loss), the GAAP equivalent. |
Adjusted EBITDA
Adjusted EBITDA is not a measure of liquidity calculated in accordance with GAAP, and should be viewed as a supplement to — not a substitute for —our results of operations presented on the basis of GAAP. Adjusted EBITDA does not purport to represent cash flow provided by, or used in, operating activities as defined by GAAP. Our statement of cash flows presents our cash flow activity in accordance with GAAP. Furthermore, Adjusted EBITDA is not necessarily comparable to similarly-titled measures reported by other companies. Non-GAAP information should not be construed as an alternative to GAAP information, as the items excluded from the non-GAAP measures often have a material impact on our financial results. Management uses, and investors should use, non-GAAP measures in conjunction with our GAAP results.
In connection with the ongoing operation of our business, our management regularly reviews Adjusted EBITDA to assess our performance. We define Adjusted EBITDA as earnings before net interest (income) expense, taxes, depreciation, amortization, acquisition-related costs, and stock-based compensation expenses. We believe that Adjusted EBITDA is an important measure of our operating performance because it allows management, lenders, investors and analysts to evaluate and assess our core operating results from period-to-period after removing the impact of changes to our capitalization structure, acquisition related costs, income tax status, and other items of a non-operational nature that affect comparability.
We believe that various forms of the Adjusted EBITDA metric are often used by analysts, investors and other interested parties to evaluate companies such as ours for the reasons discussed above. Additionally, Adjusted EBITDA is used to measure certain financial covenants in our credit facility. Adjusted EBITDA is also used for planning purposes and in presentations to our Board of Directors as well as in our incentive compensation programs.
The following table presents a reconciliation of Adjusted EBITDA to net income (loss), the most comparable GAAP measure, for each of the periods indicated:
| | | | | | | | | | | | | | | | |
| | | For the years ended June 30, | |
| | | | | | | | | | | | | | | | |
| | | 2009 | | | 2010 | | | 2011 | | | 2012 | | | 2013 | |
| | | (Unaudited) (in thousands) | |
Reconciliation of net income (loss) to Adjusted EBITDA: | | | | | | | | | | | | | | | |
| | | | | | | | | | | | | | | | |
| Net income (loss) | | $ | 955 | | | $ | 2,865 | | | $ | 32,965 | | | $ | 2,910 | | | $ | (5,065 | ) |
| | | | | | | | | | | | | | | | | | | | | |
| Stock-based compensation | | | 565 | | | | 622 | | | | 1,399 | | | | 2,755 | | | | 4,423 | |
| | | | | | | | | | | | | | | | | | | | | |
| Depreciation and amortization | | | 406 | | | | 432 | | | | 1,252 | | | | 4,372 | | | | 9,129 | |
| | | | | | | | | | | | | | | | | | | | | |
| Acquisition-related transaction costs | | | — | | | | — | | | | — | | | | 123 | | | | 145 | |
| | | | | | | | | | | | | | | | | | | | | |
| Interest (income) expense, net | | | 77 | | | | 77 | | | | (31 | ) | | | (54 | ) | | | (309 | ) |
| | | | | | | | | | | | | | | | | | | | | |
| Provision (benefit) for income taxes | | | 26 | | | | 148 | | | | (29,200 | ) | | | 1,955 | | | | (1,591 | ) |
| | | | | | | | | | | | | | | | | | | | | |
Adjusted EBITDA | | $ | 2,029 | | | $ | 4,144 | | | $ | 6,385 | | | $ | 12,061 | | | $ | 6,732 | |
Comparison of Year Ended June 30, 2013 to June 30, 2012
Revenue.Total revenue was $134.8 million for the year ended June 30, 2013, compared to $124.0 million for the year ended June 30, 2012, an increase of $10.8 million or 9%. The Company’s revenue increases with the addition of new providers. The number of cumulative providers at the end of years ended June 30, 2010, 2011, 2012 and 2013 are as follows:
| | | For the years ended June 30, | |
| | | 2010 | | | 2011 | | | 2012 | | | 2013 | |
| Providers | | | | | | | | | | | | |
| Premise | | | 6,000 | | | | 8,000 | | | | 12,000 | | | | 14,000 | |
| Plus S | | | - | | | | 200 | | | | 400 | | | | 600 | |
| | | | 6,000 | | | | 8,200 | | | | 12,400 | | | | 14,600 | |
There is not a one-to-one correlation for added providers to revenue growth. This lack of correlation is the result of: (i) providers choosing the premise model with a perpetual license results in larger upfront revenue in relation to growth in providers, (ii) more recently, providers are choosing the Plus S platform, our cloud-based model, which leads to less revenue upfront relative to the growth in providers, (iii) as existing customers consume more of our solutions and services, revenue increases without a corresponding increase in providers, and (iv) as the ambulatory market and provider venues continue to evolve, growth in providers in relation to growth in revenue will continue to change. For example, a large customer licenses our technology on an enterprise-wide basis in a retail setting which means that as deployment of the licensed technology expands in the enterprise, we will have significantly more growth in the number of providers using our technology without a corresponding increase in license revenue.
Systems sales grew by 4% and accounted for $1.7 million or 16% of total revenue growth during the year ended June 30, 2013 Systems sales (in terms of volume) decreased overall from the prior year as more providers chose the Plus S model which reduces the upfront revenue from licenses but results in a recurring revenue stream over the life of the customer contract. The reduction in system sales (volume) was overcome by an increase in a large customer license agreement revenue that resulted in the net increase in system sales for the year ended June 30, 2013. Training and consulting services declined $8.4 million, a 31% reduction from the year ended June 30, 2012. Training and consulting services were impacted by lower premise model system sales coupled with an increase in transactions with larger organizations that tend to consume relatively less training; resulting in a reduced level of training, consulting and reimbursed expenses delivered to providers compared to the prior year. Also, as the Company’s mix of new system sales in 2013 were weighted more to our Plus S model, training and consulting services are recognized over the estimated life of the contract rather than upfront.
Support services and electronic data interchange and business services combined to increase $17.6 million or 31% over the prior year. Support services, electronic data interchange and business services are generally recurring revenue streams, and growth in this revenue is largely attributable to our expanded customer base (which include customers that are new to our PrimeSUITE solution and choose our cloud-based model or customers that are taking on additional or expanded solutions or services). We expect that the recurring revenue streams for support services and the electronic data interchange and business services will continue to expand and become an increasingly larger percentage of our overall total revenue. Our ability to sell additional products and services to our existing customer base also benefitted revenue growth in 2013 compared to the prior period. The additional products that were added-on to existing customers included, but was limited to, PrimePatient, Greenway Clearinghouse, RCM, PrimeExchange).
The Company had backlog revenue of the following amounts at each of the quarterly periods (in thousands):
| | | 30-Jun-12 | | | 31-Mar-13 | | | 30-Jun-13 | | | YoY | | | Sequential | |
| | | | | | | | | | | | | | | | |
| Non-recurring revenue | | $ | 29,971 | | | $ | 24,612 | | | $ | 30,338 | | | | 1 | % | | | 23 | % |
| Recurring revenue | | $ | 66,382 | | | $ | 78,702 | | | $ | 83,111 | | | | 25 | % | | | 6 | % |
| Total | | $ | 96,353 | | | $ | 103,314 | | | $ | 113,449 | | | | 18 | % | | | 10 | % |
The Company’s backlog reflects the growth of the Company and the shift in revenue from recurring sources of revenue (cloud subscription hosting model) and away from the non-recurring revenue (licensed software model). The total backlog at June 30, 2013 was up 18% and 10%, sequentially, from the previous year-end and prior quarter, respectively. The Company’s backlog is calculated from its undelivered contracts and delivered contracts expected to be serviced over the next 12 months from the quarter end date and is consistently measured each period.
Cost of Revenue. Total cost of revenue was $64.5 million for the year ended June 30, 2013, compared to $55.9 million for the year ended June 30, 2012, an increase of $8.6 million or 16%. Cost of systems sales grew by 80% accounting for $8.2 million or substantially all the total growth in cost of revenue during the period. This increase is attributable to costs for software platform development for a large customer combined with increased amortization of capitalized software development. Cost of training and consulting services were lower by 28% and accounted for a $5.2 million reduction in cost of revenue during the period. This trend was impacted by the lower volume of perpetual license sales that reduced training, reimbursed expenses and consulting services for the year ended June 30, 2013. Cost of support services and electronic data interchange and business services combined grew $5.6 million or 21% during the year. This increase was the result of a higher proportion of new customer sales being cloud-based and transaction-based, recurring revenue and growth in the adoption of cloud-based solutions and services to existing customers.
On an overall basis, gross profit margins for the year ended June 30, 2013 were 52.2% compared to margins for the year ended June 30, 2012 and 2011 of 55.0%. Gross margin was impacted by the lower volume of perpetual license sales that reduced upfront revenue from the licenses, training and consulting and dampened increased margins from the increased scale of recurring sources from the cloud-based solutions and business services. These recurring revenue sources provide a longer-term revenue model and provide for higher profitability over a multiple-year agreement. The Company expects gross margins from recurring services to remain strong in 2014, and overall changes from current gross profit margins will depend heavily on the number and timing of new customers under the cloud-based revenue versus the premise license model.
Sales, General and Administrative. Total SG&A expenses were $58.3 million for the year ended June 30, 2013, compared to $47.6 million for the year ended June 30, 2012, an increase of $10.7 million or 22%. Growth in SG&A was largely a result of the required infrastructure to support the overall growth in the business including public company costs. SG&A expenses were 43% of revenue for the year ended June 30, 2013 as compared to 38% for the year ended June 30, 2012. This increase in SG&A as a percentage of sales can be explained by stock-based compensation growth of $1.8 million, costs that are identified as public company costs that increased more than $1.5 million, increase in depreciation and amortization of $1.0 million, a $1.4 million investment in new infrastructure software to improve visibility in the business, increase in bad debt expense from prior year of $1.3 million and, finally, investments made in the field sales and marketing infrastructure to expand sales activities to employer and retail clinics, and other new customer categories created by the evolving ambulatory healthcare market. Outside of the continued growth in these expenses, the Company began to experience leverage of its SG&A expenses to its scale. We believe our investments in our sales force, marketing and advertising position us to capture increased market share in what we believe will be an expanding market over the next several years. We believe that these investments can continue to be leveraged to maintain our sales growth in future years without a correspondingly linear increase, as a percentage of sales, in cost.
Research and Development Expenses. Research and development expenses were $19.0 million for the year ended June 30, 2013, compared to $15.7 million for the year ended June 30, 2012, an increase of $3.3 million or 21%. As a percentage of revenue, research and development expenses were 14% for the year ended June 30, 2013 as compared to 13% for the year ended June 30, 2012. Our organically developed innovation platform requires increased investment in research and development which continues to evolve to meet the needs of our customers, our market and industry regulators. In addition to research and development to support our innovation platform, we develop new products and enhanced functionality for existing products. These application development costs are capitalized once technological feasibility is attained and capitalization ceases once the technology is available for market. We capitalized $15.3 million and $12.2 million of application development costs for the years ended June 30, 2013 and 2012, respectively. While there will be continued need to invest in research and development, and the dollars for both capitalized and non-capitalized cost in the year ended June 30, 2014, in real dollars, are expected to be substantially similar to 2013, it is expected that these cost will decrease as a percentage of revenue in recognition of the ability to leverage the invested dollars across the larger installed base.
Interest and Other Expenses. Interest and other expense, net of interest (income), was $(254,000) for the year ended June 30, 2013, as compared to interest (income) of $(14,000) for the year ended June 30, 2012. The change in net interest (income) is related to availability of surplus cash from the proceeds of our initial public offering, those investments being available for the full year in Fiscal 2013 compared to Fiscal 2012, and the investment carrying a slightly higher rate of return in Fiscal 2013 compared to Fiscal 2012. At June 30, 2013 and 2012, the Company had no outstanding balance (indebtedness) on its credit facility.
Income Taxes.The Company’s effective tax rate for the year ended June 30, 2013 was 29%. The Company’s effective rate is less than the Federal statutory rate principally due to the effect of (i) stock-based compensation expense recorded currently but which is not deductible for income tax purposes because the Company is in a pre-tax net loss position for Fiscal 2013 and (ii) research and development credits. The Company has approximately $74 million in net operating losses and $4.8 million in research and development credits to offset future taxable income and tax expense. The Company, in the year ended June 30, 2013, reserved $537,000 for State research and development credits. Since such research and development credits are set to expire earlier than the State NOL’s will be used (according to our forecast), state income tax planning would dictate that it could not be concluded that it is more likely than not that these NOL’s would be utilized.
Comparison of Year Ended June 30, 2012 to June 30, 2011
Revenue.Total revenue was $124.0 million for the year ended June 30, 2012, compared to $89.8 million for the year ended June 30, 2011, an increase of $34.2 million or 38%. Systems sales grew by 24% and accounted for $7.6 million or 22% of total revenue growth during the period. Training and consulting services grew by 51% and accounted for $9.4 million or 28% of total revenue growth during the period. Support services and electronic data interchange and business services combined also grew 43% during the period, accounting for the remaining 50% of growth in total revenue. Systems sales, including training and consulting services, are one-time in nature and the substantial growth is attributable to our increased share in a growing market, our success in 2012 in solution sales to several larger providers and our success in implementing systems more rapidly which drove increased revenue in training and consulting services. Support services, electronic data interchange and business services are recurring and growth in this revenue is largely attributable to our growing customer base. Our ability to sell additional products and services to our existing customer base also benefitted revenue growth in 2012 compared to the prior period.
Cost of Revenue. Total cost of revenue was $55.9 million for the year ended June 30, 2012, compared to $40.4 million for the year ended June 30, 2011, an increase of $15.5 million or 38%. Cost of systems sales grew by 36% and accounted for $2.7 million or 18% of total growth in cost of revenue during the period. Cost of training and consulting services grew by 39% and accounted for $5.3 million or 34% of total growth in cost of revenue during the period. Cost of support services and electronic data interchange and business services combined grew 38% during the period, accounting for the remaining 48% of growth in total cost of revenue. On an overall basis, gross profit margins for 2012 were comparable to 2011. Gross margin improvements were attained in support services and in electronic data interchange and business services attributable to increased scale of higher margin service offerings combined with focused expense management. These gains were offset by absorption in cost of goods of increased amortization of acquired technology and capitalized software development totaling $2.5 million or approximately 200 basis points. We anticipate overall margin improvement with the expected revenue growth in the year ending June 30, 2014 due to additional scale of a more profitable cloud-based revenue model.
Sales, General and Administrative. Total SG&A expenses were $47.6 million for the year ended June 30, 2012, compared to $37.4 million for the year ended June 30, 2011, an increase of $10.2 million or 27%. Growth in SG&A is largely a result of the required infrastructure to support the overall growth in the business including public company costs. SG&A expenses were 38% of revenue for 2012 as compared to 42% for 2011 illustrative of the leverage as the business scales. We believe our investments in our sales force and marketing and advertising position us to capture increased market share in what we believe will be an expanding market over the next several years. We believe that these investments can continue to be leveraged to maintain our sales growth in future years without a correspondingly linear increase in cost.
Research and Development Expenses. Research and development expenses were $15.7 million for the year ended June 30, 2012, compared to $8.2 million for the year ended June 30, 2011, an increase of $7.5 million or 91%. As a percentage of revenue, research and development expenses were 13% for 2012 as compared to 9% for 2011. Our organically developed innovation platform requires increased investment in research and development which continues to evolve to meet the needs of our customers, our market and industry regulators. In addition to research and development to support our innovation platform, we develop new products and enhanced functionality for existing products. These application development costs are capitalized once technological feasibility is attained and capitalization ceases once the technology is available for market. We capitalized $12.2 million and $5.7 million of application development costs for the years ended June 30, 2012 and 2011, respectively.
Interest and Other Expenses. Interest and other expense, net of interest (income), was $(14,000) for the year ended June 30, 2012, as compared to expense of $46,000 for the year ended June 30, 2011. The change in net interest is related to availability of surplus cash from the proceeds of our offering to invest. At June 30, 2012, the Company had no outstanding balance on its credit facility.
Income Taxes. The Company’s effective tax rate for the year was 40%. The Company’s effective rate is greater than the Federal statutory rate principally due to the effect of stock-based compensation expense recorded currently but which is not deductible for income tax purposes creating a permanent difference between book and taxable income. The Company has available approximately $73 million in net operating losses and $3.3 million in credits for research and development to offset taxable income and tax expense. These and other temporary differences have resulted in net deferred tax assets which, prior to 2011, had been fully reserved with a valuation allowance. As of March 31, 2011, the Company assessed the positive and negative evidence regarding its ability to realize its deferred tax assets and concluded that it was more likely than not that these assets will be fully realized over the next several years. At March 31, 2011, the Company’s historic operations had generated taxable income over the past 12 quarters utilizing a portion of its net operating loss carryforwards in previously filed returns filed and anticipated utilizing an additional portion of its carryforwards for the year ending June 30, 2011. Combined with prospects for the next several years, the Company believed then and continues to believe now, it is more likely than not that deferred tax assets will be fully realized. Accordingly, the Company recorded a tax benefit of $31.0 million at March 31, 2011 to recognize the value of its net deferred tax assets which is reflected in the $29.2 million tax benefit for the year ended June 30, 2011. Accordingly, effective tax rate for 2011 was not meaningful.
Consolidated statements of operations (Unaudited) | | | | | | | | | | | | | |
| | | | | | | | | | | | | | | | |
2013– Quarter Ended | | | | | | | | | | | | | | | |
(In thousands) | | September 30 | | | December 31 | | | March 31 | | | June 30 | | | Total | |
| | | | | | | | | | | | | | | | |
Revenue: | | | | | | | | | | | | | | | |
| Systems sales | | $ | 9,035 | | | $ | 10,638 | | | $ | 10,430 | | | $ | 10,872 | | | $ | 40,975 | |
| Training and consulting services | | | 6,863 | | | | 4,107 | | | | 4,243 | | | | 4,207 | | | | 19,420 | |
| Support services | | | 10,292 | | | | 11,059 | | | | 11,375 | | | | 11,827 | | | | 44,553 | |
| Electronic data interchange and business services | | | 6,584 | | | | 6,917 | | | | 7,775 | | | | 8,620 | | | | 29,896 | |
| Total revenue | | | 32,774 | | | | 32,721 | | | | 33,823 | | | | 35,526 | | | | 134,844 | |
| | | | | | | | | | | | | | | | | | | | | |
Cost of revenue: | | | | | | | | | | | | | | | | | | | | |
| Systems sales | | | 3,007 | | | | 4,415 | | | | 5,221 | | | | 5,777 | | | | 18,420 | |
Training and consulting services(1) | | | 4,602 | | | | 3,312 | | | | 3,281 | | | | 2,487 | | | | 13,682 | |
Support services(1) | | | 3,125 | | | | 3,189 | | | | 3,340 | | | | 3,438 | | | | 13,092 | |
Electronic data interchange and business services(1) | | | 4,194 | | | | 4,399 | | | | 5,130 | | | | 5,542 | | | | 19,265 | |
| Total cost of revenue | | | 14,928 | | | | 15,315 | | | | 16,972 | | | | 18,282 | | | | 64,459 | |
| Gross profit | | | 17,846 | | | | 17,406 | | | | 16,851 | | | | | | | | 70,385 | |
| | | | | | | | | | | | | | | | | | | | | |
Operating expenses: | | | | | | | | | | | | | | | | | | | | |
Sales, general and administrative(1) | | | 13,324 | | | | 14,749 | | | | 15,088 | | | | 15,175 | | | | 58,336 | |
Research and development(1) | | | 4,772 | | | | 4,440 | | | | 4,555 | | | | 5,192 | | | | 18,959 | |
| Total operating expenses | | | 18,096 | | | | 19,189 | | | | 19,643 | | | | 20,367 | | | | 77,295 | |
| Operating income (loss) | | | (250 | ) | | | (1,783 | ) | | | (2,792 | ) | | | (2,085 | ) | | | (6,910 | ) |
Interest (income) expense and other expense, net | | | (265 | ) | | | 33 | | | | (22 | ) | | | - | | | | (254 | ) |
Income (loss) before income taxes | | | 15 | | | | (1,816 | ) | | | (2,770 | ) | | | (2,085 | ) | | | (6,656 | ) |
Provision (benefit) for income taxes | | | 7 | | | | (831 | ) | | | (2,162 | ) | | | 1,395 | | | | (1,591 | ) |
| Net income (loss) | | $ | 8 | | | $ | (985 | ) | | $ | (608 | ) | | $ | (3,480 | ) | | $ | (5,065 | ) |
| Other Financial Data: | | | | | | | | | | | | | | | | | | | | |
Adjusted EBITDA(2) | | $ | 2,609 | | | $ | 1,287 | | | $ | 588 | | | $ | 2,248 | | | $ | 6,732 | |
| | | | | | | | | | | | | | | | | | | | | |
Cost of revenue: | | | | | | | | | | | | | | | | | | | | |
| System sales | | $ | 8 | | | $ | 8 | | | $ | 8 | | | $ | 9 | | | $ | 33 | |
| Training and consulting services | | | 47 | | | | 48 | | | | 46 | | | | 51 | | | | 192 | |
| Support services | | | 26 | | | | 27 | | | | 26 | | | | 27 | | | | 106 | |
| Electronic data interchange and business services | | | 5 | | | | 5 | | | | 5 | | | | 4 | | | | 19 | |
| Total cost of revenue | | | 86 | | | | 88 | | | | 85 | | | | 91 | | | | 350 | |
| | | | | | | | | | | | | | | | | | | | | |
Operating expenses: | | | | | | | | | | | | | | | | | | | | |
| Sales, general and administrative | | | 843 | | | | 791 | | | | 791 | | | | 969 | | | | 3,394 | |
| Research and development | | | 170 | | | | 169 | | | | 169 | | | | 171 | | | | 679 | |
| Total operating expenses | | | 1,013 | | | | 960 | | | | 960 | | | | 1,140 | | | | 4,073 | |
| Total stock-compensation expense | | $ | 1,099 | | | $ | 1,048 | | | $ | 1,045 | | | $ | 1,231 | | | $ | 4,423 | |
Consolidated statements of operations (Unaudited) | | | | | | | | | | | | | |
| | | | | | | | | | | | | | | | |
2012 – Quarter Ended | | | | | | | | | | | | | | | |
(In thousands) | | September 30 | | | December 31 | | | March 31 | | | June 30 | | | Total | |
| | | | | | | | | | | | | | | | |
Revenue: | | | | | | | | | | | | | | | |
| Systems sales | | $ | 6,648 | | | $ | 9,205 | | | $ | 10,271 | | | $ | 13,176 | | | $ | 39,300 | |
| Training and consulting services | | | 6,603 | | | | 6,301 | | | | 7,643 | | | | 7,269 | | | | 27,816 | |
| Support services | | | 7,056 | | | | 7,710 | | | | 8,741 | | | | 9,636 | | | | 33,143 | |
| Electronic data interchange and business services | | | 5,343 | | | | 5,906 | | | | 6,210 | | | | 6,295 | | | | 23,754 | |
| Total revenue | | | 25,650 | | | | 29,122 | | | | 32,865 | | | | 36,376 | | | | 124,013 | |
| | | | | | | | | | | | | | | | | | | | | |
Cost of revenue: | | | | | | | | | | | | | | | | | | | | |
| Systems sales | | | 1,847 | | | | 2,761 | | | | 2,558 | | | | 3,093 | | | | 10,259 | |
Training and consulting services(1) | | | 4,431 | | | | 4,560 | | | | 5,355 | | | | 4,535 | | | | 18,881 | |
Support services(1) | | | 2,257 | | | | 2,672 | | | | 2,691 | | | | 2,944 | | | | 10,564 | |
Electronic data interchange and business services(1) | | | 3,821 | | | | 4,153 | | | | 4,226 | | | | 3,997 | | | | 16,197 | |
| Total cost of revenue | | | 12,356 | | | | 14,146 | | | | 14,830 | | | | 14,569 | | | | 55,901 | |
| Gross profit | | | 13,294 | | | | 14,976 | | | | 18,035 | | | | 21,807 | | | | 68,112 | |
| | | | | | | | | | | | | | | | | | | | | |
Operating expenses: | | | | | | | | | | | | | | | | | | | | |
Sales, general and administrative(1) | | | 10,678 | | | | 11,482 | | | | 11,802 | | | | 13,603 | | | | 47,565 | |
Research and development(1) | | | 3,165 | | | | 3,844 | | | | 4,021 | | | | 4,666 | | | | 15,696 | |
| Total operating expenses | | | 13,843 | | | | 15,326 | | | | 15,823 | | | | 18,269 | | | | 63,261 | |
| Operating income (loss) | | | (549 | ) | | | (350 | ) | | | 2,212 | | | | 3,538 | | | | 4,851 | |
Interest (income) and other expense, net | | | (47 | ) | | | (48 | ) | | | 115 | | | | (6 | ) | | | (14 | ) |
Income (loss) before income taxes | | | (596 | ) | | | (398 | ) | | | 2,327 | | | | 3,532 | | | | 4,865 | |
Provision (benefit) for income taxes | | | (190 | ) | | | (130 | ) | | | 948 | | | | 1,327 | | | | 1,955 | |
| Net income (loss) | | $ | (406 | ) | | $ | (268 | ) | | $ | 1,379 | | | $ | 2,205 | | | $ | 2,910 | |
| Other Financial Data: | | | | | | | | | | | | | | | | | | | | |
Adjusted EBITDA(2) | | $ | 930 | | | $ | 1,303 | | | $ | 3,974 | | | $ | 5,854 | | | $ | 12,061 | |
| | | | | | | | | | | | | | | | | | | | | |
| (1) Includes stock-based compensation in the following amounts: | | | | | | | | | |
| | | | | | | | | | | | | | | | | | | | | |
Cost of revenue: | | | | | | | | | | | | | | | | | | | | |
| System sales | | $ | 8 | | | $ | (2 | ) | | $ | 3 | | | $ | 2 | | | $ | 11 | |
| Training and consulting services | | | 92 | | | | 119 | | | | 34 | | | | 45 | | | | 290 | |
| Support services | | | 79 | | | | 3 | | | | 15 | | | | 15 | | | | 112 | |
| Electronic data interchange and business services | | | — | | | | 43 | | | | 6 | | | | 6 | | | | 55 | |
| Total cost of revenue | | | 179 | | | | 163 | | | | 58 | | | | 68 | | | | 468 | |
| | | | | | | | | | | | | | | | | | | | | |
Operating expenses: | | | | | | | | | | | | | | | | | | | | |
| Sales, general and administrative | | | 214 | | | | 343 | | | | 218 | | | | 768 | | | | 1,543 | |
| Research and development | | | 664 | | | | (76 | ) | | | 68 | | | | 88 | | | | 744 | |
| Total operating expenses | | | 878 | | | | 267 | | | | 286 | | | | 856 | | | | 2,287 | |
| Total stock-compensation expense | | $ | 1,057 | | | $ | 430 | | | $ | 344 | | | $ | 924 | | | $ | 2,755 | |
(2) Adjusted EBITDA is an unaudited number and represents income (loss) before interest, income taxes, depreciation and amortization and stock-based compensation. See discussion of Adjusted EBITDA above under “Adjusted EBITDA.”
Adjusted EBITDA is not a measure of liquidity calculated in accordance with U.S. generally accepted accounting principles, or GAAP, and should be viewed as a supplement to—not a substitute for—our results of operations presented on the basis of GAAP. Adjusted EBITDA does not purport to represent cash flow provided by, or used in, operating activities as defined by GAAP. Our statement of cash flows presents our cash flow activity in accordance with GAAP. Furthermore, Adjusted EBITDA is not necessarily comparable to similarly-titled measures reported by other companies.
We believe Adjusted EBITDA is used by and is useful to investors and other users of our consolidated financial statements in evaluating our operating performance because it provides them with an additional tool to compare business performance across companies and across periods. We believe that:
• EBITDA is widely used by investors to measure a company’s operating performance without regard to such items as interest expense, taxes, depreciation and amortization, which can vary substantially from company to company depending upon accounting methods and book value of assets, capital structure and the method by which assets were acquired; and
• investors commonly adjust EBITDA information to eliminate the effect of stock-based compensation expenses and other charges, which can vary widely from company to company and impair comparability.
Our management uses Adjusted EBITDA:
• as a measure of operating performance to assist in comparing performance from period to period on a consistent basis;
• as a measure for planning and forecasting overall expectations and for evaluating actual results against such expectations;
• in communications with the Board of Directors, shareholders, analysts and investors concerning our financial performance; and
• historically, as a significant performance measurement included in our bonus plan.
The table below sets forth a reconciliation of net income to Adjusted EBITDA (in thousands):
| | | | | | | | | | | | | | | | |
2013- Quarter Ended | | September 30 | | | December 31 | | | March 31 | | | June 30 | | | Total | |
Net (loss) income | | $ | 8 | | | $ | (985 | ) | | $ | (608 | ) | | $ | (3,480 | ) | | $ | (5,065 | ) |
Stock-based compensation expense | | | 1,099 | | | | 1,048 | | | | 1,045 | | | | 1,231 | | | | 4,423 | |
Depreciation and amortization expense | | | 1,784 | | | | 1,908 | | | | 2,337 | | | | 3,100 | | | | 9,129 | |
Acquisition-related transaction costs | | | - | | | | 131 | | | | 14 | | | | - | | | | 145 | |
Interest and other expenses, net | | | (289 | ) | | | 16 | | | | (38 | ) | | | 2 | | | | (309 | ) |
Provision (benefit) for income taxes | | | 7 | | | | (831 | ) | | | (2,162 | ) | | | 1,395 | | | | (1,591 | ) |
Adjusted EBITDA: | | $ | 2,609 | | | $ | 1,287 | | | $ | 588 | | | $ | 2,248 | | | $ | 6,732 | |
| | | | | | | | | | | | | | | | | | | | | |
2012 - Quarter Ended | | September 30 | | | December 31 | | | March 31 | | | June 30 | | | Total | |
| Net (loss) income | | $ | (406 | ) | | $ | (268 | ) | | $ | 1,379 | | | $ | 2,205 | | | $ | 2,910 | |
| Stock-based compensation expense | | | 1,057 | | | | 430 | | | | 344 | | | | 924 | | | | 2,755 | |
| Depreciation and amortization expense | | | 460 | | | | 1,149 | | | | 1,353 | | | | 1,410 | | | | 4,372 | |
| Acquisition-related transaction costs | | | | | | | 123 | | | | | | | | | | | | 123 | |
| Interest and other expenses, net | | | 9 | | | | (1 | ) | | | (50 | ) | | | (12 | ) | | | (54 | ) |
| Provision (benefit) for income taxes | | | (190 | ) | | | (130 | ) | | | 948 | | | | 1,327 | | | | 1,955 | |
| Adjusted EBITDA: | | $ | 930 | | | $ | 1,303 | | | $ | 3,974 | | | $ | 5,854 | | | $ | 12,061 | |
Liquidity and Capital Resources
Our principal capital requirements are to fund operations. We have typically funded our capital needs from operating cash flow augmented by approximately $33 million net proceeds from our offering completed in February 2012. In March 2011, we entered into a loan agreement with Bank of America, N.A. This facility provides financing of up to $5 million (based on eligible receivables) with interest at LIBOR plus 275 basis points. The loan agreement is secured by a pledge of the Company’s assets and contains customary provisions regarding covenants. The financial covenants require us to maintain a leverage ratio that does not exceed 2:1 and an EBITDA to interest expense ratio of at least 3:1. At June 30, 2013, we were in compliance with these covenants and there were no amounts outstanding on the credit facility. At each of June 30, 2013 and 2012, the Company had available borrowing capacity under this revolving credit facility of $5 million. On August 16, 2013, the Company executed a non-binding commitment with Bank of America, N.A. for a $25 million, four-year facility. The commitment is subject to certain specific conditions as documented in the commitment itself. The facility replaces the $5 million loan and has similar terms and conditions.
We are not a capital-intensive business. Our capital expenditures heretofore have been comprised of technology, fixtures and equipment to accommodate our growth and we acquired and renovated a building placed into service in 2011. Additionally, we capitalize the application development costs for new technology and enhancements to our innovation platform. In 2013, we invested approximately $15.3 million, in the aggregate, for these software development costs. We have completed the construction of our new campus facility to accommodate the growth of our business. This campus facility cost approximately $13 million at completion and was placed into service in 2013. The Company has and will continue to make investments in developed technology, including acquisitions of strategic parts of our roadmap that can be acquired more cheaply and more credibly than produced on our own. During 2013, the Company invested $6.8 million in such acquisitions, including the clearinghouse business acquired in December 2012. We believe that our funds anticipated from operations, current cash, short-term investments and funds available under our credit facility, will be sufficient to meet our working capital and capital expenditure needs for the next 12 months and for a reasonable period thereafter.
Initial Public Offering
On February 7, 2012, we completed an initial public offering of common stock. The total offering size was 7,666,667 shares (after exercise by the underwriters of their over-allotment option), consisting of 6,388,883 shares issued and sold by us. Net proceeds to the Company were approximately $56.3 million, of which $23.3 million was used for a cash payment to holders of our outstanding preferred stock concurrently with the conversion of such shares into shares of common stock in connection with the closing of the IPO. Certain holders of our outstanding preferred stock who received cash payments included certain executive officers and directors. The Company did not receive proceeds from the sale of shares by the selling shareholders and none of that cash was used in the Company’s operations. The net proceeds to the Company were $33.0 million which was used in the ongoing operations and used to fund certain acquisitions and certain construction of the campus facilities.
Cash Flow Summary
Cash and cash equivalents were $3.2 million and $5.6 million at June 30, 2013 and 2012, respectively. As of June 30, 2013 and 2012, we also had $8.0 and $29.4 million, respectively, in short-term investments classified as available for sale.
Our cash flows from operating, investing and financing activities, as reported in our consolidated financial statements included elsewhere in this report, are summarized as follows:
| | | | | | | | | | |
| | For the years ended June 30, | |
| | | 2011 | | | 2012 | | | 2013 | |
| Net cash provided by operating activities | | $ | 6,243 | | | $ | 8,286 | | | $ | 4,646 | |
| Net cash used in investing activities | | | (20,314 | ) | | | (42,136 | ) | | | (9,362 | ) |
| Net cash provided by financing activities | | | 614 | | | | 33,713 | | | | 2,315 | |
| Net decrease in cash and cash equivalents | | $ | (13,457 | ) | | $ | (137 | ) | | $ | (2,401 | ) |
Operating Activities
Operating Activities. Net cash provided by operating activities was $4.6 million for the year ended June 30, 2013, as compared with $8.3 million for the year ended June 30, 2012. Net cash provided by operating activities for 2013 consisted of the Company’s net loss of $5.1 million, decreased by cash flows used for working capital of approximately $4.8 million that was offset by non-cash charges of $14.4 million (including $9.1 million in depreciation and amortization, $4.4 million in stock compensation expense, and an increase in the charge for the provision for bad debts of $2.7 million and a decrease in deferred income taxes of $1.8 million). The Company generated cash flow from operations from sources of such as accounts receivable, prepaids and other current assets that were offset by uses of cash flow from accounts payable and accrued liabilities and deferred revenue.
Investing Activities. During the year ended June 30, 2011, we began investing surplus cash resources and as of June 30, 2013, had net short-term investments of $8.0 million. Our policy is to invest only in fixed income instruments denominated and payable in U.S. dollars, including obligations of the U.S. government and its agencies, money market instruments, commercial paper, certificates of deposit, bankers’ acceptances, corporate bonds of U.S. companies, municipal securities and asset backed securities. We do not invest in auction rate securities, futures contracts, or hedging instruments. Securities of a single issuer valued at cost at the time of purchase should not exceed 10% of the market value of the portfolio but securities issued by the U.S. Treasury and U.S. government agencies are specifically exempted from these restrictions. The final maturity of each security within the portfolio should not exceed 24 months.
Net cash used in investing activities was $9.4 million and $42.1 million for the years ended June 30, 2013 and 2012, respectively. This decrease was primarily related to the initial purchase of the short-term investments in the year ended June 30, 2012. There were notable and ratable increases in each category of investing activities including, purchases of property and equipment, capitalized software and acquisitions from the year ended June 30, 2012 to the year ended June 30, 2013. The increase in software and development reflects the continued investment the Company is making in software to address the regulatory changes, marketplace opportunity with meaningful use and, market embracing clinical technological changes. The increase in property and equipment reflects the final year of investment in the Company’s campus facility in Carrollton, GA. This campus facility was placed into service in the year ended June 30, 2013. The acquisitions are discussed in the footnote to the Company’s consolidated financial statements, and reflect the Company taking advantage of purchasing businesses that it believes it can move the Company along its technological road map faster than similar technology can be developed internally.
Financing Activities.Net cash provided by financing activities was $2.3 million and $33.7 million for the years ended June 30, 2013 and 2012, respectively. This change was substantially all related directly to our IPO. As discussed above, the initial public offering generated net proceeds of $33.0 million in the year ended June 30, 2012 that was used to complete construction of the campus facility in Carrollton, GA, certain acquisitions and the Company’s ongoing operations.
Contractual Obligations and Commitments
Our contractual cash payment commitments as of June 30, 2013, are set forth below (in thousands):
| | | | | | | | | | | | | | | | | | |
| | | Total | | | 2014 | | | 2015 | | | 2016 | | | 2017 | | | 2018 | | |
| Operating leases | | $ | 3,936 | | | $ | 2,301 | | | $ | 1,196 | | | $ | 365 | | | $ | 58 | | | | 16 | |
Off-Balance Sheet Arrangements
We engage in no activities, obligations or exposure with off-balance sheet arrangements.
Critical Accounting Policies and Estimates
Our management’s discussion and analysis of financial condition and results of operations is based upon our consolidated financial statements and notes to our consolidated financial statements, which were prepared in accordance with U.S. GAAP. The preparation of the consolidated financial statements requires us to make estimates and assumptions that affect the amounts reported in the consolidated financial statements and accompanying notes. We evaluate our estimates on an ongoing basis, including those related to revenue recognition, stock-based compensation, capitalization of software development costs and the provision for income taxes. We base our estimates and judgments on our historical experience, knowledge of factors affecting our business and our belief as to what could occur in the future considering available information and assumptions that are believed to be reasonable under the circumstances.
The accounting estimates we use in the preparation of our consolidated financial statements will change as new events occur, more experience is acquired, additional information is obtained and our operating environment changes. Changes in estimates are made when circumstances warrant. Such changes in estimates and refinements in estimation methodologies are reflected in our reported results of operations and, if material, the effects of changes in estimates are disclosed in the notes to our consolidated financial statements. By their nature, these estimates and judgments are subject to an inherent degree of uncertainty and actual results could differ materially from the amounts reported based on these estimates.
Revenue Recognition
The Company recognizes revenue in accordance with U.S. GAAP, principally ASC 985-605,Software Revenue Recognition. In October 2009, the FASB issued Accounting Standards Update (ASU) 2009-13,Multiple-Deliverable Revenue Arrangements and ASU 2009-14,Certain Revenue Arrangements That Include Software Elements — both representing consensus of the FASB Emerging Issues Task Force, to amend certain revenue recognition guidance. ASU 2009-13 amended guidance in ASC 605-25,Revenue Recognition,Multiple-Element Arrangements — to (1) modify the separation criteria by eliminating the criterion that requires objective and reliable evidence of fair value for the undelivered item(s), and (2) eliminate use of the residual method of allocation and instead require that arrangement consideration be allocated, at the inception of the arrangement, to all deliverables based on their relative selling price. ASU 2009-14 amended the scope of arrangements under ASC 985-605,Software, Revenue Recognitionto exclude tangible products containing software components and non-software components that function together to deliver a product’s essential functionality.
The amended guidance in ASC 985-605 and ASC 605-25 was effective prospectively for revenue arrangements entered into or materially modified in fiscal years beginning on or after June 15, 2010, with early application and retrospective application permitted. The Company adopted this amended guidance effective July 1, 2010 and there was no significant impact on our consolidated financial statements as a result.
The Company generates revenue from the following sources:
| ● | The sale of information systems, which includes software, hardware and peripherals, deployment and training |
| ● | The provision of system support services (PCS), which includes software application support and hardware maintenance |
| ● | The provision of outsourcing services, which includes the processing of medical claims, electronic patient statements and business services including clinically-driven revenue cycle management and EHR-enabled research |
The Company enters into contractual obligations to sell hardware, perpetual software licenses, deployment and training services, PCS services and outsourcing services. ASC 985-605-25 requires revenue earned on software arrangements involving multiple elements to be allocated to each element based on the relative fair values of those elements. The fair value of an element must be based on vendor specific objective evidence (VSOE). The Company limits its assessment of VSOE for each element to either the price charged when the same element is sold separately or the price established by management having the relevant authority to do so, for an element not yet sold separately. VSOE calculations are updated and reviewed annually. When evidence of fair value exists for the delivered and undelivered elements of a transaction, then discounts for individual elements are aggregated and the total discount is allocated to the individual elements in proportion to the elements’ fair value relative to the total contract fair value.
Revenue is recognized on the hardware and software deliverables upon shipment at which point VSOE has been established for all of the undelivered individual elements which, generally consist of training services, outsourcing services and PCS. The fair value of training is determined based on the value of those services sold separately. VSOE of PCS and outsourcing services is determined by reference to the price the Company’s customers are required to pay for the services when sold separately (renewals). Training also includes deployment services, principally start-up monitoring and workflow consulting, performed in and around the time a new implementation occurs as well as follow-up training to assist a practice’s providers in enhancing proficiency and efficiency as staffing changes occur.
The Company also generates revenue from its software products under software subscription agreements. These software subscription agreements include the right to use the software and receive unspecified future product enhancements and upgrades when and if available for a specified term, usually 36 to 60 months. These agreements are accounted for as hosting (service agreements) under ASC 985-605-55-121. Revenue from all of the deliverables related to subscription agreements, including training and support services is recognized as performed. Implementation services are charged, deferred and amortized over the longer of the contract or the estimated customer life. Any amounts invoiced or cash received in advance is recorded as deferred revenue and amortized over the longer of the contract period or the estimated customer life. The agreements with our customers for these hosting services do not allow for the customers to take ownership or possession of the software and support is not sold separately.
Risks associated with estimates and judgments and the effects on revenue recognition include: 1) if VSOE of any undelivered element does not exist, revenue is deferred until VSOE is established and 2) if the fees are not fixed or determinable, or if collection is not reasonably assured, then the revenue recognized in various periods will be less than the amount recognized had those characteristics existed with the customer. Although we believe that our approach to estimates and judgments as described herein is reasonable, actual results could differ and we may be exposed to increases or decreases in revenue that could be material.
Fair Value Considerations For Equity
Until completion of our IPO in February 2012, our equity instruments consisted of common stock and Convertible Preferred Stock Series A and B, which were reflected in our consolidated financial statements as temporary equity. We considered fair value of these instruments under guidance in ASC 820 for purposes of recording share-based compensation expense and consideration of any adjustments to fair value of convertible preferred stock for each reporting period. Our consideration of value at or around each measurement date considered a number of estimates and judgments, including:
| | ● | company performance, our growth rate and financial condition; |
| | ● | the value of companies that we consider peers based on a number of factors including, but not limited to, similarity to us with respect to industry, business model, stage of growth, financial risk or other factors; |
| | ● | changes in the Company and our prospects since the last time the Board of Directors approved option grants and/or made a determination of fair value; |
| | ● | amounts recently paid by investors for our common stock in arm’s-length transactions; |
| | ● | the rights, preferences and privileges of our convertible preferred stock relative to those of our common stock; |
| | ● | the likelihood of achieving a liquidity event, such as an initial public offering or sale of all or a portion of the company; |
| | ● | future financial projections; and |
| | ● | valuations completed near the time of the grant. |
Risks associated with these estimates and judgments and the effects thereof include the fact that consideration of future performance could be materially different than our estimates and that these and other inputs included in our valuations, such as the appropriate discount rate, or that the valuation model applied prove to be flawed. The impact of different equity valuation results from those utilized in our consolidated financial statements mean that the carrying value of our temporary equity for any period may be higher or lower than amounts reported with a corresponding impact on income available to common shareholders. In connection with this offering, all our convertible preferred stock will convert to common stock and the carrying value will be eliminated in its entirety with any difference accreted in our statement of operations.
These same risks are associated with determination of estimated fair value with respect to our common stock. Fair value of our common stock is the basis for determination of strike price for stock options issued and is an input in the Black-Scholes option pricing model for determination of estimated fair value of stock options issued. Other estimates, judgments and associated risks regarding share-based compensation are more fully described below.
Share-Based Compensation
Estimated fair value of stock option grants is determined using the Black-Scholes options pricing model. The Black-Scholes option-pricing model was developed for use in estimating the fair value of traded options that have no vesting restrictions and are fully transferable, characteristics not present in these employee stock options. Additionally, option valuation models require the input of highly subjective assumptions including the expected volatility of the stock price. Because the Company’s employee stock options have characteristics significantly different from those of traded options and because changes in the subjective input assumptions can materially affect the fair value estimates, in management’s opinion, the existing models may not provide a reliable single measure of the fair value of its share-based awards.
We considered the fair value of our common stock and the exercise price of the grant as variables in the Black-Scholes option-pricing model to determine employee stock-based compensation. This model requires the input of assumptions on each grant date, some of which are highly subjective, including the expected term of the option, expected stock price volatility and expected forfeitures.
We determined the expected term of our options based upon historical exercises, post-vesting cancellations and the contractual term of the option. We concluded that it was not practicable to calculate the volatility of our share price due to the fact that our securities were not publicly traded and therefore there is no readily determinable market value for our stock. Therefore, we based expected volatility on the historical volatility of a publicly traded peer entity for the same expected term of our options. We intend to continue to consistently apply this process using the same or similar entities until a sufficient amount of historical information regarding the volatility of our own share price becomes available, or unless circumstances change such that the identified entity is no longer similar to us. In this latter case, more suitable entities whose share prices are publicly available would be utilized in the calculation. We based the risk-free rate for the expected term of the option on the U.S. Treasury Constant Maturity Rate as of the grant date. We determined the forfeiture rate based upon our historical experience with pre-vesting option cancellations. If we had made different assumptions and estimates than those described above, the amount of our recognized and to be recognized stock-based compensation expense, net income (loss) and net income (loss) per share amounts could have been materially different.
We believe that we have used reasonable methodologies, approaches and assumptions consistent with the AICPA Practice Guide, Valuation of Privately-Held-Company Equity Securities Issued as Compensation, to determine the fair value of our common stock. We have reviewed key factors and events between each date below and have determined that the combination of the factors and events described above reflect a true measurement of the fair value of our common stock over an extended period of time.
Valuation of Deferred Tax Assets
Our deferred tax assets are comprised primarily of net operating loss carryforwards (“NOLs”) and research and development credits. At June 30, 2010, we had NOLs of approximately $69.5 million which will begin to expire in 2020. At June 30, 2010, we had research tax credit carryforwards of $2.4 million which begin expiring in 2023. At June 30, 2010, we had federal alternative minimum tax (“AMT”), credit carryforwards of $77,000. The federal AMT credit carryforwards do not expire. A valuation allowance of $31 million had been recorded at June 30, 2010.
During the third quarter of 2011, we determined that it would be more likely than not that the cumulative net operating loss and other deferred tax benefits would be recoverable by us, creating a $31 million income tax benefit due to the deferred tax asset recorded on our balance sheet as of March 31, 2011. This determination was based on the following factors:
| | ● | For the twelve quarters ending March 31, 2011, the Company’s consolidated statements of operations reflected cumulative income before taxes of $3.5 million. The quarter ending June 30, 2011, was anticipated to generate significant positive results (which results were record revenues of $29.4 million and income before taxes of $4.3 million). |
| | ● | The Company had utilized a significant portion of its net operating loss carryforwards in tax returns filed in the three years ending June 30, 2010 and anticipated utilization of an additional portion of such carryforwards for its return for fiscal 2011. |
| | ● | The significant growth in revenues and earnings the Company has experienced over the past three years is forecasted to continue. The Company has achieved or exceeded its forecast in each of the past four years as it has progressed toward significant scale and profitability. |
| | ● | The Company’s market segment is extremely positively impacted by the HITECH Act which provides significant funding through 2014 to providers for acquisition and “meaningful use” of EHR technology systems as part of the Federal government’s initiatives to facilitate improvements in healthcare delivery and mitigate costs. |
| | ● | The above factors are somewhat tempered by the current state of the U.S. economy, which is experiencing slow to modest growth. However, the healthcare sector appears to have been less affected than other sectors of the economy due in part to the impact of certain government initiatives. |
The determination of when to adjust the valuation allowance requires significant judgment on the part of management based on our evaluation of the weight of positive and negative evidence, historical experience, knowledge of current business factors and our belief of what could occur in the future. Although realization is not assured, we concluded that it is more likely than not that the deferred tax assets as of March 31, 2011, for which a valuation allowance was determined to be unnecessary, will be realized in the ordinary course of operations. Our assessment remains the same through the three year period ended in June 30, 2013. The amount of the deferred tax assets considered realizable; however, could be reduced in the near term if actual future earnings are lower than estimated, or if there are differences in the timing or amount of future reversals of existing taxable or deductible temporary differences.
Item 7A. | Quantitative and Qualitative Disclosures about Market Risk |
The primary objective of our investment activities is to preserve principal while at the same time maximizing yields without significantly increasing risk. To achieve this objective, our investments include money market and mutual funds and high quality debt securities. Our investments in debt securities are subject to interest rate risk. To minimize the exposure due to an adverse shift in interest rates, we invest in short-term securities and maintain average portfolio duration of approximately one year.
Our operations consist of research and development and sales activities in the United States. As a result, our financial results are not affected by factors such as changes in foreign currency exchange rates or economic conditions in foreign markets.
| | |
Item 8. | Consolidated Financial Statements and Supplementary Data |
The consolidated financial statements set forth herein commence on page F-1 of this Form 10-K.
| | |
Item 9. | Changes in and Disagreements with Accountants on Accounting and Financial Disclosure |
None.
Item 9A. | Controls and Procedures |
Evaluation of Disclosure Controls and Procedures
The Company maintains disclosure controls and procedures that are designed to ensure that information required to be disclosed in its Exchange Act reports is recorded, processed, summarized and reported within the time periods specified in the SEC’s rules and forms, and that such information is accumulated and communicated to its management, including the Chief Executive Officer and Chief Financial Officer, as appropriate, to allow timely decisions regarding required disclosure.
As of the end of the period covered by this report, June 30, 2013 (the “Evaluation Date”), the Company carried out an evaluation, under the supervision and with the participation of its management, including the Chief Executive Officer and Chief Financial Officer, of the effectiveness of the design and operation of its disclosure controls and procedures. Based upon this evaluation, the Chief Executive Officer and the Chief Financial Officer concluded that the Company’s disclosure controls and procedures were effective at a reasonable assurance level as of the Evaluation Date.
Management’s Report on Internal Control Over Financial Reporting
Our management is responsible for establishing and maintaining adequate internal control over financial reporting. Internal control over financial reporting is defined under applicable Securities and Exchange Commission rules as a process designed under the supervision of the Company’s Chief Executive Officer and Chief Financial Officer and effected by the Company’s Board of Directors, management and other personnel to provide reasonable assurance regarding the reliability of financial reporting and the preparation of the Company’s financial statements for external purposes in accordance with generally accepted accounting principles. The Company’s internal control over financial reporting includes those policies and procedures that:
| | ● | Pertain to the maintenance of records that, in reasonable detail, accurately and fairly reflect the transactions and dispositions of the assets of the Company; |
| | | |
| | ● | Provide reasonable assurance that transactions are recorded as necessary to permit preparation of financial statements in accordance with generally accepted accounting principles, and that receipts and expenditures of the Company are being made only in accordance with authorizations of management and the Directors of the Company; and |
| | | |
| | ● | Provide reasonable assurance regarding prevention or timely detection of unauthorized acquisition, use or disposition of the Company’s assets that could have a material effect on the financial statements. |
Because of its inherent limitations, internal control over financial reporting may not prevent or detect misstatements. Also, projections of any evaluation of effectiveness to future periods are subject to the risk that controls may become inadequate because of changes in conditions, or that the degree of compliance with the policies or procedures may deteriorate.
Under the supervision and with the participation of our management, including our Chief Executive Officer and Chief Financial Officer, we conducted an evaluation of the effectiveness of our internal control over financial reporting based on the framework in Internal Control - Integrated Framework issued by the Committee of Sponsoring Organizations of the Treadway Commission. Based on our evaluation under the framework in Internal Control - Integrated Framework, our management concluded that our internal control over financial reporting was effective as of June 30, 2013.
Changes in Internal Control Over Financial Reporting
There have been no changes in our internal control over financial reporting during the fourth quarter of fiscal year 2013 that have or are reasonably likely to materially affect our internal control over financial reporting identified in connection with the previously mentioned evaluation.
Item 9B. | Other Information |
None.
PART III
| | |
Item 10. | Directors, Executive Officers and Corporate Governance |
The information required by this item will be included in the definitive proxy statement for our 2013 annual meeting of stockholders or an amendment to this Report to be filed with the SEC within 120 days after our fiscal year ended June 30, 2013, and is incorporated into this Report by reference.
| | |
Item 11. | Executive Compensation |
The information required by this item will be included in the definitive proxy statement for our 2013 annual meeting of stockholders or an amendment to this Report to be filed with the SEC within 120 days after our fiscal year ended June 30, 2013, and is incorporated into this Report by reference.
| | |
Item 12. | Security Ownership of Certain Beneficial Owners and Management and Related Stockholder Matters |
The information required by this item will be included in the definitive proxy statement for our 2013 annual meeting of stockholders or an amendment to this Report to be filed with the SEC within 120 days after our fiscal year ended June 30, 2013, and is incorporated into this Report by reference.
| | |
Item 13. | Certain Relationships and Related Transactions, and Director Independence |
The information required by this item will be included in the definitive proxy statement for our 2013 annual meeting of stockholders or an amendment to this Report to be filed with the SEC within 120 days after our fiscal year ended June 30, 2013, and is incorporated into this Report by reference.
| | |
Item 14. | Principal Accountant Fees and Services |
The information required by this item will be included in the definitive proxy statement for our 2013 annual meeting of stockholders or an amendment to this Report to be filed with the SEC within 120 days after our fiscal year ended June 30, 2013, and is incorporated into this Report by reference.
PART IV
| | |
Item 15. | Exhibits and Financial Statement Schedules |
(a)(1) Consolidated Financial Statements
| | | |
| | | Page |
| | Greenway Medical Technologies, Inc. | |
| | | F-2 |
| | | F-3 |
| | | F-4 |
| | | F-5 |
| | | F-6 |
| | | F-7 |
(a)(2) Financial Statement Schedules
Supplemental schedules are omited because of the absence of conditions under which they are required or because the required information is given in the consolidated financial statements or notes thereto.
(a)(3) Exhibits
| | | |
Exhibit Number | | Description of Document |
| 3.1 | | Certificate of Incorporation of the Company (incorporated by reference to Exhibit 3.2 to the Company’s Form S-1/A (File No. 333-175619) filed on January 18, 2012) |
| | | |
| 3.2 | | Bylaws of the Company (incorporated by reference to Exhibit 3.3 to the Company’s Form S-1/A (File No. 333-175619) filed on January 18, 2012) |
| | | |
| 4.1 | | Form of the Company’s Common Stock Certificate (incorporated by reference to Exhibit 4.1 to the Company’s Form S-1/A (File No. 333-175619) filed on January 18, 2012) |
| | | |
| 4.2.1 | | Form of the Company’s Series A Preferred Stock Certificate (incorporated by reference to Exhibit 4.2 to the Company’s Form S-1/A (File No. 333-175619) filed on September 23, 2011) |
| | | |
| 4.2.2 | | Form of the Company’s Series B Preferred Stock Certificate (incorporated by reference to Exhibit 4.3 to the Company’s Form S-1/A (File No. 333-175619) filed on September 23, 2011) |
| | | |
| 4.3 | | Amended and Restated Investors’ Rights Agreement, by and among Greenway Medical Technologies, Inc. and the investors listed on Schedule A thereto, dated October 30, 2006(incorporated by reference to Exhibit 4.2 to the Company’s Form S-1 (File No. 333-175619) filed on July 15, 2011) |
| | | |
| 4.4 | | Second Amended and Restated Voting Agreement by and among Greenway Medical Technologies, Inc. and the investors listed on the schedules thereto dated October 30, 2006 (incorporated by reference to the Company’s Form S-1/A (incorporated by reference to Exhibit 4.3 to the Company’s Form S-1/A (File No. 333-175619) filed on August 26, 2011) |
| | | |
| 10.1* | | Greenway Medical Technologies, Inc. 2011 Stock Plan (incorporated by reference to Exhibit 10.1 to the Company’s Form S-1/A (File No. 333-175619) filed on January 18, 2012) |
| | | |
| 10.2* | | Greenway Medical Technologies, Inc. 2004 Stock Plan (incorporated by reference to Exhibit 10.2 to the Company’s Form S-1/A (File No. 333-175619) filed on August 26, 2011) |
| | | |
| 10.2.1* | | 2004 Stock Plan Form of ISO and NSO Notice of Stock Option Grant and Stock Option Agreement (incorporated by reference to Exhibit 10.2.1 to the Company’s Form S-1/A (File No. 333-175619) filed on August 26, 2011) |
| | | |
| 10.2.2* | | Amendment to 2004 Stock Plan (incorporated by reference to Exhibit 10.2.2 to the Company’s Form S-1/A (File No. 333-175619) filed on January 18, 2012) |
| | | |
| 10.3* | | Greenway Medical Technologies 1999 Stock Option Plan, as amended (incorporated by reference to Exhibit 10.3 to the Company’s Form S-1/A (File No. 333-175619) filed on August 26, 2011) |
| | | |
| 10.3.1* | | 1999 Stock Option Plan Form of ISO Agreement (incorporated by reference to Exhibit 10.3.1 to the Company’s Form S-1/A (File No. 333-175619) filed on August 26, 2011) |
| | | |
| 10.3.2* | | 1999 Stock Option Plan Form of Non-Qualified Stock Option Agreement (incorporated by reference to Exhibit 10.3.2 to the Company’s Form S-1/A (File No. 333-175619) filed on August 26, 2011) |
| | | |
| 10.4* | | Form of Indemnification Agreement by and between Greenway Medical Technologies, Inc. and each of its directors (incorporated by reference to Exhibit 10.4 to the Company’s Form S-1/A (File No. 333-175619) filed on January 18, 2012) |
| | | |
| 10.5 | | Triple Net Lease, by and between Elizabeth Village, LLC and Greenway Medical Technologies, Inc., dated as of July 1, 2000 (incorporated by reference to Exhibit 10.5 to the Company’s Form S-1 (File No. 333-175619) filed on July 15, 2011) |
| | | |
| 10.6 | | Credit Agreement, among Greenway Medical Technologies, Inc., Bank of America, N.A., and the other lenders, named therein, dated as of March 22, 2011 (incorporated by reference to Exhibit 10.6 to the Company’s Form S-1/A (File No. 333-175619) filed on August 26, 2011) |
| 10.6.1 | | Amendment to Credit Agreement (incorporated by reference to Exhibit 10.6.1 to the Company’s Form S-1/A (File No. 333-175619) filed on December 5, 2011) |
| | | |
| 10.6.2 | | Second Amendment to Credit Agreement (incorporated by reference to Exhibit 10.6.2 to the Company’s Form S-1/A (File No. 333-175619) filed on January 18, 2012) |
| | | |
| 10.6.3^ | | Third Amendment to Credit Agreement |
| | | |
| 10.6.4^ | | Fourth Amendment to Credit Agreement |
| | | |
| 10.7 | | Security Agreement, by and between Greenway Medical Technologies, Inc. and Bank of America, N.A., dated as of March 22, 2011 (incorporated by reference to Exhibit 10.7 to the Company’s Form S-1 (File No. 333-175619) filed on July 15, 2011) |
| | | |
| 10.8+ | | Software License and Services Agreement, by and between Greenway Medical Technologies, Inc. and Walgreen Co., dated as of February 28, 2011 (incorporated by reference to Exhibit 10.8 to the Company’s Form S-1/A (File No. 333-175619) filed on December 5, 2011) |
| | | |
| 10.9* | | Form of 2011 Incentive Bonus Plan (incorporated by reference to Exhibit 10.9 to the Company’s Form S-1/A (File No. 333-175619) filed on January 18, 2012) |
| | | |
| 10.10*+ | | Form of 2012 Incentive Bonus Plan (incorporated by reference to Exhibit 10.1 of the Company’s Form 8-K filed on March 5, 2012) |
| | | |
| 10.11*+ | | Form of 2013 Incentive Bonus Plan (incorporated by reference to Exhibit 10.1 of the Company’s Form 8-K filed on September 29, 2012) |
| | | |
| 10.12* | | Form of Greenway Medical Technologies, Inc. 2011 Stock Plan Stock Option Award Agreement (incorporated by reference to Exhibit 10.2 of the Company’s Form 8-K filed on March 5, 2012) |
| | | |
| 14.1 | | Greenway Medical Technologies, Inc. Code of Business Conduct and Ethics (incorporated by reference to Exhibit 14 to the Company’s Form S-1/A (File No. 333-175619) filed on January 18, 2012) |
| | | |
| 21^ | | List of subsidiaries |
| | | |
| 23.1^ | | Consent of Grant Thornton LLP |
| | | |
| 31.1^ | | Certification of Chief Executive Officer pursuant to Rule 13a-14(a)/15d-14(a) of the Securities Exchange Act of 1934, as amended, as adopted pursuant to Section 302 of the Sarbanes-Oxley Act of 2002 |
| | | |
| 31.2^ | | Certification of Chief Financial Officer pursuant to Rule 13a-14(a)/15d-14(a) of the Securities Exchange Act of 1934, as amended, as adopted pursuant to Section 302 of the Sarbanes-Oxley Act of 2002 |
| | | |
| 32.1^ | | Certification of Chief Executive Officer and Chief Financial Officer pursuant to 18 U.S.C. Section 1350, as adopted pursuant to Section 906 of the Sarbanes-Oxley Act of 2002 |
| | | |
| 101 | | Interactive Data File** |
| | |
| ^ | Filed herewith |
| | |
| * | Denotes management contract or compensatory arrangement. |
| | |
| + | Certain portions have been omitted pursuant to a confidential treatment request. Omitted information will be filed separately with the SEC. |
** Pursuant to Rule 406T of SEC Regulation S-T, the Interactive Data Files on Exhibit 101 hereto are deemed not filed or part of a registration statement or prospectus for purposes of Sections 11 or 12 of the Securities Act of 1933, as amended, are deemed not filed for purposes of Section 18 of the Securities Exchange Act of 1934, as amended, and otherwise are not subject to liability under these Sections.
SIGNATURES
Pursuant to the requirements of Section 13 or 15(d) of the Securities Exchange Act of 1934, the registrant has duly caused this Annual Report on Form 10-K for the year ended June 30, 2013 to be signed on its behalf by the undersigned, thereunto duly authorized on this 13th day of September, 2013.
| | | | |
| | GREENWAY MEDICAL TECHNOLOGIES, INC. |
| | | |
| | By: | /s/ Wyche T. Green, III | |
| �� | | |
| | Wyche T. Green, III |
| | President and Chief Executive Officer |
Pursuant to the requirements of the Securities Exchange Act of 1934, this report has been signed below by the following persons on behalf of the Registrant and in the capacities and on the dates indicated.
| | | | | | | | | | |
| | Signature | | | | Title | | | Date | |
| | | | |
| /s/ Wyche T. Green, III | | President, Chief Executive Officer, Director | September 13, 2013 |
| Wyche T. Green, III | | (Principal Executive Officer) | |
| | | | |
| /s/ W. Thomas Green, Jr. | | Chairman of the Board of Directors | September 13, 2013 |
| W. Thomas Green, Jr. | | | |
| | | | |
| /s/ James A. Cochran | | Chief Financial Officer | September 13, 2013 |
| James A. Cochran | | (Principal Financial and Accounting Officer) | |
| | | | |
| /s/ Noah Walley | | | |
| Noah Walley | | Director | September 13, 2013 |
| | | | |
| /s/ Thomas T. Richards | | Director | September 13, 2013 |
| Thomas T. Richards | | | |
| | | | |
| /s/ Walter Turek | | Director | September 13, 2013 |
| Walter Turek | | | |
| | | | |
| /s/ Neal Morrison | | Director | September 13, 2013 |
| Neal Morrison | | | |
| | | | |
| /s/ Robert Hensley | | Director | September 13, 2013 |
| Robert Hensley | | | |
INDEX TO CONSOLIDATED FINANCIAL STATEMENTS
| | | |
| | | Page |
Greenway Medical Technologies, Inc. | | |
| | | |
| | F-2 |
| | F-3 |
| | F-4 |
| | F-5 |
| | F-6 |
| | F-7 |
Board of Directors and Shareholders
Greenway Medical Technologies, Inc.
We have audited the accompanying consolidated balance sheets of Greenway Medical Technologies, Inc. (a Delaware corporation) and subsidiaries (the “Company”) as of June 30, 2013 and 2012, and the related consolidated statements of operations, changes in convertible preferred and shareholders’ equity (deficit), and cash flows for each of the three years in the period ended June 30, 2013. These financial statements are the responsibility of the Company’s management. Our responsibility is to express an opinion on these financial statements based on our audits.
We conducted our audits in accordance with the standards of the Public Company Accounting Oversight Board (United States). Those standards require that we plan and perform the audit to obtain reasonable assurance about whether the financial statements are free of material misstatement. The Company is not required to have, nor were we engaged to perform an audit of its internal control over financial reporting. Our audits included consideration of internal control over financial reporting as a basis for designing audit procedures that are appropriate in the circumstances, but not for the purpose of expressing an opinion on the effectiveness of the Company’s internal control over financial reporting. Accordingly, we express no such opinion. An audit also includes examining, on a test basis, evidence supporting the amounts and disclosures in the financial statements, assessing the accounting principles used and significant estimates made by management, as well as evaluating the overall financial statement presentation. We believe that our audits provide a reasonable basis for our opinion.
In our opinion, the consolidated financial statements referred to above present fairly, in all material respects, the financial position of Greenway Medical Technologies, Inc. and subsidiaries, as of June 30, 2013 and 2012, and the results of their operations and their cash flows for each of the three years in the period ended June 30, 2013, in conformity with accounting principles generally accepted in the United States of America.
| |
| /s/ Grant Thornton LLP |
| |
| Atlanta, Georgia |
| September 13, 2013 |
GREENWAY MEDICAL TECHNOLOGIES, INC.
| | | June 30, | |
| | | 2013 | | | 2012 | |
Assets | | | | | | |
| | | | | | | |
Current assets: | | | | | | |
| | | | | | | |
| Cash and cash equivalents | | $ | 3,184 | | | $ | 5,585 | |
| Short-term investments | | | 8,043 | | | | 29,350 | |
| Accounts receivable, net of a $900 and $720 allowance for doubtful accounts in 2013 and 2012, respectively | | | 21,151 | | | | 28,875 | |
| Inventory, net | | | 284 | | | | 281 | |
| Prepaid and other current assets | | | 3,772 | | | | 3,001 | |
| Deferred tax assets | | | 2,407 | | | | 1,699 | |
| Total current assets | | | 38,841 | | | | 68,791 | |
| | | | | | | | | |
Property and equipment, net | | | 28,416 | | | | 20,340 | |
Software development cost, net | | | 28,142 | | | | 17,156 | |
Acquired technology and other assets | | | 1,819 | | | | 510 | |
Deferred tax assets — noncurrent, net | | | 26,903 | | | | 25,846 | |
Goodwill | | | 1,540 | | | | 440 | |
Other assets | | | 468 | | | | 40 | |
| Total assets | | $ | 126,129 | | | $ | 133,123 | |
| | | | | | | | | |
Liabilities and shareholders’ equity | | | | | | | | |
| | | | | | | | | |
Current liabilities: | | | | | | | | |
| | | | | | | | | |
| Accounts payable | | $ | 9,325 | | | $ | 12,436 | |
| Accrued liabilities | | | 5,846 | | | | 9,533 | |
| Deferred revenue | | | 9,323 | | | | 12,192 | |
| Total current liabilities | | | 24,494 | | | | 34,161 | |
Obligation for purchased technology | | | — | | | | 116 | |
| | | | | | | | | |
Commitments | | | | | | | | |
| | | | | | | | | |
Shareholders’ equity: | | | | | | | | |
| | | | | | | | | |
| Common stock | | | 3 | | | | 3 | |
| Additional paid-in capital | | | 245,412 | | | | 237,558 | |
| Accumulated deficit | | | (143,780 | ) | | | (138,715 | ) |
| Total shareholders’ equity | | | 101,635 | | | | 98,846 | |
| Total liabilities and shareholders’ equity | | $ | 126,129 | | | $ | 133,123 | |
The accompanying notes are an integral part of these consolidated financial statements.
GREENWAY MEDICAL TECHNOLOGIES, INC.
| |
|
| (In Thousands, except Per Share Data) |
| | | For the years ended June 30, | |
| | | 2013 | | | 2012 | | | 2011 | |
Revenue: | | | | | | | | | |
| | | | | | | | | | |
| Systems sales | | $ | 40,975 | | | $ | 39,300 | | | $ | 31,726 | |
| Training and consulting services | | | 19,420 | | | | 27,816 | | | | 18,373 | |
| Support services | | | 44,553 | | | | 33,143 | | | | 22,401 | |
| Electronic data interchange and business services | | | 29,896 | | | | 23,754 | | | | 17,339 | |
| Total revenue | | | 134,844 | | | | 124,013 | | | | 89,839 | |
Cost of revenue: | | | | | | | | | | | | |
| | | | | | | | | | | | | |
| Systems sales | | | 18,420 | | | | 10,259 | | | | 7,522 | |
| Training and consulting services | | | 13,682 | | | | 18,881 | | | | 13,550 | |
| Support services | | | 13,092 | | | | 10,564 | | | | 7,059 | |
| Electronic data interchange and business services | | | 19,265 | | | | 16,197 | | | | 12,280 | |
| Total cost of revenue | | | 64,459 | | | | 55,901 | | | | 40,411 | |
| Gross profit | | | 70,385 | | | | 68,112 | | | | 49,428 | |
Operating expenses: | | | | | | | | | | | | |
| | | | | | | | | | | | | |
| Sales, general and administrative | | | 58,336 | | | | 47,565 | | | | 37,399 | |
| Research and development | | | 18,959 | | | | 15,696 | | | | 8,218 | |
| Total operating expenses | | | 77,295 | | | | 63,261 | | | | 45,617 | |
| Operating (loss) income | | | (6,910 | ) | | | 4,851 | | | | 3,811 | |
Interest income | | | 379 | | | | 103 | | | | 58 | |
Interest expense | | | (70 | ) | | | (49 | ) | | | (27 | ) |
Other expense, net | | | (55 | ) | | | (40 | ) | | | (77 | ) |
(Loss) income before income taxes | | | (6,656 | ) | | | 4,865 | | | | 3,765 | |
Provision (benefit) for income taxes | | | (1,591 | ) | | | 1,955 | | | | (29,200 | ) |
| Net (loss) income | | | (5,065 | ) | | | 2,910 | | | | 32,965 | |
Preferred stock dividends and accretion | | | — | | | | 28,395 | | | | (54,961 | ) |
Net (loss) income available to common shareholders | | $ | (5,065 | ) | | $ | 31,305 | | | $ | (21,996 | ) |
| | | | | | | | | | | | | |
Per share data: | | | | | | | | | | | | |
| Net (loss) income per share available to common shareholders: | | | | | | | | | | | | |
| Basic | | $ | (.17 | ) | | $ | 1.66 | | | $ | (1.90 | ) |
| Diluted | | $ | (.17 | ) | | $ | 0.11 | | | $ | (1.90 | ) |
| Weighted average number of common shares outstanding | | | | | | | | | | | | |
| Basic | | | 29,577 | | | | 18,808 | | | | 11,579 | |
| Diluted | | | 29,577 | | | | 25,369 | | | | 11,579 | |
The accompanying notes are an integral part of these consolidated financial statements.
GREENWAY MEDICAL TECHNOLOGIES, INC.
For the years ended June 30, 2011, 2012 and 2013
(Dollars in Thousands)
| | | | | | | | | | | | | | | | | | | | | | | | | | | | |
| | | Convertible Preferred | | | Shareholders’ Equity (Deficit) | |
| | | Series A | | | Series B | | | Common Stock | | | | | | | | | | |
| | | Shares | | | Amount | | | Shares | | | Amount | | | Shares | | | Amount | | | Paid-in Capital | | | Accumulated Deficit | | | Total | |
Balance, June 30, 2010 | | | 3,333 | | | $ | 49,466 | | | | 4,632 | | | $ | 54,388 | | | | 11,479 | | | $ | 11,300 | | | $ | 56,728 | | | $ | (148,024 | ) | | $ | (79,996 | ) |
| Common stock issued for acquired technology | | | - | | | | - | | | | - | | | | - | | | | 50 | | | | 50 | | | | 350 | | | | - | | | | 400 | |
| Exercise of stock options | | | - | | | | - | | | | - | | | | - | | | | 148 | | | | 148 | | | | 561 | | | | - | | | | 709 | |
| Employee stock compensation | | | - | | | | - | | | | - | | | | - | | | | - | | | | - | | | | 1,399 | | | | - | | | | 1,399 | |
| Accretion of preferred stock issue cost | | | - | | | | - | | | | - | | | | 32 | | | | - | | | | - | | | | - | | | | (32 | ) | | | (32 | ) |
| Preferred dividends | | | - | | | | 2,598 | | | | - | | | | 2,235 | | | | - | | | | - | | | | - | | | | (4,833 | ) | | | (4,833 | ) |
Accretion adjustment of preferred stock fair
value | | | - | | | | 23,569 | | | | - | | | | 26,527 | | | | - | | | | - | | | | - | | | | (50,096 | ) | | | (50,096 | ) |
| Net income | | | - | | | | - | | | | - | | | | - | | | | - | | | | - | | | | - | | | | 32,965 | | | | 32,965 | |
Balance, June 30, 2011 | | | 3,333 | | | | 75,633 | | | | 4,632 | | | | 83,182 | | | | 11,677 | | | | 11,498 | | | | 59,038 | | | | (170,020 | ) | | | (99,484 | ) |
| Exercise of stock options and warrants | | | - | | | | - | | | | - | | | | - | | | | 344 | | | | - | | | | 896 | | | | - | | | | 896 | |
| Employee stock compensation | | | - | | | | - | | | | - | | | | - | | | | - | | | | - | | | | 2,755 | | | | - | | | | 2,755 | |
| Preferred dividends | | | - | | | | 1,299 | | | | - | | | | 1,184 | | | | - | | | | - | | | | - | | | | (2,483 | ) | | | (2,483 | ) |
| Accretion adjustment of preferred stock fair value | | | - | | | | (14,827 | ) | | | - | | | | (16,051 | ) | | | - | | | | - | | | | - | | | | 30,878 | | | | 30,878 | |
| Convert $1 par common to $.0001 par common | | | - | | | | - | | | | - | | | | - | | | | - | | | | (11,497 | ) | | | 11,497 | | | | - | | | | - | |
| Sale of common stock, net of issue cost and expenses | | | - | | | | - | | | | - | | | | - | | | | 6,389 | | | | 1 | | | | 56,252 | | | | - | | | | 56,253 | |
| Convert preferred stock to common stock | | | (3,333 | ) | | | (62,105 | ) | | | (4,632 | ) | | | (68,315 | ) | | | 10,712 | | | | 1 | | | | 130,420 | | | | - | | | | 130,421 | |
| Payments in connection with preferred stock conversion | | | - | | | | - | | | | - | | | | - | | | | - | | | | - | | | | (23,300 | ) | | | - | | | | (23,300 | ) |
| Net income | | | - | | | | - | | | | - | | | | - | | | | - | | | | - | | | | - | | | | 2,910 | | | | 2,910 | |
Balance, June 30, 2012 | | | - | | | | - | | | | - | | | | - | | | | 29,122 | | | | 3 | | | | 237,558 | | | | (138,715 | ) | | | 98,846 | |
| Exercise of stock options and warrants | | | | | | | | | | | | | | | | | | | 658 | | | | | | | | 3,431 | | | | | | | | 3,431 | |
| Employee stock compensation | | | | | | | | | | | | | | | | | | | | | | | | | | | 4,423 | | | | | | | | 4,423 | |
| Net loss | | | | | | | | | | | | | | | | | | | | | | | | | | | | | | | (5,065 | ) | | | (5,065 | ) |
Balance, June 30, 2013 | | | - | | | $ | - | | | | - | | | $ | - | | | | 29,780 | | | $ | 3 | | | $ | 245,412 | | | $ | (143,780 | ) | | $ | 101,635 | |
The accompanying notes are an integral part of these consolidated financial statements.
GREENWAY MEDICAL TECHNOLOGIES, INC.
(In Thousands)
| | | | | | | | | | | |
| | | For the years ended June 30, | |
| | | 2013 | | | 2012 | | | 2011 | |
Cash flows from operating activities: | | | | | | | | | | | | |
| Net (loss) income | | $ | (5,065 | ) | | $ | 2,910 | | | $ | 32,965 | |
| Adjustments to reconcile net (loss) income to net cash provided by operating activities: | | | | | | | | | | | | |
| Net stock compensation expense | | | 4,423 | | | | 2,755 | | | | 1,399 | |
| Provision for deferred income taxes | | | (1,765 | ) | | | 1,682 | | | | 2,333 | |
| Reversal of deferred tax valuation allowance | | | — | | | | — | | | | (31,560 | ) |
| Depreciation and amortization | | | 9,129 | | | | 4,372 | | | | 1,252 | |
| Provision for bad debts | | | 2,741 | | | | 1,412 | | | | 1,083 | |
| Reduction in obligation for acquired technology | | | — | | | | (100 | ) | | | — | |
| Changes in current assets and liabilities: | | | | | | | | | | | | |
| Accounts receivable | | | 5,052 | | | | (12,176 | ) | | | (7,680 | ) |
| Inventory | | | (3 | ) | | | 179 | | | | (136 | ) |
| Prepaids and other current assets | | | (1,199 | ) | | | (1,296 | ) | | | (1,012 | ) |
| Accounts payable and accrued liabilities | | | (5,798 | ) | | | 5,028 | | | | 3,247 | |
| Deferred revenue | | | (2,869 | ) | | | 3,520 | | | | 4,352 | |
| Net cash provided by operating activities | | | 4,646 | | | | 8,286 | | | | 6,243 | |
Cash flows from investing activities: | | | | | | | | | | | | |
| Purchases of short-term investments | | | (1,635 | ) | | | (29,609 | ) | | | (17,561 | ) |
| Sales of short-term investments | | | 22,942 | | | | 10,707 | | | | 7,115 | |
| Purchases of property and equipment | | | (8,578 | ) | | | (8,041 | ) | | | (4,129 | ) |
| Business combinations to acquire technology and other assets | | | (6,750 | ) | | | (3,000 | ) | | | — | |
| Capitalized software development cost | | | (15,341 | ) | | | (12,193 | ) | | | (5,739 | ) |
| Net cash used in investing activities | | | (9,362 | ) | | | (42,136 | ) | | | (20,314 | ) |
Cash flows from financing activities: | | | | | | | | | | | | |
| Payments on capital leases | | | — | | | | — | | | | (12 | ) |
| Payments on obligation for acquired technology | | | (116 | ) | | | (137 | ) | | | (83 | ) |
| Proceeds from exercise of stock options and warrants, net of issuance costs | | | 3,431 | | | | 897 | | | | 709 | |
| Contingent consideration paid for business combination | | | (1,000 | ) | | | — | | | | — | |
| Conversion of preferred stock | | | — | | | | (23,300 | ) | | | — | |
| Sale of Common Stock | | | — | | | | 56,253 | | | | — | |
| Net cash provided by financing activities | | | 2,315 | | | | 33,713 | | | | 614 | |
Net decrease in cash and cash equivalents | | | (2,401 | ) | | | (137 | ) | | | (13,457 | ) |
Cash and cash equivalents at beginning of year | | | 5,585 | | | | 5,722 | | | | 19,179 | |
Cash and cash equivalents at end of year | | $ | 3,184 | | | $ | 5,585 | | | $ | 5,722 | |
Supplemental cash flow information: | | | | | | | | | | | | |
| Cash paid for interest | | $ | 70 | | | $ | 8 | | | $ | 27 | |
| Cash paid for taxes | | $ | 326 | | | $ | 196 | | | $ | 333 | |
Non-cash investing and financing activities: | | | | | | | | | | | | |
| Conversion of preferred stock | | $ | — | | | $ | 130,421 | | | $ | — | |
| Common stock and obligation for future payments at fair value, given in exchange for acquisition of technology | | $ | — | | | $ | 954 | | | $ | 974 | |
| Reduction in obligation for acquired technology | | $ | — | | | $ | 100 | | | $ | — | |
The accompanying notes are an integral part of these consolidated financial statements.
Notes to Consolidated Financial Statements
Greenway Medical Technologies, Inc. was incorporated September 15, 1998, as a Georgia corporation headquartered in Carrollton, Georgia. In connection with our recently completed initial public offering (“IPO”), we reincorporated in Delaware on February 7, 2012. As appropriate to the context, “Greenway”, the “Company”, and “we”, “us” and “our” are used interchangeably to refer to Greenway Medical Technologies, Inc. We develop market and sell an integrated suite of healthcare technology solutions, including practice management and electronic medical record software applications and related technologies and services for physician practices, clinics and other providers in ambulatory settings throughout the United States.
Greenway Medical Technologies, Inc. acquired the assets of GHN-Online, Inc. (“GHN”) (See Note 5) effective December 31, 2012 and, in conjunction with the acquisition, formed Greenway, LLC, a wholly-owned subsidiary. The acquisition was accounted for as a purchase business combination. The results of GHN’s operations are included in the Company’s consolidated financial statements for the periods subsequent to the effective date of the acquisition. All intercompany transactions have been eliminated in the accompanying consolidated financial statements.
The Company is subject to the risks and challenges similar to other companies in the health care information technology market including, but not limited to, operating in a rapidly evolving market, competition from larger companies, dependence on new products and on key personnel, as well as the regulatory requirements in the healthcare information environment.
2. | Summary of Significant Accounting Policies |
The Company’s fiscal year-end is June 30. Unless otherwise noted, all references to 2013, 2012, and 2011 refer to the fiscal years ended June 30 of the respective year.
Use of Estimates
In preparing these consolidated financial statements in conformity with accounting principles generally accepted in the United States of America (U.S. GAAP), management is required to make estimates and assumptions that affect the reported amounts of assets and liabilities, the disclosure of contingent assets and liabilities at the date of the consolidated financial statements, and the reported amounts of revenue and expenses during the reporting period. Actual results could differ from those estimates. The more significant estimates reflected in these consolidated financial statements include the useful lives of intangible assets, potential impairment of goodwill and intangible assets, the allowance for doubtful accounts, the allowances in the provision for income taxes, the valuation of share-based compensation and the valuation of equity issued prior to the Company’s IPO.
Subsequent Events
The Company discloses material events that occur after the balance sheet date but before consolidated financial statements are issued. In general, these events are recognized if the condition existed at the date of the balance sheet, but are not recognized if the condition did not exist at the balance sheet date. The Company discloses non-recognized events if required to keep the consolidated financial statements from being misleading.
Cash and Cash Equivalents
Cash and cash equivalents consist primarily of money market accounts. The Company considers all highly liquid investments with a maturity of three months or less when purchased to be cash equivalents.
Short-Term Investments
The Company has classified its short-term investments as available-for-sale securities. These securities are reported at fair value with any changes in market value reported as a part of comprehensive income.
Accounts Receivable and Allowance for Doubtful Accounts
Accounts receivable are stated at the amount the Company expects to collect and do not bear interest. The Company maintains an allowance for doubtful accounts based upon the expected collectability of accounts receivable. When specific amounts are determined to be uncollectible, they are charged to the allowance. Management determines the collectability of accounts receivable based primarily on the periodic review of accounts receivable aging schedules, past experience and knowledge of individual customers.
Following is a schedule of the changes in the allowance for doubtful accounts (in thousands):
| | | | | | | | | | |
| | For the years ended June 30, | |
| | | 2013 | | | 2012 | | | 2011 | |
Balance at beginning of period | | $ | 720 | | | $ | 585 | | | $ | 900 | |
| Provision for bad debts | | | 2,741 | | | | 1,412 | | | | 1,083 | |
| Write-offs | | | (2,561 | ) | | | (1,277 | ) | | | (1,398 | ) |
Balance at end of period | | $ | 900 | | | $ | 720 | | | $ | 585 | |
Property and Equipment
Property and equipment are stated at cost, net of accumulated depreciation and amortization. Major property additions, replacements and betterments are capitalized, while maintenance and repairs that do not extend the useful lives of these assets are expensed as incurred. Depreciation and amortization expense was approximately $4.5 million, $2.4 million and $1.1 million for the years ended June 30, 2013, 2012, and 2011, respectively. Depreciation is provided using the straight-line method over the estimated useful lives of the property and equipment, which are as follows:
| Software | | 3 | | years |
| Computer and other equipment | | 3 | | years |
| Leasehold improvements | | Lesser of lease term or 7 | | years |
| Furniture and fixtures | | 5 | | years |
| Building and related | | 15 - 39 | | years |
Software Development Costs
The Company applies the provisions of ASC 985-20,Software, Costs of Computer Software to be Sold, Leased or Marketed, which requires the capitalization of costs incurred in connection with the research and development of new software products and enhancements to existing software products once technological feasibility is established. Technological feasibility is established when all planning, designing, coding, and testing activities necessary to establish that the product can be produced to meet its design specifications are completed including functions, features, and technical performance requirements.
Capitalized software development costs are amortized on a straight-line basis over the estimated economic life of the related product, which is typically three years. The establishment of technological feasibility and the ongoing assessment of the recoverability of these costs require considerable judgment by management with respect to certain external factors including, but not limited to, anticipated future gross product revenue, estimated economic life, and changes in technology.
Capitalized software development costs for each of the three years in the period ended June 30, 2013, were $15.3 million, $12.2 million, and $5.7 million, respectively. Amortization cost included in the accompanying statements of operation related to software development cost are $4.4 million, $1.9 million, and $149,000 for the years ended June 30, 2013, 2012, and 2011, respectively.
The Company applies the provisions of ASC 350-40,Internal Use Software and expenses all costs incurred that relate to planning and post-implementation phases of development. Costs incurred in the development phase are capitalized and amortized over the product’s estimated useful life. For the years ended June 30, 2013, 2012 and 2011, respectively, the Company capitalized $160,000, $1.8 million and $1.4 million of costs related to software developed for internal use.
Internal software development costs are generally amortized on a straight-line basis over three years beginning with the date the software is placed into service. Amortization of software developed for internal use was $852,000 and $351,000 for the years ended June 30, 2013 and 2012, respectively. No amortization was incurred for 2011 as none of the projects were completed prior to June 30, 2011.
Goodwill
Goodwill is an asset representing the future economic benefits arising from assets acquired in a business combination that are not individually identified and separately recognized. Goodwill and intangible assets acquired in a business combination and determined to have an indefinite useful life are not amortized in accordance with accounting guidance, but accounting guidance requires that we perform an impairment test at least annually. Goodwill is reviewed for impairment at least annually in accordance with the provisions of Financial Accounting Standards Board (“FASB”) ASC Topic 350,Intangibles — Goodwill and Other (“ASC 350”). The goodwill impairment analysis is comprised of two steps. In step one the estimated fair value of a reporting unit is compared to its carrying value. Step two is required only if there is a deficiency (the estimated fair value is less than the carrying value). In step two the actual amount of the goodwill impairment is calculated by comparing the implied fair value of the reporting unit’s goodwill with the carrying amount of that goodwill. The implied fair value is determined in the same manner as the amount of goodwill recognized in a business combination. If the carrying value of a reporting unit’s goodwill exceeds its implied fair value, then an impairment loss equal to the difference would be recorded. The recoverability of indefinite lived intangible assets is assessed by comparison of the carrying value of the asset to its estimated fair value. If we determine that the carrying value of the asset exceeds its estimated fair value, an impairment loss would be recorded equal to the excess. Based upon our analysis, the Company determined that there was no impairment at June 30, 2013. The goodwill impairment will continue to be considered annually, or more frequently if facts and circumstances warrant.
Impairment of Long-Lived Assets
The Company evaluates long-lived assets for potential impairment, in accordance with ASC 360, whenever adverse events or changes in circumstances or business climate indicate that expected undiscounted future cash flows related to such long-lived assets may not be sufficient to support the net book value of such assets. Impairment exists when the carrying value of a long-lived asset exceeds its fair value. An impairment loss is recognized only if the carrying value of a long-lived asset is not recoverable and exceeds its fair value. There were no such impairment losses during the three years ended June 30, 2013.
Revenue Recognition
The Company recognizes revenue in accordance with U.S. GAAP, principally ASC 985-605,Software Revenue Recognition. In October 2009, the FASB issued Accounting Standards Update (ASU) 2009-13,Multiple-Deliverable Revenue Arrangements and ASU 2009-14,Certain Revenue Arrangements That Include Software Elements — both representing consensus of the FASB Emerging Issues Task Force, to amend certain revenue recognition guidance. ASU 2009-13 amended guidance in ASC 605-25,Revenue Recognition,Multiple-Element Arrangementsrelating to non-software transactions — to (1) modify the separation criteria by eliminating the criterion that requires objective and reliable evidence of fair value for the undelivered item(s), and (2) eliminate use of the residual method of allocation and instead require that arrangement consideration be allocated, at the inception of the arrangement, to all deliverables based on their relative selling price. ASU 2009-14 amended the scope of arrangements under ASC 985-605,Software, Revenue Recognition to exclude tangible products containing software components and non-software components that function together to deliver a product’s essential functionality.
The amended guidance in ASC 985-605 and ASC 605-25 was effective prospectively for revenue arrangements entered into or materially modified in fiscal years beginning on or after June 15, 2010, with early application and retrospective application permitted. The Company adopted this amended guidance effective July 1, 2010 and there was no significant impact on our consolidated financial statements as a result.
The Company generates revenue from the following sources:
| | ● | The sale of information systems, which includes software, hardware and peripherals, deployment and training |
| | | The provision of system support services (PCS), which includes software application support and hardware maintenance |
| | | The provision of outsourcing services, which includes the processing of medical claims, electronic patient statements and business services including clinically-driven revenue cycle management and EHR-enabled research |
The Company enters into contractual obligations to sell hardware, perpetual software licenses, deployment and training services, PCS services and outsourcing services. ASC 985-605-25 requires revenue earned on software arrangements involving multiple elements to be allocated to each element based on the relative fair values of those elements. The fair value of an element must be based on vendor specific objective evidence (VSOE). The Company limits its assessment of VSOE for each element to either the price charged when the same element is sold separately or the price established by management having the relevant authority to do so, for an element not yet sold separately. VSOE calculations are updated and reviewed annually. When evidence of fair value exists for the delivered and undelivered elements of a transaction, then discounts for individual elements are aggregated and the total discount is allocated to the individual elements in proportion to the elements’ fair value relative to the total contract fair value.
Revenue is recognized on the hardware and software deliverables upon shipment at which point VSOE has been established for all of the undelivered individual elements which, generally consist of training services, outsourcing services and PCS. The fair value of training is determined based on the value of those services sold separately. VSOE of PCS and outsourcing services is determined by reference to the price the Company’s customers are required to pay for the services when sold separately (renewals). Training also includes deployment services, principally start-up monitoring and workflow consulting, performed in and around the time a new implementation occurs as well as follow-up training to assist a practice’s providers in enhancing proficiency and efficiency as staffing changes occur.
The Company also generates revenue from its software products under software subscription agreements. These software subscription agreements include the right to use the software and receive unspecified future product enhancements and upgrades when and if available for a specified term, usually 36 to 60 months. These agreements are accounted for as hosting (service agreements) under ASC 985-605-55-121. Revenue from all of the deliverables related to subscription agreements, including training and support services is recognized as performed. Implementation services are charged, deferred and amortized over the longer of the contract or the estimated customer life. Any amounts invoiced or cash received in advance is recorded as deferred revenue and amortized over the longer of the contract period or the estimated customer life. The agreements with our customers for these hosting services do not allow for the customers to take ownership or possession of the software and support is not sold separately.
The Company records reimbursements of out-of-pocket expenses as revenue in the accompanying consolidated statements of operations. These amounts totaled approximately $4.4 million, $6.6 million and $3.3 million for each of the three years in the period ended June 30, 2013.
The Company presents net revenue net of sales tax and other sales-related taxes collected from customers.
Deferred Revenue
Deferred revenue represents deposits and other amounts received from customers for contracts for which the revenue earnings process has not yet been completed.
Share-Based Compensation
The Company applies the provisions of ASC 718,Compensation — Stock Compensation which requires companies to estimate the fair value of share-based payment awards on the date of grant based on an option-pricing model. The estimated fair value of such awards ultimately expected to vest is recognized ratably as expense over the requisite service period.
The Company will only recognize a tax benefit from stock based awards in additional paid-in capital if an incremental tax benefit is realized after all other tax attributes currently available to the Company have been utilized. In addition, the Company has elected to account for the indirect effects of stock based awards on other tax attributes, such as the research tax credit, through its statement of operations.
Equity instruments issued to nonemployees are recorded at their fair value on the measurement date. The measurement of share-based compensation is subject to periodic adjustment as the underlying equity instruments vest. The fair value of options granted to consultants is expensed over the vesting period.
Advertising Costs
Advertising costs are expensed as incurred. Advertising expenses of approximately $2.4 million, $2.2 million and $2.0 million are included within sales, general and administrative expenses in 2013, 2012 and 2011, respectively.
Income Taxes
The Company accounts for income taxes under the provisions of ASC 740-10,Income Taxes, which requires the use of an asset and liability method of accounting for deferred income taxes. Under ASC 740, deferred tax assets or liabilities at the end of each period are determined using the tax rate expected to apply to taxable income in the period in which the deferred tax asset or liability is expected to be settled or realized.
As required by the uncertain tax position guidance under ASC 740-10, the Company recognizes the financial statement benefit of a tax position only after determining that the relevant tax authority would more likely than not sustain the position following an audit. For tax positions meeting this more-likely-than-not threshold, the amount to be recognized in the consolidated financial statements is the largest benefit that has a greater than 50 percent cumulative likelihood of being realized upon ultimate settlement with the relevant tax authority. Recognition, de-recognition, and measurement is based on management’s best judgment given the facts, circumstances and information available at the reporting date.
Comprehensive Income
Comprehensive income is the total of net income and all other non-owner changes in shareholders’ equity. In 2013, 2012 and 2011, comprehensive income approximated net income.
Net Income (Loss) Per Share Available to Common Shareholders
Basic income (loss) per share available to common shareholders is computed by dividing income (loss) available to common shareholders by the sum of the weighted average number of common shares outstanding during the period. Income (loss) available to common shareholders reflects accretion of preferred stock dividends, preferred stock issuance costs and adjustment to recognize the estimated fair value of the put feature ascribed to these securities.
Diluted per share amounts give effect to all potentially dilutive common share equivalents outstanding during the period. Such potentially dilutive common share equivalents included Series A and B Preferred Stock convertible into 8.8 million shares of common stock for the year ended June 30, 2011 and which were converted to common stock in February 2012; outstanding warrants exercisable for common shares totaling approximately 121,000 at June 30, 2012 and 260,000 at June 30, 2011, respectively; and stock options exercisable for shares of common stock totaling approximately 1.8 million for the year ended June 30, 2013, 1.9 million for the year ended June 30, 2012, and 1.7 million for the year ended June 30, 2011. The dilutive effect of outstanding stock options and warrants is computed using the treasury stock method. The computation of diluted loss per share does not assume conversion, exercise, or contingent exercise of securities that would have an anti-dilutive effect on earnings and inasmuch as inclusion of any or all of the potentially dilutive common share equivalents is anti-dilutive for each of the years ended June 30, 2013 and June 30, 2011, presentation of loss per share available to common shareholders — basic and diluted are the same for the periods presented. There were no such anti-dilutive securities that were excluded from the calculation of common shares outstanding as of June 30, 2012.
Concentration of Credit Risk
Financial instruments that potentially subject the Company to significant concentrations of credit risk consist principally of cash and cash equivalents and trade accounts receivable.
The Company maintains cash and cash equivalents with various financial institutions. The Company performs periodic evaluations of the relative credit standing of those financial institutions that are considered in the Company’s investment strategy. Trade receivables are unsecured and the Company is at risk to the extent such amounts become uncollectible.
For the year ended June 30, 2013, one customer accounted for 12% of net revenue. For the years ended June 30, 2012 and 2011, no customer accounted for more than 10% of net revenue. At June 30, 2012, one customer accounted for 15% of accounts receivable; however, no customer accounted for more than 10% of accounts receivable at June 30, 2013 and 2011.
Fair Value of Financial Instruments
The book values of cash and cash equivalents, accounts receivable and accounts payable approximate their fair values, principally because of the short-term maturities of these instruments. The Company measures and reports certain financial assets at fair value on a recurring basis, including its short-term investments in money market funds and available-for-sale securities. As provided by their terms, and until their conversion in connection with our IPO, the Company’s Series A and Series B Convertible Preferred Stock issuances were carried at estimated fair value based on the greater of a) liquidation preference including accrued dividends or b) fair value of these instruments as determined by independent appraisal.
The Company applies ASC 820,Fair Value Measurements and Disclosures, with respect to fair value of (a) nonfinancial assets and liabilities that are recognized or disclosed at fair value in the Company’s consolidated financial statements on a recurring basis and (b) all financial assets and liabilities. ASC 820 prioritizes the inputs used in measuring fair value as follows:Level 1 — Quoted market prices in active markets for identical assets or liabilities;Level 2 — Observable inputs other than those included in Level 1 (for example, quoted market prices for similar assets in active markets or quoted market prices for identical assets in inactive markets); andLevel 3 — Unobservable inputs reflecting management’s own assumptions about the inputs used in estimating the value of the asset.
The Company’s financial instruments consist primarily of short term investments, which are measured using level 1 and 2 inputs (see Note 3) and its Series A and B Convertible Preferred Stock classified as temporary equity, which is measured using Level 3 inputs. Changes in the observability of valuation inputs may result in transfers within the fair value measurement hierarchy. The Company did not identify any transfers among levels of the fair value measurements hierarchy during fiscal 2013 and 2012.
The Company’s financial instruments measured at fair value as of June 30, 2013 and 2012 consisted of short term investments of available-for-sale securities. The dollar amounts in Level 1 of the Fair Value Hierarchy Category at June 30, 2013 and 2012 were $8,043,000 and $29,350,000, respectively.
The following table presents the change (in thousands) in the estimated fair value of the Series A and B Convertible Preferred Stock measured using significant unobservable inputs (Level 3):
| | | | | | | | | | |
| | | June 30, 2013 | | | June 30, 2012 | | | June 30, 2011 | |
| Series A Convertible Preferred Stock: | | | | | | | | | |
| Fair value measurement at beginning of period | | $ | — | | | $ | 75,633 | | | $ | 49,466 | |
| Change in fair value recorded in accumulated deficit | | | — | | | | (13,528 | ) | | | 26,167 | |
| Conversion to common in connection with IPO | | | — | | | | (62,105 | ) | | | — | |
| Fair value measurement at end of period | | $ | — | | | $ | — | | | $ | 75,633 | |
| | | June 30, 2013 | | | June 30, 2012 | | | June 30, 2011 | |
| Series B Convertible Preferred Stock: | | | | | | | | | |
| Fair value measurement at beginning of period | | $ | — | | | $ | 83,182 | | | $ | 54,388 | |
| Change in fair value recorded in accumulated deficit | | | — | | | | (14,867 | ) | | | 28,794 | |
| Conversion to common in connection with IPO | | | — | | | | (68,315 | ) | | | — | |
| Fair value measurement at end of period | | $ | — | | | $ | — | | | $ | 83,182 | |
Prior to the conversion in connection with our IPO, the Series A and B Convertible Preferred Stock were re-measured to fair value each reporting period. The changes in fair value, combined with dividends and accretion of preferred stock issuance costs, are recorded in the statements of changes in convertible preferred and shareholders’ equity (deficit) and are based on the change in the underlying fair value of the Company’s equity during each fiscal year presented. The fair value of the Company’s equity is the estimated amount for which a share of each of the Company’s equity instruments could be sold in a current transaction between willing parties. The Company estimated its fair value using primarily a discounted cash flow model. The operating assumptions used in the discounted cash flow model are generally consistent with the Company’s past performance and with the projections and assumptions used in the Company’s operating plans. Such assumptions are subject to change as a result of changing economic and competitive conditions.
Recent Accounting Pronouncements
In December 2010, the FASB issued Accounting Standards Update, (“ASU”), 2010-28,Intangibles -Goodwill and Other (Topic 350): When to Perform Step 2 of the Goodwill Impairment Test for Reporting Units with Zero or Negative Carrying Amounts(“ASU 2010-28”). ASU 2010-28 modifies Step 1 of the goodwill impairment test for reporting units with zero or negative carrying amounts. For those reporting units, an entity is required to perform Step 2 of the goodwill impairment test if it is more likely than not that a goodwill impairment exists. In determining whether it is more likely than not that goodwill impairment exists, an entity must consider whether there are any adverse qualitative factors indicating impairment may exist. ASU 2010-28 is effective for fiscal years, and interim periods within those years, beginning after December 15, 2010.
In December 2010, the FASB issued ASU No. 2010-29,Business Combinations (Topic 805) - Disclosure of Supplementary Pro Forma Information for Business Combinations (“ASU 2010-29”). This standard update clarifies that, when presenting comparative consolidated financial statements, SEC registrants should disclose revenue and earnings of the combined entity as though the current period business combinations had occurred as of the beginning of the comparable prior annual reporting period only. The update also expands the supplemental pro forma disclosures to include a description of the nature and amount of material, nonrecurring pro forma adjustments directly attributable to the business combination included in the reported pro forma revenue and earnings. ASU 2010-29 is effective prospectively for material (either on an individual or aggregate basis) business combinations entered into in fiscal years beginning on or after December 15, 2010, with early adoption permitted.
In connection with our acquisition of technology and other assets as described in Note 5, ASU 2010-28 and ASU 2010-29 became applicable to us; their adoption had no impact on our consolidated financial statements. We expect that ASU 2010-29 may impact our disclosures for any future business combinations. The Company has intentionally omitted the disclosures of historical proforma information on the purchase business combinations that it made during the three year period ended June 30, 2013 due to the immaterial nature of the acquired operations. The Company believes that the limited amount of information disclosed about the assets purchased and liabilities assumed are adequate in the circumstances.
In May 2011, the FASB issued ASU No. 2011-04,Fair Value Measurement (Topic 820) - Amendments to Achieve Common Fair Value Measurement and Disclosure Requirements in U.S. GAAP and IFRS. This ASU represents the converged guidance of the FASB and the International Accounting Standards Board on fair value measurement. These amendments have resulted in common requirements for measuring fair value and for disclosing information about fair value measurements, including a consistent meaning of the term “fair value.” The common requirements are expected to result in greater comparability of fair value measurements presented and disclosed in consolidated financial statements prepared in accordance with U.S. GAAP and International Financial Reporting Standards. The amendments are to be applied prospectively and are effective for fiscal years beginning after December 15, 2011. The Company adopted these provisions in the first quarter of Fiscal 2013. Adoption of this provision did not have a material impact on the Company’s consolidated financial statements.
In June 2011, the FASB issued ASU 2011-05,Comprehensive Income (Topic 220) - Presentation of Comprehensive Income. The amendments to the Codification in this ASU allow an entity the option to present the total of comprehensive income, the components of net income, and the components of other comprehensive income either in a single continuous statement of comprehensive income or in two separate but consecutive statements. In both choices, an entity is required to present each component of net income along with total net income, each component of other comprehensive income along with a total for other comprehensive income, and a total amount for comprehensive income. This ASU eliminates the option to present the components of other comprehensive income as part of the statement of changes in shareholders’ equity. The amendments to the Codification in the ASU do not change the items that must be reported in other comprehensive income or when an item of other comprehensive income must be reclassified to net income. In December 2011 ASU 2011-12 was issued to defer the effective date relating to these reclassification adjustments requirements. Other provisions of ASU 2011-05 are to be applied retrospectively and are effective for fiscal years beginning after December 15, 2011. Adoption of these provisions did not have a material impact on the Company’s consolidated financial statements as the elements of comprehensive income are not material to the consolidated statement of operations and net income approximates comprehensive income.
In September 2011, the FASB issued 2011-08,Intangibles - Goodwill and Other (Topic 350), Testing Goodwill for Impairment. The Board decided to simplify how companies are required to test goodwill for impairment. Companies now have the option to first assess qualitative factors to determine whether it is more likely than not (likelihood of more than 50%) that the fair value of a reporting unit is less than its carrying amount. If after considering the totality of events and circumstances a company determines it is not more likely than not that the fair value of a reporting unit is less than its carrying amount, it will not have to perform the two-step impairment test. The amendments are effective for annual and interim goodwill impairment tests performed for fiscal years beginning after December 15, 2011. Early adoption is permitted. If a company has not yet issued their consolidated financial statements for the most recent annual or interim period, the company may choose to perform the qualitative assessment. Adoption of ASU 2011-08 did not have a material impact on our consolidated financial statements.
Short-term investments consist of money market and mutual funds, and U.S. agency and corporate bonds with original maturities greater than three months and remaining maturities of less than one year. Investments are also made in corporate bonds with original maturities of greater than one year but maximum remaining maturities of 18 months; these investments are also included in short-term investments since the Company’s intent is to convert them into cash as may be necessary to meet liquidity needs. At June 30, 2013, all of the Company’s investments were classified as available-for-sale and are reported at fair value with any changes in market value reported as a part of comprehensive income. As of June 30, 2013, gross accumulated unrealized gains and losses for these investments were immaterial. Fair value is based on the Level 1 or 2 criteria of the fair value hierarchy specified in ASC 820-10,Fair Value Measurements and Disclosures.
Available-for-sale-securities at fair value consist of (in thousands):
| | | June 30 | |
| | | 2013 | | | 2012 | |
| | | | | | | |
| U.S. agency bonds | | $ | — | | | $ | 2,071 | |
| Corporate bonds | | | 84 | | | | 359 | |
| Mutual funds | | | 7,946 | | | | 26,875 | |
| Money market funds | | | 13 | | | | 45 | |
| Total | | $ | 8,043 | | | $ | 29,350 | |
| Property and equipment consists of (in thousands): |
| | | | | | | |
| | | June 30, | |
| | | 2013 | | | 2012 | |
| Land | | $ | 1,287 | | | $ | 1,172 | |
| Building and related | | | 17,749 | | | | 4,433 | |
| Leasehold improvements | | | 304 | | | | 304 | |
| Equipment | | | 1,582 | | | | 3,366 | |
| Furniture and fixtures | | | 4,876 | | | | 1,390 | |
| Purchased software | | | 5,874 | | | | 3,056 | |
| Acquired technology | | | 7,581 | | | | 3,894 | |
| | | | 39,253 | | | | 17,615 | |
| Less — Accumulated depreciation and amortization | | | (11,109 | ) | | | (6,509 | ) |
| | | | 28,144 | | | | 11,106 | |
| Construction in progress | | | 272 | | | | 9,234 | |
| Total | | $ | 28,416 | | | $ | 20,340 | |
In November 2012, we acquired, via a perpetual source code license agreement, certain technology valued at $1.3 million; the consideration was payable in cash. This technology provides certain analytics functionality in our application and has an estimated useful life of 3 years. In September 2010, the Company acquired certain technology and intellectual property valued at $974,000 in exchange for cash and 50,000 shares of common stock. The purchase agreement provided for a potential reduction of the cash portion of the purchase price when and if an IPO of the Company’s common stock were to be completed. Accordingly, in connection with our offering completed in February 2012, the carrying value of this obligation was reduced by approximately $100,000.
Construction of New Facilities and Real Estate Tax Incentive Transaction
In December 2011, we entered into a sale-leaseback transaction pursuant to which we sold certain land and a building under development as our new administrative headquarters located in Carrollton, Georgia. The transaction contemplates an ultimate total purchase price of approximately $12 million and in December 2011, approximately $1 million already incurred for the project, was received in cash and was simultaneously invested and is subject to an Industrial Revenue Bonds (IRB) financing agreement. The balance of approximately $11 million contemplated under this agreement was paid from our resources, then sold and proceeds reinvested in in a similar fashion. This agreement is intended to permit counties to attract business investment by offering property tax incentives. In accordance with Georgia law, we entered into this sale-leaseback agreement with the Carroll County Payroll Development Authority (the “County”) and acquired an IRB. The arrangement is structured so that our lease payments to the County equal and offset the County’s bond payments to the Company. The Bond is non-recourse to the County, our lease payments are pledged to secure repayment of the Bond, and the lease and bond provide for the legal right of offset. Consequently, the investment and lease obligation related to this arrangement have been offset in our balance sheet. The agreement has a maximum expiration date of 2021. If we had not entered into this transaction, property tax payments would have been higher. We can reacquire such property and terminate the agreement at a nominal price of ten dollars. The subject property was included in property and equipment at June 30, 2013 and in construction in progress at June 30, 2012, in the accompanying consolidated balance sheet.
The Company has accounted for all business combinations using the purchase method to record a new cost basis for the assets acquired and liabilities assumed. The Company allocated the purchase price to intangible assets representing developed technology, customer relationships, trademarks, and non-competition agreements. The excess of purchase price over the estimated fair value of the tangible assets acquired and liabilities assumed and the separately recognized intangible assets has been recorded as goodwill in the accompanying consolidated financial statements. The goodwill is attributable to synergies achieved through the streamlining of operations combined with improved margins attainable from increased market presence. None of the acquisitions made have material operations. The carrying value of goodwill is evaluated annually for potential impairment or whenever changes in circumstances may indicate that impairment may have occurred. The goodwill is deductible for tax purposes.
On December 31, 2012, we acquired certain assets of GHN in exchange for cash consideration totaling $5.5 million. Additionally, the Company incurred transaction costs totaling approximately $145,000; GHN provides clearinghouse and revenue cycle services to healthcare providers and we believe the technology acquired will enable us to offer better solutions to connect our customers with their payers for the purposes of improving their revenue cycle management processes and outcomes. Based on estimated fair value of the working capital, property and equipment and identifiable intangibles, the consideration of $5.5 million was allocated to the assets in the following amounts:
Assets Acquired | | Estimated Fair Value (in thousands) | | Estimated Useful
Life |
| Net Working Capital | | $ | 69 | | N/A |
| Property and Equipment | | | 352 | | 3 years |
| Developed Technology | | | 2,437 | | 3 years |
| Customer Relationships | | | 1,054 | | 9 years |
| Non-competition Agreements | | | 211 | | 3-5 years |
| Trademarks | | | 277 | | 10 years |
| Goodwill | | | 1,100 | | Indefinite |
| Total fair value of consideration | | $ | 5,500 | | |
In October 2011, we acquired certain technology and other assets of CySolutions which we believe has facilitated our penetration of the Federally Qualified Health Center (FQHC) market. Total consideration was approximately $4.0 million, which included approximately $1.0 million contingent consideration that would be paid on attainment of certain financial and operating performance objectives. These objectives were attained in October 2012 and the contingent consideration was paid at that time. In conjunction with this acquisition, the Company incurred transaction costs of approximately $123,000. Based on the estimated fair value of the intangibles acquired, total consideration was allocated to the following assets:
Assets Acquired | | Estimated Fair Value (in thousands) | | Estimated Useful
Life | |
| | | | | | | |
| Developed Technology | | $ | 2,920 | | 3 years | |
| Customer Relationships | | | 530 | | 5 years | |
| Non-competition Agreements | | | 64 | | 3-5 years | |
| Goodwill | | | 440 | | Indefinite | |
| Total fair value of consideration | | $ | 3,954 | | | |
6 | Amortizable Intangible Assets |
Amortizable intangible assets consist of the following (in thousands):
| | | | | | June 30, 2013 | |
Amortizable Intangible Assets | | Estimated
Useful
Lives
(months) | | | Gross Carrying
Amount | | | Accumulated Amortization | | | Net
Carrying
Value | |
| | | | | | | | | | | | | |
| Customer relationships | | | 60-180 | | | $ | 1,584 | | | $ | ( 235 | ) | | $ | 1,349 | |
| Non-competition agreements | | | 36 - 60 | | | | 275 | | | | ( 68 | ) | | | 207 | |
| Trademarks | | | 120 | | | | 277 | | | | (14 | ) | | | 263 | |
| | | | | | | | | | | | | | | | | |
| Totals | | | | | | $ | 2,136 | | | $ | ( 317 | ) | | $ | 1,819 | |
| | | | | | June 30, 2012 | |
Amortizable Intangible Assets | | Estimated
Useful
Lives
(months) | | | Gross Carrying
Amount | | | Accumulated Amortization | | | Net
Carrying
Value | |
| | | | | | | | | | | | | |
| Customer relationships | | | 60 | | | $ | 530 | | | $ | ( 75 | ) | | $ | 455 | |
| Non-competition agreements | | | 36-60 | | | | 64 | | | | ( 9 | ) | | | 55 | |
| | | | | | | | | | | | | | | | | |
| Totals | | | | | | $ | 594 | | | $ | ( 84 | ) | | $ | 510 | |
Approximately $233,000 and $84,000 of aggregate intangible amortization expense was recorded in the consolidated statements of operations for the years ended June 30, 2013, and 2012, respectively. There was no amortization expense for the year ended June 30, 2011. The weighted average remaining estimated useful lives of the intangible assets listed above, in months, at June 30, 2013 were 81, 25, and 114 for customer relationships, non-competition and trademarks, respectively. The weighted average remaining estimated useful lives for the intangible assets listed above, in months, at June 30, 2012 were 51 and 37 for customer relationships and non-competition agreements, respectively.
The estimated future amortization expense of intangible assets is as follows (in thousands):
| Year ended June 30, | | Amounts | |
| 2014 | | $ | 341 | |
| 2015 | | | 329 | |
| 2016 | | | 289 | |
| 2017 | | | 181 | |
| 2018 | | | 145 | |
| Thereafter | | | 534 | |
| Total | | $ | 1,819 | |
Amortization of acquired technology is charged to cost of systemssold and totaled $1.9 million, $1.0 million and $210,000, respectively, for each of the three years in the period ended June 30, 2013.
7. Accrued Liabilities
The following table shows the components of accrued liabilities (in thousands):
| | | | | | | |
| | | June 30 | |
| | | 2013 | | | 2012 | |
| | | | | | | |
| Accrued salaries, wages and benefits | | $ | 1,999 | | | $ | 4,936 | |
| Accrued sales tax | | | 1,186 | | | | 1,477 | |
| Accrued third party services | | | 2,303 | | | | 1,827 | |
| Obligation for purchased technology | | | - | | | | 954 | |
| Other accrued expenses | | | 358 | | | | 339 | |
| Total | | $ | 5,846 | | | $ | 9,533 | |
8. Transactionswith Related Parties
Effective July 1, 2000, the Company entered into an agreement to lease the corporate office from Green Family Real Estate, LLC, an entity controlled by the Company’s Chairman, for approximately $20,000 per month, plus annual adjustments for inflation, until June 30, 2015 (see Note 12).
In 2000, the Company entered into an agreement to rent on an hourly basis an airplane from Greenway Air, LLC, an entity controlled by the Company’s Chairman. Expenses incurred related to this agreement were approximately $116,000, $51,000 and $67,000 for each of the three years in the period ended June 30, 2013, respectively. In March 2002, the Company purchased a 1% interest in Greenway Air, LLC, for $12,500 and in September 2012 paid $427,000 to purchase an additional 15.75% interest. This investment is recorded at cost in the caption “Other Assets” in the accompanying consolidated balance sheets.
The Company has considered applicable guidance regarding variable interest entities and has determined that neither of these arrangements is such an entity.
The Company has two institutional shareholders who, as of the June 30, 2013,collectively owned approximately 42% (24% for one investor and 18% for the other) of the Company’s common stock. One affiliate (representative) from each of these institutional shareholders sits on the Company’s Board of Directors. Given this substantial ownership position, these shareholders are able individually, and collectively, to exercise substantial influence over the affairs of the Company.
In April 2011, the Company purchased three commercial lots totaling approximately six acres were used to build new facilities to accommodate its growth. The property was purchased from the Company’s Chairman pursuant to authorization from the Board of Directors. Aggregate consideration was approximately $483,000 and was based on an independent appraisal of fair value.
9. Credit Facility
In March 2011, the Company closed on a loan agreement which provides financing up to $5 million based on eligible receivables, with interest at LIBOR plus 275 basis points, is secured by a pledge of the Company’s assets and contains customary provisions regarding covenants including a prohibition on payment of cash dividends. There were no amounts outstanding on the credit facility at June 30, 2013 and 2012. The Company had a letter of credit in the amount $500,000 that reduced the availability of the loan at June 30, 2013. Therefore, there was $4.5 million available on the facility at June 30, 2013. On August 16, 2013, the Company executed a non-binding commitment with its lender for a $25 million, four-year facility. The commitment is subject to certain conditions. The facility replaces the $5 million loan and has similar terms and conditions.
10. Shareholders’ Equity
In Fiscal 2013, holders of the warrants exercised all of the remaining 121,002 shares for approximately $726,000. Additionally, during Fiscal 2013, approximately 536,500 options were exercised with a cumulative value of $2,706,000.
On February 1, 2012, our registration statement on Form S-1 (No. 333-175619) was declared effective for our initial public offering (the “IPO”), and on February 7, 2012, we consummated the IPO consisting of the sale of 7,666,667 shares of our common stock at a price of $10.00 per share, including 6,388,833 shares (including the underwriters’ exercise of their over-allotment option to purchase an addition 1,000,000 shares) issued and sold by us. Following the sale of the shares in connection with the closing of the IPO, the offering terminated. As a result of the offering, including the underwriters’ over-allotment option, we received total net proceeds of approximately $56.3 million, after deducting total expenses of $7.5 million, consisting of underwriting discounts and commissions of $4.5 million and offering-related expenses of approximately $3.0 million.
We used a portion of the net proceeds from the IPO to pay $23.3 million consisting of a cash payment to holders of our outstanding preferred stock concurrently with the conversion of such shares into shares of common stock in connection with the closing of the IPO. Certain holders of our outstanding preferred stock who received cash payments included certain executive officers and directors. We used the remaining proceeds to finance the construction of new facilities to accommodate the growth of our business (approximately $12.0 million), as well as for working capital and general corporate purposes, which may include financing our growth, developing new technology solutions and services, and funding capital expenditures, acquisitions and investments. The Company currently does not have any pending material acquisitions. We did not receive any proceeds from the sale of shares by the selling shareholders.
As indicated above, in connection with the IPO all of the convertible preferred stock outstanding automatically converted into shares of common stock as follows:
| | (1) | 3,333,333 shares of Series A Convertible Preferred Stock converted into 4,210,533 shares of common stock based on application of the conversion ratio of 1.2631: 1; |
| | (2) | 4,631,579 shares of Series B Convertible Preferred Stock converted into a like number of shares of common stock based on a conversion ratio of 1: 1; |
| | (3) | in connection with the conversion of our convertible preferred stock, a mandatory cash payment of up to $42 million was due the holders thereof based on $4.75 per equivalent common share upon conversion; this amount was satisfied by (a) a payment of $23.3 million made to certain holders and (b) issuance of 1,870,124 shares of our common stock to those holders electing to receive common stock at the $10 IPO price in lieu of cash. |
Concurrent with the IPO, the Company converted to a Delaware corporation via merger and, in connection therewith, increased the authorized common stock and modified the par value to $0.0001 per share.
The amount of stock authorized, issued and outstanding, after effect of the foregoing, is summarized (in thousands) as follows as of June 30:
| | | | | | | | | | | | | |
| | | 2013 | | | 2012 | |
| | | Common Stock | | | Preferred | | | Common Stock | | | Preferred | |
| | | | | | | | | | | | | |
| Authorized | | | 80,000 | | | | 20,000 | | | | 80,000 | | | | 20,000 | |
| Issued | | | 29,780 | | | | - | | | | 29,122 | | | | - | |
| Outstanding | | | 29,780 | | | | - | | | | 29,122 | | | | - | |
Stock Options
On November 16, 2011, we adopted, and on December 16, 2011, we received shareholder approval of the Greenway Medical Technologies, Inc. 2011 Stock Plan (the “2011 Plan”) which provides for issuance of equity awards for up to 3,000,000 shares of our common stock.The Plan allows the Company to grant incentive and non-statutory stock options as well as other types of equity awards to eligible employees, directors, and consultants of the Company. Options are generally granted for a term of 10 years and generally vest 25% after the first year and then in equal monthly increments for the subsequent three years. However, the vesting period may be accelerated following a change in control of the Company, as defined in the Plan. Incentive options granted to employees who, at the date of grant, own more than 10% of the voting power of the Company’s stock have an exercise price equal to 110% of the fair market value at the date of grant and expire five years from the date of grant. The plan provides for an equitable adjustment of the number of shares covered by outstanding awards to reflect changes in capital structure.
We also have options granted, fully vested and outstanding under our previous 1999 Stock Plan and our 2004 Stock Plan, though no new awards will be granted under the 1999 or 2004 plans. Activity under all our option plans is summarized as follows:
| | | | | | | | | | |
| | | Options Outstanding | | | Weighted Average Exercise Price | | | Aggregate Intrinsic Value | |
| | | | | | | | | | |
Outstanding as of July 1, 2010 | | | 2,340,681 | | | $ | 4.91 | | | | |
| Granted | | | 915,307 | | | | 7.95 | | | | |
| Exercised | | | (147,583 | ) | | | 4.80 | | | | |
| Canceled | | | (322,592 | ) | | | 4.09 | | | | |
Outstanding as of June 30, 2011 | | | 2,785,813 | | | $ | 4.92 | | | | |
| Granted | | | 821,654 | | | | 15.15 | | | | |
| Exercised | | | (154,906 | ) | | | 5.14 | | | | |
| Canceled | | | (55,423 | ) | | | 6.88 | | | | |
Outstanding as of June 30, 2012 | | | 3,397,138 | | | $ | 8.25 | | | $ | 35,336,000 | |
| Granted | | | 912,850 | | | | 15.41 | | | | | |
| Exercised | | | (536,479 | ) | | | 5.04 | | | | | |
| Canceled | | | (13,924 | ) | | | 9.90 | | | | | |
Outstanding as of June 30, 2013 | | | 3,759,585 | | | $ | 10.44 | | | $ | 18,598,000 | |
Options exercisable as of June 30, 2013 | | | 1,836,519 | | | $ | 7.33 | | | | | |
The following table sets forth the Company’s outstanding options and options exercisable, including the exercise price range, number of shares, weighted average exercise price and remaining contractual lives by groups of similar price and grant date as of June 30, 2013:
| | | | | | | | | | | | | | | | | |
Options Outstanding | | | Options Exercisable | |
Exercise Price | | | Number of Shares | | | Weighted Average Remaining Contractual Life | | | Weighted Average Exercise Price | | | Exercisable as of June 30, 2013 | | | Weighted Average Remaining Contractual Life | |
| $ | 3.00 | | | | 5,031 | | | | 0.42 | | | $ | 3.00 | | | | 5,031 | | | | 0.42 | |
| $ | 4.00 | | | | 22,306 | | | | 0.99 | | | $ | 4.00 | | | | 19,181 | | | | 0.92 | |
| $ | 4.75 | | | | 611,035 | | | | 3.34 | | | $ | 4.75 | | | | 611,035 | | | | 3.34 | |
| $ | 5.19 | | | | 355,482 | | | | 6.29 | | | $ | 5.19 | | | | 265,059 | | | | 6.27 | |
| $ | 6.00 | | | | 66,891 | | | | 1.47 | | | $ | 6.00 | | | | 66,891 | | | | 1.47 | |
| $ | 6.92 | | | | 259,535 | | | | 7.18 | | | $ | 6.92 | | | | 195,624 | | | | 7.15 | |
| $ | 7.00 | | | | 4,883 | | | | 0.38 | | | $ | 7.00 | | | | 4,883 | | | | 0.38 | |
| $ | 7.09 | | | | 538,260 | | | | 7.58 | | | $ | 7.09 | | | | 317,000 | | | | 7.59 | |
| $ | 11.58 | | | | 176,500 | | | | 8.00 | | | $ | 11.58 | | | | 91,868 | | | | 8.00 | |
| $ | 12.88 | | | | 27,950 | | | | 9.88 | | | $ | 12.88 | | | | - | | | | - | |
| $ | 13.31 | | | | 253,984 | | | | 8.04 | | | $ | 13.31 | | | | 43,188 | | | | 8.04 | |
| $ | 14.29 | | | | 34,553 | | | | 8.39 | | | $ | 14.29 | | | | 32,084 | | | | 8.39 | |
| $ | 14.50 | | | | 3,750 | | | | 8.69 | | | $ | 14.50 | | | | 3,750 | | | | 8.69 | |
| $ | 14.64 | | | | 31,875 | | | | 3.04 | | | $ | 14.64 | | | | - | | | | - | |
| $ | 15.28 | | | | 616,350 | | | | 9.21 | | | $ | 15.28 | | | | 34,000 | | | | 9.21 | |
| $ | 15.99 | | | | 264,000 | | | | 9.24 | | | $ | 15.99 | | | | - | | | | - | |
| $ | 16.25 | | | | 487,200 | | | | 8.92 | | | $ | 16.25 | | | | 146,925 | | | | 8.92 | |
| | | | | | 3,759,585 | | | | 7.17 | | | | | | | | 1,836,519 | | | | 5.79 | |
The fair value of stock option grants is determined using the Black-Scholes valuation model. The Black-Scholes option-pricing model was developed for use in estimating the fair value of traded options that have no vesting restrictions and are fully transferable, characteristics not present in these employee stock options. Additionally, option valuation models require the input of highly subjective assumptions, including the expected volatility of the stock price. Because the Company’s employee stock options have characteristics significantly different from those of traded options and because changes in the subjective input assumptions can materially affect the fair value estimates, in management’s opinion, the existing models may not provide a reliable single measure of the fair value of its share-based awards.
The Company’s expected volatility assumptions are based on the historical volatility of a publicly traded peer entity over the same expected term of the option. Expected life assumptions and assumed forfeiture rates are based on historical experience. The risk-free interest rate was selected based upon yields of U.S. Treasury issues with a term equal to the expected life of the option being valued.
The assumptions utilized for stock option grants during 2013, 2012 and 2011 were as follows:
| | | | | | | | | | |
| | | For the years ending June 30 | |
| | | 2013 | | | 2012 | | | 2011 | |
| | | | | | | | | | |
| Risk-free interest rate | | | .68% - .72 | % | | | .69% - 1.51 | % | | | 1.14% - 2.02 | % |
| Expected dividend yield | | | - | | | | - | | | | - | |
| Expected volatility | | | 56.7 | % | | | 53.3 | % | | | 44.1 | % |
| Expected lives of options | | 6.25 years | | | 5 years | | | 5 years | |
| Forfeiture rate | | | 1.2 | % | | | 1.4 | % | | | 4.1 | % |
| Fair Value | | | $6.88 - $8.62 | | | | $4.87 - $10.24 | | | | $2.66 -$6.41 | |
The weighted average fair value of the options granted during 2013, 2012 and 2011 was $8.31, $9.00 and $3.19, respectively. Stock-based compensation expense recorded for option grants was approximately $4.4 million, $2.8 million and $1.4 million in 2013, 2012 and 2011, respectively. As of June 30, 2013, there was approximately $10.3 million of total unrecognized compensation cost related to non-vested options. This cost is expected to be recognized over a weighted-average period of 1.8 years.
Aggregate intrinsic value represents the value of the Company’s closing stock price on the last trading day of the fiscal period in excess of the weighted average exercise price multiplied by the number of options outstanding or exercisable. For 2011, fair value of the Company’s common stock based on an independent valuation is used inasmuch as the Company was not publicly traded at that time. Options expected to vest are unvested shares net of expected forfeitures. The total intrinsic value of stock options exercised was approximately $5.4 million, $1.5 million, and $615,000 during the years ended June 30, 2013, 2012 and 2011, respectively.
11. Income Taxes
The components of the Company’s provision (benefit) for income taxes were as follows (in thousands):
| | | | | | | | | | |
| | | For the years ending June 30 | |
| | | 2013 | | | 2012 | | | 2011 | |
| Current: | | | | | | | | | |
| Federal | | $ | — | | | $ | — | | | $ | 10 | |
| State | | | 174 | | | | 273 | | | | 17 | |
| | | | 174 | | | | 273 | | | | 27 | |
| Deferred: | | | | | | | | | | | | |
| Federal | | | (1,671 | ) | | | 1,416 | | | | 2,106 | |
| State | | | (631 | ) | | | 266 | | | | 227 | |
| Change in deferred tax asset valuation allowance | | | 537 | | | | — | | | | (31,560 | ) |
| | | | (1,765 | ) | | | 1,682 | | | | (29,227 | ) |
| Provision (benefit) for income taxes | | $ | (1,591 | ) | | $ | 1,955 | | | $ | (29,200 | ) |
The following is a reconciliation of income taxes (benefit) at the federal statutory rate with income taxes (benefit) recorded by the Company (in thousands):
| | | | | | | | | | |
| | | For the years ending June 30 | |
| | | 2013 | | | 2012 | | | 2011 | |
| Income tax computed at the federal statutory rate | | $ | (2,263 | ) | | $ | 1,654 | | | $ | 1,280 | |
| State income taxes, net of federal income tax benefit | | | (221 | ) | | | 195 | | | | 151 | |
| Equity compensation | | | 1,001 | | | | 673 | | | | 391 | |
| Other permanent items | | | 254 | | | | 432 | | | | 505 | |
| Research and development and other credits | | | (647 | ) | | | (975 | ) | | | — | |
| Other | | | (252 | ) | | | (24 | ) | | | 33 | |
| Change in valuation allowance | | | 537 | | | | — | | | | (31,560 | ) |
| | | $ | (1,591 | ) | | $ | 1,955 | | | $ | (29,200 | ) |
The Company’s deferred tax assets and liabilities consist of the following (in thousands):
| | | June 30 | |
| | | 2013 | | | 2012 | |
| | | | | | | |
Deferred tax assets (liabilities): | | | | | | |
| Deferred revenue | | $ | 1,801 | | | $ | 3 | |
| Stock option obligations | | | 1,095 | | | | 1,115 | |
| Investments | | | 103 | | | | 138 | |
| Fixed assets | | | — | | | | 19 | |
| Intangibles | | | 688 | | | | 287 | |
| Research and development credit | | | 4,792 | | | | 3,320 | |
| Allowance for doubtful accounts | | | 336 | | | | 274 | |
| Other | | | 361 | | | | 1,463 | |
| Inventory | | | 19 | | | | 13 | |
| Net operating loss carryforwards | | | 27,428 | | | | 27,432 | |
| | | | | | | | | |
Deferred tax assets | | | 36,623 | | | | 34,064 | |
| | | | | | | | | |
| Fixed assets | | | (1,558 | ) | | | — | |
| Capitalized software | | | (5,218 | ) | | | (6,519 | ) |
| | | | | | | | | |
Deferred tax liabilities | | | (6,776 | ) | | | (6,519 | ) |
| Valuation allowance | | | (537 | ) | | | — | |
| | | | | | | | | |
Net deferred tax assets | | $ | 29,310 | | | $ | 27,545 | |
As of June 30, 2013, the Company had gross net operating losses (NOLs) of approximately $74 million. These NOLs will be available to offset any future taxable income and will begin to expire in 2021. The Company has also generated research credit carryforwards of approximately $4.8 million.
At March 31, 2011, the Company determined that it would be more likely than not that the cumulative net operating loss and other deferred tax benefits would be recoverable. Accordingly, net deferred tax assets of approximately $31.0 million were recorded on the Company’s balance sheet as of that date with a corresponding $31.0 million income tax benefit recorded in the statement of operations. The determination of when to adjust the valuation allowance requires significant judgment on the part of management. As of June 30, 2013, Management determined that more likely than not all net deferred tax assets, except for state R&D carryforwards, would be realized based upon future projections of taxable income. Consequently, the Company recorded a valuation allowance of $537 thousand specifically attributable to the state R&D carryforwards that may not be fully utilized before the Company’s income allocated to those states use up the existing net operating losses. Some of this is due to state income tax planning.
As of June 30, 2013, the Company had no unrecognized tax benefits. The Company will recognize accrued interest and penalties related to unrecognized tax benefits in income tax expense when and if incurred. The Company had no interest or penalties related to unrecognized tax benefits accrued as of June 30, 2013. The Company does not anticipate that the amount of the unrecognized benefit will significantly increase within the next 12 months. However, net operating loss and R&D credit carryforwards remain subject to examination to the extent they are carried forward and impact a year that is open to examination by tax authorities.
12. Leases
Rental expense, recognized on a straight-line basis, for all building and equipment leases totaled approximately $1.9 million, $1.2 million and $526,000 in 2013, 2012 and 2011, respectively. As of June 30, 2013, future minimum lease payments under operating leases with non-cancelable lease terms are as follows (in thousands):
| | | | | |
| | | Amounts | |
| 2014 | | $ | 1,565 | |
| 2015 | | | 1,271 | |
| 2016 | | | 433 | |
| 2017 | | | 57 | |
| 2018 and thereafter | | | 13 | |
| Total | | $ | 3,339 | |
13. Retirement Savings Plan
The Company offers a retirement savings plan (the Plan) under Section 401(k) of the Internal Revenue Code to eligible employees, as defined in the plan document. The Plan allows a participant to make pre-tax contributions up to the maximum allowable percentage of eligible earnings under IRS guidelines. In addition, the Company can elect to make a discretionary matching contribution based on a uniform percentage of participants’ contributions determined by the Board of Directors each year. The Company may also make additional discretionary contributions upon a resolution of the Board of Directors. The Company made no matching or discretionary contributions to the Plan for the three years in the period ended June 30, 2013.
14. Segment information
The Company complies with ASC Topic 280,Segment Reporting. ASC 280, which is based on a management approach to segment reporting and requires that the Company disclose information about the business components (operating segments) as utilized to make operating decisions and assess performance. The objective of this guidance is to help financial statement users understand the Company’s performance, assess prospects for future cash flows and judge the entity as a whole. An operating segment is defined as a component that engages in business activities whose operating results are reviewed by the chief operating decision maker and for which discrete financial information is available. The Company manages its resources and assesses its performance on an enterprise-wide basis. The Company does report revenue according to the nature of the products and services provided to its customers; providers in various settings within the ambulatory sector of the domestic healthcare market who share similar economic characteristics.
15. Commitment and Contingencies
The Company has commitments and obligations that exist in the ordinary course of business. To the extent that these commitments and obligations are material, they are disclosed in the accompanying consolidated financial statements. In addition to these commitments and obligations that exist in the ordinary course, the Company may be subject to various legal claims, pending and potential legal actions for damages and other matters arising in the normal conduct of business, including but not limited to, intellectual property infringement, misappropriation or other intellectual property violations that are claimed by third parties against our company.
In the opinion of management, there is a reasonable possibility that some of these legal claim contingencies may incur losses. There are no filed claims pending against the Company at June 30, 2013. There are, however, asserted unfilled claims that, given the early stage of these legal matters and the nature of the claims, it is not possible to estimate a loss or range of loss for the ongoing claim that exist at June 30, 2013. Further, management does not feel that any individual claim is material to disclose. We will continue to evaluate the potential exposure related to these matters in future periods. In addition to these legal claim contingencies, the Company may have additional commitments and contingencies that arise in the ordinary course of business. Management knows of no commitment and contingencies that are material and are omitted from disclosure in these consolidated financial statements.