
UNITED STATES
SECURITIES AND EXCHANGE COMMISSION
Washington, D.C. 20549
FORM N-CSR
CERTIFIED SHAREHOLDER REPORT OF REGISTERED
MANAGEMENT INVESTMENT COMPANIES
Investment Company Act file number: 811-09253
Wells Fargo Funds Trust
(Exact name of registrant as specified in charter)
525 Market St., San Francisco, CA 94105
(Address of principal executive offices) (Zip code)
Catherine Kennedy
Wells Fargo Funds Management, LLC
525 Market St., San Francisco, CA 94105
(Name and address of agent for service)
Registrant’s telephone number, including area code: 800-222-8222
Date of fiscal year end: April 30
Registrant is making a filing for 1 of its series: Wells Fargo Absolute Return Fund
Date of reporting period: April 30, 2021
ITEM 1. REPORT TO STOCKHOLDERS

| 2 | |
| 6 | |
| 10 | |
| 12 | |
| Financial statements | |
| 13 | |
| 14 | |
| 15 | |
| 16 | |
| 22 | |
| 27 | |
| 28 | |
| 32 |

| 1 | The S&P 500 Index consists of 500 stocks chosen for market size, liquidity, and industry group representation. It is a market-value-weighted index with each stock's weight in the index proportionate to its market value. You cannot invest directly in an index. |
| 2 | The Morgan Stanley Capital International (MSCI) All Country World Index (ACWI) ex USA Index (Net) is a free-float-adjusted market-capitalization-weighted index that is designed to measure the equity market performance of developed and emerging markets, excluding the United States. Source: MSCI. MSCI makes no express or implied warranties or representations and shall have no liability whatsoever with respect to any MSCI data contained herein. The MSCI data may not be further redistributed or used as a basis for other indices or any securities or financial products. This report is not approved, reviewed, or produced by MSCI. You cannot invest directly in an index. |
| 1 | The S&P 500 Index consists of 500 stocks chosen for market size, liquidity, and industry group representation. It is a market-value-weighted index with each stock's weight in the index proportionate to its market value. You cannot invest directly in an index. |
| 3 | The MSCI Emerging Markets (EM) Index (Net) is a free-float-adjusted market-capitalization-weighted index that is designed to measure equity market performance of emerging markets. You cannot invest directly in an index. |
| 1 | The S&P 500 Index consists of 500 stocks chosen for market size, liquidity, and industry group representation. It is a market-value-weighted index with each stock's weight in the index proportionate to its market value. You cannot invest directly in an index. |
| 4 | The Bloomberg Barclays U.S. Aggregate Bond Index is a broad-based benchmark that measures the investment-grade, U.S. dollar-denominated, fixed-rate taxable bond market, including Treasuries, government-related and corporate securities, mortgage-backed securities (agency fixed-rate and hybrid adjustable-rate mortgage pass-throughs), asset-backed securities, and commercial mortgage-backed securities. You cannot invest directly in an index. |
| 1 | The S&P 500 Index consists of 500 stocks chosen for market size, liquidity, and industry group representation. It is a market-value-weighted index with each stock's weight in the index proportionate to its market value. You cannot invest directly in an index. |
| 5 | The Bloomberg Barclays Global Aggregate ex-USD Index (unhedged) is an unmanaged index that provides a broad-based measure of the global investment-grade fixed-income markets excluding the U.S. dollar-denominated debt market. You cannot invest directly in an index. |
| 1 | The S&P 500 Index consists of 500 stocks chosen for market size, liquidity, and industry group representation. It is a market-value-weighted index with each stock's weight in the index proportionate to its market value. You cannot invest directly in an index. |
| 6 | The Bloomberg Barclays Municipal Bond Index is an unmanaged index composed of long-term tax-exempt bonds with a minimum credit rating of Baa. You cannot invest directly in an index. |
| 1 | The S&P 500 Index consists of 500 stocks chosen for market size, liquidity, and industry group representation. It is a market-value-weighted index with each stock's weight in the index proportionate to its market value. You cannot invest directly in an index. |
| 7 | The ICE BofA U.S. High Yield Index is a market-capitalization-weighted index of domestic and Yankee high-yield bonds. The index tracks the performance of high-yield securities traded in the U.S. bond market. You cannot invest directly in an index. Copyright 2021. ICE Data Indices, LLC. All rights reserved. |
“The passage of the massive domestic stimulus bill highlighted March activity, leading to increased forecasts for U.S. growth in 2021.” |

President
Wells Fargo Funds
| Investment objective | The Fund seeks a positive total return. |
| Manager | Wells Fargo Funds Management, LLC |
| Portfolio managers | Ben Inker, CFA®‡*, John Thorndike* |
| Average annual total returns (%) as of April 30, 2021 | |||||||||||
| Including sales charge | Excluding sales charge | Expense ratios1 (%) | |||||||||
| Inception date | 1 year | 5 year | 10 year | 1 year | 5 year | 10 year | Gross | Net 2 | |||
| Class A (WARAX)3 | 3-1-2012 | 6.62 | 2.58 | 2.56 | 13.16 | 3.81 | 3.17 | 1.50 | 1.50 | ||
| Class C (WARCX)4 | 3-1-2012 | 11.66 | 3.10 | 2.42 | 12.66 | 3.10 | 2.42 | 2.25 | 2.25 | ||
| Class R (WARHX)5 | 9-30-2015 | – | – | – | 14.17 | 3.83 | 3.14 | 1.75 | 1.75 | ||
| Class R6 (WARRX)6 | 10-31-2014 | – | – | – | 13.62 | 4.28 | 3.58 | 1.07 | 1.07 | ||
| Administrator Class (WARDX)7 | 3-1-2012 | – | – | – | 13.76 | 4.03 | 3.35 | 1.42 | 1.38 | ||
| Institutional Class (WABIX)8 | 11-30-2012 | – | – | – | 13.57 | 4.18 | 3.53 | 1.17 | 1.14 | ||
| MSCI ACWI Index (Net)9 | – | – | – | – | 45.75 | 13.85 | 9.17 | – | – | ||
| Bloomberg Barclays U.S. TIPS 1-10 Year Index10 | – | – | – | – | 7.32 | 3.62 | 2.56 | – | – | ||
| CPI 11 | – | – | – | – | 4.16 | 2.22 | 1.73 | – | – | ||
| 1 | Reflects the expense ratios as stated in the most recent prospectuses, which include the impact of 0.81% in acquired fund fees and expenses and underlying GMO fees. The expense ratios shown are subject to change and may differ from the annualized expense ratios shown in the financial highlights of this report, which do not include the expenses of GMO Benchmark-Free Allocation Fund and other acquired fund fees and expenses. |
| 2 | The manager has contractually committed through August 31, 2021, to waive fees and/or reimburse expenses to the extent necessary to cap total annual fund operating expenses after fee waivers at 0.71% for Class A, 1.46% for Class C, 0.96% for Class R, 0.28% for Class R6, 0.57% for Administrator Class, and 0.33% for Institutional Class. Brokerage commissions, stamp duty fees, interest, taxes, acquired fund fees and expenses (if any, including the expenses of GMO Benchmark-Free Allocation Fund), and extraordinary expenses are excluded from the expense caps. Prior to or after the commitment expiration date, the caps may be increased or the commitment to maintain the caps may be terminated only with the approval of the Board of Trustees. Without these caps, the Fund’s returns would have been lower. The expense ratio paid by an investor is the net expense ratio (the total annual fund operating expenses after fee waivers) as stated in the prospectuses. |
| 3 | Historical performance shown for the Class A shares prior to their inception is based on the performance of the Class III shares of the GMO Benchmark-Free Allocation Fund. The inception date of the GMO Benchmark-Free Allocation Fund Class III shares is July 23, 2003. Returns for the Class III shares do not reflect the GMO Benchmark-Free Allocation Fund’s current fee arrangement and have been adjusted downward to reflect the higher expense ratios applicable to the Class A shares at its inception. The ratio for the Class A shares was 1.66%. |
| 4 | Historical performance shown for the Class C shares prior to their inception is based on the performance of the Class III shares of the GMO Benchmark-Free Allocation Fund. The inception date of the GMO Benchmark-Free Allocation Fund Class III shares is July 23, 2003. Returns for the Class III shares do not reflect the GMO Benchmark-Free Allocation Fund’s current fee arrangement and have been adjusted downward to reflect the higher expense ratios applicable to the Class C shares at its inception. The ratio for the Class C shares was 2.41%. |
| 5 | Historical performance shown for the Class R shares prior to their inception reflects the performance of the Administrator Class shares, and is not adjusted to reflect the Class R share expenses. If these expenses had been included, returns for the Class R shares would be lower. |
| 6 | Historical performance shown for the Class R6 shares prior to their inception reflects the performance of the Institutional Class shares, and includes the higher expenses applicable to Institutional Class shares. If these expenses had not been included, returns for Class R6 shares would have been higher. |
| ‡ | CFA® and Chartered Financial Analyst® are trademarks owned by CFA Institute. |
| * | The Fund invests substantially all of its investable assets directly in GMO Benchmark-Free Allocation Fund, an investment company advised by Grantham, Mayo, Van Otterloo & Co. LLC (GMO). Mr. Inker and Mr. Thorndike have been responsible for coordinating the portfolio management of GMO Benchmark-Free Allocation Fund since 2003 and 2019, respectively. |
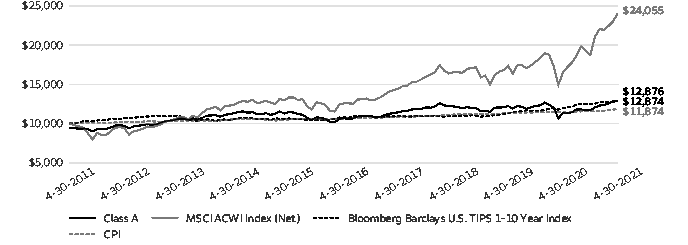
| 1 | The chart compares the performance of Class A shares for the most recent ten years with the MSCI ACWI Index (Net), Bloomberg Barclays U.S. TIPS 1-10 Year Index, and the CPI. The chart assumes a hypothetical investment of $10,000 in Class A shares and reflects all operating expenses and assumes the maximum initial sales charge of 5.75%. |
| 7 | Historical performance shown for the Administrator Class shares prior to their inception is based on the performance of the Class III shares of the GMO Benchmark-Free Allocation Fund. The inception date of the GMO Benchmark-Free Allocation Fund Class III shares is July 23, 2003. Returns for the Class III shares do not reflect the GMO Benchmark-Free Allocation Fund’s current fee arrangement and have been adjusted downward to reflect the higher expense ratios applicable to the Administrator Class shares at its inception. The ratio for the Institutional Class shares was 1.50%. |
| 8 | Historical performance shown for the Institutional Class shares prior to their inception reflects the performance of the Administrator Class shares, and is not adjusted to reflect the Institutional Class expenses. If these expenses had been included, returns for the Institutional Class shares would be higher. |
| 9 | The Morgan Stanley Capital International (MSCI) All Country World Index (ACWI) Index (Net) is a free-float-adjusted market-capitalization-weighted index that is designed to measure the equity market performance of developed and emerging markets. Source: MSCI. MSCI makes no express or implied warranties or representations and shall have no liability whatsoever with respect to any MSCI data contained herein. The MSCI data may not be further redistributed or used as a basis for other indices or any securities or financial products. This report is not approved, reviewed, or produced by MSCI. You cannot invest directly in an index. |
| 10 | The Bloomberg Barclays U.S. Treasury Inflation-Protected Securities (TIPS) 1-10 Year Index is an unmanaged index of U.S. Treasury securities with maturities of less than 10 years and more than 1 year. You cannot invest directly in an index. |
| 11 | The Consumer Price Index (CPI) is a measure of the average change over time in the prices paid by urban consumers for a market basket of consumer goods and services. You cannot invest directly in an index. |
| ■ | The Fund underperformed the MSCI ACWI Index (Net) but outperformed the Bloomberg Barclays U.S. TIPS 1–10 Year Index and the CPI for the 12-month period that ended April 30, 2021. |
| ■ | The Fund had other equity positions during the year, but they were held against broad market hedges that detracted from their contribution. While these long/short positions were net positive during the 12-month time frame, the short positions (the hedges) acted as a headwind. |
| ■ | Long positions in emerging equities throughout the year drove the majority of positive performance. The Fund also held a number of credit positions in the fixed-income portfolio that contributed positively to returns. The Fund held a large position in a collection of alternative strategies, some of which contributed to positive returns. |
| Holdings (%) as of April 30, 20211 | |
| GMO Implementation Fund | 88.66 |
| GMO Opportunistic Income Fund, Class VI | 3.40 |
| GMO SGM Major Markets Fund, Class VI | 2.58 |
| GMO Emerging Country Debt Fund, Class IV | 2.43 |
| 1 | Figures represent the investments of GMO Benchmark-Free Allocation Fund as a percentage of the Fund's net assets. Holdings are subject to change and may have changed since the date specified. |
| 1 | The S&P 500 Index consists of 500 stocks chosen for market size, liquidity, and industry group representation. It is a market-value-weighted index with each stock's weight in the index proportionate to its market value. You cannot invest directly in an index. |
| 2 | The Morgan Stanley Capital International (MSCI) Europe, Australasia, Far East (EAFE) Index (Net) is a free-float-adjusted market-capitalization-weighted index that is designed to measure the equity market performance of developed markets, excluding the United States and Canada. You cannot invest directly in an index. |
| 1 | The S&P 500 Index consists of 500 stocks chosen for market size, liquidity, and industry group representation. It is a market-value-weighted index with each stock's weight in the index proportionate to its market value. You cannot invest directly in an index. |
| 3 | The MSCI Emerging Markets (EM) Index (Net) is a free-float-adjusted market-capitalization-weighted index that is designed to measure equity market performance of emerging markets. You cannot invest directly in an index. |
| Portfolio composition as of April 30, 20211 |
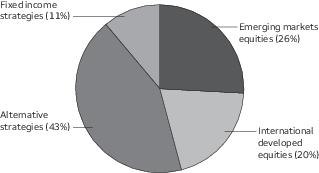
| 1 | Figures represent the portfolio allocation of the GMO Benchmark-Free Allocation Fund. Portfolio composition is subject to change and may have changed since the date specified. |
| Wells Fargo Absolute Return Fund (excluding GMO Benchmark-Free Allocation Fund and its underlying fund expenses) | Beginning account value 11-1-2020 | Ending account value 4-30-2021 | Expenses paid during the period1 | Annualized net expense ratio |
| Class A | ||||
| Actual | $1,000.00 | $1,101.10 | $3.65 | 0.70% |
| Hypothetical (5% return before expenses) | $1,000.00 | $1,021.32 | $3.51 | 0.70% |
| Class C | ||||
| Actual | $1,000.00 | $1,096.83 | $7.49 | 1.44% |
| Hypothetical (5% return before expenses) | $1,000.00 | $1,017.65 | $7.20 | 1.44% |
| Class R | ||||
| Actual | $1,000.00 | $1,099.15 | $4.79 | 0.92% |
| Hypothetical (5% return before expenses) | $1,000.00 | $1,020.23 | $4.61 | 0.92% |
| Class R6 | ||||
| Actual | $1,000.00 | $1,102.40 | $1.41 | 0.27% |
| Hypothetical (5% return before expenses) | $1,000.00 | $1,023.46 | $1.35 | 0.27% |
| Administrator Class | ||||
| Actual | $1,000.00 | $1,100.76 | $2.97 | 0.57% |
| Hypothetical (5% return before expenses) | $1,000.00 | $1,021.97 | $2.86 | 0.57% |
| Institutional Class | ||||
| Actual | $1,000.00 | $1,102.98 | $1.72 | 0.33% |
| Hypothetical (5% return before expenses) | $1,000.00 | $1,023.16 | $1.66 | 0.33% |
| Wells Fargo Absolute Return Fund (including GMO Benchmark-Free Allocation Fund and its underlying fund expenses) | Beginning account value 11-1-2020 | Ending account value 4-30-2021 | Expenses paid during the period1 | Annualized net expense ratio |
| Class A | ||||
| (Actual) | $1,000.00 | $1,101.10 | $ 8.34 | 1.60% |
| (Hypothetical) (5% return before expenses) | $1,000.00 | $1,016.86 | $ 8.00 | 1.60% |
| Class C | ||||
| (Actual) | $1,000.00 | $1,096.83 | $12.17 | 2.34% |
| (Hypothetical) (5% return before expenses) | $1,000.00 | $1,013.19 | $11.68 | 2.34% |
| Class R | ||||
| (Actual) | $1,000.00 | $1,099.15 | $ 9.47 | 1.82% |
| (Hypothetical) (5% return before expenses) | $1,000.00 | $1,015.77 | $ 9.10 | 1.82% |
| Class R6 | ||||
| (Actual) | $1,000.00 | $1,102.40 | $ 6.10 | 1.17% |
| (Hypothetical) (5% return before expenses) | $1,000.00 | $1,018.99 | $ 5.86 | 1.17% |
| Administrator Class | ||||
| (Actual) | $1,000.00 | $1,100.76 | $ 7.66 | 1.47% |
| (Hypothetical) (5% return before expenses) | $1,000.00 | $1,017.50 | $ 7.35 | 1.47% |
| Institutional Class | ||||
| (Actual) | $1,000.00 | $1,102.98 | $ 6.41 | 1.23% |
| (Hypothetical) (5% return before expenses) | $1,000.00 | $1,018.70 | $ 6.16 | 1.23% |
| Shares | Value | ||||
| Investment companies: 97.11% | |||||
| Multi-Asset Funds | |||||
| GMO Benchmark-Free Allocation Fund Class MF ♠ | 62,904,602 | $1,681,440,024 | |||
| Total Investment companies (Cost $1,499,379,587) | 1,681,440,024 | ||||
| Total investments in securities (Cost $1,499,379,587) | 97.11% | 1,681,440,024 | |||
| Other assets and liabilities, net | 2.89 | 50,046,236 | |||
| Total net assets | 100.00% | $1,731,486,260 |
| ♠ | The issuer of the security is an affiliate of the Fund as defined in the Investment Company Act of 1940. |
| Value, beginning of period | Purchases | Sales proceeds | Net realized gains (losses) on affiliated investment companies | Net change in unrealized gains (losses) on affiliated investment companies | Value, end of period | % of net assets | |
| Investment companies | |||||||
| Multi-Asset Funds | |||||||
| GMO Benchmark-Free Allocation Fund Class MF | $2,259,258,586 | $97,238,967 | $(858,846,669) | $22,319,406 | $161,469,734 | $1,681,440,024 | 97.11% |
| Shares, end of period | Dividends from affiliated investment companies | Net realized gains on capital gain distributions from affiliated investment companies | |
| Investment companies | |||
| Multi-Asset Funds | |||
| GMO Benchmark-Free Allocation Fund Class MF | 62,904,602 | $55,384,563 | $13,993,903 |
| Assets | |
Investments in affiliated investment companies, at value (cost $1,499,379,587) | $ 1,681,440,024 |
Cash | 48,588,418 |
Receivable for Fund shares sold | 3,969,260 |
Receivable for investments sold | 1,399,756 |
Prepaid expenses and other assets | 12,085 |
Total assets | 1,735,409,543 |
| Liabilities | |
Payable for Fund shares redeemed | 2,539,513 |
Management fee payable | 831,680 |
Administration fees payable | 231,332 |
Distribution fees payable | 87,721 |
Trustees’ fees and expenses payable | 1,867 |
Accrued expenses and other liabilities | 231,170 |
Total liabilities | 3,923,283 |
Total net assets | $1,731,486,260 |
| Net assets consist of | |
Paid-in capital | $ 2,015,730,559 |
Total distributable loss | (284,244,299) |
Total net assets | $1,731,486,260 |
| Computation of net asset value and offering price per share | |
Net assets – Class A | $ 353,133,625 |
Shares outstanding – Class A1 | 31,905,796 |
Net asset value per share – Class A | $11.07 |
Maximum offering price per share – Class A2 | $11.75 |
Net assets – Class C | $ 131,690,435 |
Shares outstanding – Class C1 | 12,081,847 |
Net asset value per share – Class C | $10.90 |
Net assets – Class R | $ 148,137 |
Shares outstanding – Class R1 | 12,984 |
Net asset value per share – Class R | $11.41 |
Net assets – Class R6 | $ 17,332,080 |
Shares outstanding – Class R61 | 1,561,154 |
Net asset value per share – Class R6 | $11.10 |
Net assets – Administrator Class | $ 40,693,745 |
Shares outstanding – Administrator Class1 | 3,639,814 |
Net asset value per share – Administrator Class | $11.18 |
Net assets – Institutional Class | $ 1,188,488,238 |
Shares outstanding – Institutional Class1 | 107,094,588 |
Net asset value per share – Institutional Class | $11.10 |
| 1 | The Fund has an unlimited number of authorized shares |
| 2 | Maximum offering price is computed as 100/94.25 of net asset value. On investments of $50,000 or more, the offering price is reduced. |
| Investment income | |
Dividends from affiliated investment companies | $ 55,384,563 |
| Expenses | |
Management fee | 4,224,100 |
| Administration fees | |
Class A | 671,105 |
Class C | 399,977 |
Class R | 162 |
Class R6 | 6,078 |
Administrator Class | 62,916 |
Institutional Class | 1,829,868 |
| Shareholder servicing fees | |
Class A | 797,631 |
Class C | 474,634 |
Class R | 192 |
Administrator Class | 118,394 |
| Distribution fees | |
Class C | 1,422,858 |
Class R | 145 |
Custody and accounting fees | 23,054 |
Professional fees | 37,472 |
Registration fees | 98,751 |
Shareholder report expenses | 120,770 |
Trustees’ fees and expenses | 19,512 |
Other fees and expenses | 57,645 |
Total expenses | 10,365,264 |
| Less: Fee waivers and/or expense reimbursements | |
Administrator Class | (16,985) |
Institutional Class | (429,934) |
Net expenses | 9,918,345 |
Net investment income | 45,466,218 |
Payment from affiliate | 840,939 |
| Realized and unrealized gains (losses) on investments | |
| Net realized gains on | |
Affiliated investment companies | 22,319,406 |
Capital gain distributions from affiliated investment companies | 13,993,903 |
Net realized gains on investments | 36,313,309 |
Net change in unrealized gains (losses) on investments | 161,469,734 |
Net realized and unrealized gains (losses) on investments | 197,783,043 |
Net increase in net assets resulting from operations | $244,090,200 |
| Year ended April 30, 2021 | Year ended April 30, 2020 | |||
| Operations | ||||
Net investment income | $ 45,466,218 | $ 91,487,675 | ||
Payment from affiliate | 840,939 | 0 | ||
Net realized gains on investments | 36,313,309 | 14,359,603 | ||
Net change in unrealized gains (losses) on investments | 161,469,734 | (314,690,632) | ||
Net increase (decrease) in net assets resulting from operations | 244,090,200 | (208,843,354) | ||
| Distributions to shareholders from | ||||
| Net investment income and net realized gains | ||||
Class A | (10,520,302) | (9,515,886) | ||
Class C | (4,555,046) | (5,326,006) | ||
Class R | (4,635) | 0 | ||
Class R6 | (664,227) | (902,716) | ||
Administrator Class | (1,426,677) | (2,075,107) | ||
Institutional Class | (43,198,445) | (71,689,413) | ||
Total distributions to shareholders | (60,369,332) | (89,509,128) | ||
| Capital share transactions | Shares | Shares | ||
| Proceeds from shares sold | ||||
Class A | 11,820,545 | 126,171,861 | 4,671,061 | 50,858,864 |
Class C | 539,919 | 5,719,127 | 591,736 | 6,399,495 |
Class R | 19,612 | 220,705 | 1,073 | 11,764 |
Class R6 | 191,804 | 2,049,670 | 1,034,300 | 11,116,006 |
Administrator Class | 416,961 | 4,487,504 | 947,480 | 10,476,640 |
Institutional Class | 21,087,448 | 223,635,756 | 25,838,753 | 281,518,141 |
| 362,284,623 | 360,380,910 | |||
| Reinvestment of distributions | ||||
Class A | 841,654 | 8,871,030 | 765,410 | 8,641,478 |
Class C | 425,622 | 4,430,727 | 407,464 | 4,539,140 |
Class R6 | 48,540 | 512,585 | 60,641 | 683,427 |
Administrator Class | 129,752 | 1,380,557 | 174,757 | 1,980,001 |
Institutional Class | 3,231,759 | 34,127,379 | 5,261,407 | 59,348,673 |
| 49,322,278 | 75,192,719 | |||
| Payment for shares redeemed | ||||
Class A | (10,187,273) | (107,936,942) | (13,226,374) | (140,904,801) |
Class C | (14,448,329) | (150,591,212) | (13,728,996) | (145,764,194) |
Class R | (9,225) | (103,350) | (22,063) | (241,798) |
Class R6 | (1,187,226) | (12,405,073) | (1,441,527) | (15,854,425) |
Administrator Class | (2,900,787) | (30,662,202) | (5,579,018) | (60,101,012) |
Institutional Class | (81,795,286) | (864,473,835) | (125,711,938) | (1,345,767,943) |
| (1,166,172,614) | (1,708,634,173) | |||
Net decrease in net assets resulting from capital share transactions | (754,565,713) | (1,273,060,544) | ||
Total decrease in net assets | (570,844,845) | (1,571,413,026) | ||
| Net assets | ||||
Beginning of period | 2,302,331,105 | 3,873,744,131 | ||
End of period | $ 1,731,486,260 | $ 2,302,331,105 | ||
| Year ended April 30 | |||||
| Class A | 2021 | 2020 | 2019 | 2018 | 2017 |
Net asset value, beginning of period | $10.11 | $11.15 | $11.40 | $10.90 | $10.25 |
Net investment income | 0.22 | 0.29 1 | 0.27 1 | 0.19 1 | 0.08 1 |
Net realized and unrealized gains (losses) on investments | 1.09 | (1.04) | (0.24) | 0.51 | 0.65 |
Total from investment operations | 1.31 | (0.75) | 0.03 | 0.70 | 0.73 |
| Distributions to shareholders from | |||||
Net investment income | (0.35) | (0.29) | (0.28) | (0.20) | (0.08) |
Net asset value, end of period | $11.07 | $10.11 | $11.15 | $11.40 | $10.90 |
Total return2 | 13.16% | (6.99)% | 0.42% | 6.45% | 7.15% |
| Ratios to average net assets (annualized) | |||||
Gross expenses3 | 0.69% | 0.69% | 0.69% | 0.68% | 0.67% |
Net expenses3 | 0.69% | 0.69% | 0.69% | 0.68% | 0.67% |
Net investment income | 2.33% | 2.68% | 2.43% | 1.67% | 0.78% |
| Supplemental data | |||||
Portfolio turnover rate | 5% | 4% | 5% | 5% | 2% |
Net assets, end of period (000s omitted) | $353,134 | $297,590 | $415,011 | $516,085 | $586,785 |
| 1 | Calculated based upon average shares outstanding |
| 2 | Total return calculations do not include any sales charges. |
| 3 | Ratios do not reflect net expenses of GMO Benchmark-Free Allocation Fund, Class MF. Including net expenses allocated from GMO Benchmark-Free Allocation Fund, Class MF, the ratios would be increased by the following amounts: |
| Year ended April 30, 2021 | 0.67% |
| Year ended April 30, 2020 | 0.61% |
| Year ended April 30, 2019 | 0.60% |
| Year ended April 30, 2018 | 0.60% |
| Year ended April 30, 2017 | 0.59% |
| Year ended April 30 | |||||
| Class C | 2021 | 2020 | 2019 | 2018 | 2017 |
Net asset value, beginning of period | $9.95 | $10.96 | $11.19 | $10.70 | $10.05 |
Net investment income | 0.12 1 | 0.12 | 0.19 1 | 0.10 1 | 0.00 1 |
Payment from affiliate | 0.05 | 0.00 | 0.00 | 0.00 | 0.00 |
Net realized and unrealized gains (losses) on investments | 1.08 | (0.95) | (0.24) | 0.50 | 0.65 |
Total from investment operations | 1.25 | (0.83) | (0.05) | 0.60 | 0.65 |
| Distributions to shareholders from | |||||
Net investment income | (0.30) | (0.18) | (0.18) | (0.11) | 0.00 |
Net asset value, end of period | $10.90 | $9.95 | $10.96 | $11.19 | $10.70 |
Total return2 | 12.66% 3 | (7.73)% | (0.31)% | 5.60% | 6.47% |
| Ratios to average net assets (annualized) | |||||
Gross expenses4 | 1.44% | 1.44% | 1.44% | 1.43% | 1.42% |
Net expenses4 | 1.44% | 1.44% | 1.44% | 1.43% | 1.42% |
Net investment income | 1.18% | 1.71% | 1.78% | 0.88% | 0.04% |
| Supplemental data | |||||
Portfolio turnover rate | 5% | 4% | 5% | 5% | 2% |
Net assets, end of period (000s omitted) | $131,690 | $254,485 | $419,656 | $629,813 | $765,561 |
| 1 | Calculated based upon average shares outstanding |
| 2 | Total return calculations do not include any sales charges. |
| 3 | During the year ended April 30, 2021, the Fund received a payment from an affiliate that had an impact of 0.53% on total return. See Note 4 in the Notes to Financial Statements for additional information. |
| 4 | Ratios do not reflect net expenses of GMO Benchmark-Free Allocation Fund, Class MF. Including net expenses allocated from GMO Benchmark-Free Allocation Fund, Class MF, the ratios would be increased by the following amounts: |
| Year ended April 30, 2021 | 0.67% |
| Year ended April 30, 2020 | 0.61% |
| Year ended April 30, 2019 | 0.60% |
| Year ended April 30, 2018 | 0.60% |
| Year ended April 30, 2017 | 0.59% |
| Year ended April 30 | |||||
| Class R | 2021 | 2020 | 2019 | 2018 | 2017 |
Net asset value, beginning of period | $10.33 | $11.12 | $11.37 | $10.82 | $10.22 |
Net investment income | 0.18 | 0.12 | 0.27 | 0.12 | 0.13 |
Payment from affiliate | 0.02 | 0.00 | 0.00 | 0.00 | 0.00 |
Net realized and unrealized gains (losses) on investments | 1.25 | (0.91) | (0.26) | 0.55 | 0.57 |
Total from investment operations | 1.45 | (0.79) | 0.01 | 0.67 | 0.70 |
| Distributions to shareholders from | |||||
Net investment income | (0.37) | 0.00 | (0.26) | (0.12) | (0.10) |
Net asset value, end of period | $11.41 | $10.33 | $11.12 | $11.37 | $10.82 |
Total return | 14.17% 1 | (7.10)% | 0.21% | 6.21% | 6.91% |
| Ratios to average net assets (annualized) | |||||
Gross expenses2 | 0.88% | 0.91% | 0.85% | 0.93% | 0.93% |
Net expenses2 | 0.88% | 0.91% | 0.85% | 0.93% | 0.93% |
Net investment income | 4.51% | 0.21% | 2.42% | 0.85% | 1.40% |
| Supplemental data | |||||
Portfolio turnover rate | 5% | 4% | 5% | 5% | 2% |
Net assets, end of period (000s omitted) | $148 | $27 | $262 | $368 | $756 |
| 1 | During the year ended April 30, 2021, the Fund received a payment from an affiliate that had an impact of 0.22% on total return. See Note 4 in the Notes to Financial Statements for additional information. |
| 2 | Ratios do not reflect net expenses of GMO Benchmark-Free Allocation Fund, Class MF. Including net expenses allocated from GMO Benchmark-Free Allocation Fund, Class MF, the ratios would be increased by the following amounts: |
| Year ended April 30, 2021 | 0.67% |
| Year ended April 30, 2020 | 0.61% |
| Year ended April 30, 2019 | 0.60% |
| Year ended April 30, 2018 | 0.60% |
| Year ended April 30, 2017 | 0.59% |
| Year ended April 30 | |||||
| Class R6 | 2021 | 2020 | 2019 | 2018 | 2017 |
Net asset value, beginning of period | $10.11 | $11.15 | $11.41 | $10.91 | $10.26 |
Net investment income | 0.28 | 0.35 | 0.34 | 0.31 1 | 0.14 1 |
Net realized and unrealized gains (losses) on investments | 1.08 | (1.05) | (0.27) | 0.45 | 0.64 |
Total from investment operations | 1.36 | (0.70) | 0.07 | 0.76 | 0.78 |
| Distributions to shareholders from | |||||
Net investment income | (0.37) | (0.34) | (0.33) | (0.26) | (0.13) |
Net asset value, end of period | $11.10 | $10.11 | $11.15 | $11.41 | $10.91 |
Total return | 13.62% | (6.57)% | 0.86% | 6.97% | 7.67% |
| Ratios to average net assets (annualized) | |||||
Gross expenses2 | 0.26% | 0.26% | 0.26% | 0.25% | 0.25% |
Net expenses2 | 0.26% | 0.26% | 0.26% | 0.25% | 0.25% |
Net investment income | 2.63% | 3.05% | 2.64% | 2.69% | 1.37% |
| Supplemental data | |||||
Portfolio turnover rate | 5% | 4% | 5% | 5% | 2% |
Net assets, end of period (000s omitted) | $17,332 | $25,363 | $31,838 | $46,753 | $14,636 |
| 1 | Calculated based upon average shares outstanding |
| 2 | Ratios do not reflect net expenses of GMO Benchmark-Free Allocation Fund, Class MF. Including net expenses allocated from GMO Benchmark-Free Allocation Fund, Class MF, the ratios would be increased by the following amounts: |
| Year ended April 30, 2021 | 0.67% |
| Year ended April 30, 2020 | 0.61% |
| Year ended April 30, 2019 | 0.60% |
| Year ended April 30, 2018 | 0.60% |
| Year ended April 30, 2017 | 0.59% |
| Year ended April 30 | |||||
| Administrator Class | 2021 | 2020 | 2019 | 2018 | 2017 |
Net asset value, beginning of period | $10.15 | $11.18 | $11.43 | $10.92 | $10.27 |
Net investment income | 0.24 1 | 0.27 1 | 0.27 1 | 0.19 1 | 0.07 1 |
Payment from affiliate | 0.06 | 0.00 | 0.00 | 0.00 | 0.00 |
Net realized and unrealized gains (losses) on investments | 1.08 | (1.01) | (0.24) | 0.53 | 0.68 |
Total from investment operations | 1.38 | (0.74) | 0.03 | 0.72 | 0.75 |
| Distributions to shareholders from | |||||
Net investment income | (0.35) | (0.29) | (0.28) | (0.21) | (0.10) |
Net asset value, end of period | $11.18 | $10.15 | $11.18 | $11.43 | $10.92 |
Total return | 13.76% 2 | (6.85)% | 0.48% | 6.62% | 7.31% |
| Ratios to average net assets (annualized) | |||||
Gross expenses3 | 0.61% | 0.61% | 0.60% | 0.60% | 0.59% |
Net expenses3 | 0.57% | 0.57% | 0.57% | 0.57% | 0.57% |
Net investment income | 2.20% | 2.42% | 2.44% | 1.70% | 0.72% |
| Supplemental data | |||||
Portfolio turnover rate | 5% | 4% | 5% | 5% | 2% |
Net assets, end of period (000s omitted) | $40,694 | $60,846 | $116,871 | $212,965 | $287,532 |
| 1 | Calculated based upon average shares outstanding |
| 2 | During the year ended April 30, 2021, the Fund received a payment from an affiliate that had an impact of 0.62% on total return. See Note 4 in the Notes to Financial Statements for additional information. |
| 3 | Ratios do not reflect net expenses of GMO Benchmark-Free Allocation Fund, Class MF. Including net expenses allocated from GMO Benchmark-Free Allocation Fund, Class MF, the ratios would be increased by the following amounts: |
| Year ended April 30, 2021 | 0.67% |
| Year ended April 30, 2020 | 0.61% |
| Year ended April 30, 2019 | 0.60% |
| Year ended April 30, 2018 | 0.60% |
| Year ended April 30, 2017 | 0.59% |
| Year ended April 30 | |||||
| Institutional Class | 2021 | 2020 | 2019 | 2018 | 2017 |
Net asset value, beginning of period | $10.11 | $11.15 | $11.41 | $10.92 | $10.27 |
Net investment income | 0.26 1 | 0.33 1 | 0.31 1 | 0.24 | 0.14 |
Net realized and unrealized gains (losses) on investments | 1.09 | (1.04) | (0.25) | 0.50 | 0.63 |
Total from investment operations | 1.35 | (0.71) | 0.06 | 0.74 | 0.77 |
| Distributions to shareholders from | |||||
Net investment income | (0.36) | (0.33) | (0.32) | (0.25) | (0.12) |
Net asset value, end of period | $11.10 | $10.11 | $11.15 | $11.41 | $10.92 |
Total return | 13.57% | (6.65)% | 0.76% | 6.78% | 7.58% |
| Ratios to average net assets (annualized) | |||||
Gross expenses2 | 0.36% | 0.36% | 0.36% | 0.35% | 0.35% |
Net expenses2 | 0.33% | 0.33% | 0.33% | 0.33% | 0.33% |
Net investment income | 2.43% | 3.00% | 2.82% | 2.07% | 1.19% |
| Supplemental data | |||||
Portfolio turnover rate | 5% | 4% | 5% | 5% | 2% |
Net assets, end of period (000s omitted) | $1,188,488 | $1,664,020 | $2,890,106 | $4,189,647 | $4,091,536 |
| 1 | Calculated based upon average shares outstanding |
| 2 | Ratios do not reflect net expenses of GMO Benchmark-Free Allocation Fund, Class MF. Including net expenses allocated from GMO Benchmark-Free Allocation Fund, Class MF, the ratios would be increased by the following amounts: |
| Year ended April 30, 2021 | 0.67% |
| Year ended April 30, 2020 | 0.61% |
| Year ended April 30, 2019 | 0.60% |
| Year ended April 30, 2018 | 0.60% |
| Year ended April 30, 2017 | 0.59% |
| Gross unrealized gains | $122,776,289 |
| Gross unrealized losses | 0 |
| Net unrealized gains | $122,776,289 |
| ■ | Level 1 – quoted prices in active markets for identical securities |
| ■ | Level 2 – other significant observable inputs (including quoted prices for similar securities, interest rates, prepayment speeds, credit risk, etc.) |
| ■ | Level 3 – significant unobservable inputs (including the Fund’s own assumptions in determining the fair value of investments) |
| Average daily net assets | Management fee |
| First $1 billion | 0.225% |
| Next $4 billion | 0.200 |
| Next $5 billion | 0.175 |
| Next $10 billion | 0.165 |
| Over $20 billion | 0.160 |
| Class-level administration fee | |
| Class A | 0.21% |
| Class C | 0.21 |
| Class R | 0.21 |
| Class R6 | 0.03 |
| Administrator Class | 0.13 |
| Institutional Class | 0.13 |
| Expense ratio caps | |
| Class A | 0.71% |
| Class C | 1.46 |
| Class R | 0.96 |
| Class R6 | 0.28 |
| Administrator Class | 0.57 |
| Institutional Class | 0.33 |
| Undistributed ordinary income | Unrealized gains | Capital loss carryforward |
| $46,306,196 | $122,776,289 | $(453,326,784) |
Wells Fargo Funds Trust:
| Creditable foreign taxes paid | Per share amount | Foreign income as % of ordinary income distributions |
| $4,023,068 | $0.0176 | 43.57% |
| Name and year of birth | Position held and length of service* | Principal occupations during past five years or longer | Current other public company or investment company directorships |
| William R. Ebsworth (Born 1957) | Trustee, since 2015 | Retired. From 1984 to 2013, equities analyst, portfolio manager, research director and chief investment officer at Fidelity Management and Research Company in Boston, Tokyo, and Hong Kong, and retired in 2013 as Chief Investment Officer of Fidelity Strategic Advisers, Inc. where he led a team of investment professionals managing client assets. Prior thereto, Board member of Hong Kong Securities Clearing Co., Hong Kong Options Clearing Corp., the Thailand International Fund, Ltd., Fidelity Investments Life Insurance Company, and Empire Fidelity Investments Life Insurance Company. Audit Committee Chair and Investment Committee Chair of the Vincent Memorial Hospital Endowment (non-profit organization). Mr. Ebsworth is a CFA® charterholder. | N/A |
| Jane A. Freeman (Born 1953) | Trustee, since 2015; Chair Liaison, since 2018 | Retired. From 2012 to 2014 and 1999 to 2008, Chief Financial Officer of Scientific Learning Corporation. From 2008 to 2012, Ms. Freeman provided consulting services related to strategic business projects. Prior to 1999, Portfolio Manager at Rockefeller & Co. and Scudder, Stevens & Clark. Board member of the Harding Loevner Funds from 1996 to 2014, serving as both Lead Independent Director and chair of the Audit Committee. Board member of the Russell Exchange Traded Funds Trust from 2011 to 2012 and the chair of the Audit Committee. Ms. Freeman is also an inactive Chartered Financial Analyst. | N/A |
| Isaiah Harris, Jr. (Born 1952) | Trustee, since 2009; Audit Committee Chair, since 2019 | Retired. Chairman of the Board of CIGNA Corporation since 2009, and Director since 2005. From 2003 to 2011, Director of Deluxe Corporation. Prior thereto, President and CEO of BellSouth Advertising and Publishing Corp. from 2005 to 2007, President and CEO of BellSouth Enterprises from 2004 to 2005 and President of BellSouth Consumer Services from 2000 to 2003. Emeritus member of the Iowa State University Foundation Board of Governors. Emeritus Member of the Advisory Board of Iowa State University School of Business. Advisory Board Member, Palm Harbor Academy (private school). Mr. Harris is a certified public accountant (inactive status). | CIGNA Corporation |
| Judith M. Johnson (Born 1949) | Trustee, since 2008 | Retired. Prior thereto, Chief Executive Officer and Chief Investment Officer of Minneapolis Employees Retirement Fund from 1996 to 2008. Ms. Johnson is an attorney, certified public accountant and a certified managerial accountant. | N/A |
| David F. Larcker (Born 1950) | Trustee, since 2009 | James Irvin Miller Professor of Accounting at the Graduate School of Business (Emeritus), Stanford University, Director of the Corporate Governance Research Initiative and Senior Faculty of The Rock Center for Corporate Governance since 2006. From 2005 to 2008, Professor of Accounting at the Graduate School of Business, Stanford University. Prior thereto, Ernst & Young Professor of Accounting at The Wharton School, University of Pennsylvania from 1985 to 2005. | N/A |
| Name and year of birth | Position held and length of service* | Principal occupations during past five years or longer | Current other public company or investment company directorships |
| Olivia S. Mitchell (Born 1953) | Trustee, since 2006; Nominating and Governance Committee Chair, since 2018 | International Foundation of Employee Benefit Plans Professor, Wharton School of the University of Pennsylvania since 1993. Director of Wharton’s Pension Research Council and Boettner Center on Pensions & Retirement Research, and Research Associate at the National Bureau of Economic Research. Previously, Cornell University Professor from 1978 to 1993. | N/A |
| Timothy J. Penny (Born 1951) | Trustee, since 1996; Chair, since 2018 | President and Chief Executive Officer of Southern Minnesota Initiative Foundation, a non-profit organization, since 2007. Member of the Board of Trustees of NorthStar Education Finance, Inc., a non-profit organization, since 2007. | N/A |
| James G. Polisson (Born 1959) | Trustee, since 2018 | Retired. Chief Marketing Officer, Source (ETF) UK Services, Ltd, from 2015 to 2017. From 2012 to 2015, Principal of The Polisson Group, LLC, a management consulting, corporate advisory and principal investing company. Chief Executive Officer and Managing Director at Russell Investments, Global Exchange Traded Funds from 2010 to 2012. Managing Director of Barclays Global Investors from 1998 to 2010 and Global Chief Marketing Officer for iShares and Barclays Global Investors from 2000 to 2010. Trustee of the San Francisco Mechanics’ Institute, a non-profit organization, from 2013 to 2015. Board member of the Russell Exchange Traded Fund Trust from 2011 to 2012. Director of Barclays Global Investors Holdings Deutschland GmbH from 2006 to 2009. Mr. Polisson is an attorney and has a retired status with the Massachusetts and District of Columbia Bar Associations. | N/A |
| Pamela Wheelock (Born 1959) | Trustee, since January 2020; previously Trustee from January 2018 to July 2019 | Board member of the Destination Medical Center Economic Development Agency, Rochester, Minnesota since 2019. Interim President of the McKnight Foundation from January to September 2020. Acting Commissioner, Minnesota Department of Human Services, July 2019 through September 2019. Human Services Manager (part-time), Minnesota Department of Human Services, October 2019 through December 2019. Chief Operating Officer, Twin Cities Habitat for Humanity from 2017 to 2019. Vice President of University Services, University of Minnesota from 2012 to 2016. Prior thereto, on the Board of Directors, Governance Committee and Finance Committee for the Minnesota Philanthropy Partners (Saint Paul Foundation) from 2012 to 2018, Interim Chief Executive Officer of Blue Cross Blue Shield of Minnesota from 2011 to 2012, Chairman of the Board from 2009 to 2012 and Board Director from 2003 to 2015. Vice President, Leadership and Community Engagement, Bush Foundation, Saint Paul, Minnesota (a private foundation) from 2009 to 2011. Executive Vice President and Chief Financial Officer, Minnesota Sports and Entertainment from 2004 to 2009 and Senior Vice President from 2002 to 2004. Executive Vice President of the Minnesota Wild Foundation from 2004 to 2008. Commissioner of Finance, State of Minnesota, from 1999 to 2002. Currently Board Chair of the Minnesota Wild Foundation since 2010. | N/A |
| Name and year of birth | Position held and length of service | Principal occupations during past five years or longer |
| Andrew Owen (Born 1960) | President, since 2017 | Executive Vice President of Wells Fargo & Company and Head of Affiliated Managers, Wells Fargo Asset Management, since 2014. In addition, Mr. Owen is currently President, Chief Executive Officer and Director of Wells Fargo Funds Management, LLC since 2017. Prior thereto, Executive Vice President responsible for marketing, investments and product development for Wells Fargo Funds Management, LLC, from 2009 to 2014. |
| Jeremy DePalma (Born 1974) | Treasurer, since 2012 (for certain funds in the Fund Complex); since 2021 (for the remaining funds in the Fund Complex) | Senior Vice President of Wells Fargo Funds Management, LLC since 2009. Senior Vice President of Evergreen Investment Management Company, LLC from 2008 to 2010 and head of the Fund Reporting and Control Team within Fund Administration from 2005 to 2010. |
| Michelle Rhee (Born 1966) | Chief Legal Officer, since 2019 | Secretary of Wells Fargo Funds Management, LLC and Chief Legal Counsel of Wells Fargo Asset Management since 2018. Deputy General Counsel of Wells Fargo Bank, N.A. since 2020 and Assistant General Counsel of Wells Fargo Bank, N.A. from 2018 to 2020. Associate General Counsel and Managing Director of Bank of America Corporation from 2004 to 2018. |
| Catherine Kennedy (Born 1969) | Secretary, since 2019 | Vice President of Wells Fargo Funds Management, LLC and Senior Counsel of the Wells Fargo Legal Department since 2010. Vice President and Senior Counsel of Evergreen Investment Management Company, LLC from 1998 to 2010. |
| Michael H. Whitaker (Born 1967) | Chief Compliance Officer, since 2016 | Chief Compliance Officer of Wells Fargo Asset Management since 2016. Senior Vice President and Chief Compliance Officer for Fidelity Investments from 2007 to 2016. |
GMO Benchmark-Free Allocation Fund
(A Series of GMO Trust)
Schedule of Investments
(showing percentage of total net assets)
April 30, 2021 (Unaudited)
| Shares | Description | Value ($) | ||||||||
| MUTUAL FUNDS — 100.0% |
| |||||||||
| Affiliated Issuers — 100.0% |
| |||||||||
| 6,235,561 | GMO Emerging Country Debt Fund, Class IV | 161,625,733 | ||||||||
| 449,864,859 | GMO Implementation Fund | 5,902,226,950 | ||||||||
| 8,753,763 | GMO Opportunistic Income Fund, Class VI | 226,547,387 | ||||||||
| 5,507,128 | GMO SGM Major Markets Fund, Class VI | 171,491,952 | ||||||||
|
| |||||||||
TOTAL MUTUAL FUNDS (COST $6,471,345,834) | 6,461,892,022 | |||||||||
|
| |||||||||
| SHORT-TERM INVESTMENTS — 0.1% |
| |||||||||
| Money Market Funds — 0.1% |
| |||||||||
| 5,965,026 | State Street Institutional Treasury Money Market Fund – Premier Class, 0.01%(a) | 5,965,026 | ||||||||
|
| |||||||||
TOTAL SHORT-TERM INVESTMENTS (COST $5,965,026) | 5,965,026 | |||||||||
|
| |||||||||
TOTAL INVESTMENTS — 100.1% (Cost $6,477,310,860) | 6,467,857,048 | |||||||||
| Other Assets and Liabilities (net) — (0.1%) | (3,303,247 | ) | ||||||||
|
| |||||||||
| TOTAL NET ASSETS — 100.0% | $ | 6,464,553,801 | ||||||||
|
| |||||||||
Notes to Schedule of Investments:
| (a) | The rate disclosed is the 7 day net yield as of April 30, 2021. |
32 | Wells Fargo Absolute Return Fund
Appendix I (unaudited)
GMO Benchmark-Free Allocation Fund
(A Series of GMO Trust)
Statement of Assets and Liabilities — April 30, 2021 (Unaudited)
Assets: |
| |||
Investments in affiliated issuers, at value(a) | $ | 6,461,892,022 | ||
Investments in unaffiliated issuers, at value(b) | 5,965,026 | |||
Receivable for Fund shares sold | 6,294,695 | |||
Dividends and interest receivable | 28 | |||
Receivable for expenses reimbursed and/or waived by GMO | 307,062 | |||
|
| |||
Total assets | 6,474,458,833 | |||
|
| |||
Liabilities: | ||||
Payable for investments purchased | 3,381,141 | |||
Payable for Fund shares repurchased | 2,121,243 | |||
Payable to affiliate for: | ||||
Management fee | 3,464,113 | |||
Supplemental support fee – Class MF | 139,792 | |||
Shareholder service fee | 507,421 | |||
Payable to agents unaffiliated with GMO | 2,237 | |||
Payable to Trustees and related expenses | 46,141 | |||
Accrued expenses | 242,944 | |||
|
| |||
Total liabilities | 9,905,032 | |||
|
| |||
Net assets | $ | 6,464,553,801 | ||
|
| |||
Net assets consist of: | ||||
Paid-in capital | $ | 6,680,341,949 | ||
Distributable earnings (accumulated loss) | (215,788,148 | ) | ||
|
| |||
| $ | 6,464,553,801 | |||
|
| |||
Net assets attributable to: | ||||
Class III | $ | 1,990,076,795 | ||
|
| |||
Class IV | $ | 2,139,739,136 | ||
|
| |||
Class MF | $ | 1,681,724,433 | ||
|
| |||
Class R6 | $ | 316,284,100 | ||
|
| |||
Class I | $ | 336,729,337 | ||
|
| |||
Shares outstanding: | ||||
Class III | 74,509,401 | |||
|
| |||
Class IV | 80,119,762 | |||
|
| |||
Class MF | 62,904,602 | |||
|
| |||
Class R6 | 11,850,037 | |||
|
| |||
Class I | 12,618,184 | |||
|
| |||
Net asset value per share: | ||||
Class III | $ | 26.71 | ||
|
| |||
Class IV | $ | 26.71 | ||
|
| |||
Class MF | $ | 26.73 | ||
|
| |||
Class R6 | $ | 26.69 | ||
|
| |||
Class I | $ | 26.69 | ||
|
| |||
(a) Cost of investments – affiliated issuers: | $ | 6,471,345,834 | ||
(b) Cost of investments – unaffiliated issuers: | $ | 5,965,026 | ||
For further information regarding GMO Benchmark-Free Allocation Fund, please refer to its audited financial statements for the fiscal year ended February 28, 2021, which are available at: https://www.sec.gov/Archives/edgar/data/772129/000119312521144817/d30683dncsr.htm
Wells Fargo Absolute Return Fund | 33
P.O. Box 219967
Kansas City, MO 64121-9967

A260/AR260 04-21
ITEM 2. CODE OF ETHICS
(a) As of the end of the period covered by the report, Wells Fargo Funds Trust has adopted a code of ethics that applies to its President and Treasurer. A copy of the code of ethics is filed as an exhibit to this Form N-CSR.
(c) During the period covered by this report, there were no amendments to the provisions of the code of ethics adopted in Item 2(a) above.
(d) During the period covered by this report, there were no implicit or explicit waivers to the provisions of the code of ethics adopted in Item 2(a) above.
ITEM 3. AUDIT COMMITTEE FINANCIAL EXPERT
The Board of Trustees of Wells Fargo Funds Trust has determined that Judith Johnson is an audit committee financial expert, as defined in Item 3 of Form N-CSR. Mrs. Johnson is independent for purposes of Item 3 of Form N-CSR.
ITEM 4. PRINCIPAL ACCOUNTANT FEES AND SERVICES
(a), (b), (c), (d) The following table presents aggregate fees billed in each of the last two fiscal years for services rendered to the Registrant by the Registrant’s principal accountant. These fees were billed to the registrant and were approved by the Registrant’s audit committee.
| Fiscal year ended April 30, 2021 | Fiscal year ended April 30, 2020 | |||||||
Audit fees | $ | 24,250 | $ | 23,230 | ||||
Audit-related fees | — | — | ||||||
Tax fees (1) | 4,440 | 4,340 | ||||||
All other fees | — | — | ||||||
|
|
|
| |||||
| $ | 28,690 | $ | 27,570 | |||||
|
|
|
| |||||
| (1) | Tax fees consist of fees for tax compliance, tax advice, tax planning and excise tax. |
(e) The Chair of the Audit Committees is authorized to pre-approve: (1) audit services for the mutual funds of Wells Fargo Funds Trust; (2) non-audit tax or compliance consulting or training services provided to the Funds by the independent auditors (“Auditors”) if the fees for any particular engagement are not anticipated to exceed $50,000; and (3) non-audit tax or compliance consulting or training services provided by the Auditors to a Fund’s investment adviser and its controlling entities (where pre-approval is required because the engagement relates directly to the operations and financial reporting of the Fund) if the fee to the Auditors for any particular engagement is not anticipated to exceed $50,000. For any such pre-approval sought from the Chair, Management shall prepare a brief description of the proposed services.
If the Chair approves of such service, he or she shall sign the statement prepared by Management.
Such written statement shall be presented to the full Committees at their next regularly scheduled meetings.
(f) Not applicable
(g) Not applicable
(h) Not applicable
ITEM 5. AUDIT COMMITTEE OF LISTED REGISTRANTS
Not applicable.
ITEM 6. INVESTMENTS
A Portfolio of Investments for one series of Wells Fargo Funds Trust is included as part of the report to shareholders filed under Item 1 of this Form.
ITEM 7. DISCLOSURE OF PROXY VOTING POLICIES AND PROCEDURES FOR CLOSED-END MANAGEMENT INVESTMENT COMPANIES
Not applicable.
ITEM 8. PORTFOLIO MANAGERS OF CLOSED-END MANAGEMENT INVESTMENT COMPANIES
Not applicable.
ITEM 9. PURCHASES OF EQUITY SECURITIES BY CLOSED-END MANAGEMENT INVESTMENT COMPANY AND AFFILIATED PURCHASERS
Not applicable.
ITEM 10. SUBMISSION OF MATTERS TO A VOTE OF SECURITY HOLDERS
There have been no material changes to the procedures by which shareholders may recommend nominees to the registrant’s Board of Trustees that have been implemented since the registrant’s last provided disclosure in response to the requirements of this Item.
ITEM 11. CONTROLS AND PROCEDURES
(a) The President and Treasurer have concluded that the Wells Fargo Funds Trust disclosure controls and procedures (as defined in Rule 30a-3(c) under the Investment Company Act of 1940) provide reasonable assurances that material information relating to the registrant is made known to them by the appropriate persons based on their evaluation of these controls and procedures as of a date within 90 days of the filing of this report.
(b) There were no significant changes in the registrant’s internal controls over financial reporting (as defined in Rule 30a-3(d) under the Investment Company Act of 1940) that occurred during the most recent fiscal half-year of the period covered by this report that materially affected, or is reasonably likely to materially affect, the registrant’s internal control over financial reporting.
ITEM 12. DISCLOSURES OF SECURITIES LENDING ACTIVITES FOR CLOSED-END MANAGEMENT INVESTMENT COMPANIES
Not applicable.
ITEM 13. EXHIBITS
(a)(2) Certifications pursuant to Section 302 of the Sarbanes-Oxley Act of 2002.
(b) Certifications pursuant to Section 906 of the Sarbanes-Oxley Act of 2002.
SIGNATURES
Pursuant to the requirements of the Securities Exchange Act of 1934 and the Investment Company Act of 1940, the registrant has duly caused this report to be signed on its behalf by the undersigned, thereunto duly authorized.
| Wells Fargo Funds Trust | ||
| By: | ||
| /s/ Andrew Owen | ||
| Andrew Owen | ||
| President | ||
| Date: | June 25, 2021 | |
Pursuant to the requirements of the Securities Exchange Act of 1934 and the Investment Company Act of 1940, this report has been signed below by the following persons on behalf of the registrant and in the capacities and on the date indicated.
| Wells Fargo Funds Trust | ||
| By: | ||
| /s/ Andrew Owen | ||
| Andrew Owen | ||
| President | ||
| Date: | June 25, 2021 | |
| By: | ||
| /s/ Jeremy DePalma | ||
| Jeremy DePalma | ||
| Treasurer | ||
| Date: | June 25, 2021 | |